Attached files
| file | filename |
|---|---|
| EX-10.3 - EXHIBIT 10-3 - THESTREET, INC. | s102723_ex10-3.htm |
| EX-23.1 - EXHIBIT 23-1 - THESTREET, INC. | s102723_ex23-1.htm |
| EX-31.1 - EXHIBIT 31-1 - THESTREET, INC. | s102723_ex31-1.htm |
| EX-21.1 - EXHIBIT 21-1 - THESTREET, INC. | s102723_ex21-1.htm |
| EX-10.33 - EXHIBIT 10-33 - THESTREET, INC. | s102723_ex10-33.htm |
| EX-10.31 - EXHIBIT 10-31 - THESTREET, INC. | s102723_ex10-31.htm |
| EX-32.2 - EXHIBIT 32-2 - THESTREET, INC. | s102723_ex32-2.htm |
| EX-10.17 - EXHIBIT 10-17 - THESTREET, INC. | s102723_ex10-17.htm |
| EX-31.2 - EXHIBIT 31-2 - THESTREET, INC. | s102723_ex31-2.htm |
| EX-10.30 - EXHIBIT 10-30 - THESTREET, INC. | s102723_ex10-30.htm |
| EX-32.1 - EXHIBIT 32-1 - THESTREET, INC. | s102723_ex32-1.htm |
| EX-10.18 - EXHIBIT 10-18 - THESTREET, INC. | s102723_ex10-18.htm |
| EX-10.32 - EXHIBIT 10-32 - THESTREET, INC. | s102723_ex10-32.htm |
UNITED STATES
SECURITIES AND EXCHANGE COMMISSION
Washington, D.C. 20549
FORM 10-K
ANNUAL REPORT PURSUANT TO SECTION 13
OR 15(d) OF THE
SECURITIES EXCHANGE ACT OF 1934
FOR THE FISCAL YEAR ENDED DECEMBER 31, 2015
COMMISSION FILE NUMBER 0-25779
THESTREET, INC.
(Exact name of Registrant as specified in its charter)
| Delaware | 06-1515824 | |
| (State or other jurisdiction of incorporation or organization) | (I.R.S. Employer Identification No.) | |
| 14 Wall Street, 15th Floor New York, New York |
10005 | |
| (Address of principal executive offices) | (Zip code) |
Registrant’s telephone number, including area code: (212) 321-5000
Securities registered pursuant to Section
12(b) of the Act:
| Title of Each Class | Name of Each Exchange on Which the Securities are Registered | |
| Common Stock, par value $0.01 per share | Nasdaq Global Market |
Securities registered pursuant to Section 12(g) of the Act: None
Indicate by check mark if the Registrant is a well-known seasoned issuer, as defined in Rule 405 of the Securities Act. Yes ¨ No x
Indicate by check mark if the Registrant is not required to file reports pursuant to Section 13 or Section 15(d) of the Exchange Act. Yes ¨ No x
Indicate by a check mark whether the Registrant (1) has filed all reports required to be filed by Section 13 or 15(d) of the Securities Exchange Act of 1934 during the preceding 12 months (or for such shorter period that the Registrant was required to file such reports), and (2) has been subject to such filing requirements for the past 90 days. Yes x No ¨
Indicate by check mark whether the Registrant has submitted electronically and posted on its corporate web site, if any, every Interactive Data File required to be submitted and posted pursuant to Rule 405 of Regulation S-T (§232.405 of this chapter) during the preceding 12 months (or for such shorter period that the Registrant as required to submit and post such files). Yes x No ¨
Indicate by check mark if disclosure of delinquent filers pursuant to Item 405 of Regulation S-K (§229.405 of this chapter) is not contained herein, and will not be contained, to the best of the Registrant’s knowledge, in definitive proxy or information statements incorporated by reference in Part III of this Form 10-K or any amendment to this Form 10-K. ¨
Indicate by check mark whether the Registrant is a large accelerated filer, an accelerated filer, a non-accelerated filer, or a smaller reporting company. See the definitions of “large accelerated filer,” “accelerated filer” and “smaller reporting company” in Rule 12b-2 of the Exchange Act.
| Large accelerated filer ☐ | Accelerated filer x | Non-accelerated filer ☐ | Smaller reporting company ☐ |
Indicate by check mark whether the Registrant is a shell company (as defined in Rule 12b-2 of the Act). Yes ¨ No x
The aggregate market value of the Registrant’s common stock held by non-affiliates of the Registrant (assuming, for the sole purpose of this calculation, that all directors and executive officers of the Registrant are “affiliates”), based upon the closing price of the Registrant’s common stock on June 30, 2015 as reported by Nasdaq, was approximately $59 million.
Indicate the number of shares outstanding of each of the Registrant’s classes of common stock, as of the latest practicable date.
| Title of Each Class | Number of Shares Outstanding as of March 3, 2016 |
| Common Stock, par value $0.01 par value | 35,229,680 |
Documents Incorporated By Reference
Part III of this Form 10-K incorporates by reference certain information from the Registrant’s Definitive Proxy Statement for its 2016 Annual Meeting of Stockholders to be filed with the Securities and Exchange Commission within 120 days after the end of the fiscal year covered by this Report.
THESTREET, INC.
2015 ANNUAL REPORT ON FORM 10-K
TABLE OF CONTENTS
ii
THESTREET, INC.
2015 ANNUAL REPORT ON FORM 10-K
Special Note Regarding Forward-Looking Statements – all statements contained in this Report that are not descriptions of historical facts are forward-looking statements within the meaning of Section 27A of the Securities Act of 1933, as amended (the “Securities Act”), and Section 21E of the Securities Exchange Act of 1934, as amended (the “Exchange Act”). Forward-looking statements are inherently subject to risks and uncertainties, and actual results could differ materially from those reflected in the forward-looking statements due to a number of factors, which include, but are not limited to, the factors set forth under the heading “Risk Factors” and elsewhere in this Report, and in other documents we file with the Securities and Exchange Commission from time to time. Certain forward-looking statements may be identified by terms such as “may,” “will,” “should,” “could,” “expects,” “plans,” “intends,” “anticipates,” “believes,” “estimates,” “predicts,” “forecasts,” “potential,” or “continue” or similar terms or the negative of these terms. All statements relating to our plans, strategies and objectives are deemed forward-looking statements. Although we believe that the expectations reflected in the forward-looking statements are reasonable, we cannot guarantee future results, levels of activity, performance or achievements. We have no obligation to update these forward-looking statements, whether as a result of new information, future developments or otherwise.
Overview
TheStreet, Inc., together with its wholly owned subsidiaries (“TheStreet”, “we”, “us” or the “Company”), is a leading digital financial media company focused on the financial and mergers and acquisitions environment. The Company’s collection of digital services provides users, subscribers and advertisers with a variety of content and tools through a range of online, social media, tablet and mobile channels. Our mission is to provide investors and advisors with actionable ideas from the world of investing, finance and business, and dealmakers with sophisticated analysis of the mergers and acquisitions environment, in order to break down information barriers, level the playing field and help all individuals and organizations grow their wealth. With a robust suite of digital services, TheStreet offers the tools and insights needed to make informed decisions about earning, investing, saving and spending money. Since its inception in 1996, TheStreet believes it has distinguished itself from other financial media companies with its journalistic excellence, unbiased approach and interactive multimedia coverage of the financial markets, economy, industry trends, investment and financial planning.
We pioneered online publishing of business and investment information through our creation of TheStreet, which launched in 1996 as a paid subscription financial news and commentary Website. Today, TheStreet is our flagship advertising-supported property, a leading site in its category and a source of subscribers to a variety of our paid subscription products. Our subscription products are designed to address the needs of investors with various areas of interest and increasing levels of financial sophistication, including fledgling investors, consumers interested in personal finance guidance, long-term and short-term active investors, day and swing traders, and fundamental, technical and options traders. Our RateWatch business publishes bank rate market information on a subscription basis to financial institutions, government agencies, educational researchers and commercial organizations. The Deal, LLC (“The Deal”), our institutional services platform, provides dealmakers, advisers and institutional investors with director and officer profiles, relationship capital management services, and transactional information pertaining to mergers and acquisitions and other changes in the corporate control environment.
| 1 |
Subscription Services
Subscription services revenue is comprised of subscriptions, licenses and fees for access to securities investment information, stock market commentary, rate services, director and officer profiles, relationship capital management services, and transactional information pertaining to mergers and acquisitions and other changes in the corporate control environment. Subscription services contributed 82% of our total revenue in 2015, as compared to 79% in 2014 and 80% in 2013. The increase is primarily the result of the acquisition of Management Diagnostics Limited in October 2014.
We believe we were one of the first companies to successfully create a large scale, consumer-focused, digital subscription services content business. We believe we have been able to successfully sustain our subscription services business because we have a 20-year track record of providing high quality, independent investing ideas that have produced financial value for our readers. We believe our track record provides us with a competitive advantage and we will seek to enhance the value of our leading brand and our ability to monetize that value.
In addition to our consumer-focused subscription products, which include RealMoney, RealMoney Pro, Actions Alerts PLUS, TheStreet Quant Ratings, and Stocks Under $10, our subscription services business also includes information and transactional services revenue from RateWatch and The Deal.
RateWatch maintains a constantly-updated database of deposit, loan and fee rate data from over 100,000 financial institutions. This historical and real-time rate data is licensed to financial institutions, government agencies, educational researchers and commercial organizations. Data is provided in formats ranging from standard rate templates to large raw data files for use with third party analytical tools. The RateWatch product line also includes banking-related product and fee comparisons, financial strength reporting, educational webinars, mystery shopping and consumer and financial institution surveys.
In September 2012, the Company acquired The Deal, LLC (“The Deal”) as it expanded its subscription services with a new focus on institutional investors, in addition to retail investors. Founded in 1999 as The Daily Deal print newspaper, The Deal transformed its business into a digital subscription platform that delivers sophisticated coverage on changes in corporate control, including mergers and acquisitions, private equity, corporate activism and restructuring. The Deal was created for organizations seeking to generate deal flow, improve client intelligence and enhance market knowledge. It provides full access to proprietary commentary, analysis and data produced every day by The Deal’s editors and journalists and can be customized based on each client’s job function, deal focus and workflow and delivered straight to a mobile device or existing corporate platform.
In April 2013, the Company acquired The DealFlow Report, The Life Settlements Report and the PrivateRaise database from DealFlow Media, Inc. to further broaden the information and services available to institutional investors. These newsletters and database, and the employees providing their content, have been incorporated into The Deal.
| 2 |
Additionally, in October 2014, the Company acquired Management Diagnostics Limited (“MDL”), a privately held company headquartered in London, England to expand the Company’s international operations and further the Company’s transition from primarily serving retail investors to also becoming an indispensable data and business intelligence source for institutional clients. Founded in 1999, MDL is the owner of BoardEx, an institutional relationship capital management database and platform. Clients, including investment banks, consultancies, executive search firms, law firms and academia use BoardEx to leverage their relationships and facilitate business and corporate development initiatives. MDL’s products and services, and the employees providing these products and services have been incorporated into The Deal.
Our subscription services revenue also includes revenue generated from syndication and licensing of data from TheStreet Ratings (“Ratings”), which tracks the risk-adjusted performance of more than 20,000 mutual funds and exchange-traded funds (ETFs) and more than 4,000 stocks.
Media
Media revenue is comprised of fees charged for the placement of advertising and sponsorships within TheStreet and its affiliated properties, event and other miscellaneous revenue. Media contributed 18% of our total revenue in 2015, as compared to 21% in 2014 and 20% in 2013. The decrease is primarily the result of the acquisition of MDL in October 2014, which added to the Company’s subscription services revenue.
Our advertising-supported properties, which include TheStreet, MainStreet, Stockpickr, and Real Money, attract one of the largest and most affluent audiences of any digital publisher in our content vertical. TheStreet, with its enviable track record as a leading and distinctive digital voice in the financial category, is regarded as a must-buy for most of our core online brokerage advertisers and a highly effective means for other financial services companies and non-endemic advertisers to communicate with our engaged, affluent audience. Our direct sales team sells the full capabilities of TheStreet and its affiliated properties via sponsorships, custom programs, video, mobile, newsletters, audience targeting, native advertising, social amplification and distribution as well as programmatic direct and real time bidding.
Our media revenue also includes revenue generated from syndication and licensing of data as well as other miscellaneous, non-subscription related sources.
Marketing
We pursue a variety of sales and marketing initiatives to sell subscriptions to our subscription services, increase traffic to our sites, license our content, expose our brands, and build our customer databases. These initiatives may include promoting our services through online, email, social, radio and direct mail, telemarketing and establishing content syndication relationships with leading companies. Our in-house online marketing and creative design teams create a variety of marketing campaigns, which are then implemented by our technical and operations team and by third-party service providers. We also have a reporting and analysis group that analyzes traffic and subscription data to determine the effectiveness of the campaigns. We also sell our subscription services through a direct sales force to institutional clients.
We also use content syndication arrangements to capitalize on the cost efficiencies of online delivery and create additional value from content we already have produced for our own properties. By syndicating our content to other leading Websites to host on their own sites, we expose our brands and top-quality writing to millions of potential users. In one type of syndication arrangement, we provide leading Websites in our vertical, including Yahoo! Finance, AOL Daily Finance, Marketwatch and MSN Money, with selected content to host along with additional article headlines that these partners display on their stock quote result pages, in both instances providing links back to our site. This type of arrangement exposes new audiences to our brands and content and generates additional traffic to our sites, creating the opportunity for us to increase our advertising revenue and subscription sales.
| 3 |
We seek to generate additional visitors to our sites through search engine optimization efforts, in order to increase the visibility of our content on search engines such as Google Search, Yahoo and Microsoft’s Bing, and through efforts to increase our presence on a variety of social media platforms, such as Facebook, LinkedIn and Twitter. We have been active in developing and distributing mobile and tablet applications to deliver our content to new audiences. Finally, we focus on increasing the engagement our visitors have with our sites, measured by visits per visitor, page views per visit and by time spent on site, and we continuously seek to improve the experience our sites offer.
In addition, we obtain exposure through other media outlets who cite our writers and our stories or who invite our writers to appear on segments. In 2015, we were mentioned or featured in reports by major news/media outlets, including The Wall Street Journal, USA Today, and The New York Times. Many of our writers and analysts provided key market commentary and consumer advice for CNBC, NBC, ABC, CBS, Fox and other national and local news organizations.
Competition
Our services face intense competition from other providers of business, personal finance, investing and ratings content, including:
| · | online services or Websites focused on business, personal finance or investing, such as The Wall Street Journal Digital Network, CNN Money, Forbes.com, Reuters.com, Bloomberg.com, Seeking Alpha, Business Insider and CNBC.com, as well as financial portals such as Yahoo! Finance, AOL Daily Finance and MSN Money; |
| · | publishers and distributors of traditional media focused on business, personal finance or investing, including print and radio, such as The Wall Street Journal and financial talk radio programs, and business television networks such as Bloomberg, CNBC and the Fox Business Channel; |
| · | investment newsletter publishers, such as The Motley Fool, Stansberry & Associates Investment Research and InvestorPlace Media; |
| · | other providers of business intelligence on mergers and acquisitions, restructurings and financings, such as Bloomberg and Mergermarket Group; |
| · | established ratings services, such as Standard & Poor’s, Morningstar and Lipper, with respect to our Ratings products, and rate database providers such as Informa and SNL Financial, with respect to our RateWatch products; and |
| · | other providers of director, officer and dealmaker data, including Bloomberg, S&P Capital IQ, Dow Jones, The New York Stock Exchange, LexisNexis, Relationship Science, and Thomson Reuters. |
Many of these competitors have significantly greater scale and resources than we do. Additionally, advances in technology have reduced the cost of production and online distribution of written, audio and video content, which has resulted in the proliferation of small, often self-published providers of free content, such as bloggers.
We believe that advertisers and agencies often look to independent measurement data such as that provided by comScore, Inc., an independent Web measurement company (“comScore”), in order to gain a sense of the performance of various sites, in relation to their peer category, when determining where to allocate advertising dollars.
According to a survey by comScore during the fourth quarter of 2015, TheStreet ranks:
| 4 |
| · | #1 Website with readers having a portfolio value over $1 million; |
| · | #2 Website with readers having household income over $75,000; and |
| · | #1 Website with readers checking stock quotes. |
We compete with these other content providers for customers, including subscribers, readers and viewers of our video content, for advertising revenue, and for employees and contributors to our services. Our ability to compete successfully depends on many factors, including the quality, originality, timeliness, insightfulness and trustworthiness of our content and that of our competitors, the reputations of our contributors and our brands, the success of our recommendations and research, our ability to introduce products and services that keep pace with new investing trends, the experience we and our competitors offer our users and the effectiveness of our sales and marketing efforts.
Infrastructure, Operations and Technology
Our main technological infrastructure consists of proprietary and Drupal-based content management, subscription management, Ratings models, and e-commerce systems. We also utilize the services of third-party cloud computing providers, more specifically Amazon Web Services, as well as content delivery networks such as Fastly, to help us efficiently distribute our content to our customers. Our RateWatch systems consist of proprietary and commercial software hosted internally. Our operations are dependent in part on our ability, and that of our third-party cloud computing providers, to keep our systems up to rapidly evolving modern standards and to protect our systems against damage from fire, earthquakes, power loss, telecommunications failure, break-ins, computer viruses, hacker attacks, terrorist attacks and other events beyond our control.
Our content-management systems are based on proprietary software, Drupal and Kaltura Content Management Systems. They allow our stories, videos and data to be prepared for distribution online to a large audience. These systems enable us to distribute and syndicate our content economically and efficiently to multiple destinations in a variety of technical formats.
Our subscription-management system is based on proprietary software and allows us to communicate automatically with readers during their free-trial and subscription periods. The system is capable of yielding a variety of customized subscription offers to potential subscribers, using various communication methods and platforms.
Our e-commerce system is based on proprietary software and controls user access to a wide array of service offerings. The system automatically controls aspects of online daily credit card billing, based upon user-selected billing terms. All financial revenue-recognition reports are automatically generated, providing detailed reporting on all account subscriptions. This generally allows a user to sign up and pay for an online service for his or her selected subscription term (e.g., annual or monthly).
Our Ratings business is based on a set of proprietary statistical models that use key financial metrics and indicators to rate stocks, mutual funds and ETFs. The data and output from these models are managed and stored within a content management system and updated daily based on changes in markets. The system is capable of search-based syndication of customized ratings data that can be distributed in a variety of technical formats. Our RateWatch business uses proprietary software to input and extract from a commercial database platform financial rate data that we collect through the efforts of our large data collection team. The RateWatch proprietary software automatically generates and distributes customer reports based on our data.
| 5 |
Intellectual Property
To protect our intellectual property (“IP”), we rely on a combination of trademarks, copyrights, patent protection, confidentiality agreements and various other contractual arrangements with our employees, affiliates, customers, strategic partners and others. We own several trademark registrations and copyrights, and have pending trademark and patent applications in the United States. In addition, our Code of Conduct and Business Ethics, employee handbook, and other internal policies seek to protect our IP against misappropriation, infringement, and unfair competition. We also utilize various tools to police the Internet to monitor piracy and unauthorized use of our content. Finally, whether we are contracting out our IP or licensing third-party content and/or technology, we incorporate contractual provisions to protect our IP and seek indemnification for any third-party infringement claims.
However, we cannot provide any guarantee that the foregoing provisions will be adequate to protect us from third-party claims or that these provisions will prevent the theft of our IP, as we may be unable to detect the unauthorized use of, or take appropriate steps to enforce, our IP rights. Failure to adequately protect our intellectual property could harm our brand, devalue our proprietary content, and affect our ability to compete effectively. Further, any infringement claims, even if not meritorious, could result in the expenditure of significant financial and managerial resources on our part, which could materially adversely affect our business, results of operations and financial condition.
Customers
For the years ended December 31, 2015, 2014 and 2013, no single customer accounted for 10% or more of consolidated revenue.
Seasonality
There does not tend to be significant seasonality to our subscription services revenue. There is seasonality in our advertising revenue, as spending by our customers generally tends to be higher in the fourth calendar quarter as compared to other quarters, and the first and third calendar quarters often are lower than the other quarters.
Segments
We operate in one reportable segment. For a discussion of revenue, net income and total assets, see Part II, Items 7 and 8 of this Annual Report on Form 10-K.
Geography
During 2015 and 2014, significantly all of our long-lived assets were located in the United States and Europe. During 2013 all of our long-lived assets were located in the United States. Substantially all of our revenue in 2015, 2014 and 2013 was generated from customers in the United States and Europe. For a discussion of the risks related to foreign operations, see the information in Part I, Item 1A of this Annual Report on Form 10-K under the heading "Risk Factors" under the captions "Our foreign operations subject us to a number of operating, economic, political and regulatory risks that may have a material adverse impact on our financial condition and results of operations" and “Foreign exchange variability could adversely affect our consolidated operating results.”
| 6 |
Employees
As of December 31, 2015, the Company had 651 employees. The Company has never had a work stoppage and none of its employees are represented under collective bargaining agreements. The Company considers its relations with its employees to be good.
Government Regulation
We are subject to government regulation in connection with securities laws and regulations applicable to all publicly-owned companies, as well as laws and regulations applicable to businesses generally, including privacy regulations and taxes levied adopted at the local, state, national and international levels. In recent years, consumer protection regulations, particularly in connection with privacy matters, has become more expansive, and we expect that new laws and regulations will continue to be enacted at the local, state, national and international levels. Such new legislation, alone or combined with increased enforcement of existing laws, could have a material adverse effect on our future operating performance and business due to increased compliance costs.
Available Information
We were founded in 1996 as a limited liability company, and reorganized as a C corporation in 1998. We consummated our initial public offering in 1999 and we file annual, quarterly and current reports, proxy statements and other information with the Securities and Exchange Commission (“SEC”). Our Corporate Website is located at http://www.t.st. We make available free of charge, on or through our Website, our annual, quarterly and current reports, and any amendments to those reports, as soon as reasonably practicable after electronically filing such reports with the SEC. Information contained on our Website is not part of this Report or any other report filed with the SEC.
You may download the information that we file with the SEC at www.sec.gov.
Investing in our Common Stock involves a high degree of risk. You should carefully consider the following risk factors, as well as the other information in this Report, before deciding whether to invest in our Common Stock. Our business, prospects, financial condition or operating results could be materially adversely affected by any of these risks, as well as other risks not currently known to us or that we currently consider immaterial. The trading price of our Common Stock could decline as a result of any of these risks, and you could lose part or all of your investment in our Common Stock. When deciding whether to invest in our Common Stock, you should also refer to the other information in this Report, including our consolidated financial statements and related notes and the information contained in Part II, Item 7 of this Report entitled “Management’s Discussion and Analysis of Financial Condition and Results of Operations.” Please also refer to the Special Note Regarding Forward-Looking Statements appearing in Part I, Item 1 of this Report.
Our quarterly financial results may fluctuate and our future revenue is difficult to forecast.
Our quarterly operating results may fluctuate significantly in the future as a result of a variety of factors, many of which are outside our control, including:
| · | the level of interest and investment in individual stocks versus index funds and exchange-traded funds (ETF) by both individual and institutional investors, which can impact our ability to sell premium subscription products and to sell advertising; |
| 7 |
| · | the overall willingness of potential and existing customers to pay for content distributed over the Internet, where a large quantity of content is available for free; |
| · | demand and pricing for advertising on our Websites, which is affected by advertising budget cycles of our customers, general economic conditions, demand for advertising on the Internet generally, the supply of advertising inventory in the market and actions by our competitors; |
| · | subscription price reductions attributable to decreased demand or increased competition; |
| · | the value to potential and existing customers of the investing ideas we offer in our subscription services and the performance of those ideas relative to appropriate benchmarks; |
| · | new products or services introduced by our competitors; |
| · | content production, specifically video, traffic acquisition costs, and/or other costs; |
| · | for our business-to-business products such as The Deal, BoardEx and Private Raise, the volatility in mergers and acquisitions, restructuring and financing activities; |
| · | for RateWatch, the volatility of interest rates and bank fees and the underlying demand for banking products by consumers; |
| · | costs or lost revenue associated with system downtime affecting the Internet generally or our Websites in particular; |
| · | general economic and financial market conditions; and | |
| · | our ability to attract and retain editorial and managerial talent. |
We had a net loss in each of our last three fiscal years 2015, 2014 and 2013, and have incurred net losses for most years of our history. We may not generate net income in future periods. We forecast our current and future expense levels based on expected revenue and our operating plans, and expect to increase our investments in our business this year with significant strategic investments in technology, marketing and content. These investments are intended to improve our products offered to both consumers and businesses but may not have the desired effect or impact. Because of the above factors, as well as other material risks we face, as described elsewhere in this Report, our operating results may be below the expectations of public market analysts and investors in some future quarters. In such an event, the price of our Common Stock is likely to decline.
Key content contributors, particularly James J. Cramer, are important to our current retail investor product offerings.
Some of our products, particularly our editorial subscription products, reflect the talents, efforts, personalities, investing skills and portfolio returns, and reputations of their respective writers. As a result, the services of these key content contributors, including our co-founder James J. Cramer, form an essential element of our subscription revenue.
In November 2013, we entered into a new four-year employment agreement with Mr. Cramer, our founder and chief markets commentator, which will expire on December 31, 2017, unless renewed. This employment agreement provides for higher payments than the previous one, including a payment of royalties tied to products associated with Mr. Cramer, and includes a minimum guarantee of $2.5 million per year, a licensing fee of $300,000 per year, as well as reimbursement for certain expenses annually. In addition to his content contributions, we benefit from Mr. Cramer’s popularity and visibility, which have provided public awareness of our services and introduced our content to new audiences. For example, Mr. Cramer hosts CNBC’s finance television show, Mad Money. If, however, Mr. Cramer no longer appeared on the show or the program was cancelled for any reason, it could negatively impact his public profile and visibility, and in turn, our subscription products. Further, the continued value of Mr. Cramer’s contributions could be materially adversely affected if Mr. Cramer were to otherwise lose popularity with the public. While we believe we greatly benefit from Mr. Cramer’s contributions and his media exposure for other companies, we can give no assurance that our relationship with Mr. Cramer will lead to higher revenues from our subscription products or improve our organic growth.
| 8 |
In addition to Mr. Cramer, we seek to compensate and provide incentives for key content contributors through competitive salaries, stock ownership and bonus plans and/or royalty arrangements, and we have entered into employment or contributor agreements with certain of them. If we are unable to retain key content contributors, or, should we lose the services of one or more of our key content contributors to death, disability, loss of reputation or other reason, or should their popularity diminish or their investing returns and investing ideas fail to meet or exceed benchmarks and investor expectations, we may fail to attract new content contributors acceptable to readers of our collection of Websites and editorial subscription products. Thus, the loss of services of one or more of our key content contributors could have a material adverse effect on our business, results of operations and financial condition.
We have recently experienced several changes in our management team and will need to recruit, hire and retain additional executive talent which may cause disruption in our business.
We have recently had significant changes in executive leadership. In February 2016, Elisabeth DeMarse resigned as our President and Chief Executive Officer and as a member of our Board of Directors. In connection with Ms. DeMarse’s resignation, Lawrence S. Kramer, the Chairman of our Board of Directors who had recently joined the Board in October 2015 and was named Chairman in December 2015, was appointed as our Interim President and Chief Executive Officer in February 2016. We are currently conducting a search for a full-time replacement. Additionally, in January 2016, Eric Lundberg joined the Company as Chief Financial Officer, filling the role vacated by John C. Ferrara in October 2015. Other recent departures at the end of 2015 include our Chief Business Officer, Erwin Eichmann, and our General Counsel, Vanessa J. Soman.
These changes and the short time interval in which they have occurred have been disruptive to our employees and may add to the risk of control failures, including a failure in the effective operation of our internal control over financial reporting or our disclosure controls and procedures. Additionally, it may take time to hire new executives and for the new management team to become sufficiently familiar with our business and each other to effectively develop and implement our business strategies. Accordingly, disruption to our organization as a result of executive management transition could have a material adverse effect on our business, financial condition and results of operations.
Changes to company strategy, which can often times occur with the appointment of new executives, can create uncertainty, may negatively impact our ability to execute quickly and effectively, and may ultimately be unsuccessful. In addition, executive leadership transition periods are often difficult and tension can result from changes in strategy and management style. Management transition inherently causes some loss of institutional knowledge, which can negatively affect strategy and execution. Until we integrate new personnel, and unless they are able to succeed in their positions, we may be unable to successfully manage and grow our business, and our results of operations and financial condition could suffer as a result. In addition, uncertainty regarding the timing or effectiveness of our management transition process may also harm our reputation and adversely affect the trading price of our common stock.
Our business depends on attracting and retaining capable management and operating personnel.
Our ability to compete in the marketplace depends upon our ability to recruit and retain other key employees, including executives to operate our business, technology personnel to run our publishing, commerce, communications, video and other systems, direct marketers to sell subscriptions to our premium services and salespersons to sell our advertising inventory and subscriptions.
Several, but not all, of our key employees are bound by agreements containing non-competition provisions. There can be no assurances that these arrangements with key employees will provide adequate protections to us or will not result in further management changes that would have material adverse impact on us. In addition, we may incur increased costs to continue to compensate our key executives, as well as other employees, through competitive salaries, stock ownership and bonus plans. Nevertheless, we can make no assurances that these programs will allow us to retain our management or key employees or hire new employees. The loss of one or more of our key employees, or our inability to attract experienced and qualified replacements, could materially adversely affect our business, results of operations and financial condition.
The terms of our Series B Preferred Stock include a substantial liquidation preference, as well as significant control rights.
TCV VI, L.P. and TCV Member Fund, L.P., (together “TCV”) hold all of the shares of our Series B Preferred Stock (“Series B Preferred Stock”), which were originally issued in a November 2007 private placement. These shares are convertible into an aggregate of 3,856,942 shares of our Common Stock, at a conversion price of $14.26 per share, or approximately 10% of our outstanding Common Stock. However, the holders of our Series B Preferred Stock are entitled to a $55 million liquidation preference upon liquidation or dissolution of the Company or upon any change of control event. Accordingly, unless otherwise agreed to by TCV, the liquidation preference entitles the holders of our Series B Preferred Stock to a substantial premium in the event of a sale of the Company, which not only makes it more difficult for a third party to acquire the Company, but also may result in the holders of our Common Stock receiving significantly less than their pro rata share of the proceeds in the event we are acquired.
The holders of the Series B Preferred Stock have the right to vote on any matter submitted to a vote of the stockholders of the Company and are entitled to vote that number of votes equal to the aggregate number of shares of Common Stock issuable upon the conversion of such holders’ shares of Series B Preferred Stock. In addition, TCV has the right to appoint one person to our board of directors, although they are not currently exercising this right.
| 9 |
The affirmative vote of the holders of a majority of Series B Preferred Stock is necessary for the Company to take any of the following actions: (i) authorize, create or issue any class or classes of our capital stock ranking senior to, or on a parity with (as to dividends or upon a liquidation event) the Series B Preferred Stock or any securities exercisable or exchangeable for, or convertible into, any now or hereafter authorized capital stock ranking senior to, or on a parity with (as to dividends or upon a liquidation event) the Series B Preferred Stock; (ii) approve any increase or decrease in the authorized number of shares of Series B Preferred Stock; (iii) approve any amendment, waiver, alteration or repeal of our certificate of incorporation or bylaws in a way that adversely affects the rights, preferences or privileges of the Series B Preferred Stock; (iv) authorize the payment of any dividends (other than dividends paid in capital stock of us or any of our subsidiaries) in excess of $0.10 per share per annum of our Common Stock unless after the payment of such dividends we have unrestricted cash (net of all indebtedness for borrowed money, purchase money obligations, promissory notes or bonds) in an amount equal to at least two times the product obtained by multiplying the number of shares of Series B Preferred Stock outstanding at the time such dividend is paid by the liquidation preference; and (v) authorize the purchase or redemption of: (A) any Common Stock (except for the purchase or redemption from employees, directors and consultants pursuant to agreements providing us with repurchase rights upon termination of their service with us) unless after such purchase or redemption we have unrestricted cash (net of all indebtedness for borrowed money, purchase money obligations, promissory notes or bonds) equal to at least two times the product obtained by multiplying the number of shares of Series B Preferred Stock outstanding at the time such dividend is paid by the liquidation preference; or (B) any class or series of now or hereafter authorized capital stock of ours that ranks junior to (upon a liquidation event) the Series B Preferred Stock.
As a result of the foregoing, TCV may be able to block the proposed approval of any of the above actions, which blockage may prevent us from achieving strategic or other goals dependent on such actions, including without limitation additional capital raising, certain dividend increases and the repurchase of outstanding Common Stock. All of the foregoing rights may limit our ability to take certain actions deemed in the interests of all of our stockholders but as to which the holders of the Series B Preferred Stock have control rights.
We expect to make significant investments in our business in 2016 to increase organic growth, which will reduce our cash and require time to translate to revenue.
Following several years of cost-cutting measures, we intend to make significant investments in our business this year, including launching new versions of our products and unveiling a newly expanded news operation intended to serve all of our businesses. We also intend to make additional strategic investments in technology, marketing and content. These investments may not be successful and will reduce our available cash to spend on other initiatives such as acquisitions of complementary products and services or distributions to our stockholders. In addition, these investments will take some time to translate into increased revenues or may never translate into revenue growth.
| 10 |
We may have difficulty maintaining or increasing our advertising revenue, a significant portion of which is concentrated among our top advertisers and subject to industry and other factors.
Although our reliance on advertising has decreased as an overall component of our revenues, it remains important to our growth. Our ability to maintain or increase our advertising revenue may be adversely affected by a variety of factors. Such factors include general market conditions, seasonal fluctuations in financial news consumption and overall online usage, our ability to maintain or increase our unique visitors, page view inventory and user engagement, our ability to attract audiences possessing demographic characteristics most desired by our advertisers, and our ability to retain existing advertisers and win new advertisers in a number of advertising categories from other Websites, television, newspapers, magazines, newsletters or other new media.
As a general matter, the continued fragmentation of digital media has intensified competition for advertising revenues. Advertising revenue could decline if the relationships we have with high-traffic Websites are adversely affected. In addition, our advertising revenue may decline as a result of pricing pressures on Internet advertising rates due to industry developments, changes in consumer interest in the financial media and other factors in and outside of our control, including in particular as a result of any significant or prolonged downturn in, or periods of extreme volatility of, the financial markets. As the use of mobile accelerates as the “go-to” method of consuming digital content, our ability to monetize mobile content, for which CPMs are lower, is increasingly important. Also, our advertising revenue would be adversely affected if advertisers sought to use third-party networks to attempt to reach our audience while they visit third-party sites instead of purchasing advertising from us to reach our audience on our own sites. Further, any advertising revenue that is performance-based may be adversely impacted by the foregoing and other factors. If our advertising revenue significantly decreases, our business, results of operations and financial condition could be materially adversely affected.
In addition to the headwinds facing digital media advertising, general economic weakness and uncertainty in the United States and globally, while improved, continue to adversely affect and may continue to adversely affect our advertising revenues.
Finally, our top five advertisers accounted for approximately 38% of our total media revenue in 2015. Furthermore, although we have advertisers from outside the financial services industry, such as travel, automotive and technology, a large proportion of our top advertisers are concentrated in financial services, particularly in the online brokerage business. Recent consolidation of financial institutions and other factors could cause us to lose a number of our top advertisers, which could have a material adverse effect on our business, results of operations and financial condition. As is typical in the advertising industry, generally, our advertising contracts have short notice cancellation provisions.
Many individuals are increasingly using mobile devices rather than personal computers to access news and other online services. If we are unable to effectively provide our content and subscription products to users of these devices, our business could be adversely affected.
The number of people who access news and other online services through mobile devices continues to increase at a rapid rate. To date, we have not been able to generate revenue from advertising or content delivered to mobile devices as effectively as we have for advertising or content delivered to personal computers. As our members increasingly use mobile devices to access our online services, if we are unable to successfully implement monetization strategies for our content on mobile devices, if these strategies are not as successful as our offerings for personal computers, or if we incur excessive expenses in this effort, our financial performance and ability to grow revenue would be negatively affected. Additionally, as new devices, such as wearables, and new platforms are continually being released, it is difficult to predict the problems we may encounter in developing versions of our solutions for use on these alternative devices, and we may need to devote significant resources to the creation, support, and maintenance of such new services and products.
| 11 |
Risks associated with our strategic acquisitions could adversely affect our business.
We have completed several acquisitions in recent years, and we may make additional acquisitions and strategic investments in the future. Acquisitions involve numerous risks, including difficulties in the assimilation of the operations and services of the acquired companies as well as the diversion of management’s attention from other business concerns. In addition, there are expenses incurred in connection with these acquisitions and the subsequent assimilation of operations and services, as well as the potential loss of key employees of the acquired company. There can be no assurance that our acquisitions will be successfully integrated into our operations or that we will be able to realize the benefits intended in such acquisitions. In addition, there can be no assurance that we will complete any future acquisitions or that acquisitions will contribute favorably to our operations and financial condition. For example, in October 2014 we acquired Management Diagnostics Limited (“MDL”), a relationship capital management company that offers BoardEx and is headquartered in the U.K. with locations in New York, New York and Chennai, India. This acquisition has helped us expand internationally and is helping to accelerate our transition from primarily serving retail investors to also becoming an indispensable data, news and information source for institutional clients, but we can provide no assurances that our long term strategic objectives will be attained.
Although due diligence and detailed analysis is conducted before these acquisitions are completed, there can be no assurance that such steps can or will fully expose all hidden problems that the acquired company may have. In addition, our valuations and analyses are based on numerous assumptions, and there can be no assurance that those assumptions will be proven correct or appropriate. Relevant facts and circumstances of our analyses could have changed over time, and new facts and circumstances may come to light as to render the previous assumptions and the valuations and analyses based thereon incorrect.
Our foreign operations subject us to a number of operating, economic, political and regulatory risks that may have a material adverse impact on our financial condition and results of operations.
Our acquisition of MDL in October 2014 significantly increased the importance of foreign markets to our future operations and growth and also exposes us to a number of additional risks. Operations outside of the United States may be affected by changes in trade protection laws, policies and measures and other regulatory requirements affecting trade and investment; unexpected regulatory, social, political, or economic changes in a specific country or region; changes in intellectual property, privacy and data protection; import/export regulations in both the United States and foreign countries and difficulties in staffing and managing foreign operations. Political changes, labor strikes, acts of war or terrorism and natural disasters, some of which may be disruptive, can interfere with our data collection, our customers and all of our activities in a particular location. We may also be affected by potentially adverse tax consequences and difficulties associated with repatriating cash generated or held abroad. Since approximately half of MDL’s revenues are generated outside of the United States, the Company’s acquisition of MDL significantly increases our exposure to these risks.
We are now subject to the European Union (“EU”) regulations relating to privacy, including the EU Directive on Data Protection, which imposes significant restrictions on the collection and use of personal data that are more stringent and impose greater burdens on businesses than current privacy standards in the United States. One such burden is a prohibition on the transfer of personal information from the EU to other countries whose laws do not protect personal data to an adequate level of privacy or security. The United States is one such country and this prohibition and the fact we are subject to the EU regulations may impact on our ability to carry out certain aspects of our business in the United States. The EU has recently passed the General Data Protection Regulation, which will result in greater compliance burdens for companies with users and operations in Europe over the next two years. The costs of compliance with, and other burdens imposed by, these laws, regulations and policies that are applicable to us may limit the use and adoption of our products and solutions and could have a material adverse impact on our results of operations.
Foreign operations are also subject to risks of violations of laws prohibiting improper payments and bribery, including the U.S. Foreign Corrupt Practices Act, the U.K. Bribery Act and similar regulations in foreign jurisdictions. The U.K. Bribery Act, for example, prohibits both domestic and international bribery, as well as bribery across both private and public sectors. An organization that fails to prevent bribery committed by anyone associated with the organization can be charged under the U.K. Bribery Act unless the organization can establish the defense of having implemented adequate procedures to prevent bribery. Failure to comply with these laws could subject us to civil and criminal penalties that could have a material adverse impact on our financial condition and results of operations.
| 12 |
If our goodwill and other intangibles becomes impaired, we may be required to record a reduction in such amount which would negatively impact our financial results.
As of December 31, 2015, we had goodwill of $43.3 million and net intangible assets of $18.7 million. Goodwill and intangible asset impairment analysis and measurement is a process that requires significant judgment. Under the provisions of ASC 350, goodwill and indefinite lived intangible assets are required to be tested for impairment on an annual basis and between annual tests whenever circumstances arise that indicate a possible impairment might exist. We perform our annual impairment tests of goodwill and indefinite lived intangible assets as of October 1 each year. Impairment exists when the carrying amount of goodwill and indefinite lived intangible assets exceed their implied fair value, resulting in an impairment charge for this excess. In the past we recorded impairments of goodwill and intangible assets. Although currently we do not anticipate any impairment, we may have to record additional impairments in the future which may materially adversely affect our results of operations and financial condition.
System failure or interruption may result in reduced traffic, reduced revenue and harm to our reputation.
Our ability to provide timely, updated information depends on the efficient and uninterrupted operation of our computer and communications hardware and software systems. Similarly, our ability to track, measure and report the delivery of advertisements on our Websites depends on the efficient and uninterrupted operation of third-party systems. Our operations depend in part on the protection of our data systems and those of our third-party providers against damage from human error, natural disasters, fire, power loss, water damage, telecommunications failure, computer viruses, terrorist acts, vandalism, sabotage, and other adverse events. Although we utilize the services of third-party cloud computing providers, specifically Amazon Web Services with procedural security systems and have put in place certain other disaster recovery measures, including offsite storage of backup data, these disaster recovery measures currently may not be comprehensive enough and there is no guarantee that our Internet access and other data operations will be uninterrupted, error-free or secure. Any system failure, including network, software or hardware failure, that causes an interruption in our service or a decrease in responsiveness of our Websites could result in reduced traffic, reduced revenue and harm to our reputation, brand and relations with our advertisers and strategic partners. Our insurance policies may not adequately compensate us for such losses. In such event, our business, results of operations and financial condition could be materially adversely affected.
Our Ratings models, purchased from a third party, were written in legacy technologies that do not have robust backup or recovery provisions. The ongoing production of valid ratings data is based upon the successful continued migration of these legacy systems to more robust and current systems. The hardware platforms upon which these applications run have been migrated to more modern equipment within our multi-redundant hosting facilities; however, many of the core application code remains in production. Migration of such complex applications is time consuming, resource intensive and can pose considerable risk.
Disruptions to our third-party technology providers and management systems could harm our business and lead to loss of customers and advertisers.
We depend on third-party technology providers and management systems to distribute our content and process transactions. For example, we use Fastly and Amazon Web Services to help us efficiently distribute our content to customers. We also use a third party vendor to process credit cards for our subscriptions. We exercise no control over our third-party vendors, which makes us vulnerable to any errors, interruptions, or delays in their operations. Any disruption in the services provided by these vendors could have significant adverse impacts on our business reputation, advertiser and customer relations and operating results. Upon expiration or termination of any of our agreements with third-party vendors, we may not be able to replace the services provided to us in a timely manner or on terms and conditions, including service levels and cost, that are favorable to us, and a transition from one vendor to another vendor could subject us to operational delays and inefficiencies until the transition is complete.
| 13 |
We may face liability for, or incur costs to defend, information published in our services.
From time to time we are subject to claims for defamation, libel, copyright or trademark infringement, fraud or negligence, or other theories of liability, in each case relating to the articles, commentary, investment recommendations, ratings, or other information we provide through our services. We maintain insurance to provide coverage with respect to such claims, but our insurance may not adequately protect us against these claims. For example, from time to time, actions filed against us include claims for punitive damages, which are excluded from coverage under our insurance policies.
Failure to establish and maintain successful strategic relationships with other companies could decrease our subscriber and user base.
We rely in part on establishing and maintaining successful strategic relationships with other companies to attract and retain a portion of our current subscriber and reader base and to enhance public awareness of our brands. In particular, our relationships with Yahoo! Finance, MSN Money and CNN Money, which index our headlines and/or host our content including our video offerings, have been important components of our effort to enhance public awareness of our brands, which awareness we believe also is enhanced by the public appearances of James J. Cramer, in particular on his “Mad Money” television program and on “Squawk on the Street”, both of which are telecast by CNBC. If we do not successfully establish and maintain our strategic relationships on commercially reasonable terms or if these relationships do not attract significant revenue, our business, results of operations and financial condition could be materially adversely affected.
Difficulties associated with our brand development may harm our ability to attract subscribers to our paid services and users to our advertising-supported services.
We believe that maintaining and growing awareness about our services is an important aspect of our efforts to continue to attract users. Our efforts to build brand awareness may not be cost effective or successful in reaching potential users, and some potential users may not be receptive to our marketing efforts or advertising campaigns. Accordingly, we can make no assurances that such efforts will be successful in raising awareness of our brands or in persuading potential users to subscribe to or use our services.
Our ability to successfully attract and retain subscribers to our subscription services may be affected by the perceived quality of the content, including the performance of investment ideas we publish, and other factors.
Our ability to successfully attract and retain subscribers to our subscription services depends on the quality of the content of the services, including the performance of any investment ideas published in the services. To the extent the returns on such portfolios fail to meet or exceed the expectations of our subscribers or the performance of relevant benchmarks, our ability to attract new subscribers or retain existing subscribers to such services will be adversely affected. Additionally, factors such as the expiration of temporary product promotions, changes in our renewal policies or practices for subscribers to our subscription services, or changes in the degree of credit card failures could have a material impact on customer retention.
Failure to maintain our reputation for trustworthiness may harm our business.
Our brand is based upon the integrity of our editorial content. We are proud of the trust and reputation for quality we have developed over the course of 20 years and we seek to renew and deepen that trust continually. We require all of our content contributors, whether employees or outside contributors, to adhere to strict standards of integrity, including standards that are designed to prevent any actual or potential conflict of interest, and to comply with all applicable laws, including securities laws. The occurrence of events such as our misreporting a news story, the non-disclosure of a stock ownership position by one or more of our content contributors, the manipulation of a security by one or more of our content contributors, or any other breach of our compliance policies, could harm our reputation for trustworthiness and reduce readership. In addition, in the event the reputation of any of our directors, officers, key contributors, writers or editorial staff were harmed for any other reason, we could suffer as result of our association with the individual, and also could suffer if the quantity or value of future services we received from the individual was diminished. These events could materially adversely affect our business, results of operations and financial condition.
| 14 |
Our revenue could be adversely affected if the securities markets and/or mergers and acquisitions activity decline, are stagnant or experience extreme volatility.
Our results of operations, particularly related to subscription revenue, are affected by certain economic factors, including the performance of the securities markets and mergers and acquisitions activity. While we believe investors and dealmakers are seeking more information related to the financial markets and mergers and acquisitions from trusted sources, the existence of adverse or stagnant securities markets conditions and lack of investor confidence could result in investors decreasing their interest in investor-related and deal-related publications, which could adversely affect the subscription revenue we derive from our subscription based Websites and newsletters.
We may not adequately protect our own intellectual property and may incur costs to defend against, or face liability for, intellectual property infringement claims of others.
To protect our intellectual property (“IP”), we rely on a combination of trademarks, copyrights, patent protection, confidentiality agreements and various other contractual arrangements with our employees, affiliates, customers, strategic partners and others. We own several trademark registrations and copyrights, and have pending trademark and patent applications, in the United States. In addition, our Code of Conduct and Business Ethics, employee handbook, and other internal policies seek to protect our IP against misappropriation, infringement, and unfair competition. We also utilize various tools to police the Internet to monitor piracy and unauthorized use of our content. Finally, whether we are contracting out our IP or licensing third-party content and/or technology, we incorporate contractual provisions to protect our IP and seek indemnification for any third-party infringement claims.
However, we cannot provide any guarantee that the foregoing provisions will be adequate to protect us from third-party claims or that these provisions will prevent the theft of our IP, as we may be unable to detect the unauthorized use of, or take appropriate steps to enforce, our IP rights. Failure to adequately protect our intellectual property could harm our brand, devalue our proprietary content, and affect our ability to compete effectively. Further, any infringement claims, even if not meritorious, could result in the expenditure of significant financial and managerial resources on our part, which could materially adversely affect our business, results of operations and financial condition.
We face intense competition.
Many of our competitors have longer operating histories, greater name recognition, larger customer bases and significantly greater financial, technical and marketing resources than we have. Increased competition could result in price reductions, reduced margins or loss of market share, any of which could materially adversely affect our business, results of operations and financial condition. Accordingly, we cannot guarantee that we will be able to compete effectively with our current or future competitors or that this competition will not significantly harm our business.
| 15 |
Our services face intense competition from other providers of business, personal finance, investing and ratings content, including:
| · | online services or Websites focused on business, personal finance or investing, such as The Wall Street Journal Digital Network, CNN Money, Forbes.com, Reuters.com, Bloomberg.com, Seeking Alpha, Business Insider and CNBC.com, as well as financial portals such as Yahoo! Finance, AOL Daily Finance and MSN Money; |
| · | publishers and distributors of traditional media focused on business, personal finance or investing, including print and radio, such as The Wall Street Journal and financial talk radio programs, and business television networks such as Bloomberg, CNBC and the Fox Business Channel; |
| · | investment newsletter publishers, such as The Motley Fool, Stansberry & Associates Investment Research and Investor Place Media; |
| · | other providers of business intelligence on mergers and acquisitions, restructurings and financings, such as Bloomberg and Mergermarket Group; |
| · | established ratings services, such as Standard & Poor’s, Morningstar and Lipper, with respect to our Ratings products, and rate database providers such as Informa and SNL Kagan, with respect to our RateWatch products; and | |
| · | other providers of director, officer and dealmaker data, including Bloomberg, S&P Capital IQ, Dow Jones, The New York Stock Exchange, LexisNexis, Relationship Science, and Thomson Reuters. |
Additionally, advances in technology have reduced the cost of production and online distribution of print, audio and video content, which has resulted in the proliferation of providers of free content. We compete with these other publications and services for customers, including subscribers, readers and viewers of our video content, for advertising revenue, and for employees and contributors to our services. Our ability to compete successfully depends on many factors, including the quality, originality, timeliness, insightfulness and trustworthiness of our content and that of our competitors, the popularity and performance of our contributors, the success of our recommendations and research, our ability to introduce products and services that keep pace with new investing trends, our ability to adopt and deploy new technologies for running our business, the ease of use of services developed either by us or our competitors and the effectiveness of our sales and marketing efforts. In addition, media technologies and platforms are rapidly evolving and the rate of consumption of media on various platforms may shift rapidly. If we fail to offer our content through the platforms in which our audience desires to consume it, or if we do not have offerings on such platforms that are as compelling as those of our competitors, our business, results of operations and financial condition may be materially adversely affected. In addition, the economics of distributing content through new platforms may be materially different from the economics of distributing content through our current platforms and any such difference may have a material adverse effect on our business, results of operations and financial condition.
We face government regulation and legal uncertainties.
We are subject to government regulation in connection with securities laws and regulations applicable to all publicly-owned companies, as well as laws and regulations applicable to businesses generally, including privacy regulations and taxes levied adopted at the local, state, national and international levels. In recent years, consumer protection regulations, particularly in connection with the Internet, have become more aggressive, and we expect that new laws and regulations will continue to be enacted at the local, state, national and international levels. Such new legislation, alone or combined with increasingly aggressive enforcement of existing laws, could have a material adverse effect on our future operating performance and business due to increased compliance costs.
| 16 |
Foreign exchange variability could adversely affect our consolidated operating results
Our growth strategy contemplates increased services to foreign and domestic customers. As a consequence of expanding the footprint of the Company to markets outside of the United States, in particular the United Kingdom, we will be exposed to market risks from changes in interest rates and foreign currency exchange rates that may adversely affect our results of operations and financial condition. We do not engage in currency hedging or have any positions in derivative instruments to hedge our currency risk. Our reported revenue could suffer if certain foreign currencies, principally the British pound, decline relative to the U.S. dollar, although the impact on operating income would likely be offset in part by an opposing currency impact on locally based operating expense. Conversely, if the U.S. dollar were to weaken against the British pound, assuming all other variables remained constant, our revenues would increase, having a positive impact on earnings, and our overall expenses would increase, having a negative impact on earnings. Also, by virtue of our cross-border operations, we will be subject to the risks normally associated with such activities, including those relating to delayed payments from customers in some countries or difficulties in the collection of receivables generally.
In addition, we will be exposed to the risk of changes in social, political and economic conditions in the countries where we engage in business. Political and economic instability in these countries could adversely affect our business activities and operations. Unexpected changes in local regulatory requirements, tariffs and other trade barriers and price or exchange controls could limit operations and make the repatriation of profits difficult. In addition, the uncertainty of differing legal environments could limit our ability to effectively enforce our rights in some markets.
Any failure of our internal security measures or breach of our privacy protections could cause us to lose users and subject us to liability.
Users who subscribe to our paid subscription services are required to furnish certain personal information (including name, mailing address, phone number, email address and credit card information), which we use to administer our services. We also require users of some of our free services and features to provide us with some personal information during the membership registration process. Additionally, we rely on security and authentication technology licensed from third parties to perform real-time credit card authorization and verification, and at times rely on third parties, including technology consulting firms, to help protect our infrastructure from security threats. We may have to continue to expend capital and other resources on the hardware and software infrastructure that provides security for our processing, storage and transmission of personal information.
| 17 |
In this regard, our users depend on us to keep their personal information safe and private and not to disclose it to third parties or permit our security to be breached. However, advances in computer capabilities, new discoveries in the field of cryptography or other events or developments, including improper acts by third parties, may result in a compromise or breach of the security measures we use to protect the personal information of our users. If a party were to compromise or breach our information security measures or those of our agents, such party could misappropriate the personal information of our users, cause interruptions in our operations, expose us to significant liabilities and reporting obligations, damage our reputation and discourage potential users from registering to use our Websites or other services, any of which could have a material adverse effect on our business, results of operations and financial condition.
We utilize various third parties to assist with various aspects of our business. Some of these partnerships require the exchange of user information. This is required because some features of our Websites may be hosted by these third parties. While we take significant measures to guarantee the security of our customer data and require such third parties to comply with our privacy and security policies as well as generally be contractually bound to defend, indemnify and hold us harmless with respect to any claims related to any breach of relevant privacy laws related to the service provider, we are still at risk if any of these third-party systems are breached or compromised and may in such event suffer a material adverse effect to business, results of operations and financial condition.
Our charter documents and Delaware law could prevent a takeover that stockholders consider favorable and could also reduce the market price of our common stock.
Our certificate of incorporation and our bylaws contain provisions that could delay or prevent a change in control of our company. These provisions could also make it more difficult for stockholders to elect directors and take other corporate actions. These provisions include:
| • | providing for a classified board of directors with staggered, three-year terms; |
| • | not providing for cumulative voting in the election of directors; |
| • | permitting an amendment of our certificate of incorporation only through a super-majority vote of the stockholders; |
| • | prohibiting stockholder action by written consent; |
| • | require that, to the fullest extent permitted by law and unless we consent to an alternate forum, certain proceedings against or involving us or our directors, officers, or employees be brought exclusively in the Court of Chancery in the State of Delaware; |
| • | limiting the persons who may call special meetings of stockholders; and |
| • | requiring advance notification for stockholder director nominations and other proposals. |
These and other provisions in our certificate of incorporation, our bylaws, and under Delaware law could discourage potential takeover attempts, reduce the price that investors might be willing to pay for shares of our common stock in the future and result in the market price being lower than it would be without these provisions.
If our ability to use our tax operating loss carryforwards and other tax attributes is limited, we may not receive the benefit of those assets.
We have net operating loss carryforwards of approximately $154 million as of December 31, 2015, available to offset future taxable income through 2035. These net operating losses date back to December 1999 and will begin expiring in 2019. Our ability to fully utilize these net operating loss carryforwards is dependent upon the generation of future taxable income before the expiration of the carryforward period attributable to these net operating losses. Furthermore, as a result of prior ownership changes under section 382 of the Internal Revenue Code of 1986, as amended, approximately $123 million of these net operating losses will be subject to certain limitations.
Investment of our cash carries risks.
Financial instruments that subject us to concentrations of credit risk consist primarily of cash, cash equivalents and restricted cash. We maintain all of our cash, cash equivalents and restricted cash in seven financial institutions and perform periodic evaluations of the relative credit standing of these institutions. No assurances can be made that the third-party institutions will retain acceptable credit ratings or investment practices. Investment decisions of third parties and market conditions may adversely affect our cash balances and financial condition. While we believe our investment policy is conservative, there can be no assurance that we will not suffer losses on any of our investments.
| 18 |
If we fail to maintain proper and effective internal controls, our ability to produce accurate and timely financial statements could be impaired and investors’ views of us could be harmed.
As a Public Company, we are required to maintain internal control over financial reporting and to report any material weaknesses in such internal controls. We have evaluated and tested our internal controls in order to allow management to report on our internal controls, as required by Section 404 of the Sarbanes-Oxley Act of 2002. If we are not able to meet the requirements of Section 404 in a timely manner or with adequate compliance, we would be required to disclose material weaknesses if they develop or are uncovered and we may be subject to sanctions or investigation by regulatory authorities, such as the Securities and Exchange Commission. Any such action could negatively impact the perception of us in the financial market and our business.
In addition, our internal controls may not prevent or detect all errors and fraud. A control system, no matter how well designed and operated, is based upon certain assumptions and can provide only reasonable assurance that the objectives of the control system will be met.
If securities or industry analysts do not publish research or reports about our business, or if they publish negative reports about our business, our stock price and trading volume could decline.
The trading market for our common stock may be influenced by the research and reports that securities or industry analysts publish about us or our business. We do not have control over these analysts. If one or more of the analysts who cover us downgrade our stock or change their opinion of our shares or publish inaccurate or unfavorable research about our business, our stock price would likely decline. If one or more of these analysts cease coverage of our company or fail to publish reports on us regularly, we could lose visibility in the financial markets, which could cause our stock price or trading volume to decline.
If we are unable to satisfy the continued listing requirements of The NASDAQ Stock Market, our common stock could be delisted and the price and liquidity of our common stock may be adversely affected.
Our common stock is currently listed on The NASDAQ Global Market. To maintain the listing of our common stock, we are required to meet certain listing requirements, including, among others, a requirement to maintain a minimum closing bid price of $1.00 per share. If our common stock trades below the $1.00 minimum closing bid price requirement for 30 consecutive business days or if we do not meet other listing requirements, we may be notified by NASDAQ of non-compliance. Our common stock recently closed below $1.00 per share on February 25, 2016 and has been closing at or below $1.00 per share since that date and through the filing of this report. If the price per share of our common stock were to fall below NASDAQ listing standards, our common stock may be delisted. If we are notified by NASDAQ of non-compliance with the $1.00 minimum closing bid price requirement, we would regain compliance if our common stock trades above $1.00 per share for ten consecutive business days during the 180 days following notice of non-compliance. We may also be permitted to transfer our listing to the Nasdaq Capital Market, which would provide us an additional 180 days to regain compliance with the minimum closing bid price requirement. If our common stock is delisted, market liquidity for our common stock could be severely affected and our stockholders’ ability to sell their shares of our common stock could be limited. In addition, our common stock could be subject to “penny stock” rules which impose additional disclosure requirements on broker-dealers and could further negatively impact our market liquidity for our common stock and our stockholders’ ability to sell their shares of our common stock. Accordingly, a delisting of our common stock from NASDAQ would negatively affect the value of our common stock. Delisting could also have other negative results, including, but not limited to, the loss of institutional investor interest.
Item 1B. Unresolved Staff Comments.
None.
We do not own any real property and we lease all of our facilities. Our principal administrative, sales, marketing, and editorial facilities currently reside in a facility encompassing approximately 35,000 square feet of office space on one floor in an office building at 14 Wall Street in New York, New York. Bankers Financial Products Corporation (d/b/a RateWatch) occupies approximately 16,000 square feet of office space in Fort Atkinson, Wisconsin. The Deal, LLC occupies approximately 2,211 square feet of office space in Petaluma, California and approximately 350 square feet of office space in Washington, D.C. The Deal’s U.K. subsidiary, Management Diagnostic Limited (“MDL”), occupies approximately 8,202 square feet of office space in London, England, and MDL’s subsidiary, BoardEx India Private Limited, occupies approximately 22,480 square feet of office space in Chennai, India. We also remain responsible for a sublease of approximately 21,500 square feet of office space in an office building at 20 Broad Street in New York, New York, which we in turn have sublet to another tenant.
The Company is party to legal proceedings arising in the ordinary course of business or otherwise, none of which is deemed material.
Item 4. Mine Safety Disclosures
Not applicable.
| 19 |
| Item 5. | Market for Registrant’s Common Equity, Related Stockholder Matters and Issuer Purchases of Equity Securities. |
We have been a Nasdaq-listed company since May 11, 1999 and our Common Stock currently is quoted on the Nasdaq Global Market under the symbol TST. There is no public trading market for our Series B Preferred Stock. The following table sets forth, for the periods indicated, the high and low closing sales prices per share of the Common Stock as reported on the Nasdaq Global Market.
| Low | High | |||||||
| 2014 | ||||||||
| First quarter | $ | 2.20 | $ | 2.94 | ||||
| Second quarter | $ | 2.30 | $ | 2.68 | ||||
| Third quarter | $ | 2.12 | $ | 2.55 | ||||
| Fourth quarter | $ | 2.10 | $ | 2.46 | ||||
| 2015 | ||||||||
| First quarter | $ | 1.75 | $ | 2.30 | ||||
| Second quarter | $ | 1.72 | $ | 1.97 | ||||
| Third quarter | $ | 1.59 | $ | 1.92 | ||||
| Fourth quarter | $ | 1.44 | $ | 1.73 | ||||
On March 3, 2016, the last reported sale price for our Common Stock was $0.89 per share.
The graph below compares the cumulative total stockholder return on the Company’s Common Stock from December 31, 2010 through December 31, 2015 with the cumulative total return on the Nasdaq Composite Index and the Research Data Group (RDG) Internet Composite Index. The performance graph is based upon closing prices on December 31st of each year other than 2011, which is based on the closing price on December 30, 2011, the last trading day before December 31, 2011. The comparison assumes $100 was invested on December 31, 2010 in the Company’s Common Stock and in each of the foregoing indices and assumes reinvestment of dividends. The returns shown are based upon historical results and are not intended to suggest future performance.
| 20 |
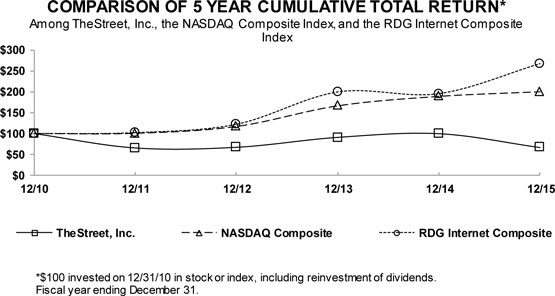
| ASSUMES $100 INVESTED ON DECEMBER 31, 2010 AND REINVESTMENT OF ALL DIVIDENDS | ||||||||||||||||||||||||
| December 31, | ||||||||||||||||||||||||
| 2010 | 2011 | 2012 | 2013 | 2014 | 2015 | |||||||||||||||||||
| TheStreet, Inc. | 100.00 | 65.55 | 67.10 | 90.80 | 99.59 | 66.35 | ||||||||||||||||||
| NASDAQ Composite | 100.00 | 100.53 | 116.92 | 166.19 | 188.78 | 199.95 | ||||||||||||||||||
| RDG Internet Composite | 100.00 | 102.11 | 122.23 | 199.42 | 195.42 | 267.25 | ||||||||||||||||||
Holders
The number of holders of record of our Common Stock on March 3, 2016 was 181 which does not include beneficial owners of our Common Stock whose shares are held in the names of various dealers, clearing agencies, banks, brokers and other fiduciaries.
Dividends
For each of the four quarters in the years ended December 31, 2015 and 2014, the Company paid a quarterly cash dividend of $0.025 per share on its Common Stock and its Series B Preferred Stock on a converted common share basis. For the years ended December 31, 2015 and 2014, the dividend payments totaled approximately $3.9 million and $3.9 million, respectively. The Certificate of Designations for the Series B Preferred Stock currently prohibits the Company from paying cash dividends in excess of $0.10 per share per annum without the prior approval of holder of the Series B Preferred Stock. The Company does not intend to pay a cash dividend for the first quarter of 2016 and will continue to evaluate the uses of its cash in 2016 in connection with planned investments in the business.
Issuer Purchases of Equity Securities
The Company did not repurchase any shares of its Common Stock during the year ended December 31, 2015 as the affirmative vote of the holders of a majority of the outstanding shares of Series B Preferred Stock, voting separately as a single class, is currently necessary in order for us to repurchase any of our Common Stock. Absent the consent of the holders of our Series B Preferred Stock, the Company will be unable to conduct share repurchases. For additional information, see Item 7 “Management’s Discussion and Analysis of Financial Condition and Results of Operations — Treasury Stock” and Item 1A “Risk Factors — The terms of our Series B Preferred Stock include a substantial liquidation preference, as well as significant control rights.”
| 21 |
Item 6. Selected Financial Data.
The following selected financial data is qualified by reference to, and should be read in conjunction with, our audited consolidated financial statements and the notes to those statements and “Management’s Discussion and Analysis of Financial Condition and Results of Operations” appearing elsewhere herein. The selected statement of operations data presented below for the years ended December 31, 2015, 2014 and 2013, and the balance sheet data as of December 31, 2015 and 2014, are derived from our audited consolidated financial statements included elsewhere herein. The selected statement of operations data presented below for the years ended December 31, 2012 and 2011 and the balance sheet data as of December 31, 2013, 2012 and 2011 have been derived from our audited consolidated financial statements, which are not included herein.
| For the Year Ended December 31, | ||||||||||||||||||||
| 2015 | 2014 | 2013 | 2012 | 2011 | ||||||||||||||||
| (In thousands, except per share data) | ||||||||||||||||||||
| Statement of Operations Data: (1) | ||||||||||||||||||||
| Net revenue: | ||||||||||||||||||||
| Subscription services | $ | 55,206 | $ | 48,036 | $ | 43,549 | $ | 37,149 | $ | 38,901 | ||||||||||
| Media | 12,450 | 13,017 | 10,901 | 13,572 | 18,859 | |||||||||||||||
| Total net revenue | 67,656 | 61,053 | 54,450 | 50,721 | 57,760 | |||||||||||||||
| Operating expense: | ||||||||||||||||||||
| Cost of services | 33,616 | 31,731 | 27,432 | 24,886 | 26,499 | |||||||||||||||
| Sales and marketing | 16,191 | 15,600 | 14,453 | 13,396 | 16,682 | |||||||||||||||
| General and administrative | 15,000 | 13,947 | 12,219 | 13,638 | 15,811 | |||||||||||||||
| Depreciation and amortization | 4,309 | 3,179 | 3,769 | 5,512 | 5,757 | |||||||||||||||
| Restructuring and other charges | (1,221 | ) | — | 386 | 6,590 | 1,826 | ||||||||||||||
| Loss (gain) on disposition of assets | — | — | 187 | (233 | ) | — | ||||||||||||||
| Total operating expense | 67,895 | 64,457 | 58,446 | 63,789 | 66,575 | |||||||||||||||
| Operating loss | (239 | ) | (3,404 | ) | (3,996 | ) | (13,068 | ) | (8,815 | ) | ||||||||||
| Net interest (expense) income | (123 | ) | 89 | 210 | 353 | 668 | ||||||||||||||
| Loss on sales of marketable securities | — | — | — | — | (35 | ) | ||||||||||||||
| Loss from continuing operations before income taxes | (362 | ) | (3,315 | ) | (3,786 | ) | (12,715 | ) | (8,182 | ) | ||||||||||
| Provision for income taxes | 1,181 | 475 | — | — | — | |||||||||||||||
| Loss from continuing operations | (1,543 | ) | (3,790 | ) | (3,786 | ) | (12,715 | ) | (8,182 | ) | ||||||||||
| Discontinued operations: | ||||||||||||||||||||
| Loss on disposal of discontinued operations | — | — | — | — | (2 | ) | ||||||||||||||
| Loss from discontinued operations | — | — | — | — | (2 | ) | ||||||||||||||
| Net loss | (1,543 | ) | (3,790 | ) | (3,786 | ) | (12,715 | ) | (8,184 | ) | ||||||||||
| Preferred stock cash dividends | 386 | 386 | — | 193 | 386 | |||||||||||||||
| Net loss attributable to common stockholders | $ | (1,929 | ) | $ | (4,176 | ) | $ | (3,786 | ) | $ | (12,908 | ) | $ | (8,570 | ) | |||||
| Cash dividends paid on common shares | $ | 3,539 | $ | 3,477 | $ | — | $ | 1,636 | $ | 3,447 | ||||||||||
| Basic and diluted net loss per share: | ||||||||||||||||||||
| Net loss attributable to common stockholders | $ | (0.06 | ) | $ | (0.12 | ) | $ | (0.11 | ) | $ | (0.39 | ) | $ | (0.27 | ) | |||||
| Weighted average basic and diluted shares outstanding | 34,839 | 34,371 | 33,725 | 32,710 | 31,954 | |||||||||||||||
| Cash dividends declared and paid per common share | $ | 0.10 | $ | 0.10 | $ | — | $ | 0.05 | $ | 0.10 | ||||||||||
| 22 |
| December 31, | ||||||||||||||||||||
| 2015 | 2014 | 2013 | 2012 | 2011 | ||||||||||||||||
| (In thousands) | ||||||||||||||||||||
| Balance Sheet Data (1): | ||||||||||||||||||||
| Cash and cash equivalents, current and noncurrent marketable securities, current and noncurrent restricted cash | $ | 30,697 | $ | 37,329 | $ | 59,842 | $ | 60,541 | $ | 75,315 | ||||||||||
| Working capital | 2,074 | 5,326 | 31,208 | 18,829 | 46,013 | |||||||||||||||
| Total assets | 102,892 | 111,932 | 108,894 | 111,535 | 121,413 | |||||||||||||||
| Long-term obligations, less current maturities | 7,267 | 7,639 | 4,959 | 4,629 | 4,857 | |||||||||||||||
| Total stockholders’ equity | 61,994 | 67,870 | 74,163 | 75,458 | 88,144 | |||||||||||||||
| (1) | Acquisitions of businesses we have made are included in our consolidated financial statements beginning on the dates of acquisition. Acquisitions we have made for the periods indicated above consist of: MDL in October 2014; The DealFlow Report, The Life Settlements Report and the PrivateRaise database in April 2013; and The Deal, LLC in September 2012. See “Management’s Discussion and Analysis of Financial Condition and Results of Operations” and Note 2 to Consolidated Financial Statements (Acquisitions) for additional information regarding our acquisitions. |
Item 7. Management’s Discussion and Analysis of Financial Condition and Results of Operations.
Please refer to the Special Note Regarding Forward-Looking Statements appearing in Part I, Item 1 of this Report.
The following discussion and analysis should be read in conjunction with the Company’s audited consolidated financial statements and notes thereto.
Overview
TheStreet, Inc., together with its wholly owned subsidiaries (“TheStreet”, “we”, “us” or the “Company”), is a leading digital financial media company focused on the financial and mergers and acquisitions environment. The Company’s collection of digital services provides users, subscribers and advertisers with a variety of content and tools through a range of online, social media, tablet and mobile channels. Our mission is to provide investors and advisors with actionable ideas from the world of investing, finance and business, and dealmakers with sophisticated analysis of the mergers and acquisitions environment in order to break down information barriers, level the playing field and help all individuals and organizations grow their wealth. With a robust suite of digital services, TheStreet offers the tools and insights needed to make informed decisions about earning, investing, saving and spending money. Since its inception in 1996, TheStreet believes it has distinguished itself from other financial media companies with its journalistic excellence, unbiased approach and interactive multimedia coverage of the financial markets, economy, industry trends, investment and financial planning.
Subscription Services
Subscription services revenue is comprised of subscriptions, licenses and fees for access to securities investment information, stock market commentary, rate services, director and officer profiles, relationship capital management services, and transactional information pertaining to mergers and acquisitions and other changes in the corporate control environment. Subscription services contributed 82% of our total revenue in 2015, as compared to 79% in 2014 and 80% in 2013. The increase is primarily the result of the acquisition of MDL in October 2014.
| 23 |
We believe we were one of the first companies to successfully create a large scale, consumer-focused, digital subscription services content business. We believe we have been able to successfully build our subscription services business because we have established a track record for over 20 years of providing high quality, independent investing ideas that have produced financial value for our readers. We believe our track record provides us with a competitive advantage and we will seek to enhance the value of our leading brand and our ability to monetize that value.
In addition to our consumer-focused subscription products, which include RealMoney, RealMoney Pro, Action Alerts PLUS, TheStreet Quant Ratings, and Stocks Under $10, our subscription services business also includes information and transactional services revenue from RateWatch and The Deal.
RateWatch maintains a constantly-updated database of deposit, loan and fee rate data from over 100,000 financial institutions. This historical and real-time rate data is licensed to financial institutions, government agencies, educational researchers and commercial organizations. Data is provided in formats ranging from standard rate templates to large raw data files for use with third party analytical tools. The RateWatch product line also includes banking-related product and fee comparisons, financial strength reporting, educational webinars, mystery shopping and consumer and financial institution surveys.
In September 2012, the Company acquired The Deal and transformed its business into a digital subscription platform that delivers sophisticated coverage on changes in corporate control, including mergers and acquisitions, private equity, corporate activism and restructuring. In April 2013, the Company acquired The DealFlow Report, The Life Settlements Report and the PrivateRaise database from DealFlow Media, Inc. to further broaden the information and services available to institutional investors. These newsletters and database, and the employees providing their content, have been incorporated into The Deal.
Additionally, in October 2014, the Company acquired Management Diagnostics Limited (“MDL”), a privately held company headquartered in London, England to expand the Company’s international operations and further the Company’s transition from primarily serving retail investors to also becoming an indispensable data and business intelligence source for institutional clients. Founded in 1999, MDL is the owner of BoardEx, an institutional relationship capital management database and platform. Clients, including investment banks, consultancies, executive search firms, law firms and academia, use BoardEx to leverage their relationships and facilitate business and corporate development initiatives. MDL’s products and services, and the employees providing these products and services have been incorporated into The Deal.
Our subscription services revenue also includes revenue generated from syndication and licensing of data from TheStreet Ratings (“Ratings”), which tracks the risk-adjusted performance of more than 20,000 mutual funds and exchange-traded funds (ETFs) and more than 4,000 stocks.
Media
Media revenue is comprised of fees charged for the placement of advertising and sponsorships within TheStreet and its affiliated properties, event and other miscellaneous revenue. Media contributed 18% of our total revenue in 2015, as compared to 21% in 2014 and 20% in 2013. The decrease is primarily the result of the acquisition of MDL in October 2014, which added to the Company’s subscription services revenue.
| 24 |
Our advertising-supported properties, which include TheStreet, MainStreet, Stockpickr and Real Money, attract one of the largest and most affluent audiences of any digital publisher in our content vertical. TheStreet, with its enviable track record as a leading and distinctive digital voice in the financial category, is regarded as a must-buy for most of our core online brokerage advertisers and a highly effective means for other financial services companies and non-endemic advertisers to communicate with our engaged, affluent audience. Our direct sales team sells the full capabilities of TheStreet and its affiliated properties via sponsorships, custom programs, video, mobile, newsletters, audience targeting, native advertising, social amplification and distribution as well as programmatic direct and real time bidding.
Our media revenue also includes revenue generated from syndication and licensing of data as well as other miscellaneous, non-subscription related sources.
Results of Operations
Comparison of Fiscal Years Ended December 31, 2015 and 2014
Revenue
| For the Year Ended December 31, | ||||||||||||||||||||
| Revenue: | 2015 | Percent of Total | 2014 | Percent of Total Revenue | Percent Change | |||||||||||||||
| Subscription services | $ | 55,205,507 | 82 | % | $ | 48,035,953 | 79 | % | 15 | % | ||||||||||
| Media | 12,450,393 | 18 | % | 13,017,265 | 21 | % | -4 | % | ||||||||||||
| Total revenue | $ | 67,655,900 | 100 | % | $ | 61,053,218 | 100 | % | 11 | % | ||||||||||
Subscription services. Subscription services revenue is comprised of subscriptions, licenses and fees for access to securities investment information, stock market commentary, rate services, director and officer profiles, relationship capital management services, and transactional information pertaining to mergers and acquisitions and other changes in the corporate control environment. Revenue is recognized ratably over the contract period.
Subscription services revenue for the year ended December 31, 2015 increased by approximately $7.2 million, or 15%, when compared to the year ended December 31, 2014. The increase was the result of approximately $8.1 million of additional revenue related to the operations of Management Diagnostics Limited (“MDL”), which was acquired on October 31, 2014 and therefore contributed only two months of revenue in the prior year period. Excluding the impact of MDL in both periods, revenue for the year ended December 31, 2015 decreased by approximately $934 thousand, or 2%, when compared to the year ended December 31, 2014. The decrease was primarily related to a 2% decrease in the weighted-average number of subscriptions, while the average revenue recognized per subscription remained flat over the periods.
Media. Media revenue is comprised of fees charged for the placement of advertising and sponsorships within TheStreet and its affiliated properties, event and other miscellaneous revenue.
Media revenue for the year ended December 31, 2015 decreased by approximately $567 thousand, or 4%, when compared to the year ended December 31, 2014. The decrease in advertising revenue was expected since the Company reduced available inventory for advertising as we focus on enhancing user experience on our free sites to grow the number of subscribers to our subscription based products.
| 25 |
Operating Expense
| For the Year Ended December 31, | ||||||||||||||||||||
| 2015 | Percent of Total Revenue | 2014 | Percent of Total Revenue | Percent Change | ||||||||||||||||
| Operating expense: | ||||||||||||||||||||
| Cost of services | $ | 33,615,867 | 50 | % | $ | 31,730,740 | 52 | % | 6 | % | ||||||||||
| Sales and marketing | 16,190,749 | 24 | % | 15,600,129 | 26 | % | 4 | % | ||||||||||||
| General and administrative | 15,000,439 | 22 | % | 13,946,681 | 23 | % | 8 | % | ||||||||||||
| Depreciation and amortization | 4,309,094 | 6 | % | 3,179,377 | 5 | % | 36 | % | ||||||||||||
| Restructuring and other charges | (1,221,224 | ) | -2 | % | — | — | N/A | |||||||||||||
| Total operating expense | $ | 67,894,925 | $ | 64,456,927 | 5 | % | ||||||||||||||
Cost of services. Cost of services expense consists primarily of compensation, benefits, outside contributor costs related to the creation of our content, licensed data and the technology required to publish our content.
Cost of services expense increased by approximately $1.9 million, or 6%, over the period. The increase was the result of approximately $2.8 million of additional cost related to the operations of MDL, which was acquired on October 31, 2014 and therefore contributed only two months of expense in the prior year period. Excluding the impact of MDL in both periods, cost of services expense for the year ended December 31, 2015 decreased by approximately $934 thousand, or 3%, when compared to the year ended December 31, 2014. The decrease was primarily the result of lower compensation and related expense, fees paid to outside contributors and recruiting fees, the aggregate of which decreased by approximately $1.6 million. These cost decreases were partially offset by higher third-party data, consulting, hosting and internet related costs, the aggregate of which increased by approximately $801 thousand.
Sales and marketing. Sales and marketing expense consists primarily of compensation expense for the direct sales force, marketing services, and customer service departments, advertising and promotion expenses and credit card processing fees.
Sales and marketing expense increased by approximately $591 thousand, or 4%, over the period. The increase was the result of approximately $1.1 million of additional cost related to the operations of MDL, which was acquired on October 31, 2014 and therefore contributed only two months of expense in the prior year period. Excluding the impact of MDL in both periods, sales and marketing expense for the year ended December 31, 2015 decreased by approximately $553 thousand, or 4%, when compared to the year ended December 31, 2014. The decrease was primarily the result of lower advertising, promotion and public relations costs, the aggregate of which decreased by approximately $896 thousand. These cost decreases were partially offset by higher compensation and related expense (primarily commission payments and related payroll taxes), which increased by approximately $346 thousand.
General and administrative. General and administrative expense consists primarily of compensation for general management, finance, technology, legal and administrative personnel, occupancy costs, professional fees, insurance and other office expenses.
| 26 |
General and administrative expense increased by approximately $1.1 million, or 8%, over the period. The increase was the result of approximately $1.6 million of additional cost related to the operations of MDL, which was acquired on October 31, 2014 and therefore contributed only two months of expense in the prior year period. Excluding the impact of MDL in both periods, general and administrative expense for the year ended December 31, 2015 decreased by approximately $515 thousand, or 4%, when compared to the year ended December 31, 2014. The decrease was primarily the result of the absence of costs in the current year related to the MDL acquisition and to a conference that the Company hosted, both of which were incurred in the prior year period, lower compensation and related expense (primarily reduced bonus payments), as well as reduced contributions to TheStreet Foundation, the aggregate of which decreased by approximately $1.3 million. These cost decreases were offset by higher professional, recruiting and tax expense, the aggregate of which increased by approximately $781 thousand.
Depreciation and amortization. Depreciation and amortization expense increased by approximately $1.1 million, or 36%, over the period. The increase was the result of approximately $952 thousand of additional cost related to the operations of MDL, which was acquired on October 31, 2014 and therefore contributed only two months of expense in the prior year period. Excluding the impact of MDL in both periods, depreciation and amortization expense for the year ended December 31, 2015 increased by approximately $178 thousand, or 6%, when compared to the year ended December 31, 2014. The increase was primarily the result of a reduction to the estimated useful life of certain fixed assets acquired from The Deal and a capitalized Website development project.
Restructuring and other charges. In August 2015, the Company received a one year notice of termination under which the landlord elected to terminate The Deal’s office space lease. As a result, the Company is no longer obligated to fulfill the original full lease term. As such, the Company recorded an adjustment to its 2012 Restructuring reserve totaling approximately $1.2 million, resulting in a restructuring and other charges credit on the Company’s Consolidated Statements of Operations. The Company is also entitled to receive a lease termination fee of approximately $583 thousand from the landlord when the office space is vacated. The Company did not incur any restructuring and other charges during the year ended December 31, 2014.
Net Interest Income
| For the Year Ended December 31, | ||||||||||||
| 2015 | 2014 | Percent Change | ||||||||||
| Net interest (expense) income | $ | (122,637 | ) | $ | 88,993 | -238 | % | |||||
The change in net interest (expense) income was the result of higher interest expense related to the accretion of certain accrued expenses that were recorded in connection with prior acquisitions and lower interest income due to reduced marketable security and cash balances.
Provision for Income Taxes
Income tax expense for the year ended December 31, 2015 totaled approximately $1.2 million, as compared to income tax expense for the year ended December 31, 2014 totaling approximately $475 thousand, and reflects an effective tax rate of -327% and -14%, respectively. Income tax expense for the years ended December 31, 2015 and 2014 primarily relates to the recognition of approximately $1.2 million and $441 thousand, respectively, of a deferred tax liability related to goodwill that is amortized for income tax but not amortized for financial reporting purposes, as well as the recognition of approximately $4 thousand and $34 thousand, respectively, of income tax expense related to the operations of MDL in certain jurisdictions where there are no net operating losses available to offset taxable income.
| 27 |
Net Loss Attributable to Common Stockholders
Net loss attributable to common stockholders for the year ended December 31, 2015 totaled approximately $1.9 million, or $0.06 per basic and diluted share, as compared to net loss attributable to common stockholders for the year ended December 31, 2014 totaling approximately $4.2 million, or $0.12 per basic and diluted share.
Comparison of Fiscal Years Ended December 31, 2014 and 2013
Revenue
| For the Year Ended December 31, | ||||||||||||||||||||
| Revenue: | 2014 | Percent of Total Revenue | 2013 | Percent of Total Revenue | Percent Change | |||||||||||||||
| Subscription services | $ | 48,035,953 | 79 | % | $ | 43,549,359 | 80 | % | 10 | % | ||||||||||
| Media | 13,017,265 | 21 | % | 10,901,052 | 20 | % | 19 | % | ||||||||||||
| Total revenue | $ | 61,053,218 | 100 | % | $ | 54,450,411 | 100 | % | 12 | % | ||||||||||
Subscription services. Subscription services revenue for the year ended December 31, 2014 increased by approximately $4.5 million, or 10%, when compared to the year ended December 31, 2013. The increase was the result of approximately $1.6 million of additional revenue related to the operations of MDL since its acquisition. Excluding MDL, revenue for the year ended December 31, 2014 increased by approximately $2.9 million, or 7%, when compared to the year ended December 31, 2013. The increase was primarily related to a 14% increase in the weighted-average number of subscriptions, partially offset by a 6% decrease in the average revenue recognized per subscription. The increase in the weighted average number of subscriptions was due to new subscribers to the Company’s newsletter products, primarily from the introduction of several new newsletters in the second half of 2013. The decrease in the average revenue recognized per subscription during the period was primarily the result of the mix of products sold and the introduction of several newsletter products at lower prices.
Media. Media revenue for the year ended December 31, 2014 increased by approximately $2.1 million, or 19%, when compared to the year ended December 31, 2013. The increase was primarily the result of additional ad units and increased pricing on certain units which resulted from higher demand from repeat and non-repeat advertisers. Media revenue includes approximately $8 thousand of barter revenue in the year ended December 31, 2014, as compared to approximately $94 thousand of barter revenue in the year ended December 31, 2013.
| 28 |
Operating Expense
| For the Year Ended December 31, | ||||||||||||||||||||
| 2014 | Percent of Total Revenue | 2013 | Percent of Total Revenue | Percent Change | ||||||||||||||||
| Operating expense: | ||||||||||||||||||||
| Cost of services | $ | 31,730,740 | 52 | % | $ | 27,431,566 | 50 | % | 16 | % | ||||||||||
| Sales and marketing | 15,600,129 | 26 | % | 14,453,465 | 27 | % | 8 | % | ||||||||||||
| General and administrative | 13,946,681 | 23 | % | 12,218,964 | 22 | % | 14 | % | ||||||||||||
| Depreciation and amortization | 3,179,377 | 5 | % | 3,768,536 | 7 | % | -16 | % | ||||||||||||
| Restructuring and other charges | — | — | 385,610 | 1 | % | -100 | % | |||||||||||||
| Loss (gain) on disposition of assets | — | — | 187,434 | 0 | % | -100 | % | |||||||||||||
| Total operating expense | $ | 64,456,927 | $ | 58,445,575 | 10 | % | ||||||||||||||
Cost of services. Cost of services expense increased by approximately $4.3 million, or 16%, over the period. The increase was the result of approximately $862 thousand of additional cost related to the operations of MDL since its acquisition combined with transaction related costs. Excluding MDL and transaction related costs, cost of services expense for the year ended December 31, 2014 increased by approximately $3.4 million, or 13%, when compared to the year ended December 31, 2013. The increase was primarily the result of increased compensation and related expense due to a 5% increase in average headcount (excluding the impact of MDL headcount), fees paid to outside contributors, consulting fees and recruiting costs, the aggregate of which increased by approximately $4.6 million. These cost increases were partially offset by lower revenue share payments made to certain distribution partners, and reduced computer services and supplies costs, the aggregate of which decreased by approximately $971 thousand.
Sales and marketing. Sales and marketing expense increased by approximately $1.1 million, or 8%, over the period. The increase was the result of approximately $289 thousand of additional cost related to the operations of MDL since its acquisition combined with transaction related costs. Excluding MDL and transaction related costs, sales and marketing expense for the year ended December 31, 2014 increased by approximately $858 thousand, or 6%, when compared to the year ended December 31, 2013. The increase was the result of higher advertising and promotion, employee benefit and bonus payments, public relations and advertisement serving costs, the aggregate of which increased by $1.3 million. These cost increases were partially offset by reduced salary costs due to a 2% decrease in average headcount (excluding the impact of MDL headcount), and lower travel and entertainment costs, the aggregate of which decreased by approximately $503 thousand. Sales and marketing expense includes approximately $8 thousand of barter expense in the year ended December 31, 2014, as compared to approximately $94 thousand in the year ended December 31, 2013.
General and administrative. General and administrative expense increased by approximately $1.7 million, or 14%, over the period. The increase was the result of approximately $1.5 million of additional cost related to the operations of MDL since its acquisition combined with transaction related costs. Excluding MDL and transaction related costs, general and administrative expense for the year ended December 31, 2014 increased by approximately $265 thousand, or 2%, when compared to the year ended December 31, 2013. The increase was primarily the result of higher compensation expense primarily related to bonus payments and increased employee benefit costs, contributions made by the Company to TheStreet Foundation, costs to host an industry conference and bad debt expense, the aggregate of which increased by approximately $1.0 million. These cost increases were partially offset by reduced professional fees, consulting, tax and occupancy related costs, the aggregate of which decreased by approximately $818 thousand.
| 29 |
Depreciation and amortization. Depreciation and amortization expense decreased by approximately $589 thousand, or 16%, over the period. The decrease was primarily the result of an overall reduced level of capital expenditures over the past few years partially offset by increased amortization expense related to the purchases of MDL and assets from DealFlow Media, Inc.
Restructuring and other charges. The Company did not incur any restructuring and other charges during the year ended December 31, 2014. During the year ended December 31, 2013, the Company recognized restructuring and other charges totaling approximately $386 thousand primarily related to noncash stock-based compensation costs in connection with the accelerated vesting of certain restricted stock units for a terminated employee.
Loss (gain) on disposition of assets. The Company did not incur any loss (gain) during the year ended December 31, 2014. During the year ended December 31, 2013, the Company sold certain non-strategic assets resulting in a loss of approximately $187 thousand.
Net Interest Income
| For the Year Ended December 31, | ||||||||||||
| 2014 | 2013 | Percent Change | ||||||||||
| Net interest income | $ | 88,993 | $ | 209,463 | -58 | % | ||||||
The decrease in net interest income was the result of reduced marketable securities balances, decreased cash due to the acquisition of MDL, lower interest rates, and interest expense related to the accretion of certain accrued expenses that were recorded in connection with prior acquisitions.
Net Loss Attributable to Common Stockholders
Net loss attributable to common stockholders for the year ended December 31, 2014 totaled $4.2 million, or $0.12 per basic and diluted share, compared to net loss attributable to common stockholders totaling $3.8 million, or $0.11 per basic and diluted share, for the year ended December 31, 2013.
Critical Accounting Estimates
General
The Company’s discussion and analysis of its financial condition and results of operations are based upon its consolidated financial statements, which have been prepared in accordance with U.S. generally accepted accounting principles (“GAAP”). The preparation of these financial statements requires management to make estimates and assumptions that affect the reported amounts of assets and liabilities and disclosure of contingent assets and liabilities at the date of the financial statements and the reported amounts of revenue and expense during the reporting period. Actual results could differ from those estimates. Estimates and assumptions are reviewed periodically and the effects of revisions are reflected in the consolidated financial statements in the period they are deemed to be necessary. Significant estimates made in the accompanying consolidated financial statements include, but are not limited to, the following:
| 30 |
Revenue Recognition
We generate our revenue primarily from subscription services and media.
Subscription services revenue is comprised of subscriptions, licenses and fees for access to securities investment information, stock market commentary, rate services, director and officer profiles, relationship capital management services, and transactional information pertaining to mergers and acquisitions and other changes in the corporate control environment. Subscriptions are charged to customers’ credit cards or are directly billed to corporate subscribers, and are generally billed in advance on a monthly, quarterly or annual basis. We calculate net subscription revenue by deducting from gross revenue an estimate of potential refunds from cancelled subscriptions as well as chargebacks of disputed credit card charges. Net subscription revenue is recognized ratably over the subscription periods. Deferred revenue relates to payments for subscription fees for which revenue has not been recognized because services have not yet been provided.
Subscription services revenue is subject to estimation and variability due to the fact that, in the normal course of business, subscribers may for various reasons contact us or their credit card companies to request a refund or other adjustment for a previously purchased subscription. With respect to many of our annual newsletter subscription products, we offer the ability to receive a refund during the first 30 days but none thereafter. Accordingly, we maintain a provision for estimated future revenue reductions resulting from expected refunds and chargebacks related to subscriptions for which revenue was recognized in a prior period. The calculation of this provision is based upon historical trends and is reevaluated each quarter. The provision was not material for any of the three years ended December 31, 2015.
Media revenue is comprised of fees charged for the placement of advertising and sponsorships within TheStreet and its affiliated properties, our subscription and institutional services, and other miscellaneous revenue. Media revenue is recognized as the advertising or sponsorship is displayed, provided that collection of the resulting receivable is reasonably assured.
Capitalized Software and Website Development Costs
We expense all costs incurred in the preliminary project stage for software developed for internal use and capitalize all external direct costs of materials and services consumed in developing or obtaining internal-use computer software in accordance with Accounting Standards Codification (“ASC”) 350, Intangibles – Goodwill and Other (“ASC 350”). In addition, for employees who are directly associated with and who devote time to internal-use computer software projects, to the extent of the time spent directly on the project, we capitalize payroll and payroll-related costs of such employees incurred once the development has reached the applications development stage. For the years ended December 31, 2015, 2014 and 2013, we capitalized software development costs totaling approximately $486 thousand, $408 thousand and $289 thousand, respectively. All costs incurred for upgrades, maintenance and enhancements that do not result in additional functionality are expensed.
We also account for our Website development costs under ASC 350, which provides guidance on the accounting for the costs of development of company Websites, dividing the Website development costs into five stages: (1) the planning stage, during which the business and/or project plan is formulated and functionalities, necessary hardware and technology are determined, (2) the Website application and infrastructure development stage, which involves acquiring or developing hardware and software to operate the Website, (3) the graphics development stage, during which the initial graphics and layout of each page are designed and coded, (4) the content development stage, during which the information to be presented on the Website, which may be either textual or graphical in nature, is developed, and (5) the operating stage, during which training, administration, maintenance and other costs to operate the existing Website are incurred. The costs incurred in the Website application and infrastructure stage, the graphics development stage and the content development stage are capitalized; all other costs are expensed as incurred. Amortization of capitalized costs will not commence until the project is completed and placed into service. For the years ended December 31, 2015, 2014 and 2013, we capitalized Website development costs totaling approximately $1.8 million, $1.2 million and $443 thousand, respectively.
| 31 |
Capitalized software and Website development costs are amortized using the straight-line method over the estimated useful life of the software or Website, which varies based upon the project. Total amortization expense was approximately $1.0 million, $428 thousand and $743 thousand, for the years ended December 31, 2015, 2014 and 2013, respectively.
Goodwill and Indefinite Lived Intangible Assets
Goodwill represents the excess of purchase price over the value assigned to the net tangible and identifiable intangible assets of businesses acquired. Under the provisions of ASC 350, goodwill and indefinite lived intangible assets are required to be tested for impairment on an annual basis and between annual tests whenever circumstances arise that indicate a possible impairment might exist. We perform our annual impairment tests of goodwill and indefinite lived intangible assets as of October 1 each year. Impairment exists when the carrying amount of goodwill and indefinite lived intangible assets exceed their implied fair value, resulting in an impairment charge for this excess.
We evaluate goodwill for impairment using a two-step impairment test approach at the Company level, as the Company is considered to operate as a single reporting unit. The first step compares the fair value of the Company with its book value, including goodwill. As outlined in ASC 350, if the fair value of a reporting unit exceeds its carrying amount, goodwill of the reporting unit is not considered impaired and the second step of the impairment test is unnecessary. As we concluded that our goodwill was not impaired as of the valuation date, step two was not performed.
In conducting our 2015 annual goodwill impairment test with the assistance of our independent appraisal firm, we used the market approach for the valuation of our common stock and the income approach for our preferred shares. We also performed an income approach by using the discounted cash flow (“DCF”) method to confirm the reasonableness of the results of the common stock market approach. Based on these approaches, we determined the Company’s business enterprise value (common equity plus preferred equity) to be $107.4 million as of the valuation date. We calculated the common equity value using the midpoint of the Company’s high and low common stock prices on the valuation date, as shown in the following figure:
| Average Stock Price – October 1, 2015 | ||||
| Low stock price | $ | 1.60 | ||
| High stock price | $ | 1.68 | ||
| Average stock price | $ | 1.64 | ||
We multiplied the average stock price of $1.64 by the 34,856,369 common shares outstanding, indicating a common equity value of $57.2 million on a non-controlling basis. In order to determine the value of the common equity on a controlling basis, a control premium was applied. We searched the FactSet MergerStat/BVR Control Premium Study for all transactions involving U.S. companies during the past 12 months, and for transactions involving U.S. companies with the same SIC code as the Company over various time periods. The data indicated a wide range of control premiums, and we selected 20 percent as an appropriate control premium. Applying a control premium of 20 percent resulted in a value of the common equity on a controlling basis of $68.6 million.
| 32 |
In addition to Common Stock, we have preferred stock with a liquidation value of $55.0 million. With the assistance of our third party valuation firm, we used the income approach to compute the fair value of the Preferred Stock to be $38.8 million which we added to the fair value of the Common Stock. The resulting enterprise value of $107.4 million represents the value of the Company on a controlling basis. This value was greater than the carrying value of $70.2 million, indicating our goodwill was not impaired as of the October 1, 2015 valuation date.
The fair value of our outstanding preferred shares requires significant judgments, including the estimation of the amount of time until a liquidation event occurs as well as an appropriate cash flow discount rate. Further, in assigning a fair value to our preferred stock, we also considered that the preferred shareholders are entitled to receive a $55 million liquidation preference upon liquidation or dissolution of the Company or upon any change of control event (as defined in the Certificate of Designation of Series B Preferred Stock). Additionally, the holders of the preferred shares are entitled to receive dividends and to vote as a single class together with the holders of the Common Stock on an as-converted basis and, provided certain preferred share ownership levels are maintained, are entitled to representation on our board of directors and may unilaterally block issuance of certain classes of capital stock, the purchase or redemption of certain classes of capital stock, including Common Stock (with certain exceptions), and any increases in the per-share amount of dividends payable to the holders of the Common Stock.
In conducting our 2015 annual indefinite lived intangible asset impairment test with the assistance of our independent appraisal firm, we determined its fair value using the relief-from-royalty method. This analysis calculated the fair value as the present value of the future expenses avoided by owning the indefinite lived trade name rather than having to license its use. We selected an appropriate royalty rate by reviewing licensing transactions for similar assets between service businesses, with a focus on companies that operate in industries similar to ours. Based upon the analysis, we concluded that the book value of the indefinite lived trade name was not impaired as of the October 1, 2015 valuation date.
Determining the fair value of goodwill or other intangible assets with indefinite lives involves the use of significant estimates and assumptions. These estimates and assumptions include revenue growth rates and operating margins used to calculate projected future cash flows, risk-adjusted discount rates, future economic and market conditions, and appropriate market comparables. We base our fair value estimates on assumptions believed to be reasonable. However, as these estimates and assumptions are unpredictable and inherently uncertain, actual future results may differ from these estimates.
A decrease in the price of our Common Stock, or changes in the estimated value of our preferred shares, could materially affect the determination of the fair value and could result in an impairment charge to reduce the carrying value of goodwill, which could be material to our financial position and results of operations.
Additionally, we evaluate the remaining useful lives of intangible assets each year to determine whether events or circumstances continue to support their useful life. There have been no changes in useful lives of intangible assets for each period presented.
Long-Lived Assets
We evaluate long-lived assets, including amortizable identifiable intangible assets, for impairment whenever events or changes in circumstances indicate that the carrying amount of an asset may not be recoverable. Upon such an occurrence, recoverability of assets is measured by comparing the carrying amount of an asset to forecasted undiscounted net cash flows expected to be generated by the asset. If the carrying amount of the asset exceeds its estimated future cash flows, an impairment charge is recognized for the amount by which the carrying amount of the asset exceeds the fair value of the asset.
| 33 |
Investments
We believe that conservative investment policies are appropriate and we are not motivated to strive for aggressive spreads above Treasury rates. Preservation of capital is of foremost concern, and by restricting investments to investment grade securities of relatively short maturities, we believe that our capital will be largely protected from severe economic conditions or drastic shifts in interest rates. A high degree of diversification adds further controls over capital risk.
Financial instruments that subject us to concentrations of credit risk consist primarily of cash, cash equivalents and restricted cash. We maintain all of our cash, cash equivalents and restricted cash in seven financial institutions and we perform periodic evaluations of the relative credit standing of these institutions. As of December 31, 2015, our cash, cash equivalents and restricted cash primarily consisted of money market funds and checking accounts.
As of December 31, 2015, marketable securities consist of two municipal auction rate securities (“ARS”) issued by the District of Columbia with a cost basis of approximately $1.9 million and a fair value of approximately $1.6 million. As of December 31, 2014, marketable securities also included an investment grade corporate bond, and the aggregate cost basis of these marketable securities was approximately $3.9 million and the aggregate fair value was approximately $3.6 million. The decrease in marketable securities was due to our non-reinvesting the proceeds as securities matured. With the exception of the ARS, the maximum maturity for any investment is three years. The ARS mature in the year 2038. We account for our marketable securities in accordance with the provisions of ASC 320-10. We classify these securities as available for sale and the securities are reported at fair value. Unrealized gains and losses are recorded as a component of accumulated other comprehensive loss and excluded from net loss.
During 2008, we made an investment in Debtfolio, Inc. (‘Debtfolio”), doing business as Geezeo, an online financial management solutions provider for banks and credit unions. The investment totaled approximately $1.9 million for an 18.5% ownership stake. Additionally, we incurred approximately $0.2 million of legal fees in connection with this investment. During the first quarter of 2009, the carrying value of our investment was written down to fair value based upon an estimate of the market value of our equity in light of Debtfolio’s efforts to raise capital at the time from third parties. The impairment charge approximated $1.5 million. During the three months ended June 30, 2010, we determined it was necessary to record a second impairment charge totaling approximately $555 thousand, writing the value of the investment to zero. This was deemed necessary by management based upon its consideration of Debtfolio’s continued negative cash flow from operations, current financial position and lack of current liquidity. In October 2011, Debtfolio repurchased our ownership stake in exchange for a subordinated promissory note in the aggregate principal amount of approximately $555 thousand payable on October 31, 2014. On October 28, 2014, a revised subordinated promissory note with revised repayment terms was agreed to which required cash payments totaling $255 thousand during 2014, and eight quarterly installments of approximately $48 thousand plus 5% simple interest during 2015 and 2016. As of December 31, 2015, all required payments have been received. As of December 31, 2015 and 2014, we maintain a full valuation allowance against this subordinated promissory note due to the uncertainty of eventual collection.
See Note 5 to Consolidated Financial Statements (Fair Value Measurements) for additional information about the investment of our cash.
| 34 |
Stock-Based Compensation
We account for stock-based compensation in accordance with ASC 718-10, Share Based Payment Transactions (“ASC 718-10”). This requires that the cost resulting from all share-based payment transactions be recognized in the financial statements based upon estimated fair values.
Stock-based compensation expense recognized for the years ended December 31, 2015, 2014 and 2013 was approximately $1.6 million, $1.8 million and $2.1 million, respectively. As of December 31, 2015, there was approximately $1.8 million of unrecognized stock-based compensation expense remaining to be recognized over a weighted-average period of 1.9 years.
Stock-based compensation expense recognized in our consolidated statements of operations for the years ended December 31, 2015, 2014 and 2013 includes compensation expense for all share-based payment awards based upon the estimated grant date fair value. We recognize compensation expense for stock-based payment awards on a straight-line basis over the requisite service period of the award. As stock-based compensation expense recognized in the years ended December 31, 2015, 2014 and 2013 is based upon awards ultimately expected to vest, it has been reduced for estimated forfeitures. We estimate forfeitures at the time of grant which are revised, if necessary, in subsequent periods if actual forfeitures differ from those estimates.
We estimate the value of stock option awards on the date of grant using the Black-Scholes option-pricing model. This determination is affected by our stock price as well as assumptions regarding expected volatility, risk-free interest rate, and expected dividends. Because option-pricing models require the use of subjective assumptions, changes in these assumptions can materially affect the fair value of the options. The assumptions presented in the table below represent the weighted-average value of the applicable assumption used to value stock option awards at their grant date. In determining the volatility assumption, we used a historical analysis of the volatility of our share price for the preceding period equal to the expected option lives. The expected option lives, which represent the period of time that options granted are expected to be outstanding, were estimated based upon the “simplified” method for “plain-vanilla” options. The risk-free interest rate assumption was based upon observed interest rates appropriate for the term of our stock option awards. The dividend yield assumption was based on the history and expectation of future dividend payouts. The value of the portion of the award that is ultimately expected to vest is recognized as expense over the requisite service periods. Our estimate of pre-vesting forfeitures is primarily based on our historical experience and is adjusted to reflect actual forfeitures as the options vest. The weighted-average grant date fair value per share of stock option awards granted during the years ended December 31, 2015, 2014 and 2013 was $0.39, $0.44 and $0.63, respectively, using the Black-Scholes model with the following weighted-average assumptions:
| For the Year Ended December 31, | ||||||||||||
| 2015 | 2014 | 2013 | ||||||||||
| Expected option lives | 3.0 years | 3.6 years | 3.7 years | |||||||||
| Expected volatility | 35.45 | % | 35.54 | % | 40.11 | % | ||||||
| Risk-free interest rate | 0.97 | % | 1.11 | % | 0.85 | % | ||||||
| Expected dividends | 4.59 | % | 4.22 | % | 0.00 | % | ||||||
The value of each restricted stock unit awarded is equal to the closing price per share of the Company’s Common Stock on the date of grant. The value of the portion of the award that is ultimately expected to vest is recognized as expense over the requisite service periods. The weighted-average grant date fair value per share of restricted stock units granted during the years ended December 31, 2015, 2014 and 2013 was $2.19, $2.23 and $2.06, respectively.
| 35 |
The impact of stock-based compensation expense has been significant to reported results of operations and per share amounts. Because option-pricing models require the use of subjective assumptions, changes in these assumptions can materially affect the fair value of the options. For each 1% increase in the risk-free interest rate used in the Black-Scholes option-pricing model, the resulting estimated impact to our total operating expense for the year ended December 31, 2015 would have caused an increase of approximately $20,000. For each 10% increase in the expected volatility used in the Black-Scholes option-pricing model, the resulting estimated impact to our total operating expense for the year ended December 31, 2015 would have caused an increase of approximately $119,000. Because options are expensed over three to five years from the date of grant, the foregoing estimated increases include potential expense for options granted during prior years. In calculating the amount of each variable that is included in the Black-Scholes options-pricing model (i.e., option exercise price, stock price, option term, risk free interest rate, annual dividend rate and volatility), the weighted average of such variable for all grants issued in a given year was used.
If factors change and we employ different assumptions in future periods, the compensation expense that we record may differ significantly from what we have recorded in the current period.
Income Taxes
We account for our income taxes in accordance with ASC 740-10, Income Taxes (“ASC 740-10”). Under ASC 740-10, deferred tax assets and liabilities are recognized for the future tax consequences attributable to differences between the financial statement carrying amounts of existing assets and liabilities and their tax bases. ASC 740-10 also requires that deferred tax assets be reduced by a valuation allowance if it is more likely than not that some or all of the deferred tax assets will not be realized based on all available positive and negative evidence. As of December 31, 2015 and 2014, we maintain a full valuation allowance against our deferred tax assets due to our prior history of pre-tax losses and uncertainty about the timing of and ability to generate taxable income in the future and our assessment that the realization of the deferred tax assets did not meet the “more likely than not” criterion under ASC 740-10. We expect to continue to maintain a full valuation allowance until, or unless, we can sustain a level of profitability that demonstrates our ability to utilize these assets.
ASC 740-10 also prescribes a recognition threshold and a measurement attribute for the financial statement recognition and measurement of tax positions taken or expected to be taken in a tax return. For those benefits to be recognized, a tax position must be more likely than not to be sustained upon examination by taxing authorities. Differences between tax positions taken or expected to be taken in a tax return and the benefit recognized and measured pursuant to the interpretation are referred to as “unrecognized benefits.” A liability is recognized for an unrecognized tax benefit because it represents an enterprise’s potential future obligation to the taxing authority for a tax position that was not recognized as a result of applying the provisions of ASC 740-10. As of December 31, 2015 and 2014, no liability for unrecognized tax benefits was required to be recorded.
Deferred tax assets pertaining to windfall tax benefits on the exercise of share awards and the corresponding credit to additional paid-in capital are recorded if the related tax deduction reduces tax payable. We have elected the “with-and-without approach” regarding ordering of windfall tax benefits to determine whether the windfall tax benefit did reduce taxes payable in the current year. Under this approach, the windfall tax benefits would be recognized in additional paid-in capital only if an incremental tax benefit is realized after considering all other tax benefits presently available to us.
| 36 |
Contingencies
Accounting for contingencies, including those matters described in the Commitments and Contingencies section of Item 7. Management’s Discussion and Analysis of Financial Condition and Results of Operations, is highly subjective and requires the use of judgments and estimates in assessing their magnitude and likely outcome. In many cases, the outcomes of such matters will be determined by third parties, including governmental or judicial bodies. The provisions made in the consolidated financial statements, as well as the related disclosures, represent management’s best estimate of the then current status of such matters and their potential outcome based on a review of the facts and in consultation with outside legal counsel where deemed appropriate. We would record a material loss contingency in our consolidated financial statements if the loss is both probable of occurring and reasonably estimated. We regularly review contingencies and as new information becomes available may, in the future, adjust our associated liabilities.
Credit Risk of Customers and Business Concentrations
Our customers are primarily concentrated in the United States and Europe, and we carry accounts receivable balances. We perform ongoing credit evaluations, generally do not require collateral, and establish an allowance for doubtful accounts based upon factors surrounding the credit risk of customers, historical trends and other information. To date, actual losses have been within management’s expectations.
For the years ended December 31, 2015, 2014 and 2013, no single customer accounted for 10% or more of consolidated revenue. As of December 31, 2015 and 2014, no single customer accounted for more than 10% of our gross accounts receivable balance.
Liquidity and Capital Resources
Our current assets at December 31, 2015 consisted primarily of cash and cash equivalents and accounts receivable. We do not hold inventory. Our current liabilities at December 31, 2015 consisted primarily of deferred revenue, accrued expenses and accounts payable. At December 31, 2015, our current assets were approximately $35.7 million, 6 percent greater than our current liabilities. With respect to many of our annual newsletter subscription products, we offer the ability to receive a refund during the first 30 days but none thereafter. We do not as a general matter offer refunds for advertising that has run.
We generally have invested in money market funds and other short-term, investment grade instruments that are highly liquid and of high quality, with the intent that such funds are available for sale for acquisition and operating purposes. As of December 31, 2015, our cash, cash equivalents, marketable securities and restricted cash amounted to approximately $30.7 million, representing 30% of total assets. Our cash, cash equivalents and restricted cash primarily consisted of money market funds and checking accounts. Our marketable securities consisted of two municipal auction rate securities issued by the District of Columbia with a fair value of approximately $1.6 million that mature in the year 2038. Our total cash-related position is as follows:
| 37 |
| December 31, 2015 | December 31, 2014 | |||||||
| Cash and cash equivalents | $ | 28,445,416 | $ | 32,459,009 | ||||
| Current and noncurrent marketable securities | 1,590,000 | 3,569,240 | ||||||
| Current and noncurrent restricted cash | 661,250 | 1,301,000 | ||||||
| Total cash and cash equivalents, current and noncurrent marketable securities and current and noncurrent restricted cash | $ | 30,696,666 | $ | 37,329,249 | ||||
Financial instruments that subject us to concentrations of credit risk consist primarily of cash, cash equivalents and restricted cash. We maintain all of our cash, cash equivalents and restricted cash in seven financial institutions, and we perform periodic evaluations of the relative credit standing of these institutions.
Net cash provided by operating activities totaled approximately $891 thousand for the year ended December 31, 2015, as compared to net cash provided by operating activities totaling approximately $3.6 million for the year ended December 31, 2014. The reduction in net cash provided by operating activities was primarily the result of changes in the balances of accrued expenses, other liabilities, deferred revenue, other receivables, other current liabilities, prepaid expenses and other current assets and accounts receivable over the periods. These declines were partially offset by the reduction in the Company’s net loss and increased noncash expenses over the periods.
Net cash used in investing activities totaled approximately $670 thousand for the year ended December 31, 2015, as compared to net cash used in investing activities totaling approximately $12.4 million for the year ended December 31, 2014. The reduction in net cash used in investing activities was primarily the result of the acquisition of Management Diagnostics Limited in the prior year period and a reduction in restricted cash, partially offset by fewer maturities of marketable securities and increased capital expenditures.
Net cash used in financing activities totaled approximately $4.1 million for the year ended December 31, 2015, essentially flat when compared to the year ended December 31, 2014. Year-over-year changes included a decrease in the shares withheld on RSU vesting to pay for withholding taxes offset by a reduction in the proceeds received from the exercise of stock options.
We currently have a total of approximately $661 thousand of cash that serves as collateral for outstanding letters of credit, which cash is classified as restricted. The letters of credit serve as security deposits for office space in New York City.
We believe that our current cash and cash equivalents will be sufficient to meet our anticipated cash needs for at least the next 12 months. We are committed to cash expenditures in an aggregate amount of approximately $5.2 million through December 31, 2016, in respect of the contractual obligations set forth below under “Commitments and Contingencies.”
As of December 31, 2015 we had approximately $154 million of federal and state net operating loss carryforwards. We maintain a full valuation allowance against our deferred tax assets as management concluded that it was more likely than not that we would not realize the benefit of our deferred tax assets by generating sufficient taxable income in future years. We expect to continue to maintain a full valuation allowance until, or unless, we can sustain a level of profitability that demonstrates our ability to utilize these assets.
| 38 |
In accordance with Section 382 of the Internal Revenue Code, the ability to utilize our net operating loss carryforwards could be limited in the event of a change in ownership and as such a portion of the existing net operating loss carryforwards may be subject to limitation.
Treasury Stock
In December 2000, our Board of Directors authorized the repurchase of up to $10 million of our Common Stock, from time to time, in private purchases or in the open market. In February 2004, our Board of Directors approved the resumption of the stock repurchase program (the “Program”) under new price and volume parameters, leaving unchanged the maximum amount available for repurchase under the Program. However, the affirmative vote of the holders of a majority of the outstanding shares of Series B Preferred Stock, voting separately as a single class, is necessary in order for us to repurchase our Common Stock (except for the purchase or redemption from employees, directors and consultants pursuant to agreements providing us with repurchase rights upon termination of their service with us), unless after such purchase we have unrestricted cash (net of all indebtedness for borrowed money, purchase money obligations, promissory notes or bonds) equal to at least two times the product obtained by multiplying the number of shares of Series B Preferred Stock outstanding at the time such dividend is paid by the liquidation preference. During the years ended December 31, 2015 and 2014, we did not purchase any shares of Common Stock under the Program. Since inception of the Program, we have purchased a total of 5,453,416 shares of Common Stock at an aggregate cost of approximately $7.3 million.
In addition, pursuant to the terms of our 2007 Performance Incentive Plan (the “2007 Plan”), and certain procedures adopted by the Compensation Committee of our Board of Directors, in connection with the exercise of stock options by certain of our employees, and the issuance of shares of Common Stock in settlement of vested restricted stock units, we may withhold shares in lieu of payment of the exercise price and/or the minimum amount of applicable withholding taxes then due. Through December 31, 2015, we had withheld an aggregate of 1,670,623 shares which have been recorded as treasury stock.
We also received an aggregate of 208,270 shares as partial settlement of the working capital and debt adjustment from the acquisition of Corsis Technology Group II LLC, and 3,338 shares as partial settlement of the working capital adjustment from the acquisition of Kikucall, Inc. These shares have also been recorded as treasury stock.
Commitments and Contingencies
We are committed to cash expenditures in an aggregate amount of approximately $5.2 million through December 31, 2016, primarily related to operating leases for office space, which expire at various dates through January, 2026. Certain leases contain escalation clauses relating to increases in property taxes and maintenance costs. Rent expense was approximately $2.1 million, $1.8 million and $1.5 million for the years ended December 31, 2015, 2014 and 2013, respectively. Additionally, we have agreements with certain of our outside contributors, whose future minimum payments are dependent on the future fulfillment of their services thereunder. As of December 31, 2015, total future minimum cash payments are as follows:
| Payments Due by Year | ||||||||||||||||||||||||||||
| Contractual obligations: | Total | 2016 | 2017 | 2018 | 2019 | 2020 | After 2020 | |||||||||||||||||||||
| Operating leases | $ | 12,073,785 | $ | 2,566,802 | $ | 2,419,444 | $ | 2,117,147 | $ | 1,996,904 | $ | 1,987,382 | $ | 986,106 | ||||||||||||||
| Employment agreement | 5,000,000 | 2,500,000 | 2,500,000 | — | — | — | — | |||||||||||||||||||||
| Outside contributors | 137,500 | 137,500 | — | — | — | — | — | |||||||||||||||||||||
| Total contractual cash obligations | $ | 17,211,285 | $ | 5,204,302 | $ | 4,919,444 | $ | 2,117,147 | $ | 1,996,904 | $ | 1,987,382 | $ | 986,106 | ||||||||||||||
| 39 |
Future minimum cash payments for the year ended December 31, 2016 related to operating leases have been reduced by approximately $488 thousand related to payments to be received related to the sublease of office space.
See Note 11 (Commitments and Contingencies) in Notes to Consolidated Financial Statements for a discussion of contingencies.
New Accounting Pronouncements
See Note 1 in Notes to Consolidated Financial Statements for new accounting pronouncements impacting the Company.
Item 7A. Quantitative and Qualitative Disclosures About Market Risk.
We believe that our market risk exposures are immaterial as we do not have instruments for trading purposes, and reasonable possible near-term changes in market rates or prices will not result in material near-term losses in earnings, material changes in fair values or cash flows for all instruments.
We maintain all of our cash, cash equivalents and restricted cash in seven financial institutions, and we perform periodic evaluations of the relative credit standing of these institutions. However, no assurances can be given that the third party institutions will retain acceptable credit ratings or investment practices.
Following our acquisition of MDL, we have greater exposure to fluctuations in foreign currency exchange rates, in particular with respect to the British pound. Accordingly, our results of operations and cash flows are subject to fluctuations due to changes in exchange rates. Fluctuations in currency exchange rates could result in translation gains and losses when we consolidate our results and harm our business. Because we conduct a growing portion of our business outside the U.S. but report our results in U.S. dollars, we face exposure to adverse movements in currency exchange rates, which may cause our revenue and operating results to differ materially from expectations. For example, if the U.S. dollar strengthens relative to the British pound, our non-U.S. revenue and operating results would be adversely affected when translated into U.S. dollars. Conversely, a decline in the U.S. dollar relative to the British pound would increase our non-U.S. revenue and operating results when translated into U.S. dollars. We do not engage in currency hedging or have any positions in derivative instruments to hedge our currency risk.
The effect of a 10% adverse change in exchange rates would have resulted in an approximate $972 thousand reduction to 2015 revenue, with an offsetting reduction to 2015 operating expenses of $544 thousand, and a decrease in the value of the Company’s assets and liabilities of approximately $447 thousand and $529 thousand, respectively.
Item 8. Financial Statements and Supplementary Data.
Our consolidated financial statements required by this item are included in Item 15 of this Report.
Item 9. Changes In and Disagreements With Accountants on Accounting and Financial Disclosure.
None.
| 40 |
Item 9A. Controls and Procedures.
| (a) | Disclosure Controls and Procedures. |
We maintain disclosure controls and procedures that are designed to ensure that information required to be disclosed in our reports under the Securities Exchange Act of 1934, as amended (“Exchange Act”) is recorded, processed, summarized and reported within the time periods specified in the SEC’s rules and forms, and that such information is accumulated and communicated to management, including our interim chief executive officer and chief financial officer, as appropriate, to allow timely decisions regarding required disclosures. Our management, with the participation of our interim chief executive officer (our principal executive officer) and chief financial officer (our principal financial officer), has evaluated the effectiveness of our disclosure controls and procedures (as defined in Exchange Act Rules 131-15(e) and 15d-15(e)) as of December 31, 2015. Based on that evaluation, our management concluded that our disclosure controls and procedures were effective as of December 31, 2015.
| (b) | Management’s Annual Report on Internal Control over Financial Reporting. |
Our management is responsible for establishing and maintaining adequate internal control over financial reporting as defined in Exchange Act Rules 13a-15(f) and 15d-15(f). Our internal control system was designed to provide reasonable assurance regarding the reliability of financial reporting and the preparation and fair presentation of published financial statements in accordance with generally accepted accounting principles and includes those policies and procedures that:
| · | pertain to the maintenance of records that in reasonable detail accurately and fairly reflect the transactions and dispositions of our assets; |
| · | provide reasonable assurance that transactions are recorded as necessary to permit preparation of our financial statements in accordance with generally accepted accounting principles, and that our receipts and expenditures are being made only in accordance with authorizations of our management and directors; and |
| · | provide reasonable assurance regarding prevention or timely detection of unauthorized acquisition, use or disposition of our assets that could have a material effect on our financial statements. |
Internal control over financial reporting may not prevent or detect misstatements due to its inherent limitations. Management's projections of any evaluation of the effectiveness of internal control over financial reporting as to future periods are subject to the risks that controls may become inadequate because of changes in conditions, or that the degree of compliance with the policies or procedures may deteriorate.
Our management assessed the effectiveness of our internal control over financial reporting as of December 31, 2015 and in making this assessment used the criteria set forth by the Committee of Sponsoring Organizations of the Treadway Commission in Internal Control-Integrated Framework (2013 Framework) in accordance with the standards of the Public Company Accounting Oversight Board (United States). Based on the foregoing evaluation, our management concluded that, as of December 31, 2015, our internal control over financial reporting was effective.
| 41 |
| (c) | Changes in Internal Control Over Financial Reporting |
There have been no changes in our internal control over financial reporting during the quarter ended December 31, 2015 that have materially affected, or are reasonably likely to materially affect, our internal control over financial reporting.
The effectiveness of our internal control over financial reporting as of December 31, 2015 has been independently audited by BDO USA, LLP, an independent registered public accounting firm, and their attestation is included herein.
| 42 |
Report of Independent Registered Public Accounting Firm
Board of Directors and Stockholders
TheStreet, Inc.
New York, New York
We have audited TheStreet, Inc.’s internal control over financial reporting as of December 31, 2015, based on criteria established in Internal Control – Integrated Framework (2013) issued by the Committee of Sponsoring Organizations of the Treadway Commission (the COSO criteria). TheStreet, Inc.’s management is responsible for maintaining effective internal control over financial reporting and for its assessment of the effectiveness of internal control over financial reporting, included in the accompanying Item 9A, Management’s Annual Report on Internal Control Over Financial Reporting”. Our responsibility is to express an opinion on the company’s internal control over financial reporting based on our audit.
We conducted our audit in accordance with the standards of the Public Company Accounting Oversight Board (United States). Those standards require that we plan and perform the audit to obtain reasonable assurance about whether effective internal control over financial reporting was maintained in all material respects. Our audit included obtaining an understanding of internal control over financial reporting, assessing the risk that a material weakness exists, and testing and evaluating the design and operating effectiveness of internal control based on the assessed risk. Our audit also included performing such other procedures as we considered necessary in the circumstances. We believe that our audit provides a reasonable basis for our opinion.
A company’s internal control over financial reporting is a process designed to provide reasonable assurance regarding the reliability of financial reporting and the preparation of financial statements for external purposes in accordance with generally accepted accounting principles. A company’s internal control over financial reporting includes those policies and procedures that (1) pertain to the maintenance of records that, in reasonable detail, accurately and fairly reflect the transactions and dispositions of the assets of the company; (2) provide reasonable assurance that transactions are recorded as necessary to permit preparation of financial statements in accordance with generally accepted accounting principles, and that receipts and expenditures of the company are being made only in accordance with authorizations of management and directors of the company; and (3) provide reasonable assurance regarding prevention or timely detection of unauthorized acquisition, use, or disposition of the company’s assets that could have a material effect on the financial statements.
Because of its inherent limitations, internal control over financial reporting may not prevent or detect misstatements. Also, projections of any evaluation of effectiveness to future periods are subject to the risk that controls may become inadequate because of changes in conditions, or that the degree of compliance with the policies or procedures may deteriorate.
In our opinion, TheStreet, Inc. maintained, in all material respects, effective internal control over financial reporting as of December 31, 2015, based on the COSO criteria.
We also have audited, in accordance with the standards of the Public Company Accounting Oversight Board (United States), the consolidated statements of operations, comprehensive loss, stockholders’ equity, and cash flows for each of the three years in the period ended December 31, 2015 and our report dated March 9, 2016 expressed an unqualified opinion.
/s/ BDO USA, LLP
New York, New York
March 9, 2016
| 43 |
None
Item 10. Directors, Executive Officers and Corporate Governance.
The information required by this Item is incorporated herein by reference to our definitive Proxy Statement for our 2016 Annual Meeting of Stockholders to be filed with the Securities and Exchange Commission within 120 days after the end of the fiscal year covered by this Report (the “Proxy Statement”).
Item 11. Executive Compensation.
The information required by this Item is incorporated herein by reference to the Proxy Statement.
Item 12. Security Ownership of Certain Beneficial Owners and Management and Related Stockholder Matters.
Other than the information provided below, the information required by this Item is incorporated herein by reference to the Proxy Statement.
Equity Compensation Plan Information
Under the terms of the 1998 Stock Incentive Plan (the “1998 Plan”), 8,900,000 shares of Common Stock of the Company were reserved for awards of incentive stock options, nonqualified stock options, restricted stock, deferred stock, restricted stock units, or any combination thereof. Under the terms of the 2007 Plan, 7,750,000 shares of Common Stock of the Company were reserved for awards of incentive stock options, nonqualified stock options, stock appreciation rights, restricted stock, restricted stock units or other stock-based awards. The 2007 Plan also authorized cash performance awards. Additionally, under the terms of the 2007 Plan, unused shares authorized for award under the 1998 Plan are available for issuance under the 2007 Plan. No further awards will be made under the 1998 Plan. Awards may be granted to such directors, employees and consultants of the Company as the Compensation Committee of the Board of Directors shall select in its discretion or delegate management to select. Only employees of the Company are eligible to receive incentive stock options. Awards generally vest over a three- to five-year period and stock options generally have terms of five years. The following table sets forth certain information, as of December 31, 2015, concerning shares of Common Stock authorized for issuance under the 2007 Plan.
| Number of securities to be issued upon exercise of outstanding options | Weighted-average exercise price of outstanding options | Number of securities remaining available for future issuance under equity compensation plans (excluding securities reflected in column (a)) | ||||||||||
| (a) | (b) | (c) | ||||||||||
| Equity compensation plans approved by security holders | 2,572,571 | $ | 1.35 | 1,818,675 | * | |||||||
| Equity compensation plans not approved by security holders** | 1,625,360 | $ | 1.77 | - | ||||||||
| 44 |
| * |
Aggregate number of shares available for grant under the 2007 Plan, which grants may be in the form of incentive stock options, nonqualified stock options, stock appreciation rights, restricted stock, restricted stock units or other stock-based awards in the discretion of the Board of Directors, with respect to non-employee director grants, or the Compensation Committee, with respect to all other grants. The 2007 Plan also authorizes cash performance awards.
|
| ** | Includes inducement option grants made pursuant to NASDAQ Listing Rule 5635(c). |
Item 13. Certain Relationships and Related Transactions, and Director Independence.
The information required by this Item is incorporated herein by reference to the Proxy Statement.
Item 14. Principal Accounting Fees and Services.
The information required by this Item is incorporated herein by reference to the Proxy Statement.
Item 15. Exhibits, Financial Statement Schedules.
| (a) | 1. | Consolidated Financial Statements: |
| See TheStreet, Inc. Index to Consolidated Financial Statements on page F-1. | ||
| 2. | Consolidated Financial Statement Schedules: | |
| See TheStreet, Inc. Index to Consolidated Financial Statements on page F-1. | ||
| 3. | Exhibits: |
Incorporated by reference to the Exhibit Index immediately preceding the exhibits attached to this Annual Report on Form 10-K.
| 45 |
Pursuant to the requirements of Section 13 or 15(d) of the Securities Exchange Act of 1934, as amended, the Registrant has duly caused this report to be signed on its behalf by the undersigned, thereunto duly authorized.
| TheStreet, Inc. | |||
| Date: March 9, 2016 | By: | /s/ Lawrence S. Kramer | |
| Name: | Lawrence S. Kramer | ||
| Title: | Chairman and Interim Chief Executive Officer | ||
POWER OF ATTORNEY
Each person whose individual signature appears below hereby authorizes and appoints Lawrence S. Kramer and Eric Lundberg, and each of them, with full power of substitution and resubstitution and full power to act without the other, as his or her true and lawful attorney-in-fact and agent to act in his or her name, place and stead and to execute in the name and on behalf of each person, individually and in each capacity stated below, and to file any and all amendments to this Annual Report on Form 10-K, and to file the same, with all exhibits thereto, and other documents in connection therewith, with the Securities and Exchange Commission, granting unto said attorneys-in-fact and agents, and each of them, full power and authority to do and perform each and every act and thing, ratifying and confirming all that said attorneys-in-fact and agents or any of them or their or his substitute or substitutes may lawfully do or cause to be done by virtue thereof.
Pursuant to the requirements of the Securities Exchange Act of 1934, as amended, this report has been signed below by the following persons on behalf of the Registrant and in the capacities and on the dates indicated:
| Signature | Title | Date | ||
| Chairman, and Interim | ||||
| /s/ Lawrence S. Kramer | Chief Executive Officer | |||
| (Lawrence S. Kramer) | (principal executive officer) | March 9, 2016 | ||
| /s/ Eric Lundberg | Chief Financial Officer | |||
| (Eric Lundberg) | (principal financial officer) | March 9, 2016 | ||
| /s/ Richard Broitman | Chief Accounting Officer | March 9, 2016 | ||
| (Richard Broitman) | (principal accounting officer) | |||
| /s/ James J. Cramer | Director | March 9, 2016 | ||
| (James J. Cramer) | ||||
| /s/ Bowers W. Espy | Director | March 9, 2016 | ||
| (Bowers W. Espy) | ||||
| /s/ Sarah Fay | Director | March 9, 2016 | ||
| (Sarah Fay) | ||||
| /s/ Keith B. Hall | Director | March 9, 2016 | ||
| (Keith B. Hall) | ||||
| /s/ Stephen R. Zacharias | Director | March 9, 2016 | ||
| (Stephen R. Zacharias) |
| 46 |
THESTREET, INC.
INDEX TO CONSOLIDATED FINANCIAL STATEMENTS
F-1
Report of Independent Registered Public Accounting Firm
Board of Directors and Stockholders
TheStreet, Inc.
New York, New York
We have audited the accompanying consolidated balance sheets of TheStreet, Inc. as of December 31, 2015 and 2014 and the related consolidated statements of operations, comprehensive loss, stockholders’ equity, and cash flows for each of the three years in the period ended December 31, 2015. In connection with our audits of the financial statements, we have also audited the financial statement schedule listed in the accompanying index. These financial statements and schedule are the responsibility of the Company’s management. Our responsibility is to express an opinion on these financial statements and schedule based on our audit.
We conducted our audits in accordance with the standards of the Public Company Accounting Oversight Board (United States). Those standards require that we plan and perform the audit to obtain reasonable assurance about whether the financial statements are free of material misstatement. An audit includes examining, on a test basis, evidence supporting the amounts and disclosures in the financial statements, assessing the accounting principles used and significant estimates made by management, as well as evaluating the overall presentation of the financial statements and schedule. We believe that our audits provide a reasonable basis for our opinion.
In our opinion, the consolidated financial statements referred to above present fairly, in all material respects, the financial position of TheStreet, Inc. at December 31, 2015 and 2014, and the results of its operations and its cash flows for each of the three years in the period ended December 31, 2015, in conformity with accounting principles generally accepted in the United States of America.
Also, in our opinion, the financial statement schedule, when considered in relation to the basic consolidated financial statements taken as a whole, presents fairly, in all material respects, the information set forth therein.
We also have audited, in accordance with the standards of the Public Company Accounting Oversight Board (United States), TheStreet, Inc.’s internal control over financial reporting as of December 31, 2015, based on criteria established in Internal Control – Integrated Framework (2013) issued by the Committee of Sponsoring Organizations of the Treadway Commission (COSO) and our report dated March 9, 2016 expressed an unqualified opinion thereon.
| /s/ BDO USA, LLP | |
| New York, New York | |
| March 9, 2016 |
F-2
CONSOLIDATED BALANCE SHEETS
| December 31, | ||||||||
| 2015 | 2014 | |||||||
| assets | ||||||||
| Current Assets: | ||||||||
| Cash and cash equivalents | $ | 28,445,416 | $ | 32,459,009 | ||||
| Accounts receivable, net of allowance for doubtful accounts of $357,417 as of December 31, 2015 and $318,141 as of December 31, 2014 | 5,102,464 | 5,103,899 | ||||||
| Marketable securities | - | 2,009,240 | ||||||
| Other receivables | 790,148 | 549,933 | ||||||
| Prepaid expenses and other current assets | 1,205,708 | 987,693 | ||||||
| Restricted cash | 161,250 | 639,750 | ||||||
| Total current assets | 35,704,986 | 41,749,524 | ||||||
| Property and equipment, net of accumulated depreciation and amortization of $4,804,411 as of December 31, 2015 and $4,003,538 as of December 31, 2014 | 2,773,737 | 2,926,825 | ||||||
| Marketable securities | 1,590,000 | 1,560,000 | ||||||
| Other assets | 329,885 | 77,052 | ||||||
| Goodwill | 43,318,670 | 44,810,467 | ||||||
| Other intangibles, net of accumulated amortization of $15,674,328 as of December 31, 2015 and $12,896,782 as of December 31, 2014 | 18,674,376 | 20,147,209 | ||||||
| Restricted cash | 500,000 | 661,250 | ||||||
| Total assets | $ | 102,891,654 | $ | 111,932,327 | ||||
| liabilities and stockholders’ equity | ||||||||
| Current Liabilities: | ||||||||
| Accounts payable | $ | 2,494,341 | $ | 2,474,737 | ||||
| Accrued expenses | 5,161,981 | 6,279,082 | ||||||
| Deferred revenue | 24,738,780 | 26,427,816 | ||||||
| Other current liabilities | 1,235,551 | 1,241,508 | ||||||
| Total current liabilities | 33,630,653 | 36,423,143 | ||||||
| Deferred tax liability | 1,906,295 | 728,899 | ||||||
| Other liabilities | 5,360,467 | 6,910,175 | ||||||
| Total liabilities | 40,897,415 | 44,062,217 | ||||||
| Stockholders’ Equity | ||||||||
| Convertible preferred stock; $0.01 par value; 10,000,000 shares authorized; 5,500 issued and outstanding as of December 31, 2015 and December 31, 2014; the aggregate liquidation preference as of December 31, 2015 and December 31, 2014 totals $55,000,000 | 55 | 55 | ||||||
| Common stock; $0.01 par value; 100,000,000 shares authorized; 42,458,779 shares issued and 35,123,132 shares outstanding as of December 31, 2015, and 41,967,369 shares issued and 34,727,641 shares outstanding as of December 31, 2014 | 424,588 | 419,674 | ||||||
| Additional paid-in capital | 269,524,415 | 271,943,049 | ||||||
| Accumulated other comprehensive loss | (1,999,026 | ) | (227,476 | ) | ||||
| Treasury stock at cost 7,335,647 shares as of December 31, 2015 and 7,239,728 shares as of December 31, 2014 | (13,056,541 | ) | (12,908,943 | ) | ||||
| Accumulated deficit | (192,899,252 | ) | (191,356,249 | ) | ||||
| Total stockholders’ equity | 61,994,239 | 67,870,110 | ||||||
| Total liabilities and stockholders’ equity | $ | 102,891,654 | $ | 111,932,327 | ||||
The accompanying Notes to Consolidated Financial Statements are an integral part of these financial statements
F-3
CONSOLIDATED STATEMENTS OF OPERATIONS
| For the Years Ended December 31, | ||||||||||||
| 2015 | 2014 | 2013 | ||||||||||
| Net revenue: | ||||||||||||
| Subscription services | $ | 55,205,507 | $ | 48,035,953 | $ | 43,549,359 | ||||||
| Media | 12,450,393 | 13,017,265 | 10,901,052 | |||||||||
| Total net revenue | 67,655,900 | 61,053,218 | 54,450,411 | |||||||||
| Operating expense: | ||||||||||||
| Cost of services (exclusive of depreciation and amortization shown separately below) | 33,615,867 | 31,730,740 | 27,431,566 | |||||||||
| Sales and marketing | 16,190,749 | 15,600,129 | 14,453,465 | |||||||||
| General and administrative | 15,000,439 | 13,946,681 | 12,218,964 | |||||||||
| Depreciation and amortization | 4,309,094 | 3,179,377 | 3,768,536 | |||||||||
| Restructuring and other charges | (1,221,224 | ) | — | 385,610 | ||||||||
| Loss on disposition of assets | — | — | 187,434 | |||||||||
| Total operating expense | 67,894,925 | 64,456,927 | 58,445,575 | |||||||||
| Operating loss | (239,025 | ) | (3,403,709 | ) | (3,995,164 | ) | ||||||
| Net interest (expense) income | (122,637 | ) | 88,993 | 209,463 | ||||||||
| Net loss before income taxes | (361,662 | ) | (3,314,716 | ) | (3,785,701 | ) | ||||||
| Provision for income taxes | 1,181,341 | 475,161 | — | |||||||||
| Net loss | (1,543,003 | ) | (3,789,877 | ) | (3,785,701 | ) | ||||||
| Preferred stock cash dividends | 385,696 | 385,696 | — | |||||||||
| Net loss attributable to common stockholders | $ | (1,928,699 | ) | $ | (4,175,573 | ) | $ | (3,785,701 | ) | |||
| Basic and diluted net loss per share: | ||||||||||||
| Net loss attributable to common stockholders | $ | (0.06 | ) | $ | (0.12 | ) | $ | (0.11 | ) | |||
| Cash dividends declared and paid per common share | $ | 0.10 | $ | 0.10 | $ | — | ||||||
| Weighted average basic and diluted shares outstanding | 34,839,233 | 34,370,843 | 33,725,317 | |||||||||
The accompanying Notes to Consolidated Financial Statements are an integral part of these financial statements
F-4
CONSOLIDATED STATEMENTS OF COMPREHENSIVE LOSS
| For the Years Ended December 31, | ||||||||||||
| 2015 | 2014 | 2013 | ||||||||||
| Net loss | $ | (1,543,003 | ) | $ | (3,789,877 | ) | $ | (3,785,701 | ) | |||
| Foreign currency translation (loss) gain | (1,797,794 | ) | 58,768 | — | ||||||||
| Unrealized gain (loss) on marketable securities | 26,244 | (108,061 | ) | (49,189 | ) | |||||||
| Comprehensive loss | $ | (3,314,553 | ) | $ | (3,839,170 | ) | $ | (3,834,890 | ) | |||
The accompanying Notes to Consolidated Financial Statements are an integral part of these financial statements
F-5
THESTREET, INC.
CONSOLIDATED STATEMENTS OF STOCKHOLDERS’ EQUITY
FOR THE YEARS ENDED DECEMBER 31, 2015, 2014, AND 2013
| Common Stock | Series B Preferred Stock | Accumulated Other | Treasury Stock | |||||||||||||||||||||||||||||||||||||
| Shares | Par Value | Shares | Par Value | Additional Paid in Capital | Comprehensive Loss | Shares | Cost | Accumulated Deficit | Total Stockholders' Equity | |||||||||||||||||||||||||||||||
| Balance at December 31, 2012 | 39,855,468 | 398,555 | 5,500 | 55 | 270,943,151 | (128,994 | ) | (6,827,716 | ) | (11,974,261 | ) | (183,780,671 | ) | 75,457,835 | ||||||||||||||||||||||||||
| Unrealized loss on marketable securities | - | - | - | - | - | (49,189 | ) | - | - | - | (49,189 | ) | ||||||||||||||||||||||||||||
| Exercise and issuance of equity grants | 793,949 | 7,939 | - | - | 66,427 | - | (186,191 | ) | (390,199 | ) | - | (315,833 | ) | |||||||||||||||||||||||||||
| Issuance of Common Stock for acquisition | 408,829 | 4,088 | - | - | 776,775 | - | - | - | - | 780,863 | ||||||||||||||||||||||||||||||
| Stock-based consideration for services | - | - | - | - | 2,075,183 | - | - | - | - | 2,075,183 | ||||||||||||||||||||||||||||||
| Net loss | - | - | - | - | - | - | - | - | (3,785,701 | ) | (3,785,701 | ) | ||||||||||||||||||||||||||||
| Balance at December 31, 2013 | 41,058,246 | 410,582 | 5,500 | 55 | 273,861,536 | (178,183 | ) | (7,013,907 | ) | (12,364,460 | ) | (187,566,372 | ) | 74,163,158 | ||||||||||||||||||||||||||
| Unrealized loss on marketable securities | - | - | - | - | - | (108,061 | ) | - | - | - | (108,061 | ) | ||||||||||||||||||||||||||||
| Foreign currency translation gain | - | - | - | - | - | 58,768 | - | - | - | 58,768 | ||||||||||||||||||||||||||||||
| Exercise and issuance of equity grants | 909,123 | 9,092 | - | - | 293,885 | - | (225,821 | ) | (544,483 | ) | - | (241,506 | ) | |||||||||||||||||||||||||||
| Stock-based consideration for services | - | - | - | - | 1,774,761 | - | - | - | - | 1,774,761 | ||||||||||||||||||||||||||||||
| Common stock cash dividends | - | - | - | - | (3,601,437 | ) | - | - | - | - | (3,601,437 | ) | ||||||||||||||||||||||||||||
| Preferred stock cash dividends | - | - | - | - | (385,696 | ) | - | - | - | - | (385,696 | ) | ||||||||||||||||||||||||||||
| Net loss | - | - | - | - | - | - | - | - | (3,789,877 | ) | (3,789,877 | ) | ||||||||||||||||||||||||||||
| Balance at December 31, 2014 | 41,967,369 | 419,674 | 5,500 | 55 | 271,943,049 | (227,476 | ) | (7,239,728 | ) | (12,908,943 | ) | (191,356,249 | ) | 67,870,110 | ||||||||||||||||||||||||||
| Unrealized gain on marketable securities | - | - | - | - | - | 26,244 | - | - | - | 26,244 | ||||||||||||||||||||||||||||||
| Foreign currency translation loss | - | - | - | - | - | (1,797,794 | ) | - | - | - | (1,797,794 | ) | ||||||||||||||||||||||||||||
| Exercise and issuance of equity grants | 491,410 | 4,914 | - | - | (4,075 | ) | - | (95,919 | ) | (147,598 | ) | - | (146,759 | ) | ||||||||||||||||||||||||||
| Stock-based consideration for services | - | - | - | - | 1,570,142 | - | - | - | - | 1,570,142 | ||||||||||||||||||||||||||||||
| Common stock cash dividends | - | - | - | - | (3,599,005 | ) | - | - | - | - | (3,599,005 | ) | ||||||||||||||||||||||||||||
| Preferred stock cash dividends | - | - | - | - | (385,696 | ) | - | - | - | - | (385,696 | ) | ||||||||||||||||||||||||||||
| Net loss | - | - | - | - | - | - | - | - | (1,543,003 | ) | (1,543,003 | ) | ||||||||||||||||||||||||||||
| Balance at December 31, 2015 | 42,458,779 | $ | 424,588 | 5,500 | $ | 55 | $ | 269,524,415 | $ | (1,999,026 | ) | (7,335,647 | ) | $ | (13,056,541 | ) | $ | (192,899,252 | ) | $ | 61,994,239 | |||||||||||||||||||
The accompanying Notes to Consolidated Financial
Statements are an integral part of these financial statements
F-6
CONSOLIDATED STATEMENTS OF CASH FLOWS
| For the Years Ended December 31, | ||||||||||||
| 2015 | 2014 | 2013 | ||||||||||
| Cash Flows from Operating Activities: | ||||||||||||
| Net loss | $ | (1,543,003 | ) | $ | (3,789,877 | ) | $ | (3,785,701 | ) | |||
| Adjustments to reconcile net loss to net cash provided by operating activities: | ||||||||||||
| Stock-based compensation expense | 1,570,142 | 1,774,761 | 1,681,988 | |||||||||
| Provision for doubtful accounts | 280,383 | 189,992 | 22,859 | |||||||||
| Depreciation and amortization | 4,309,094 | 3,179,377 | 3,768,536 | |||||||||
| Deferred tax | 1,177,396 | 440,899 | — | |||||||||
| Restructuring and other charges | — | — | 393,195 | |||||||||
| Deferred rent | (120,400 | ) | (325,147 | ) | (322,533 | ) | ||||||
| Loss (gain) on disposition of assets | — | — | 187,434 | |||||||||
| Noncash barter activity | — | — | 20,000 | |||||||||
| Changes in operating assets and liabilities: | ||||||||||||
| Accounts receivable | (304,156 | ) | 189,008 | 1,509,138 | ||||||||
| Other receivables | (242,563 | ) | 573,028 | 951,116 | ||||||||
| Prepaid expenses and other current assets | (223,375 | ) | 268,677 | 296,012 | ||||||||
| Other assets | (66,556 | ) | 14,138 | (6,675 | ) | |||||||
| Accounts payable | 22,452 | 73,567 | (1,463,684 | ) | ||||||||
| Accrued expenses | (1,146,629 | ) | 979,331 | (1,384,257 | ) | |||||||
| Deferred revenue | (1,109,538 | ) | (144,069 | ) | 517,882 | |||||||
| Other current liabilities | (311,049 | ) | 212,149 | 114,950 | ||||||||
| Other liabilities | (1,401,639 | ) | (83,749 | ) | (21,908 | ) | ||||||
| Net cash provided by operating activities | 890,559 | 3,552,085 | 2,478,352 | |||||||||
| Cash Flows from Investing Activities: | ||||||||||||
| Sale and maturity of marketable securities | 2,005,484 | 9,420,434 | 22,247,394 | |||||||||
| Purchase of assets from DealFlow Media, Inc. | — | — | (1,764,716 | ) | ||||||||
| Purchase of Management Diagnostics Limited | 50,494 | (19,922,072 | ) | — | ||||||||
| Capital expenditures | (3,365,509 | ) | (1,931,173 | ) | (1,118,679 | ) | ||||||
| Restricted cash | 639,750 | — | — | |||||||||
| Proceeds from the disposition of assets | — | — | 71,881 | |||||||||
| Net cash (used in) provided by investing activities | (669,781 | ) | (12,432,811 | ) | 19,435,880 | |||||||
F-7
| For the Years Ended December 31, | ||||||||||||
| 2015 | 2014 | 2013 | ||||||||||
| Cash Flows from Financing Activities: | ||||||||||||
| Cash dividends paid on common stock | (3,539,477 | ) | (3,476,893 | ) | — | |||||||
| Cash dividends paid on preferred stock | (385,696 | ) | (385,696 | ) | — | |||||||
| Proceeds from the exercise of stock options | 839 | 302,977 | 74,366 | |||||||||
| Shares withheld on RSU vesting to pay for withholding taxes | (147,598 | ) | (544,483 | ) | (390,199 | ) | ||||||
| Net cash used in financing activities | (4,071,932 | ) | (4,104,095 | ) | (315,833 | ) | ||||||
| Effect of exchange rate changes on cash and cash equivalents | (162,439 | ) | 71 | — | ||||||||
| Net (decrease) increase in cash and cash equivalents | (4,013,593 | ) | (12,984,750 | ) | 21,598,399 | |||||||
| Cash and cash equivalents, beginning of period | 32,459,009 | 45,443,759 | 23,845,360 | |||||||||
| Cash and cash equivalents, end of period | $ | 28,445,416 | $ | 32,459,009 | $ | 45,443,759 | ||||||
| Supplemental disclosures of cash flow information: | ||||||||||||
| Cash payments made for taxes | $ | 223,110 | $ | — | $ | — | ||||||
| Noncash investing and financing activities: | ||||||||||||
| Stock issued for business combination | $ | — | $ | — | $ | 780,863 | ||||||
The accompanying Notes to Consolidated Financial Statements are an integral part of these financial statements
F-8
NOTES TO CONSOLIDATED FINANCIAL STATEMENTS
December 31, 2015
(1) Organization, Nature of Business and Summary of Operations and Significant Accounting Policies
Organization and Nature of Business
TheStreet, Inc. together with its wholly owned subsidiaries (“TheStreet”, “we”, “us” or the “Company”), is a leading digital financial media company focused on the financial and mergers and acquisitions environment. The Company’s collection of digital services provides users, subscribers and advertisers with a variety of content and tools through a range of online, social media, tablet and mobile channels. Our mission is to provide investors and advisors with actionable ideas from the world of investing, finance and business, and dealmakers with sophisticated analysis of the mergers and acquisitions environment, in order to break down information barriers, level the playing field and help all individuals and organizations grow their wealth. With a robust suite of digital services, TheStreet offers the tools and insights needed to make informed decisions about earning, investing, saving and spending money. Since its inception in 1996, TheStreet believes it has distinguished itself from other financial media companies with its journalistic excellence, unbiased approach and interactive multimedia coverage of the financial markets, economy, industry trends, investment and financial planning.
Substantially all of the Company’s revenue in 2015, 2014 and 2013 was generated from customers in the United States and Europe. During 2015, 2014 and 2013, substantially all of the Company’s long-lived assets were located in the United States and Europe.
Use of Estimates
The preparation of financial statements in conformity with U.S. generally accepted accounting principles (“GAAP”) requires management to make estimates and assumptions that affect the reported amounts of assets and liabilities and disclosure of contingent assets and liabilities at the date of the financial statements and the reported amounts of revenue and expense during the reporting period. Actual results could differ from those estimates. Estimates and assumptions are reviewed periodically and the effects of revisions are reflected in the consolidated financial statements in the period they are deemed to be necessary. Significant estimates made in the accompanying consolidated financial statements include, but are not limited to, the following:
| · | useful lives of intangible assets, |
| · | useful lives of fixed assets, |
| · | the carrying value of goodwill, intangible assets and marketable securities, |
| · | allowances for doubtful accounts and deferred tax assets, |
| · | accrued expense estimates, |
| · | reserves for estimated tax liabilities, |
| · | estimates in connection with the allocation of the purchase price of Management Diagnostics Limited and certain assets acquired from DealFlow Media, Inc. to the fair value of the assets acquired and liabilities assumed, |
| · | certain estimates and assumptions used in the calculation of the fair value of equity compensation issued to employees, |
| · | restructuring charges, and |
| · | the calculation of a contingent earn-out payment from the acquisition of Management Diagnostics Limited. |
F-9
Consolidation
The consolidated financial statements have been prepared in accordance with GAAP and include the accounts of TheStreet, Inc. and its wholly-owned subsidiaries. All intercompany balances and transactions have been eliminated in consolidation.
Revenue Recognition
The Company generates its revenue primarily from subscription services and media.
Subscription services revenue is comprised of subscriptions, licenses and fees for access to securities investment information, stock market commentary, rate services, director and officer profiles, relationship capital management services, and transactional information pertaining to mergers and acquisitions and other changes in the corporate control environment. Subscriptions are charged to customers’ credit cards or are directly billed to corporate subscribers, and are generally billed in advance on a monthly, quarterly or annual basis. The Company calculates net subscription revenue by deducting from gross revenue an estimate of potential refunds from cancelled subscriptions as well as chargebacks of disputed credit card charges. Net subscription revenue is recognized ratably over the subscription periods. Deferred revenue relates to payments for subscription fees for which revenue has not been recognized because services have not yet been provided.
Subscription services revenue is subject to estimation and variability due to the fact that, in the normal course of business, subscribers may for various reasons contact us or their credit card companies to request a refund or other adjustment for a previously purchased subscription. With respect to many of our annual newsletter subscription products, we offer the ability to receive a refund during the first 30 days but none thereafter. Accordingly, we maintain a provision for estimated future revenue reductions resulting from expected refunds and chargebacks related to subscriptions for which revenue was recognized in a prior period. The calculation of this provision is based upon historical trends and is reevaluated each quarter. The provision was not material for any of the three years ended December 31, 2015.
Media revenue is comprised of fees charged for the placement of advertising and sponsorships within TheStreet and our affiliated properties, our subscription and institutional services, and other miscellaneous revenue. Media revenue is recognized as the advertising or sponsorship is displayed, provided that collection of the resulting receivable is reasonably assured.
Cash, Cash Equivalents and Restricted Cash
The Company considers all short-term investment-grade securities with original maturities of three months or less from the date of purchase to be cash equivalents. As of December 31, 2015, the Company has a total of approximately $661 thousand of cash that serves as collateral for outstanding letters of credit, which cash is classified as restricted. The letters of credit serve as security deposits for the Company’s office space in New York City.
F-10
Property and Equipment
Property and equipment are stated at cost, net of accumulated depreciation and amortization. Property and equipment are depreciated on a straight-line basis over the estimated useful lives of the assets. The estimated useful life of computer equipment, computer software and telephone equipment is three years and of furniture and fixtures is five years. Leasehold improvements are amortized on a straight-line basis over the shorter of the respective lease term or the estimated useful life of the asset. If the useful lives of the assets differ materially from the estimates contained herein, additional costs could be incurred, which could have an adverse impact on our expenses.
Capitalized Software and Website Development Costs
The Company expenses all costs incurred in the preliminary project stage for software developed for internal use and capitalizes all external direct costs of materials and services consumed in developing or obtaining internal-use computer software in accordance with Accounting Standards Codification (“ASC”) 350, Intangibles – Goodwill and Other (“ASC 350”). In addition, for employees who are directly associated with and who devote time to internal-use computer software projects, to the extent of the time spent directly on the project, the Company capitalizes payroll and payroll-related costs of such employees incurred once the development has reached the applications development stage. For the years ended December 31, 2015, 2014 and 2013, the Company capitalized software development costs totaling approximately $486 thousand, $408 thousand and $289 thousand, respectively. All costs incurred for upgrades, maintenance and enhancements that do not result in additional functionality are expensed.
The Company also accounts for its Website development costs under ASC 350, which provides guidance on the accounting for the costs of development of company Websites, dividing the Website development costs into five stages: (1) the planning stage, during which the business and/or project plan is formulated and functionalities, necessary hardware and technology are determined, (2) the Website application and infrastructure development stage, which involves acquiring or developing hardware and software to operate the Website, (3) the graphics development stage, during which the initial graphics and layout of each page are designed and coded, (4) the content development stage, during which the information to be presented on the Website, which may be either textual or graphical in nature, is developed, and (5) the operating stage, during which training, administration, maintenance and other costs to operate the existing Website are incurred. The costs incurred in the Website application and infrastructure stage, the graphics development stage and the content development stage are capitalized; all other costs are expensed as incurred. Amortization of capitalized costs will not commence until the project is completed and placed into service. For the years ended December 31, 2015, 2014 and 2013, the Company capitalized Website development costs totaling approximately $1.8 million, $1.2 million and $443 thousand, respectively.
Capitalized software and Website development costs are amortized using the straight-line method over the estimated useful life of the software or Website, which varies based upon the project. Total amortization expense was approximately $1.0 million, $428 thousand and $743 thousand, for the years ended December 31, 2015, 2014 and 2013, respectively.
Goodwill and Indefinite Lived Intangible Assets
Goodwill represents the excess of purchase price over the value assigned to the net tangible and identifiable intangible assets of businesses acquired. Under the provisions of ASC 350, goodwill and indefinite lived intangible assets are required to be tested for impairment on an annual basis and between annual tests whenever circumstances arise that indicate a possible impairment might exist. We perform our annual impairment tests of goodwill and indefinite lived intangible assets as of October 1 each year. Impairment exists when the carrying amount of goodwill and indefinite lived intangible assets exceed their implied fair value, resulting in an impairment charge for this excess.
F-11
The Company evaluates goodwill for impairment using a two-step impairment test approach at the Company level, as the Company is considered to operate as a single reporting unit. In the first step, the fair value of the Company is compared to its book value, including goodwill and indefinite-lived intangible assets. If the fair value of the Company is less than the book value, a second step is performed that compares the implied fair value of the Company's goodwill and indefinite lived intangible assets to the book value of the goodwill and indefinite lived intangible assets. The fair value for the goodwill and indefinite lived intangible assets is determined based on the difference between the fair value of the Company and the net fair values of identifiable assets and liabilities. If the fair value of the goodwill and indefinite lived intangible assets is less than the book value, the difference is recognized as impairment.
ASU 2011-08, Testing for Goodwill Impairment (“ASU 2011-08”) permits an entity to make a qualitative assessment of whether it is more likely than not that a reporting unit’s fair value is less than its carrying amount before applying the two-step goodwill impairment test. If an entity concludes it is not more likely than not that the fair value of a reporting unit is less than its carrying amount, it need not perform the two-step impairment test. During 2015, the Company elected not to apply the qualitative assessment under this guidance and continued to apply the quantitative assessment in its evaluating of goodwill for impairment.
In testing for impairment of goodwill, the fair value of the Company was estimated using a market approach for the valuation of our common stock, based upon actual prices of the Company’s Common Stock, and the income approach for the estimated fair value of the Company’s outstanding Preferred Shares. The Company also performed an income approach to confirm the reasonableness of the common stock market approach by using the discounted cash flow method. Based upon annual impairment tests performed in 2015 and 2014, no impairment was indicated as the Company’s fair value, inclusive of a control premium, exceeded its book value by approximately 53% and 62%, respectively. The fair value of the Company’s outstanding Preferred Shares requires significant judgments, including the estimation of the amount of time until a liquidation event occurs as well as an appropriate cash flow discount rate. Further, in assigning a fair value to the Company’s Preferred Stock, the Company also considered that the preferred shareholders are entitled to receive a $55 million liquidation preference upon liquidation or dissolution of the Company or upon any change of control event. Additionally, the holders of the Preferred Shares are entitled to receive dividends and to vote as a single class together with the holders of the Common Stock on an as-converted basis and, provided certain preferred share ownership levels are maintained, are entitled to representation on the Company’s board of directors and may unilaterally block issuance of certain classes of capital stock, the purchase or redemption of certain classes of capital stock, including Common Stock (with certain exceptions) and any increases in the per-share amount of dividends payable to the holders of the Common Stock. A decrease in the price of the Company’s Common Stock, or changes in the estimated value of the Company’s Preferred Shares, could materially affect the determination of the fair value and could result in an impairment charge to reduce the carrying value of goodwill, which could be material to the Company’s financial position and results of operations.
In testing for impairment of the Company’s indefinite lived intangible asset, the Company determined the fair value using the relief-from-royalty method. This analysis calculated the fair value as the present value of the future expenses avoided by owning the indefinite lived trade name rather than having to license its use. The Company selected an appropriate royalty rate by reviewing licensing transactions for similar trade names and by considering the profitability associated with its operations. Based upon annual impairment tests performed in 2015 and 2014, the Company concluded that the book value of its indefinite lived trade name was not impaired as the fair value exceeded its book value by approximately 129% and 165%, respectively.
F-12
Additionally, the Company evaluates the remaining useful lives of intangible assets each year to determine whether events or circumstances continue to support their useful life. There have been no changes in useful lives of intangible assets for each period presented.
During the year ended December 31, 2014, the Company performed its annual impairment test of goodwill and indefinite-lived intangible assets as of September 30. For the year ended December 31, 2015, the Company changed the date of its annual impairment test of goodwill and indefinite-lived intangible assets to October 1 in order to allow for a more comprehensive review. The change in the testing date does not represent a material change in the method of applying the accounting policy and such change does not have an effect on the financial statements.
Long-Lived Assets
The Company evaluates long-lived assets, including amortizable identifiable intangible assets, for impairment whenever events or changes in circumstances indicate that the carrying amount of an asset may not be recoverable. Upon such an occurrence, recoverability of assets is measured by comparing the carrying amount of an asset to forecasted undiscounted net cash flows expected to be generated by the asset. If the carrying amount of the asset exceeds its estimated future cash flows, an impairment charge is recognized for the amount by which the carrying amount of the asset exceeds the fair value of the asset. Management does not believe that there was any impairment of long-lived assets as of December 31, 2015 and 2014.
Income Taxes
The Company accounts for its income taxes in accordance with ASC 740-10, Income Taxes (“ASC 740-10”). Under ASC 740-10, deferred tax assets and liabilities are recognized for the future tax consequences attributable to differences between the financial statement carrying amounts of existing assets and liabilities and their tax bases. ASC 740-10 also requires that deferred tax assets be reduced by a valuation allowance if it is more likely than not that some or all of the deferred tax assets will not be realized based on all available positive and negative evidence. As of December 31, 2015 and 2014, we maintain a full valuation allowance against our deferred tax assets due to our prior history of pre-tax losses and uncertainty about the timing of and ability to generate taxable income in the future and our assessment that the realization of the deferred tax assets did not meet the “more likely than not” criterion under ASC 740-10. We expect to continue to maintain a full valuation allowance until, or unless, we can sustain a level of profitability that demonstrates our ability to utilize these assets.
ASC 740-10 also prescribes a recognition threshold and a measurement attribute for the financial statement recognition and measurement of tax positions taken or expected to be taken in a tax return. For those benefits to be recognized, a tax position must be more likely than not to be sustained upon examination by taxing authorities. Differences between tax positions taken or expected to be taken in a tax return and the benefit recognized and measured pursuant to the interpretation are referred to as “unrecognized benefits.” A liability is recognized for an unrecognized tax benefit because it represents an enterprise’s potential future obligation to the taxing authority for a tax position that was not recognized as a result of applying the provisions of ASC 740-10. As of December 31, 2015 and 2014, no liability for unrecognized tax benefits was required to be recorded. Interest costs related to unrecognized tax benefits would be classified within “Net interest income” in the consolidated statements of operations. Penalties would be recognized as a component of “General and administrative” expenses. There is no interest expense or penalty related to tax uncertainties reported in the consolidated statements of operations for the years ended December 31, 2015, 2014 or 2013.
F-13
Deferred tax assets pertaining to windfall tax benefits on the exercise of share awards and the corresponding credit to additional paid-in capital are recorded if the related tax deduction reduces tax payable. The Company has elected the “with-and-without approach” regarding ordering of windfall tax benefits to determine whether the windfall tax benefit did reduce taxes payable in the current year. Under this approach, the windfall tax benefits would be recognized in additional paid-in capital only if an incremental tax benefit is realized after considering all other tax benefits presently available to the Company.
The Company files income tax returns in the United States (federal), and in various state and local jurisdictions, as well as in the United Kingdom and India. In most instances, the Company is no longer subject to federal, state and local income tax examinations by tax authorities for years prior to 2012, and is not currently under examination by any federal, state or local jurisdiction. It is not anticipated that unrecognized tax benefits will significantly change in the next twelve months.
Fair Value of Financial Instruments
The carrying amounts of accounts and other receivables, accounts payable, accrued expenses and deferred revenue approximate fair value due to the short-term maturities of these instruments.
Business Concentrations and Credit Risk
Financial instruments that subject the Company to concentrations of credit risk consist primarily of cash, cash equivalents and restricted cash. The Company maintains all of its cash, cash equivalents and restricted cash in seven financial institutions, and performs periodic evaluations of the relative credit standing of these institutions. As of December 31, 2015, the Company’s cash, cash equivalents and restricted stock primarily consisted of money market funds and checking accounts.
For the years ended December 31, 2015, 2014 and 2013, no single customer accounted for 10% or more of consolidated revenue. As of December 31, 2015 and 2014, no single customer accounted for more than 10% of our gross accounts receivable balance.
The Company’s customers are primarily concentrated in the United States and Europe, and we carry accounts receivable balances. The Company performs ongoing credit evaluations, generally does not require collateral, and establishes an allowance for doubtful accounts based upon factors surrounding the credit risk of customers, historical trends and other information. To date, actual losses have been within management’s expectations.
Other Comprehensive Loss
Comprehensive loss is a measure which includes both net loss and other comprehensive loss. Other comprehensive loss results from items deferred from recognition into the statement of operations. Accumulated other comprehensive loss is separately presented on the consolidated statement of comprehensive loss and on both the Company's consolidated balance sheet and as part of the consolidated statement of stockholders’ equity. Other comprehensive loss consists of unrealized gains and losses on marketable securities classified as available for sale as well as foreign currency translation adjustments from subsidiaries where the local currency is the functional currency.
F-14
Foreign Currency
The functional currency of the Company’s international subsidiaries is the local currency. The financial statements of these subsidiaries are translated into U.S. dollars using period-end rates of exchange for assets and liabilities, historical rates of exchange for equity, and average rates of exchange for the period for revenue and expense. Translation gains (losses) are recorded in accumulated other comprehensive loss as a component of stockholders’ equity. Gains and losses resulting from currency transactions are included in earnings.
Net Loss Per Share of Common Stock
Basic net loss per share is computed using the weighted average number of common shares outstanding during the period. Diluted net loss per share is computed using the weighted average number of common shares and potential common shares outstanding during the period, so long as the inclusion of potential common shares does not result in a lower net loss per share. Potential common shares consist of restricted stock units (using the treasury stock method), the incremental common shares issuable upon the exercise of stock options (using the treasury stock method), and the conversion of the Company’s convertible preferred stock (using the if-converted method). For the years ended December 31, 2015 2014 and 2013, approximately 3.1 million, 5.2 million and 4.2 million, respectively, of unvested restricted stock units, vested and unvested options to purchase Common Stock, were excluded from the calculation, as their effect would result in a lower net loss per share.
Advertising Costs
Advertising costs are expensed as incurred. For the years ended December 31, 2015, 2014 and 2013, advertising expense totaled approximately $2.6 million, $3.0 million and $2.9 million, respectively.
Stock-Based Compensation
The Company accounts for stock-based compensation in accordance with ASC 718-10, Share Based Payment Transactions (“ASC 718-10”). This requires that the cost resulting from all share-based payment transactions be recognized in the financial statements based upon estimated fair values.
Stock-based compensation expense recognized for the years ended December 31, 2015, 2014 and 2013 was approximately $1.6 million, $1.8 million and $2.1 million, respectively. As of December 31, 2015, there was approximately $1.8 million of unrecognized stock-based compensation expense remaining to be recognized over a weighted-average period of 1.9 years.
Stock-based compensation expense recognized in the Company’s consolidated statements of operations for the years ended December 31, 2015, 2014 and 2013 includes compensation expense for all share-based payment awards based upon the estimated grant date fair value. The Company recognizes compensation expense for share-based payment awards on a straight-line basis over the requisite service period of the award. As stock-based compensation expense recognized in the years ended December 31, 2015, 2014 and 2013 is based upon awards ultimately expected to vest, it has been reduced for estimated forfeitures. The Company estimates forfeitures at the time of grant which are revised, if necessary, in subsequent periods if actual forfeitures differ from those estimates.
F-15
The Company estimates the value of stock option awards on the date of grant using the Black-Scholes option-pricing model. This determination is affected by the Company’s stock price as well as assumptions regarding expected volatility, risk-free interest rate, and expected dividends. Because option-pricing models require the use of subjective assumptions, changes in these assumptions can materially affect the fair value of the options. The assumptions presented in the table below represent the weighted-average value of the applicable assumption used to value stock option awards at their grant date. In determining the volatility assumption, the Company used a historical analysis of the volatility of the Company’s share price for the preceding period equal to the expected option lives. The expected option lives, which represent the period of time that options granted are expected to be outstanding, were estimated based upon the “simplified” method for “plain-vanilla” options. The risk-free interest rate assumption was based upon observed interest rates appropriate for the term of the Company’s stock option awards. The dividend yield assumption was based on the history and expectation of future dividend payouts. The value of the portion of the award that is ultimately expected to vest is recognized as expense over the requisite service periods. The Company’s estimate of pre-vesting forfeitures is primarily based on historical experience and is adjusted to reflect actual forfeitures as the options vest. The weighted-average grant date fair value per share of stock option awards granted during the years ended December 31, 2015, 2014 and 2013 was $0.39, $0.44 and $0.63, respectively, using the Black-Scholes model with the following weighted-average assumptions:
| For the Year Ended December 31, | ||||||||||||
| 2015 | 2014 | 2013 | ||||||||||
| Expected option lives | 3.0 years | 3.6 years | 3.7 years | |||||||||
| Expected volatility | 35.45 | % | 35.54 | % | 40.11 | % | ||||||
| Risk-free interest rate | 0.97 | % | 1.11 | % | 0.85 | % | ||||||
| Expected dividends | 4.59 | % | 4.22 | % | 0.00 | % | ||||||
The value of each restricted stock unit awarded is equal to the closing price per share of the Company’s Common Stock on the date of grant. The value of the portion of the award that is ultimately expected to vest is recognized as expense over the requisite service periods. The weighted-average grant date fair value per share of restricted stock units granted during the years ended December 31, 2015, 2014 and 2013 was $2.19, $2.23 and $2.06, respectively.
The Company utilizes the alternative transition method for calculating the tax effects of stock-based compensation. Under the alternative transition method the Company established the beginning balance of the additional paid-in capital pool (“APIC pool”) related to the tax effects of employee stock-based compensation and then determines the subsequent impact on the APIC pool and cash flows of the tax effects of employee stock-based compensation awards that are outstanding.
2007 Performance Incentive Plan
In 2007, the Company adopted the 2007 Plan, whereby executive officers, directors, employees and consultants may be eligible to receive cash or equity-based performance awards based on set performance criteria.
In 2015, 2014 and 2013, the Compensation Committee granted short-term cash performance awards, payable to certain officers upon the Company’s achievement of specified performance goals for such year. The target short-term cash bonus opportunities for officers reflected a percentage of the officer’s base salary. The short-term cash incentives were based upon achievement of certain financial targets, as defined by the Compensation Committee. Potential payout was zero if a threshold percentage of the target was not achieved and a sliding scale thereafter, subject to a cap, starting at a figure less than 100% if the threshold was achieved but the target was not met and ending at a figure above 100% if the target was exceeded. Short-term incentives of approximately $670 thousand, $918 thousand and $599 thousand were deemed earned with respect to the years ended December 31, 2015, 2014 and 2013, respectively.
F-16
Services Agreement
On November 13, 2012, the Company entered into a Services Agreement (the “Agreement”) in which a third-party granted TheStreet an exclusive right to sell and serve advertisement and e-commerce on certain of its personal finance Websites. The agreement terminated on May 31, 2013. TheStreet supported the Websites by providing personal finance content, various promotion and advertisements on TheStreet’s Websites, and marketing and accounting support. Under the Agreement, the Company reimbursed this third party for certain expenses, subject to specified limits. Both parties shared in the profits generated by the partnership, after TheStreet recouped the aggregate amount paid to the third party in addition to certain sales, marketing, editorial and operational costs incurred by the Company.
In accordance with ASC 808, “Accounting for Collaborative Agreement,” a participant in a collaborative arrangement must report the costs incurred and revenues generated on sales to third parties at gross or net amounts, depending on whether the participant is the principal or the agent in the transaction. Based on the facts and circumstances with regards to the Agreement, the Company determined that it was the Principal in this Agreement for all advertising sold by the Company. With respect to the advertising and e-commerce revenue generated by the third party, the Company treated this as a reimbursement of expenses paid. For the year ended December 31, 2013 the Company recognized $264 thousand in net expense reimbursements reflected in cost of sales on the consolidated statement of operations related to this agreement.
Preferred Stock
The Company applies the guidance in ASC 480, Distinguishing Liabilities from Equity (“ASC 480”) when determining the classification and measurement of its convertible preferred shares. Preferred shares subject to mandatory redemption (if any) are classified as liability instruments and are measured at fair value. Accordingly the Company classifies conditionally redeemable preferred shares (if any), which includes preferred shares that feature redemption rights that are either within the control of the holder or subject to redemption upon the occurrence of uncertain events not solely within the Company’s control, as temporary equity. At all other times, the Company classifies its preferred shares as a component of stockholders’ equity.
The Company’s Series B Convertible Preferred Stock does not feature any redemption rights within the holders’ control or conditional redemption features not solely within the Company’s control as of December 31, 2015. Accordingly, the Series B Convertible Preferred Stock is presented as a component of stockholders’ equity.
Subsequent Events
The Company has evaluated subsequent events for recognition or disclosure.
F-17
New Accounting Pronouncements
In May 2014, the Financial Accounting Standards Board (“FASB”) issued Accounting Standards Update No. 2014-09, “Revenue from Contracts with Customers” (“ASU 2014-09”), which supersedes nearly all existing revenue recognition guidance under GAAP. The core principle of ASU 2014-09 is to recognize revenues when promised goods or services are transferred to customers in an amount that reflects the consideration to which an entity expects to be entitled for those goods or services. ASU 2014-09 defines a five step process to achieve this core principle and, in doing so, more judgment and estimates may be required within the revenue recognition process than are required under existing GAAP. On July 9, 2015, the FASB voted to defer the effective date by one year to December 15, 2017 for interim and annual reporting periods beginning after that date. Early adoption of ASU 2014-09 is permitted but not before the original effective date (annual periods beginning after December 15, 2016). When effective, ASU 2014-09 prescribes either of the following transition methods: (i) a full retrospective approach reflecting the application of the standard in each prior reporting period with the option to elect certain practical expedients; or (ii) a retrospective approach with the cumulative effect of initially adopting ASU 2014-09 recognized at the date of adoption (which includes additional footnote disclosures). We are currently evaluating the impact of our pending adoption of ASU 2014-09 on our consolidated financial statements and have not yet determined the method by which we will adopt the standard.
In January 2015, the FASB issued ASU 2015-01, Income Statement — Extraordinary and Unusual Items (Subtopic 225-20): Simplifying Income Statement Presentation by Eliminating the Concept of Extraordinary Items (“ASU 2015-01”). ASU 2015-01 eliminates the concept of extraordinary items from GAAP but retains the presentation and disclosure guidance for items that are unusual in nature or occur infrequently and expands the guidance to include items that are both unusual in nature and infrequently occurring. ASU 2015-01 is effective for fiscal years, and interim periods within those years, beginning after December 15, 2015. A reporting entity may apply ASU 2015-01 prospectively. A reporting entity may also apply ASU 2015-01 retrospectively to all periods presented in the financial statements. We believe the adoption of ASU 2015-01 will not have a material effect on our consolidated financial statements.
In November 2015, the FASB issued Accounting Standards Update No. 2015-17, Income Taxes (Topic 740) Balance Sheet Classification of Deferred Taxes (ASU 2015-17). ASU 2015-17 requires entities to present deferred tax assets and deferred tax liabilities as noncurrent in a classified balance sheet. ASU 2017-17 simplifies the current guidance, which requires entities to separately present deferred tax assets and deferred tax liabilities as current and noncurrent in a classified balance sheet. The guidance in ASU 2015-17 is required for annual reporting periods beginning after December 15, 2016, including interim periods within the reporting period. We early adopted the provisions of this ASU during the fourth quarter of fiscal year 2015 and applied it retrospectively. Adoption of this standard did not impact the balance sheet classification of the Company’s deferred tax liability, results of operations, retained earnings, or cash flows in the current or previous interim and annual reporting periods.
In February 2016, the FASB issued Accounting Standards Update No. 2016-02, Leases. The new standard establishes a right-of-use (ROU) model that requires a lessee to record a ROU asset and a lease liability on the balance sheet for all leases with terms longer than 12 months. Leases will be classified as either finance or operating, with classification affecting the pattern of expense recognition in the income statement. The new standard is effective for fiscal years beginning after December 15, 2018, including interim periods within those fiscal years. A modified retrospective transition approach is required for lessees for capital and operating leases existing at, or entered into after, the beginning of the earliest comparative period presented in the financial statements, with certain practical expedients available. We are currently evaluating the impact of our pending adoption of the new standard on our consolidated financial statements.
F-18
(2) Acquisitions
Management Diagnostics Limited
On October 31, 2014, the Company acquired all of the outstanding share capital of Management Diagnostics Limited (“MDL”), a privately held company headquartered in London, England. MDL is the owner of BoardEx, an institutional relationship capital management database and platform. Clients, including investment banks, consultancies and law firms use BoardEx to leverage their relationships and facilitate business and corporate development initiatives. The Company paid cash consideration of approximately $22.1 million at closing, of which $1.5 million was placed in escrow which will be used to secure indemnity obligations for a period of 24 months. Additionally, the Company assumed net liabilities approximating $5.0 million, inclusive of a potential earn-out payable in 2018 based on 2017 net revenue of BoardEx’s existing products and services. The results of operations of MDL are included in the Company’s consolidated financial statements for the year ended December 31, 2015 and for the year ended December 31, 2014 from October 31, 2014, the date of the acquisition.
In December of 2015, the Company made an entity classification election under IRC Section 301.7701-1 to treat MDL as a disregarded entity for US income tax purposes. Since an election under IRC Section 338(g) was made on the acquisition of MDL to treat it as an asset purchase for U.S. income tax purposes, the goodwill is amortizable under IRC Section 197 over 15 years on the Company’s U.S. income tax return.
The following table summarizes the consideration paid and the amounts of the assets acquired and liabilities assumed recognized at the acquisition date.
| Amortization Life | ||||||||
| (in years) | Amount | |||||||
| Accounts receivable, net | $ | 997,161 | ||||||
| Other receivables | 750,434 | |||||||
| Prepaid expenses and other current assets | 91,598 | |||||||
| Property and equipment, net | 153,060 | |||||||
| Other assets | 109,000 | |||||||
| Identifiable intangible assets: | ||||||||
| - Customer relationships | 10 | 3,670,000 | ||||||
| - Database | 10 | 5,130,000 | ||||||
| - Trade name | 6 | 310,000 | ||||||
| Accounts payable | (50,135 | ) | ||||||
| Accrued expenses | (956,156 | ) | ||||||
| Deferred revenue | (4,367,717 | ) | ||||||
| Other current liabilities | (40,516 | ) | ||||||
| Other liabilities | (2,687,838 | ) | ||||||
| Total identifiable net assets | 3,108,891 | |||||||
| Goodwill | 16,813,181 | |||||||
| Cash consideration, net of cash acquired | $ | 19,922,072 | ||||||
Acquisition related costs totaling $1.5 million are included in general and administrative expenses in the Company’s condensed consolidated statement of operations for the year ended December 31, 2014.
The DealFlow Report, The Life Settlements Report and the PrivateRaise database
On April 19, 2013, the Company acquired The DealFlow Report, The Life Settlements Report and the PrivateRaise database (the “DealFlow” acquisition) from DealFlow Media, Inc. These newsletters and database, and the employees providing their content, have been incorporated into The Deal, TheStreet’s institutional platform. The Company paid cash consideration of approximately $2.0 million and issued 408,829 unregistered shares of the Company’s common stock, having a value on the closing date of approximately $781 thousand. Additionally, the Company assumed net liabilities of approximately $726 thousand. The acquisition was not significant and pro forma financial information was not required. The results of operations of DealFlow are included in the consolidated financial statements for the year ended December 31, 2015 and 2014, and for the year ended December 31, 2013 from April 19, 2013, the date of the acquisition.
F-19
Proforma Information
Unaudited pro forma consolidated financial information is presented below as if the acquisition of MDL had occurred on January 1, 2013. The historical financial statements of MDL were prepared in accordance with United Kingdom generally accepted accounting principles and have been converted to U.S. generally accepted accounting principles for purposes of the unaudited pro forma consolidated financial information presented below. The results have been adjusted to account for the amortization of acquired intangible assets, to reclassify a defined benefit plan actuarial gain recorded by MDL within the statement of operations to accumulated other comprehensive income in accordance with U.S. generally accepted accounting principles, and deal acquisition costs. The pro forma information presented below does not purport to present what actual results would have been if the acquisition had occurred at January 1, 2013, nor does the information project results for any future period. The unaudited pro forma consolidated financial information should be read in conjunction with the historical financial information of the Company included in this report, as well as the historical financial information included in other reports and documents filed with the Securities and Exchange Commission. The unaudited pro forma consolidated financial information for the years ended December 31, 2014 and 2013 is as follows:
| For the Years Ended December 31, | ||||||||
| 2014 | 2013 | |||||||
| Total Revenue | $ | 69,554,714 | $ | 63,979,231 | ||||
| Net Loss | $ | (1,505,531 | ) | $ | (2,814,915 | ) | ||
| Basic and diluted net loss per share | $ | (0.04 | ) | $ | (0.08 | ) | ||
(3) Net Loss Per Share
Basic net loss per share is computed using the weighted average number of common shares outstanding during the period. Diluted net loss per share is computed using the weighted average number of common shares and potential common shares outstanding during the period, so long as the inclusion of potential common shares does not result in a lower net loss per share. Potential common shares consist of restricted stock units (using the treasury stock method), the incremental common shares issuable upon the exercise of stock options (using the treasury stock method), and the conversion of the Company’s convertible preferred stock (using the if-converted method). For the years ended December 31, 2015, 2014 and 2013, approximately 3.1 million, 5.2 million and 4.2 million unvested restricted stock units, vested and unvested options to purchase Common Stock, respectively, were excluded from the calculation, as their effect would result in a lower net loss per share.
F-20
The following table reconciles the numerator and denominator for the calculation.
| For the Years Ended December 31, | ||||||||||||
| 2015 | 2014 | 2013 | ||||||||||
| Basic and diluted net loss per share Numerator: | ||||||||||||
| Net loss | $ | 1,543,003 | $ | 3,789,877 | $ | 3,785,701 | ||||||
| Preferred stock cash dividends | 385,696 | 385,696 | - | |||||||||
| Numerator for basic and diluted earnings per share – Net loss attributable to common stockholders | $ | 1,928,699 | $ | 4,175,573 | $ | 3,785,701 | ||||||
| Denominator: | ||||||||||||
| Weighted average basic and diluted shares outstanding | 34,839,233 | 34,370,843 | 33,725,317 | |||||||||
| Basic and diluted net loss per share: | ||||||||||||
| Net loss attributable to common stockholders | $ | (0.06 | ) | $ | (0.12 | ) | $ | (0.11 | ) | |||
(4) Cash and Cash Equivalents, Marketable Securities and Restricted Cash
The Company’s cash and cash equivalents and restricted cash primarily consist of money market funds and checking accounts. As of December 31, 2015, marketable securities consist of two municipal auction rate securities (“ARS”) issued by the District of Columbia with a cost basis of approximately $1.9 million and a fair value of approximately $1.6 million. As of December 31, 2014, marketable securities also included an investment grade corporate bond, and the aggregate fair value of these marketable securities was approximately $3.6 million and the total cost basis was approximately $3.9 million. The decrease in marketable securities was due to the Company not reinvesting the proceeds as securities matured. With the exception of the ARS, the maximum maturity for any investment is three years. The ARS mature in the year 2038. The Company accounts for its marketable securities in accordance with ASC 320-10. The Company classifies these securities as available for sale and the securities are reported at fair value. Unrealized gains and losses are recorded as a component of accumulated other comprehensive loss and excluded from net loss as they are deemed temporary. Additionally, as of December 31, 2015 and 2014, the Company has a total of approximately $661 thousand and $1.3 million, respectively, of cash that serves as collateral for outstanding letters of credit, and which cash is therefore restricted. The letters of credit serve as security deposits for the Company’s office space in New York City.
| As of December 31, | ||||||||
| 2015 | 2014 | |||||||
| Cash and cash equivalents | $ | 28,445,416 | $ | 32,459,009 | ||||
| Current and noncurrent marketable securities | 1,590,000 | 3,569,240 | ||||||
| Current and noncurrent restricted cash | 661,250 | 1,301,000 | ||||||
| Total cash and cash equivalents, current and noncurrent marketable securities and current and noncurrent restricted cash | $ | 30,696,666 | $ | 37,329,249 | ||||
F-21
(5) Fair Value Measurements
The Company measures the fair value of its financial instruments in accordance with ASC 820-10, which refines the definition of fair value, provides a framework for measuring fair value and expands disclosures about fair value measurements. ASC 820-10 defines fair value as the price that would be received to sell an asset or paid to transfer a liability (an exit price) in an orderly transaction between market participants at the reporting date. The statement establishes consistency and comparability by providing a fair value hierarchy that prioritizes the inputs to valuation techniques into three broad levels, which are described below:
| • | Level 1: Inputs are quoted market prices in active markets for identical assets or liabilities (these are observable market inputs). |
| • | Level 2: Inputs other than quoted market prices included within Level 1 that are observable for the asset or liability (includes quoted market prices for similar assets or identical or similar assets in markets in which there are few transactions, prices that are not current or vary substantially). |
| • | Level 3: Inputs are unobservable inputs that reflect the entity’s own assumptions in pricing the asset or liability (used when little or no market data is available). |
Financial assets and liabilities included in our financial statements and measured at fair value are classified based on the valuation technique level in the table below:
| As of December 31, 2015 | ||||||||||||||||
| Total | Level 1 | Level 2 | Level 3 | |||||||||||||
| Description: | ||||||||||||||||
| Cash and cash equivalents (1) | $ | 28,445,416 | $ | 28,445,416 | $ | — | $ | — | ||||||||
| Restricted cash (1) | 661,250 | 661,250 | — | — | ||||||||||||
| Marketable securities (2) | 1,590,000 | — | — | 1,590,000 | ||||||||||||
| Contingent earn-out (3) | 2,590,339 | — | — | 2,590,339 | ||||||||||||
| Total at fair value | $ | 33,287,005 | $ | 29,106,666 | $ | — | $ | 4,180,339 | ||||||||
| As of December 31, 2014 | ||||||||||||||||
| Total | Level 1 | Level 2 | Level 3 | |||||||||||||
| Description: | ||||||||||||||||
| Cash and cash equivalents (1) | $ | 32,459,009 | $ | 32,459,009 | $ | — | $ | — | ||||||||
| Restricted cash (1) | 1,301,000 | 1,301,000 | — | — | ||||||||||||
| Marketable securities (2) | 3,569,240 | 2,009,240 | — | 1,560,000 | ||||||||||||
| Contingent earn-out (3) | 2,602,105 | — | — | 2,602,105 | ||||||||||||
| Total at fair value | $ | 39,931,354 | $ | 35,769,249 | $ | — | $ | 4,162,105 | ||||||||
(1) Cash and cash equivalents and restricted cash, totaling approximately $29.1 million and $33.8 million as of December 31, 2015 and 2014, respectively, consist primarily of money market funds and checking accounts for which we determine fair value through quoted market prices.
F-22
(2) Marketable securities include two municipal ARS issued by the District of Columbia having a fair value totaling approximately $1.6 million and $1.6 million as of December 31, 2015 and 2014, respectively. Historically, the fair value of ARS investments approximated par value due to the frequent resets through the auction process. Due to events in credit markets, the auction events, which historically have provided liquidity for these securities, have been unsuccessful. The result of a failed auction is that these ARS holdings will continue to pay interest in accordance with their terms at each respective auction date; however, liquidity of the securities will be limited until there is a successful auction, the issuer redeems the securities, the securities mature or until such time as other markets for these ARS holdings develop. For each of our ARS, we evaluate the risks related to the structure, collateral and liquidity of the investment, and forecast the probability of issuer default, auction failure and a successful auction at par, or a redemption at par, for each future auction period. Temporary impairment charges are recorded in accumulated other comprehensive loss, whereas other-than-temporary impairment charges are recorded in our consolidated statement of operations. As of December 31, 2015, the Company determined there was a decline in the fair value of its ARS investments of $260 thousand from its cost basis, which was deemed temporary and was included within accumulated other comprehensive loss. The Company used a discounted cash flow and market approach model to determine the estimated fair value of its investment in ARS. The assumptions used in preparing the discounted cash flow model include estimates for interest rate, timing and amount of cash flows and expected holding period of ARS. At December 31, 2014, marketable securities also consisted of an investment grade corporate bond for which we determined fair value through quoted market prices.
(3) Contingent earn-out represents additional purchase consideration payable to the former shareholders of Management Diagnostics Limited based upon the achievement of specific 2017 audited revenue benchmarks. The probability of achieving each benchmark is based on Management’s assessment of the projected 2017 revenue. The present value of each probability weighted payment was calculated by discounting the probability weighted payment by the corresponding present value factor.
The following table provides a reconciliation of the beginning and ending balance for the Company’s assets and liabilities measured at fair value using significant unobservable inputs (Level 3):
| Marketable Securities | ||||
| Balance December 31, 2013 | $ | 1,580,000 | ||
| Change in fair value of investment | (20,000 | ) | ||
| Balance December 31, 2014 | 1,560,000 | |||
| Change in fair value of investment | 30,000 | |||
| Balance December 31, 2015 | $ | 1,590,000 | ||
| Contingent Earn-Out | ||||
| Balance December 31, 2013 | $ | - | ||
| Addition | 2,602,105 | |||
| Balance December 31, 2014 | 2,602,105 | |||
| Purchase accounting adjustment | (144,398 | ) | ||
| Accretion of net present value | 132,632 | |||
| Balance December 31, 2015 | $ | 2,590,339 | ||
(6) Property and Equipment
Property and equipment are stated at cost, net of accumulated depreciation and amortization. Property and equipment are depreciated on a straight-line basis over the estimated useful lives of the assets. The estimated useful life of computer equipment, computer software and telephone equipment is three years and of furniture and fixtures is five years. Leasehold improvements are amortized on a straight-line basis over the shorter of the respective lease term or the estimated useful life of the asset. If the useful lives of the assets differ materially from the estimates contained herein, additional costs could be incurred, which could have an adverse impact on our expenses.
F-23
Property and equipment as of December 31, 2015 and 2014 consists of the following:
| As of December 31, | ||||||||
| 2015 | 2014 | |||||||
| Computer equipment and software | $ | 1,823,428 | $ | 1,456,483 | ||||
| Furniture and fixtures and telephone equipment | 2,041,229 | 2,072,289 | ||||||
| Leasehold improvements | 3,713,491 | 3,401,591 | ||||||
| 7,578,148 | 6,930,363 | |||||||
| Less accumulated depreciation and amortization | 4,804,411 | 4,003,538 | ||||||
| Property and equipment, net | $ | 2,773,737 | $ | 2,926,825 | ||||
Depreciation and amortization expense for the above noted property and equipment was approximately $1.3 million, $912 thousand and $1.4 million for the years ended December 31, 2015, 2014 and 2013, respectively. The Company does not include depreciation and amortization expense in cost of services, sales and marketing or general and administrative expense.
(7) Goodwill and Other Intangible Assets
The changes in the carrying amount of goodwill for the years ended December 31, 2015 and 2014 were as follows:
| Balance as of December 31, 2013 | $ | 27,997,286 | ||
| Acquisition of Management Diagnostics Limited | 16,813,181 | |||
| Balance as of December 31, 2014 | 44,810,467 | |||
| Purchase accounting adjustments | (237,772 | ) | ||
| Exchange rate impact | (1,254,025 | ) | ||
| Balance as of December 31, 2015 | $ | 43,318,670 |
The Company’s goodwill and other intangible assets and related accumulated amortization as of December 31, 2015 and 2014 consist of the following:
| As of December 31, | ||||||||
| 2015 | 2014 | |||||||
| Total goodwill | $ | 43,318,670 | $ | 44,810,467 | ||||
| Other intangible assets not subject to amortization: | ||||||||
| Trade name | $ | 720,000 | $ | 720,000 | ||||
| Total other intangible assets not subject to amortization | 720,000 | 720,000 | ||||||
| Other intangible assets subject to amortization: | ||||||||
| Customer relationships | 14,188,406 | 14,462,136 | ||||||
| Software models | 1,988,194 | 1,988,194 | ||||||
| Noncompete agreement | 130,000 | 130,000 | ||||||
| Product databases | 8,863,608 | 8,619,588 | ||||||
| Trade names | 786,878 | 810,000 | ||||||
| Capitalized website and software development | 7,511,193 | 6,153,648 | ||||||
| Domain names | 160,425 | 160,425 | ||||||
| Total other intangible assets subject to amortization | 33,628,704 | 32,323,991 | ||||||
| Less accumulated amortization | (15,674,328 | ) | (12,896,782 | ) | ||||
| Net other intangible assets subject to amortization | 17,954,376 | 19,427,209 | ||||||
| Total other intangible assets | $ | 18,674,376 | $ | 20,147,209 | ||||
F-24
Intangible assets were established through business acquisitions and internally developed capitalized website and software development costs. Definite-lived intangible assets are amortized on a straight-line basis over a weighted-average period of approximately 9.9 years for customer relationships, 4.7 years for software models, 3.0 years for noncompete agreements, 9.9 years for product databases and 8.3 years for trade names.
Amortization expense totaled approximately $3.1 million, $2.3 million and $2.4 million for the years ended December 31, 2015, 2014 and 2013, respectively. The estimated amortization expense for the next five years is as follows:
| For the Years Ended | ||||||
| December 31, | Amount | |||||
| 2016 | $ | 3,743,107 | ||||
| 2017 | 3,501,122 | |||||
| 2018 | 2,698,284 | |||||
| 2019 | 1,710,601 | |||||
| 2020 | 1,701,990 | |||||
| Thereafter | 4,599,272 | |||||
| Total | $ | 17,954,376 | ||||
(8) Accrued Expenses
Accrued expenses as of December 31, 2015 and 2014 consist of the following:
| As of December 31, | ||||||||
| 2015 | 2014 | |||||||
| Payroll and related costs | $ | 1,941,665 | $ | 2,544,215 | ||||
| Tax related | 728,336 | 666,102 | ||||||
| Professional fees | 591,827 | 890,567 | ||||||
| Business development | 391,854 | 467,876 | ||||||
| Advertising | 208,507 | 334,295 | ||||||
| Other liabilities | 1,299,792 | 1,376,027 | ||||||
| Total accrued expenses | $ | 5,161,981 | $ | 6,279,082 | ||||
(9) Income Taxes
The Company accounts for its income taxes in accordance with ASC 740-10. Under ASC 740-10, deferred tax assets and liabilities are recognized for the future tax consequences attributable to differences between the financial statement carrying amounts of existing assets and liabilities and their tax bases. ASC 740-10 also requires that deferred tax assets be reduced by a valuation allowance if it is more likely than not that some or all of the deferred tax assets will not be realized based on all available positive and negative evidence.
The Company had approximately $154 million and $149 million of federal and state net operating loss carryforwards as of December 31, 2015 and 2014, respectively. The Company has a full valuation allowance against its deferred tax assets as management concluded that it was more likely than not that the Company would not realize the benefit of its deferred tax assets by generating sufficient taxable income in future years. The Company expects to continue to provide a full valuation allowance until, or unless, it can sustain a level of profitability that demonstrates its ability to utilize these assets.
F-25
Subject to potential Section 382 limitations as discussed below, the federal losses are available to offset future taxable income through 2035 and expire from 2019 through 2035. Since the Company does business in various states and each state has its own rules with respect to the number of years losses may be carried forward, the state net operating loss carryforwards expire from 2016 through 2035. The net operating loss carryforwards as of December 31, 2015 and 2014 include approximately $16 million and $16 million, respectively, related to windfall tax benefits for which a benefit would be recorded to additional paid in capital when realized.
In accordance with Section 382 of the Internal Revenue code, the ability to utilize the Company’s net operating loss carryforwards could be limited in the event of a change in ownership and as such a portion of the existing net operating loss carryforwards may be subject to limitation.
The Company is subject to federal, state and local corporate income taxes. The components of the provision for income taxes reflected on the consolidated statements of operations are set forth below:
| For the Years Ended December 31, | ||||||||||||
| 2015 | 2014 | 2013 | ||||||||||
| (in thousands) | ||||||||||||
| Current taxes: | ||||||||||||
| U.S. federal | $ | - | $ | 8 | $ | - | ||||||
| State and local | - | 8 | - | |||||||||
| Foreign | 4 | 18 | - | |||||||||
| Total current tax expense | $ | 4 | $ | 34 | $ | - | ||||||
| Deferred taxes: | ||||||||||||
| U.S. federal | $ | 809 | $ | 382 | $ | - | ||||||
| State and local | 368 | 59 | - | |||||||||
| Foreign | - | - | - | |||||||||
| Total deferred tax expense | $ | 1,177 | $ | 441 | $ | - | ||||||
| Total tax expense | $ | 1,181 | $ | 475 | $ | - | ||||||
A reconciliation of the statutory U.S. federal income tax rate to the Company's effective income tax rate is set forth below:
| For the Years Ended December 31, | ||||||||||||
| 2015 | 2014 | 2013 | ||||||||||
| U.S. statutory federal income tax rate | 34.0 | % | 34.0 | % | 34.0 | % | ||||||
| State income taxes, net of federal tax benefit | (67.2 | ) | 1.1 | 6.3 | ||||||||
| Effect of permanent differences | (35.7 | ) | (9.7 | ) | (2.9 | ) | ||||||
| R&D credit | 26.7 | 0.0 | 0.0 | |||||||||
| Change to valuation allowance | (281.5 | ) | (37.4 | ) | (37.4 | ) | ||||||
| Foreign rate tax differential | (2.9 | ) | (2.3 | ) | - | |||||||
| Effective income tax rate | (326.6 | )% | (14.3 | )% | 0.0 | % | ||||||
F-26
Deferred income taxes reflect the net tax effects of temporary differences between the financial reporting and tax bases of assets and liabilities and are measured using the enacted tax rates and laws that will be in effect when such differences are expected to reverse. Significant components of the Company's net deferred tax assets and liabilities are set forth below:
| As of December 31, | ||||||||
| 2015 | 2014 | |||||||
| (in thousands) | ||||||||
| Deferred tax assets: | ||||||||
| Operating loss carryforward | $ | 70,426 | $ | 63,553 | ||||
| Windfall tax benefit carryforward | (5,332 | ) | (5,332 | ) | ||||
| Capital loss carryforward | 229 | 28 | ||||||
| Intangible assets | (329 | ) | 628 | |||||
| Accrued expenses | 1,158 | 1,753 | ||||||
| Depreciation | 884 | 953 | ||||||
| Other | 1,820 | 1,894 | ||||||
| Total deferred tax assets | 68,856 | 63,477 | ||||||
| Deferred tax liabilities: | ||||||||
| Goodwill | (1,612 | ) | (455 | ) | ||||
| Trademarks | (294 | ) | (274 | ) | ||||
| Total deferred tax liabilities | (1,906 | ) | (729 | ) | ||||
| Less: valuation allowance | (68,856 | ) | (63,477 | ) | ||||
| Net deferred tax liability | $ | (1,906 | ) | $ | (729 | ) | ||
The Company has no uncertain tax positions pursuant to ASC 740-10 for the years ended December 31, 2015, 2014 and 2013.
(10) Stockholders’ Equity
Convertible Preferred Stock
Securities Purchase Agreement
On November 15, 2007, the Company entered into a Securities Purchase Agreement (the “Purchase Agreement”) with TCV VI, L.P., a Delaware limited partnership, and TCV Member Fund, L.P., a Delaware limited partnership (collectively, the “Purchasers”).
Pursuant to the Purchase Agreement, the Company sold the Purchasers an aggregate of 5,500 shares of its newly-created Series B convertible preferred stock, par value $0.01 per share (“Series B Preferred Stock”), that are immediately convertible into an aggregate of 3,856,942 shares of its Common Stock at a conversion price of $14.26 per share, and warrants (the “Warrants”) to purchase an aggregate of 1,157,083 shares of Common Stock for $15.69 per share. The consideration paid for the Series B Preferred Stock and the Warrants was $55 million. As of December 31, 2015, no Series B Preferred Stock has been converted and the warrants have expired without any shares having been purchased. The Series B Preferred Stock has not been registered and the Company has not registered the shares of Common Stock issuable upon the conversion of the Series B Preferred Stock.
F-27
Investor Rights Agreement
On November 15, 2007, the Company also entered into an Investor Rights Agreement with the Purchasers (the “Investor Rights Agreement”) pursuant to which, among other things, the Company agreed to grant the Purchasers certain registration rights including the right to require the Company to file a registration statement within 30 days to register the Common Stock issuable upon conversion of the Series B Preferred Stock and upon exercise of the Warrants and to use its reasonable best efforts to cause the registration to be declared effective within 90 days after the date the registration is filed. To date, no such request has been made.
Certificate of Designation
Pursuant to a Certificate of Designation for the Series B Preferred Stock (the “Certificate of Designation”) filed by the Company with the Secretary of State of the State of Delaware on November 15, 2007: (i) the Series B Preferred Stock has a purchase price per share equal to $10,000 (the “Original Issue Price”); (ii) in the event of any Liquidation Event (as defined in the Certificate of Designation), the holders of shares of Series B Preferred Stock are entitled to receive, prior to any distribution to the holders of the Common Stock, an amount per share equal to the Original Issue Price, plus any declared and unpaid dividends; (iii) the holders of the Series B Preferred Stock have the right to vote on any matter submitted to a vote of the stockholders of the Company and are entitled to vote that number of votes equal to the aggregate number of shares of Common Stock issuable upon the conversion of such holders’ shares of Series B Preferred Stock; (iv) for so long as 40% of the shares of Series B Preferred Stock remain outstanding, the holders of a majority of such shares will have the right to elect one person to the Company’s board of directors; (v) the Series B Preferred Stock automatically converts into an aggregate of 3,856,942 shares of Common Stock in the event that the Common Stock trades on a trading market at or above a closing price equal to $28.52 per share for 90 consecutive trading days and any demand registration previously requested by the holders of the Series B Preferred Stock has become effective; and (vi) so long as 30% of the shares of the currently-outstanding Series B Preferred Stock remain outstanding, the affirmative vote of the holders of a majority of such shares will be necessary to take any of the following actions: (a) authorize, create or issue any class or classes of our capital stock ranking senior to, or on a parity with (as to dividends or upon a liquidation event) the Series B Preferred Stock or any securities exercisable or exchangeable for, or convertible into, any now or hereafter authorized capital stock ranking senior to, or on a parity with (as to dividends or upon a liquidation event) the Series B Preferred Stock (including, without limitation, the issuance of any shares of Series B Preferred Stock (other than shares of Series B Preferred Stock issued as a stock dividend or in a stock split)); (b) any increase or decrease in the authorized number of shares of Series B Preferred Stock; (c) any amendment, waiver, alteration or repeal of our certificate of incorporation or bylaws in a way that adversely affects the rights, preferences or privileges of the Series B Preferred Stock; (d) the payment of any dividends (other than dividends paid in the capital stock of the Company or any of its subsidiaries) in excess of $0.10 per share per annum on the Common Stock unless after the payment of such dividends we have unrestricted cash (net of all indebtedness for borrowed money, purchase money obligations, promissory notes or bonds) in an amount equal to at least two times the product obtained by multiplying the number of shares of Series B Preferred Stock outstanding at the time such dividend is paid by the liquidation preference; and (e) the purchase or redemption of: (1) any Common Stock (except for the purchase or redemption from employees, directors and consultants pursuant to agreements providing us with repurchase rights upon termination of their service with us) unless after such purchase or redemption we have unrestricted cash (net of all indebtedness for borrowed money, purchase money obligations, promissory notes or bonds) equal to at least two times the product obtained by multiplying the number of shares of Series B Preferred Stock outstanding at the time such dividend is paid by the liquidation preference; or (2) any class or series of now or hereafter of our authorized stock that ranks junior to (upon a liquidation event) the Series B Preferred Stock.
F-28
Treasury Stock
In December 2000, the Company’s Board of Directors authorized the repurchase of up to $10 million of the Company’s Common Stock, from time to time, in private purchases or in the open market. In February 2004, the Company’s Board of Directors approved the resumption of the stock repurchase program (the “Program”) under new price and volume parameters, leaving unchanged the maximum amount available for repurchase under the Program. However, the affirmative vote of the holders of a majority of the outstanding shares of Series B Preferred Stock, voting separately as a single class, is necessary for the Company to repurchase its Common Stock (except as described above). During the years ended December 31, 2015 and 2014, the Company did not purchase any shares of Common Stock under the Program. Since inception of the Program, the Company has purchased a total of 5,453,416 shares of Common Stock at an aggregate cost of approximately $7.3 million.
In addition, pursuant to the terms of the Company’s 2007 Plan, and certain procedures adopted by the Compensation Committee of the Board of Directors, in connection with the exercise of stock options by certain of the Company’s employees, and the issuance of shares of Common Stock in settlement of vested restricted stock units, the Company may withhold shares in lieu of payment of the exercise price and/or the minimum amount of applicable withholding taxes then due. Through December 31, 2015, the Company had withheld an aggregate of 1,670,623 shares which have been recorded as treasury stock. In addition, the Company received an aggregate of 208,270 shares as partial settlement of the working capital and debt adjustment from the acquisition of Corsis Technology Group II LLC and 3,338 shares as partial settlement of the working capital adjustment from the acquisition of Kikucall, Inc. These shares have also been recorded as treasury stock.
Dividends
During the years ended December 31, 2015 and 2014, the Company paid a quarterly cash dividend of $0.025 per share on its Common Stock and its Series B Preferred Stock on a converted common share basis. These dividend payments totaled approximately $3.9 million and $3.9 million, respectively. There were no dividends paid during the year ended December 31, 2013.
Stock Options
Under the terms of the 1998 Stock Incentive Plan (the “1998 Plan”), 8,900,000 shares of Common Stock of the Company were reserved for awards of incentive stock options, nonqualified stock options, restricted stock, deferred stock, restricted stock units, or any combination thereof. Under the terms of the 2007 Plan, 7,750,000 shares of Common Stock of the Company were reserved for awards of incentive stock options, nonqualified stock options, stock appreciation rights, restricted stock, restricted stock units or other stock-based awards. The 2007 Plan also authorized cash performance awards. Additionally, under the terms of the 2007 Plan, unused shares authorized for award under the 1998 Plan are available for issuance under the 2007 Plan. No further awards will be made under the 1998 Plan. Awards may be granted to such directors, employees and consultants of the Company as the Compensation Committee of the Board of Directors shall select in its discretion or delegate to management to select. Only employees of the Company are eligible to receive grants of incentive stock options. Awards generally vest over a three- to five-year period and stock options generally have terms of five years. As of December 31, 2015, there remained approximately 1.8 million shares available for future awards under the 2007 Plan. Stock-based compensation expense for the years ended December 31, 2015, 2014 and 2013 was approximately $1.6 million, $1.8 million and $2.1 million (inclusive of $393 thousand included in restructuring and other charges), respectively.
F-29
A stock option represents the right, once the option has vested and become exercisable, to purchase a share of the Company’s Common Stock at a particular exercise price set at the time of the grant. A restricted stock unit (“RSU”) represents the right to receive one share of the Company’s Common Stock (or, if provided in the award, the fair market value of a share in cash) on the applicable vesting date for such RSU. Until the stock certificate for a share of Common Stock represented by an RSU is delivered, the holder of an RSU does not have any of the rights of a stockholder with respect to the Common Stock. However, the grant of an RSU includes the grant of dividend equivalents with respect to such RSU. The Company records cash dividends for RSUs to be paid in the future at an amount equal to the rate paid on a share of Common Stock for each then-outstanding RSU granted. The accumulated dividend equivalents related to outstanding grants vest on the applicable vesting date for the RSU with respect to which such dividend equivalents were credited, and are paid in cash at the time a stock certificate evidencing the shares represented by such vested RSU is delivered.
A summary of the activity of the 1998 and 2007 Plans and awards issued outside of the Plan pertaining to stock option grants is as follows:
| Shares Underlying Awards | Weighted Average Exercise Price | Aggregate Intrinsic Value ($000) | Weighted Average Remaining Contractual Life (In Years) | |||||||||||||
| Awards outstanding, December 31, 2014 | 4,246,041 | $ | 1.90 | |||||||||||||
| Options granted | 40,576 | $ | 2.23 | |||||||||||||
| Options exercised | (603 | ) | $ | 1.39 | ||||||||||||
| Options cancelled | (367,657 | ) | $ | 1.90 | ||||||||||||
| Options expired | (526,750 | ) | $ | 2.12 | ||||||||||||
| Awards outstanding, December 31, 2015 | 3,391,607 | $ | 1.87 | $ | 35 | 2.73 | ||||||||||
| Awards vested and expected to vest at December 31, 2015 | 3,345,054 | $ | 1.87 | $ | 35 | 2.73 | ||||||||||
| Awards exercisable at December 31, 2015 | 2,724,166 | $ | 1.84 | $ | 29 | 2.71 | ||||||||||
F-30
A summary of the activity of the 1998 and 2007 Plans pertaining to grants of restricted stock units is as follows:
| Shares Underlying Awards | Aggregate Intrinsic Value ($000) | Weighted Average Remaining Contractual Life (In Years) | ||||||||||
| Awards outstanding, December 31, 2014 | 1,205,343 | |||||||||||
| Restricted stock units granted | 104,289 | |||||||||||
| Restricted stock units settled by delivery of Common Stock upon vesting | (490,807 | ) | ||||||||||
| Restricted stock units cancelled | (12,501 | ) | ||||||||||
| Awards outstanding, December 31, 2015 | 806,324 | $ | 1,209 | 1.98 | ||||||||
| Awards vested and expected to vest at December 31, 2015 | 793,199 | $ | 1,190 | 1.73 | ||||||||
A summary of the status of the Company’s unvested share-based payment awards as of December 31, 2015 and changes in the year then ended is as follows:
| Unvested Awards | Awards | Weighted Average Grant Date Fair Value | ||||||
| Shares underlying awards unvested at December 31, 2014 | 3,181,037 | $ | 1.16 | |||||
| Shares underlying options granted | 40,576 | $ | 0.39 | |||||
| Shares underlying restricted stock units granted | 104,289 | $ | 2.19 | |||||
| Shares underlying options vested | (981,172 | ) | $ | 0.52 | ||||
| Shares underlying restricted stock units issued | (490,807 | ) | $ | 2.18 | ||||
| Shares underlying unvested options cancelled | (367,657 | ) | $ | 0.58 | ||||
| Shares underlying unvested restricted stock units cancelled | (12,501 | ) | $ | 1.70 | ||||
| Shares underlying awards unvested at December 31, 2015 | 1,473,765 | $ | 1.44 | |||||
For the years ended December 31, 2015, 2014 and 2013, approximately 41 thousand, 276 thousand, and 1.6 million stock options, respectively, were granted to employees of the Company, and 603, 186 thousand and 43 thousand options were exercised during the years ended December 31, 2015, 2014 and 2013, respectively, yielding $838, $303 thousand and $74 thousand, respectively, of cash proceeds to the Company. For the years ended December 31, 2015, 2014 and 2013, approximately 104 thousand, 471 thousand and 1.3 million restricted stock units, respectively, were granted to employees of the Company, and 491 thousand, 723 thousand and 751 thousand, respectively, were issued under restricted stock unit grants. For the years ended December 31, 2015, 2014 and 2013, the total fair value of share-based awards vested was approximately $1.3 million, $2.4 million and $2.1 million, respectively. For the years ended December 31, 2015, 2014 and 2013, the total intrinsic value of options exercised was approximately $373, $154 thousand and $16 thousand, respectively. For the years ended December 31, 2015, 2014 and 2013, the total intrinsic value of restricted stock units that vested was approximately $840 thousand, $1.7 million and $1.4 million, respectively. As of December 31, 2015, there was approximately $1.8 million of unrecognized stock-based compensation expense remaining to be recognized over a weighted-average period of 1.9 years.
F-31
(11) Commitments and Contingencies
Operating Leases and Employment Agreements
The Company is committed under operating leases, principally for office space, which expire at various dates through January 2026. Certain leases contain escalation clauses relating to increases in property taxes and maintenance costs. Rent expense was approximately $2.1 million, $1.8 million and $1.5 million for the years ended December 31, 2015, 2014 and 2013, respectively. Additionally, the Company has agreements with certain of its employees and outside contributors, whose future minimum payments are dependent on the future fulfillment of their services thereunder. As of December 31, 2015, total future minimum cash payments are as follows:
| Payments Due by Year | ||||||||||||||||||||||||||||
| Contractual obligations: | Total | 2016 | 2017 | 2018 | 2019 | 2020 | After 2020 | |||||||||||||||||||||
| Operating leases | $ | 12,073,785 | $ | 2,566,802 | $ | 2,419,444 | $ | 2,117,147 | $ | 1,996,904 | $ | 1,987,382 | $ | 986,106 | ||||||||||||||
| Employment agreement | 5,000,000 | 2,500,000 | 2,500,000 | — | — | — | — | |||||||||||||||||||||
| Outside contributors | 137,500 | 137,500 | — | — | — | — | — | |||||||||||||||||||||
| Total contractual cash obligations | $ | 17,211,285 | $ | 5,204,302 | $ | 4,919,444 | $ | 2,117,147 | $ | 1,996,904 | $ | 1,987,382 | $ | 986,106 | ||||||||||||||
Future minimum cash payments for the year ending December 31, 2016 related to operating leases has been reduced by approximately $488 thousand related to payments to be received related to the sublease of office space.
Legal Proceedings
The Company is party to legal proceedings arising in the ordinary course of business or otherwise, none of which is deemed material.
(12) Long Term Investment
During 2008, the Company made an investment in Debtfolio, Inc., doing business as Geezeo, an online financial management solutions provider for banks and credit unions. The investment totaled approximately $1.9 million for an 18.5% ownership stake. Additionally, the Company incurred approximately $0.2 million of legal fees in connection with this investment. During the first quarter of 2009, the carrying value of the Company’s investment was written down to fair value based upon an estimate of the market value of the Company’s equity in light of Debtfolio’s efforts to raise capital at the time from third parties. The impairment charge approximated $1.5 million. During the three months ended June 30, 2010, the Company determined it was necessary to record a second impairment charge totaling approximately $555 thousand, writing the value of the investment to zero. This was deemed necessary by management based upon their consideration of Debtfolio, Inc.’s continued negative cash flow from operations, current financial position and lack of current liquidity. In October 2011, Debtfolio, Inc. repurchased the Company’s ownership stake in exchange for a subordinated promissory note in the aggregate principal amount of $555 thousand payable on October 31, 2014. On October 28, 2014, a revised subordinated promissory note with revised repayment terms was agreed to which required cash payments totaling $255 thousand during 2014, and eight quarterly installments of approximately $48 thousand plus 5% simple interest during 2015 and 2016. As of December 31, 2015, all required payments have been received. As of December 31, 2015 and 2014, we maintain a full valuation allowance against this subordinated promissory note due to the uncertainty of eventual collection.
F-32
(13) Restructuring and Other Charges
During the year ended December 31, 2013, the Company recognized restructuring and other charges totaling approximately $386 thousand primarily related to noncash stock-based compensation costs in connection with the accelerated vesting of certain restricted stock units for a terminated employee (the “2013 Restructuring”).
The following table displays the activity of the 2013 Restructuring reserve account during the year ended December 31, 2013:
| Restructuring and other charges | $ | 385,610 | ||
| Noncash deductions | (393,195 | ) | ||
| Adjustment to prior estimate | 7,585 | |||
| Ending balance | $ | - |
During the year ended December 31, 2012, the Company implemented a targeted reduction in force. Additionally, in accessing the ongoing needs of the organization, the Company elected to discontinue using certain software as a service, consulting and data providers, and elected to write-off certain previously capitalized software development projects. The actions were taken after a review of the Company’s cost structure with the goal of better aligning the cost structure with the Company’s revenue base. These restructuring efforts resulted in restructuring and other charges from continuing operations of approximately $3.4 million during the year ended December 31, 2012. Additionally, as a result of the Company’s acquisition of The Deal in September 2012, the Company discontinued the use of The Deal’s office space and implemented a reduction in force to eliminate redundant positions, resulting in restructuring and other charges from continuing operations of approximately $3.5 million during the year ended December 31, 2012. In August 2015, the Company received a one year notice of termination under which the landlord elected to terminate The Deal’s office space lease. As a result, the Company is no longer obligated to fulfill the original full lease term. As such, the Company recorded an adjustment to its restructuring reserve totaling approximately $1.2 million, resulting in a restructuring and other charges credit on the Company’s Consolidated Statements of Operations. Collectively, these activities are referred to as the “2012 Restructuring”.
The following table displays the activity of the 2012 Restructuring reserve account from the initial charges during the first quarter of 2012 through December 31, 2015. The remaining balance as of December 31, 2015 relates to the lease for The Deal’s office space which expires in August 2016.
F-33
| Workforce Reduction | Asset Write-Off | Termination of Vendor Services | Lease Termination | Total | ||||||||||||||||
| Restructuring charge | $ | 3,307,330 | $ | 954,302 | $ | 531,828 | $ | 2,085,000 | $ | 6,878,460 | ||||||||||
| Noncash charges | (222,215 | ) | (954,302 | ) | (220,178 | ) | - | (1,396,695 | ) | |||||||||||
| Payments | (2,462,425 | ) | - | (148,816 | ) | (190,518 | ) | (2,801,759 | ) | |||||||||||
| Balance December 31, 2012 | 622,690 | - | 162,834 | 1,894,482 | 2,680,006 | |||||||||||||||
| Adjustments to prior estimates | (7,586 | ) | - | 5,446 | 27,130 | 24,990 | ||||||||||||||
| (Payments)/sublease income, net | (615,104 | ) | - | (168,280 | ) | (640,200 | ) | (1,423,584 | ) | |||||||||||
| Balance December 31, 2013 | - | - | - | 1,281,412 | 1,281,412 | |||||||||||||||
| Adjustment to prior estimates | - | - | - | 44,678 | 44,678 | |||||||||||||||
| (Payments)/sublease income, net | - | - | - | 58,646 | 58,646 | |||||||||||||||
| Balance December 31, 2014 | - | - | - | 1,384,736 | 1,384,736 | |||||||||||||||
| Adjustment to prior estimates | - | - | - | (1,196,834 | ) | (1,196,834 | ) | |||||||||||||
| (Payments)/sublease income, net | - | - | - | (88,593 | ) | (88,593 | ) | |||||||||||||
| Balance December 31, 2015 | $ | - | $ | - | $ | - | $ | 99,309 | $ | 99,309 | ||||||||||
In March 2009, the Company announced and implemented a reorganization plan, including an approximate 8% reduction in the Company’s workforce, to align the Company’s resources with its strategic business objectives. Additionally, effective March 21, 2009 the Company’s then chief executive officer tendered his resignation, effective May 8, 2009 the Company’s then chief financial officer tendered his resignation, and in December 2009 the Company sold its Promotions.com subsidiary and entered into negotiations to sublease certain office space maintained by Promotions.com. As a result of these activities, the Company incurred restructuring and other charges from continuing operations of approximately $3.5 million during the year ended December 31, 2009 (the “2009 Restructuring”). During the year ended December 31, 2012, the Company recorded a reduction to previously estimated charges resulting in a net credit of approximately $289 thousand.
The following table displays the activity of the 2009 Restructuring reserve account from the initial charges during the first quarter 2009 through its conclusion in 2014.
F-34
| Restructuring and other charges | $ | 3,460,914 | ||
| Noncash charges | (451,695 | ) | ||
| Payments | (1,779,163 | ) | ||
| Balance December 31, 2009 | 1,230,056 | |||
| Payments | (385,295 | ) | ||
| Balance December 31, 2010 | 844,761 | |||
| Payments | (170,396 | ) | ||
| Balance December 31, 2011 | 674,365 | |||
| Payments | (165,401 | ) | ||
| Reduction to prior estimate | (288,667 | ) | ||
| Balance December 31, 2012 | 220,297 | |||
| Payments | (124,023 | ) | ||
| Balance December 31, 2013 | 96,274 | |||
| Reduction to prior estimate | (75,603 | ) | ||
| Payments | (20,671 | ) | ||
| Balance December 31, 2014 | $ | - |
(14) Other Liabilities
Other liabilities consist of the following:
| As of December 31, | ||||||||
| 2015 | 2014 | |||||||
| Acquisition contingent earn-out | $ | 2,590,339 | $ | 2,602,105 | ||||
| Deferred rent | 1,870,583 | 2,301,999 | ||||||
| Deferred revenue | 897,453 | 619,443 | ||||||
| Other liabilities | 2,092 | 1,892 | ||||||
| Noncurrent restructuring charges | - | 1,384,736 | ||||||
| $ | 5,360,467 | $ | 6,910,175 | |||||
(15) Employee Benefit Plan
The Company maintains a noncontributory savings plan in accordance with Section 401(k) of the Internal Revenue Code. The 401(k) plan covers all eligible employees. For the year ended December 31, 2013, the plan provided an employer match of 100% of employee contributions, up to a maximum of 6% of each employee’s total compensation within statutory limits, and effective January 1, 2014, the Company increased its matching contribution to 100% of employee contributions, up to a maximum of 8% of each employee’s total compensation within statutory limits. The Company’s matching contribution totaled approximately $1.7 million, $1.4 million and $759 thousand for the years ended December 31, 2015, 2014 and 2013, respectively.
F-35
(16) Subsequent Event
On February 23, 2016, the Company announced that its Board of Directors had appointed Lawrence S. Kramer as interim President and Chief Executive Officer. The appointment followed the resignation of Elisabeth DeMarse as the Company’s President and Chief Executive Officer and member of the Board of Directors. The change was effective immediately. The Company also entered into a Separation Agreement and Release of All Claims with Ms. DeMarse (the “Separation Agreement”). Pursuant to the terms of the Separation Agreement, Ms. DeMarse has agreed to provide transition services to the Company through February 29, 2016 (the “Separation Date”) and to release certain claims she may have against the Company and other released parties. The Company has agreed to pay or otherwise provide Ms. DeMarse with (1) amounts earned as an employee through the Separation Date, (2) an amount equal to $1,104,000, which reflects the amount of the cash payment to which Ms. DeMarse would have been entitled under her existing Amended and Restated Severance Agreement with the Company had she been terminated without cause, (3) reimbursement for premiums to continue Ms. DeMarse’s medical coverage pursuant to the Consolidated Omnibus Budget Reconciliation Act (“COBRA”) for 18 months, at the coverage levels in effect immediately prior to the Separation Date.
(17) Selected Quarterly Financial Data (Unaudited)
| For the Year Ended December 31, 2015 | ||||||||||||||||
| First Quarter | Second Quarter | Third Quarter | Fourth Quarter | |||||||||||||
| (In thousands, except per share data) | ||||||||||||||||
| Total net revenue | $ | 16,890 | $ | 17,137 | $ | 16,662 | $ | 16,967 | ||||||||
| Total operating expense (Note) | 17,601 | 17,521 | 16,033 | 16,740 | ||||||||||||
| Net (loss) income | (977 | ) | (671 | ) | 354 | (249 | ) | |||||||||
| Preferred stock cash dividends | 96 | 96 | 96 | 96 | ||||||||||||
| Net (loss) income attributable to common stockholders | $ | (1,073 | ) | $ | (768 | ) | $ | 258 | $ | (346 | ) | |||||
| Basic and diluted net loss per share: | ||||||||||||||||
| Net (loss) income attributable to common stockholders | $ | (0.03 | ) | $ | (0.02 | ) | $ | 0.01 | $ | (0.01 | ) | |||||
| For the Year Ended December 31, 2014 | ||||||||||||||||
| First Quarter | Second Quarter | Third Quarter | Fourth Quarter | |||||||||||||
| (In thousands, except per share data) | ||||||||||||||||
| Total net revenue | $ | 14,389 | $ | 14,762 | $ | 14,619 | $ | 17,283 | ||||||||
| Total operating expense | 15,554 | 15,435 | 15,113 | 18,355 | ||||||||||||
| Net loss | (1,127 | ) | (642 | ) | (467 | ) | (1,556 | ) | ||||||||
| Preferred stock cash dividends | 96 | 96 | 96 | 96 | ||||||||||||
| Net loss attributable to common stockholders | $ | (1,223 | ) | $ | (738 | ) | $ | (563 | ) | $ | (1,652 | ) | ||||
| Basic and diluted net loss per share: | ||||||||||||||||
| Net loss attributable to common stockholders | $ | (0.04 | ) | $ | (0.02 | ) | $ | (0.02 | ) | $ | (0.05 | ) | ||||
Note: In August 2015, the Company received a one year notice of termination under which the landlord elected to terminate The Deal’s office space lease resulting in a $1.2 million restructuring and other charges reduction to total operating expense.
F-36
SCHEDULE II—VALUATION AND QUALIFYING
ACCOUNTS
For the Years Ended December 31, 2015, 2014 and 2013
| Allowance for Doubtful Accounts | Balance at Beginning of Period | Provisions Charged to Expense | Write- offs | Balance at End of Period | ||||||||||||
| For the year ended December 31, 2015 | $ | 318,141 | $ | 129,108 | $ | 89,832 | $ | 357,417 | ||||||||
| For the year ended December 31, 2014 | $ | 202,207 | $ | 202,340 | $ | 86,406 | $ | 318,141 | ||||||||
| For the year ended December 31, 2013 | $ | 165,291 | $ | 80,819 | $ | 43,903 | $ | 202,207 | ||||||||
F-37
EXHIBIT INDEX
| Exhibit | Incorporated by Reference | |||||||||
| Number | Description | Form | File No. | Exhibit | Filing Date | |||||
| 3.1 | Amended and Restated Bylaws of the Company. | 8-K | 000-25779 | 3.1 | March 19, 2015 | |||||
| 3.2 | Restated Certificate of Incorporation of the Company. | 10-K | 000-25779 | 3.1 | March 14, 2011 | |||||
| 3.3 | Certificate of Amendment dated May 31, 2011 to Restated Certificate of Incorporation. | 8-K | 000-25779 | 99.1 | June 2, 2011 | |||||
| 3.4 | Certificate of Designation of the Company’s Series B Preferred Stock, as filed with the Secretary of State of Delaware on November 15, 2007. | 8-K | 000-25779 | 3.1 | November 20, 2007 | |||||
| 4.1 | Specimen certificate for the Company’s shares of Common Stock. | S-1/A | 333-72799 | 4.3 | April 19, 1999 | |||||
| 4.2 | Investor Rights Agreement dated November 15, 2007 by and among the Company, TCV VI, L.P. and TCV Member Fund, L.P. | 8-K | 000-25779 | 4.1 | November 20, 2007 | |||||
| 10.1 | Stock Purchase Agreement, dated October 7, 2014 by and between TheStreet, Inc., The Deal, LLC and Management Diagnostics Limited. | 10-K | 000-25779 | 10.1 | March 5, 2015 | |||||
| 10.2+ | Severance Agreement Between TheStreet, Inc. and Erwin Eichmann, dated November 5, 2014 | 10-Q | 000-25779 | 10.1 | November 7, 2014 | |||||
| 10.3+ | Separation Agreement and Release of All Claims dated as of December 16, 2015 between the Company and Erwin Eichmann | |||||||||
| 10.4+ | Form of Indemnification Agreement for directors and executive officers of the Company. | 10-K | 000-25779 | 10.26 | March 7, 2012 | |||||
| 10.5+ | Amended and Restated 2007 Performance Incentive Plan. | 14A | 000-25779 | April 30, 2013 | ||||||
| 10.6 | Agreement of Lease, dated July 22, 1999, between 14 Wall Street Holdings 1, LLC (as successor to W12/14 Wall Acquisition Associates LLC) and the Company. | 10-Q | 000-25779 | 10.1 | August 16, 1999 | |||||
| 10.7 | Amendment of Lease dated October 31, 2001, between 14 Wall Street Holdings 1, LLC (as successor to W12/14 Wall Acquisition Associates LLC) and the Company. | 10-K | 000-25779 | 10.12 | March 16, 2005 | |||||
| 10.8 | Second Amendment of Lease dated March 21, 2007, between 14 Wall Street Holdings 1, LLC and the Company. | 10-K | 000-25779 | 10.24 | March 14, 2008 | |||||
| 10.9 | Third Amendment of Lease dated December 31, 2008, between CRP/Capstone 14W Property Owner, L.L.C. and the Company. | 10-K | 000-25779 | 10.22 | March 13, 2009 | |||||
| 10.10 | Stock Purchase Agreement dated November 1, 2007 by and among BFPC Newco LLC, Larry Starkweather, Kyle Selberg, Rachelle Zorn, Robert Quinn and Larry Starkweather as Agent. | 8-K | 000-25779 | 2.1 | November 6, 2007 | |||||
| 10.11 | Securities Purchase Agreement dated November 15, 2007 by and among the Company, TCV VI, L.P. and TCV Member Fund, L.P. | 8-K | 000-25779 | 10.1 | November 20, 2007 | |||||
| 10.12 | Equity Interest Purchase Agreement, dated as of September 11, 2012 between TheStreet, Inc. and WPPN, L.P. | 8-K | 000-25779 | 2.1 | September 12, 2012 | |||||
| 10.13+ | Employment Letter dated as of March 7, 2012 between the Company and Elisabeth DeMarse. | 10-Q | 000-25779 | 10.1 | May 7, 2012 | |||||
| 10.14+ | Agreement for Grant of Incentive Stock Options dated as of March 7, 2012 between the Company and Elisabeth DeMarse. | 10-Q | 000-25779 | 10.2 | May 7, 2012 | |||||
| 10.15+ | Agreement for Grant of Non-Qualified Stock Options dated as of March 7, 2012 between the Company and Elisabeth DeMarse. | 10-Q | 000-25779 | 10.3 | May 7, 2012 | |||||
| 10.16+ | Stock Purchase Agreement dated as of March 7, 2012 between the Company and Elisabeth DeMarse. | 10-Q | 000-25779 | 10.4 | May 7, 2012 | |||||
| 10.17+ | Amended and Restated Severance Agreement dated as of December 21, 2015 between the Company and Elisabeth DeMarse. | |||||||||
| 10.18+ | Separation Agreement and Release of All Claims dated as of February 22, 2016 between the Company and Elisabeth DeMarse. | |||||||||
| 10.19+ | Employment Offer Letter dated as of August 13, 2012 between the Company and Erwin Eichmann. | 10-K | 000-25773 | 10.23 | February 22, 2013 | |||||
| 10.20+ | Sign-On Bonus Offer Letter dated as of August 13, 2012 between the Company and Erwin Eichmann. | 10-K | 000-25773 | 10.24 | February 22, 2013 | |||||
| 10.21+ | Agreement for Grant of Incentive Stock Option dated as of August 17, 2012 between the Company and Erwin Eichmann. | 10-K | 000-25773 | 10.25 | February 22, 2013 | |||||
| 10.22+ | Employment Offer Letter dated as of February 1, 2013 between the Company and John C. Ferrara. | 10-K | 000-25773 | 10.26 | February 22, 2013 | |||||
| 10.23+ | Separation Agreement and General Release dated as of November 2, 2015 between the Company and John C. Ferrara. | 10-Q | 000-25779 | 10.2 | November 5, 2015 | |||||
| 10.24+ | Form of Stock Option Grant Agreement under the Company’s 2007 Performance Incentive Plan. | 10-K | 000-25779 | 10.19 | February 28, 2014 | |||||
| 10.25+ | Form of Agreement of Restricted Stock Units Under the Company’s 2007 Performance Incentive Plan. | 10-K | 000-25779 | 10.20 | February 28, 2014 | |||||
| 10.26+ | Employment Agreement dated as of November 14, 2013 between James J. Cramer and the Company. | 10-K | 000-25779 | 10.21 | February 28, 2014 | |||||
| 10.27 | Employment Offer Letter dated as of July 18, 2013 between the Company and Vanessa J. Soman. | 10-K | 000-25779 | 10.22 | February 28, 2014 | |||||
| 10.28+ | Severance Agreement between TheStreet, Inc. and Vanessa J. Soman, dated January 26, 2015. | 10-Q | 000-25779 | 10.1 | August 7, 2015 | |||||
| 10.29+ | Separation Agreement and General Release dated as of September 22, 2015 between the Company and Vanessa J. Soman. | 10-Q | 000-25779 | 10.1 | November 5, 2015 | |||||
| 10.30+ | Employment Offer Letter dated as of January 19, 2016 between the Company and Eric Lundberg. | |||||||||
| 10.31+ | Severance Agreement dated as of January 19, 2016 between the Company and Eric Lundberg. | |||||||||
| 10.32+ | Agreement for Grant of Non-Qualified Stock Option dated as of January 19, 2016 between the Company and Eric Lundberg. |
| 10.33+ | Director Compensation Policy. | |||||||||
| 21.1 | Subsidiaries of the Company. | |||||||||
| 23.1 | Consent of BDO USA, LLP. | |||||||||
| 31.1 | Rule 13a-14(a) Certification of CEO. | |||||||||
| 31.2 | Rule 13a-14(a) Certification of CFO. | |||||||||
| 32.1 | Section 1350 Certification of CEO. | |||||||||
| 32.2 | Section 1350 Certification of CFO. | |||||||||
| 101.INS* | XBRL Instance Document | |||||||||
| 101.SCH* | XBRL Taxonomy Extension Schema Document | |||||||||
| 101.CAL* | XBRL Taxonomy Extension Calculation Document | |||||||||
| 101.DEF* | XBRL Taxonomy Extension Definitions Document | |||||||||
| 101.LAB* | XBRL Taxonomy Extension Labels Document | |||||||||
| 101.PRE* | XBRL Taxonomy Extension Presentation Document |
|
+ |
Indicates management contract or compensatory plan or arrangement |
| * | Pursuant to Rule 406T of Regulation S-T, this interactive data file is deemed not filed or part of a registration statement or prospectus for purposes of Sections 11 or 12 of the Securities Act of 1933, is deemed not filed for purposes of Section 18 of the Securities Exchange Act of 1934, and otherwise is not subject to liability under these sections. |