Attached files
| file | filename |
|---|---|
| EX-32.1 - EXHIBIT 32.1 - HOPFED BANCORP INC | d33414dex321.htm |
| EX-21.1 - EXHIBIT 21.1 - HOPFED BANCORP INC | d33414dex211.htm |
| EX-31.2 - EXHIBIT 31.2 - HOPFED BANCORP INC | d33414dex312.htm |
| EX-32.2 - EXHIBIT 32.2 - HOPFED BANCORP INC | d33414dex322.htm |
| 10-K - FORM 10-K - HOPFED BANCORP INC | d33414d10k.htm |
| EX-31.1 - EXHIBIT 31.1 - HOPFED BANCORP INC | d33414dex311.htm |
| EX-23.1 - EXHIBIT 23.1 - HOPFED BANCORP INC | d33414dex231.htm |
Table of Contents
Exhibit 13
SELECTED FINANCIAL INFORMATION AND OTHER DATA
The following summary of selected financial information and other data does not purport to be complete and is qualified in its entirety by reference to the detailed information and Consolidated Financial Statements and accompanying Notes appearing elsewhere in this Report.
Financial Condition and Other Data
| At December 31, | ||||||||||||||||||||
| 2015 | 2014 | 2013 | 2012 | 2011 | ||||||||||||||||
| (Dollars in thousands) | ||||||||||||||||||||
| Total amount of: |
||||||||||||||||||||
| Assets |
$ | 903,154 | $ | 935,785 | $ | 973,649 | $ | 967,689 | $ | 1,040,820 | ||||||||||
| Loans receivable, net |
556,349 | 539,264 | 543,632 | 524,985 | 556,360 | |||||||||||||||
| Cash and due from banks |
46,926 | 34,389 | 37,229 | 31,563 | 44,389 | |||||||||||||||
| Federal Home Loan Bank stock |
4,428 | 4,428 | 4,428 | 4,428 | 4,428 | |||||||||||||||
| Securities available for sale |
237,177 | 303,628 | 318,910 | 356,345 | 383,782 | |||||||||||||||
| Deposits |
739,406 | 731,308 | 762,997 | 759,865 | 800,095 | |||||||||||||||
| Repurchase agreements |
45,770 | 57,358 | 52,759 | 43,508 | 43,080 | |||||||||||||||
| FHLB advances |
15,000 | 34,000 | 46,780 | 43,741 | 63,319 | |||||||||||||||
| Subordinated debentures |
10,310 | 10,310 | 10,310 | 10,310 | 10,310 | |||||||||||||||
| Total stockholders’ equity |
87,630 | 98,402 | 95,717 | 104,999 | 118,483 | |||||||||||||||
| Number of active: |
||||||||||||||||||||
| Real estate loans Outstanding |
4,089 | 4,527 | 4,730 | 4,212 | 4,383 | |||||||||||||||
| Deposit accounts |
44,174 | 44,183 | 44,792 | 40,770 | 42,140 | |||||||||||||||
| Offices open |
18 | 18 | 18 | 18 | 18 | |||||||||||||||
| Operating Data | ||||||||||||||||||||
| Year Ended December 31, | ||||||||||||||||||||
| 2015 | 2014 | 2013 | 2012 | 2011 | ||||||||||||||||
| (Dollars in thousands) | ||||||||||||||||||||
| Interest and dividend income |
$ | 33,122 | $ | 34,680 | $ | 35,857 | $ | 40,840 | $ | 46,240 | ||||||||||
| Interest expense |
6,550 | 8,879 | 10,581 | 14,877 | 18,415 | |||||||||||||||
|
|
|
|
|
|
|
|
|
|
|
|||||||||||
| Net interest income before provision for loan losses |
26,572 | 25,801 | 25,276 | 25,963 | 27,825 | |||||||||||||||
| Provision for loan losses |
1,051 | (2,273 | ) | 1,604 | 2,275 | 5,921 | ||||||||||||||
|
|
|
|
|
|
|
|
|
|
|
|||||||||||
| Net interest income |
25,521 | 28,074 | 23,672 | 23,688 | 21,904 | |||||||||||||||
| Non-interest income |
7,602 | 7,840 | 9,372 | 9,639 | 10,193 | |||||||||||||||
| Non-interest expense |
30,445 | 33,916 | 28,638 | 28,441 | 28,693 | |||||||||||||||
|
|
|
|
|
|
|
|
|
|
|
|||||||||||
| Income before income taxes |
2,678 | 1,998 | 4,406 | 4,886 | 3,404 | |||||||||||||||
| Provision for income taxes |
274 | (201 | ) | 644 | 817 | 484 | ||||||||||||||
|
|
|
|
|
|
|
|
|
|
|
|||||||||||
| Net income |
$ | 2,404 | $ | 2,199 | $ | 3,762 | $ | 4,069 | $ | 2,920 | ||||||||||
|
|
|
|
|
|
|
|
|
|
|
|||||||||||
| Preferred stock dividend and accretion of stock warrants |
— | — | — | 1,229 | 1,031 | |||||||||||||||
|
|
|
|
|
|
|
|
|
|
|
|||||||||||
| Net income available to common stockholders |
$ | 2,404 | $ | 2,199 | $ | 3,762 | $ | 2,840 | $ | 1,889 | ||||||||||
|
|
|
|
|
|
|
|
|
|
|
|||||||||||
1
Table of Contents
Selected Quarterly Information (Unaudited)
| First Quarter |
Second Quarter |
Third Quarter |
Fourth Quarter |
|||||||||||||
| ( Dollars in thousands) | ||||||||||||||||
| Year Ended December 31, 2015: |
||||||||||||||||
| Interest and dividend income |
$ | 9,195 | $ | 7,919 | $ | 8,012 | $ | 7,996 | ||||||||
| Net interest income after provision for losses on loans |
7,347 | 6,037 | 6,104 | 6,033 | ||||||||||||
| Non-interest income |
1,913 | 1,868 | 1,936 | 1,885 | ||||||||||||
| Non-interest expense |
7,470 | 8,234 | 7,553 | 7,188 | ||||||||||||
| Net income (loss) |
1,355 | (117 | ) | 510 | 656 | |||||||||||
| Year Ended December 31, 2014: |
||||||||||||||||
| Interest and dividend income |
$ | 8,658 | $ | 8,734 | $ | 8,994 | $ | 8,294 | ||||||||
| Net interest income after provision for losses on loans |
5,940 | 6,641 | 7,700 | 7,793 | ||||||||||||
| Non-interest income |
1,598 | 1,945 | 2,393 | 1,904 | ||||||||||||
| Non-interest expense |
7,324 | 7,447 | 7,563 | 11,582 | ||||||||||||
| Net income (loss) |
354 | 925 | 1,953 | (1,033 | ) | |||||||||||
2
Table of Contents
Key Operating Ratios
| At or for the Year Ended December 31, | ||||||||||||
| 2015 | 2014 | 2013 | ||||||||||
| Performance Ratios |
||||||||||||
| Return on average assets (net income available to common shareholders divided by average total assets) |
0.27 | % | 0.23 | % | 0.39 | % | ||||||
| Return on average equity (net income available to common shareholders divided by average total equity) |
2.65 | % | 2.20 | % | 3.59 | % | ||||||
| Interest rate spread (combined weighted average interest rate earned less combined weighted average interest rate cost) |
3.20 | % | 2.90 | % | 2.81 | % | ||||||
| Net interest margin |
3.36 | % | 3.08 | % | 3.01 | % | ||||||
| Ratio of average interest-earning assets to average interest-bearing liabilities |
119.43 | % | 117.88 | % | 116.15 | % | ||||||
| Ratio of non-interest expense to average total assets |
3.41 | % | 3.57 | % | 2.99 | % | ||||||
| Ratio of net interest income after provision for loan losses to non-interest expense |
86.68 | % | 85.81 | % | 86.44 | % | ||||||
| Efficiency ratio (non-interest expense divided by sum of net interest income plus non-interest income) |
86.85 | % | 97.83 | % | 80.15 | % | ||||||
| Asset Quality Ratios |
||||||||||||
| Non-performing assets to total assets at end of period |
1.02 | % | 0.55 | % | 1.82 | % | ||||||
| Non-accrual loans to total loans at end of period |
1.32 | % | 0.58 | % | 1.21 | % | ||||||
| Allowance for loan losses to total loans at end of period |
1.01 | % | 1.15 | % | 1.57 | % | ||||||
| Allowance for loan losses to non-performing loans at end of period |
76.80 | % | 198.08 | % | 86.25 | % | ||||||
| Provision for loan losses to total loans receivable, net |
0.19 | % | (0.42 | %) | 0.30 | % | ||||||
| Net charge-offs to average loans outstanding |
0.29 | % | 0.02 | % | 0.66 | % | ||||||
| Capital Ratios |
||||||||||||
| Total equity to total assets at end of period |
9.72 | % | 10.52 | % | 9.83 | % | ||||||
| Average total equity to average assets |
10.17 | % | 10.55 | % | 10.94 | % | ||||||
Regulatory Capital
| December 31, 2015 | ||||||||
| (Dollars in thousands) | ||||||||
| Corporation | Bank | |||||||
| Tier 1 Leverage capital to adjusted average assets |
$ | 95,156 | $ | 93,328 | ||||
| Less: Tier 1 Leverage capital requirement |
34,924 | 34,840 | ||||||
|
|
|
|
|
|||||
| Excess |
60,232 | 58,488 | ||||||
|
|
|
|
|
|||||
| Tier 1 Risk Based capital to risk weighted assets |
$ | 95,156 | $ | 93,328 | ||||
| Less: Tier 1 Risk Based capital requirement |
35,079 | 34,704 | ||||||
|
|
|
|
|
|||||
| Excess |
60,077 | 58,624 | ||||||
|
|
|
|
|
|||||
| Total risk-based capital to risk weighted assets |
$ | 100,857 | $ | 99,029 | ||||
| Less: Risk-based capital requirement |
46,772 | 46,272 | ||||||
|
|
|
|
|
|||||
| Excess |
$ | 54,085 | $ | 52,757 | ||||
|
|
|
|
|
|||||
| Common equity tier 1 capital to risk weighted assets |
$ | 95,156 | $ | 93,328 | ||||
| Less: Common equity tier 1 capital requirement |
26,309 | 26,028 | ||||||
|
|
|
|
|
|||||
| Excess |
$ | 68,847 | $ | 67,300 | ||||
|
|
|
|
|
|||||
3
Table of Contents
MANAGEMENT’S DISCUSSION AND ANALYSIS OF
FINANCIAL CONDITION AND RESULTS OF OPERATIONS
General
This discussion relates to the financial condition and results of operations of the Company, which consist of the consolidation of Heritage Bank USA, Inc. (“the Bank”) and HopFed Bancorp, Inc. (“the Corporation”), JBMM LLC, Heritage Interim Corporation, Heritage USA Title LLC, and Fort Webb LLC. The Corporation became the holding company for the Bank in February 1998. The principal business of the Bank consists of accepting deposits from the general public and investing these funds primarily in loans and in investment securities and mortgage-backed securities. The Bank’s loan portfolio consists primarily of loans secured by residential real estate located in its market area.
For the year ended December 31, 2015, the Company’s net loan portfolio increased by $17.1 million, or 3.2%, as compared to the balance at December 31, 2014. Loan portfolio growth was strong during the first half of the year and declined slightly during last quarter of the year. The majority of the growth in the loan portfolio was the result of the Company’s opening of a loan production office in Nashville, Tennessee (“LPO”). The Company’s LPO office had approximately $15.4 million in loans outstanding at December 31, 2015.
Management continues to focus on reducing our average cost of deposits. For the years ended December 31, 2015, and December 31, 2014, our average cost of total deposits was 0.69% and 0.75%, respectively. As a result of our efforts to reduce the Company’s interest expense, total time deposits declined by $17.3 million and $50.1 million in the years ended December 31, 2015, and December 31, 2014, respectively. At December 31, 2015, total time deposits now compose 42.6% of total deposits, as compared to 65.0% of total deposits at December 31, 2011. At December 31, 2015, the Company has $52.4 million in time deposits maturing in the first two months of 2016 that have a weighted average cost of 2.52%. The Company anticipates retaining a reasonable portion of these deposits at current market interest rates. However, at December 31, 2015, the Company has increased its cash balance to $54.7 million as compared to $40.4 million at December 31, 2014, to ensure we maintain acceptable levels of liquidity to meet customer needs.
The Company’s level of loans classified as substandard continues to decline. The Company’s level of classified loans peeked at $90.4 million in June 2012. In response to the high level of classified loans, management undertook aggressive action to remediate this issue. These actions included additional customer contact with problem credits, the review of interim financial statements to more closely monitor developing trends in customers’ finances and the establishment of a special assets department. The special assets department (“special assets”) assumes the responsibility for a smaller number of loan relationships that are adversely classified, have negative cash flow trends developing, are likely to face future foreclosing actions or may already be in the process of foreclosure. The purpose of special assets is to determine if a customer relationship can be saved by improved financial reporting and performance. If the Company determines that the customers’ finances are not likely to improve in the future, the special assets officer develops a strategy for the Company to exit the relationship. At December 31, 2015, the Company has $28.1 million in loans classified as substandard, representing 27.8% of the Company’s risk based capital as compared to $37.4 million in loans classified as substandard at December 31, 2014. It is the intent of the Company to continue to place a heavy emphasis on this strategy, with a goal to maintain our level of classified asset to risk based capital at less than 30%.
At December 31, 2015, approximately $10.6 million, or 47.3% of the Company’s land portfolio (non-agricultural related) is classified as substandard. At December 31, 2015, the Company has no land loans under development. At December 31, 2015, the inventory of land loans includes 84 lots available for sale with an aggregate loan balance of $2.7 million. The average lot has a loan balance of approximately $32,700. At December 31, 2015, the Company has one land loan, totaling $1.6 million, in non-accrual status. The loan has 33 unsold lots that are a mixture of commercial and residential with an average balance per lot of approximately $39,000. Also at December 31, 2015, the Company has $15.5 million land loans on property that is designated for future development in which no meaningful infrastructure has been financed. These loans represent 1,234 acres of land with an average price per acre of approximately $12,200.
4
Table of Contents
At December 31, 2014, the inventory of land loans included 131 lots available for sale with an aggregate loan balance of $3.4 million. The average lot had an average loan balance of approximately $26,300. Also at December 31, 2014, the Company has $16.8 million in land loans on property that is designated for future development in which no meaningful infrastructure has been financed. These loans represent approximately 1,247 acres of land with an average price per acre of approximately $13,500. The remaining $6.5 million in land loans are considered to be used for personal and recreational purposes. At December 31, 2014, the Company had $18.5 million in land loans on property that is designated for future development in which no meaningful infrastructure has been started. These loans represented approximately 1,322 acres of land with an average price per acre of approximately $14,000. The reduction of land loans classified as substandard remains a high priority of management.
For the year ended December 31, 2015, the Company recorded net income available for common shareholders of $2.4 million, a return on average assets of 0.27% and a return on average equity of 2.65%. The Company’s small improvement in net income was the result of lower FHLB borrowing cost, which was largely offset by lower yields on interest earning assets, a lower volume of interest earning assets, the opening of the LPO and higher core operating expenses.
For the year ended December 31, 2014, the Company recorded net income available for common shareholders of $2.2 million, a return on average assets of 0.23% and a return on average equity of 2.2%. Company results for the year ended December 31, 2014, were adversely affected by the decision to prepay $35.9 million in FHLB advances and incurring a prepayment penalty of $2.5 million and a $1.8 million loss on the sale of a substandard rated commercial real estate loan.
For the year ended December 31, 2013, the Company recorded net income available for common shareholders of $3.8 million, a return on average assets of 0.39% and a return on average equity of 3.59%. Company results for the year ended December 31, 2013, improved as a result of the repurchase of preferred stock in December of 2012. On January 16, 2013, the Company repurchased the Warrant from the Treasury for $256,257.
The Company’s net income is dependent primarily on its net interest income, which is the difference between interest income earned on its loans, investment securities and mortgage-backed securities portfolios and interest paid on interest-bearing liabilities. Net interest income is determined by (i) the difference between yields earned on interest-earning assets and rates paid on interest-bearing liabilities (“interest rate spread”) and (ii) the relative amounts of interest-earning assets and interest-bearing liabilities. The Company’s interest rate spread is affected by regulatory, economic and competitive factors that influence interest rates, loan demand and deposit flows. To a lesser extent, the level of non-interest expenses such as compensation, employee benefits, data processing expenses, local deposit and federal income taxes also affect the Company’s net income.
The operations of the Company and the entire financial services are significantly affected by prevailing economic conditions, competition and the monetary, fiscal and regulatory policies of governmental agencies. Lending activities are influenced by the demand for and supply of housing, competition among lenders, the level of interest rates and the availability of funds. Deposit flows and costs of funds are influenced by prevailing market rates of interest, primarily on competing investments, account maturities and the levels of personal income and savings in the Company’s market area.
5
Table of Contents
Aggregate Contractual Obligations
| Maturity by Period | ||||||||||||||||||||
| December 31, 2015 (In thousands) | Less than | Greater than 1 year |
Greater than 3 year |
Greater than |
||||||||||||||||
| 1 year | to 3 years | to 5 years | 5 years | Total | ||||||||||||||||
| Deposits |
$ | 626,071 | 97,256 | 16,079 | — | 739,406 | ||||||||||||||
| FHLB borrowings |
4,000 | 11,000 | — | — | 15,000 | |||||||||||||||
| Repurchase agreements |
45,770 | — | — | — | 45,770 | |||||||||||||||
| Subordinated debentures |
— | — | — | 10,310 | 10,310 | |||||||||||||||
| Lease commitments |
212 | 249 | 18 | — | 479 | |||||||||||||||
| Purchase obligations |
2,140 | 3,495 | 1,380 | — | 7,015 | |||||||||||||||
|
|
|
|
|
|
|
|
|
|
|
|||||||||||
| Total |
$ | 678,193 | 112,000 | 17,477 | 10,310 | 817,980 | ||||||||||||||
|
|
|
|
|
|
|
|
|
|
|
|||||||||||
Deposits represent non-interest bearing, money market, savings, interest bearing checking accounts and certificates of deposits held by the Company. Amounts that have an indeterminate maturity period are included in the less than one-year category.
FHLB borrowings represent the amounts that are due to FHLB of Cincinnati. All amounts have fixed maturity dates. On December 30, 2014, the Company pre-paid $35.9 million in advances and incurred a $2.5 million prepayment penalty in the process. At December 31, 2015, the Company has three advances at the FHLB, a $4.0 million advance due in March 2016 at a rate of 5.34%, a $5.0 million advance due in October 2017 at a rate of 0.88% and a $6.0 million advance due in July 2018 at a rate of 1.18%.
Repurchase agreements represent both long term wholesale and short term retail repurchase accounts. The Company’s one remaining wholesale repurchase agreement has a $6.0 million balance, a rate of 4.36%, and matures on September 18, 2016. Retail repurchase agreements mature daily and pay interest based on their account balances.
Subordinated debentures represent the amount borrowed in a private pool trust preferred issuance group on September 25, 2003. The debentures are priced at the three-month LIBOR plus 3.10%. At December 31, 2015, the three-month LIBOR rate was 0.61%. The debentures re-price and pay interest quarterly and have a thirty-year final maturity. The debentures may be called at the issuer’s discretion on a quarterly basis after five years. The interest rate of the debentures reset on the 8th day of January, April, August and November of each year.
Lease commitments represent the total minimum lease payments under non-cancelable operating leases.
The most significant operating contract is for the Company’s data processing services, which re-prices monthly based on the number of accounts and other operational factors. The Company’s operating contract with the current data processing provider is currently set to expire September 30, 2019.
Off Balance Sheet Arrangements
| Maturity by Period | ||||||||||||||||||||
| December 31, 2015 (In thousands) | Less than | Greater than 1 year |
Greater than 3 year |
Greater than |
||||||||||||||||
| 1 year | to 3 years | to 5 years | 5 years | Total | ||||||||||||||||
| Commercial lines of credit |
$ | 29,653 | 24,539 | 49 | 705 | 54,946 | ||||||||||||||
| Commitments to extend credit |
32,684 | 9,679 | 2,083 | 1,917 | 46,363 | |||||||||||||||
| Standby letters of credit |
56 | 12 | — | — | 68 | |||||||||||||||
| Home equity lines of credit |
317 | 2,282 | 4,310 | 23,080 | 29,989 | |||||||||||||||
|
|
|
|
|
|
|
|
|
|
|
|||||||||||
| Total |
$ | 62,710 | 36,512 | 6,442 | 25,702 | 131,366 | ||||||||||||||
|
|
|
|
|
|
|
|
|
|
|
|||||||||||
6
Table of Contents
Standby letters of credit represent commitments by the Company to repay a third party beneficiary when a customer fails to repay a loan or debt instrument. The terms and risk of loss involved in issuing standby letters of credit are similar to those involved in issuing loan commitments and extending credit. In addition to credit risk, the Company also has liquidity risk associated with stand-by letters of credit because funding for these obligations could be required immediately. Unused lines of credit represent commercial and residential equity lines of credit with maturities ranging from one to fifteen years.
Accounting for Derivative Instruments and Hedging Activities
In October 2008, the Bank entered into a receive fixed pay variable swap transaction in the amount of $10.0 million with Compass Bank of Birmingham in which Heritage Bank will pay Compass a fixed rate of 7.27% quarterly for seven years while Compass paid Heritage Bank a rate equal to the three month LIBOR plus 3.10%, the rate banks in London charge one another for overnight borrowings. The Bank signed an inter-company transfer with the Company that allowed the Company to convert its variable rate subordinated debenture issuance to a fixed rate. The critical terms of the interest rate swap matched the term of the corresponding variable rate subordinated debt issuance. The Company considered the interest rate swap a cash flow hedge and conducted a quarterly analysis to ensure that the hedge was effective. The derivative matured on October 8, 2015.
Quantitative and Qualitative Disclosure about Market Risk
Quantitative Aspects of Market Risk. The principal market risk affecting the Company is risk associated with interest rate volatility (interest rate risk). The Company does not maintain a trading account for investment securities. The Company is not subject to foreign currency exchange rate risk or commodity price risk. Substantially all of the Company’s interest rate risk is derived from the Bank’s lending, deposit taking, and investment activities. This risk could result in reduced net income, loss in fair values of assets and/or increases in fair values of liabilities due to changes in interest rates.
Qualitative Aspects of Market Risk. The Company’s principal financial objective is to achieve long-term profitability while reducing its exposure to fluctuating market interest rates. The Company has sought to reduce the exposure of its earnings to changes in market interest rates by attempting to manage the mismatch between assets and liabilities maturities and interest rates. The principal element in achieving this objective is to increase the interest rate sensitivity of the Company’s interest-earning assets by retaining for its portfolio loans with interest rates subject to periodic adjustment to market conditions. The Company relies on retail deposits as its primary source of funds. However, management is utilizing brokered deposits, wholesale repurchase agreements and FHLB borrowings as sources of liquidity. As part of its interest rate risk management strategy, the Bank promotes demand accounts, overnight repurchase agreements and certificates of deposit with primarily terms of up to five years.
Asset / Liability Management
Key components of a successful asset/liability strategy are the monitoring and managing of interest rate sensitivity of both the interest-earning asset and interest-bearing liability portfolios. The Company has employed various strategies intended to minimize the adverse affect of interest rate risk on future operations by providing a better match between the interest rate sensitivity between its assets and liabilities. In particular, the Company’s strategies are intended to stabilize net interest income for the long-term by protecting its interest rate spread against increases in interest rates. Such strategies include the origination of adjustable-rate mortgage loans secured by one-to-four family residential real estate, and, to a lesser extent, multi-family real estate loans and the origination of other loans with interest rates that are more sensitive to adjustment based upon market conditions than long-term, fixed-rate residential mortgage loans. At December 31, 2015, approximately $125.3 million of the $181.4 million of one-to-four family residential loans originated by the Company (comprising 69.1% of such loans) had adjustable rates or will mature within one year.
7
Table of Contents
The U.S. government agency securities generally are purchased for a term of fifteen years or less. Securities may or may not have call options. A security with call options improves the yield on the security but also has little or no positive price convexity. Non-callable securities or securities with one time calls offer a lower yield but more positive price convexity and an improved predictability of cash flow. Generally, securities with the greater call options (continuous and quarterly) are purchased only during times of extremely low interest rates. The reasons for purchasing these securities generally focus on the fact that a non-callable or one time call is of little value if rates are exceptionally low.
At December 31, 2015, the Company owns one U.S. Treasury security with a market value of $2.0 million maturing on April 15, 2017. U.S. Treasury securities have the full faith and credit guarantee of the United States government. At December 31, 2015, the Company’s agency security portfolio consisted of $2.2 million of unsecured debt issued by Tennessee Valley Authority (“TVA”), $12.9 million issued by the Federal Home Loan Bank (FHLB) and $15.4 million issued by the Federal Farm Credit Bank (FFCB). All U.S. Agency debt securities have a credit rating of AA+ and continue to maintain the implicit backing of the United States of America with the exception of TVA debt, which maintains the full faith and credit of the United States of America.
At December 31, 2015, $4.2 million in agency securities were due within five years, approximately $22.3 million were due in five to ten years and approximately $4.0 million were due in more than ten years. At December 31, 2015, $9.4 million of these securities had a call provision, which authorizes the issuing agency to prepay the securities at face value on or before October 13, 2017 If, prior to their maturity dates, market interest rates decline below the rates paid on the securities, the issuing agency may elect to exercise its right to prepay the securities. At December 31, 2015, the non-amortizing agency portfolio has an estimated weighted average maturity is 6.5 years and an effective duration of 5.9 years.
The Company owns significant positions in agency securities issued by the Small Business Administration. These securities are classified as SBAPs, SBICs and SBA Pools. The SBAP notes have a twenty year maturity, pay interest monthly and principal semi-annually. The SBIC notes have a ten year final maturity and pay principal and interest quarterly. SBA pools are floating rate securities tied to prime that may have final maturities of ten, twenty-five or thirty years and pay principal and interest monthly. The interest rates on SBA pools reset either on a quarterly or monthly basis, providing the Company with lower price volatility as compared to fixed rate securities. The purchase of variable rate securities with low price volatility provides the Company with a source of lower risk liquidity should loan demand improve or interest rates increase. The risk in purchasing SBA Pools is that they are typically purchased at significant premiums and therefore carry a greater than higher level of prepayment risk while providing lower yields as compared to many long term fixed rate investment products.
All SBA securities, SBAP, SBIC’s and SBA Pools are backed by the full faith and credit of the United States Government and classified by the Company’s regulators as zero risk based assets. SBIC notes are ten year notes that typically are used to finance equipment for businesses. SBIC notes behave somewhat similar to a ten year mortgage backed security, with slow prepayments in their first two or three years and then an acceleration of prepayment. SBAP notes are twenty year amortizing notes typically used to finance commercial real estate. SBAP typically experience slower prepayment speeds as compared to 20 year GNMA mortgage backed securities as SBAP notes typically have prepayment penalties that make it cost prohibitive for many borrowers to prepay during the first five years of the loan. Current SBA pools are experiencing abnormally slow prepayment speeds as the loans tied to the prime rate provide relatively inexpensive financing for businesses requiring an SBA guarantee to meet their credit needs. Typically, SBA pools will experience an increase in prepayments as they become more than three years old.
At December 31, 2015, the Company’s agency bond portfolio includes approximately $53.3 million in SBAP securities, $6.0 million in SBIC securities and $3.1 million in SBA Pools. At December 31, 2015, the weighted average life of the Company’s amortizing U.S. Agency portfolio is 4.6 years and the portfolio has an effective duration of 4.0 years.
8
Table of Contents
The Company maintains a significant municipal bond portfolio. The majority of the municipal portfolio was purchased during 2008 and 2009 as municipal bond yields increased to levels not seen in the last ten years despite record low Treasury rates. The municipal bond portfolio largely consists of local school district and county courthouse bonds with guarantees from both the local counties and the State of Kentucky and general obligations bonds issued by municipalities in Kentucky. As outlined below, the Company’s exposure to municipal securities outside the Commonwealth of Kentucky is limited to $4.1 million at December 31, 2015. At December 31, 2015, the Company’s municipal portfolio consists of the following types of securities:
| Market Value (Dollars in Thousands) |
||||
| • Kentucky school bonds |
$ | 21.8 | ||
| • Kentucky courts and facilities |
7.2 | |||
| • Kentucky general obligations |
7.2 | |||
| • Other Kentucky bonds |
10.5 | |||
| • Out of state bonds |
4.1 | |||
|
|
|
|||
| Total |
$ | 50.8 | ||
|
|
|
|||
At December 31, 2015, the Company has $44.6 million in tax free municipal bonds and $6.2 million in taxable municipal bonds. Tax free municipal bonds were purchased to provide long-term income stability and higher tax equivalent yields as compared to other portions of the Company’s investment portfolio. The Company’s investment policy limits municipal concentrations to 125% of the Bank’s Tier 1 Capital, currently $93.3 million. The investment policy places a concentration limit on the amounts of municipal bonds per issuer in Tennessee and Kentucky to 15% of the Bank’s Tier 1 Capital and out of market issuers to 10% of Tier 1 Capital. At December 31, 2015, the largest municipal bond concentration for one issuer was $2.9 million. The investment policy limits concentrations in the amounts a single state guarantee program can provide to a bond at 75% of Tier 1 Capital. The Company is currently within policy guidelines on all concentration limits.
At December 31, 2015, no municipal bonds were due in less than one year, $12.1 million were due within one to five years, $20.4 million were due in five to ten years, $14.1 million were due in ten to fifteen years and $4.2 million were due in fifteen years. At December 31, 2015, approximately $34.6 million of the Company’s municipal bond portfolio is callable with call dates ranging from March 2016 to December 2022. The majority of callable municipal bonds purchased by the Company were originally scheduled to have a call ten years after issuance. At December 31, 2015, approximately $2.6 million of municipal bonds had a call date of less than one year, approximately $27.2 million had a call date from one to five years and approximately $4.8 million and had a call date in more than five years but less than ten years. At December 31, 2015, the weighted average life of the tax free municipal bond portfolio is 3.9 years and its modified duration is 3.6 years. At December 31, 2015, the weighted average life of the taxable municipal bond portfolio is 4.8 years and its modified duration is 4.3 years.
Mortgage-backed securities entitle the Company to receive a pro-rata portion of the cash flow from an identified pool of mortgages. Although mortgage-backed securities generally offer lesser yields than the loans for which they are exchanged, mortgage-backed securities present lower credit risk by virtue of the guarantees that back them, are more liquid than individual mortgage loans, and may be used to collateralize borrowings or other obligations of the Company. Further, mortgage-backed securities provide a monthly stream of both interest and principal, thereby providing the Company with a cash flow to reinvest at current market rates and limit the Company’s interest rate risk. Mortgage backed securities may be collateralized by either single family or multi-family properties.
At December 31, 2015, the Company’s mortgage backed security portfolio consisted of $8.1 million issued by the FHLMC, $28.3 million issued by the FNMA and $30.0 million issued by the Government National Mortgage Agency (GNMA). GNMA securities are guaranteed by the full faith and credit of the U.S. Government while FHLMC and FHLB mortgage backed securities maintain the implicit backing of the United States of America.
9
Table of Contents
In 2015, the prepayment speeds of single family mortgage backed securities slowed considerable as most homeowners with a desire to refinance their home had already done so. At December 31, 2015, approximately $20.6 million of the Company’s mortgage back security portfolio consisted of adjustable rate mortgages. These mortgages are fixed for a period of one, three or five years and then revert to a one year adjustable rate mortgage. At December 31, 2015, the weighted average life of the fixed rate mortgage loan portfolio is approximately 4.7 years and an effective duration is approximately 4.1 years. At December 31, 2015, the weighted average life of the adjustable rate mortgage loan portfolio is approximately 6.2 years and an effective duration is approximately 5.4 years.
At December 31, 2015, the Company held approximately $19.5 million in Collateral Mortgage Obligations (CMO) issued by various agencies of the United States government, including $4.0 million by GNMA and $15.5 million by FNMA. A CMO is a mortgage-backed security that has a structured payment stream based on various factors and does not necessarily remit monthly principal and interest on a pro-rata basis. At December 31, 2015, approximately $7.5 million of the CMO portfolio consisted of pools of multi-family loans and $12.0 million consisted of pools of single family loans. At December 31, 2015, the Company’s CMO portfolio had a weighted average life of approximately 3.5 years and a modified duration of approximately 3.2 years.
At December 31, 2015, the Company held $177,000 of a private label CMO and $3.5 million in floating rate SLMA collateralized debt obligation (“CDO”) secured by federally guaranteed student loans. The CDO owned by the Company utilizes a pool of government guaranteed student loans as collateral and not mortgage loans. The CDO’s secured by SLMA collateral are floating rate securities tied to the one month LIBOR rate and re-price on a monthly basis.
In June of 2008, the Company purchased $2.0 million par value of a private placement subordinated debenture issued by First Financial Services Corporation (“FFKY”), the holding company for First Federal Savings Bank (“First Fed”). The debenture is a thirty year security with a coupon rate of 8.00%. FFKY was a NASDAQ listed commercial bank holding company located in Elizabethtown, Kentucky. In October of 2010, FFKY informed the owners of its subordinated trust, including the Company, that it would defer future dividend payments for up to five years as prescribed by the trust. FFKY and First Fed have significant asset quality issues that have resulted in negative earnings since 2009. In 2013, the Company recognized a $400,000 other than temporary impairment loss on the subordinated debenture issued by FFKY. The recognition of a loss was the result of the Company’s analysis that, despite a slowly improving financial condition, FFKY was not likely to resume dividend payments prior to the end of the five year interest rate extension period.
On January 1, 2015, FFKY was sold and merged into Community Bank Shares of Indiana, (“CBIN”). On January 12, 2015, the Company was notified by Wilmington Trust that its investment in First Federal Statutory Trust III, (“FFKY Trust”), had elected to terminate the extension period of interest payments effective January 1, 2015. All accrued interest due and payable to all owners of securities through March 15, 2015, was paid to the Trustee in January 2015 and remains current at December 31, 2015. On January 21, 2015, the Company determined that FFKY Trust is no longer impaired and has placed the investment back into accrual status. On July 1, 2015, CBIN changed its NASDAQ ticker symbol to YCB.
Interest Rate Sensitivity Analysis
The Company’s profitability is affected by fluctuations in interest rates. A sudden and substantial increase or decrease in interest rates may adversely impact the Company’s earnings to the extent that the interest rates on interest earning assets and interest bearing liabilities do not change at the same speed, to the same extent or on the same basis. As part of its effort to manage interest rate risk, the Bank monitors its net economic value of capital (“EVE”) by using our asset liability software to assist in modeling how changes in interest rates affect the values of various assets and liabilities on the Company’s balance sheet. By calculating our EVE, the Company is able to construct models that show the effect of different interest rate changes on its total capital. This risk analysis is a key tool that allows banks to prepare against constantly changing interest rates.
10
Table of Contents
Generally, EVE is a cash flow calculation that takes the present value of all asset cash flows and subtracts the present value of all liability cash flows. The application of the methodology attempts to quantify interest rate risk as the change in the EVE, which would result from a theoretical 200 basis point (1 basis point equals .01%) change in market rates. Both a 300 basis point increase in market interest rates and a 100 basis point decrease in market interest rates are considered.
The following table presents the Company’s EVE at December 31, 2015, as calculated by the Company’s asset liability model for the year period ending December 31, 2015.
| Change | Net Portfolio Value | |||||||||||
| In Rates |
$ Amount | $ Change | % Change | |||||||||
| (Dollars in thousands) | ||||||||||||
| +300 bp |
$ | 80,442 | ($ | 21,716 | ) | (21.3 | %) | |||||
| +200 bp |
89,022 | (13,136 | ) | (12.9 | %) | |||||||
| +100 bp |
96,589 | (5,569 | ) | (5.5 | %) | |||||||
| 0 bp |
102,158 | — | — | |||||||||
| -100 bp |
107,843 | 5,685 | 5.6 | % | ||||||||
| Interest Rate Risk Measures: 200 Basis Point (bp) Rate Shock |
||||
| Tangible Common Equity Ratio at December 31, 2015 |
9.7 | % | ||
| Pre-Shock Tier 1 Capital Ratio at December 31, 2015 |
10.9 | % | ||
| Exposure Measure: 2% Increase in Rates |
8.3 | % | ||
The computation of prospective effects of hypothetical interest rate changes are based on numerous assumptions, including relative levels of market interest rates, loan prepayments and deposit decay rates, and should not be relied upon as indicative of actual results. The computations do not contemplate any actions the Company could undertake in response to changes in interest rates. The matching of assets and liabilities may be analyzed by examining the extent to which such assets and liabilities are “interest rate sensitive” and by monitoring an institution’s interest rate sensitivity “gap.” An asset or liability is said to be interest rate sensitive within a specific period if it will mature or re-price within that period.
Interest Income Analysis
As a part of the Company’s asset liability management process, an emphasis is placed on the effect that changes in interest rates have on the net interest income of the Company and the resulting change in the net present value of capital. As a part of its analysis, the Company uses third party software and analytical tools derived from the Company’s regulatory reporting models to analyze the re-pricing characteristics of both assets and liabilities and the resulting net present value of the Company’s capital given various changes in interest rates. The model also uses mortgage prepayment assumptions obtained from third party vendors to anticipate prepayment speeds on both loans and investments. The Company’s model uses incremental changes in interest rates. For example, a 3.0% change in annual rates includes a 75 basis point change in each of the next four quarters.
For the year ended December 31, 2015, the Company’s previous efforts to increase duration in our investment portfolio had a positive effect on its results of operations. At December 31, 2015, the investment portfolio’s duration has been reduced largely through the reduction in the six of the portfolio. The Company purchased a large volume of municipal bonds in 2008 and 2009 and those bonds are approaching their ten year call dates. The Company’s current models indicate that a large percentage of these bonds will be called in 2019 with a 2% increase in interest rates. The Company continues to analyze our municipal portfolio for future sale candidates given our concentration in Kentucky municipal bonds and the status of Commonwealth of Kentucky having to most underfunded public pension system in the United States.
11
Table of Contents
Management continues to focus on reducing the Company’s cost of interest bearing liabilities by reducing both the cost and dependency on time deposit funding and FHLB advances. The average balance and weighted average cost of time deposits has declined in each of the last two years. The average balance of time deposits for the year ended December 31, 2015 was $320.9 million, as compared to $356.1 million and $407.0 million for the years ended December 31, 2014, and December 31, 2013, respectively. The average balance of FHLB borrowings for the years December 31, 2015, 2014, and 2012 were $17.3 million, $42.4 million and $44.9 million, respectively.
The average cost of time deposits for the years ended December 31, 2015, December 31, 2014, and December 31, 2013, was 1.16%, 1.17% and 1.41%, respectively. In January and February of 2016, the Company has approximately $52.4 million in time deposits maturing with a weighted average cost of 2.52%. See Note 6 of the Consolidated Financial Statements for more details.
The average cost of FHLB borrowings for the years ended December 31, 2015, December 31, 2014, and December 31, 2013, was 1.67%, 3.92% and 3.96%, respectively. The Company has a $4.0 million FHLB borrowing maturing in March 2016 with a current cost of 5.36%. See Note 7 of the Consolidated Financial Statements for more details.
The amount of change in interest rate sensitivity eventually achieved by management will be largely dependent on its ability to make changes at a reasonable cost. The reduction of interest rate in the one to two year time frame can dramatically reduce the Company’s net income due to the severe upward slope of the interest rate yield curve. To the extent possible, management will reduce its balances in FHLB deposits to ensure greater flexibility in the event of a sudden change of interest rates.
The Company’s analysis at December 31, 2015, indicates that changes in interest rates are likely to result in modest changes in the Company’s annual net interest income. A summary of the Company’s analysis at December 31, 2015, for the year ending December 31, 2016, is as follows:
| Down 1.00% | No Change | Up 1.00% | Up 2.00% | Up 3.00% | ||||||||||||||||
| (Dollars in Thousands) | ||||||||||||||||||||
| Net interest income |
$ | 26,207 | $ | 27,754 | $ | 28,770 | $ | 29,477 | $ | 29,964 | ||||||||||
Gap Analysis
The interest rate sensitivity gap is defined as the difference between the amount of interest-earning assets maturing or re-pricing within a specific time period and the amount of interest-bearing liabilities maturing or re-pricing within that time period. A gap is considered positive when the amount of interest rate sensitive assets exceeds the amount of interest rate sensitive liabilities, and is considered negative when the amount of interest rate sensitive liabilities exceeds the amount of interest rate sensitive assets.
At December 31, 2015, the Company had a negative one year or less interest rate sensitivity gap of 26.90% of total interest-earning assets. Generally, during a period of rising interest rates, a negative gap position would be expected to adversely affect net interest income while a positive gap position would be expected to result in an increase in net interest income. Conversely during a period of falling interest rates, a negative gap would be expected to result in an increase in net interest income and a positive gap would be expected to adversely affect net interest income. This analysis is considered less reliable as compared to the Company’s ALM models as changes in various interest rate spreads are not incorporated in Gap Analysis. Furthermore, the presence of non-interest bearing liabilities does not factor in the Company’s Gap Analysis but provides an additional source of funds that can offset the negative impact of changing interest rates. Gap Analysis does not give considerations to how much the yield on assets and the cost of liabilities may change in any given period. In the current rate environment, loans yields often re-price more quickly and more substantially as opposed to short-term deposits, which are currently priced at much lower levels.
12
Table of Contents
The following table sets forth the amounts of interest-earning assets and interest-bearing liabilities outstanding at December 31, 2015, which are expected to mature, are likely to be called or re-priced in each of the time periods shown.
| Over one | Over Five | Over Ten | Over | |||||||||||||||||||||
| One Year | Through | Through | Through | Fifteen | ||||||||||||||||||||
| or Less | Five Years | Ten Years | Fifteen Years | Years | Total | |||||||||||||||||||
| Interest-earning assets |
||||||||||||||||||||||||
| Loans: |
||||||||||||||||||||||||
| 1 - 4 family residential |
$ | 73,139 | 23,197 | 27,275 | 18,405 | 42,190 | 184,206 | |||||||||||||||||
| Multi-family |
10,883 | 3,215 | 6,390 | 1,857 | 2,380 | 24,725 | ||||||||||||||||||
| Construction |
18,032 | 16,846 | — | — | — | 34,878 | ||||||||||||||||||
| Non-residential |
84,787 | 35,612 | 14,681 | 8,055 | 6,576 | 149,711 | ||||||||||||||||||
| Land |
13,680 | 7,514 | 136 | 554 | 569 | 22,453 | ||||||||||||||||||
| Farmland |
26,733 | 4,861 | 6,435 | 2,158 | 2,059 | 42,246 | ||||||||||||||||||
| Consumer |
14,289 | 5,687 | 299 | 49 | — | 20,324 | ||||||||||||||||||
| Commercial |
61,629 | 17,029 | 7,741 | 344 | — | 86,743 | ||||||||||||||||||
| Interest bearing deposits |
7,772 | — | — | — | — | 7,772 | ||||||||||||||||||
| Non-amortizing securities |
2,551 | 42,560 | 33,467 | 228 | 6,379 | 85,185 | ||||||||||||||||||
| Amortizing securities |
16,285 | 22,824 | 15,612 | 4,996 | 2,732 | 62,449 | ||||||||||||||||||
| Mortgage backed securities |
18,314 | 19,178 | 22,386 | 17,909 | 11,756 | 89,543 | ||||||||||||||||||
|
|
|
|
|
|
|
|
|
|
|
|
|
|||||||||||||
| Total |
348,094 | 198,523 | 134,422 | 54,555 | 74,641 | 810,235 | ||||||||||||||||||
|
|
|
|
|
|
|
|
|
|
|
|
|
|||||||||||||
| Interest bearing liabilities: |
||||||||||||||||||||||||
| Deposits |
501,001 | 113,335 | — | — | — | 614,336 | ||||||||||||||||||
| Borrowed funds |
65,080 | 6,000 | — | — | — | 71,080 | ||||||||||||||||||
|
|
|
|
|
|
|
|
|
|
|
|
|
|||||||||||||
| Total |
566,081 | 119,335 | — | — | — | 685,416 | ||||||||||||||||||
|
|
|
|
|
|
|
|
|
|
|
|
|
|||||||||||||
| Interest sensitivity gap |
($ | 217,987 | ) | 79,188 | 134,422 | 54,555 | 74,641 | 124,819 | ||||||||||||||||
|
|
|
|
|
|
|
|
|
|
|
|
|
|||||||||||||
| Cumulative interest sensitivity gap |
($ | 217,987 | ) | (138,799 | ) | ($ | 4,377 | ) | $ | 50,178 | $ | 124,819 | 124,819 | |||||||||||
|
|
|
|
|
|
|
|
|
|
|
|
|
|||||||||||||
| Ratio of interest-earning assets to interest bearing liabilities |
61.49 | % | 166.36 | % | — | — | — | 118.21 | % | |||||||||||||||
|
|
|
|
|
|
|
|
|
|
|
|
|
|||||||||||||
| Ratio of cumulative gap to total interest-earning assets |
(26.90 | %) | (17.13 | %) | (0.54 | %) | 6.19 | % | 15.41 | % | 15.41 | % | ||||||||||||
|
|
|
|
|
|
|
|
|
|
|
|
|
|||||||||||||
The preceding table was prepared based upon the assumption that loans will not be repaid before their respective contractual maturities, except for adjustable rate loans, which are classified, based upon their next re-pricing date. Further, it is assumed that fixed maturity deposits are not withdrawn prior to maturity and other deposits are withdrawn or re-priced within one year. Mortgage-backed securities are classified based on their three month prepayment speeds. Prepayment speeds on mortgage backed securities have slowed considerably as many outstanding mortgage loans have low coupons and are not prone to future refinancing. We anticipate that the majority of mortgage pools will exhibit historically low prepayment speeds for several years. The preceding table does not reflect possible changes in cash flows that may result from this change in Fannie Mae and Freddie Mac portfolio servicing practices or Small Business Administration lending practices. The actual interest rate sensitivity of the Company’s assets and liabilities could vary significantly from the information set forth in the table due to market and other factors. The retention of adjustable-rate mortgage loans in the Company’s investment and loan portfolios helps reduce the Company’s exposure to changes in interest rates. However, there are unquantifiable credit risks resulting from potential increased costs to borrowers as a result of re-pricing adjustable-rate mortgage loans. It is possible that during periods of rising interest rates, the risk of default on adjustable-rate mortgage loans may increase due to the upward adjustment of interest costs to the borrowers.
13
Table of Contents
Average Balance, Interest and Average Yields and Rates
The following table sets forth certain information relating to the Company’s average interest-earning assets and average interest-bearing liabilities and reflects the average yield on assets and average cost of liabilities for the periods and at the date indicated. Such yields and costs are derived by dividing income or expense by the average monthly balance of assets or liabilities, respectively, for the periods presented. Average balances are derived from month-end balances. Management does not believe that the use of month-end balances instead of daily balances has caused any material difference in the information presented.
The table also presents information for the periods and at the date indicated with respect to the difference between the average yield earned on interest-earning assets and average rate paid on interest-bearing liabilities, or “interest rate spread,” which commercial banks have traditionally used as an indicator of profitability. Another indicator of an institution’s net interest income is its “net yield on interest-earning assets,” which is its net interest income divided by the average balance of interest-earning assets. Net interest income is affected by the interest rate spread and by the relative amounts of interest-earning assets and interest-bearing liabilities. When interest-earning assets approximate or exceed interest-bearing liabilities, any positive interest rate spread will generate net interest income. The following table is for the month of December 31, 2015.
| December 2015 Monthly Averages | ||||||||
| Balance | Weighted Average Yield/ Cost |
|||||||
| (Dollars in thousands) | ||||||||
| Interest-earning assets: |
||||||||
| Loans receivable, net |
$ | 561,665 | 4.65 | % | ||||
| Non taxable securities available for sale |
50,305 | 4.47 | %* | |||||
| Taxable securities available for sale |
188,244 | 2.05 | % | |||||
| Federal Home Loan Bank stock |
4,428 | 3.75 | % | |||||
| Interest bearing deposits |
20,380 | 0.29 | % | |||||
|
|
|
|
|
|||||
| Total interest-earning assets |
825,022 | 3.92 | % | |||||
| Non-interest-earning assets |
72,601 | |||||||
|
|
|
|||||||
| Total assets |
$ | 897,623 | ||||||
|
|
|
|||||||
| Interest-bearing liabilities: |
||||||||
| Deposits |
$ | 622,462 | 0.84 | % | ||||
| FHLB borrowings |
15,000 | 2.19 | % | |||||
| Repurchase agreements |
42,916 | 2.91 | % | |||||
| Subordinated debentures |
10,310 | 7.22 | % | |||||
|
|
|
|
|
|||||
| Total interest-bearing liabilities |
690,688 | 0.96 | % | |||||
| Non-interest-bearing liabilities |
119,305 | |||||||
|
|
|
|||||||
| Total liabilities |
809,993 | |||||||
| Common stock |
79 | |||||||
| Additional paid-in capital |
58,624 | |||||||
| Retained earnings |
47,104 | |||||||
| Treasury stock |
(13,471 | ) | ||||||
| Unearned ESOP shares |
(7,180 | ) | ||||||
| Accumulated other comprehensive income |
2,474 | |||||||
|
|
|
|||||||
| Total liabilities and equity |
$ | 897,623 | ||||||
|
|
|
|||||||
| Interest rate spread |
2.96 | % | ||||||
|
|
|
|||||||
| Net interest margin |
3.18 | % | ||||||
|
|
|
|||||||
| Ratio of interest-earning assets to interest-bearing liabilities |
119.45 | % | ||||||
|
|
|
|||||||
| * | Tax equivalent yield at the Company’s 34% tax bracket and the Company’s month to date cost of funds rate of 0.96%. |
14
Table of Contents
| Years Ended December 31, | ||||||||||||||||||||||||||||||||||||
| 2015 | 2014 | 2013 | ||||||||||||||||||||||||||||||||||
| Average Balance |
Interest | Average Yield/ Cost |
Average Balance |
Interest | Average Yield/ Cost |
Average Balance |
Interest | Average Yield / Cost |
||||||||||||||||||||||||||||
| (Dollars in Thousands) | ||||||||||||||||||||||||||||||||||||
| Interest-earning assets: |
||||||||||||||||||||||||||||||||||||
| Loans receivable, net (a) |
$ | 552,265 | 25,322 | 4.59 | % | $ | 534,404 | 26,038 | 4.87 | % | $ | 528,074 | 26,750 | 5.07 | % | |||||||||||||||||||||
| Taxable securities AFS |
203,160 | 6,149 | 3.03 | % | 262,154 | 6,548 | 2.50 | % | 269,304 | 6,873 | 2.55 | % | ||||||||||||||||||||||||
| Non-taxable securities AFS |
52,836 | 2,464 | 4.66 | % | 64,393 | 3,097 | 4.81 | % | 70,178 | 3,292 | 4.69 | % | ||||||||||||||||||||||||
| Other interest-bearing deposits |
8,528 | 22 | 0.26 | % | 10,461 | 26 | 0.25 | % | 9,060 | 24 | 0.26 | % | ||||||||||||||||||||||||
|
|
|
|
|
|
|
|
|
|
|
|
|
|
|
|
|
|
|
|||||||||||||||||||
| Total interest-earning assets |
$ | 816,789 | 33,957 | 4.16 | % | $ | 871,412 | 35,709 | 4.10 | % | $ | 876,616 | 36,939 | 4.21 | % | |||||||||||||||||||||
|
|
|
|
|
|
|
|
|
|
|
|
|
|||||||||||||||||||||||||
| Non-interest-earning assets |
75,032 | 77,716 | 80,609 | |||||||||||||||||||||||||||||||||
|
|
|
|
|
|
|
|||||||||||||||||||||||||||||||
| Total assets |
$ | 891,821 | $ | 949,128 | $ | 957,225 | ||||||||||||||||||||||||||||||
|
|
|
|
|
|
|
|||||||||||||||||||||||||||||||
| Interest-bearing liabilities: |
||||||||||||||||||||||||||||||||||||
| Deposits |
$ | 612,816 | 5,031 | 0.82 | % | $ | 640,676 | 5,603 | 0.87 | % | $ | 657,895 | 7,114 | 1.08 | % | |||||||||||||||||||||
| Borrowings |
71,084 | 1,519 | 2.14 | % | 98,574 | 3,276 | 3.32 | % | 96,823 | 3,467 | 3.58 | % | ||||||||||||||||||||||||
|
|
|
|
|
|
|
|
|
|
|
|
|
|
|
|
|
|
|
|||||||||||||||||||
| Total interest-bearing liabilities |
683,900 | 6,550 | 0.96 | % | 739,250 | 8,879 | 1.20 | % | 754,718 | 10,581 | 1.40 | % | ||||||||||||||||||||||||
|
|
|
|
|
|
|
|
|
|
|
|
|
|||||||||||||||||||||||||
| Non-interest-bearing liabilities |
117,215 | 109,766 | 97,762 | |||||||||||||||||||||||||||||||||
|
|
|
|
|
|
|
|||||||||||||||||||||||||||||||
| Total liabilities |
801,115 | 849,016 | 852,480 | |||||||||||||||||||||||||||||||||
| Common stock |
79 | 79 | 79 | |||||||||||||||||||||||||||||||||
| Common stock warrants |
— | — | 18 | |||||||||||||||||||||||||||||||||
| Additional paid-in capital |
58,544 | 58,384 | 75,353 | |||||||||||||||||||||||||||||||||
| Retained earnings |
46,305 | 45,211 | 39,204 | |||||||||||||||||||||||||||||||||
| Treasury stock |
(11,449 | ) | (5,998 | ) | (14,702 | ) | ||||||||||||||||||||||||||||||
| Unearned ESOP shares |
(5,709 | ) | — | — | ||||||||||||||||||||||||||||||||
| Accumulated other comprehensive income |
2,936 | 2,436 | 4,793 | |||||||||||||||||||||||||||||||||
|
|
|
|
|
|
|
|||||||||||||||||||||||||||||||
| Total liabilities and equity |
$ | 891,821 | $ | 949,128 | $ | 957,225 | ||||||||||||||||||||||||||||||
|
|
|
|
|
|
|
|||||||||||||||||||||||||||||||
| Net interest income |
27,407 | 26,830 | 26,358 | |||||||||||||||||||||||||||||||||
|
|
|
|
|
|
|
|||||||||||||||||||||||||||||||
| Interest rate spread |
3.20 | % | 2.90 | % | 2.81 | % | ||||||||||||||||||||||||||||||
|
|
|
|
|
|
|
|||||||||||||||||||||||||||||||
| Net interest margin |
3.36 | % | 3.08 | % | 3.01 | % | ||||||||||||||||||||||||||||||
|
|
|
|
|
|
|
|||||||||||||||||||||||||||||||
| Ratio of average interest-earning assets to average interest-bearing liabilities |
119.43 | % | 117.88 | % | 116.15 | % | ||||||||||||||||||||||||||||||
|
|
|
|
|
|
|
|||||||||||||||||||||||||||||||
| (a) | Average loans include non-performing loans. |
| (b) | Interest income and yields are presented on a fully tax equivalent basis. |
15
Table of Contents
Rate Volume Analysis
The following table sets forth certain information regarding changes in interest income and interest expense of the Company for the periods indicated. For each category of interest-earning asset and interest-bearing liability, information is provided on changes attributable to: (i) changes in volume (changes in volume from year to year multiplied by the average rate for the prior year) and (ii) changes in rate (changes in the average rate from year to year multiplied by the prior year’s volume). All amounts are quoted on a tax equivalent basis using a cost of funds rate of 1.20% for 2014 and a 0.96% rate for 2015.
| Year Ended December 31, | ||||||||||||||||||||||||
| 2015 vs. 2014 | 2014 vs. 2013 | |||||||||||||||||||||||
| Increase (Decrease) due to |
Increase (Decrease) due to |
|||||||||||||||||||||||
| Rate | Volume | Total Increase (Decrease) |
Rate | Volume | Total Increase (Decrease) |
|||||||||||||||||||
| (Dollars in thousands) | ||||||||||||||||||||||||
| Interest-earning assets: |
||||||||||||||||||||||||
| Loans receivable |
$ | (1,535 | ) | 819 | (716 | ) | $ | (1,020 | ) | 308 | (712 | ) | ||||||||||||
| Securities available for sale, taxable |
1,387 | (1,786 | ) | (399 | ) | (146 | ) | (179 | ) | (325 | ) | |||||||||||||
| Securities available for sale, non-taxable |
(94 | ) | (539 | ) | (633 | ) | 83 | (278 | ) | (195 | ) | |||||||||||||
| Other interest-earning assets |
1 | (5 | ) | (4 | ) | (2 | ) | 4 | 2 | |||||||||||||||
|
|
|
|
|
|
|
|
|
|
|
|
|
|||||||||||||
| Total interest-earning assets |
(241 | ) | (1,511 | ) | (1,752 | ) | (1,085 | ) | (145 | ) | (1,230 | ) | ||||||||||||
|
|
|
|
|
|
|
|
|
|
|
|
|
|||||||||||||
| Interest-bearing liabilities: |
||||||||||||||||||||||||
| Deposits |
(197 | ) | (375 | ) | (572 | ) | (1,100 | ) | (411 | ) | (1,511 | ) | ||||||||||||
| Borrowings |
(1,310 | ) | (447 | ) | (1,757 | ) | (175 | ) | (16 | ) | (191 | ) | ||||||||||||
|
|
|
|
|
|
|
|
|
|
|
|
|
|||||||||||||
| Total interest-bearing liabilities |
(1,507 | ) | (822 | ) | (2,329 | ) | (1,275 | ) | (427 | ) | (1,702 | ) | ||||||||||||
|
|
|
|
|
|
|
|
|
|
|
|
|
|||||||||||||
| Increase (decrease) in net interest income |
$ | 1,266 | (689 | ) | 577 | $ | 190 | 282 | 472 | |||||||||||||||
|
|
|
|
|
|
|
|
|
|
|
|
|
|||||||||||||
Critical Accounting Policies and Estimates
The Company’s financial statements are prepared in accordance with accounting principles generally accepted in the United States of America. The financial information contained within these statements is, to a significant extent, financial information that is based on appropriate measures of the financial effects of transactions and events that have already occurred. Based on its consideration of accounting policies that involved the most complex and subjective decisions and assessments, management has identified its most critical accounting policy to be that related to the allowance for loan losses. The Company’s allowance for loan loss methodology incorporates a variety of risk considerations, both quantitative and qualitative; in establishing an allowance for loan loss that management believes is appropriate at each reporting date. Quantitative factors included the Company’s historical loss experience, delinquency and charge-off trends, collateral values, changes in non-performing loans, and other factors. Quantitative factors also incorporate known information about individual loans, including borrower’s sensitivity to economic conditions throughout the southeast and particular, the state of certain industries. Size and complexity of individual credits in relation to loan structure, existing loan policies and pace of portfolio growth are other qualitative factors that are considered in the methodology.
16
Table of Contents
As the Company adds new products and increases the complexity of the loan portfolio, its methodology accordingly may change. In addition, it may report materially different amounts for the provision for loan losses in the statement of operations if management’s assessment of the above factors changes in future periods. This discussion and analysis should be read in conjunction with the Company’s consolidated financial statements and the accompanying notes presented elsewhere herein. Although management believes the levels of the allowance for loan losses as of both December 31, 2015 and December 31, 2014, were adequate to absorb inherent losses in the loan portfolio, a decline in local economic conditions, or other factors, could result in increasing losses that cannot be reasonably predicted at this time. The Company also considers its policy on non-accrual loans as a critical accounting policy. Loans are placed on non-accrual when a loan is specifically determined to be impaired or when principal or interest is delinquent for 91 days or more.
Comparison of Financial Condition at December 31, 2015 and December 31, 2014
For the year ended December 31, 2015, the Company’s total assets declined by $32.6 million, to $903.2 million as compared to $935.8 million for the year ended December 31, 2014. At December 31, 2015, the Company’s non-interest checking account balances were $125.1 million, as compared to $115.1 million at December 31, 2014. The Company has sought to lower its cost of deposits for several years but placing a greater emphasis on growing our transaction account balances, making the transition away from a heavy dependence on time deposits for the bulk of the Company’s funding needs. As a result, we have experienced a decline in the balances of time deposits. The Company’s time deposit balances declined from $331.9 million at December 31, 2014, to $314.7 million at December 31, 2015. At December 31, 2015, the Company’s balance of borrowing from the FHLB declined to $15.0 million, as compared to $34.0 million at December 31, 2014.
The available for sale portfolio declined $66.4 million, from $303.6 million at December 31, 2014, to $237.2 million at December 31, 2015. The Company used cash flows from the investment portfolio to fund a reduction in time deposits, FHLB borrowings, to repurchase treasury stock and loan growth. At December 31, 2015, the Company’s investment in Federal Home Loan Bank stock was carried at an amortized cost of $4.4 million.
The Company’s net loan portfolio increased by $17.1 million during the year ended December 31, 2015. Net loans totaled $539.3 million and $556.3 million at December 31, 2014, and December 31, 2015, respectively. In 2015, the majority of the Company’s loan portfolio growth occurred as a result of opening a loan production office in Nashville, Tennessee, in October 2014. At December 31, 2015, the Nashville loan production office had outstanding loans of $15.4 million.
The allowance for loan losses totaled $5.7 million at December 31, 2015, a decline of $589,000 from the allowance for loan losses of $6.3 million at December 31, 2014. The ratio of the allowance for loan losses to total loans was 1.01% and 1.15% at December 31, 2015, and December 31, 2014, respectively. Also, at December 31, 2015, the Company’s non-accrual loans were approximately $7.4 million, or 1.32% of total loans, compared to $3.2 million or 0.58% of total loans, December 31, 2014. The Company’s ratio of allowance for loan losses to non-accrual loans at December 31, 2015 and December 31, 2014, was 76.80% and 198.08%, respectively.
17
Table of Contents
Comparison of Operating Results for the Years Ended December 31, 2015 and 2014
Net Income. The Company’s net income available for common shareholders for the year ended December 31, 2015, was $2.4 million compared to $2.2 million for the year ended December 31, 2014. The slight improvement in net income for the year ended December 31, 2015, as compared to December 31, 2014, was largely the result the collection of $800,000 of past due interest on a previously impaired investment security.
Net Interest Income. Net interest income for the year ended December 31, 2015, was $26.6 million, compared to $25.8 million for the year ended December 31, 2014. The increase in net interest income for the year ended December 31, 2015, was largely the result of a $2.3 million reduction in interest expense, offsetting a $1.6 million decline in interest income.
For the year ended December 31, 2015, the Company’s tax equivalent average yield on total interest-earning assets was 4.16% compared to 4.10% for the year ended December 31, 2014, and its average cost of interest-bearing liabilities was 0.96%, compared to 1.20% for the year ended December 31, 2014. As a result, the Company’s tax equivalent interest rate spread for the year ended December 31, 2015, was 3.20%, compared to 2.90% for the year ended December 31, 2014, and its tax equivalent net interest margin was 3.36% for the year ended December 31, 2015, compared to 3.08% for the year ended December 31, 2014.
Interest Income. Interest income declined $1.6 million from $34.7 million to $33.1 million, or approximately 4.5% during the year ended December 31, 2015, compared to the year ended December 31, 2014. The decline in interest income was largely attributable to a decline in yields on assets and a decline in the average balance of the Company’s available for sale portfolio. The average balance on taxable securities available for sale declined $59.0 million, from $262.2 million for the year ended December 31, 2014, to $203.2 million for the year ended December 31, 2015. The average yield on taxable securities available for sale was 3.03% and 2.50%, respectively, for the years ended December 31, 2015, and December 31, 2014, respectively. The average balance of non-taxable securities available for sale declined by approximately $11.6 million, from $64.4 million for the year ended December 31, 2014, to $52.8 million for the year ended December 31, 2015. The average yield on non-taxable securities available for sale decreased from 4.81% for the year ended December 31, 2014, to 4.66% for the year ended December 31, 2015. For the year ended December 31, 2015, the average balance of loans was $552.3 million, an increase of $17.9 million as compared to the year ended December 31, 2014. The average yield on loans declined from 4.87% for the year ended December 31, 2014, to 4.59% for the year ended December 31, 2015.
Interest Expense. Interest expense declined to $6.6 million for the year ended December 31, 2015, compared to $8.9 million for 2014. The decline in interest expense was largely attributable to the $1.8 million decline in interest expense on borrowed funds. The average cost of average interest-bearing deposits declined from 0.87% for the year ended December 31, 2014, to 0.82% for the year ended December 31, 2015. Over the same period, the average balance of interest bearing deposits declined from $640.7 million for the year ended December 31, 2014, to $612.8 million for the year ended December 31, 2015. The Company’s cost structure has benefited from its growth of non-interest bearing deposits. For the year ended December 31, 2015, the average balance of non-interest bearing deposits was $113.3 million, an increase of $8.4 million, or 8.0%, over the average balance of non-interest bearing deposits for the year ended December 31, 2014. The average balance of FHLB borrowings declined from $42.4 million for the year ended December 31, 2014, to $17.3 million for the year ended December 31, 2015, as the Company paid off a sizable portion of its FHLB borrowings. The average cost of FHLB borrowings decreased from 3.92% for the year ended December 31, 2014, to 1.67% for the year ended December 31, 2015.
Provision for Loan Losses. The Company determined that an additional $1.1 million in provision for loan losses was required for the year ended December 31, 2015. For the year ended December 31, 2014, the Company determined that significant improvements in our credit quality provided the opportunity to reduce the allowance for loan loss account by $2.3 million. The reduction in the allowance for loan loss account was the result of lower levels of past due loans, improving appraisal values on collateral securing loans classified as substandard, and a continued reduction in the amount of problem assets.
18
Table of Contents
Non-Interest Income. Non-interest income declined by $238,000 for the year ended December 31, 2015, to $7.6 million, compared to $7.8 million for the year ended December 31, 2014. The decline in non-interest income is largely the result of a $429,000 decline in service charge income. The decline in service charge income was partially offset by a $55,000 increase in merchant card income. For the year ended December 31, 2015, the Company’s financial services income declined by $295,000 as compared to the year ended December 31, 2014. For the year ended December 31, 2015, income from mortgage origination income was $1.2 million, as compared to $719,000 for the year ended December 31, 2014. For the year ended December 31, 2015, gains on the sale of securities were $691,000, as compared to $578,000 for the year ended December 31, 2014.
Non-Interest Expense. Total non-interest expense for the year ended December 31, 2015, was $30.4 million, compared to $33.9 million in 2014, a decline of $3.5 million, or approximately 10.3%. The decline in non-interest expense was heavily influenced by a $1.8 million loss on the sale of an adversely classified commercial real estate loan and the $2.5 million FHLB prepayment penalty during the year ended December 31, 2014. For the year ended December 31, 2015, the Company’s salaries and benefits expense increased by $588,000, or 3.9%, as compared to the year ended December 31, 2014. For the year ended December 31, 2015, professional services expenses increased by $175,000, or 13.1% as compared to the year ended December 31, 2014, due to changes implemented for disaster recovery purposes required by regulators. For the year ended December 31, 2015, losses on the sale of other real estate owned increased by $508,000, or 244.2% as compared to the year ended December 31, 2014. For the year ended December 31, 2015, expenses related to other real estate owned increased by $245,000, or 92.1%, due to an increase in the Company’s activities in acquiring and disposing of properties. For the year ended December 31, 2015, no other non-interest expense increased by more than $150,000 as compared to the year ended December 21, 2014.
Income Taxes. The effective tax rates for the years ended December 31, 2015, and December 31, 2014, were 10.2% and (10.1%), respectively. The Company’s effective tax rate remains well below historical levels due to a higher percentage of pre-tax income that is not subject to federal income tax. The Company’s sizable holdings in municipal bonds, life insurance contracts and certain tax credits earned have lowered our effective tax rate.
19
Table of Contents
Comparison of Operating Results for the Years Ended December 31, 2014 and 2013
Net Income. The Company’s net income available for common shareholders for the year ended December 31, 2014, was $2.2 million compared to $3.8 million for the year ended December 31, 2013. In 2014, the reduction in net income was largely the result of the Company’s decision to prepay $35.9 million in FHLB borrowings and incur a prepayment penalty of $2.5 million. This action will save the Company approximately $135,000 per month beginning in January 2015 and the Company will recoup our one time penalty in approximately 20 months. During 2014, the Company sold a loan note for a loss of approximately $1.8 million.
Net Interest Income. Net interest income for the year ended December 31, 2014, was $25.8 million, compared to $25.3 million for the year ended December 31, 2015. The increase in net interest income for the year ended December 31, 2014, was largely the result of a $1.5 million reduction in interest expense on deposits, offsetting a $1.2 million decline in interest income. For the year ended December 31, 2014, the Company’s tax equivalent average yield on total interest-earning assets was 4.10% compared to 4.21% for the year ended December 31, 2013, and its average cost of interest-bearing liabilities was 1.20%, compared to 1.40% for the year ended December 31, 2013. As a result, the Company’s tax equivalent interest rate spread for the year ended December 31, 2014, was 2.90%, compared to 2.81% for the year ended December 31, 2013, and its tax equivalent net interest margin was 3.08% for the year ended December 31, 2014, compared to 3.01% for the year ended December 31, 2013.
Interest Income. Interest income declined $1.2 million from $35.9 million to $34.7 million, or approximately 3.3% during the year ended December 31, 2014, compared to 2013. The decline in interest income was largely attributable to a decline in yields on assets and a decline in the average balance of interest earning assets. The average balance on taxable securities available for sale declined from $269.3 million for the year ended December 31, 2013, to $262.2 million for the year ended December 31, 2014. The average yield on taxable securities available for sale was 2.50% and 2.55%, respectively, for the years ended December 31, 2014, and December 31, 2013, respectively. The average balance of non-taxable securities available for sale declined by approximately $5.8 million, from $70.2 million for the year ended December 31, 2013, to $64.4 million for the year ended December 31, 2014. The average yield on non-taxable securities available for sale increased from 4.69% for the year ended December 31, 2013, to 4.81% for the year ended December 31, 2014. For the year ended December 31, 2014, the average balance of loans was $534.4 million, an increase of $6.3 million as compared to the year ended December 31, 2013. The average yield on loans declined from 5.07% for the year ended December 31, 2013, to 4.87% for the year ended December 31, 2014.
Interest Expense. Interest expense declined to $8.9 million for the year ended December 31, 2014, compared to $10.6 million for the year ended December 31, 2013. The decline in interest expense was attributable to the $1.5 million decline in interest expense on deposits. The average cost of average interest-bearing deposits declined to 0.87% for the year ended December 31, 2014, from 1.08% for the year ended December 31, 2013. Over the same period, the average balance of interest bearing deposits declined from $657.9 million for the year ended December 31, 2013, to $640.7 million for the year ended December 31, 2014. The Company’s cost structure has benefited from its growth of non-interest bearing deposits. For the year ended December 31, 2014, the average balance of non-interest bearing deposits was $104.9 million, an increase of $12.5 million, or 13.5%, over the average balance of non-interest bearing deposits for the year ended December 31, 2013. The average balance of FHLB borrowings declined from $44.9 million for the year ended December 31, 2013, to $42.4 million for the year ended December 31, 2014. The average cost of FHLB borrowings decreased from 3.96% for the year ended December 31, 2013, to 3.92% for the year ended December 31, 2014.
Provision for Loan Losses. The Company determined that an additional $1.6 million in provision for loan losses was required for the year ended December 31, 2013. For the year ended December 31, 2014, the Company determined that significant improvements in our credit quality provided the opportunity to reduce the allowance for loan loss account by $2.3 million. The reduction in the allowance for loan loss account was the result of lower levels of past due loans, improving appraisal values on collateral securing loans classified as substandard, and a continued reduction in the amount of problem assets.
20
Table of Contents
Non-Interest Income. Non-interest income declined by $1.6 million for the year ended December 31, 2014, to $7.8 million, compared to $9.4 million for the year ended December 31, 2013. The decline in non-interest income is largely the result of a $1.1 million decline in gains on the sale of securities. For the year ended December 31, 2014, the Company’s financial services income declined by $270,000 as compared to the year ended December 31, 2013, due to the sale of the Company’s insurance assets in December 2013, which resulted in a gain of $412,000 for the year ended December 31, 2013. For the year ended December 31, 2014, income from service charges declined $316,000, to $3.4 million, as compared to the year ended December 31, 2013.
Non-Interest Expense. Total non-interest expense for the year ended December 31, 2014, was $33.9 million, compared to $28.6 million in 2013, an increase of $5.3 million, or approximately 18.4%. The increase in non-interest expense was heavily influenced by a $1.8 million loss on the sale of an adversely classified commercial real estate loan and the $2.5 million FHLB prepayment penalty. Excluding these two expenses, non-interest expense increased by approximately $1.0 million, or 3.4%, for the year ended December 31, 2014, as compared to the year ended December 31, 2013. For the year ended December 31, 2014, the Company’s salaries and benefits expense increased by $489,000, or 3.3%, as compared to the year ended December 31, 2013. For the year ended December 31, 2014, state deposit taxes increased by $755,000, or 130% as compared to the year ended December 31, 2013, due to the charter change of the Company’s bank subsidiaries charter. For the year ended December 31, 2014, data processing expenses increased by $192,000, or 7.12% as compared to the year ended December 31, 2013, due to changes implemented for disaster recovery purposes required by regulators. For the year ended December 31, 2014, no other non-interest expense increased by more than $200,000 as compared to the year ended December 21, 2013. For the year ended December 31, 2014, the Company’s most significant reductions in non-interest expense included occupancy expenses and professional services expenses, which declined $258,000 and $442,000, respectively, for the year ended December 31, 2014, as compared to the year ended December 31, 2013.
Income Taxes. The effective tax rates for the years ended December 31, 2014, and December 31, 2013, was (10.1%) and 14.6%, respectively. The Company’s effective tax rate remains well below historical levels due to a higher percentage of pre-tax income that is not subject to federal income tax. The Company’s sizable holdings in municipal bonds, life insurance contracts and certain tax credits earned have lowered our effective tax rate.
Liquidity and Capital Resources
The Company’s primary business is that of the Bank. Management believes dividends that may be paid from the Bank to the Company will provide sufficient funds for the Company’s current and anticipated needs; however, no assurance can be given that the Company will not have a need for additional funds in the future. The Bank is subject to certain regulatory limitations with respect to the payment of dividends to the Company.
Capital Resources. At December 31, 2015, the Bank exceeded all regulatory minimum capital requirements. For a detailed discussion of the Kentucky Department of Financial Institutions (“KDFI”) and FDIC capital requirements, and for a tabular presentation of the Bank’s compliance with such requirements, see Note 16 of Notes to Consolidated Financial Statements. See the Company’s Risk Factors, located in our Annual Report filed on SEC form10-K for the year ended December 31, 2015, for comments related to effects that the implementation of Basel III will have on the Company’s future operations.
21
Table of Contents
Liquidity. Liquidity management is both a daily and long-term function of business management. If the Bank requires funds beyond its ability to generate them internally, the Bank believes that it could borrow funds from the FHLB. At December 31, 2015, the Bank had outstanding advances of $15.0 million from the FHLB and $32.5 million of letters of credit issued by the FHLB to secure municipal deposits. The Bank can immediately borrow an additional $54.0 million from the FHLB and the Company has the ability to pledge another $17.2 million in securities to the FHLB for additional borrowing capacity. The Bank can immediately borrow $8.0 million from its correspondent bank. See Note 7 of Notes to Consolidated Financial Statements.
Subordinated Debentures Issuance. On September 25, 2003, the Company issued $10,310,000 of subordinated debentures in a private placement offering. The securities have a thirty-year maturity and are callable at the issuer’s discretion on a quarterly basis beginning five years after issuance. The securities are priced at a variable rate equal to the three-month LIBOR (London Interbank Offering Rate) plus 3.10%. Interest is paid and the rate of interest may change on a quarterly basis. The Company’s subsidiary, a state chartered commercial bank supervised by the KDFI and the FDIC may recognize the proceeds of trust preferred securities as capital. KDFI and FDIC regulations provide that 25% of Tier I capital may consist of trust preferred proceeds. See Note 10 of Notes to Consolidated Financial Statements.
The Bank’s primary sources of funds consist of deposits, repayment of loans and mortgage-backed securities, maturities of investments and interest-bearing deposits, and funds provided from operations. While scheduled repayments of loans and mortgage-backed securities and maturities of investment securities are predictable sources of funds, deposit flows and loan prepayments are greatly influenced by the general level of interest rates, economic conditions and competition. The Bank uses its liquidity resources principally to fund existing and future loan commitments, to fund maturing certificates of deposit and demand deposit withdrawals, to invest in other interest-earning assets, to maintain liquidity, and to meet operating expenses.
Management believes that loan repayments and other sources of funds will be adequate to meet the Bank’s liquidity needs for the immediate future. A portion of the Bank’s liquidity consists of cash and cash equivalents. At December 31, 2015, cash and cash equivalents totaled $54.7 million. The level of these assets depends upon the Bank’s operating, investing and financing activities during any given period.
Cash flows from operating activities for the years ended December 31, 2015, 2014 and 2013 were $6.4 million, $10.1 million, and $9.3 million, respectively.
Cash flows provided by investment activities were $42.5 million and $19.0 million for the years ended December 31, 2015, and December 31, 2014, respectively. For the year ended December 31, 2013, the Company’s investment activities used $4.3 million of the Company’s. A principal use of cash in this area has been purchases of securities available for sale of $56.9 million, offset by proceeds from sales, calls and maturities of securities of $120.4 million during 2015. The Company invested $19.0 million, $1.9 million and $21.6 million of cash in loans in 2015, 2014 and 2013, respectively. Sales and maturities of available for sale securities exceeded purchases by $63.5 million in 2015, $21.0 million in 2014 and $18.9 million in 2013.
At December 31, 2015, the Bank had $46.4 million in outstanding commitments to originate loans and unused lines of credit of $85.0 million. The Bank anticipates that it will have sufficient funds available to meet its current loan origination and lines of credit commitments. The Bank has certificates of deposit maturing in one year or less of $201.3 million at December 31, 2015. Based on historical experience, management believes that a significant portion of such deposits will remain with the Bank.
22
Table of Contents
Impact of Inflation and Changing Prices
The consolidated financial statements and notes thereto presented herein have been prepared in accordance with accounting principles generally accepted in the United States of America, which require the measurement of financial position and operating results in terms of historical dollars without considering the change in the relative purchasing power of money over time and due to inflation. The impact of inflation is reflected in the increased cost of the Company’s operations.
Unlike most industrial companies, nearly all the assets and liabilities of the Company are monetary in nature. As a result, changes in interest rates have a greater impact on the Company’s performance than do the effects of general levels of inflation. Interest rates do not necessarily move in the same direction or to the same extent as the price of goods and services.
Forward-Looking Statements
Management’s discussion and analysis includes certain forward-looking statements addressing, among other things, the Bank’s prospects for earnings, asset growth and net interest margin. Forward-looking statements are accompanied by, and identified with, such terms as “anticipates,” “believes,” “expects,” “intends,” and similar phrases. Management’s expectations for the Company’s future involve a number of assumptions and estimates. Factors that could cause actual results to differ from the expectations expressed herein include: substantial changes in interest rates, and changes in the general economy; changes in the Company’s strategies for credit-risk management, interest-rate risk management and investment activities. Accordingly, any forward-looking statements included herein do not purport to be predictions of future events or circumstances and may not be realized.
Stock Performance Comparison
The following graph, which was prepared by SNL Financial LC (“SNL”), shows the cumulative total return of the Common Stock of the Company since December 31, 2010, compared with the (1) NASDAQ Composite Index, comprised of all U.S. Companies quoted on NASDAQ, (2) the SNL Midwest Thrift Index, comprised of publically traded thrifts and thrift holding companies operating in the Midwestern United States, and (3) the SNL Midwest Bank Index, comprised of publically traded commercial banks and bank holding companies operating in the Midwestern United States. Cumulative total return on the Common Stock or the index equals the total increase in the value since December 31, 2010, assuming reinvestment of all dividends paid into the Common Stock or the index, respectively. The graph was prepared assuming that $100 was invested on December 31, 2010, in the Common Stock, the securities included in the indices. The stock price performance included in this graph is not necessarily indicative of future stock price performance.
23
Table of Contents
On June 5, 2013, the Company became a Kentucky state chartered commercial bank holding company. As such, the Company will compare the SNL Midwest Bank index in the current and in future periods.
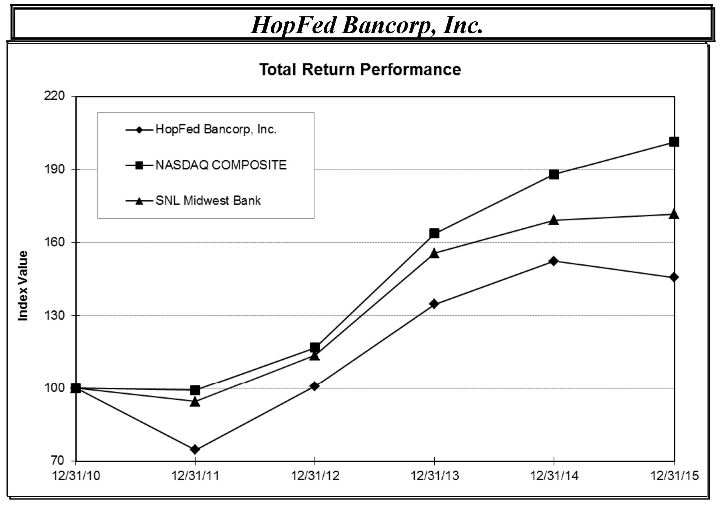
| Period Ending | ||||||||||||||||||||||||
| Index |
12/31/10 | 12/31/11 | 12/31/12 | 12/31/13 | 12/31/14 | 12/31/15 | ||||||||||||||||||
| HopFed Bancorp, Inc. |
100.00 | 74.67 | 100.79 | 134.62 | 152.38 | 145.65 | ||||||||||||||||||
| NASDAQ COMPOSITE |
100.00 | 99.21 | 116.82 | 163.75 | 188.03 | 201.40 | ||||||||||||||||||
| SNL Midwest Bank |
100.00 | 94.46 | 113.69 | 155.65 | 169.21 | 171.78 | ||||||||||||||||||
24
Table of Contents
Consolidated Financial Statements
HopFed Bancorp, Inc.
and Subsidiaries
December 31, 2015, 2014 and 2013
Table of Contents
Table of Contents
REPORT OF INDEPENDENT REGISTERED PUBLIC ACCOUNTING FIRM
To the Board of Directors and Stockholders
of HopFed Bancorp, Inc.
Hopkinsville, Kentucky
We have audited the accompanying consolidated balance sheets of HopFed Bancorp, Inc. and subsidiaries (the “Company”) as of December 31, 2015 and 2014, and the related consolidated statements of income, comprehensive income (loss), changes in stockholders’ equity, and cash flows for each of the years in the three-year period ended December 31, 2015. These consolidated financial statements are the responsibility of the Company’s management. Our responsibility is to express an opinion on these consolidated financial statements based on our audits.
We conducted our audits in accordance with the standards of the Public Company Accounting Oversight Board (United States). Those standards require that we plan and perform the audits to obtain reasonable assurance about whether the financial statements are free of material misstatement. An audit includes examining, on a test basis, evidence supporting the amounts and disclosures in the financial statements, assessing the accounting principles used and significant estimates made by management, as well as evaluating the overall financial statement presentation. We believe that our audits provide a reasonable basis for our opinion.
In our opinion, the consolidated financial statements referred to above present fairly, in all material respects, the financial position of HopFed Bancorp, Inc. and subsidiaries as of December 31, 2015 and 2014, and the results of their operations and their cash flows for each of the years in the three-year period ended December 31, 2015, in conformity with accounting principles generally accepted in the United States of America.
We also have audited, in accordance with the standards of the Public Company Accounting Oversight Board (United States), HopFed Bancorp, Inc.’s internal control over financial reporting as of December 31, 2015, based on criteria established in Internal Control-Integrated Framework (2013) issued by the Committee of Sponsoring Organizations of the Treadway Commission (COSO) and our report dated March 3, 2016, expressed an unqualified opinion on the effectiveness of the Company’s internal control over financial reporting.
| (signed) Rayburn | Fitzgerald PC |
| Brentwood, Tennessee |
| March 3, 2016 |
Table of Contents
HopFed Bancorp, Inc. and Subsidiaries
Consolidated Balance Sheets
December 31, 2015 and 2014
(Dollars in Thousands)
| 2015 | 2014 | |||||||
| Assets | ||||||||
| Cash and due from banks |
$ | 46,926 | 34,389 | |||||
| Interest-earning deposits |
7,772 | 6,050 | ||||||
|
|
|
|
|
|||||
| Cash and cash equivalents |
54,698 | 40,439 | ||||||
| Federal Home Loan Bank stock, at cost (note 2) |
4,428 | 4,428 | ||||||
| Securities available for sale (notes 2 and 8) |
237,177 | 303,628 | ||||||
| Loans held for sale |
2,792 | 1,444 | ||||||
| Loans receivable, net of allowance for loan losses of $5,700 at December 31, 2015, and $6,289 at December 31, 2014 (notes 3 and 7) |
556,349 | 539,264 | ||||||
| Accrued interest receivable |
4,139 | 4,576 | ||||||
| Real estate and other assets owned (note 14) |
1,736 | 1,927 | ||||||
| Bank owned life insurance |
10,319 | 9,984 | ||||||
| Premises and equipment, net (note 4) |
24,034 | 22,940 | ||||||
| Deferred tax assets (note 13) |
2,642 | 2,261 | ||||||
| Intangible asset (note 5) |
— | 33 | ||||||
| Other assets |
4,840 | 4,861 | ||||||
|
|
|
|
|
|||||
| Total assets |
$ | 903,154 | 935,785 | |||||
|
|
|
|
|
|||||
| Liabilities and Stockholders’ Equity | ||||||||
| Liabilities: |
||||||||
| Deposits (note 6): |
||||||||
| Non-interest-bearing accounts |
$ | 125,070 | 115,051 | |||||
| Interest-bearing accounts: |
||||||||
| Interest bearing checking accounts |
203,779 | 186,616 | ||||||
| Savings and money market accounts |
95,893 | 97,726 | ||||||
| Other time deposits |
314,664 | 331,915 | ||||||
|
|
|
|
|
|||||
| Total deposits |
739,406 | 731,308 | ||||||
| Advances from Federal Home Loan Bank (note 7) |
15,000 | 34,000 | ||||||
| Repurchase agreements (note 8) |
45,770 | 57,358 | ||||||
| Subordinated debentures (note 10) |
10,310 | 10,310 | ||||||
| Advances from borrowers for taxes and insurance |
614 | 513 | ||||||
| Dividends payable |
287 | 301 | ||||||
| Accrued expenses and other liabilities |
4,137 | 3,593 | ||||||
|
|
|
|
|
|||||
| Total liabilities |
815,524 | 837,383 | ||||||
|
|
|
|
|
|||||
See accompanying notes to consolidated financial statements.
28
Table of Contents
HopFed Bancorp, Inc. and Subsidiaries
Consolidated Balance Sheets, Continued
December 31, 2015 and 2014
(Dollars in Thousands)
| 2015 | 2014 | |||||||
| Stockholders’ equity |
||||||||
| Preferred stock, par value $0.01 per share; authorized - 500,000 shares; no shares issued or outstanding at December 31, 2015 and December 31, 2014 |
$ | — | — | |||||
| Common stock, par value $.01 per share; authorized 15,000,000 shares; 7,951,699 issued and 6,865,811 outstanding at December 31, 2015, and 7,949,665 issued and 7,171,282 outstanding at December 31, 2014 |
79 | 79 | ||||||
| Additional paid-in-capital |
58,604 | 58,466 | ||||||
| Retained earnings |
47,124 | 45,729 | ||||||
| Treasury stock- common (at cost 1,085,888 shares at December 31, 2015 and 778,383 shares at December 31, 2014) |
(13,471 | ) | (9,429 | ) | ||||
| Unearned ESOP Shares (at cost 546,413 shares at December 31, 2015 and none at December 31, 2014) |
(7,180 | ) | — | |||||
| Accumulated other comprehensive income, net of taxes |
2,474 | 3,557 | ||||||
|
|
|
|
|
|||||
| Total stockholders’ equity |
87,630 | 98,402 | ||||||
|
|
|
|
|
|||||
| Total liabilities and stockholders’ equity |
$ | 903,154 | 935,785 | |||||
|
|
|
|
|
|||||
Commitments and contingencies (notes 11 and 15)
See accompanying notes to consolidated financial statements
29
Table of Contents
HopFed Bancorp, Inc. and Subsidiaries
Consolidated Statements of Income
For the Years ended December 31, 2015, 2014 and 2013
(Dollars in Thousands)
| 2015 | 2014 | 2013 | ||||||||||
| Interest and dividend income |
||||||||||||
| Loans receivable |
$ | 25,300 | 26,025 | 26,741 | ||||||||
| Securities available for sale |
6,149 | 6,548 | 6,873 | |||||||||
| Nontaxable securities available for sale |
1,651 | 2,081 | 2,219 | |||||||||
| Interest-earning deposits |
22 | 26 | 24 | |||||||||
|
|
|
|
|
|
|
|||||||
| Total interest and dividend income |
33,122 | 34,680 | 35,857 | |||||||||
|
|
|
|
|
|
|
|||||||
| Interest expense: |
||||||||||||
| Deposits (note 6) |
5,031 | 5,603 | 7,114 | |||||||||
| Advances from Federal Home loan Bank |
289 | 1,665 | 1,780 | |||||||||
| Repurchase agreements |
491 | 874 | 954 | |||||||||
| Subordinated debentures |
739 | 737 | 733 | |||||||||
|
|
|
|
|
|
|
|||||||
| Total interest expense |
6,550 | 8,879 | 10,581 | |||||||||
|
|
|
|
|
|
|
|||||||
| Net interest income |
26,572 | 25,801 | 25,276 | |||||||||
|
|
|
|
|
|
|
|||||||
| Provision for loan losses (note 3) |
1,051 | (2,273 | ) | 1,604 | ||||||||
|
|
|
|
|
|
|
|||||||
| Net interest income after provision for loan losses |
25,521 | 28,074 | 23,672 | |||||||||
|
|
|
|
|
|
|
|||||||
| Non-interest income: |
||||||||||||
| Other-than-temporary impairment losses on debt securities |
— | — | (511 | ) | ||||||||
| Portion of losses recognized in other comprehensive income |
— | — | 111 | |||||||||
|
|
|
|
|
|
|
|||||||
| Net impairment losses recognized in earnings (note 2) |
— | — | (400 | ) | ||||||||
| Service charges |
2,925 | 3,354 | 3,670 | |||||||||
| Merchant card income |
1,130 | 1,075 | 983 | |||||||||
| Mortgage origination income |
1,175 | 719 | 634 | |||||||||
| Realized gain from sale of securities available for sale, net (note 2) |
691 | 578 | 1,661 | |||||||||
| Income from bank owned life insurance |
335 | 307 | 354 | |||||||||
| Financial services commission |
685 | 980 | 1,250 | |||||||||
| Gain on sale of assets |
— | — | 412 | |||||||||
| Other operating income |
661 | 827 | 808 | |||||||||
|
|
|
|
|
|
|
|||||||
| Total non-interest income |
7,602 | 7,840 | 9,372 | |||||||||
|
|
|
|
|
|
|
|||||||
See accompanying notes to consolidated financial statements.
30
Table of Contents
HopFed Bancorp, Inc. and Subsidiaries
Consolidated Statements of Income, Continued
For the Years ended December 31, 2015, 2014 and 2013
(Dollars in Thousands, Except Per Share and Share Amounts)
| 2015 | 2014 | 2013 | ||||||||||
| Non-interest expenses: |
||||||||||||
| Salaries and benefits (note 12) |
15,810 | 15,222 | 14,733 | |||||||||
| Occupancy expense (note 4) |
3,077 | 3,217 | 3,475 | |||||||||
| Data processing expense |
2,827 | 2,887 | 2,695 | |||||||||
| State deposit tax |
1,018 | 1,336 | 581 | |||||||||
| Intangible amortization |
33 | 97 | 162 | |||||||||
| Professional services |
1,506 | 1,331 | 1,773 | |||||||||
| Advertising expense |
1,302 | 1,341 | 1,236 | |||||||||
| Postage and communications expense |
577 | 577 | 567 | |||||||||
| Supplies expense |
527 | 627 | 495 | |||||||||
| Deposit insurance and examination fees |
586 | 724 | 727 | |||||||||
| Loss on sale of assets |
1 | 25 | 12 | |||||||||
| Loss on sale of real estate owned |
716 | 208 | 140 | |||||||||
| Expenses related to real estate owned |
511 | 266 | 402 | |||||||||
| Loss on sale of loan note |
— | 1,781 | — | |||||||||
| Loss on early debt extinguishment |
— | 2,510 | — | |||||||||
| Other operating expenses |
1,954 | 1,767 | 1,640 | |||||||||
|
|
|
|
|
|
|
|||||||
| Total non-interest expense |
30,445 | 33,916 | 28,638 | |||||||||
|
|
|
|
|
|
|
|||||||
| Income before income tax expense |
2,678 | 1,998 | 4,406 | |||||||||
| Income tax expense (benefit) (note 13) |
274 | (201 | ) | 644 | ||||||||
|
|
|
|
|
|
|
|||||||
| Net income |
$ | 2,404 | 2,199 | 3,762 | ||||||||
|
|
|
|
|
|
|
|||||||
| Earnings per share available to common stockholders (note 18): |
||||||||||||
| Basic |
$ | 0.38 | 0.30 | 0.50 | ||||||||
|
|
|
|
|
|
|
|||||||
| Fully diluted |
$ | 0.38 | 0.30 | 0.50 | ||||||||
|
|
|
|
|
|
|
|||||||
| Weighted average shares outstanding - basic |
6,372,277 | 7,306,078 | 7,483,606 | |||||||||
|
|
|
|
|
|
|
|||||||
| Weighted average shares outstanding - diluted |
6,372,277 | 7,306,078 | 7,483,606 | |||||||||
|
|
|
|
|
|
|
|||||||
See accompanying notes to consolidated financial statements.
31
Table of Contents
HopFed Bancorp, Inc. and Subsidiaries
Consolidated Statements of Comprehensive Income (Loss)
For the Years ended December 31, 2015, 2014 and 2013
(Dollars in Thousands)
| 2015 | 2014 | 2013 | ||||||||||
| Net income |
$ | 2,404 | 2,199 | 3,762 | ||||||||
| Other comprehensive income, net of tax: |
||||||||||||
| Unrealized gain (loss) on non – Other than temporary impaired Investment securities available for sale, net of taxes |
(1,121 | ) | 5,130 | (10,568 | ) | |||||||
| Unrealized gain on OTTI securities, net of taxes |
237 | — | — | |||||||||
| Unrealized gain on derivatives, net of taxes |
257 | 237 | 248 | |||||||||
| Reclassification adjustment for gains and accretion included in net income, net of taxes |
(456 | ) | (381 | ) | (832 | ) | ||||||
|
|
|
|
|
|
|
|||||||
| Total other comprehensive income (loss) |
(1,083 | ) | 4,986 | (11,152 | ) | |||||||
|
|
|
|
|
|
|
|||||||
| Comprehensive income (loss) |
$ | 1,321 | 7,185 | (7,390 | ) | |||||||
|
|
|
|
|
|
|
|||||||
See accompanying notes to consolidated financial statements.
32
Table of Contents
HopFed Bancorp, Inc. and Subsidiaries
Consolidated Statements of Changes in Stockholders’ Equity
For the Years ended December 31, 2015, 2014 and 2013
(Dollars in Thousands, Except Share Amounts)
| Common Shares |
Preferred Shares |
Common Stock |
Common Stock Warrant |
Additional Paid-in Capital |
Retained Earnings |
Preferred Treasury Stock |
Common Treasury Stock |
Accumulated Other Comprehensive Income (Loss) |
Total Equity |
|||||||||||||||||||||||||||||||
| Balance December 31, 2012 |
7,502,812 | 18,400 | $ | 79 | 556 | 76,288 | 41,829 | (18,400 | ) | (5,076 | ) | 9,723 | 104,999 | |||||||||||||||||||||||||||
| Net income |
— | — | — | — | — | 3,762 | — | — | — | 3,762 | ||||||||||||||||||||||||||||||
| Restricted stock awards |
21,559 | — | — | — | — | — | — | — | — | — | ||||||||||||||||||||||||||||||
| Net change in unrealized losses on securities available for sale, net of tax benefit of $5,873 |
— | — | — | — | — | — | — | — | (11,400 | ) | (11,400 | ) | ||||||||||||||||||||||||||||
| Net change in unrealized losses on derivatives, net of taxes of ($128) |
— | — | — | — | — | — | — | — | 248 | 248 | ||||||||||||||||||||||||||||||
| Preferred stock retired |
— | (18,400 | ) | — | — | (18,400 | ) | — | 18,400 | — | — | — | ||||||||||||||||||||||||||||
| Cash dividend to common stockholders’ ($0.12 per share) |
— | — | — | — | — | (897 | ) | — | — | — | (897 | ) | ||||||||||||||||||||||||||||
| Common stock repurchase |
(76,468 | ) | — | — | — | — | — | — | (853 | ) | — | (853 | ) | |||||||||||||||||||||||||||
| Cash repurchase of warrant |
— | — | — | (556 | ) | 299 | — | — | — | — | (257 | ) | ||||||||||||||||||||||||||||
| Compensation expense, restricted stock awards |
— | — | — | — | 115 | — | — | — | — | 115 | ||||||||||||||||||||||||||||||
|
|
|
|
|
|
|
|
|
|
|
|
|
|
|
|
|
|
|
|
|
|||||||||||||||||||||
| Balance December 31, 2013 |
7,447,903 | — | 79 | — | 58,302 | 44,694 | — | (5,929 | ) | (1,429 | ) | 95,717 | ||||||||||||||||||||||||||||
|
|
|
|
|
|
|
|
|
|
|
|
|
|
|
|
|
|
|
|
|
|||||||||||||||||||||
| Net Income |
— | — | — | — | — | 2,199 | — | — | — | 2,199 | ||||||||||||||||||||||||||||||
| Restricted stock awards |
22,378 | — | — | — | — | — | — | — | — | — | ||||||||||||||||||||||||||||||
| Net change in unrealized gain on securities available for sale, net of taxes of ($2,446) |
— | — | — | — | — | — | — | — | 4,749 | 4,749 | ||||||||||||||||||||||||||||||
| Net change in unrealized loss on derivatives, net of taxes of ($122) |
— | — | — | — | — | — | — | — | 237 | 237 | ||||||||||||||||||||||||||||||
| Cash dividend to common stockholders’ ($0.16 per share) |
— | — | — | — | — | (1,164 | ) | — | — | — | (1,164 | ) | ||||||||||||||||||||||||||||
| Common stock repurchase |
(298,999 | ) | — | — | — | — | — | — | (3,500 | ) | — | (3,500 | ) | |||||||||||||||||||||||||||
| Compensation expense, restricted stock awards |
— | — | — | — | 164 | — | — | — | — | 164 | ||||||||||||||||||||||||||||||
|
|
|
|
|
|
|
|
|
|
|
|
|
|
|
|
|
|
|
|
|
|||||||||||||||||||||
| Balance December 31, 2014 |
7,171,282 | — | 79 | — | 58,466 | 45,729 | — | (9,429 | ) | 3,557 | 98,402 | |||||||||||||||||||||||||||||
|
|
|
|
|
|
|
|
|
|
|
|
|
|
|
|
|
|
|
|
|
|||||||||||||||||||||
See accompanying notes to consolidated financial statements.
33
Table of Contents
HopFed Bancorp, Inc. and Subsidiaries
Consolidated Statements of Changes in Stockholders’ Equity
For the Years ended December 31, 2015, 2014 and 2013 (Continued)
(Dollars in Thousands, Except Share Amounts)
| Common Shares |
Preferred Shares |
Common Stock |
Common Stock Warrant |
Additional Paid-in Capital |
Retained Earnings |
Preferred Treasury Stock |
Common Treasury Stock |
Unearned ESOP Shares |
Accumulated Other Comprehensive Income (Loss) |
Total Equity |
||||||||||||||||||||||||||||||||||
| Brought Forward |
7,171,282 | — | 79 | — | 58,466 | 45,729 | — | (9,429 | ) | — | 3,557 | 98,402 | ||||||||||||||||||||||||||||||||
| Net Income |
— | — | — | — | — | 2,404 | — | — | — | — | 2,404 | |||||||||||||||||||||||||||||||||
| Restricted stock awards |
2,034 | — | — | — | — | — | — | — | — | — | — | |||||||||||||||||||||||||||||||||
| Net change in unrealized gain on securities available for sale, net of taxes of $690 |
— | — | — | — | — | — | — | — | — | (1,340 | ) | (1,340 | ) | |||||||||||||||||||||||||||||||
| Net change in unrealized losses on derivatives, net of taxes of ($132) |
— | — | — | — | — | — | — | — | — | 257 | 257 | |||||||||||||||||||||||||||||||||
| Cash dividend to common stockholders’ ($0.16 per share) |
— | — | — | — | — | (1,009 | ) | — | — | — | — | (1,009 | ) | |||||||||||||||||||||||||||||||
| Common stock repurchase |
(907,505 | ) | — | — | — | — | — | — | (11,926 | ) | — | — | (11,926 | ) | ||||||||||||||||||||||||||||||
| Common stock issued |
600,000 | — | — | — | — | — | — | 7,884 | (7,884 | ) | — | — | ||||||||||||||||||||||||||||||||
| ESOP Shares Earned |
— | — | — | — | (52 | ) | — | — | — | 704 | — | 652 | ||||||||||||||||||||||||||||||||
| Compensation expense, restricted stock awards |
— | — | — | — | 190 | — | — | — | — | — | 190 | |||||||||||||||||||||||||||||||||
|
|
|
|
|
|
|
|
|
|
|
|
|
|
|
|
|
|
|
|
|
|
|
|||||||||||||||||||||||
| Balance December 31, 2015 |
6,865,811 | — | $ | 79 | — | 58,604 | 47,124 | — | (13,471 | ) | (7,180 | ) | 2,474 | 87,630 | ||||||||||||||||||||||||||||||
|
|
|
|
|
|
|
|
|
|
|
|
|
|
|
|
|
|
|
|
|
|
|
|||||||||||||||||||||||
See accompanying notes to consolidated financial statements.
34
Table of Contents
HopFed Bancorp, Inc. and Subsidiaries
Consolidated Statements of Cash Flows
For the Years ended December 31, 2015, 2014 and 2013
(Dollars in Thousands)
| 2015 | 2014 | 2013 | ||||||||||
| Cash flows from operating activities: |
||||||||||||
| Net income |
$ | 2,404 | 2,199 | 3,762 | ||||||||
| Adjustments to reconcile net income to net cash provided by operating activities: |
||||||||||||
| Provision for loan losses |
1,051 | (2,273 | ) | 1,604 | ||||||||
| Depreciation |
1,266 | 1,336 | 1,502 | |||||||||
| Amortization of intangible assets |
33 | 97 | 162 | |||||||||
| Amortization of investment premiums and discounts, net |
1,650 | 2,076 | 2,561 | |||||||||
| Other than temporary impairment charge (recovery) on available for sale securities |
(17 | ) | — | 400 | ||||||||
| Expense (benefit) for deferred income taxes |
177 | (231 | ) | 566 | ||||||||
| Stock compensation expense |
138 | 164 | 115 | |||||||||
| Income from bank owned life insurance |
(335 | ) | (307 | ) | (354 | ) | ||||||
| Gain on sale of securities available for sale |
(691 | ) | (578 | ) | (1,661 | ) | ||||||
| Gain on sales of loans |
(1,175 | ) | (719 | ) | (634 | ) | ||||||
| Loss on sale of commercial real estate loan |
— | 1,781 | — | |||||||||
| Loss on sale of premises and equipment |
1 | 25 | 12 | |||||||||
| Proceeds from sales of loans |
43,847 | 37,300 | 17,577 | |||||||||
| Loss on sale of foreclosed assets |
716 | 208 | 140 | |||||||||
| Originations of loans sold |
(44,020 | ) | (32,835 | ) | (16,943 | ) | ||||||
| (Increase) decrease in: |
||||||||||||
| Accrued interest receivable |
437 | 657 | 165 | |||||||||
| Other assets (increase) |
21 | 1,513 | 171 | |||||||||
| Increase (decrease) in accrued expenses and other liabilities |
933 | (277 | ) | 170 | ||||||||
|
|
|
|
|
|
|
|||||||
| Net cash provided by operating activities |
6,436 | 10,136 | 9,315 | |||||||||
|
|
|
|
|
|
|
|||||||
| Cash flows from investing activities |
||||||||||||
| Proceeds from sales, calls and maturities of securities available for sale |
120,354 | 112,235 | 124,471 | |||||||||
| Purchase of securities available for sale |
(56,875 | ) | (91,257 | ) | (105,605 | ) | ||||||
| Net (increase) decrease in loans |
(19,005 | ) | (1,908 | ) | (21,630 | ) | ||||||
| Proceeds from sale of foreclosed assets |
344 | 1,118 | 908 | |||||||||
| Purchase of premises and equipment |
(2,361 | ) | (1,168 | ) | (2,473 | ) | ||||||
|
|
|
|
|
|
|
|||||||
| Net cash provided by (used in) investing activities |
42,457 | 19,020 | (4,329 | ) | ||||||||
|
|
|
|
|
|
|
|||||||
See accompanying notes to consolidated financial statements.
35
Table of Contents
HopFed Bancorp, Inc. and Subsidiaries
Consolidated Statements of Cash Flows, Continued
For the Years ended December 31, 2015, 2014 and 2013
(Dollars in Thousands)
| 2015 | 2014 | 2013 | ||||||||||
| Cash flows from financing activities: |
||||||||||||
| Net increase (decrease) in deposits |
$ | 8,098 | (31,689 | ) | 3,132 | |||||||
| Increase (decrease) in advance payments by borrowers for taxes and insurance |
101 | (8 | ) | 125 | ||||||||
| Advances from Federal Home Loan Bank |
41,000 | 57,000 | 23,000 | |||||||||
| Repayment of advances from Federal Home Loan Bank |
(60,000 | ) | (69,780 | ) | (19,961 | ) | ||||||
| Increase (decrease) in repurchase agreements |
(11,588 | ) | 4,599 | 9,251 | ||||||||
| Repurchase of common stock |
(11,926 | ) | (3,500 | ) | (853 | ) | ||||||
| Repurchase of common stock warrant |
— | — | (257 | ) | ||||||||
| Proceeds on repayment of ESOP loan |
704 | — | — | |||||||||
| Dividends paid on common stock |
(1,023 | ) | (1,187 | ) | (751 | ) | ||||||
|
|
|
|
|
|
|
|||||||
| Net cash provided by (used in) financing activities |
(34,634 | ) | (44,565 | ) | 13,686 | |||||||
|
|
|
|
|
|
|
|||||||
| Increase (decrease) in cash and cash equivalents |
14,259 | (15,409 | ) | 18,672 | ||||||||
| Cash and cash equivalents, beginning of period |
40,439 | 55,848 | 37,176 | |||||||||
|
|
|
|
|
|
|
|||||||
| Cash and cash equivalents, end of period |
$ | 54,698 | 40,439 | 55,848 | ||||||||
|
|
|
|
|
|
|
|||||||
| Supplemental disclosures of cash flow information: |
||||||||||||
| Interest paid |
$ | 6,587 | 8,977 | 10,840 | ||||||||
|
|
|
|
|
|
|
|||||||
| Income taxes paid (refund) |
($ | 900 | ) | (718 | ) | (487 | ) | |||||
|
|
|
|
|
|
|
|||||||
| Supplemental disclosures of non-cash investing and financing activities: |
||||||||||||
| Loans charged off |
$ | 1,867 | 1,232 | 4,444 | ||||||||
|
|
|
|
|
|
|
|||||||
| Loan transferred to held for sale |
$ | — | 6,987 | — | ||||||||
|
|
|
|
|
|
|
|||||||
| Foreclosures and in substance foreclosures of loans during year |
$ | 869 | 1,579 | 1,379 | ||||||||
|
|
|
|
|
|
|
|||||||
| Net unrealized gains (losses) on investment securities classified as available for sale |
($ | 2,030 | ) | 7,195 | (17,273 | ) | ||||||
|
|
|
|
|
|
|
|||||||
| Increase (decrease) in deferred tax asset related to unrealized gain (losses) on investments |
$ | 691 | (2,446 | ) | 5,873 | |||||||
|
|
|
|
|
|
|
|||||||
| Dividends declared and payable |
$ | 287 | 301 | 325 | ||||||||
|
|
|
|
|
|
|
|||||||
| Sale and financing of stock to ESOP |
$ | 7,884 | — | — | ||||||||
|
|
|
|
|
|
|
|||||||
| Issue of unearned restricted stock |
$ | 25 | 260 | 232 | ||||||||
|
|
|
|
|
|
|
|||||||
See accompanying notes to consolidated financial statements.
36
Table of Contents
HopFed Bancorp, Inc. and Subsidiaries
Notes to Consolidated Financial Statements
December 31, 2015, 2014 and 2013
| (1) | Summary of Significant Accounting Policies: |
Nature of Operations and Customer Concentration
HopFed Bancorp, Inc. (the Corporation) is a bank holding company incorporated in the state of Delaware and headquartered in Hopkinsville, Kentucky. The Corporation’s principal business activities are conducted through its wholly-owned subsidiary, Heritage Bank USA, Inc. (the Bank), a Kentucky state chartered commercial bank engaged in the business of accepting deposits and providing mortgage, consumer, construction and commercial loans to the general public through its retail banking offices. The Bank’s business activities are primarily limited to western Kentucky and middle and western Tennessee. The Bank is subject to competition from other financial institutions. Deposits at the Bank are insured up to the applicable limits by the Federal Deposit Insurance Corporation (FDIC).
As part of the enactment of the Dodd-Frank Financial Reform Act of 2010, the Corporation and Bank’s former regulator, the Office of Thrift Supervision, was eliminated on July 21, 2011. Prior to June 5, 2013, the Bank was subject to comprehensive regulation, examination and supervision by the Office of Comptroller of the Currency (OCC) and the FDIC. After June 5, 2013, the Bank’s legal name was changed to Heritage Bank USA, Inc. and the Bank was granted a Kentucky commercial bank charter and is now supervised by the Kentucky Department of Financial Institutions (“KDFI”) and the Federal Deposit Insurance Corporation (“FDIC”). Supervision of the Corporation continues to be conducted by the Federal Reserve Bank of Saint Louis (“FED”).
A substantial portion of the Bank’s loans are secured by real estate in the western Kentucky and middle and west Tennessee markets. In addition, foreclosed real estate is located in this same market. Accordingly, the ultimate ability to collect on a substantial portion of the Bank’s loan portfolio and the recovery of a substantial portion of the carrying amount of foreclosed real estate is susceptible to changes in local market conditions.
Principles of Consolidation
The consolidated financial statements include the accounts of the Corporation and the Bank (collectively the Company) for all periods. Significant inter-company balances and transactions have been eliminated in consolidation.
Accounting
The accounting and reporting policies of the Company are in accordance with accounting principles generally accepted in the United States of America and conform to general practices in the banking industry.
37
Table of Contents
HopFed Bancorp, Inc. and Subsidiaries
Notes to Consolidated Financial Statements, Continued
December 31, 2015, 2014 and 2013
| (1) | Summary of Significant Accounting Policies: (Continued) |
Accounting, (Continued)
The Company determines whether it has a controlling financial interest in an entity by first evaluating whether the entity is a voting interest entity or a variable interest entity (VIE) under accounting principles generally accepted in the United States. Voting interest entities in which the total equity investment is a risk is sufficient to enable the entity to finance itself independently and provides the equity holders with the obligation to absorb losses, the right to receive residual returns and the right to make decision about the entity’s activities. The Company consolidates voting interest entities in which it has all, or at least a majority of, the voting interest. As defined in applicable accounting standards, VIE’s are entities in which it has all, or at least a majority of, the voting interest. A controlling financial interest in a VIE is present when an enterprise has both the power to direct the activities of the VIE that most significantly impact the VIE’s economic performance and an obligation to absorb losses or the right to receive benefits that could potentially be significant to the VIE. The subsidiaries, HopFed Capital Trust I and Fort Webb LP, LLC are VIEs for which the Company is not the primary beneficiary. Accordingly, these accounts are not included in the Company’s consolidated financial statements.
The Company has evaluated subsequent events for potential impact and disclosure through the issue date of these consolidated financial statements.
Estimates
In preparing the consolidated financial statements, management is required to make estimates and assumptions that affect the reported amounts of assets and liabilities as of the date of the consolidated balance sheets and revenues and expenses for each year. Actual results could differ significantly from those estimates. Material estimates that are particularly susceptible to significant change relate to the determination of the allowance for loan losses and the valuation of real estate acquired in connection with foreclosures or in satisfaction of loans. In connection with the determination of the allowances for loan losses and foreclosed real estate, management obtains independent appraisals for significant collateral.
Cash and Cash Equivalents
Cash and cash equivalents are defined as cash on hand, amounts due on demand from commercial banks, interest-earning deposits in other financial institutions and federal funds sold with maturities of three months or less. The Company is required to maintain reserve funds in either cash on hand or on deposit with the Federal Reserve Bank. At December 31, 2015, the Company’s reserve requirement was met to available cash on hand.
38
Table of Contents
HopFed Bancorp, Inc. and Subsidiaries
Notes to Consolidated Financial Statements, Continued
December 31, 2015, 2014 and 2013
| (1) | Summary of Significant Accounting Policies: (Continued) |
Securities
The Company reports debt, readily-marketable equity, mortgage-backed and mortgage related securities in one of the following categories: (i) “trading” (held for current resale) which are to be reported at fair value, with unrealized gains and losses included in earnings; and (ii) “available for sale” (all other debt, equity, mortgage-backed and mortgage related securities) which are to be reported at fair value, with unrealized gains and losses reported net of tax as a separate component of stockholders’ equity. At the time of new security purchases, a determination is made as to the appropriate classification. Realized and unrealized gains and losses on trading securities are included in net income. Unrealized gains and losses on securities available for sale are recognized as direct increases or decreases in stockholders’ equity, net of any tax effect. Cost of securities sold is recognized using the specific identification method. Interest income on securities is recognized as earned. The Company purchases many agency bonds at either a premium or discount to its par value. Premiums and discounts on agency bonds are amortized using the net interest method. For callable bonds purchased at a premium, the premium is amortized to the first call date. If the bond is not called on that date, the premium is fully amortized and the Company recognizes an increase in the net yield of the investment. The Company has determined that callable bonds purchased at a premium have a high likelihood of being called, and the decision to amortize premiums to their first call is a more conservative method of recognizing income and any variance from amortizing to contractual maturity is not material to the consolidated financial statements. For agency bonds purchased at a discount, the discount is accreted to the final maturity date. For callable bonds purchased at discount and called before maturity, the Company recognizes a gain on the sale of securities. The Company amortizes premiums and accretes discounts on mortgage back securities and collateralized mortgage obligations based on the securities three month average prepayment speed.
Other Than Temporary Impairment
A decline in the fair value of any available-for-sale security below cost that is deemed to be other-than-temporary results in a reduction in the carrying amount to fair value. To determine whether impairment is other-than-temporary, management considers whether the entity expects to recover the entire amortized cost basis of the security by reviewing the present value of the future cash flows associated with the security. The shortfall of the present value of the cash flows expected to be collected in relation to the amortized cost basis is referred to as a credit loss. If a credit loss is identified, management then considers whether it is more-likely-than-not that the Company will be required to sell the security prior to recovery. If management concludes that it is not more-likely-than-not that it will be required to sell the security, then the security is not other-than-temporarily impaired and the shortfall is recorded as a component of equity. If the security is determined to be other-than-temporarily impaired, the credit loss is recognized as a charge to earnings and a new cost basis for the security is established.
Other Securities
Other securities which are not actively traded and may be restricted, such as Federal Home Loan Bank (FHLB) stock are recognized at cost, as the value is not considered impaired.
39
Table of Contents
HopFed Bancorp, Inc. and Subsidiaries
Notes to Consolidated Financial Statements, Continued
December 31, 2015, 2014 and 2013
| (1) | Summary of Significant Accounting Policies: (Continued) |
Loans Receivable
Loans receivable are stated at unpaid principal balances, less the allowance for loan losses and deferred loan cost. The Statement of Financial Accounting Standards ASC 310-20, Nonrefundable Fees and Other Costs Associated with Originating or Acquiring Loans and Initial Direct Costs of Leases, requires the recognition of loan origination fee income over the life of the loan and the recognition of certain direct loan origination costs over the life of the loan. Uncollectible interest on loans that are contractually past due is charged off, or an allowance is established based on management’s periodic evaluation. The Company charges off loans after, in management’s opinion, the collection of all or a large portion of the principal or interest is not collectable. The allowance is established by a charge to interest income equal to all interest previously accrued, and income is subsequently recognized only to the extent that cash payments are received while the loan is classified as non-accrual, when the loan is ninety days past due. Loans may be returned to accrual status when all principal and interest amounts contractually due (including arrearages) are reasonably assured of repayment within an acceptable period of time, and there is a sustained period of repayment performance by the borrower in accordance with the contractual terms of interest and principal.
The Company provides an allowance for loan losses and includes in operating expenses a provision for loan losses determined by management. Management’s periodic evaluation of the adequacy of the allowance is based on the Company’s past loan loss experience, known and inherent risks in the portfolio, adverse situations that may affect the borrower’s ability to repay, the estimated value of any underlying collateral, and current economic conditions. Management’s estimate of the adequacy of the allowance for loan loss can be classified as either a reserve for currently classified loans or estimates of future losses in the current loan portfolio.
Loans are considered to be impaired when, in management’s judgment, principal or interest is not collectible according to the contractual terms of the loan agreement. When conducting loan evaluations, management considers various factors such as historical loan performance, the financial condition of the borrower and adequacy of collateral to determine if a loan is impaired. Impaired loans and loans classified as Troubled Debt Restructurings (“TDR’s”) may be classified as either substandard or doubtful and reserved for based on individual loans risk for loss. Loans not considered impaired may be classified as either special mention or watch and may have an allowance established for it. Typically, unimpaired classified loans exhibit some form of weakness in either industry trends, collateral, or cash flow that result in a default risk greater than that of the Company’s typical loan. All classified amounts include all unpaid interest and fees as well as the principal balance outstanding.
40
Table of Contents
HopFed Bancorp, Inc. and Subsidiaries
Notes to Consolidated Financial Statements, Continued
December 31, 2015, 2014 and 2013
| (1) | Summary of Significant Accounting Policies: (Continued) |
Loans Receivable (Continued)
The measurement of impaired loans generally may be based on the present value of future cash flows discounted at the historical effective interest rate. However, the majority of the Company’s problem loans become collateral dependent at the time they are judged to be impaired. Therefore, the measurement of impaired requires the Company to obtain a new appraisal to obtain the fair value of the collateral. The appraised value is then discounted to an estimated of the Company’s net realizable value, reducing the appraised value by the amount of holding and selling cost. When the measured amount of an impaired loan is less than the recorded investment in the loan, the impairment is recorded as a charge to income and a valuation allowance, which is included as a component of the allowance for loan losses. For loans not individually evaluated, management considers the Company’s recent charge off history, the Company’s current past due and non-accrual trends, banking industry trends and both local and national economic conditions when making an estimate as to the amount to reserve for losses. Management believes it has established the allowance in accordance with accounting principles generally accepted in the United States of America and has taken into account the views of its regulators and the current economic environment.
Loans held for sale
Mortgage loans originated and intended for sale are carried at the lower of cost or estimated fair value as determined on a loan-by-loan basis. Net unrealized losses, if any, are recognized through a valuation allowance by charges to income. Realized gains and losses are recognized when legal title to the loans has been transferred to the purchaser and sales proceeds have been received and are reflected in the accompanying consolidated statement of operations in gains on mortgage loans sold, net of related costs such as compensation expenses. The Company does not securitize mortgage loans and maintains a very small percentage of servicing on loans sold.
Fixed Rate Mortgage Originations
The Company operates a mortgage division that originates mortgage loans in the name of assorted investors, including Federal Home Loan Mortgage Corporation (Freddie Mac). Originations for Freddie Mac are sold through the Bank while originations to other investors are processed for a fee. On a limited basis, loans sold to Freddie Mac may result in the Bank retaining loan servicing rights. In recent years, customers have chosen lower origination rates over having their loan locally serviced; thereby limiting the amount of new loans sold with servicing retained. At December 31, 2015, the Bank maintained a servicing portfolio of one to four family real estate loans of approximately $22.8 million. For the years ended December 31, 2015, December 31, 2014, and December 31, 2013, the Bank has reviewed the value of the servicing asset as well as the operational cost associated with servicing the portfolio. The Bank has determined that the values of its servicing rights are not material to the Company’s consolidated financial statements.
Real Estate and Other Assets Owned
Assets acquired through, or in lieu of, loan foreclosure or repossession carried at the lower of cost or fair value less selling expenses. Costs of improving the assets are capitalized, whereas costs relating to holding the property are expensed. Management conducts periodic valuations (no less than annually) and any adjustments to value are recognized in the current period’s operations.
41
Table of Contents
HopFed Bancorp, Inc. and Subsidiaries
Notes to Consolidated Financial Statements, Continued
December 31, 2015, 2014 and 2013
| (1) | Summary of Significant Accounting Policies: (Continued) |
Brokered Deposits
The Company may choose to attract deposits from several sources, including using outside brokers to assist in obtaining time deposits using national distribution channels. Brokered deposits offer the Company an alternative to Federal Home Loan Bank advances and local retail time deposits
Repurchase Agreements
The Company sells investments from its portfolio to business and municipal customers with a written agreement to repurchase those investments on the next business day. The repurchase product gives business customers the opportunity to earn income on liquid cash reserves. These funds are overnight borrowings of the Company secured by Company assets and are not FDIC insured.
Treasury Stock
The Company may occasional purchase its own common stock either in open market transactions or privately negotiated transactions. The value of the Company’s common stock held in treasury is listed at cost.
Unearned ESOP Shares
The Company offers an Employee Stock Ownership Plan (“ESOP”) to the employees of the Company. The unearned portion of common stock of the Company held in the ESOP Trust is recorded on the balance sheet at cost. Common stock is released from the ESOP Trust to the Company’s employees as the Bank makes payments on the loan to the Corporation on behalf of the ESOP Trust.
Comprehensive Income
Comprehensive income consists of net income and other comprehensive income, net of applicable income taxes. Other comprehensive income includes unrealized appreciation (depreciation) on available-for-sale securities and unrealized appreciation (depreciation) on available-for-sale securities for which a portion of an other than temporary impairment has been recognized in income.
Revenue Recognition
Mortgage loans held for sale are generally delivered to secondary market investors under best efforts sales commitments entered into prior to the closing of the individual loan. Loan sales and related gains or losses are recognized at settlement. Loan fees earned for the servicing of secondary market loans are recognized as earned.
42
Table of Contents
HopFed Bancorp, Inc. and Subsidiaries
Notes to Consolidated Financial Statements, Continued
December 31, 2015, 2014 and 2013
| (1) | Summary of Significant Accounting Policies: (Continued) |
Revenue Recognition (Continued)
Interest income on loans receivable is reported on the interest method. Interest income is not reported when full loan repayment is in doubt, typically when the loan is impaired, placed in non-accrual status, or payments are past due more than 90 days. Interest earned as reported as income is reversed on any loans classified as non-accrual or past due more than 90 days. Interest may continue to accrue on loans over 90 days past due if they are well secured and in the process of collection.
Income Taxes
Income taxes are accounted for through the use of the asset and liability method. Under the asset and liability method, deferred taxes are recognized for the tax consequences of temporary differences by applying enacted statutory rates applicable to future years to differences between the financial statement carrying amounts and the tax bases of existing assets and liabilities. The effect on deferred taxes of a change in tax rates would be recognized in income in the period that includes the enactment date. The Company files its federal and Kentucky income tax returns as well as its Kentucky and Tennessee franchise and excise tax returns on a consolidated basis with its subsidiaries. All taxes are accrued on a separate entity basis.
Operating Segments
The Company’s continuing operations include one primary segment, retail banking. The retail banking segment involves the origination of commercial, residential and consumer loans as well as the collections of deposits in eighteen branch offices.
Premises and Equipment
Land, land improvements, buildings, and furniture and equipment are carried at cost, less accumulated depreciation and amortization. Buildings and land improvements are depreciated generally by the straight-line method, and furniture and equipment are depreciated under various methods over the estimated useful lives of the assets. The Company capitalizes interest expense on construction in process at a rate equal to the Company’s cost of funds. The estimated useful lives used to compute depreciation are as follows:
| Land improvements |
5-15 years | |||
| Buildings |
40 years | |||
| Furniture and equipment |
5-15 years |
Intangible Assets
The core deposit intangible asset related to the middle Tennessee acquisition of June 2006 is amortized using the sum of the year’s digits method over an estimated period of nine years. At December 31, 2015, the core deposit intangible was fully amortized.
Bank Owned Life Insurance
Bank owned life insurance policies (BOLI) are recorded at the cash surrender value or the amount to be realized upon current redemption. The realization of the redemption value is evaluated for each insuring entity that holds insurance contracts annually by management.
43
Table of Contents
HopFed Bancorp, Inc. and Subsidiaries
Notes to Consolidated Financial Statements, Continued
December 31, 2015, 2014 and 2013
| (1) | Summary of Significant Accounting Policies: (Continued) |
Advertising
The Company expenses the production cost of advertising as incurred.
Financial Instruments
The Company has entered into off-balance-sheet financial instruments consisting of commitments to extend credit and commercial letters of credit. Such financial instruments are recorded in the consolidated financial statements when they are funded or related fees are incurred or received.
Derivative Instruments
Under guidelines ASC 815, Accounting for Derivative Instruments and Hedging Activities, as amended, all derivative instruments are required to be carried at fair value on the consolidated balance sheet. ASC 815 provides special hedge accounting provisions, which permit the change in fair value of the hedge item related to the risk being hedged to be recognized in earnings in the same period and in the same income statement line as the change in the fair value of the derivative.
A derivative instrument designated in a hedge relationship to mitigate exposure to changes in the fair value of an asset, liability or firm commitment attributable to a particular risk, such as interest rate risk, are considered fair value hedges under ASC 815. Derivative instruments designated in a hedge relationship to mitigate exposure to variability in expected future cash flows, or other types of forecasted transactions, are considered cash flow hedges. Cash value hedges are accounted for by recording the fair value of the derivative instrument and the fair value related to the risk being hedged of the hedged asset or liability on the consolidated balance sheet with corresponding offsets recorded in the consolidated balance sheet. The adjustment to the hedged asset or liability is included in the basis of the hedged item, while the fair value of the derivative is recorded as a freestanding asset or liability. Actual cash receipts or payments and related amounts accrued during the period on derivatives included in a fair value hedge relationship are recorded as adjustments to the income or expense recorded on the hedged asset or liability.
Under both the fair value and cash flow hedge methods, derivative gains and losses not effective in hedging the change in fair value or expected cash flows of the hedged item are recognized immediately in the income statement. At the hedge’s inception and at least quarterly thereafter, a formal assessment is performed to determine whether changes in the fair values or cash flows of the derivative instrument has been highly effective in offsetting changes in the fair values or cash flows of the hedged items and whether they are expected to be highly effective in the future. If it is determined a derivative instrument has not been, or will not continue to be highly effective as a hedge, hedged accounting is discontinued. ASC 815 basis adjustments recorded on hedged assets and liabilities are amortized over the remaining life of the hedged item beginning no later than when hedge accounting ceases. There were no fair value hedging gains or losses, as a result of hedge ineffectiveness, recognized for the years ended December 31, 2015, December 31, 2014, and December 31, 2013, respectively.
44
Table of Contents
HopFed Bancorp, Inc. and Subsidiaries
Notes to Consolidated Financial Statements, Continued
December 31, 2015, 2014 and 2013
| (1) | Summary of Significant Accounting Policies: (Continued) |
Fair Values of Financial Instruments
ASC 825, Disclosures about Fair Value of Financial Instruments, requires disclosure of fair value information about financial instruments, whether or not recognized in the consolidated balance sheets for which it is practicable to estimate that value. In cases where quoted market prices are not available, fair values are based on estimates using present value or other valuation techniques. Those techniques are significantly affected by the assumptions used, including the discount rate and estimates of future cash flows. In that regard, the derived fair value estimates cannot be substantiated by comparison to independent markets and, in many cases, could not be realized in immediate settlement of the instruments. Fair value estimates are made at a point in time, based on relevant market information and information about the financial instrument. Accordingly, such estimates involve uncertainties and matters of judgment and therefore cannot be determined with precision. ASC 825 excludes certain financial instruments and all non-financial instruments from its disclosure requirements. Accordingly, the aggregate fair value amounts presented do not represent the underlying value of the Company.
The following are the more significant methods and assumptions used by the Company in estimating its fair value disclosures for financial instruments:
Cash and cash equivalents
The carrying amounts reported in the consolidated balance sheets for cash and cash equivalents approximate those assets’ fair values, because they mature within 90 days or less and do not present credit risk concerns.
Interest earning deposits
The carrying amounts reported in the consolidated balance sheets for interest earning deposits approximate those assets’ fair values, because they are considered overnight deposits and may be withdrawn at any time without penalty and do not present credit risk concerns.
Available-for-sale securities
Fair values for investment securities available-for-sale are based on quoted market prices, where available. If quoted market prices are not available, fair values are based on quoted market prices of comparable instruments provided by a third party pricing service. The Company reviews all securities in which the book value is greater than the market value for impairment that is other than temporary. For securities deemed to be other than temporarily impaired, the Company reduces the book value of the security to its market value by recognizing an impairment charge on its income statement.
Loans held for sale
Mortgage loans originated and intended to be sold are carried at the lower of cost or estimated fair value as determined on a loan by loan basis. Gains or losses are recognized at the time of ownership transfer. Net unrealized losses, if any, are recognized through a valuation allowance and charged to income.
45
Table of Contents
HopFed Bancorp, Inc. and Subsidiaries
Notes to Consolidated Financial Statements, Continued
December 31, 2015, 2014 and 2013
| (1) | Summary of Significant Accounting Policies: (Continued) |
Fair Values of Financial Instruments, (Continued)
Loans receivable
The fair values for of fixed-rate loans and variable rate loans that re-price on an infrequent basis is estimated using discounted cash flow analysis which considers future re-pricing dates and estimated repayment dates, and further using interest rates currently being offered for loans of similar type, terms to borrowers of similar credit quality. Loan fair value estimates include judgments regarding future expected loss experience and risk characteristics. The estimated fair value of variable-rate loans that re-price frequently and with have no significant change in credit risk is approximately the carrying value of the loan.
Letters of credit
The fair value of standby letters of credit is estimated using the fees currently charged to enter into similar agreements, taking into account the remaining terms of the agreements, the likelihood of the counter parties drawing on such financial instruments and the present creditworthiness of such counter parties. Such commitments have been made on terms which are competitive in the markets in which the Company operates, thus, the fair value of standby letters of credit equals the carrying value for the purposes of this disclosure.
Accrued interest receivable
Fair value is estimated to approximate the carrying amount because such amounts are expected to be received within 90 days or less and any credit concerns have been previously considered in the carrying value.
Repurchase agreements
Overnight repurchase agreements have a fair value at book, given that they mature overnight. The fair values for of longer date repurchase agreements is estimated using discounted cash flow analysis which considers the current market pricing for repurchase agreements of similar final maturities and collateral requirements.
Bank owned life insurance
The fair value of bank owned life insurance is the cash surrender value of the policy less redemption charges. By surrendering the policy, the Company is also subject to federal income taxes on all earnings previously recognized.
Deposits
The fair values disclosed for deposits with no stated maturity such as demand deposits, interest-bearing checking accounts and savings accounts are, by definition, equal to the amount payable on demand at the reporting date (that is, their carrying amounts). The fair values for certificates of deposit and other fixed maturity time deposits are estimated using a discounted cash flow calculation that applies interest rates currently being offered on such type accounts or similar accounts to a schedule of aggregated contractual maturities or similar maturities on such time deposits.
46
Table of Contents
HopFed Bancorp, Inc. and Subsidiaries
Notes to Consolidated Financial Statements, Continued
December 31, 2015, 2014 and 2013
| (1) | Summary of Significant Accounting Policies: (Continued) |
Fair Values of Financial Instruments, (Continued)
Advances from the Federal Home Loan Bank (FHLB)
The fair value of these advances is estimated by discounting the future cash flows of these advances using the current rates at which similar advances or similar financial instruments could be obtained.
FHLB stock
The fair value of FHLB stock is recognized at cost.
Subordinated debentures
The book value of subordinated debentures is cost. The subordinated debentures re-price quarterly at a rate equal to three month libor plus 3.10%.
Treasury Stock
The book value of treasury stock is cost and includes acquisition fees, if any.
Unearned ESOP Shares
The book value of unearned ESOP shares is cost.
Off-Balance-Sheet Instruments
Off-balance-sheet lending commitments approximate their fair values due to the short period of time before the commitment expires.
Dividend Restrictions
The Company is not permitted to pay a dividend to common shareholders if it fails to make a quarterly interest payment to the holders of the Company’s subordinated debentures. Furthermore, the Bank may be restricted in the payment of dividends to the Corporation by the KDFI or FDIC. Any restrictions imposed by either regulator would effectively limit the Company’s ability to pay a dividend to its common stockholders as discussed in Note 17. At December 31, 2015, there were no such restrictions. At December 31, 2015, the Corporation has approximately $2.1 million in cash on hand available to pay common dividends and repurchase treasury stock as outlined in Note 20. At December 31, 2015, the Bank may not pay an additional cash dividend to the Company without regulatory approval.
Earnings Per Share
Earnings per share (EPS) consists of two separate components, basic EPS and diluted EPS. Basic EPS is computed by dividing net income available to common shareholders by the weighted average number of common shares outstanding for each period presented. Diluted EPS is calculated by dividing net income available to common shareholders by the weighted average number of common shares outstanding plus dilutive common stock equivalents (CSE). CSE consists of dilutive stock options granted through the Company’s stock option plan. Restricted stock awards represent future compensation expense and are dilutive. Common stock equivalents which are considered anti-dilutive are not included for the purposes of this calculation. Common stock warrants issued in December 2008 and all stock options outstanding are currently anti-dilutive and are not included for the purposes of this calculation.
47
Table of Contents
HopFed Bancorp, Inc. and Subsidiaries
Notes to Consolidated Financial Statements, Continued
December 31, 2015, 2014 and 2013
| (1) | Summary of Significant Accounting Policies: (Continued) |
Fair Values of Financial Instruments, (Continued)
Stock Compensation
The Company utilized the Black-Sholes valuation model to determine the fair value of stock options on the date of grant. The model derives the fair value of stock options based on certain assumptions related to the expected stock prices volatility, expected option life, risk-free rate of return and the dividend yield of the stock. The expected life of options granted is estimated based on historical employee exercise behavior. The risk free rate of return coincides with the expected life of the options and is based on the ten year Treasury note rate at the time the options are issued. The historical volatility levels of the Company’s common stock are used to estimate the expected stock price volatility. The set dividend yield is used to estimate the expected dividend yield of the stock.
Effect of New Accounting Pronouncements
ASU 2015-01, “Income Statement - Extraordinary and Unusual Items (Subtopic 225-20) – Simplifying Income Statement Presentation by Eliminating the Concept of Extraordinary Items.” ASU 2015-01 eliminates from U.S. GAAP the concept of extraordinary items, which, among other things, required an entity to segregate extraordinary items considered to be unusual and infrequent from the results of ordinary operations and show the item separately in the income statement, net of tax, after income from continuing operations. ASU 2015-01 is effective for the Company beginning January 1, 2016, though early adoption is permitted. The Company does not anticipate that the implementation of ASU 2015-01 will have a significant impact on the Company’s Consolidated Financial Statements.
ASU No. 2015-02, “Amendments to the Consolidation Analysis.”This ASU affects reporting entities that are required to evaluate whether they should consolidate certain legal entities. Specifically, the amendments: (1) Modify the evaluation of whether limited partnerships and similar legal entities are variable interest entities (“VIEs”) or voting interest entities; (2) Eliminate the presumption that a general partner should consolidate a limited partnership; (3) Affect the consolidation analysis of reporting entities that are involved with VIEs, particularly those that have fee arrangements and related party relationships; and (4) Provide a scope exception from consolidation guidance for reporting entities with interests in legal entities that are required to comply with or operate in accordance with requirements that are similar to those in Rule 2a-7 of the Investment Company Act of 1940 for registered money market funds. ASU No. 2015-02 is effective for interim and annual reporting periods beginning after December 15, 2015. The Company does not anticipate that the provisions of ASU No. 2015-02 will have a material impact on the Company’s Consolidated Financial Statements.
48
Table of Contents
HopFed Bancorp, Inc. and Subsidiaries
Notes to Consolidated Financial Statements, Continued
December 31, 2015, 2014 and 2013
| (1) | Summary of Significant Accounting Policies: (Continued) |
Effect of New Accounting Pronouncements (Continued
In May 2014, the FASB issued new guidance related to Revenue from Contracts with Customers. This guidance supersedes the revenue recognition requirements in Accounting Standards Codification Topic 605, Revenue Recognition, and most industry-specific guidance throughout the Accounting Standards Codification. The guidance requires an entity to recognize revenue to depict the transfer of promised goods or services to customers in an amount that reflects the consideration to which the company expects to be entitled in exchange for those goods or services. This guidance is effective for interim and annual reporting periods beginning after December 15, 2016; however, the FASB has agreed to a one year deferral of the effective date to December 15, 2017. The Company is currently evaluating this guidance to determine the impact on its consolidated financial statements.
On June 12, 2014, the FASB issued ASU 2014-11, which makes limited amendments to the guidance in ASC 860 on accounting for certain repurchase agreements (“repos”). ASU 2014-11 requires entities to account for repurchase-to-maturity transactions as secured borrowings (rather than as sales with forward repurchase agreements), (2) eliminates accounting guidance on linked repurchase financing transactions, and (3) expands disclosure requirements related to certain transfers of financial assets that are accounted for as sales and certain transfers (specifically, repos, securities lending transactions, and repurchase-to-maturity transactions) accounted for as secured borrowings. ASU 2014-11 also amends ASC 860 to clarify that repos and securities lending transactions that do not meet all of the de-recognition criteria in ASC 860-10-40-5 should be accounted for as secured borrowings. In addition, the ASU provides examples of repurchase and securities lending arrangements that illustrate whether a transferor has maintained effective control over the transferred financial assets. For public business entities, the accounting changes were effective beginning after January 1, 2015. The implementation of ASU 2014-11 did not have a material impact on the Company’s Consolidated Financial Statements.
In September 2015, the FASB issued Accounting Standards Update No. 2015-16, Simplifying the Accounting for Measurement-Period Adjustments. The guidance in this update eliminates the requirement to restate prior period financial statements for measurement period adjustments. The new guidance requires that the cumulative impact of a measurement period adjustment (including the impact on prior periods) be recognized in the reporting period in which the adjustment is identified. The new guidance is intended to reduce complexity in financial reporting. The elimination of the restatement requirement should simplify financial reporting for many entities. However, recognizing the entire impact of a measurement period adjustment in a single reporting period may introduce earnings volatility and reduce comparability between periods when the adjustments are material. The accounting changes in this update are effective for public companies for annual periods, and the interim periods within those annual periods, beginning after December 15, 2015. Early application is permitted for financial statements that have not been issued. The Company does not anticipate that the implementation of ASU 2015-16 will have a material impact on the Company’s Consolidated Financial Statements.
49
Table of Contents
HopFed Bancorp, Inc. and Subsidiaries
Notes to Consolidated Financial Statements, Continued
December 31, 2015, 2014 and 2013
| (1) | Summary of Significant Accounting Policies: (Continued) |
Effect of New Accounting Pronouncements (Continued)
In January 2014, the FASB issued ASU No. 2014-04, Receivables-Troubled Debt Restructurings by Creditors (Subtopic 310-40): Reclassification of Residential Real Estate Collateralized Consumer Mortgage Loans upon Foreclosure. These amendments are intended to clarify when a creditor should be considered to have received physical possession of residential real estate property collateralizing a consumer mortgage loan such that the loan should be derecognized and the real estate recognized. The amendments clarify that an in substance repossession or foreclosure occurs, and a creditor is considered to have received physical possession of residential real estate property collateralizing a consumer mortgage loan, upon either: (1) the creditor obtaining legal title to the residential real estate property upon completion of residential foreclosure, or (2) the borrower conveying all interest in the residential real estate property to the creditor to satisfy that loan through completion of a deed in lieu of foreclosure or through a similar legal agreement. Additional disclosures about such activities are required by these amendments. The amendments in this ASU became effective for public companies for annual periods and interim periods within those annual periods beginning after December 15, 2014. The Company’s implementation of ASU 2014-04 did not have a material impact on the Company’s Consolidated Financial Statements.
ASU 2015-02, “Consolidation (Topic 810) – Amendments to the Consolidation Analysis.” ASU 2015-02 implements changes to both the variable interest consolidation model and the voting interest consolidation model. ASU 2015-02 (i) eliminates certain criteria that must be met when determining when fees paid to a decision maker or service provider do not represent a variable interest, (ii) amends the criteria for determining whether a limited partnership is a variable interest entity and (iii) eliminates the presumption that a general partner controls a limited partnership in the voting model. ASU 2015-02 will be effective on January 1, 2016 and is not expected to have a significant impact on the Company’s financial statements.
ASU 2015-03, “Interest – Imputation of Interest (Subtopic 835-30) – Simplifying the Presentation of Debt Issuance Costs.” ASU 2015-03 requires that debt issuance costs related to a recognized debt liability be presented in the balance sheet as a direct deduction from the carrying amount of that debt liability, consistent with debt discounts. The recognition and measurement guidance for debt issuance costs are not affected by the amendments in ASU 2015-03. ASU 2015-03 will be effective on January 1, 2016, though early adoption is permitted. ASU 2015-03 is not expected to have a significant impact on the Company’s financial statements.
50
Table of Contents
HopFed Bancorp, Inc. and Subsidiaries
Notes to Consolidated Financial Statements, Continued
December 31, 2015, 2014 and 2013
| (1) | Summary of Significant Accounting Policies: (Continued) |
Effect of New Accounting Pronouncements (Continued)
ASU 2015-15, “Interest – Imputation of Interest (Subtopic 835-30) – Presentation and Subsequent Measurement of Debt Issuance Costs Associated with Line-of-Credit Arrangements. Amendments to SEC Paragraphs Pursuant to Staff Announcement at June 18, 2015 EITF Meeting.” ASU 2015-15 adds SEC paragraphs pursuant to an SEC Staff Announcement that given the absence of authoritative guidance within ASU 2015-03 for debt issuance costs related to line-of-credit arrangements, the SEC staff would not object to an entity deferring and presenting debt issuance costs as an asset and subsequently amortizing the deferred debt issuance costs ratably over the term of the line-of-credit arrangement, regardless of whether there are any outstanding borrowings on the line-of-credit arrangement. ASU 2015-15 is not expected to have a significant impact on the Company’s financial statements.
ASU 2016-1, “No. 2016-01, Financial Instruments – Overall (Subtopic 825-10): Recognition and Measurement of Financial Assets and Financial Liabilities. ASU 2016-1, among other things, (i) requires equity investments, with certain exceptions, to be measured at fair value with changes in fair value recognized in net income, (ii) simplifies the impairment assessment of equity investments without readily determinable fair values by requiring a qualitative assessment to identify impairment, (iii) eliminates the requirement for public business entities to disclose the methods and significant assumptions used to estimate the fair value that is required to be disclosed for financial instruments measured at amortized cost on the balance sheet, (iv) requires public business entities to use the exit price notion when measuring the fair value of financial instruments for disclosure purposes, (v) requires an entity to present separately in other comprehensive income the portion of the total change in the fair value of a liability resulting from a change in the instrument-specific credit risk when the entity has elected to measure the liability at fair value in accordance with the fair value option for financial instruments, (vi) requires separate presentation of financial assets and financial liabilities by measurement category and form of financial asset on the balance sheet or the accompanying notes to the financial statements and (viii) clarifies that an entity should evaluate the need for a valuation allowance on a deferred tax asset related to available-for-sale. ASU 2016-1 will be effective on January 1, 2018, and is not expected to have a significant impact on the Company’s financial statements.
51
Table of Contents
HopFed Bancorp, Inc. and Subsidiaries
Notes to Consolidated Financial Statements, Continued
December 31, 2015, 2014 and 2013
| (1) | Summary of Significant Accounting Policies: (Continued) |
Effect of New Accounting Pronouncements (Continued)
ASU 2015-05, “Intangibles – Goodwill and Other—Internal-Use Software (Subtopic 350-40) – Customer’s Accounting for Fees Paid in a Cloud Computing Arrangement.” ASU 2015-05 addresses accounting for fees paid by a customer in cloud computing arrangements such as (i) software as a service, (ii) platform as a service, (iii) infrastructure as a service and (iv) other similar hosting arrangements. ASU 2015-05 provides guidance to customers about whether a cloud computing arrangement includes a software license. If a cloud computing arrangement includes a software license, then the customer should account for the software license element of the arrangement consistent with the acquisition of other software licenses. If a cloud computing arrangement does not include a software license, the customer should account for the arrangement as a service contract. ASU 2015-05 will be effective on January 1, 2016 and is not expected to have a significant impact on the Company’s financial statements.
Other accounting standards that have been issued or proposed by the FASB or other standards- bodies are not expected to have a material impact on the Company’s financial position, results of operations or cash flows.
Reclassifications
Certain items in prior financial statements have been reclassified to conform to the current presentation.
52
Table of Contents
HopFed Bancorp, Inc. and Subsidiaries
Notes to Consolidated Financial Statements, Continued
December 31, 2015, 2014 and 2013
(Table Amounts in Thousands)
| (2) | Securities: |
Securities, which consist of debt and equity investments, have been classified in the consolidated balance sheets according to management’s intent. The carrying amount of securities and their estimated fair values follow:
| December 31, 2015 | ||||||||||||||||
| Gross | Gross | Estimated | ||||||||||||||
| Amortized | Unrealized | Unrealized | Fair | |||||||||||||
| Cost | Gains | Losses | Value | |||||||||||||
| Restricted: |
||||||||||||||||
| FHLB stock |
$ | 4,428 | — | — | 4,428 | |||||||||||
|
|
|
|
|
|
|
|
|
|||||||||
| Available for Sale: |
||||||||||||||||
| U.S. Treasury securities |
$ | 2,001 | — | (1 | ) | 2,000 | ||||||||||
| U.S. Agency securities |
91,694 | 1,727 | (488 | ) | 92,933 | |||||||||||
| Tax free municipal bonds |
42,237 | 2,481 | (59 | ) | 44,659 | |||||||||||
| Taxable municipal bonds |
6,190 | 52 | (65 | ) | 6,177 | |||||||||||
| Trust preferred securities |
1,617 | 248 | — | 1,865 | ||||||||||||
| Mortgage-backed securities: |
||||||||||||||||
| GNMA |
29,990 | 239 | (239 | ) | 29,990 | |||||||||||
| FNMA |
28,189 | 266 | (152 | ) | 28,303 | |||||||||||
| FHLMC |
8,113 | 24 | (51 | ) | 8,086 | |||||||||||
| Non- Agency CMOs |
3,828 | — | (174 | ) | 3,654 | |||||||||||
| AGENCY CMOs |
19,570 | 71 | (131 | ) | 19,510 | |||||||||||
|
|
|
|
|
|
|
|
|
|||||||||
| $ | 233,429 | 5,108 | (1,360 | ) | 237,177 | |||||||||||
|
|
|
|
|
|
|
|
|
|||||||||
53
Table of Contents
HopFed Bancorp, Inc. and Subsidiaries
Notes to Consolidated Financial Statements, Continued
December 31, 2015, 2014 and 2013
(Table Amounts in Thousands)
| (2) | Securities: (Continued) |
| December 31, 2014 | ||||||||||||||||
| Gross | Gross | Estimated | ||||||||||||||
| Amortized | Unrealized | Unrealized | Fair | |||||||||||||
| Cost | Gains | Losses | Value | |||||||||||||
| Restricted: |
||||||||||||||||
| FHLB stock |
$ | 4,428 | — | — | 4,428 | |||||||||||
|
|
|
|
|
|
|
|
|
|||||||||
| Available for Sale: |
||||||||||||||||
| U.S. Treasury Securities |
3,977 | 3 | — | 3,980 | ||||||||||||
| U.S. Agency Securities |
$ | 105,631 | 2,128 | (527 | ) | 107,232 | ||||||||||
| Tax free municipal bonds |
57,399 | 3,814 | (166 | ) | 61,047 | |||||||||||
| Taxable municipal bonds |
11,871 | 235 | (63 | ) | 12,043 | |||||||||||
| Trust preferred securities |
1,600 | — | (111 | ) | 1,489 | |||||||||||
| Commercial bonds |
2,000 | 7 | — | 2,007 | ||||||||||||
| Mortgage-backed securities: |
||||||||||||||||
| GNMA |
27,535 | 670 | (122 | ) | 28,083 | |||||||||||
| FNMA |
50,617 | 694 | (536 | ) | 50,775 | |||||||||||
| FHLMC |
3,276 | 38 | — | 3,314 | ||||||||||||
| Non-Agency CMOs |
9,895 | — | (252 | ) | 9,643 | |||||||||||
| AGENCY CMOs |
28,024 | 176 | (205 | ) | 27,995 | |||||||||||
|
|
|
|
|
|
|
|
|
|||||||||
| $ | 297,848 | 7,762 | (1,982 | ) | 303,628 | |||||||||||
|
|
|
|
|
|
|
|
|
|||||||||
The scheduled maturities of debt securities available for sale at December 31, 2015, were as follows:
| Estimated | ||||||||
| Amortized | Fair | |||||||
| Cost | Value | |||||||
| Due within one year |
$ | — | — | |||||
| Due in one to five years |
17,939 | 18,304 | ||||||
| Due in five to ten years |
42,151 | 42,793 | ||||||
| Due after ten years |
22,702 | 24,088 | ||||||
|
|
|
|
|
|||||
| 82,792 | 85,185 | |||||||
| Amortizing agency bonds |
60,947 | 62,449 | ||||||
| Mortgage-backed securities |
89,690 | 89,543 | ||||||
|
|
|
|
|
|||||
| Total unrestricted securities available for sale |
$ | 233,429 | 237,177 | |||||
|
|
|
|
|
|||||
54
Table of Contents
HopFed Bancorp, Inc. and Subsidiaries
Notes to Consolidated Financial Statements, Continued
December 31, 2015, 2014 and 2013
(Table Amounts in Thousands)
| (2) | Securities: (Continued) |
The scheduled maturities of debt securities available for sale at December 31, 2014, were as follows:
| Estimated | ||||||||
| Amortized | Fair | |||||||
| Cost | Value | |||||||
| Due within one year |
$ | 4,830 | 4,927 | |||||
| Due in one to five years |
21,564 | 21,818 | ||||||
| Due in five to ten years |
41,683 | 42,613 | ||||||
| Due after ten years |
33,119 | 35,380 | ||||||
|
|
|
|
|
|||||
| 101,196 | 104,738 | |||||||
| Amortizing agency bonds |
77,305 | 79,080 | ||||||
| Mortgage-backed securities |
119,347 | 119,810 | ||||||
|
|
|
|
|
|||||
| Total unrestricted securities available for sale |
$ | 297,848 | 303,628 | |||||
|
|
|
|
|
|||||
The FHLB stock is an equity interest in the Federal Home Loan Bank. FHLB stock does not have a readily determinable fair value because ownership is restricted and a market is lacking. FHLB stock is classified as a restricted investment security, carried at cost and evaluated for impairment.
The estimated fair value and unrealized loss amounts of temporarily impaired investments as of December 31, 2015, are as follows:
| Less than 12 months | 12 months or longer | Total | ||||||||||||||||||||||
| Estimated | Unrealized | Estimated | Unrealized | Estimated | Unrealized | |||||||||||||||||||
| Fair Value | Losses | Fair Value | Losses | Fair Value | Losses | |||||||||||||||||||
| Available for sale |
||||||||||||||||||||||||
| U.S. Treasury securities |
$ | 2,000 | (1 | ) | — | — | 2,000 | (1 | ) | |||||||||||||||
| U.S. Agency debt securities |
26,499 | (203 | ) | 16,224 | (285 | ) | 42,723 | (488 | ) | |||||||||||||||
| Taxable municipals |
2,159 | (32 | ) | 1,887 | (33 | ) | 4,046 | (65 | ) | |||||||||||||||
| Tax free municipals |
— | — | 3,878 | (59 | ) | 3,878 | (59 | ) | ||||||||||||||||
| Mortgage-backed securities: |
||||||||||||||||||||||||
| GNMA |
10,840 | (105 | ) | 11,508 | (134 | ) | 22,348 | (239 | ) | |||||||||||||||
| FNMA |
11,484 | (87 | ) | 3,036 | (65 | ) | 14,520 | (152 | ) | |||||||||||||||
| FHLMC |
7,336 | (51 | ) | — | — | 7,336 | (51 | ) | ||||||||||||||||
| Non-Agency CMOs |
— | — | 3,654 | (174 | ) | 3,654 | (174 | ) | ||||||||||||||||
| AGENCY CMOs |
9,781 | (90 | ) | 1,991 | (41 | ) | 11,772 | (131 | ) | |||||||||||||||
|
|
|
|
|
|
|
|
|
|
|
|
|
|||||||||||||
| Total Available for Sale |
$ | 70,099 | (569 | ) | 42,178 | (791 | ) | 112,277 | (1,360 | ) | ||||||||||||||
|
|
|
|
|
|
|
|
|
|
|
|
|
|||||||||||||
55
Table of Contents
HopFed Bancorp, Inc. and Subsidiaries
Notes to Consolidated Financial Statements, Continued
December 31, 2015, 2014 and 2013
(Table Amounts in Thousands)
| (2) | Securities: (Continued) |
The estimated fair value and unrealized loss amounts of temporarily impaired investments as of December 31, 2014, are as follows:
| Less than 12 months | 12 months or longer | Total | ||||||||||||||||||||||
| Estimated | Unrealized | Estimated | Unrealized | Estimated | Unrealized | |||||||||||||||||||
| Fair Value | Losses | Fair Value | Losses | Fair Value | Losses | |||||||||||||||||||
| Available for sale |
||||||||||||||||||||||||
| U.S. Agency debt securities |
$ | 14,021 | (20 | ) | 29,156 | (507 | ) | 43,177 | (527 | ) | ||||||||||||||
| Taxable municipals |
— | — | 4,785 | (63 | ) | 4,785 | (63 | ) | ||||||||||||||||
| Tax free municipals |
— | — | 6,647 | (166 | ) | 6,647 | (166 | ) | ||||||||||||||||
| Trust preferred securities |
— | — | 1,489 | (111 | ) | 1,489 | (111 | ) | ||||||||||||||||
| Mortgage-backed securities: |
||||||||||||||||||||||||
| GNMA |
12,568 | (108 | ) | 2,895 | (14 | ) | 15,463 | (122 | ) | |||||||||||||||
| FNMA |
— | — | 18,927 | (536 | ) | 18,927 | (536 | ) | ||||||||||||||||
| NON-AGENCY CMOs |
1,923 | (14 | ) | 7,720 | (238 | ) | 9,643 | (252 | ) | |||||||||||||||
| AGENCY CMOs |
9,545 | (91 | ) | 7,685 | (114 | ) | 17,230 | (205 | ) | |||||||||||||||
|
|
|
|
|
|
|
|
|
|
|
|
|
|||||||||||||
| Total Available for Sale |
$ | 38,057 | (233 | ) | 79,304 | (1,749 | ) | 117,361 | (1,982 | ) | ||||||||||||||
|
|
|
|
|
|
|
|
|
|
|
|
|
|||||||||||||
Management evaluates securities for other-than-temporary impairment at least on a quarterly basis, and more frequently when economic or market concerns warrant such evaluations. Consideration is given to (1) the length of time and the extent to which the fair value has been less than cost, (2) the financial condition and near-term prospects of the issuer, and (3) the intent and ability of the Company to retain its investment in the issuer for a period of time sufficient to allow for any anticipated recovery in fair value.
At December 31, 2015, the Company has 71 securities with unrealized losses. Management believes these unrealized losses relate to changes in interest rates and not credit quality. Management also believes the Company has the ability to hold these securities until maturity or for the foreseeable future and therefore no declines are deemed to be other than temporary.
56
Table of Contents
HopFed Bancorp, Inc. and Subsidiaries
Notes to Consolidated Financial Statements, Continued
December 31, 2015, 2014 and 2013
| (2) | Securities: (Continued) |
The carrying value of the Company’s investment securities may decline in the future if the financial condition of issuers deteriorates and management determines it is probable that the Company will not recover the entire amortized cost bases of the securities. As a result, there is a risk that other-than-temporary impairment charges may occur in the future.
In June of 2008, the Company purchased $2.0 million par value of a private placement subordinated debenture issued by First Financial Services Corporation (“FFKY”), the holding Company for First Federal Savings Bank (“First Fed”). The debenture is a thirty year security with a coupon rate of 8.00%. FFKY is a NASDAQ listed commercial bank holding company located in Elizabethtown, Kentucky. In October of 2010, FFKY informed the owners of its subordinated trust, including the Company, that it was deferring the dividend payments for up to five years as prescribed by the trust agreement.
At September 30, 2013, the Company recognized a $400,000 impairment charge due against this security. The impairment charge was recognized due to management’s financial analysis of the issuing institution and our opinion that it would be unable to make dividend payments after the five year extension expired. In January 2015, FFKY was sold to Your Community Bankshares (“YCB”). YCB assumed the debt of FFKY and paid all interest current. The Company is currently accreting the $400,000 impairment charge back into income at a rate of $4,200 per quarter.
During 2015, the Company sold investment securities classified as available for sale for proceeds of $84.9 million resulting in gross gains of $1,274,000 and gross losses of $583,000. During 2014, the Company sold investment securities classified as available for sale for proceeds of $75.3 million resulting in gross gains of $788,000 and gross losses of $210,000. During 2013, the Company sold investment securities classified as available for sale for proceeds of $68.5 million resulting in gross gains of $1.7 million and gross losses of $33,000.
As part of its normal course of business, the Bank holds significant balances of municipal and other deposits that require the Bank to pledge investment instruments as collateral. At December 31, 2015, the Bank pledged investments with a book value of $135.9 million and a market value of approximately $140.3 million to various municipal entities as required by law. In addition, the Bank has provided $32.5 million of letters of credit issued by the Federal Home Loan Bank of Cincinnati to collateralize municipal deposits. The collateral for these letters of credit are the Bank’s one to four family loan portfolio.
57
Table of Contents
HopFed Bancorp, Inc. and Subsidiaries
Notes to Consolidated Financial Statements, Continued
December 31, 2015, 2014 and 2013
(Table Amounts in Thousands, Except Percentages)
| (3) | Loans Receivable, Net: |
The components of loans receivable in the consolidated balance sheets as of December 31, 2015, and December 31, 2014, were as follows:
| December 31, 2015 | December 31, 2014 | |||||||||||||||
| Amount | Percent | Amount | Percent | |||||||||||||
| Real estate loans: |
||||||||||||||||
| One-to-four family (closed end) first mortgages |
$ | 145,999 | 26.0 | % | $ | 150,551 | 27.6 | % | ||||||||
| Second mortgages (closed end) |
1,771 | 0.3 | % | 2,102 | 0.4 | % | ||||||||||
| Home equity lines of credit |
33,644 | 6.0 | % | 34,238 | 6.3 | % | ||||||||||
| Multi-family |
24,725 | 4.4 | % | 25,991 | 4.8 | % | ||||||||||
| Construction |
34,878 | 6.2 | % | 24,241 | 4.4 | % | ||||||||||
| Land |
22,453 | 4.0 | % | 26,654 | 4.9 | % | ||||||||||
| Farmland |
42,246 | 7.5 | % | 42,874 | 7.8 | % | ||||||||||
| Non-residential real estate |
149,711 | 26.6 | % | 150,596 | 27.6 | % | ||||||||||
|
|
|
|
|
|
|
|
|
|||||||||
| Total mortgage loans |
455,427 | 81.0 | % | 457,247 | 83.8 | % | ||||||||||
| Consumer loans |
20,324 | 3.6 | % | 14,438 | 2.6 | % | ||||||||||
| Commercial loans |
86,743 | 15.4 | % | 74,154 | 13.6 | % | ||||||||||
|
|
|
|
|
|
|
|
|
|||||||||
| Total other loans |
107,067 | 19.0 | % | 88,592 | 16.2 | % | ||||||||||
|
|
|
|
|
|
|
|
|
|||||||||
| Total loans, gross |
562,494 | 100.0 | % | 545,839 | 100.0 | % | ||||||||||
|
|
|
|
|
|||||||||||||
| Deferred loan cost, net of fees |
(445 | ) | (286 | ) | ||||||||||||
| Less allowance for loan losses |
(5,700 | ) | (6,289 | ) | ||||||||||||
|
|
|
|
|
|||||||||||||
| Total loans |
$ | 556,349 | $ | 539,264 | ||||||||||||
|
|
|
|
|
|||||||||||||
58
Table of Contents
HopFed Bancorp, Inc. and Subsidiaries
Notes to Consolidated Financial Statements, Continued
December 31, 2015, 2014 and 2013
| (3) | Loans Receivable, Net: (Continued) |
Loans serviced for the benefit of others totaled approximately $36.9 million, $30.4 million and $32.6 million at December 31, 2015, 2014 and 2013, respectively. At December 31, 2015, approximately $22.8 million of the $36.9 million in loans serviced by the Company are serviced for the benefit of Freddie Mac. Servicing loans for others generally consists of collecting mortgage payments, maintaining escrow amounts, disbursing payments to investors and foreclosure processing. The servicing rights associated with these loans are not material to the Company’s consolidated financial statements. Qualified one-to-four family first mortgage loans, non-residential real estate loans, multi-family loans and commercial real estate loans are pledged to the Federal Home Loan Bank of Cincinnati as discussed in Note 7.
The Company originates most fixed rate loans for immediate sale to FHLMC or other investors. Generally, the sale of such loans is arranged shortly after the loan application is tentatively approved through commitments.
The Company conducts annual reviews on all loan relationships above $1.0 million to ascertain the borrowers continued ability to service their debt as agreed. In addition to the credit relationships mentioned above, management may classify any credit relationship once it becomes aware of adverse credit trends for that customer. Typically, the annual review consists of updated financial statements for borrowers and any guarantors, a review of the borrower’s credit history with the Company and other creditors, and current income tax information. As a result of this review, management will classify loans based on their credit risk.
The Company uses the following risk definitions for commercial loan risk grades:
Excellent - Loans in this category are to persons or entities of unquestioned financial strength, a highly liquid financial position, with collateral that is liquid and well margined. These borrowers have performed without question on past obligations, and the bank expects their performance to continue. Internally generated cash flow covers current maturities of long-term debt by a substantial margin. Loans secured by bank certificates of deposit and savings accounts, with appropriate holds placed on the accounts, are to be rated in this category.
Very Good - These are loans to persons or entities with strong financial condition and above- average liquidity who have previously satisfactorily handled their obligations with the bank. Collateral securing the bank’s debt is margined in accordance with policy guidelines. Internally generated cash flow covers current maturities of long-term debt more than adequately. Unsecured loans to individuals supported by strong financial statements and on which repayment is satisfactory may be included in this classification.
Satisfactory - Assets of this grade conform to substantially all the Bank’s underwriting criteria and evidence an average level of credit risk; however, such assets display more susceptibility to economic, technological or political changes since they lack the above average financial strength of credits rated Very Good. Borrower’s repayment capacity is considered to be adequate. Credit is appropriately structured and serviced; payment history is satisfactory.
59
Table of Contents
HopFed Bancorp, Inc. and Subsidiaries
Notes to Consolidated Financial Statements, Continued
December 31, 2015, 2014 and 2013
| (3) | Loans Receivable, Net: (Continued) |
Acceptable - Assets of this grade conform to most of the Bank’s underwriting criteria and evidence an acceptable, though higher than average, level of credit risk; however, these loans have certain risk characteristics which could adversely affect the borrower’s ability to repay given material adverse trends. Loans in this category require an above average level of servicing and show more reliance on collateral and guaranties to preclude a loss to the Bank should material adverse trends develop. If the borrower is a company, its earnings, liquidity and capitalization are slightly below average when compared to its peers.
Watch - These loans are characterized by borrowers who have marginal cash flow, marginal profitability, or have experienced an unprofitable year and a declining financial condition. The borrower has in the past satisfactorily handled debts with the bank, but in recent months has either been late, delinquent in making payments, or made sporadic payments. While the bank continues to be adequately secured, margins have decreased or are decreasing, despite the borrower’s continued satisfactory condition. Other characteristics of borrowers in this class include inadequate credit information, weakness of financial statement and repayment capacity, but with collateral that appears to limit exposure. This classification includes loans to established borrowers that are reasonably margined by collateral, but where potential for improvement in financial capacity appears limited.
Special Mention - Loans in this category have potential weaknesses that deserve management’s close attention. If left uncorrected, these potential weaknesses may result in deteriorating prospects for the asset or in the institution’s credit position at some future date. Borrowers may be experiencing adverse operating trends or market conditions. Non- financial reasons for rating a credit exposure Special Mention include, but are not limited to: management problems, pending litigations, ineffective loan agreement and/or inadequate loan documentation, structural weaknesses and/or lack of control over collateral.
Substandard - A substandard asset is inadequately protected by the current sound worth or paying capacity of the debtor or the collateral pledged. There exists one or more well defined weaknesses that jeopardize the liquidation of the debt. There is a distinct possibility the Bank will experience some loss if the deficiencies are not corrected. Generally, the asset is considered collectible as to both principal and interest primarily because of collateral coverage or enterprise value. Generally, the asset is current and marginally secured.
Doubtful - A loan classified as doubtful has all the weaknesses inherent in a loan classified as substandard, with the added characteristic that the weaknesses make collection or liquidation in full, on the basis of currently existing facts, conditions, and values, highly questionable and improbable. These are poor quality loans in which neither the collateral, if any, nor the financial condition of the borrower presently ensure collectability in full in a reasonable period of time; in fact, there is permanent impairment in the collateral securing the bank’s loan. These loans are in a work-out status and have a defined work-out strategy.
60
Table of Contents
HopFed Bancorp, Inc. and Subsidiaries
Notes to Consolidated Financial Statements, Continued
December 31, 2015, 2014 and 2013
| (3) | Loans Receivable, Net: (Continued) |
Loss - Loans classified as loss are considered uncollectible and of such little value that their continuance as bankable assets is not warranted. The bank takes losses in the period in which they become uncollectible.
The following credit risk standards are assigned to consumer loans.
Satisfactory - All consumer open-end and closed-end retail loans shall have an initial risk grade assigned of 3 - Satisfactory.
Substandard Assets -All consumer open-end and closed-end retail loans past due 90 cumulative days from the contractual date will be classified as 7 - Substandard. If a consumer/retail loan customer files bankruptcy, the loan will be classified as 7 - Substandard regardless of payment history.
Loss Assets - All closed-end retail loans that become past due 120 cumulative days and open-end retail loans that become past due 180 cumulative days from the contractual due date will be charged off as loss assets. The charge off will be taken by the end of the month in which the 120-day or 180-day time period elapses. All losses in retail credit will be recognized when the affiliate becomes aware of the loss, but in no case should the charge off exceed the time frames stated within this policy.
A loan is considered to be impaired when management determines that it is probable that the Company will be unable to collect all principal and interest payments due in accordance with the contractual terms of the loan agreement. The value of individually impaired loans is measured based on the present value of expected payments or using the fair value of the collateral if the loan is collateral dependent. Currently, it is management’s practice to classify all substandard or doubtful loans as impaired.
61
Table of Contents
HopFed Bancorp, Inc. and Subsidiaries
Notes to Consolidated Financial Statements, Continued
December 31, 2015, 2014 and 2013
| (3) | Loans Receivable, Net: (Continued) |
Loan Origination/Risk Management
The Company has certain lending policies and procedures in place that are designed to maximize loan income within an acceptable level of risk. Management reviews and approves these policies and procedures on a regular basis. A reporting system supplements the review process by providing management with frequent reports related to loan production, loan quality, concentrations of credit, loan delinquencies and non-performing and potential problem loans. Diversification in the loan portfolio is a means of managing risk associated with fluctuations in economic conditions.
Commercial and industrial loans are underwritten after evaluating and understanding the borrower’s ability to operate profitably and prudently expand its business. Underwriting standards are designed to promote relationship banking rather than transactional banking. Once it is determined that the borrower’s management possesses sound ethics and solid business acumen, the Company’s management examines current and projected cash flows to determine the ability of the borrower to repay their obligations as agreed. Commercial and industrial loans are primarily made based on the identified cash flows of the borrower and secondarily on the underlying collateral provided by the borrower. The cash flows of borrowers, however, may not be as expected and the collateral securing these loans may fluctuate in value. Most commercial and industrial loans are secured by the assets being financed or other business assets such as accounts receivable or inventory and may incorporate a personal guarantee; however, some short-term loans may be made on an unsecured basis. In the case of loans secured by accounts receivable, the availability of funds for the repayment of these loans may be substantially dependent on the ability of the borrower to collect amounts due from its customers.
Commercial real estate loans are subject to underwriting standards and processes similar to commercial and industrial loans, in addition to those of real estate loans. These loans are viewed primarily as cash flow loans and secondarily as loans secured by real estate. Commercial real estate lending typically involves higher loan principal amounts and the repayment of these loans is generally largely dependent on the successful operation of the property securing the loan or the business conducted on the property securing the loan. Commercial real estate loans may be more adversely affected by conditions in the real estate markets or in the general economy. The properties securing the Company’s commercial real estate portfolio are diverse in terms of type and geographic location. This diversity helps reduce the Company’s exposure to adverse economic events that affect any single market or industry. Management monitors and evaluates commercial real estate loans based on collateral, geography and risk grade criteria. As a general rule, the Company avoids financing single-purpose projects unless other underwriting factors are present to help mitigate risk. The Company also utilizes third-party experts to provide insight and guidance about economic conditions and trends affecting market areas it serves. In addition, management tracks the level of owner-occupied commercial real estate loans versus non-owner occupied loans. At December 31, 2015, approximately $82.3 million of the outstanding principal balance of the Company’s non-residential real estate loans were secured by owner-occupied properties, approximately $67.4 million was secured by non-owner occupied properties.
62
Table of Contents
HopFed Bancorp, Inc. and Subsidiaries
Notes to Consolidated Financial Statements, Continued
December 31, 2015, 2014 and 2013
| (3) | Loans Receivable, Net: (Continued) |
Loan Origination/Risk Management (Continued)
With respect to loans to developers and builders that are secured by non-owner occupied properties that the Company may originate from time to time, the Company generally requires the borrower to have had an existing relationship with the Company and have a proven record of success. Construction loans are underwritten utilizing feasibility studies, independent appraisal reviews, sensitivity analysis of absorption and lease rates and financial analysis of the developers and property owners. Construction loans are generally based upon estimates of costs and value associated with the completed project. These estimates may be inaccurate. Construction loans often involve the disbursement of substantial funds with repayment substantially dependent on the success of the ultimate project. Sources of repayment for these types of loans may be pre-committed permanent loans from approved long-term lenders, sales of developed property or an interim loan commitment from the Company until permanent financing is obtained. These loans are closely monitored by on-site inspections and are considered to have higher risks than other real estate loans due to their ultimate repayment being sensitive to interest rate changes, governmental regulation of real property, general economic conditions and the availability of long-term financing.
The Company maintains an independent loan review function that is typically outsourced to firms that specialize in conducting loan reviews. Results of these reviews are presented to management. The loan review process complements and reinforces the risk identification and assessment decisions made by lenders and credit personnel, as well as the Company policies and procedures.
Most of the Company’s lending activity occurs in Western Kentucky and middle and western Tennessee. The majority of the Company’s loan portfolio consists of non-residential real estate loans and one-to-four family residential real estate loans.
63
Table of Contents
HopFed Bancorp, Inc. and Subsidiaries
Notes to Consolidated Financial Statements, Continued
December 31, 2015, 2014 and 2013
(Table Amounts in Thousands)
| (3) | Loans Receivable, Net: (Continued) |
Loans by classification type and the related valuation allowance amounts at December 31, 2015, were as follows:
| Special | Impaired Loans | Specific Allowance for |
Allowance for Loans not |
|||||||||||||||||||||||||
| Pass | Mention | Substandard | Doubtful | Total | Impairment | Impaired | ||||||||||||||||||||||
| One-to-four family mortgages |
$ | 142,729 | 41 | 3,229 | — | 145,999 | 60 | 970 | ||||||||||||||||||||
| Home equity line of credit |
33,475 | — | 169 | — | 33,644 | — | 201 | |||||||||||||||||||||
| Junior lien |
1,720 | 35 | 16 | — | 1,771 | — | 8 | |||||||||||||||||||||
| Multi-family |
21,644 | — | 3,081 | — | 24,725 | 138 | 89 | |||||||||||||||||||||
| Construction |
34,878 | — | — | — | 34,878 | — | 377 | |||||||||||||||||||||
| Land |
11,794 | 41 | 10,618 | — | 22,453 | 69 | 1,310 | |||||||||||||||||||||
| Non-residential real estate |
138,865 | 2,489 | 8,357 | — | 149,711 | 134 | 1,005 | |||||||||||||||||||||
| Farmland |
41,917 | — | 329 | — | 42,246 | — | 358 | |||||||||||||||||||||
| Consumer loans |
20,123 | — | 201 | — | 20,324 | 49 | 309 | |||||||||||||||||||||
| Commercial loans |
84,317 | 352 | 2,074 | — | 86,743 | 180 | 443 | |||||||||||||||||||||
|
|
|
|
|
|
|
|
|
|
|
|
|
|
|
|||||||||||||||
| Total |
$ | 531,462 | 2,958 | 28,074 | — | 562,494 | 630 | 5,070 | ||||||||||||||||||||
|
|
|
|
|
|
|
|
|
|
|
|
|
|
|
|||||||||||||||
Loans by classification type and the related valuation allowance amounts at December 31, 2014, were as follows:
| Special | Impaired Loans | Specific Allowance for |
Allowance for Loans not |
|||||||||||||||||||||||||
| Pass | Mention | Substandard | Doubtful | Total | Impairment | Impaired | ||||||||||||||||||||||
| One-to-four family mortgages |
$ | 146,129 | 203 | 4,219 | — | 150,551 | 51 | 1,147 | ||||||||||||||||||||
| Home equity line of credit |
33,481 | — | 757 | — | 34,238 | — | 181 | |||||||||||||||||||||
| Junior lien |
2,025 | 40 | 37 | — | 2,102 | — | 14 | |||||||||||||||||||||
| Multi-family |
20,066 | 2,904 | 3,021 | — | 25,991 | — | 85 | |||||||||||||||||||||
| Construction |
24,241 | — | — | — | 24,241 | — | 146 | |||||||||||||||||||||
| Land |
15,328 | 362 | 10,964 | — | 26,654 | 663 | 460 | |||||||||||||||||||||
| Non-residential real estate |
131,854 | 5,492 | 13,250 | — | 150,596 | 738 | 1,345 | |||||||||||||||||||||
| Farmland |
40,121 | 516 | 2,237 | — | 42,874 | — | 461 | |||||||||||||||||||||
| Consumer loans |
14,118 | 21 | 299 | — | 14,438 | 62 | 432 | |||||||||||||||||||||
| Commercial loans |
71,246 | 325 | 2,583 | — | 74,154 | — | 504 | |||||||||||||||||||||
|
|
|
|
|
|
|
|
|
|
|
|
|
|
|
|||||||||||||||
| Total |
$ | 498,609 | 9,863 | 37,367 | — | 545,839 | 1,514 | 4,775 | ||||||||||||||||||||
|
|
|
|
|
|
|
|
|
|
|
|
|
|
|
|||||||||||||||
64
Table of Contents
HopFed Bancorp, Inc. and Subsidiaries
Notes to Consolidated Financial Statements, Continued
December 31, 2015, 2014 and 2013
(Table Amounts in Thousands)
| (3) | Loans Receivable, Net: (Continued) |
Impaired loans by classification type and the related valuation allowance amounts at December 31, 2015, were as follows:
| At December 31, 2015 | For the year ended December 31, 2015 |
|||||||||||||||||||
| Recorded Investment |
Unpaid Principal Balance |
Related Allowance |
Average Recorded Investment |
Interest Income Recognized |
||||||||||||||||
| Impaired loans with no specific allowance |
||||||||||||||||||||
| One-to-four family mortgages |
$ | 2,526 | 2,526 | — | 2,389 | 80 | ||||||||||||||
| Home equity line of credit |
169 | 169 | — | 457 | 7 | |||||||||||||||
| Junior liens |
16 | 16 | — | 17 | 1 | |||||||||||||||
| Multi-family |
2,128 | 2,128 | — | 2,797 | 126 | |||||||||||||||
| Construction |
— | — | — | — | — | |||||||||||||||
| Land |
10,038 | 10,998 | — | 8,520 | 671 | |||||||||||||||
| Non-residential real estate |
7,640 | 7,640 | — | 283 | 404 | |||||||||||||||
| Farmland |
329 | 329 | — | 7,774 | 19 | |||||||||||||||
| Consumer loans |
5 | 5 | — | 3 | — | |||||||||||||||
| Commercial loans |
1,274 | 1,274 | — | 1,599 | 73 | |||||||||||||||
|
|
|
|
|
|
|
|
|
|
|
|||||||||||
| Total |
24,125 | 25,085 | — | 23,839 | 1,381 | |||||||||||||||
|
|
|
|
|
|
|
|
|
|
|
|||||||||||
| Impaired loans with a specific allowance |
||||||||||||||||||||
| One-to-four family mortgages |
$ | 703 | 703 | 60 | 709 | 40 | ||||||||||||||
| Home equity line of credit |
— | — | — | — | — | |||||||||||||||
| Junior liens |
— | — | — | — | — | |||||||||||||||
| Multi-family |
953 | 953 | 138 | 318 | 17 | |||||||||||||||
| Construction |
— | — | — | — | — | |||||||||||||||
| Land |
580 | 580 | 69 | 1,707 | 46 | |||||||||||||||
| Non-residential real estate |
717 | 717 | 134 | 836 | 28 | |||||||||||||||
| Farmland |
— | — | — | — | — | |||||||||||||||
| Consumer loans |
196 | 196 | 49 | 194 | — | |||||||||||||||
| Commercial loans |
800 | 800 | 180 | 514 | 15 | |||||||||||||||
|
|
|
|
|
|
|
|
|
|
|
|||||||||||
| Total |
3,949 | 3,949 | 630 | 4,278 | 146 | |||||||||||||||
|
|
|
|
|
|
|
|
|
|
|
|||||||||||
| Total impaired loans |
$ | 28,074 | 29,034 | 630 | 28,117 | 1,527 | ||||||||||||||
|
|
|
|
|
|
|
|
|
|
|
|||||||||||
65
Table of Contents
HopFed Bancorp, Inc. and Subsidiaries
Notes to Consolidated Financial Statements, Continued
December 31, 2015, 2014 and 2013
(Table Amounts in Thousands)
| (3) | Loans Receivable, Net: (Continued) |
Impaired loans by classification type and the related valuation allowance amounts at December 31, 2014, were as follows:
| At December 31, 2014 | For the year ended December 31, 2014 |
|||||||||||||||||||
| Recorded Investment |
Unpaid Principal Balance |
Related Allowance |
Average Recorded Investment |
Interest Income Recognized |
||||||||||||||||
| Impaired loans with no specific allowance |
||||||||||||||||||||
| One-to-four family mortgages |
$ | 3,501 | 3,501 | — | 2,972 | 176 | ||||||||||||||
| Home equity line of credit |
757 | 757 | — | 690 | 35 | |||||||||||||||
| Junior liens |
37 | 37 | — | 39 | 2 | |||||||||||||||
| Multi-family |
3,021 | 3,021 | — | 1,342 | 190 | |||||||||||||||
| Construction |
— | — | — | 29 | — | |||||||||||||||
| Land |
7,740 | 7,740 | — | 8,978 | 339 | |||||||||||||||
| Non-residential real estate |
12,057 | 12,057 | — | 8,672 | 669 | |||||||||||||||
| Farmland |
2,237 | 2,237 | — | 3,968 | 125 | |||||||||||||||
| Consumer loans |
51 | 51 | — | 36 | 3 | |||||||||||||||
| Commercial loans |
2,583 | 2,583 | — | 2,246 | 154 | |||||||||||||||
|
|
|
|
|
|
|
|
|
|
|
|||||||||||
| Total |
31,984 | 31,984 | — | 28,972 | 1,693 | |||||||||||||||
|
|
|
|
|
|
|
|
|
|
|
|||||||||||
| Impaired loans with a specific allowance |
||||||||||||||||||||
| One-to-four family mortgages |
$ | 718 | 718 | 51 | 1,434 | 44 | ||||||||||||||
| Home equity line of credit |
— | — | — | — | — | |||||||||||||||
| Junior liens |
— | — | — | — | — | |||||||||||||||
| Multi-family |
— | — | — | — | — | |||||||||||||||
| Construction |
— | — | — | — | — | |||||||||||||||
| Land |
3,224 | 4,737 | 663 | 3,418 | 160 | |||||||||||||||
| Non-residential real estate |
1,193 | 1,258 | 738 | 3,617 | 69 | |||||||||||||||
| Farmland |
— | — | — | 619 | — | |||||||||||||||
| Consumer loans |
248 | 248 | 62 | 355 | — | |||||||||||||||
| Commercial loans |
— | — | — | 100 | — | |||||||||||||||
|
|
|
|
|
|
|
|
|
|
|
|||||||||||
| Total |
5,383 | 6,961 | 1,514 | 9,543 | 273 | |||||||||||||||
|
|
|
|
|
|
|
|
|
|
|
|||||||||||
| Total impaired loans |
$ | 37,367 | 38,945 | 1,514 | 38,515 | 1,966 | ||||||||||||||
|
|
|
|
|
|
|
|
|
|
|
|||||||||||
66
Table of Contents
HopFed Bancorp, Inc. and Subsidiaries
Notes to Consolidated Financial Statements, Continued
December 31, 2015, 2014 and 2013
(Table Amounts in Thousands)
| (3) | Loans Receivable, Net: (Continued) |
The following table presents the balance in the allowance for loan losses and the recorded investment in loans as of December 31, 2015, and December 31, 2014, by portfolio segment and based on the impairment method as of December 31, 2015, and December 31, 2014.
| Commercial | Land Development / Construction |
Commercial Real Estate |
Residential Real Estate |
Consumer | Total | |||||||||||||||||||
| December 31, 2015: |
||||||||||||||||||||||||
| Allowance for loan losses: |
||||||||||||||||||||||||
| Ending allowance balance attributable to loans: |
||||||||||||||||||||||||
| Individually evaluated for impairment |
$ | 180 | 69 | 272 | 60 | 49 | 630 | |||||||||||||||||
| Collectively evaluated for impairment |
443 | 1,687 | 1,452 | 1,179 | 309 | 5,070 | ||||||||||||||||||
|
|
|
|
|
|
|
|
|
|
|
|
|
|||||||||||||
| Total ending allowance balance |
$ | 623 | 1,756 | 1,724 | 1,239 | 358 | 5,700 | |||||||||||||||||
|
|
|
|
|
|
|
|
|
|
|
|
|
|||||||||||||
| Loans: |
||||||||||||||||||||||||
| Loans individually evaluated for impairment |
$ | 2,074 | 10,618 | 11,767 | 3,414 | 201 | 28,074 | |||||||||||||||||
| Loans collectively evaluated for impairment |
84,669 | 46,713 | 204,915 | 178,000 | 20,123 | 534,420 | ||||||||||||||||||
|
|
|
|
|
|
|
|
|
|
|
|
|
|||||||||||||
| Total ending loans balance |
$ | 86,743 | 57,331 | 216,682 | 181,414 | 20,324 | 562,494 | |||||||||||||||||
|
|
|
|
|
|
|
|
|
|
|
|
|
|||||||||||||
| Commercial | Land Development / Construction |
Commercial Real Estate |
Residential Real Estate |
Consumer | Total | |||||||||||||||||||
| December 31, 2014: |
||||||||||||||||||||||||
| Allowance for loan losses: |
||||||||||||||||||||||||
| Ending allowance balance attributable to loans: |
||||||||||||||||||||||||
| Individually evaluated for impairment |
$ | — | 663 | 738 | 51 | 62 | 1,514 | |||||||||||||||||
| Collectively evaluated for impairment |
504 | 606 | 1,891 | 1,342 | 432 | 4,775 | ||||||||||||||||||
|
|
|
|
|
|
|
|
|
|
|
|
|
|||||||||||||
| Total ending allowance balance |
$ | 504 | 1,269 | 2,629 | 1,393 | 494 | 6,289 | |||||||||||||||||
|
|
|
|
|
|
|
|
|
|
|
|
|
|||||||||||||
| Loans: |
||||||||||||||||||||||||
| Loans individually evaluated for impairment |
$ | 2,583 | 10,964 | 18,508 | 5,013 | 299 | 37,367 | |||||||||||||||||
| Loans collectively evaluated for impairment |
71,571 | 39,931 | 200,953 | 181,878 | 14,139 | 508,472 | ||||||||||||||||||
|
|
|
|
|
|
|
|
|
|
|
|
|
|||||||||||||
| Total ending loans balance |
$ | 74,154 | 50,895 | 219,461 | 186,891 | 14,438 | 545,839 | |||||||||||||||||
|
|
|
|
|
|
|
|
|
|
|
|
|
|||||||||||||
67
Table of Contents
HopFed Bancorp, Inc. and Subsidiaries
Notes to Consolidated Financial Statements, Continued
December 31, 2015, 2014 and 2013
(Table Amounts in Thousands)
| (3) | Loans Receivable, Net: (Continued) |
The average recorded investment in impaired loans for the years ended December 31, 2015, 2014 and 2013 was $28.1 million, $38.5 million and $43.1 million, respectively. Interest income recognized on impaired loans for the years ended December 31, 2015 and December 31, 2014 and December 31, 2013, was $1.5 million, $2.0 million and $859,000, respectively. The following table provides a detail of the Company’s activity in the allowance for loan loss account allocated by loan type for the year ended December 31, 2015:
| Balance 12/31/2014 |
Charge off 2015 |
Recovery 2015 |
General Provision 2015 |
Specific Provision 2015 |
Ending Balance 12/31/2015 |
|||||||||||||||||||
| One-to-four family mortgages |
$ | 1,198 | (143 | ) | 39 | (176 | ) | 112 | 1,030 | |||||||||||||||
| Home equity line of credit |
181 | (92 | ) | 10 | 20 | 82 | 201 | |||||||||||||||||
| Junior liens |
14 | — | 4 | (6 | ) | (4 | ) | 8 | ||||||||||||||||
| Multi-family |
85 | — | — | 4 | 138 | 227 | ||||||||||||||||||
| Construction |
146 | — | — | 231 | — | 377 | ||||||||||||||||||
| Land |
1,123 | (911 | ) | — | 850 | 317 | 1,379 | |||||||||||||||||
| Non-residential real estate |
2,083 | (222 | ) | 2 | (944 | ) | 220 | 1,139 | ||||||||||||||||
| Farmland |
461 | — | — | 500 | (603 | ) | 358 | |||||||||||||||||
| Consumer loans |
494 | (298 | ) | 118 | (123 | ) | 167 | 358 | ||||||||||||||||
| Commercial loans |
504 | (201 | ) | 54 | (61 | ) | 327 | 623 | ||||||||||||||||
|
|
|
|
|
|
|
|
|
|
|
|
|
|||||||||||||
| $ | 6,289 | (1,867 | ) | 227 | 295 | 756 | 5,700 | |||||||||||||||||
|
|
|
|
|
|
|
|
|
|
|
|
|
|||||||||||||
The following table provides a detail of the Company’s activity in the allowance for loan loss account allocated by loan type for the year ended December 30, 2014:
| Balance 12/31/2013 |
Charge off 2014 |
Recovery 2014 |
General Provision 2014 |
Specific Provision 2014 |
Ending Balance 12/31/2014 |
|||||||||||||||||||
| One-to-four family mortgages |
$ | 2,048 | (233 | ) | 24 | (304 | ) | (337 | ) | 1,198 | ||||||||||||||
| Home equity line of credit |
218 | (83 | ) | 3 | (37 | ) | 80 | 181 | ||||||||||||||||
| Junior liens |
39 | — | 9 | (25 | ) | (9 | ) | 14 | ||||||||||||||||
| Multi-family |
466 | — | — | (381 | ) | — | 85 | |||||||||||||||||
| Construction |
88 | (139 | ) | 9 | 58 | 130 | 146 | |||||||||||||||||
| Land |
1,305 | — | — | (74 | ) | (108 | ) | 1,123 | ||||||||||||||||
| Non-residential real estate |
2,719 | (66 | ) | 864 | (1,368 | ) | (66 | ) | 2,083 | |||||||||||||||
| Farmland |
510 | — | — | 542 | (591 | ) | 461 | |||||||||||||||||
| Consumer loans |
541 | (415 | ) | 109 | (13 | ) | 272 | 494 | ||||||||||||||||
| Commercial loans |
748 | (296 | ) | 94 | (244 | ) | 202 | 504 | ||||||||||||||||
|
|
|
|
|
|
|
|
|
|
|
|
|
|||||||||||||
| $ | 8,682 | (1,232 | ) | 1,112 | (1,846 | ) | (427 | ) | 6,289 | |||||||||||||||
|
|
|
|
|
|
|
|
|
|
|
|
|
|||||||||||||
68
Table of Contents
HopFed Bancorp, Inc. and Subsidiaries
Notes to Consolidated Financial Statements, Continued
December 31, 2015, 2014 and 2013
(Table Amounts in Thousands)
| (3) | Loans Receivable, Net: (Continued) |
Non-accrual loans totaled $7.4 million and $3.2 million at December 31, 2015, and December 31, 2014, respectively. All non-accrual loans noted below are classified as either substandard or doubtful. Interest income foregone on such loans totaled $337,000 at December 31, 2015, $76,000 at December 31, 2014, and $432,000 at December 31, 2013, respectively. The Company is not committed to lend additional funds to borrowers whose loans have been placed on a non-accrual basis. There were no loans past due more than three months and still accruing interest as of December 31, 2015, and December 31, 2014. For the years ended December 31, 2015, and December 31, 2014, the components of the Company’s balances of non-accrual loans are as follows:
| 12/31/2015 | 12/31/2014 | |||||||
| One-to-four family first mortgages |
$ | 2,234 | 1,501 | |||||
| Home equity lines of credit |
48 | — | ||||||
| Junior liens |
— | — | ||||||
| Multi-family |
1,968 | 95 | ||||||
| Land |
1,553 | 215 | ||||||
| Non-residential real estate |
247 | 1,159 | ||||||
| Farmland |
166 | 115 | ||||||
| Consumer loans |
8 | — | ||||||
| Commercial loans |
1,198 | 90 | ||||||
|
|
|
|
|
|||||
| Total non-accrual loans |
$ | 7,422 | 3,175 | |||||
|
|
|
|
|
|||||
69
Table of Contents
HopFed Bancorp, Inc. and Subsidiaries
Notes to Consolidated Financial Statements, Continued
December 31, 2015, 2014 and 2013
(Table Amounts in Thousands)
| (3) | Loans Receivable, Net: (Continued) |
The table below presents loan balances at December 31, 2015, by loan classification allocated between past due, classified, performing and non-performing:
| Currently Performing |
30 - 89 Days Past Due |
Non-accrual Loans |
Special Mention |
Impaired Loans | ||||||||||||||||||||||||
| Currently Performing | ||||||||||||||||||||||||||||
| Substandard | Doubtful | Total | ||||||||||||||||||||||||||
| One-to-four family mortgages |
$ | 142,058 | 671 | 2,234 | 41 | 995 | — | $ | 145,999 | |||||||||||||||||||
| Home equity line of credit |
33,396 | 79 | 48 | — | 121 | — | 33,644 | |||||||||||||||||||||
| Junior liens |
1,720 | — | — | 35 | 16 | — | 1,771 | |||||||||||||||||||||
| Multi-family |
21,638 | 6 | 1,968 | — | 1,113 | — | 24,725 | |||||||||||||||||||||
| Construction |
34,878 | — | — | — | — | — | 34,878 | |||||||||||||||||||||
| Land |
11,047 | 747 | 1,553 | 41 | 9,065 | — | 22,453 | |||||||||||||||||||||
| Non-residential real estate |
138,637 | 228 | 247 | 2,489 | 8,110 | — | 149,711 | |||||||||||||||||||||
| Farmland |
41,853 | 64 | 166 | — | 163 | — | 42,246 | |||||||||||||||||||||
| Consumer loans |
20,108 | 15 | 8 | — | 193 | — | 20,324 | |||||||||||||||||||||
| Commercial loans |
84,272 | 45 | 1,198 | 352 | 876 | — | 86,743 | |||||||||||||||||||||
|
|
|
|
|
|
|
|
|
|
|
|
|
|
|
|||||||||||||||
| Total |
$ | 529,607 | 1,855 | 7,422 | 2,958 | 20,652 | — | 562,494 | ||||||||||||||||||||
|
|
|
|
|
|
|
|
|
|
|
|
|
|
|
|||||||||||||||
The table below presents loan balances at December 31, 2014, by loan classification allocated between performing and non-performing:
| Currently Performing |
30—89 Days Past Due |
Non-accrual Loans |
Special Mention |
Impaired Loans | ||||||||||||||||||||||||
| Currently Performing | ||||||||||||||||||||||||||||
| Substandard | Doubtful | Total | ||||||||||||||||||||||||||
| One-to-four family mortgages |
$ | 145,372 | 757 | 1,501 | 203 | 2,718 | — | 150,551 | ||||||||||||||||||||
| Home equity line of credit |
33,338 | 143 | — | — | 757 | — | 34,238 | |||||||||||||||||||||
| Junior liens |
2,025 | — | — | 40 | 37 | — | 2,102 | |||||||||||||||||||||
| Multi-family |
20,066 | — | 95 | 2,904 | 2,926 | — | 25,991 | |||||||||||||||||||||
| Construction |
24,241 | — | — | — | — | — | 24,241 | |||||||||||||||||||||
| Land |
14,674 | 654 | 215 | 362 | 10,749 | — | 26,654 | |||||||||||||||||||||
| Non-residential real estate |
131,854 | — | 1,159 | 5,492 | 12,091 | — | 150,596 | |||||||||||||||||||||
| Farmland |
40,057 | 64 | 115 | 516 | 2,122 | — | 42,874 | |||||||||||||||||||||
| Consumer loans |
14,104 | 14 | — | 21 | 299 | — | 14,438 | |||||||||||||||||||||
| Commercial loans |
71,191 | 55 | 90 | 325 | 2,493 | — | 74,154 | |||||||||||||||||||||
|
|
|
|
|
|
|
|
|
|
|
|
|
|
|
|||||||||||||||
| Total |
$ | 496,922 | 1,687 | 3,175 | 9,863 | 34,192 | — | 545,839 | ||||||||||||||||||||
|
|
|
|
|
|
|
|
|
|
|
|
|
|
|
|||||||||||||||
70
Table of Contents
HopFed Bancorp, Inc. and Subsidiaries
Notes to Consolidated Financial Statements, Continued
December 31, 2015, 2014 and 2013
| (3) | Loans Receivable, Net: (Continued) |
All loans listed as 30-89 days past due and non-accrual are not performing as agreed. Loans listed as special mention, substandard and doubtful are paying as agreed. However, the customer’s financial statements may indicate weaknesses in their current cash flow, the customer’s industry may be in decline due to current economic conditions, collateral values used to secure the loan may be declining, or the Company may be concerned about the customer’s future business prospects.
Troubled Debt Restructuring
On a periodic basis, the Company may modify the terms of certain loans. In evaluating whether a restructuring constitutes a troubled debt restructuring (TDR), Financial Accounting Standards Board has issued Accounting Standards Update 310 (ASU 310); A Creditor’s Determination of Whether a Restructuring is a Troubled Debt Restructuring. In evaluating whether a restructuring constitutes a TDR, the Company must separately conclude that both of the following exist:
| a.) | The restructuring constitutes a concession |
| b.) | The debtor is experiencing financial difficulties |
ASU 310 provides the following guidance for the Company’s evaluation of whether it has granted a concession as follows:
If a debtor does not otherwise have access to funds at a market interest rate for debt with similar risk characteristics as the restructured debt, the restructured debt would be considered a below market rate, which may indicate that the Company may have granted a concession. In that circumstance, the Company should consider all aspects of the restructuring in determining whether it has granted a concession, the creditor must make a separate assessment about whether the debtor is experiencing financial difficulties to determine whether the restructuring constitutes a TDR.
A temporary or permanent increase in the interest rate on a loan as a result of a restructuring does not eliminate the possibility of the restructuring from being considered a concession if the new interest rate on the loan is below the market interest rate for loans of similar risk characteristics.
A restructuring that results in a delay in payment that is insignificant is not a concession. However, the Company must consider a variety of factors in assessing whether a restructuring resulting in a delay in payment is insignificant.
71
Table of Contents
HopFed Bancorp, Inc. and Subsidiaries
Notes to Consolidated Financial Statements, Continued
December 31, 2015, 2014 and 2013
(Table Amount in Thousands)
| (3) | Loans Receivable, Net: (Continued) |
Troubled Debt Restructurings, (Continued)
At December 31, 2015, the Company had two loan relationships with a total of eight loans classified as performing TDR. The largest loan relationship classified as a TDR is collateralized by non-owner occupied commercial real estate and was placed on interest only payments in 2014. At July 31, 2015, both loans were removed from interest only and are now paying monthly principal and interest payments in accordance with the Company’s loan policy. At December 31, 2015, the loan relationship has a balance of approximately $3.3 million.
The second TDR relationship includes six loans and is secured by a non-owner occupied commercial real estate loan. This loan relationship was placed on interest only payments in the third quarter of 2015. The owner has significant equity in the collateral and is attempting the sell the asset to use the equity for unanticipated financial obligations. The aggregate loan balance of this relationship is $2.2 million. A summary of the activity in loans classified as TDRs for the twelve month period ended December 31, 2015, is as follows:
| Balance at | New | Loss or | Transferred to | Loan | Balance at |
|||||||||||||||||||
| 12/31/14 | TDR | Foreclosure | Non-accrual | Amortization | 12/31/15 | |||||||||||||||||||
| Non-residential real estate |
$ | 3,284 | 2,265 | — | — | (13 | ) | $ | 5,536 | |||||||||||||||
|
|
|
|
|
|
|
|
|
|
|
|
|
|||||||||||||
| Total performing TDR |
$ | 3,284 | 2,265 | — | — | (13 | ) | $ | 5,536 | |||||||||||||||
|
|
|
|
|
|
|
|
|
|
|
|
|
|||||||||||||
A summary of the activity in loans classified as TDRs for the year ended December 31, 2014, is as follows:
| Balance at | New | Loss or | Transferred to | Removed from (Taken to) |
Balance at |
|||||||||||||||||||
| 12/31/13 | TDR | Foreclosure | Held For Sale | Non-accrual | 12/31/14 | |||||||||||||||||||
| Non-residential real estate |
$ | — | 10,271 | — | (6,987 | ) | — | 3,284 | ||||||||||||||||
|
|
|
|
|
|
|
|
|
|
|
|
|
|||||||||||||
| Total performing TDR |
$ | — | 10,271 | — | (6,987 | ) | — | $ | 3,284 | |||||||||||||||
|
|
|
|
|
|
|
|
|
|
|
|
|
|||||||||||||
72
Table of Contents
HopFed Bancorp, Inc. and Subsidiaries
Notes to Consolidated Financial Statements, Continued
December 31, 2015, 2014 and 2013
(Table Amounts in Thousands)
| (3) | Loans Receivable, Net: (Continued) |
The Company originates loans to officers and directors and their affiliates at terms substantially identical to those available to other borrowers. Loans to officers and directors at December 31, 2015 and December 31, 2014, were approximately $3.8 million and $4.0 million, respectively. At December 31, 2015, funds committed that were undisbursed to officers and directors approximated $493,000.
The following summarizes activity of loans to officers and directors and their affiliates for the years ended December 31, 2015, and December 31, 2014:
| 2015 | 2014 | |||||||
| Balance at beginning of period |
4,022 | 4,800 | ||||||
| New loans |
682 | 669 | ||||||
| Principal repayments |
(860 | ) | (1,447 | ) | ||||
|
|
|
|
|
|||||
| Balance at end of period |
3,844 | 4,022 | ||||||
|
|
|
|
|
|||||
| (4) | Premises and Equipment: |
Components of premises and equipment included in the consolidated balance sheets as of December 31, 2015 and December 31, 2014, consisted of the following:
| 2015 | 2014 | |||||||
| Land |
$ | 6,579 | $ | 6,576 | ||||
| Land improvements |
1,097 | 611 | ||||||
| Buildings |
22,405 | 20,914 | ||||||
| Construction in process |
— | 486 | ||||||
| Furniture and equipment |
6,488 | 6,213 | ||||||
|
|
|
|
|
|||||
| 36,569 | 34,800 | |||||||
| Less accumulated depreciation |
12,535 | 11,860 | ||||||
|
|
|
|
|
|||||
| Premises and equipment, net |
$ | 24,034 | $ | 22,940 | ||||
|
|
|
|
|
|||||
Depreciation expense was approximately $1,266,000, $1,336,000 and $1,502,000 for the years ended December 31, 2015, 2014 and 2013, respectively.
73
Table of Contents
HopFed Bancorp, Inc. and Subsidiaries
Notes to Consolidated Financial Statements, Continued
December 31, 2015, 2014 and 2013
(Table Amounts in Thousands)
| (5) | Intangible Assets: |
The amount of other intangible assets and the changes in the carrying amounts of other intangible assets for the years ended December 31, 2015, 2014 and 2013:
| Core Deposits | ||||
| Intangible | ||||
| Balance, December 31, 2012 |
$ | 292 | ||
| Amortization |
(162 | ) | ||
|
|
|
|||
| Balance December 31, 2013 |
130 | |||
| Amortization |
(97 | ) | ||
|
|
|
|||
| Balance December 31, 2014 |
33 | |||
| Amortization |
(33 | ) | ||
|
|
|
|||
| Balance, December 31, 2015 |
$ | — | ||
|
|
|
|||
74
Table of Contents
HopFed Bancorp, Inc. and Subsidiaries
Notes to Consolidated Financial Statements, Continued
December 31, 2015, 2014 and 2013
(Table Amounts in Thousands)
| (6) | Deposits: |
At December 31, 2015, the scheduled maturities of other time deposits were as follows:
Years Ending December 31,
| 2016 |
$ | 201,329 | ||
| 2017 |
60,281 | |||
| 2018 |
36,975 | |||
| 2019 |
6,441 | |||
| 2020 |
9,638 | |||
|
|
|
|||
| $ | 314,664 | |||
|
|
|
The amount of other time deposits with a minimum denomination of $250,000 was approximately $78.8 million at December 31, 2015, and December 31, 2014, respectively. At December 31, 2015, directors, members of senior management and their affiliates had deposits in the Bank of approximately $6.2 million.
Interest expense on deposits for the years ended December 31, 2015, December 31, 2014 and December 31, 2013 is summarized as follows:
| 2015 | 2014 | 2013 | ||||||||||
| Interest bearing checking accounts |
$ | 1,105 | $ | 1,253 | $ | 1,243 | ||||||
| Money market accounts |
88 | 86 | 73 | |||||||||
| Savings |
103 | 109 | 79 | |||||||||
| Other time deposits |
3,735 | 4,155 | 5,719 | |||||||||
|
|
|
|
|
|
|
|||||||
| $ | 5,031 | $ | 5,603 | $ | 7,114 | |||||||
|
|
|
|
|
|
|
|||||||
The Bank maintains clearing arrangements for its demand, interest bearing checking accounts and money market accounts with BBVA Compass Bank. The Bank is required to maintain certain cash reserves in its account to cover average daily clearings. At December 31, 2015, average daily clearings were approximately $5.9 million.
At December 31, 2015, the Company had approximately $196,000 of deposit accounts in overdraft status and thus has been reclassified to loans on the accompanying consolidated balance sheet. At December 31, 2014, the Company had approximately $248,000 of deposit accounts in overdraft status and thus has been reclassified to loans on the accompanying consolidated balance sheet. At December 31, 2015, and December 31, 2014, the Company had deposits classified as brokered deposits totaling $34.4 million and $37.1 million, respectively.
75
Table of Contents
HopFed Bancorp, Inc. and Subsidiaries
Notes to Consolidated Financial Statements, Continued
December 31, 2015, 2014 and 2013
(Table Amounts in Thousands, Except Percentages)
| (7) | Advances from Federal Home Loan Bank: |
Federal Home Loan Bank advances are summarized as follows:
| December 31, | ||||||||||||||||
| 2015 | 2014 | |||||||||||||||
| Weighted | Weighted | |||||||||||||||
| Types of Advances |
Amount | Average Rate | Amount | Average Rate | ||||||||||||
| Fixed-rate |
$ | 15,000 | 2.19 | % | $ | 34,000 | 0.88 | % | ||||||||
Scheduled maturities of FHLB advances as of December 31, 2015 are as follows:
| Years Ending | Fixed | Average | ||||||
| December 31, |
Rate | Cost | ||||||
| 2016 |
$ | 4,000 | 5.34 | % | ||||
| 2017 |
5,000 | 0.88 | % | |||||
| 2018 |
6,000 | 1.18 | % | |||||
|
|
|
|
|
|||||
| Total |
$ | 15,000 | 2.19 | % | ||||
|
|
|
|
|
|||||
The Bank has an approved line of credit of $30 million at the FHLB of Cincinnati, which is secured by a blanket agreement to maintain residential first mortgage loans and non-residential real estate loans with a principal value of 125% of the outstanding advances and has a variable interest rate. At December 31, 2015, the Bank could borrow an additional $54.0 million from the FHLB of Cincinnati without pledging additional collateral. At December 31, 2015, the Bank has an additional $17.2 million in additional collateral that could be pledged to the FHLB to secure additional advance requirements. The Bank has an $8 million unsecured line of credit with BVA Compass Bank of Birmingham, Alabama. The Company’s overnight lines of credit with both the Federal Home Loan Bank of Cincinnati and Compass Bank had no balance at December 31, 2015.
76
Table of Contents
HopFed Bancorp, Inc. and Subsidiaries
Notes to Consolidated Financial Statements, Continued
December 31, 2015, 2014 and 2013
(Table Amounts in Thousands, Except Percentages)
| (8) | Repurchase Agreements: |
In 2006, the Company enhanced its cash management product line to include an automated sweep of excess funds from checking accounts to repurchase accounts, allowing interest to be paid on excess funds remaining in checking accounts of business and municipal customers. Repurchase balances are overnight borrowings from customers and are not FDIC insured. In addition, the Company has entered into two long term repurchase agreements with third parties.
At December 31, 2015, the Company provided investment securities with a market value and book value of $45.8 million as collateral for repurchase agreements. The maximum repurchase balances outstanding during the twelve month periods ending December 31, 2015, and December 31, 2014, was $57.4 million and $57.9 million, respectively.
At December 31, 2015, and December 31, 2014, the respective cost and maturities of the Company’s repurchase agreements are as follows:
| 2015 Third Party |
Balance | Average Rate | Maturity | Comments | ||||||||||
| Merrill Lynch |
$ | 6,000 | 4.36 | % | 9/18/2016 | Quarterly callable | ||||||||
| Various customers |
39,770 | 0.61 | % | Overnight | ||||||||||
|
|
|
|
|
|||||||||||
| Total
|
$
|
45,770
|
|
|
1.13
|
%
|
||||||||
| 2014 Third Party |
Balance | Average Rate | Maturity | Comments | ||||||||||
| Merrill Lynch |
$ | 6,000 | 4.36 | % | 9/18/2016 | Quarterly callable | ||||||||
| Various customers |
51,358 | 0.60 | % | Overnight | ||||||||||
|
|
|
|
|
|||||||||||
| Total |
$ | 57,358 | 1.42 | % | ||||||||||
|
|
|
|
|
|||||||||||
77
Table of Contents
HopFed Bancorp, Inc. and Subsidiaries
Notes to Consolidated Financial Statements, Continued
December 31, 2015, 2014 and 2013
| (9) | Fair Value Measurement: |
In September 2006, FASB issued ASC Topic 820, Fair Value Measurements and Disclosures. ASC 820 establishes a fair value hierarchy which requires an entity to maximize the use of observable input and minimize the use of unobservable inputs when measuring fair value. Although ASC 820 provides for fair value accounting, the Company did not elect the fair value option for any financial instrument not presently required to be accounted for at fair value.
HopFed Bancorp has developed a process for determining fair values. Fair value is based upon quoted market prices, where available. If listed prices or quotes are not available, fair value is based upon internally developed models or processes that use primarily market based or based on third party market data, including interest rate yield curves, option volatilities and other third party information. Valuation adjustments may be made to ensure that financial instruments are recorded at fair value. Furthermore, while the Company believes its valuation methods are appropriate and consistent with other market participants, the use of different methodologies, or assumptions, to determine the fair value of certain financials instruments could result in a different estimate of fair value at the reporting date.
ASC 820 establishes a three-level valuation hierarchy for disclosure of fair value measurement. The valuation hierarchy is based upon the transparency of inputs to the valuation of an asset or liability as of the measurement date.
| • | Level 1 is for assets and liabilities that management has obtained quoted prices (unadjusted for transaction cost) or identical assets or liabilities in active markets that the Company has the ability to access as of the measurement date. |
| • | Level 2 is for assets and liabilities in which significant unobservable inputs other than Level 1 prices such as quoted prices for similar assets and liabilities; quoted prices in markets that are not active; or other inputs that are observable or can be corroborated by observable market data. |
| • | Level 3 is for assets and liabilities in which significant unobservable inputs that reflect a reporting entity’s own assumptions about the assumptions that market participants would use in pricing an asset or liability. |
The fair value of securities available for sale are determined by a matrix pricing, which is a mathematical technique what is widely used in the industry to value debt securities without relying exclusively on quoted prices for the individual securities in the Company’s portfolio but relying on the securities relationship to other benchmark quoted securities. Impaired loans are valued at the net present value of expected payments and considering the fair value of any assigned collateral.
78
Table of Contents
HopFed Bancorp, Inc. and Subsidiaries
Notes to Consolidated Financial Statements, Continued
December 31, 2015, 2014 and 2013
(Table Amounts in Thousands)
| (9) | Fair Value Measurement: (Continued) |
The Company has certain liabilities carried at fair value including interest rate swap agreements. The fair value of these liabilities is based on information obtained from a third party bank and is reflected within level 2 of the valuation hierarchy.
Assets and Liabilities Measured on a Recurring Basis
The assets and liabilities measured at fair value on a recurring basis are summarized below:
| December 31, 2015 |
Total carrying value in the consolidated |
Quoted Prices In Active Markets for |
Significant Other Observable |
Significant Unobservable |
||||||||||||
| Description |
balance sheet at December 31, 2015 |
Identical Assets (Level 1) |
Inputs (Level 2) |
Inputs (Level 3) |
||||||||||||
| Assets |
||||||||||||||||
| Available for sale securities |
$ | 237,177 | 2,000 | 233,312 | 1,865 | |||||||||||
| December 31, 2014 |
Total carrying value in the consolidated |
Quoted Prices In Active Markets for |
Significant Other Observable |
Significant Unobservable |
||||||||||||
| Description |
balance sheet at December 31, 2014 |
Identical Assets (Level 1) |
Inputs (Level 2) |
Inputs (Level 3) |
||||||||||||
| Assets |
||||||||||||||||
| Available for sale securities |
$ | 303,628 | 3,980 | 298,159 | 1,489 | |||||||||||
| Liabilities |
||||||||||||||||
| Interest rate swap |
$ | 390 | — | 390 | — | |||||||||||
79
Table of Contents
HopFed Bancorp, Inc. and Subsidiaries
Notes to Consolidated Financial Statements, Continued
December 31, 2015, 2014 and 2013
(Table Amounts in Thousands)
| (9) | Fair Value Measurement: (Continued) |
The assets and liabilities measured at fair value on a non-recurring basis are summarized below:
| December 31, 2015 |
Total carrying value in the |
Quoted Prices In Active |
Significant Other |
Significant | ||||||||||||
| Description |
consolidated balance sheet at 12/31/2015 |
Markets for Identical Assets (Level 1) |
Observable Inputs (Level 2) |
Unobservable Inputs (Level 3) |
||||||||||||
| Assets |
||||||||||||||||
| Other real estate owned |
$ | 1,736 | — | — | 1,736 | |||||||||||
| Impaired loans, net of allowance of $630 |
$ | 3,319 | — | — | 3,319 | |||||||||||
| December 31, 2014 |
Total carrying value in the |
Quoted Prices In Active |
Significant Other |
Significant | ||||||||||||
| Description |
consolidated balance sheet at 12/31/2014 |
Markets for Identical Assets (Level 1) |
Observable Inputs (Level 2) |
Unobservable Inputs (Level 3) |
||||||||||||
| Assets |
||||||||||||||||
| Other real estate owned |
$ | 1,927 | — | — | 1,927 | |||||||||||
| Impaired loans, net of allowance of $1,514 |
$ | 3,869 | — | — | 3,869 | |||||||||||
80
Table of Contents
HopFed Bancorp, Inc. and Subsidiaries
Notes to Consolidated Financial Statements, Continued
December 31, 2015, 2014 and 2013
(Table Amounts in Thousands)
| (9) | Fair Value Measurement: (Continued) |
Change in level 3 fair value measurements:
The table below includes a roll-forward of the balance sheet items for the years ended December 31, 2015 and 2014, (including the change in fair value) for assets and liabilities classified by HopFed Bancorp, Inc. within level 3 of the valuation hierarchy for assets and liabilities measured at fair value on a recurring basis. When a determination is made to classify a financial instrument within level 3 of the valuation hierarchy, the determination is based upon the significance of the unobservable factors to the overall fair value measurement. However, since level 3 financial instruments typically include, in addition to the unobservable or level 3 components, observable components (that is components that are actively quoted and can be validated to external sources), the gains and losses in the table below include changes in fair value due in part to observable factors that are part of the valuation methodology.
| Year ended December 31, | ||||||||||||||||
| 2015 | 2014 | |||||||||||||||
| Other | Other | Other | Other | |||||||||||||
| Assets | Liabilities | Assets | Liabilities | |||||||||||||
| Fair value, December 31, |
$ | 1,489 | — | $ | 1,489 | — | ||||||||||
| Change in unrealized gains (losses) included in other comprehensive income for assets and liabilities still held at December 31, |
359 | — | — | — | ||||||||||||
| Other than temporary impairment charge |
— | — | — | — | ||||||||||||
| Recovery of prior impairment charge |
17 | — | — | — | ||||||||||||
| Purchases, issuances and settlements, net |
— | — | — | — | ||||||||||||
| Transfers in and/or out of Level 3 |
— | — | — | — | ||||||||||||
|
|
|
|
|
|
|
|
|
|||||||||
| Fair value, December 31, |
$ | 1,865 | — | $ | 1,489 | — | ||||||||||
|
|
|
|
|
|
|
|
|
|||||||||
81
Table of Contents
HopFed Bancorp, Inc. and Subsidiaries
Notes to Consolidated Financial Statements, Continued
December 31, 2015, 2014 and 2013
(Table Amounts in Thousands)
| (9) | Fair Value Measurement: (Continued) |
The estimated fair values of financial instruments were as follows at December 31, 2015:
| Using | ||||||||||||||||||||
| Quoted Prices | Significant | |||||||||||||||||||
| In Active Markets | Other | Significant | ||||||||||||||||||
| Estimated | for Identical | Observable | Unobservable | |||||||||||||||||
| Carrying | Fair | Assets | Inputs | Inputs | ||||||||||||||||
| Amount | Value | Level 1 | Level 2 | Level 3 | ||||||||||||||||
| Financial Assets: |
||||||||||||||||||||
| Cash and due from banks |
$ | 46,926 | 46,926 | 46,926 | — | — | ||||||||||||||
| Interest-earning deposits |
7,772 | 7,772 | 7,772 | — | — | |||||||||||||||
| Securities available for sale |
237,177 | 237,177 | 2,000 | 233,312 | 1,865 | |||||||||||||||
| Federal Home Loan Bank stock |
4,428 | 4,428 | — | 4,428 | — | |||||||||||||||
| Loans held for sale |
2,792 | 2,792 | — | 2,792 | — | |||||||||||||||
| Loans receivable |
556,349 | 552,981 | — | — | 552,981 | |||||||||||||||
| Accrued interest receivable |
4,139 | 4,139 | — | 4,139 | — | |||||||||||||||
| Financial liabilities: |
||||||||||||||||||||
| Deposits |
739,406 | 724,877 | — | 724,877 | — | |||||||||||||||
| Advances from borrowers for taxes and insurance |
614 | 614 | — | 614 | — | |||||||||||||||
| Advances from Federal Home Loan Bank |
15,000 | 14,985 | — | 14,985 | — | |||||||||||||||
| Repurchase agreements |
45,770 | 45,931 | — | 45,931 | — | |||||||||||||||
| Subordinated debentures |
10,310 | 10,099 | — | — | 10,099 | |||||||||||||||
| Off-balance-sheet liabilities: |
||||||||||||||||||||
| Commitments to extend credit |
— | — | — | — | — | |||||||||||||||
| Commercial letters of credit |
— | — | — | — | — | |||||||||||||||
82
Table of Contents
HopFed Bancorp, Inc. and Subsidiaries
Notes to Consolidated Financial Statements, Continued
December 31, 2015, 2014 and 2013
(Table Amounts in Thousands)
| (9) | Fair Value Measurement: (Continued) |
The estimated fair values of financial instruments were as follows at December 31, 2014:
| Using | ||||||||||||||||||||
| Quoted Prices | Significant | |||||||||||||||||||
| In Active Markets | Other | Significant | ||||||||||||||||||
| Estimated | for Identical | Observable | Unobservable | |||||||||||||||||
| Carrying | Fair | Assets | Inputs | Inputs | ||||||||||||||||
| Amount | Value | Level 1 | Level 2 | Level 3 | ||||||||||||||||
| Financial Assets: |
||||||||||||||||||||
| Cash and due from banks |
$ | 34,389 | 34,389 | 34,389 | — | — | ||||||||||||||
| Interest-earning deposits |
6,050 | 6,050 | 6,050 | — | — | |||||||||||||||
| Securities available for sale |
303,628 | 303,628 | 3,980 | 298,159 | 1,489 | |||||||||||||||
| Federal Home Loan Bank stock |
4,428 | 4,428 | — | 4,428 | — | |||||||||||||||
| Loans held for sale |
1,444 | 1,444 | — | 1,444 | — | |||||||||||||||
| Loans receivable |
539,264 | 537,493 | — | — | 537,493 | |||||||||||||||
| Accounts receivable |
4,576 | 4,576 | — | 4,576 | — | |||||||||||||||
| Financial liabilities: |
||||||||||||||||||||
| Deposits |
731,308 | 714,750 | — | 714,750 | — | |||||||||||||||
| Advances from borrowers for taxes and insurance |
513 | 513 | — | 513 | — | |||||||||||||||
| Advances from Federal Home Loan Bank |
34,000 | 34,217 | — | 34,217 | — | |||||||||||||||
| Repurchase agreements |
57,358 | 57,688 | — | 57,688 | — | |||||||||||||||
| Subordinated debentures |
10,310 | 10,099 | — | — | 10,099 | |||||||||||||||
| Off-balance-sheet liabilities: |
||||||||||||||||||||
| Commitments to extend credit |
— | — | — | — | — | |||||||||||||||
| Commercial letters of credit |
— | — | — | — | — | |||||||||||||||
| Market value of interest rate swap |
390 | 390 | — | 390 | — | |||||||||||||||
83
Table of Contents
HopFed Bancorp, Inc. and Subsidiaries
Notes to Consolidated Financial Statements, Continued
December 31, 2015, 2014 and 2013
(Table Amounts in Thousands)
| (9) | Fair Value Measurement: (Continued) |
Non-Financial Assets and Non-Financial Liabilities:
The Company has no non-financial assets or non-financial liabilities measured at fair value on a recurring basis. Certain non-financial assets measured at fair value on a non-recurring basis include foreclosed assets (upon initial recognition or subsequent impairment), non-financial assets and intangible assets and other non-financial long-lived assets measured at fair value for impairment assessment. Non-financial assets measured at fair value on a non-recurring basis during the reported periods include certain foreclosed assets which, upon initial recognition, were re-measured and reported at fair value through a charge-off to the allowance for loan losses and certain foreclosed assets which, subsequent to their initial recognition, were re-measured at fair value through a write-down included in other non-interest expense. The fair value of a foreclosed asset is estimated using Level 2 inputs based on observable market data or Level 3 inputs based on customized discounting criteria.
The following table presents foreclosed assets that were re-measured and reported at fair value:
| Years Ended December 31, | ||||||||||||
| 2015 | 2014 | 2013 | ||||||||||
| Beginning balance |
$ | 1,927 | 1,674 | 1,548 | ||||||||
| Foreclosed assets measured at initial recognition: |
||||||||||||
| Carrying value of foreclosed assets prior to acquisition |
986 | 1,816 | 1,535 | |||||||||
| Proceeds from sale of foreclosed assets |
(344 | ) | (1,118 | ) | (908 | ) | ||||||
| Charge-offs recognized in the allowance for loan loss |
(117 | ) | (237 | ) | (361 | ) | ||||||
| Losses included in non-interest expense |
(716 | ) | (208 | ) | (140 | ) | ||||||
|
|
|
|
|
|
|
|||||||
| Fair value |
$ | 1,736 | 1,927 | 1,674 | ||||||||
|
|
|
|
|
|
|
|||||||
84
Table of Contents
HopFed Bancorp, Inc. and Subsidiaries
Notes to Consolidated Financial Statements, Continued
December 31, 2015, 2014 and 2013
| (10) | Subordinated Debentures: |
On September 25, 2003, the Company formed HopFed Capital Trust I (the Trust). The Trust is a statutory trust formed under the laws of the state of Delaware. In September 2003, the Trust issued variable rate capital securities with an aggregate liquidation amount of $10,000,000 ($1,000 per preferred security) to a third-party investor. The Company then issued floating rate junior subordinated debentures aggregating $10,310,000 to the Trust. The junior subordinated debentures are the sole assets of the Trust. The junior subordinated debentures and the capital securities pay interest and dividends, respectively, on a quarterly basis. The variable interest rate is the three-month LIBOR plus 3.10% adjusted quarterly. The most recent interest rate adjustment for the trust was effective January 8, 2016, which adjusted the total coupon rate to 3.72%. These junior subordinated debentures mature in 2033, at which time the capital securities must be redeemed. The junior subordinated debentures and capital securities became redeemable contemporaneously, in whole or in part, beginning October 8, 2008 at a redemption price of $1,000 per capital security.
The Company has provided a full-irrevocable and unconditional guarantee on a subordinated basis of the obligations of the Trust under the capital securities in the event of the occurrence of an event of default, as defined in such guarantee.
| (11) | Concentrations of Credit Risk: |
Most of the Bank’s business activity is with customers located within the western part of the Commonwealth of Kentucky and middle and western Tennessee. One-to-four family residential and non residential real estate collateralize the majority of the loans. The Bank requires collateral for the majority of loans.
The distribution of commitments to extend credit approximates the distribution of loans outstanding. The contractual amounts of credit-related financial instruments such as commitments to extend credit and commercial letters of credit represent the amounts of potential accounting loss should the contract be fully drawn upon, the customer default, and the value of any existing collateral become worthless.
At December 31, 2015, all cash and cash equivalents are deposited with Compass BBVA Bank, the Federal Reserve Bank or the Federal Home Loan Bank of Cincinnati (FHLB). Deposits at Compass BBVA Bank are insured to $250,000. All deposits at the FHLB are liabilities of the individual bank and were not federally insured. The FHLB is a government sponsored enterprise (GSE) and has the second highest rating available by all rating agencies. At December 31, 2015, total FHLB deposits were approximately $12.5 million and total deposits at the Federal Reserve were $8.1 million, none of which is insured by the FDIC. At December 31, 2015, total deposits at BBVA were $26.8 million, of which $250,000 were insured by the FDIC.
85
Table of Contents
HopFed Bancorp, Inc. and Subsidiaries
Notes to Consolidated Financial Statements, Continued
December 31, 2015, 2014 and 2013
| (12) | Employee Benefit Plans: |
Stock Option Plan
On February 24, 1999, the Board of Directors of the Company adopted the HopFed Bancorp, Inc. 1999 Stock Option Plan (Option Plan), which was subsequently approved at the 1999 Annual Meeting of Stockholders. Under the Option Plan, the Option Committee has discretionary authority to grant stock options and stock appreciation rights to such employees, directors and advisory directors, as the committee shall designate. The Option Plan reserved 403,360 shares of common stock for issuance upon the exercise of options or stock appreciation rights. At December 31, 2012, the Company can no longer issue options under this plan. The remaining 20,808 options are fully vested and outstanding until their maturity date.
On May 31, 2000, the Board of Directors of the Company adopted the HopFed Bancorp, Inc. 2000 Stock Option Plan (the “2000 Option Plan”). Under the 2000 Option Plan, the option committee has discretionary authority to grant stock options to such employees as the committee shall designate. The 2000 Option Plan reserves 40,000 shares of common stock for issuance upon the exercise of options. The Company will receive the exercise price for shares of common stock issued to 2000 Option Plan participants upon the exercise of their option. The Board of Directors has granted options to purchase 40,000 shares of common stock under the 2000 Option Plan at an exercise price of $10.00 per share, which was the fair market value on the date of the grant. At December 31, 2015, all options having been granted under the 2000 Option Plan have been exercised and expired.
| Number of Shares |
Weighted Average Exercise Price |
|||||||
| Options outstanding, December 2012 |
20,808 | $ | 16.67 | |||||
| Granted |
— | — | ||||||
| Exercised |
— | — | ||||||
| Forfeited |
— | — | ||||||
|
|
|
|
|
|||||
| Options outstanding, December 2013 |
20,808 | $ | 16.67 | |||||
| Granted |
— | — | ||||||
| Exercised |
— | — | ||||||
| Forfeited |
(20,808 | ) | $ | 16.67 | ||||
|
|
|
|
|
|||||
| Options outstanding, December 2014 |
— | — | ||||||
|
|
|
|
|
|||||
At December 31, 2015, there are no stock options outstanding.
86
Table of Contents
HopFed Bancorp, Inc. and Subsidiaries
Notes to Consolidated Financial Statements, Continued
December 31, 2015, 2014 and 2013
(Table Amounts in Thousands)
| (12) | Employee Benefit Plans: (Continued) |
HopFed Bancorp Long Term Incentive Plans
On February 18, 2004, the Board of Directors of the Company adopted the HopFed Bancorp, Inc. 2004 Long Term Incentive Plan (the Plan), which was subsequently approved at the 2004 Annual Meeting of Stockholders. Under the Plan, the Compensation Committee has discretionary authority to grant up to 200,000 shares in the form of restricted stock grants, options, and stock appreciation rights to such employees, directors and advisory directors as the committee shall designate. The grants vest in equal installments over a four-year period. Grants may vest immediately upon specific events, including a change of control of the Company, death or disability of award recipient, and termination of employment of the recipient by the Company without cause.
On March 20, 2013, the Board of Directors of the Company adopted the HopFed Bancorp, Inc. 2013 Long Term Incentive Plan (the Plan), which was subsequently approved at the 2013 Annual Meeting of Stockholders. Under the Plan, the Compensation Committee has discretionary authority to grant up to 300,000 shares in the form of restricted stock grants and options to such employees, directors and advisory directors as the committee shall designate. The grants vest in equal installments over a three or four year period. Grants may vest immediately upon specific events, including a change of control of the Company, death or disability of award recipient, and termination of employment of the recipient by the Company without cause. The 2004 Plan has now expired and no other shares may be issued under the 2004 Plan.
Awards are recognized as an expense to the Company in accordance with the vesting schedule. Awards in which the vesting is accelerated must be recognized as an expense immediately. Awards are valued at the closing stock price on the day the award is granted. For the year ended December 31, 2015, the Compensation Committee granted 2,034 shares of restricted stock with a market value of $25,000. For the year ended December 31, 2014, the Compensation Committee granted 22,378 shares of restricted stock with a market value of $260,000. For the year ended December 31, 2013, the Compensation Committee granted 21,559 shares of restricted stock with a market value of $232,000. The Company recognized $190,000, $164,000, and $115,000 in compensation expense in 2015, 2014 and 2013, respectively.
The remaining compensation expense to be recognized at December 31, 2015, is as follows:
| Year Ending December 31, |
Approximate Future Compensation Expense |
|||
| 2016 |
$ | 139 | ||
| 2017 |
52 | |||
| 2018 |
9 | |||
| 2019 |
3 | |||
|
|
|
|||
| Total |
$ | 203 | ||
|
|
|
|||
87
Table of Contents
HopFed Bancorp, Inc. and Subsidiaries
Notes to Consolidated Financial Statements, Continued
December 31, 2015, 2014 and 2013
| (12) | Employee Benefit Plans: (Continued) |
HopFed Bancorp Long Term Incentive Plans
The Compensation Committee may make additional awards of restricted stock, thereby increasing the future expense related to this plan. The early vesting of restricted stock awards due to factors outlined in the award agreement may accelerate future compensation expenses related to the plan. However, the total amount of future compensation expense would not change as a result of an accelerated vesting of shares. At December 31, 2015, the Company has 254,256 restricted shares available from the HopFed Bancorp, Inc. 2013 Long Term Incentive Plan that may be awarded.
401(K) Plan
The Company has a 401(K) retirement program that is available to all employees who meet minimum eligibility requirements. Participants may generally contribute up to 15% of earnings. Prior to January 1, 2015, the Company matched employee contributions up to 4%. In addition, the Company chose to provide all eligible employees an additional 4% of compensation without regards to the amount of the employee contribution. Expense related to Company contributions amounted to $769,000 and $737,000 in 2014 and 2013, respectively. The reduction in expense related to the 401K program in 2014 and 2013 was the offset of approximately $43,000 and $22,000, respectively, in Company contributions forfeited by employees who are no longer employed by the Company and have not met the full vesting requirements of the plan. In 2015, the Company discontinued all 401(K) contributions on behalf of employees while allowing employees to continue to make contributions to the plan. The Company established a new retirement plan for all employees discussed below.
HopFed Bancorp, Inc. 2015 Employee Stock Ownership Plan
On March 2, 2015, the Company implemented the HopFed Bancorp, Inc. 2015 Employee Stock Ownership Plan (the “ESOP”) which covers substantially all employees who are at least 21 years old with at least one year of employment with the Company and Heritage Bank USA, Inc. (the “Bank”), the Company’s commercial bank subsidiary. The ESOP has three individuals who have been selected by the Company to serve as trustees. A directed corporate trustee has also been appointed. The ESOP will be administered by a committee (the “Committee”) currently composed of eleven employees selected by the Company or its designee. The 2015 ESOP received approval from the Federal Reserve Bank of St. Louis to own up to 24.9% of the Company’s stock.
88
Table of Contents
HopFed Bancorp, Inc. and Subsidiaries
Notes to Consolidated Financial Statements, Continued
December 31, 2015, 2014 and 2013
| (12) | Employee Benefit Plans: (Continued) |
HopFed Bancorp, Inc. 2015 Employee Stock Ownership Plan (Continued)
On March 2, 2015, the ESOP entered into a loan agreement with the Corporation to borrow up to $13,500,000 to purchase up to 1,000,000 shares common stock (“ESOP Loan”). On the same date, the ESOP purchased 600,000 shares from the Corporation at a cost of $7,884,000 using the proceeds of the ESOP Loan. In accordance with the ESOP Loan documents, the common stock purchased by the ESOP serves as collateral for the ESOP Loan. The ESOP Loan will be repaid principally from discretionary contributions by the Bank to the ESOP. The ESOP Loan was amended to provide for no future draws and a final maturity of December 9, 2026. The interest rate on the ESOP Loan is 3.0%. Shares purchased by the ESOP will be held in a suspense account for allocation among participants as the ESOP Loan is repaid. The ESOP shares are dividend paying. Dividends on unearned shares will be used to repay the ESOP Loan.
For the year ended December 31, 2015, the Company recognized an expense of $652,000 related to the ESOP loan payment. At December 31, 2015, the Company released 53,587 shares from the ESOP trust to individual employees of the plan as a result of the loan payment.
Deferred Compensation Plan
During 2002, the Company purchased assets and assumed the liabilities relating to a nonqualified deferred compensation plan for certain employees of the Fulton division. The Company owns single premium life insurance policies on the life of each participant and is the beneficiary of the policy value. When a participant retires, the benefits accrued for each participant will be distributed to the participant in equal installments for 15 years. The plan is now fully funded and no additional expenses will be recognized. The Deferred Compensation Plan also provides the participant with life insurance coverage, which is a percentage of the net death proceeds for the policy, if any, applicable to the participant. The original face value of all deferred compensation contracts was approximately $668,000. At December 31, 2015, the accrued value of all deferred compensation contacts is approximately $265,000. The Company is currently making cash remittances of approximately $12,000 per year on deferred compensation contracts.
89
Table of Contents
HopFed Bancorp, Inc. and Subsidiaries
Notes to Consolidated Financial Statements, Continued
December 31, 2015, 2014 and 2013
(Table Amounts in Thousands Except Percentages)
| (13) | Income Taxes: |
The provision for income tax expense (benefit) for the years ended December 31, 2015, December 31, 2014, and December 31, 2013, consisted of the following:
| 2015 | 2014 | 2013 | ||||||||||
| Current |
||||||||||||
| Federal |
$ | — | — | (32 | ) | |||||||
| State |
97 | 30 | 110 | |||||||||
|
|
|
|
|
|
|
|||||||
| 97 | 30 | 78 | ||||||||||
| Deferred |
||||||||||||
| Federal |
177 | (231 | ) | 566 | ||||||||
| State |
— | — | — | |||||||||
|
|
|
|
|
|
|
|||||||
| 177 | (231 | ) | 566 | |||||||||
|
|
|
|
|
|
|
|||||||
| $ | 274 | (201 | ) | 644 | ||||||||
|
|
|
|
|
|
|
|||||||
Total income tax expense for the years ended December 31, 2015, December 31, 2014, and December 31, 2013, differed from the amounts computed by applying the federal income tax rate of 34 percent to income before income taxes as follows:
| 2015 | 2014 | 2013 | ||||||||||
| Expected federal income tax expense at statutory tax rate |
$ | 911 | 679 | 1,498 | ||||||||
| Effect of nontaxable interest income |
(458 | ) | (542 | ) | (590 | ) | ||||||
| Effect of nontaxable bank owned life insurance income |
(114 | ) | (104 | ) | (120 | ) | ||||||
| Effect of QSCAB credit |
(109 | ) | (220 | ) | (220 | ) | ||||||
| State taxes on income, net of federal benefit |
59 | 10 | 73 | |||||||||
| Other tax credits |
(80 | ) | (80 | ) | (80 | ) | ||||||
| Non deductible expenses |
65 | 56 | 83 | |||||||||
|
|
|
|
|
|
|
|||||||
| Total income tax expense |
$ | 274 | ($ | 201 | ) | 644 | ||||||
|
|
|
|
|
|
|
|||||||
| Effective tax rate (benefit) |
10.2 | % | (10.1 | %) | 14.6 | % | ||||||
|
|
|
|
|
|
|
|||||||
90
Table of Contents
HopFed Bancorp, Inc. and Subsidiaries
Notes to Consolidated Financial Statements, Continued
December 31, 2015, 2014 and 2013
(Table Amounts in Thousands)
| (13) | Income Taxes: (Continued) |
The components of deferred taxes as of December 31, 2015, and December 31, 2014, are summarized as follows:
| 2015 | 2014 | |||||||
| Deferred tax assets: |
||||||||
| Allowance for loan loss |
$ | 1,938 | $ | 2,116 | ||||
| Accrued expenses |
377 | 89 | ||||||
| Net operating loss carry forward |
1,182 | 1,135 | ||||||
| Tax credit carry forward |
258 | 258 | ||||||
| Intangible amortization |
784 | 981 | ||||||
| Other |
267 | 287 | ||||||
| Other real estate owned |
— | 95 | ||||||
|
|
|
|
|
|||||
| 4,806 | 4,961 | |||||||
|
|
|
|
|
|||||
| Deferred tax liabilities: |
||||||||
| FHLB stock dividends |
(787 | ) | (787 | ) | ||||
| Unrealized gain on items in comprehensive income |
(1,275 | ) | (1,832 | ) | ||||
| Depreciation and amortization |
(102 | ) | (81 | ) | ||||
|
|
|
|
|
|||||
| (2,164 | ) | (2,700 | ) | |||||
|
|
|
|
|
|||||
| Net deferred tax asset |
$ | 2,642 | $ | 2,261 | ||||
|
|
|
|
|
|||||
The Small Business Protection Act of 1996, among other things, repealed the tax bad debt reserve method for thrifts effective for taxable years beginning after December 31, 1995. Commercial banks with assets greater than $500 million can no longer use the reserve method and may only deduct loan losses as they actually arise (i.e., the specific charge-off method). At December 31, 2015, the Company has net operating loss carry forwards of $3.1 million which begin to expire in 2034.
The portion of a thrift’s tax bad debt reserve that is not recaptured (generally pre-1988 bad debt reserves) under the 1996 law is only subject to recapture at a later date under certain circumstances. These include stock repurchase redemptions by the thrift or if the thrift converts to a type of institution (such as a credit union) that is not considered a bank for tax purposes. However, no recapture was required due to the Bank’s charter conversion from a thrift to a commercial bank or if the bank was acquired by another bank. The Bank does not anticipate engaging in any transactions at this time that would require the recapture of its remaining tax bad debt reserves. Therefore, retained earnings at December 31, 2015, and December 31, 2014, includes approximately $4,027,000 which represents such bad debt deductions for which no deferred income taxes have been provided.
91
Table of Contents
HopFed Bancorp, Inc. and Subsidiaries
Notes to Consolidated Financial Statements, Continued
December 31, 2015, 2014 and 2013
(Table Amounts in Thousands)
| (13) | Income Taxes: (Continued) |
No valuation allowance for deferred tax assets was recorded at December 31, 2015, and December 31, 2014, as management believes it is more likely than not that all of the deferred tax assets will be realized because they were supported by recoverable taxes paid in prior years and expected future taxable income. There were no unrecognized tax benefits during any of the reported periods. The Corporation files income tax returns in the U.S. federal jurisdiction. The Company is no longer subject to U.S. federal income tax examinations by tax authorities for years before 2011.
| (14) | Real Estate and Other Assets Owned: |
The Company’s real estate and other assets owned balances at December 31, 2015, and December 31, 2014, represent properties and personal collateral acquired by the Bank through customer loan defaults. The property is recorded at the lower of cost or fair value less estimated cost of to sell at the date acquired with any loss recognized as a charge off through the allowance for loan loss account. Additional real estate and other asset losses may be determined on individual properties at specific intervals or at the time of disposal. Additional losses are recognized as a non-interest expense. As of December 31, 2015, and December 31, 2014, the composition of the Company’s balance in both real estate and other assets owned are as follows:
| December 31, | ||||||||
| 2015 | 2014 | |||||||
| One-to-four family mortgages |
$ | 55 | $ | 159 | ||||
| Land |
943 | 1,768 | ||||||
| Non-residential real estate |
738 | — | ||||||
|
|
|
|
|
|||||
| Total other assets owned |
$ | 1,736 | $ | 1,927 | ||||
|
|
|
|
|
|||||
92
Table of Contents
HopFed Bancorp, Inc. and Subsidiaries
Notes to Consolidated Financial Statements, Continued
December 31, 2015, 2014 and 2013
(Table amounts in Thousands)
| (15) | Commitments and Contingencies: |
In the ordinary course of business, the Bank has various outstanding commitments and contingent liabilities that are not reflected in the accompanying consolidated financial statements.
The Bank had open loan commitments at December 31, 2015, and December 31, 2014, of approximately $46.4 million and $45.2 million, respectively. At December 31, 2015 and December 31, 2014, the Bank had no fixed rate loan commitments. Unused lines of credit were approximately $84.9 million and $80.1 million at December 31, 2015 and 2014, respectively. Also at December 31, 2015 and December 31, 2014, the Bank has unused consumer lines of credit tied to customer deposit accounts of $9.5 million and $35.5 million, respectively.
The Company and the Bank have agreed to enter into employment agreements with certain officers, which provide certain benefits in the event of their termination following a change in control of the Company or the Bank. The employment agreements provide for an initial term of three years. On each anniversary of the commencement date of the employment agreements, the term of each agreement may be extended for an additional year at the discretion of the Board. In the event of a change in control of the Company or the Bank, as defined in the agreement, the officers shall be paid an amount equal to two times the officer’s base salary as defined in the employment agreement.
The Company and the Bank have entered into commitments to rent facilities, purchase services and lease operating equipment that are non-cancelable. At December 31, 2015, future minimal purchase, lease and rental commitments were as follows:
| Years Ending December 31 |
||||
| 2016 |
$ | 2,352 | ||
| 2017 |
2,240 | |||
| 2018 |
1,505 | |||
| 2019 |
1,397 | |||
| 2020 |
— | |||
|
|
|
|||
| Total |
$ | 7,494 | ||
|
|
|
|||
The Company incurred rental expenses of approximately $61,000, $66,000 and $54,000 for the years ended December 31, 2015, December 31, 2014, and December 31, 2013, respectively.
In the normal course of business, the Bank and Corporation have entered into operating contracts necessary to conduct the Company’s daily business. The most significant operating contract is for the Bank’s data processing services. The monthly cost associated with this contract is variable based on the number of accounts and usage but has an expected annual cost of approximately $1.4 million. The Bank has several ATM branding agreements with local businesses. These agreements allow the Bank to maintain a cash machine and signage in various locations for an annual cost of approximately $103,000.
93
Table of Contents
HopFed Bancorp, Inc. and Subsidiaries
Notes to Consolidated Financial Statements, Continued
December 31, 2015, 2014 and 2013
| (15) | Commitments and Contingencies: (Continued) |
The Company is partially self-insured for medical benefits provided to employees. Heritage Bank is named as the plan administrator for this plan and has retained Anthem Blue Cross Blue Shield (“Anthem”) to process claims and handle other duties of the plan. Anthem does not assume any liabilities as a third party administrator. The Bank purchased two stop-loss insurance policies to limit total medical claims from Anthem. The first specific stop-loss policy limits the Company’s cost in any one year to $90,000 per covered individual. The Company has purchased a second stop-loss policy that limits the aggregate claims for the Company in a given year at $1,852,013 based upon the Company’s current enrollment. The Company has established a liability for outstanding claims as well as incurred but unreported claims. While management uses what it believes are pertinent factors in estimating the plan liability, the actual liability is subject to change based upon unexpected claims experience and fluctuations in enrollment during the plan year. At December 31, 2015, and December 31, 2014, the Company recognized a liability for self-insured medical expenses of approximately $400,000 and $170,000, respectively.
The Company is a party to financial instruments with off-balance-sheet risk in the normal course of business to meet the financing needs of its customers and to reduce its own exposure to fluctuations in interest rates. These financial instruments include commitments to extend credit, standby letters of credit, and financial guarantees. Those instruments involve, to varying degrees, elements of credit and interest rate risk in excess of the amount recognized in the consolidated balance sheets. The contract or notional amounts of those instruments reflect the extent of involvement the Company has in particular classes of financial instruments.
The Company’s exposure to credit loss in the event of nonperformance by the other party to the financial instrument for commitments to extend credit and standby letters of credit and financial guarantees written is represented by the contractual notional amount of those instruments. The Company uses the same credit policies in making these commitments and conditional obligations as it does for on-balance-sheet instruments.
Commitments to extend credit are agreements to lend to a customer as long as there is no violation of any condition established in the contract. Commitments generally have fixed expiration dates or other termination clauses and may require payment of a fee. Since many of the commitments are expected to expire without being drawn upon, the total commitment amounts do not necessarily represent future cash requirements. The Company evaluates each customer’s creditworthiness on a case-by-case basis. The amount of collateral obtained, if deemed necessary by the Company upon extension of credit, is based on management’s credit evaluation of the counter-party. Collateral held varies but may include property, plant, and equipment and income-producing commercial properties.
94
Table of Contents
HopFed Bancorp, Inc. and Subsidiaries
Notes to Consolidated Financial Statements, Continued
December 31, 2015, 2014 and 2013
| (15) | Commitments and Contingencies: (Continued) |
Standby letters of credit are conditional commitments issued by the Company to guarantee the performance of a customer to a third party. Those guarantees are primarily issued to support public and private borrowing arrangements, including commercial paper, bond financing, and similar transactions. Most guarantees extend from one to two years. The credit risk involved in issuing letters of credit is essentially the same as that involved in extending loan facilities to customers.
In October of 2008, the Company entered into an interest rate swap agreement for a term of seven years and an amount of $10 million. The Bank paid a fixed rate of 7.27% for seven years and received an amount equal to the three-month London Interbank Lending Rate (Libor) plus 3.10%. The interest rate swap was classified as a cash flow hedge by the Bank and was tested quarterly for effectiveness. The interest rate swap matured on October 8, 2015.
The Bank, in the normal course of business, originates fixed rate mortgages that are sold to Freddie Mac. Upon tentative underwriting approval by Freddie Mac, the Bank issues a best effort commitment to originate a fixed rate first mortgage under specific terms and conditions that the Bank intends to sell to Freddie Mac. The Bank no longer assumes a firm commitment to originate fixed rate loans, thus eliminating the risk of having to deliver loans they did not close or pay commitment fees to make Freddie Mac whole.
The Company is subject to various claims and legal actions that have arisen in the course of conducting business. Management does not expect the ultimate disposition of these matters to have a material adverse impact on the Company’s financial statements.
| (16) | Regulatory Matters: |
Prior to June 5, 2013, the Corporation was a federally chartered thrift holding company regulated by the Federal Reserve Bank and the bank subsidiary was regulated by the Office of the Comptroller of the Currency. On June 5, 2013, the Bank converted its charter to a Kentucky non-member state chartered commercial bank. The Corporation is now a commercial bank holding company and, as such, is subject to regulation, examination and supervision by the Federal Reserve Bank. The Corporation’s wholly owned bank subsidiary is a state chartered commercial bank supervised by the Kentucky Department of Financial Institutions and the Federal Deposit Insurance Corporation. Failure to meet minimum capital requirements can initiate certain mandatory and possibly additional discretionary actions by regulators that, if undertaken, could have a direct material effect on the Corporation’s and the Bank’s financial statements.
Under capital adequacy guidelines and the regulatory framework for prompt corrective action, the Bank must meet specific capital guidelines that involve quantitative measures of the Bank’s assets, liabilities and certain off-balance sheet items as calculated under regulatory accounting practices. The Bank’s capital amounts and classification are also subject to qualitative judgments by the regulators about components, risk weightings and other factors.
95
Table of Contents
HopFed Bancorp, Inc. and Subsidiaries
Notes to Consolidated Financial Statements, Continued
December 31, 2015, 2014 and 2013
(Table Amounts in Thousands, Except Percentages)
| (16) | Regulatory Matters: (Continued) |
Quantitative measures established by regulation to ensure capital adequacy require the Bank to maintain minimum amounts and ratios (set forth in the table below) of tangible and core capital (as defined in the regulations) to adjusted total assets (as defined), and of total capital (as defined) and Tier 1 to risk weighted assets (as defined). Management believes, as of December 31, 2015, and December 31, 2014, that the Bank meets all capital adequacy requirements to which it is subject.
The Company’s consolidated capital ratios and the Bank’s actual capital amounts and ratios as of December 31, 2015, and December 31, 2014, are presented below:
| To be Well | ||||||||||||||||||||||||
| For Capital | Capitalized for | |||||||||||||||||||||||
| Adequacy | Prompt Correction | |||||||||||||||||||||||
| Actual | Purchases | Action Provisions | ||||||||||||||||||||||
| Amount | Ratio | Amount | Ratio | Amount | Ratio | |||||||||||||||||||
| As of December 31, 2015 |
||||||||||||||||||||||||
| Tier 1 leverage capital to adjusted total assets |
||||||||||||||||||||||||
| Company |
$ | 95,156 | 10.9 | % | $ | 34,924 | 4.0 | % | $ | 43,656 | 5.0 | % | ||||||||||||
| Bank |
$ | 93,328 | 10.7 | % | $ | 34,840 | 4.0 | % | $ | 43,550 | 5.0 | % | ||||||||||||
| Total capital to risk weighted assets |
||||||||||||||||||||||||
| Company |
$ | 100,857 | 17.3 | % | $ | 46,772 | 8.0 | % | $ | 58,465 | 10.0 | % | ||||||||||||
| Bank |
$ | 99,029 | 17.1 | % | $ | 46,272 | 8.0 | % | $ | 57,840 | 10.0 | % | ||||||||||||
| Tier 1 capital to risk weighted assets |
||||||||||||||||||||||||
| Company |
$ | 95,156 | 16.3 | % | $ | 35,079 | 6.0 | % | $ | 46,772 | 8.0 | % | ||||||||||||
| Bank |
$ | 93,328 | 16.1 | % | $ | 34,704 | 6.0 | % | $ | 46,272 | 8.0 | % | ||||||||||||
| Common equity tier 1 capital to risk weighted assets |
||||||||||||||||||||||||
| Company |
$ | 95,156 | 16.3 | % | $ | 26,309 | 4.5 | % | n/a | n/a | ||||||||||||||
| Bank |
$ | 93,328 | 16.1 | % | $ | 26,028 | 4.5 | % | $ | 37,596 | 6.5 | % | ||||||||||||
| As of December 31, 2014 |
||||||||||||||||||||||||
| Tier 1 leverage capital to adjusted total assets |
||||||||||||||||||||||||
| Company |
$ | 104,813 | 11.1 | % | $ | 37,763 | 4.0 | % | $ | 47,204 | 5.0 | % | ||||||||||||
| Bank |
$ | 102,240 | 11.0 | % | $ | 37,252 | 4.0 | % | $ | 46,567 | 5.0 | % | ||||||||||||
| Total capital to risk weighted assets |
||||||||||||||||||||||||
| Company |
$ | 111,102 | 19.1 | % | $ | 46,662 | 8.0 | % | $ | 58,327 | 10.0 | % | ||||||||||||
| Bank |
$ | 108,529 | 18.6 | % | $ | 46,576 | 8.0 | % | $ | 58,220 | 10.0 | % | ||||||||||||
| Tier 1 capital to risk weighted assets |
||||||||||||||||||||||||
| Company |
$ | 104,813 | 18.0 | % | $ | 23,331 | 4.0 | % | n/a | n/a | ||||||||||||||
| Bank |
$ | 102,240 | 17.6 | % | $ | 23,288 | 4.0 | % | $ | 34,932 | 6.0 | % | ||||||||||||
96
Table of Contents
HopFed Bancorp, Inc. and Subsidiaries
Notes to Consolidated Financial Statements, Continued
December 31, 2015, 2014 and 2013
| (17) | Stockholders’ Equity: |
The Company’s sources of income and funds for dividends to its stockholders are earnings on its investments and dividends from the Bank. The Bank’s primary regulator, the KDFI, has regulations that impose certain restrictions on payment of dividends to the Corporation. Current regulations of the KDFI allow the Bank (based upon its current capital level and supervisory status assigned by the KDFI) to pay a dividend as long as the Bank subsidiary maintains an appropriate Tier 1 Capital ratio. Furthermore, for the Bank to pay a dividend to the Corporation without regulatory approval, the dividend is limited to the total amount of the Bank’s current year net income plus the Bank’s net income of the prior two years less any previous dividends paid by the Bank to the Corporation during that time. At December 31, 2015, the Bank was unable to pay additional dividends to the Corporation without regulatory approval. Given the prospects for the approval of Basel III, the Company anticipates that in practice it will need to maintain a minimum Tier 1 Capital ratio of 8.50% at its bank subsidiary to continue to pay dividends to common shareholders and will structure its business plan to maintain a Tier 1 Capital ratio at the Bank level at or above 9.00%.
Federal Reserve regulations also place restrictions after the conversion on the Company with respect to repurchases of its common stock. With prior notice to the Federal Reserve, the Company is allowed to repurchase its outstanding shares. In August 2006, under the supervision of the OTS, the Company announced that it replaced a previously announced stock buyback plan with a new plan to purchase up to 125,000 shares of common stock over the next two years. Under the plan that expired September 30, 2008, the Company purchased 106,647 shares of common stock at an average price of $15.36 per share. The Company reissued 112,639 shares of Treasury Stock as part of the stock offering discussed below.
On October 28, 2014, the Company’s Board of Directors announced it may purchase an additional 300,000 shares of common stock and another 1.0 million shares of common stock for general corporate purchases or future employee benefit plans. That plan expired October 31, 2015, with the Company having purchased 860,303 shares of common stock and having reissued 600,000 shares of common stock to establish the ESOP. On November 18, 2015, the Company’s announced a new stock repurchase program of up to 300,000 shares of the Company’s common stock that will expire December 31, 2017. The Company will conduct repurchases through open market transactions or in privately negotiated transactions that may be made from time to time depending on market conditions and other factors. At December 31, 2015, the Company holds a total of 1,085,888 shares of treasury stock at an average price of $12.41 per share. At December 31, 2015, the Company may purchase 252,798 shares of treasury stock under the current approved plan.
On December 12, 2008, HopFed Bancorp issued 18,400 shares of preferred stock to the United States Treasury (Treasury) for $18,400,000 pursuant to the Capital Purchase Program. The Company issued a Warrant to the Treasury as a condition to its participation in the Capital Purchase Program. The Warrant had an exercise price of $11.32 each and was immediately exercisable, giving the Treasury the right to purchase 243,816 shares of the Company’s Common Stock.
97
Table of Contents
HopFed Bancorp, Inc. and Subsidiaries
Notes to Consolidated Financial Statements, Continued
December 31, 2015, 2014 and 2013
| (17) | Stockholders’ Equity: (Continued) |
The warrants expired ten years from the date of issuance. The Preferred Stock had no stated maturity and was non-voting, other than having class voting rights on certain matters, and pays cumulative dividends quarterly at a rate of 5% per year for the first five years and 9% thereafter. As a result of a 2% stock dividend paid to shareholders of record at September 30, 2010, and October 3, 2011, total warrants issued was adjusted to 253,667 and the warrant strike price was adjusted to $10.88.
On December 19, 2012, HopFed Bancorp repurchased the 18,400 shares of Preferred Stock previously sold to the Treasury at par plus accrued dividends. The repurchase was accomplished with the assistance of a $6.0 million dividend paid to the Company from the Bank. On January 11, 2013, the Company repurchased the warrant from the Treasury for $256,257.
On September 16, 2010, and September 21, 2011, respectively, the Company declared a 2% stock dividend payable to shareholders of record on September 30, 2010 and October 3, 2011. The stock dividend was paid on October 18, 2010, and October 18, 2011, resulting in the issuance of 143,458 shares of common stock in October of 2010 and 146,485 shares of common stock in October 2011. As discussed earlier, both the price and amount of all outstanding options and common stock warrants were adjusted accordingly.
The common stock warrants were assigned a value of $2.28 per warrant, or $555,900. As a result, the value of the warrants was recorded as a discount on the preferred stock and was accreted as a reduction in net income available for common shareholders. In 2012, the Company accelerated the last year of our warrant accretion, recognizing $222,360 of accretion, due to the repurchase of all preferred stock from the Treasury and our stated plans to attempt to repurchase the warrant. For the purposes of these calculations, the fair value of the common stock warrants was estimated using the following assumptions:
| • Risk free rate |
2.60 | % | ||
| • Expected life of warrants |
10 years | |||
| • Expected dividend yield |
3.50 | % | ||
| • Expected volatility |
26.5 | % | ||
| • Weighted average fair value |
$ | 2.28 |
The Company’s computation of expected volatility is based on the weekly historical volatility. The risk free rate was the approximate rate of the ten year treasury at the end of November 2008.
The Company has paid all interest payments due on HopFed Capital Trust 1. If interest payments to HopFed Capital Trust 1 are not made in a timely manner, the Company is prohibited from making cash dividend payments to its common shareholders.
98
Table of Contents
HopFed Bancorp, Inc. and Subsidiaries
Notes to Consolidated Financial Statements, Continued
December 31, 2015, 2014 and 2013
| (17) | Stockholders’ Equity: (Continued) |
In July 2013, the Federal Reserve Board and the FDIC approved final rules that substantially amend the regulatory risk-based capital rules applicable to Heritage Bank USA, Inc. and HopFed Bancorp, Inc. The final rules implement the regulatory capital reforms of the Basel Committee on Banking Supervision reflected in “Basel III: A Global Regulatory Framework for More Resilient Banks and Banking Systems” (Basel III) and changes required by the Dodd-Frank Act.
Under these rules, the leverage and risk-based capital ratios of bank holding companies may not be lower than the leverage and risk-based capital ratios for insured depository institutions. The final rules implementing the Basel III regulatory capital reforms will become effective as to the Bank and Corporation on January 1, 2015, and include new minimum risk-based capital and leverage ratios. Moreover, these rules refine the definition of what constitutes “capital” for purposes of calculating those ratios, including the definitions of Tier 1 capital and Tier 2 capital.
The new minimum capital level requirements applicable to bank holding companies and banks subject to the rules are:
| • | a new common equity Tier 1 capital ratio of 4.5%; |
| • | a Tier 1 risk-based capital ratio of 6% (increased from 4%) |
| • | a total risk-based capital ratio of 8% (unchanged from current rules) |
| • | a Tier 1 leverage ratio of 4% for all institutions. |
The rules also establish a “capital conservation buffer” of 2.5% (to be phased in over three years) above the new regulatory minimum risk-based capital ratios, and result in the following minimum ratios once the capital conservation buffer is fully phased in:
| • | a common equity Tier 1 risk-based capital ratio of 7.0% |
| • | a Tier 1 risk-based capital ratio of 8.5% |
| • | a total risk-based capital ratio of 10.5%. |
At December 31, 2015, the Bank and Corporation met all fully phased capital requires of Basel III, including the capital conservation buffer of 2.5%.
99
Table of Contents
HopFed Bancorp, Inc. and Subsidiaries
Notes to Consolidated Financial Statements, Continued
December 31, 2015, 2014 and 2013
| (18) | Earnings Per Share: |
Earnings per share of common stock are based on the weighted average number of basic shares and dilutive shares outstanding during the year. Common stock warrants outstanding are not included in the dilutive earnings per share computations because they would be anti-dilutive.
The following is a reconciliation of weighted average common shares for the basic and dilutive earnings per share computations:
| Years Ended December 31, | ||||||||||||
| 2015 | 2014 | 2013 | ||||||||||
| Basic earnings per share: |
||||||||||||
| Weighted average common shares |
6,919,190 | 7,306,078 | 7,483,606 | |||||||||
| Adjustment for ESOP activity |
(546,913 | ) | — | — | ||||||||
|
|
|
|
|
|
|
|||||||
| Weighted average common shares |
6,372,277 | 7,306,078 | 7,483,606 | |||||||||
| Dilutive effect of stock options |
— | — | — | |||||||||
| Weighted average common and incremental shares |
6,372,277 | 7,306,078 | 7,483,606 | |||||||||
|
|
|
|
|
|
|
|||||||
| (19) | Variable Interest Entities: |
Under ASC 810, the Company is deemed to be the primary beneficiary and required to consolidate a variable interest entity (VIE) if it has a variable interest in the VIE that provides it with a controlling financial interest. For such purposes, the determination of whether a controlling financial interest exists is based on whether a single party has both the power to direct the activities of the VIE that most significantly impact the VIE’s economic performance and the obligation to absorb losses of the VIE or the right to receive benefits from the VIE that could potentially be significant to the VIE. ASC 810 requires continual reconsideration of conclusions reached regarding which interest holder is a VIE’s primary beneficiary and disclosures surrounding those VIE’s which have not been consolidated. The consolidation methodology provided in this footnote as of December 31, 2015, and December 31, 2014, has been prepared in accordance with ASC 810. At December 31, 2015, the Company did not have any consolidated variable interest entities to disclose but did have a commitment to a low income housing partnership and issued trust preferred securities.
100
Table of Contents
HopFed Bancorp, Inc. and Subsidiaries
Notes to Consolidated Financial Statements, Continued
December 31, 2015, 2014 and 2013
(Table Amounts in Thousands)
| (20) | Condensed Parent Company Only Financial Statements: |
The following condensed balance sheets as of December 31, 2015, and December 31, 2014, and condensed statements of income and cash flows for the years ended December 31, 2015, December 31, 2014, and December 31, 2013, of the parent company only should be read in conjunction with the consolidated financial statements and the notes thereto.
| Condensed Balance Sheets: | ||||||||
| 2015 | 2014 | |||||||
| Assets: |
||||||||
| Cash and due from banks |
$ | 2,087 | 2,932 | |||||
| Investment in subsidiary |
95,804 | 106,088 | ||||||
| Prepaid expenses and other assets |
490 | 534 | ||||||
|
|
|
|
|
|||||
| Total assets |
$ | 98,381 | 109,554 | |||||
|
|
|
|
|
|||||
| Liabilities and equity |
||||||||
| Liabilities |
||||||||
| Unrealized loss on derivative |
$ | — | 390 | |||||
| Dividends payable - common |
287 | 301 | ||||||
| Interest payable |
89 | 87 | ||||||
| Other liabilities |
65 | 64 | ||||||
| Subordinated debentures |
10,310 | 10,310 | ||||||
|
|
|
|
|
|||||
| Total liabilities |
10,751 | 11,152 | ||||||
|
|
|
|
|
|||||
| Equity: |
||||||||
| Preferred stock |
— | — | ||||||
| Common stock |
79 | 79 | ||||||
| Additional paid-in capital |
58,604 | 58,466 | ||||||
| Retained earnings |
47,124 | 45,729 | ||||||
| Treasury stock- common stock |
(13,471 | ) | (9,429 | ) | ||||
| Unearned ESOP shares |
(7,180 | ) | — | |||||
| Accumulated other comprehensive income |
2,474 | 3,557 | ||||||
|
|
|
|
|
|||||
| Total equity |
87,630 | 98,402 | ||||||
|
|
|
|
|
|||||
| Total liabilities and equity |
$ | 98,381 | 109,554 | |||||
|
|
|
|
|
|||||
101
Table of Contents
HopFed Bancorp, Inc. and Subsidiaries
Notes to Consolidated Financial Statements, Continued
December 31, 2015, 2014 and 2013
(Table Amounts in Thousands)
| (20) | Condensed Parent Company Only Financial Statements: (Continued) |
Condensed Statements of Income:
| 2015 | 2014 | 2013 | ||||||||||
| Interest and dividend income: |
||||||||||||
| Dividend income from subsidiary Bank |
$ | 12,100 | 2,600 | 5,500 | ||||||||
|
|
|
|
|
|
|
|||||||
| Total interest and dividend income |
12,100 | 2,600 | 5,500 | |||||||||
|
|
|
|
|
|
|
|||||||
| Interest expense |
740 | 737 | 733 | |||||||||
| Non-interest expenses |
541 | 546 | 684 | |||||||||
|
|
|
|
|
|
|
|||||||
| Total expenses |
1,281 | 1,283 | 1,417 | |||||||||
|
|
|
|
|
|
|
|||||||
| Income before income taxes and equity in undistributed earnings of subsidiary |
10,819 | 1,317 | 4,083 | |||||||||
| Income tax benefits |
(529 | ) | (459 | ) | (496 | ) | ||||||
|
|
|
|
|
|
|
|||||||
| Income before equity in undistributed earnings of subsidiary |
11,348 | 1,776 | 4,579 | |||||||||
| Equity in (distribution in excess of) earnings of subsidiary |
(8,944 | ) | 423 | (817 | ) | |||||||
|
|
|
|
|
|
|
|||||||
| Income available to common shareholders |
$ | 2,404 | 2,199 | 3,762 | ||||||||
|
|
|
|
|
|
|
|||||||
102
Table of Contents
HopFed Bancorp, Inc. and Subsidiaries
Notes to Consolidated Financial Statements, Continued
December 31, 2015, 2014 and 2013
(Table Amounts in Thousands)
| (20) | Condensed Parent Company Only Financial Statements: (Continued) |
Condensed Statements of Cash Flows:
| 2015 | 2014 | 2013 | ||||||||||
| Cash flows from operating activities: |
||||||||||||
| Net income |
$ | 2,404 | 2,199 | 3,762 | ||||||||
| Adjustments to reconcile net income to net cash (used in) provided by operating activities |
||||||||||||
| Equity in undistributed earnings of subsidiary |
8,943 | (423 | ) | 817 | ||||||||
| Amortization of restricted stock |
190 | 164 | 115 | |||||||||
| Increase (decrease) in: |
||||||||||||
| Current income taxes payable |
11 | 200 | (355 | ) | ||||||||
| Accrued expenses |
(149 | ) | 280 | (142 | ) | |||||||
|
|
|
|
|
|
|
|||||||
| Net cash (used in) provided by operating activities: |
11,399 | 2,420 | 4,197 | |||||||||
|
|
|
|
|
|
|
|||||||
| Cash flows for investing activities: |
||||||||||||
| Net cash flow used in investing activities |
— | — | — | |||||||||
| Cash flows from financing activities: |
||||||||||||
| Purchase of preferred stock - treasury |
— | — | — | |||||||||
| Purchase of common stock - treasury |
(11,926 | ) | (3,500 | ) | (853 | ) | ||||||
| Purchase of common stock warrant |
— | — | (257 | ) | ||||||||
| Proceeds on ESOP loan |
704 | — | — | |||||||||
| Dividends paid on common stock |
(1,022 | ) | (1,187 | ) | (751 | ) | ||||||
|
|
|
|
|
|
|
|||||||
| Net cash (used in) provided by financing activities |
(12,244 | ) | (4,687 | ) | (1,861 | ) | ||||||
|
|
|
|
|
|
|
|||||||
| Net increase (decrease) in cash |
(845 | ) | (2,267 | ) | 2,336 | |||||||
|
|
|
|
|
|
|
|||||||
| Cash and due from banks at beginning of year |
2,932 | 5,199 | 2,863 | |||||||||
|
|
|
|
|
|
|
|||||||
| Cash and due from banks at end of year |
$ | 2,087 | 2,932 | 5,199 | ||||||||
|
|
|
|
|
|
|
|||||||
103
Table of Contents
HopFed Bancorp, Inc. and Subsidiaries
Notes to Consolidated Financial Statements, Continued
December 31, 2015, 2014 and 2013
(Table Amounts in Thousands)
| (21) | Investments in Affiliated Companies (Unaudited): |
Investments in affiliated companies accounted for under the equity method consist of 100% of the common stock of HopFed Capital Trust I (the Trust), a wholly owned statutory business trust. The Trust was formed on September 25, 2003. Summary financial information for the HopFed Capital Trust 1 is as follows:
Summary Balance Sheets
| December. 31, 2015 |
December. 31, 2014 |
|||||||
| Asset – investment in subordinated debentures issued by HopFed Bancorp, Inc. |
$ | 10,310 | 10,310 | |||||
|
|
|
|
|
|||||
| Liabilities |
$ | — | — | |||||
| Stockholders’ equity: |
||||||||
| Trust preferred securities |
10,000 | 10,000 | ||||||
| Common stock (100% owned by HopFed Bancorp, Inc.) |
310 | 310 | ||||||
|
|
|
|
|
|||||
| Total stockholder’s equity |
10,310 | 10,310 | ||||||
|
|
|
|
|
|||||
| Total liabilities and stockholder’s equity |
$ | 10,310 | 10,310 | |||||
|
|
|
|
|
|||||
Summary Statements of Income
| Years Ended December. 31, | ||||||||
| 2015 | 2014 | |||||||
| Income – interest income from subordinated debentures issued by HopFed Bancorp, Inc. |
$ | 354 | 348 | |||||
|
|
|
|
|
|||||
| Net income |
$ | 354 | 348 | |||||
|
|
|
|
|
|||||
Summary Statements of Stockholder’s Equity
| Trust Preferred Securities |
Common Stock |
Retained Earnings |
Total Stockholder’s Equity |
|||||||||||||
| Beginning balances, January 1, 2015 |
$ | 10,000 | 310 | — | 10,310 | |||||||||||
| Retained earnings: |
||||||||||||||||
| Net income |
— | — | 354 | 354 | ||||||||||||
| Dividends: |
||||||||||||||||
| Trust preferred securities |
— | — | (343 | ) | (343 | ) | ||||||||||
| Common dividends paid to HopFed Bancorp, Inc. |
— | — | (11 | ) | (11 | ) | ||||||||||
|
|
|
|
|
|
|
|
|
|||||||||
| Total retained earnings |
— | — | — | — | ||||||||||||
|
|
|
|
|
|
|
|
|
|||||||||
| Ending balances, December 31, 2015 |
$ | 10,000 | 310 | — | 10,310 | |||||||||||
|
|
|
|
|
|
|
|
|
|||||||||
104
Table of Contents
HopFed Bancorp, Inc. and Subsidiaries
Notes to Consolidated Financial Statements, Continued
December 31, 2015, 2014 and 2013
(Table Amounts in Thousands, Except Share and Per Share Amounts)
| (22) | Quarterly Results of Operations: (Unaudited) |
Summarized unaudited quarterly operating results for the year ended December 31, 2015:
| First Quarter |
Second Quarter |
Third Quarter |
Fourth Quarter |
|||||||||||||
| December 31, 2015: |
||||||||||||||||
| Interest and dividend income |
$ | 9,195 | 7,919 | 8,012 | 7,996 | |||||||||||
| Interest expense |
1,633 | 1,612 | 1,633 | 1,672 | ||||||||||||
|
|
|
|
|
|
|
|
|
|||||||||
| Net interest income |
7,562 | 6,307 | 6,379 | 6,324 | ||||||||||||
| Provision for loan losses |
215 | 270 | 275 | 291 | ||||||||||||
|
|
|
|
|
|
|
|
|
|||||||||
| Net interest income after provision for loan losses |
7,347 | 6,037 | 6,104 | 6,033 | ||||||||||||
| Noninterest income |
1,913 | 1,868 | 1,936 | 1,885 | ||||||||||||
| Noninterest expense |
7,470 | 8,234 | 7,553 | 7,188 | ||||||||||||
|
|
|
|
|
|
|
|
|
|||||||||
| Income (loss) before income taxes |
1,790 | (329 | ) | 487 | 730 | |||||||||||
| Income tax expense (benefit) |
435 | (212 | ) | (23 | ) | 74 | ||||||||||
|
|
|
|
|
|
|
|
|
|||||||||
| Net income (loss) |
$ | 1,355 | (117 | ) | 510 | 656 | ||||||||||
|
|
|
|
|
|
|
|
|
|||||||||
| Basic earnings (loss) per share |
$ | 0.20 | (0.02 | ) | 0.08 | 0.10 | ||||||||||
|
|
|
|
|
|
|
|
|
|||||||||
| Diluted earnings (loss) per share |
$ | 0.20 | (0.02 | ) | 0.08 | 0.10 | ||||||||||
|
|
|
|
|
|
|
|
|
|||||||||
| Weighted average shares outstanding: |
||||||||||||||||
| Basic |
6,732,456 | 6,425,687 | 6,359,556 | 6,328,324 | ||||||||||||
|
|
|
|
|
|
|
|
|
|||||||||
| Diluted |
6,732,456 | 6,425,687 | 6,359,556 | 6,328,324 | ||||||||||||
|
|
|
|
|
|
|
|
|
|||||||||
105
Table of Contents
HopFed Bancorp, Inc. and Subsidiaries
Notes to Consolidated Financial Statements, Continued
December 31, 2015, 2014 and 2013
(Table Amounts in Thousands, Except Share and Per Share Amounts)
| (22) | Quarterly Results of Operations: (Unaudited) |
Summarized unaudited quarterly operating results for the year ended December 31, 2014:
| First | Second | Third | Fourth | |||||||||||||
| Quarter | Quarter | Quarter | Quarter | |||||||||||||
| December 31, 2014: |
||||||||||||||||
| Interest and dividend income |
$ | 8,658 | 8,734 | 8,994 | 8,294 | |||||||||||
| Interest expense |
2,338 | 2,354 | 2,186 | 2,001 | ||||||||||||
|
|
|
|
|
|
|
|
|
|||||||||
| Net interest income |
6,320 | 6,380 | 6,808 | 6,293 | ||||||||||||
| Provision for loan losses |
380 | (261 | ) | (892 | ) | (1,500 | ) | |||||||||
|
|
|
|
|
|
|
|
|
|||||||||
| Net interest income after provision for loan losses |
5,940 | 6,641 | 7,700 | 7,793 | ||||||||||||
| Noninterest income |
1,598 | 1,945 | 2,393 | 1,904 | ||||||||||||
| Noninterest expense |
7,324 | 7,447 | 7,563 | 11,582 | ||||||||||||
|
|
|
|
|
|
|
|
|
|||||||||
| Income (loss) before income taxes |
214 | 1,139 | 2,530 | (1,885 | ) | |||||||||||
| Income tax expense (benefit) |
(140 | ) | 214 | 577 | (852 | ) | ||||||||||
|
|
|
|
|
|
|
|
|
|||||||||
| Net income (loss) |
$ | 354 | 925 | 1,953 | (1,033 | ) | ||||||||||
|
|
|
|
|
|
|
|
|
|||||||||
| Basic earnings (loss) per share |
$ | 0.05 | 0.13 | 0.27 | (0.14 | ) | ||||||||||
|
|
|
|
|
|
|
|
|
|||||||||
| Diluted earnings (loss) per share |
$ | 0.05 | 0.13 | 0.27 | (0.14 | ) | ||||||||||
|
|
|
|
|
|
|
|
|
|||||||||
| Weighted average shares outstanding: |
||||||||||||||||
| Basic |
7,416,716 | 7,376,726 | 7,265,597 | 7,165,957 | ||||||||||||
|
|
|
|
|
|
|
|
|
|||||||||
| Diluted |
7,416,716 | 7,376,726 | 7,265,597 | 7,165,957 | ||||||||||||
|
|
|
|
|
|
|
|
|
|||||||||
106
Table of Contents
HopFed Bancorp, Inc. and Subsidiaries
Notes to Consolidated Financial Statements, Continued
December 31, 2015, 2014 and 2013
(Table Amounts in Thousands)
| (23) | Comprehensive Income: |
FASB ASC 220, Comprehensive Income, established standards for reporting comprehensive income. Comprehensive income includes net income and other comprehensive net income which is defined as non-owner related transactions in equity. The following table sets forth the amounts of other comprehensive income (loss) included in stockholders’ equity along with the related tax effect for the years ended December 31, 2015, 2014 and 2013.
| Pre-Tax | Tax Benefit | Net of Tax | ||||||||||
| Amount | (Expense) | Amount | ||||||||||
| December 31, 2015: |
||||||||||||
| Unrealized holding gains (losses) on: |
||||||||||||
| Available for sale securities |
($ | 1,698 | ) | 577 | (1,121 | ) | ||||||
| Available for sale securities – OTTI |
359 | (122 | ) | 237 | ||||||||
| Derivatives |
389 | (132 | ) | 257 | ||||||||
| Reclassification adjustments for gains on: |
||||||||||||
| Available for sale securities |
(691 | ) | 235 | (456 | ) | |||||||
|
|
|
|
|
|
|
|||||||
| ($ | 1,641 | ) | 558 | (1,083 | ) | |||||||
|
|
|
|
|
|
|
|||||||
| December 31, 2014: |
||||||||||||
| Unrealized holding gains on: |
||||||||||||
| Available for sale securities |
$ | 7,773 | (2,643 | ) | 5,130 | |||||||
| Derivatives |
359 | (122 | ) | 237 | ||||||||
| Reclassification adjustments for gains on: |
||||||||||||
| Available for sale securities |
(578 | ) | 197 | (381 | ) | |||||||
|
|
|
|
|
|
|
|||||||
| $ | 7,554 | (2,568 | ) | 4,986 | ||||||||
|
|
|
|
|
|
|
|||||||
| December 31, 2013: |
||||||||||||
| Unrealized holding gains on: |
||||||||||||
| Available for sale securities |
($ | 16,012 | ) | 5,444 | (10,568 | ) | ||||||
| Derivatives |
376 | (128 | ) | 248 | ||||||||
| Reclassification adjustments for gains on: |
||||||||||||
| Available for sale securities |
(1,661 | ) | 565 | (1,096 | ) | |||||||
| Other than temporary impairment |
400 | (136 | ) | 264 | ||||||||
|
|
|
|
|
|
|
|||||||
| ($ | 16,897 | ) | 5,745 | (11,152 | ) | |||||||
|
|
|
|
|
|
|
|||||||
| (24) | Subsequent Event |
On February 12, 2016, the Kentucky Department of Financial Institutions granted Heritage Bank permission to pay a $2.0 million cash dividend from the Bank to the Corporation. The Bank will pay the dividend in one lump sum in 2016.
107