Attached files
| file | filename |
|---|---|
| EX-23.1 - EXHIBIT 23.1 - Blueknight Energy Partners, L.P. | exhibit231ye2015.htm |
| EX-32.1 - EXHIBIT 32.1 - Blueknight Energy Partners, L.P. | exhibit321ye2015.htm |
| EX-31.2 - EXHIBIT 31.2 - Blueknight Energy Partners, L.P. | exhibit312ye2015.htm |
| EX-31.1 - EXHIBIT 31.1 - Blueknight Energy Partners, L.P. | exhibit311ye2015.htm |
| EX-21.1 - EXHIBIT 21.1 - Blueknight Energy Partners, L.P. | exhibit211ye2015.htm |
UNITED STATES
SECURITIES AND EXCHANGE COMMISSION
Washington, D.C. 20549
FORM 10-K
x ANNUAL REPORT PURSUANT TO SECTION 13 or 15(D) OF THE SECURITIES EXCHANGE ACT OF 1934
For the fiscal year ended December 31, 2015
OR
o | TRANSITION REPORT PURSUANT TO SECTION 13 or 15(d) OF THE SECURITIES EXCHANGE ACT OF 1934 |
For the transition period from __________ to _________
Commission File Number 001-33503
BLUEKNIGHT ENERGY PARTNERS, L.P.
(Exact name of registrant as specified in its charter)
Delaware (State or other jurisdiction of incorporation or organization) | 20-8536826 (IRS Employer Identification No.) | |
201 NW 10th, Suite 200 Oklahoma City, Oklahoma 73103 (Address of principal executive offices, zip code) Registrant’s telephone number, including area code: (405) 278-6400 | ||
(Former name, former address and former fiscal year, if changed since last report)
Securities Registered Pursuant to Section 12(b) of the Act:
Title of each class | Name of each exchange on which registered | |
Common Units representing limited partner interests | Nasdaq Global Market | |
Series A Preferred Units representing limited partner interests | Nasdaq Global Market | |
Securities Registered Pursuant to Section 12(g) of the Act:
None
Indicate by check mark if the registrant is a well-known seasoned issuer, as defined in Rule 405 of the Securities Act. Yes o No x
Indicate by check mark if the registrant is not required to file reports pursuant to Section 13 or Section 15(d) of the Act. Yes o No x
Indicate by check mark whether the registrant (1) has filed all reports required to be filed by Section 13 or 15(d) of the Securities Exchange Act of 1934 during the preceding 12 months (or for such shorter period that the registrant was required to file such reports), and (2) has been subject to such filing requirements for the past 90 days. Yes ý No o
Indicate by check mark whether the registrant has submitted electronically and posted on its corporate Web site, if any, every Interactive Data File required to be submitted and posted pursuant to Rule 405 of Regulation S-T (§232.405 of this chapter) during the preceding 12 months (or for such shorter period that the registrant was required to submit and post such files). Yes ý No o
Indicate by check mark if disclosure of delinquent filers pursuant to Item 405 of Regulation S-K (§229.405 of this chapter) is not contained herein, and will not be contained, to the best of registrant's knowledge, in definitive proxy or information statements incorporated by reference in Part III of this Form 10-K or any amendment to this Form 10-K. o
Indicate by check mark whether the registrant is a large accelerated filer, an accelerated filer, a non-accelerated filer, or a smaller reporting company. See the definitions of “large accelerated filer,” “accelerated filer” and “smaller reporting company” in Rule 12b-2 of the Exchange Act. (Check one):
Large accelerated filer o | Accelerated filer ý | |
Non-accelerated filer o (Do not check if a smaller reporting company) | Smaller reporting company o | |
Indicate by check mark whether the registrant is a shell company (as defined in Rule 12b-2 of the Exchange Act). Yes o No ý
As of June 30, 2015, the aggregate market value of the registrant’s common units held by non-affiliates of the registrant was approximately $143.5 million, based on $7.49 per common unit, the closing price of the common units as reported on the NASDAQ Global Market on such date.
As of March 3, 2016, there were 30,158,619 Series A Preferred Units and 33,198,339 common units outstanding.
Table of Contents | ||
Page | ||
Business. | ||
Risk Factors. | ||
Unresolved Staff Comments. | ||
Properties. | ||
Legal Proceedings. | ||
Mine Safety Disclosures. | ||
Market for Registrant’s Common Equity, Related Unitholder Matters and Issuer Purchases of Equity Securities. | ||
Selected Financial Data. | ||
Management’s Discussion and Analysis of Financial Condition and Results of Operations. | ||
Quantitative and Qualitative Disclosures about Market Risk. | ||
Financial Statements and Supplementary Data. | ||
Changes in and Disagreements with Accountants on Accounting and Financial Disclosure. | ||
Controls and Procedures. | ||
Directors, Executive Officers and Corporate Governance. | ||
Executive Compensation. | ||
Security Ownership of Certain Beneficial Owners and Management and Related Unitholder Matters. | ||
Certain Relationships and Related Transactions, and Director Independence. | ||
Principal Accountant Fees and Services. | ||
Exhibits, Financial Statement Schedules. | ||
i
DEFINITIONS
We use the following terms in this report:
Barrel: One barrel of petroleum products equals 42 United States gallons.
Bpd: Barrels per day.
Common carrier pipeline: A pipeline engaged in the transportation of petroleum products as a public utility and common carrier for hire.
Condensate: A natural gas liquid with a low vapor pressure, mainly composed of propane, butane, pentane and heavier hydrocarbon fractions.
Feedstock: A raw material required for an industrial process such as petrochemical manufacturing.
Finished asphalt products: As used herein, the term refers to liquid asphalt cement sold directly to end users and to asphalt emulsions, asphalt cutbacks, polymer modified asphalt cement and related asphalt products processed using liquid asphalt cement. The term is also used to refer to various residual fuel oil products directly sold to end users.
Liquid asphalt cement: A dark brown to black cementitious material that is primarily produced by petroleum distillation. When crude oil is separated in distillation towers at a refinery, the heaviest hydrocarbons with the highest boiling points settle at the bottom. These tar-like fractions, called residuum, require relatively little additional processing to become products such as asphalt cement or residual fuel oil. Liquid asphalt cement is primarily used in the road construction and maintenance industry. Residual fuel oil is primarily used as a burner fuel in numerous industrial and commercial business applications. As used herein, the term refers to both liquid asphalt cement and residual fuel oils.
Midstream: The industry term for the components of the energy industry in between the production of oil and gas (upstream) and the distribution of refined and finished products (downstream).
PMAC: Polymer modified asphalt cement.
Preferred Units: Series A Preferred Units representing limited partnership interests in our partnership.
SemCorp: SemCorp refers to SemGroup Corporation and its predecessors (including SemGroup, L.P.), subsidiaries and affiliates (other than our General Partner and us during periods in which we were affiliated with SemGroup, L.P.).
Terminalling: The receipt of crude oil and petroleum products for storage into storage tanks and other appurtenant equipment, including pipelines, where the crude oil and petroleum products will be commingled with other products of similar quality; the storage of the crude oil and petroleum products; and the delivery of the crude oil and petroleum products as directed by a distributor into a truck, vessel or pipeline.
Throughput: The volume of product transported or passing through a pipeline, plant, terminal or other facility.
ii
PART I.
As used in this annual report, unless we indicate otherwise: (1) “Blueknight Energy Partners,” “our,” “we,” “us” and similar terms refer to Blueknight Energy Partners, L.P. , together with its subsidiaries, (2) our “General Partner” refers to Blueknight Energy Partners G.P., L.L.C., (3) “Vitol” refers to Vitol Holding B.V., its affiliates and subsidiaries (other than our General Partner and us) and (4) “Charlesbank” refers to Charlesbank Capital Partners, LLC, its affiliates and subsidiaries (other than our General Partner and us).
Forward Looking Statements
This report contains “forward-looking statements” within the meaning of the federal securities laws. Statements included in this annual report that are not historical facts (including any statements regarding plans and objectives of management for future operations or economic performance, or assumptions or forecasts related thereto) are forward-looking statements. These statements can be identified by the use of forward-looking terminology including “may,” “will,” “should,” “believe,” “expect,” “intend,” “anticipate,” “estimate,” “continue” or other similar words. These statements discuss future expectations, contain projections of results of operations or of financial condition, or state other “forward-looking” information. We and our representatives may from time to time make other oral or written statements that are also forward-looking statements.
Such forward-looking statements are subject to various risks and uncertainties that could cause actual results to differ materially from those anticipated as of the date of this report. Although we believe that the expectations or assumptions reflected in these forward-looking statements are based on reasonable assumptions, no assurance can be given that these expectations will prove to be correct. Important factors that could cause our actual results to differ materially from the expectations reflected in these forward-looking statements include, among other things, those set forth in “Item 1A-Risk Factors,” included in this annual report, and those set forth from time to time in our filings with the Securities and Exchange Commission (“SEC”), which are available through the Investor Relations link at www.bkep.com and through the SEC’s Electronic Data Gathering and Retrieval System (“EDGAR”) at http://www.sec.gov.
All forward-looking statements included in this report are based on information available to us on the date of this report. We undertake no obligation to publicly update or revise any forward-looking statement, whether as a result of new information, future events or otherwise. All subsequent written and oral forward-looking statements attributable to us or persons acting on our behalf are expressly qualified in their entirety by the cautionary statements contained throughout this report.
Item 1. Business
Overview
We are a publicly traded master limited partnership with operations in twenty-four states. We provide integrated terminalling, storage, gathering and transportation services for companies engaged in the production, distribution and marketing of crude oil and liquid asphalt cement. We manage our operations through four operating segments: (i) asphalt terminalling services, (ii) crude oil terminalling and storage services, (iii) crude oil pipeline services, and (iv) crude oil trucking and producer field services.
Our Operations
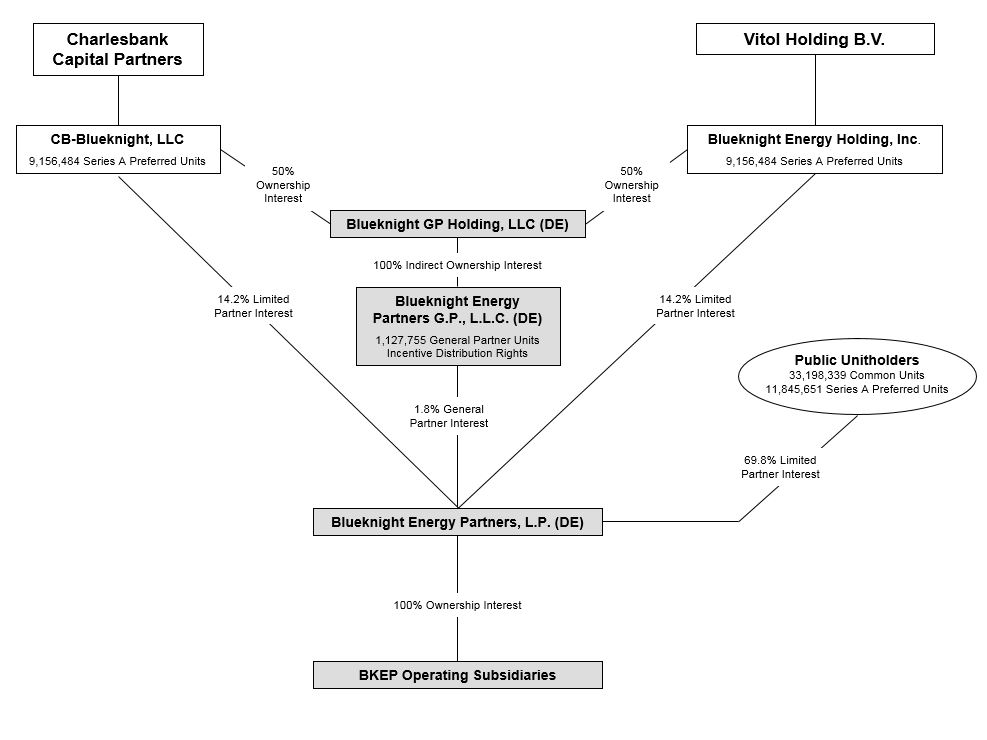
We were formed as a Delaware limited partnership in 2007 to own, operate and develop a diversified portfolio of complementary midstream energy assets. Our operating assets are owned by, and our operations are conducted through, our subsidiaries. Our General Partner has sole responsibility for conducting our business and for managing our operations. Our General Partner is jointly owned by Blueknight Energy Holding, Inc. (which is an affiliate of Vitol) and CB-Blueknight, LLC (which is an affiliate of Charlesbank). As such, Vitol and Charlesbank control our operations.
Our General Partner has no business or operations other than managing our business. In addition, outside of its investment in us, our General Partner owns no assets or property other than a minimal amount of cash, which has been distributed by us to our General Partner in respect of its interest in us. Our partnership agreement imposes no additional material liabilities upon our General Partner or obligations to contribute to us other than those liabilities and obligations imposed on general partners under the Delaware Revised Uniform Limited Partnership Act.
1
The following diagram depicts our organizational structure, including our relationship with our affiliates and subsidiaries, as of March 3, 2016:
Our Strengths and Strategies
Strategically placed assets. Our primary crude oil terminalling and storage facilities are located within the Cushing Interchange in Cushing, Oklahoma, one of the largest crude oil marketing hubs in the United States and the designated point of delivery specified in all New York Mercantile Exchange (“NYMEX”) crude oil futures contracts. We believe that the Cushing Interchange will continue to serve as one of the largest crude oil marketing hubs in the United States. In addition, we have approximately 985 miles of strategically positioned gathering and transportation pipelines in Oklahoma and Texas as well as 45 asphalt terminals located in 23 states that we believe are well positioned to provide services in the market areas they serve throughout the continental United States.
Growth opportunities. Vitol and Charlesbank have indicated that they intend to use us as a growth vehicle to pursue the acquisition and expansion of midstream energy businesses and assets. Vitol and Charlesbank may use a development company, in which we would have no interest, for pursuing projects that we may later have the opportunity to acquire. Further, we may be involved in additional midstream projects for Vitol or Charlesbank outside of any development company. We also cannot say with any certainty whether or not such a development company, or Vitol or Charlesbank, will develop any projects or, if they do, which, if any, of these future acquisition opportunities may be made available to us, or if we will choose to pursue any such opportunity. There are currently no such projects active.
Experienced management team. Our General Partner has an experienced and knowledgeable management team with extensive experience in the energy industry. We expect to directly benefit from this management team’s strengths, including significant relationships throughout the energy industry with producers, marketers and refiners of crude oil, and customers of our asphalt terminalling services.
2
Our relationship with Vitol and Charlesbank. Vitol and Charlesbank jointly own our General Partner and therefore control our operations. Vitol owns a diversified portfolio of midstream energy assets in the United States and internationally. Charlesbank is a middle-market private equity investment firm based in Boston and New York. These relationships may provide us with additional capital sources for future growth as well as increased opportunities to provide terminalling, storage, processing, gathering and transportation services. While these relationships may benefit us, they may also be a source of potential conflicts. Vitol and Charlesbank are not restricted from competing with us and both have ownership interests in other publicly traded midstream partnerships. Vitol and Charlesbank may acquire, construct or dispose of additional midstream or other assets in the future without any obligation to offer us the opportunity to purchase or construct those assets.
Industry Overview
Asphalt Industry
We provide asphalt terminalling services to marketers and distributors of liquid asphalt cement and asphalt-related products. Our business model begins with the unloading of product at one of our terminals and extends to the point of distribution to our customers. We do not take title to the product - we lease certain facilities for operation by our customers and at some facilities we process, blend and manufacture products to meet our customers’ specifications. Our terminal network consists of 45 facilities located coast-to-coast throughout the United States.
Liquid asphalt cement is one of the oldest engineering materials. Liquid asphalt cement’s adhesive and waterproofing properties have been used for building structures, waterproofing ships, mummification and numerous other applications.
Production of liquid asphalt cement begins with the refining of crude oil. Liquid asphalt cement is a dark brown to black cementitious material that is primarily produced by petroleum distillation. When crude oil is separated in distillation towers at a refinery, the heaviest hydrocarbons with the highest boiling points settle at the bottom. These tar-like fractions, called residuum, require relatively little additional processing to become products such as asphalt base or residual fuel oil. Liquid asphalt cement production typically represents only a small portion of the total product production in the crude oil refining process. The liquid asphalt cement produced by petroleum distillation can be sold by the refinery either directly into the wholesale and retail liquid asphalt cement markets or to a liquid asphalt cement marketer.
In its normal state, asphalt cement is too viscous a liquid to be used at ambient temperatures. For paving applications, asphalt cement can be heated (hot mix asphalt), diluted or cut back with petroleum solvents (cutback asphalts), or emulsified in a water base with emulsifying chemicals by a colloid mill (asphalt emulsions). Hot mix asphalt is produced by mixing hot asphalt cement and heated aggregate (stone, sand and/or gravel). The hot mix asphalt is loaded into trucks for transport to the paving site, where it is placed on the road surface by paving machines and compacted by rollers. Hot mix asphalt is used for new construction, reconstruction and for thin maintenance overlay on existing roads.
Asphalt emulsions and cutback asphalts are used for a variety of applications including spraying as a tack coat between an old pavement and a new hot mix asphalt overlay, cold mix pothole patching material, and preventive maintenance surface applications such as chip seals. Asphalt emulsions are also used for fog seal, slurry seal, scrub seal, sand seal and microsurfacing maintenance treatments, for warm mix emulsion/aggregate mixtures, base stabilization and both central plant and in-place recycling. Asphalt emulsions and cutback asphalts are generally sold directly to government agencies but are also sold to contractors.
The asphalt industry in the United States is characterized by a high degree of seasonality. Much of this seasonality is due to the impact that weather conditions have on road construction schedules, particularly in cold weather states. Refineries produce liquid asphalt cement year round, but the peak asphalt demand season is during the warm weather months when most of the road construction activity in the United States takes place. Liquid asphalt cement marketers and finished asphalt product producers with access to storage capacity possess the inherent advantage of being able to purchase supply from refineries on a year-round basis and then sell finished asphalt products in the peak summer demand season.
Crude Oil Industry
We provide crude oil gathering, marketing, transportation, storage and terminalling services to producers, marketers and refiners of crude oil products. The market we serve, which begins at the source of production and extends to the point of distribution to the end user customer, is commonly referred to as the “midstream” market. Our crude oil operations are located primarily in Oklahoma, Kansas and Texas, where there are extensive crude oil production operations in place and our assets extend from gathering systems and trucking networks in and around producing fields to transportation pipelines carrying crude
3
oil to logistics hubs, such as the Cushing Interchange, where we have terminalling and storage facilities that aid our customers in managing their crude oil.
Gathering, marketing and transportation. Pipeline transportation is generally considered the lowest cost and safest method for shipping crude oil and refined petroleum products to other locations. Crude oil pipelines transport oil from the wellhead to logistics hubs and/or refineries. Logistics hubs like the Cushing Interchange provide storage and connections to other pipeline systems and modes of transportation, such as tankers, railroads and trucks. Vessels and railroads provide additional transportation capabilities for shipping crude oil between gathering storage systems, pipelines, terminals and storage centers and end-users. Vessel transportation is typically a cost-efficient mode of transportation that allows for the ability to transport large volumes of crude oil over long distances.
Trucking complements pipeline gathering systems by gathering crude oil from operators at remote wellhead locations not served by pipeline gathering systems. These trucks can also be used to transport crude oil to aggregation points and storage facilities, which are generally located along pipeline gathering and transportation systems. Trucking is generally limited to low volume, short haul movements where other alternatives to pipeline transportation are often unavailable. Trucking costs escalate sharply with distance, making trucking the most expensive mode of crude oil transportation. Despite being small in terms of both volume per shipment and distance, trucking is an essential component of the oil distribution system.
Terminalling and storage. Terminalling and storage facilities complement the crude oil pipeline gathering and transportation systems. Terminals are facilities where crude oil is transferred to or from a storage facility or transportation system, such as a gathering pipeline, to another transportation system, such as trucks or another pipeline. Terminals play a key role in moving crude oil to end-users such as refineries by providing storage and inventory management and distribution.
Storage and terminalling assets generate revenues through a combination of storage and throughput charges to third parties. Storage fees are generated when tank capacity is provided to third parties. Terminalling services fees, also referred to as throughput services fees, are generated when a terminal receives crude oil from a shipper and redelivers it to another shipper. Both storage and terminalling services fees are earned from refiners and gatherers that need segregated storage for refining feedstocks, pipeline operators, refiners or traders that need segregated storage, traders who make or take delivery under NYMEX contracts and producers and marketers that seek to increase their marketing alternatives.
Overview of the Cushing Interchange. The Cushing Interchange, located in Cushing, Oklahoma, is one of the largest crude oil marketing hubs in the United States and the designated point of delivery specified in NYMEX crude oil futures contracts. As the NYMEX delivery point and a cash market hub, the Cushing Interchange serves as the primary source of refinery feedstock for Midwest refiners and plays an integral role in establishing and maintaining markets for many varieties of foreign and domestic crude oil. The following table lists certain of the entities with incoming pipelines connected to the Cushing Interchange, the proprietary terminals within the complex and outgoing pipelines from the Cushing Interchange for delivery throughout the United States:
Incoming Pipelines to Cushing Interchange | Cushing Interchange Terminals | Outgoing Pipelines from Cushing Interchange |
Blueknight Energy Partners, L.P. BP p.l.c. Enterprise Products Partners L.P. Sunoco Logistics Partners, L.P. Plains All American Pipeline, L.P. Enbridge Energy Partners, L.P. Rose Rock Midstream, L.P. Basin Pipeline System TransCanada Corp. White Cliffs Pipeline, LLC | Blueknight Energy Partners, L.P. Enterprise Products Partners L.P. Enbridge Energy Partners, L.P. Plains All American Pipeline, L.P. ConocoPhillips Rose Rock Midstream, L.P. Magellan Midstream Partners, L.P. Deeprock Energy Resources LLC Kinder Morgan, Inc. Gavilon, LLC NGL Energy Partners, L.P. | Blueknight Energy Partners, L.P. BP p.l.c. ConocoPhillips Sunoco Logistics Partners, L.P. Enbridge Energy Partners, L.P. Osage Pipeline Company, LLC Plains All American Pipeline, L.P. Magellan Midstream Partners, L.P. Centurion Pipeline L.P. Seaway Crude Pipeline Company LLC Gavilon, LLC |
With our pipeline and terminalling infrastructure, we have the ability to receive and/or deliver, directly or indirectly, to all pipelines and terminals within the Cushing Interchange.
4
Residual Fuel Oil Industry
Like asphalt cement, residual fuel oil is another by-product of the crude oil distillation process. Residual fuel oil is primarily used as a burner fuel in numerous industrial and commercial applications including the utility industry, the shipping and paper industry, steel mills, tire manufacturing, and food processors.
The residual fuel oil industry in the United States is characterized by a high degree of seasonality with much of the seasonality driven by the impact of weather on the need to produce power for heating and cooling applications. The residual fuel oil market is largely a commodity market with price functioning as the primary decision-making criterion. However, many customers have unique product specifications driven by their particular business applications that require the blending of various components to meet those specifications.
Residual fuel oil is purchased from a variety of refiners by our customers and transported to our terminalling and storage facilities via numerous transportation methods including rail tank car, barge, ship and truck. Some of our customers use our asphalt assets to service their residual fuel oil business.
Asphalt Terminalling Services
With approximately 8.2 million barrels of total asphalt product and residual fuel oil storage capacity, we are able to provide our customers the ability to effectively manage their asphalt product storage and processing and marketing activities. As of March 3, 2016, we have 45 terminals located in 23 states and as such are well-positioned to provide asphalt terminalling services in the market areas they serve throughout the continental United States.
We serve the asphalt industry by providing our customers access to their market areas through a combination of the leasing of certain of our asphalt facilities and the provision of storage and processing services at other of our asphalt and residual fuel oil facilities. We generate revenues by charging a fee for the lease of a facility or for services provided as asphalt products are terminalled, stored and/or processed in our facilities.
In addition, as of December 31, 2015, we have leases and storage agreements with third party customers relating to all of our asphalt facilities. The majority of the leases and storage agreements related to these facilities have terms that expire between the end of 2016 and the end of 2018. We operate the asphalt facilities that are contracted by storage, throughput and handling agreements while our contract counterparties operate the asphalt facilities that are subject to the lease agreements.
At facilities where we have storage contracts, we receive, store and/or process our customer’s asphalt products until we deliver these products to our customers or other third parties. Our asphalt assets include the logistics assets, such as docks and rail spurs and the piping and pumping equipment necessary to facilitate the unloading of liquid asphalt cement into our terminalling and storage facilities, as well as the processing and manufacturing equipment required for the processing of asphalt emulsions, asphalt cutbacks, polymer modified asphalt cement and other related finished asphalt products. After initial unloading, the liquid asphalt cement is moved via heat-traced pipe into storage tanks. These tanks are insulated and contain heating elements that allow the asphalt cement to be stored in a heated state. The asphalt cement can then be directly sold by our customers to end users or used as a raw material for the processing of asphalt emulsions, asphalt cutbacks, polymer modified asphalt cement and related finished asphalt products that we process in accordance with the formulations and specifications provided by our customers. Depending on the product, the processing of asphalt entails combining asphalt cement and various other products such as emulsifying chemicals and polymers to achieve the desired specification and application requirements.
At leased facilities, our customers conduct the operations at the asphalt facility, including the storage and processing of asphalt products, and we collect a monthly rental fee relating to the lease of such facility. Generally, under the terms of these leases, (i) title to the asphalt, raw materials or finished asphalt products received, unloaded, stored or otherwise handled at such asphalt facility is in the name of the lessee, (ii) the lessee is responsible for complying with environmental, health, safety, transportation and security laws, (iii) the lessee is required to obtain and maintain necessary permits, licenses, plans, approvals or other such authorizations and is responsible for insuring such asphalt facility, and (iv) most routine maintenance and repair of such asphalt facility is the responsibility of the lessee.
We do not take title to, or marketing responsibility for, the liquid asphalt product that we terminal, store and/or process. As a result, our asphalt operations have minimal direct exposure to changes in commodity prices, but the volumes of liquid asphalt cement we receive, store and/or process are indirectly affected by commodity prices.
5
The following table provides an overview of our asphalt facilities as of December 31, 2015:
Location | Number of Facilities(2) | Total Tankage (in thousands of Bbls)(1) |
Arkansas | 1 | 21 |
California | 1 | 66 |
Colorado | 4 | 401 |
Georgia | 1 | 38 |
Idaho | 1 | 285 |
Illinois | 2 | 232 |
Indiana | 1 | 156 |
Kansas | 4 | 492 |
Missouri | 3 | 643 |
Montana | 1 | 123 |
Nebraska | 1 | 292 |
New Jersey | 1 | 459 |
Nevada | 1 | 280 |
Ohio | 1 | 38 |
Oklahoma | 6 | 904 |
Pennsylvania | 1 | 59 |
Tennessee | 3 | 470 |
Texas | 3 | 779 |
Utah | 2 | 300 |
Virginia | 1 | 547 |
Washington | 3 | 470 |
Wyoming | 1 | 219 |
Total | 43 | 7,274 |
_______________
(1) Total tankage refers to the approximate total capacity of all tanks.
(2) | This table does not include two facilities acquired in February 2016. These facilities are located in North Carolina and Virginia and have combined tankage of 885,000 bbls. |
Our asphalt assets range in age from one year to over fifty years, and we expect that our storage tanks and related assets will have an average remaining life in excess of 20 years.
Significant Customers. Ergon Asphalt & Emulsions, Heartland Asphalt Materials, Inc., Suncor Energy USA, Axeon Marketing, LLC and Western States Asphalt, Inc. each accounted for at least 10% but not more than 25% of asphalt terminalling services revenue in 2015. The loss of any of these customers could have a material adverse effect on our business, cash flows and results of operations. No other customer accounted for more than 10% of our asphalt terminalling services revenue during 2015.
Crude Oil Terminalling and Storage Services
With approximately 7.4 million barrels of above-ground crude oil terminalling facilities and storage tanks, we are able to provide our customers the ability to effectively manage their crude oil inventories and enhance flexibility in their marketing and operating activities. Our crude oil terminalling and storage assets are located throughout our core operating areas with the majority of our crude oil terminalling and storage strategically located at the Cushing Interchange.
Our crude oil terminals and storage assets receive crude oil products from pipelines, including those owned by us, and distribute these products to interstate common carrier pipelines and regional independent refiners, among other third parties. Our crude oil terminals derive most of their revenues from terminalling services fees charged to customers.
6
The table below sets forth the total average barrels stored at and delivered out of our Cushing terminal in each of the periods presented and the total storage capacity at our Cushing terminal and at our other terminals at the end of such periods:
For the year ended December 31, | ||||
2014 | 2015 | |||
(in thousands) | ||||
Average crude oil barrels stored per month at our Cushing terminal | 1,724 | 5,322 | ||
Average crude oil delivered (Bpd) to our Cushing terminal | 77 | 117 | ||
Total storage capacity at our Cushing terminal (barrels at end of period) | 6,600 | 6,600 | ||
Total other storage capacity (barrels at end of period) | 1,091 | 824 | ||
The following table outlines the location of our crude oil terminals and their storage capacities and number of tanks as of December 31, 2015:
Location | Storage Capacity (thousands of barrels) | Number of Tanks | ||
Cushing, Oklahoma | 6,600 | 34 | ||
Longview, Texas | 238 | 4 | ||
Other(1) | 586 | 194 | ||
Total | 7,424 | 232 | ||
_______________
(1) Consists of miscellaneous storage tanks located at various points along our pipeline and gathering systems.
Cushing Terminal. One of our principal assets is our Cushing terminal, which is located within the Cushing Interchange in Cushing, Oklahoma. Currently, we own and operate 34 crude oil storage tanks with approximately 6.6 million barrels of storage capacity at this location. We own approximately 50 additional acres of land within the Cushing Interchange that is available for future expansion.
Our Cushing terminal was constructed over the last 50 years and has an expected remaining life of at least 20 years. Over 90% of our total storage capacity in our Cushing terminal has been built since 2002. We estimate that our storage tanks have a weighted average age of twelve years.
The design and construction specifications of our storage tanks meet or exceed the minimums established by the American Petroleum Institute, (“API”). Our storage tanks also undergo regular maintenance inspection programs that are more stringent than established governmental guidelines. We believe that these design specifications and inspection programs will result in lower future maintenance capital costs to us.
A key attribute of our Cushing terminal is that through our pipeline interface, we have access and connectivity to almost all of the terminals located within the Cushing Interchange. This connectivity is a key attribute of our Cushing terminal because it provides us the ability to deliver to virtually any customer within the Cushing Interchange.
Our Cushing terminal can receive crude oil from our Mid-Continent system as well as other terminals owned by Magellan Midstream Partners, Enterprise Products Partners, Sunoco Logistics Partners, Plains All American Pipeline, L.P., Seaway Crude Pipeline Company, LLC, Enbridge Energy Partners, Rose Rock Midstream Partners, Deeprock Energy Resources, LLC and two truck stations. Our Cushing terminal’s pipeline connections to major markets in the Mid-Continent region provide our customers with marketing flexibility. Our Cushing terminal can deliver crude oil via pipeline and, in the aggregate, is capable of receiving and/or delivering approximately 350,000 Bpd of crude oil.
Longview Terminal. We own and operate the Longview terminal, located in Longview, Texas, consisting of four tanks with a total storage capacity of 238,000 barrels. We use our Longview terminal in connection with our East Texas system. A number of other potential customers have access to the Longview terminal. The Longview terminal was constructed beginning in the 1940s, and we believe it has a remaining life of at least 20 years.
Significant Customers. For the year ended December 31, 2015, Vitol accounted for at least 45% but not more than 50% of our total crude oil terminalling and storage revenue, and MV Purchasing, LLC and Sunoco Partners Marketing & Terminals, L.P. each accounted for at least 10% but not more than 20% of our total crude oil terminalling and storage revenue. The loss of any of these customers could have a material adverse effect on our business, cash flows and results of operations. No other
7
customer accounted for more than 10% of our crude oil terminalling and storage revenue during 2015. As of March 2016, we provide crude oil terminalling and storage services to Vitol under agreements with aggregate storage capacity of 2.2 million barrels expiring in May 2017. For more information regarding the Vitol storage agreements, please see “Item 13-Certain Relationships and Related Party Transactions, and Director Independence-Agreements with Vitol.”
Crude Oil Pipeline Services
We own and operate a crude oil transportation system in the Mid-Continent region of the United States with a combined length of approximately 515 miles and a 220 mile tariff-regulated crude oil gathering and transportation pipeline in the Longview, Texas area. In addition, we own and operate the Eagle North system in the Mid-Continent region of the United States with a length of approximately 250 miles.
System | Asset Type | Approximate Length (miles) | Average Throughput for Year Ended December 31, 2014 (Bpd) | Average Throughput for Year Ended December 31, 2015 (Bpd) | Pipe Diameter Range |
Mid-Continent | Gathering and transportation pipelines | 515 | 20,397 | 23,706 | 4” to 20” |
East Texas | Gathering and transportation pipelines | 220 | 17,521 | 15,645 | 6” to 8” |
Eagle North | Transportation pipeline | 250 | 13,370 | 12,289 | 6” to 8” |
Mid-Continent System. Our Mid-Continent transportation system provides access to our Cushing terminal and other storage facilities. The Oklahoma portion of our Mid-Continent system consists of approximately 515 miles of various sized pipeline, of which approximately 115 miles is currently idle. Crude oil delivered into the Oklahoma portion of our Mid-Continent system is transported to our Cushing terminal or delivered to local area refiners. The Mid-Continent system includes an approximately 75-mile gathering and transportation system in southern Oklahoma acquired in November 2015, on which we market approximately 35,000 barrels of crude oil per month. The marketed barrels are delivered to a single customer in southern Oklahoma. The Mid-Continent system also includes a 35-mile gathering and transportation system in the Texas Panhandle near Dumas, Texas. Crude oil collected through the Texas Panhandle portion of our Mid-Continent system is transported by pipeline to a station where it is then delivered to market via tanker truck. For the years ended December 31, 2014 and 2015, this system delivered an average of approximately 20,397 Bpd and 23,706 Bpd of crude oil, respectively. The Mid-Continent system was constructed in various stages beginning in the 1940s, and we believe it has a remaining life of at least 20 years. In December 2015 we recorded a $1.4 million impairment expense to write a portion of the Mid-Continent system down to its estimated fair value.
East Texas System. Our East Texas system consists of approximately 220 miles of tariff-regulated crude oil gathering pipeline, of which approximately 135 miles is comprised of currently idle, inactive gathering lines. The East Texas portion of this system delivers to crude oil terminalling, refinery and storage facilities at various delivery points in the East Texas region. For the years ended December 31, 2014 and 2015, our East Texas system gathered an average of approximately 17,521 Bpd and 15,645 Bpd, respectively. Shippers on the East Texas system include Eastex Crude Co, Enbridge Energy Marketing LLC, XTO Energy Inc., Vitol, Delek Refining Ltd, Texas Gathering Company LLC, Plains All American, L.P. and Sunoco Logistics Partners L.P. The East Texas system was constructed in various stages beginning in the 1940s and we believe it has a remaining life of at least 20 years. In December 2015 we recorded a $12.6 million impairment expense to write this system down to its estimated fair value.
Eagle North System. Our Eagle North system is comprised of a 250-mile, 8-inch pipeline, of which approximately 55 miles is currently idle, that originates in Cushing, Oklahoma and terminates in Ardmore, Oklahoma.
Significant Customers. For the year ended December 31, 2015, Vitol accounted for at least 30% but not more than 35% of our total crude oil pipeline services revenue, and XTO Energy, Inc. and Valero Marketing & Supply Co. each accounted for at least 10% but not more than 25% of crude oil pipeline services revenue in 2015. The loss of any of these customers could have a material adverse effect on our business, cash flows and results of operations. No other customer accounted for more than 10% of our crude oil pipeline services revenue during 2015.
Crude Oil Trucking and Producer Field Services
We provide two types of trucking services: crude oil trucking and producer field services.
8
Crude Oil Trucking Services. To complement our pipeline gathering, marketing and transportation business, we use our approximately 152 owned or leased tanker trucks, which have an average tank size of approximately 200 barrels, to move crude oil to aggregation points, pipeline injection stations and storage facilities. Our tanker trucks moved an average of 64,000 Bpd and 51,000 Bpd, respectively, for the years ended December 31, 2014 and 2015 from wellhead locations not served by pipeline gathering systems to aggregation points and storage facilities. The following table outlines the distribution of our trucking assets among our operating areas as of March 3, 2016:
Location | Number of Trucks | |
Oklahoma | 108 | |
Kansas | 33 | |
Texas | 11 | |
Total | 152 | |
During the second half of 2015, our West Texas operating margins and transported volumes were negatively impacted by increased competition from transporters moving equipment from crude oil shale areas to West Texas, where crude oil volumes have remained fairly steady, and producers and marketers quickly pipe-connecting barrels for transport. As a result, we decided to cease trucking barrels in West Texas and refocus our efforts on transporting barrels around our owned crude oil pipelines and storage assets in Oklahoma and Kansas. Due to this change we recognized a $1.6 million restructuring expense in December 2015, comprised of employee severance costs and the recognition of future lease expense on idled equipment as of December 31, 2015. The severance costs were paid in the first quarter of 2016 and the lease payments will be made over the remaining lease terms, which extend through July 2019. See Note 6 to our Consolidated Financial Statements for additional detail regarding this restructuring expense. Additionally, in December 2015 we recorded a $0.5 million impairment expense to write the assets related to our West Texas trucking stations down to their estimated fair value.
Producer Field Services. We provide various producer field services for companies such as Pioneer Natural Resources Co., Parallel Energy, L.P., Regency Gas Services, LLC, DCP Midstream, LLC and ConocoPhillips Co. These services may include gathering condensates by way of bobtail trucks for natural gas companies to hauling produced water to disposal wells, providing hot and cold fresh water, chemical and down hole well treating, wet oil clean up, and building and maintaining separation facilities. We provide these services at contracted hourly rates. Our producer service fleet consists of approximately 90 trucks in a number of different sizes.
Significant Customers. For the year ended December 31, 2015, Vitol accounted for at least 40% but not more than 45% of our total crude oil trucking and producer field services revenue, and MV Purchasing, LLC and Devon Energy Production Co. each accounted for at least 10% but not more than 25% of crude oil trucking and producer field services revenue in 2015. The loss of any of these customers could have a material adverse effect on our business, cash flows and results of operations. No other customer accounted for more than 10% of our crude oil trucking and producer field services revenue during 2015.
Competition
We are subject to competition from other crude oil gathering, pipeline transportation, terminalling and storage operations, and trucking operations that may be able to supply our customers with the same or comparable services on a more competitive basis. We compete with national, regional and local liquid asphalt cement storage and processing companies, and gathering, storage and pipeline companies, including the major integrated oil companies, of widely varying sizes, financial resources and experience.
With respect to our crude oil gathering and transportation services, these competitors include Enterprise Products Partners L.P., Plains All American Pipeline, L.P., Magellan Midstream Partners, L.P., Sunoco Logistics Partners L.P. and Rose Rock Midstream Partners, L.P., among others. With respect to our crude oil storage and terminalling services, these competitors include Magellan Midstream Partners, L.P., Enbridge Energy Partners, L.P., Plains All American Pipeline, L.P. and Rose Rock Midstream Partners, L.P., among others. Several of our competitors conduct portions of their operations through publicly traded partnerships with structures similar to ours, including Plains All American Pipeline, L.P., Enterprise Products Partners L.P., Sunoco Logistics Partners L.P., Magellan Midstream Partners, L.P. and Rose Rock Midstream Partners, L.P. Our ability to compete could be harmed by factors we cannot control, including:
• | the perception that another company can provide better service; |
• | the availability of crude oil alternative supply points, or crude oil supply points located closer to the operations of our customers; and/or |
9
• | a decision by our competitors to acquire or construct crude oil midstream assets and provide gathering, transportation, terminalling or storage services in geographic areas, or to customers, served by our assets and services. |
The asphalt industry is highly fragmented and regional in nature. Participants range in size from major oil companies to small family-owned businesses. Participants in the asphalt business include refiners such as BP p.l.c., Flint Hills Resources, L.P., CHS, Inc., Exxon Mobil Corporation, ConocoPhillips Co., NuStar Energy L.P., Ergon, Inc., Marathon Petroleum Company LLC, Alon USA LP, Suncor Energy Inc. and Valero Energy Corporation; resellers such as NuStar Energy L.P., Idaho Asphalt Supply, Inc. and Asphalt Materials, Inc.; and large road construction firms such as Old Castle Materials, Inc. and Colas SA. We compete for asphalt terminalling services with the national, regional and local industry participants as well as liquid asphalt cement terminalling and storage companies including the major integrated oil companies and a variety of others, such as KinderMorgan Inc., International-Matex Tank Terminals and Houston Fuel Oil Terminal Company.
If we are unable to compete effectively with services offered by other midstream enterprises, our financial results and ability to make distributions to our unitholders may be adversely affected. Additionally, we also compete with national, regional and local companies for asset acquisitions and expansion opportunities. Some of these competitors are substantially larger than us and have greater financial resources and lower costs of capital than we do.
Pipeline Regulation
Currently, we have tariff rates that are regulated by the Texas Railroad Commission. We do not currently offer interstate transportation service regulated by the Federal Energy Regulatory Commission (“FERC”) with the exception of two short interstate segments where the sole shipper is our affiliate. Our interstate pipeline segments are subject to regulatory enforcement by the Pipeline Hazardous Materials Safety Administration.
Gathering and Intrastate Pipeline Regulation. All intrastate pipelines in the state of Texas are regulated by the Texas Railroad Commission and intrastate pipelines in the state of Oklahoma are regulated by the Oklahoma Corporation Commission. In the states in which we operate, regulation of crude gathering facilities and intrastate crude pipeline facilities generally includes various safety, environmental and, in some circumstances, nondiscriminatory take requirements and complaint-based rate regulation. For example, our intrastate crude pipeline facilities in Texas must have a tariff on file and charge just and reasonable rates for service, which must be provided on a non-discriminatory basis.
Pipeline Safety. Our pipelines are subject to state and federal laws and regulations governing design, construction, operation and maintenance of the lines; qualifications of pipeline personnel; public awareness; emergency response and other aspects of pipeline safety. These laws and regulations are subject to change, resulting in potentially more stringent requirements and increased costs. Applicable pipeline safety regulations establish minimum safety requirements and, for pipelines that pose a greater risk to populated areas or environmentally sensitive areas, impose a more rigorous requirement for the implementation of pipeline integrity management programs for our pipelines. On January 3, 2012, President Obama signed the Pipeline Safety, Regulatory Certainty, and Job Creation Act of 2011. That legislation increased the maximum civil penalties for pipeline safety administrative enforcement actions; required the DOT to study and report on the expansion of integrity management requirements, the sufficiency of existing gathering line regulations to ensure safety and the feasibility of leak detection systems for hazardous liquid pipelines; required pipeline operators to verify their records on maximum allowable operating pressure; and imposed new emergency response and incident notification requirements. In 2015 several amendments were issued. These amendments added additional construction inspection requirements, clarified integrity management rules, and updated federally incorporated standards. The states in which we operate pipelines incorporate into their state rules those federal safety standards for hazardous liquids pipelines contained in Title 49, Part 195 of the Federal Code of Regulations. As a result, the issuance of any new pipeline safety regulations, including additional requirements for integrity management, is likely to increase the operating costs of our pipelines subject to such new requirements, and such future costs may be material.
Trucking Regulation. We operate a fleet of trucks to transport crude oil and oilfield materials as a private, contract and common carrier. We are licensed to perform both intrastate and interstate motor carrier services. As a motor carrier, we are subject to certain safety regulations issued by the DOT. The trucking regulations cover, among other things, driver operations, maintaining log books, truck manifest preparations, the placement of safety placards on the trucks and trailer vehicles, drug and alcohol testing, safety of operation and equipment and many other aspects of truck operations. We are also subject to requirements of the federal Occupational Safety and Health Act, as amended (“OSHA”), with respect to our trucking operations.
10
Environmental, Health and Safety Risks
General. Our midstream crude oil gathering, transportation, terminalling and storage operations, and our asphalt assets, are subject to stringent federal, state and local laws and regulations relating to the discharge of materials into the environment or otherwise relating to protection of the environment. As with the midstream and liquid asphalt cement industries generally, compliance with current and anticipated environmental laws and regulations increases our overall cost of business, including our capital costs to construct, maintain and upgrade equipment and facilities. Failure to comply with these laws and regulations may result in the assessment of significant administrative, civil and criminal penalties, the imposition of investigatory and remedial liabilities, and issuance of injunctions that may restrict or prohibit some or all of our operations. We believe that our operations are in substantial compliance with applicable laws and regulations. However, environmental laws and regulations are subject to change, resulting in potentially more stringent requirements, and we cannot provide any assurance that the cost of compliance with current and future laws and regulations will not have a material effect on our results of operations or earnings.
Risks of accidental releases into the environment are inherent in the nature of both our midstream and liquid asphalt cement operations, such as leaks or spills of petroleum products or hazardous materials from our pipelines, trucks, terminals and storage facilities. A discharge of petroleum products or hazardous materials into the environment could, to the extent such event is not covered by insurance, subject us to substantial expense, including costs related to environmental clean-up or restoration, compliance with applicable laws and regulations, and any personal injury, natural resource or property damage claims made by neighboring landowners and other third parties.
The following is a summary of the more significant current environmental, health and safety laws and regulations to which our business operations are subject and for which compliance may require material capital expenditures or have a material adverse impact on our results of operations, financial position and cash flows.
Water. The federal Clean Water Act and analogous state and local laws impose restrictions and strict controls regarding the discharge of pollutants into waters of the United States and state waters. We note that the term “waters of the United States” is already broadly construed, and the United States Environmental Protection Agency (“EPA”) and U.S. Army Corps of Engineers recently adopted a rule to clarify the meaning of the term “waters of the United States.” Many interested parties believe that the rule expands federal jurisdiction under the Clean Water Act. The effectiveness of the new rule has been stayed pending ongoing judicial challenges. Permits must be obtained to discharge pollutants into these waters. The Clean Water Act and analogous laws provide significant penalties for unauthorized discharges and impose substantial potential liabilities for cleaning up spills and leaks into water. In addition, the Clean Water Act and analogous state laws require individual permits or coverage under general permits for discharges of storm water runoff from certain types of facilities. Some states also maintain groundwater protection programs that require permits for discharges or operations that may impact groundwater conditions. We believe that we are in substantial compliance with any such applicable state requirements.
The federal Oil Pollution Act, as amended (“OPA”), was enacted in 1990 and amended provisions of the Federal Water Pollution Control Act of 1972, the Clean Water Act, and other statutes as they pertain to prevention and response to oil spills. The OPA, and analogous state and local laws, subject owners of facilities used for storing, handling or transporting oil, including trucks and pipelines, to strict, joint and potentially unlimited liability for containment and removal costs, natural resource damages and certain other consequences of an oil spill, where such spill is into navigable waters, along shorelines or in the exclusive economic zone of the United States. The OPA, the Clean Water Act and other analogous laws also impose certain spill prevention, control and countermeasure requirements, such as the preparation of detailed oil spill emergency response plans and the construction of dikes and other containment structures to prevent contamination of navigable or other waters in the event of an oil overflow, rupture or leak. We believe that we are in substantial compliance with applicable OPA and analogous state and local requirements.
Air Emissions. Our operations are subject to the federal Clean Air Act (“CAA”), as amended, as well as to comparable state and local laws. We believe that our operations are in substantial compliance with these laws in those areas in which we operate. Amendments to the CAA enacted in 1990 imposed a federal operating permit requirement for major sources of air emissions. Our crude oil terminal located in Cushing, Oklahoma holds such a permit, which is referred to as a “Title V permit.” On April 17, 2012, the EPA approved final rules under the CAA that established new air emission controls for oil and natural gas production, pipelines and processing operations. These rules became effective on October 15, 2012. To respond to challenges made to the rules, the EPA revised certain aspects of the April 2012 rules and has indicated it may reconsider other aspects. The costs of compliance with any modified or newly issued rules cannot be predicted. The Obama administration also announced in January 2015 that other federal agencies, including the Bureau of Land Management, the Pipeline and Hazardous Materials Safety Administration (“PHMSA”), and the Department of Energy, will impose new or more stringent regulations on the oil and gas sector that are said to have the effect of reducing methane emissions. In August 2015, the EPA proposed a rule to set standards for methane and volatile organic compound emissions from new and modified sources in the oil
11
and gas sector, including transmission. A final rule is expected in 2016. Depending on whether such rules are promulgated and the applicability and restrictions in any promulgated rule, compliance with such rules could result in additional compliance costs for us and for others in our industry. In response to these and other regulatory developments, we may be required to incur certain capital expenditures in the next several years for air pollution control equipment and operational changes in connection with obtaining or maintaining permits and approvals and complying with applicable regulations addressing air emission related issues. Although we can provide no assurance, we believe future compliance with the CAA, as currently amended, will not have a material adverse effect on our financial condition, results of operations or cash flows.
Climate Change. Legislative and regulatory measures to address concerns that emissions of certain gases, commonly referred to as “greenhouse gases” (“GHGs”), may be contributing to warming of the Earth’s atmosphere are in various phases of discussions or implementation at the international, national, regional, and state levels. The oil and gas industry is a direct source of certain GHG emissions, namely carbon dioxide and methane, and future restrictions on such emissions could impact our future operations. In the United States, the U.S. Congress has considered, but to date has not enacted, federal legislation requiring GHG controls. In addition, the EPA has promulgated a series of rulemakings and other actions to regulate GHGs as pollutants under the CAA. In May 2010, EPA finalized the Prevention of Significant Deterioration and Title V GHG Tailoring Rule, which phased in federal new source review and Title V permitting requirements for certain affected stationary sources of GHG emissions, beginning January 2, 2011. On June 23, 2014, the United States Supreme Court ruled that portions of the EPA’s GHG regulatory program violated the Clean Air Act. Specifically, the Supreme Court determined that GHGs cannot independently trigger Prevention of Significant Deterioration (“PSD”) permitting requirements. However, the Court held that certain PSD permitting requirements may apply to GHG emissions if emissions of another regulated pollutant, like sulfur dioxide or particulate matter, trigger PSD permitting. Additionally, the Supreme Court held that the Tailoring Rule’s regulatory emissions thresholds violated the Clean Air Act, while suggesting that EPA could promulgate “de minimis” thresholds for GHGs. Further proceedings are ongoing in the United States Court of Appeals for the District of Columbia. These EPA rulemakings could affect our operations and ability to obtain air permits for new or modified facilities. Furthermore, in 2009, the EPA issued a “Mandatory Reporting of Greenhouse Gases” final rule, establishing a comprehensive scheme of regulations that require monitoring and reporting of GHG emissions on an annual basis by operators of stationary sources in the U.S. emitting more than established annual thresholds of carbon dioxide-equivalent GHG emissions. Monitoring obligations began in 2010 and the emissions reporting required took effect in 2011. The scope of the rule was subsequently expanded to cover additional petroleum and natural gas production, processing, and transmission sources that were not previously covered by the rule. Although this rule does not control GHG emission levels from any facilities, it has caused us to incur monitoring and reporting costs. In addition, efforts have been and continue to be made in the international community toward the adoption of international treaties or protocols. In 2015, the United States participated in the United Nations Conference on Climate Change, which led to the adoption of the Paris Agreement that will require countries to review and “represent a progression” in their intended nationally determined contributions, which set GHG emission reduction goals, every five years beginning in 2020.
Legislation and regulations relating to control or reporting of GHG emissions are also in various stages of discussions or implementation in many of the states in which we operate. Passage of climate change legislation or other federal or state legislative or regulatory initiatives that regulate or restrict GHG emissions in areas in which we conduct business could adversely affect the demand for our products and services, and depending on the particular program adopted could increase the costs of our operations, including costs to operate and maintain our facilities, install new emission controls on our facilities, acquire allowances to authorize our GHG emissions (e.g., from natural gas fired combustion units), pay any taxes related to our GHG emissions and/or administer and manage a GHG emissions program. At this time, it is not possible to accurately estimate how laws or regulations addressing GHG emissions would impact our business. Although we do not expect we would be impacted to a greater degree than other similarly situated midstream transporters of petroleum products, the greenhouse gas control programs could have an adverse effect on our cost of doing business and could reduce demand for the products we transport.
In addition to potential impacts on our business directly or indirectly resulting from climate-change legislation or regulations, our business also could be negatively affected by climate related physical changes or changes in weather patterns. Severe weather could result in damages to or loss of our physical assets, impact our ability to conduct operations and/or result in a disruption of our customer’s operations. These types of physical changes could also affect entities that provide goods and services to us and indirectly have an adverse affect on our business as a result of increases in costs or availability of goods and services. Changes of this nature could have a material adverse impact on our business.
Solid Waste Disposal and Environmental Remediation. The Comprehensive Environmental Response, Compensation, and Liability Act, as amended (“CERCLA”), also known as Superfund, as well as comparable state and local laws, impose liability without regard to fault or the legality of the original act, on certain classes of persons associated with the release of a “hazardous substance” into the environment. These persons include the owner or operator of the site or sites where the release
12
occurred and companies that disposed of, or arranged for the disposal of, the hazardous substances found at the site. Under CERCLA, such persons may be subject to strict and, under certain circumstances, joint and several liability for cleanup costs, for damages to natural resources, and for the costs of certain health studies. It is not uncommon for neighboring landowners and other third parties to file claims for personal injury and property damage allegedly caused by releases of hazardous substances or other pollutants. We generate materials in the course of our operations that are regulated as hazardous substances. Beyond the federal statute, many states have enacted environmental response statutes that are analogous to CERCLA.
We generate wastes, including “hazardous wastes,” that are subject to the requirements of the federal Resource Conservation and Recovery Act, as amended (“RCRA”), as well as to comparable state and local laws. While normal costs of complying with these laws would not be expected to have a material adverse effect on our financial conditions, we could incur substantial expense in the future if the RCRA exclusion for certain oil and gas waste were eliminated. Should our oil and gas wastes become subject to RCRA, we would also become subject to more rigorous and costly disposal requirements, resulting in additional capital expenditures or operating expenses for us.
We currently own or lease properties where hazardous substances are being handled, transported or stored or have been handled, transported or stored for many years. Although we believe that operating and disposal practices that were standard in the midstream, field services and liquid asphalt cement industries at the time were utilized at properties leased or owned by us, historical releases of hazardous substances or associated generated wastes have occurred on or under the properties owned or leased by us, or on or under other locations where these wastes were taken for disposal. In addition, many of these properties have been operated in the past by third parties whose treatment and disposal or release of hazardous substances or associated generated wastes were not under our control. These properties and the materials disposed on them may be subject to CERCLA, RCRA and analogous state laws. Under such laws, we could be required to remove or remediate previously spilled hazardous materials or associated generated wastes (including wastes disposed of or released by other site occupants or by prior owners or operators), or to clean up contaminated property (including contaminated groundwater).
Contamination resulting from the release of hazardous substances or associated generated wastes is not unusual within the midstream and liquid asphalt cement industries. Other assets we have acquired or will acquire in the future may have environmental remediation liabilities for which we are not indemnified. In the future, we likely will experience releases of hazardous materials, including petroleum products, into the environment from our pipeline terminalling and storage operations, or discover releases that were previously unidentified. Although we maintain a program designed to prevent and, as applicable, to detect and address such releases promptly, damages and liabilities incurred due to environmental releases from our assets may substantially affect our business.
Regulation of Hydraulic Fracturing. A portion of our customers’ production is developed from unconventional sources, such as shales, that require hydraulic fracturing as part of the completion process. Hydraulic fracturing involves the injection of water, sand and chemicals under pressure into shale formations to stimulate crude oil and/or gas production. The practice of hydraulic fracturing has been subject to public scrutiny in recent years and various efforts to regulate, or in some cases prohibit, hydraulic fracturing have been, and are still being, pursued at the local, state and federal levels of government. For example, several states, including states in which we operate, have imposed disclosure requirements on hydraulic fracturing, and several local governments have prohibited or severely restricted hydraulic fracturing within their jurisdictions. Restrictions on hydraulic fracturing could adversely affect our operations by reducing the volumes of crude oil that we transport.
Endangered Species and Migratory Birds. The Endangered Species Act (“ESA”), restricts activities that may affect endangered or threatened species or their habitats. While some of our operations may be located in areas that are designated as habitats for endangered or threatened species, we believe that we are in substantial compliance with the ESA. However, the designation of previously unlisted endangered or threatened species could cause us to incur additional costs or become subject to operating restrictions or bans or limit future development in the affected areas. The Migratory Bird Treaty Act (“MBTA"), implements various treaties and conventions between the United States and certain other nations for the protection of migratory birds. Pursuant to the MBTA, the taking, killing or possessing of migratory birds is unlawful without a permit, thereby potentially requiring the implementation of operating restrictions or a temporary, seasonal, or permanent ban in affected areas. We believe that we are in substantial compliance with the MBTA.
OSHA. We are subject to the requirements of OSHA, as well as to comparable state and local laws that regulate the protection of worker health and safety. In addition, the OSHA hazard communication standard requires that certain information be maintained about hazardous materials used or produced in operations and that this information be provided to employees, state and local government authorities and citizens. We believe that our operations are in substantial compliance with OSHA requirements and industry standards, record keeping requirements and monitoring of occupational exposure to regulated substances.
13
Anti-Terrorism Measures. The federal Department of Homeland Security Appropriations Act of 2007 requires the Department of Homeland Security (“DHS”), to issue regulations establishing risk-based performance standards for the security of chemical and industrial facilities, including oil and gas facilities that are deemed to present “high levels of security risk.” The DHS issued an interim final rule in April 2007 known as the Chemical Facility Anti-Terrorism Standards (“CFATS”) regarding risk-based performance standards to be attained pursuant to the act and, on November 20, 2007, further issued an Appendix A to CFATS that establish chemicals of interest and their respective threshold quantities that will trigger compliance with these interim rules. We currently do not handle, use, store, or process any “Chemicals of Interest” (“COI”) listed in Appendix A above their respective threshold quantities, and are therefore not subject to requirements of CFATS. We will continue to monitor the CFATS for regulatory changes that could impact our operations in the future.
Operational Hazards and Insurance
Pipelines, terminals, storage tanks and similar facilities may experience damage as a result of an accident or natural disaster. These hazards can cause personal injury and loss of life, severe damage to and destruction of property and equipment, pollution or environmental damage and suspension of operations. We have maintained insurance of various types and varying levels of coverage that we consider adequate under the circumstances to cover our operations and properties, including coverage for pollution related events. However, such insurance does not cover every potential risk associated with operating pipelines, terminals and other facilities. Notwithstanding what we believe is a favorable claims history, the overall cost of the insurance program as well as the deductibles and overall retention levels that we maintain have increased. Through the utilization of deductibles and retentions we self insure the “working layer” of loss activity to create a more efficient and cost effective program. The working layer consists of high frequency/low severity losses that are best retained and managed in-house. As we continue to grow, we will continue to monitor our retentions as they relate to the overall cost and scope of our insurance program.
Employees
As of December 31, 2015, we employed approximately 480 persons. None of these employees are represented by labor unions or covered by any collective bargaining agreement. We believe that relations with these employees are satisfactory.
Financial Information about Segments
Information regarding our operating revenues, profit and loss and identifiable assets attributable to each of our segments is presented in Note 20 to our consolidated financial statements included in this annual report on Form 10-K.
Available Information
We provide public access to our annual reports on Form 10-K, quarterly reports on Form 10-Q, current reports on Form 8-K and amendments to these reports filed with the SEC under the Securities and Exchange Act of 1934. These documents may be accessed free of charge on our website, www.bkep.com, as soon as is reasonably practicable after their filing with the SEC. Information contained on our website is not incorporated by reference in this report or any of our other filings. The filings are also available through the SEC at the SEC’s Public Reference Room at 100 F Street, N.E., Washington, D.C. 20549. Information on the operation of the Public Reference Room is available by calling 1-800-SEC-0330. The SEC also maintains a website that contains reports, proxy and information statements, and other information regarding issuers that file electronically with the SEC. The SEC’s website is www.sec.gov.
Item 1A. Risk Factors
Limited partner interests are inherently different from the capital stock of a corporation, although many of the business risks to which we are subject are similar to those that would be faced by a corporation engaged in a similar business. You should carefully consider the following risk factors together with all of the other information included in this report. If any of the following risks were actually to occur, our business, financial condition, results of operations and cash flows could be materially adversely affected. In that case, we might not be able to pay distributions on our units, the trading price of our units could decline and our unitholders could lose all or part of their investment.
Risks Related to our Business
We may not have sufficient cash from operations following the establishment of cash reserves and payment of fees and expenses, including cost reimbursements to our General Partner, to enable us to make cash distributions to holders of our units at our current distribution rate.
14
In order to make cash distributions on our Preferred Units at the preference distribution rate of $0.17875 per unit per quarter, or $0.715 per unit per year, and on our common units at the minimum quarterly distribution of $0.11 per unit per quarter, or $0.44 per unit per year, we will require available cash of approximately $9.2 million per quarter, or $36.7 million per year. We may not have sufficient available cash from operating surplus each quarter to enable us to make cash distributions on our Preferred Units at the preference rate or on our common units at the minimum quarterly distribution rate. The amount of cash we can distribute on our units principally depends upon the amount of cash we generate from our operations, which will fluctuate from quarter to quarter based on, among other things, the risks described herein.
In addition, the actual amount of cash we will have available for distribution will depend on other factors, including:
• | the level of capital expenditures we make; |
• | the cost of acquisitions; |
• | our debt service requirements and other liabilities; |
• | fluctuations in our working capital needs; |
• | our ability to borrow funds and access capital markets; |
• | restrictions contained in our credit facility or other debt agreements; and |
• | the amount of cash reserves established by our General Partner. |
Our cash available for distributions to our unitholders could be negatively impacted if we are unable to extend existing storage contracts or enter into new storage contracts at our Cushing terminal.
We have a total of 6.6 million barrels of storage capacity at the Cushing terminal. Customer storage contracts for 2.8 million barrels of storage at this location are month-to-month or expire in 2016. We may not be able to extend, renegotiate or replace these contracts when they expire, and the terms of any renegotiated contracts may not be as favorable as the contracts they replace. In addition, to the degree that we operate outside of long-term contracts, our revenues can be significantly more volatile than would be the case with a pricing structure negotiated through a long-term storage contract. If we cannot successfully renew significant contracts or must renew them on less favorable terms, our revenues from these arrangements could decline which could have a material adverse effect on our financial condition, results of operations and cash flows.
We depend on certain key customers for a portion of our revenues and are exposed to credit risks of these customers. The loss of or material nonpayment or nonperformance by any of these key customers could adversely affect our cash flow and results of operations.
We rely on certain key customers for a portion of revenues. For example, Vitol represented approximately $1.2 million, or 2%, of our total asphalt terminalling services revenue in 2015, $11.5 million, or 47%, of our total crude oil terminalling and storage revenue, $9.3 million, or 32%, of our crude oil pipeline services revenue, and $15.6 million, or 40%, of our total crude oil trucking and producer field services revenue. Vitol is a private company and we have limited information regarding its financial condition. Vitol comprised 17% of total accounts receivable at December 31, 2015.
In addition to Vitol, other key customers include Ergon Asphalt & Emulsions, Heartland Asphalt Materials, Inc., Suncor Energy USA, Axeon Marketing, LLC and Western States Asphalt, Inc., which each accounted for at least 10% but not more than 25% of total asphalt terminalling services revenue in 2015. MV Purchasing, LLC and Sunoco Partners Marketing & Terminals, L.P., each accounted for at least 10% but no more than 20% of total crude oil terminalling and storage revenue. MV Purchasing, LLC and Devon Energy Production Co. each accounted for at least 10% but no more than 25% of total crude oil trucking and producer field services revenue in 2015. XTO Energy, Inc. and Valero Marketing & Supply Co. each accounted for at least 10% but no more than 25% of total crude oil pipeline services revenue in 2015.
We may be unable to negotiate extensions or replacements of contracts with key customers on favorable terms. In addition, some of these key customers may experience financial problems that could have a significant effect on their creditworthiness. Severe financial problems encountered by our customers could limit our ability to collect amounts owed to us, or to enforce performance of obligations under contractual arrangements. Additionally, many of our customers finance their activities through cash flow from operations, the incurrence of debt or the issuance of equity. The reduction of cash flow resulting from declines in commodity prices, a reduction in borrowing bases under credit facilities, the lack of availability of debt or equity financing, or any combination of such factors may result in a significant reduction of our customers’ liquidity and limit their ability to make payments or perform on their obligations to us. Furthermore, some of our customers may be highly leveraged and subject to their own operating and regulatory risks, which increases the risk that they may default on their
15
obligations to us. The loss of all or even a portion of the contracted volumes of these key customers, as a result of competition, creditworthiness or otherwise, could have a material adverse effect on our business, cash flows, ability to make distributions to our unitholders, unit price, results of operations and ability to conduct our business.
We are exposed to the credit risks of our third-party customers in the ordinary course of our gathering activities. Any material nonpayment or nonperformance by our third-party customers could reduce our ability to make distributions to our unitholders.
We are subject to risks of loss resulting from nonpayment or nonperformance by our third-party customers. Some of our customers may be highly leveraged and subject to their own operating and regulatory risks including risks relating to commodity price deterioration or other conditions in the energy industry. In addition, any material nonpayment or nonperformance by our customers could require us to pursue substitute customers for our affected assets or provide alternative services. Any such efforts may not be successful, may be expensive to undertake, and may not provide similar fees. These events could have a material adverse effect on our financial condition and results of operations.
The amount of cash we have available for distribution to holders of our units depends primarily on our cash flow and not solely on earnings reflected in our financial statements. Consequently, even if we are profitable and are otherwise able to pay distributions, we may not be able to make cash distributions to holders of our units.
Our unitholders should be aware that the amount of cash we have available for distribution depends primarily upon our cash flow and not solely on earnings reflected in our financial statements, which will be affected by non-cash items. As a result, we may make cash distributions, if permitted by our credit agreement, during periods when we record losses for financial accounting purposes and may not make cash distributions during periods when we record net earnings for financial accounting purposes.
Our debt levels under our credit agreement may limit our ability to make distributions and our flexibility in obtaining additional financing and in pursuing other business opportunities.
As of December 31, 2015, we had approximately $246.3 million in outstanding indebtedness, including approximately $1.3 million in outstanding letters of credit, under our $400.0 million credit facility. Our level of debt under the credit facility could have important consequences for us, including the following:
• | our ability to obtain additional financing, if necessary, for working capital, capital expenditures, acquisitions or other purposes may be impaired or such financing may not be available on favorable terms; |
• | we will need a substantial portion of our cash flow to make principal and interest payments on our debt, reducing the funds that would otherwise be available for operations, future business opportunities and distributions to unitholders; |
• | our debt level will make us more vulnerable to competitive pressures or a downturn in our business or the economy generally; and |
• | our debt level may limit our flexibility in responding to changing business and economic conditions. |
Our ability to service our debt will depend upon, among other things, our future financial and operating performance, which will be affected by prevailing economic conditions and financial, business, regulatory and other factors. Our ability to service debt under our credit facility also will depend on market interest rates, since the interest rates applicable to our borrowings will fluctuate with the eurodollar rate or the prime rate. If our operating results are not sufficient to service our current or future indebtedness, we will be forced to take actions such as reducing distributions, reducing or delaying our business activities, acquisitions, investments or capital expenditures, selling assets, restructuring or refinancing our debt, or seeking additional equity capital. We may not be able to effect any of these actions on satisfactory terms, or at all.
We may not be able to raise sufficient capital to grow our business.
As of March 3, 2016, we have aggregate unused credit availability under our revolving credit facility of approximately $129.7 million, although our ability to borrow such funds may be limited by the financial covenants in our credit facility, and cash on hand of approximately $1.4 million. Our ability to access the public capital markets on terms acceptable to us or at all may be limited due to, among other things, commodity price volatility and deterioration, general economic conditions, rising interest rates, capital market volatility, the uncertainty of our future cash flows, adverse business developments and other contingencies. In addition, we may have difficulty obtaining a credit rating or any credit rating that we do obtain may be lower than it otherwise would be due to these uncertainties. The lack of a credit rating or a low credit rating
16
may also adversely impact our ability to access capital markets on terms acceptable to us or at all, and may increase significantly the costs of financing our growth potential.
If we fail to raise additional capital or an event of default occurs under our credit agreement, we may be forced to sell assets or take other action that could have a material adverse effect on our business, unit price and results of operations. In addition, if we are unable to access the capital markets for acquisitions or expansion projects on terms acceptable to us or at all, or if the financing cost related to any such acquisitions or expansion projects increases, it may have a material adverse effect on our business, cash flows, ability to make distributions to our unitholders, unit price, results of operations and ability to conduct our business.
If we borrow funds to make any permitted quarterly distributions, our ability to pursue acquisitions and other business opportunities may be limited and our operations may be materially and adversely affected.
Available cash for the purpose of making distributions to unitholders includes working capital borrowings. If we borrow funds to pay one or more quarterly distributions, such amounts will incur interest and must be repaid in accordance with the terms of our credit facility. In addition, any amounts borrowed for permitted distributions to our unitholders will reduce the funds available to us for other purposes under our credit facility, including amounts available for use in connection with acquisitions and other business opportunities. If we are unable to pursue our growth strategy due to our limited ability to borrow funds, our operations may be materially and adversely affected.
We are indirectly exposed to commodity price volatility.
Our operations have minimal direct exposure to changes in asphalt and crude oil prices. However, the volumes of asphalt and crude oil we gather, market, transport or store are affected by commodity prices because many of our customers have direct commodity price exposure. Many of our customers have been, and continue to be, adversely affected by the recent significant decline in commodity prices. If our customers continue to be negatively impacted by commodity price volatility or a sustained period of depressed commodity prices or other adverse conditions of the energy industry, they may, among other things, decrease the amount of services that we provide to them. The prices of asphalt and crude oil are inherently volatile, and we expect this volatility to continue. Any significant reduction in the amount of services we provide to our customers would have a material adverse effect on our results of operations and cash flows.
Our revenues from third-party customers are generated under contracts that must be renegotiated periodically and that allow the customer to reduce or suspend performance in some circumstances, which could cause our revenues from those contracts to decline and reduce our ability to make distributions to our unitholders.
Some of our contract-based revenues from customers are generated under contracts with terms which allow the customer to reduce or suspend performance under the contract in specified circumstances, such as the occurrence of a catastrophic event to our or the customer’s operations. The occurrence of an event which results in a material reduction or suspension of our customer’s performance could have a material adverse effect on our financial condition, results of operations and cash flows.
Our contracts with some of our customers have terms of one year or less. As these contracts expire, they must be extended and renegotiated or replaced. We may not be able to extend, renegotiate or replace these contracts when they expire, and the terms of any renegotiated contracts may not be as favorable as the contracts they replace. In particular, our ability to extend or replace contracts could be harmed by numerous competitive factors, such as those described above under “Item 1. Business - Competition.” We face intense competition in our gathering, pipeline transportation, terminalling and storage and trucking activities. Competition from other providers of crude oil gathering, pipeline transportation, terminalling and storage and trucking services that are able to supply our customers with those services at a lower price could reduce our ability to make distributions to our unitholders. Additionally, we may incur substantial costs if modifications to our terminals are required in order to attract substitute customers or provide alternative services. If we cannot successfully renew significant contracts or must renew them on less favorable terms, or if we incur substantial costs in modifying our terminals, our revenues from these arrangements could decline, which could have a material adverse effect on our financial condition, results of operations and cash flows.
Certain of our asphalt terminalling services contracts have short terms, and certain leases relating to our asphalt operations may be terminated upon short notice.
As of March 3, 2016, we had leases and storage agreements with third party customers relating to each of our 45 asphalt facilities. The majority of the leases and storage agreements related to these facilities have terms that expire between the end of 2016 and the end of 2018. We may not be able to renew or extend our existing contracts or enter into new leases or storage
17
agreements when such contracts expire on terms acceptable to us or at all. In addition, certain key customers account for a significant portion of our asphalt terminalling services revenues, the loss of which could result in a significant decrease in revenues from our asphalt operations. A significant decrease in the revenues we receive from our asphalt operations could result in violations of covenants under our credit facility and could have a material adverse effect on our business, cash flows, ability to make distributions to our unitholders, the price of our units, our results of operations and ability to conduct our business.
In addition, certain of our asphalt facilities are located on land that we lease from third parties. Some of these leases may be terminated by the lessor with as short as thirty days’ notice. We also have not yet received consent from certain of the lessors to sublease such facilities, which may result in a default under such lease or invalidate the subleases. If such leases were terminated, it could have a material adverse effect on our ability to provide asphalt terminalling services, which could have a material adverse effect on our business, cash flows, ability to make distributions to our unitholders, unit price, results of operations and ability to conduct our business. In addition, in certain instances, we have not entered into new leases with a lessor although we continue to operate under expired leases and make payments to the lessor and are in the process of negotiating new leases. If it were determined that we did not have rights under these leases, it could have a material adverse effect on our ability to conduct our asphalt operations and on our financial condition, results of operations and cash flows.
We are not fully insured against all risks incident to our business and could incur substantial liabilities as a result.
We may not be able to maintain or obtain insurance of the type and amount we desire at reasonable rates. As a result of changing market conditions, premiums and deductibles for certain of our insurance policies may increase substantially in the future. In some instances, certain insurance could become unavailable or available only for reduced amounts of coverage. If we were to incur a significant liability for which we were not fully insured, it could have a material adverse effect on our business, cash flows, ability to make distributions to our unitholders, unit price, results of operations and ability to conduct our business.
A significant decrease in demand for asphalt and/or crude oil products in the areas served by our operations could reduce our ability to make distributions to our unitholders.
A sustained decrease in demand for asphalt and/or crude oil products in the areas served by our storage facilities and pipelines could significantly reduce our revenues and, therefore, reduce our ability to make or increase distributions to our unitholders. Factors that could lead to a decrease in market demand for asphalt and crude oil products include:
• | lower demand by consumers for refined products, including asphalt products, as a result of recession or other adverse economic conditions or due to high prices caused by an increase in the market price of crude oil or higher taxes or other governmental or regulatory actions that increase, directly or indirectly, the cost of gasoline or other refined products; |
• | a shift by consumers to more fuel-efficient or alternative fuel vehicles or an increase in fuel economy of vehicles, whether as a result of technological advances by manufacturers, governmental or regulatory actions, or otherwise; and |
• | fluctuations in demand for crude oil, including those caused by refinery downtime or shutdowns. |
Certain of our field and pipeline operating costs and expenses are fixed and do not vary with the volumes we gather and transport. These costs and expenses may not decrease ratably or at all should we experience a reduction in our volumes gathered or transported by our operations. As a result, we may experience declines in our margin and profitability if our volumes decrease.
A material decrease in the production of crude oil from the oil fields served by our pipelines could materially reduce our ability to make distributions to our unitholders.
The throughput on our crude oil pipelines depends on the availability and demand for transportation and storage of crude oil produced from the oil fields served by such pipelines or through connections with pipelines owned by third parties. Crude oil production may decline for a number of reasons, including natural declines due to depleting wells, a material decrease in the price of crude oil, or the inability of producers to obtain necessary drilling or other permits from applicable governmental authorities. Recently, commodity prices have declined significantly. If prices remain depressed for any sustained period of time, production may slow and our customers may decrease the volumes we transport or store for them. If we are unable to replace volumes lost due to a temporary or permanent material decrease in production from the oil fields served by our crude oil pipelines, our throughput could decline, reducing our revenue and cash flow and adversely affecting our financial condition and results of operations. In addition, it is difficult to attract producers to a new gathering system if the producer is already
18
connected to an existing system. As a result, third-party shippers on our pipeline systems may experience difficulty acquiring crude oil at the wellhead in areas where there are existing relationships between producers and other gatherers and purchasers of crude oil.
A material decrease in the production of liquid asphalt cement could materially reduce our ability to make distributions to our unitholders.
The throughput at our asphalt facilities depends on the availability of attractively priced liquid asphalt cement produced from the various liquid asphalt cement producing refineries. Liquid asphalt cement production may decline for a number of reasons, including refiners processing more light, sweet crude oil or refiners installing coker units that further refine heavy residual fuel oil bottoms such as liquid asphalt cement. If our customers are unable to replace volumes lost due to a temporary or permanent material decrease in production from the suppliers of liquid asphalt cement, our throughput could decline, reducing our revenue and cash flow and adversely affecting our financial condition and results of operations.
We face intense competition in our gathering, transportation, terminalling and storage activities. Competition from other providers of crude oil gathering, transportation, terminalling and storage services that are able to supply our customers with those services at a lower price could reduce our ability to make distributions to our unitholders.
We are subject to competition from other crude oil gathering, transportation, terminalling and storage operations that may be able to supply our customers with the same or comparable services on a more competitive basis. We compete with national, regional and local gathering, storage, terminalling and pipeline companies, including the major integrated oil companies, of widely varying sizes, financial resources and experience. Some of these competitors are substantially larger than us, have greater financial resources, and control substantially greater storage capacity than we do. With respect to our gathering and transportation services, these competitors include Enterprise Products Partners L.P., Plains All American Pipeline, L.P., ConocoPhillips, Sunoco Logistics Partners L.P. and Rose Rock Midstream Partners, L.P., among others. With respect to our storage and terminalling services, these competitors include Magellan Midstream Partners, L.P., Enbridge Energy Partners, L.P., Enterprise Products Partners L.P., Plains All American Pipeline, L.P. and Rose Rock Midstream Partners, L.P. Several of our competitors conduct portions of their operations through publicly traded partnerships with structures similar to ours, including Plains All American Pipeline, L.P., Enterprise Products Partners L.P., Sunoco Logistics Partners L.P., Enbridge Energy Partners, L.P. and Rose Rock Midstream Partners, L.P. Our ability to compete could be harmed by numerous factors, including:
• | price competition; |
• | the perception that another company can provide better service; and |
• | the availability of alternative supply points, or supply points located closer to the operations of our customers. |
In addition, each of Charlesbank and Vitol owns midstream assets and may engage in competition with us. If we are unable to compete with services offered by other midstream enterprises, it could have a material adverse effect on our financial condition, results of operations and cash flows. See “- Risks Inherent in an Investment in Us - Vitol and Charlesbank may compete with us, which could adversely affect our existing business and limit our ability to acquire additional assets or businesses.”
Some of our pipeline systems are dependent upon interconnections with other crude oil pipelines to reach end markets.
Some of our pipeline systems are dependent upon their interconnections with other crude oil pipelines to reach end markets. Reduced throughput on these interconnecting pipelines as a result of testing, line repair, reduced operating pressures or other causes could result in reduced throughput on our pipeline systems that would adversely affect our revenue, cash flow and results of operations.
If we are unable to make acquisitions on economically acceptable terms, our future growth may be limited.
Our ability to grow in the future will depend, in part, on our ability to make acquisitions that result in an increase in the cash generated per unit from operations. Vitol and Charlesbank have indicated that they intend to use us as a growth vehicle to pursue the acquisition and expansion of midstream energy businesses and assets. Vitol and Charlesbank may use a development company, in which we would have no interest, for pursuing projects that we may later have the opportunity to acquire. Further, we may be involved in additional midstream projects for Vitol or Charlesbank outside of any development company. We also cannot say with any certainty whether or not such a development company, or Vitol or Charlesbank, will develop any projects or, if they do, which, if any, of these future acquisition opportunities may be made available to us, or if we will choose to pursue any such opportunity. In addition, identifying projects for and developing projects within such a
19
development company may result in the diversion of management’s and employees’ attention from operating our assets and other business concerns of our partnership.
In addition to any projects acquired and developed by such a development company, we may also make acquisitions directly from third parties. If we are unable to make accretive acquisitions, because we are (1) unable to acquire projects from such a development company when they are available, (2) unable to identify attractive acquisition candidates or negotiate acceptable purchase contracts with them, (3) unable to obtain financing for these acquisitions on economically acceptable terms or (4) outbid by competitors, then our future growth and ability to increase distributions will be limited. Furthermore, even if we do make acquisitions that we believe will be accretive, these acquisitions may nevertheless result in a decrease in the cash generated from operations per unit.
Any acquisition involves potential risks, including, among other things:
• | mistaken assumptions about volumes, revenues and costs, including synergies; |
• | an inability to integrate successfully the businesses we acquire; |
• | an inability to hire, train or retain qualified personnel to manage and operate our business and assets; |
• | the assumption of unknown liabilities; |
• | limitations on rights to indemnity from the seller; |
• | mistaken assumptions about the overall costs of equity or debt; |
• | the diversion of management’s and employees’ attention from other business concerns; |
• | unforeseen difficulties operating in new product areas or new geographic areas; and |
• | customer or key employee losses at the acquired businesses. |
If we consummate any future acquisitions, our capitalization and results of operations may change significantly, and our unitholders likely will not have the opportunity to evaluate the economic, financial and other relevant information that we will consider in determining the application of these funds and other resources.
If we acquire assets that are distinct and separate from our existing terminalling, storage, gathering and transportation operations, it could subject us to additional business and operating risks.
We may acquire assets that have operations in new and distinct lines of business from our asphalt or crude oil operations. Integration of a new business is a complex, costly and time-consuming process. Failure to timely and successfully integrate acquired entities’ lines of business with our existing operations may have a material adverse effect on our business, financial condition, results of operations and cash flows. The difficulties of integrating a new business with our existing operations include, among other things:
• | operating distinct businesses that require different operating strategies and different managerial expertise; |
• | the necessity of coordinating organizations, systems and facilities in different locations; |
• | integrating personnel with diverse business backgrounds and organizational cultures; and |
• | consolidating corporate and administrative functions. |
In addition, the diversion of our attention and any delays or difficulties encountered in connection with the integration of a new business, such as unanticipated liabilities or costs, could harm our existing business, results of operations, financial conditions and prospects. Furthermore, new lines of business may subject us to additional business and operating risks. For example, we may in the future determine to acquire businesses that are subject to direct exposure to fluctuations in commodity prices. These new business and operating risks could have a material adverse effect on our financial condition, results of operations and cash flows.
Expanding our business by constructing new assets subjects us to risks that projects may not be completed on schedule and that the costs associated with projects may exceed our expectations and budgets, which could cause our cash available for distribution to our unitholders to be less than anticipated.
The construction of additions or modifications to our existing assets, and the construction of new assets, involves numerous regulatory, environmental, political, legal and operational uncertainties and requires the expenditure of significant amounts of capital. If we undertake these types of projects, they may not be completed on schedule or at all or within the
20
budgeted cost. Moreover, we may construct facilities to capture anticipated future growth in demand in a market in which such growth does not materialize.
Construction and additional development of the Knight Warrior Pipeline project subjects us to risks of construction delays, cost over-runs, limitations on our growth and negative effects on our operating results, liquidity and financial position.
In August 2014, we announced our intention to build the Knight Warrior Pipeline to link the emerging East Texas Woodbine/Eaglebine crude oil resource play to Oiltanking Houston, a crude oil and product terminal on the Houston Ship Channel, owned and operated by Oiltanking Partners, L.P. While the Knight Warrior Pipeline continues to be in our plans, the project is currently on hold and we are approaching it very cautiously as a result of the significant decline in the market price for crude oil, reduced area crude oil rig counts and crude oil production as well as the increased cost of capital. If and when construction is restarted, the Knight Warrior Pipeline project will take more than a year to complete, and the construction of the project is subject to a number of factors not always within our control, including issues with obtaining rights-of-way from third-party landowners, the permitting processes, unavailability of materials, labor disruptions, environmental hazards, financing, accidents, weather and other factors. Some of these factors could result in meaningful delays in the construction of the project. Delays in the completion of the project could have a material adverse effect on our business, financial condition, results of operations and liquidity. The construction of the Knight Warrior Pipeline project will require the expenditure of significant amounts of capital, which is subject to variables that may significantly increase expected costs. Should the actual cost of the project exceed our estimates and contingencies, our liquidity and capital position could be adversely affected.
Our expansion projects may not immediately produce operating cash flows.
Expansion projects require us to make significant capital investments over time and we will incur financing costs during the planning and construction phases of these projects; however, the operating cash flows we expect these projects to generate will not materialize, if at all, until sometime after the projects are completed and placed into service. As a result, to the extent we finance our projects with borrowings, our leverage may increase during the period prior to the generation of those operating cash flows and, to the extent we finance our projects with equity, our cash available for distribution on a common unit basis may decrease during the period prior to the generation of those operating cash flows. If we experience unanticipated or extended delays in generating operating cash flow from construction projects, or if such operating cash flows do not materialize as expected, we may need to reduce or reprioritize our capital budget in order to meet our capital requirements, and our liquidity and capital position could be adversely affected.
We may incur significant costs and liabilities as a result of pipeline integrity management program requirements and any necessary pipeline repair, or preventative or remedial measures, which could have a material adverse effect on our results of operations.
The DOT has adopted regulations requiring pipeline operators to develop integrity management programs for pipelines that could affect “high consequence areas,” including populated areas, areas that are unusually sensitive to environmental damage and commercially navigable waterways. The regulations require operators of covered pipelines to:
• | perform ongoing assessments of pipeline integrity; |
• | identify and characterize threats to pipeline segments that could impact a high consequence area; |
• | improve data collection, integration and analysis; |
• | repair and remediate the pipeline as necessary; and |
• | implement preventive and mitigating actions. |
Effective in July 2008, the DOT broadened the scope of coverage of its existing pipeline safety standards, including its integrity management programs, to include certain rural onshore hazardous liquid and low-stress pipeline systems found near “unusually sensitive areas,” including non-populated areas requiring extra protection because of the presence of sole source drinking water resources, endangered species or other ecological resources. Also, in December 2006, PIPES was enacted. PIPES reauthorized and amended the DOT’s pipeline safety programs and included a provision eliminating the regulatory exemption for hazardous liquid pipelines operated at low stress. The Pipeline Safety, Regulatory Certainty, and Job Creation Act of 2011, enacted in January 2012, required the DOT to study and report on the expansion of integrity management requirements, the sufficiency of existing gathering line regulations to ensure safety and the feasibility of leak detection systems for hazardous liquid pipelines. On August 13, 2012, PHMSA published rules to update pipeline safety regulations, including increasing maximum civil penalties from $0.1 million to $0.2 million per day of violation and from $1.0 million to $2.0 million as a maximum account for a related series of violations as well as changing PHMSA’s enforcement process. PHMSA also issued an Advisory Bulletin in May 2012 which advised pipeline operators that they must have records to document the
21
maximum operating pressure for each section of their pipeline and that the records must be traceable, verifiable and complete. Locating such records and, in the absence of any such records, verifying maximum pressures through physical testing (including hydrotesting) or modifying or replacing facilities to meet the demands of verifiable pressures, could significantly increase an operator’s costs. PHMSA is currently proposing additional regulations. Adoption of new or more stringent pipeline safety regulations affecting our rural gathering or low-stress pipelines could result in more rigorous and costly integrity management planning requirements being imposed on those lines, which could have a material adverse effect on our results of operations. Please read “Item 1. Business-Regulation-Pipeline Safety” for more information.
We may be subject to significant costs related to environmental investigations and/or remediation activities at our asphalt facilities.
We acquired our asphalt assets from SemCorp in 2008 and 2009. The majority of these assets were previously acquired by SemCorp from Koch Industries, Inc. (together with its subsidiaries, “Koch”) in 2005. Koch retained certain liabilities, including certain environmental liabilities, when it sold the assets to SemCorp. Since 2005, Koch has been conducting environmental investigation and/or remediation activities at certain of our asphalt facilities in connection with these retained environmental liabilities. Koch may allege that they are not responsible for retained environmental liabilities at certain of our asphalt facilities. Although we intend to defend any such allegations, if we are found to be liable for such environmental liabilities, it could have a material adverse effect on our business, cash flows, ability to make distributions to our unitholders, the price of our units, our results of operations and ability to conduct our business.
Our operations are subject to environmental and worker safety laws and regulations that may expose us to significant costs and liabilities. Failure to comply with these laws and regulations could adversely affect our ability to make distributions to our unitholders.
Our operations are subject to stringent federal, state and local laws and regulations relating to the protection of the environment. Various governmental authorities, including the EPA, have the power to enforce compliance with these laws and regulations and the permits issued under them, and violators are subject to administrative, civil and criminal penalties, including civil fines, injunctions or both. Joint and several strict liability may be incurred without regard to fault or the legality of the original conduct under CERCLA, RCRA and analogous state laws for the remediation of contaminated areas. Private parties also may have the right to pursue legal actions to enforce compliance, as well as seek damages for non-compliance, with environmental laws and regulations or for personal injury or property damage. Moreover, new laws, regulations or enforcement policies could be implemented that significantly increase our compliance costs and the cost of any remediation that may become necessary, some of which may be material.
We incur environmental costs and liabilities in connection with the handling of hydrocarbons and solid wastes. We currently own, operate or lease properties that for many years have been used for midstream activities, including properties in and around the Cushing Interchange, and with respect to our asphalt assets, for asphalt activities. Activities by us or prior owners, lessees or users of these properties over whom we had no control may have resulted in the spill or release of hydrocarbons or solid wastes on or under them. Additionally, some sites we own or operate are located near current or former storage, terminal and pipeline operations, and there is a risk that contamination has migrated from those sites to ours. Increasingly strict environmental laws, regulations and enforcement policies as well as claims for damages and other similar developments could result in significant costs and liabilities, and our ability to make distributions to our unitholders could suffer as a result. Please see “Item 1-Business-Environmental, Health, and Safety Risks” for more information.
In addition, the workplaces associated with the storage facilities and pipelines we operate are subject to OSHA requirements and comparable state statutes that regulate the protection of the health and safety of workers. The OSHA hazard communication standard requires that we maintain information about hazardous materials used or produced in our operations and that we provide this information to employees, state and local government authorities, and local residents. Failure to comply with OSHA requirements, including general industry standards, recordkeeping requirements and monitoring of occupational exposure to regulated substances, could subject us to fines or significant compliance costs and have a material adverse effect on our financial condition, results of operations and cash flows.
Adoption of legislation and regulatory measures targeting GHG emissions could affect our operations, expose us to significant costs and liabilities, and reduce demand for the products we transport.
The crude oil and petroleum-based product business is a direct source of certain GHG emissions, namely carbon dioxide and methane, and future restrictions on such emissions could impact our future operations. Federal legislation requiring GHG controls has been considered and could be enacted in the future. Moreover, the EPA has promulgated a series of rulemakings and other actions intended to result in the regulation of GHGs as pollutants under the CAA. In April 2010, EPA promulgated
22
final motor vehicle GHG emission standards and has taken the position that the motor vehicle GHG emission standards triggered CAA permitting requirements for certain affected stationary sources of GHG emissions as of January 2, 2011. In May 2010, the EPA finalized the Prevention of Significant Deterioration and Title V GHG Tailoring Rule, which phased in federal new source review and Title V permitting requirements for certain affected stationary sources of GHG emissions, beginning January 2, 2011. On June 23, 2014, the United States Supreme Court ruled that portions of the EPA’s GHG regulatory program violated the Clean Air Act. Specifically, the Supreme Court determined that GHGs cannot independently trigger PSD permitting requirements. However, the Court held that certain PSD permitting requirements may apply to GHG emissions if emissions of another regulated pollutant, like sulfur dioxide or particulate matter, trigger PSD permitting. Additionally, the Supreme Court held that the Tailoring Rule’s regulatory emissions thresholds violated the Clean Air Act, while suggesting that the EPA could promulgate “de minimis” thresholds for GHGs. Further proceedings are ongoing in the United States Court of Appeals for the District of Columbia. These EPA rulemakings could affect our operations by effectively reducing demand for motor fuels from crude oil and could affect our ability to obtain air permits for new or modified facilities. Moreover, in 2009, the EPA issued a rule that established comprehensive requirements for monitoring and reporting of GHG emissions on an annual basis by operators of certain stationary sources in the U.S. emitting more than established annual thresholds of carbon dioxide-equivalent GHG emissions. Monitoring obligations began in 2010 and reporting obligations began in March 2011. Some of our facilities include natural gas-fired combustion units that may become subject to the rule. These facilities are required to annually calculate their GHG emissions to determine whether they trigger reporting and monitoring requirements. To date, none of our facilities have exceeded the thresholds established for reporting or monitoring requirements. Although this rule does not control GHG emission levels from any facilities, it has caused us to incur monitoring and reporting costs relating to GHG emissions. Furthermore, the scope of the rule was expanded in 2011 to cover additional petroleum and natural gas production, processing, and transmission sources (“Subpart W”) that were not previously covered by the rule. This expansion in scope may impact the crude oil industry and, as a result, affect our business. We also note, as previously mentioned, that the EPA proposed rules to set standards for methane and volatile organic compound emissions from new and modified sources in the oil and gas sector, including transmission. This action was taken pursuant to the President’s Climate Action Plan, which may give rise to other regulations affecting our business. A final rule is expected in 2016. We continue to monitor and review these regulations to determine future impacts, including potential reporting requirements. Legislation and regulations relating to control or reporting of GHG emissions are also in various stages of discussions or implementation in many of the states in which we operate.
Passage of climate change legislation or other federal or state legislative or regulatory initiatives that regulate or restrict GHG emissions in areas in which we conduct business or that have the effect of requiring or encouraging reduced consumption or production of crude oil and petroleum-based products could potentially
• | adversely affect the demand for our products and services; |
• | affect our operations and ability to obtain air permits for new or modified facilities; |
• | increase the costs to operate and maintain our facilities; |
• | increase the costs of our business by requiring us to acquire allowances to authorize our GHG emissions (e.g., for natural gas-fired combustion units); |
• | increase the costs of our business by requiring us to pay any taxes related to our GHG emissions and/or administer and manage a GHG emissions program; and |
• | increase the cost or availability of goods and services as a result of impacts on entities that provide goods and services to us. |
In addition to potential impacts on our business directly or indirectly resulting from climate-change legislation or regulations, our business also could be negatively affected by climate related physical changes or changes in weather patterns. A loss of coastline in the vicinity of our facilities or an increase in severe weather patterns could result in damages to or loss of our physical assets, impact our ability to conduct operations and/or result in a disruption of our customer’s operations. These kinds of physical changes could also affect entities that provide goods and services to us and indirectly have an adverse affect on our business as a result of increases in costs or availability of goods and services. Changes of this nature could have a material adverse impact on our business.
A portion of our customers’ production is developed from unconventional sources, such as shales, that require hydraulic fracturing as part of the completion process. Hydraulic fracturing involves the injection of water, sand and chemicals under pressure into shale formations to stimulate crude oil and/or gas production. The practice of hydraulic fracturing has been subject to public scrutiny in recent years and various efforts to regulate, or in some cases prohibit, hydraulic fracturing have been, and are still being, pursued at the local, state and federal levels of government. For example, several states, including states in which we operate, have imposed disclosure requirements on hydraulic fracturing, and several local governments have
23
prohibited or severely restricted hydraulic fracturing within their jurisdictions. Restrictions on hydraulic fracturing could adversely affect our operations by reducing the volumes of crude oil that we transport.
Additionally, the ESA restricts activities that may affect endangered or threatened species or their habitats. While some of our operations may be located in areas that are designated as habitats for endangered or threatened species, we believe that we are in substantial compliance with the ESA. However, the designation of previously unlisted endangered or threatened species could cause us to incur additional costs or become subject to operating restrictions or bans or limit future development in the affected areas. The MBTA implements various treaties and conventions between the United States and certain other nations for the protection of migratory birds. Pursuant to the MBTA, the taking, killing or possessing of migratory birds is unlawful without a permit, thereby potentially requiring the implementation of operating restrictions or a temporary, seasonal, or permanent ban in affected areas. We believe that we are in substantial compliance with the MBTA, but noncompliance could result in fines or operational prohibitions that could adversely affect our financial condition and results of operations.
Please also see “Item 1. Business-Environmental, Health and Safety Risks-Climate.”
Our business involves many hazards and operational risks, including adverse weather conditions, which could cause us to incur substantial liabilities.
Our operations are subject to the many hazards inherent in the transportation and storage of crude oil and the storage and processing of liquid asphalt cement, including:
• | explosions, earthquakes, fires and accidents, including road and highway accidents involving our tanker trucks; |
• | extreme weather conditions, such as hurricanes, which are common in the Gulf Coast, and tornadoes and flooding which are common in the Midwest and other areas of the United States in which we operate; |
• | damage to our pipelines, storage tanks, terminals and equipment; |
• | leaks or releases of crude oil into the environment; and |
• | acts of terrorism or vandalism. |
If any of these events were to occur, we could suffer substantial losses because of personal injury or loss of life, severe damage to and destruction of property and equipment, and pollution or other environmental damage resulting in curtailment or suspension of our related operations. In addition, mechanical malfunctions, faulty measurement or other errors may result in significant costs or lost revenues.
We do not own all of the land on which our pipelines and facilities are located, which could disrupt our operations.
We do not own all of the land on which our pipelines and crude oil and asphalt facilities have been constructed, and we are therefore subject to the possibility of more onerous terms and/or increased costs to retain necessary land use if rights-of-way or any material real property leases are invalid, lapse or terminate. We obtain the rights to construct and operate our pipelines and some of our crude oil and asphalt facilities on land owned by third parties and governmental agencies for a specific period of time. Our loss of these rights, through our inability to renew leases, right-of-way contracts or otherwise, could have a material adverse effect on our business, results of operations, financial condition, cash flows and ability to make cash distributions to our unitholders. In addition, we are in the process of obtaining consents from the lessors for certain leased property that was transferred to us as part of the acquisition of our asphalt assets. If any consent is denied, it could have a material adverse effect on our business, results of operations, financial condition, cash flows and our ability to make cash distributions to our unitholders.
We could experience increased severity or frequency of accidents and other claims.
Potential liability associated with accidents in the trucking industry is severe and occurrences are unpredictable. A material increase in the frequency or severity of accidents or workers’ compensation claims or the unfavorable development of existing claims could materially adversely affect our results of operations. In the event that accidents occur, we may be unable to obtain desired contractual indemnities, and our insurance may prove inadequate in certain cases. The occurrence of an event not fully insured or indemnified against, or the failure or inability of a customer or insurer to meet its indemnification or insurance obligations, could result in substantial losses.
Changes in trucking regulations may increase our costs and negatively impact our results of operations.
24
Our trucking services are subject to regulation as a motor carrier by the DOT and by various state agencies, whose regulations include certain permit requirements of state highway and safety authorities. These regulatory authorities exercise broad powers over our trucking operations, generally governing such matters as the authorization to engage in motor carrier operations, safety, equipment testing and specifications and insurance requirements. There are additional regulations specifically relating to the trucking industry, including testing and specification of equipment and product handling requirements. The trucking industry is subject to possible regulatory and legislative changes that may impact our operations and affect the economics of the industry by requiring changes in operating practices or by changing the demand for or the cost of providing truckload services. Some of these possible changes include increasingly stringent fuel emission limits, changes in the regulations that govern the amount of time a driver may drive or work in any specific period, limits on vehicle weight and size and other matters, including safety requirements.
Terrorist or cyber-attacks and threats, escalation of military activity in response to these attacks or acts of war could have a material adverse effect on our business, financial condition or results of operations.
Terrorist attacks and threats, cyber-attacks, escalation of military activity or acts of war may have significant effects on general economic conditions, fluctuations in consumer confidence and spending and market liquidity, each of which could materially and adversely affect our business. Terrorist or cyber-attacks, rumors or threats of war, actual conflicts involving the United States or its allies, or military or trade disruptions may significantly affect our operations and those of our customers. Strategic targets, such as energy-related assets, may be at greater risk of future attacks than other targets in the United States. We do not maintain specialized insurance for possible exposures resulting from a cyber-attack on our assets that may shut down all or part of our business. Disruption or significant increases in energy prices could result in government-imposed price controls. It is possible that any of these occurrences, or a combination of them, could have a material adverse effect on our business, financial condition and results of operations.
Risks Inherent in an Investment in Us
Vitol and Charlesbank control our General Partner, which has sole responsibility for conducting our business and managing our operations. Our General Partner has conflicts of interest with us and limited fiduciary duties, which may permit it to favor its own interests to the detriment of our unitholders.
Vitol and Charlesbank own and control our General Partner. Some of our General Partner’s directors are directors and officers of Vitol or Charlesbank. Therefore, conflicts of interest may arise between our General Partner, on the one hand, and us and our unitholders, on the other hand. In resolving those conflicts of interest, our General Partner may favor its own interests and the interests of its affiliates over the interests of our unitholders. Although the conflicts committee of the board of directors of our General Partner (the “Board”) may review such conflicts of interest, the Board is not required to submit such matters to the conflicts committee. These conflicts include, among others, the following situations:
• | neither our partnership agreement nor any other agreement requires our General Partner, Vitol or Charlesbank to pursue a business strategy that favors us. Such persons may make decisions in their best interest, which may be contrary to our interests; |
• | our General Partner is allowed to take into account the interests of parties other than us and our unitholders, such as Vitol, Charlesbank and their affiliates, in resolving conflicts of interest; |
• | if we do not have sufficient available cash from operating surplus, our General Partner could cause us to use cash from non-operating sources, such as asset sales, issuances of securities and borrowings, to pay distributions, which means that we could make distributions that deteriorate our capital base and that our General Partner could receive distributions on its incentive distribution rights to which it would not otherwise be entitled if we did not have sufficient available cash from operating surplus to make such distributions; |
• | Vitol and Charlesbank are holders of our Preferred Units and may favor their interests in actions relating to such units, including causing us to make distributions on such units even if no distributions are made on the common units; |
• | Vitol and Charlesbank may compete with us, including with respect to future acquisition opportunities (either through a development company or otherwise) and each of them currently owns or has an equity position in one or more entities that own and operate midstream assets; |
• | Vitol and Charlesbank may favor their own interests in proposing the terms of any acquisitions we make directly from them or from a development company, and such terms may not be as favorable as those we could receive from an unrelated third party; |
25
• | our General Partner has limited liability and reduced fiduciary duties and our unitholders have restricted remedies available for actions that, without the limitations, might constitute breaches of fiduciary duty; |
• | our General Partner determines the amount and timing of asset purchases and sales, borrowings, issuance of additional partnership securities and reserves, each of which can affect the amount of cash that is distributed to unitholders; |
• | our General Partner determines the amount and timing of any capital expenditures and whether a capital expenditure is a maintenance capital expenditure, which reduces operating surplus, or an expansion capital expenditure, which does not reduce operating surplus. This determination can affect the amount of cash that is distributed to our unitholders; |
• | our General Partner may make a determination to receive a quantity of our Class B units in exchange for resetting the target distribution levels related to its incentive distribution rights without the approval of the conflicts committee of our General Partner or our unitholders; |
• | our General Partner determines which costs incurred by it and its affiliates are reimbursable by us; |
• | our partnership agreement does not restrict our General Partner from causing us to pay it or its affiliates for any services rendered to us or entering into additional contractual arrangements with any of these entities on our behalf; |
• | our General Partner intends to limit its liability regarding our contractual and other obligations and, in some circumstances, is entitled to be indemnified by us; |
• | our General Partner may exercise its limited right to call and purchase common units if it and its affiliates own more than 80% of the common units; |
• | our General Partner controls the enforcement of obligations owed to us by our General Partner and its affiliates; and |
• | our General Partner decides whether to retain separate counsel, accountants or others to perform services for us. |
Our partnership agreement limits the fiduciary duties our General Partner owes to holders of our units and restricts the remedies available to holders of our units for actions taken by our General Partner that might otherwise constitute breaches of fiduciary duty.
Our partnership agreement contains provisions that reduce the fiduciary standards to which our General Partner would otherwise be held by state fiduciary duty laws. For example, our partnership agreement:
• | permits our General Partner to make a number of decisions in its individual capacity, as opposed to in its capacity as our General Partner. This entitles our General Partner to consider only the interests and factors that it desires, and it has no duty or obligation to give any consideration to any interest of, or factors affecting, us, our affiliates or any limited partner. Examples include the exercise of its right to receive a quantity of our Class B units in exchange for resetting the target distribution levels related to its incentive distribution rights, the exercise of its limited call right, the exercise of its rights to transfer or vote the units it owns, the exercise of its registration rights and its determination whether or not to consent to any merger or consolidation of the partnership or amendment to the partnership agreement; |
• | provides that our General Partner will not have any liability to us or our unitholders for decisions made in its capacity as a general partner so long as it acted in good faith, meaning it believed the decision was in the best interests of our partnership; |
• | generally provides that affiliated transactions and resolutions of conflicts of interest not approved by the conflicts committee of the Board acting in good faith and not involving a vote of unitholders must be on terms no less favorable to us than those generally being provided to or available from unrelated third parties or must be “fair and reasonable” to us, as determined by our General Partner in good faith. In determining whether a transaction or resolution is “fair and reasonable,” our General Partner may consider the totality of the relationships between the parties involved, including other transactions that may be particularly advantageous or beneficial to us; |
• | provides that our General Partner and its officers and directors will not be liable for monetary damages to us, our limited partners or assignees for any acts or omissions unless there has been a final and non-appealable judgment entered by a court of competent jurisdiction determining that our General Partner or its officers and directors acted in bad faith or engaged in fraud or willful misconduct or, in the case of a criminal matter, acted with knowledge that the conduct was criminal; and |
• | provides that in resolving conflicts of interest, it will be presumed that in making its decision our General Partner acted in good faith, and in any proceeding brought by or on behalf of any limited partner or us, the person bringing or prosecuting such proceeding will have the burden of overcoming such presumption. |
26
By purchasing a common unit, a common unitholder will become bound by the provisions in the partnership agreement, including the provisions discussed above.
Vitol and Charlesbank may compete with us, which could adversely affect our existing business and limit our ability to acquire additional assets or businesses.
Neither our partnership agreement nor any other agreement with Vitol or Charlesbank prohibits Vitol or Charlesbank from owning assets or engaging in businesses that compete directly or indirectly with us. In addition, Vitol or Charlesbank may acquire (either directly or through a development company), construct or dispose of additional midstream or other assets in the future, without any obligation to offer us the opportunity to purchase or construct any of those assets. Vitol is a large, international organization and Charlesbank is a middle-market private equity investment firm, and each of them currently owns or has an equity position in one or more entities that own and operate midstream assets. Each of Vitol and Charlesbank has significantly greater resources and experience than we have, which factors may make it more difficult for us to compete with these entities with respect to commercial activities as well as for acquisition candidates. As a result, competition from these entities could adversely impact our results of operations and cash available for distribution.
Cost reimbursements due to our General Partner and its affiliates for services provided, which are determined by our General Partner, may be substantial and will reduce our cash available for distribution to our unitholders.
Pursuant to our partnership agreement, our General Partner and its affiliates, including Vitol and Charlesbank, are entitled to receive reimbursement for the payment of expenses related to our operations and for the provision of various general and administrative services for our benefit. Payments for these services may be substantial and reduce the amount of cash available for distribution to unitholders. In addition, under Delaware partnership law, our General Partner has unlimited liability for our obligations, such as our debts and environmental liabilities, except for our contractual obligations that are expressly made without recourse to our General Partner. To the extent our General Partner incurs obligations on our behalf, we are obligated under our partnership agreement to reimburse or indemnify our General Partner. If we are unable or unwilling to reimburse or indemnify our General Partner, our General Partner may take actions to cause us to make payments of these obligations and liabilities. Any such payments would reduce the amount of cash otherwise available for distribution to our unitholders.
Holders of our Preferred Units and common units have limited voting rights and are not entitled to elect our General Partner or its directors.
Unlike the holders of common stock in a corporation, unitholders have only limited voting rights on matters affecting our business and, therefore, limited ability to influence management’s decisions regarding our business. Unitholders did not elect our General Partner or the Board and have no right to elect our General Partner or the Board on an annual or other continuing basis. The Board is chosen by Vitol and Charlesbank. Furthermore, if the unitholders are dissatisfied with the performance of our General Partner, they have little ability to remove our General Partner. Amendments to our partnership agreement may be proposed only by or with the consent of our General Partner. As a result of these limitations, the price at which the common units will trade could be diminished because of the absence or reduction of a takeover premium in the trading price.
Control of our General Partner may be transferred to a third party without unitholder consent.
Our General Partner may transfer its general partner interest to a third party in a merger or in a sale of all or substantially all of its assets without the consent of the unitholders. Furthermore, our partnership agreement does not restrict the ability of Vitol and Charlesbank, the owners of our General Partner, from transferring all or a portion of their ownership interest in our General Partner to a third party. The new owner of our General Partner would then be in a position to replace the Board and officers of our General Partner with its own choices and thereby influence the decisions made by the Board and officers.
We may issue additional units without approval of our unitholders, which would dilute our unitholders’ ownership interests.
Except in the case of the issuance of units that rank equal to or senior to the Preferred Units, our partnership agreement does not limit the number or price of additional limited partner interests that we may issue at any time without the approval of our unitholders. In addition, because we are a limited partnership, we will not be subject to the shareholder approval requirements relating to the issuance of securities (other than in connection with the establishment or material amendment of a stock option or purchase plan or the making or material amendment of any other equity compensation arrangement) contained in Nasdaq Marketplace Rule 5635. The issuance by us of additional common units or other equity securities of equal or senior rank may have any or all of the following effects, among others:
• | our unitholders’ proportionate ownership interest in us will decrease; |
27
• | the amount of cash available for distribution on each unit may decrease; |
• | the ratio of taxable income to distributions may increase; |
• | the relative voting strength of each previously outstanding unit may be diminished; and |
• | the market price of the common units may decline. |
Our partnership agreement restricts the voting rights of unitholders, other than our General Partner and its affiliates, including Vitol and Charlesbank, owning 20% or more of any class of our partnership securities.
Unitholders’ voting rights are further restricted by the partnership agreement, which provides that any units held by a person that owns 20% or more of any class of units then outstanding, other than our General Partner, its affiliates, their transferees and persons who acquired such units with the prior approval of the Board, cannot vote on any matter. Our partnership agreement also contains provisions limiting the ability of unitholders to call meetings or to acquire information about our operations, as well as other provisions.
Even if our public unitholders are dissatisfied with our General Partner, it will be difficult for them to remove our General Partner without its consent.
It will be difficult for our public unitholders to remove our General Partner without its consent because our General Partner and its affiliates own a substantial number of our units. The vote of the holders of at least 66 2/3% of all outstanding units voting together as a single class is required to remove the General Partner. As of December 31, 2015, Vitol and Charlesbank collectively owned approximately 28.9% of our aggregate outstanding Preferred Units and common units.
Affiliates of our General Partner may sell units in the public markets, which sales could have an adverse impact on the trading price of the units.
As of March 3, 2016, the executive officers and directors of our General Partner beneficially own an aggregate of 497,296 common units and 31,395 Preferred Units and Vitol and Charlesbank collectively own 18,312,968 Preferred Units. The sale of these units in the public markets could have an adverse impact on the public trading price of the units or on any trading market that may develop.
Our General Partner has a limited call right that may require our unitholders to sell their units at an undesirable time or price.
If at any time our General Partner and its affiliates own more than 80% of any class of units then outstanding, our General Partner will have the right, but not the obligation, which it may assign to any of its affiliates or to us, to acquire all, but not less than all, of such class of units held by unaffiliated persons at a price not less than their then-current market price. As a result, our unitholders may be required to sell their units at an undesirable time or price and may not receive any return on their investment. Our unitholders also may incur a tax liability upon a sale of their units. As of December 31, 2015, Vitol and Charlesbank collectively owned 60.7% of our outstanding Preferred Units.
Holders of our Preferred Units have a distribution preference and a liquidation preference, which may adversely impact the value of our common units.
The Preferred Units rank prior to our common units as to both distributions of available cash and distributions upon liquidation. Holders of our Preferred Units are entitled to preferred quarterly distributions of $0.17875 per unit per quarter (or $0.7150 per unit on an annual basis). If we fail to pay in full any distribution on our Preferred Units, the amount of such unpaid distribution will accrue and accumulate from the last day of the quarter for which such distribution is due until paid in full. If we are liquidated, we may not have sufficient funds remaining after payment of amounts to our creditors and to holders of our Preferred Units to make any distribution to holders of our common units.
The conversion rate applicable to the Preferred Units will not be adjusted for all events that may be dilutive.
The number of our common units issuable upon conversion of the Preferred Units is subject to adjustment only for subdivisions, splits or certain combinations of our common units. The number of common units issuable upon conversion is not subject to adjustment for other events, such as employee option grants, offerings of our common units for cash or in connection with acquisitions or other transactions that may increase the number of outstanding common units and dilute the ownership of existing common unitholders. The terms of the Preferred Units do not restrict our ability to offer common units in the future or to engage in other transactions that could dilute our common units.
28
We have rights to require our preferred unitholders to convert their Preferred Units into common units, and we may exercise this mandatory conversion right at an undesirable time.
We have the right in certain circumstances to force the conversion of all outstanding Preferred Units to common units. These circumstances include a situation in which holders of a certain number of Preferred Units have elected for the Preferred Units that they hold to be converted to common units, then we could then force all remaining outstanding Preferred Units to convert to common units. Vitol and Charlesbank, the owners of our General Partner, own enough Preferred Units such that if they converted all of them to common units, we would be able to exercise this mandatory conversion right. In addition, we also have the right, effective October 25, 2015, to force the conversion of the outstanding Preferred Units at any time if (i) the daily volume-weighted average trading price of our common units is greater than $8.45 for twenty out of the trailing thirty trading days ending two trading days before we furnish notice of conversion and (ii) the average trading volume of our common units has exceeded 20,000 common units for twenty out of the trailing thirty trading days ending two trading days before we furnish notice of conversion. As a result, our preferred unitholders may be required to convert their Preferred Units at an undesirable time and may not receive their expected return on investment.
Holders of the Preferred Units will not have rights to distributions as holders of common units until they acquire our common units.
Until our preferred unitholders acquire common units upon conversion of the Preferred Units, such preferred unitholders will have no rights with respect to distributions on our common units. Upon conversion, our preferred unitholders will be entitled to exercise the rights of a holder of our common units only as to matters for which the record date occurs after the date on which such Preferred Units were converted to our common units.
The Preferred Units are limited partner interests in our partnership and therefore are subordinate to any indebtedness.
The Preferred Units are limited partner interests in our partnership and do not constitute indebtedness. As such, the Preferred Units will rank junior to all indebtedness and other non-equity claims on our partnership with respect to assets available to satisfy claims on our partnership, including in a liquidation of our partnership.
Units held by persons who are not Eligible Holders will be subject to the possibility of redemption.
Our General Partner has the right under our partnership agreement to institute procedures, by giving notice to each of our unitholders, that would require transferees of units and, upon the request of our General Partner, existing holders of our units to certify that they are Eligible Holders. The purpose of these certification procedures would be to enable us to establish a federal income tax expense as a component of the pipeline’s cost of service for ratemaking purposes under current FERC policy applicable to entities that pass through their taxable income to their owners. Eligible Holders are individuals or entities subject to United States federal income taxation on the income generated by us or entities not subject to United States federal income taxation on the income generated by us, so long as all of the entity’s owners are subject to such taxation. If these tax certification procedures are implemented, we will have the right to redeem the units held by persons who are not Eligible Holders at the lesser of the holder’s purchase price and the then-current market price of the units. The redemption price would be paid in cash or by delivery of a promissory note, as determined by our General Partner.
Market interest rates may affect the value of our units.
One of the factors that will influence the price of our units will be the distribution yield on our units relative to market interest rates. An increase in market interest rates could cause the market price of the units to go down. The trading price of the units will also depend on many other factors, which may change from time to time, including:
• | the market for similar securities; |
• | government action or regulation; |
• | general economic conditions or conditions in the financial markets; and |
• | our financial condition, performance and prospects. |
Our unitholders’ liability may not be limited if a court finds that unitholder action constitutes control of our business.
29
A general partner of a partnership generally has unlimited liability for the obligations of the partnership, except for those contractual obligations of the partnership that are expressly made without recourse to the general partner. Our partnership is organized under Delaware law and we conduct business in a number of other states. The limitations on the liability of holders of limited partner interests for the obligations of a limited partnership have not been clearly established in some of the other states in which we do business.
Our unitholders could be liable for our obligations as if they were a general partner if:
• | a court or government agency determined that we were conducting business in a state but had not complied with that particular state’s partnership statute; or |
• | a unitholder’s right to act with other unitholders to remove or replace the general partner, to approve some amendments to our partnership agreement or to take other actions under our partnership agreement constitute “control” of our business. |
Unitholders may have liability to repay distributions that were wrongfully distributed to them.
Under certain circumstances, unitholders may have to repay amounts wrongfully returned or distributed to them. Under Section 17-607 and 17-804 of the Delaware Revised Uniform Limited Partnership Act, we may not make a distribution to our unitholders if the distribution would cause our liabilities to exceed the fair value of our assets. Delaware law provides that for a period of three years from the date of the impermissible distribution, limited partners who received the distribution and who knew at the time of the distribution that it violated Delaware law will be liable to the limited partnership for the distribution amount. Substituted limited partners are liable for the obligations of the assignor to make contributions to the partnership that are known to the substituted limited partner at the time it became a limited partner and for unknown obligations if the liabilities could be determined from the partnership agreement. Liabilities to partners on account of their partnership interests and liabilities that are non-recourse to the partnership are not counted for purposes of determining whether a distribution is permitted.
Tax Risks to Unitholders
Our common unitholders have been and will be required to pay taxes on their share of our taxable income even if they have not received or do not receive any cash distributions from us.
Because our unitholders are treated as partners to whom we allocate taxable income which could be different in amount than the cash we distribute, our common unitholders will be required to pay any federal income taxes and, in some cases, state and local income taxes on their share of our taxable income, even if our common unitholders receive no cash distributions from us. Our common unitholders may not receive cash distributions from us equal to their share of our taxable income or even equal to the actual tax liability that results from that income.
Our tax treatment depends on our status as a partnership for federal income tax purposes, as well as our not being subject to a material amount of entity-level taxation by individual states. If the IRS were to treat us as a corporation or if we were to become subject to a material amount of entity-level taxation for state tax purposes, then our cash available for distribution to our unitholders would be substantially reduced.
The anticipated after-tax economic benefit of an investment in our common units depends largely on us being treated as a partnership for federal income tax purposes. If less than 90% of the gross income of a publicly traded partnership, such as us, for any taxable year is “qualifying income” from sources such as the transportation, marketing (other than to end users), or processing of crude oil, natural gas or products thereof, interest, dividends or similar sources, that partnership will be taxable as a corporation under Section 7704 of the Internal Revenue Code for federal income tax purposes for that taxable year and all subsequent years. We have not requested and do not plan to request a ruling from the IRS with respect to our treatment as a partnership for federal income tax purposes.
If we were treated as a corporation for federal income tax purposes, then we would pay federal income tax on our taxable income at the corporate tax rate, which is currently a maximum of 35%, and would likely pay additional state income tax at varying rates. Distributions would generally be taxed again to unitholders as corporate distributions and none of our income, gains, losses, deductions or credits would flow through to our unitholders. Because a tax would be imposed upon us as a corporation, cash available for distribution to our unitholders would be substantially reduced. Therefore, treatment of us as a corporation would result in a material reduction in the anticipated cash flow and after-tax return to unitholders and thus would likely result in a substantial reduction in the value of our units.
30
In addition, recently enacted legislation applicable to partnership tax years beginning after 2017 changes the audit procedures for large partnerships and in certain circumstances would permit the IRS to assess and collect taxes (including any applicable penalties and interest) resulting from partnership-level federal income tax audits directly from us in the year in which the audit is completed. If we are required to make payments of taxes, penalties and interest resulting from audit adjustments, our cash available for distribution to our unitholders might be substantially reduced. Moreover, changes in current state law may subject us to entity-level taxation by individual states. Because of widespread state budget deficits and other reasons, several states are evaluating ways to subject partnerships to entity-level taxation through the imposition of state income, franchise and other forms of taxation. For example, we are required to pay annually a Texas franchise tax at a maximum effective rate of 0.7% of our gross income apportioned to Texas with respect to the prior year. Imposition of such a tax on us by Texas and, if applicable, by any other state will reduce the cash available for distribution to our unitholders.
Our partnership agreement provides that if a law is enacted or existing law is modified or interpreted in a manner that subjects us to taxation as a corporation or otherwise subjects us to entity-level taxation for federal, state or local income tax purposes, the minimum quarterly distribution amount and the target distribution amounts will be adjusted to reflect the impact of that law on us. No such adjustments have been made to date, but there can be no assurance that no such adjustments will be made in the future.
The tax treatment of publicly traded partnerships or an investment in our common units could be subject to potential legislative, judicial or administrative changes and differing interpretations, possibly on a retroactive basis.
The present federal income tax treatment of publicly traded partnerships, including us, or an investment in our common units may be modified by administrative, legislative or judicial interpretation at any time. Any modification to the federal income tax laws and interpretations thereof may or may not be applied retroactively. Moreover, any such modification could make it more difficult or impossible for us to meet the exception which allows publicly traded partnerships that generate qualifying income to be treated as partnerships (rather than corporations) for U.S. federal income tax purposes, affect or cause us to change our business activities, or affect the tax consequences of an investment in our common units. For example, members of Congress have considered substantive changes to existing federal income tax laws that would affect the tax treatment of certain publicly traded partnerships. We are unable to predict whether any of these changes, or other proposals, will ultimately be enacted. Any such changes could negatively impact the value of an investment in our units.
If the IRS contests any of the federal income tax positions we take, the market for our common units may be adversely affected, and the costs of any such contest will reduce our cash available for distribution to our unitholders.
We have not requested a ruling from the IRS with respect to our treatment as a partnership for federal income tax purposes or any other matter affecting us. The IRS may adopt positions that differ from the conclusions of our counsel or from the positions we take. It may be necessary to resort to administrative or court proceedings to sustain some or all of our counsel’s conclusions or the positions we take. A court may not agree with some or all of our counsel’s conclusions or the positions we take. Any contest with the IRS may materially and adversely impact the market for our units and the price at which they trade. In addition, the costs of any contest with the IRS will be borne indirectly by our unitholders and our General Partner because the costs will reduce our cash available for distribution.
Tax gain or loss on the disposition of our common units could be more or less than expected.
If our unitholders sell their units, they will recognize a gain or loss equal to the difference between the amount realized and their tax basis in those units. Because distributions to a unitholder which exceed the total net taxable income allocated to the unitholder decrease the unitholder’s tax basis in his or her units, any such prior excess distribution will, in effect, become taxable income to the unitholder if the common units are sold by the unitholder at a price greater than their tax basis, even if the price the unitholder receives is less than the original cost. Furthermore, a substantial portion of the amount realized, whether or not representing gain, may be taxed as ordinary income to the selling unitholder due to potential recapture items, including depreciation recapture. In addition, because the amount realized includes a unitholder’s share of our non-recourse liabilities, a unitholder who sells common units may incur a tax liability in excess of the amount of cash received from the sale.
If the IRS makes audit adjustments to our income tax returns for tax years beginning after 2017, it may collect any resulting taxes (including any applicable penalties and interest) directly from us, in which case our cash available for distribution to our unitholders might be substantially reduced.
Pursuant to recently enacted legislation, if the IRS makes audit adjustments to income tax returns for tax years beginning after 2017, it may assess and collect taxes (including any applicable penalties and interest) directly from us in the year in which
31
the audit is completed. If we are required to make payments of taxes, penalties and interest resulting from audit adjustments, our cash available for distribution to our unitholders might be substantially reduced. In addition, because payment would be due for the taxable year in which the audit is completed, unitholders during that taxable year would bear the expense of the adjustment even if they were not unitholders during the audited taxable year.
Tax-exempt entities and non-United States persons face unique tax issues from owning units that may result in adverse tax consequences to them.
Investment in common units by tax-exempt entities, such as individual retirement accounts (known as IRAs), pension plans and non-U.S. persons raises issues unique to them. For example, virtually all of our income allocated to organizations exempt from federal income tax, including individual retirement accounts and other retirement plans, will be unrelated business taxable income and will be taxable to them. Distributions to non-U.S. persons will be reduced by withholding taxes at the highest applicable effective tax rate, and non-U.S. persons will be required to file United States federal income tax returns and pay tax on their share of our taxable income. If a potential unitholder is a tax-exempt entity or a non-U.S. person, it should consult its tax advisor before investing in our units.
We will treat each purchaser of our common units as having the same tax benefits without regard to the specific common units purchased. The IRS may challenge this treatment, which could adversely affect the value of the common units.
Because we cannot match transferors and transferees of common units and because of other reasons, we will adopt depreciation and/or amortization positions that may not conform with all aspects of existing Treasury regulations. A successful IRS challenge to those positions could adversely affect the amount of tax benefits available to our unitholders. It also could affect the timing of these tax benefits or the amount of gain from their sale of common units and could have a negative impact on the value of our common units or result in audit adjustments to our unitholders’ tax returns.
The sale or exchange of 50% or more of our capital and profits interests during any twelve-month period will result in the termination of our partnership for federal income tax purposes.
We will be considered to have terminated for federal income tax purposes if there are one or more transfers of interests in our partnership that together represent sales or exchanges of 50% or more of the total interests in our capital and profits within a twelve-month period. For purposes of determining whether the 50% threshold has been met,
• | multiple transfers of the same interest within a twelve month period will be counted only once; and |
• | if Vitol or Charlesbank sells or exchanges its interests in our General Partner, the interests held by our General Partner in us will be deemed to have been sold or exchanged. |
While we would continue our existence as a Delaware limited partnership, our tax termination would, among other things, result in the closing of our taxable year for all unitholders which would result in us filing two tax returns (and our unitholders could receive two Schedules K-1 if relief is not available, as described below) for one fiscal year if the termination occurs on a day other than December 31 and could result in a deferral of depreciation deductions allowable in computing our taxable income. In the case of a unitholder reporting on a taxable year other than a fiscal year ending December 31, the closing of our taxable year may also result in more than twelve months of our taxable income or loss being includable in his taxable income for the year of termination. A tax termination would not affect our classification as a partnership for federal income tax purposes, but instead, we would be treated as a new partnership for tax purposes. If treated as a new partnership, we must make new tax elections, and if we were to fail to recognize and report on our tax return that a termination occurred, we could be subject to penalties. The IRS has announced a relief procedure whereby if a publicly traded partnership that has technically terminated requests and the IRS grants special relief, among other things, the partnership will be required to provide only a single Schedule K-1 to unitholders for the year in which the termination occurs notwithstanding two partnership tax years.
Our unitholders likely will be subject to state and local taxes and return filing or withholding requirements in states in which they do not live as a result of investing in our units.
In addition to federal income taxes, our unitholders will likely be subject to other taxes, such as state and local income taxes, unincorporated business taxes and estate, inheritance, or intangible taxes that are imposed by the various jurisdictions in which we conduct business or own property. Our unitholders may be required to file state and local income tax returns and pay state and local income taxes in certain of these various jurisdictions. Further, our unitholders may be subject to penalties for failure to comply with those requirements. We currently own property and conduct business in Texas, Oklahoma, Kansas, Colorado, New Mexico, Arkansas, California, Georgia, Idaho, Illinois, Indiana, Missouri, Michigan, Montana, Nebraska,
32
Nevada, New Jersey, North Carolina, Ohio, Pennsylvania, Tennessee, Utah, Virginia and Washington. Most of these states currently impose income taxes on corporations, and many of these states impose income taxes on other entities and nonresident individuals. We may own property or conduct business in other states or foreign countries in the future. It is each unitholder’s responsibility to file all federal, state, local and foreign tax returns. Under the tax laws of some states where we will conduct business, we may be required to withhold a percentage from amounts to be distributed to a unitholder who is not a resident of that state. For example, in the case of Oklahoma, we are required to either obtain a withholding exemption affidavit from and generally report detailed tax information about our non-Oklahoma resident unitholders or withhold an amount equal to 5% of the portion of our distributions to unitholders which is deemed to be the Oklahoma share of our income.
We hold certain assets located at certain of our asphalt facilities in a subsidiary taxed as a corporation. Such subsidiary is subject to entity level federal and state income taxes on its net taxable income and, if a material amount of entity-level taxes were incurred, then our cash available for distribution to our unitholders could be substantially reduced.
We hold certain of our asphalt processing assets and related fee income through BKEP Asphalt, L.L.C., that is a subsidiary taxed as a corporation. Such subsidiary is required to pay federal income tax on its income at the corporate tax rate, which is currently a maximum of 35%, and will likely pay state (and possibly local) income tax at varying rates. Distributions from such subsidiary will generally be taxed again to unitholders as corporate distributions and none of the income, gains, losses, deductions or credits of such subsidiary will flow through to our unitholders. Currently, the maximum federal income tax rate applicable to dividend income from such subsidiary which is allocable to individuals is 20% plus an unearned Medicare tax of 3.8%. An individual unitholder’s share of dividend and interest income from such subsidiary would constitute portfolio income that could not be offset by the unitholder’s share of our other losses or deductions. If a material amount of entity-level taxes are incurred by such subsidiary, then our cash available for distribution to its unitholders could be substantially reduced.
We prorate our items of income, gain, loss and deduction between transferors and transferees of our common units each month based upon the ownership of our common units on the first day of each month, instead of on the basis of the date a particular common unit is transferred. The IRS may challenge this treatment, which could change the allocation of items of income, gain, loss and deduction among our common unitholders.
We prorate our items of income, gain, loss and deduction between transferors and transferees of our common units each month based upon the ownership of our common units on the first day of each month, instead of on the basis of the date a particular unit is transferred. The use of this proration method may not be permitted under existing Treasury Regulations. The U.S. Treasury Department and the IRS recently issued final Treasury Regulations pursuant to which a publicly traded partnership may use a similar monthly simplifying convention to allocate tax items among transferor and transferee unitholders although such tax items must be prorated on a daily basis. However, these Treasury Regulations do not specifically authorize the use of the proration method we have adopted. If the IRS were to successfully challenge our proration method, we may be required to change the allocation of items of income, gain, loss and deduction among our unitholders.
A unitholder whose units are loaned to a “short seller” to effect a short sale of units may be considered as having disposed of those units. If so, such unitholder would no longer be treated for tax purposes as a partner with respect to those units during the period of the loan and may recognize gain or loss from the disposition.
Because a unitholder whose units are loaned to a “short seller” to effect a short sale of units may be considered as having disposed of the loaned units, such unitholder may no longer be treated for tax purposes as a partner with respect to those units during the period of the loan to the short seller and the unitholder may recognize gain or loss from such disposition. Moreover, during the period of the loan to the short seller, any of our income, gain, loss or deduction with respect to those units may not be reportable by the unitholder and any cash distributions received by the unitholder as to those units could be fully taxable as ordinary income. Unitholders desiring to assure their status as partners and avoid the risk of gain recognition from a loan to a short seller are urged to consult a tax advisor to discuss whether it is advisable modify any applicable brokerage account agreements to prohibit their brokers from borrowing their units.
Unitholders converting preferred units into common units could under certain limited circumstances receive a gross income allocation that may materially increase the taxable income allocated to such unitholders.
Under our partnership agreement and in accordance with Treasury Regulations, immediately after the conversion of a preferred unit, we will adjust the capital accounts of all of our partners to reflect any positive difference (“Unrealized Gain”) or negative difference (“Unrealized Loss”) between the fair market value and the carrying value of our assets at such time as if such Unrealized Gain or Unrealized Loss had been recognized on an actual sale of each such asset for an amount equal to its fair market value at the time of such conversion. Such Unrealized Gain or Unrealized Loss (or items thereof) will be allocated
33
first to the converting preferred unitholder in respect of common units received upon the conversion until the capital account of each such common unit is equal to the per unit capital account for each existing common unit. This allocation of Unrealized Gain or Unrealized Loss will not be taxable to the converting preferred unitholder or to any other unitholders. If the Unrealized Gain or Unrealized Loss allocated as a result of the conversion of a preferred unit is not sufficient to cause the capital account of each common unit received upon such conversion to equal the per unit capital account for each existing common unit, then capital account balances will be reallocated among the unitholders as needed to produce this result. In the event that such a reallocation is needed, a converting preferred unitholder would be allocated taxable gross income in an amount equal to the amount of any such reallocation to it.
The tax treatment of publicly traded partnerships or an investment in our common units could be subject to potential legislative, judicial or administrative changes and differing interpretations, possibly on a retroactive basis.
The present federal income tax treatment of publicly traded partnerships, including us, or an investment in our common units, may be modified by administrative, legislative or judicial interpretation at any time. For example, from time to time, the President and members of Congress propose and consider substantive changes to the existing federal income tax laws that affect publicly traded partnerships, including elimination of partnership tax treatment for publicly traded partnerships. Any modification to the federal income tax laws and interpretations thereof may or may not be retroactively applied and could make it more difficult or impossible for us to meet the requirements that must be satisfied in order for us to be treated as a partnership for federal income tax purposes.
On May 5, 2015, the U.S. Treasury Department and the IRS released proposed regulations (the “Proposed Regulations”), regarding qualifying income under Section 7704(d)(1)(E) of the Code. The U.S. Treasury Department and the IRS have requested comments from industry participants regarding the standards set forth in the Proposed Regulations. The Proposed Regulations provide an exclusive list of industry-specific activities and certain limited support activities that generate qualifying income. We do not believe the Proposed Regulations affect our ability to qualify as a publicly traded partnership. However, the Proposed Regulations could be changed before they are finalized an could take a position that is contrary to our interpretation. In the event that we do not satisfy the standards set forth in the final regulations for income that we treat as qualifying, we anticipate being able to continue to treat income from these activities as qualifying income for ten years under special transition rules provided for in the Proposed Regulations.
We are unable to predict whether any of these changes, or other proposals, will ultimately be enacted. Any such changes could negatively impact the value of an investment in our common units. Our partnership agreement provides that if a law is enacted or existing law is modified or interpreted in a manner that subjects us to taxation as a corporation or otherwise subjects us to entity-level taxation for federal income tax purposes, the minimum quarterly distribution and the target distribution levels will be adjusted to reflect the impact of that law on us.
We may adopt certain valuation methodologies and monthly conventions for federal income tax purposes that may result in a shift of income, gain, loss and deduction between our General Partner and our common unitholders. The IRS may challenge this treatment, which could adversely affect the value of our outstanding units.
When we issue additional units or engage in certain other transactions, we will determine the fair market value of our assets and allocate any unrealized gain or loss attributable to our assets to the capital accounts of our common unitholders and our General Partner. Our methodology may be viewed as understating the value of our assets. In that case, there may be a shift of income, gain, loss and deduction between certain common unitholders and our General Partner, which may be unfavorable to such unitholders. Moreover, under our valuation methods, subsequent purchasers of units may have a greater portion of their Internal Revenue Code Section 743(b) adjustment allocated to our tangible assets and a lesser portion allocated to our intangible assets. The IRS may challenge our valuation methods, or our allocation of the Section 743(b) adjustment attributable to our tangible and intangible assets, and allocations of taxable income, gain, loss and deduction between our General Partner and certain of our common unitholders.
A successful IRS challenge to these methods or allocations could adversely affect the amount of taxable income or loss being allocated to our common unitholders. It also could affect the amount of taxable gain from our unitholders’ sale of units and could have a negative impact on the value of the units or result in audit adjustments to our unitholders’ tax returns without the benefit of additional deductions.
Compliance with and changes in tax law could adversely affect our performance.
We are subject to extensive tax laws and regulations, including federal and state income taxes and transactional taxes such as excise, sales/use, payroll, franchise and ad valorem taxes. New tax laws and regulations and changes in existing tax laws
34
and regulations are continuously being enacted that could result in increased tax expenditures in the future. Many of these tax liabilities are subject to audits by the respective taxing authority. These audits may result in additional taxes as well as interest and penalties.
Item 1B. Unresolved Staff Comments.
None.
Item 2. Properties.
A description of our properties is contained in “Item 1-Business.”
Title to Properties
Substantially all of our pipelines are constructed on rights-of-way granted by the apparent record owners of the property. Lands over which pipeline rights-of-way have been obtained may be subject to prior liens that have not been subordinated to the right-of-way grants. We have also obtained, where necessary, easement agreements, licenses or permits from public authorities and railroad companies to cross over or under, or to lay facilities in or along, watercourses, county roads, municipal streets, railroad properties and state highways, as applicable. In the event of a challenge to our pipeline location, we generally have the right or of eminent domain or other recourse to retain the pipeline in place. In some cases, property on which our pipelines were built was purchased in fee. Our crude oil terminals are on real property owned or leased by us.
Our asphalt assets are on real property owned or leased by us. Some of the real property leases that were transferred to us as part of the acquisition of our asphalt assets required the consent of the counterparty to such lease. In certain instances, we have not entered into new leases with a lessor although we continue to use such leases and make payments to the lessor and are in the process of negotiating new leases.
Other than as described above, we believe that we have satisfactory title to or rights in all of our assets. Although title or rights to such properties is subject to encumbrances in certain cases, such as customary interests generally retained in connection with acquisition of real property, liens related to environmental liabilities associated with historical operations, liens for current taxes and other burdens and minor easements, restrictions and other encumbrances to which the underlying properties were subject at the time of acquisition by our predecessor or us, we believe that none of these burdens will materially interfere with their use in the operation of our business.
Item 3. Legal Proceedings.
The information required by this item is included under the caption “Commitments and Contingencies” in Note 17 to our financial statements, and is incorporated herein by reference thereto.
Item 4. Mine Safety Disclosures.
None.
PART II. OTHER INFORMATION
Item 5. | Market for Registrant’s Common Equity, Related Unitholder Matters and Issuer Purchases of Equity Securities. |
Our common units are traded on the Nasdaq Global Market under the symbol “BKEP” and our Preferred Units are traded on the Nasdaq Global Market under the symbol “BKEPP”.
On March 3, 2016, there were 33,198,339 common units outstanding, held by approximately 1,029 unitholders of record and 30,158,619 Preferred Units outstanding held by approximately 3 unitholders of record. The actual number of unitholders is greater than the number of holders of record. 18,312,968 of the Preferred Units are held by Vitol and Charlesbank.
The following table shows the high and low sales prices per common unit and Preferred Unit, as reported by Nasdaq, as well as distributions declared by quarter during the periods indicated.
35
Common Units | Low | High | Cash Distribution per Unit | ||||||||
2014: | |||||||||||
First Quarter | $ | 8.27 | $ | 9.40 | $ | 0.1300 | |||||
Second Quarter | 8.65 | 9.50 | 0.1325 | ||||||||
Third Quarter | 7.52 | 9.32 | 0.1345 | ||||||||
Fourth Quarter | 5.48 | 8.30 | 0.1365 | ||||||||
2015: | |||||||||||
First Quarter | $ | 5.91 | $ | 8.45 | $ | 0.1395 | |||||
Second Quarter | 7.25 | 8.40 | 0.1425 | ||||||||
Third Quarter | 5.38 | 7.52 | 0.1450 | ||||||||
Fourth Quarter | 4.54 | 6.69 | 0.1450 | ||||||||
Preferred Units | |||||||||||
2014: | |||||||||||
First Quarter | $ | 9.10 | $ | 10.20 | $ | 0.1788 | |||||
Second Quarter | 9.04 | 11.41 | 0.1788 | ||||||||
Third Quarter | 9.30 | 10.50 | 0.1788 | ||||||||
Fourth Quarter | 7.01 | 9.69 | 0.1788 | ||||||||
2015: | |||||||||||
First Quarter | $ | 8.06 | $ | 9.48 | $ | 0.1788 | |||||
Second Quarter | 8.41 | 9.52 | 0.1788 | ||||||||
Third Quarter | 6.34 | 8.75 | 0.1788 | ||||||||
Fourth Quarter | 6.00 | 7.51 | 0.1788 | ||||||||
Distributions of Available Cash
Our partnership agreement requires that, within 45 days after the end of each quarter, we distribute all of our available cash (as defined in our partnership agreement) to unitholders of record on the applicable record date.
Available cash, for any quarter, consists of all cash on hand at the end of that quarter:
• | less the amount of cash reserves established by our General Partner to: |
◦ | provide for the proper conduct of our business; |
◦ | comply with applicable law, any of our debt instruments or other agreements; or |
◦ | provide funds for distributions to our unitholders for any one or more of the next four quarters; |
• | plus all additional cash and cash equivalents on hand on the date of determination of available cash for the quarter resulting from working capital borrowings made after the end of the quarter. Working capital borrowings are generally borrowings that are made under a credit facility, commercial paper facility or similar financing arrangement, and in all cases are used solely for working capital purposes or to pay distributions to partners and with the intent of the borrower to repay such borrowings within 12 months. |
Pursuant to our credit facility, as refinanced in June 2013, we are permitted to make quarterly distributions of available cash to unitholders so long as no default exists under the credit agreement on a pro forma basis after giving effect to such distribution.
Our partnership agreement requires that we make distributions of available cash from operating surplus for any quarter in the following manner:
36
• | first, 98.2% to the holders of Preferred Units, pro rata, and 1.8% to our General Partner, until we distribute for each outstanding Preferred Unit an amount equal to the Series A Quarterly Distribution Amount (as defined in the partnership agreement) for that quarter; |
• | second, 98.2% to the holders of Preferred Units, pro rata, and 1.8% to our General Partner, until we distribute for each outstanding Preferred Unit an amount equal to any arrearages in the payment of the Series A Quarterly Distribution Amount for any prior quarters; |
• | third, 98.2% to all common unitholders and Class B unitholders (if any), pro rata, and 1.8% to our General Partner, until we distribute for each outstanding common and Class B unit an amount equal to the minimum quarterly distribution of $0.11 per unit for that quarter; and |
• | thereafter, in the manner described in “-General Partner Interest and Incentive Distribution Rights” below. |
The preceding discussion is based on the assumptions that our General Partner maintains its 1.8% general partner interest and that we do not issue additional classes of equity securities.
General Partner Interest and Incentive Distribution Rights
The following discussion assumes that our General Partner maintains its approximate 1.8% general partner’s interest and continues to own the incentive distribution rights.
Our partnership agreement provides that our General Partner will be entitled to an approximate 1.8% of all distributions that we make prior to our liquidation. Our General Partner has the right, but not the obligation, to contribute a proportionate amount of capital to us to maintain its approximate 1.8% general partner interest if we issue additional units. Our General Partner’s approximate 1.8% interest, and the percentage of our cash distributions to which it is entitled, will be proportionately reduced if we issue additional units in the future (other than the issuance of partnership securities issued in connection with a reset of the incentive distribution target levels relating to our General Partner’s incentive distribution rights or the issuance of partnership securities upon conversion of outstanding partnership securities) and our General Partner does not contribute a proportionate amount of capital to us in order to maintain its then current general partner interest. Our General Partner will be entitled to make a capital contribution in order to maintain its then current general partner interest in the form of the contribution to us of common units based on the current market value of the contributed common units.
Incentive distribution rights represent the right to receive an increasing percentage (13.0%, 23.0% and 48.0%) of quarterly distributions of available cash from operating surplus after the minimum quarterly distribution and the target distribution levels have been achieved. Our General Partner currently holds the incentive distribution rights, but may transfer these rights separately from its general partner interest, subject to restrictions in the partnership agreement.
If for any quarter:
• | we have distributed available cash from operating surplus to the holders of our Preferred Units in an amount equal to the Series A Quarterly Distribution Amount; |
• | we have distributed available cash from operating surplus to the holders of our Preferred Units in an amount necessary to eliminate any cumulative arrearages in the payment of the Series A Quarterly Distribution Amount; and |
• | we have distributed available cash from operating surplus to the common unitholders and Class B unitholders in an amount equal to the minimum quarterly distribution; |
then, our partnership agreement requires that we distribute any additional available cash from operating surplus for that quarter among the unitholders and our General Partner in the following manner:
• | first, 98.2% to all unitholders holding common units or Class B units, pro rata, and 1.8% to our General Partner, until each unitholder receives a total of $0.1265 per unit for that quarter (the “first target distribution”); |
• | second, 85.2% to all unitholders holding common units or Class B units, pro rata, and 14.8% to our General Partner, until each unitholder receives a total of $0.1375 per unit for that quarter (the “second target distribution”); |
• | third, 75.2% to all unitholders holding common units or Class B units, pro rata, and 24.8% to our General Partner, until each unitholder receives a total of $0.1825 per unit for that quarter (the “third target distribution”); and |
• | thereafter, 50.2% to all unitholders holding common units or Class B units, pro rata, and 49.8% to our General Partner. |
37
For equity compensation plan information, see “Item 12. Security Ownership of Certain Beneficial Owners and Management and Related Stockholder Matters-Securities Authorized for Issuance under Equity Compensation Plans.”
Unregistered Sales of Securities
None.
Item 6. Selected Financial Data.
The following table shows selected historical financial and operating data of Blueknight Energy Partners, L.P. for the annual periods and as of the dates presented.
We derived the information in the following table from, and that information should be read together with and is qualified in its entirety by reference to, the historical financial statements and the accompanying notes thereto, including those included elsewhere in this annual report. The table should be read together with “Item 1. Business” and “Item 7. Management’s Discussion and Analysis of Financial Condition and Results of Operations.”
38
2011 | 2012 | 2013 | 2014 | 2015 | |||||||||||||||
Statement of Operations Data: | (in thousands, except for per unit data) | ||||||||||||||||||
Service revenues: | |||||||||||||||||||
Third party revenue | $ | 129,104 | $ | 130,696 | $ | 142,916 | $ | 143,838 | $ | 140,926 | |||||||||
Related party revenue | 44,089 | 48,153 | 51,755 | 42,788 | 39,103 | ||||||||||||||
Total revenue | 173,193 | 178,849 | 194,671 | 186,626 | 180,029 | ||||||||||||||
Expenses: | |||||||||||||||||||
Operating | 114,731 | 122,746 | 133,610 | 134,245 | 131,205 | ||||||||||||||
General and administrative | 17,311 | 19,795 | 17,482 | 17,498 | 18,976 | ||||||||||||||
Asset Impairment Expense | 867 | 1,942 | 524 | — | 21,996 | ||||||||||||||
Total expenses | 132,909 | 144,483 | 151,616 | 151,743 | 172,177 | ||||||||||||||
Gain on sale of assets | 3,008 | 7,271 | 1,073 | 2,464 | 6,137 | ||||||||||||||
Operating income | 43,292 | 41,637 | 44,128 | 37,347 | 13,989 | ||||||||||||||
Other income (expense) | |||||||||||||||||||
Equity earnings (loss) in unconsolidated entity | — | — | (502 | ) | 883 | 3,932 | |||||||||||||
Interest expense(1) | (32,898 | ) | (11,705 | ) | (11,615 | ) | (12,268 | ) | (11,202 | ) | |||||||||
Unrealized gains on investments | — | — | — | 2,079 | — | ||||||||||||||
Change in fair value of embedded derivative within convertible debt | 20,224 | — | — | — | — | ||||||||||||||
Change in fair value of rights offering contingency | 1,883 | — | — | — | — | ||||||||||||||
Income before income taxes | 32,501 | 29,932 | 32,011 | 28,041 | 6,719 | ||||||||||||||
Provision for income taxes | 287 | 318 | 593 | 469 | 323 | ||||||||||||||
Net income from continuing operations | 32,214 | 29,614 | 31,418 | 27,572 | 6,396 | ||||||||||||||
Income (loss) from discontinued operations | 1,261 | 1,951 | (3,383 | ) | — | — | |||||||||||||
Net income | $ | 33,475 | $ | 31,565 | $ | 28,035 | $ | 27,572 | $ | 6,396 | |||||||||
Allocation of net income for purpose of calculating earnings per unit: | |||||||||||||||||||
General partners interest in net income | $ | 912 | $ | 774 | $ | 647 | $ | 641 | $ | 554 | |||||||||
Preferred partners interest in net income | $ | 16,446 | $ | 21,564 | $ | 21,564 | $ | 21,563 | $ | 21,564 | |||||||||
Accretion of discount on increasing rate preferred units | $ | 2,243 | $ | — | $ | — | $ | — | $ | — | |||||||||
Beneficial conversion feature attributable to preferred units | $ | 43,259 | $ | 1,853 | |||||||||||||||
Beneficial conversion feature attributable to repurchase of preferred units | $ | (6,892 | ) | $ | — | $ | — | $ | — | $ | — | ||||||||
Gain on extinguishment attributable to redemption of convertible debt, recorded as a capital transaction | $ | (2,375 | ) | $ | — | $ | — | $ | — | $ | — | ||||||||
Net income (loss) available to limited partners | $ | (20,118 | ) | $ | 7,374 | $ | 5,824 | $ | 5,368 | $ | (15,722 | ) | |||||||
Basic and diluted net income (loss) per limited partner unit: | |||||||||||||||||||
Common units | $ | (0.61 | ) | $ | 0.32 | $ | 0.25 | $ | 0.20 | $ | (0.47 | ) | |||||||
Subordinated Units | $ | (0.52 | ) | $ | — | $ | — | $ | — | $ | — | ||||||||
Cash distributions per unit to limited partners(2): | |||||||||||||||||||
Paid | $ | — | $ | 0.44 | $ | 0.48 | $ | 0.52 | $ | 0.56 | |||||||||
Declared | $ | 0.11 | $ | 0.45 | $ | 0.49 | $ | 0.53 | $ | 0.57 | |||||||||
Cash distributions per unit to preferred partners: | |||||||||||||||||||
Paid | $ | 0.52 | $ | 0.71 | $ | 0.72 | $ | 0.72 | $ | 0.72 | |||||||||
Declared | $ | 0.58 | $ | 0.72 | $ | 0.72 | $ | 0.72 | $ | 0.72 | |||||||||
Balance Sheet Data (at period end): | |||||||||||||||||||
Property, plant and equipment, net | $ | 266,355 | $ | 267,741 | $ | 297,400 | $ | 310,163 | $ | 312,934 | |||||||||
Total assets | $ | 304,755 | $ | 299,825 | $ | 354,748 | $ | 364,395 | $ | 364,746 | |||||||||
Long-term debt and capital lease obligations | $ | 220,781 | $ | 212,006 | $ | 275,707 | $ | 219,736 | $ | 247,548 | |||||||||
Total partners’ capital | $ | 57,799 | $ | 58,655 | $ | 55,458 | $ | 119,956 | $ | 87,219 | |||||||||
________________
(1) | Interest expense prior to June 28, 2013 includes interest expense incurred under our prior credit facility. Interest expense after June 28, 2013 includes interest expense under our credit facility, as well as amortization of debt issuance costs. Interest expense from October 25, 2010 through November 2011 includes amortization of the convertible subordinated debenture discount until their redemption. |
(2) | Cash distributions paid per unit to limited partners represent payments made per unit during the period stated. Cash distributions declared per unit to limited partners represent distributions declared per unit for the quarters within the period stated. Declared distributions were paid within 45 days following the close of each quarter. |
39
Item 7. Management’s Discussion and Analysis of Financial Condition and Results of Operations
Overview
We are a publicly traded master limited partnership with operations in twenty-four states. We provide integrated terminalling, storage, gathering and transportation services for companies engaged in the production, distribution and marketing of liquid asphalt cement and crude oil. We manage our operations through four operating segments: (i) asphalt terminalling services, (ii) crude oil terminalling and storage services, (iii) crude oil pipeline services and (iv) crude oil trucking and producer field services.
Potential Impact of Recent Crude Oil Market Price Changes on Future Revenues
From August 2014 to March 2016, the market price of West Texas Intermediate crude oil has decreased approximately 70% , from approximately $100 per barrel to approximately $30 per barrel. In addition, during the fourth quarter of 2014, the West Texas Intermediate crude oil forward price curve changed from a backwardated curve (in which the current crude oil price per barrel is more than the future price per barrel and a premium is placed on delivering product to market and selling as soon as possible) to a contango curve (in which future prices are higher than current prices and a premium is placed on storing product and selling at a later time). In addition to changes in the price of crude oil and changes in the forward pricing curve, there has been significant volatility in the overall energy industry and specifically in publicly traded midstream energy partnerships. As a result there are a number of trends that may impact our partnership in the near term. These include the market price for crude oil, decreased production in areas in which we serve, decreased demand for transportation capacity and an increased cost of capital. We expect these changes to have the following near-term impacts:
Asphalt Terminalling Services - Although there is no direct correlation between the price of crude oil and the price of asphalt, the asphalt industry tends to benefit from a lower crude oil price environment, strong economy and an increase in infrastructure spend. As a result, we do not expect the significant decrease in the price of crude oil to significantly impact our asphalt terminalling services operating segment.
Crude Oil Terminalling and Storage Services - A contango crude oil curve tends to favor the crude oil storage business as crude oil marketers are incentivized to store crude oil during the current month and sell into the future month. In September 2014, we had approximately 4.8 million barrels of storage with contracts that had expired or would expire between September 30, 2014 and May 31, 2015. As a result of the decrease in the crude oil price and change in the crude oil futures pricing curve, our weighted average storage rates have increased by 20% from September 2014 to March 2016. Beginning in the second quarter of 2015, we executed storage contracts for higher rates, leading to increased revenue for 2015 as compared to 2014. We have 2.8 million barrels of storage with contracts that expire during 2016. We have also increased customer diversity by the addition of three new customers. As a result storage capacity leased by Vitol decreased from nearly two thirds of our Cushing storage at September 30, 2014 to less than one-half beginning in the second quarter of 2015.
Crude Oil Pipeline Services - We do not currently expect the recent crude oil price changes to have a significant impact on our Mid-Continent pipeline system as a portion of that capacity is contracted under a long-term throughput and deficiency agreement and volumes have remained consistent throughout 2015. The throughput and deficiency agreement on our Eagle North system has not been renewed and volumes transported under the agreement are expected to cease by the end of the second quarter of 2016. We have plans to reverse the flow of the Eagle North system to transport lighter gravities of crude oil from Southern Oklahoma to Cushing, Oklahoma. We do not currently anticipate a significant impact on the overall revenues from this pipeline. We may experience a decrease in revenue on our East Texas pipeline system as a result of an overall decrease in production in the area and the expiration of an incentive tariff on a section of the system. Because of an anticipated decrease in futures revenues and resulting decline in market values, we have recognized non-cash impairment expenses of $12.6 million and $1.4 million related to our East Texas pipeline system and a portion of our Mid-Continent pipeline system, respectively, that is reflected in asset impairment expense in 2015. In addition, in West Texas a number of new pipelines have been or are expected to be put into service, which will increase the amount of takeaway capacity and competition for the same or declining volumes of crude oil and may impact margins and future equity earnings from the West Texas Pecos River Pipeline, in which we have a 30% equity ownership interest.
Crude Oil Trucking and Producer Field Services - A backwardated crude oil curve tends to favor the crude oil transportation services business as crude oil marketers are incentivized to deliver crude oil to market and sell as soon as possible. When the crude oil market curve changed from a backwardated curve to a contango curve in the fourth quarter of 2014, coupled with a decrease in the absolute price of crude oil, transported volumes started decreasing. Throughout 2015, we also experienced downward rate pressure in our trucking and producer field services business as producers and marketers
40
attempted to renegotiate service rates to preserve their operating margins in the changing market. In addition, during the second half of 2015, our West Texas operating margins and transported volumes were negatively impacted by increased competition from transporters moving equipment from crude oil shale areas to West Texas, where crude oil volumes have remained relatively consistent, and by producers and marketers quickly pipe-connecting transported barrels. As a result, we decided to cease trucking barrels in West Texas and refocus our efforts on transporting barrels around our owned crude oil pipelines and storage assets in Oklahoma and Kansas. We recorded a restructuring charge of $1.6 million associated with our exit from West Texas in addition to a non-cash impairment expense of $0.5 million associated with a write-down of assets to their estimated net realizable value. See Note 6 to our consolidated financial statements for additional detail regarding this restructuring expense.
Organic Projects vs. Acquisitions - In addition to the impacts above, we anticipate that a prolonged period of lower crude oil prices, a decrease in drilling and production volumes and increases in the cost of capital may change our bias from organic projects toward acquisitions with faster positive cash flows as opposed to organic projects that do not generate positive cash flow during their development. For example, while the development of the Knight Warrior Pipeline continues to be in our plans, this organic project is currently on hold and we are approaching it cautiously as a result of the current overall environment. We plan to continue to develop projects organically, but do so considering production volumes, pricing and drilling activities in areas in which we operate.
Recent Events
A time line of certain recent events is set forth below.
• | February 1, 2013 - We entered into an agreement with Advantage Pipeline, L.L.C. (“Advantage Pipeline”) to acquire approximately 30% ownership in a 70 mile crude oil pipeline project running from Pecos, Texas to Crane, Texas (the “Pecos River Pipeline”). The West Texas Pecos River Pipeline is a new 16" diameter pipeline that will enable west Texas producers to deliver crude oil to Gulf Coast markets through a pipeline connection at Crane, Texas. On September 17, 2013, commercial service started on Phase I of the system consisting of the Highway 18 Station near Grandfalls, Texas and 36 miles of pipeline connecting to the Longhorn Pipeline in Crane, Texas. In October 2014, utilizing temporary power, commercial service started on Phase II of the system consisting of the Highway 285 Station near Pecos, Texas and 29 miles of pipeline connecting to the Highway 18 Station. Full power for the Highway 285 Station was established in January 2015. We operate the pipeline under a long term agreement with Advantage Pipeline. |
• | June 28, 2013 - We entered into an amended and restated credit agreement which consists of a $400.0 million revolving loan facility. |
• | March 2014 - We entered into two interest rate swap agreements with an aggregate notional value of $200.0 million. The first agreement became effective June 28, 2014 and matures on June 28, 2018. Under the terms of the first interest rate swap agreement, we pay a fixed rate of 1.45% and receive one-month LIBOR with monthly settlement. The second agreement became effective January 28, 2015 and matures on January 28, 2019. Under the terms of the second interest rate swap agreement, we pay a fixed rate of 1.97% and receive one month LIBOR with monthly settlement. |
• | August 6, 2014 - We announced our intention to build the Knight Warrior Pipeline, which will link the emerging East Texas Woodbine/Eaglebine crude oil resource play to Oiltanking Houston, a crude oil and product terminal on the Houston Ship Channel, owned and operated by Oiltanking Partners, L.P. |
• | August 29, 2014 - We entered into a Crude Oil Throughput and Deficiency Agreement with Eaglebine Crude Oil Marketing LLC, a joint venture partly owned by Vitol Inc., effective as of August 28, 2014, pursuant to which we will provide certain crude oil transportation services on the Knight Warrior Pipeline for Eaglebine Crude. |
• | September 15, 2014 - We amended our credit facility to, among other things, amend the maximum permitted consolidated total leverage ratio and to increase the limit on material project adjustments to EBITDA (as defined in the credit agreement). |
• | September 22, 2014 - We issued and sold 9,775,000 common units for a public offering price of $7.61 per unit, resulting in proceeds of approximately $71.2 million, net of underwriters’ discount and offering expenses of $3.2 million. |
• | May 7, 2015 - We announced the acquisition of an asphalt terminalling facility in Cheyenne, Wyoming. |
• | November 2, 2015 - We acquired the 75 mile Red River pipeline system and related crude oil marketing business in southern Oklahoma. |
• | November 4 and 5, 2015 - We indicated that as a result of the significant decline in the market price for crude oil, reduced area crude oil rig counts and crude oil production as well as the increased cost of capital, the Knight Warrior Pipeline project has been paused. |
41
• | December 31, 2015 - We recorded a restructuring expense of $1.6 million related to employee severance and idle equipment costs related to our exit from the West Texas trucking business. We recorded non-cash fixed asset impairment expenses of $12.6 million, $1.4 million, and $0.5 million related to the write-down of our East Texas pipeline system, a portion of our Mid-Continent pipeline system, and our West Texas trucking stations, respectively, to their estimated fair value. We also recorded a non-cash impairment of $7.5 million related to goodwill associated with our pipeline services reporting unit. |
Our Revenues
Our revenues consist of (i) terminalling and storage revenues, (ii) gathering, transportation and producer field services revenues and (iii) fuel surcharge revenues. During the year ended December 31, 2015, we derived approximately $39.1 million of our revenues from services we provided to Vitol and Advantage Pipeline L.L.C. (“Advantage Pipeline”), with the remainder of our services being provided to third parties.
Terminalling and storage revenues consist of (i) storage service fees from actual storage used on a month-to-month basis; (ii) storage service fees resulting from short-term and long-term contracts for committed space that may or may not be utilized by the customer in a given month; and (iii) terminal throughput service charges to pump crude oil to connecting carriers or to deliver asphalt product out of our terminals. Terminal throughput service charges are recognized as the crude oil exits the terminal and is delivered to the connecting crude oil carrier or third-party terminal and as the asphalt product is delivered out of our terminal. Storage service revenues are recognized as the services are provided on a monthly basis. We earn terminalling and storage revenues in two of our segments: (i) crude oil terminalling and storage services and (ii) asphalt terminalling services.
As of March 2016, we have approximately 5.7 million barrels of crude oil storage under service contracts with remaining terms of up to thirteen months, including 2.8 million barrels of crude oil storage contracts that are either month-to-month contracts or expire in 2016. Storage contracts with Vitol represent 2.4 million barrels of crude oil storage capacity under contract.
We have leases and storage agreements with third party customers relating to our 45 asphalt facilities. The majority of the leases and storage agreements related to these facilities have terms that expire between the end of 2016 and the end of 2018. We operate the asphalt facilities pursuant to the storage agreements while our contract counterparties operate the asphalt facilities that are subject to the lease agreements.
Gathering and transportation services revenues consist of service fees recognized for the gathering of crude oil for our customers and the transportation of crude oil to refiners, to common carrier pipelines for ultimate delivery to refiners or to terminalling and storage facilities owned by us and others. Revenue for the gathering and transportation of crude oil is recognized when the service is performed and is based upon regulated and non-regulated tariff rates and the related transport volumes. Producer field services revenue consists of a number of services ranging from gathering condensates from natural gas producers to hauling produced water to disposal wells. Revenue for producer field services is recognized when the service is performed. We earn gathering and transportation revenues in two of our segments: (i) crude oil pipeline services and (ii) crude oil trucking and producer field services.
During the year ended December 31, 2015, we transported approximately 52,000 Bpd on our pipelines, an increase of 4% as compared to the year ended December 31, 2014. Vitol accounted for 31% and 28% of volumes transported in 2015 and 2014, respectively.
During the year ended December 31, 2015, we transported approximately 51,000 Bpd on our crude transport trucks, a decrease of 20% as compared to the year ended December 31, 2014. Vitol accounted for approximately 44% and 42% of volumes transported in 2015 and 2014, respectively.
Fuel surcharge revenues are comprised of revenues recognized for the reimbursement of fuel and power consumed to operate our asphalt product storage tanks and terminals. We recognize fuel surcharge revenues in the period in which the related fuel and power expenses are incurred.
Our Expenses
Operating expenses remained relatively consistent in 2015 as compared to 2014, decreasing by 2%. General and administrative expenses increased by 8% in 2015 as compared to 2014. Our interest expense decreased by $1.1 million in 2015
42
as compared to 2014. See Interest expense within our results of operations discussion for additional detail regarding the factors that contributed to the decrease in interest expense in 2015.
Income Taxes
As part of the process of preparing the consolidated financial statements, we are required to estimate the federal and state income taxes in each of the jurisdictions in which our subsidiary that is taxed as a corporation operates. This process involves estimating the actual current tax exposure together with assessing temporary differences resulting from differing treatment of items, such as depreciation, for tax and accounting purposes. These differences result in deferred tax assets and liabilities, which are included in our consolidated balance sheets. We must then assess, using all available positive and negative evidence, the likelihood that the deferred tax assets will be recovered from future taxable income. If we believe that recovery is not likely, we must establish a valuation allowance. To the extent we establish a valuation allowance or increase or decrease this allowance in a period, we must include an expense or reduction of expense within the tax provisions in the consolidated statements of operations.
Under ASC 740 – Accounting for Income Taxes, an enterprise must use judgment in considering the relative impact of negative and positive evidence. The weight given to the potential effect of negative and positive evidence should be commensurate with the extent to which it can be objectively verified. The more negative evidence that exists (a) the more positive evidence is necessary and (b) the more difficult it is to support a conclusion that a valuation allowance is not needed for some portion, or all of the deferred tax asset. Among the more significant types of evidence that we consider are:
• | taxable income projections in future years, |
• | whether the carryforward period is so brief that it would limit realization of tax benefits, |
• | future revenue and operating cost projections that will produce more than enough taxable income to realize the deferred tax asset based on existing service rates and cost structures, and |
• | our earnings history exclusive of the loss that created the future deductible amount coupled with evidence indicating that the loss is an aberration rather than a continuing condition. |
Based on the consideration of the above factors for our subsidiary that is taxed as a corporation for purposes of determining the likelihood of realizing the benefits of the deferred tax assets, we have provided a full valuation allowance against our deferred tax asset as of December 31, 2015.
Our Assets and Services
Our network of assets provides our customers the flexibility to access multiple points for the receipt and delivery of crude oil and the terminalling, storage and processing of crude oil and asphalt cement. Our operations have minimal direct exposure to changes in crude oil and asphalt cement prices, but the volumes of crude oil and asphalt cement we gather, transport, terminal or store are affected by commodity prices. We generate revenues by charging a fee for services provided at each transportation stage as crude oil is shipped from its origin at the wellhead to destination points such as the Cushing Interchange, to refineries in Oklahoma, Kansas and Texas or to pipelines and by charging a fee for services provided for the terminalling and storage of crude oil and asphalt cement.
• | Asphalt Terminalling Services. Our 45 asphalt terminals are located in 23 states and are well positioned to provide asphalt terminalling services in the market areas they serve throughout the continental United States. With our approximately 8.2 million barrels of total asphalt product and residual fuel oil storage capacity, we are able to provide our customers the ability to effectively manage their asphalt product storage and processing and marketing activities. We currently have storage contracts or leases with third party customers for all of our 45 asphalt facilities. |
• | Crude oil terminalling and storage assets and services. We provide crude oil terminalling and storage services at our terminalling and storage facilities located in Oklahoma and Texas. We currently own and operate an aggregate of approximately 7.4 million barrels of storage capacity. Of this storage capacity, approximately 6.6 million barrels are located at our terminal in Cushing, Oklahoma. Our Cushing terminal is strategically located within the Cushing Interchange, one of the largest crude oil marketing hubs in the United States and the designated point of delivery specified in all NYMEX crude oil futures contracts. Our terminals have a combined capacity to receive or deliver approximately 10.0 million barrels of crude oil per month. We also own approximately 50 acres of additional land within the Cushing Interchange where we can develop additional storage capacity. |
• | Crude oil pipeline assets and services. We own and operate three pipeline systems, the Mid-Continent system, the East Texas system and the Eagle North system, collectively consisting of approximately 985 miles of pipelines that |
43
gather crude oil for our customers and transport it to refiners, to common carrier pipelines for ultimate delivery to refiners or to terminalling and storage facilities owned by us and others. Our pipeline system located in Oklahoma and the Texas Panhandle, which we refer to as the Mid-Continent system, has a combined length of approximately 515 miles. Our second pipeline gathering and transportation system located in East Texas, which we refer to as the East Texas system, consists of approximately 220 miles of tariff-regulated crude oil gathering pipeline. Our third pipeline transportation system located in Oklahoma, which we refer to as the Eagle North system, consists of approximately 250 miles of pipeline.
• | Crude oil trucking and producer field services. In addition to our pipelines, we use our approximately 152 owned or leased tanker trucks to gather crude oil in Kansas, Oklahoma, Texas, New Mexico and Colorado for our customers at remote wellhead locations generally not connected to pipeline and gathering systems and transport the crude oil to aggregation points and storage facilities located along pipeline gathering and transportation systems. In connection with our gathering services, we also provide a number of producer field services, ranging from gathering condensates from natural gas producers to hauling production waste water to disposal wells. Our producer service fleet consists of approximately 90 trucks in a number of different sizes. |
Factors That Will Significantly Affect Our Results
Commodity Prices. Although our current operations have minimal direct exposure to commodity prices, the volumes of crude oil and liquid asphalt cement we gather, transport, terminal or store are affected by commodity prices. Petroleum product prices may be contango (future prices higher than current prices) or backwardated (future prices lower than current prices) depending on market expectations for future supply and demand. Our terminalling and storage services benefit most from an increasing price environment, when a premium is placed on storage, and our gathering and transportation services benefit most from a declining price environment, when a premium is placed on prompt delivery.
Volumes. Our results of operations are dependent upon the volumes of crude oil we gather, transport, terminal and store and asphalt we terminal, store and/or process. An increase or decrease in the production of crude oil from the oil fields served by our pipelines or an increase or decrease in the demand for crude oil in the areas served by our pipelines and storage facilities will have a corresponding effect on the volumes we gather, transport, terminal and store. The production and demand for crude oil and liquid asphalt cement are driven by many factors, including the price for crude oil.
Acquisition Activities. We may pursue acquisition opportunities. These acquisition efforts may involve assets that, if acquired, would have a material effect on our financial condition, results of operations and cash flows. We can give no assurance that any such acquisition efforts will be successful or that any such acquisition will be completed on terms ultimately favorable to us.
Organic Expansion Activities. We may pursue opportunities to expand our existing asset base and consider constructing additional assets in strategic locations. The construction of additions or modifications to our existing assets, and the construction of new assets, involve numerous regulatory, environmental, political, legal and operational uncertainties beyond our control and may require the expenditure of significant amounts of capital.
Distributions to our Unitholders. We may make distributions to holders of our Preferred Units and common units as well as to our General Partner. To the extent that substantially all of our cash generated by our operations is used to make such distributions, we expect that we will rely upon external financing sources, including commercial bank borrowings and other debt and equity issuances, to fund our acquisition and expansion capital expenditures, as well as our working capital needs.
Vitol Storage Agreements
In recent years, a significant portion of our crude oil storage capacity has been contracted to Vitol under multiple agreements. In the years 2013 and 2014, 4.1 million barrels of storage capacity were contracted to Vitol under these storage agreements. As of December 31, 2015, 2.2 million barrels of storage capacity were contracted to Vitol under one storage agreement. Service revenues under these agreements are based on the barrels of storage contracted to Vitol under the applicable agreement at rates that, we believe, are fair and reasonable to us and our unitholders and are comparable with the rates we charge third parties. The Board’s conflicts committee reviewed and approved these agreements in accordance with our procedures for approval of related party transactions and the provisions of the partnership agreement. We generated revenues under these agreements of approximately $17.6 million, $12.0 million and $9.4 million during the years ended December 31, 2013, 2014 and 2015, respectively.
As of March 3, 2016, 2.2 million barrels of storage capacity were contracted to Vitol under the crude oil storage
44
agreement with the current term expiring on May 1, 2017.
Eaglebine Crude Throughput and Deficiency Agreement
On August 6, 2014, we announced our intention to build the Knight Warrior Pipeline, which will link the emerging East Texas Woodbine/Eaglebine crude oil resource play to Oiltanking Houston, a crude oil and product terminal on the Houston Ship Channel, owned and operated by Oiltanking Partners, L.P. On August 29, 2014 we entered into a Crude Oil Throughput and Deficiency Agreement with Eaglebine Crude Oil Marketing LLC (“Eaglebine Crude”), a joint venture partly owned by Vitol Inc., effective as of August 28, 2014, pursuant to which we will provide certain crude oil transportation services on the Knight Warrior Pipeline for Eaglebine Crude. Eaglebine Crude will pay throughput fees under the Agreement based on Eaglebine Crude’s per barrel daily volume commitment of at least 40,000 barrels per day (subject to possible adjustments under certain conditions). The term of the Agreement is for five years beginning on the first day of the month following the date that is thirty days after the Partnership notifies Eaglebine Crude that the Knight Warrior Pipeline is complete. We believe that the rates we will charge Eaglebine Crude under this agreement are fair and reasonable to us and our unitholders and are comparable with the rates we charge third parties. The Board’s conflicts committee reviewed and approved this agreement, including the amendments thereto, in accordance with our procedures for approval of related party transactions and the provisions of the partnership agreement.
While the Knight Warrior Pipeline continues to be in our plans, the project is currently on hold and we are approaching it very cautiously as a result of the significant decline in the market price for crude oil, reduced area crude oil rig counts and crude oil production as well as the increased cost of capital. The Eaglebine Crude contract is not impacted by the project delay.
Results of Operations
Non-GAAP Financial Measures
To supplement our financial information presented in accordance with GAAP, management uses additional measures that are known as “non-GAAP financial measures” in its evaluation of past performance and prospects for the future. The primary measure used by management is operating margin excluding depreciation and amortization.
Management believes that the presentation of such additional financial measures provides useful information to investors regarding our performance and results of operations because these measures, when used in conjunction with related GAAP financial measures, (i) provide additional information about our core operating performance and ability to generate and distribute cash flow, (ii) provide investors with the financial analytical framework upon which management bases financial, operational, compensation and planning decisions and (iii) present measurements that investors, rating agencies and debt holders have indicated are useful in assessing us and our results of operations. These additional financial measures are reconciled to the most directly comparable measures as reported in accordance with GAAP, and should be viewed in addition to, and not in lieu of, our Consolidated Financial Statements and footnotes.
The table below summarizes our financial results for the year ended December 31, 2013, 2014 and 2015, reconciled to the most directly comparable GAAP measure:
45
For the year | Favorable/(Unfavorable) | ||||||||||||||||||||||
Operating Results | ended December 31, | 2013-2014 | 2014-2015 | ||||||||||||||||||||
(dollars in thousands) | 2013 | 2014 | 2015 | $ | % | $ | % | ||||||||||||||||
Operating Margin, excluding depreciation and amortization | |||||||||||||||||||||||
Asphalt terminalling services operating margin | $ | 40,968 | $ | 41,244 | $ | 48,212 | 276 | 1 | % | 6,968 | 17 | % | |||||||||||
Crude oil terminalling and storage operating margin | 27,079 | 18,818 | 18,842 | (8,261 | ) | (31 | )% | 24 | — | % | |||||||||||||
Crude oil pipeline services operating margin | 6,909 | 10,457 | 7,694 | 3,548 | 51 | % | (2,763 | ) | (26 | )% | |||||||||||||
Crude oil trucking and producer field services operating margin | 10,067 | 7,907 | 1,304 | (2,160 | ) | (21 | )% | (6,603 | ) | (84 | )% | ||||||||||||
Total operating margin, excluding depreciation and amortization | 85,023 | 78,426 | 76,052 | (6,597 | ) | (8 | )% | (2,374 | ) | (3 | )% | ||||||||||||
Depreciation and amortization | 23,962 | 26,045 | 27,228 | (2,083 | ) | (9 | )% | (1,183 | ) | (5 | )% | ||||||||||||
General and administrative expenses | 17,482 | 17,498 | 18,976 | (16 | ) | — | % | (1,478 | ) | (8 | )% | ||||||||||||
Asset impairment expense | 524 | — | 21,996 | 524 | 100 | % | (21,996 | ) | NA | ||||||||||||||
Gain on sale of assets | 1,073 | 2,464 | 6,137 | 1,391 | 130 | % | 3,673 | 149 | % | ||||||||||||||
Operating income: | 44,128 | 37,347 | 13,989 | (6,781 | ) | (15 | )% | (23,358 | ) | (63 | )% | ||||||||||||
Other income (expense) | |||||||||||||||||||||||
Equity earnings (loss) in unconsolidated entity | (502 | ) | 883 | 3,932 | 1,385 | 276% | 3,049 | 345 | % | ||||||||||||||
Interest expense | (11,615 | ) | (12,268 | ) | (11,202 | ) | (653 | ) | (6 | )% | 1,066 | 9 | % | ||||||||||
Unrealized gains on investments | — | 2,079 | — | 2,079 | NA | (2,079 | ) | (100)% | |||||||||||||||
Income tax expense | (593 | ) | (469 | ) | (323 | ) | 124 | 21 | % | 146 | 31 | % | |||||||||||
Net income from continuing operations | 31,418 | 27,572 | 6,396 | (3,846 | ) | (12 | )% | (21,176 | ) | (77 | )% | ||||||||||||
Loss from discontinued operations | (3,383 | ) | — | — | 3,383 | (100 | )% | — | — | % | |||||||||||||
Net income | $ | 28,035 | $ | 27,572 | $ | 6,396 | (463 | ) | (2 | )% | (21,176 | ) | (77 | )% | |||||||||
Total operating margin excluding depreciation and amortization decreased 3% from 2014 to 2015. Asphalt terminalling services margin increased $7.0 million or 17% from 2014 to 2015 as a result of increased product throughput volumes, our acquisition of an asphalt terminal in Cheyenne, Wyoming and renegotiated throughput fees for some of our asphalt facilities. This increase was more than offset by decreases in our crude oil pipeline services and crude oil trucking and producer field services operating segments. The 2014 crude oil pipeline services margin included $4.2 million in sales of crude oil related to accumulated pipeline loss allowances in addition to a $1.5 million insurance claim settlement realized in the third quarter of 2014 that decreased operating expenses. There were no sales of crude oil related to accumulated pipeline loss allowances in 2015. Crude oil trucking and producer field service volumes have decreased approximately 20% for 2015 as compared to 2014. This is due to the decrease in crude oil prices and production volumes and increases in pipeline-connected barrels and competition. In addition, crude oil trucking and producer field services’ operating margin was impacted by $1.6 million of expenses related to restructuring the segment. See Note 6 to our Consolidated Financial Statements for additional detail regarding this restructuring expense.
Total operating margin excluding depreciation and amortization decreased from 2013 to 2014 due primarily to continued decreases in Cushing crude oil storage rates and decreased terminal throughput volumes resulting from the backwardated crude oil market curve which did not favor storage. Additionally, we experienced decreases in the average rates we charged our customers for services in our trucking and producer field services segment. These decreases were partially offset by increased operating margin in our pipeline services segment due to a 7% increase in revenues and decreased operating expenses.
A more detailed analysis of changes in operating margin by segment follows.
46
Analysis of Operating Segments
Asphalt terminalling services segment
Our asphalt terminalling services segment operations generally consist of fee based activities associated with providing storage, terminalling and throughput services for asphalt product and residual fuel oil. Revenue is generated through short- and long-term storage contracts.
The following table sets forth our operating results from our asphalt terminalling services segment for the periods indicated:
For the year | Favorable/(Unfavorable) | ||||||||||||||||||||||
Operating results | ended December 31, | 2013-2014 | 2014-2015 | ||||||||||||||||||||
(dollars in thousands) | 2013 | 2014 | 2015 | $ | % | $ | % | ||||||||||||||||
Revenues | |||||||||||||||||||||||
Third Party Revenues | $ | 63,803 | $ | 66,273 | $ | 72,152 | 2,470 | 4 | % | 5,879 | 9 | % | |||||||||||
Related Party Revenues | 1,944 | 1,119 | 1,278 | (825 | ) | (42 | )% | 159 | 14 | % | |||||||||||||
Total Revenues | 65,747 | 67,392 | 73,430 | 1,645 | 3 | % | 6,038 | 9 | % | ||||||||||||||
Operating Expenses (excluding depreciation and amortization) | 24,779 | 26,148 | 25,218 | (1,369 | ) | (6 | )% | 930 | 4 | % | |||||||||||||
Operating Margin (excluding depreciation and amortization) | $ | 40,968 | $ | 41,244 | $ | 48,212 | 276 | 1 | % | 6,968 | 17 | % | |||||||||||
The following is a discussion of items impacting our asphalt terminalling services segment operating margin for the periods indicated:
• | Third party revenues increased for the year ended December 31, 2015 as compared to the year ended December 31, 2014 primarily due to increased product throughputs and renegotiated throughput fees for some of our facilities as well as revenues earned in relation to an asphalt terminalling facility we acquired in May 2015. Related party revenues increased due to an increase in contracted storage barrels. |
• | Operating expenses decreased in 2015 as compared to 2014 as a result of a decrease in utilities expense. |
• | Third party revenues increased for 2014 as compared to 2013 due primarily to contractual rate escalations. Related party revenues decreased from 2013 to 2014 due to lower overall contracted storage from short-term storage contracts. |
• | The increase in operating expenses in 2014 as compared to 2013 is primarily attributable to the timing of maintenance and repair and increased rent expense. |
47
Crude oil terminalling and storage segment
Our terminalling and storage segment operations generally consist of fee based activities associated with providing storage, terminalling, and throughput services for crude oil. Revenue is generated through short- and long-term storage contracts.
The following table sets forth our operating results from our crude oil terminalling and storage segment for the periods indicated:
For the year | Favorable/(Unfavorable) | ||||||||||||||||||||||
Operating results | ended December 31, | 2013-2014 | 2014-2015 | ||||||||||||||||||||
(dollars in thousands) | 2013 | 2014 | 2015 | $ | % | $ | % | ||||||||||||||||
Revenues | |||||||||||||||||||||||
Third Party Revenues | $ | 11,910 | $ | 9,258 | $ | 13,076 | (2,652 | ) | (22 | )% | 3,818 | 41 | % | ||||||||||
Related Party Revenues | 19,148 | 13,524 | 11,522 | (5,624 | ) | (29 | )% | (2,002 | ) | (15 | )% | ||||||||||||
Total Revenues | 31,058 | 22,782 | 24,598 | (8,276 | ) | (27 | )% | 1,816 | 8 | % | |||||||||||||
Operating Expenses (excluding depreciation and amortization) | 3,979 | 3,964 | 5,756 | 15 | — | % | (1,792 | ) | (45 | )% | |||||||||||||
Operating Margin (excluding depreciation and amortization) | $ | 27,079 | $ | 18,818 | $ | 18,842 | (8,261 | ) | (31 | )% | 24 | — | % | ||||||||||
Average crude oil stored per month at our Cushing terminal (in thousands of barrels) | 4,858 | 1,724 | 5,322 | (3,134 | ) | (65 | )% | 3,598 | 209 | % | |||||||||||||
Average crude oil delivered to our Cushing terminal (in thousands of barrels per day) | 85 | 77 | 117 | (8 | ) | (9 | )% | 40 | 52 | % | |||||||||||||
The following is a discussion of items impacting our crude oil terminalling and storage segment operating margin for the periods indicated:
• | Revenues are impacted by changes in market dynamics at the Cushing Interchange. As contracts were expiring in early 2014, the rates at which we recontracted storage agreements were impacted by a backwardated market for West Texas Intermediate crude, increased Cushing storage capacity, additional pipeline capacity for delivery out of the Cushing Interchange and significant production increases in Kansas, Oklahoma and Texas. These trends negatively impacted demand for crude oil storage and created downward pressure on storage rates for 2014 compared to 2013. In the fourth quarter of 2014, the market for West Texas Intermediate crude oil returned to contango in which future prices are higher than current prices, resulting in increased demand for storage services at the Cushing Interchange. Storage contracts were executed in the second quarter of 2015 for higher rates, leading to increased revenue for 2015 as compared to 2014. |
• | Operating expenses for 2014 compared to 2013 were consistent. Operating expenses for 2015 increased compared to 2014 due primarily to the timing of tank inspections and related maintenance and repair and increases in utility expenses due to increased product movements through the terminal. |
• | As of March 2016, we have approximately 5.7 million barrels of crude oil storage under service contracts with remaining terms of up to thirteen months, including 2.8 million barrels of crude oil storage contracts that are month-to-month or expire in 2016. Storage contracts with Vitol represent 2.4 million barrels of crude oil storage capacity under contract. |
48
Crude oil pipeline services
Our crude oil pipeline services segment operations generally consist of fee-based activity associated with transporting crude oil products on pipelines. Revenues are generated primarily through tariffs and other transportation fees.
The following table sets forth our operating results from our crude oil pipeline services segment for the periods indicated:
For the year | Favorable/(Unfavorable) | ||||||||||||||||||||||
Operating results | ended December 31, | 2013-2014 | 2014-2015 | ||||||||||||||||||||
(dollars in thousands) | 2013 | 2014 | 2015 | $ | % | $ | % | ||||||||||||||||
Revenues | |||||||||||||||||||||||
Third Party Revenues | $ | 15,658 | $ | 18,024 | $ | 18,659 | 2,366 | 15 | % | 635 | 4 | % | |||||||||||
Related Party Revenues | 9,018 | 8,381 | 10,687 | (637 | ) | (7 | )% | 2,306 | 28 | % | |||||||||||||
Total Revenues | 24,676 | 26,405 | 29,346 | 1,729 | 7 | % | 2,941 | 11 | % | ||||||||||||||
Operating Expenses (excluding depreciation and amortization) | 17,767 | 15,948 | 21,393 | 1,819 | 10 | % | (5,445 | ) | (34 | )% | |||||||||||||
Operating Expenses (intersegment) | — | — | 259 | — | — | % | (259 | ) | NA | ||||||||||||||
Operating Margin (excluding depreciation and amortization) | $ | 6,909 | $ | 10,457 | $ | 7,694 | 3,548 | 51 | % | (2,763 | ) | (26 | )% | ||||||||||
Average throughput volume (in thousands of barrels per day) | |||||||||||||||||||||||
Mid-Continent | 17 | 20 | 24 | 3 | 18 | % | 4 | 20 | % | ||||||||||||||
East Texas | 22 | 18 | 16 | (4 | ) | (18 | )% | (2 | ) | (11 | )% | ||||||||||||
Eagle North | 15 | 13 | 12 | (2 | ) | (13 | )% | (1 | ) | (8 | )% | ||||||||||||
The following is a discussion of items impacting our crude oil pipeline services segment operating margin for the periods indicated:
• | Excluding the impact of $4.2 million in sales of crude oil related to accumulated pipeline loss allowances in 2014, third party revenues would have increased approximately $5.0 million from 2014 to 2015. The increase in revenues is due to the acquisition of the Red River Pipeline, which is part of our Mid-Continent pipeline system, in November 2015, and due to the recognition of $1.6 million of revenue related to volume deficiencies under the Eagle North throughput and deficiency agreement that was initially deferred in 2012 and 2013. This was an increase of $0.8 million over the revenue related to volume deficiencies that was recognized in 2014. Related party revenues increased due to a termination fee of $1.2 million charged on the cancellation of an operating and maintenance agreement with Vitol and an increase in volumes. |
• | Operating expenses for 2015 include $3.2 million in cost of crude oil sales related to a marketing contract associated with the 75 mile Red River pipeline that we acquired in November 2015. The $1.5 million insurance claim settlement received in September 2014 is also contributing to the change in operating expenses from 2014 to 2015. |
• | Third party revenues increased from 2013 to 2014 due primarily to increased volumes on our Mid-Continent system related to the Arbuckle pipeline system which went into service during the fourth quarter of 2013 and due to $0.8 million of revenue related to volume deficiencies under the Eagle North throughput and deficiency agreement that were initially deferred in 2011. |
• | Included in revenues for 2013 and 2014 are sales of crude oil related to accumulated pipeline loss allowances on our pipeline systems that amounted to $6.9 million and $4.2 million, respectively. We expect the sale of accumulated pipeline loss allowances to occur in the future in connection with the pipeline systems we operate; however, future revenue may be lower than that realized historically. There were no sales of accumulated pipeline loss allowances during 2015. |
49
• | Volumes on our East Texas system decreased from 2013 to 2014 primarily as a result of the loss of one customer that took volumes to one of its own pipelines in connection with a reversal of the flow of the customer’s pipeline. In December of 2015, we decided to idle the southern portion of this system due to further decreases in the demand resulting from declining oil production in the area. |
• | Repair and maintenance expense decreased by $1.7 million in 2014 as compared to 2013 primarily due to approximately $2.1 million of costs we incurred in relation to the clean up of a spill on one of our pipeline systems in 2013. Operating expenses were further reduced in 2014 by a $1.5 million insurance claim settlement received in September 2014. |
These decreases in operating expenses were partially offset by an increase of $0.7 million in employment expense during 2014 as compared to 2013 due to additional personnel hired to support the operation of our Oklahoma Arbuckle pipeline, Advantage Pipeline’s Pecos River pipeline and Vitol’s Midland pipeline system, and a $0.4 million increase in property tax expense in 2014 as compared to 2013 due to increases in the assessed values of our pipeline systems.
Crude oil trucking and producer field services
Our crude oil trucking and producer field services segment operations generally consist of fee-based activity associated with transporting crude oil products on trucks. Revenues are generated primarily through transportation fees.
The following table sets forth our operating results from our crude oil trucking and producer field services segment for the periods indicated:
For the year | Favorable/(Unfavorable) | ||||||||||||||||||||||
Operating results | ended December 31, | 2013-2014 | 2014-2015 | ||||||||||||||||||||
(dollars in thousands) | 2013 | 2014 | 2015 | $ | % | $ | % | ||||||||||||||||
Revenues | |||||||||||||||||||||||
Third Party Revenues | $ | 51,545 | $ | 50,283 | $ | 37,039 | (1,262 | ) | (2 | )% | (13,244 | ) | (26 | )% | |||||||||
Related Party Revenues | 21,645 | 19,764 | 15,616 | (1,881 | ) | (9 | )% | (4,148 | ) | (21 | )% | ||||||||||||
Intersegment Revenues | — | — | 259 | — | — | % | 259 | NA | |||||||||||||||
Total Revenues | 73,190 | 70,047 | 52,914 | (3,143 | ) | (4 | )% | (17,133 | ) | (24 | )% | ||||||||||||
Operating Expenses (excluding depreciation and amortization) | 63,123 | 62,140 | 51,610 | 983 | 2 | % | 10,530 | 17 | % | ||||||||||||||
Operating Margin (excluding depreciation and amortization) | $ | 10,067 | $ | 7,907 | $ | 1,304 | (2,160 | ) | (21 | )% | (6,603 | ) | (84 | )% | |||||||||
Average volume (in thousands of barrels per day) | 62 | 64 | 51 | 2 | 3 | % | (13 | ) | (20 | )% | |||||||||||||
The following is a discussion of items impacting our crude oil trucking and producer field services segment operating margin for the periods indicated:
• | Operating margin decreased in 2015 as a result of the significant decrease in crude oil prices, an increase in pipeline-connected barrels and an increase in competition as competitors repositioned under-utilized equipment to areas in which we operate. All of these changes led to decreased volumes, transportation rates and margins. |
• | The decrease in operating expense from 2014 to 2015 is primarily due to decreased wages and commissions paid to drivers, fuel costs, which are due to decreased volumes transported, and due to a decline in the usage of third party trucking companies in 2015. Partially offsetting these decreases is an expense of $1.6 million in the fourth quarter of 2015 related to the cost of restructuring the segment which resulted in the closing of a number of locations in West Texas. The expense consists of severance costs paid to employees and for the recognition of costs to recognize future operating lease payments for idled equipment. The severance costs were paid in the first quarter of 2016 and the lease payments will be made over the remaining lease terms, which extend through July 2019. See Note 6 to our Consolidated Financial Statements for additional detail regarding this restructuring charge. |
50
• | Despite volume increases from 2013 to 2014, our operating margin declined in 2014, primarily due to an increase in pipeline connected barrels and a decrease in the average distance barrels were hauled for our customers which impacted our overall rate per barrel charged and operating margin. |
Other Income and Expenses
Depreciation and amortization. Depreciation and amortization increased to $27.2 million for 2015 compared to $26.0 million for 2014 and $24.0 million for 2013. This increase is primarily due to our Arbuckle pipeline that was placed in service in the fourth quarter of 2013, the acquisition of our Red River pipeline in 2015, and maintenance capital expenditures in each year.
General and administrative expenses. General and administrative expenses were $19.0 million for the year ended December 31, 2015 compared to $17.5 million for both the years ended December 31, 2014 and 2013. This increase is primarily attributable to employee compensation-related expenses and increased legal expenses incurred in connection with litigation that was settled in the third quarter of 2015.
Asset impairment expense. During 2015, we recorded fixed asset impairment expenses of $12.6 million, $1.4 million, and $0.5 million related to the write-down of our East Texas pipeline system, a portion of our Mid-Continent pipeline system, and our West Texas trucking stations, respectively, to their estimated fair value. We also recorded an impairment expense of $7.5 million related to goodwill associated with our pipeline services reporting unit. We recorded asset impairment expenses of $0.5 million in 2013 in relation to certain miscellaneous assets. No asset impairment expenses were recorded in 2014. We used a discounted cash flow model, supplemented by a market approach to evaluate goodwill and the estimated fair value of assets. Key assumptions in the analysis include the use of an appropriate discount rate, volume and rate forecasts and estimates of operating costs. Due to the imprecise nature of our projections and assumptions, actual results can and often do differ from our estimates. If the assumptions used in our projections and analysis prove to be inaccurate or if the markets in which we operate experience future adverse conditions, we could incur additional impairment charges in the future.
Gain on sale of assets. Gain on sale of assets was $6.1 million in 2015 compared to $2.5 million and $1.1 million for 2014 and 2013, respectively. The gain on sale of assets in 2015 includes a $6.0 million gain on the sale of crude oil pipeline linefill and storage tank bottoms related to the settlement of litigation with SemCorp in September 2015. Gains recorded in 2014 primarily consist of the sale of surplus, used property and equipment. The $1.1 million of gains recorded in 2013 consist of $0.4 million received from the sale of pipeline gathering systems as well as gains from the sale of surplus, used property and equipment.
Equity earnings (loss) in unconsolidated affiliate. The equity earnings (loss) is attributed to our investment in Advantage Pipeline. Losses for 2013 were the result of expenses incurred during the construction phase of the West Texas Pecos River Pipeline. On September 17, 2013, commercial service started on Phase I of the system consisting of the Highway 18 Station near Grandfalls, Texas and 36 miles of pipeline connecting to the Longhorn Pipeline in Crane, Texas. During 2014 and 2015, equity earnings were realized as a result of increased throughput on the pipeline due to the completion of the Crane West station in the second quarter of 2014. Additionally, in October 2014, utilizing temporary power, commercial service started on Phase II of the system consisting of the Highway 285 Station near Pecos, Texas and 29 miles of pipeline connecting to the Highway 18 Station, further increasing revenues, the full effect of which is reflected in 2015. Full power for the Highway 285 Station was established in January 2015.
Interest expense. Interest expense was $11.2 million for 2015 compared to $12.3 million and $11.6 million for 2014 and 2013, respectively. Interest expense represents interest on borrowings under our credit facility as well as amortization of debt issuance costs.
The decrease in interest expense from 2014 to 2015 was primarily a result of a decrease in the weighted average interest rate and decreases in the weighted average debt outstanding during the periods. During 2014 and 2015, the weighted average interest rate under the credit agreement was 3.44% and 3.37%, respectively. This decrease was partially offset by capitalized interest, which decreased by $0.1 million to $0.2 million in 2015 as compared to 2014. In addition, the interest expense resulting from the amortization of debt issuance costs increased by $0.1 million in 2015. As of December 31, 2015, borrowings under our amended and restated credit agreement bore interest at a weighted average interest rate of 3.38%, inclusive of interest expense associated with the amortization of debt issuance costs.
The increase in interest expense from 2013 to 2014 was primarily a result of our entering into two interest rate swap agreements in March 2014. In 2014 we recorded interest expense of $3.3 million in relation to these interest rate swaps including unrealized losses due to the change in fair value of these interest rate swaps of $2.6 million. In addition, the amount
51
of interest we capitalized decreased by $0.8 million to $0.3 million in 2014 as compared to 2013. These increases were partially offset by the $1.8 million of debt issuance costs that were expensed in 2013 in relation to our prior credit facility. In addition, the interest expense resulting from the amortization of debt issuance costs decreased by $0.5 million in 2014. During 2013 and 2014, the weighted average interest rate under the credit agreement was 5.99% and 3.44%, respectively. As of December 31, 2014, borrowings under our amended and restated credit agreement bore interest at a weighted average interest rate of 3.39%, inclusive of interest expense associated with the amortization of debt issuance costs.
Unrealized gains on investments. In November 2014, we received 30,393 Class A Common Units of SemCorp in connection with the settlement of two unsecured claims we filed in connection with SemCorp's predecessor's bankruptcy filing in 2008. The fair market value of these units on the date of receipt was $2.5 million. An unrealized loss of $0.4 million was incurred as a result of marking the units to their fair market value of $68.39 per unit as of December 31, 2014. In March 2015, we sold all of these units for a total of $2.3 million.
Loss from discontinued operations. During the year ended December 31, 2013, we sold our Thompson-to-Webster pipeline system in south Texas. In addition, we conveyed title of our Northumberland, Pennsylvania asphalt storage facility to Koch as part of a litigation settlement. The loss from discontinued operations in 2013 is primarily the result of impairment expenses of $5.7 million and $0.6 million related to the Thompson-to-Webster pipeline system and the Northumberland, Pennsylvania asphalt storage facility, respectively. The operations of these business components are presented as discontinued operations for all periods presented. No operations were discontinued in 2014 or 2015.
Effects of Inflation
In recent years, inflation has been modest and has not had a material impact upon the results of our operations.
Off Balance Sheet Arrangements
We do not have any off-balance sheet arrangements as defined by Item 303 of Regulation S-K.
Liquidity and Capital Resources
Cash Flows and Capital Expenditures
The following table summarizes our sources and uses of cash for the year ended December 31, 2013, 2014 and 2015:
Year ended December 31, | |||||||||||
2013 | 2014 | 2015 | |||||||||
(in millions) | |||||||||||
Net cash provided by operating activities | $ | 60.6 | $ | 58.2 | $ | 60.5 | |||||
Net cash used in investing activities | (80.7 | ) | (34.3 | ) | (44.6 | ) | |||||
Net cash provided by (used in) financing activities | 20.2 | (24.5 | ) | (15.6 | ) | ||||||
Operating Activities. Net cash provided by operating activities was $60.5 million for the year ended December 31, 2015, as compared to $58.2 million for the year ended December 31, 2014. The increase in cash provided by operating activities is primarily the result of changes in working capital.
Net cash provided by operating activities was $58.2 million for the year ended December 31, 2014, as compared to $60.6 million for the year ended December 31, 2013. The decrease in cash provided by operating activities is primarily the result of a reduction in operating income partially offset by changes in working capital.
Investing Activities. Net cash used in investing activities was $44.6 million for the year ended December 31, 2015, as compared to $34.3 million of net cash used in investing activities for the year ended December 31, 2014. Capital expenditures for the year ended December 31, 2015, included maintenance capital expenditures of $7.9 million, net of reimbursable expenditures of $0.5 million, expansion capital expenditures of $33.2 million, primarily related to the Knight Warrior pipeline project, and acquisitions of $21.0 million. These expenditures were partially offset by proceeds from the sale of assets of $14.7 million, as well as $2.3 million related to proceeds from the sale of investments in 2015.
Net cash used in investing activities was $34.3 million for the year ended December 31, 2014, as compared to $80.7 million of net cash used in investing activities for the year ended December 31, 2013. The decrease in cash used in investing
52
activities was primarily the result of capital expenditures related to the completion of our southern Oklahoma Arbuckle Pipeline addition to our Mid-Continent pipeline system in 2013 and our $20.0 million investment in Advantage Pipeline in 2013. These decreases were partially offset by capital expenditures for our Knight Warrior pipeline in 2014. Capital expenditures for the year ended December 31, 2014 included maintenance capital expenditures of $6.0 million, net of reimbursable expenditures of $1.7 million, and expansion capital expenditures of $29.7 million.
Financing Activities. Net cash used in financing activities was $15.6 million for the year ended December 31, 2015, as compared to $24.5 million of net cash used in financing activities for the year ended December 31, 2014. Financing activities for the year ended December 31, 2015, consisted primarily of net borrowings under our credit facility of $29.0 million and distributions of $41.6 million.
Net cash used in financing activities was $24.5 million for the year ended December 31, 2014, as compared to $20.2 million of net cash provided by financing activities for the year ended December 31, 2013. Financing activities for the year ended December 31, 2014 consisted primarily of $35.9 million in distributions to our unitholders and net repayments on long term debt of $57.0 million partially offset by net proceeds of $71.2 million from the issuance of 9,775,000 common units.
Our Liquidity and Capital Resources
Cash flow from operations and our credit facility are our primary sources of liquidity, although our ability to borrow such funds may be limited by the financial covenants in the credit facility. At December 31, 2015, we had a working capital deficit of $7.5 million. This is primarily a function of our approach to cash management. At December 31, 2015, we had approximately $153.7 million of availability under our revolving credit facility, although our ability to borrow such funds may be limited by the financial covenants in our credit facility. As of December 31, 2015, we could borrow up to $328.8 million or an additional $82.5 million, under our credit facility within our covenant restrictions. As of March 3, 2016, we have aggregate unused commitments under our revolving credit facility of approximately $129.7 million, although our ability to borrow such funds may be limited by the financial covenants in our credit facility, and cash on hand of approximately $1.4 million.
Capital Requirements. Our capital requirements consist of the following:
• | maintenance capital expenditures, which are capital expenditures made to maintain the existing integrity and operating capacity of our assets and related cash flows further extending the useful lives of the assets; and |
• | expansion capital expenditures, which are capital expenditures made to expand or to replace partially or fully depreciated assets or to expand the operating capacity or revenue of existing or new assets, whether through construction, acquisition or modification. |
Expansion capital expenditures for organic growth projects totaled $33.2 million in the year ended December 31, 2015, compared to $29.7 million in the year ended December 31, 2014. These capital expenditures were funded by cash flows from operations, borrowings under our credit facility and proceeds from the issuance of common units. We currently expect our expansion capital expenditures for organic growth projects to be approximately $10.0 million to $15.0 million in 2016. Maintenance capital expenditures totaled $7.9 million, net of reimbursable expenditures of $0.5 million, in the year ended December 31, 2015 compared to $6.0 million in the year ended December 31, 2014. We currently expect maintenance capital expenditures to be approximately $5.0 million to $7.0 million, net of reimbursable expenditures, in 2016. Our sources of liquidity for these expansion and maintenance capital expenditures in 2016 are expected to be a combination of cash flows from operations and borrowings under our credit facility.
Our Ability to Grow Depends on Our Ability to Access External Expansion Capital. Our partnership agreement requires that we distribute all of our available cash to our unitholders. Available cash is reduced by cash reserves established by our General Partner to provide for the proper conduct of our business (including for future capital expenditures) and to comply with the provisions of our credit facility. We may not grow as quickly as businesses that reinvest their available cash to expand ongoing operations because we distribute all of our available cash.
Description of Credit Facility. On June 28, 2013, we entered into an amended and restated credit agreement which consists of a $400.0 million revolving loan facility. On September 15, 2014, the Partnership amended its credit facility to, among other things, amend the maximum permitted consolidated total leverage ratio as discussed below and to increase the limit on material project adjustments to EBITDA (as defined in the credit agreement).
Our credit agreement is guaranteed by all of our existing subsidiaries. Obligations under our credit agreement are secured by first priority liens on substantially all of our assets and those of the guarantors.
53
Our credit agreement includes procedures for adding financial institutions as revolving lenders or for increasing the revolving commitment of any currently committed revolving lender, subject to the consent of the new or increasing lenders and an aggregate maximum of $500.0 million for all revolving loan commitments under our credit agreement.
The credit agreement will mature on June 28, 2018, and all amounts outstanding under our credit agreement shall become due and payable on such date. We may prepay all loans under our credit agreement at any time without premium or penalty (other than customary LIBOR breakage costs), subject to certain notice requirements. The credit agreement requires mandatory prepayments of amounts outstanding thereunder with the net proceeds from certain asset sales, property or casualty insurance claims, and condemnation proceedings, unless we reinvest such proceeds in accordance with the credit agreement, but these mandatory prepayments will not require any reduction of the lenders' commitments under the credit agreement.
Borrowings under our credit agreement bear interest, at our option, at either the reserve-adjusted eurodollar rate (as defined in the credit agreement) plus an applicable margin that ranges from 2.0% to 3.0% or the alternate base rate (the highest of the agent bank’s prime rate, the federal funds effective rate plus 0.5%, and the 30-day eurodollar rate plus 1.0%) plus an applicable margin that ranges from 1.0% to 2.0%.
We pay a per annum fee on all letters of credit issued under the credit agreement, which fee equals the applicable margin for loans accruing interest based on the eurodollar rate, and we pay a commitment fee on the unused commitments under the credit agreement. The credit agreement does not have a floor for the alternate base rate or the eurodollar rate. The applicable margins for the interest rate, the letter of credit fee and the commitment fee vary quarterly based on our consolidated total leverage ratio (as defined in the credit agreement, being generally computed as the ratio of consolidated total debt to consolidated earnings before interest, taxes, depreciation, amortization and certain other non-cash charges).
The credit agreement includes financial covenants that are tested on a quarterly basis, based on the rolling four-quarter period that ends on the last day of each fiscal quarter.
Prior to the date on which we issue qualified senior notes in an aggregate principal amount (when combined with all other qualified senior notes previously or concurrently issued) that equals or exceeds $200.0 million, the maximum permitted consolidated total leverage ratio is 4.50 to 1.00; provided that:
• | the maximum permitted consolidated total leverage ratio is 5.00 to 1.00 for the fiscal quarters ending March 31, 2016 through September 30, 2016, 4.75 to 1.00 for the fiscal quarter ending December 31, 2016, and 4.50 to 1.00 for each fiscal quarter thereafter; |
• | we may elect to increase the maximum permitted consolidated total leverage ratio to 5.50 to 1.00 for two consecutive fiscal quarters ending on or before September 30, 2016; and |
• | if we make a specified acquisition (as defined in the credit agreement, but generally being an acquisition with consideration in excess of $15.0 million), we may elect to increase the maximum permitted consolidated total leverage ratio to 5.00 to 1.00 from and after the last day of the fiscal quarter immediately preceding the fiscal quarter in which such acquisition occurs to and including the last day of the second full fiscal quarter following the fiscal quarter in which such acquisition occurred. |
From and after the date on which we issue qualified senior notes in an aggregate principal amount (when combined with all other qualified senior notes previously or concurrently issued) that equals or exceeds $200.0 million, the maximum permitted consolidated total leverage ratio is 5.00 to 1.00; provided that the maximum permitted consolidated total leverage ratio is 5.50 to 1.00 for the fiscal quarters ending March 31, 2016 through September 30, 2016, and 5.00 to 1.00 for each fiscal quarter thereafter.
The maximum permitted consolidated senior secured leverage ratio (as defined in the credit agreement, but generally computed as the ratio of consolidated total secured debt to consolidated earnings before interest, taxes, depreciation, amortization and certain other non-cash charges) is 3.50 to 1.00, but this covenant is only tested from and after the date on which we issue qualified senior notes in an aggregate principal amount (when combined with all other qualified senior notes previously or concurrently issued) that equals or exceeds $200.0 million.
The minimum permitted consolidated interest coverage ratio (as defined in the credit agreement, but generally computed as the ratio of consolidated earnings before interest, taxes, depreciation, amortization and certain other non-cash charges to consolidated interest expense) is 2.50 to 1.00.
In addition, the credit agreement contains various covenants that, among other restrictions, limit our ability to:
54
• | create, issue, incur or assume indebtedness; |
• | create, incur or assume liens; |
• | engage in mergers or acquisitions; |
• | sell, transfer, assign or convey assets; |
• | repurchase our equity, make distributions to unitholders and make certain other restricted payments; |
• | make investments; |
• | modify the terms of certain indebtedness, or prepay certain indebtedness; |
• | engage in transactions with affiliates; |
• | enter into certain hedging contracts; |
• | enter into certain burdensome agreements; |
• | change the nature of our business; |
• | enter into operating leases; and |
• | make certain amendments to our partnership agreement. |
At December 31, 2015, our consolidated total leverage ratio was 3.75 to 1.00 and our consolidated interest coverage ratio was 6.54 to 1.00. We were in compliance with all covenants of our credit agreement as of December 31, 2015.
The credit agreement permits us to make quarterly distributions of available cash (as defined in our partnership agreement) to unitholders so long as no default or event of default exists under the credit agreement on a pro forma basis after giving effect to such distribution. We are currently allowed to make distributions to our unitholders in accordance with this covenant; however, we will only make distributions to the extent we have sufficient cash from operations after establishment of cash reserves as determined by the General Partner in accordance with our cash distribution policy, including the establishment of any reserves for the proper conduct of our business.
In addition to other customary events of default, the Credit Agreement includes an event of default if (i) our General Partner ceases to own 100% of our general partner interest or ceases to control us, or (ii) Vitol and Charlesbank cease to collectively own and control 50.0% or more of the membership interests of our General Partner.
If an event of default relating to bankruptcy or other insolvency events occurs with respect to our General Partner or us, all indebtedness under our credit agreement will immediately become due and payable. If any other event of default exists under our credit agreement, the lenders may accelerate the maturity of the obligations outstanding under our credit agreement and exercise other rights and remedies. In addition, if any event of default exists under our credit agreement, the lenders may commence foreclosure or other actions against the collateral.
If any default occurs under our credit agreement, or if we are unable to make any of the representations and warranties in our credit agreement, we will be unable to borrow funds or have letters of credit issued under our credit agreement.
Contractual Obligations. A summary of our contractual cash obligations over the next several fiscal years, as of December 31, 2015, is as follows:
Payments Due by Period | |||||||||||||||||||
Contractual Obligations | Total | Less than 1 year | 1-3 years | 4-5 years | More than 5 years | ||||||||||||||
(in millions) | |||||||||||||||||||
Debt obligations(1) | $ | 263.2 | $ | 7.3 | $ | 255.9 | $ | — | $ | — | |||||||||
Operating lease obligations | 18.6 | 5.7 | 8.4 | 3.8 | 0.7 | ||||||||||||||
____________________
(1) | Represents required future principal repayments of borrowings of $245.0 million and variable rate interest payments of $18.2 million. At December 31, 2015, our borrowings had an interest rate of approximately 2.96% excluding interest relating to amortization of debt issuance costs. This interest rate was used to calculate future interest payments. All amounts outstanding under our credit agreement mature in June 2018. |
Critical Accounting Policies and Estimates
Our discussion and analysis of our financial condition and results of operations is based upon our consolidated financial statements. We prepared these consolidated financial statements in conformity with accounting principles generally accepted in the United States of America. As such, we are required to make certain estimates, judgments and assumptions that affect the reported amounts of assets and liabilities at the date of the financial statements and the reported amounts of revenue and expenses during the periods presented. We based our estimates on historical experience, available information and various other
55
assumptions we believe to be reasonable under the circumstances. On an on-going basis, we evaluate our estimates; however, actual results may differ from these estimates under different assumptions or conditions. The accounting policies that we believe require our most difficult, subjective or complex judgments and are the most critical to our reporting of results of operations and financial position are as follows:
Use of Estimates. The preparation of financial statements in conformity with accounting principles generally accepted in the United States of America requires management to make estimates and assumptions that affect the reported amounts and disclosure of contingencies. Management makes significant estimates including: (1) allowance for doubtful accounts receivable; (2) estimated useful lives of assets, which impacts depreciation; (3) estimated cash flows and fair values inherent in impairment tests; (4) accruals related to revenues and expenses; (5) the estimated fair value of financial instruments; and (6) liability and contingency accruals. Although management believes these estimates are reasonable, actual results could differ from these estimates.
Property, Plant and Equipment. Property, plant and equipment are recorded at cost. Expenditures for maintenance and repairs that do not add capacity or extend the useful life of an asset are expensed as incurred. The carrying value of the assets is based on estimates, assumptions and judgments relative to useful lives and salvage values. As assets are disposed of or sold, the cost and related accumulated depreciation are removed from the accounts, and any resulting gain or loss is included in operating income in the consolidated statements of operations.
We calculate depreciation using the straight-line method, based on estimated useful lives of our assets. These estimates are based on various factors including age (in the case of acquired assets), manufacturing specifications, technological advances and historical data concerning useful lives of similar assets. Uncertainties that impact these estimates include changes in laws and regulations relating to restoration and abandonment requirements, economic conditions and supply and demand in the area. When assets are put into service, we make estimates with respect to useful lives and salvage values that we believe to be reasonable. However, subsequent events could cause us to change our estimates, thus impacting the future calculation of depreciation and amortization. The estimated useful lives of our asset groups are as follows:
Asset Group | Estimated Useful Lives (Years) |
Land improvements | 10-20 |
Pipelines and facilities | 5-30 |
Storage and terminal facilities | 10-35 |
Transportation equipment | 3-10 |
Office property and equipment and other | 3-30 |
We capitalize certain costs directly related to the construction of assets, including interest and engineering costs. Upon disposition or retirement of property, plant and equipment, any gain or loss is included in other income in the consolidated statements of operations.
We have contractual obligations to perform dismantlement and removal activities in the event that some of our assets are abandoned. These obligations include varying levels of activity including completely removing the assets and returning the land to its original state. We have determined that the settlement dates related to the retirement obligations are indeterminate. The assets with indeterminate settlement dates have been in existence for many years and with regular maintenance will continue to be in service for many years to come. In addition, it is not possible to predict when demands for our services will cease, and we do not believe that such demand will cease for the foreseeable future. Accordingly, we believe the date when these assets will be abandoned is indeterminate. With no reasonably determinable abandonment date, we cannot reasonably estimate the fair value of the associated asset retirement obligations. We believe that if our asset retirement obligations were settled in the foreseeable future the potential cash flows that would be required to settle the obligations based on current costs are not material. We will record asset retirement obligations for these assets in the period in which sufficient information becomes available for us to reasonably determine the settlement dates.
Impairment of Long-lived Assets. Long-lived assets with recorded values that are not expected to be recovered through future cash flows are written-down to estimated fair value. Assets are tested for impairment when events or circumstances indicate that their carrying values may not be recoverable. The carrying value of a long-lived asset is not recoverable if it exceeds the sum of the undiscounted cash flows expected to result from the use and eventual disposition of the asset. If the carrying value exceeds the sum of the undiscounted cash flows, an impairment loss equal to the amount the carrying value exceeds the fair value of the asset is recognized. Fair value is generally determined from estimated discounted future net cash flows.
56
Goodwill - Goodwill represents the excess of the cost of acquisitions over the amounts assigned to assets acquired and liabilities assumed. Goodwill is not amortized, but is tested annually for impairment and when events and circumstances warrant an interim evaluation. Goodwill is tested for impairment at a level of reporting referred to as a reporting unit. If the fair value of a reporting unit exceeds its carrying amount, goodwill of the reporting unit is not considered to be impaired. The impairment test is generally based on the estimated discounted future net cash flows of the respective reporting unit, utilizing discount rates and other factors in determining the fair value of the reporting unit. Inputs in the Partnership’s estimated discounted future net cash flows include existing and estimated future asset utilization, estimated growth rates in future cash flows, and estimated terminal values. During the fourth quarter of 2015, our goodwill impairment test indicated that the fair value of the crude oil trucking and producer field services and asphalt services reporting units exceeded their carrying values and no impairments were indicated. However, an impairment was indicated in the crude oil pipeline services reporting unit and an impairment expense of $7.5 million was recorded.
Recent Accounting Pronouncements
For information regarding recent accounting developments that may affect our future financial statements, see Note 22 to our Consolidated Financial Statements.
Item 7A. Quantitative and Qualitative Disclosures about Market Risk
Interest Rate Risk. We are exposed to market risk due to variable interest rates under our credit facility. As of March 3, 2016, we had $269.0 million outstanding under our credit facility that was subject to a variable interest rate. Borrowings under our credit agreement bear interest, at our option, at either the reserve adjusted eurodollar rate (as defined in the credit agreement) plus an applicable margin or the alternate base rate (the highest of the agent bank’s prime rate, the federal funds effective rate plus 0.5%, and the 30-day eurodollar rate plus 1%) plus an applicable margin. Interest rate swap agreements are used to manage a portion of the exposure related to changing interest rates by converting floating-rate debt to fixed-rate debt. In March 2014, we entered into two interest rate swap agreements with an aggregate notional value of $200.0 million. The first agreement became effective June 28, 2014 and matures on June 28, 2018. Under the terms of the first interest rate swap agreement, we pay a fixed rate of 1.45% and receive one-month LIBOR with monthly settlement. The second agreement became effective January 28, 2015 and matures on January 28, 2019. Under the terms of the second interest rate swap agreement, we pay a fixed rate of 1.97% and receive one-month LIBOR with monthly settlement. The fair market value of the interest rate swaps at December 31, 2015 is a liability of $3.1 million and is recorded in long-term derivative liabilities on the consolidated balance sheet. The interest rate swaps do not receive hedge accounting treatment under ASC 815 - Derivatives and Hedging. Changes in the fair value of the interest rate swaps are recorded in interest expense in the consolidated statements of operations.
During the year ended December 31, 2015, the weighted average interest rate under our credit agreement was 3.37%. As of December 31, 2015, borrowings under our credit facility bore interest at a weighted average interest rate of 3.38%.
Changes in economic conditions could result in higher interest rates, thereby increasing our interest expense and reducing our funds available for capital investment, operations or distributions to our unitholders. Based on borrowings as of December 31, 2015, the terms of our credit agreement, current interest rates and the effect of our interest rate swap agreements, an increase or decrease of 100 basis points in the interest rate would result in increased annual interest expense of approximately $0.5 million or decreased annual interest expense of $0.4 million, respectively.
Commodity Price Risk. As we neither take ownership of the asphalt cement or crude oil we transport or store for our customers, and we engage in limited commodity marketing, we have limited direct exposure to risks associated with changes in asphalt cement and crude oil prices. However, the volumes of asphalt cement and crude oil we gather, transport, market or store are indirectly affected by commodity prices because many of our customers have direct commodity price exposure. We do not intend to mitigate this risk to our revenues by hedging this limited commodity price exposure. For additional information regarding the anticipated impact of this risk on our future revenues, see “Item 7-Management’s Discussion and Analysis of Financial Condition and Results of Operations-Potential Impact of Recent Crude Oil Market Price Changes on Future Revenues.”
Item 8. Financial Statements and Supplementary Data.
Our consolidated financial statements, together with the report of our independent registered public accounting firm PricewaterhouseCoopers LLP, are set forth on pages F-1 through F-31 of this report and are incorporated herein by reference.
57
Item 9. Changes in and Disagreements with Accountants on Accounting and Financial Disclosure.
None.
Item 9A. Controls and Procedures
Evaluation of disclosure controls and procedures. Our General Partner’s management, including the Chief Executive Officer and Chief Financial Officer of our General Partner, evaluated, as of the end of the period covered by this report, the effectiveness of our disclosure controls and procedures as defined in Rule 13a-15(e) under the Securities Exchange Act of 1934. Based on that evaluation, the Chief Executive Officer and Chief Financial Officer of our General Partner concluded that our disclosure controls and procedures, as of December 31, 2015, were effective.
Management’s Report on Internal Control Over Financial Reporting. Our General Partner’s management is responsible for establishing and maintaining adequate internal control over financial reporting. Our General Partner’s management, including the Chief Executive Officer and Chief Financial Officer of our General Partner, conducted an evaluation of the effectiveness of our internal control over financial reporting based on the framework in Internal Control - Integrated Framework (2013) issued by the Committee of Sponsoring Organizations of the Treadway Commission. Based on its evaluation under the framework in Internal Control - Integrated Framework, our management concluded that our internal control over financial reporting was effective as of December 31, 2015. Our internal control over financial reporting as of December 31, 2015 has been audited by PricewaterhouseCoopers LLP, our independent registered public accounting firm, as stated in their report appearing on page F-1.
Changes in internal control over financial reporting. There were no changes in our internal control over financial reporting that occurred during the three months ended December 31, 2015, that have materially affected, or are reasonably likely to materially affect, our internal control over financial reporting.
58
PART III.
Item 10. Directors, Executive Officers and Corporate Governance.
Our General Partner manages our operations and activities. Our General Partner is not elected by our unitholders and will not be subject to re-election on a regular basis in the future. The directors of our General Partner oversee our operations. Unitholders are not entitled to elect the directors of our General Partner or directly or indirectly participate in our management or operations. Our General Partner owes a limited fiduciary duty to our unitholders. Our General Partner will be liable, as general partner, for all of our debts (to the extent not paid from our assets), except for indebtedness or other obligations that are made specifically nonrecourse to it. Our General Partner, therefore, may cause us to incur indebtedness or other obligations that are nonrecourse to it.
Directors and Executive Officers
The Board currently consists of Michael R. Eisenson (affiliated with Charlesbank), Jon M. Biotti (affiliated with Charlesbank), Miguel A. (“Mike”) Loya (affiliated with Vitol), Francis Brenner (affiliated with Vitol), Duke R. Ligon (an independent director), Steven M. Bradshaw (an independent director) and John A. Shapiro (an independent director). Mr. Ligon serves as the Chairman of the Board, the chairman of the audit committee and a member of the compensation committee and the conflicts committee of the Board. Mr. Bradshaw serves as the chairman of the conflicts committee and a member of the compensation committee and the audit committee of the Board. Mr. Shapiro serves as the chairman of the compensation committee and a member of the conflicts committee and the audit committee of the Board.
The following table shows information regarding the current directors and executive officers of our General Partner as of March 3, 2016.
Name | Age | Position with Blueknight Energy Partners G.P., L.L.C. | ||
Mark A. Hurley | 57 | Chief Executive Officer | ||
Alex G. Stallings | 48 | Chief Financial Officer and Secretary | ||
Chris A. Paul | 57 | Chief Legal Officer and General Counsel | ||
James R. Griffin | 38 | Chief Accounting Officer | ||
Jeffery A. Speer | 49 | Chief Operating Officer | ||
Brian L. Melton | 46 | Vice President Pipeline Marketing and Business Development | ||
Duke R. Ligon | 74 | Director, Chairman of the Board and Audit Committee | ||
Steven M. Bradshaw | 67 | Director, Chairman of the Conflicts Committee | ||
John A. Shapiro | 64 | Director, Chairman of the Compensation Committee | ||
Miguel A. (“Mike”) Loya | 60 | Director | ||
Michael R. Eisenson | 60 | Director | ||
Jon M. Biotti | 47 | Director | ||
Francis Brenner | 46 | Director | ||
Our directors hold office until the earlier of their death, resignation, removal or disqualification or until their successors have been elected and qualified. Officers serve at the discretion of the Board. There are no family relationships among any of our directors or executive officers.
Mark A. Hurley became the Chief Executive Officer of our General Partner in September 2012. Mr. Hurley served as the Senior Vice President, Crude Oil and Offshore of Enterprise Products, LLC from 2010 to 2012, where he led the newly formed crude oil and offshore business segment. Mr. Hurley began his career at Shell, where he served from 1981 to 2009, most recently as President of Shell Pipeline Co., LP. Mr. Hurley received his bachelor of science in chemical engineering from North Carolina State University.
Alex G. Stallings has served as Chief Financial Officer and Secretary of our General Partner since March 2009. Mr. Stallings served as Chief Accounting Officer and Secretary of our General Partner from February 2007 to March 2009. Additionally, Mr. Stallings served as SemCorp’s Chief Accounting Officer from September 2002 to July 2008. Prior to joining SemCorp, Mr. Stallings served as Chief Accounting Officer for Staffmark, Inc., a temporary staffing company where he was responsible for the public reporting and integration of numerous acquisitions during his tenure. Mr. Stallings also
59
previously was an audit manager for the public accounting firm of Coopers & Lybrand, working in its Tulsa, Oklahoma office. Mr. Stallings is a certified public accountant in the state of Oklahoma.
Chris A. Paul was appointed Chief Legal Officer of our General Partner in October 2013 and has served as General Counsel since June 2013. He previously was a shareholder with McAfee & Taft in Tulsa, Oklahoma where he was the firm’s leader of the aerospace and midstream energy/transportation industry groups. Prior to that, he was in private practice as an owner of Joyce & Paul, a Partner with Gardere & Wynne, and earlier as a JAGC in the U.S. Army. Mr. Paul received his B.A. International Studies from Dickinson College and his J.D. from the College of William and Mary.
James R. Griffin has served as the Chief Accounting Officer of our General Partner since March 2009. Mr. Griffin served as our General Partner’s controller from May of 2007 to March 2009 and SemCorp’s transactional services controller from September 2006 to May 2007. Prior to joining SemCorp, Mr. Griffin served as an audit manager for the public accounting firm of PricewaterhouseCoopers LLP, working in its Tulsa, Oklahoma office. Mr. Griffin is a certified public accountant in the state of Oklahoma.
Jeffery A. Speer has served as Chief Operating Officer of our General Partner since July 2013 and previously as Senior Vice President-Operations of our General Partner since February 2010. Previously, Mr. Speer had served as the Vice President of Operations for one of our subsidiaries since June 2009. He served as Vice President of Operations for SemCorp’s asphalt and emulsion business from June 2005 to June 2009. Prior to joining SemCorp, Mr. Speer served as Vice President of Operations for Koch Industries, Inc. and had operational responsibility for Koch’s crude oil and pipeline divisions in Oklahoma, Texas and Canada as well as Koch’s agricultural and asphalt and emulsion businesses. Mr. Speer has more than twenty-five years experience in the energy industry and holds a Bachelor’s degree in mechanical engineering from Kansas State University.
Brian L. Melton has served as Vice President Pipeline Marketing and Business Development of our General Partner since December 2013. Previously, he served as Vice President of Business Development / Corporate Strategy for Crestwood Equity Partners, L.P., Crestwood Midstream Energy Partners, L.P. and Inergy, L.P. from September 2008 until December 2013. Prior to joining Inergy in 2008, he was a director in the Energy Corporate Investment Banking groups of Wachovia Securities and A.G. Edwards. He has served on the Board of Directors of Abraxas Petroleum Corporation (AXAS) since October of 2009. Mr. Melton received a Bachelor of Science degree in Management and a Master of Business Administration degree from Arkansas State University.
Duke R. Ligon has served as a director of our General Partner since October 2008. He is an attorney, an owner and manager of Mekusukey Oil Company, LLC, and served as senior vice president and general counsel of Devon Energy Corporation from January 1997 until he retired in February 2007. From February 2007 to February 2010, Mr. Ligon served in the capacity of Strategic Advisor to Love’s Travel Stops & Country Stores, Inc., based in Oklahoma City, and has previously acted as Executive Director of the Love’s Entrepreneurship Center at Oklahoma City University. He is also a member of the Board of Directors of PostRock Energy Corporation (PSTR), Heritage Trust Company, Security State Bank (in which he has a 14% beneficial ownership), Orion California LP, Emerald Oil, Inc. (EOX), Cavaloz Holdings and System One. He was formerly on the Board of Directors of SteelPath MLP Funds Trust, TransMontaigne Partners L.P. (TLP), Pre-Paid Legal Services, Inc. (PPD), Panhandle Oil and Gas Inc. (PHX),Vantage Drilling Company (VTG) and TEPPCO Partners, L.P. (TPP). Mr. Ligon received an undergraduate degree in chemistry from Westminster College and a law degree from the University of Texas School of Law. Mr. Ligon was selected to serve as a director on the Board due to his extensive business and leadership experience derived from his background as a director of various companies in the energy industry as well as his financial and legal expertise.
Steven M. Bradshaw has served as a director of our General Partner since November 2009. He has over 35 years of experience in the global logistics and transportation industry and currently serves as the Managing Director at Global Logistics Solutions. From 2005 to 2009, Mr. Bradshaw served as Vice President - Administration of Premium Drilling, Inc., an offshore drilling contractor that provides drilling services to the international oil and gas industry. Previously, he served as Executive Vice President of Skaugen PetroTrans, Inc. from 2001 to 2003. He also served for sixteen years in various operating and marketing capacities at Kirby Corporation, including as President, Refined Products Division from 1992 to 1996. In addition, Mr. Bradshaw serves on the Board of Directors of CollegeCommunityCareer. Mr. Bradshaw also served as an officer in the United States Navy and holds an MBA from Harvard University and a Bachelor’s degree in mathematics from the University of Missouri. Mr. Bradshaw was selected to serve as a director on the Board due to his business judgment and extensive industry knowledge and experience.
John A. Shapiro has served as a director of our General Partner since November 2009. Mr. Shapiro retired as an officer at Morgan Stanley & Co. where he had served for more than 24 years in various capacities, most recently as Global Head of
60
Commodities. While an officer at Morgan Stanley, Mr. Shapiro participated in the successful acquisitions of TransMontaigne Inc. and Heidmar Inc. and served as a member of the board of directors of both companies. Prior to joining Morgan Stanley & Co., Mr. Shapiro worked for Conoco, Inc. and New England Merchants National Bank. Mr. Shapiro has been a lecturer at Princeton University, Harvard University School of Government, HEC Business School (Paris, France) and Oxford University Energy Program (Oxford, UK). In addition, he serves on the board of directors of Citymeals-on-Wheels and holds an MBA from Harvard University and a Bachelor’s degree in economics from Princeton University. Mr. Shapiro has served on the board of directors of Blue Wolf Mongolia Holdings. Mr. Shapiro was selected to serve as a director on the Board due to his financial expertise and extensive industry experience developed through his work at Morgan Stanley & Co. and by serving as a director of other energy companies.
Miguel A. (“Mike”) Loya has served as a director of our General Partner since November 2009. Mr. Loya has served as a director of Vitol since 1997 and as the President and Chief Executive of Vitol, Inc. since 2006. As such, he is Vitol’s senior shareholder responsible for the management of the Vitol Group’s trading activities, companies and assets in North and South America. Previously, Mr. Loya has enjoyed positions with Tenneco, Transworld Oil U.S.A., Amerada Hess and Exxon Mobil Corporation. Mr. Loya holds an MBA from Harvard University and a Bachelor’s degree in mechanical engineering from the University of Texas at El Paso. Mr. Loya was selected to serve as a director on the Board due to his affiliation with Vitol, his knowledge of the energy industry and his financial and business expertise.
Michael R. Eisenson has served as a director of our General Partner since November 2010. Mr. Eisenson is a Managing Director and Chief Executive Officer of Charlesbank, which is a Boston-based private equity firm. Prior to co-founding Charlesbank in 1998, Mr. Eisenson was the President of Harvard Private Capital Group. He began his tenure at Harvard Management Company in 1986 as Managing Director. Before joining Harvard Management Company, Mr. Eisenson was with The Boston Consulting Group, a corporate strategy consulting firm. Mr. Eisenson serves on the board of directors of Penske Auto Group (PAG) and several privately held Charlesbank portfolio companies. Mr. Eisenson was also a board member of Regency Gas Services, representing Charlesbank which was Regency’s founding equity investor. He is a graduate of Williams College, with a Bachelor’s degree in economics, and holds an MBA and a Juris Doctorate degree from Yale University. Mr. Eisenson was selected to serve as a director on the Board due to his affiliation with Charlesbank, his knowledge of the energy industry and his financial and business expertise.
Jon M. Biotti has served as a director of our General Partner since November 2010. Mr. Biotti is a Managing Director of Charlesbank, which he joined in 1998 after graduating from Harvard Business School where he was an entrepreneurial studies fellow. Mr. Biotti also worked as a banking associate at Brown Brothers Harriman & Co. Mr. Biotti serves on the board of directors of Southcross Energy (SXE) and of several privately held Charlesbank portfolio companies. Mr. Biotti was also a board member of Regency Gas Services, representing Charlesbank which was Regency’s founding equity investor. Educated at Harvard, Mr. Biotti received a Bachelor’s degree in government and sociology, an MBA and an MA in public administration. Mr. Biotti was selected to serve as a director on the Board due to his affiliation with Charlesbank, his knowledge of the energy industry and his financial and business expertise.
Francis Brenner has served as a director of our General Partner since September 2012. Mr. Brenner has served as the Investments Director for the Americas for Vitol Inc. since 2010. Between 2001 and 2010, Mr. Brenner was with Morgan Stanley, most recently as an Executive Director in the Morgan Stanley Commodities Group. Prior to joining Morgan Stanley, Mr. Brenner was involved in the design and construction of utility infrastructure at Tyco International. Mr. Brenner holds an MBA from the University of Michigan and a Bachelors degree in engineering from the University of Wisconsin-Platteville. Mr. Brenner was selected to serve as a director on the Board due to his affiliation with Vitol, his knowledge of the energy business and his financial and business expertise.
Independence of Directors
Our General Partner currently has seven directors, three of whom (Messrs. Bradshaw, Ligon and Shapiro) are “independent” as defined under the independence standards established by Nasdaq. Nasdaq’s independence definition includes a series of objective tests, including that the director is not an employee of the company and has not engaged in various types of business dealings with the company. In addition, the Board has made a subjective determination as to each independent director that no relationships exist which, in the opinion of the Board, would interfere with the exercise of independent judgment in carrying out the responsibilities of a director. In making these determinations, the directors reviewed and discussed information provided by the directors and us with regard to each director’s business and personal activities as they may relate to us and our management. Nasdaq does not require a listed limited partnership like us to have a majority of independent directors on the Board or to establish a nominating committee.
61
In addition, the members of the audit committee also each qualify as “independent” under special standards established by the SEC for members of audit committees, and the audit committee includes at least one member who is determined by the board of directors to meet the qualifications of an “audit committee financial expert” in accordance with SEC rules, including that the person meets the relevant definition of an “independent” director. John A. Shapiro is the independent director who has been determined to be an audit committee financial expert. Unitholders should understand that this designation is a disclosure requirement of the SEC related to experience and understanding with respect to certain accounting and auditing matters. The designation does not impose any duties, obligations or liability that are greater than are generally imposed on a member of the audit committee and board of directors, and the designation of a director as an audit committee financial expert pursuant to this SEC requirement does not affect the duties, obligations or liability of any other member of the audit committee or board of directors.
Board Leadership Structure and Risk Oversight
The Chief Executive Officer and Chairman of the Board positions of our General Partner are held by separate individuals in recognition of the differences between the two roles. We have taken this position to achieve an appropriate balance with regard to our strategic direction, oversight of management, unitholder interests and director independence. Our General Partner’s Chief Executive Officer is responsible for setting our strategic direction and overseeing our day to day performance. Our General Partner’s Chairman of the Board is an independent director who provides guidance to the Chief Executive Officer and sets the agenda for and presides over Board meetings.
Our Board is engaged in the oversight of risk through regular updates from our management team regarding those risks confronting us, the actions and strategies necessary to mitigate those risks and the status and effectiveness of those actions and strategies. These regular updates are provided at meetings of the Board and the audit committee as well as other meetings with the Chairman of the Board, the Chief Executive Officer and other members of our General Partner’s management team.
Board Committees
We have standing conflicts, audit and compensation committees of the Board. Each member of the audit, compensation and conflicts committees is an independent director in accordance with Nasdaq and applicable securities laws. Each of the audit, compensation and conflicts committees has a written charter approved by the Board. The written charter for each of these committees is available on our web site at www.bkep.com under the “Investors-Corporate Governance” section. We will also provide a copy of any of our committee charters to any of our unitholders without charge upon written request to the attention of Investor Relations at 6060 American Plaza, Suite 600, Tulsa, Oklahoma 74135. The current members of the audit, compensation and conflicts committees of the Board and a brief description of the functions performed by each committee are set forth below.
Conflicts Committee. The members of the conflicts committee are Messrs. Bradshaw (chairman), Ligon and Shapiro. The primary responsibility of the conflicts committee is to review matters that the directors believe may involve conflicts of interest. The conflicts committee determines if the resolution of the conflict of interest is fair and reasonable to us. The conflicts committee may retain independent legal and financial advisors to assist it in its evaluation of a transaction. The members of the conflicts committee may not be officers or employees of our General Partner or directors, officers or employees of its affiliates and must meet the independence standards to serve on an audit committee of a board of directors established by any national securities exchange upon which our common units are traded and the SEC. Any matters approved by the conflicts committee will be conclusively deemed to be fair and reasonable to us, approved by all of our partners, and not a breach by our General Partner of any duties it may owe us or our unitholders.
Audit Committee. The members of the audit committee are Messrs. Bradshaw, Ligon (chairman) and Shapiro. The primary responsibilities of the audit committee are to assist the Board in its general oversight of our financial reporting, internal controls and audit functions, and it is directly responsible for the appointment, retention, compensation and oversight of the work of our independent auditors.
For information regarding our audit committee financial expert, see “- Independence of Directors” above.
Compensation Committee. The members of the compensation committee are Messrs. Bradshaw, Ligon and Shapiro (chairman). The primary responsibility of the compensation committee is to oversee compensation decisions for the outside directors of our General Partner and executive officers of our General Partner, as well as administer the General Partner's Long-Term Incentive Plan.
62
Code of Ethics and Business Conduct
Our General Partner has adopted a Code of Business Conduct and Ethics applicable to all of our General Partner’s employees, including all officers, and including our General Partner’s independent directors, who are not employees of our General Partner, with regard to their activities relating to us. The Code of Business Conduct and Ethics incorporates guidelines designed to deter wrongdoing and to promote honest and ethical conduct and compliance with applicable laws and regulations. It also incorporates our expectations of our General Partner’s employees that enable us to provide accurate and timely disclosure in our filings with the Securities and Exchange Commission and other public communications. The Code of Business Conduct and Ethics is publicly available under the “Investors - Corporate Governance” section of our web site at www.bkep.com. The information contained on, or connected to, our web site is not incorporated by reference into this annual report on Form 10-K and should not be considered part of this or any other report that we file with, or furnish to, the SEC. We will also provide a copy of the Code of Business Conduct and Ethics to any of our unitholders without charge upon written request to the attention of Investor Relations at 6060 American Plaza, Suite 600, Tulsa, Oklahoma 74135. If any substantive amendments are made to the Code of Business Conduct and Ethics, or if we or our General Partner grant any waiver, including any implicit waiver, from a provision of the code to any of our General Partner’s executive officers and directors, we will disclose the nature of such amendment or waiver on that web site or in a current report on Form 8-K.
Section 16(a) Beneficial Ownership Reporting Compliance
Based solely upon a review of Forms 3, 4 and 5 (and any amendments thereto) furnished to us, we believe that all directors, officers, beneficial owners of more than 10% of any class of our securities or any other person subject to Section 16 of the Exchange Act complied with the Section 16(a) filing requirements of them during the year ended December 31, 2015.
Reimbursement of Expenses of our General Partner
Pursuant to our partnership agreement, our General Partner and its affiliates are entitled to receive reimbursement for the payment of expenses related to our operations and for the provision of various general and administrative services for our benefit.
Item 11. Executive Compensation.
Compensation Discussion and Analysis
Throughout this section, each person who served as the Principal Executive Officer (“PEO”) during 2015, each person who served as the Principal Financial Officer (“PFO”) during 2015 and the three most highly compensated executive officers other than the PEO and PFO serving at December 31, 2015, are referred to as the Named Executive Officers (“NEOs”). The NEOs include the following:
• | Mark A. Hurley, Chief Executive Officer; |
• | Alex G. Stallings, Chief Financial Officer and Secretary; |
• | Jeffery A. Speer, Chief Operating Officer; |
• | Chris A. Paul, Chief Legal Officer and General Counsel; and |
• | Brian L. Melton, Vice President Pipeline Marketing & Business Development. |
As is the case with many publicly traded partnerships, we have not historically directly employed any persons responsible for managing or operating us or for providing services relating to day-to-day business affairs. Our General Partner manages our operations and activities, and its Board and officers make decisions on our behalf. The compensation for the NEOs for services rendered to us is determined by the compensation committee of our General Partner.
Compensation Methodology. The compensation committee of the Board seeks to provide a total compensation package designed to drive performance and reward contributions in support of our business strategies and to attract, motivate and retain high quality talent with the skills and competencies required by us. Once every two to three years, our compensation committee examines the compensation practices of certain of our peer companies, which, as of our most recent examination in May 2015, includes American Midstream Partners, LP, Crestwood Midstream Partners LP, Genesis Energy, LP, Holly Energy Partners, L.P., Niska Gas Storage Partners LLC, Rose Rock Midstream, L.P., Tesoro Logistics LP and Transmontaigne Partners L.P. The compensation committee may review and, in certain cases, participate in, various relevant compensation surveys and consult with compensation consultants with respect to determining compensation for the NEOs.
63
In 2015, management, for the benefit of the compensation committee of the Board, engaged BDO USA, LLP (“BDO”) as its independent compensation consultant to provide the compensation committee comparable market based compensation data and other data regarding compensation programs and methodologies applicable to the NEOs and other employees of our General Partner. In its consultation role, BDO was tasked with conducting an assessment of our peer group, and benchmarking the compensation of our NEOs against our peer group. The compensation committee will utilize the compensation survey data when making decisions to change any individual named executive officer’s compensation, or when making changes or additions to any compensation program or methodologies. BDO’s work for the compensation committee did not raise any conflicts of interest in 2015. The compensation committee of the Board did not engage a consultant in 2013 or 2014.
Elements of Compensation. Historically, the primary elements of our General Partner’s compensation program have been a combination of annual cash and long-term equity-based compensation, and the principal elements of compensation for the NEOs were the following:
• | base salary; |
• | discretionary bonus awards; |
• | long-term incentive plan awards; and |
• | other benefits. |
The compensation committee reviews and makes recommendations regarding the mix of compensation, both among short and long-term compensation and cash and non-cash compensation, to establish structures that it believes are appropriate for each of the NEOs. We believe that the mix of base salary, discretionary bonus awards, awards under the long-term incentive plan and other benefits fit our overall compensation objectives. We believe this mix of compensation provides competitive compensation opportunities to align and drive employee performance in support of our business strategies and to attract, motivate and retain high quality talent with the skills and competencies that we require.
Base Salary. Historically, our General Partner’s compensation committee established base salaries for the NEOs based on various factors including the amounts it considered necessary to attract and retain the highest quality executives, the responsibilities of the NEOs and market data including publicly available market data for the peer companies listed above as reported in their filings with the SEC.
Each of the NEOs other than Messrs. Speer and Melton has entered into employment agreements with a subsidiary of our General Partner. As of December 31, 2015, the employment agreements for our NEOs provide for an annual base salary of $445,000, $319,800 and $285,000 for Messrs. Hurley, Stallings and Paul, respectively, and in 2015, Messrs. Speer and Melton’s base salary was $228,000 and $237,000, respectively. These base salary amounts were originally determined based upon the scope of each executive’s responsibilities that were commensurate with such executive’s position as well as the added responsibilities the executives have that were typical of executives in publicly traded partnerships, taking into account competitive market compensation paid by similar companies for comparable positions. In addition, the base salary amounts payable to Messrs. Hurley, Speer, Paul and Melton were determined, in part, by the base salary amount and other benefits each such individual received prior to joining our General Partner’s management team. In March 2013, our General Partner’s compensation committee increased the base salaries of Messrs. Stallings and Speer to $306,000 and $214,000, respectively. In March 2014, our General Partner’s compensation committee decided to increase the base salaries of Messrs. Hurley, Stallings, Speer and Paul to $435,000, $312,000, $220,420 and $278,100, respectively. In March 2015, our General Partner’s compensation committee decided to increase the base salaries of Messrs. Hurley, Stallings, Speer, Paul and Melton to $445,000, $319,800, $228,000, $285,000 and $237,000, respectively. In March 2016, our General Partner's compensation committee decided to increase the base salary of Mr. Speer to $240,000.
Discretionary Bonus Awards. Our General Partner’s compensation committee may also award discretionary bonus awards to the NEOs. Our General Partner may use discretionary bonus awards for achieving financial and operational goals and for achieving individual performance objectives.
During March 2013, the compensation committee awarded discretionary bonuses of $425,000, $140,000 and $115,000 to each of Messrs. Hurley, Stallings and Speer, respectively, relating to our results of operations in 2012.
During March 2014, the compensation committee awarded discretionary bonuses of $440,000, $160,000, $135,000, $135,000 and $100,000 to each of Messrs. Hurley, Stallings, Speer, Paul and Melton, respectively, relating to our results of operations in 2013. Please see “-2013 Incentive Compensation” for a discussion of these discretionary bonuses.
64
During March 2015, the compensation committee awarded discretionary bonuses of $400,000, $130,000, $110,200, $115,000 and $105,800 to each of Messrs. Hurley, Stallings, Speer, Paul and Melton, respectively, relating to our results of operations in 2014. Please see “-2014 Incentive Compensation” for a discussion of these discretionary bonuses.
During March 2016, the compensation committee awarded discretionary bonuses of $450,000, $145,000, $135,000, $125,000 and $110,000 to each of Messrs. Hurley, Stallings, Speer, Paul and Melton, respectively, relating to our results of operations in 2015. Please see “-2015 Incentive Compensation” for a discussion of these discretionary bonuses.
Long-Term Incentive Plan Awards. Our General Partner has adopted the Long-Term Incentive Plan for employees, consultants and directors of our General Partner and its affiliates who perform services for us. Each of the NEOs is eligible to participate in the Long-Term Incentive Plan. The Long-Term Incentive Plan provides for the grant of unit awards, restricted units, phantom units, unit options, unit appreciation rights, distribution equivalent rights and substitute awards. For a more detailed description of our Long-Term Incentive Plan, please see “-Long-Term Incentive Plan.”
During September 2012, in connection with his appointment as our Chief Executive Officer, the compensation committee made an award of 500,000 phantom units to Mr. Hurley. The award vests ratably in 20% increments on each of September 20, 2013, 2014, 2015, 2016 and 2017, respectively. These phantom units do not contain distribution equivalent rights.
During March 2013, the compensation committee made awards of phantom units of 16,770 units and 16,149 units to Messrs. Stallings and Speer, respectively, relating to our results of operations in 2012. The awards vested on January 1, 2016. These phantom units contained distribution equivalent rights that entitled the holder of such units to receive a cash payment equal to the amount of any ordinary quarterly cash distribution paid to our common unitholders.
During March 2014, the compensation committee made awards of phantom units of 17,089 units, 16,538 units, 17,089 units and 12,679 units to Messrs. Stallings, Speer, Paul and Melton, respectively, relating to our results of operations in 2013. The awards vest on January 1, 2017. These phantom units contain distribution equivalent rights that entitle the holder of such units to receive a cash payment equal to the amount of any ordinary quarterly cash distribution paid to our common unitholders. Please see “-2013 Incentive Compensation” for a discussion of these awards.
During March 2015, the compensation committee made awards of phantom units of 15,528 units, 13,818 units, 14,963 units and 13,160 units to Messrs. Stallings, Speer, Paul and Melton, respectively, relating to our results of operations in 2014. The awards vest on January 1, 2018. These phantom units contain distribution equivalent rights that entitle the holder of such units to receive a cash payment equal to the amount of any ordinary quarterly cash distribution paid to our common unitholders. Please see “-2014 Incentive Compensation” for a discussion of these awards.
During March 2016, the compensation committee made awards of phantom units of 29,880 units, 26,892 units, 29,880 units and 21,912 units to Messrs. Stallings, Speer, Paul and Melton, respectively, relating to our results of operations in 2015. The awards vest on January 1, 2019. These phantom units contain distribution equivalent rights that entitle the holder of such units to receive a cash payment equal to the amount of any ordinary quarterly cash distribution paid to our common unitholders. Please see “-2015 Incentive Compensation” for a discussion of these awards.
Other Benefits. The employment agreements entered into by each of the NEOs other than Messrs. Speer and Melton with our General Partner provide that such NEO is eligible to participate in any employee benefit plans maintained by our General Partner during the term of his employment with the General Partner. During 2013, 2014 and 2015, our General Partner maintained an employee health insurance plan and an Exec-U-Care plan under which our officers were reimbursed for certain co-pays and deductibles for medical expenses in addition to the Long-Term Incentive Plan described above. In addition, the employment agreements provide that each NEO is entitled to reimbursement for out-of-pocket expenses incurred while performing his duties under the employment agreement. Furthermore, we currently provide auto allowances to our NEOs.
2013 Incentive Compensation. For 2013, the Board approved a cash bonus plan whereby a bonus pool for all employees, including the NEOs, was established. The bonus pool equaled a percentage of a performance metric equal to cash flow generated prior to distributions, incentive compensation and reserves established by our General Partner (which was set at approximately $48 million for 2013). Between 50% and 75% of the bonus pool was to be funded based on the achievement of this performance metric (with up to an additional 15% being contributed based on achieving results in excess of this performance metric), with an additional 15% of the bonus pool based on the achievement of Partnership-wide goals and an additional 10% of the bonus pool based on the achievement of environmental, health and safety targets. Individual awards (which, as in prior years, were expected to be paid in a combination of cash bonuses and equity compensation) were to be determined by the compensation committee in its discretion based on individual performance, exceptional service to us, challenges and opportunities not reasonably foreseeable at the beginning of the year, internal equities and external competition
65
or opportunities. In 2013, actual cash flow generated prior to distributions, incentive compensation and reserves established by our General Partner was $53 million, resulting in 90% of the bonus pool being contributed based on achieving this metric. In addition, Partnership-wide goals were achieved resulting in 15% of the bonus pool being contributed, and 5% of the bonus pool was contributed based on the partial achievement of environmental, health and safety targets.
During March 2014, our General Partner’s chief executive officer proposed to the compensation committee that each of our NEOs (other than Mr. Hurley) receive (i) a discretionary bonus award relating to our results of operations in 2013 as follows: $160,000, $135,000, $135,000 and $100,000 for Messrs. Stallings, Speer, Paul and Melton, respectively, and (ii) awards of phantom units relating to our results of operations for 2013 as follows: 17,089 units, 16,538 units, 17,089 units and 12,679 units to Messrs. Stallings, Speer, Paul and Melton, respectively. The compensation committee agreed with these recommendations and, on March 10, 2014, made discretionary bonus awards and phantom unit grants in accordance with such recommendations and also awarded Mr. Hurley a discretionary bonus award of $440,000 relating to our results of operations in 2013. The discretionary bonus awards were paid in March 2014. The compensation committee considered the achievement of performance metrics outlined in the prior paragraph as well as the performance of the individual NEO in determining to make such awards.
2014 Incentive Compensation. For 2014, the Board approved a cash bonus plan whereby a bonus pool for all employees, including the NEOs, was established. The bonus pool equaled a percentage of a performance metric equal to cash flow generated prior to distributions, incentive compensation, reserves established by our General Partner and certain other adjustments (which was set at approximately $52 million for 2014). Between 25% and 50% of the bonus pool was to be funded based on the achievement of this performance metric (with up to an additional 25% being contributed based on achieving results in excess of this performance metric). An additional 20% to 40% of the bonus pool was to be funded based on the achievement of Partnership growth goals, with an additional 15% of the bonus pool based on the achievement of Partnership-wide goals and an additional 10% of the bonus pool based on the achievement of environmental, health and safety targets. Individual awards (which, as in prior years, were expected to be paid in a combination of cash bonuses and equity compensation) were to be determined by the compensation committee in its discretion based on individual performance, exceptional service to us, challenges and opportunities not reasonably foreseeable at the beginning of the year, internal equities and external competition or opportunities. In 2014, actual cash flow generated prior to distributions, incentive compensation and reserves established by our General Partner was $50.4 million, resulting in 40% of the bonus pool being contributed based on partially achieving this metric. In addition, Partnership growth goals were partially achieved resulting in 20% of the bonus pool being contributed, Partnership-wide goals were achieved resulting in 15% of the bonus pool being contributed, and 5% of the bonus pool was contributed based on the partial achievement of environmental, health and safety targets.
During March 2015, our General Partner’s chief executive officer proposed to the compensation committee that each of our NEOs (other than Mr. Hurley) receive (i) a discretionary bonus award relating to our results of operations in 2014 as follows: $130,000, $110,200, $115,000 and $105,800 for Messrs. Stallings, Speer, Paul and Melton, respectively, and (ii) awards of phantom units relating to our results of operations for 2014 as follows: 15,528 units, 13,818 units, 14,963 units and 13,160 units to Messrs. Stallings, Speer, Paul and Melton, respectively. The compensation committee agreed with these recommendations and on March 6, 2015, made discretionary bonus awards and phantom unit grants in accordance with such recommendations and also awarded Mr. Hurley a discretionary bonus award of $400,000 relating to our results of operations in 2014. The discretionary bonus awards were paid in March 2015. The compensation committee considered the achievement of performance metrics outlined in the prior paragraph as well as the performance of the individual NEO in determining to make such awards.
2015 Incentive Compensation. For 2015, the Board approved a cash bonus plan whereby a bonus pool for all employees, including the NEOs, was established. The bonus pool equaled a percentage of a performance metric equal to cash flow generated prior to distributions, incentive compensation, reserves established by our General Partner and certain other adjustments (which was set at approximately $46.5 million for 2015). Between 35% and 50% of the bonus pool was to be funded based on the achievement of this performance metric (with up to an additional 20% being contributed based on achieving results in excess of this performance metric). An additional 15% to 35% of the bonus pool was to be funded based on the achievement of our growth goals, with an additional 15% of the bonus pool based on the achievement of partnership wide goals and an additional 10% of the bonus pool based on the achievement of environmental, health and safety targets. Individual awards (which, as in prior years, were expected to be paid in a combination of cash bonuses and equity compensation) was to be determined by the compensation committee in its discretion based on individual performance, exceptional service to the Partnership, challenges and opportunities not reasonably foreseeable at the beginning of the year, internal equities and external competition or opportunities. In 2015, actual cash flow generated prior to distributions, incentive compensation and reserves established by our General Partner was $59.1 million, resulting in 60% of the bonus pool being contributed based on this metric. In addition, company growth goals were partially achieved resulting in 15% of the bonus
66
pool being contributed, company wide goals were achieved resulting in 15% of the bonus pool being contributed, and 10% of the bonus pool was contributed based on the partial achievement of environmental, health and safety targets.
During March 2016, our General Partner’s chief executive officer proposed to the compensation committee that each of our NEOs (other than Mr. Hurley) receive (i) a discretionary bonus award relating to our results of operations in 2015 as follows: $145,000, $135,000, $125,000 and $110,000 for Messrs. Stallings, Speer, Paul and Melton, respectively, and (ii) awards of phantom units relating to our results of operations for 2015 as follows: 29,880 units, 26,892 units, 29,880 units and 21,912 to Messrs. Stallings, Speer, Paul and Melton, respectively. The compensation committee agreed with these recommendations and on March 4, 2016 made discretionary bonus awards and phantom unit grants in accordance with such recommendations and also awarded Mr. Hurley a discretionary bonus award of $450,000 relating to our results of operations in 2015. The discretionary bonus awards will be paid in March 2016. The compensation committee considered the achievement of performance metrics outlined in the prior paragraph as well as the performance of the individual NEO in determining to make such awards.
2016 Incentive Compensation. For 2016, the Board has considered a cash bonus plan whereby a bonus pool for all employees, including the NEOs, would be established. The Board has not yet established the plan or performance metrics by which the bonus pool will be determined.
Compensation Mix. Our General Partner’s compensation committee determines the mix of compensation, both among short and long-term compensation and cash and non-cash compensation, to establish structures that it believes are appropriate for each of the NEOs.
Role of Executive Officers in Executive Compensation. Our General Partner’s compensation committee determines the compensation of the NEOs. Our General Partner's chief executive officer, Mr. Hurley, made recommendations to the compensation committee for the awards of phantom units and discretionary bonuses to be paid to our NEOs relating to our results of operations in 2013, 2014 and 2015. However, Mr. Hurley does not make any recommendations regarding his personal compensation. In addition, the employment agreement entered into by Mr. Stallings was originally approved by the management committee of SemCorp’s general partner pursuant to its limited liability company agreement.
Employment Agreements. As indicated above, each of the NEOs except Messrs. Speer and Melton has entered into an employment agreement with our General Partner or one of its subsidiaries.
Employment Agreement of Mr. Hurley. Pursuant to Mr. Hurley’s employment agreement, Mr. Hurley was paid an initial annual base salary of $425,000. In March 2014, our General Partner's compensation committee increased the base salary of Mr. Hurley to $435,000. In March 2015, our General Partner's compensation committee increased the base salary of Mr. Hurley to $445,000. Mr. Hurley’s employment agreement has an initial five year term that automatically renews for subsequent one year periods unless either party gives 90 days advance notice. Mr. Hurley received a sign-on bonus of $100,000 that was paid in October 2012. Additionally, Mr. Hurley was entitled to a $425,000 bonus during his first year of employment. This bonus was paid in March 2013. Mr. Hurley also received 500,000 non-participating phantom units in September 2012 under the General Partner’s Long-Term Incentive Plan, which vest ratably over five years pursuant to the Phantom Unit Agreement he entered into with the General Partner. The employment agreement also provides that Mr. Hurley is eligible to participate in any employee benefit plans maintained by the General Partner and is entitled to reimbursement for certain out-of-pocket expenses. Mr. Hurley has agreed not to disclose any confidential information obtained by him while employed under his employment agreement and has agreed to a one year non-solicitation covenant.
Except in the event of termination for Cause (as defined below), termination by Mr. Hurley other than for Good Reason (as defined below), termination after the expiration of the term of Mr. Hurley’s employment agreement or termination due to death or disability, Mr. Hurley’s employment agreement provides for payment of any unpaid base salary and vested benefits under any incentive plans, a lump sum payment equal to twelve months of base salary, and Mr. Hurley will also be entitled to continued participation in our General Partner’s welfare benefit programs for a period of eighteen months following termination. Based upon Mr. Hurley’s current base salary, the maximum amount of the lump sum severance payment would be approximately $0.4 million, in addition to continued participation in the General Partner’s welfare benefit programs and the amounts of earned but unpaid base salary and benefits under any incentive plans.
For purposes of the employment agreement with Mr. Hurley:
“Cause” means (i) conviction of Mr. Hurley by a court of competent jurisdiction of any felony or a crime involving moral turpitude; (ii) Mr. Hurley’s willful and intentional failure or willful intentional refusal to follow reasonable and lawful instructions of the Board; (iii) Mr. Hurley’s material breach or default in the performance of his obligations under the
67
employment agreement; or (iv) Mr. Hurley’s act of misappropriation, embezzlement, intentional fraud or similar conduct involving the General Partner.
“Good Reason” means (i) a material reduction in Mr. Hurley’s base salary; (ii) a material diminution of Mr. Hurley’s duties, authority or responsibilities as in effect immediately prior to such diminution; or (iii) the relocation of Mr. Hurley’s principal work location to a location more than 150 miles from its current location.
“Change of Control” means any of the following events: (i) Charlesbank Capital Partners, LLC and/or Vitol Holding B.V., or their respective affiliates, cease to be the beneficial owner, on a combined basis, of 50% or more of the combined voting power of the equity interests in the General Partner; (ii) our limited partners approve, in one or a series of transactions, a plan of complete liquidation of us; (iii) the sale or other disposition either by the General Partner or by us of all or substantially all of the assets of the General Partner or us in one or more transactions to any person other than the General Partner and its affiliates; or (iv) a transaction resulting in a person other than the General Partner or an affiliate of the General Partner being our general partner.
The employment agreement contains payment obligations that may be triggered by a termination after a Change of Control as defined therein. See “- Potential Payments Upon Change of Control or Termination.” If, within eighteen months after a Change of Control occurs, Mr. Hurley is terminated by our General Partner without Cause or Mr. Hurley terminates the agreement for Good Reason, he will be entitled to payment of any unpaid base salary and vested benefits under any incentive plans, a lump sum payment equal to twelve months of base salary and Mr. Hurley’s most recent annual bonus and continued participation in our General Partner’s welfare benefit programs for the longer of the remainder of the term of the employment agreement or one year after termination. Based upon Mr. Hurley’s current base salary and most recent annual bonus, the maximum amount of the lump sum severance payment would be approximately $0.8 million, in addition to continued participation in the General Partner’s welfare benefit programs and the amounts of earned but unpaid base salary and benefits under any incentive plans.
In October 2012, Vitol and Charlesbank, the owners of Blueknight GP Holding, LLC (“HoldCo”), the owner of our General Partner, admitted Mr. Hurley as a member of HoldCo. In connection with his admission as a member of HoldCo, Mr. Hurley was issued a non-voting economic interest in HoldCo (the “Profits Interest”). Mr. Hurley’s Profits Interest in HoldCo vests in 20% increments on each of October 4, 2013, 2014, 2015, 2016 and 2017 and entitles Mr. Hurley, to the extent vested, to (i) 2% of the total amount of proceeds and/or distributions in excess of $100,000,000 received by HoldCo in connection with a transaction resulting in a change of control of us, and (ii) 2% of the portion of any interim quarterly distribution received by HoldCo in excess of $1,250,000. As of December 31, 2015, 60% of the Profits Interest is vested.
Although the entire economic burden of the Profits Interest, which is equity classified, is borne solely by HoldCo and does not impact our cash or units outstanding, the intent of the Profits Interest is to provide a performance incentive and encourage retention of Mr. Hurley. Therefore, we recognize the grant date fair value of the Profits Interest as compensation expense over the service period. The expense is also reflected as a capital contribution and, thus, results in a corresponding credit to Partners’ capital in our consolidated financial statements. Our expense was $0.1 million for each of the years 2013, 2014 and 2015.
Employment Agreement of Mr. Stallings. The employment agreement entered into by Mr. Stallings had an initial term of two years that automatically renews for subsequent one year periods unless either party gives 90 days advance notice. This employment agreement provides for the initial annual base salaries described above. In addition, Mr. Stallings is eligible for discretionary bonus awards and long-term incentives which may be made from time to time in the sole discretion of the Board. The employment agreement also provides that Mr. Stallings is eligible to participate in any employee benefit plans maintained by our General Partner during the term of his employment with the General Partner and for up to 12 months thereafter and are entitled to reimbursement for certain out-of-pocket expenses.
Pursuant to the employment agreement, Mr. Stallings has agreed not to disclose any confidential information obtained by him while employed under the agreement. In addition, the employment agreement contains payment obligations that may be triggered by a termination after a Change of Control as defined therein. See “- Potential Payments Upon Change of Control or Termination.”
Under the employment agreement entered into with Mr. Stallings, our General Partner may be required to pay certain amounts upon a change of control of us or our General Partner or upon the termination of Mr. Stallings in certain circumstances. Except in the event of termination for Cause, termination by Mr. Stallings other than for Good Reason, or termination after the expiration of the term of the employment agreement, the employment agreements provides for payment of any unpaid base salary and vested benefits under any incentive plans, a lump sum payment equal to twelve months of base
68
salary and continued participation in our General Partner’s welfare benefit programs for the longer of the remainder of the term of the employment agreement or one year after termination.
The employment agreement also provides that if, within one year after a Change of Control occurs, Mr. Stallings is terminated by our General Partner without Cause or Mr. Stallings terminates the agreement for Good Reason, he will be entitled to payment of any unpaid base salary and vested benefits under any incentive plans, a lump sum payment equal to 24 months of base salary and continued participation in our General Partner’s welfare benefit programs for the longer of the remainder of the term of the employment agreement or one year after termination. Based upon Mr. Stallings’ current base salary, the maximum amount of the lump sum severance payment would be approximately $0.6 million, in addition to continued participation in the General Partner’s welfare benefit programs and the amounts of earned but unpaid base salary and benefits under any incentive plans.
For purposes of the employment agreements with Mr. Stallings:
“Cause” means (i) conviction of Mr. Stallings by a court of competent jurisdiction of any felony or a crime involving moral turpitude; (ii) Mr. Stallings’ willful and intentional failure or willful intentional refusal to follow reasonable and lawful instructions of the Board; (iii) Mr. Stallings’ material breach or default in the performance of his obligations under the employment agreement; or (iv) Mr. Stallings’ act of misappropriation, embezzlement, intentional fraud or similar conduct involving our General Partner.
“Good Reason” means (i) a material reduction in Mr. Stallings’ base salary; (ii) a material diminution of Mr. Stallings’ duties, authority or responsibilities as in effect immediately prior to such diminution; or (iii) the relocation of Mr. Stallings’ principal work location to a location more than 50 miles from its current location.
“Change of Control” means any of the following events: (i) any person or group other than Charlesbank Capital Partners, LLC and/or Vitol Holding B.V., or their respective affiliates shall become the beneficial owner, by way of merger, consolidation, recapitalization, reorganization or otherwise, of 50% or more of the combined voting power of the equity interests in us or our General Partner; (ii) our limited partners approve, in one or a series of transactions, a plan of complete liquidation of us; (iii) the sale or other disposition either by our General Partner or us of all or substantially all of the assets of our General Partner or us in one or more transactions to any person other than our General Partner and its affiliates; or (iv) a transaction resulting in a person other than our General Partner or an affiliate of our General Partner being our general partner.
Employment Agreement of Mr. Paul. The employment agreement of Mr. Paul has a three year term that commenced in June 2013. The employment agreement provides for the initial annual base salary described above. The employment agreement provides that Mr. Paul is eligible to participate in any employee benefit plans maintained by the General Partner and is entitled to reimbursement for certain out-of-pocket expenses. Mr. Paul has agreed not to disclose any confidential information obtained by him while employed under his employment agreement and has agreed to a one year non-solicitation covenant.
Except in the event of termination for Cause (as defined below), termination by Mr. Paul other than for Good Reason (as defined below), termination after the expiration of the term of Mr. Paul’s employment agreement or termination due to death or disability, Mr. Paul’s employment agreement provides for payment of any unpaid base salary and vested benefits under any incentive plans, a lump sum payment equal to the amount of Mr. Paul’s base salary that would have been payable for the lesser of (i) a 24-month period or (ii) the remainder of the term of his employment agreement, and Mr. Paul will also be entitled to continued participation in our General Partner’s welfare benefit programs for a period of eighteen months following termination. Based upon Mr. Paul’s current base salary, the maximum amount of the lump sum severance payment would be approximately $0.2 million, in addition to continued participation in the General Partner’s welfare benefit programs and the amounts of earned but unpaid base salary and benefits under any incentive plans.
For purposes of the employment agreement with Mr. Paul:
“Cause” means (i) conviction of Mr. Paul by a court of competent jurisdiction of any felony or a crime involving moral turpitude; (ii) Mr. Paul’s willful and intentional failure or willful intentional refusal to follow reasonable and lawful instructions of the Board; (iii) Mr. Paul’s material breach or default in the performance of his obligations under the employment agreement; or (iv) Mr. Paul’s act of misappropriation, embezzlement, intentional fraud or similar conduct involving the General Partner.
“Good Reason” means (i) a material reduction in Mr. Paul’s base salary; (ii) a material diminution of Mr. Paul’s duties, authority or responsibilities as in effect immediately prior to such diminution; or (iii) the relocation of Mr. Paul’s principal work location to a location more than 50 miles from its current location.
69
Potential Payments Upon Change of Control.
Employment Agreements. The employment agreements with Messrs. Hurley and Stallings contain provisions that could result in the payment of amounts to such individuals upon a termination or change of control (as defined in such employment agreements).
As described above, under Messrs. Hurley’s and Stallings’ employment agreements, the applicable NEO is entitled to certain payments if the employment agreement is terminated in certain circumstances as described above. Upon a termination, Messrs. Hurley and Stallings would be entitled to a lump sum payment of approximately $0.4 million and approximately $0.3 million, respectively, in addition to continued participation in our General Partner’s welfare benefit programs and the amounts of unpaid base salary and benefits under any incentive plans. In addition, as described above, Messrs. Hurley’s and Stallings’ employment agreements provide that, if such individual's employment is terminated in certain circumstances within one year, in the case of Mr. Stallings, or eighteen months, in the case of Mr. Hurley, after a Change of Control (as defined in the applicable agreement and described above) occurs, he will be entitled to certain payments as described above. Upon such an event, Messrs. Hurley and Stallings would be entitled to a lump sum payment of approximately $0.8 million and approximately $0.6 million, respectively, in addition to continued participation in our General Partner’s welfare benefit programs and the amounts of earned but unpaid base salary and benefits under any incentive plans.
LTIP Awards. The restricted and phantom units granted under the Long-Term Incentive Plan will vest automatically upon a change of control (as defined in the Long-Term Incentive Plan) of us or our General Partner, subject to any contrary provisions in the award agreement.
Long-Term Incentive Plan
General. Our General Partner has adopted the Long-Term Incentive Plan for employees, consultants and directors of our General Partner and its affiliates who perform services for us. The summary of the Long-Term Incentive Plan contained herein does not purport to be complete and is qualified in its entirety by reference to the Long-Term Incentive Plan. The Long-Term Incentive Plan provides for the grant of unit awards, restricted units, phantom units, unit options, unit appreciation rights and distribution equivalent rights. Effective April 29, 2014, the Partnership’s unitholders voted to approve an amendment to the Long-Term Incentive Plan, which increased the number of common units reserved for issuance thereunder by 1,500,000 common units, from 2,600,000 common units to 4,100,000 common units, subject to adjustment for certain events. Units that are canceled, forfeited or withheld to satisfy our General Partner’s tax withholding obligations are available for delivery pursuant to other awards. The Long-Term Incentive Plan is administered by the compensation committee of the Board. The Long-Term Incentive Plan has been designed to furnish additional compensation to employees, consultants and directors and to align their economic interests with those of other common unitholders.
Unit Awards. The compensation committee may grant unit awards to eligible individuals under the Long-Term Incentive Plan. A unit award is an award of common units that are fully vested upon grant and not subject to forfeiture.
Restricted Units and Phantom Units. A restricted unit is a common unit that is subject to forfeiture. Upon vesting, the forfeiture restrictions lapse and the recipient holds a common unit that is not subject to forfeiture. A phantom unit is a notional unit that entitles the grantee to receive a common unit upon the vesting of the phantom unit or, in the discretion of the compensation committee, cash equal to the fair market value of a common unit. The compensation committee may make grants of restricted units and phantom units under the Long-Term Incentive Plan to eligible individuals containing such terms, consistent with the Long-Term Incentive Plan, as the compensation committee may determine, including the period over which restricted units and phantom units granted will vest. The compensation committee may, in its discretion, base vesting on the grantee’s completion of a period of service or upon the achievement of specified performance goals or other criteria.
Distributions made by us with respect to awards of restricted units may, in the compensation committee’s discretion, be subject to the same vesting requirements as the restricted units. The compensation committee, in its discretion, may also grant tandem distribution equivalent rights with respect to phantom units.
We intend for restricted units and phantom units granted under the Long-Term Incentive Plan to serve as a means of incentive compensation for performance and not primarily as an opportunity to participate in the equity appreciation of the common units. Therefore, participants will not pay any consideration for the common units they receive with respect to these types of awards, and neither we nor our General Partner will receive remuneration for the units delivered with respect to these awards.
70
Options and Unit Appreciation Rights. The Long-Term Incentive Plan also permits the grant of options covering common units and unit appreciation rights. Options represent the right to purchase a number of common units at a specified exercise price. Unit appreciation rights represent the right to receive the appreciation in the value of a number of common units over a specified exercise price, either in cash or in common units as determined by the compensation committee. Options and unit appreciation rights may be granted to such eligible individuals and with such terms as the compensation committee may determine, consistent with the Long-Term Incentive Plan; however, an option or unit appreciation right must have an exercise price equal to the fair market value of a common unit on the date of grant.
Distribution Equivalent Rights. Distribution equivalent rights are rights to receive all or a portion of the distributions otherwise payable on units during a specified time. Distribution equivalent rights may be granted alone or in combination with another award.
By giving participants the benefit of distributions paid to unitholders generally, grants of distribution equivalent rights provide an incentive for participants to operate our business in a manner that allows our partnership to provide increasing partnership distributions. Typically, distribution equivalent rights will be granted in tandem with a phantom unit, so that the amount of the participant’s compensation is tied to both the market value of our units and the distributions that unitholders receive while the award is outstanding. We believe this aligns the participant’s incentives directly to the measures that drive returns for our unitholders.
Source of Common Units; Cost. Common units to be delivered with respect to awards may be common units acquired by our General Partner on the open market, common units already owned by our General Partner, common units acquired by our General Partner directly from us or any other person or any combination of the foregoing. Our General Partner will be entitled to reimbursement by us for the cost incurred in acquiring common units. With respect to options, our General Partner will be entitled to reimbursement by us for the difference between the cost incurred by our General Partner in acquiring these units and the proceeds received from an optionee at the time of exercise. Thus, we will bear the cost of the options. If we issue new units with respect to these awards, the total number of units outstanding will increase, and our General Partner will remit the proceeds it receives from a participant, if any, upon exercise of an award to us. With respect to any awards settled in cash, our General Partner will be entitled to reimbursement by us for the amount of the cash settlement.
Amendment or Termination of Long-Term Incentive Plan. The Board, in its discretion, may terminate the Long-Term Incentive Plan at any time with respect to the units for which a grant has not theretofore been made. The Long-Term Incentive Plan will automatically terminate on the earlier of the 10th anniversary of the date it was initially approved by our unitholders or when units are no longer available for delivery pursuant to awards under the Long-Term Incentive Plan. The Board will also have the right to alter or amend the Long-Term Incentive Plan or any part of it from time to time and the compensation committee may amend any award; provided, however, that no change in any outstanding award may be made that would materially impair the rights of the participant without the consent of the affected participant.
Unit Purchase Plan
On June 23, 2014, the Partnership’s unitholders approved the Blueknight Energy Partners, L.P. Employee Unit Purchase Plan (the “Unit Purchase Plan”). The Unit Purchase Plan provides employees of the General Partner and its affiliates who perform services for the Partnership the opportunity to acquire or increase their ownership of common units. Eligible employees who enroll in the Unit Purchase Plan may elect to have a designated whole percentage (ranging from 1% to 15%) of their eligible compensation for each pay period withheld for the purchase of common units. A maximum of 1,000,000 common units may be delivered under the Unit Purchase Plan, subject to adjustment for a recapitalization, split, reorganization or similar event pursuant to the terms of the Unit Purchase Plan. The purpose of the Unit Purchase Plan is to promote our interests by providing employees of the General Partner and its affiliates a cost-effective program to enable them to acquire or increase their ownership of common units and to provide a means whereby such individuals may develop a sense of proprietorship and personal involvement in our development and financial success, and to encourage them to devote their best efforts to our business, thereby advancing our interests. As of December 31, 2015, 30,075 common units have been delivered under the Unit Purchase Plan.
71
Summary Compensation Table
The following table summarizes the compensation of our NEOs for the years ended 2015, 2014 and 2013.
Name and Position(1) | Year | Salary ($)(2) | Bonus ($) | Stock Awards ($)(3) | Option Awards ($) | Non-Equity Incentive Compensation ($) | All Other Compensation ($)(4)(5) | Total ($) |
Mark A. Hurley Chief Executive Officer | 2015 | 442,500 | 450,000 | — | — | — | 43,929 | 936,429 |
2014 | 432,917 | 400,000 | — | — | — | 37,122 | 870,039 | |
2013 | 425,000 | 440,000 | — | — | — | 34,153 | 899,153 | |
Alex G. Stallings Chief Financial Officer and Secretary | 2015 | 317,850 | 145,000 | 120,187 | — | — | 63,228 | 646,265 |
2014 | 310,750 | 130,000 | 154,826 | — | — | 66,760 | 662,336 | |
2013 | 304,503 | 160,000 | 146,738 | — | — | 69,102 | 680,343 | |
Jeffery A. Speer Chief Operating Officer | 2015 | 226,105 | 135,000 | 106,951 | — | — | 59,535 | 527,591 |
2014 | 219,083 | 110,200 | 149,834 | — | — | 57,322 | 536,439 | |
2013 | 213,000 | 135,000 | 141,304 | — | — | 54,020 | 543,324 | |
Chris A. Paul Chief Legal Officer and General Counsel | 2015 | 283,275 | 125,000 | 115,814 | — | — | 50,524 | 574,613 |
2014 | 276,412 | 115,000 | 154,826 | — | — | 35,584 | 581,822 | |
2013 | 146,250 | 135,000 | — | — | — | 19,336 | 300,586 | |
Brian L. Melton Vice President Pipeline Marketing & Business Development | 2015 | 235,250 | 110,000 | 101,858 | — | — | 90,154 | 537,262 |
2014 | 230,000 | 105,800 | 114,872 | — | — | 125,911 | 576,583 | |
2013 | 9,583 | 100,000 | — | — | — | 740 | 110,323 | |
_______________
(1) | Mr. Hurley was appointed as our General Partner’s Chief Executive Officer in September 2012. Mr. Stallings has served as our General Partner’s Chief Financial Officer and Secretary since March 2009. Mr. Speer served as the Vice President of Operations for one of our subsidiaries prior to February 2010 and has served as our General Partner’s Senior Vice President - Operations since February 2010 and Chief Operating Officer since July 2013. Mr. Paul has served as our General Partner’s General Counsel since June 2013 and was appointed as our General Partner’s Chief Legal Officer in October 2013. Mr. Melton has served as our General Partner’s Vice President Pipeline Marketing & Business Development since December 2013. |
(2) | In March 2013, Messrs. Stallings’ and Speer’s annual base salary was increased to $306,000 and $214,000, respectively. In March 2014, Messrs. Hurley’s, Stallings’, Speer’s, Paul’s and Melton’s annual base salary was increased to $435,000, $312,000, $220,420, $278,100 and $230,000, respectively. In March 2015, Messrs. Hurley’s, Stallings’, Speer’s, Paul’s and Melton’s annual base salary was increased to $445,000, $319,800, $228,000, $285,000 and $237,000, respectively. |
(3) | Dollar amounts represent the grant date fair value of awards granted in each year with respect to phantom unit grants under the Long-Term Incentive Plan. See Note 14 to our consolidated financial statements for assumptions used in calculating these amounts. |
(4) | We provide distribution equivalent rights (“DERs”) under the Long-Term Incentive Plan, auto allowances, reimbursement of certain deductibles and co-payments for medical expenses and discretionary matching and profit sharing contributions to our 401(k) plan to our NEOs. In 2015, payments of $25,740, $24,319, $16,018 and $12,764 related to the DERs were made to Messrs. Stallings, Speer, Paul and Melton, respectively. In 2015, auto allowances of $10,800 were paid each to Messrs. Hurley, Stallings, Speer, Paul and Melton. In 2015, matching and profit sharing contributions to our 401(k) plan of $24,351, $24,351, $20,653, $17,358, and $16,941 were made for Messrs. Hurley, Stallings, Speer, Paul and Melton, respectively. |
(5) | In connection with his appointment as Vice President Pipeline Marketing & Business Development, Mr. Melton received a signing bonus of $45,000 and a relocation benefit of $42,500, both of which were paid in 2014, and a signing bonus of $45,000 paid in 2015. |
Pension Benefits
We do not have a pension plan in which our named executive officers are eligible to participate.
Non-Qualified Deferred Compensation
We do not have a non-qualified deferred compensation plan.
72
Grants of Plan-Based Awards Table for Fiscal Year 2015
The following tables provide information concerning each grant of an award made to a NEO during 2015, including, but not limited to, awards made under our General Partner’s Long-Term Incentive Plan.
Estimated Future Payments Under Non-Equity Incentive Plan Awards | Estimated Future Payouts Under Equity Incentive Plan Awards | |||||||||||||
Name | Grant Date | Threshold ($) | Target ($) | Maximum ($) | Threshold ($) | Target ($) | Maximum ($) | All Other Unit Awards: Number of Units (#)(1)(2) | All Other Unit Awards: Number of Securities Underlying Options (#) | Exercise or Base Price of Option Awards ($/Sh) | Grant Date Fair Value of Unit and Option Awards ($) | |||
Alex G. Stallings | March 6, 2015 | — | — | — | — | — | — | 15,528 | — | — | 120,187 | |||
Jeffrey A. Speer | March 6, 2015 | — | — | — | — | — | — | 13,818 | — | — | 106,951 | |||
Chris A. Paul | March 6, 2015 | — | — | — | — | — | — | 14,963 | — | — | 115,814 | |||
Brian L. Melton | March 6, 2015 | 13,160 | — | — | 101,858 | |||||||||
____________________
(1) | This amount represents grants of phantom units under our General Partner’s Long-Term Incentive Plan. See Note 14 to our Consolidated Financial Statements. |
(2) | No awards were granted to Mr. Hurley in 2015. |
Outstanding Equity Awards at Fiscal Year-End 2015
The following tables provide information concerning all outstanding equity awards made to a NEO as of December 31, 2015, including, but not limited to, awards made under our General Partner’s Long-Term Incentive Plan.
Option Awards | Stock Awards | ||||||||||||||||||||
Name | Number of Securities Underlying Unexercised Options (#) Exercisable | Number of Securities Underlying Unexercised Options (#) Unexercisable | Equity Incentive Plan Awards: Number of Securities Underlying Unexercised Unearned Options (#) | Option Exercise Price ($) | Option Expiration Date | Number of Units That Have Not Vested (#) | Market Value of Units That Have Not Vested ($) | Equity Incentive Plan Awards: Number of Unearned Units or Other Rights That Have Not Vested (#) | Equity Incentive Plan Awards: Market or Payout Value of Unearned Units or Other Rights That Have Not Vested ($) | ||||||||||||
Mark A. Hurley | — | — | — | — | — | — | — | 200,000 | (1) | 1,068,961 | (2) | ||||||||||
Alex G. Stallings | — | — | — | — | — | — | — | 16,770 | (3) | 111,521 | (4) | ||||||||||
— | — | — | — | — | — | — | 17,089 | (5) | 113,642 | (4) | |||||||||||
15,528 | (6) | 87,267 | (4) | ||||||||||||||||||
Jeffery A. Speer | — | — | — | — | — | — | — | 16,149 | (3) | 107,391 | (4) | ||||||||||
— | — | — | — | — | — | — | 16,538 | (5) | 109,978 | (4) | |||||||||||
13,818 | (6) | 77,657 | (4) | ||||||||||||||||||
Chris A. Paul | — | — | — | — | — | — | — | 17,089 | (5) | 113,642 | (4) | ||||||||||
14,963 | (6) | 84,092 | (4) | ||||||||||||||||||
Brian L. Melton | — | — | — | — | — | — | — | 12,679 | (5) | 84,315 | (4) | ||||||||||
13,160 | (6) | 73,959 | (4) | ||||||||||||||||||
____________________
(1) | Represents phantom units granted in 2012 under our General Partner’s Long-Term Incentive Plan. These phantom units will vest ratably over five years, with 20% vesting on each anniversary of the September 20, 2012 grant date. These phantom units do not contain distribution equivalent rights. |
(2) | Market value of awards reported in this column is calculated as the product of the closing market price of $5.62 of the Partnership’s common units at December 31, 2015, less the present value of the estimated distributions to be paid to holders of an outstanding common unit prior to the vesting of the underlying award, and the number of phantom units outstanding at December 31, 2015. |
73
(3) | Represents phantom units granted in 2013 under our General Partner’s Long-Term Incentive Plan. These phantom units vested on January 1, 2016. All of the distribution equivalent rights associated with these phantom units are currently payable. |
(4) | Market value of awards reported in this column is calculated as the product of the closing market price of $5.62 of the Partnership’s common units at December 31, 2015 and the number of phantom units outstanding at December 31, 2015. |
(5) | Represents phantom units granted in 2014 under our General Partner’s Long-Term Incentive Plan. These phantom units will vest on January 1, 2017. All of the distribution equivalent rights associated with these phantom units are currently payable. |
(6) | Represents phantom units granted in 2015 under our General Partner’s Long-Term Incentive Plan. These phantom units will vest on January 1, 2018. All of the distribution equivalent rights associated with these phantom units are currently payable. |
Option Exercises and Stock Vested Table for Fiscal Year 2015
The following table provides information regarding each vesting of phantom units held by our NEOs in 2015. Our NEOs have not been granted stock option awards.
Stock Awards(1) | ||||||
Name | Number of Shares Acquired on Vesting (#) | Value Realized on Vesting ($) | ||||
Mark A. Hurley | 100,000 | 594,000 | (2) | |||
Alex G. Stallings | 20,000 | 122,200 | (3) | |||
Jeffrey A. Speer | 20,000 | 122,200 | (3) | |||
____________________
(1) | No awards vested in 2015 for Messrs. Paul or Melton. |
(2) | This value is based on the average of the high and low trading prices of our common unit on September 28, 2015, the date of issuance of such common units. |
(3) | This value is based on the average of the high and low trading prices of our common units on January 20, 2015, the date of issuance of such common units. |
Director Compensation for Fiscal Year 2015
Name | Fees Earned or Paid in Cash ($) | Stock Awards(3) ($) | Option Awards ($) | Non-Equity Incentive Plan Compensation ($) | Change in Pension Value and Nonqualified Deferred Compensation Earnings ($) | All Other Compensation ($) | Total ($) |
Duke R. Ligon | 119,000 | 55,000 | — | — | — | — | 174,000 |
Miguel A. (“Mike”) Loya(1) | — | — | — | — | — | — | — |
Steven M. Bradshaw | 119,000 | 45,000 | — | — | — | — | 164,000 |
John A. Shapiro | 119,000 | 45,000 | — | — | — | — | 164,000 |
Michael R. Eisenson(2) | — | — | — | — | — | — | — |
Jon M. Biotti(2) | — | — | — | — | — | — | — |
Francis Brenner(1) | — | — | — | — | — | — | — |
____________________
(1) | Affiliated with Vitol. |
(2) | Affiliated with Charlesbank. |
(3) | These amounts represent the grant date fair value of restricted and unrestricted units awarded under the Long-Term Incentive Plan. The grant date fair value of these awards is computed in accordance with ASC 718 Compensation -Stock Compensation. See Note 14 to our consolidated financial statements for assumptions used in calculating these amounts. |
Directors who are not officers or employees of any controlling entity or their affiliates receive compensation for attending meetings of the Board and committees thereof. Such directors receive (i) $75,000 per year as an annual retainer fee paid in cash, (ii) $5,000 per year for each Board committee on which such director serves (except that the chairperson of each committee will receive $10,000 per year for serving as chairperson of such committee payable in unrestricted common units) payable in unrestricted common units, (iii) $10,000 per year if Chairman of the Board payable in unrestricted common units, (iv) $2,000 per diem for each Board or committee meeting attended, (v) 5,000 restricted units upon becoming a director, vesting in one-third increments over a three-year period, (vi) $25,000 of restricted units based on the grant date fair value on each anniversary of becoming a director, vesting in one-third increments over a three-year period, (vii) reimbursement for out-of-pocket expenses associated with attending Board or committee meetings and (viii) director and officer liability insurance
74
coverage. In addition, each director is fully indemnified by us for actions associated with being a director to the fullest extent permitted under Delaware law.
Compensation Committee Interlocks and Insider Participation
During the year ended December 31, 2015, the compensation committee of our General Partner was comprised of Messrs. Ligon, Bradshaw and Shapiro (Chairman). No member of the compensation committee was an officer or employee of our General Partner.
Compensation Committee Report
The compensation committee of the general partner of Blueknight Energy Partners, L.P. has reviewed and discussed the Compensation Discussion and Analysis section of this report required by Item 402(b) of Regulation S-K with management of the general partner of Blueknight Energy Partners, L.P. and, based on that review and discussion, has recommended that the Compensation Discussion and Analysis be included in this Annual Report on Form 10-K.
The Compensation Committee
John A. Shapiro, Committee Chair
Steven M. Bradshaw
Duke R. Ligon
Item 12. Security Ownership of Certain Beneficial Owners and Management and Related Unitholder Matters.
Security Ownership of Certain Beneficial Owners and Management
The following table sets forth the beneficial ownership of our units as of March 3, 2016 held by:
• | each person or group of persons who beneficially own 5% or more of the then outstanding common units; |
• | all of the directors of our General Partner; |
• | each NEO of our General Partner; and |
• | all current directors and NEOs of our General Partner as a group. |
Except as indicated by footnote, the persons named in the table below have sole voting and investment power with respect to all units shown as beneficially owned by them, subject to community property laws where applicable. Percentage of total common and Preferred Units beneficially owned is based on 33,198,339 common units and 30,158,619 Preferred Units outstanding as of March 3, 2016.
75
Name of Beneficial Owner(1) | Common Units Beneficially Owned | Percentage of Common Units Beneficially Owned | Preferred Units Beneficially Owned | Percentage of Preferred Units Beneficially Owned | Percentage of Total Common and Preferred Units Beneficially Owned | ||
Blueknight Energy Holding, Inc.(2) | — | — | 9,156,484 | 30.4% | 14.5% | ||
CB-Blueknight, LLC(3) | — | — | 9,156,484 | 30.4% | 14.5% | ||
Mark A. Hurley(6) | 223,383 | * | — | — | * | ||
Alex G. Stallings(4)(6) | 103,635 | * | 20,000 | * | * | ||
James R. Griffin(6) | 50,079 | * | — | — | * | ||
Jeffery A. Speer(6) | 35,106 | * | — | — | * | ||
Chris A. Paul | 4,294 | * | — | — | * | ||
Brian L. Melton(6) | 5,150 | * | 400 | * | * | ||
Duke R. Ligon(5) | 31,547 | * | 4,455 | * | * | ||
Steven M. Bradshaw(5) | 20,031 | * | 3,565 | * | * | ||
John A. Shapiro(5) | 24,071 | * | 2,975 | * | * | ||
Miguel A. (“Mike”) Loya(2)(7) | — | — | — | — | — | ||
Michael R. Eisenson(3)(8) | — | — | — | — | — | ||
Jon M. Biotti(3)(8) | — | — | — | — | — | ||
Francis Brenner(7) | — | — | — | — | — | ||
MSD Capital, L.P.(9) | 3,576,944 | 10.8% | 1,935,842 | 6.4% | 8.7% | ||
Swank Capital, L.L.C.(10) | 4,450,828 | 13.4% | 3,064,648 | 10.2% | 11.9% | ||
Neuberger Berman Group LLC(11) | 5,551,721 | 16.7% | — | — | 8.8% | ||
DG Capital Management, Inc.(12) | 2,849,595 | 8.6% | — | — | 4.5% | ||
Clearbridge Investments, LLC(13) | 2,328,539 | 7.0% | — | — | 3.7% | ||
All current executive officers and directors as a group (13 persons) | 497,296 | 1.5% | 31,395 | * | * | ||
_______________
* | Less than 1%. |
(1) | Unless otherwise indicated, the address for all beneficial owners in this table is 6060 American Plaza, Suite 600, Tulsa, Oklahoma 74135. |
(2) | Blueknight Energy Holding, Inc. is a subsidiary of Vitol. The address for Vitol is 1100 Louisiana Street, Suite 5500, Houston, Texas 77002. Blueknight Energy Holding, Inc. owns 50% of Blueknight GP Holdings, LLC, which owns the membership interests in our General Partner. |
(3) | CB-Blueknight, LLC is a subsidiary of Charlesbank. The address for Charlesbank is 200 Clarendon Street, 54th Floor, Boston, Massachusetts. CB-Blueknight, LLC owns 50% of Blueknight GP Holdings, LLC, which owns the membership interests in our General Partner. |
(4) | Mr. Stallings has pledged as collateral to a bank 78,054 common units and 20,000 preferred units. |
(5) | Does not include unvested restricted units granted under the Long-Term Incentive Plan, none of which will vest within 60 days of the date hereof. |
(6) | Does not include unvested phantom units granted under the Long-Term Incentive Plan, none of which will vest within 60 days of the date hereof. |
(7) | Messrs. Loya and Brenner are affiliated with Vitol. |
(8) | Messrs. Eisenson and Biotti are affiliated with Charlesbank. |
(9) | Based on a Schedule 13D, filed June 8, 2012 by MSDC Management , L.P. with the SEC. The filing is made jointly with MSD Torchlight Partners, L.P. and Marc R. Lisker. The filers report that they have shared voting power with respect to the 3,576,944 common units and 1,935,842 preferred units and that their address is 645 Fifth Avenue, 21st Floor, New York, New York 10022. |
(10) | Common shares based on a Schedule 13G/A filed on February 13, 2015 with the SEC by Cushing MLP Asset Management, L.P. The filing was made jointly with Cushing MLP Asset Management, LP and Jerry V. Swank, and reported that they have shared voting power with respect to the 4,450,828 common units. Preferred shares based on a Schedule 13G/A filed on February 10, 2016 with the SEC by Cushing MLP Asset Management, L.P. The filing was made jointly with Cushing MLP Asset Management, L.P. and Jerry V. Swank, and reported that they have shared voting power with respect to the3,064,648 preferred units. Both filings reported that their address is 8117 Preston Road, Suite 440, Dallas, Texas, 75225. |
(11) | Based on a Schedule 13G, filed February 9, 2016 by Neuberger Berman Group LLC with the SEC. The filing is made jointly with Neuberger Berman LLC. The filers report that they have shared voting power with respect to 5,321,920 common units and shared dispositive power with respect to 5,551,721 common units. Their address as reported in such Schedule 13G is 605 Third Avenue, New York, New York 10158. |
(12) | Based on a Schedule 13G, filed February 8, 2016 by DG Capital Management, LLC with the SEC. This filing is made jointly with Dov Gertzulin. The filers report that they each have shared voting power with respect to 2,849,595 common units. Their address as reported on such Schedule 13G is 460 Park Avenue, 22nd Floor, New York, NY 10022. |
(13) | Based on a Schedule 13G, filed February 16, 2016 by Clearbridge Investments, LLC with the SEC. The filer’s address as reported in such Schedule 13G is 620 8th Avenue, New York, New York 10018. |
76
Securities Authorized for Issuance under Equity Compensation Plans
Equity Compensation Plan Information(1) | ||||||
(a) Number of securities to be issued upon exercise of outstanding options, warrants and rights | (b) Weighted-average exercise price of outstanding options, warrants and rights | (c) Number of securities remaining available for future issuance under equity compensation plans (excluding securities reflected in column (a)) | ||||
Equity compensation plans approved by security holders | 718,226 | $— | 2,931,986 | |||
Equity compensation plans not approved by security holders | — | N/A | N/A | |||
Total | 718,226 | $— | 2,931,986 | |||
________________
(1) | Our General Partner has adopted and maintains the Long-Term Incentive Plan for employees, consultants and directors of our General Partner and its affiliates who perform services for us. An aggregate of 695,603 phantom units that have been granted to our executive officers and other employees remain outstanding and have not yet vested. Excluding phantom unit grants, the responses are as follows: (a) 22,623, (b) $0 and (c) 3,627,589. No value is shown in column (b) of the table because the phantom units and restricted units do not have an exercise price. For more information about the Long-Term Incentive Plan, please see “Item 11-Executive Compensation-Compensation Discussion and Analysis-Long-Term Incentive Plan.” In addition, on June 23, 2014, our unitholders approved the Unit Purchase Plan. A maximum of 1,000,000 common units may be delivered under the Unit Purchase Plan, subject to adjustment for a recapitalization, split, reorganization or similar event pursuant to the terms of the Unit Purchase Plan. As of December 31, 2015, 30,075 common units had been delivered under the Unit Purchase Plan. For more information about the Unit Purchase Plan, please see “Item 11-Executive Compensation-Compensation Discussion and Analysis-Unit Purchase Plan.” |
Item 13. Certain Relationships and Related Transactions, and Director Independence.
Distributions and Payments to Our General Partner and Its Affiliates
Our General Partner is owned by Vitol and Charlesbank, which each own 9,156,484 of the 30,159,958 outstanding Preferred Units, representing an aggregate 29% limited partner interest in us as of March 3, 2016. In addition, our General Partner owns a 1.8% general partner interest in us and the incentive distribution rights. For a description of the distributions and payments our General Partner is entitled to receive, see “Item 5-Market for Registrant’s Common Equity, Related Unitholder Matters and Issuer Purchases of Equity Securities-General Partner Interest and Incentive Distribution Rights.”
Agreements with Vitol
Vitol Storage Agreements
In recent years, a significant portion of our crude oil storage capacity has been dedicated to Vitol under multiple agreements. As of December 31, 2013, 2014 and 2015, 4.1 million barrels, 3.1 million barrels and 2.2 million barrels of storage capacity, respectively, were dedicated to Vitol under these storage agreements. As of December 31, 2015, 2.2 million barrels of storage capacity were dedicated to Vitol under one storage agreement. Service revenues under these agreements are based on the barrels of storage capacity dedicated to Vitol under the applicable agreement at rates that, we believe, are fair and reasonable to us and our unitholders and are comparable with the rates we charge third parties. The Board’s conflicts committee reviewed and approved these agreements in accordance with our procedures for approval of related party transactions and the provisions of the partnership agreement. We generated revenues under these agreements of approximately $17.6 million, $12.0 million and $9.4 million for the years ended December 31, 2013, 2014 and 2014, respectively.
As of March 3, 2016, 2.2 million barrels of storage capacity were dedicated to Vitol under a crude oil storage agreement with the current term expiring in May 2017.
Vitol Operating and Maintenance Agreement
In August 2011, we entered into an operating and maintenance agreement (the “Vitol O&M Agreement”) with Vitol relating to the operation and maintenance of Vitol’s crude oil terminal located in Midland, Texas (the “Midland Terminal”). Pursuant to the Vitol O&M Agreement, we provide certain operating and maintenance services with respect to the Midland Terminal. The term of the Vitol O&M Agreement commenced on September 1, 2012 and shall continue for five years unless terminated by either party, as provided in the agreement. During the years ended December 31, 2013, 2014 and 2015, we
77
generated revenues of $0.8 million, $1.6 million and $2.5 million, respectively, under the Vitol O&M Agreement. The Vitol O&M Agreement was terminated in July 2015. Revenues for the year ended December 31, 2015 include a termination fee of $1.2 million and transition services fees of $0.1 million. We believe that the rates we charged Vitol under this agreement were fair and reasonable to us and our unitholders and were comparable with the rates we charge third parties. The Board’s conflicts committee reviewed and approved this agreement in accordance with our procedures for approval of related party transactions and the provisions of our partnership agreement.
Vitol Shared Services Agreement
In August 2012, we entered into a shared services agreement (the “Vitol Shared Services Agreement”) with Vitol pursuant to which we provide Vitol certain strategic assessment, economic evaluation and project design services. The initial one-year term of the Vitol Shared Services Agreement commenced on August 1, 2012 and automatically renewed in August 2013 and August 2014 for one year terms. The Vitol Shared Services Agreement renews annually unless terminated by either party, as provided in the agreement. During the years ended December 31, 2013, 2014 and 2015, the Partnership generated revenues of $0.2 million, $0.1 million and less than $0.1 million, respectively, under the Vitol Shared Services Agreement. We believe that the rates we charge Vitol under this agreement are fair and reasonable to us and our unitholders. The Board’s conflicts committee reviewed and approved this agreement in accordance with our procedures for approval of related party transactions and the provisions of our partnership agreement.
Eaglebine Crude Throughput and Deficiency Agreement
On August 29, 2014 we entered into a Crude Oil Throughput and Deficiency Agreement with Eaglebine Crude Oil Marketing LLC (“Eaglebine Crude”), a joint venture partly owned by Vitol Inc., effective as of August 28, 2014, pursuant to which we will provide certain crude oil transportation services on the Knight Warrior Pipeline for Eaglebine Crude. Eaglebine Crude will pay throughput fees under the Agreement based on Eaglebine Crude’s per barrel daily volume commitment of at least 40,000 barrels per day (subject to possible adjustments under certain conditions). The term of the Agreement is for five years beginning on the first day of the month following the date that is thirty days after the Partnership notifies Eaglebine Crude that the Knight Warrior Pipeline is complete. The Board’s conflicts committee reviewed and approved this agreement, including the amendments thereto, in accordance with our procedures for approval of related party transactions and the provisions of the partnership agreement.
While the Knight Warrior Pipeline continues to be in our plans, the project is currently on hold and we are approaching it very cautiously as a result of the significant recent decline in the market price for crude oil, reduced area crude oil rig counts and crude oil production as well as the increased cost of capital. The Eaglebine Crude contract is not impacted by the project delay.
Agreements with Advantage Pipeline
Advantage Pipeline Operating and Administrative Services Agreement
We have a 30% ownership interest in Advantage Pipeline. In January 2013, we entered into an operating and administrative services agreement with Advantage Pipeline (the “Advantage O&A Services Agreement”) pursuant to which we operate Advantage Pipeline’s Pecos River Pipeline in west Texas. Under the Advantage O&A Services Agreement, the Partnership we also provide certain administrative services to Advantage Pipeline. The initial term of the Advantage O&A Services Agreement commenced on January 31, 2013 and shall continue for ten years, with us and Advantage Pipeline each having an option to extend the term for an additional five years. During the years ended December 31, 2013, 2014 and 2015, under this agreement we earned revenues of $0.3 million, $0.5 million and $0.5 million, respectively.
Indemnification of Directors and Officers
Under our partnership agreement, in most circumstances, we will indemnify the following persons, to the fullest extent permitted by law, from and against all losses, claims, damages or similar events:
• | our General Partner; |
• | any departing general partner; |
• | any person who is or was an affiliate of a general partner or any departing general partner; |
• | any person who is or was a director, officer, member, partner, fiduciary or trustee of any entity set forth in the preceding three bullet points; |
78
• | any person who is or was serving as director, officer, member, partner, fiduciary or trustee of another person at the request of our General Partner or any departing general partner; and |
• | any person designated by our General Partner. |
Any indemnification under these provisions will only be out of our assets. Unless it otherwise agrees, our General Partner will not be liable for, or have any obligation to contribute or lend funds or assets to us to enable us to effectuate, indemnification. We may purchase insurance against liabilities asserted against us and expenses incurred by persons for our activities, regardless of whether we would have the power to indemnify the person against liabilities under our partnership agreement.
We and our General Partner have also entered into separate indemnification agreements with each of the directors and officers of our General Partner. The terms of the indemnification agreements are consistent with the terms of the indemnification provided by our partnership agreement and our General Partner’s limited liability company agreement. The indemnification agreements also provide that we and our General Partner must advance payment of certain expenses to such indemnified directors and officers, including fees of counsel, subject to receipt of an undertaking from the indemnitee to return such advance if it is it is ultimately determined that the indemnitee is not entitled to indemnification.
Approval and Review of Related Party Transactions
If we contemplate entering into a transaction, other than a routine or ordinary course of business transaction, in which a related person will have a direct or indirect material interest, the proposed transaction is submitted for consideration to the Board of our General Partner or to our management, as appropriate. If the Board is involved in the approval process, it determines whether to refer the matter to the conflicts committee of the Board, as constituted under our limited partnership agreement. If a matter is referred to the conflicts committee, it obtains information regarding the proposed transaction from management and determines whether to engage independent legal counsel or an independent financial advisor to advise the members of the committee regarding the transaction. If the conflicts committee retains such counsel or financial advisor, it considers such advice and, in the case of a financial advisor, such advisor’s opinion as to whether the transaction is fair and reasonable to us and to our unitholders.
Director Independence
Please see “Item 10-Directors, Executive Officers and Corporate Governance” of this report for a discussion of director independence matters.
Item 14. Principal Accountant Fees and Services.
We have engaged PricewaterhouseCoopers LLP as our principal accountant. The following table summarizes fees we have paid PricewaterhouseCoopers LLP for independent auditing, tax and related services for each of the last two fiscal years:
Year ended December 31, | ||||||||
2014 | 2015 | |||||||
Audit fees(1) | $ | 657,526 | $ | 702,489 | ||||
Audit-related fees(2) | — | — | ||||||
Tax fees(3) | 237,132 | 235,556 | ||||||
All other fees(4) | — | — | ||||||
____________________
(1) | Audit fees represent amounts billed for each of the years presented for professional services rendered in connection with (a) the audit of our annual financial statements and internal controls over financial reporting, (b) the review of our quarterly financial statements and (c) those services normally provided in connection with statutory and regulatory filings or engagements, including comfort letters, consents and other services related to SEC matters. |
(2) | Audit-related fees represent amounts we were billed in each of the years presented for assurance and related services that are reasonably related to the performance of the annual audit or quarterly reviews. |
(3) | Tax fees represent amounts we were billed in each of the years presented for professional services rendered in connection with tax compliance, tax advice and tax planning. This category primarily includes services relating to the preparation of unitholder annual K-1 statements. |
(4) | All other fees represent amounts we were billed in each of the years presented for services not classifiable under the other categories listed in the table above. |
All audit and non-audit services provided by PricewaterhouseCoopers LLP are subject to pre-approval by our audit committee to ensure that the provisions of such services do not impair the auditor’s independence. Under our pre-approval
79
policy, the audit committee is informed of each engagement of the independent auditor to provide services under the policy. The audit committee of our General Partner has approved the use of PricewaterhouseCoopers LLP as our independent principal accountant.
80
PART IV. FINANCIAL INFORMATION
Item 15. Exhibits, Financial Statement Schedules.
(a) Financial Statements and Schedules
(1) | See the Index to Financial Statements on page F-1. |
(2) | All schedules have been omitted because they are either not applicable, not required or the information called for therein appears in the consolidated financial statements or notes thereto |
(3) | Exhibits |
INDEX TO EXHIBITS
Exhibit Number | Description |
3.1 | Amended and Restated Certificate of Blueknight Energy Partners, L.P. (the “Partnership”), dated November 19, 2009 but effective as of December 1, 2009 (filed as Exhibit 3.1 to the Partnership’s Current Report on Form 8-K, filed November 25, 2009, and incorporated herein by reference). |
3.2 | Fourth Amended and Restated Agreement of Limited Partnership of the Partnership, dated September 14, 2011 (filed as Exhibit 3.1 to the Partnership’s Current Report on Form 8-K, filed September 14, 2011, and incorporated herein by reference). |
3.3 | Amended and Restated Certificate of Formation of the General Partner, dated November 19, 2009 but effective as of December 1, 2009 (filed as Exhibit 3.2 to the Partnership’s Current Report on Form 8-K, filed November 25, 2009, and incorporated herein by reference). |
3.4 | Second Amended and Restated Limited Liability Company Agreement of the General Partner, dated December 1, 2009 (filed as Exhibit 3.2 to the Partnership’s Current Report on Form 8-K, filed December 7, 2009, and incorporated herein by reference). |
4.1 | Specimen Unit Certificate (included in Exhibit 3.2). |
4.2 | Registration Rights Agreement, dated as of October 25, 2010, by and among Blueknight Energy Partners, L.P., Blueknight Energy Holding, Inc. and CB-Blueknight, LLC (filed as Exhibit 4.1 to the Partnership’s Current Report on Form 8-K, filed October 25, 2010, and incorporated herein by reference). |
4.3 | Specimen Right Certificate (filed as Exhibit 4.2 to the Partnership’s Current Report on Form 8-K, filed September 27, 2011, and incorporated herein by reference). |
4.4 | Rights Agent Agreement, dated as of September 27, 2011, between Blueknight Energy Partners, L.P. and American Stock Transfer & Trust Company, LLC, as rights agent (filed as Exhibit 4.1 to the Partnership’s Current Report on Form 8-K, filed September 27, 2011, and incorporated herein by reference). |
4.5 | Specimen Series A Preferred Unit Certificate (filed as Exhibit 4.3 to the Partnership’s Current Report on Form 8-K, filed September 27, 2011, and incorporated herein by reference). |
10.1 | Consulting Services Agreement, dated August 17, 2011 to be effective as of July 1, 2011, by and between BKEP Pipeline, L.L.C. and Vitol Midstream LLC (filed as Exhibit 10.1 to the Partnership’s Current Report on Form 8-K, filed August 18, 2011, and incorporated herein by reference). |
10.2 | Operating and Maintenance Agreement, dated August 17, 2011 to be effective as of July 1, 2011, by and between BKEP Pipeline, L.L.C. and Vitol Midstream LLC (filed as Exhibit 10.2 to the Partnership’s Current Report on Form 8-K, filed August 18, 2011, and incorporated herein by reference). |
10.3# | Crude Oil Storage Services Agreement, effective as of May 1, 2010, by and between BKEP Crude, LLC and Vitol Inc. (filed as Exhibit 10.54 to the Partnership’s Annual Report on Form 10-K, filed on March 30, 2010, and incorporated herein by reference). |
10.4# | First Amendment to Crude Oil Storage Services Agreement, dated to be effective as of March 1, 2013, by and between BKEP Crude, LLC and Vitol Inc. |
10.5# | Second Amendment to Crude Oil Storage Services Agreement, effective May 1, 2015, by and between BKEP Crude, LLC and Vitol, Inc. (filed as Exhibit 10.1 to the Partnership’s Current Report on Form 8-K, filed January 26, 2015, and incorporated herein by reference). |
10.6† | Blueknight Energy Partners G.P., L.L.C. Long-Term Incentive Plan (as amended and restated effective April 29, 2014) (filed as Exhibit 10.2 to the Partnership’s Current Report on Form 8-K, filed June 27, 2014, and incorporated herein by reference). |
10.7† | Form of Employment Agreement (filed as Exhibit 10.6 to the Partnership’s Registration Statement on Form S-1 (Reg. No. 333-141196), filed May 25, 2007, and incorporated herein by reference). |
10.8† | Form of Employment Agreement (filed as Exhibit 10.14 to the Partnership’s Quarterly Report on Form 10-Q, filed on March 23, 2009, and incorporated herein by reference). |
81
10.9† | Form of Employment Agreement (filed as Exhibit 10.2 to the Partnership’s Current Report on Form 8-K, filed on November 25, 2009, and incorporated herein by reference). |
10.10† | Form of Indemnification Agreement (filed as Exhibit 10.7 to the Partnership’s Registration Statement on Form S-1 (Reg. No. 333-141196), filed May 25, 2007, and incorporated herein by reference). |
10.11† | Form of Phantom Unit Agreement (filed as Exhibit 10.15 to the Partnership’s Quarterly Report on Form 10-Q, filed on March 23, 2009, and incorporated herein by reference). |
10.12† | Form of Phantom Unit Agreement (filed as Exhibit 10.19 to the Partnership’s Annual Report on Form 10-K, filed on March 16, 2011, and incorporated herein by reference). |
10.13† | Form of Retention Agreement (filed as Exhibit 10.16 to the Partnership’s Quarterly Report on Form 10-Q, filed on March 23, 2009, and incorporated herein by reference). |
10.14† | Form of Director Restricted Common Unit Agreement (filed as Exhibit 10.2 to the Partnership’s Current Report on Form 8-K, filed on December 23, 2008, and incorporated herein by reference). |
10.15† | Form of Director Restricted Subordinated Unit Agreement (filed as Exhibit 10.3 to the Partnership’s Current Report on Form 8-K, filed on December 23, 2008, and incorporated herein by reference). |
10.16† | Employment Agreement, dated October 4, 2012, between Mark Hurley and BKEP Management, Inc. (filed as Exhibit 10.1 to the Partnership’s Current Report on Form 8-K/A, filed October 4, 2012 and incorporated herein by reference). |
10.17† | Employee Phantom Unit Agreement, dated October 4, 2012, between Mark Hurley and Blueknight Energy Partners G.P., L.L.C. (filed as Exhibit 10.2 to the Partnership’s Current Report on Form 8-K/A, filed October 4, 2012 and incorporated herein by reference). |
10.18 | Mutual Easement Agreement, dated as of April 7, 2009 to be effective as of 11:59 PM CDT March 31, 2009, among SemCrude, L.P., SemGroup Energy Partners, L.L.C., and SemGroup Crude Storage, L.L.C. (filed as Exhibit 10.12 to the Partnership’s Current Report on Form 8-K, filed on April 10, 2009, and incorporated herein by reference). |
10.19 | Pipeline Easement Agreement, dated as of April 7, 2009 to be effective as of 11:59 PM CDT March 31, 2009, by and among White Cliffs Pipeline, L.L.C., SemGroup Energy Partners, L.L.C., and SemGroup Crude Storage, L.L.C. (filed as Exhibit 10.13 to the Partnership’s Current Report on Form 8-K, filed on April 10, 2009, and incorporated herein by reference). |
10.20 | Shared Services Agreement, dated to be effective as of August 1, 2012, by and between the Partnership and Vitol Inc. (filed as Exhibit 10.3 to the Partnership’s Quarterly Report on Form 10-Q for the quarter ended June 30, 2012 and filed August 7, 2012, and incorporated herein by reference). |
10.21# | Crude Oil Storage Services Agreement, dated to be effective as of June 1, 2012, by and between BKEP Pipeline, LLC and Vitol Inc. (filed as Exhibit 10.1 to the Partnership’s Quarterly Report on Form 10-Q for the quarter ended March 31, 2012 and filed May 9, 2012, and incorporated herein by reference). |
10.22# | First Amendment to Crude Oil Storage Services Agreement, dated to be effective as of March 1, 2013, by and between BKEP Pipeline, LLC and Vitol Inc. (filed as Exhibit 10.38 to the Partnership’s Annual Report on Form 10-K, filed on March 14, 2013, and incorporated herein by reference). |
10.23# | Second Amendment to Crude Oil Storage Services Agreement, effective November 1, 2013, by and between BKEP Pipeline, LLC and Vitol Inc. (filed as Exhibit 10.1 to the Partnership’s Current Report on Form 8-K, filed on October 18, 2013, and incorporated herein by reference). |
10.24# | Third Amendment to Crude Oil Storage Services Agreement, dated to be effective as of April 1, 2014, by and between BKEP Pipeline, LLC and Vitol, Inc. (filed as Exhibit 10.2 to the Partnership’s Current Report on Form 8-K, filed on April 14, 2014, and incorporated herein by reference). |
10.25# | Crude Oil Storage Services Agreement, dated to be effective as of June 1, 2012, by and between BKEP Pipeline, LLC and Vitol Inc. (filed as Exhibit 10.2 to the Partnership’s Quarterly Report on Form 10-Q for the quarter ended March 31, 2012 and filed May 9, 2012, and incorporated herein by reference). |
10.26# | First Amendment to Crude Oil Storage Services Agreement, dated to be effective as of March 1, 2013, by and between BKEP Pipeline, LLC and Vitol Inc. (filed as Exhibit 10.40 to the Partnership’s Annual Report on Form 10-K, filed on March 14, 2013, and incorporated herein by reference). |
10.27# | Second Amendment to Crude Oil Storage Services Agreement, dated to be effective as of April 1, 2014, by and between BKEP Pipeline, LLC and Vitol Inc. (filed as Exhibit 10.1 to the Partnership’s Current Report on Form 8-K, filed on April 14, 2014, and incorporated herein by reference). |
10.28# | Crude Oil Storage Services Agreement, dated to be effective as of September 1, 2012, by and between BKEP Pipeline, LLC and Vitol Inc. (filed as Exhibit 10.4 to the Partnership’s Quarterly Report on Form 10-Q for the quarter ended June 30, 2012 and filed August 7, 2012, and incorporated herein by reference). |
10.29# | First Amendment to Crude Oil Storage Services Agreement, dated to be effective as of March 1, 2013, by and between BKEP Pipeline, LLC and Vitol Inc. (filed as Exhibit 10.42 to the Partnership’s Annual Report on Form 10-K, filed on March 14, 2013, and incorporated herein by reference). |
82
10.30# | Second Amendment to Crude Oil Storage Services Agreement, effective November 1, 2013, by and between BKEP Pipeline, LLC and Vitol, Inc. (filed as Exhibit 10.2 to the Partnership’s Current Report on Form 8-K, filed on October 18, 2013, and incorporated herein by reference). |
10.31# | Third Amendment to Crude Oil Storage Services Agreement, dated to be effective as of April 1, 2014, by and between BKEP Pipeline, LLC and Vitol, Inc. (filed as Exhibit 10.2 to the Partnership’s Current Report on Form 8-K, filed on April 14, 2014, and incorporated herein by reference). |
10.32 | Credit Agreement, dated as of June 28, 2013 by and among the Partnership, Wells Fargo Bank, N.A., as Administrative Agent, and the other agents and lenders party thereto (filed as Exhibit 10.1 to the Partnership’s Current Report on Form 8-K, filed July 1, 2013, and incorporated herein by reference). |
10.33# | Crude Oil Throughput and Deficiency Agreement, dated August 28, 2014 between Knight Warrior LLC and Eaglebine Crude Oil Marketing LLC (filed as Exhibit 10.1 to the Partnership’s Quarterly Report on Form 10-Q, filed on November 6, 2014, and incorporated herein by reference). |
10.34 | First Amendment to Amended and Restated Credit Agreement, dated as of September 15, 2014, by and among the Partnership, Wells Fargo Bank, National Association, as Administrative Agent, and the several lenders from time to time party thereto (filed as Exhibit 10.1 to the Partnership’s Current Report on Form 8-K, filed September 1, 2014, and incorporated herein by reference). |
10.35† | Blueknight Energy Partners, L.P. Employee Unit Purchase Plan, dated to be effective as of June 23, 2014 (filed as Exhibit 10.1 to the Partnership’s Current Report on Form 8-K, filed on June 27, 2014, and incorporated herein by reference). |
21.1* | List of Subsidiaries of Blueknight Energy Partners, L.P. |
23.1* | Consent of PricewaterhouseCoopers, L.L.P. |
31.1* | Certifications of Chief Executive Officer Pursuant to Section 302 of the Sarbanes-Oxley Act of 2002. |
31.2* | Certifications of Chief Financial Officer Pursuant to Section 302 of the Sarbanes-Oxley Act of 2002. |
32.1* | Certification of Chief Executive Officer and Chief Financial Officer pursuant to 18 U.S.C., Section 1350, as adopted pursuant to Section 906 of the Sarbanes-Oxley Act of 2002. Pursuant to SEC Release 34-47551, this Exhibit is furnished to the SEC and shall not be deemed to be “filed.” |
101** | The following financial information from Blueknight Energy Partners, L.P.’s Annual Report on Form 10-K for the year ended December 31, 2015, formatted in XBRL (eXtensible Business Reporting Language): (i) Document and Entity Information; (ii) Consolidated Balance Sheets as of December 31, 2014 and 2015; (iii) Consolidated Statements of Operations for the years ended December 31, 2013, 2014 and 2015; (iv)Consolidated Statement of Changes in Partners’ Capital for the years ended December 31, 2013, 2014 and 2015; (v) Consolidated Statements of Cash Flows for the years ended December 31, 2013, 2014 and 2015; and (vi) Notes to Consolidated Financial Statements. |
_________
* | Filed herewith. |
** | Furnished herewith |
# | Certain portions of this exhibit are subject to a request for confidential treatment by the Securities and Exchange Commission. The omitted portions have been separately filed with the Securities and Exchange Commission. |
† | As required by Item 15(a)(3) of Form 10-K, this exhibit is identified as a compensatory plan or arrangement. |
83
SIGNATURES
Pursuant to the requirements of Section 13 or 15(d) of the Securities Exchange Act of 1934, the registrant has duly caused this report to be signed on its behalf by the undersigned thereunto duly authorized.
BLUEKNIGHT ENERGY PARTNERS, L.P. | |||
By: | Blueknight Energy Partners G.P., L.L.C. | ||
Its General Partner | |||
March 9, 2016 | By: | /s/ Alex G Stallings | |
Alex G. Stallings | |||
Chief Financial Officer and Secretary | |||
Pursuant to the requirements of the Securities Exchange Act of 1934, this report has been signed below by the following persons on behalf of the registrant and in the capacities indicated on March 9, 2016.
Signature | Title |
/s/ Mark A. Hurley | Chief Executive Officer and Director (Principal Executive Officer) |
Mark A. Hurley | |
/s/ Alex G. Stallings | Chief Financial Officer and Secretary (Principal Financial Officer) |
Alex G. Stallings | |
/s/ James R. Griffin | Chief Accounting Officer (Principal Accounting Officer) |
James R. Griffin | |
/s/ Duke R. Ligon | Director |
Duke R. Ligon | |
/s/ Steven M. Bradshaw | Director |
Steven M. Bradshaw | |
/s/ John A. Shapiro | Director |
John A. Shapiro | |
/s/ M.A. Loya | Director |
M.A. Loya | |
/s/ Michael R. Eisenson | Director |
Michael R. Eisenson | |
/s/ Jon M. Biotti | Director |
Jon M. Biotti | |
/s/ Francis Brenner | Director |
Francis Brenner | |
84
INDEX TO BLUEKNIGHT ENERGY PARTNERS, L.P. CONSOLIDATED FINANCIAL STATEMENTS | |
Report of Independent Registered Public Accounting Firm | |
Consolidated Balance Sheets as of December 31, 2014 and 2015 | |
Consolidated Statements of Operations for the Years Ended December 31, 2013, 2014 and 2015 | |
Consolidated Statement of Changes in Partners’ Capital for the Years Ended December 31, 2013, 2014, and 2015 | |
Consolidated Statements of Cash Flows for the Years Ended December 31, 2013, 2014 and 2015 | |
Notes to the Consolidated Financial Statements | |
i
REPORT OF INDEPENDENT REGISTERED PUBLIC ACCOUNTING FIRM
To the Board of Directors of Blueknight Energy Partners GP, L.L.C. and Unitholders of Blueknight Energy Partners, L.P.
In our opinion, the accompanying consolidated balance sheets and the related consolidated statements of operations, consolidated statement of changes in partners’ capital and consolidated statements of cash flows present fairly, in all material respects, the financial position of Blueknight Energy Partners, L.P. and its subsidiaries (the “Partnership”) at December 31, 2015 and 2014, and the results of their operations and their cash flows for each of the three years in the period ended December 31, 2015, in conformity with accounting principles generally accepted in the United States of America. Also in our opinion, the Partnership maintained, in all material respects, effective internal control over financial reporting as of December 31, 2015, based on criteria established in Internal Control - Integrated Framework (2013) issued by the Committee of Sponsoring Organizations of the Treadway Commission (COSO). The Partnership’s management is responsible for these financial statements, for maintaining effective internal control over financial reporting and for its assessment of the effectiveness of internal control over financial reporting, included in Management’s Report on Internal Control over Financial Reporting appearing under Item 9A in the Partnership’s Form 10-K for the year ended December 31, 2015. Our responsibility is to express opinions on these financial statements and on the Partnership’s internal control over financial reporting based on our integrated audits. We conducted our audits in accordance with the standards of the Public Company Accounting Oversight Board (United States). Those standards require that we plan and perform the audits to obtain reasonable assurance about whether the financial statements are free of material misstatement and whether effective internal control over financial reporting was maintained in all material respects. Our audits of the financial statements included examining, on a test basis, evidence supporting the amounts and disclosures in the financial statements, assessing the accounting principles used and significant estimates made by management, and evaluating the overall financial statement presentation. Our audit of internal control over financial reporting included obtaining an understanding of internal control over financial reporting, assessing the risk that a material weakness exists, and testing and evaluating the design and operating effectiveness of internal control based on the assessed risk. Our audits also included performing such other procedures as we considered necessary in the circumstances. We believe that our audits provide a reasonable basis for our opinions.
A company’s internal control over financial reporting is a process designed to provide reasonable assurance regarding the reliability of financial reporting and the preparation of financial statements for external purposes in accordance with generally accepted accounting principles. A company’s internal control over financial reporting includes those policies and procedures that (i) pertain to the maintenance of records that, in reasonable detail, accurately and fairly reflect the transactions and dispositions of the assets of the company; (ii) provide reasonable assurance that transactions are recorded as necessary to permit preparation of financial statements in accordance with generally accepted accounting principles, and that receipts and expenditures of the company are being made only in accordance with authorizations of management and directors of the company; and (iii) provide reasonable assurance regarding prevention or timely detection of unauthorized acquisition, use, or disposition of the company’s assets that could have a material effect on the financial statements.
Because of its inherent limitations, internal control over financial reporting may not prevent or detect misstatements. Also, projections of any evaluation of effectiveness to future periods are subject to the risk that controls may become inadequate because of changes in conditions, or that the degree of compliance with the policies or procedures may deteriorate.
/s/ PricewaterhouseCoopers LLP
Tulsa, Oklahoma
March 9, 2016
F-1
BLUEKNIGHT ENERGY PARTNERS, L.P. CONSOLIDATED BALANCE SHEETS (in thousands, except per unit data) | |||||||
As of December 31, | |||||||
2014 | 2015 | ||||||
ASSETS | |||||||
Current assets: | |||||||
Cash and cash equivalents | $ | 2,661 | $ | 3,038 | |||
Accounts receivable, net of allowance for doubtful accounts of $222 and $38 at December 31, 2014 and 2015, respectively | 9,051 | 8,697 | |||||
Receivables from related parties, net of allowance for doubtful accounts of $225 at both dates | 2,316 | 1,844 | |||||
Prepaid insurance | 1,582 | 1,397 | |||||
Investments | 2,079 | — | |||||
Other current assets | 3,805 | 4,384 | |||||
Total current assets | 21,494 | 19,360 | |||||
Property, plant and equipment, net of accumulated depreciation of $192,440 and $205,967 at December 31, 2014 and 2015, respectively | 310,163 | 312,934 | |||||
Investment in unconsolidated affiliate | 20,381 | 19,078 | |||||
Goodwill | 7,216 | 4,387 | |||||
Debt issuance costs, net | 3,085 | 2,201 | |||||
Intangibles and other assets, net | 2,056 | 6,786 | |||||
Total assets | $ | 364,395 | $ | 364,746 | |||
LIABILITIES AND PARTNERS’ CAPITAL | |||||||
Current liabilities: | |||||||
Accounts payable | $ | 7,626 | $ | 5,236 | |||
Accrued interest payable | 233 | 191 | |||||
Accrued property taxes payable | 2,046 | 2,773 | |||||
Unearned revenue | 1,531 | 4,299 | |||||
Unearned revenue with related parties | 909 | 756 | |||||
Accrued payroll | 6,520 | 7,263 | |||||
Other current liabilities | 3,204 | 6,358 | |||||
Total current liabilities | 22,069 | 26,876 | |||||
Long-term payable to related parties | 116 | 80 | |||||
Other long-term liabilities | 3,620 | 2,468 | |||||
Interest rate swap liabilities | 2,634 | 3,103 | |||||
Long-term debt | 216,000 | 245,000 | |||||
Commitments and contingencies (Note 17) | |||||||
Partners’ capital: | |||||||
Series A Preferred Units (30,158,619 units issued and outstanding for both dates) | 204,599 | 204,599 | |||||
Common unitholders (32,774,163 and 33,039,818 units issued and outstanding at December 31, 2014 and December 31, 2015, respectively) | 525,767 | 493,824 | |||||
General partner interest (1.8% with 1,127,755 general partner units outstanding for both dates) | (610,410 | ) | (611,204 | ) | |||
Total partners’ capital | 119,956 | 87,219 | |||||
Total liabilities and partners’ capital | $ | 364,395 | $ | 364,746 | |||
The accompanying notes are an integral part of these consolidated financial statements.
F-2
BLUEKNIGHT ENERGY PARTNERS, L.P. CONSOLIDATED STATEMENTS OF OPERATIONS (in thousands, except per unit data) | |||||||||||
Year ended December 31, | |||||||||||
2013 | 2014 | 2015 | |||||||||
Service revenue: | |||||||||||
Third party revenue | $ | 142,916 | $ | 143,838 | $ | 140,926 | |||||
Related party revenue | 51,755 | 42,788 | 39,103 | ||||||||
Total revenue | 194,671 | 186,626 | 180,029 | ||||||||
Expenses: | |||||||||||
Operating | 133,610 | 134,245 | 131,205 | ||||||||
General and administrative | 17,482 | 17,498 | 18,976 | ||||||||
Asset impairment expense | 524 | — | 21,996 | ||||||||
Total expenses | 151,616 | 151,743 | 172,177 | ||||||||
Gain on sale of assets | 1,073 | 2,464 | 6,137 | ||||||||
Operating income | 44,128 | 37,347 | 13,989 | ||||||||
Other income (expense): | |||||||||||
Equity earnings (loss) in unconsolidated affiliate | (502 | ) | 883 | 3,932 | |||||||
Interest expense (net of capitalized interest of $1,048, $291, and $184, respectively) | (11,615 | ) | (12,268 | ) | (11,202 | ) | |||||
Unrealized gains on investments | — | 2,079 | — | ||||||||
Income from continuing operations before income taxes | 32,011 | 28,041 | 6,719 | ||||||||
Provision for income taxes | 593 | 469 | 323 | ||||||||
Income from continuing operations | 31,418 | 27,572 | 6,396 | ||||||||
Discontinued operations: | |||||||||||
Loss from discontinued operations (including asset impairment expense of $6,353 for the year ended December 31, 2013) (See Note 5) | (3,383 | ) | — | — | |||||||
Net income | $ | 28,035 | $ | 27,572 | $ | 6,396 | |||||
Allocation of net income for calculation of earnings per unit: | |||||||||||
General partner interest in net income | $ | 647 | $ | 641 | $ | 554 | |||||
Preferred interest in net income | $ | 21,564 | $ | 21,563 | $ | 21,564 | |||||
Income (loss) available to limited partners | $ | 5,824 | $ | 5,368 | $ | (15,722 | ) | ||||
Basic and diluted income (loss) from continuing operations per common unit | $ | 0.39 | $ | 0.20 | $ | (0.47 | ) | ||||
Basic and diluted loss from discontinued operations per common unit | $ | (0.14 | ) | $ | — | $ | — | ||||
Basic and diluted net income (loss) per common unit | $ | 0.25 | $ | 0.20 | $ | (0.47 | ) | ||||
Weighted average common units outstanding - basic and diluted | 22,706 | 25,670 | 32,945 | ||||||||
The accompanying notes are an integral part of these consolidated financial statements.
F-3
BLUEKNIGHT ENERGY PARTNERS, L.P. CONSOLIDATED STATEMENT OF CHANGES IN PARTNERS’ CAPITAL (in thousands) | |||||||||||||||
Common Unitholders | Series A Preferred Unitholders | General Partner Interest | Total Partners’ Capital | ||||||||||||
Balance, December 31, 2012 | $ | 464,433 | $ | 204,599 | $ | (610,377 | ) | $ | 58,655 | ||||||
Net income | 5,885 | 21,564 | 586 | 28,035 | |||||||||||
Equity-based incentive compensation | 1,864 | — | 48 | 1,912 | |||||||||||
Profits interest contribution | — | — | 150 | 150 | |||||||||||
Distributions | (11,033 | ) | (21,564 | ) | (697 | ) | (33,294 | ) | |||||||
Balance, December 31, 2013 | $ | 461,149 | $ | 204,599 | $ | (610,290 | ) | $ | 55,458 | ||||||
Net income | 5,517 | 21,564 | 491 | 27,572 | |||||||||||
Equity-based incentive compensation | 1,590 | — | 29 | 1,619 | |||||||||||
Profits interest contribution | — | — | 150 | 150 | |||||||||||
Distributions | (13,671 | ) | (21,564 | ) | (790 | ) | (36,025 | ) | |||||||
Proceeds from sale of 9,775,000 common units, net of underwriters' discount and offering expenses of $3.2 million | 71,182 | — | — | 71,182 | |||||||||||
Balance, December 31, 2014 | $ | 525,767 | $ | 204,599 | $ | (610,410 | ) | $ | 119,956 | ||||||
Net income | (15,281 | ) | 21,564 | 113 | 6,396 | ||||||||||
Equity-based incentive compensation | 2,095 | — | 36 | 2,131 | |||||||||||
Profits interest contribution | — | — | 150 | 150 | |||||||||||
Distributions | (18,943 | ) | (21,564 | ) | (1,093 | ) | (41,600 | ) | |||||||
Proceeds from sale of 30,075 common units pursuant to the Employee Unit Purchase Plan | 186 | — | — | 186 | |||||||||||
Balance, December 31, 2015 | $ | 493,824 | $ | 204,599 | $ | (611,204 | ) | $ | 87,219 | ||||||
The accompanying notes are an integral part of this consolidated financial statement.
F-4
BLUEKNIGHT ENERGY PARTNERS, L.P. CONSOLIDATED STATEMENTS OF CASH FLOWS (in thousands) | |||||||||||
Year ended December 31, | |||||||||||
2013 | 2014 | 2015 | |||||||||
Cash flows from operating activities: | |||||||||||
Net income | $ | 28,035 | $ | 27,572 | $ | 6,396 | |||||
Adjustments to reconcile net income to net cash provided by operating activities: | |||||||||||
Provision for uncollectible receivables from third parties | 400 | 126 | (184 | ) | |||||||
Provision for uncollectible receivables from related parties | — | 225 | — | ||||||||
Depreciation and amortization | 24,241 | 26,045 | 27,228 | ||||||||
Impairment of intangible assets | — | — | 7,498 | ||||||||
Amortization and write-off of debt issuance costs | 3,326 | 821 | 884 | ||||||||
Unrealized loss related to interest rate swaps | — | 2,634 | 469 | ||||||||
Fixed asset impairment charge | 6,877 | — | 14,498 | ||||||||
Gain on sale of assets | (2,661 | ) | (2,464 | ) | (6,137 | ) | |||||
Equity-based incentive compensation | 1,912 | 1,538 | 2,131 | ||||||||
Equity loss (earnings) in unconsolidated affiliate | 502 | (883 | ) | (3,932 | ) | ||||||
Distributions from unconsolidated affiliate | — | — | 4,313 | ||||||||
Gain related to investments | — | (2,079 | ) | (267 | ) | ||||||
Changes in assets and liabilities | |||||||||||
Decrease (increase) in accounts receivable | (3,970 | ) | 3,067 | 538 | |||||||
Decrease in receivables from related parties | 373 | 608 | 472 | ||||||||
Decrease in prepaid insurance | 2,333 | 2,943 | 3,998 | ||||||||
Decrease (increase) in other current assets | (2,499 | ) | 516 | (579 | ) | ||||||
Decrease (increase) in other assets | 50 | (299 | ) | (1,485 | ) | ||||||
Decrease in accounts payable | (417 | ) | (580 | ) | (792 | ) | |||||
Increase (decrease) in accrued interest payable | 318 | (249 | ) | (42 | ) | ||||||
Decrease in accrued interest payable to related parties | (304 | ) | — | — | |||||||
Increase (decrease) in accrued property taxes | (128 | ) | 236 | 727 | |||||||
Increase (decrease) in unearned revenue | 150 | (82 | ) | 2,075 | |||||||
Increase (decrease) in unearned revenue from related parties | (73 | ) | 782 | (189 | ) | ||||||
Increase (decrease) in accrued payroll | 970 | (859 | ) | 743 | |||||||
Increase (decrease) in other accrued liabilities | 1,116 | (1,378 | ) | 2,169 | |||||||
Net cash provided by operating activities | 60,551 | 58,240 | 60,532 | ||||||||
Cash flows from investing activities: | |||||||||||
Acquisitions | — | — | (20,951 | ) | |||||||
Capital expenditures | (64,956 | ) | (37,368 | ) | (41,609 | ) | |||||
Proceeds from sale of assets | 4,258 | 3,063 | 14,687 | ||||||||
Investment in unconsolidated affiliate | (20,000 | ) | — | — | |||||||
Distributions from unconsolidated affiliate | — | — | 922 | ||||||||
Proceeds from sale of investments | — | — | 2,346 | ||||||||
Net cash used in investing activities | (80,698 | ) | (34,305 | ) | (44,605 | ) | |||||
Cash flows from financing activities: | |||||||||||
Payment on insurance premium financing agreement | (2,342 | ) | (2,518 | ) | (3,286 | ) | |||||
Debt issuance costs | (3,681 | ) | (326 | ) | — | ||||||
Payments on long-term payable to related party | (2,681 | ) | — | — | |||||||
Borrowings under credit facility | 342,411 | 60,733 | 112,000 | ||||||||
Payments under credit facility | (280,411 | ) | (117,733 | ) | (83,000 | ) | |||||
Proceeds from equity issuances, net of offering costs | — | 71,182 | 186 | ||||||||
Capital contribution related to profits interest | 150 | 150 | 150 | ||||||||
Distributions | (33,294 | ) | (35,944 | ) | (41,600 | ) | |||||
Net cash provided by (used in) financing activities | 20,152 | (24,456 | ) | (15,550 | ) | ||||||
Net increase (decrease) in cash and cash equivalents | 5 | (521 | ) | 377 | |||||||
Cash and cash equivalents at beginning of period | 3,177 | 3,182 | 2,661 | ||||||||
Cash and cash equivalents at end of period | $ | 3,182 | $ | 2,661 | $ | 3,038 | |||||
F-5
BLUEKNIGHT ENERGY PARTNERS, L.P. CONSOLIDATED STATEMENTS OF CASH FLOWS (in thousands) | |||||||||||
Supplemental disclosure of cash flow information: | |||||||||||
Increase (decrease) in accounts payable related to purchase of property, plant and equipment | $ | (3,098 | ) | $ | 1,669 | $ | (1,598 | ) | |||
Increase in accrued liabilities related to insurance premium financing agreement | $ | 2,609 | $ | 2,494 | $ | 3,813 | |||||
Decrease in accounts receivable related to purchase of property, plant and equipment | $ | 1,274 | $ | — | $ | — | |||||
Cash paid for interest, net of amounts capitalized | $ | 9,644 | $ | 9,085 | $ | 9,915 | |||||
Cash paid for income taxes | $ | 419 | $ | 508 | $ | 412 | |||||
The accompanying notes are an integral part of these consolidated financial statements.
F-6
BLUEKNIGHT ENERGY PARTNERS, L.P.
NOTES TO CONSOLIDATED FINANCIAL STATEMENTS
1. ORGANIZATION AND NATURE OF BUSINESS
Blueknight Energy Partners, L.P. and subsidiaries (collectively, the “Partnership”) is a publicly traded master limited partnership with operations in twenty-four states. The Partnership provides integrated terminalling, storage, processing, gathering and transportation services for companies engaged in the production, distribution and marketing of crude oil and asphalt products. The Partnership manages its operations through four operating segments: (i) asphalt terminalling services, (ii) crude oil terminalling and storage services, (iii) crude oil pipeline services and (iv) crude oil trucking and producer field services. The Partnership’s common units and preferred units, which represent limited partnership interests in the Partnership, are listed on the NASDAQ Global Market under the symbols “BKEP” and “BKEPP,” respectively. The Partnership was formed in February 2007 as a Delaware master limited partnership initially to own, operate and develop a diversified portfolio of complementary midstream energy assets.
2. BASIS OF CONSOLIDATION AND PRESENTATION
The accompanying consolidated financial statements and related notes present and discuss the Partnership’s consolidated financial position as of December 31, 2014 and 2015, and the consolidated results of the Partnership’s operations, cash flows and changes in partners’ capital for the years ended December 31, 2013, 2014 and 2015. The consolidated financial statements have been prepared in accordance with accounting principles generally accepted in the United States of America (“GAAP”). All significant intercompany accounts and transactions have been eliminated in the preparation of the accompanying consolidated financial statements.
3. SUMMARY OF SIGNIFICANT ACCOUNTING POLICIES
USE OF ESTIMATES - The preparation of financial statements in conformity with accounting principles generally accepted in the United States of America requires management to make estimates and assumptions that affect the reported amounts and disclosure of contingencies. Management makes significant estimates including: (1) allowance for doubtful accounts receivable; (2) estimated useful lives of assets, which impacts depreciation; (3) estimated cash flows and fair values inherent in impairment tests; (4) accruals related to revenues and expenses; (5) the estimated fair value of financial instruments; and (6) liability and contingency accruals. Although management believes these estimates are reasonable, actual results could differ from these estimates.
CASH AND CASH EQUIVALENTS - The Partnership includes as cash and cash equivalents, cash and all investments with original maturities of three months or less which are readily convertible into known amounts of cash.
ACCOUNTS RECEIVABLE - The majority of the Partnership’s accounts receivable relates to its trucking and producer field services and asphalt terminalling services activities. Accounts receivable included in the consolidated balance sheets are reflected net of the allowance for doubtful accounts of $0.2 million and less than $0.1 million at December 31, 2014 and 2015, respectively.
The Partnership reviews all outstanding accounts receivable balances on a monthly basis and records a reserve for amounts that the Partnership expects will not be fully recovered. Although the Partnership considers its allowance for doubtful trade accounts receivable to be adequate, there is no assurance that actual amounts will not vary significantly from estimated amounts.
PROPERTY, PLANT AND EQUIPMENT - Property, plant and equipment are recorded at cost. Expenditures for maintenance and repairs that do not add capacity or extend the useful life of an asset are expensed as incurred. The carrying value of the assets is based on estimates, assumptions and judgments relative to useful lives and salvage values. As assets are disposed of, the cost and related accumulated depreciation are removed from the accounts, and any resulting gain or loss is included in consolidated operating income in the consolidated statements of operations.
Depreciation is calculated using the straight-line method, based on estimated useful lives of the assets. These estimates are based on various factors including age (in the case of acquired assets), manufacturing specifications, technological advances and historical data concerning useful lives of similar assets. Uncertainties that impact these estimates include changes in laws and regulations relating to restoration and abandonment requirements, economic conditions and supply and demand in the area. When assets are put into service, management makes estimates with respect to useful lives and salvage values that it believes
F-7
are reasonable. However, subsequent events could cause management to change its estimates, thus impacting the future calculation of depreciation.
The Partnership has contractual obligations to perform dismantlement and removal activities in the event that some of its asphalt product and residual fuel oil terminalling and storage assets are abandoned (see Note 17.). Such obligations are recognized in the period incurred if reasonably estimable.
IMPAIRMENT OF LONG-LIVED ASSETS AND OTHER INTANGIBLE ASSETS - Long-lived assets with recorded values that are not expected to be recovered through future cash flows are written-down to estimated fair value. A long-lived asset is tested for impairment when events or circumstances indicate that its carrying value may not be recoverable. The carrying value of a long-lived asset is not recoverable if it exceeds the sum of the undiscounted cash flows expected to result from the use and eventual disposition of the asset. If the carrying value exceeds the sum of the undiscounted cash flows, an impairment loss equal to the amount by which the carrying value exceeds the fair value of the asset is recognized. Fair value is generally determined from estimated discounted future net cash flows. The Partnership recognized fixed asset impairment charges of $6.9 million during the year ended December 31, 2013 that included $5.7 million related to the Thompson pipeline system located in southern Texas. This system was sold in December 2013 (see Note 5). During the year ended December 31, 2015, the Partnership recognized fixed asset impairment charges of $12.6 million, $1.4 million, and $0.5 million related to the East Texas pipeline system, a portion of the Mid-Continent pipeline system, and the West Texas trucking stations, respectively. The Partnership had no impairment charges during the year ended December 31, 2014.
Acquired customer relationships and non-compete agreements are capitalized and amortized over useful lives ranging from 4 to 20 years using the straight-line method of amortization. An impairment loss is recognized for definite-lived intangibles if the carrying amount of an intangible asset is not recoverable and its carrying amount exceeds its fair value. No impairment charge was recognized during the years ended December 31, 2013, 2014 or 2015 with respect to intangible assets.
EQUITY METHOD INVESTMENTS - The Partnership’s investment in Advantage Pipeline, L.L.C. (“Advantage Pipeline”), over which the Partnership has significant influence but not control, is accounted for by the equity method. The Partnership does not consolidate any part of the assets or liabilities of its equity investee. As of December 31, 2015, the Partnership's investment represents a 30% ownership interest in Advantage Pipeline. The Partnership’s share of net income or loss is reflected as one line item on the Partnership’s consolidated statements of operations entitled “Equity earnings in unconsolidated affiliate” and will increase or decrease, as applicable, the carrying value of the Partnership’s investment in the unconsolidated affiliate on the consolidated balance sheets. Distributions to the Partnership reduce the carrying value of its investment and will be reflected in the Partnership’s Consolidated Statements of Cash Flows in the line item “Distributions from unconsolidated affiliate.” In turn, contributions will increase the carrying value of the Partnership’s investment and will be reflected in the Partnership’s Consolidated Statements of Cash Flows in investing activities. The Partnership evaluates its equity investment for impairment in accordance with FASB guidance with respect to the equity method of accounting for investments in common stock. An impairment of an equity investment results when factors indicate that the investment’s fair value is less than its carrying value and the reduction in value is other than temporary in nature.
DEBT ISSUANCE COSTS - Costs incurred in connection with the issuance of long-term debt related to the Partnership’s credit facilities are capitalized and amortized using the straight-line method over the term of the related debt. Use of the straight-line method does not differ materially from the “effective interest” method of amortization.
INVESTMENTS - In November 2014, the Partnership received 30,393 Class A Common Units of SemCorp in connection with the settlement of two unsecured claims the Partnership filed in connection with SemCorp's predecessor's bankruptcy filing in 2008. The fair market value of these units on the date of receipt was $2.5 million. An unrealized loss of $0.4 million was incurred as a result of marking the units to their fair market value of $68.39 per unit as of December 31, 2014. The Partnership presents the unrealized gains and losses related to these units as one line item on the Partnership’s consolidated statements of operations entitled “Unrealized gains on investments.” In March 2015, the Partnership sold all of these units for a total of $2.3 million.
GOODWILL - Goodwill represents the excess of the cost of acquisitions over the amounts assigned to assets acquired and liabilities assumed. Goodwill is not amortized but is tested annually for impairment and when events and circumstances warrant an interim evaluation. Goodwill is tested for impairment at a level of reporting referred to as a reporting unit. The Partnership has four reporting units comprised of (i) its asphalt services, (ii) its crude oil terminalling and storage services, (iii) its crude oil pipeline services, and (iv) its crude oil trucking and producer field services. The Partnership has recorded goodwill of $0.9 million related to its crude oil trucking and producer field services reporting unit and $3.5 million related to its asphalt terminalling services reporting unit. During 2015, the Partnership recorded goodwill of $3.5 million attributable to its
F-8
asphalt terminalling services reporting unit related to the acquisition of an asphalt terminalling facility in Cheyenne, Wyoming, as well as $1.2 million attributable to its crude oil pipeline services reporting unit related to the acquisition of a pipeline system and related crude oil marketing business in southern Oklahoma. If the fair value of a reporting unit exceeds its carrying amount, goodwill of the reporting unit is not considered to be impaired. The impairment test is generally based on the estimated discounted future net cash flows of the respective reporting unit, utilizing discount rates and other factors in determining the fair value of the reporting unit. Inputs in the Partnership’s estimated discounted future net cash flows include existing and estimated future asset utilization, estimated growth rates in future cash flows, and estimated terminal values (these are all considered Level 3 inputs). During the fourth quarter of 2015 impairment testing indicated that the fair value of the pipeline services reporting was less than the carrying value, and the Partnership recognized impairment of goodwill of $7.5 million related to its crude oil pipeline services reporting unit.
ENVIRONMENTAL MATTERS - Liabilities for loss contingencies, including environmental remediation costs, arising from claims, assessments, litigation, fines, penalties and other sources are charged to expense when it is probable that a liability has been incurred and the amount of the assessment and/or remediation can be reasonably estimated. The Partnership recorded loss contingencies related to environmental matters of $0.2 million and less than $0.1 million as of December 31, 2014 and 2015, respectively.
REVENUE RECOGNITION - The Partnership’s revenues consist of (i) terminalling and storage revenues, (ii) gathering, transportation and producer field services revenues, (iii) crude oil marketing revenues and (iv) fuel surcharge revenues.
Terminalling and storage revenues consist of (i) storage service fees from actual storage used on a month-to-month basis; (ii) storage service fees resulting from short-term and long-term contracts for committed space that may or may not be utilized by the customer in a given month; and (iii) terminal throughput service charges to pump crude oil to connecting carriers or to deliver asphalt product out of the Partnership’s terminals. Terminal throughput service charges are recognized as the crude oil exits the terminal and is delivered to the connecting crude oil carrier or third-party terminal and as the asphalt product is delivered out of the Partnership’s terminal. Storage service revenues are recognized as the services are provided and the amounts earned on a monthly basis.
Gathering and transportation services revenues consist of service fees recognized for the gathering of crude oil for the Partnership’s customers and the transportation of the crude oil to refiners, to common carrier pipelines for ultimate delivery to refiners, or to terminalling and storage facilities owned by the Partnership and others. Revenue for the gathering and transportation of crude oil is recognized when the service is performed and is based upon regulated and non-regulated tariff rates and the related transport volumes. Producer field services revenue consists of a number of services ranging from gathering condensates from natural gas producers to hauling produced water to disposal wells. Revenue for producer field services is recognized when the service is performed.
Crude oil marketing revenues consist of sales proceeds recognized for the sale of crude oil to third party customers. Revenue for the sale of crude oil is recognized when title to the crude oil transfers to the customer and is based on contractual prices for the sale of crude oil.
Fuel surcharge revenues are comprised of revenues recognized for the reimbursement of fuel and power consumed to operate the Partnership’s asphalt product storage tanks and terminals. The Partnership recognizes fuel surcharge revenues in the period in which the related fuel and power expenses are incurred.
INCOME AND OTHER TAXES - For federal and most state income tax purposes, the majority of income, gains, losses, expenses, deductions and tax credits generated by the Partnership flow through to the unitholders of the Partnership. In 2007, the state of Texas implemented a partnership-level tax based on a percentage of the revenue earned for services provided in the state of Texas. The Partnership has estimated its liability related to this tax to be $0.4 million and $0.2 million for December 31, 2014 and 2015, respectively, which is reported as a provision for income taxes on its consolidated statements of operations. See Note 21 for a discussion of certain risks related to the Partnership’s ability to be treated as a partnership for federal income tax purposes.
STOCK BASED COMPENSATION - The Partnership’s general partner adopted the Blueknight Energy Partners G.P. L.L.C. Long-Term Incentive Plan (the “LTIP”). The compensation committee of the Board administers the LTIP. Effective April 29, 2014, the Partnership's unitholders approved an amendment to the LTIP to increase the number of common units reserved for issuance under the incentive plan by 1.5 million common units from 2.6 million common units to 4.1 million common units, subject to adjustment for certain events. Although other types of awards are contemplated under the LTIP, awards issued to date include “phantom” units, which convey the right to receive common units upon vesting, and “restricted” units, which are grants of common units restricted until the time of vesting. Certain of the phantom unit awards also include
F-9
distribution equivalent rights (“DERs”). A DER entitles the grantee to a cash payment equal to the cash distribution paid on an outstanding common unit prior to the vesting date of the underlying award. Cash distributions paid on DERs are accounted for as partnership distributions. Recipients of restricted units are entitled to receive cash distributions paid on common units during the vesting period.
The Partnership classifies unit award grants as either equity or liability awards. All award grants made under the LTIP from its inception through December 31, 2015 have been classified as equity awards. Fair value for award grants classified as equity is determined on the grant date of the award and this value is recognized as compensation expense ratably over the requisite service period of unit award grants, which generally is the vesting period. Fair value for equity awards is calculated as the closing price of the Partnership’s common units representing limited partner interests in the Partnership (“common units”) on the grant date and is reduced by the present value of estimated cash distributions to be paid on common units during the vesting period to the extent a unit award does not include DERs. Compensation expense related to unit-based payments is included in operating and general and administrative expenses on the Partnership’s consolidated statements of operations.
FAIR VALUE OF FINANCIAL INSTRUMENTS - The Partnership measures all financial instruments, including derivatives embedded in other contracts, at fair value and recognizes them in the consolidated balance sheet as an asset or a liability, depending on its rights and obligations under the applicable contract. The changes in the fair value of financial instruments are recognized currently in earnings in the consolidated statements of operations.
4. EQUITY METHOD INVESTMENT
The Partnership’s investment in Advantage Pipeline, over which the Partnership has significant influence but not control, is accounted for by the equity method. As of December 31, 2015, the Partnership's investment represents a 30% ownership interest in Advantage Pipeline.
Summarized financial information for Advantage Pipeline is set forth in the table below for the periods indicated.
As of December 31, | |||||||
2014 | 2015 | ||||||
Balance sheets | |||||||
Current assets | $ | 5,260 | $ | 2,496 | |||
Noncurrent assets | 77,398 | 86,702 | |||||
Total assets | $ | 82,658 | $ | 89,198 | |||
Current liabilities | 1,392 | $ | 2,534 | ||||
Long-term liabilities | 15,000 | 23,194 | |||||
Member’s equity | 66,266 | 63,470 | |||||
Total liabilities and member’s equity | $ | 82,658 | $ | 89,198 | |||
Year ended December 31, | |||||||||||
2013 | 2014 | 2015 | |||||||||
Income statements | |||||||||||
Operating revenues | $ | 645 | $ | 10,894 | $ | 26,398 | |||||
Net income (loss) | $ | (1,824 | ) | $ | 3,354 | $ | 14,909 | ||||
5. DISCONTINUED OPERATIONS
Northumberland, Pennsylvania Asphalt Facility
On November 1, 2013, the Partnership entered into a litigation settlement in which title to our Northumberland, Pennsylvania asphalt facility was conveyed on November 21, 2013 to the counterparty to the settlement agreement in return for complete indemnification from any and all environmental liabilities or lawsuits related to the facility (see Note 17). The Partnership recognized a loss on the disposal of the facility of $0.6 million. The financial results of the Partnership’s operations related to the Northumberland asphalt facility are reflected as discontinued operations in the consolidated statements of operations.
F-10
The amounts of revenue, costs and income taxes reported in discontinued operations are set forth in the table below for the periods indicated:
For the year ended December 31, | |||
2013 | |||
(in thousands) | |||
Total revenue | $ | 583 | |
Expenses: | |||
Operating | 149 | ||
Gain on sale of assets | (56 | ) | |
Loss on disposal of operations | 621 | ||
Loss from discontinued operations | $ | (131 | ) |
Basic and diluted loss from discontinued operations per common unit | $ | (0.01 | ) |
The following table discloses the major classes of discontinued assets and liabilities related to the Northumberland asphalt facility at the disposal date:
November 21, 2013 | |||
Northumberland asphalt facility | |||
(in thousands) | |||
Assets | |||
Accounts Receivable | $ | 4 | |
Plant, property and equipment, net | — | ||
Other assets | — | ||
Assets of discontinued operations | $ | 4 | |
Liabilities | |||
Accounts Payable | $ | 13 | |
Deferred Revenue | 28 | ||
Other liabilities | 84 | ||
Liabilities of discontinued operations | $ | 125 | |
Thompson to Webster Pipeline System
In 2013, the Partnership evaluated the costs associated with future maintenance of the Thompson to Webster Gathering System, and the potential future realizable cash flows from this pipeline were assessed. The Partnership determined that it was not economically feasible for it to continue to operate the pipeline. The Partnership assessed the recoverability of the carrying value of this asset and determined it was impaired. This resulted in $5.7 million of impairment expense being recorded in 2013, which reduced the carrying value of this pipeline to the discounted future net cash flows we expected to realize from this asset. During the discussions with the then-current shipper on necessary future maintenance and the possibility of idling the system, the shipper expressed interest in purchasing the system. On December 30, 2013, the sale to the shipper was finalized. The financial information of the Thompson to Webster pipeline facility is reflected as discontinued operations in the consolidated statements of operations.
Continuing cash flows were generated under a Transition Services Agreement with the purchaser. The term of the agreement was six months commencing December 31, 2013, and was cancellable by the purchaser with a 30 day notice. There was no renewal option. The Transition Services Agreement provided for a monthly fee of $15,000 and reimbursement of direct expenses. Direct expenses were insignificant. The Transition Services Agreement term expired on June 30, 2014.
F-11
The amounts of revenue, costs and income taxes reported in discontinued operations are set forth in the table below for the periods indicated:
For the year ended December 31, | |||
2013 | |||
Total revenue | $ | 2,302 | |
Expenses: | |||
Operating | 1,354 | ||
Gain on sale of assets | 1,532 | ||
Asset impairment expense | 5,732 | ||
Loss from discontinued operations | $ | (3,252 | ) |
Basic and diluted loss from discontinued operations per common unit | $ | (0.13 | ) |
The following table discloses the major classes of discontinued assets and liabilities related to the Thompson to Webster system at the disposal date:
December 30, 2013 | |||
Thompson to Webster pipeline system | |||
(in thousands) | |||
Assets | |||
Accounts Receivable | $ | 400 | |
Plant, property and equipment, net | 1,000 | ||
Assets of discontinued operations | $ | 1,400 | |
Liabilities | |||
Accounts Payable | $ | 1 | |
Deferred Revenue | 148 | ||
Other liabilities | 339 | ||
Liabilities of discontinued operations | $ | 488 | |
6. RESTRUCTURING CHARGES
During the fourth quarter of 2015, the Partnership recognized certain restructuring charges in our crude oil trucking and producer field services segment pursuant to an approved plan to exit the trucking market in West Texas. The following restructuring charges were accrued for as of December 31, 2015 and reported in operating expenses in the Partnership’s consolidated statement of operations for the year ended December 31, 2015.
For the year ended December 31, | |||
2015 | |||
(in thousands) | |||
Severance charges | $ | 315 | |
Lease payments related to operating leases for idled equipment | 1,250 | ||
Total restructuring costs | $ | 1,565 | |
F-12
Changes in the accrued amounts pertaining to the above charges are summarized as follows:
For the year ended December 31, | |||
2015 | |||
(in thousands) | |||
Beginning Balance | $ | — | |
Charged to expense | 1,565 | ||
Cash Payments | — | ||
Ending Balance | $ | 1,565 | |
These charges represent the total amount expected to be incurred in connection with the restructuring plan. The severance costs were paid in the first quarter of 2016 and the lease payments will be made over the remaining lease terms, which extend through July 2019.
7. PROPERTY, PLANT AND EQUIPMENT
Estimated Useful Lives (Years) | December 31, 2014 | December 31, 2015 | |||||||
(dollars in thousands) | |||||||||
Land | N/A | $ | 18,292 | $ | 19,680 | ||||
Land improvements | 10-20 | 6,398 | 6,382 | ||||||
Pipelines and facilities | 5-30 | 168,537 | 165,497 | ||||||
Storage and terminal facilities | 10-35 | 240,004 | 251,051 | ||||||
Transportation equipment | 3-10 | 13,557 | 13,728 | ||||||
Office property and equipment and other | 3-20 | 28,958 | 28,453 | ||||||
Pipeline linefill and tank bottoms | N/A | 10,186 | 3,474 | ||||||
Construction-in-progress | N/A | 16,671 | 30,636 | ||||||
Property, plant and equipment, gross | 502,603 | 518,901 | |||||||
Accumulated depreciation and impairments | (192,440 | ) | (205,967 | ) | |||||
Property, plant and equipment, net | $ | 310,163 | $ | 312,934 | |||||
Depreciation expense for the years ended December 31, 2013, 2014 and 2015 was $24.2 million, $26.0 million and $27.0 million, respectively. During the year ended December 31, 2013, the Partnership recorded fixed asset impairment expense of $5.9 million related to it’s crude oil pipeline services reporting unit and $1.0 million related to it’s asphalt terminalling services reporting unit. There was no impairment expense recorded during the year ended December 31, 2014. During the year ended December 31, 2015, the Partnership recorded fixed asset impairment expense of $14.0 million related to it’s crude oil pipeline services reporting unit and $0.5 million related to it’s crude oil trucking and field services reporting unit.
8. INTANGIBLES AND OTHER ASSETS, NET
Other assets, net of accumulated amortization, consist of the following (in thousands):
F-13
December 31, | |||||||
2014 | 2015 | ||||||
Customer relationships | $ | 661 | $ | 4,132 | |||
Deferred charges related to pipeline connection agreements | 671 | 2,627 | |||||
Deposits | 792 | 307 | |||||
Prepaid insurance | — | 12 | |||||
Other prepaid expenses | 67 | 70 | |||||
Intangibles and other assets, gross | 2,191 | 7,148 | |||||
Accumulated amortization of intangible assets | (135 | ) | (362 | ) | |||
Intangibles and other assets, net | $ | 2,056 | $ | 6,786 | |||
Amortization expense related to intangibles was less than $0.1 million for each of the years ended December 31, 2013 and 2014, and $0.2 million for the year ended December 31, 2015. The estimated aggregate amortization expense on amortizable intangible assets currently owned by the Partnership is as follows (in thousands):
For year ending: | |||
December 31, 2016 | $ | 435 | |
December 31, 2017 | 435 | ||
December 31, 2018 | 435 | ||
December 31, 2019 | 435 | ||
December 31, 2020 | 433 | ||
Thereafter | 4,224 | ||
Total estimated aggregate amortization expense | $ | 6,397 | |
In connection with the acquisition of a producer field services business in December 2010, the Partnership recorded intangibles for customer relationships of $0.7 million and a non-compete agreement of $0.2 million. Both of these assets relate to the crude oil trucking and producer field services operating segment. In December 2012, the non-compete agreement was determined to be impaired due to the death of the counterpart to the agreement and an impairment expense of $0.1 million was recognized. In connection with the acquisition of a pipeline and crude oil marketing business in November 2015, the Partnership recorded intangibles for customer relationships of $3.5 million in its crude oil pipeline services operating segment. The customer relationships are being amortized over a range of 4 to 20 years.
9. DEBT
On June 28, 2013, the Partnership entered into an amended and restated credit agreement which consists of a $400.0 million revolving loan facility. On September 15, 2014, the Partnership amended its credit facility to, among other things, amend the maximum permitted consolidated total leverage ratio as discussed below and to increase the limit on material project adjustments to EBITDA (as defined in the credit agreement).
As of March 3, 2016, approximately $269.0 million of revolver borrowings and $1.3 million of letters of credit were outstanding under the credit facility, leaving the Partnership with approximately $129.7 million available capacity for additional revolver borrowings and letters of credit under the credit facility, although the Partnership’s ability to borrow such funds may be limited by the financial covenants in the credit facility. The proceeds of loans made under the amended and restated credit agreement may be used for working capital and other general corporate purposes of the Partnership. All references herein to the credit agreement on or after June 28, 2013 refer to the amended and restated credit agreement, as amended on September 15, 2014.
The credit agreement is guaranteed by all of the Partnership’s existing subsidiaries. Obligations under the credit agreement are secured by first priority liens on substantially all of the Partnership’s assets and those of the guarantors.
The credit agreement includes procedures for additional financial institutions to become revolving lenders, or for any existing lender to increase its revolving commitment thereunder, subject to the consent of the new or increasing lenders and an aggregate maximum of $500.0 million for all revolving loan commitments under the credit agreement.
F-14
The credit agreement will mature on June 28, 2018, and all amounts outstanding under the credit agreement will become due and payable on such date. The Partnership may prepay all loans under the credit agreement at any time without premium or penalty (other than customary LIBOR breakage costs), subject to certain notice requirements. The credit agreement requires mandatory prepayments of amounts outstanding thereunder with the net proceeds from certain asset sales, property or casualty insurance claims, and condemnation proceedings, unless the Partnership reinvests such proceeds in accordance with the credit agreement, but these mandatory prepayments will not require any reduction of the lenders' commitments under the credit agreement.
Borrowings under the credit agreement bear interest, at the Partnership’s option, at either the reserve-adjusted eurodollar rate (as defined in the credit agreement) plus an applicable margin that ranges from 2.0% to 3.0% or the alternate base rate (the highest of the agent bank’s prime rate, the federal funds effective rate plus 0.5%, and the 30-day eurodollar rate plus 1%) plus an applicable margin that ranges from 1.0% to 2.0%. The Partnership pays a per annum fee on all letters of credit issued under the credit agreement, which fee equals the applicable margin for loans accruing interest based on the eurodollar rate, and the Partnership pays a commitment fee ranging from 0.375% to 0.5% on the unused commitments under the credit agreement. The credit agreement does not have a floor for the alternate base rate or the eurodollar rate. The applicable margins for the Partnership’s interest rate, the letter of credit fee and the commitment fee vary quarterly based on the Partnership’s consolidated total leverage ratio (as defined in the credit agreement, being generally computed as the ratio of consolidated total debt to consolidated earnings before interest, taxes, depreciation, amortization and certain other non-cash charges).
The credit agreement includes financial covenants that are tested on a quarterly basis, based on the rolling four-quarter period that ends on the last day of each fiscal quarter.
Prior to the date on which the Partnership issues qualified senior notes in an aggregate principal amount (when combined with all other qualified senior notes previously or concurrently issued) that equals or exceeds $200.0 million, the maximum permitted consolidated total leverage ratio is 4.50 to 1.00; provided that:
• | the maximum permitted consolidated total leverage ratio is 5.00 to 1.00 for the fiscal quarters ending March 31, 2016 through September 30, 2016, 4.75 to 1.00 for the fiscal quarter ending December 31, 2016, and 4.50 to 1.00 for each fiscal quarter thereafter; |
• | the Partnership may elect to increase the maximum permitted consolidated total leverage ratio to 5.50 to 1.00 for two consecutive fiscal quarters ending on or before September 30, 2016; and |
• | if the Partnership makes a specified acquisition (as defined in the credit agreement, but generally being an acquisition with consideration in excess of $10.0 million), the Partnership may elect to increase the maximum permitted consolidated total leverage ratio to 5.00 to 1.00 from and after the last day of the fiscal quarter immediately preceding the fiscal quarter in which such acquisition occurs to and including the last day of the second full fiscal quarter following the fiscal quarter in which such acquisition occurred. |
From and after the date on which the Partnership issues qualified senior notes in an aggregate principal amount (when combined with all other qualified senior notes previously or concurrently issued) that equals or exceeds $200.0 million, the maximum permitted consolidated total leverage ratio is 5.00 to 1.00; provided that the maximum permitted consolidated total leverage ratio is 5.50 to 1.00 for the fiscal quarters ending March 31, 2016 through September 30, 2016, and 5.00 to 1.00 for each fiscal quarter thereafter.
The maximum permitted consolidated senior secured leverage ratio (as defined in the credit agreement, but generally computed as the ratio of consolidated total secured debt to consolidated earnings before interest, taxes, depreciation, amortization and certain other non-cash charges) is 3.50 to 1.00, but this covenant is only tested from and after the date on which the Partnership issues qualified senior notes in an aggregate principal amount (when combined with all other qualified senior notes previously or concurrently issued) that equals or exceeds $200.0 million.
The minimum permitted consolidated interest coverage ratio (as defined in the credit agreement, but generally computed as the ratio of consolidated earnings before interest, taxes, depreciation, amortization and certain other non-cash charges to consolidated interest expense) is 2.50 to 1.00.
In addition, the credit agreement contains various covenants that, among other restrictions, limit the Partnership’s ability to:
• | create, issue, incur or assume indebtedness; |
• | create, incur or assume liens; |
• | engage in mergers or acquisitions; |
• | sell, transfer, assign or convey assets; |
F-15
• | repurchase the Partnership’s equity, make distributions to unitholders and make certain other restricted payments; |
• | make investments; |
• | modify the terms of certain indebtedness, or prepay certain indebtedness; |
• | engage in transactions with affiliates; |
• | enter into certain hedging contracts; |
• | enter into certain burdensome agreements; |
• | change the nature of the Partnership’s business; |
• | enter into operating leases; and |
• | make certain amendments to the Partnership’s partnership agreement. |
At December 31, 2015, the Partnership’s consolidated total leverage ratio was 3.75 to 1.00 and the consolidated interest coverage ratio was 6.54 to 1.00. The Partnership was in compliance with all covenants of its credit agreement as of December 31, 2015.
The credit agreement permits the Partnership to make quarterly distributions of available cash (as defined in the Partnership’s partnership agreement) to unitholders so long as no default or event of default exists under the credit agreement on a pro forma basis after giving effect to such distribution. The Partnership is currently allowed to make distributions to its unitholders in accordance with this covenant; however, the Partnership will only make distributions to the extent it has sufficient cash from operations after establishment of cash reserves as determined by the Board in accordance with the Partnership’s cash distribution policy, including the establishment of any reserves for the proper conduct of the Partnership’s business. See Note 11 for additional information regarding distributions.
In addition to other customary events of default, the Credit Agreement includes an event of default if (i) the General Partner ceases to own 100% of the Partnership’s general partner interest or ceases to control the Partnership, or (ii) Vitol Holding B.V. (together with its affiliates, “Vitol”) and Charlesbank Capital Partners, LLC cease to collectively own and control 50.0% or more of the membership interests of the General Partner
If an event of default relating to bankruptcy or other insolvency events occurs with respect to the General Partner or the Partnership, all indebtedness under the credit agreement will immediately become due and payable. If any other event of default exists under the credit agreement, the lenders may accelerate the maturity of the obligations outstanding under the credit agreement and exercise other rights and remedies. In addition, if any event of default exists under the credit agreement, the lenders may commence foreclosure or other actions against the collateral.
If any default occurs under the credit agreement, or if the Partnership is unable to make any of the representations and warranties in the credit agreement, the Partnership will be unable to borrow funds or have letters of credit issued under the credit agreement.
Upon the execution of the amended and restated credit agreement on June 28, 2013, the Partnership expensed $1.8 million of debt issuance costs related to the extinguished term loan, and the Partnership expensed $0.2 million in debt issuance costs related to its revolving loan facility, leaving a remaining balance of $0.5 million ascribed to those lenders with commitments under both the prior and the amended and restated credit facility. During the year ended December 31, 2013, the Partnership capitalized debt issuance costs of $0.2 million related to the prior credit facility. During the years ended December 31, 2013 and 2014, the Partnership capitalized debt issuance costs of $3.4 million and $0.3 million related to the current credit facility, respectively. During the year ended December 31, 2015, the Partnership capitalized no debt issuance costs related to the current credit facility. The debt issuance costs are being amortized over the term of the amended and restated credit agreement. Interest expense related to debt issuance cost amortization for the years ended December 31, 2013, 2014 and 2015 was $1.3 million, $0.8 million and $0.9 million, respectively, excluding the $1.8 million of debt issuance costs related to the extinguished term loan and $0.2 million in debt issuance costs related to the revolving loan facility that were expensed upon the execution of the amended and restated credit agreement in June of 2013.
During the years ended December 31, 2013, 2014 and 2015, the weighted average interest rate under the Partnership's credit agreement, excluding the $2.0 million of debt issuance costs related to the prior credit facility that was expensed during the year ended December 31, 2013, was 5.99%, 3.44% and 3.37%, respectively, resulting in interest expense of approximately $10.7 million, $9.2 million and $7.9 million, respectively. As of December 31, 2015, borrowings under the Partnership’s amended and restated credit agreement bore interest at a weighted average interest rate of 3.38%.
During the years ended December 31, 2013, 2014 and 2015, the Partnership capitalized interest of $1.0 million, $0.3 million and $0.2 million, respectively.
F-16
The Partnership is exposed to market risk for changes in interest rates related to its credit facility. Interest rate swap agreements are used to manage a portion of the exposure related to changing interest rates by converting floating-rate debt to fixed-rate debt. In March 2014 the Partnership entered into two interest rate swap agreements with an aggregate notional amount of $200.0 million. The first agreement has a notional amount of $100.0 million, became effective June 28, 2014, and matures on June 28, 2018. Under the terms of the first interest rate swap agreement, the Partnership pays a fixed rate of 1.45% and receives one-month LIBOR with monthly settlement. The second agreement has a notional amount of $100.0 million, became effective January 28, 2015, and matures on January 28, 2019. Under the terms of the second interest rate swap agreement, the Partnership pays a fixed rate of 1.97% and receives one-month LIBOR with monthly settlement. During the years ended December 31, 2014 and 2015, the Partnership recorded swap interest expense of $0.7 million and $2.9 million, respectively. The fair market value of the interest rate swaps at December 31, 2014 and 2015 is a liability of $2.6 million and $3.1 million, respectively, and is recorded in long-term derivative liabilities on the consolidated balance sheets. The interest rate swaps do not receive hedge accounting treatment under ASC 815 - Derivatives and Hedging. Changes in the fair value of the interest rate swaps are recorded in interest expense in the statements of operations.
10. NET INCOME PER LIMITED PARTNER UNIT
For purposes of calculating earnings per unit, the excess of distributions over earnings or excess of earnings over distributions for each period are allocated to the Partnership’s general partner based on the general partner’s ownership interest at the time. The following sets forth the computation of basic and diluted net income per common unit (in thousands, except per unit data):
Year ended December 31, | |||||||||||
2013 | 2014 | 2015 | |||||||||
Net income | $ | 28,035 | $ | 27,572 | $ | 6,396 | |||||
General partner interest in net income | 647 | 641 | 554 | ||||||||
Preferred interest in net income | 21,564 | 21,563 | 21,564 | ||||||||
Income (loss) available to limited partners | $ | 5,824 | $ | 5,368 | $ | (15,722 | ) | ||||
Basic and diluted weighted average number of units: | |||||||||||
Common units | 22,706 | 25,670 | 32,945 | ||||||||
Restricted and phantom units | 651 | 675 | 685 | ||||||||
Basic and diluted income (loss) from continuing operations per common unit | $ | 0.39 | $ | 0.20 | $ | (0.47 | ) | ||||
Basic and diluted loss from discontinued operations per common unit | $ | (0.14 | ) | $ | — | $ | — | ||||
Basic and diluted net income (loss) per common unit | $ | 0.25 | $ | 0.20 | $ | (0.47 | ) | ||||
11. PARTNERS’ CAPTIAL AND DISTRIBUTIONS
On September 22, 2014, the Partnership issued and sold 9,775,000 common units for a public offering price of $7.61, resulting in proceeds of approximately $71.2 million, net of underwriters' discount and offering expenses of $3.2 million. The Partnership intends to use the net proceeds from the offering for general partnership purposes, including the repayment of a portion of the outstanding borrowings under the Partnership's credit facility and partially funding the Knight Warrior pipeline project.
In accordance with the terms of its partnership agreement, each quarter the Partnership distributes all of its available cash (as defined in the partnership agreement) to its unitholders. Generally, distributions are allocated: first, 98.2% to the Series A Preferred Unitholders and 1.8% to its general partner until the Partnership distributes for each Series A Preferred Unit an amount equal to the Series A quarterly distribution amount discussed below; then 98.2% to the Series A Preferred Unitholders and 1.8% to its general partner until the Partnership distributes for each Series A Preferred Unit an amount equal to any Series A cumulative distribution arrearage; and, thereafter, 98.2% to the common unitholders and 1.8% to its general partner. Distributions are also paid to the holders of restricted units and phantom units as disclosed in Note 14.
F-17
In October 2010, pursuant to the terms of a global transaction agreement with Vitol and Charlesbank, the Partnership issued and sold 10,769,231 Preferred Units to each Purchaser (or 21,538,462 Preferred Units in the aggregate) for a cash purchase price of $6.50 per Preferred Unit, resulting in total gross proceeds of approximately $140.0 million.
These Preferred Units are convertible at the holders’ option into common units. The Preferred Units were issued at a discount to the market price of the common units into which they are convertible. This discount totaling $54.5 million represented a beneficial conversion feature and was reflected as an increase in common and subordinated unitholders’ capital and a decrease in Preferred Unitholders’ capital to reflect the fair value of the Preferred Units at issuance on the Partnership’s consolidated statement of changes in partners’ capital for the year ended December 31, 2010. The beneficial conversion feature was considered a dividend and was distributed ratably from the issuance date of October 25, 2010 through the first conversion date which is January 2012, resulting in an increase in preferred capital and a decrease in common and subordinated unitholders’ capital.
Holders of the Preferred Units are entitled to quarterly distributions of 2.75% per unit per quarter (or 11.0% per unit on an annual basis). If the Partnership fails to pay in full any distribution on the Preferred Units, the amount of such unpaid distribution will accrue and accumulate from the last day of the quarter for which such distribution is due until paid in full.
The Partnership paid distributions totaling $21.6 million during 2013 on the Preferred Units for the quarters ending December 31, 2012, March 31, 2013, June 30, 2013 and September 30, 2013. The Partnership paid distributions totaling $21.6 million during 2014 on the Preferred Units for the quarters ending December 31, 2013, March 31, 2014, June 30, 2014 and September 30, 2014. The Partnership paid distributions totaling $21.6 million during 2015 on the Preferred Units for the quarters ending December 31, 2015, March 31, 2015, June 30, 2015 and September 30, 2015. On January 20, 2016, the Board approved a distribution of $0.17875 per Preferred Unit, or a total distribution of $5.4 million, for the quarter ending December 31, 2015. The Partnership paid this distribution on the Preferred Units on February 12, 2016 to unitholders of record as of February 2, 2016.
The Partnership paid distributions totaling $11.8 million during 2013 on the common units for the quarters ending December 31, 2012, March 31, 2013, June 30, 2013 and September 30, 2013. Of the $11.8 million paid during 2013, approximately $0.7 million and $0.3 million was paid to the Partnership's general partner and to holders of phantom and restricted units under the LTIP, respectively. The Partnership paid distributions totaling $14.5 million during 2014 on the common units for the quarters ending December 31, 2013, March 31, 2014, June 30, 2014 and September 30, 2014. Of the $14.5 million paid during 2014, approximately $0.8 million and $0.3 million was paid to the Partnership's general partner and to holders of phantom and restricted units under the LTIP, respectively. The Partnership paid distributions totaling $20.0 million during 2015 on the common units for the quarters ending December 31, 2014, March 31, 2015, June 30, 2015 and September 30, 2015. Of the $20.0 million paid during 2015, approximately $1.1 million and $0.4 million was paid to the Partnership's general partner and to holders of phantom and restricted units under the LTIP, respectively. In addition, on January 20, 2016, the Board declared a cash distribution of $0.1450 per unit on its outstanding common units for the quarter ending December 31, 2015. The distribution was paid on February 12, 2016 to unitholders of record on February 2, 2016. The total distribution was approximately $5.2 million, with approximately $4.8 million and $0.3 million paid to the Partnership’s common unitholders and general partner, respectively, and $0.1 million paid to holders of phantom and restricted units pursuant to awards granted under the LTIP.
12. MAJOR CUSTOMERS AND CONCENTRATION OF CREDIT RISK
For the year ended December 31, 2015, Ergon Asphalt & Emulsions, Heartland Asphalt Materials, Inc., Suncor Energy USA, Axeon Marketing, LLC and Western States Asphalt, Inc. each accounted for at least 10% but not more than 25% of asphalt terminalling services revenue. Vitol accounted for at least 45% but not more than 50% of total crude oil terminalling and storage revenue, and MV Purchasing, LLC and Sunoco Partners Marketing & Terminals, L.P. each accounted for at least 10% but not more than 20% of total crude oil terminalling and storage revenue. Vitol accounted for at least 30% but not more than 35% of crude oil pipeline services revenue, and XTO Energy, Inc. and Valero Marketing & Supply Co. each accounted for at least 10% but no more than 25% of crude oil pipeline services revenue in 2015. Vitol accounted for at least 40% but no more than 45% of crude oil trucking and producer field services revenue, and MV Purchasing, LLC and Devon Energy Production Co. accounted for at least 10% but not more than 25% of crude oil trucking and producer field services revenue in 2015. Vitol and Coffeyville Resources each comprised at least 15% but not more than 20% of total accounts receivable at December 31, 2015.
For the year ended December 31, 2014, Ergon Asphalt & Emulsions, Heartland Asphalt Materials, Inc., Axeon Marketing, LLC and Suncor Energy USA accounted for at least 10% but not more than 25% of asphalt terminalling services revenue. Vitol accounted for at least 50% but not more than 60% of total crude oil terminalling and storage revenue, and MV Purchasing, LLC
F-18
accounted for at least 10% but not more than 20% of total crude oil terminalling and storage revenue. Vitol and XTO Energy Inc. each accounted for at least 20% but no more than 30% of crude oil pipeline services revenue in 2014. Vitol and MV Purchasing, LLC accounted for at least 25% but not more than 40% of crude oil trucking and producer field services revenue in 2014. Vitol comprised 20% of total accounts receivable at December 31, 2014.
For the twelve months ended December 31, 2013, Ergon Asphalt & Emulsions, Heartland Asphalt Materials, Inc., Nustar Marketing, LLC and Suncor Energy USA accounted for at least 10% but not more than 25% of asphalt services revenue. Vitol accounted for at least 60% but not more than 70% of total crude oil terminalling and storage revenue, and MV Purchasing, LLC accounted for at least 10% but not more than 20% of total crude oil terminalling and storage revenue. Vitol, Valero Marketing and Supply Co. and ExxonMobil Corporation each accounted for at least 10% but no more than 35% of crude oil pipeline services revenue in 2013. Vitol and MV Purchasing, LLC accounted for at least 15% but not more than 30% of crude oil trucking and producer field services revenue in 2013.
Financial instruments that potentially subject the Partnership to concentrations of credit risk consist principally of trade receivables. The Partnership’s accounts receivable are primarily from producers, purchasers and shippers of crude oil and asphalt product and at times will include Vitol. This industry concentration has the potential to impact the Partnership’s overall exposure to credit risk in that the customers may be similarly affected by changes in economic, industry or other conditions. The Partnership periodically reviews credit exposure and financial information of its counterparties.
13. RELATED PARTY TRANSACTIONS
The Partnership provides crude oil gathering, transportation, terminalling and storage services to Vitol as well as certain operating, strategic assessment, economic evaluation and project design services. For the years ended December 31, 2013, 2014 and 2015, the Partnership recognized revenues of $51.2 million, $41.8 million and $37.8 million, respectively, for services provided to Vitol. As of December 31, 2014, and 2015 the Partnership had receivables, net of allowances for doubtful accounts, from Vitol of $2.3 million and $1.8 million, respectively.
The Partnership also provides operating and administrative services to Advantage Pipeline. For the years ended December 31, 2013, 2014 and 2015, the Partnership recognized revenues of $0.6 million, $1.0 million and $1.3 million, respectively, for services provided to Advantage Pipeline. As of both December 31, 2014 and 2015, the Partnership had receivables from Advantage Pipeline of less than $0.1 million.
Vitol Storage Agreements
In recent years, a significant portion of the Partnership’s crude oil storage capacity has been dedicated to Vitol under multiple agreements. As of December 31, 2013, 2014 and 2015, 4.1 million barrels, 3.1 million barrels and 2.2 million barrels of storage capacity, respectively, were dedicated to Vitol under these storage agreements. As of December 31, 2015, 2.2 million barrels of storage capacity were dedicated to Vitol under one storage agreement. Service revenues under these agreements are based on the barrels of storage capacity dedicated to Vitol under the applicable agreement at rates that, the Partnership believes, are fair and reasonable to the Partnership and its unitholders and are comparable with the rates the Partnership charges third parties. The Board’s conflicts committee reviewed and approved these agreements in accordance with the Partnership’s procedures for approval of related party transactions and the provisions of the partnership agreement. The Partnership generated revenues under these agreements of approximately $17.6 million, $12.0 million and $9.4 million for the years ended December 31, 2013, 2014 and 2015, respectively.
As of March 3, 2016, 2.2 million barrels of storage capacity were dedicated to Vitol under the crude oil storage agreement with the current term expiring on May 1, 2017.
Vitol Throughput Capacity Agreement
In August 2010, the Partnership and Vitol entered into a Throughput Capacity Agreement (the “ENPS Throughput Agreement”). Pursuant to the ENPS Throughput Agreement, Vitol purchased 100% of the throughput capacity on the Partnership’s Eagle North pipeline system (“ENPS”). The Partnership put ENPS in service in December 2010. In September 2010, Vitol paid the Partnership a prepaid fee equal to $5.5 million, and Vitol agreed to pay additional usage fees for every barrel delivered by or on behalf of Vitol on ENPS. This $5.5 million fee received from Vitol was accounted for as a long-term payable to a related party. In addition, if the payments made by Vitol in any contract year under the ENPS Throughput Agreement were in the aggregate less than $2.4 million, then Vitol was obligated to pay the Partnership a deficiency payment equal to $2.4 million minus the aggregate amount of all payments made by Vitol during such contract year. In March 2012, the Partnership received a deficiency payment of $0.3 million from Vitol in relation to the 2011 contract year. In February 2013,
F-19
the Partnership received a deficiency payment of $0.2 million from Vitol in relation to the 2012 contract year. The ENPS Throughput Agreement was approved by the Board’s conflicts committee in accordance with the Partnership’s procedures for approval of related party transactions and the provisions of its partnership agreement.
During the year ended December 31, 2013, the Partnership incurred interest expense under this agreement of approximately $0.1 million. The agreement had an effective annual interest rate of 14.1%. In April 2013, the Partnership repurchased 100% of the throughput capacity on ENPS from Vitol for $2.5 million, and the ENPS Throughput Agreement was terminated.
Vitol Operating and Maintenance Agreement
In August 2011, the Partnership and Vitol entered into an operating and maintenance agreement (the “Vitol O&M Agreement”) relating to the operation and maintenance of Vitol’s crude oil terminal located in Midland, Texas (the “Midland Terminal”) and Vitol's crude oil gathering system located near Midland, Texas (the “Midland Gathering System”. Pursuant to the Vitol O&M Agreement, the Partnership provides certain operating and maintenance services with respect to the Midland Terminal and Midland Gathering System. The five year term of the Vitol O&M Agreement commenced on September 1, 2012. During the years ended December 31, 2013, 2014 and 2015, the Partnership generated revenues of $0.8 million, $1.6 million and $2.5 million, respectively, under the Vitol O&M Agreement. The Vitol O&M Agreement was terminated in July 2015. Revenues for the year ended December 31, 2015 include a termination fee of $1.2 million and transition services fees of $0.1 million. The Partnership believes that the rates it charged Vitol under the Vitol O&M Agreement were fair and reasonable to the Partnership and its unitholders and were comparable with the rates the Partnership charges third parties. The Board’s conflicts committee reviewed and approved the Vitol O&M Agreement in accordance with the Partnership’s procedures for approval of related party transactions and the provisions of the partnership agreement.
Vitol Shared Services Agreement
In August 2012, the Partnership and Vitol entered into a shared services agreement (the “Vitol Shared Services Agreement”) pursuant to which the Partnership provides Vitol certain strategic assessment, economic evaluation and project design services. The original term of the Vitol Shared Services Agreement commenced on August 1, 2012 and continued for one year. In August 2013, the term of the Vitol Shared Services Agreement was automatically renewed for one year. The Vitol Shared Services Agreement was terminated in March 2015. During the years ended December 31, 2013, 2014 and 2015, the Partnership generated revenues of $0.2 million, $0.1 million and less than $0.1 million, respectively, under the Vitol Shared Services Agreement. The Partnership believes that the rates it charges Vitol under the Vitol Shared Services Agreement are fair and reasonable to the Partnership and its unitholders. The Board’s conflicts committee reviewed and approved the Vitol Shared Services Agreement in accordance with the Partnership’s procedures for approval of related party transactions and the provisions of the partnership agreement.
Vitol’s Commitment under the Partnership’s Prior Credit Agreement
Vitol was a lender under the Partnership’s prior credit agreement and committed to loan the Partnership $15.0 million pursuant to such agreement. During the year ended December 31, 2013, Vitol received its pro rata portion of the interest payments in connection with being a lender under the credit agreement and received approximately $0.3 million in connection therewith. Vitol is not a lender under the Partnership’s amended and restated credit agreement.
Eaglebine Crude Oil Throughput and Deficiency Agreement
On August 29, 2014 the Partnership entered into a Crude Oil Throughput and Deficiency Agreement with Eaglebine Crude Oil Marketing LLC (“Eaglebine Crude”), a joint venture partly owned by Vitol Inc. effective as of August 28, 2014, pursuant to which the Partnership will provide certain crude oil transportation services on the Knight Warrior Pipeline for Eaglebine Crude. On August 5, 2014, the Partnership announced its intention to build the Knight Warrior Pipeline, which will link the emerging East Texas Woodbine/Eaglebine crude oil resource play to Oiltanking Houston, a crude oil and product terminal on the Houston Ship Channel, owned and operated by Oiltanking Partners, L.P. Eaglebine Crude will pay throughput fees under the Agreement based on Eaglebine Crude’s per barrel daily volume commitment of at least 40,000 barrels per day (subject to possible adjustments under certain conditions). The term of the Agreement is for five years beginning on the first day of the month following the date that is thirty days after the Partnership notifies Eaglebine Crude that the Knight Warrior Pipeline is complete. Fifty percent of the membership interests of Blueknight Energy Partners G.P., L.L.C., the general partner of the Partnership, are indirectly owned by Blueknight Energy Holding, Inc. Blueknight Energy Holding, Inc. and Eaglebine Crude are affiliated entities as both companies are indirectly owned or controlled by Vitol Holding B.V. The Partnership believes that the rates it will charge Eaglebine Crude under this agreement are fair and reasonable to the Partnership and its unitholders and are
F-20
comparable with the rates the Partnership charges third parties. The Board’s conflicts committee reviewed and approved this agreement, including the amendments thereto, in accordance with the Partnership's procedures for approval of related party transactions and the provisions of the partnership agreement.
While the Knight Warrior Pipeline continues to be in the Partnership’s plans, the project is currently on hold and the Partnership is approaching it very cautiously as a result of the significant decline in the market price for crude oil, reduced area crude oil rig counts and crude oil production as well as the increased cost of capital. The Eaglebine Crude contract is not impacted by the project delay.
Advantage Pipeline Operating and Administrative Services Agreement
In January 2013, the Partnership and Advantage Pipeline entered into an operating and administrative services agreement (the “Advantage O&A Services Agreement”) pursuant to which the Partnership operates Advantage Pipeline’s Pecos River Pipeline in west Texas. Under the Advantage O&A Services Agreement, the Partnership provides certain administrative services to Advantage Pipeline. The initial term of the Advantage O&A Services Agreement commenced on January 31, 2013 and shall continue for ten years, with the Partnership and Advantage Pipeline each having an option to extend the term for an additional five years. During the years ended December 31, 2013, 2014 and 2015, the Partnership earned revenues of $0.3 million, $0.5 million and $0.5 million, respectively, under this agreement.
14. LONG-TERM INCENTIVE PLAN
In July 2007, the General Partner adopted the LTIP. The compensation committee of the Board administers the LTIP. Effective April 29, 2014, the Partnership’s unitholders approved an amendment to the LTIP to increase the number of common units reserved for issuance under the incentive plan to 4.1 million common units, subject to adjustment for certain events. Although other types of awards are contemplated under the LTIP, currently outstanding awards include “phantom” units, which convey the right to receive common units upon vesting, and “restricted” units, which are grants of common units restricted until the time of vesting. Certain of the phantom unit awards also include distribution equivalent rights (“DERs”).
Subject to applicable earning criteria, a DER entitles the grantee to a cash payment equal to the cash distribution paid on an outstanding common unit prior to the vesting date of the underlying award. Recipients of restricted units are entitled to receive cash distributions paid on common units during the vesting period which distributions are reflected initially as a reduction of partners’ capital. Distributions paid on units which ultimately do not vest are reclassified as compensation expense. Awards granted to date are equity awards and, accordingly, the fair value of the awards as of the grant date is expensed over the vesting period.
In connection with each anniversary of joining the Board, restricted common units are granted to the independent directors. The units vest in one-third increments over three years. The following table includes information on grants made to the directors under the LTIP:
Grant Date | Number of Units | Weighted Average Grant Date Fair Value | Grant Date Total Fair Value | |||||||
(in thousands) | ||||||||||
December 2013 | 7,500 | $ | 8.62 | $ | 65 | |||||
December 2014 | 7,500 | 6.43 | 48 | |||||||
December 2015 | 15,120 | 5.06 | 77 | |||||||
Additionally, in December 2015, 14,112 common units were granted that have no vesting requirements. This grant was made as part of the independent directors’ compensation. The fair value of this grant was $0.1 million.
The Partnership also grants phantom units to employees. These grants are equity awards under ASC 718 – Stock Compensation, and, accordingly, the fair value of the awards as of the grant date is expensed over the vesting period. The following table includes information on the outstanding grants:
F-21
Grant Date | Number of Units | Weighted Average Grant Date Fair Value | Grant Date Total Fair Value | |||||||
(in thousands) | ||||||||||
March 2013 | 251,106 | $ | 8.75 | $ | 2,197 | |||||
March 2014 | 276,773 | 9.06 | 2,508 | |||||||
March 2015 | 266,076 | 7.74 | 2,059 | |||||||
The unrecognized estimated compensation cost of outstanding phantom units at December 31, 2015 was $2.2 million, which will be recognized over the remaining vesting period. On January 1, 2016, 195,625 units of the March 2013 grant vested.
In September 2012, Mark Hurley was granted 500,000 phantom units under the LTIP upon his employment as the Chief Executive Officer of the General Partner. These grants are equity awards under ASC 718 – Stock Compensation, and, accordingly, the fair value of the awards as of the grant date is expensed over the vesting period. These units vest ratably over five years pursuant to the Employee Phantom Unit Agreement between Mr. Hurley and the General Partner and do not include DERs. The weighted average grant date fair value for the units of $5.62 was determined based on the closing market price of the Partnership’s common units on the grant date of the award, less the present value of the estimated distributions to be paid to holders of an outstanding common unit prior to the vesting of the underlying award. The value of this award grant was approximately $2.8 million on the grant date, and the unrecognized estimated compensation cost at December 31, 2015 was $1.0 million and will be expensed over the remaining vesting period.
The Partnership’s equity-based incentive compensation expense was $2.3 million for each of the years ended December 31, 2013 and 2014, and $2.7 million for the year ended December 31, 2015.
Activity pertaining to phantom common units and restricted common unit awards granted under the LTIP is as follows:
Number of Units | Weighted Average Grant Date Fair Value | |||||
Nonvested at December 31, 2014 | 1,020,264 | $ | 7.46 | |||
Granted | 295,308 | 7.47 | ||||
Vested | 349,426 | 6.39 | ||||
Forfeited | 50,605 | 8.65 | ||||
Nonvested at December 31, 2015 | 915,541 | $ | 7.81 | |||
15. EMPLOYEE BENEFIT PLAN
Under the Partnership’s 401(k) Plan, which was instituted in 2009, employees who meet specified service requirements may contribute a percentage of their total compensation, up to a specified maximum, to the 401(k) Plan. The Partnership may match each employee’s contribution, up to a specified maximum, in full or on a partial basis. The Partnership recognized expense of $1.4 million, $1.5 million and $1.5 million for the years ended December 31, 2013, 2014, and 2015 for discretionary contributions under the 401(k) Plan.
The Partnership may also make annual lump-sum contributions to the 401(k) Plan irrespective of the employee’s contribution match. The Partnership may make a discretionary annual contribution in the form of profit sharing calculated as a percentage of an employee’s eligible compensation. This contribution is retirement income under the qualified 401(k) Plan. Annual profit sharing contributions to the 401(k) Plan are submitted to and approved by the Board. The Partnership recognized expense of $0.8 million, $0.9 million and $0.9 million for each of the years ended December 31, 2013, 2014, and 2015, for discretionary profit sharing contributions under the 401(k) Plan.
16. PROFITS INTEREST OF BLUEKNIGHT GP HOLDING, LLC
In October 2012, the owners of Blueknight GP Holding, LLC (“HoldCo”), the owner of the General Partner, admitted Mr. Hurley as a member of HoldCo. In connection with his admission as a member of HoldCo, Mr. Hurley was issued a non-voting economic interest in HoldCo (the “Profits Interest”). Mr. Hurley’s Profits Interest in HoldCo will vest in 20% increments on each of October 4, 2013, 2014, 2015, 2016 and 2017 and entitle Mr. Hurley, to the extent vested, to (i) 2% of the total amount of proceeds and/or distributions in excess of $100,000,000 received by HoldCo in connection with a transaction resulting in a
F-22
change of control of the Partnership, and (ii) 2% of the portion of any interim quarterly distribution received by HoldCo in excess of $1,250,000. As of December 31, 2015, 60% of the Profits Interest is vested.
Although the entire economic burden of the Profits Interest, which is equity classified, is borne solely by HoldCo and does not impact the Partnership’s cash or units outstanding, the intent of the Profits Interest is to provide a performance incentive and encourage retention of Mr. Hurley. Therefore, the Partnership recognizes the grant date fair value of the Profits Interest as compensation expense over the service period. The expense is also reflected as a capital contribution and thus, results in a corresponding credit to Partners’ Capital in the Partnership’s Consolidated Financial Statements. The Partnership recognized expense of $0.1 million in relation to the Profits Interest for each of years ended December 31, 2013, 2014 and 2015 .
17. COMMITMENTS AND CONTINGENCIES
The Partnership leases certain real property, equipment and operating facilities under various operating and capital leases. It also incurs costs associated with leased land, rights-of-way, permits and regulatory fees, the contracts for which generally extend beyond one year but can be cancelled at any time should they not be required for operations. Future non-cancellable commitments related to these items at December 31, 2015, are summarized below (in thousands):
Operating Leases | |||
For years ending: | |||
December 31, 2015 | $ | 5,686 | |
December 31, 2016 | 4,560 | ||
December 31, 2017 | 3,841 | ||
December 31, 2018 | 2,594 | ||
December 31, 2019 | 1,205 | ||
Thereafter | 746 | ||
Total future minimum lease payments | $ | 18,632 | |
Rental expense related to operating leases was $7.5 million, $8.4 million and $9.5 million for each of the years ended December 31, 2013, 2014 and 2015, respectively.
The Partnership is from time to time subject to various legal actions and claims incidental to its business. Management believes that these legal proceedings will not have a material adverse effect on the financial position, results of operations or cash flows of the Partnership. Once management determines that information pertaining to a legal proceeding indicates that it is probable that a liability has been incurred and the amount of such liability can be reasonably estimated, an accrual is established equal to its estimate of the likely exposure.
On February 6, 2012, the Partnership filed suit against SemCorp and others in Oklahoma County District Court. In the suit, the Partnership was seeking a judgment that SemCorp immediately return approximately 140,000 barrels of crude oil linefill belonging to the Partnership, and the Partnership was seeking judgment in an amount in excess of $75,000 for actual damages, special damages, punitive damages, pre-judgment interest, reasonable attorney’s fees and costs, and such other relief that the Court deems equitable and just. In September 2015, this lawsuit was resolved among all parties under the terms of a confidential settlement agreement in which all parties continue to expressly deny liability for any claim or counterclaim asserted against them. In connection with the settlement, the Partnership recognized a $6.0 million gain on the sale of crude oil pipeline linefill and storage tank bottoms.
The Partnership may become the subject of additional private or government actions regarding these matters in the future. Litigation may be time-consuming, expensive and disruptive to normal business operations, and the outcome of litigation is difficult to predict. The defense of these lawsuits may result in the incurrence of significant legal expense, both directly and as the result of the Partnership’s indemnification obligations. The litigation may also divert management’s attention from the Partnership’s operations which may cause its business to suffer. An unfavorable outcome in any of these matters may have a material adverse effect on the Partnership’s business, financial condition, results of operations, cash flows, ability to make distributions to its unitholders, the trading price of the Partnership’s common units and its ability to conduct its business. All or a portion of the defense costs and any amount the Partnership may be required to pay to satisfy a judgment or settlement of these claims may or may not be covered by insurance.
F-23
The Partnership has contractual obligations to perform dismantlement and removal activities in the event that some of its asphalt product and residual fuel oil terminalling and storage assets are abandoned. These obligations include varying levels of activity including completely removing the assets and returning the land to its original state. The Partnership has determined that the settlement dates related to the retirement obligations are indeterminate. The assets with indeterminate settlement dates have been in existence for many years and with regular maintenance will continue to be in service for many years to come. Also, it is not possible to predict when demands for the Partnership’s terminalling and storage services will cease, and the Partnership does not believe that such demand will cease for the foreseeable future. Accordingly, the Partnership believes the date when these assets will be abandoned is indeterminate. With no reasonably determinable abandonment date, the Partnership cannot reasonably estimate the fair value of the associated asset retirement obligations. Management believes that if the Partnership’s asset retirement obligations were settled in the foreseeable future the potential cash flows that would be required to settle the obligations based on current costs are not material. The Partnership will record asset retirement obligations for these assets in the period in which sufficient information becomes available for it to reasonably determine the settlement dates.
18. ENVIRONMENTAL REMEDIATION
The Partnership maintains insurance of various types with varying levels of coverage that it considers adequate under the circumstances to cover its operations and properties. The insurance policies are subject to deductibles and retention levels that the Partnership considers reasonable and not excessive. Consistent with insurance coverage generally available in the industry, in certain circumstances the Partnership’s insurance policies provide limited coverage for losses or liabilities relating to gradual pollution, with broader coverage for sudden and accidental occurrences. Although the Partnership maintains a program designed to prevent and, as applicable, to detect and address such releases promptly, damages and liabilities incurred due to environmental releases from its assets may substantially affect its business.
At December 31, 2014 and 2015, the Partnership was aware of existing conditions that may cause it to incur expenditures in the future for the remediation of existing contamination. The Partnership recorded loss contingencies related to environmental matters of $0.2 million and less than $0.1 million as of December 31, 2014 and 2015, respectively. Changes in the Partnership’s estimates and assumptions may occur as a result of the passage of time and the occurrence of future events.
19. FAIR VALUE MEASUREMENTS
The Partnership utilizes a three-tier framework for assets and liabilities required to be measured at fair value. In addition, the Partnership uses valuation techniques, such as the market approach (comparable market prices), the income approach (present value of future income or cash flow), and the cost approach (cost to replace the service capacity of an asset or replacement cost) to value these assets and liabilities as appropriate. The Partnership uses an exit price when determining the fair value. The exit price represents amounts that would be received to sell an asset or paid to transfer a liability in an orderly transaction between market participants.
The Partnership utilizes a three-tier fair value hierarchy that prioritizes the inputs to valuation techniques used to measure fair value into three broad levels. The following is a brief description of those three levels:
Level 1 | Observable inputs such as quoted prices (unadjusted) in active markets for identical assets or liabilities. |
Level 2 | Inputs other than quoted prices that are observable for these assets or liabilities, either directly or indirectly. These include quoted prices for similar assets or liabilities in active markets and quoted prices for identical or similar assets or liabilities in markets that are not active. |
Level 3 | Unobservable inputs in which there is little market data, which requires the reporting entity to develop its own assumptions. |
This hierarchy requires the use of observable market data, when available, to minimize the use of unobservable inputs when determining fair value. In periods in which they occur, the Partnership recognizes transfers into and out of Level 3 as of the end of the reporting period. Transfers out of Level 3 represent existing assets and liabilities that were classified previously as Level 3 for which the observable inputs became a more significant portion of the fair value estimates. Determining the appropriate classification of the Partnership’s fair value measurements within the fair value hierarchy requires management’s judgment regarding the degree to which market data is observable or corroborated by observable market data.
The Partnership’s recurring financial assets and liabilities subject to fair value measurements and the necessary disclosures are as follows (in thousands):
F-24
Fair Value Measurements as of December 31, 2014 | |||||||||||||||
Description | Total | Quoted Prices in Active Markets for Identical Assets (Level 1) | Significant Other Observable Inputs (Level 2) | Significant Unobservable Inputs (Level 3) | |||||||||||
Liabilities: | |||||||||||||||
Interest rate swap liabilities | $ | 2,634 | $ | — | $ | 2,634 | $ | — | |||||||
Total | $ | 2,634 | $ | — | $ | 2,634 | $ | — | |||||||
Fair Value Measurements as of December 31, 2015 | |||||||||||||||
Description | Total | Quoted Prices in Active Markets for Identical Assets (Level 1) | Significant Other Observable Inputs (Level 2) | Significant Unobservable Inputs (Level 3) | |||||||||||
Liabilities: | |||||||||||||||
Interest rate swap liabilities | $ | 3,103 | $ | — | $ | 3,103 | $ | — | |||||||
Total | $ | 3,103 | $ | — | $ | 3,103 | $ | — | |||||||
Fair Value of Other Financial Instruments
The following disclosure of the estimated fair value of financial instruments is made in accordance with accounting guidance for financial instruments. The Partnership has determined the estimated fair values by using available market information and valuation methodologies. Considerable judgment is required in interpreting market data to develop the estimates of fair value. The use of different market assumptions or valuation methodologies may have a material effect on the estimated fair value amounts.
At December 31, 2015, the carrying values on the consolidated balance sheets for cash and cash equivalents (classified as Level 1), accounts receivable and accounts payable approximate their fair value because of their short term nature.
Based on the borrowing rates currently available to the Partnership for credit agreement debt with similar terms and maturities and consideration of the Partnership’s non-performance risk, long-term debt associated with the Partnership’s credit agreement at December 31, 2015 approximates its fair value. The fair value of the Partnership’s long-term debt was calculated using observable inputs (LIBOR for the risk free component) and unobservable company-specific credit spread information. As such, the Partnership considers this debt to be Level 3.
20. OPERATING SEGMENTS
The Partnership’s operations consist of four operating segments: (i) asphalt terminalling services, (ii) crude oil terminalling and storage services, (iii) crude oil pipeline services and (iv) crude oil trucking and producer field services.
ASPHALT TERMINALLING SERVICES —The Partnership provides asphalt product and residual fuel terminalling, storage and blending services at its 45 terminalling and storage facilities located in 23 states.
CRUDE OIL TERMINALLING AND STORAGE SERVICES —The Partnership provides crude oil terminalling and storage services at its terminalling and storage facilities located in Oklahoma and Texas.
CRUDE OIL PIPELINE SERVICES —The Partnership owns and operates three pipeline systems, the Mid-Continent system, the East Texas system and Eagle North system, that gather crude oil purchased by its customers and transports it to refiners, to common carrier pipelines for ultimate delivery to refiners or to terminalling and storage facilities owned by the Partnership and others. The Partnership refers to its pipeline system located in Oklahoma and the Texas Panhandle as the Mid-Continent system. It refers to its second pipeline system, which is located in Texas, as the East Texas system. The Partnership refers to its third system, originating in Cushing, Oklahoma and terminating in Ardmore, Oklahoma, as the Eagle North system.
F-25
CRUDE OIL TRUCKING AND PRODUCER FIELD SERVICES — The Partnership uses its owned and leased tanker trucks to gather crude oil for its customers at remote wellhead locations generally not covered by pipeline and gathering systems and to transport the crude oil to aggregation points and storage facilities located along pipeline gathering and transportation systems. Crude oil producer field services consist of a number of producer field services, ranging from gathering condensates from natural gas companies to hauling produced water to disposal wells.
The Partnership’s management evaluates performance based upon segment operating margin, which includes revenues from related parties and external customers and operating expenses excluding depreciation and amortization. The non-GAAP measure of operating margin (in the aggregate and by segment) is presented in the following table. The Partnership computes the components of operating margin by using amounts that are determined in accordance with GAAP. A reconciliation of operating margin to income before income taxes, which is its nearest comparable GAAP financial measure, is included in the following table. The Partnership believes that investors benefit from having access to the same financial measures being utilized by management. Operating margin is an important measure of the economic performance of the Partnership’s core operations. This measure forms the basis of the Partnership’s internal financial reporting and is used by its management in deciding how to allocate capital resources among segments. Income before income taxes, alternatively, includes expense items, such as depreciation and amortization, general and administrative expenses and interest expense, which management does not consider when evaluating the core profitability of the Partnership’s operations.
The following table reflects certain financial data for each segment for the periods indicated (in thousands):
F-26
For the year ended December 31, | |||||||||||
2013 | 2014 | 2015 | |||||||||
Asphalt Terminalling Services | |||||||||||
Service revenue | |||||||||||
Third party revenue | $ | 63,803 | $ | 66,273 | $ | 72,152 | |||||
Related party revenue | 1,944 | 1,119 | 1,278 | ||||||||
Total revenue for reportable segments | 65,747 | 67,392 | 73,430 | ||||||||
Operating expenses (excluding depreciation and amortization) | 24,779 | 26,148 | 25,218 | ||||||||
Operating margin (excluding depreciation and amortization) | 40,968 | 41,244 | 48,212 | ||||||||
Additions to long-lived assets | 6,052 | 6,766 | 19,769 | ||||||||
Total assets (end of period) | $ | 100,345 | $ | 92,628 | $ | 98,848 | |||||
Crude Oil Terminalling and Storage Services | |||||||||||
Service revenue | |||||||||||
Third party revenue | $ | 11,910 | $ | 9,258 | $ | 13,076 | |||||
Related party revenue | 19,148 | 13,524 | 11,522 | ||||||||
Total revenue for reportable segments | 31,058 | 22,782 | 24,598 | ||||||||
Operating expenses (excluding depreciation and amortization) | 3,979 | 3,964 | 5,756 | ||||||||
Operating margin (excluding depreciation and amortization) | 27,079 | 18,818 | 18,842 | ||||||||
Additions to long-lived assets | 5,516 | 8,551 | 3,282 | ||||||||
Total assets (end of period) | $ | 64,591 | $ | 69,469 | $ | 73,502 | |||||
Crude Oil Pipeline Services | |||||||||||
Service revenue | |||||||||||
Third party revenue | $ | 15,658 | $ | 18,024 | $ | 18,659 | |||||
Related party revenue | 9,018 | 8,381 | 10,687 | ||||||||
Total revenue for reportable segments | 24,676 | 26,405 | 29,346 | ||||||||
Operating expenses (excluding depreciation and amortization) | 17,767 | 15,948 | 21,393 | ||||||||
Intersegment operating expenses | — | — | 259 | ||||||||
Operating margin (excluding depreciation and amortization) | 6,909 | 10,457 | 7,694 | ||||||||
Additions to long-lived assets | 51,609 | 20,970 | 34,953 | ||||||||
Total assets (end of period) | $ | 169,739 | $ | 184,933 | $ | 175,142 | |||||
Crude Oil Trucking and Producer Field Services | |||||||||||
Service revenue | |||||||||||
Third party revenue | $ | 51,545 | $ | 50,283 | $ | 37,039 | |||||
Related party revenue | 21,645 | 19,764 | 15,616 | ||||||||
Intersegment revenue | — | — | 259 | ||||||||
Total revenue for reportable segments | 73,190 | 70,047 | 52,914 | ||||||||
Operating expenses (excluding depreciation and amortization) | 63,123 | 62,140 | 51,610 | ||||||||
Operating margin (excluding depreciation and amortization) | 10,067 | 7,907 | 1,304 | ||||||||
Additions to long-lived assets | 1,779 | 1,081 | 4,556 | ||||||||
Total assets (end of period) | $ | 20,073 | $ | 17,365 | $ | 17,256 | |||||
Total operating margin (excluding depreciation and amortization)(1) | $ | 85,023 | $ | 78,426 | $ | 76,052 | |||||
F-27
Total Segment Revenues | 194,671 | 186,626 | 180,288 | ||||||||
Elimination of Intersegment Revenues | — | — | (259 | ) | |||||||
Consolidated Revenues | 194,671 | 186,626 | 180,029 | ||||||||
____________________
(1) | The following table reconciles segment operating margin (excluding depreciation and amortization) to income before income taxes (in thousands): |
For the year ended December 31, | ||||||||||||
2013 | 2014 | 2015 | ||||||||||
Operating margin (excluding depreciation and amortization) | $ | 85,023 | $ | 78,426 | $ | 76,052 | ||||||
Depreciation and amortization on continuing operations | (23,962 | ) | (26,045 | ) | (27,228 | ) | ||||||
General and administrative expenses | (17,482 | ) | (17,498 | ) | (18,976 | ) | ||||||
Asset impairment expense | (524 | ) | — | (21,996 | ) | |||||||
Gain on sale of assets | 1,073 | 2,464 | 6,137 | |||||||||
Equity earnings (loss) in unconsolidated entity | (502 | ) | 883 | 3,932 | ||||||||
Interest expense | (11,615 | ) | (12,268 | ) | (11,202 | ) | ||||||
Unrealized gains on investments | — | 2,079 | — | |||||||||
Income from continuing operations before income taxes | $ | 32,011 | $ | 28,041 | $ | 6,719 | ||||||
21. INCOME TAXES
The anticipated after-tax economic benefit of an investment in the Partnership’s common units depends largely on the Partnership being treated as a partnership for federal income tax purposes. If less than 90% of the gross income of a publicly traded partnership, such as the Partnership, for any taxable year is “qualifying income” from sources such as the transportation, marketing (other than to end users), or processing of crude oil, natural gas or products thereof, interest, dividends or similar sources, that partnership will be taxable as a corporation under Section 7704 of the Internal Revenue Code for federal income tax purposes for that taxable year and all subsequent years.
If the Partnership were treated as a corporation for federal income tax purposes, then it would pay federal income tax on its income at the corporate tax rate, which is currently a maximum of 35%, and would likely pay state income tax at varying rates. Distributions would generally be taxed again to unitholders as corporate distributions and none of the Partnership’s income, gains, losses, deductions or credits would flow through to its unitholders. Because a tax would be imposed upon the Partnership as an entity, cash available for distribution to its unitholders would be substantially reduced. Treatment of the Partnership as a corporation would result in a material reduction in the anticipated cash flow and after-tax return to unitholders and thus would likely result in a substantial reduction in the value of the Partnership’s common units.
The Partnership has entered into storage contracts and leases with third party customers with respect to substantially all of its asphalt facilities. At the time of entering into such agreements, it was unclear under current tax law as to whether the rental income from the leases, and the fees attributable to certain of the processing services the Partnership provides under certain of the storage contracts, constitute “qualifying income.” In the second quarter of 2009, the Partnership submitted a request for a ruling from the IRS that rental income from the leases constitutes “qualifying income.” In October 2009, the Partnership received a favorable ruling from the IRS. As part of this ruling, however, the Partnership agreed to transfer, and has transferred, certain of its asphalt processing assets and related fee income to a subsidiary taxed as a corporation. This transfer occurred in the first quarter of 2010. Such subsidiary is required to pay federal income tax on its income at the corporate tax rate, which is currently a maximum of 35%, and will likely pay state (and possibly local) income tax at varying rates. Distributions from this subsidiary will generally be taxed again to unitholders as corporate distributions and none of the income, gains, losses, deductions or credits of this subsidiary will flow through to the Partnership’s unitholders.
In relation to the Partnership’s taxable subsidiary, the tax effects of temporary differences between the tax basis of assets and liabilities and their financial reporting amounts at December 31, 2015 are presented below (dollars in thousands):
F-28
Deferred tax assets | |||
Difference in bases of property, plant and equipment | $ | 892 | |
Deferred tax asset | 892 | ||
Less: valuation allowance | (892 | ) | |
Net deferred tax asset | $ | — | |
The Partnership has considered the taxable income projections in future years, whether the carryforward period is so brief that it would limit realization of tax benefits, whether future revenue and operating cost projections will produce enough taxable income to realize the deferred tax asset based on existing service rates and cost structures, and the Partnership’s earnings history exclusive of the loss that created the future deductible amount for the Partnership’s subsidiary that is taxed as a corporation for purposes of determining the likelihood of realizing the benefits of the deferred tax assets. As a result of the Partnership’s consideration of these factors, the Partnership has provided a full valuation allowance against its deferred tax asset as of December 31, 2015.
22. RECENTLY ISSUED ACCOUNTING STANDARDS
In April 2014, the FASB issued ASU 2014-08, “Reporting Discontinued Operations and Disclosures of Disposals of Components of an Entity.” The amendments in this update change the criteria for reporting discontinued operations for all public and nonpublic entities. The amendments also require new disclosures about discontinued operations and disposals of components of an entity that do not qualify for discontinued operations reporting. The amendments in this update are effective for fiscal years, and interim periods within those years, beginning after December 15, 2014. The Partnership adopted this update for the period ending March 31, 2015, and there was no impact on the Partnership’s financial position, results of operations or cash flows.
In May 2014, the FASB issued ASU 2014-09, “Revenue from Contracts with Customers.” The amendments in this Update create Topic 606, Revenue from Contracts with Customers, and supersede the revenue recognition requirements in Topic 605, Revenue Recognition, including most industry-specific revenue recognition guidance throughout the Industry Topics of the Codification. In addition, the amendments supersede the cost guidance in Subtopic 605-35, Revenue Recognition-Construction-Type and Production-Type Contracts, and create new Subtopic 340-40, Other Assets and Deferred Costs-Contracts with Customers. In summary, the core principle of Topic 606 is that an entity recognizes revenue to depict the transfer of promised goods or services to customers in an amount that reflects the consideration to which the entity expects to be entitled in exchange for those goods or services. In August 2015, the FASB issued Accounting Standards Update No. 2015-14, “Revenue from Contracts with Customers.” The amendment in this update deferred the effective date of ASU 2014-09 by one year to annual reporting periods beginning after December 15, 2017, including interim reporting periods within that reporting period. Earlier application is permitted only as of annual reporting periods beginning after December 15, 2016, including interim reporting periods within that reporting period. The Partnership is evaluating the impact of this guidance, which will be adopted beginning with the Partnership’s quarterly report for the period ending March 31, 2018.
In August 2014, the FASB issued ASU 2014-15, “Presentation of Financial Statements - Going Concern.” The Update provides U.S. GAAP guidance on management’s responsibility in evaluating whether there is substantial doubt about a company’s ability to continue as a going concern and about related footnote disclosures. For each reporting period, management will be required to evaluate whether there are conditions or events that raise substantial doubt about a company’s ability to continue as a going concern within one year from the date the financial statements are issued. The amendments in this update are effective for the annual period ending after December 15, 2016, and for annual periods and interim periods thereafter. The Partnership is evaluating the impact of this guidance, which will be adopted beginning with the Partnership's annual report for the period ending December 31, 2016.
In January 2015, the FASB issued ASU 2015-01, “Simplifying Income Statement Presentation by Eliminating the Concept of Extraordinary Items.” The objective of this Update is to simplify the income statement presentation requirements by eliminating the concept of extraordinary items. Extraordinary items are events and transactions that are distinguished by their unusual nature and by the infrequency of their occurrence. Eliminating the extraordinary classification simplifies income statement presentation by altogether removing the concept of extraordinary items from consideration. The amendments in this update are effective for fiscal years, and interim periods within those years, beginning after December 15, 2015. The Partnership has evaluated the impact of this guidance, which will be adopted beginning with the Partnership’s quarterly report for the period ending March 31, 2016, and expects there will be no material impact on the Partnership’s financial position, results of operations or cash flow.
F-29
In February 2015, the FASB issued ASU 2015-02, “Consolidation (Topic 810): Amendments to the Consolidation Analysis,” which eliminates the presumption that a general partner should consolidate a limited partnership. It also modifies the evaluation of whether limited partnerships are variable interest entities or voting interest entities and adds requirements that limited partnerships must meet to qualify as voting interest entities. This guidance is effective for public companies for fiscal years beginning after December 15, 2015. The Partnership has evaluated the impact of this guidance, which will be adopted beginning with the Partnership’s quarterly report for the period ending March 31, 2016, and expects there will be no material impact on the Partnership’s financial position, results of operations or cash flow.
On April 7, 2015, the FASB issued ASU 2015-03, “Simplifying the Presentation of Debt Issuance Costs,” which requires debt issuance costs to be presented in the balance sheet as a direct deduction from the associated debt liability. This update is effective for financial statements issued for fiscal years beginning after December 15, 2015, and interim periods within those fiscal years. The Partnership has evaluated the impact of this guidance, which will be adopted beginning with the Partnership’s quarterly report for the period ending March 31, 2016, and expects there will be no material impact on the Partnership’s financial position, results of operations or cash flow.
On April 30, 2015, the FASB issued ASU 2015-06, “Effects on Historical Earnings per Unit of Master Limited Partnership Dropdown Transactions.” Master limited partnerships (MLPs) apply the two-class method to calculate earnings per unit (EPU) because the general partner, limited partners, and incentive distribution rights holders each participate differently in the distribution of available cash. When a general partner transfers (or “drops down”) net assets to a master limited partnership and that transaction is accounted for as a transaction between entities under common control, the statements of operations of the master limited partnership are adjusted retrospectively to reflect the dropdown transaction as if it occurred on the earliest date during which the entities were under common control.
The amendments in ASU 2015-06 specify that for purposes of calculating historical EPU under the two-class method, the earnings (losses) of a transferred business before the date of a dropdown transaction should be allocated entirely to the general partner interest, and previously reported EPU of the limited partners would not change as a result of a dropdown transaction. Qualitative disclosures about how the rights to the earnings (losses) differ before and after the dropdown transaction occurs also are required. This update is effective for financial statements issued for fiscal years beginning after December 15, 2015, and interim periods within those fiscal years. The Partnership has evaluated the impact of this guidance, which will be adopted beginning with the Partnership’s quarterly report for the period ending March 31, 2016, and expects there will be no material impact on the Partnership’s financial position, results of operations or cash flow.
In August 2015, the FASB issued ASU 2015-15, “Interest - Imputation of Interest (Subtopic 835-30).” This update adds SEC paragraphs pursuant to the SEC Staff Announcement at the June 18, 2015 Emerging Issues Task Force (“EITF”) meeting about the presentation and subsequent measurement of debt issuance costs associated with line-of-credit arrangements. The Partnership adopted this update for the interim period ending September 30, 2015, and there is no impact on the Partnership's financial position, results of operations or cash flows.
In September 2015, the FASB issued ASU 2015-16, “Business Combinations (Topic 805).” Topic 805 requires that an acquirer retrospectively adjust provisional amounts recognized in a business combination, during the measurement period. To simplify the accounting for adjustments made to provisional amounts, the amendments in this update require that the acquirer recognize adjustments to provisional amounts that are identified during the measurement period in the reporting period in which the adjustment amount is determined. The acquirer is required to also record, in the same period’s financial statements, the effect on earnings of changes in depreciation, amortization, or other income effects, if any, as a result of the change to the provisional amounts, calculated as if the accounting had been completed at the acquisition date. In addition, an entity is required to present separately on the face of the income statement or disclose in the notes to the financial statements the portion of the amount recorded in current-period earnings by line item that would have been recorded in previous reporting periods if the adjustment to the provisional amounts had been recognized as of the acquisition date. This update is effective for financial statements issued for fiscal years beginning after December 15, 2015, and interim periods within those fiscal years. The Partnership has evaluated the impact of this guidance, which will be adopted beginning with the Partnership’s quarterly report for the period ending March 31, 2016, and expects there will be no material impact on the Partnership’s financial position, results of operations or cash flow.
In November 2015, the FASB issued ASU 2015-17, “Income Taxes (Topic 740).” This update simplifies the presentation of deferred income taxes on the balance sheet. This update is effective for financial statements issued for annual periods beginning after December 15, 2016, and interim periods within those fiscal years. The Partnership is evaluating the impact of this guidance, which will be adopted beginning with the Partnership’s quarterly report for the period ending March 31, 2017.
F-30
In January 2016, the FASB issued ASU 2016-01, “Financial Instruments - Overall (Subtopic 825-10).” This update is intended to enhance the reporting model for financial instruments to provide users of financial statements with more decision-useful information. The amendments in the update address certain aspects of recognition, measurement, presentation, and disclosure of financial instruments. This update is effective for financial statements issued for annual periods beginning after December 15, 2017, and interim periods within those fiscal years. The Partnership is evaluating the impact of this guidance, which will be adopted beginning with the Partnership’s quarterly report for the period ending March 31, 2018.
In February 2016, the FASB issued ASU 2016-02, “Leases (Topic 842).” This update introduces a new lease model that requires the recognition of lease assets and lease liabilities on the balance sheet and the disclosure of key information about leasing arrangements. This update is effective for financial statements issued for annual periods beginning after December 15, 2018, and interim periods within those fiscal years. The Partnership is evaluating the impact of this guidance, which will be adopted beginning with the Partnership’s quarterly report for the period ending March 31, 2019.
23. QUARTERLY FINANCIAL DATA (UNAUDITED)
Summarized quarterly financial data is as follows (in thousands, except per unit data):
First Quarter | Second Quarter | Third Quarter | Fourth Quarter | Full Year | |||||||||||||||
2014: | |||||||||||||||||||
Revenues | $ | 46,442 | $ | 45,797 | $ | 48,358 | $ | 46,029 | $ | 186,626 | |||||||||
Operating income | 6,852 | 7,526 | 12,604 | 10,365 | 37,347 | ||||||||||||||
Net income | 3,892 | 3,619 | 11,271 | 8,790 | 27,572 | ||||||||||||||
Basic net income (loss) per common unit | (0.07 | ) | (0.08 | ) | 0.23 | 0.12 | 0.20 | ||||||||||||
Diluted net income (loss) per common unit | (0.07 | ) | (0.08 | ) | 0.20 | 0.10 | 0.20 | ||||||||||||
2015: | |||||||||||||||||||
Revenues | $ | 42,356 | $ | 46,574 | $ | 47,217 | $ | 43,882 | $ | 180,029 | |||||||||
Operating income (loss) | 5,297 | 8,484 | 17,010 | (16,802 | ) | 13,989 | |||||||||||||
Net income (loss) | 1,579 | 7,710 | 13,967 | (16,860 | ) | 6,396 | |||||||||||||
Basic net income (loss) per common unit | (0.12 | ) | 0.06 | 0.24 | (0.65 | ) | (0.47 | ) | |||||||||||
Diluted net income (loss) per common unit | (0.12 | ) | 0.06 | 0.21 | (0.65 | ) | (0.47 | ) | |||||||||||
F-31