Attached files
| file | filename |
|---|---|
| 8-K - 8-K - NPK FERTILIZERS INDIA 2016 EVENT (MARCH 2016) - MOSAIC CO | a8-knpkfertilizersindia201.htm |

1 Competition for Indian Demand NPK Fertilizers India 2016 Shangri-La’s Eros Hotel New Delhi March 9, 2016 Dr. Michael R. Rahm Vice President Market and Strategic Analysis

2 Safe Harbor This document contains forward-looking statements within the meaning of the Private Securities Litigation Reform Act of 1995. Such statements include, but are not limited to, statements about the Wa’ad Al Shamal Phosphate Company (also known as the Ma’aden joint venture) and other proposed or pending future transactions or strategic plans and other statements about future financial and operating results. Such statements are based upon the current beliefs and expectations of The Mosaic Company’s management and are subject to significant risks and uncertainties. These risks and uncertainties include but are not limited to risks and uncertainties arising from the ability of the Ma’aden joint venture to obtain additional planned funding in acceptable amounts and upon acceptable terms, the timely development and commencement of operations of production facilities in the Kingdom of Saudi Arabia, the future success of current plans for the Ma’aden joint venture and any future changes in those plans; difficulties with realization of the benefits of our long term natural gas based pricing ammonia supply agreement with CF Industries, Inc., including the risk that the cost savings from the agreement may not be realized or that the price of natural gas or ammonia during the agreement’s term are at levels at which the pricing becomes disadvantageous to Mosaic; customer defaults; the effects of Mosaic’s decisions to exit business operations or locations; the predictability and volatility of, and customer expectations about, agriculture, fertilizer, raw material, energy and transportation markets that are subject to competitive and other pressures and economic and credit market conditions; the level of inventories in the distribution channels for crop nutrients; the effect of future product innovations or development of new technologies on demand for our products; changes in foreign currency and exchange rates; international trade risks and other risks associated with Mosaic’s international operations and those of joint ventures in which Mosaic participates, including the risk that protests against natural resource companies in Peru extend to or impact the Miski Mayo mine; changes in government policy; changes in environmental and other governmental regulation, including expansion of the types and extent of water resources regulated under federal law, greenhouse gas regulation, implementation of numeric water quality standards for the discharge of nutrients into Florida waterways or efforts to reduce the flow of excess nutrients into the Mississippi River basin, the Gulf of Mexico or elsewhere; further developments in judicial or administrative proceedings, or complaints that Mosaic’s operations are adversely impacting nearby farms, business operations or properties; difficulties or delays in receiving, increased costs of or challenges to necessary governmental permits or approvals or increased financial assurance requirements; resolution of global tax audit activity; the effectiveness of Mosaic’s processes for managing its strategic priorities; adverse weather conditions affecting operations in Central Florida, the Mississippi River basin, the Gulf Coast of the United States or Canada, and including potential hurricanes, excess heat, cold, snow, rainfall or drought; actual costs of various items differing from management’s current estimates, including, among others, asset retirement, environmental remediation, reclamation or other environmental regulation, Canadian resources taxes and royalties, or the costs of the Ma’aden joint venture, its existing or future funding and Mosaic’s commitments in support of such funding; reduction of Mosaic’s available cash and liquidity, and increased leverage, due to its use of cash and/or available debt capacity to fund financial assurance requirements and strategic investments; brine inflows at Mosaic’s Esterhazy, Saskatchewan, potash mine or other potash shaft mines; other accidents and disruptions involving Mosaic’s operations, including potential mine fires, floods, explosions, seismic events or releases of hazardous or volatile chemicals; and risks associated with cyber security, including reputational loss, as well as other risks and uncertainties reported from time to time in The Mosaic Company’s reports filed with the Securities and Exchange Commission. Actual results may differ from those set forth in the forward-looking statements.
3 Preliminaries India in the context of the global markets Focus on phosphate and potash (P&K) Current situation and five-year outlook Observations and perspectives of an outsider

4 Agenda and Take-Aways Agricultural Situation and Outlook - No structural imbalance but just a string of above-trend harvests - Long term food story not in vogue but still intact - Constructive outlook underpins positive plant nutrient demand prospects - India: feeding a growing and more affluent population with better technology/practices Phosphate Situation and Outlook - Demand growth projected to accelerate following the recent slowdown - A balanced outlook but big changes on the supply side of the ledger - Trade flows expected to continue to adjust to supply developments - India: from demand drag to demand driver but subsidy policies remain a wildcard Potash Situation and Outlook - Collapses of key potash currencies a main driver of lower prices - Stronger and steadier demand growth forecast for the next five years - Market not grossly out of balance and significant supply adjustments underway - India: demand recovery expected due to positive agronomic and economic factors

5 Agricultural Situation and Outlook

6 No structural imbalance Farmers can’t frack corn and the world cannot stop eating - Most agricultural commodity prices are holding up in a volatile environment - No disruptive technological developments (e.g. like hydraulic fracturing in energy markets) - No gross supply/demand imbalance (e.g. like over-investment and a demand slowdown in the iron ore market) - New crop corn and soybean prices continue to trade at ~$4 and ~$9 per bushel - New crop wheat prices under pressure due to strong dollar and large supplies - Recent palm oil and sugar price rallies due to smaller El Niño-impacted crops 30 40 50 60 70 80 90 100 110 120 2014 2015 2016 Index Source: CRB Commodity Prices 2014 Q1=100 Oil WTI Iron Ore Corn HRW Wheat 1,750 2,000 2,250 2,500 2,750 3,000 Jan-14 Jul-14 Jan-15 Jul-15 Jan-16 Ringgits Tonne Source: CRB Malaysian Palm Oil Prices Daily Close of Nearby Option
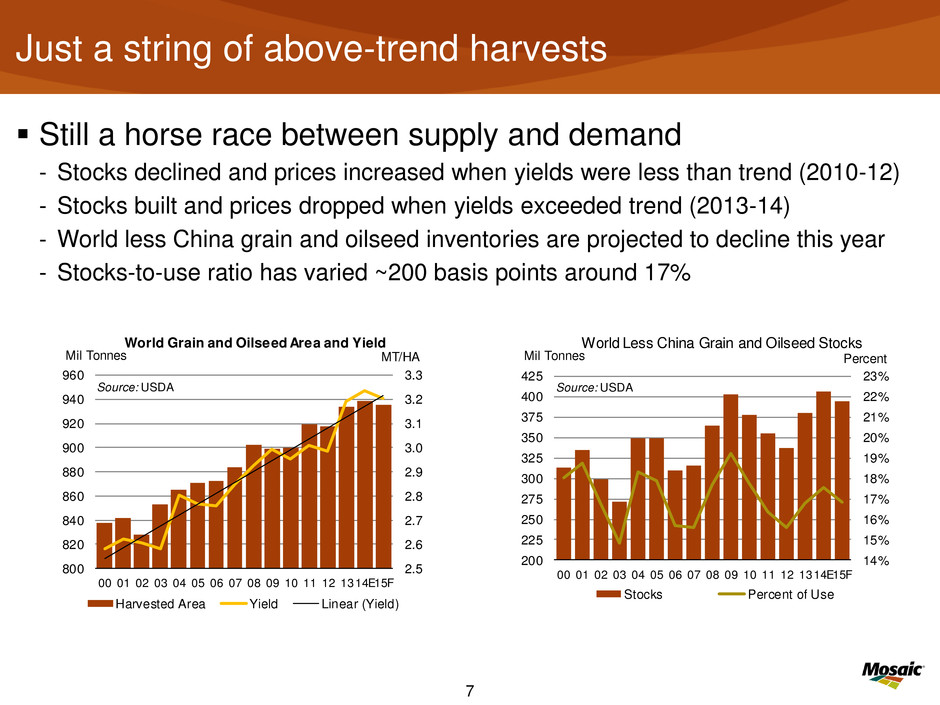
7 Just a string of above-trend harvests Still a horse race between supply and demand - Stocks declined and prices increased when yields were less than trend (2010-12) - Stocks built and prices dropped when yields exceeded trend (2013-14) - World less China grain and oilseed inventories are projected to decline this year - Stocks-to-use ratio has varied ~200 basis points around 17% 2.5 2.6 2.7 2.8 2.9 3.0 3.1 3.2 3.3 800 820 840 860 880 900 920 940 960 00 01 02 03 04 05 06 07 08 09 10 11 12 1314E15F MT/HAMil Tonnes World Grain and Oilseed Area and Yield Harvested Area Yield Linear (Yield) Source: USDA 14% 15% 16% 17% 18% 19% 20% 21% 22% 23% 200 225 250 275 300 325 350 375 400 425 00 01 02 03 4 05 06 07 08 09 10 11 12 1314E15F PercentMil Tonnes World Less China Grain and Oilseed Stocks Stocks Percent of Use Source: USDA
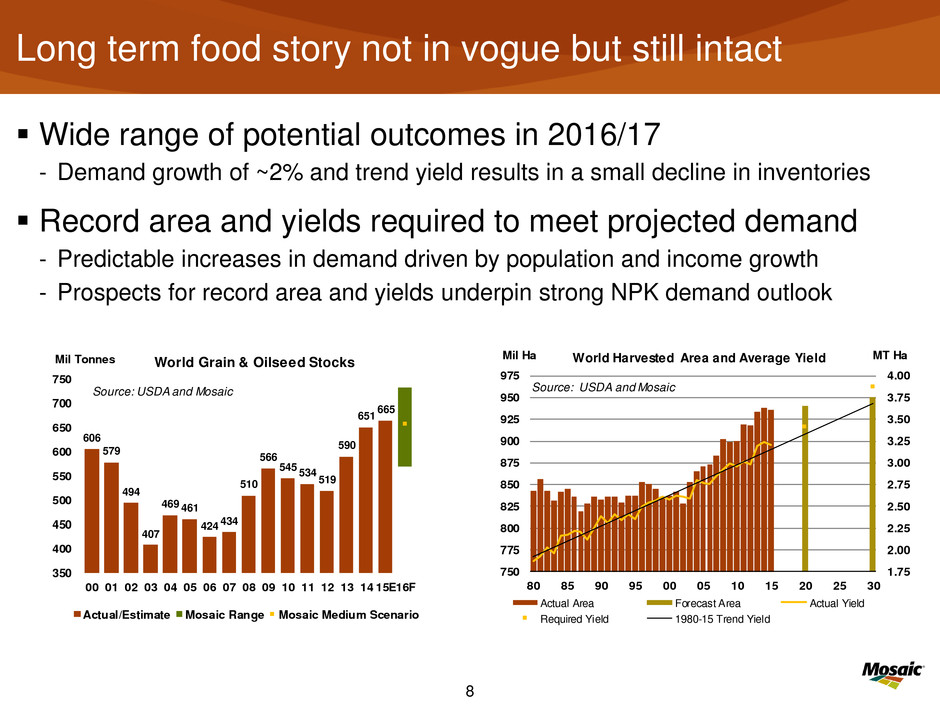
8 Long term food story not in vogue but still intact Wide range of potential outcomes in 2016/17 - Demand growth of ~2% and trend yield results in a small decline in inventories Record area and yields required to meet projected demand - Predictable increases in demand driven by population and income growth - Prospects for record area and yields underpin strong NPK demand outlook 1.75 2.00 2.25 2.50 2.75 3.00 3.25 3.50 3.75 4.00 750 775 800 825 850 875 900 925 950 975 80 85 90 95 00 05 10 15 20 25 30 MT HaMil Ha World Harvested Area and Average Yield Actual Area Forecast Area Actual Yield Required Yield 1980-15 Trend Yield Source: USDA and Mosaic 606 579 494 407 469 461 424 434 510 566 545 534 519 590 651 665 350 400 450 500 550 600 650 700 750 00 01 02 03 04 05 6 07 08 09 10 11 12 13 14 15E16F Mil Tonnes World Grain & Oilseed Stocks Actual/Estimate Mosaic Range Mosaic Medium Scenario Source: USDA and Mosaic

9 Feeding a larger, more affluent, more urbanized, and older population . . . 0 200 400 600 800 1,000 1,200 1,400 1,600 1,800 1980 1985 1990 1995 2000 2005 2010 2015 2020 2025 2030 2035 2040 MillionsIndia Population Rural vs. Urban Source: World Bank Rural Urban 0 200 400 600 800 1,000 1,200 1,400 1,600 1,800 1980 1985 1990 1995 2000 2005 2010 2015 2020 2025 2030 2035 2040 Millions Source: World Bank India Population by Age Group 14-64 Yrs 65+ Yrs 0-14 Yrs 500 100 1500 2000 2500 3000 1980 1985 1990 1995 2000 2005 2010 2015 2020 US$ Source: IMF India GDP Per Capita -0.2% 0.0% 0.1% 0.6% 0.8% 0.7% 0.9% 1.0% 1.2% 2.2% -2 0 0 200 400 600 800 1,000 FSU Europe Other China No th America Mideast Latin America Other Asia/Oceania India Africa Million People and CAGR World Population Change 2015-2040 Source: World Bank

10 . . . by closing yield gaps with better technology/practices 0 1 2 3 4 5 6 70 75 80 85 90 95 00 05 10 15 MT Ha Source: USDA Wheat Yields India World China Pakistan Austraila 1 2 3 4 5 6 70 75 80 85 90 95 00 05 10 15 MT Ha Source: USDA Rice Yields India World China Vietn m Thailand 0.0 0.5 1.0 1.5 2.0 2.5 3.0 3.5 70 75 80 85 90 95 00 05 10 15 MT Ha Source: USDA Soybean Yields India World USA Brazil China Wheat yields are in line with global average. Rice and soybean yields are less than the world averages. Indian yields lag Chinese yields by a wide margin. Better technology (seeds) and practices (balanced nutrient use) are keys to closing the gap.

11 More balanced nutrient use is one of the practices required to achieve higher yields in the long term 0 5,000 10,000 15,000 20,000 25,000 30,000 2005 2006 2007 2008 2009 2010 2011 2012 2013 2014 2015 2016 India NPK Retail Prices Urea MOP DAP INR MT Source: FAI, Mosaic 1.75 2.00 2.25 2.50 2.75 3.00 3.25 3.50 3.75 8 82 84 86 88 90 92 94 96 98 0 02 04 06 08 10 12 14 India N:P Ratio Actual TargetFertilizer Year Beginning April 1 Source: FAI 3.0 4.0 5.0 6.0 7.0 8.0 9. 10.0 80 82 84 86 88 90 92 94 96 98 00 02 04 06 08 10 12 14 India N:K Ratio Actual TargetFertilizer Year Beginning April 1 Source: FAI Changes in PK subsidies in 2010/11 abruptly reversed hard-fought 10-year gains to reach the 4:2:1 target of N:P:K use. Overuse of urea an increasingly serious issue. Micronutrient deficiencies also need to be addressed. Widely understood that subsidy reform required, but it is held hostage by politics. DBT looks like a potential solution: give rupees to farmers and let NPK companies compete for them by delivering the greatest value (e.g. more balanced blends, innovative micronutrient-enhanced products).

12 Phosphate Situation and Outlook

13 Demand growth expected to accelerate Global phosphate shipments increased just 1.3% per year from 2010 to 2015. India was a drag on demand with shipments dropping 2.4 million tonnes from 2010 to 2015. Strong growth in China, other Asia, and Brazil more than offset the drop in India and resulted in modest gains. Demand is projected to grow to 2.8% per year to 74 million tonnes in 2020 as demand gets back on track in India and other regions register decent increases. 35 40 45 50 55 60 65 70 75 80 00 01 02 03 04 05 06 07 08 09 10 11 12 13 14 15E16F 20F Global Phosphate Shipments Actual High Forecast Low Forecast Likely Forecast CRU - Jan 2016 MMT DAP/MAP/TSP Source: Mosaic and CRU Phosphate Outlook Jan 2016 -4.5% -0.5% 0.7% 1.8% 6.5% 2.3% 5.5% 4.5% 1.8% -3 -2 -1 0 1 2 3 4 India Europe/FSU Other Latin Am Mideast/Other Africa North America Brazil Other Asia + Oceania China MMT DAP/MAP/TSP (Percentage is CAGR) Change in Phosphate Shipments 2015 vs. 2010 Source: Mo aic and CRU Phosphate Outlook Jan 2016 India: from worst to (almost) first 0.2% 3.5% 3.6% 1.1% 3.9% 4.3% 3.0% 4.8% 3.1% -3 -2 -1 0 1 2 3 4 North America Mideast/Other Africa Other Asia + Oceania Other Latin Am Europe/FSU Brazil India China MMT DAP/MAP/TSP (Percentage is CAGR) Change in Phosphate Shipments 2020F vs. 2015 Source: Mosaic and CRU Phosphate Outlook Jan 2016

14 0 5,000 10,000 15,000 20,000 25,000 30,000 2005 2006 2007 2008 2009 2010 2011 2012 2013 2014 2015 2016 India NPK Retail Prices Urea MOP DAP INR MT Source: FAI, Mosaic Subsidy changes crater phosphate shipments Indian shipments and imports collapsed following subsidy change and price spike in 2010/11. Retail DAP prices increased from less than R10,000 per tonne in 2010 Q1 to about R24,000 in 2015/16. Farmers responded to price changes by buying more lower-cost urea and less higher-cost DAP with the N:P ratio jumping from 2:1 to 3:1. Shipments picked up in 2015/16 mainly due to the emptying of channel inventories during the four previous years. 0 2 4 6 8 10 12 14 00 02 04 06 08 10 12 14 16F 18F 20F Mil Tonnes DAP/MAP/TSP Source: CRU and Mosaic India Phosphate Shipment and Imports Shipments Imports 1.75 2.00 2.25 2.50 2.75 3.00 3.25 3.50 3.75 80 82 84 86 88 90 92 94 96 98 00 02 04 06 08 10 12 14 India N:P Ratio Actual TargetFertilizer Year Beginning April 1 Source: FAI

15 2016/17 subsidy expected to result in stable to lower retail prices and underpin strong demand prospects Retail DAP Price Scenarios (order of magnitude change) Scenario ==> (1) (2) (3) (4) (5) Exchange Rate (R/US$) 69 69 69 66 72 Subsidy Reduction (R/Tonne) 3,800 3,800 3,800 3,000 4,000 DAP Price c&f India ($/Tonne) 370 380 390 370 390 Retail DAP Price (R/Tonne) Change (from R23,700) 22,410 -5.4% 23,140 -2.4% 23,870 0.7% 20,430 -13.8% 25,315 6.8% Strong demand prospects assuming a normal monsoon Source: Mosaic

16 A balanced supply/demand outlook 40% 50% 60% 70% 80% 90% 100% 0 10 20 30 40 50 60 10 11 12 13 14 15E 16F 17F 18F 19F 20F Th ou sa nd s Global Capacity, Production and Opr Rate Operational Capacity Production Oper Rate Mil Tonnes Phos Acid Opr Rate Source: CRU and Mosaic 40% 50% 60% 70% 80% 90% 100% 0 10 20 30 40 50 60 10 1 2 13 14 15E 16F 17F 18F 19F 20F Op Rate MMT P2O5 Source: CRU. January 2016 Global Phosphoric Acid Supply and Demand Capacity Production Operating Rate The global phosphoric acid operating rate is expected to remain relatively stable at elevated levels through the end of the decade. Mosaic forecasts utilize operational capacities that are less than consultant estimates and result in projected operating rates in the 85% to 90% range during the next five years. The most recent CRU forecasts include higher capacity estimates and slightly lower demand forecasts and result in operating rates in the 80% to 85% range during the forecast period. A back-of-the-envelope calculation: if global DAP/MAP/TSP shipments increase 2% or ~1.3 million tonnes per year, then gains during the next five years will total about 6.5 million tonnes or roughly equal to the new capacity expected on line from four OCP Jorf Phosphate Hubs and the Ma’aden phase II expansion

17 Significant changes on the supply side of the ledger China has accounted for all of the net increase in global phosphate supplies so far this century and has transitioned from the largest importer to the largest exporter of finished phosphate products. China has stopped building phosphate plants, and a restructuring of this sector is expected during the next several years. There are few phosphate projects in the pipeline other than the four OCP Jorf Phosphate Hubs and the Ma’aden Phase 2 development. So these are the main supply sources expected to meet future demand growth. 0 10 20 30 40 50 60 00 01 02 03 04 05 06 07 08 09 10 11 12 13 14 15E 16F 17F 18F 19F 20F MMT P2O5 Source: CRU January 2016 Global Phosphoric Acid Capacity Rest of World China 54.5 58.6 2.9 1.6 0.8 1.2 50 51 52 53 54 55 56 57 58 59 60 2014 OCP Ma'aden Other China 2020F MMT P2O5 Source: CRU, January 2016 Global Phosphoric Acid Capacity 0 4 8 12 16 20 24 28 32 36 -6 -4 -2 0 2 4 6 8 10 12 85 90 95 00 05 10 15E Mil Tonnes Production Mil Tonnes Net Exports China DAP/MAP/TSP Production and Net Exports DAP/MAP/TSP N t Exports DAP/MAP/TSP Production Source: CRU January 2016

18 Trade flows expected to adjust to supply developments China 8% USA 51% Jordan 9% FSU 23% Morocco 4% Other 5% India DAP Imports by Origin 2009/10 China 49% Saudi Arabia 31% USA 12% Jordan 8% India DAP Imports by Origin 2014/15 China 71% Saudi Arabia 17% USA 10% Jordan 2% India DAP Imports by Origin 2015/16 Estimate 5.2 MMT Source: FAI and Mosaic 3.9 MMT5.9 MMT India 34% Brazil 16%Vietnam 8% Pakistan 6% Indonesia 5% Other 31% China DAP/MAP/TSP Exports by Des ination Jan-Dec 2015 Source: China Customs China and Saudi Arabia are the dominate suppliers of DAP to India today. The two countries accounted for 80% of Indian DAP imports in 2014/15 and likely will account for about 90% in 2015/16. China alone likely will account for more than 70% of Indian DAP imports this fertilizer year, but exports to India still account for only one-third of Chinese total phosphate exports. China and Saudi Arabia likely will continue to meet most of the projected demand growth in India due to freight advantages. Saudi Arabia is expanding capacity and new Moroccan supplies likely targeted to Africa and South America will push a larger share of Chinese output into India.

19 Potash Situation and Outlook

20 Collapses of key potash currencies a main driver of lower prices 200 250 300 350 400 450 500 13 14 15 16 $ Tonne Muriate of Potash Spot Prices Blend Grade c&f Brazil Std Grade c&f SE Asia Blend Grade fob NOLA China Contract First Mover Source: Argus FMB 3/19/15 1/1/13 1/20/14 40 50 60 70 80 90 100 110 14 15 16 YTD Index Source: CRB Key Potash Exporter Exchange Rates 2014 Q1=100 Canadian Dollar Russian Ruble Belarus Ruble 40 50 60 70 80 90 100 110 14 15 16 YTD Index Source: CRB Key Potash Importer Exchange Rates 2014 Q1=100 Brazilian Real Indian Rupee Indonesian Rupiah Malaysian Ringgit Several factors have combined to push potash prices lower, but the collapse of key currencies is one of the main drivers. The Russian ruble and Belarussian ruble have declined about 55% since 2014 Q1. The Canadian dollar also has depreciated 20% during the same period. Currencies of the leading importing countries also have declined with the Brazilian real eroding 40% since the beginning of 2014.

21 0 25 50 75 100 125 150 175 200 225 250 275 300 0 10 20 30 40 50 60 70 US$/Tonne Million Tonnes 2014-16 MOP Cost Curve fob Mine at Name Plate Capacity Source: CRU 2014 2016 2016 vs. 2014 MOP Cost Curve fob Mine at Nameplate Capacity Exporter: Lower dollar costs/higher local currency price Importer: Higher local currency costs 0 750 1500 2250 3000 3750 4500 5250 6000 200 250 300 350 400 450 500 550 600 10 11 12 13 14 15 16 YTD 1000 Belarus Rubles Tonne US$ Tonne Source: Argus FMB and CRB MOP Price c&f Brazil Port US$ Tonne 1000 Belarussian Rubles Tonne 500 600 700 800 900 1000 1100 1200 1300 200 250 300 350 400 450 500 550 600 10 11 12 13 14 15 16 YTD Reais Tonne US$ Tonne Source: Argus FMB and CRB MOP Price c&f Brazil Port US$ Tonne Reais Tonne Less impact from currencies going forward? Impacts of a collapse of key potash currencies

22 Strong and steadier demand prospects Global MOP shipments increased 2.5% per year from 2010 to 2015, but growth was erratic. India was a drag on demand with shipments dropping 2.2 million tonnes during this period. China accounted for most of the net growth with both imports and domestic production surging to record highs in 2015. Demand is projected to climb 2.3% per year to 68 million tonnes in 2020 with most of the major importing regions expected to register solid gains. 25 35 45 55 65 75 00 01 02 03 04 05 06 07 08 09 10 11 12 13 14 15E16F 20F MMT MOP Global Potash Shipments Actual High Forecast Low Forecast Likely Forecast CRU - Feb 2016 Source: Mosaic, CRU -8.3% -1.3% -0.8% 0.9% 2.0% 3.2% 7.7% 11.6% -3.0 -2.0 -1.0 0.0 1.0 2.0 3.0 4.0 5.0 6.0 7.0 India North America Europe/FSU Indonesia/Malaysia Other Asia/Oceania Brazil Rest of World China Mil Tonnes KCl (Percentage is CAGR) Change in Potash Shipments 2015 vs. 2010 Source: Mosaic and CRU Outlook February 2016 0.0% 0.5% 1.5% 1.1% 4.3% 2.9% 4.8% 8.8% -3.0 -2.0 -1.0 0.0 1.0 2.0 3.0 4.0 5.0 6.0 7.0 China North America Other Asia/Oceania Europe/FSU India Brazil Rest of World Indonesia/Malaysia Mil Tonnes KCl (Percentage is CAGR) Change in Potash Shipments 2020F vs. 2015 Source: Mosaic and CRU Outlook February 2016
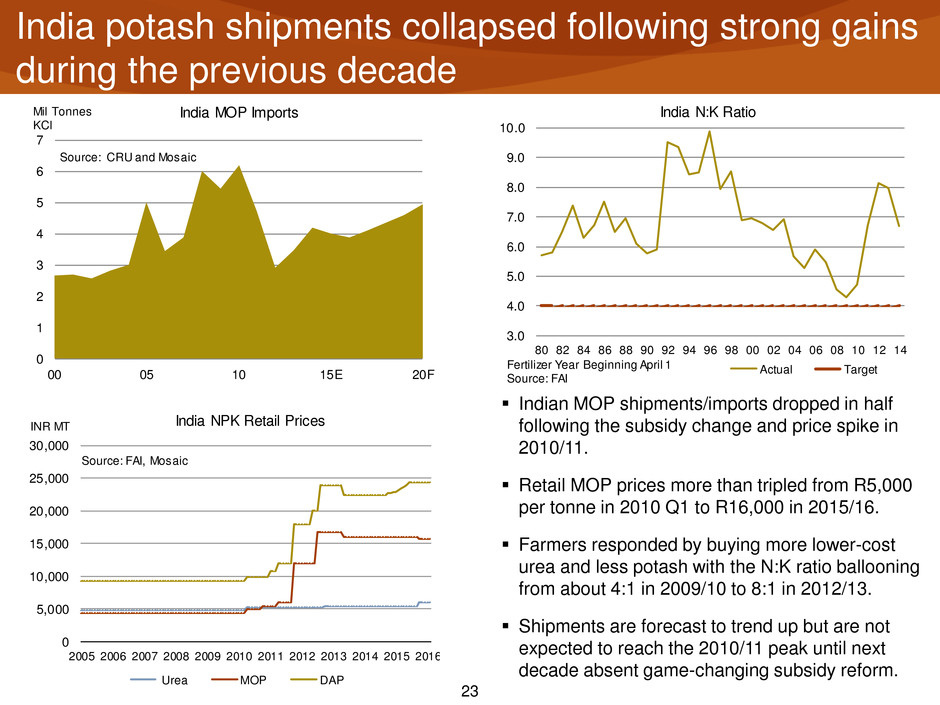
23 India potash shipments collapsed following strong gains during the previous decade Indian MOP shipments/imports dropped in half following the subsidy change and price spike in 2010/11. Retail MOP prices more than tripled from R5,000 per tonne in 2010 Q1 to R16,000 in 2015/16. Farmers responded by buying more lower-cost urea and less potash with the N:K ratio ballooning from about 4:1 in 2009/10 to 8:1 in 2012/13. Shipments are forecast to trend up but are not expected to reach the 2010/11 peak until next decade absent game-changing subsidy reform. 0 5,000 10,000 15,000 20,000 25,000 30,000 2005 2006 2007 2008 2009 2010 2011 2012 2013 2014 2015 2016 India NPK Retail Prices Ur a MOP DAP INR MT Source: FAI, Mosaic 3.0 4.0 5.0 6.0 7.0 8.0 9.0 10.0 80 82 84 86 88 90 92 94 96 98 00 02 04 06 08 10 12 14 India N:K Ratio Actual TargetFertilizer Year Beginning April 1 Source: FAI 0 1 2 3 4 5 6 7 00 05 10 15E 20F Mil Tonnes KCl Source: CRU and Mosaic India MOP Imports

24 2016/17 subsidy expected to result in lower retail prices and bolster the demand outlook Retail MOP Price Scenarios (order of magnitude change) Scenario ==> (1) (2) (3) (4) (5) Exchange Rate (R/US$) 69 69 69 66 72 Subsidy Reduction (R/Tonne) 500 500 500 300 700 MOP Price c&f India ($/Tonne) 260 270 280 260 280 Retail MOP Price (R/Tonne) Change (from R16,000) 14,080 -12.0% 14,815 -7.4% 15,550 -2.8% 13,055 -18.4% 16,640 4.0% Positive demand outlook assuming a normal monsoon Source: Mosaic
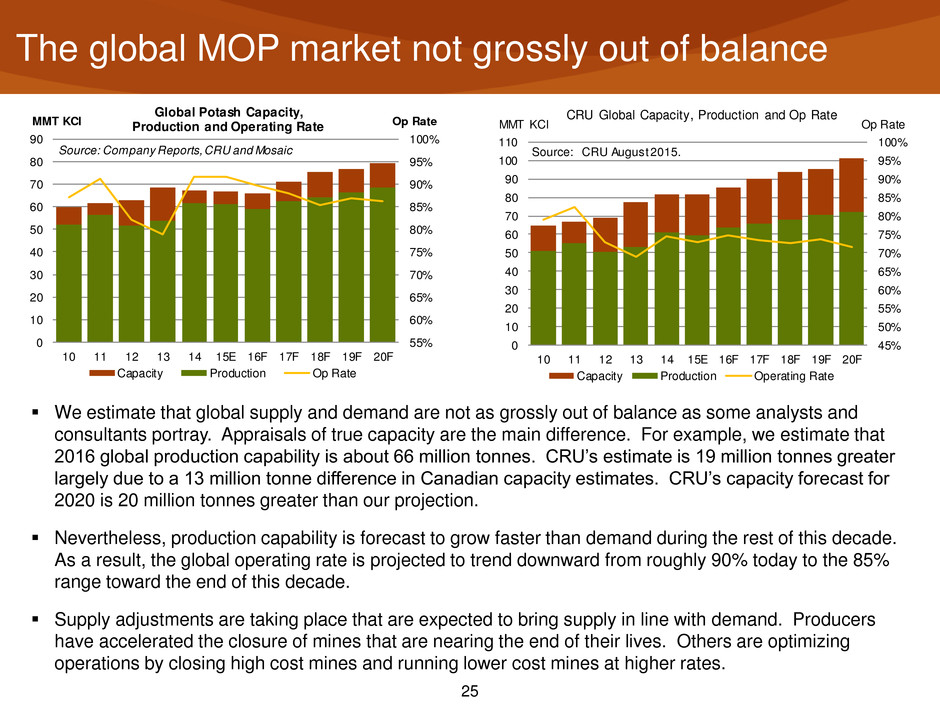
25 The global MOP market not grossly out of balance 55% 60% 65% 70% 75% 80% 85% 90% 95% 100% 0 10 20 30 40 50 60 70 80 90 10 11 12 13 14 15E 16F 17F 18F 19F 20F Op RateMMT KCl Source: Company Reports, CRU and Mosaic Global Potash Capacity, Production and Operating Rate Capacity Production Op Rate 45% 50% 55% 60% 65% 70% 75% 80% 85% 90% 95% 100% 0 10 20 30 40 50 60 70 80 90 100 110 10 11 12 13 14 15E 16F 17F 18F 19F 20F Op RateMMT KCl Source: CRU August 2015. CRU Global Capacity, Production and Op Rate Capa ity Production Operating Rate We estimate that global supply and demand are not as grossly out of balance as some analysts and consultants portray. Appraisals of true capacity are the main difference. For example, we estimate that 2016 global production capability is about 66 million tonnes. CRU’s estimate is 19 million tonnes greater largely due to a 13 million tonne difference in Canadian capacity estimates. CRU’s capacity forecast for 2020 is 20 million tonnes greater than our projection. Nevertheless, production capability is forecast to grow faster than demand during the rest of this decade. As a result, the global operating rate is projected to trend downward from roughly 90% today to the 85% range toward the end of this decade. Supply adjustments are taking place that are expected to bring supply in line with demand. Producers have accelerated the closure of mines that are nearing the end of their lives. Others are optimizing operations by closing high cost mines and running lower cost mines at higher rates.
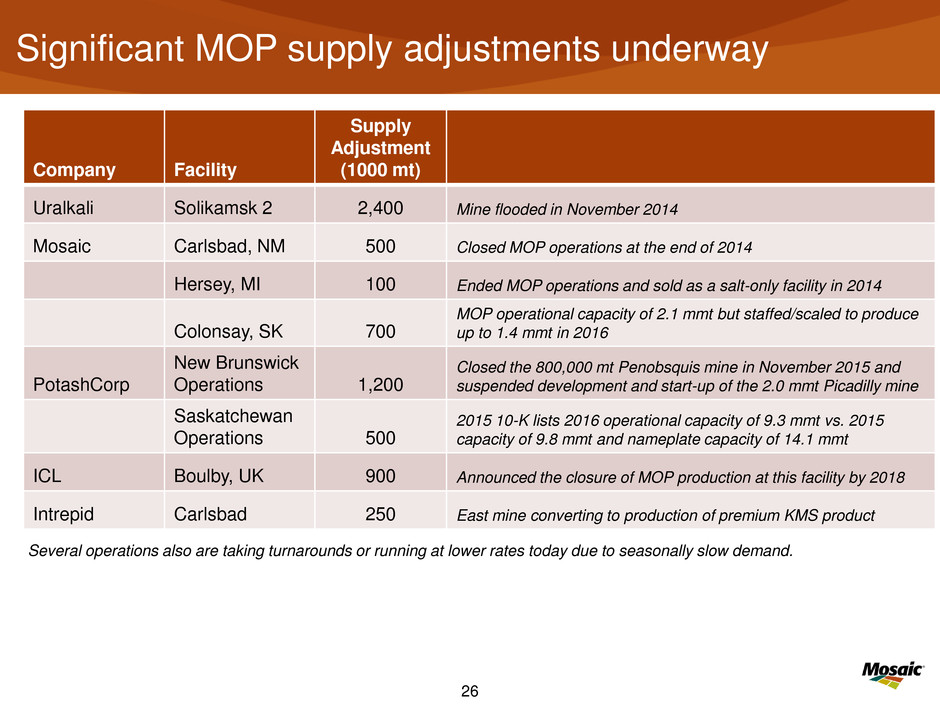
26 Significant MOP supply adjustments underway Company Facility Supply Adjustment (1000 mt) Uralkali Solikamsk 2 2,400 Mine flooded in November 2014 Mosaic Carlsbad, NM 500 Closed MOP operations at the end of 2014 Hersey, MI 100 Ended MOP operations and sold as a salt-only facility in 2014 Colonsay, SK 700 MOP operational capacity of 2.1 mmt but staffed/scaled to produce up to 1.4 mmt in 2016 PotashCorp New Brunswick Operations 1,200 Closed the 800,000 mt Penobsquis mine in November 2015 and suspended development and start-up of the 2.0 mmt Picadilly mine Saskatchewan Operations 500 2015 10-K lists 2016 operational capacity of 9.3 mmt vs. 2015 capacity of 9.8 mmt and nameplate capacity of 14.1 mmt ICL Boulby, UK 900 Announced the closure of MOP production at this facility by 2018 Intrepid Carlsbad 250 East mine converting to production of premium KMS product Several operations also are taking turnarounds or running at lower rates today due to seasonally slow demand.

27 Competition for Indian Demand NPK Fertilizers India 2016 Shangri-La’s Eros Hotel New Delhi March 9, 2016 Dr. Michael R. Rahm Vice President Market and Strategic Analysis Thank You!

28 Appendix

29 2016 Phosphate and Potash Shipment Forecasts 65-67 30 35 40 45 50 55 60 65 70 00 01 02 03 04 05 06 07 08 09 10 11 12 13 14 15E 16F Global Phosphate ShipmentsMMT Product DAP/MAP/NPS/TSP Source: CRU and Mosaic 58-60 25 30 35 40 45 50 55 60 65 00 01 02 03 04 05 06 07 08 09 10 11 12 13 14 15E16F Global Potash ShipmentsMil Tonnes KCl Source: CRU and Mosaic

30 2016 Phosphate Shipment Forecasts by Region Million Tonnes DAP/MAP/NPS*/TSP 2014R 2015E Nov Low 2016F Nov High 2016F Feb Low 2016F Feb High 2016F Comments China 21.4 19.6 20.8 21.2 20.6 20.9 Shipments of high analysis products declined last year due to moderate demand growth, delays in the winter stockpiling program, and competition from lower analysis products. We project a rebound this year based on continued profitable farm economics -- despite lower corn support prices and the VAT tax. India 7.7 9.2 9.1 9.4 8.5 8.8 Shipments and imports popped 1.5 and 2.5 mmt, respectively, last year with importers entering the market for large tonnage early in 2015/16. A below average monsoon hindered on-farm demand and led to a buildup of channel stocks. Our 2016 forecast has been cut to reflect a pulldown of inventories. Other Asia/Oceania 7.6 8.5 7.8 8.1 8.1 8.3 Shipments last year exceeded our earlier forecast despite weaker and volatile currencies and weather issues in some regions. Our 2016 forecast is up slightly from the November forecast as a result of profitable farm economics, average to below-average channel inventories and more stable foreign exchange rates. Europe and FSU 4.8 4.7 5.8 5.9 5.3 5.5 Shipments were about flat in 2015 (from a re-based level of ~4.8 mmt). Shipments in 2016 are projected to rebound due to steady to modestly higher shipments in Europe and stronger gains in the FSU. Weak currencies such as the ruble are expected to boost agricultural exports and phosphate use. Brazil 7.5 6.9 7.1 7.5 7.0 7.3 The collapse of the real and lack of credit resulted in a drop in shipments in 2015. The decline was about in line with the drop in phosphate use so channel inventories remained above-average. A modest rebound is expected due to lower phosphate prices, strong farm economics, and improved credit availability. Other Latin America 3.2 3.0 3.2 3.4 3.2 3.4 Shipments held up a bit better than expected in 2015, but still showed a modest year-over-year decline. Shipments are forecast to rebound this year as a result of steady agricultural commodity prices, more stable currencies and potentially much higher imports by Argentina. North America 8.9 9.0 8.8 9.0 8.8 9.0 Shipments exceeded our prior forecast for 2015 following a solid fall application season. Our 2016 forecast is unchanged from last November and assumes that markets will bid for, and farmers will plant, 90-91 million acres of corn, 82-83 million acres of soybeans, and 52-53 million acres of wheat this year. Other 4.0 3.5 3.4 3.6 3.6 3.8 Continued moderate growth is expected in Africa and parts of the Mideast. Total 64.9 64.4 66.0 68.0 65.0 67.0 Shipments last year were revised down 1.0 million tonnes from our prior point estimate largely due to much lower-than-expected Chinese shipments. We have lowered 2016 guidance 1.0 million tonnes to 65-67 million with a point estimate of 65.5 million mostly as a result of lower Indian shipments. Source: CRU and Mosaic. Numbers may not sum to total due to rounding.

31 2016 Potash Shipment Forecasts by Region Muriate of Potash Million Tonnes (KCl) 2014 2015E Nov Low 2016F Nov High 2016F Feb Low 2016F Feb High 2016F Comments China 13.8 15.8 14.3 14.6 13.4 13.7 Implied shipments surged 2.0 mmt to 15.8 mmt in 2015 as a result of record net imports (9.2 mmt) and record production (6.6 mmt) and exceeded our prior forecast by 1.8 mmt. The demand outlook remains positive, but shipments are projected to drop 2.0+ mmt due to a drawdown of channel inventories in 2016. India 4.3 4.0 4.6 5.0 3.7 3.9 Implied shipments totaled 4.0 mmt in 2015, down from 4.3 mmt in 2014 and less than our prior forecast of 4.3-4.4 mmt. A below average monsoon and a weaker and volatile rupee combined to limit imports. Shipments this year are projected to decline slightly absent a change in these key drivers. Indonesia/ Malaysia 5.3 4.3 4.9 5.2 4.7 5.1 Shipments dropped 1.0 mmt last year due to a build of channel inventories in 2014, weaker currencies, lower palm oil prices, and dry weather. Shipments are forecast to rebound more than 0.5 mmt this year based on better rainfall, lower K prices, moderate rice and palm oil prices, and more stable currencies. Europe and FSU 10.2 10.1 10.3 10.6 10.3 10.6 Shipments dropped slightly last year with declines in Western Europe exceeding moderate gains in Eastern Europe and the FSU. Shipments are forecast to tick up this year due to generally positive economic and agronomic demand drivers and average channel inventories. Brazil 9.3 8.7 8.8 9.0 8.2 8.5 The drop in shipments was about in line with the decline in use last year. As a result, channel inventories remained at elevated levels at the end of 2015. Shipments are forecast to decline again this year based on a modest uptick in projected use and a drawdown of channel inventories. North America 9.8 8.9 8.9 9.2 8.8 9.1 Shipments in CY 2015 declined nearly 1.0 mmt from the high level in 2014. Shipments roughly equaled estimated use, so channel inventories remain at or above average. Shipments this year are projected to stay about flat due to a small increase in use and a moderate pull down of channel inventories. Other 10.0 9.0 9.2 9.4 8.9 9.1 Shipments last year declined from high levels in 2014 due to across-the-board drops in Africa, the Mideast, and other Asian and Latin American countries. Shipments are projected to remain about flat this year as a result of moderate gains in demand met in part by a reduction of channel inventories. Total 62.7 60.7 61.0 63.0 58.0 60.0 The 2.0 mmt decline in 2015 was the result of a 2.0 mmt gain in China and a 4.0 mmt decline in the rest of the world (ROW). The large decline in ROW was the result of pipeline inventory builds in many countries and sluggish demand in a few others. Shipments this year are forecast to total 58-60 mmt with a point estimate of 59.7. The 1.0 mmt decline is the result of a roughly 2.0 mmt drop in China and a 1.0 mmt gain in the ROW. Source: CRU and Mosaic. Numbers may not sum to total due to rounding.
