Attached files
| file | filename |
|---|---|
| 8-K - 8-K - Independence Contract Drilling, Inc. | d119502d8k.htm |
 Evercore ISI Oilfield Tour & Growth Company 1x1 Forum & E&P Investor Event March 8, 2016 www.icdrilling.com Exhibit 99.1 |
 2 |
 Forward
Looking Statements and Non- GAAP Financial Measures
3/7/2016 3 Various statements contained in this presentation, including those that express a belief, expectation or intention, as well as those that are not
statements of historical fact, are forward-looking statements. These
forward-looking statements may include projections and estimates concerning the timing and success of specific projects and our future revenues, income and capital spending. Our forward-looking
statements are generally accompanied by words such as “estimate,”
“project,” “predict,”
“believe,” “expect,”
“anticipate,” “potential,”
“plan,” “goal,”
“will” or other words that convey the uncertainty of future events or outcomes. The forward-looking statements in this presentation speak only as of the date of this presentation; we disclaim any
obligation to update these statements unless required by law, and we caution
you not to rely on them unduly. We have based these forward-looking statements on our current expectations and assumptions about future events. While our management considers these
expectations and assumptions to be reasonable, they are inherently subject to significant
business, economic, competitive, regulatory and other risks, contingencies and uncertainties, most of which are difficult to predict and many of which are beyond our control. These and other important factors, including those discussed under
“Risk Factors” and “Management’s Discussion and Analysis of Financial Condition and Results of Operations”
included in the Company’s
filings with the Securities and Exchange Commission, including the Company’s
Annual Report on Form 10-K, may cause our actual results, performance or achievements to differ materially from any future results, performance or achievements expressed or implied by these forward-looking statements. These risks, contingencies and uncertainties include, but are not limited to, the following: •our inability to implement our business and growth strategy;
•a sustained decrease in domestic spending by the
oil and natural gas exploration and production industry; •decline in or substantial volatility of crude oil and natural gas commodity prices; •fluctuation of our operating results and volatility of our industry;
•inability to maintain or increase pricing on our
contract drilling services;
•delays in construction or deliveries of our new
land drilling rigs; •the loss
of our customer, financial distress or management changes of potential customers or failure to obtain contract renewals and additional customer contracts for our drilling services; •an increase in interest rates and deterioration in the credit markets;
•our inability to raise sufficient funds through
debt financing and equity issuances needed to maintain financial liquidity and fund our planned operations and capital expenditures;
•our inability to comply with the financial and
other covenants in debt agreements that we may enter into as a result of reduced revenues and financial performance;
•a
substantial reduction in borrowing base under our revolving credit facility as a result of a decline in the appraised value of our drilling rigs or rigs losing eligibility for inclusion in the borrowing base; •overcapacity and competition in our industry;
•unanticipated costs, delays and other difficulties
in executing our long-term growth strategy; •the loss of key management personnel;
•new technology that may cause our drilling methods
or equipment to become less competitive; •labor costs or shortages of skilled workers;
•the loss of or interruption in operations of one
or more key vendors; •the
effect of operating hazards and severe weather on our rigs, facilities, business, operations and financial results, and limitations on our insurance
coverage; •increased regulation
of drilling in unconventional formations; •the incurrence of significant costs and liabilities in the future resulting from our failure to comply with new or existing environmental
regulations or an accidental release of hazardous substances into the environment; •the potential failure by us to establish and maintain effective internal control over financial
reporting; •lack of operating
history as a contract drilling company; and •uncertainties associated with any registration statement, including financial statements, we may be required to file with the SEC. All forward-looking statements are necessarily only estimates of future results, and there can be no assurance that actual results will not
differ materially from expectations, and, therefore, you are cautioned not
to place undue reliance on such statements. Any forward-looking statements are qualified in their entirety by reference to the factors discussed throughout this presentation. Further, any
forward-looking statement speaks only as of the date on which it is made, and we
undertake no obligation to update any forward-looking statement to reflect events or circumstances after the date on which the statement is made or to reflect the occurrence of unanticipated events. Each of EBITDA and Adjusted EBITDA is a supplemental non-GAAP financial measure that is used by management and external users of our financial statements, such as industry analysts, investors, lenders and rating agencies. We define “EBITDA”
as earnings (or loss) before interest, taxes, depreciation, and amortization, and we define “Adjusted
EBITDA” as EBITDA before stock-based compensation, gain/loss on warrant derivative liability and non-cash asset impairments. Adjusted EBITDA is not a measure of net income as determined by U.S.
generally accepted accounting principles (“GAAP”). Management believes each of EBITDA and Adjusted EBITDA is useful because it allows us and our stockholders to more effectively evaluate our
operating performance and compare the results of our operations from period
to period and against our peers without regard to our financing methods or capital structure. We exclude the items listed above from net income (loss) in calculating EBITDA and Adjusted EBITDA because these amounts can vary substantially from company to company within our industry depending upon accounting methods and book
values of assets, capital structures and the method by which the assets were
acquired. EBITDA and Adjusted EBITDA should not be considered an alternative to, or more meaningful than, net income (loss), the most closely comparable financial measure calculated in accordance with GAAP or as an indicator of our operating performance or liquidity. Certain items excluded from EBITDA and
Adjusted EBITDA are significant components in understanding and assessing a
company’s financial performance, such as a company’s cost of capital and tax structure, as well as stock-based compensation and the historic costs of depreciable assets,
none of which are components of EBITDA or Adjusted EBITDA. Our presentation
of EBITDA and Adjusted EBITDA should not be construed as an inference that our results will be unaffected by unusual or non-recurring items. Our computations of EBITDA and Adjusted EBITDA may not be comparable to other similarly titled measures of other
companies. 3 |
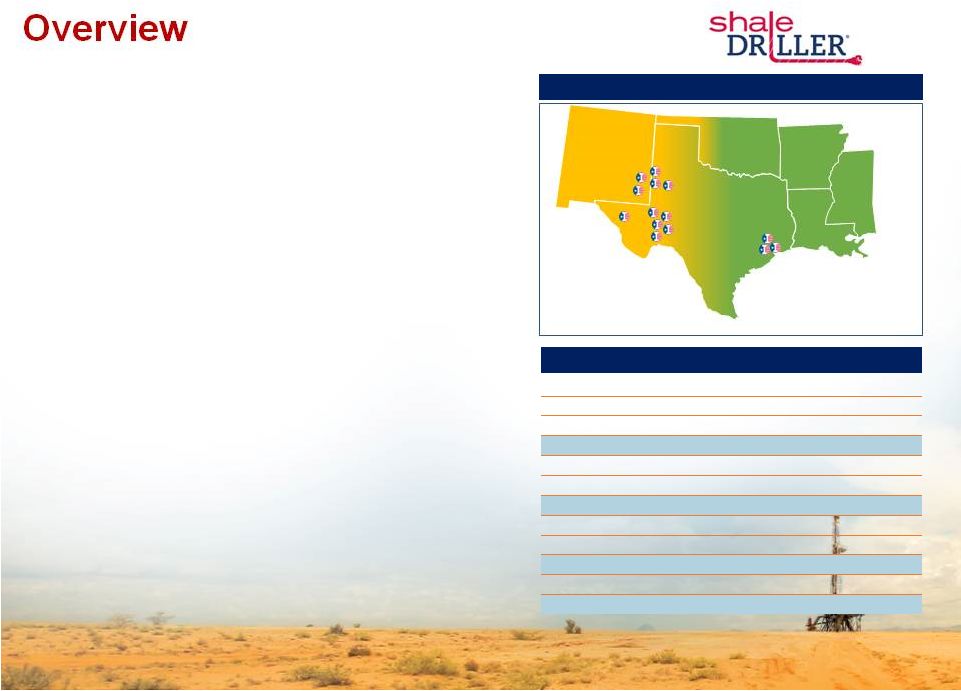 1. Includes 12 marketed 200 Series Shaledriller® rigs and one rig conversion to 200 Series pad optimal status at the end of Q1’16.
. Excludes one non-walking rig scheduled for conversion to 200
Series pad optimal status when market conditions improve. 2.
Market data as of 3/2/2016
3. Adjusted to reflect revised rig appraisals completed 1Q’16
Overview Successfully Completed IPO in August 2014 (NYSE: ICD) Best-in-Class 14 Rig Fleet • Sector’s most technologically advanced rigs • Fleet composed of thirteen 200 Series Shaledriller® rigs (1) • One non-walking rig scheduled for conversion to 200 Series pad optimal status when market conditions improve Established reputation for operational excellence and safety • Safety focused operations • Fleet-wide uptime of ~98% • Industry leading utilization: ~87% during 4Q’15 (2) • Best-in-class operating stats: longest lateral drilled in Permian Basin: ~14,000 feet; walking between well groups 300 ft / between pads 600 ft • Average fleet age of ~2 years Key near-term initiatives • Target generating a free cash flow surplus in 2016 • Postponing all newbuild activity until market conditions improve Current Operational Footprint Current Capitalization & Liquidity (2) US$MM, unless otherwise noted Share Price ($/Share) 3.98 Share Outstanding (MM) 24.4 Equity Value 97.1 Total Debt 62.7 Cash 5.3 Aggregate Value 154.5 Borrowing Base Unused Capacity (3) 21.8 Cash 5.3 Total Current Liquidity 27.1 Book Value of Equity 232.7 Total Capitalization 295.4 4 Texas Oklahoma Arkansas Louisiana New Mexico Target Areas of Growth Texas, Louisiana, Oklahoma and New Mexico January 31, 2016 |
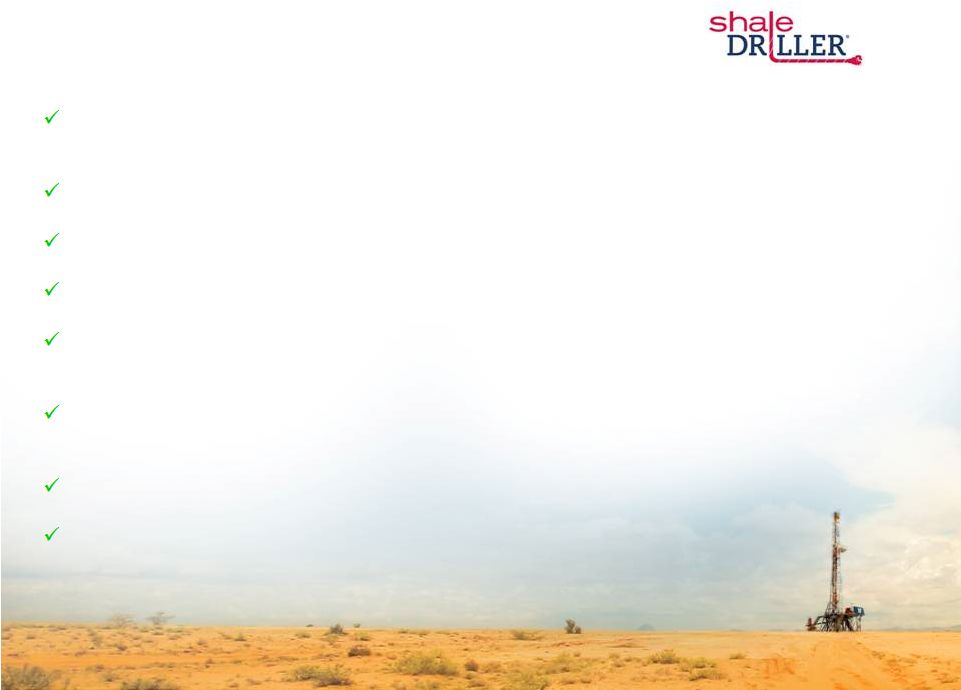    ICD is a leader in the rig replacement cycle – pad optimal rigs are critical in the progression of the U.S. unconventional drilling evolution With industry leading fleet utilization, ICD is the rig provider of choice By driving faster cycle times, ICD’s rigs bend the E&P cost curve down ICD’s standardized fleet supports lower capital intensity Modular manufacturing gives ICD a low cost rig fleet, and provides a compounding capital advantage ICD’s “Big Data” generation capability allows ICD to participate in the next wave
in drilling technology innovation
ICD’s rigs provide high quality EBITDA with a high cash conversion rate
Balance sheet supported by the highest quality asset base in the industry
– average age of fleet is ~2 years
Key Differentiators Driving ICD’s
Value Proposition 5 |
 Overview of
Current U.S. Land Drilling Market Conditions
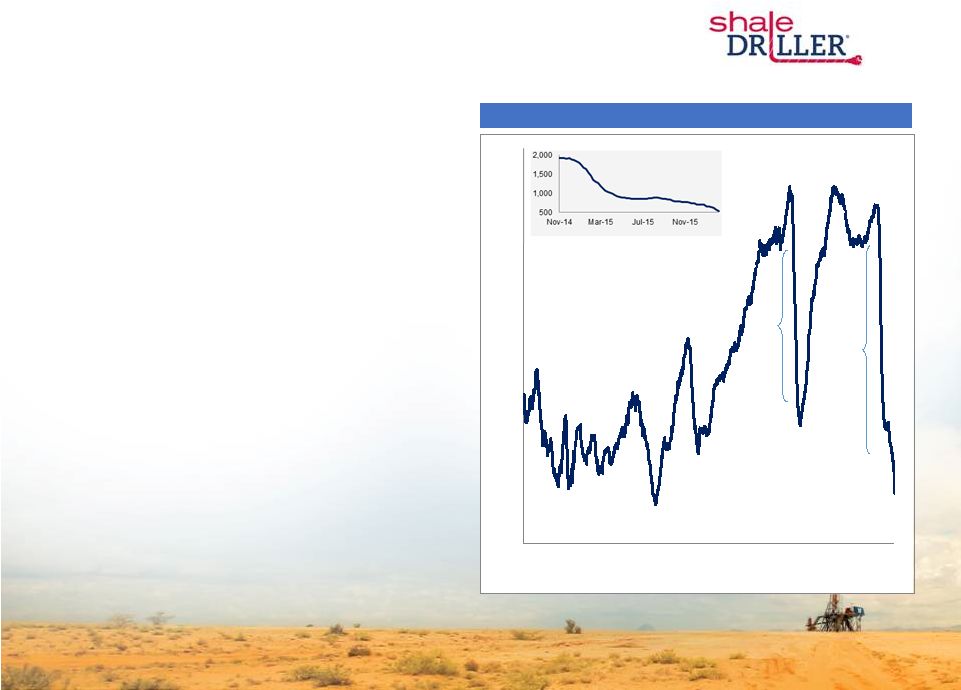
• While the U.S. land rig count is at historical lows, E&P operators remain laser-focused on efficient unconventional development • E&P operators are seeking differentiated technology that improves efficiency and reduces overall costs to develop reserves (more production for less cost) • Horizontal development is the priority today vs. legacy vertical programs, and multi-well pad development in a manufacturing well- bore model is becoming standard operating procedure, with increasing wells per pad being a key focus • In a commodity recovery, short cycle development opportunities such as onshore shale will be the first developed, and pad- optimal rigs will be the equipment of choice for operators U.S. Land Rig Count at Historical Lows Source: BHI U.S. Land Rig Count, Rig Data February 12, 2016 6 300 500 700 900 1,100 1,300 1,500 1,700 1,900 2,100 1990 1993 1996 1999 2002 2005 2008 2011 2014 1,141 (Dec 1990) 902 (Dec 1992) 592 (Apr 1993) 1,029 (Sep 1997) 736 (Apr 2002) 879 (Jun 2009) 541 (Feb 12, 2016) 1,942 (Aug 2008) 2,005 (Oct 2011) 1,924 (Sep 2014) (1,063) (1,383) 1,273 (Jul 2001) RigData November 2014 to Present |
    Market
Conditions •
North American E&P operators developing unconventional shale resources
have become the global swing producer
• To continue in prominence in this role, North American E&P’s must have the lowest cost operations in the most economic basins available • Achieving this goal requires E&Ps to embrace technological innovation, value-added processes and services that drive major operating efficiencies • ICD is a technological disruptor in North American unconventional drilling – pad-optimal rigs (as defined by the E&P industry) deployed on multi-well
pads in a wellbore manufacturing model materially reduce cycle times and
operating costs for E&P operators
1. Includes 13 marketed 200 Series Shaledriller® rigs. One additional non-walking rig in the fleet is scheduled for conversion to 200 Series
pad optimal status when market conditions improve.
7 |
       High
- Pressure Mud Pumps
Key Pad-Optimal Rig Characteristics
(As Defined by E&P Operators)
Omni-Directional Walking System
• Allows rig to move in any direction quickly between wellheads, rapidly and efficiently adjusts to
misaligned wellbores, walks over raised well heads and increases safety
• Superior to skidding systems which can only move to properly aligned wells in a straight line
• Self-leveling capabilities 1,500 hp Drawworks • Rigs powered with 1,500 hp drawworks are well suited to the majority of unconventional resource formations • Ideally sized for drilling longer laterals while occupying a small footprint on the job site
Bi-Fuel Capabilities
• Operator can change between diesel or natural gas mix • Use of natural gas/diesel blend can result in major savings • Reduces carbon emissions • High pressure mud pumps allow for drilling mud to be pumped through extended horizontal laterals
• Necessary for drilling the long laterals required by complex horizontal drilling programs
8 Fast Moving • Specifically designed to reduce cycle times (reduces rig-move time between drilling locations)
• Designed to minimize truck loads (and times) required for moves between drilling sites; complete move
in 48 hours (4 daylight days or less)
AC Programmable • Uses a variable frequency drive that allows for precise computer control of key drilling parameters
during operations, providing accurate drilling through the wellbore
• AC rigs drill faster with less open hole time and superior wellbore geometry vs. mechanical or SCR rigs
• In today’s market, it is no longer a differentiating feature, it is a requirement |
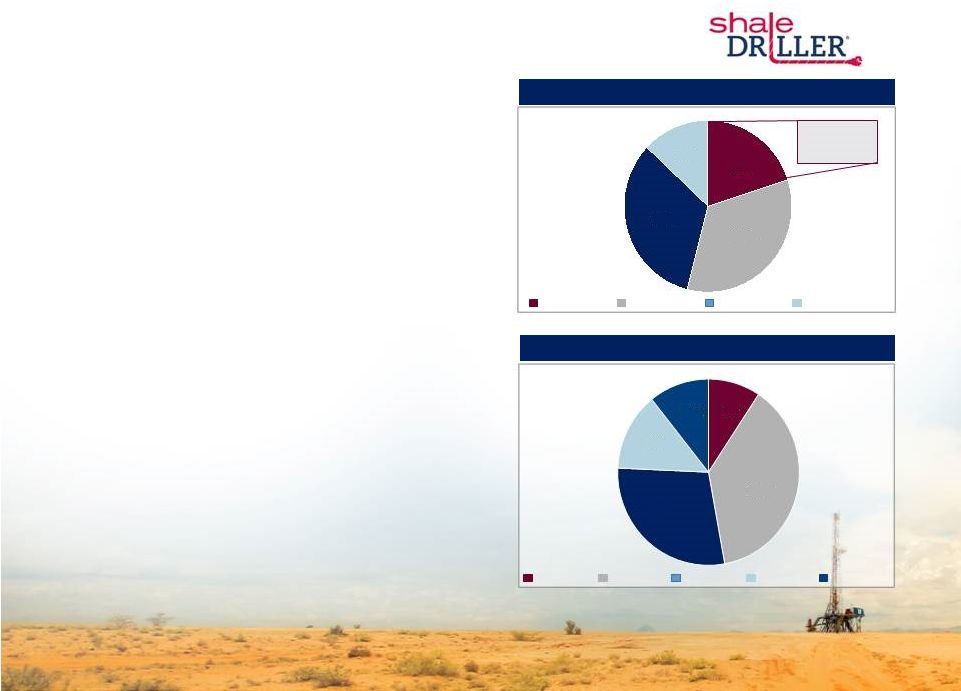 Competitor 4) Competitor 3 Competitor 2 Competitor 1 ICD (Shaledriller®) Dissecting the New Land Drilling Industry 9 New Land Drilling Industry – Pad-Optimal Fleet (2) Land Drilling Industry – AC Rig Fleet (1) 1. Includes only 1,500 hp AC rigs 2. Excludes skidding rigs . 750 Rigs Pad-optimal Skidding Non-Moving Other New Land Drilling Industry Source: ICD, Investor Presentations, Company Websites As E&P operators continue the shift towards a wellbore manufacturing model, the focus will be squarely on the rigs that consistently eliminate non-productive time and drive major operating efficiencies •Pad-
optimal
rigs, as defined by E&P operators, represent equipment that is best suited for wellbore manufacturing - Drills more wells per year and accelerates E&P operators’ production profiles and cash flows •The majority of AC rigs in the U.S. are not pad-optimal, lacking effective moving systems to navigate complex pads, high pressure mud pumps, and other key subsystems - AC is no longer a differentiating technology - Of the ~750 AC rigs in the U.S., only ~20% of them have the equipment necessary to be pad-optimal •ICD’s rigs are equipped with the latest technology to help
operators bend the cost curve down
ICD’s rigs eliminate non-productive time, drill longer
laterals faster and for less cost, and materially reduce
cycle times ~140 Rigs Source: Wall Street Research 20% 34% 33% 13% 9% 38% 29% 13% 11% |
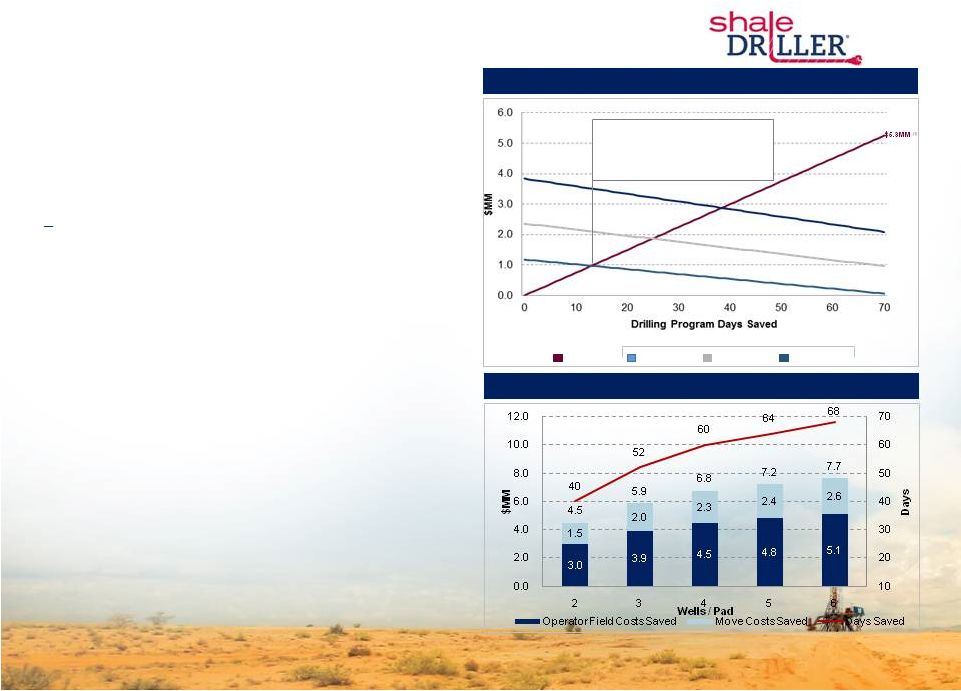 Cutting only 13 days off a 295
day drilling program justifies the
incremental cost of a $16k/day
pad-optimal rig $16,000 Dayrate $20,000 Dayrate $25,000 Dayrate Incremental Cost of a Pad-Optimal Rig (2) AFE Savings Examples of ICD Delivering Significant Value for E&P Operators Cutting Cycle Times - Illustrative Savings vs Legacy Rigs 1. Assumes 75k operator spread cost over 70 days 2. Based on $12,000 dayrate for legacy rig for a 295 day program; incremental cost calculated as Pad-Optimal Rig Cost * (295 –
Days Saved) – Legacy Rig Cost * 295 days 3. Based on an assumed 20 well program, 15 drilling days per well, 4 days per move with $150k cost per move, $75k operator spread cost per day
(including rig cost) 10
Case Study: Multi-Well Pad Drilling Program
• An operator drilling multi-well pads benefits from ICD’s pad-optimal technology vs. single or double well pads, reducing cycle times as number of moves and move durations decline Non pad-optimal rigs, with legacy skidding or slow walking systems, are effective on 1-2 well pads but cannot efficiently prosecute larger well pads that are becoming increasingly common today • Results in major cost savings for E&P operators • In an environment where total operator spread costs can approach $75,000/day on a wellsite, the incremental dayrate for a pad-optimal rig is marginal • In 2015, for a large E&P operator utilizing a pad drilling program, ICD cut 70 days and $5.3MM off their drilling budget AFE $5.3MM (1) Multi-Well Pad Drilling - Illustrative Savings vs 1 Well Pads (3) |
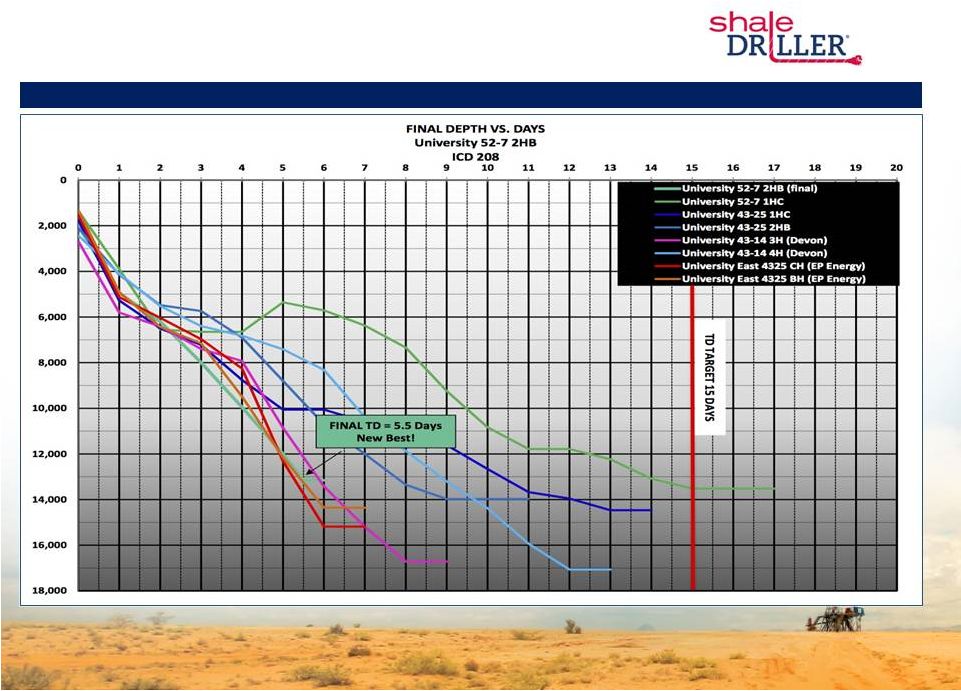 By Saving
Drilling Days, ICD’s Rigs Drive Major Value Savings for E&P
Operators ICD Rig Delivers Industry-Leading Cycle Times
11 |
 ICD
Initiatives 12
• Postponing all new build activities until market improves • Postponing commencement of second rig conversion until market improves • Since June 30, 2015: - Removed approximately $1.0 million from run rate SG&A costs. - Removed approximately $1.0 million from construction overhead costs while maintaining internal build expertise - Removed approximately $600 per day of rig operating costs. |
 Operations Update 13 Since filing of its Form 10-K on February 18, 2016: • Successfully extended contracts on a multi-well basis into 2016 for two rigs operating in the spot market • Received notification from a customer that it will place an ICD rig currently operating under term contract on a standby- without- crew basis. As a result, ICD expects to have four rigs earning revenue on a standby basis at the end of 1Q’16 |
 14 ICD Financial Update • 2016 Capital Expenditure Budget: ~$10 million. - Rig conversion in process - Maintenance capex - Planned 7500psi upgrade - Non-deferrable capex • Ratios at 12/31/15: - Net Debt/Adjusted EBITDA: 2.3x - Interest coverage ratio: 7.8x - Net Debt/Total Capitalization: 20% • Aggregate Backlog at 12/31/15: ~$75 million (2) • Targeting free cash flow surplus in 2016 (3) Financial Liquidity @ 12/31/15 $ millions Financial Update Cash @ 12/31/15 $5.3 Plus: Adjusted Revolving Credit Facility Borrowing Base @ 12/31/15 (1) 84.5 Less: Outstanding Borrowings @ 9/30/15 (62.7) Total Liquidity $27.1 (1) Adjusted to reflect appraisal values from appraisal completed Q1’16: Total facility commitment is $125 million. Borrowing
base excludes one idle 200 series rig and two rigs scheduled
for conversion. Rigs that do not earn revenue for a period of 90 consecutive days no longer considered an eligible rig and are excluded from the borrowing base.. (2) Backlog includes only contracts with original durations of six months or more. Backlog excludes other revenues such as fees for mobilization,
demobilization and customer reimbursables. Backlog does not include
potential reductions in rates during periods in which the rig is moving, on standby or incurring maintenance and repair time in excess of contractually allowed downtime. ICD expects to have rigs earning revenue on a standby-without-crew basis during 2016.
(3) Free cash flow defined as adjusted EBITDA less planned capital expenditures, cash interest expense and cash taxes and plus/minus any decreases/increases in net working capital. ICD deferring all discretionary capex to future periods in order to maintain liquidity to fund all required capital expenditures and interest requirements |
 15 |
 Land
Drilling’s Only Pure-Play, Pad Optimal,
Growth Story Large Operators are Leading Unconventional Resource Capture Major Secular Shift in Unconventional Development is Underway Ongoing Resource Play Development Driving a Rig Replacement Cycle Pad Optimal AC Drilling Rigs are in Short Supply Major Barriers to Entry Exist for New Contract Drillers Vertically Integrated Model Provides a Compounding Capital Advantage ShaleDriller ® Offers a Compelling Value Proposition to E&P Customers 16 Delivering Value to Stakeholders |
 Supplemental Materials |
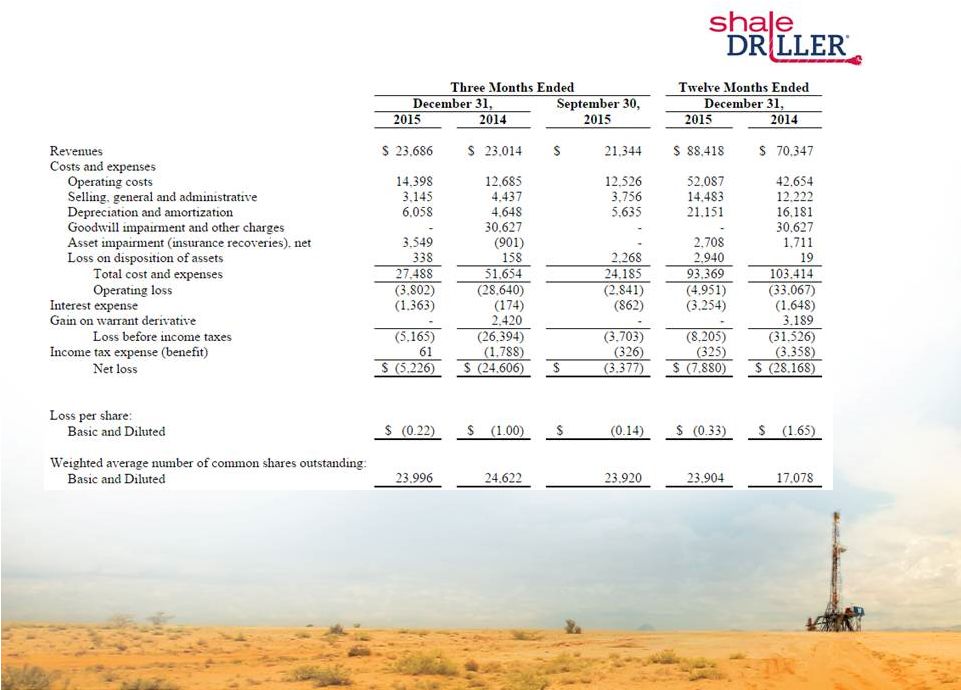 Income
Statement 18 |
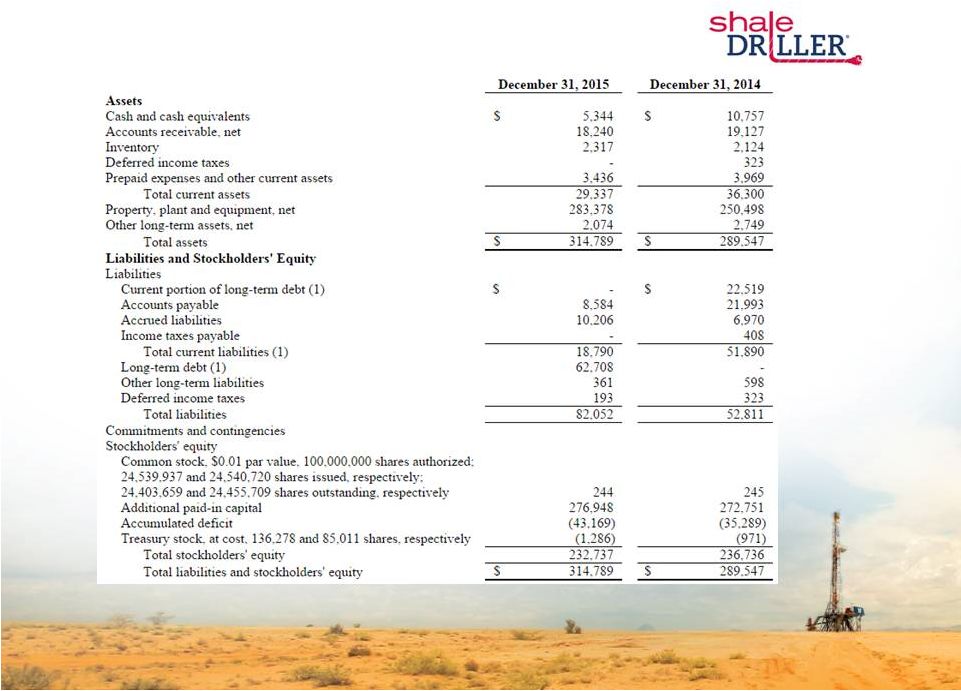 Balance
Sheet 19
Although borrowings under our credit facility do not mature until 2018, we revised the
classification of long-term debt in our balance sheet as of December 31, 2014 from long-term debt to current portion of long-term debt due to our credit facility at the time including both a required lock-box payment method and a subjective acceleration clause permitting the lenders to
declare an event of default in the event of a material adverse change. We subsequently amended our credit facility to provide for a springing lock-box arrangement to permit the long-term classification of the debt, subject to
the credit facility's ultimate maturity and our compliance with its terms and conditions. The reclassification did not affect previously reported net income, total assets, total liabilities, stockholders equity or cash flows as of and for
the year ended December 31, 2014 |
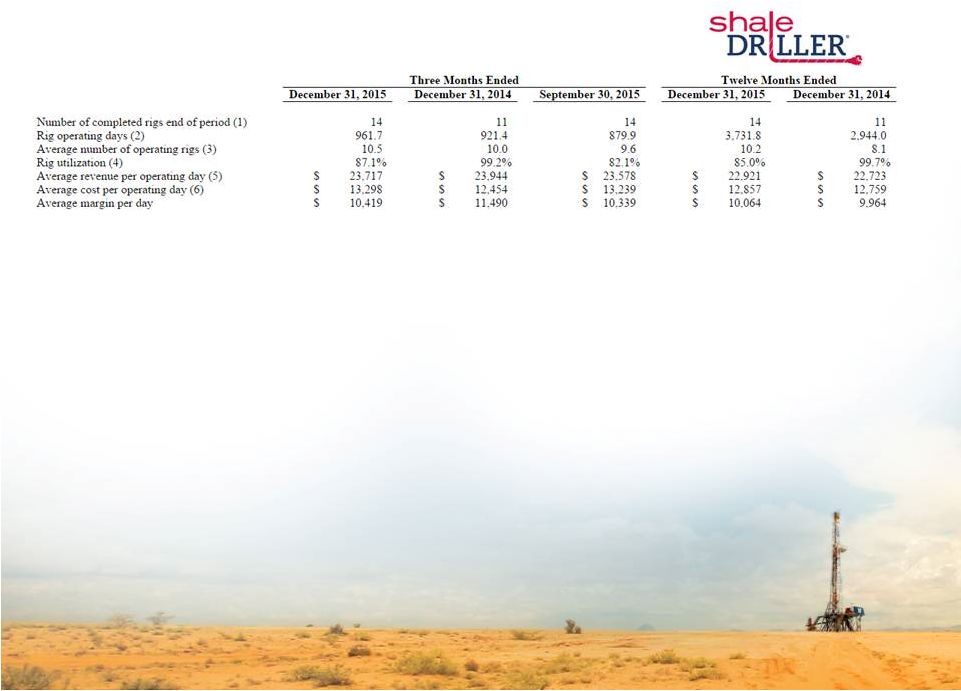 Operating
Data 20 (1) Number of completed rigs as of December 31, 2015, increased by three compared to the number of completed rigs as of December 31, 2014, reflecting the addition of three newly constructed rigs (2) Rig operating days represent the number of days that our rigs are earning revenue under a contract, including days that standby revenues or
early termination revenues are earned.
During the twelve months ended December 31, 2015, there were 471.3 operating days in
which ICD earned revenue on a standby basis, including 228.5 standby-without- crew days. During the twelve months ended December 31, 2014 we did not record any operating days designated as standby-without-crew
days (3) Average
number of operating rigs is calculated by dividing the total number of rig operating days in the period by the total number of calendar days in the period (4) Rig utilization is calculated as rig operating days divided by the total number of days our drilling rigs are available during the applicable
period. During the third quarter of 2015, the Company elected to remove
its two 100 series non-walking rigs from its marketed fleet pending completion of their planned rig conversions to 200 series, pad-optimal status. Rig utilization during the third and fourth quarter of 2015 excludes these two rigs
(5) Average revenue per operating day represents total contract drilling revenues
earned during the period divided by rig operating days in the period. Excluded in calculating average revenue per operating day are revenues associated with the reimbursement of out-of-pocket costs paid by customers of $0.9
million, $0.9 million and $0.6 million during the three months ended
December 31, 2015 and 2014, and September 30, 2015, respectively, and $2.9 million and $3.2 million during the twelve months ended December 31, 2015 and 2014, respectively (6) Average cost per operating day represents total direct operating costs incurred during the period divided by rig operating days in the
period. The following costs are excluded in calculating average cost per
operating day: (i) costs relating to out-of-pocket costs reimbursed by customers of $0.9 million, $0.9 million and $0.6 million during the three months ended December 31, 2015 and 2014, and September 30, 2015, respectively, and $2.9 million and $3.2 million during the twelve months ended December
31, 2015 and 2014, respectively, (ii) new crew training costs of $0.3
million, $0.3 million and $0.3 million during the three months ended December 31, 2015 and 2014, and September 30, 2015, respectively, and $0.8 million and $1.8 million during the twelve months ended December 31, 2015 and 2014, respectively, and (iii) construction
overhead costs expensed due to reduced rig construction activity of $0.5
million during the fourth quarter of 2015 |
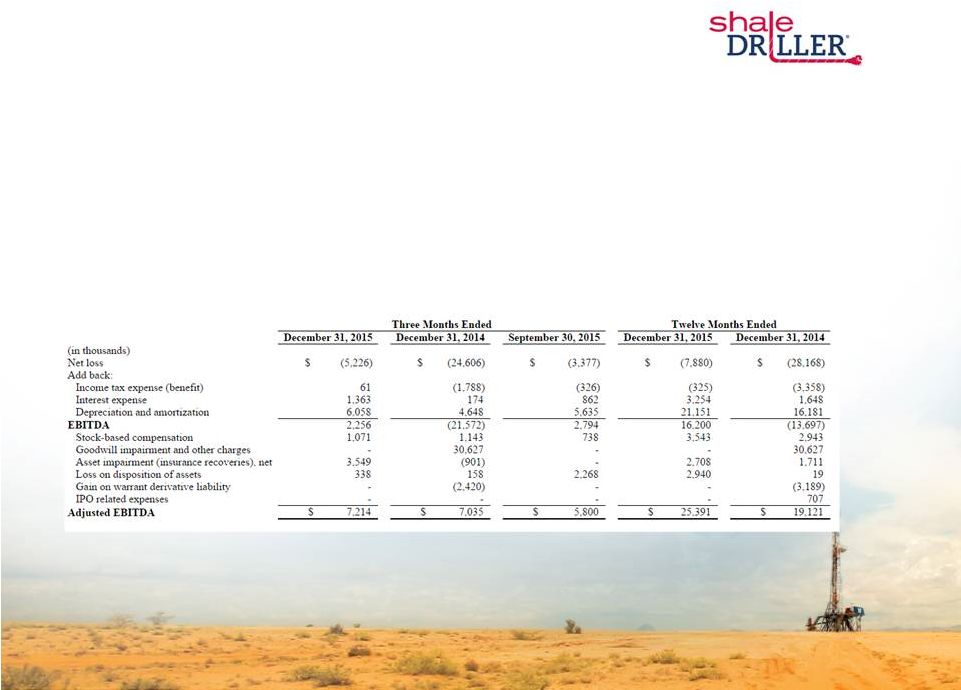 Non-GAAP Financial Measures
21 Adjusted EBITDA is a supplemental non-GAAP financial measure that is used by management and external users of our financial statements, such
as industry analysts, investors, lenders and rating agencies. We define
"EBITDA" as earnings (or loss) before interest, taxes, depreciation, and amortization, and we define "Adjusted EBITDA" as EBITDA before stock-based compensation, gain/loss on warrant derivative liability and non-cash asset impairments, gains or losses on disposition of
assets and other non-operating items. Adjusted EBITDA is not a
measure of net income as determined by U.S. generally accepted accounting principles ("GAAP")
Management believes Adjusted EBITDA is useful because it allows our stockholders to
more effectively evaluate our operating performance and compare the results of our operations from period to period and against our peers without regard to our financing methods or capital structure. We exclude the items listed above from
net income (loss) in calculating Adjusted EBITDA because these amounts
can vary substantially from company to company within our industry depending upon accounting methods and book values of assets, capital structures and the method by which the assets were acquired. Adjusted EBITDA should not be considered an alternative to, or more meaningful than,
net income (loss), the most closely comparable financial measure
calculated in accordance with GAAP or as an indicator of our operating performance or liquidity. Certain items excluded from Adjusted EBITDA are significant components in understanding and assessing a company's financial performance, such as a company's cost of capital and tax
structure, as well as stock-based compensation and the historic costs
of depreciable assets, none of which are components of Adjusted EBITDA. Our presentation of Adjusted EBITDA should not be construed as an inference that our results will be unaffected by unusual or non-recurring items. Our computations of Adjusted EBITDA may not be
comparable to other similarly titled measures of other companies
The following table presents a reconciliation of Adjusted EBITDA to the GAAP financial
measure of net income for each of the periods indicated |
 22 22 |