Attached files
| file | filename |
|---|---|
| 8-K - CURRENT REPORT ON FORM 8-K - DELTA AIR LINES, INC. | dal_8k.htm |
Exhibit 99.1

Delta – A High Quality Company JP Morgan Aviation , Transportation and Industrials Conference March 8 , 2016

2 Safe Harbor Statements in this presentation that are not historical facts, including statements regarding our estimates, expectations, be lie fs, intentions, projections or strategies for the future, may be "forward - looking statements" as defined in the Private Securities L itigation Reform Act of 1995. All forward - looking statements involve a number of risks and uncertainties that could cause actual results t o differ materially from the estimates, expectations, beliefs, intentions, projections and strategies reflected in or suggested by the forward - looking statements. These risks and uncertainties include, but are not limited to, the cost of aircraft fuel; the impac t of rebalancing our hedge portfolio, recording mark - to - market adjustments or posting collateral in connection with our fuel hedge contracts; the availability of aircraft fuel; the effects of terrorist attacks or geopolitical conflict; the possible effects of accidents involving our aircraft; the restrictions that financial covenants in our financing agreements will have on our financial and bus iness operations; labor issues; interruptions or disruptions in service at one of our hub or gateway airports; disruptions or secur ity breaches of our information technology infrastructure; our dependence on technology in our operations; the effects of weather , natural disasters and seasonality on our business; the effects of an extended disruption in services provided by third party reg ional carriers; failure or inability of insurance to cover a significant liability at Monroe’s Trainer refinery; the impact of envi ron mental regulation on the Trainer refinery, including costs related to renewable fuel standard regulations; our ability to retain man age ment and key employees; competitive conditions in the airline industry; the effects of extensive government regulation on our busi nes s; the sensitivity of the airline industry to prolonged periods of stagnant or weak economic conditions; and the effects of the rap id spread of contagious illnesses. Additional information concerning risks and uncertainties that could cause differences between actual results and forward - looking statements is contained in our Securities and Exchange Commission filings, including our Annu al Report on Form 10 - K for the fiscal year ended Dec. 31, 2015. Caution should be taken not to place undue reliance on our forward - looking statements, which represent our views only as of March 8 , 2016 and which we have no current intention to update . In this presentation, we will discuss certain non - GAAP financial measures. You can find the reconciliations of those measures t o comparable GAAP measures on our website at delta.com

A High Quality Company Consistently Producing Solid Results Momentum Continues in 2016 Building A Durable Business Model Leveraging our solid foundation to produce consistent, sustainable results for shareholders • Running a reliable, customer - focused airline is producing record profits and returns, allowing for improved balance sheet strength and increased capital returns to shareholders • More durable business model positioned to produce strong profits and cash flows throughout the business cycle • Fuel tailwind, modest capacity growth and success with commercial and cost initiatives provide solid earnings momentum into 2016 3
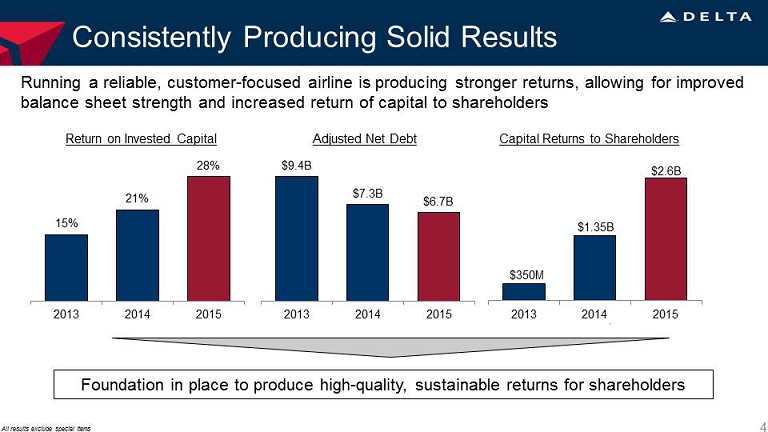
Consistently Producing Solid Results Running a reliable, customer - focused airline is producing stronger returns, allowing for improved balance sheet strength and increased return of capital to shareholders All results exclude special items Foundation in place to produce high - quality, sustainable returns for shareholders $ 9.4B $ 7.3B $ 6.7B 2013 2014 2015 15% 21% 28% 2013 2014 2015 $ 350M $ 2.6B 2013 2014 2015 $1.35B 4 Return on Invested Capital Capital Returns to Shareholders Adjusted Net Debt

Operating margin 18% - 20% Passenger unit revenue change year over year Down 2.5% - 4.5% Fuel Price $1.33 - $1.35 CASM – ex fuel including profit sharing change year over year Up ~5% Cash return to shareholders ~$880 million Fuel price includes taxes, settled hedges, refinery contribution and excludes MTM adjustments; CASM excludes special items. • Unit revenue guidance reflects a stable demand environment, with capacity actions and commercial initiatives offsetting currency pressures • Lower fuel prices and cost discipline drive ~10 points of YOY margin expansion this quarter • Share repurchases include $350 million ASR completed in connection with the common stock contribution to the pension plan March Quarter 2016 Forecast Producing A Record March Quarter 5
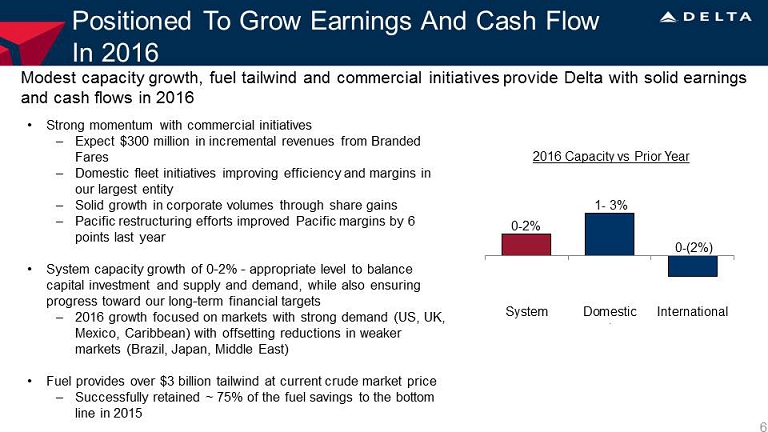
Positioned To Grow Earnings And Cash Flow In 2016 • Strong momentum with commercial initiatives – Expect $300 million in incremental revenues from Branded Fares – Domestic fleet initiatives improving efficiency and margins in our largest entity – Solid growth in corporate volumes through share gains – Pacific restructuring efforts improved Pacific margins by 6 points last year • System capacity growth of 0 - 2% - appropriate level to balance capital investment and supply and demand, while also ensuring progress toward our long - term financial targets – 2016 growth focused on markets with strong demand ( US, UK, Mexico, Caribbean) with offsetting reductions in weaker markets (Brazil, Japan, Middle East) • Fuel provides over $3 billion tailwind at current crude market price – Successfully retained ~ 75% of the fuel savings to the bottom line in 2015 Modest capacity growth, fuel tailwind and commercial initiatives provide Delta with solid earnings and cash flows in 2016 6 0 - 2% System Domestic International 1 - 3% 2016 Capacity vs Prior Year 0 - (2%)
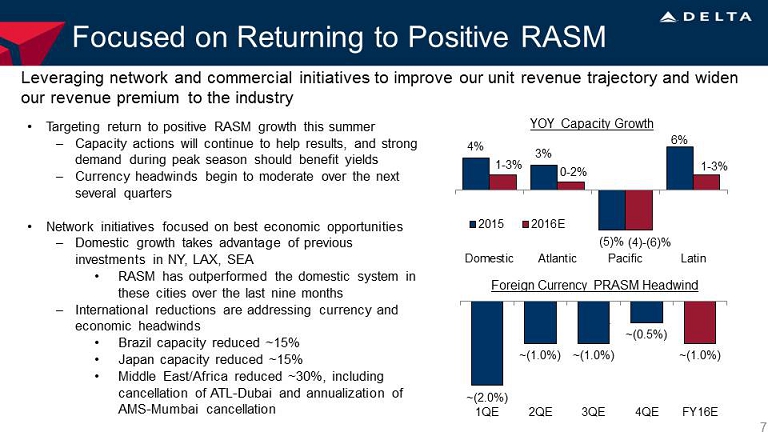
Focused on Returning to Positive RASM • Targeting return to positive RASM growth this summer – Capacity actions will continue to help results, and strong demand during peak season should benefit yields – Currency headwinds begin to moderate over the next several quarters • Network initiatives focused on best economic opportunities – Domestic growth takes advantage of previous investments in NY, LAX, SEA • RASM has outperformed the domestic system in these cities over the last nine months – International reductions are addressing currency and economic headwinds • Brazil capacity reduced ~15% • Japan capacity reduced ~15% • Middle East/Africa reduced ~30%, including cancellation of ATL - Dubai and annualization of AMS - Mumbai cancellation Leveraging network and commercial initiatives to improve our unit revenue trajectory and widen our revenue premium to the industry 7 ~(2.0%) ~(1.0%) ~(1.0%) ~(0.5%) ~(1.0%) 1QE 2QE 3QE 4QE FY16E Foreign Currency PRASM Headwind 4% 3% (5)% 6% 1 - 3% 0 - 2% (4) - (6)% 1 - 3% Domestic Atlantic Pacific Latin 2015 2016E YOY Capacity Growth

Fuel Tailwind To Continue In 2016 Hedge book closed out, allowing for full downside participation in fuel market • Second year of lower market fuel prices contributing to more than $3 billion incremental fuel savings in 2016 at current levels • Delta effectively has no open hedge positions in 2016 – Hedge losses are locked - in at $100 - $200 million per quarter this year • The refinery provides Delta with a competitive advantage – Logistics expertise creates opportunities to drive efficiency and value through the fuel supply chain – Lower crack spreads are a net positive overall for Delta, but are pushing refinery toward breakeven results for 2016 8 YoY : (6%) ( 7%) ( 22%) ~(35%) $3.07 $2.87 $ 2.23 2013 2014 2015 2016E Delta Jet Fuel Prices ~$1.45 Fuel price includes taxes, settled hedges, refinery contribution and excludes MTM adjustments

Delta: Evolution Over The Past Decade Consolidation High Quality Product Sustainable Earnings & Cash Flow • Investments in network, products, and services in addition to highly motivated employees drive Delta’s industry leading operational reliability, customer satisfaction and 19% domestic unit revenue premium • Reallocating capacity and leveraging scale to produce better revenue efficiency • Revenues have increased ~20% on 20% fewer departures, 6% fewer seats, and 12% fewer aircraft since the merger • Managing to a 20%+ annual ROIC target as capacity growth is driven by seat - density and upgauging rather than incremental aircraft purchases • ROIC has improved ~27 points since merger Through consolidation, innovation, and capital discipline, Delta is uniquely positioned among high - performing S&P industrial companies Capital Efficiency • Top - line growth, non - fuel cost productivity, and lower interest expense producing margin and earnings expansion • $4 - 5B annual free cash flow has allowed Delta to de - risk the balance sheet and reach investment grade, while also increasing cash returns to shareholders Delta’s ROIC, Free Cash Flow, and EPS growth are in the top 10% of S&P Industrials 9
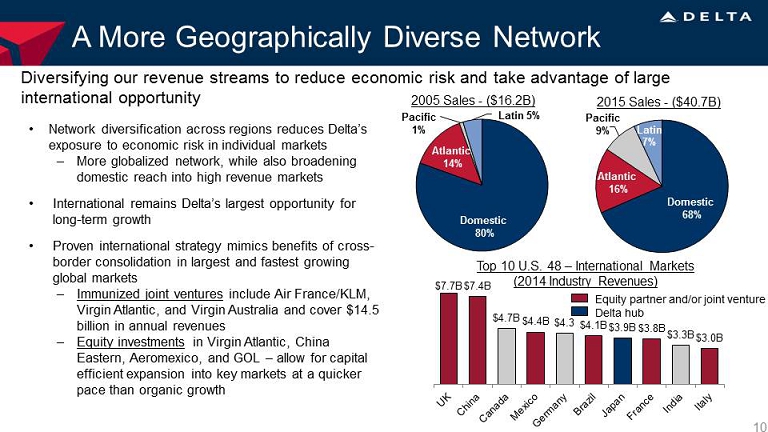
A More Geographically Diverse Network Diversifying our revenue streams to reduce economic risk and take advantage of large international opportunity • Network diversification across regions reduces Delta’s exposure to economic risk in individual markets – More globalized network, while also broadening domestic reach into high revenue markets • International remains Delta’s largest opportunity for long - term growth • Proven international strategy mimics benefits of cross - border consolidation in largest and fastest growing global markets – Immunized joint ventures include Air France/KLM, Virgin Atlantic, and Virgin Australia and cover $14.5 billion in annual revenues – Equity investments in Virgin Atlantic, China Eastern, Aeromexico , and GOL – allow for capital efficient expansion into key markets at a quicker pace than organic growth 10 Domestic 80% Atlantic 14% Pacific 1% Latin 5% 9% Latin 7 % Domestic 68% Pacific 9% Atlantic 16% 2005 Sales - ($16.2B) 2015 Sales - ($40.7B) $ 7.7B $ 7.4B $ 4.7B $ 4.4B $4.3 $ 4.1B $ 3.9B $ 3.8B $ 3.3B $ 3.0B Top 10 U.S. 48 – International Markets (2014 Industry Revenues) Equity partner and/or joint venture Delta hub

Top - Line Is More Than Ticket Revenues Investing in segmentation and other ancillary opportunities provides additional sources of revenue and allows Delta to capture a greater portion of the travel spend • Branded F ares is on track to drive $2.4 billion in revenue by 2018 vs. $1.2 billion in 2015 – Upgauging / larger aircraft allow for more product differentiation and unlock the value in Branded Fares – Future initiatives include increasing number of premium class seats, improving distribution effectiveness, and expanding Basic Economy across the system from 1,025 markets today • Realized $400 million in incremental revenue from American Express last year and expect total benefit to double between 2015 and 2020 • MRO business has grown by more than 25% since 2010 and will expand at a similar pace over the next five years 11 Merchandising Service Revenue per Passenger $6.35 $8.30 $15.00 2013 2015 2018 Goal 30% 80%

A Healthier Industry Focused On Shareholder Returns Mainline Aircraft Deliveries for Major U.S. Carriers 1,035 623 Deliveries 1999 - 2001 Scheduled Deliveries 2016 - 2018 $5.3 B $18.7 B 1999 2015 Airline Industry Net Income Airline Industry Free Cash Flow 12 Industry producing record earnings and cash flows… …With much different view on capacity and capital $10.7 B 1999 2015 $2.8 B $15.6 B 1999-2001 2013-2015 Airline Industry Capital Returns ($1.6B) • Capacity growth for the four largest carriers being funded by replacement aircraft and upgauging , not purchase of growth aircraft as it was in prior cycles • Industry is generating strong free cash flow and systematically returning it to owners $20B less capital

Opportunity Ahead For Investors Delta’s stock represents an opportunity for investors to purchase a high - quality industrial at an attractive valuation Consistently producing high - quality returns and cash flows … … While valuations remain at a discount High quality industrial transports are companies with similar index characteristics to Delta – part of S&P 500 and Dow Transportation Index (CHRW, CSX, EXPD, FDX, KSU, NSC, R, UNP, UPS); For both peer groups, ROIC and free cash flow are the 2013 - 15 average . Data source is FactSet ; Delta ROIC & P/E reflect benefit of NOLs; P/E & P/FCF are as of 2/29/16; Adjusted for Special Items 13 21.4% 22.3% 18.8% Delta High Quality Ind. Transports S&P Industrials ROIC - 3 Year Average $3.2B $1.1B $1.6B Delta High Quality Ind. Transports S&P Industrials Free Cash Flow - 3 Year Average 7.6x 14.6x 16.7x Delta High-Quality Ind. Transports S&P Industrials Forward Price to Earnings 7.3x 22.2x 18.2x Delta High-Quality Ind. Transports S&P Industrials Forward Price to Free Cash Flow

Non-GAAP Financial Measures
Delta sometimes uses information ("non-GAAP financial measures") that is derived from the Consolidated Financial Statements, but that is not presented in accordance with accounting principles generally accepted in the U.S. (“GAAP”). Under the U.S. Securities and Exchange Commission rules, non-GAAP financial measures may be considered in addition to results prepared in accordance with GAAP, but should not be considered a substitute for or superior to GAAP results. The tables below show reconciliations of non-GAAP financial measures used in this presentation to the most directly comparable GAAP financial measures.
Forward Looking Projections. Delta is unable to reconcile certain forward-looking projections to GAAP as the nature or amount of special items cannot be estimated at this time.
Return on Invested Capital
Delta presents return on invested capital as management believes this metric is helpful to investors in assessing the company’s ability to generate returns using its invested capital and as a measure against the industry. Return on invested capital is adjusted total operating income divided by average invested capital.
| Year Ended December 31, | ||||||||||||||||
| (in billions, except % of return) | 2015 | 2014 | 2013 | 2009 | ||||||||||||
| Adjusted book value of equity | $ | 17.6 | $ | 18.5 | $ | 15.4 | $ | 12.9 | ||||||||
| Average adjusted net debt | 6.9 | 8.2 | 10.5 | 16.8 | ||||||||||||
| Average invested capital | $ | 24.5 | $ | 26.7 | $ | 25.9 | $ | 29.7 | ||||||||
| Adjusted total operating income | $ | 6.9 | $ | 5.5 | $ | 3.9 | $ | 0.5 | ||||||||
| Return on invested capital | 28.3% | 20.7% | 15.1% | 1.5% | ||||||||||||
| Three year average | 21.4% | |||||||||||||||
| Change in ROIC since merger | ~27% | |||||||||||||||
Adjusted Net Debt
Delta uses adjusted total debt, including aircraft rent, in addition to long-term adjusted debt and capital leases, to present estimated financial obligations. Delta reduces adjusted debt by cash, cash equivalents and short-term investments and hedge margin receivable, resulting in adjusted net debt, to present the amount of assets needed to satisfy the debt. Management believes this metric is helpful to investors in assessing the company’s overall debt profile. Management has reduced adjusted debt by the amount of hedge margin receivable, which reflects cash posted to counterparties, as we believe this removes the impact of current market volatility on our unsettled hedges and is a better representation of the continued progress we have made on our debt initiatives.
| (in billions) | December 31, 2015 | December 31, 2014 | December 31, 2013 | |||||||||||||||||||||
| Debt and capital lease obligations | $ | 8.3 | $ | 9.7 | $ | 11.2 | ||||||||||||||||||
| Plus: unamortized discount, net and debt issuance costs | 0.1 | 0.2 | 0.5 | |||||||||||||||||||||
| Adjusted debt and capital lease obligations | $ | 8.4 | $ | 9.9 | $ | 11.7 | ||||||||||||||||||
| Plus: 7x last twelve months' aircraft rent | 1.8 | 1.6 | 1.5 | |||||||||||||||||||||
| Adjusted total debt | 10.2 | 11.5 | 13.2 | |||||||||||||||||||||
| Less: cash, cash equivalents and short-term investments | (3.4 | ) | (3.3 | ) | (3.8 | ) | ||||||||||||||||||
| Less: hedge margin receivable | (0.1 | ) | (0.9 | ) | – | |||||||||||||||||||
| Adjusted net debt | $ | 6.7 | $ | 7.3 | $ | 9.4 | ||||||||||||||||||
| 14 |
Average fuel price per gallon, adjusted
The table below shows the average fuel price per gallon. Management then adjusts for MTM adjustments and settlements for the reason described below:
MTM adjustments and settlements. MTM adjustments are defined as fair value changes recorded in periods other than the settlement period. Such fair value changes are not necessarily indicative of the actual settlement value of the underlying hedge in the contract settlement period. Settlements represent cash received or paid on hedge contracts settled during the period. These items adjust fuel expense to show the economic impact of hedging, including cash received or paid on hedge contracts during the period. Adjusting for these items allows investors to better understand and analyze our core operational performance in the periods shown.
| Year Ended December 31, | ||||||||||||||||
| (per gallon) | 2015 | 2014 | 2013 | 2012 | ||||||||||||
| Fuel purchase cost | $ | 1.74 | $ | 2.91 | $ | 3.09 | $ | 3.23 | ||||||||
| Airline segment fuel hedge losses (gains) | 0.23 | 0.58 | (0.12 | ) | 0.01 | |||||||||||
| Refinery segment impact | (0.07 | ) | (0.02 | ) | 0.03 | 0.01 | ||||||||||
| Average fuel price | $ | 1.90 | $ | 3.47 | $ | 3.00 | $ | 3.25 | ||||||||
| MTM adjustments and settlements | 0.33 | (0.60 | ) | 0.07 | 0.01 | |||||||||||
| Average fuel price, adjusted | $ | 2.23 | $ | 2.87 | $ | 3.07 | $ | 3.26 | ||||||||
| Change year-over-year | (22% | ) | (7% | ) | (6% | ) | ||||||||||
Free Cash Flow, Three Year Average
Delta presents free cash flow because management believes this metric is helpful to investors to evaluate the company's ability to generate cash that is available for use for debt service or general corporate initiatives. Adjustments include:
Hedge deferrals. During the March 2015 quarter, we effectively deferred settlement of a portion of our hedge portfolio until 2016 by entering into fuel derivative transactions that, excluding market movements from the date of the transactions, would provide approximately $150 million in cash receipts during the September 2015 quarter and $150 million in cash receipts for the December 2015 quarter. Additionally, these transactions will require approximately $300 million in cash payments in 2016 (excluding market movements from the date of the transactions). By effectively deferring settlement of a portion of the original derivative transactions, the restructured hedge portfolio provides additional time for the fuel market to stabilize while adding some hedge protection in 2016. Free cash flow is adjusted to include these deferral transactions in order to allow investors to better understand the net impact of hedging activities in the period shown.
Hedge margin. Free cash flow is adjusted for hedge margin as we believe this adjustment removes the impact of current market volatility on our unsettled hedges and allows investors to better understand and analyze the company’s core operational performance in the period shown.
| 15 |
Free Cash Flow, Three Year Average (cont.)
| Year Ended December 31, | ||||||||||||
| (in billions) | 2015 | 2014 | 2013 | |||||||||
| Net cash provided by operating activities | $ | 7.9 | $ | 4.9 | $ | 4.5 | ||||||
| Net cash used in investing activities | (4.0 | ) | (2.5 | ) | (2.7 | ) | ||||||
| Adjustments: | ||||||||||||
| Hedge deferral | 0.4 | – | – | |||||||||
| Hedge margin | (0.8 | ) | 0.9 | – | ||||||||
| Net purchases of short-term investments and other | 0.3 | 0.4 | 0.3 | |||||||||
| Total free cash flow | $ | 3.8 | $ | 3.7 | $ | 2.1 | ||||||
| Three year average | $ | 3.2 | ||||||||||
| 16 |