Attached files
| file | filename |
|---|---|
| EX-31.2 - EX-31.2 - Black Stone Minerals, L.P. | bsm-ex312_304.htm |
| EX-31.1 - EX-31.1 - Black Stone Minerals, L.P. | bsm-ex311_303.htm |
| EX-23.3 - EX-23.3 - Black Stone Minerals, L.P. | bsm-ex233_307.htm |
| EX-99.1 - EX-99.1 - Black Stone Minerals, L.P. | bsm-ex991_306.htm |
| EX-23.2 - EX-23.2 - Black Stone Minerals, L.P. | bsm-ex232_302.htm |
| EX-32.1 - EX-32.1 - Black Stone Minerals, L.P. | bsm-ex321_305.htm |
| EX-23.1 - EX-23.1 - Black Stone Minerals, L.P. | bsm-ex231_301.htm |
| EX-21.1 - EX-21.1 - Black Stone Minerals, L.P. | bsm-ex211_300.htm |
UNITED STATES
SECURITIES AND EXCHANGE COMMISSION
Washington, D.C. 20549
FORM 10-K
(Mark One)
|
x |
ANNUAL REPORT PURSUANT TO SECTION 13 OR 15(d) OF THE SECURITIES EXCHANGE ACT OF 1934 |
For the fiscal year ended December 31, 2015
OR
|
o |
TRANSITION REPORT PURSUANT TO SECTION 13 OR 15(d) OF SECURITIES EXCHANGE ACT OF 1934 |
For the transition period _______________ to _______________
Commission file number 001-37362
Black Stone Minerals, L.P.
(Exact Name of Registrant As Specified in Its Charter)
|
Delaware |
|
47-1846692 |
|
(State or Other Jurisdiction of Incorporation or Organization) |
|
(I.R.S. Employer Identification No.) |
|
|
|
|
|
1001 Fannin Street, Suite 2020 Houston, Texas |
|
77002 |
|
(Address of Principal Executive Offices) |
|
(Zip Code) |
Registrant’s telephone number, including area code: (713) 445-3200
Securities registered pursuant to Section 12(b) of the Act:
|
Title of each class |
|
Name of each exchange on which registered |
|
Common Units Representing Limited Partner Interests |
|
New York Stock Exchange |
Securities registered pursuant to Section 12(g) of the Act: None
Indicate by check mark if the registrant is a well-known seasoned issuer, as defined in Rule 405 of the Securities Act. Yes o No x
Indicate by check mark if the registrant is not required to file reports pursuant to Section 13 or Section 15(d) of the Act. Yes o No x
Indicate by check mark whether the registrant (1) has filed all reports required to be filed by Section 13 or 15(d) of the Securities Exchange Act of 1934 during the preceding 12 months (or for such shorter period that the registrant was required to file such reports), and (2) has been subject to such filing requirements for the past 90 days. Yes x No o
Indicate by check mark whether the registrant has submitted electronically and posted on its corporate Web site, if any, every Interactive Data File required to be submitted and posted pursuant to Rule 405 of Regulation S-T (§ 232.405 of this chapter) during the preceding 12 months (or for such shorter period that the registrant was required to submit and post such files). Yes x No o
Indicate by check mark if disclosure of delinquent filers pursuant to Item 405 of Regulation S-K (§ 229.405 of this chapter) is not contained herein, and will not be contained, to the best of registrant’s knowledge, in definitive proxy or information statements incorporated by reference in Part III of this Form 10-K or any amendment to this Form 10-K. o
Indicate by check mark whether the registrant is a large accelerated filer, an accelerated filer, a non-accelerated filer, or a smaller reporting company. See the definitions of “large accelerated filer,” “accelerated filer” and “smaller reporting company” in Rule 12b-2 of the Exchange Act. (Check One):
|
Large Accelerated Filer |
|
¨ |
|
Accelerated Filer |
|
¨ |
|
|
|
|
|
|
|
|
|
|
|
Non-Accelerated Filer |
|
x |
(Do not check if a smaller reporting company) |
|
Smaller Reporting Company |
|
¨ |
Indicate by check mark whether the registrant is a shell company (as defined in Rule 12b-2 of the Exchange Act). Yes o No x
The aggregate market value of the common units held by non-affiliates was $1,240,495,410 on June 30, 2015, the last business day of the registrant’s most recently completed second fiscal quarter, based on a closing price of $17.22 per unit as reported by the New York Stock Exchange on such date. As of March 4, 2016, 96,965,879 common units, 95,002,347 subordinated units, and 77,216 preferred units of the registrant were outstanding.
Documents Incorporated by Reference: Certain information called for in Items 10, 11, 12, 13, and 14 of Part III are incorporated by reference from the registrant’s definitive proxy statement for the annual meeting of unitholders to be held on May 26, 2016.
TABLE OF CONTENTS
|
|
|
|
PAGE |
|
ITEMS 1 AND 2. |
|
2 |
|
|
ITEM 1A. |
|
26 |
|
|
ITEM 1B. |
|
44 |
|
|
ITEM 3. |
|
44 |
|
|
ITEM 4. |
|
44 |
|
|
ITEM 5. |
|
45 |
|
|
ITEM 6. |
|
50 |
|
|
ITEM 7. |
MANAGEMENT’S DISCUSSION AND ANALYSIS OF FINANCIAL CONDITION AND RESULTS OF OPERATIONS |
|
51 |
|
ITEM 7A. |
|
64 |
|
|
ITEM 8. |
|
65 |
|
|
ITEM 9. |
CHANGES IN AND DISAGREEMENTS WITH ACCOUNTANTS ON ACCOUNTING AND FINANCIAL DISCLOSURE |
|
65 |
|
ITEM 9A. |
|
65 |
|
|
ITEM 9B. |
|
66 |
|
|
ITEM 10. |
|
67 |
|
|
ITEM 11. |
|
67 |
|
|
ITEM 12. |
SECURITY OWNERSHIP OF CERTAIN BENEFICIAL OWNERS AND MANAGEMENT AND RELATED UNITHOLDER MATTERS |
|
67 |
|
ITEM 13. |
CERTAIN RELATIONSHIPS AND RELATED TRANSACTIONS, AND DIRECTOR INDEPENDENCE |
|
67 |
|
ITEM 14. |
|
67 |
|
|
ITEM 15. |
|
68 |
|
ii
The following list includes a description of the meanings of some of the oil and gas industry terms used in this Annual Report on Form 10-K (“Annual Report”).
Basin. A large depression on the earth’s surface in which sediments accumulate.
Bbl. One stock tank barrel, or 42 U.S. gallons liquid volume.
Bbl/d. Bbl per day.
Bcf. One billion cubic feet of natural gas.
Boe. Barrels of oil equivalent, with six thousand cubic feet of natural gas being equivalent to one barrel of oil. This “Btu-equivalent” conversion metric is based on an approximate energy equivalency and does not reflect the price or value relationship between oil and natural gas.
Boe/d. Boe per day.
British Thermal Unit (Btu). The quantity of heat required to raise the temperature of one pound of water by one degree Fahrenheit.
Completion. The process of treating a drilling well followed by the installation of permanent equipment for the production of natural gas or oil, or in the case of a dry hole, the reporting of abandonment to the appropriate agency.
Condensate. A mixture of hydrocarbons that exists in the gaseous phase at original reservoir temperature and pressure, but that, when produced, is in the liquid phase at surface pressure and temperature.
Crude oil. Liquid hydrocarbons retrieved from geological structures underground to be refined into fuel sources.
Delaware Act. Delaware Revised Uniform Limited Partnership Act.
Delay rental. Payment made to the lessor under a non-producing oil and natural gas lease at the end of each year to defer a drilling obligation and continue the lease for another year during its primary term.
Deterministic method. The method of estimating reserves or resources under which a single value for each parameter (from the geoscience, engineering, or economic data) in the reserves calculation is used in the reserves estimation procedure.
Developed acreage. The number of acres that are allocated or assignable to productive wells or wells capable of production.
Development costs. Capital costs incurred in the acquisition, exploitation, and exploration of proved oil and natural gas reserves.
Development well. A well drilled within the proved area of an oil and natural gas reservoir to the depth of a stratigraphic horizon known to be productive.
Differential. An adjustment to the price of oil or natural gas from an established spot market price to reflect differences in the quality and/or location of oil or natural gas.
Dry hole or dry well. A well found to be incapable of producing hydrocarbons in sufficient quantities such that proceeds from the sale of such production exceed production expenses and taxes.
Economically producible. A resource that generates revenue that exceeds, or is reasonably expected to exceed, the costs of the operation.
Electrical log. An analysis that provides information on porosity, hydraulic conductivity, and fluid content of formations drilled in fluid-filled boreholes.
iii
Exploitation. A drilling or other project which may target proven or unproven reserves (such as probable or possible reserves), but which generally has a lower risk than that associated with exploration projects.
Exploratory well. A well drilled to find and produce natural gas or oil reserves not classified as proved to find a new reservoir in a field previously found to be productive of natural gas or oil in another reservoir or to extend a known reservoir.
Extension well. A well drilled to extend the limits of a known reservoir.
Field. An area consisting of either a single reservoir or multiple reservoirs, all grouped on or related to the same individual geological structural feature and/or stratigraphic condition.
Formation. A layer of rock which has distinct characteristics that differs from nearby rock.
Gross acres or gross wells. The total acres or wells, as the case may be, in which a working interest is owned.
Horizontal drilling. A drilling technique used in certain formations where a well is drilled vertically to a certain depth and then drilled at a right angle within a specified interval.
Hydraulic fracturing. A process used to stimulate production of hydrocarbons. The process involves the injection of water, sand, and chemicals under pressure into the formation to fracture the surrounding rock and stimulate production.
Lease bonus. Usually a one-time payment made to a mineral owner as consideration for the execution of an oil and natural gas lease.
Lease operating expense. All direct and allocated indirect costs of lifting hydrocarbons from a producing formation to the surface constituting part of the current operating expenses of a working interest. Such costs include labor, supplies, repairs, maintenance, allocated overhead charges, workover costs, insurance, and other expenses incidental to production, but exclude lease acquisition or drilling or completion costs.
MBbls. One thousand barrels of oil or other liquid hydrocarbons.
MBoe. One thousand barrels of oil equivalent, determined using a ratio of six Mcf of natural gas to one Bbl of oil.
MBoe/d. MBoe per day.
Mcf. Thousand cubic feet of natural gas.
Mineral interests. Real-property interests that grant ownership of the oil and natural gas under a tract of land and the rights to explore for, drill for, and produce oil and natural gas on that land or to lease those exploration and development rights to a third party.
MMBtu. Million British Thermal Units.
MMcf. Million cubic feet of natural gas.
Net acres or net wells. The sum of the fractional working interest owned in gross acres or gross wells, respectively.
Net revenue interest. An owner’s interest in the revenues of a well after deducting proceeds allocated to royalty, overriding royalty, and other non-cost-bearing interests.
Natural gas. A combination of light hydrocarbons that, in average pressure and temperature conditions, is found in a gaseous state. In nature, it is found in underground accumulations, and may potentially be dissolved in oil or may also be found in its gaseous state.
NGLs. Natural gas liquids.
Nonparticipating royalty interest (NPRI). A type of non-cost-bearing royalty interest, which is carved out of the mineral interest and represents the right, which is typically perpetual, to receive a fixed cost-free percentage of production or revenue from production, without an associated right to lease.
iv
NYMEX. New York Mercantile Exchange.
Oil. Crude oil and condensate.
Oil and natural gas properties. Tracts of land consisting of properties to be developed for oil and natural gas resource extraction.
Operator. The individual or company responsible for the exploration and/or production of an oil or natural gas well or lease.
Overriding royalty interest (ORRI). A fractional, undivided interest or right of participation in the oil or natural gas, or in the proceeds from the sale of the oil or gas, produced from a specified tract or tracts, which are limited in duration to the terms of an existing lease and which are not subject to any portion of the expense of development, operation, or maintenance.
PDP. Proved developed producing, used to characterize reserves.
Play. A set of discovered or prospective oil and/or natural gas accumulations sharing similar geologic, geographic and temporal properties, such as source rock, reservoir structure, timing, trapping mechanism, and hydrocarbon type.
Plugging and abandonment. Refers to the sealing off of fluids in the strata penetrated by a well so that the fluids from one stratum will not escape into another or to the surface. Regulations of all states require plugging of abandoned wells.
Pooling. The majority of our producing acreage is pooled with third-party acreage. Pooling refers to an operator’s consolidation of multiple adjacent leased tracts, which may be covered by multiple leases with multiple lessors, in order to maximize drilling efficiency or to comply with state mandated well spacing requirements. Pooling dilutes our royalty in a given well or unit, but it also increases both the acreage footprint and the number of wells in which we have an economic interest. To estimate our total potential drilling locations in a given play, we include third-party acreage that is pooled with our acreage.
Production Costs. The production or operational costs incurred while extracting and producing, storing, and transporting oil and/or natural gas. Typical of these costs are wages for workers, facilities lease costs, equipment maintenance, logistical support, applicable taxes, and insurance.
PUD. Proved undeveloped, used to characterize reserves.
Productive well. A well that is found to be capable of producing hydrocarbons in sufficient quantities such that proceeds from the sale of the production exceed production expenses and taxes.
Proved developed reserves. Reserves that can be expected to be recovered through existing wells with existing equipment and operating methods.
Proved developed producing reserves. Reserves expected to be recovered from existing completion intervals in existing wells.
Proved reserves. The estimated quantities of oil and natural gas which geological and engineering data demonstrate with reasonable certainty to be commercially recoverable in future years from known reservoirs under existing economic and operating conditions.
Proved undeveloped reserves. Proved reserves that are expected to be recovered from new wells on undrilled acreage or from existing wells where a relatively major expenditure is required for recompletion.
Reliable technology. A grouping of one or more technologies (including computation methods) that have been field tested and have been demonstrated to provide reasonably certain results with consistency and repeatability in the formation being evaluated or in an analogous formation.
Reserves. Reserves are estimated remaining quantities of oil and natural gas and related substances anticipated to be economically producible, as of a given date, by application of development projects to known accumulations. In addition, there must exist, or there must be a reasonable expectation that there will exist, the legal right to produce or a revenue interest in the production, installed means of delivering oil and natural gas or related substances to the market, and all permits and financing required to implement the project. Reserves should not be assigned to adjacent reservoirs isolated by major, potentially sealing, faults until those reservoirs are penetrated and evaluated as economically producible. Reserves should not be assigned to areas that are clearly separated
v
from a known accumulation by a non-productive reservoir (i.e., absence of reservoir, structurally low reservoir, or negative test results). Such areas may contain prospective resources (i.e., potentially recoverable resources from undiscovered accumulations).
Reservoir. A porous and permeable underground formation containing a natural accumulation of producible natural gas and/or oil that is confined by impermeable rock or water barriers and is separate from other reservoirs.
Resource play. A set of discovered or prospective oil and/or natural gas accumulations sharing similar geologic, geographic, and temporal properties, such as source rock, reservoir structure, timing, trapping mechanism, and hydrocarbon type.
Royalty interest. An interest that gives an owner the right to receive a portion of the resources or revenues without having to carry any costs of development.
Seismic data. Seismic data is used by scientists to interpret the composition, fluid content, extent, and geometry of rocks in the subsurface. Seismic data is acquired by transmitting a signal from an energy source, such as dynamite or water, into the earth. The energy so transmitted is subsequently reflected beneath the earth’s surface and a receiver is used to collect and record these reflections.
Shale. A fine grained sedimentary rock formed by consolidation of clay- and silt-sized particles into thin, relatively impermeable layers. Shale can include relatively large amounts of organic material compared with other rock types and thus has the potential to become rich hydrocarbon source rock. Its fine grain size and lack of permeability can allow shale to form a good cap rock for hydrocarbon traps.
Spacing. The distance between wells producing from the same reservoir and is often established by regulatory agencies.
Standardized measure. The present value of estimated future net revenue to be generated from the production of proved reserves, determined in accordance with the rules and regulations of the SEC (using prices and costs in effect as of the date of estimation), less future development, production and income tax expenses, and discounted at 10% per annum to reflect the timing of future net revenue. Because we are a limited partnership, we are generally not subject to federal or state income taxes and thus make no provision for federal or state income taxes in the calculation of our standardized measure. Standardized measure does not give effect to derivative transactions.
Tight formation. A formation with low permeability that produces natural gas with low flow rates for long periods of time.
Trend. A region of oil and/or natural gas production, the geographic limits of which have not been fully defined, having geological characteristics that have been ascertained through supporting geological, geophysical, or other data to contain the potential for oil and/or natural gas reserves in a particular formation or series of formations.
Undeveloped acreage. Lease acreage on which wells have not been drilled or completed to a point that would permit the production of commercial quantities of oil and natural gas regardless of whether such acreage contains proved reserves.
Working interest. An operating interest that gives the owner the right to drill, produce, and conduct operating activities on the property, and receive a share of production and requires the owner to pay a share of the costs of drilling and production operations.
Workover. Operations on a producing well to restore or increase production.
WTI. West Texas Intermediate oil, which is a light, sweet crude oil, characterized by an American Petroleum Institute (“API”) gravity between 39 and 41 and a sulfur content of approximately 0.4 weight percent that is used as a benchmark for the other crude oils.
vi
CAUTIONARY NOTE REGARDING FORWARD-LOOKING STATEMENTS
Certain statements and information in this Annual Report may constitute “forward-looking statements.” The words “believe,” “expect,” “anticipate,” “plan,” “intend,” “foresee,” “should,” “would,” “could,” or other similar expressions are intended to identify forward-looking statements, which are generally not historical in nature. These forward-looking statements are based on our current expectations and beliefs concerning future developments and their potential effect on us. While management believes that these forward-looking statements are reasonable as and when made, there can be no assurance that future developments affecting us will be those that we anticipate. All comments concerning our expectations for future revenues and operating results are based on our forecasts for our existing operations and do not include the potential impact of any future acquisitions. Our forward-looking statements involve significant risks and uncertainties (some of which are beyond our control) and assumptions that could cause actual results to differ materially from our historical experience and our present expectations or projections. Important factors that could cause actual results to differ materially from those in the forward-looking statements include, but are not limited to, those summarized below:
|
|
· |
our ability to execute our business strategies; |
|
|
· |
the volatility of realized oil and natural gas prices; |
|
|
· |
the level of production on our properties; |
|
|
· |
regional supply and demand factors, delays, or interruptions of production; |
|
|
· |
our ability to replace our oil and natural gas reserves; |
|
|
· |
our ability to identify, complete, and integrate acquisitions; |
|
|
· |
general economic, business, or industry conditions; |
|
|
· |
competition in the oil and natural gas industry; |
|
|
· |
the ability of our operators to obtain capital or financing needed for development and exploration operations; |
|
|
· |
title defects in the properties in which we invest; |
|
|
· |
the availability or cost of rigs, equipment, raw materials, supplies, oilfield services, or personnel; |
|
|
· |
restrictions on the use of water; |
|
|
· |
the availability of transportation facilities; |
|
|
· |
the ability of our operators to comply with applicable governmental laws and regulations and to obtain permits and governmental approvals; |
|
|
· |
federal and state legislative and regulatory initiatives relating to hydraulic fracturing; |
|
|
· |
future operating results; |
|
|
· |
future cash flows and liquidity, including our ability to generate sufficient cash to pay quarterly distributions; |
|
|
· |
exploration and development drilling prospects, inventories, projects, and programs; |
|
|
· |
operating hazards faced by our operators; |
|
|
· |
the ability of our operators to keep pace with technological advancements; and |
|
|
· |
certain factors discussed elsewhere in this Annual Report. |
For additional information regarding known material factors that could cause our actual results to differ from our projected results, please read Part I, Item 1A. “Risk Factors.”
Readers are cautioned not to place undue reliance on forward-looking statements, which speak only as of the date hereof. We undertake no obligation to publicly update or revise any forward-looking statements after the date they are made, whether as a result of new information, future events, or otherwise.
1
Unless the context clearly indicates otherwise, references in this Annual Report on Form 10-K to “BSMC,” “Black Stone Minerals, L.P. Predecessor,” or “our predecessor,” refer to Black Stone Minerals Company, L.P. and its subsidiaries for time periods prior to the initial public offering of Black Stone Minerals, L.P. on May 6, 2015 (the “IPO”), and references to “BSM,” “Black Stone,” “we,” “our,” “us,” “the Partnership,” or like terms refer to Black Stone Minerals, L.P. and its subsidiaries for time periods subsequent to the IPO.
ITEMS 1 AND 2. BUSINESS AND PROPERTIES
General
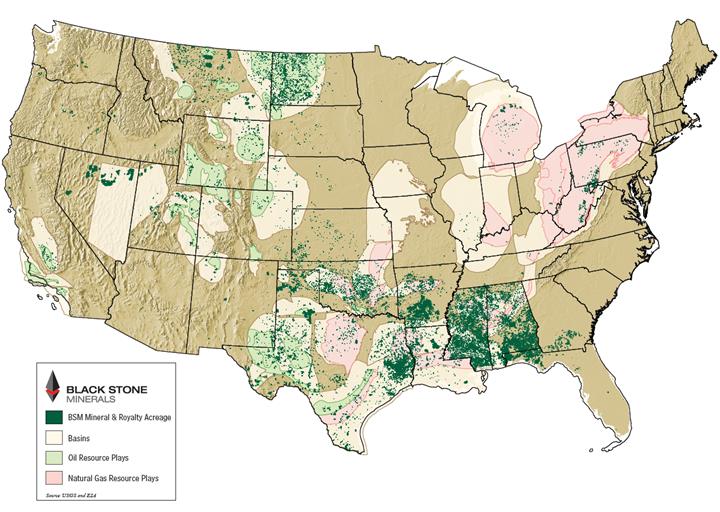
We are one of the largest owners of oil and natural gas mineral interests in the United States. Our principal business is actively managing our existing portfolio of mineral and royalty assets to maximize its value and expanding our asset base through acquisitions of additional mineral and royalty interests. We maximize value through marketing our mineral assets for lease, creatively structuring terms on those leases to encourage and accelerate drilling activity, and selectively participating alongside our lessees on a working-interest basis in low-risk development-drilling opportunities on our mineral acreage. Our primary business objective is to grow our reserves, production, and cash generated from operations over the long term, while increasing, to the extent practicable, the distribution to our unitholders over time.
We own mineral interests in approximately 14.6 million acres, with an average 47.8% ownership interest in that acreage. We also own nonparticipating royalty interests in 1.3 million acres and overriding royalty interests in 1.4 million acres. These non-cost-bearing interests, which we refer to collectively as our “mineral and royalty interests,” include ownership in over 45,000 producing wells. Our mineral and royalty interests are located in 41 states and in 61 onshore basins in the continental United States. Many of these interests are in active resource plays, including the Bakken/Three Forks, Eagle Ford Shale, Wolfcamp, Haynesville/Bossier, and Fayetteville Shale plays, as well as emerging plays such as the Lower Wilcox and Canyon Lime plays. The combination of the breadth of our asset base and the long-lived, non-cost-bearing nature of our mineral and royalty interests exposes us to potential additional production and reserves from new and existing plays without investing additional capital.
We are a publicly traded Delaware limited partnership formed on September 16, 2014. On May 1, 2015, our common units began trading on the New York Stock Exchange under the symbol “BSM.” On May 6, 2015, we completed our initial public offering of 22,500,000 common units representing limited partner interests at a price to the public of $19.00 per common unit.
BSM files or furnishes annual reports on Form 10-K, quarterly reports on Form 10-Q, and current reports on Form 8-K, as well as any amendments to these reports with the U.S. Securities and Exchange Commission (“SEC”). Through our website, http://www.blackstoneminerals.com, we make available electronic copies of the documents we file or furnish to the SEC. Access to these electronic filings is available free of charge as soon as reasonably practicable after filing or furnishing them to the SEC.
Recent Developments
Common Unit Repurchase Program
On March 4, 2016, the board of directors of our general partner authorized the repurchase of up to $50.0 million in common units over the next six months. The repurchase program authorizes us to make repurchases on a discretionary basis as determined by management, subject to market conditions, applicable legal requirements, available liquidity, and other appropriate factors. All or a portion of any repurchases may be made under a Rule 10b5-1 plan, which would permit common units to be repurchased when we might otherwise be precluded from doing so under insider trading laws. The repurchase program does not obligate us to acquire any particular amount of common units and may be modified or suspended at any time and could be terminated prior to completion. We will periodically report the number of common units repurchased. The repurchase program will be funded from our cash on hand or available revolving credit facility. Any repurchased common units will be cancelled.
Cash Tender Offer
On November 6, 2015, we commenced a tender offer to purchase up to 100% of the 117,963 then outstanding preferred units from our preferred unitholders at the units’ par value of $1,000.00 per preferred unit, plus unpaid accrued yield. The tender offer expired on December 10, 2015. We purchased and cancelled 40,747 preferred units, representing 34.5% of our then outstanding preferred units. The tendered units were purchased for $1,019.45 per preferred unit for a total cost of approximately $41.5 million, excluding fees and expenses relating to the tender offer.
2
We closed five separate transactions to acquire unproved oil and natural gas properties in the Permian Basin during 2015 for a total of $51.7 million. We acquired acreage in the Eagle Ford Shale play through two transactions totaling $9.7 million during 2015, and we also acquired an overriding royalty interest in the Utica Shale and Marcellus plays for $1.8 million.
Our Assets
As of December 31, 2015, our total estimated proved oil and natural gas reserves were 49,788 MBoe based on a reserve report prepared by Netherland Sewell and Associates (“NSAI”), an independent third-party petroleum engineering firm. Of the reserves as of December 31, 2015, approximately 89.6% were proved developed reserves (approximately 88.1% proved developed producing and 1.5% proved developed non-producing) and approximately 10.4% were proved undeveloped reserves. At December 31, 2015, our estimated proved reserves were 31.8% oil and 68.2% natural gas.
The locations of our oil and natural gas properties are presented on the following map. Additional information related to these properties follows this map.
Mineral and Royalty Interests
Mineral interests are real-property interests that are typically perpetual and grant ownership of the oil and natural gas under a tract of land and the rights to explore for, drill for, and produce oil and natural gas on that land or to lease those exploration and development rights to a third party. When those rights are leased, usually for a three-year term, we typically receive an upfront cash payment, known as lease bonus, and we retain a mineral royalty, which entitles us to a cost-free percentage (usually ranging from 20% to 25%) of production or revenue from production. A lessee can extend the lease beyond the initial lease term with continuous drilling, production, or other operating activities. When production or drilling ceases, the lease terminates, allowing us to lease the exploration
3
and development rights to another party. Mineral interests generate the substantial majority of our revenue and are also the assets that we have the most influence over.
In addition to mineral interests, we also own other types of non-cost-bearing royalty interests, which include:
|
|
· |
nonparticipating royalty interests (“NPRIs”), which are royalty interests that are carved out of the mineral estate and represent the right, which is typically perpetual, to receive a fixed, cost-free percentage of production or revenue from production, without an associated right to lease or receive lease bonus; and |
|
|
· |
overriding royalty interests (“ORRIs”), which are royalty interests that burden working interests and represent the right to receive a fixed, cost-free percentage of production or revenue from production from a lease. ORRIs remain in effect until the associated leases expire. |
Working-Interest Participation Program
We own working interests related to our mineral interests in various plays across our asset base. Many of these working interests were acquired through working-interest participation rights, which we often include in the terms of our leases. This participation right complements our core mineral-and-royalty-interest business because it allows us to realize additional value from our minerals. Under the terms of the relevant leases, we are typically granted a unit-by-unit or a well-by-well option to participate on a non-operated, working-interest basis in drilling opportunities on our mineral acreage. This right to participate in a unit or well is exercisable at our sole discretion. We generally only exercise this option when the results from prior drilling and production activities have substantially reduced the economic risk associated with development drilling and where we believe the probability of achieving attractive economic returns is high. A small portion of our working interests, unrelated to our mineral and royalty assets, were acquired because of the attractive working-interest investment opportunities on those properties. The majority of these assets are focused in the Anadarko Basin, and to a lesser extent, in the Permian and Powder River Basins.
We collectively refer to these working interests as our “working-interest participation program.” When we participate in non-operated working-interest opportunities, we are required to pay our portion of the costs associated with drilling and operating these wells. Our 2016 drilling capital expenditure budget associated with our working-interest participation program is approximately $60.0 million. Approximately 95% of our 2016 drilling capital budget will be spent in the Haynesville/Bossier and the Bakken/Three Forks plays, with the remainder spent in various plays including the Wolfcamp and Wilcox plays. As of December 31, 2015, we owned non-operated working interests in over 10,000 gross (269 net) wells.
Working interest production represented 29.5% of our total production volumes during the year ended December 31, 2015.
Our Properties
Material Basins and Producing Regions
The following table summarizes our exposure to the U.S. basins and regions we consider most material to our current and future business.
|
|
|
Acreage as of December 31, 20151 |
|
|
Average Daily |
|
||||||||||||||||||
|
|
|
Mineral and Royalty Interests |
|
|
Working Interests |
|
|
Production (Boe/d) |
|
|||||||||||||||
|
USGS Petroleum Province2 |
|
Mineral Interests |
|
|
NPRIs |
|
|
ORRIs |
|
|
Gross |
|
|
Net |
|
|
For the Year Ended December 31, 2015 |
|
||||||
|
Louisiana-Mississippi Salt Basins |
|
|
5,274,784 |
|
|
|
111,707 |
|
|
|
17,660 |
|
|
|
54,346 |
|
|
|
6,917 |
|
|
|
5,576 |
|
|
Western Gulf (onshore) |
|
|
1,553,239 |
|
|
|
180,185 |
|
|
|
79,895 |
|
|
|
124,656 |
|
|
|
18,112 |
|
|
|
6,527 |
|
|
Williston Basin |
|
|
1,112,646 |
|
|
|
62,133 |
|
|
|
30,765 |
|
|
|
54,666 |
|
|
|
7,740 |
|
|
|
4,037 |
|
|
Palo Duro Basin |
|
|
1,010,414 |
|
|
|
22,791 |
|
|
|
1,120 |
|
|
|
— |
|
|
|
— |
|
|
|
23 |
|
|
Permian Basin |
|
|
780,361 |
|
|
|
577,172 |
|
|
|
102,967 |
|
|
|
8,113 |
|
|
|
4,734 |
|
|
|
903 |
|
|
Anadarko Basin |
|
|
534,332 |
|
|
|
10,616 |
|
|
|
178,394 |
|
|
|
31,313 |
|
|
|
21,294 |
|
|
|
2,404 |
|
|
Appalachian Basin |
|
|
486,964 |
|
|
|
416 |
|
|
|
12,492 |
|
|
|
— |
|
|
|
— |
|
|
|
920 |
|
|
East Texas Basin |
|
|
406,111 |
|
|
|
41,975 |
|
|
|
30,294 |
|
|
|
110,507 |
|
|
|
30,504 |
|
|
|
3,687 |
|
|
Arkoma Basin |
|
|
331,777 |
|
|
|
5,170 |
|
|
|
35,949 |
|
|
|
8,950 |
|
|
|
2,409 |
|
|
|
1,849 |
|
|
Bend Arch-Fort Worth Basin |
|
|
138,933 |
|
|
|
52,368 |
|
|
|
40,663 |
|
|
|
53,606 |
|
|
|
11,022 |
|
|
|
660 |
|
|
Southwestern Wyoming |
|
|
25,450 |
|
|
|
560 |
|
|
|
70,607 |
|
|
|
15,336 |
|
|
|
2,477 |
|
|
|
530 |
|
|
Other |
|
|
2,935,091 |
|
|
|
188,446 |
|
|
|
789,502 |
|
|
|
39,262 |
|
|
|
9,300 |
|
|
|
1,551 |
|
|
Total |
|
|
14,590,102 |
|
|
|
1,253,539 |
|
|
|
1,390,308 |
|
|
|
500,755 |
|
|
|
114,509 |
|
|
|
28,667 |
|
4
|
2 |
The basins and regions shown in the table are consistent with U.S. Geological Survey (“USGS”) delineations of petroleum provinces of onshore and state offshore areas in the continental United States. We refer to these petroleum provinces as “basins” or “regions.” |
The following is an overview of the U.S. basins and regions we consider most material to our current and future business.
|
|
· |
Louisiana-Mississippi Salt Basins. The Louisiana-Mississippi Salt Basins region ranges from northern Louisiana and southern Arkansas through south central and southern Mississippi, southern Alabama, and the Florida Panhandle. The Haynesville/Bossier plays, which have been extensively delineated through drilling, are the most prospective unconventional plays for natural gas production and reserves within this region. Approximately half of the Haynesville/Bossier plays’ prospective acreage is within the Louisiana-Mississippi Salt Basins region, where we own significant mineral and royalty interests and working interests. There are a number of additional active conventional and unconventional plays in the basins in which we hold considerable mineral and royalty interests, including the Brown Dense, Cotton Valley, Hosston, Norphlet, Smackover, Tuscaloosa Marine Shale, and Wilcox plays. |
|
|
· |
Western Gulf (onshore). The Western Gulf region, which ranges from South Texas through southeastern Louisiana, includes a variety of both conventional and unconventional plays. We have extensive exposure to the Eagle Ford Shale in South Texas, where we are experiencing a significant level of development drilling on our mineral interests within the oil and rich-gas and condensate areas of the play. In addition to the Eagle Ford Shale play, there are a number of other active conventional and unconventional plays to which we have exposure to in the region, including the Austin Chalk, Buda, Eaglebine (or Maness) Shale, Frio, Glenrose, Olmos, Woodbine, Vicksburg, Wilcox, and Yegua plays. |
|
|
· |
Williston Basin. The Williston Basin stretches through all of North Dakota, the northwest part of South Dakota, and eastern Montana and includes plays such as the Bakken/Three Forks plays, where we have significant exposure through our mineral and royalty interests as well as through our working interests. We are also exposed to other well-known plays in the basin, including the Duperow, Mission Canyon, Madison, Ratcliff, Red River, and Spearfish plays. |
|
|
· |
Palo Duro Basin. The Palo Duro Basin covers much of the Texas Panhandle but also occupies a small portion of the Oklahoma Panhandle and extends partially into New Mexico to the west. We have a significant acreage position in the Palo Duro Basin, much of which underlies an unconventional oil play in the Canyon Lime. We are also well positioned relative to a number of other active conventional and unconventional plays in the Palo Duro Basin, including the Brown Dolomite, Canyon Wash, Cisco Sand, and Strawn Wash plays. |
|
|
· |
Permian Basin. The Permian Basin ranges from southeastern New Mexico into West Texas and is currently one of the most active areas for drilling in the United States. It includes three geologic provinces: the Midland Basin to the east, the Delaware Basin to the west, and the Central Basin in between. Our acreage underlies prospective areas for the Wolfcamp play in the Midland and Delaware Basins, the Spraberry formation in the Midland Basin, and the Bone Springs formation in the Delaware Basin, which are among the plays most actively targeted by drillers within the basin. In addition to these plays, we own mineral and royalty interests that are prospective for a number of other active conventional and unconventional plays in the Permian Basin, including the Atoka, Clearfork, Ellenberger, San Andres, Strawn, and Wichita Albany plays. |
|
|
· |
Anadarko Basin. The Anadarko Basin encompasses the Texas Panhandle, southeastern Colorado, southwestern Kansas, and western Oklahoma. We own mineral and royalty interests as well as working interests in prospective areas for most of the prolific plays in this basin, including the Granite Wash, Atoka, Cleveland, and Woodford Shale plays. Other active plays in which we hold interests in prospective acreage include the Cottage Grove, Hogshooter, Marmaton, Springer, and Tonkawa plays. |
|
|
· |
Appalachian Basin. The Appalachian Basin covers most of Pennsylvania, eastern Ohio, West Virginia, western Maryland, eastern Kentucky, central Tennessee, western Virginia, northwestern Georgia, and northern Alabama. The basin’s most active plays in which we have acreage are the Marcellus Shale and Utica plays, which cover most of western Pennsylvania, northern West Virginia, and eastern Ohio. In addition to the Marcellus Shale, there are a number of other active conventional and unconventional plays to which we have material exposure in the Appalachian Basin, including the Berea, Big Injun, Devonian, Huron, Rhinestreet, and Utica plays. |
5
|
|
· |
Arkoma Basin. The Arkoma Basin stretches from southeast Oklahoma through central Arkansas. The Fayetteville Shale play is one of the basin’s most significant unconventional natural gas plays. We own material mineral and royalty interests within the prospective area of the Fayetteville Shale. In addition, we have exposure to a number of other active conventional and unconventional plays in the basin, including the Atoka, Cromwell, Dunn, Hale, and Woodford Shale plays. |
|
|
· |
Bend Arch-Fort Worth Basin. The Bend Arch-Fort Worth Basin covers much of north central Texas and includes the Barnett Shale play as its most active unconventional play. Through our mineral and royalty interests in this basin, we have significant exposure to the Barnett Shale as well as a number of other active conventional and unconventional plays in the basin, including the Bend Conglomerate, Caddo, Marble Falls, and Mississippian Lime plays. |
|
|
· |
Southwestern Wyoming. The Southwestern Wyoming region covers most of southern and western Wyoming. The Pinedale Anticline is one of the region’s largest producing fields and mainly produces from the Lance formation. We have a meaningful position in the Pinedale Anticline, and we have interests prospective for other active plays as well, including the Mesaverde, Niobrara, and Wasatch plays. |
Interests by USGS Petroleum Province
The following tables present information about our mineral-and-royalty-interest and non-operated working-interest acreage, production, and well count by basin. We may own more than one type of interest in the same tract of land. For example, where we have acquired working interests through our working-interest participation program in a given tract, our working-interest acreage in that tract will relate to the same acres as our mineral-interest acreage in that tract. Consequently, some of the acreage shown for one type of interest below may also be included in the acreage shown for another type of interest. Because of our working-interest participation program, overlap between working-interest acreage and mineral-and-royalty-interest acreage is significant, while overlap between the different types of mineral and royalty interests is not significant.
6
The following table sets forth information about our mineral interests:
|
|
|
|
|
|
|
|
|
|
|
|
|
|
|
Average Daily Production (Boe/d) |
|
|||||||||
|
|
|
As of December 31, 2015 |
|
|
For the Year Ended December 31, |
|
||||||||||||||||||
|
USGS Petroleum Province1 |
|
Acres |
|
|
Average Ownership Interest2 |
|
|
Average Ownership Leased3 |
|
|
|
2015 |
|
|
|
2014 |
|
|
|
2013 |
|
|||
|
Louisiana-Mississippi Salt Basins |
|
|
5,274,784 |
|
|
|
54.4 |
% |
|
|
7.2 |
% |
|
|
3,384 |
|
|
|
4,061 |
|
|
|
5,455 |
|
|
Western Gulf (onshore) |
|
|
1,553,239 |
|
|
|
55.2 |
% |
|
|
39.8 |
% |
|
|
5,021 |
|
|
|
4,099 |
|
|
|
3,443 |
|
|
Williston Basin |
|
|
1,112,646 |
|
|
|
16.8 |
% |
|
|
23.8 |
% |
|
|
2,430 |
|
|
|
1,989 |
|
|
|
1,646 |
|
|
Palo Duro Basin |
|
|
1,010,414 |
|
|
|
46.7 |
% |
|
|
6.4 |
% |
|
|
23 |
|
|
|
16 |
|
|
|
15 |
|
|
Permian Basin |
|
|
780,361 |
|
|
|
16.4 |
% |
|
|
54.9 |
% |
|
|
585 |
|
|
|
566 |
|
|
|
499 |
|
|
Eastern Great Basin |
|
|
599,463 |
|
|
|
96.8 |
% |
|
|
0.1 |
% |
|
|
— |
|
|
|
— |
|
|
|
— |
|
|
Black Warrior Basin |
|
|
592,116 |
|
|
|
54.7 |
% |
|
|
2.3 |
% |
|
|
39 |
|
|
|
41 |
|
|
|
41 |
|
|
Anadarko Basin |
|
|
534,332 |
|
|
|
33.0 |
% |
|
|
56.9 |
% |
|
|
959 |
|
|
|
790 |
|
|
|
815 |
|
|
Appalachian Basin |
|
|
486,964 |
|
|
|
39.5 |
% |
|
|
27.6 |
% |
|
|
80 |
|
|
|
89 |
|
|
|
67 |
|
|
East Texas Basin |
|
|
406,111 |
|
|
|
56.1 |
% |
|
|
29.3 |
% |
|
|
884 |
|
|
|
793 |
|
|
|
994 |
|
|
Arkoma Basin |
|
|
331,777 |
|
|
|
54.4 |
% |
|
|
26.1 |
% |
|
|
1,458 |
|
|
|
1,646 |
|
|
|
1,642 |
|
|
Western Great Basin |
|
|
308,258 |
|
|
|
88.9 |
% |
|
|
0.0 |
% |
|
|
— |
|
|
|
— |
|
|
|
— |
|
|
Piedmont |
|
|
179,724 |
|
|
|
67.7 |
% |
|
|
0.0 |
% |
|
|
— |
|
|
|
— |
|
|
|
— |
|
|
North-Central Montana |
|
|
151,113 |
|
|
|
14.7 |
% |
|
|
16.3 |
% |
|
|
4 |
|
|
|
7 |
|
|
|
4 |
|
|
Bend Arch-Fort Worth Basin |
|
|
138,933 |
|
|
|
20.8 |
% |
|
|
32.9 |
% |
|
|
392 |
|
|
|
252 |
|
|
|
325 |
|
|
Atlantic Coastal Plain |
|
|
117,326 |
|
|
|
12.2 |
% |
|
|
0.0 |
% |
|
|
— |
|
|
|
— |
|
|
|
— |
|
|
Cherokee Platform |
|
|
106,475 |
|
|
|
13.8 |
% |
|
|
29.2 |
% |
|
|
41 |
|
|
|
46 |
|
|
|
34 |
|
|
Illinois Basin |
|
|
79,221 |
|
|
|
53.6 |
% |
|
|
6.1 |
% |
|
|
2 |
|
|
|
1 |
|
|
|
1 |
|
|
Powder River Basin |
|
|
66,415 |
|
|
|
11.1 |
% |
|
|
15.1 |
% |
|
|
56 |
|
|
|
3 |
|
|
|
2 |
|
|
Uinta-Piceance Basin |
|
|
63,408 |
|
|
|
3.2 |
% |
|
|
31.4 |
% |
|
|
6 |
|
|
|
6 |
|
|
|
5 |
|
|
Other |
|
|
697,022 |
|
|
|
35.1 |
% |
|
|
12.3 |
% |
|
|
295 |
|
|
|
311 |
|
|
|
332 |
|
|
Total |
|
|
14,590,102 |
|
|
|
47.8 |
% |
|
|
18.1 |
% |
|
|
15,659 |
|
|
|
14,716 |
|
|
|
15,320 |
|
|
1 |
The basins and regions shown in the table are consistent with USGS petroleum-province delineations. |
|
2 |
Ownership interest is equal to the percentage that our undivided ownership interest in a tract bears to the entire tract. The per-basin average ownership interest shown reflects the weighted average of our ownership interests in all tracts in the basin. Our weighted-average mineral royalty for all of our mineral interests is approximately 20%, which may be multiplied by our ownership interest to approximate the average royalty interest in our mineral and royalty interests. |
|
3 |
The average percent leased reflects the weighted average of our leased acres relative to our total acreage on a tract-by-tract basis in the basin. |
7
The following table sets forth information about our NPRIs:
|
|
|
|
|
|
|
|
|
|
|
|
|
|
|
Average Daily Production (Boe/d) |
|
|||||||||
|
|
|
As of December 31, 2015 |
|
|
For the Year Ended December 31, |
|
||||||||||||||||||
|
USGS Petroleum Province1 |
|
Acres |
|
|
Average Royalty Interest2 |
|
|
Average Percent Leased3 |
|
|
|
2015 |
|
|
|
2014 |
|
|
|
2013 |
|
|||
|
Permian Basin |
|
|
577,172 |
|
|
|
3.2 |
% |
|
|
26.5 |
% |
|
|
31 |
|
|
|
11 |
|
|
|
3 |
|
|
Western Gulf (onshore) |
|
|
180,185 |
|
|
|
5.2 |
% |
|
|
36.0 |
% |
|
|
10 |
|
|
|
14 |
|
|
|
3 |
|
|
North-Central Montana |
|
|
127,307 |
|
|
|
3.0 |
% |
|
|
8.2 |
% |
|
|
— |
|
|
|
— |
|
|
|
— |
|
|
Louisiana-Mississippi Salt Basins |
|
|
111,707 |
|
|
|
6.8 |
% |
|
|
24.6 |
% |
|
|
— |
|
|
<1 |
|
|
<1 |
|
||
|
Williston Basin |
|
|
62,133 |
|
|
|
2.6 |
% |
|
|
33.0 |
% |
|
|
106 |
|
|
|
64 |
|
|
|
32 |
|
|
Bend Arch-Fort Worth Basin |
|
|
52,368 |
|
|
|
4.3 |
% |
|
|
7.4 |
% |
|
|
— |
|
|
|
3 |
|
|
|
2 |
|
|
East Texas Basin |
|
|
41,975 |
|
|
|
2.8 |
% |
|
|
79.2 |
% |
|
|
381 |
|
|
|
2 |
|
|
|
2 |
|
|
Powder River Basin |
|
|
32,424 |
|
|
|
6.3 |
% |
|
|
4.2 |
% |
|
|
— |
|
|
|
— |
|
|
|
— |
|
|
Palo Duro Basin |
|
|
22,791 |
|
|
|
3.8 |
% |
|
|
1.7 |
% |
|
|
— |
|
|
|
— |
|
|
|
— |
|
|
Anadarko Basin |
|
|
10,616 |
|
|
|
4.4 |
% |
|
|
92.6 |
% |
|
|
8 |
|
|
|
2 |
|
|
|
3 |
|
|
Cambridge Arch-Central Kansas Uplift |
|
|
8,583 |
|
|
|
5.7 |
% |
|
|
83.1 |
% |
|
|
— |
|
|
|
— |
|
|
|
— |
|
|
Montana Thrust Belt |
|
|
6,474 |
|
|
|
3.2 |
% |
|
|
14.7 |
% |
|
|
— |
|
|
|
— |
|
|
|
— |
|
|
Southwest Montana |
|
|
6,307 |
|
|
|
5.3 |
% |
|
|
5.1 |
% |
|
|
— |
|
|
|
— |
|
|
|
— |
|
|
Arkoma Basin |
|
|
5,170 |
|
|
|
4.5 |
% |
|
|
71.6 |
% |
|
|
21 |
|
|
|
— |
|
|
|
— |
|
|
Cherokee Platform |
|
|
2,634 |
|
|
|
4.6 |
% |
|
|
30.4 |
% |
|
|
— |
|
|
|
— |
|
|
|
— |
|
|
Nemaha Uplift |
|
|
2,334 |
|
|
|
1.6 |
% |
|
|
41.4 |
% |
|
|
— |
|
|
|
— |
|
|
|
— |
|
|
Sedgwick Basin |
|
|
1,530 |
|
|
|
3.1 |
% |
|
|
78.4 |
% |
|
|
— |
|
|
|
— |
|
|
|
— |
|
|
Southwestern Wyoming |
|
|
560 |
|
|
|
1.0 |
% |
|
|
0.0 |
% |
|
|
— |
|
|
|
— |
|
|
|
— |
|
|
Denver Basin |
|
|
480 |
|
|
|
9.1 |
% |
|
|
0.0 |
% |
|
|
— |
|
|
|
— |
|
|
|
— |
|
|
Appalachian Basin |
|
|
416 |
|
|
|
8.9 |
% |
|
|
6.0 |
% |
|
|
— |
|
|
|
— |
|
|
|
— |
|
|
Other |
|
|
373 |
|
|
|
2.0 |
% |
|
|
12.2 |
% |
|
|
185 |
|
|
|
151 |
|
|
|
148 |
|
|
Total |
|
|
1,253,539 |
|
|
|
3.9 |
% |
|
|
27.1 |
% |
|
|
742 |
|
|
|
247 |
|
|
|
193 |
|
|
1 |
The basins and regions shown in the table are consistent with USGS petroleum-province delineations. |
|
2 |
Average royalty interest is equal to the weighted-average percentage of production or revenues (before operating costs) that we are entitled to on a tract-by-tract basis in the basin. |
|
3 |
The average percent leased reflects the weighted average of our leased acres relative to our total acreage on a tract-by-tract basis in the basin. |
8
The following table sets forth information about our ORRIs:
|
|
|
|
|
|
|
|
|
|
|
Average Daily Production (Boe/d) |
|
|||||||||
|
|
|
As of December 31, 2015 |
|
|
For the Year Ended December 31, |
|
||||||||||||||
|
USGS Petroleum Province1 |
|
Acres |
|
|
Average Royalty Interest2 |
|
|
|
2015 |
|
|
|
2014 |
|
|
|
2013 |
|
||
|
North-Central Montana |
|
|
458,645 |
|
|
|
2.4 |
% |
|
|
35 |
|
|
|
36 |
|
|
|
42 |
|
|
Anadarko Basin |
|
|
178,394 |
|
|
|
2.2 |
% |
|
|
232 |
|
|
|
253 |
|
|
|
258 |
|
|
Permian Basin |
|
|
102,967 |
|
|
|
1.2 |
% |
|
|
72 |
|
|
|
60 |
|
|
|
69 |
|
|
Western Gulf (onshore) |
|
|
79,895 |
|
|
|
1.9 |
% |
|
|
262 |
|
|
|
166 |
|
|
|
126 |
|
|
Powder River Basin |
|
|
74,713 |
|
|
|
1.5 |
% |
|
|
98 |
|
|
|
50 |
|
|
|
52 |
|
|
Southwestern Wyoming |
|
|
70,607 |
|
|
|
2.1 |
% |
|
|
529 |
|
|
|
530 |
|
|
|
631 |
|
|
Michigan Basin |
|
|
56,178 |
|
|
|
1.0 |
% |
|
|
21 |
|
|
|
21 |
|
|
|
24 |
|
|
Uinta-Piceance Basin |
|
|
55,684 |
|
|
|
1.6 |
% |
|
|
37 |
|
|
|
32 |
|
|
|
37 |
|
|
Bend Arch-Fort Worth Basin |
|
|
40,663 |
|
|
|
4.5 |
% |
|
|
160 |
|
|
|
166 |
|
|
|
208 |
|
|
Arkoma Basin |
|
|
35,949 |
|
|
|
2.3 |
% |
|
|
29 |
|
|
|
23 |
|
|
|
24 |
|
|
Williston Basin |
|
|
30,765 |
|
|
|
2.1 |
% |
|
|
76 |
|
|
|
54 |
|
|
|
53 |
|
|
East Texas Basin |
|
|
30,294 |
|
|
|
3.5 |
% |
|
|
81 |
|
|
|
100 |
|
|
|
110 |
|
|
San Juan Basin |
|
|
28,187 |
|
|
|
1.1 |
% |
|
|
3 |
|
|
|
3 |
|
|
|
4 |
|
|
Paradox Basin |
|
|
23,374 |
|
|
|
0.6 |
% |
|
|
2 |
|
|
|
2 |
|
|
|
3 |
|
|
Northern Alaska |
|
|
20,039 |
|
|
|
1.7 |
% |
|
|
32 |
|
|
|
27 |
|
|
|
18 |
|
|
Louisiana-Mississippi Salt Basins |
|
|
17,660 |
|
|
|
3.2 |
% |
|
|
1,185 |
|
|
|
903 |
|
|
|
819 |
|
|
Wind River Basin |
|
|
15,841 |
|
|
|
1.9 |
% |
|
|
33 |
|
|
|
31 |
|
|
|
33 |
|
|
Denver Basin |
|
|
15,080 |
|
|
|
2.8 |
% |
|
|
83 |
|
|
|
91 |
|
|
|
107 |
|
|
Wyoming Thrust Belt |
|
|
8,149 |
|
|
|
1.1 |
% |
|
|
5 |
|
|
|
5 |
|
|
|
5 |
|
|
Cambridge Arch-Central Kansas Uplift |
|
|
5,762 |
|
|
|
3.8 |
% |
|
|
5 |
|
|
|
4 |
|
|
|
4 |
|
|
Other |
|
|
41,462 |
|
|
|
2.1 |
% |
|
|
906 |
|
|
|
879 |
|
|
|
905 |
|
|
Total |
|
|
1,390,308 |
|
|
|
2.1 |
% |
|
|
3,886 |
|
|
|
3,436 |
|
|
|
3,532 |
|
|
1 |
The basins and regions shown in the table are consistent with USGS petroleum-province delineations. |
|
2 |
Average royalty interest is equal to the weighted-average percentage of production or revenues (before operating costs) that we are entitled to on a tract-by-tract basis in the basin. |
9
The following table sets forth information about our non-operated working interests:
|
|
|
|
|
|
|
|
|
|
|
Average Daily Production (Boe/d) |
|
|||||||||
|
|
|
As of December 31, 2015 |
|
|
For the Year Ended December 31, |
|
||||||||||||||
|
USGS Petroleum Province1 |
|
Gross Acres2 |
|
|
Net Acres2 |
|
|
2015 |
|
|
2014 |
|
|
2013 |
|
|||||
|
Western Gulf (onshore) |
|
|
124,656 |
|
|
|
18,112 |
|
|
|
1,234 |
|
|
|
786 |
|
|
|
831 |
|
|
East Texas Basin |
|
|
110,507 |
|
|
|
30,504 |
|
|
|
2,341 |
|
|
|
1,564 |
|
|
|
1,427 |
|
|
Williston Basin |
|
|
54,666 |
|
|
|
7,740 |
|
|
|
1,425 |
|
|
|
1,386 |
|
|
|
844 |
|
|
Louisiana-Mississippi Salt Basins |
|
|
54,346 |
|
|
|
6,917 |
|
|
|
1,007 |
|
|
|
2,077 |
|
|
|
3,105 |
|
|
Bend Arch-Fort Worth Basin |
|
|
53,606 |
|
|
|
11,022 |
|
|
|
108 |
|
|
|
129 |
|
|
|
159 |
|
|
Anadarko Basin |
|
|
31,313 |
|
|
|
21,294 |
|
|
|
1,205 |
|
|
|
1,402 |
|
|
|
1,567 |
|
|
Southwestern Wyoming |
|
|
15,336 |
|
|
|
2,477 |
|
|
|
1 |
|
|
|
6 |
|
|
|
8 |
|
|
Michigan Basin |
|
|
13,287 |
|
|
|
1,330 |
|
|
|
6 |
|
|
|
6 |
|
|
|
6 |
|
|
Powder River Basin |
|
|
11,507 |
|
|
|
2,535 |
|
|
|
169 |
|
|
|
121 |
|
|
|
61 |
|
|
Arkoma Basin |
|
|
8,950 |
|
|
|
2,409 |
|
|
|
341 |
|
|
|
360 |
|
|
|
408 |
|
|
Permian Basin |
|
|
8,113 |
|
|
|
4,734 |
|
|
|
214 |
|
|
|
204 |
|
|
|
160 |
|
|
Denver Basin |
|
|
4,286 |
|
|
|
1,037 |
|
|
|
5 |
|
|
|
4 |
|
|
|
4 |
|
|
San Juan Basin |
|
|
3,442 |
|
|
|
1,575 |
|
|
|
11 |
|
|
|
9 |
|
|
|
10 |
|
|
North-Central Montana |
|
|
2,080 |
|
|
|
605 |
|
|
|
1 |
|
|
|
1 |
|
|
|
1 |
|
|
Wind River Basin |
|
|
2,000 |
|
|
|
935 |
|
|
|
— |
|
|
|
— |
|
|
|
— |
|
|
Paradox Basin |
|
|
1,125 |
|
|
|
522 |
|
|
|
5 |
|
|
|
5 |
|
|
|
5 |
|
|
Southern Oklahoma |
|
|
390 |
|
|
|
92 |
|
|
|
174 |
|
|
|
141 |
|
|
|
138 |
|
|
Cherokee Platform |
|
|
328 |
|
|
|
137 |
|
|
|
5 |
|
|
|
9 |
|
|
|
14 |
|
|
Big Horn Basin |
|
|
320 |
|
|
|
320 |
|
|
|
— |
|
|
|
— |
|
|
|
— |
|
|
Wyoming Thrust Belt |
|
|
176 |
|
|
|
176 |
|
|
|
— |
|
|
|
— |
|
|
|
— |
|
|
Other |
|
|
321 |
|
|
|
36 |
|
|
|
128 |
|
|
|
109 |
|
|
|
129 |
|
|
Total |
|
|
500,755 |
|
|
|
114,509 |
|
|
|
8,380 |
|
|
|
8,319 |
|
|
|
8,877 |
|
|
1 |
The basins and regions shown in the table are consistent with USGS petroleum-province delineations. |
|
2 |
Excludes acreage that is not quantifiable due to incomplete seller records. |
10
The following table sets forth information about our mineral-and-royalty-interest and working-interest wells as of December 31, 2015:
|
Mineral and Royalty Interests |
|
|
Working Interests |
|
||||||
|
USGS Petroleum Province1 |
|
Gross Well Count2 |
|
|
USGS Petroleum Province1 |
|
Gross Well Count2 |
|
||
|
Permian Basin |
|
|
19,671 |
|
|
Anadarko Basin |
|
|
3,026 |
|
|
Anadarko Basin |
|
|
3,599 |
|
|
Uinta-Piceance Basin |
|
|
1,962 |
|
|
Williston Basin |
|
|
2,643 |
|
|
Permian Basin |
|
|
773 |
|
|
Louisiana-Mississippi Salt Basins |
|
|
2,536 |
|
|
Arkoma Basin |
|
|
709 |
|
|
Western Gulf (onshore) |
|
|
2,504 |
|
|
Southern Oklahoma |
|
|
692 |
|
|
East Texas Basin |
|
|
2,303 |
|
|
Western Gulf (onshore) |
|
|
593 |
|
|
Uinta-Piceance Basin |
|
|
2,224 |
|
|
Williston Basin |
|
|
542 |
|
|
Arkoma Basin |
|
|
1,726 |
|
|
Louisiana-Mississippi Salt Basins |
|
|
492 |
|
|
Bend Arch-Fort Worth Basin |
|
|
1,212 |
|
|
East Texas Basin |
|
|
448 |
|
|
Michigan Basin |
|
|
1,043 |
|
|
Bend Arch-Fort Worth Basin |
|
|
224 |
|
|
Southern Wyoming |
|
|
700 |
|
|
Appalachian Basin |
|
|
189 |
|
|
Cherokee Platform |
|
|
660 |
|
|
Nemaha Uplift |
|
|
174 |
|
|
Appalachian Basin |
|
|
633 |
|
|
Michigan Basin |
|
|
62 |
|
|
Southern Oklahoma |
|
|
620 |
|
|
Powder River Basin |
|
|
51 |
|
|
San Juan Basin |
|
|
481 |
|
|
Cherokee Platform |
|
|
15 |
|
|
San Joaquin Basin |
|
|
455 |
|
|
North-Central Montana |
|
|
10 |
|
|
North-Central Montana |
|
|
440 |
|
|
Paradox Basin |
|
|
8 |
|
|
Nemaha Uplift |
|
|
419 |
|
|
Southwestern Wyoming |
|
|
5 |
|
|
Powder River Basin |
|
|
366 |
|
|
San Juan |
|
|
5 |
|
|
Wyoming Thrust Belt |
|
|
361 |
|
|
Black Warrior Basin |
|
|
5 |
|
|
Other |
|
|
1,716 |
|
|
Other |
|
|
125 |
|
|
Total |
|
|
46,312 |
|
|
Total |
|
|
10,110 |
|
|
1 |
The basins and regions shown in the table are consistent with USGS petroleum-province delineations. |
|
2 |
We own both mineral and royalty interests and working interests in 4,498 of the wells shown in each column above. |
11
The following table presents information about our mineral-and-royalty-interest and working-interest acreage by the resource plays we consider most material to our current and future business and contribute 61.0% of our aggregate production for the year ended December 31, 2015.
|
|
|
Acreage as of December 31, 20151 |
|
|||||||||||||||||
|
|
|
Mineral and Royalty Interests |
|
|
Working Interests |
|
||||||||||||||
|
Resource Play2 |
|
Mineral Interests |
|
|
NPRIs |
|
|
ORRIs |
|
|
Gross |
|
|
Net |
|
|||||
|
Bakken Shale |
|
|
304,908 |
|
|
|
36,421 |
|
|
|
12,730 |
|
|
|
50,091 |
|
|
|
7,104 |
|
|
Three Forks |
|
|
292,960 |
|
|
|
33,602 |
|
|
|
12,050 |
|
|
|
50,292 |
|
|
|
6,731 |
|
|
Haynesville Shale |
|
|
271,237 |
|
|
|
7,123 |
|
|
|
14,468 |
|
|
|
149,500 |
|
|
|
35,746 |
|
|
Marcellus Shale |
|
|
248,786 |
|
|
|
— |
|
|
|
9,962 |
|
|
|
— |
|
|
|
— |
|
|
Canyon Lime |
|
|
219,438 |
|
|
|
— |
|
|
|
— |
|
|
|
— |
|
|
|
— |
|
|
Bossier Shale |
|
|
207,593 |
|
|
|
2,096 |
|
|
|
8,441 |
|
|
|
122,121 |
|
|
|
31,958 |
|
|
Tuscaloosa Marine Shale |
|
|
179,345 |
|
|
|
3,981 |
|
|
|
860 |
|
|
|
— |
|
|
|
— |
|
|
Wolfcamp-Midland |
|
|
154,965 |
|
|
|
68,827 |
|
|
|
58,362 |
|
|
|
160 |
|
|
|
4 |
|
|
Granite Wash |
|
|
100,883 |
|
|
|
4,042 |
|
|
|
87,516 |
|
|
|
4,840 |
|
|
|
1,254 |
|
|
Fayetteville Shale |
|
|
70,446 |
|
|
|
— |
|
|
|
11,673 |
|
|
|
— |
|
|
|
— |
|
|
Barnett Shale |
|
|
62,178 |
|
|
|
4,004 |
|
|
|
37,472 |
|
|
|
13,417 |
|
|
|
7,284 |
|
|
Eagle Ford Shale |
|
|
59,465 |
|
|
|
85,609 |
|
|
|
46,926 |
|
|
|
7,039 |
|
|
|
437 |
|
|
Wolfcamp-Delaware |
|
|
32,815 |
|
|
|
11,033 |
|
|
|
1,040 |
|
|
|
642 |
|
|
|
160 |
|
|
1 |
We may own more than one type of interest in the same tract of land. For example, where we have acquired working interests through our working-interest participation program in a given tract, our working-interest acreage in that tract will relate to the same acres as our mineral-interest acreage in that tract. Consequently, some of the acreage shown for one type of interest above may also be included in the acreage shown for another type of interest. Because of our working-interest participation program, overlap between working-interest acreage and mineral-and-royalty-interest acreage is significant, while overlap between the different types of mineral and royalty interests is not significant. Working-interest acreage excludes acreage that is not quantifiable due to incomplete seller records. |
|
2 |
The plays above have been delineated based on information from the EIA, the USGS, or state agencies or according to areas of the most active industry development. |
12
The following tables present information about our mineral-and-royalty-interest and non-operated working-interest acreage, and production by resource play. As with the acreage shown for the basins above, we may own more than one type of interest in the same tract of land. Consequently, some of the acreage shown for one type of interest below may also be included in the acreage shown for another type of interest.
Mineral Interests
The following table sets forth information about our mineral interests:
|
|
|
|
|
|
|
|
|
|
|
|
|
|
|
Average Daily Production (Boe/d) |
|
|||||||||
|
|
|
As of December 31, 2015 |
|
|
For the Year Ended December 31, |
|
||||||||||||||||||
|
Resource Play1 |
|
Acres |
|
|
Average Ownership Interest2 |
|
|
Average Ownership Leased3 |
|
|
2015 |
|
|
2014 |
|
|
2013 |
|
||||||
|
Bakken Shale |
|
|
304,908 |
|
|
|
18.2 |
% |
|
|
73.5 |
% |
|
|
1,746 |
|
|
|
1,275 |
|
|
|
1,074 |
|
|
Three Forks |
|
|
292,960 |
|
|
|
17.9 |
% |
|
|
74.7 |
% |
|
|
823 |
|
|
|
626 |
|
|
|
490 |
|
|
Haynesville Shale |
|
|
271,237 |
|
|
|
68.5 |
% |
|
|
59.8 |
% |
|
|
2,728 |
|
|
|
3,152 |
|
|
|
4,139 |
|
|
Marcellus Shale |
|
|
248,786 |
|
|
|
17.8 |
% |
|
|
44.0 |
% |
|
|
71 |
|
|
|
74 |
|
|
|
50 |
|
|
Canyon Lime |
|
|
219,438 |
|
|
|
30.7 |
% |
|
|
18.3 |
% |
|
|
8 |
|
|
|
1 |
|
|
|
1 |
|
|
Bossier Shale |
|
|
207,593 |
|
|
|
70.2 |
% |
|
|
67.3 |
% |
|
|
351 |
|
|
|
548 |
|
|
|
1,066 |
|
|
Tuscaloosa Marine Shale |
|
|
179,345 |
|
|
|
63.0 |
% |
|
|
68.8 |
% |
|
|
46 |
|
|
|
6 |
|
|
<1 |
|
|
|
Wolfcamp-Midland |
|
|
154,965 |
|
|
|
4.7 |
% |
|
|
97.5 |
% |
|
|
76 |
|
|
|
27 |
|
|
|
15 |
|
|
Granite Wash |
|
|
100,883 |
|
|
|
15.1 |
% |
|
|
55.5 |
% |
|
|
194 |
|
|
|
241 |
|
|
|
276 |
|
|
Fayetteville Shale |
|
|
70,446 |
|
|
|
56.7 |
% |
|
|
77.0 |
% |
|
|
1,349 |
|
|
|
1,529 |
|
|
|
1,508 |
|
|
Barnett Shale |
|
|
62,178 |
|
|
|
15.6 |
% |
|
|
61.2 |
% |
|
|
239 |
|
|
|
228 |
|
|
|
299 |
|
|
Eagle Ford Shale |
|
|
59,465 |
|
|
|
15.8 |
% |
|
|
85.3 |
% |
|
|
2,355 |
|
|
|
1,595 |
|
|
|
989 |
|
|
Wolfcamp-Delaware |
|
|
32,815 |
|
|
|
20.3 |
% |
|
|
89.9 |
% |
|
|
148 |
|
|
|
132 |
|
|
|
72 |
|
|
1 |
The plays above have been delineated based on information from the EIA, the USGS, or state agencies or according to areas of the most active industry development. |
|
2 |
Ownership interest is equal to the percentage that our undivided ownership interest in a tract bears to the entire tract. The per-play average ownership interests shown above reflect the weighted average of our ownership interests in all tracts in the play. Our weighted-average mineral royalty for all of our mineral interests is approximately 20%, which may be multiplied by our ownership interest to approximate the average royalty interest in our mineral and royalty interests. |
|
3 |
The average percent leased reflects the weighted average of our leased acres relative to our total acreage on a tract-by-tract basis in the play. |
13
The following table sets forth information about our NPRIs:
|
|
|
|
|
|
|
|
|
|
|
|
|
|
|
Average Daily Production (Boe/d) |
|
|||||||||
|
|
|
As of December 31, 2015 |
|
|
For the Year Ended December 31, |
|
||||||||||||||||||
|
Resource Play1 |
|
Acres |
|
|
Average Royalty Interest2 |
|
|
Average Percent Leased3 |
|
|
2015 |
|
|
2014 |
|
|
2013 |
|
||||||
|
Bakken Shale |
|
|
36,421 |
|
|
|
1.4 |
% |
|
|
51.4 |
% |
|
|
56 |
|
|
|
37 |
|
|
|
18 |
|
|
Three Forks |
|
|
33,602 |
|
|
|
1.2 |
% |
|
|
54.9 |
% |
|
|
50 |
|
|
|
27 |
|
|
|
13 |
|
|
Haynesville Shale |
|
|
7,123 |
|
|
|
4.2 |
% |
|
|
97.1 |
% |
|
|
325 |
|
|
|
— |
|
|
|
— |
|
|
Marcellus Shale |
|
|
— |
|
|
|
0.0 |
% |
|
NA |
|
|
|
— |
|
|
|
— |
|
|
|
— |
|
|
|
Canyon Lime |
|
|
— |
|
|
|
0.0 |
% |
|
NA |
|
|
|
— |
|
|
|
— |
|
|
|
— |
|
|
|
Bossier Shale |
|
|
2,096 |
|
|
|
2.7 |
% |
|
|
60.2 |
% |
|
|
53 |
|
|
|
— |
|
|
|
— |
|
|
Tuscaloosa Marine Shale |
|
|
3,981 |
|
|
|
2.1 |
% |
|
|
48.2 |
% |
|
|
— |
|
|
|
— |
|
|
|
— |
|
|
Wolfcamp-Midland |
|
|
68,827 |
|
|
|
1.5 |
% |
|
|
62.9 |
% |
|
|
22 |
|
|
|
5 |
|
|
|
— |
|
|
Granite Wash |
|
|
4,042 |
|
|
|
0.9 |
% |
|
|
100.0 |
% |
|
|
5 |
|
|
<1 |
|
|
|
— |
|
|
|
Fayetteville Shale |
|
|
— |
|
|
|
0.0 |
% |
|
NA |
|
|
|
— |
|
|
|
— |
|
|
|
— |
|
|
|
Barnett Shale |
|
|
4,004 |
|
|
|
2.8 |
% |
|
|
86.3 |
% |
|
|
— |
|
|
|
2 |
|
|
|
2 |
|
|
Eagle Ford Shale |
|
|
85,609 |
|
|
|
1.5 |
% |
|
|
27.8 |
% |
|
|
3 |
|
|
|
7 |
|
|
|
— |
|
|
Wolfcamp-Delaware |
|
|
11,033 |
|
|
|
3.4 |
% |
|
|
59.8 |
% |
|
|
1 |
|
|
|
2 |
|
|
<1 |
|
|
|
1 |
The plays above have been delineated based on information from the EIA, the USGS or state agencies or according to areas of the most active industry development. |
|
2 |
Average royalty interest is equal to the weighted-average percentage of production or revenues (before operating costs) that we are entitled to on a tract-by-tract basis for the given area. |
|
3 |
The average percent leased reflects the weighted average of our leased acres relative to our total acreage on a tract-by-tract basis in the play. |
ORRIs
The following table sets forth information about our ORRIs:
|
|
|
|
|
|
|
|
|
|
|
Average Daily Production (Boe/d) |
|
|||||||||
|
|
|
As of December 31, 2015 |
|
|
For the Year Ended December 31, |
|
||||||||||||||
|
Resource Play1 |
|
Acres |
|
|
Average Royalty Interest2 |
|
|
2015 |
|
|
2014 |
|
|
2013 |
|
|||||
|
Bakken Shale |
|
|
12,730 |
|
|
|
1.2 |
% |
|
|
41 |
|
|
|
27 |
|
|
|
20 |
|
|
Three Forks |
|
|
12,050 |
|
|
|
1.2 |
% |
|
|
27 |
|
|
|
18 |
|
|
|
20 |
|
|
Haynesville Shale |
|
|
14,468 |
|
|
|
4.4 |
% |
|
|
1,111 |
|
|
|
816 |
|
|
|
689 |
|
|
Marcellus Shale |
|
|
9,962 |
|
|
|
2.8 |
% |
|
|
6 |
|
|
|
— |
|
|
|
— |
|
|
Canyon Lime |
|
|
— |
|
|
|
0.0 |
% |
|
|
— |
|
|
|
— |
|
|
|
— |
|
|
Bossier Shale |
|
|
8,441 |
|
|
|
4.7 |
% |
|
|
57 |
|
|
|
60 |
|
|
|
89 |
|
|
Tuscaloosa Marine Shale |
|
|
860 |
|
|
|
2.0 |
% |
|
|
— |
|
|
<1 |
|
|
<1 |
|
||
|
Wolfcamp-Midland |
|
|
58,362 |
|
|
|
0.4 |
% |
|
|
5 |
|
|
|
3 |
|
|
|
5 |
|
|
Granite Wash |
|
|
87,516 |
|
|
|
1.2 |
% |
|
|
115 |
|
|
|
191 |
|
|
|
180 |
|
|
Fayetteville Shale |
|
|
11,673 |
|
|
|
4.0 |
% |
|
|
— |
|
|
|
— |
|
|
|
— |
|
|
Barnett Shale |
|
|
37,472 |
|
|
|
4.7 |
% |
|
|
158 |
|
|
|
163 |
|
|
|
205 |
|
|
Eagle Ford Shale |
|
|
46,926 |
|
|
|
2.1 |
% |
|
|
204 |
|
|
|
96 |
|
|
|
52 |
|
|
Wolfcamp-Delaware |
|
|
1,040 |
|
|
|
0.6 |
% |
|
|
— |
|
|
|
— |
|
|
|
— |
|
|
1 |
The plays above have been delineated based on information from the EIA, the USGS, or state agencies or according to areas of the most active industry development. |
|
2 |
Average royalty interest is equal to the weighted-average percentage of production or revenues (before operating costs) that we are entitled to on a tract-by-tract basis in this play. |
14
The following table sets forth information about our working interests.
|
|
|
|
|
|
|
|
|
|
|
Average Daily Production (Boe/d) |
|
|||||||||
|
|
|
As of December 31, 2015 |
|
|
For the Year Ended December 31, |
|
||||||||||||||
|
Resource Play1 |
|
Gross Acres2 |
|
|
Net Acres2 |
|
|
2015 |
|
|
2014 |
|
|
2013 |
|
|||||
|
Bakken Shale |
|
|
50,091 |
|
|
|
7,104 |
|
|
|
792 |
|
|
|
855 |
|
|
|
507 |
|
|
Three Forks |
|
|
50,292 |
|
|
|
6,731 |
|
|
|
551 |
|
|
|
491 |
|
|
|
307 |
|
|
Haynesville Shale |
|
|
149,500 |
|
|
|
35,746 |
|
|
|
2,909 |
|
|
|
3,136 |
|
|
|
3,937 |
|
|
Marcellus Shale |
|
|
— |
|
|
|
— |
|
|
|
— |
|
|
|
— |
|
|
|
— |
|
|
Canyon Lime |
|
|
— |
|
|
|
— |
|
|
|
— |
|
|
|
— |
|
|
|
— |
|
|
Bossier Shale |
|
|
122,121 |
|
|
|
31,958 |
|
|
|
135 |
|
|
|
199 |
|
|
|
277 |
|
|
Tuscaloosa Marine Shale |
|
|
— |
|
|
|
— |
|
|
|
— |
|
|
|
— |
|
|
|
— |
|
|
Wolfcamp-Midland |
|
|
160 |
|
|
|
4 |
|
|
|
— |
|
|
|
1 |
|
|
|
1 |
|
|
Granite Wash |
|
|
4,840 |
|
|
|
1,254 |
|
|
|
537 |
|
|
|
647 |
|
|
|
753 |
|
|
Fayetteville Shale |
|
|
— |
|
|
|
— |
|
|
|
— |
|
|
|
— |
|
|
|
— |
|
|
Barnett Shale |
|
|
13,417 |
|
|
|
7,284 |
|
|
|
104 |
|
|
|
124 |
|
|
|
154 |
|
|
Eagle Ford Shale |
|
|
7,039 |
|
|
|
437 |
|
|
|
11 |
|
|
|
— |
|
|
|
— |
|
|
Wolfcamp-Delaware |
|
|
642 |
|
|
|
160 |
|
|
|
23 |
|
|
|
33 |
|
|
|
4 |
|
|
1 |
The plays above have been delineated based on information from the EIA, the USGS, or state agencies or according to areas of the most active industry development. |
|
2 |
Excludes acreage that is not quantifiable due to incomplete seller records. |
Estimated Proved Reserves
Evaluation and Review of Estimated Proved Reserves
The information included in this Annual Report on Form 10-K relating to our estimated proved oil and natural gas reserves is based upon a reserve report prepared by NSAI, a third-party petroleum engineering firm, as of December 31, 2015.
NSAI provides worldwide petroleum property analysis services for energy clients, financial organizations, and government agencies. NSAI was founded in 1961 and performs consulting petroleum engineering services under Texas Board of Professional Engineers Registration No. F-2699. Within NSAI, the technical person primarily responsible for preparing the estimates set forth in the NSAI summary reserve report incorporated herein is Mr. J. Carter Henson, Jr. Mr. Henson, a Licensed Professional Engineer in the State of Texas (License No. 73964), has been practicing consulting petroleum engineering at NSAI since 1989 and has over 8 years of prior industry experience. He graduated from Rice University in 1981 with a Bachelor of Science Degree in Mechanical Engineering. As technical principal, Mr. Henson meets or exceeds the education, training, and experience requirements set forth in the Standards Pertaining to the Estimating and Auditing of Oil and Gas Reserves Information promulgated by the Society of Petroleum Engineers and is proficient in judiciously applying industry standard practices to engineering evaluations as well as applying SEC and other industry reserves definitions and guidelines. NSAI does not own an interest in us or any of our properties, nor is it employed by us on a contingent basis. A copy of NSAI’s estimated proved reserve report as of December 31, 2015 is attached as an exhibit to this Annual Report.
We maintain an internal staff of petroleum engineers and geoscience professionals who worked closely with our third-party reserve engineers to ensure the integrity, accuracy, and timeliness of the data used to calculate our estimated proved reserves. Our internal technical team members met with our third-party reserve engineers periodically during the period covered by the above referenced reserve report to discuss the assumptions and methods used in the reserve estimation process. We provided historical information to the third-party reserve engineers for our properties, such as oil and natural gas production, well test data, realized commodity prices, and operating and development costs. We also provided ownership interest information with respect to our properties. Brock Morris, our Senior Vice President, Engineering and Geology, is primarily responsible for overseeing the preparation of all of our reserve estimates. Mr. Morris is a petroleum engineer with approximately 30 years of reservoir-engineering and operations experience.
15
The preparation of our historical proved reserve estimates were completed in accordance with our internal control procedures. Throughout the year, our technical team met with NSAI to review properties and discuss evaluation methods and assumptions used in the proved reserves estimates, in accordance with our prescribed internal control procedures. Our internal controls over the reserves estimation process include verification of input data used in the reserves evaluation software as well as reviews by our internal engineering staff and management, which include the following:
|
|
· |
Comparison of historical operating expenses from the lease operating statements to the operating costs input in the reserves database; |
|
|
· |
Review of working interests and net revenue interests in the reserves database against our well ownership system; |
|
|
· |
Review of historical realized commodity prices and differentials from index prices compared to the differentials used in the reserves database; |
|
|
· |
Review of capital costs assumptions to actual historical capital costs; |
|
|
· |
Review of actual historical production volumes compared to projections in the reserve report; |
|
|
· |
Discussion of material reserve variances among our internal reservoir engineers and our Senior Vice President, Engineering and Geology; and |
|
|
· |
Review of preliminary reserve estimates by our President and Chief Executive Officer with our internal technical staff. |
Estimation of Proved Reserves
In accordance with rules and regulations of the SEC applicable to companies involved in oil and natural gas producing activities, proved reserves are those quantities of oil and natural gas, which, by analysis of geoscience and engineering data, can be estimated with reasonable certainty to be economically producible from a given date forward, from known reservoirs, and under existing economic conditions, operating methods, and government regulations. The term “reasonable certainty” means deterministically, the quantities of oil and/or natural gas are much more likely to be achieved than not, and probabilistically, there should be at least a 90% probability of recovering volumes equal to or exceeding the estimate. All of our estimated proved reserves as of December 31, 2015 are based on deterministic methods. Reasonable certainty can be established using techniques that have been proved effective by actual production from projects in the same reservoir or an analogous reservoir or by using reliable technology. Reliable technology is a grouping of one or more technologies (including computational methods) that has been field tested and has been demonstrated to provide reasonably certain results with consistency and repeatability in the formation being evaluated or in an analogous formation.
In order to establish reasonable certainty with respect to our estimated net proved reserves NSAI employed technologies including, but not limited to, electrical logs, radioactivity logs, core analyses, geologic maps, and available down hole pressure and production data, seismic data, and well test data. Reserves attributable to producing wells with sufficient production history were estimated using appropriate decline curves or other performance relationships. Reserves attributable to producing wells with limited production history and for undeveloped locations were estimated using performance from analogous wells in the surrounding area and geologic data to assess the reservoir continuity. In addition to assessing reservoir continuity, geologic data from well logs, core analyses, and seismic data were used to estimate original oil and natural gas in place. Recovery factors were determined utilizing reservoir simulation or analogy with similar reservoirs where similar drilling and completion techniques have been employed.
16
Summary of Estimated Proved Reserves
The following table presents our estimated proved oil and natural gas reserves:
|
|
|
As of December 31, 20151 |
|
|
|
|
|
(Unaudited) |
|
|
|
Estimated proved developed reserves2: |
|
|
|
|
|
Oil (MBbls) |
|
|
15,497 |
|
|
Natural gas (MMcf) |
|
|
174,555 |
|
|
Total (MBoe) |
|
|
44,590 |
|
|
Estimated proved undeveloped reserves3: |
|
|
|
|
|
Oil (MBbls) |
|
|
345 |
|
|
Natural gas (MMcf) |
|
|
29,120 |
|
|
Total (MBoe) |
|
|
5,198 |
|
|
Estimated proved reserves: |
|
|
|
|
|
Oil (MBbls) |
|
|
15,842 |
|
|
Natural gas (MMcf) |
|
|
203,675 |
|
|
Total (MBoe) |
|
|
49,788 |
|
|
Percent proved developed |
|
|
89.6 |
% |
|
1 |
Estimates of reserves as of December 31, 2015 were prepared using oil and natural gas prices equal to the unweighted arithmetic average of the first-day-of-the-month market price for each month in the period January through December 2015. For oil volumes, the average WTI spot oil price of $50.28 per barrel is used for estimates of reserves for all the properties as of December 31, 2015. These average prices are adjusted for quality, transportation fees, and market differentials. For natural gas volumes, the average Henry Hub price of $2.59 per MMBTU is used for estimates of reserves for all the properties as of December 31, 2015. These average prices are adjusted for energy content, transportation fees, and market differentials. Natural gas prices are also adjusted to account for NGL revenue since there is not sufficient data to account for NGL volumes separately in the reserve estimates. These reserve estimates exclude NGL quantities. When taking these adjustments into account, the average adjusted gas price weighted by production over the remaining lives of the properties is $2.45 per Mcf. Reserve estimates do not include any value for probable or possible reserves that may exist, nor do they include any value for undeveloped acreage. The reserve estimates represent our net revenue interest in our properties. Although we believe these estimates are reasonable, actual future production, cash flows, taxes, development expenditures, operating expenses, and quantities of recoverable oil and natural gas may vary substantially from these estimates. |
|
2 |
Proved developed reserves of 84 MBoe as of December 31, 2015 were attributable to noncontrolling interests in our consolidated subsidiaries. |
|
3 |
As of December 31, 2015, no proved undeveloped reserves were attributable to noncontrolling interests in our consolidated subsidiaries. |
Reserve engineering is and must be recognized as a subjective process of estimating volumes of economically recoverable oil and natural gas that cannot be measured in an exact manner. The accuracy of any reserve estimate is a function of the quality of available data and of engineering and geological interpretation. As a result, the estimates of different engineers often vary for the same property. In addition, the results of drilling, testing, and production may justify revisions of such estimates. Accordingly, reserve estimates often differ from the quantities of oil and natural gas that are ultimately recovered. Estimates of economically recoverable oil and natural gas and of future net revenues are based on a number of variables and assumptions, all of which may vary from actual results, including geologic interpretation, prices, and future production rates and costs. Please read Part I, Item 1A. “Risk Factors.”
Additional information regarding our estimated proved reserves can be found in the notes to the consolidated financial statements of BSM included elsewhere in this Annual Report and the estimated proved reserve reports as of December 31, 2015, which are included as exhibits to this Annual Report.
17
Estimated Proved Undeveloped Reserves
As of December 31, 2015, our PUDs were composed of 345 MBbls of oil and 29,120 MMcf of natural gas, for a total of 5,198 MBoe. PUDs will be converted from undeveloped to developed as the applicable wells begin production.
The following tables summarize our changes in PUDs during the year ended December 31, 2015 (in MBoe):
|
|
|
Proved Undeveloped Reserves |
|
|
|
|
|
(Unaudited) |
|
|
|
Balance as of December 31, 2014 |
|
|
595 |
|
|
Acquisitions of reserves |
|
|
— |
|
|
Extensions and discoveries |
|
|
5,051 |
|
|
Revisions of previous estimates |
|
|
(101 |
) |
|
Transfers to estimated proved developed |
|
|
(347 |
) |
|
Balance as of December 31, 2015 |
|
|
5,198 |
|
There were no PUD reserves acquired during the year ended December 31, 2015. New PUD reserves totaling 5,051 MBoe were added during the year ended December 31, 2015 resulted primarily from drilling and capital expenditures in the Haynesville/Bossier, Bakken/Three Forks, and Wolfcamp plays.
During the year ended December 31, 2015, we had downward revisions of previous PUD reserve estimates totaling 101 MBoe, which were made up of 307 MMcf of natural gas reserve estimate revisions and 50 MBbl of oil reserve estimate revisions. Reductions of 45 MBoe are related to wells removed from PUD status as a result of stale permits or updated operator information, and 56 MBoe are related to revised reserve estimates for PUD locations in the Wolfcamp and Haynesville plays.
Costs incurred relating to the development of locations that were classified as PUDs at December 31, 2014 were $1.3 million during the year ended December 31, 2015. Additionally, during the year ended December 31, 2015, we incurred $58.7 million drilling and completing other wells which were not classified as PUDs as of December 31, 2014. Estimated future development costs during the year ended December 31, 2016 relating to the development of PUD reserves at December 31, 2015 are projected to be approximately $30.6 million. All of our PUD drilling locations as of December 31, 2015 are scheduled to be drilled within five years or less from the date the reserves were initially booked as proved undeveloped reserves.
We generally do not have evidence of approval of our operators’ development plans. As a result, our proved undeveloped reserve estimates are limited to those relatively few locations for which we have received and approved an authorization for expenditure and which remained undrilled as of December 31, 2015. As of December 31, 2015, approximately 10.4% of our total proved reserves were classified as PUDs.
18
Oil and Natural Gas Production Prices and Production Costs
Production and Price History
For the year ended December 31, 2015, 34.1% of our production and 58.5% of our oil and natural gas revenues were related to oil and condensate production and sales. During the same period, natural gas and natural gas liquids were 65.9% of our production and 41.5% of our oil and natural gas revenues.
The following table sets forth information regarding production of oil and natural gas and certain price and cost information for each of the periods indicated:
|
|
|
Year Ended December 31, |
|
|||||||||
|
|
|
2015 |
|
|
2014 |
|
|
2013 |
|
|||
|
Production: |
|
|
|
|
|
|
|
|
|
|
|
|
|
Oil and condensate (MBbls)1 |
|
|
3,565 |
|
|
|
3,005 |
|
|
|
2,626 |
|
|
Natural gas (MMcf)1 |
|
|
41,389 |
|
|
|
42,273 |
|
|
|
45,400 |
|
|
Total (MBoe) |
|
|
10,463 |
|
|
|
10,051 |
|
|
|
10,193 |
|
|
Average daily production (MBoe/d) |
|
|
28.7 |
|
|
|
27.5 |
|
|
|
27.9 |
|
|
Realized Prices2: |
|
|
|
|
|
|
|
|
|
|
|
|
|
Oil and condensate (per Bbl) |
|
$ |
45.87 |
|
|
$ |
85.65 |
|
|
$ |
96.25 |
|
|
Natural gas and natural gas liquids (per Mcf)1 |
|
$ |
2.80 |
|
|
$ |
4.91 |
|
|
$ |
4.06 |
|
|
Unit Cost per Boe: |
|
|
|
|
|
|
|
|
|
|
|
|
|
Lease operating expense |
|
$ |
2.06 |
|
|
$ |
2.11 |
|
|
$ |
2.07 |
|
|
Production costs and ad valorem taxes |
|
$ |
3.42 |
|
|
$ |
4.93 |
|
|
$ |
4.20 |
|
|
1 |
As a mineral-and-royalty interest owner, we are often provided insufficient and inconsistent data by our operators. As a result, we are unable to reliably determine the total volumes of NGLs associated with the production of natural gas on our acreage. As such, the realized prices account for all value attributable to NGLs. The oil and condensate production volumes and natural gas production volumes do not include NGL volumes. |
|
2 |
Excludes the effect of commodity derivative instruments. |
Productive Wells
Productive wells consist of producing wells, wells capable of production, and exploratory, development, or extension wells that are not dry wells. As of December 31, 2015, we owned mineral and royalty interests or working interests in 51,924 productive wells, which consisted of 31,967 oil wells and 19,957 natural gas wells. As of December 31, 2015, we owned mineral and royalty interests in 46,312 productive wells, which consisted of 31,136 oil wells and 15,176 natural gas wells, and working interests in 10,110 gross productive wells and 269 net productive wells, which consisted of 4,128 gross (55 net) productive oil wells and 5,982 gross (214 net) productive natural gas wells. We own both mineral and royalty interests and working interests in 4,498 of these wells.
19
Mineral and Royalty Interests
The following table sets forth information relating to our acreage for our mineral interests as of December 31, 2015:
|
State |
|
Developed Acreage |
|
|
Undeveloped Acreage |
|
|
Total Acreage |
|
|||
|
Texas |
|
|
320,947 |
|
|
|
3,627,378 |
|
|
|
3,948,325 |
|
|
Mississippi |
|
|
5,264 |
|
|
|
2,320,726 |
|
|
|
2,325,990 |
|
|
Alabama |
|
|
2,792 |
|
|
|
2,025,227 |
|
|
|
2,028,019 |
|
|
Arkansas |
|
|
4,887 |
|
|
|
1,187,605 |
|
|
|
1,192,492 |
|
|
North Dakota |
|
|
17,800 |
|
|
|
850,142 |
|
|
|
867,942 |
|
|
Nevada |
|
|
— |
|
|
|
792,328 |
|
|
|
792,328 |
|
|
Florida |
|
|
— |
|
|
|
698,830 |
|
|
|
698,830 |
|
|
Louisiana |
|
|
35,354 |
|
|
|
490,274 |
|
|
|
525,628 |
|
|
Oklahoma |
|
|
120,860 |
|
|
|
350,317 |
|
|
|
471,177 |
|
|
Montana |
|
|
20,765 |
|
|
|
408,373 |
|
|
|
429,138 |
|
|
Other |
|
|
83,900 |
|
|
|
1,226,333 |
|
|
|
1,310,233 |
|
|
Total |
|
|
612,569 |
|
|
|
13,977,533 |
|
|
|
14,590,102 |
|
The following table sets forth information relating to our acreage for our NPRIs as of December 31, 2015:
|
State |
|
Developed Acreage |
|
|
Undeveloped Acreage |
|
|
Total Acreage |
|
|||
|
Texas |
|
|
199,596 |
|
|
|
659,780 |
|
|
|
859,376 |
|
|
Montana |
|
|
11,684 |
|
|
|
167,606 |
|
|
|
179,290 |
|
|
Louisiana |
|
|
11,148 |
|
|
|
43,708 |
|
|
|
54,856 |
|
|
Mississippi |
|
|
10,045 |
|
|
|
33,509 |
|
|
|
43,554 |
|
|
North Dakota |
|
|
18,540 |
|
|
|
18,616 |
|
|
|
37,156 |
|
|
Arkansas |
|
|
3,974 |
|
|
|
15,207 |
|
|
|
19,181 |
|
|
Wyoming |
|
|
1,360 |
|
|
|
16,840 |
|
|
|
18,200 |
|
|
New Mexico |
|
|
14,129 |
|
|
|
1,120 |
|
|
|
15,249 |
|
|
Oklahoma |
|
|
7,056 |
|
|
|
4,828 |
|
|
|
11,884 |
|
|
Kansas |
|
|
8,722 |
|
|
|
2,663 |
|
|
|
11,385 |
|
|
Other |
|
|
367 |
|
|
|
3,041 |
|
|
|
3,408 |
|
|
Total |
|
|
286,621 |
|
|
|
966,918 |
|
|
|
1,253,539 |
|
The following table sets forth information relating to our acreage for our ORRIs as of December 31, 2015:
|
State |
|
Developed Acreage |
|
|
Undeveloped Acreage |
|
|
Total Acreage |
|
|||
|
Montana |
|
|
295,969 |
|
|
|
165,676 |
|
|
|
461,645 |
|
|
Texas |
|
|
228,964 |
|
|
|
47,058 |
|
|
|
276,022 |
|
|
Wyoming |
|
|
134,234 |
|
|
|
35,100 |
|
|
|
169,334 |
|
|
Oklahoma |
|
|
158,783 |
|
|
|
— |
|
|
|
158,783 |
|
|
Utah |
|
|
40,510 |
|
|
|
28,149 |
|
|
|
68,659 |
|
|
Michigan |
|
|
55,259 |
|
|
|
919 |
|
|
|
56,178 |
|
|
New Mexico |
|
|
46,631 |
|
|
|
1,847 |
|
|
|
48,478 |
|
|
Colorado |
|
|
27,028 |
|
|
|
5,111 |
|
|
|
32,139 |
|
|
Kansas |
|
|
18,274 |
|
|
|
921 |
|
|
|
19,195 |
|
|
Louisiana |
|
|
15,264 |
|
|
|
375 |
|
|
|
15,639 |
|
|
Other |
|
|
55,467 |
|
|
|
28,769 |
|
|
|
84,236 |
|
|
Total |
|
|
1,076,383 |
|
|
|
313,925 |
|
|
|
1,390,308 |
|
20
The following table sets forth information relating to our acreage for our non-operated working interests as of December 31, 2015:
|
|
|
Developed Acreage |
|
|
Undeveloped Acreage |
|
|
Total Acreage |
|
|||||||||||||||
|
State |
|
Gross |
|
|
Net |
|
|
Gross |
|
|
Net |
|
|
Gross |
|
|
Net |
|
||||||
|
Texas |
|
|
181,541 |
|
|
|
45,882 |
|
|
|
131,157 |
|
|
|
29,017 |
|
|
|
312,698 |
|
|
|
74,899 |
|
|
Louisiana |
|
|
31,570 |
|
|
|
4,292 |
|
|
|
18,879 |
|
|
|
1,909 |
|
|
|
50,449 |
|
|
|
6,201 |
|
|
North Dakota |
|
|
42,060 |
|
|
|
6,154 |
|
|
|
8,804 |
|
|
|
990 |
|
|
|
50,864 |
|
|
|
7,144 |
|
|
Wyoming |
|
|
22,342 |
|
|
|
4,207 |
|
|
|
6,678 |
|
|
|
1,916 |
|
|
|
29,020 |
|
|
|
6,123 |
|
|
Michigan |
|
|
13,208 |
|
|
|
1,330 |
|
|
|
79 |
|
|
|
— |
|
|
|
13,287 |
|
|
|
1,330 |
|
|
Oklahoma |
|
|
11,452 |
|
|
|
3,066 |
|
|
|
90 |
|
|
|
7 |
|
|
|
11,542 |
|
|
|
3,073 |
|
|
Kansas |
|
|
6,480 |
|
|
|
6,213 |
|
|
|
921 |
|
|
|
— |
|
|
|
7,401 |
|
|
|
6,213 |
|
|
Colorado |
|
|
7,088 |
|
|
|
2,598 |
|
|
|
— |
|
|
|
— |
|
|
|
7,088 |
|
|
|
2,598 |
|
|
New Mexico |
|
|
6,038 |
|
|
|
3,615 |
|
|
|
360 |
|
|
|
89 |
|
|
|
6,398 |
|
|
|
3,704 |
|
|
South Dakota |
|
|
2,160 |
|
|
|
504 |
|
|
|
880 |
|
|
|
55 |
|
|
|
3,040 |
|
|
|
559 |
|
|
Other |
|
|
7,013 |
|
|
|
2,258 |
|
|
|
1,955 |
|
|
|
407 |
|
|
|
8,968 |
|
|
|
2,665 |
|
|
Total |
|
|
330,952 |
|
|
|
80,119 |
|
|
|
169,803 |
|
|
|
34,390 |
|
|
|
500,755 |
|
|
|
114,509 |
|
The following table lists the net undeveloped acres, the net acres expiring in the years ending December 31, 2016, 2017, and 2018, and, where applicable, the net acres expiring that are subject to extension options:
|
|
|
|
2016 Expirations |
|
|
2017 Expirations |
|
|
2018 Expirations |
|
|||||||||||||||
|
Net Undeveloped Acreage |
|
Net Acreage without Ext. Opt. |
|
|
Net Acreage with Ext. Opt. |
|
|
Net Acreage without Ext. Opt. |
|
|
Net Acreage with Ext. Opt. |
|
|
Net Acreage without Ext. Opt. |
|
|
Net Acreage with Ext. Opt. |
|
|||||||
|
|
34,390 |
|
|
5,506 |
|
|
|
195 |
|
|
|
1,745 |
|
|
|
75 |
|
|
|
437 |
|
|
|
— |
|
Drilling Results for Our Working Interests
The following table sets forth information with respect to the number of wells completed on our properties during the periods indicated. The information should not be considered indicative of future performance, nor should it be assumed that there is necessarily any correlation among the number of productive wells drilled, the quantities of reserves found, and the economic value. Productive wells are those that produce commercial quantities of hydrocarbons, whether or not they produce a reasonable rate of return.
|
|
|
For the Year Ended December 31, |
|
|||||||||
|
|
|
2015 |
|
|
2014 |
|
|
2013 |
|
|||
|
Gross development wells: |
|
|
|
|
|
|
|
|
|
|
|
|
|
Productive |
|
|
74.0 |
|
|
|
222.0 |
|
|
|
210.0 |
|
|
Dry |
|
|
1.0 |
|
|
|
1.0 |
|
|
|
— |
|
|
Total |
|
|
75.0 |
|
|
|
223.0 |
|
|
|
210.0 |
|
|
Net development wells: |
|
|
|
|
|
|
|
|
|
|
|
|
|
Productive |
|
|
2.9 |
|
|
|
7.3 |
|
|
|
7.6 |
|
|
Dry |
|
<0.1 |
|
|
|
— |
|
|
|
— |
|
|
|
Total |
|
|
2.9 |
|
|
|
7.3 |
|
|
|
7.6 |
|
|
Gross exploratory wells: |
|
|
|
|
|
|
|
|
|
|
|
|
|
Productive |
|
|
— |
|
|
|
1.0 |
|
|
|
1.0 |
|
|
Dry |
|
|
— |
|
|
|
1.0 |
|
|
|
— |
|
|
Total |
|
|
— |
|
|
|
2.0 |
|
|
|
1.0 |
|
|
Net exploratory wells: |
|
|
|
|
|
|
|
|
|
|
|
|
|
Productive |
|
|
— |
|
|
<0.1 |
|
|
|
0.1 |
|
|
|
Dry |
|
|
— |
|
|
|
— |
|
|
|
— |
|
|
Total |
|
|
— |
|
|
<0.1 |
|
|
|
0.1 |
|
|
As of December 31, 2015, we had 40 wells in the process of drilling, completing or dewatering, or shut in awaiting infrastructure that are not reflected in the above table.
21
Oil and natural gas exploration, development, and production operations are subject to stringent laws and regulations governing the discharge of materials into the environment or otherwise relating to protection of the environment or occupational health and safety. These laws and regulations have the potential to impact production on our properties, which could materially adversely affect our business and our prospects. Numerous federal, state, and local governmental agencies, such as the Environmental Protection Agency (“EPA”), issue regulations that often require compliance measures that carry substantial administrative, civil, and criminal penalties and may result in injunctive obligations for non-compliance. These laws and regulations may require the acquisition of a permit before drilling commences, restrict the types, quantities, and concentrations of various substances that can be released into the environment in connection with drilling and production activities, limit or prohibit construction or drilling activities on certain lands lying within wilderness, wetlands, ecologically sensitive, and other protected areas, require action to prevent, or remediate pollution from current or historic operations, such as plugging abandoned wells or closing earthen pits, result in the suspension or revocation of necessary permits, licenses, and authorizations, require that additional pollution controls be installed, and impose substantial liabilities for pollution resulting from operations. The strict, joint, and several liability nature of such laws and regulations could impose liability upon our operators, or us as working-interest owners if the operator fails to perform, regardless of fault. Moreover, it is not uncommon for neighboring landowners and other third parties to file claims for personal injury and property damage allegedly caused by the release of hazardous substances, hydrocarbons, or other waste products into the environment. Changes in environmental laws and regulations occur frequently, and any changes that impact our operators and result in more stringent and costly pollution control or waste handling, storage, transport, disposal, or cleanup requirements could materially adversely affect our business and prospects. Below is a summary of environmental laws applicable to our operators.
Waste Handling
The Resource Conservation and Recovery Act, as amended (“RCRA”), and comparable state statutes and regulations promulgated thereunder, affect oil and natural gas exploration, development, and production activities by imposing requirements regarding the generation, transportation, treatment, storage, disposal, and cleanup of hazardous and non-hazardous wastes. With federal approval, the individual states administer some or all of the provisions of RCRA, sometimes in conjunction with their own, more stringent requirements. Although most wastes associated with the exploration, development, and production of oil and natural gas are exempt from regulation as hazardous wastes under RCRA, these wastes typically constitute “solid wastes” that are subject to less stringent non-hazardous waste requirements. However, it is possible that RCRA could be amended or the EPA or state environmental agencies could adopt policies to require oil and natural gas exploration, development, and production wastes to become subject to more stringent waste handling requirements. Administrative, civil, and criminal penalties can be imposed for failure to comply with waste handling requirements. Any changes in the laws and regulations could have a material adverse effect on our operators’ capital expenditures and operating expenses, which in turn could affect production from our properties and adversely affect our business and prospects.
Remediation of Hazardous Substances
The Comprehensive Environmental Response, Compensation and Liability Act (“CERCLA”), also known as the “Superfund” law, and analogous state laws generally impose strict, joint, and several liability, without regard to fault or legality of the original conduct, on classes of persons who are considered to be responsible for the release of a “hazardous substance” into the environment. These persons include the current owner or operator of a contaminated facility (which can include working-interest owners), a former owner or operator of the facility at the time of contamination and those persons that disposed or arranged for the disposal of the hazardous substance at the facility. Under CERCLA and comparable state statutes, persons deemed “responsible parties” may be subject to strict and joint and several liability for the costs of removing or remediating previously disposed wastes (including wastes disposed of or released by prior owners or operators) or property contamination (including groundwater contamination), for damages to natural resources and for the costs of certain health studies. In addition, it is not uncommon for neighboring landowners and other third parties to file claims for personal injury and property damage allegedly caused by the hazardous substances released into the environment. Oil and natural gas exploration and production activities on our properties use materials that, if released, would be subject to CERCLA and comparable state statutes. Therefore, governmental agencies or third parties may seek to hold our operators, or us as working-interest owners if the operator fails to perform, responsible under CERCLA and comparable state statutes for all or part of the costs to clean-up sites at which these “hazardous substances” have been released.
Water Discharges
The Federal Water Pollution Control Act of 1972, also known as the “Clean Water Act” (“CWA”), the Safe Drinking Water Act (“SDWA”), the Oil Pollution Act (“OPA”), and analogous state laws and regulations promulgated thereunder impose restrictions and strict controls regarding the unauthorized discharge of pollutants, including produced waters and other gas and oil wastes, into navigable waters of the United States, as well as state waters. The discharge of pollutants into regulated waters is prohibited, except in accordance with the terms of a permit issued by the EPA or the state. The Clean Water Act and regulations implemented thereunder also prohibit the discharge of dredge and fill material into regulated waters, including jurisdictional wetlands, unless authorized by an appropriately issued permit. In September 2015, new EPA and U.S. Army Corps of Engineers rules defining the scope of the EPA’s and the Corps’ jurisdiction became effective. To the extent the rule expands the scope of the CWA’s jurisdiction, our operators could
22
face increased costs and delays with respect to obtaining permits for dredge and fill activities in wetland areas. The rule has been challenged in court on the grounds that it unlawfully expands the reach of CWA programs, and implementation of the rule has been stayed pending resolution of the court challenge. In addition, spill prevention, control, and countermeasure plan requirements under federal law require appropriate containment berms and similar structures to help prevent the contamination of navigable waters in the event of a petroleum hydrocarbon tank spill, rupture, or leak. The EPA has also adopted regulations requiring certain oil and natural gas exploration and production facilities to obtain individual permits or coverage under general permits for storm water discharges.
The OPA is the primary federal law for oil spill liability. The OPA contains numerous requirements relating to the prevention of and response to petroleum releases into waters of the United States, including the requirement that operators of offshore facilities and certain onshore facilities near or crossing waterways must develop and maintain facility response contingency plans and maintain certain significant levels of financial assurance to cover potential environmental cleanup and restoration costs. The OPA subjects owners of facilities to strict, joint and several liability for all containment and cleanup costs and certain other damages arising from a release, including, but not limited to, the costs of responding to a release of oil into surface waters.
Noncompliance with the Clean Water Act or the OPA may result in substantial administrative, civil, and criminal penalties, as well as injunctive obligations.
Air Emissions
The federal Clean Air Act and comparable state laws and regulations regulate emissions of various air pollutants through the issuance of permits and the imposition of other requirements. The EPA has developed, and continues to develop, stringent regulations governing emissions of air pollutants at specified sources. New facilities may be required to obtain permits before work can begin, and existing facilities may be required to obtain additional permits and incur capital costs in order to remain in compliance. For example, in August 2012, the EPA adopted new regulations under the Clean Air Act that established new emission control requirements for oil and natural gas production and processing operations. More recently, in October 2015, the EPA lowered the National Ambient Air Quality Standard, (“NAAQS”) for ozone from 75 to 70 parts per billion for both the 8-hour primary and secondary standards. State implementation of the revised NAAQS could result in stricter permitting requirements, delay or prohibit the ability of our operators to obtain such permits, and result in increased expenditures for pollution control equipment, the costs of which could be significant. These laws and regulations may increase the costs of compliance for oil and natural gas producers and impact production on our properties, and federal and state regulatory agencies can impose administrative, civil, and criminal penalties for non-compliance with air permits or other requirements of the federal Clean Air Act and associated state laws and regulations. Moreover, obtaining or renewing permits has the potential to delay the development of oil and natural gas projects.
Climate Change
In response to findings that emissions of carbon dioxide, methane, and other greenhouse gases (“GHGs”) present an endangerment to public health and the environment, the EPA has adopted regulations under existing provisions of the federal Clean Air Act that, among other things, require preconstruction and operating permits for certain large stationary sources. Facilities required to obtain preconstruction permits for their GHG emissions also will be required to meet “best available control technology” standards that will be established on a case-by-case basis. These EPA rulemakings could adversely affect operations on our properties and restrict or delay the ability of our operators to obtain air permits for new or modified sources. In addition, the EPA has adopted rules requiring the monitoring and reporting of GHG emissions from specified onshore and offshore oil and natural gas production sources in the United States on an annual basis, which include operations on certain of our properties. More recently, in December 2015, the EPA finalized rules adding new sources to the scope of the GHG monitoring and reporting rule. These new sources include gathering and boosting facilities as well as completions and workovers of hydraulically fractured wells. Also, in August 2015, the EPA announced proposed rules that would establish new air emission controls for methane emissions from certain new, modified or reconstructed equipment and processes in the oil and natural gas source category, including production, processing, transmission and storage activities, as part of an overall effort to reduce methane emissions by up to 45 percent in 2025. These rules could result in increased compliance costs for our operators and require them to make expenditures to purchase pollution control equipment. Consequently, these and other regulations related to controlling GHG emissions could have an adverse impact on our business and results of operations.
While Congress has from time to time considered legislation to reduce emissions of GHGs, there has not been significant activity in the form of adopted legislation to reduce GHG emissions at the federal level in recent years. In the absence of federal climate legislation, a number of state and regional efforts have emerged that are aimed at tracking or reducing GHG emissions by means of cap and trade programs. These programs typically require major sources of GHG emissions to acquire and surrender emission allowances in return for emitting those GHGs. Although it is not possible at this time to predict how legislation or new regulations that may be adopted to address GHG emissions would impact our business, any future laws and regulations imposing reporting obligations on, or limiting emissions of GHGs from, our operators’ equipment and operations could require them to incur costs to reduce emissions of GHGs associated with their operations. In addition, substantial limitations on GHG emissions could adversely affect demand for the oil and natural gas produced from our properties. Restrictions on emissions of methane or carbon
23
dioxide that may be imposed in various states, as well as state and local climate change initiatives, could adversely affect the oil and natural gas industry, and, at this time, it is not possible to accurately estimate how potential future laws or regulations addressing GHG emissions would impact our business. Finally, it should be noted that some scientists have concluded that increasing concentrations of GHGs in the Earth’s atmosphere may produce climate changes that have significant physical effects, such as increased frequency and severity of storms, floods, and other climatic events; if any of these effects were to occur, they could have a material adverse effect on our properties and operations.
Hydraulic Fracturing
Our operators engage in hydraulic fracturing. Hydraulic fracturing is a common practice that is used to stimulate production of hydrocarbons from tight formations, including shales. The process involves the injection of water, sand, and chemicals under pressure into formations to fracture the surrounding rock and stimulate production. The federal SDWA regulates the underground injection of substances through the Underground Injection Control (“UIC”) program. Hydraulic fracturing is generally exempt from regulation under the UIC program, and the hydraulic-fracturing process is typically regulated by state oil and natural gas commissions. The U.S. Environmental Protection Agency (“EPA”), however, has recently taken the position that hydraulic fracturing with fluids containing diesel fuel is subject to regulation under the UIC program and issued guidance in February 2014 applicable to hydraulic fracturing involving the use of diesel fuel. The EPA has also issued final regulations under the federal Clean Air Act governing performance standards, including standards for the capture of air emissions released during hydraulic fracturing; proposed in April 2015 to prohibit the discharge of wastewater from hydraulic fracturing operations to publicly owned wastewater treatment plants; and issued in May 2014 an Advanced Notice of Proposed Rulemaking seeking comment on its intent to develop regulations under the Toxic Substances Control Act to require companies to disclose information regarding the chemicals used in hydraulic fracturing. Also, the Bureau of Land Management (“BLM”) finalized rules in March 2015 that impose new or more stringent standards for performing hydraulic fracturing on federal and American Indian lands including, for example, notice to and pre approval by BLM of the proposed hydraulic fracturing activities; development and pre approval by BLM of a plan for managing and containing flowback fluids and produced water recovered during the hydraulic fracturing process; implementation of measures designed to protect usable water from hydraulic fracturing activities; and public disclosure of the chemicals used in the hydraulic fracturing fluid. The U.S. District Court of Wyoming has temporarily stayed implementation of this rule. A final decision has not yet been issued.
Several governmental reviews are underway that focus on environmental aspects of hydraulic fracturing activities. In June 2015, the EPA released its draft report on the potential impacts of hydraulic fracturing on drinking water resources, which concluded that hydraulic fracturing activities have not led to widespread, systemic impacts on drinking water sources in the United States, although there are above and below ground mechanisms by which hydraulic fracturing activities have the potential to impact drinking water sources. The draft report is expected to be finalized after a public comment period and a formal review by EPA’s Science Advisory Board. In addition, the White House Council on Environmental Quality is coordinating an administration wide review of hydraulic fracturing practices. These studies, depending on their results, could spur efforts to further regulate hydraulic fracturing.
Several states where we own interests in oil and gas producing properties, including Colorado, North Dakota, Louisiana, Oklahoma, and Texas, have adopted or are considering adopting regulations that could restrict or prohibit hydraulic fracturing in certain circumstances or require the disclosure of the composition of hydraulic-fracturing fluids. For example, in Texas, the Texas Railroad Commission (“RRC”) published a final rule in October 2014 governing permitting or re-permitting of disposal wells that requires, among other things, the submission of information on seismic events occurring within a specified radius of the disposal well location, as well as logs, geologic cross sections and structure maps relating to the disposal area in question. If the permittee or an applicant of a disposal well permit fails to demonstrate that the injected fluids are confined to the disposal zone or if scientific data indicates such a disposal well is likely to be or determined to be contributing to seismic activity, then the RRC may deny, modify, suspend or terminate the permit application or existing operating permit for that well. These existing or any new legal requirements establishing seismic permitting requirements or similar restrictions on the construction or operation of disposal wells for the injection of produced water likely will result in added costs to comply and affect our operators’ rate of production, which in turn could have a material adverse effect on our results of operations and financial position. In addition to state laws, local land use restrictions, such as city ordinances, may restrict or prohibit the performance of well drilling in general or hydraulic fracturing in particular. In the event state, local, or municipal legal restrictions are adopted in areas where our operators conduct operations, our operators may incur substantial costs to comply with these requirements, which may be significant in nature, experience delays, or curtailment in the pursuit of exploration, development, or production activities and perhaps even be precluded from the drilling of wells.
There has been increasing public controversy regarding hydraulic fracturing with regard to increased risks of induced seismicity, the use of fracturing fluids, impacts on drinking water supplies, use of water, and the potential for impacts to surface water, groundwater, and the environment generally. A number of lawsuits and enforcement actions have been initiated across the country implicating hydraulic-fracturing practices. If new laws or regulations are adopted that significantly restrict hydraulic fracturing, those laws could make it more difficult or costly for our operators to perform fracturing to stimulate production from tight formations. In addition, if hydraulic fracturing is further regulated at the federal or state level, fracturing activities on our properties could become subject to additional permitting and financial assurance requirements, more stringent construction specifications, increased monitoring, reporting and recordkeeping obligations, plugging and abandonment requirements, and also to attendant permitting delays and potential increases in costs. Legislative changes could cause operators to incur substantial compliance costs. At this time, it is not
24
possible to estimate the impact on our business of newly enacted or potential federal or state legislation governing hydraulic fracturing.
Occupational Safety and Health Act
The OSHA and comparable state laws and regulations govern the protection of the health and safety of employees. In addition, OSHA’s hazard communication standard, the Emergency Planning and Community Right to Know Act and implementing regulations, and similar state statutes and regulations require that information be maintained about hazardous materials used or produced in operations on our properties and that this information be provided to employees, state and local government authorities, and citizens.
Endangered Species
The Endangered Species Act (“ESA”) and analogous state laws restrict activities that may affect endangered or threatened species or their habitats. Some of our properties may be located in areas that are or may be designated as habitats for endangered or threatened species, and previously unprotected species may later be designated as threatened or endangered in areas where we hold mineral interests. This could cause our operators to incur increased costs arising from species protection measures, delay the completion of exploration and production activities, and/or result in limitations on operating activities that could have an adverse impact on our business.
Title to Properties
Prior to completing an acquisition of oil and natural gas properties, we perform title reviews on high-value tracts. Our title reviews are meant to confirm quantum of oil and natural gas properties acquired, lease status, and royalties as well as encumbrances and other related burdens. Depending on the materiality of properties, we may obtain a title opinion if we believe additional title due diligence is necessary. As a result, title examinations have been obtained on a significant portion of our properties. After an acquisition, we review the assignments from the seller for scrivener’s and other errors and execute and record corrective assignments as necessary.
In addition to our initial title work, our operators conduct a thorough title examination prior to leasing and drilling a well. Should our operators’ title work uncover any title defects, either we or our operators will perform curative work with respect to such defects. Our operators generally will not commence drilling operations on a property until any material title defects on such property have been cured.
We believe that the title to our assets is satisfactory in all material respects. Although title to these properties is subject to encumbrances in some cases, such as customary interests generally retained in connection with the acquisition of real property, customary royalty interests and contract terms and restrictions, liens under operating agreements, liens related to environmental liabilities associated with historical operations, liens for current taxes and other burdens, easements, restrictions, and minor encumbrances customary in the oil and natural gas industry, we believe that none of these liens, restrictions, easements, burdens, and encumbrances will materially detract from the value of these properties or from our interest in these properties or materially interfere with our use of these properties in the operation of our business. In addition, we believe that we have obtained sufficient rights-of-way grants and permits from public authorities and private parties for us to operate our business in all material respects.
Marketing and Major Customers
If we were to lose a significant customer, such loss could impact revenue derived from our mineral-and-royalty-interest or working-interest properties. The loss of any single lessee is mitigated by our diversified customer base. The following table indicates our significant customers that accounted for 10% or more of our total revenues for the periods indicated:
|
|
For the Year Ended December 31, |
|
||||||||
|
|
2015 |
|
|
2014 |
|
|
2013 |
|
||
|
Chesapeake Energy Corporation |
* |
|
|
|
10.0 |
% |
|
|
10.9 |
% |
|
* |
Accounted for less than 10% of total revenues for the period indicated. |
Competition
The oil and natural gas business is highly competitive in the exploration for and acquisition of reserves, the acquisition of minerals and oil and natural gas leases, and personnel required to find and produce reserves. Many of these companies not only explore for and produce oil and natural gas, but also carry on midstream and refining operations and market petroleum and other products on a regional, national, or worldwide basis. Certain of our competitors may possess financial or other resources substantially larger than we possess. Our ability to acquire additional minerals and properties and to discover reserves in the future will be
25
dependent upon our ability to identify and evaluate suitable acquisition prospects and to consummate transactions in a highly competitive environment. Oil and natural gas products compete with other sources of energy available to customers, primarily based on price. These alternate sources of energy include coal, nuclear, solar and wind. Changes in the availability or price of oil and natural gas or other sources of energy, as well as business conditions, conservation, legislation, regulations, and the ability to convert to alternate fuels and other sources of energy may affect the demand for oil and natural gas.
Seasonal Nature of Business
Weather conditions affect the demand for, and prices of, natural gas and can also delay drilling activities, disrupting our overall business plans. Demand for natural gas is typically higher during the winter, resulting in higher natural gas prices for our natural gas production during our first and fourth quarters. Certain natural gas users utilize natural gas storage facilities and purchase some of their anticipated winter requirements during the summer, which can lessen seasonal demand fluctuations. Seasonal weather conditions can limit drilling and producing activities and other oil and natural gas operations in a portion of our operating areas. Due to these seasonal fluctuations, our results of operations for individual quarterly periods may not be indicative of the results that we may realize on an annual basis.
Employees
We are managed and operated by the board of directors and executive officers of our general partner. All of our employees, including our executive officers, are employees of Black Stone Natural Resources Management Company (“Black Stone Management”). As of December 31, 2015, Black Stone Management had 107 full-time employees. None of Black Stone Management’s employees are represented by labor unions or covered by any collective bargaining agreements.
Facilities
Our principal office location is in Houston, Texas and consists of 58,261 square feet of leased space.
Limited partner interests are inherently different from the capital stock of a corporation, although many of the business risks to which we are subject are similar to those that would be faced by a corporation engaged in a similar business. If any of the following risks were to occur, our financial condition, results of operations, cash flows, and ability to make distributions could be materially adversely affected. In that case, we might not be able to make distributions on our common units, the trading price of our common units could decline, and holders of our units could lose all or part of their investment.
Risks Related to Our Business
We may not generate sufficient cash from operations after establishment of cash reserves to pay the minimum quarterly distribution on our common and subordinated units. If we make distributions, our preferred unitholders have priority with respect to rights to share in those distributions over our common and subordinated unitholders for so long as our preferred units are outstanding.
We may not generate sufficient cash from operations each quarter to pay the full minimum quarterly distribution to our common and subordinated unitholders. Our preferred unitholders have priority with respect to rights to share in distributions over our common and subordinated unitholders. Furthermore, our partnership agreement does not require us to pay distributions to our common and subordinated unitholders on a quarterly basis or otherwise. The amount of cash to be distributed each quarter will be determined by the board of directors of our general partner.
The amount of cash we have to distribute each quarter principally depends upon the amount of revenues we generate, which are largely dependent upon the prices that our operators realize from the sale of oil and natural gas. The actual amount of cash we will have to distribute each quarter will be reduced by principal and interest payments on our outstanding debt, working-capital requirements, and other cash needs. In addition, we may restrict distributions, in whole or in part, to fund replacement capital expenditures, acquisitions, and participation in working interests. If over the long term we do not retain cash for replacement capital expenditures in amounts necessary to maintain our asset base, a portion of future distributions will represent a return of capital and the value of our common units will be adversely affected, which will eventually cause our cash distributions per unit to decrease. Withholding cash for our capital expenditures may have an adverse impact on the cash distributions in the quarter in which amounts are withheld.
26
For a description of additional restrictions and factors that may affect our ability to make cash distributions, please read Part II, Item 5. “Market for Registrant’s Common Equity, Related Unitholder Matters and Issuer Purchases of Equity Securities—Cash Distribution Policy.”
The amount of cash we distribute to holders of our units depends primarily on our cash generated from operations and not our profitability, which may prevent us from making cash distributions during periods when we record net income.
The amount of cash we distribute depends primarily upon our cash generated from operations and not solely on profitability, which will be affected by non-cash items. As a result, we may make cash distributions during periods in which we record net losses for financial accounting purposes and may be unable to make cash distributions during periods in which we record net income.
The volatility of oil and natural gas prices due to factors beyond our control greatly affects our financial condition, results of operations, and cash distributions to unitholders.
Our revenues, operating results, cash distributions to unitholders, and the carrying value of our oil and natural gas properties depend significantly upon the prevailing prices for oil and natural gas. Historically, oil and natural gas prices have been volatile and are subject to fluctuations in response to changes in supply and demand, market uncertainty, and a variety of additional factors that are beyond our control, including:
|
|
• |
the domestic and foreign supply of and demand for oil and natural gas; |
|
|
• |
market expectations about future prices of oil and natural gas; |
|
|
• |
the level of global oil and natural gas exploration and production; |
|
|
• |
the cost of exploring for, developing, producing, and delivering oil and natural gas; |
|
|
• |
the price and quantity of foreign imports; |
|
|
• |
political and economic conditions in oil producing regions, including the Middle East, Africa, South America, and Russia; |
|
|
• |
the ability of members of the Organization of Petroleum Exporting Countries to agree to and maintain oil price and production controls; |
|
|
• |
trading in oil and natural gas derivative contracts; |
|
|
• |
the level of consumer product demand; |
|
|
• |
weather conditions and natural disasters; |
|
|
• |
technological advances affecting energy consumption; |
|
|
• |
domestic and foreign governmental regulations and taxes; |
|
|
• |
the continued threat of terrorism and the impact of military and other action, including U.S. military operations in the Middle East; |
|
|
• |
the proximity, cost, availability, and capacity of oil and natural gas pipelines and other transportation facilities; |
|
|
• |
the price and availability of alternative fuels; and |
|
|
• |
overall domestic and global economic conditions. |
These factors and the volatility of the energy markets make it extremely difficult to predict future oil and natural gas price movements with any certainty. For example, during the five years prior to December 31, 2015, the spot price for West Texas Intermediate light sweet crude oil, which we refer to as WTI has ranged from a high of $113.39 per Bbl in 2011 to a low of $34.55 per Bbl in 2015. During the same period, the Henry Hub spot market price of natural gas has ranged from a low of $1.63 in 2015 to a high of $8.15 per MMBtu in 2014. During 2015, the WTI spot price of oil ranged from $34.55 to $61.36 per Bbl and the Henry Hub spot market price of natural gas ranged from $1.63 to $3.32 per MMBtu. On December 31, 2013, the WTI spot price for oil was $98.17 per Bbl and the Henry Hub spot market price of natural gas was $4.31 per MMBtu. On December 31, 2014, the WTI spot price for oil was $53.45 per Bbl, and the Henry Hub spot market price of natural gas was $2.99 per MMBtu. On December 31, 2015, the WTI spot price for oil was $37.13 per Bbl, and the Henry Hub spot market price of natural gas was $2.28 per MMBtu.
Any prolonged substantial decline in the price of oil and natural gas will likely have a material adverse effect on our financial condition, results of operations, and cash distributions to unitholders. We may use various derivative instruments in connection with anticipated oil and natural gas sales to minimize the impact of commodity price fluctuations. However, we cannot always hedge the entire exposure of our operations from commodity price volatility. To the extent we do not hedge against commodity price volatility, or our hedges are not effective, our results of operations and financial position may be diminished.
In addition, lower oil and natural gas prices may also reduce the amount of oil and natural gas that can be produced economically by our operators. This scenario may result in our having to make substantial downward adjustments to our estimated
27
proved reserves, which could negatively impact our borrowing base and our ability to fund our operations. If this occurs or if production estimates change or exploration or development results deteriorate, successful efforts method of accounting principles may require us to write down, as a non-cash charge to earnings, the carrying value of our oil and natural gas properties. Our operators could also determine during periods of low commodity prices to shut in or curtail production from wells on our properties. In addition, they could determine during periods of low commodity prices to plug and abandon marginal wells that otherwise may have been allowed to continue to produce for a longer period under conditions of higher prices. Specifically, they may abandon any well if they reasonably believe that the well can no longer produce oil or natural gas in commercially paying quantities.
Oil prices have declined substantially from historical highs and may remain depressed for the foreseeable future. Approximately 58.5% of our 2015 oil and natural gas revenues were derived from oil and condensate sales. Any additional decreases in prices of oil may adversely affect our cash generated from operations, results of operations, financial position, and our ability to pay the minimum quarterly distribution on all of our outstanding common and subordinated units, perhaps materially.
The spot WTI market price at Cushing, Oklahoma has declined from $98.17 per Bbl on December 31, 2013 to $37.13 per Bbl on December 31, 2015. The reduction in price has been caused by many factors, including substantial increases in U.S. oil production from unconventional (shale) reservoirs, with limited increases in demand. The International Energy Agency (“IEA”) forecasts global demand growth to ease back considerably in 2016 to 1.2 million Bbl/d from a five-year high of 1.6 million Bbl/d in 2015. This environment could cause prices for oil to remain at current levels or to fall to lower levels. If prices for oil continue to remain depressed for lengthy periods, we may be required to further write down the value of our oil and natural gas properties in addition to impairments taken during 2015, and some of our undeveloped locations may no longer be economically viable. In addition, sustained low prices for oil will continue to negatively impact the value of our estimated proved reserves and the amount that we are allowed to borrow under our bank credit facility and reduce the amounts of cash we would otherwise have available to pay expenses, fund capital expenditures, make distributions to our unitholders, and service our indebtedness.
Natural gas prices have declined substantially from historical highs and are expected to remain depressed for the foreseeable future. Approximately 65.9% of our 2015 total production was natural gas, on a “Btu-equivalent” basis. Any additional decreases in prices of natural gas may adversely affect our cash generated from operations, results of operations, financial position, and our ability to pay the minimum quarterly distribution on all of our outstanding common and subordinated units, perhaps materially.
During the eight years prior to December 31, 2015, natural gas prices at Henry Hub have ranged from a high of $13.31 per MMBtu in 2008 to a low of $1.63 per MMBtu in 2015. On December 31, 2015, the Henry Hub spot market price of natural gas was $2.28 per MMBtu. The reduction in prices has been caused by many factors, including increases in natural gas production from unconventional (shale) reservoirs, without an offsetting increase in demand. The expected increase in natural gas production, based on reports from the EIA, could cause the prices for natural gas to remain at current levels or fall to lower levels. If prices for natural gas continue to remain depressed for lengthy periods, we may be required to further write down the value of our oil and natural gas properties in addition to impairments taken during 2015, and some of our undeveloped locations may no longer be economically viable. In addition, sustained low prices for natural gas will continue to negatively impact the value of our estimated proved reserves and the amount that we are allowed to borrow under our bank credit facility and reduce the amounts of cash we would otherwise have available to pay expenses, make distributions to our unitholders, and service our indebtedness.
Our failure to successfully identify, complete, and integrate acquisitions could adversely affect our growth, results of operations, and cash distributions to unitholders.
We depend partly on acquisitions to grow our reserves, production, and cash generated from operations. Our decision to acquire a property will depend in part on the evaluation of data obtained from production reports and engineering studies, geophysical and geological analyses and seismic data, and other information, the results of which are often inconclusive and subject to various interpretations. The successful acquisition of properties requires an assessment of several factors, including:
|
|
• |
recoverable reserves; |
|
|
• |
future oil and natural gas prices and their applicable differentials; |
|
|
• |
development plans; |
|
|
• |
operating costs; and |
|
|
• |
potential environmental and other liabilities. |
The accuracy of these assessments is inherently uncertain and we may not be able to identify attractive acquisition opportunities. In connection with these assessments, we perform a review of the subject properties that we believe to be generally consistent with industry practices. Our review will not reveal all existing or potential problems nor will it permit us to become sufficiently familiar with the properties to assess fully their deficiencies and capabilities. Inspections may not always be performed on every well, if applicable, and environmental problems, such as groundwater contamination, are not necessarily observable even when an inspection is undertaken. Even when problems are identified, the seller may be unwilling or unable to provide effective contractual protection
28
against all or part of the problems. Even if we do identify attractive acquisition opportunities, we may not be able to complete the acquisition or do so on commercially acceptable terms.
There is intense competition for acquisition opportunities in our industry. Competition for acquisitions may increase the cost of, or cause us to refrain from, completing acquisitions. Our ability to complete acquisitions is dependent upon, among other things, our ability to obtain financing. In addition, compliance with regulatory requirements may impose substantial additional obligations on our operators, causing them to expend additional time and resources in compliance activities, and potentially increase our operators’ exposure to penalties or fines for non-compliance with additional legal requirements. Further, the process of integrating acquired assets may involve unforeseen difficulties and may require a disproportionate amount of our managerial and financial resources.
No assurance can be given that we will be able to identify suitable acquisition opportunities, negotiate acceptable terms, obtain financing for acquisitions on acceptable terms, or successfully acquire identified targets. Our failure to achieve consolidation savings, to integrate the acquired businesses and assets into our existing operations successfully, or to minimize any unforeseen operational difficulties could have a material adverse effect on our financial condition, results of operations, and cash distributions to unitholders. The inability to effectively manage the integration of acquisitions could reduce our focus on subsequent acquisitions and current operations, which, in turn, could negatively impact our growth, results of operations, and cash distributions to unitholders.
Any acquisitions of additional mineral and royalty interests that we complete will be subject to substantial risks.
Even if we do make acquisitions that we believe will increase our cash generated from operations, these acquisitions may nevertheless result in a decrease in our cash distributions per unit. Any acquisition involves potential risks, including, among other things:
|
|
• |
the validity of our assumptions about estimated proved reserves, future production, prices, revenues, capital expenditures, operating expenses, and costs; |
|
|
• |
a decrease in our liquidity by using a significant portion of our cash generated from operations or borrowing capacity to finance acquisitions; |
|
|
• |
a significant increase in our interest expense or financial leverage if we incur debt to finance acquisitions; |
|
|
• |
the assumption of unknown liabilities, losses, or costs for which we are not indemnified or for which any indemnity we receive is inadequate; |
|
|
• |
mistaken assumptions about the overall cost of equity or debt; |
|
|
• |
our ability to obtain satisfactory title to the assets we acquire; |
|
|
• |
an inability to hire, train, or retain qualified personnel to manage and operate our growing business and assets; and |
|
|
• |
the occurrence of other significant changes, such as impairment of oil and natural gas properties, goodwill or other intangible assets, asset devaluation, or restructuring charges. |
We depend on various unaffiliated operators for all of the exploration, development, and production on the properties underlying our mineral and royalty interests and non-operated working interests. Substantially all of our revenue is derived from the sale of oil and natural gas production from producing wells in which we own a royalty interest or a non-operated working interest. A reduction in the expected number of wells to be drilled on our acreage by these operators or the failure of our operators to adequately and efficiently develop and operate our acreage could have an adverse effect on our results of operations.
Our assets consist of mineral and royalty interests and non-operated working interests. For the year ended December 31, 2015, we received revenue from over 1,000 operators. The failure of our operators to adequately or efficiently perform operations or an operator’s failure to act in ways that are in our best interests could reduce production and revenues. Our operators are often not obligated to undertake any development activities other than those required to maintain their leases on our acreage. In the absence of a specific contractual obligation, any development and production activities will be subject to their reasonable discretion. Our operators could determine to drill and complete fewer wells on our acreage than is currently expected. The success and timing of drilling and development activities on our properties, and whether the operators elect to drill any additional wells on our acreage, depends on a number of factors that will be largely outside of our control, including:
|
|
• |
the capital costs required for drilling activities by our operators, which could be significantly more than anticipated; |
|
|
• |
the ability of our operators to access capital; |
|
|
• |
prevailing commodity prices; |
|
|
• |
the availability of suitable drilling equipment, production and transportation infrastructure, and qualified operating personnel; |
|
|
• |
the operators’ expertise, operating efficiency, and financial resources; |
|
|
• |
approval of other participants in drilling wells; |
29
|
|
• |
the operators’ expected return on investment in wells drilled on our acreage as compared to opportunities in other areas; |
|
|
• |
the selection of technology; |
|
|
• |
the selection of counterparties for the marketing and sale of production; and |
|
|
• |
the rate of production of the reserves. |
The operators may elect not to undertake development activities, or may undertake these activities in an unanticipated fashion, which may result in significant fluctuations in our results of operations and cash distributions to our unitholders. Sustained reductions in production by the operators on our properties may also adversely affect our results of operations and cash distributions to unitholders.
We may experience delays in the payment of royalties and be unable to replace operators that do not make required royalty payments, and we may not be able to terminate our leases with defaulting lessees if any of the operators on those leases declare bankruptcy.
A failure on the part of the operators to make royalty payments gives us the right to terminate the lease, repossess the property, and enforce payment obligations under the lease. If we repossessed any of our properties, we would seek a replacement operator. However, we might not be able to find a replacement operator and, if we did, we might not be able to enter into a new lease on favorable terms within a reasonable period of time. In addition, the outgoing operator could be subject to a proceeding under title 11 of the United States Code (the “Bankruptcy Code”), in which case our right to enforce or terminate the lease for any defaults, including non-payment, may be substantially delayed or otherwise impaired. In general, in a proceeding under the Bankruptcy Code, the bankrupt operator would have a substantial period of time to decide whether to ultimately reject or assume the lease, which could prevent the execution of a new lease or the assignment of the existing lease to another operator. In the event that the operator rejected the lease, our ability to collect amounts owed would be substantially delayed, and our ultimate recovery may be only a fraction of the amount owed or nothing. In addition, if we are able to enter into a new lease with a new operator, the replacement operator may not achieve the same levels of production or sell oil or natural gas at the same price as the operator it replaced.
Acquisitions, funding our working-interest participation program, and our operators’ development activities of our leases will require substantial capital, and we and our operators may be unable to obtain needed capital or financing on satisfactory terms or at all.
The oil and natural gas industry is capital intensive. We make and expect to continue to make substantial capital expenditures in connection with the acquisition of mineral and royalty interests and participation in our working-interest participation program. To date, we have financed capital expenditures primarily with funding from cash generated by operations, limited borrowings under our credit facility, and an issuance of equity securities.
In the future, we may restrict distributions to fund acquisitions and participation in our working interests but eventually we may need capital in excess of the amounts we retain in our business or borrow under our credit facility. We cannot assure you that we will be able to access external capital on terms favorable to us or at all. If we are unable to fund our capital requirements, we may be unable to complete acquisitions, take advantage of business opportunities, or respond to competitive pressures, any of which could have a material adverse effect on our results of operation and cash distributions to unitholders.
Most of our operators are also dependent on the availability of external debt and equity financing sources to maintain their drilling programs. If those financing sources are not available to the operators on favorable terms or at all, then we expect the development of our properties to be adversely affected. If the development of our properties is adversely affected, then revenues from our mineral and royalty interests and non-operated working interests may decline.
Unless we replace the oil and natural gas produced from our properties, our cash generated from operations and our ability to make distributions to our common and subordinated unitholders could be adversely affected.
Producing oil and natural gas wells are characterized by declining production rates that vary depending upon reservoir characteristics and other factors. Our future oil and natural gas reserves and our operators’ production thereof and our cash generated from operations and ability to make distributions are highly dependent on the successful development and exploitation of our current reserves. The production decline rates of our properties may be significantly higher than currently estimated if the wells on our properties do not produce as expected. We may also not be able to find, acquire, or develop additional reserves to replace the current and future production of our properties at economically acceptable terms, which would adversely affect our business, financial condition, results of operations, and cash distributions to our common and subordinated unitholders.
We either have little or no control over the timing of future drilling with respect to our mineral and royalty interests and non-operated working interests.
Our proved undeveloped reserves may not be developed or produced. Recovery of proved undeveloped reserves requires significant capital expenditures and successful drilling operations, and the decision to pursue development of a proved undeveloped
30
drilling location will be made by the operator and not by us. The reserve data included in the reserve report of our engineer assume that substantial capital expenditures are required to develop the reserves. We cannot be certain that the estimated costs of the development of these reserves are accurate, that development will occur as scheduled or that the results of the development will be as estimated. Delays in the development of our reserves, increases in costs to drill and develop our reserves, or decreases in commodity prices will reduce the future net revenues of our estimated proved undeveloped reserves and may result in some projects becoming uneconomical. In addition, delays in the development of reserves could force us to reclassify certain of our undeveloped reserves as unproved reserves.
Project areas on our properties, which are in various stages of development, may not yield oil or natural gas in commercially viable quantities.
Project areas on our properties are in various stages of development, ranging from project areas with current drilling or production activity to project areas that have limited drilling or production history. If the wells in the process of being completed do not produce sufficient revenues or if dry holes are drilled, our financial condition, results of operations, and cash distributions to unitholders may be adversely affected.
Our operators’ identified potential drilling locations are susceptible to uncertainties that could materially alter the occurrence or timing of their drilling.
The ability of our operators to drill and develop identified potential drilling locations depends on a number of uncertainties, including the availability of capital, construction of infrastructure, inclement weather, regulatory changes and approvals, oil and natural gas prices, costs, drilling results, and the availability of water. Further, our operators’ identified potential drilling locations are in various stages of evaluation, ranging from locations that are ready to drill to locations that will require substantial additional interpretation. The use of technologies and the study of producing fields in the same area will not enable our operators to know conclusively prior to drilling whether oil or natural gas will be present or, if present, whether oil or natural gas will be present in sufficient quantities to be economically viable. Even if sufficient amounts of oil or natural gas exist, our operators may damage the potentially productive hydrocarbon-bearing formation or experience mechanical difficulties while drilling or completing the well, possibly resulting in a reduction in production from the well or abandonment of the well. If our operators drill additional wells that they identify as dry holes in current and future drilling locations, their drilling success rate may decline and materially harm their business as well as ours.
We cannot assure you that the analogies our operators draw from available data from the wells on our acreage, more fully explored locations, or producing fields will be applicable to their drilling locations. Further, initial production rates reported by our or other operators in the areas in which our reserves are located may not be indicative of future or long-term production rates. Because of these uncertainties, we do not know if the potential drilling locations our operators have identified will ever be drilled or if our operators will be able to produce oil or natural gas from these or any other potential drilling locations. As such, the actual drilling activities of our operators may materially differ from those presently identified, which could adversely affect our business, results of operation, and cash distributions to unitholders.
The unavailability, high cost, or shortages of rigs, equipment, raw materials, supplies, or personnel may restrict or result in increased costs for operators related to developing and operating our properties.
The oil and natural gas industry is cyclical, which can result in shortages of drilling rigs, equipment, raw materials (particularly sand and other proppants), supplies, and personnel. When shortages occur, the costs and delivery times of rigs, equipment, and supplies increase and demand for, and wage rates of, qualified drilling rig crews also rise with increases in demand. In accordance with customary industry practice, our operators rely on independent third-party service providers to provide many of the services and equipment necessary to drill new wells. If our operators are unable to secure a sufficient number of drilling rigs at reasonable costs, our financial condition and results of operations could suffer. Shortages of drilling rigs, equipment, raw materials (particularly sand and other proppants), supplies, personnel, trucking services, tubulars, fracking and completion services, and production equipment could delay or restrict our operators’ exploration and development operations, which in turn could have a material adverse effect on our financial condition, results of operations, and cash distributions to unitholders.
The marketability of oil and natural gas production is dependent upon transportation, pipelines, and refining facilities, which neither we nor many of our operators control. Any limitation in the availability of those facilities could interfere with our or our operators’ ability to market our or our operators’ production and could harm our business.
The marketability of our or our operators’ production depends in part on the availability, proximity, and capacity of pipelines, tanker trucks, and other transportation methods, and processing and refining facilities owned by third parties. The amount of oil that can be produced and sold is subject to curtailment in certain circumstances, such as pipeline interruptions due to scheduled and unscheduled maintenance, excessive pressure, physical damage, or lack of available capacity on these systems, tanker truck availability, and extreme weather conditions. Also, the shipment of our or our operators’ oil and natural gas on third-party pipelines may be curtailed or delayed if it does not meet the quality specifications of the pipeline owners. The curtailments arising from these and similar circumstances may last from a few days to several months. In many cases, we or our operators are provided only with
31
limited, if any, notice as to when these circumstances will arise and their duration. Any significant curtailment in gathering system or transportation, processing, or refining-facility capacity could reduce our or our operators’ ability to market oil production and have a material adverse effect on our financial condition, results of operations, and cash distributions to unitholders. Our or our operators’ access to transportation options and the prices we or our operators receive can also be affected by federal and state regulation—including regulation of oil production, transportation, and pipeline safety—as well by general economic conditions and changes in supply and demand. In addition, the third parties on whom we or our operators rely for transportation services are subject to complex federal, state, tribal, and local laws that could adversely affect the cost, manner, or feasibility of conducting our business.
Our estimated reserves are based on many assumptions that may turn out to be inaccurate. Any material inaccuracies in these reserve estimates or underlying assumptions will materially affect the quantities and present value of our reserves.
Oil and natural gas reserve engineering is not an exact science and requires subjective estimates of underground accumulations of oil and natural gas and assumptions concerning future oil and natural gas prices, production levels, ultimate recoveries, and operating and development costs. As a result, estimated quantities of proved reserves, projections of future production rates, and the timing of development expenditures may be incorrect. Our estimates of proved reserves and related valuations as of December 31, 2015 were prepared by NSAI, a third-party petroleum engineering firm, which conducted a detailed review of all of our properties for the period covered by its reserve report using information provided by us. Over time, we may make material changes to reserve estimates taking into account the results of actual drilling, testing, and production. Also, certain assumptions regarding future oil and natural gas prices, production levels, and operating and development costs may prove incorrect. Any significant variance from these assumptions to actual figures could greatly affect our estimates of reserves and future cash generated from operations. Numerous changes over time to the assumptions on which our reserve estimates are based, as described above, often result in the actual quantities of oil and natural gas that are ultimately recovered being different from our reserve estimates.
The estimates of reserves as of December 31, 2015 were prepared using an average price equal to the unweighted arithmetic average of hydrocarbon prices received on a field-by-field basis on the first day of each month within the year ended December 31, 2015 in accordance with the SEC guidelines applicable to reserve estimates for those periods. Reserve estimates do not include any value for probable or possible reserves that may exist, nor do they include any value for unproved undeveloped acreage.
Conservation measures and technological advances could reduce demand for oil and natural gas.
Fuel conservation measures, alternative fuel requirements, increasing consumer demand for alternatives to oil and natural gas, technological advances in fuel economy, and energy-generation devices could reduce demand for oil and natural gas. The impact of the changing demand for oil and natural gas services and products may have a material adverse effect on our business, financial condition, results of operations, and cash distributions to unitholders.
We rely on a few key individuals whose absence or loss could adversely affect our business.
Many key responsibilities within our business have been assigned to a small number of individuals. The loss of their services could adversely affect our business. In particular, the loss of the services of one or more members of our executive team could disrupt our business. Further, we do not maintain “key person” life insurance policies on any of our executive team or other key personnel. As a result, we are not insured against any losses resulting from the death of these key individuals.
The results of exploratory drilling in shale plays will be subject to risks associated with drilling and completion techniques and drilling results may not meet our expectations for reserves or production.
Our operators use the latest drilling and completion techniques in their operations, and these techniques come with inherent risks. When drilling horizontal wells, operators risk not landing the well bore in the desired drilling zone and straying from the desired drilling zone. When drilling horizontally through a formation, operators risk being unable to run casing through the entire length of the well bore and being unable to run tools and other equipment consistently through the horizontal well bore. Risks that our operators face while completing wells include being unable to fracture stimulate the planned number of stages, to run tools the entire length of the well bore during completion operations, and to clean out the well bore after completion of the final fracture stimulation stage. In addition, to the extent our operators engage in horizontal drilling, those activities may adversely affect their ability to successfully drill in identified vertical drilling locations. Furthermore, certain of the new techniques that our operators may adopt, such as infill drilling and multi-well pad drilling, may cause irregularities or interruptions in production due to, in the case of infill drilling, offset wells being shut in and, in the case of multi-well pad drilling, the time required to drill and complete multiple wells before these wells begin producing. The results of drilling in new or emerging formations are more uncertain initially than drilling results in areas that are more developed and have a longer history of established production. Newer or emerging formations and areas often have limited or no production history and consequently our operators will be less able to predict future drilling results in these areas.
Ultimately, the success of these drilling and completion techniques can only be evaluated over time as more wells are drilled and production profiles are established over a sufficiently long time period. If our operators’ drilling results are weaker than anticipated or they are unable to execute their drilling program on our properties, our operating and financial results in these areas may be lower than we anticipate. Further, as a result of any of these developments we could incur material write-downs of our oil and
32
natural gas properties and the value of our undeveloped acreage could decline, and our results of operations and cash distributions to unitholders could be adversely affected.
Oil and natural gas operations are subject to various governmental laws and regulations. Compliance with these laws and regulations can be burdensome and expensive, and failure to comply could result in significant liabilities, which could reduce cash distributions to our unitholders.
Operations on the properties in which we hold interests are subject to various federal, state, and local governmental regulations that may be changed from time to time in response to economic and political conditions. Matters subject to regulation include drilling operations, production and distribution activities, discharges or releases of pollutants or wastes, plugging and abandonment of wells, maintenance and decommissioning of other facilities, the spacing of wells, unitization and pooling of properties, and taxation. From time to time, regulatory agencies have imposed price controls and limitations on production by restricting the rate of flow of oil and natural gas wells below actual production capacity to conserve supplies of oil and natural gas. In addition, the production, handling, storage and transportation of oil and natural gas, as well as the remediation, emission, and disposal of oil and natural gas wastes, by-products thereof, and other substances and materials produced or used in connection with oil and natural gas operations are subject to regulation under federal, state, and local laws and regulations primarily relating to protection of worker health and safety, natural resources, and the environment. Failure to comply with these laws and regulations may result in the assessment of sanctions, including administrative, civil, or criminal penalties, permit revocations, requirements for additional pollution controls, and injunctions limiting or prohibiting some or all of the operations on our properties. Moreover, these laws and regulations have continually imposed increasingly strict requirements for water and air pollution control and solid waste management.
Laws and regulations governing exploration and production may also affect production levels. Our operators must comply with federal and state laws and regulations governing conservation matters, including:
|
|
• |
provisions related to the unitization or pooling of the oil and natural gas properties; |
|
|
• |
the establishment of maximum rates of production from wells; |
|
|
• |
the spacing of wells; |
|
|
• |
the plugging and abandonment of wells; and |
|
|
• |
the removal of related production equipment. |
Additionally, federal and state regulatory authorities may expand or alter applicable pipeline-safety laws and regulations, compliance with which may require increased capital costs for third-party oil and natural gas transporters. These transporters may attempt to pass on such costs to our operators, which in turn could affect profitability on the properties in which we own mineral and royalty interests.
Our operators must also comply with laws and regulations prohibiting fraud and market manipulations in energy markets. To the extent the operators of our properties are shippers on interstate pipelines, they must comply with the tariffs of those pipelines and with federal policies related to the use of interstate capacity.
Our operators may be required to make significant expenditures to comply with the governmental laws and regulations described above. We believe the trend of more expansive and stricter environmental legislation and regulations will continue. Please read Part I, Items 1 and 2. “Business and Properties—Environmental Matters” for a description of the laws and regulations that affect our operators and that may affect us. These and other potential regulations could increase the operating costs of our operators and delay production, which could reduce the amount of cash distributions to our unitholders.
Louisiana mineral servitudes are subject to reversion to the surface owner after ten years’ nonuse.
We own mineral servitudes covering several hundred thousand acres in Louisiana. A mineral servitude is created in Louisiana when the mineral rights are separated from the ownership of the surface, whether by sale or reservation. These mineral servitudes, once created, are subject to a ten-year prescription of nonuse. During the ten-year period, the mineral-servitude owner has to conduct good-faith operations on the servitude for the discovery and production of minerals, or the mineral servitude “prescribes,” and the mineral rights associated with that servitude revert to the surface owner. A good-faith operation for the discovery and production of minerals, even one resulting in a dry hole, conducted within the ten-year period will interrupt the prescription of nonuse and restart the running of the ten-year prescriptive period. If the operation results in production, prescription is interrupted as long as the production continues or operations are conducted in good faith to secure or restore production. If any of our mineral servitudes are prescribed by operation of Louisiana law, our operating results may be adversely affected.
33
Federal and state legislative and regulatory initiatives relating to hydraulic fracturing could result in increased costs, additional operating restrictions or delays, and fewer potential drilling locations.
Our operators engage in hydraulic fracturing. Hydraulic fracturing is a common practice that is used to stimulate production of hydrocarbons, particularly natural gas, from tight formations, including shales. The process involves the injection of water, sand, and chemicals under pressure into formations to fracture the surrounding rock and stimulate production. The federal Safe Drinking Water Act (“SDWA”) regulates the underground injection of substances through the Underground Injection Control (“UIC”) program. Hydraulic fracturing is generally exempt from regulation under the UIC program, and the hydraulic-fracturing process is typically regulated by state oil and natural gas commissions. The U.S. Environmental Protection Agency (“EPA”), however, has recently taken the position that hydraulic fracturing with fluids containing diesel fuel is subject to regulation under the UIC program and issued guidance in February 2014 applicable to hydraulic fracturing involving the use of diesel fuel. The EPA has also issued final regulations under the federal Clean Air Act governing performance standards, including standards for the capture of air emissions released during hydraulic fracturing; proposed in April 2015 to prohibit the discharge of wastewater from hydraulic fracturing operations to publicly owned wastewater treatment plants; and issued in May 2015 an Advanced Notice of Proposed Rulemaking seeking comment on its intent to develop regulations under the Toxic Substances Control Act to require companies to disclose information regarding the chemicals used in hydraulic fracturing. Also, the Bureau of Land Management (“BLM”) finalized rules in March 2015 that impose new or more stringent standards for performing hydraulic fracturing on federal and American Indian lands including, for example, notice to and pre‑approval by BLM of the proposed hydraulic fracturing activities; development and pre‑approval by BLM of a plan for managing and containing flowback fluids and produced water recovered during the hydraulic fracturing process; implementation of measures designed to protect usable water from hydraulic fracturing activities; and public disclosure of the chemicals used in the hydraulic fracturing fluid. The U.S. District Court of Wyoming has temporarily stayed implementation of this rule. A final decision has not yet been issued.
Several governmental reviews are underway that focus on environmental aspects of hydraulic fracturing activities. In June 2015, the EPA released its draft report on the potential impacts of hydraulic fracturing on drinking water resources, which concluded that hydraulic fracturing activities have not led to widespread, systemic impacts on drinking water sources in the United States, although there are above and below ground mechanisms by which hydraulic fracturing activities have the potential to impact drinking water sources. The draft report is expected to be finalized after a public comment period and a formal review by EPA’s Science Advisory Board. In addition, the White House Council on Environmental Quality is coordinating an administration‑wide review of hydraulic fracturing practices. These studies, depending on their results, could spur efforts to further regulate hydraulic fracturing.
Several states, including Colorado, North Dakota, Louisiana, Oklahoma, and Texas, where we own interests in oil and natural gas producing properties, have adopted or are considering adopting regulations that could restrict or prohibit hydraulic fracturing in certain circumstances or require the disclosure of the composition of hydraulic-fracturing fluids. For example, in Texas, the Texas Railroad Commission (“RRC”) published a final rule in October 2014 governing permitting or re-permitting of disposal wells that require, among other things, the submission of information on seismic events occurring within a specified radius of the disposal well location, as well as logs, geologic cross sections and structure maps relating to the disposal area in question. If the permittee or an applicant of a disposal well permit fails to demonstrate that the injected fluids are confined to the disposal zone or if scientific data indicates such a disposal well is likely to be or determined to be contributing to seismic activity, then the RRC may deny, modify, suspend, or terminate the permit application or existing operating permit for that well. These existing or any new legal requirements establishing seismic permitting requirements or similar restrictions on the construction or operation of disposal wells for the injection of produced water likely will result in added costs to comply and affect our operators’ rate of production, which in turn could have a material adverse effect on our results of operations and financial position. In addition to state laws, local land use restrictions, such as city ordinances, may restrict or prohibit the performance of well drilling in general or hydraulic fracturing in particular. In the event state, local, or municipal legal restrictions are adopted in areas where our operators conduct operations, our operators may incur substantial costs to comply with these requirements, which may be significant in nature, experience delays, or curtailment in the pursuit of exploration, development, or production activities and perhaps even be precluded from the drilling of wells.
There has been increasing public controversy regarding hydraulic fracturing with regard to increased risks of induced seismicity, the use of fracturing fluids, impacts on drinking water supplies, use of water, and the potential for impacts to surface water, groundwater, and the environment generally. A number of lawsuits and enforcement actions have been initiated across the country implicating hydraulic-fracturing practices. If new laws or regulations are adopted that significantly restrict hydraulic fracturing, those laws could make it more difficult or costly for our operators to perform fracturing to stimulate production from tight formations. In addition, if hydraulic fracturing is further regulated at the federal or state level, fracturing activities on our properties could become subject to additional permitting and financial assurance requirements, more stringent construction specifications, increased monitoring, reporting and recordkeeping obligations, plugging and abandonment requirements, and also to attendant permitting delays and potential increases in costs. Legislative changes could cause operators to incur substantial compliance costs. At this time, it is not possible to estimate the impact on our business of newly enacted or potential federal or state legislation governing hydraulic fracturing.
34
Our credit facility has substantial restrictions and financial covenants that may restrict our business and financing activities and our ability to pay distributions.
Our credit facility limits the amounts we can borrow to a borrowing base amount, as determined by the lenders at their sole discretion based on their valuation of our proved reserves and their internal criteria. The borrowing base is redetermined at least semi-annually, and the available borrowing amount could be further decreased as a result of such redeterminations. Decreases in the available borrowing amount could result from declines in oil and natural gas prices, operating difficulties or increased costs, declines in reserves, lending requirements, or regulations or certain other circumstances. As of December 31, 2015, we had outstanding borrowings of $66.0 million and the aggregate maximum credit amounts of the lenders were $1.0 billion. Our borrowing base determined by the lenders under our credit facility in October 2015 is $550.0 million and the next semi-annual redetermination is scheduled for April 2016. A future decrease in our borrowing base could be substantial and could be to a level below our then-outstanding borrowings. Outstanding borrowings in excess of the borrowing base are required to be repaid in five equal monthly payments, or we are required to pledge other oil and natural gas properties as additional collateral, within 30 days following notice from the administrative agent of the new or adjusted borrowing base. If we do not have sufficient funds on hand for repayment, we may be required to seek a waiver or amendment from our lenders, refinance our credit facility, or sell assets, debt, or common units. We may not be able to obtain such financing or complete such transactions on terms acceptable to us or at all. Failure to make the required repayment could result in a default under our credit facility, which could materially adversely affect our business, financial condition, results of operations, and distributions to our unitholders.
The operating and financial restrictions and covenants in our credit facility restrict, and any future financing agreements likely will restrict, our ability to finance future operations or capital needs, engage, expand, or pursue our business activities, or pay distributions. Our credit facility restricts, and any future credit facility likely will restrict, our ability to:
|
|
• |
incur indebtedness; |
|
|
• |
grant liens; |
|
|
• |
make certain acquisitions and investments; |
|
|
• |
enter into hedging arrangements; |
|
|
• |
enter into transactions with our affiliates; |
|
|
• |
make distributions to our unitholders; or |
|
|
• |
enter into a merger, consolidation, or sale of assets. |
Our credit facility restricts our ability to make distributions to unitholders or to repurchase units unless after giving effect to such distribution or repurchase, there is no event of default under our credit facility and our outstanding borrowings are not in excess of our borrowing base. While we currently are not restricted by our credit facility from declaring a distribution, we may be restricted from paying a distribution in the future.
We also are required to comply with certain financial covenants and ratios under the credit facility. Our ability to comply with these restrictions and covenants in the future is uncertain and will be affected by the levels of cash flow from our operations and events or circumstances beyond our control, such as reduced oil and natural gas prices. If we violate any of the restrictions, covenants, ratios, or tests in our credit facility, a significant portion of our indebtedness may become immediately due and payable, our ability to make distributions will be inhibited, and our lenders’ commitment to make further loans to us may terminate. We might not have, or be able to obtain, sufficient funds to make these accelerated payments. In addition, our obligations under our credit facility are secured by substantially all of our assets, and if we are unable to repay our indebtedness under our credit facility, the lenders can seek to foreclose on our assets.
The adoption of climate change legislation by Congress could result in increased operating costs and reduced demand for the oil and natural gas that our operators produce.
In response to findings that emissions of carbon dioxide, methane, and other greenhouse gases (“GHGs”) present an endangerment to public health and the environment, the EPA has adopted regulations under existing provisions of the federal Clean Air Act that, among other things, require preconstruction and operating permits for certain large stationary sources. Facilities required to obtain preconstruction permits for their GHG emissions also will be required to meet “best available control technology” standards that will be established on a case-by-case basis. These EPA rulemakings could adversely affect operations on our properties and restrict or delay the ability of our operators to obtain air permits for new or modified sources. In addition, the EPA has adopted rules requiring the monitoring and reporting of GHG emissions from specified onshore and offshore oil and natural gas production sources in the United States on an annual basis, which include operations on certain of our properties. More recently, in December 2015, the EPA finalized rules added new sources to the scope of the GHG monitoring and reporting rule. These new sources include gathering and boosting facilities as well as completions and workovers of hydraulically fractured wells. Also, in August 2015, the EPA announced proposed rules that would establish new air emission controls for methane emissions from certain new, modified, or
35
reconstructed equipment and processes in the oil and natural gas source category, including production, processing, transmission, and storage activities, as part of an overall effort to reduce methane emissions by up to 45% in 2025. These rules could result in increased compliance costs for our operators and require them to make expenditures to purchase pollution control equipment. Consequently, these and other regulations related to controlling GHG emissions could have an adverse impact on our business and results of operations.
While Congress has from time to time considered legislation to reduce emissions of GHGs, there has not been significant activity in the form of adopted legislation to reduce GHG emissions at the federal level in recent years. In the absence of federal climate legislation, a number of state and regional efforts have emerged that are aimed at tracking or reducing GHG emissions by means of cap and trade programs. These programs typically require major sources of GHG emissions to acquire and surrender emission allowances in return for emitting those GHGs. Although it is not possible at this time to predict how legislation or new regulations that may be adopted to address GHG emissions would impact our business, any future laws and regulations imposing reporting obligations on, or limiting emissions of GHGs from, our operators’ equipment and operations could require them to incur costs to reduce emissions of GHGs associated with their operations. In addition, substantial limitations on GHG emissions could adversely affect demand for the oil and natural gas produced from our properties. Restrictions on emissions of methane or carbon dioxide that may be imposed in various states, as well as state and local climate change initiatives, could adversely affect the oil and natural gas industry, and, at this time, it is not possible to accurately estimate how potential future laws or regulations addressing GHG emissions would impact our business. Finally, it should be noted that some scientists have concluded that increasing concentrations of GHGs in the Earth’s atmosphere may produce climate changes that have significant physical effects, such as increased frequency and severity of storms, floods, and other climatic events; if any of these effects were to occur, they could have a material adverse effect on our properties and operations.
Operating hazards and uninsured risks may result in substantial losses to us or our operators, and any losses could adversely affect our results of operations and cash distributions to unitholders.
We may be secondarily liable for damage to the environment caused by our operators. The operations of our operators will be subject to all of the hazards and operating risks associated with drilling for and production of oil and natural gas, including the risk of fire, explosions, blowouts, surface cratering, uncontrollable flows of natural gas, oil and formation water, pipe or pipeline failures, abnormally pressured formations, casing collapses, and environmental hazards such as oil spills, natural gas leaks and ruptures, or discharges of toxic gases. In addition, their operations will be subject to risks associated with hydraulic fracturing, including any mishandling, surface spillage, or potential underground migration of fracturing fluids, including chemical additives. The occurrence of any of these events could result in substantial losses to our operators due to injury or loss of life, severe damage to or destruction of property, natural resources and equipment, pollution or other environmental damage, clean-up responsibilities, regulatory investigations and penalties, suspension of operations, and repairs required to resume operations.
In accordance with what we believe to be customary industry practice, we maintain insurance against some, but not all, of our business risks. Our insurance may not be adequate to cover any losses or liabilities we may suffer. Also, insurance may no longer be available to us or, if it is, its availability may be at premium levels that do not justify its purchase. The occurrence of a significant uninsured claim, a claim in excess of the insurance coverage limits maintained by us or a claim at a time when we are not able to obtain liability insurance could have a material adverse effect on our ability to conduct normal business operations and on our financial condition, results of operations, or cash distributions to unitholders. In addition, we may not be able to secure additional insurance or bonding that might be required by new governmental regulations. This may cause us to restrict our operations, which might severely impact our financial position. We may also be liable for environmental damage caused by previous owners of properties purchased by us, which liabilities may not be covered by insurance.
We may not have coverage if we are unaware of a sudden and accidental pollution event and unable to report the “occurrence” to our insurance company within the time frame required under our insurance policy. We do not have, and do not intend to obtain, coverage for gradual, long-term pollution events. In addition, these policies do not provide coverage for all liabilities, and we cannot assure our unitholders that the insurance coverage will be adequate to cover claims that may arise or that we will be able to maintain adequate insurance at rates we consider reasonable. A loss not fully covered by insurance could have a material adverse effect on our financial position, results of operations, and cash distributions to unitholders.
Title to the properties in which we have an interest may be impaired by title defects.
No assurance can be given that we will not suffer a monetary loss from title defects or title failure. Additionally, undeveloped acreage has greater risk of title defects than developed acreage. If there are any title defects or defects in assignment of leasehold rights in properties in which we hold an interest, we will suffer a financial loss.
Cyber attacks could significantly affect us.
Cyber attacks on businesses have escalated in recent years. We rely on electronic systems and networks to control and manage our business and have multiple layers of security to mitigate risks of cyber attack. If, however, we were to experience an attack and
36
our security measures failed, the potential consequences to our businesses and the communities in which we operate could be significant.
Risks Inherent in an Investment in Us
We expect to distribute a substantial majority of the cash we generate from operations each quarter, which could limit our ability to grow and make acquisitions.
We expect to distribute a substantial majority of the cash we generate from operations each quarter. As a result, we will have limited cash generated from operations to reinvest in our business or to fund acquisitions, and we will rely primarily upon external financing sources, including commercial bank borrowings and the issuance of debt and equity securities, to fund our acquisitions and growth capital expenditures. If we are unable to finance growth externally, our distribution policy will significantly impair our ability to grow.
If we issue additional units in connection with any acquisitions or growth capital expenditures, the payment of distributions on those additional units may increase the risk that we will be unable to maintain or increase our per unit distribution level. Other than limitations restricting our ability to issue units ranking senior or on parity with our preferred units, there are no limitations in our partnership agreement on our ability to issue additional units, including units ranking senior to the common units with respect to distributions. The incurrence of additional commercial borrowings or other debt to finance our growth would result in increased interest expense and required principal repayments, which, in turn, may reduce the cash that we have available to distribute to our unitholders. Please read Part II, Item 5. “Market for Registrant’s Common Equity, Related Unitholder Matters and Issuer Purchases of Equity Securities—Cash Distribution Policy.”
The board of directors of our general partner may modify or revoke our cash distribution policy at any time at its discretion. Our partnership agreement does not require us to pay any distributions at all. If we make distributions, our preferred unitholders have priority with respect to rights to share in those distributions over our common and subordinated unitholders for so long as our preferred units are outstanding.
Our partnership agreement generally provides that, during the subordination period (as defined in our partnership agreement), we will pay any distributions each quarter as follows: (i) first, to the holders of preferred units in an amount of approximately $25.00 per preferred unit, (ii) second, to the holders of common units, until each common unit has received the applicable minimum quarterly distribution plus any arrearages from prior quarters, and (iii) third, to the holders of subordinated units, until each subordinated unit has received the applicable minimum quarterly distribution. If the distributions to our common and subordinated unitholders exceed the applicable minimum quarterly distribution per unit, then such excess amounts will be distributed pro rata on the common and subordinated units as if they were a single class. The preferred units have a right to further participate (on an as-converted basis) in quarterly distributions in excess of the quarterly preferred distribution amount under certain circumstances that we do not expect to occur. Even if those additional distributions do occur, considering that the outstanding preferred units are convertible into only a relatively small number of our total outstanding common and subordinated units, we believe these additional distributions payable under those circumstances would not materially adversely affect the per unit distribution rate we would otherwise pay on our common and subordinated units. Our initial minimum quarterly distribution is $1.05 per common and subordinated unit on an annualized basis (or $0.2625 per unit on a quarterly basis) for the four quarters ending March 31, 2016. The minimum quarterly distribution will be $1.15 per common and subordinated unit on an annualized basis (or $0.2875 per unit on a quarterly basis) for the four quarters ending March 31, 2017. We expect that we will distribute a substantial majority of the cash we generate from operations each quarter. However, the board of directors of our general partner could elect not to pay distributions for one or more quarters or at all. Please read Part II, Item 5. “Market for Registrant’s Common Equity, Related Unitholder Matters and Issuer Purchases of Equity Securities—Cash Distribution Policy.”
Our partnership agreement does not require us to pay any distributions at all on our common units. Accordingly, investors are cautioned not to place undue reliance on the permanence of any distribution policy in making an investment decision. Any modification or revocation of our cash distribution policy could substantially reduce or eliminate the amounts of distributions to our unitholders. The amount of distributions we make, if any, and the decision to make any distribution at all will be determined by the board of directors of our general partner. If we make distributions, our preferred unitholders have priority with respect to rights to share in those distributions over our common and subordinated unitholders for so long as our preferred units are outstanding. Please read Part II, Item 5. “Market for Registrant’s Common Equity, Related Unitholder Matters and Issuer Purchases of Equity Securities—Cash Distribution Policy—Preferred Units.”
37
Our minimum quarterly distribution provides the common unitholders a specified priority right to distributions over the subordinated unitholders if we pay distributions. It does not provide the common unitholders the right to require payment of any distributions.
Our partnership agreement does not require us to pay any distributions on our common and subordinated units. The provision providing for a minimum quarterly distribution merely provides the common unitholders with a specified priority right to distributions before the subordinated unitholders receive distributions, if distributions are made with respect to the common and subordinated units.
Our partnership agreement eliminates the fiduciary duties that might otherwise be owed to the partnership and its partners by our general partner and its directors and executive officers under Delaware law.
Our partnership agreement contains provisions that eliminate the fiduciary duties that might otherwise be owed by our general partner and its directors and executive officers. For example, our partnership agreement provides that our general partner and its directors and executive officers have no duties to the partnership or its partners except as expressly set forth in the partnership agreement. In place of default fiduciary duties, our partnership agreement imposes a contractual standard requiring our general partner and its directors and executive officers to act in good faith, meaning they cannot cause the general partner to take an action that they subjectively believe is adverse to our interests. Such contractual standards allow our general partner and its directors and executive officers to manage and operate our business with greater flexibility and to subject the actions and determinations of our general partner and its directors and executive officers to lesser legal or judicial scrutiny than would be the case if state law fiduciary standards were applicable.
Our partnership agreement restricts the situations in which remedies may be available to our unitholders for actions taken that might constitute breaches of duty under applicable Delaware law and breaches of the contractual obligations in our partnership agreement.
Our partnership agreement restricts the potential liability of our general partner and its directors and executive officers to our unitholders. For example, our partnership agreement provides that our general partner and its directors and executive officers will not be liable for monetary damages to us or our limited partners for any acts or omissions unless there has been a final and non-appealable judgment entered by a court of competent jurisdiction determining that the general partner or those other persons acted in bad faith or engaged in willful misconduct or fraud or, with respect to any criminal conduct, with the knowledge that its conduct was unlawful.
Unitholders are bound by the provisions of our partnership agreement, including the provisions described above.
Our partnership agreement restricts the voting rights of unitholders owning 15% or more of our units, subject to certain exceptions.
Our partnership agreement restricts unitholders’ voting rights by providing that any units held by a person or group that owns 15% or more of any class of units then outstanding, other than the limited partners in BSMC prior to the IPO, their transferees, and persons who acquired such units with the prior approval of the board of directors of our general partner, may not vote on any matter.
Actions taken by our general partner may affect the amount of cash generated from operations that is available for distribution to unitholders or accelerate the right to convert subordinated units.
The amount of cash generated from operations available for distribution to unitholders is affected by decisions of our general partner regarding such matters as:
|
|
• |
amount and timing of asset purchases and sales; |
|
|
• |
cash expenditures; |
|
|
• |
borrowings; |
|
|
• |
entry into and repayment of current and future indebtedness; |
|
|
• |
issuance of additional units; and |
|
|
• |
the creation, reduction, or increase of reserves in any quarter. |
In addition, borrowings by us do not constitute a breach of any duty owed by our general partner to our unitholders, including borrowings that have the purpose or effect of:
|
|
• |
enabling holders of subordinated units to receive distributions; or |
|
|
• |
hastening the expiration of the subordination period. |
In addition, our general partner may use an amount, equal to $137.6 million, which would not otherwise constitute cash generated from operations, in order to permit the payment of distributions on subordinated units. All of these actions may affect the amount of cash distributed to our unitholders and may facilitate the conversion of subordinated units into common units.
38
For example, in the event we have not generated sufficient cash from our operations to pay the minimum quarterly distribution on our common units and our subordinated units, our partnership agreement permits us to borrow funds, which would enable us to make such distribution on all outstanding units.
We have a call right that may require common unitholders to sell their common units at an undesirable time or price.
If at any point in time prior to the end of the subordination period we have acquired more than 80% of the total number of common units outstanding, we have the right, but not the obligation, to purchase all of the remaining common units at a price equal to the greater of (1) the average of the daily closing price of the common units over the 20 trading days preceding the date three days before notice of exercise of the call right is first mailed and (2) the highest per-unit price paid by us or any of our affiliates for common units during the 90-day period preceding the date such notice is first mailed. This limited call right is not exercisable as long as any of our preferred units are outstanding, or at any time after the subordination period has ended.
Unitholders may have liability to repay distributions.
Under certain circumstances, unitholders may have to repay amounts wrongfully returned or distributed to them. Under Section 17-607 of the Delaware Revised Uniform Limited Partnership Act (the “Delaware Act”), we may not make a distribution to our unitholders if the distribution would cause our liabilities to exceed the fair value of our assets. Delaware law provides that for a period of three years from the date of the impermissible distribution, limited partners who received the distribution and who knew at the time of the distribution that it violated Delaware law will be liable to the limited partnership for the distribution amount. Liabilities to partners on account of their partnership interests and liabilities that are non-recourse to the partnership are not counted for purposes of determining whether a distribution is permitted.
Increases in interest rates may cause the market price of our common units to decline.
An increase in interest rates may cause a corresponding decline in demand for equity investments in general, and in particular, for yield-based equity investments such as our common units. Any such increase in interest rates or reduction in demand for our common units resulting from other investment opportunities may cause the trading price of our common units to decline.
We may issue additional common units and other equity interests without common and subordinated unitholder approval, which would dilute holders of common and subordinated units. However, our partnership agreement does not authorize us to issue units ranking senior to or at parity with our preferred units without preferred unitholder approval.
Under our partnership agreement, we are authorized to issue an unlimited number of additional interests, including common units, without a vote of the unitholders other than, in certain instances, approval of holders of our preferred units. Our issuance of additional common units or other equity interests of equal or senior rank will have the following effects:
|
|
• |
the proportionate ownership interest of common and subordinated unitholders in us immediately prior to the issuance will decrease; |
|
|
• |
the amount of cash distributions on each common and subordinated unit may decrease; |
|
|
• |
the ratio of our taxable income to distributions may increase; |
|
|
• |
the relative voting strength of each previously outstanding common and subordinated unit may be diminished; and |
|
|
• |
the market price of the common units may decline. |
However, our partnership agreement does not authorize us to issue securities having preferences or rights with priority over or on a parity with the preferred units with respect to rights to share in distributions, redemption obligations, or redemption rights without preferred unitholder approval.
The market price of our common units could be adversely affected by sales of substantial amounts of our common units in the public or private markets.
As of December 31, 2015, we had 96,161,911 common units and 95,057,312 subordinated units outstanding. All of the subordinated units could convert into common units on no more than a one-to-one basis at the end of the subordination period. Sales by holders of a substantial number of our common units in the public markets, or the perception that these sales might occur, could have a material adverse effect on the price of our common units or impair our ability to obtain capital through an offering of equity securities.
The price of our common units may fluctuate significantly, and unitholders could lose all or part of their investment.
The market price of our common units may be influenced by many factors, some of which are beyond our control, including those described elsewhere in these risk factors.
39
We have and will continue to incur increased costs as a result of being a publicly traded partnership.
As a publicly traded partnership, we have and will continue to incur significant legal, accounting, and other expenses that we did not incur prior to the IPO. In addition, the Sarbanes-Oxley Act, as well as rules implemented by the SEC and the NYSE, require publicly traded entities to maintain various corporate governance practices that further increase our costs. Before we are able to make distributions to our unitholders, we must first pay or reserve for our expenses, including the costs of being a publicly traded partnership. As a result, the amount of cash we have available to distribute to our unitholders will be affected by the costs associated with being a publicly traded partnership.
Following the IPO, we became subject to the public reporting requirements of the Securities Exchange Act of 1934 (the “Exchange Act”). These requirements have increased our legal and financial compliance costs.
For as long as we are an emerging growth company, we will not be required to comply with certain disclosure requirements, including those relating to accounting standards, our executive compensation, and internal control auditing requirements that apply to other public companies.
We are classified as an “emerging growth company” under Section 2(a)(19) of the Securities Act. For as long as we are an emerging growth company, which may be up to five full fiscal years, we will not be required to comply with certain requirements that other public companies are required to comply with. Among other things, we will not be required to:
|
|
• |
provide an auditor’s attestation report on management’s assessment of the effectiveness of our system of internal control over financial reporting pursuant to Section 404(b) of the Sarbanes-Oxley Act; |
|
|
• |
comply with any new requirements adopted by the PCAOB requiring mandatory audit firm rotation or a supplement to the auditor’s report in which the auditor would be required to provide additional information about the audit and the financial statements of the issuer; or |
|
|
• |
provide certain disclosure regarding executive compensation required of larger public companies. |
If we fail to develop or maintain an effective system of internal controls, we may not be able to accurately report our financial results or prevent fraud. As a result, current and potential unitholders could lose confidence in our financial reporting, which would harm our business and the trading price of our units.
Effective internal controls are necessary for us to provide reliable financial reports, prevent fraud, and operate successfully as a publicly traded partnership. If we cannot provide reliable financial reports or prevent fraud, our reputation and operating results would be harmed. We cannot be certain that our efforts to develop and maintain our internal controls will be successful, that we will be able to maintain adequate controls over our financial processes and reporting in the future, or that we will be able to comply with our obligations under Section 404 of the Sarbanes-Oxley Act. For example, Section 404 requires us, among other things, to annually review and report on, and our independent registered public accounting firm to attest to, the effectiveness of our internal controls over financial reporting. We must comply with Section 404 (except for the requirement for an auditor’s attestation report) beginning with our fiscal year ending December 31, 2016. Any failure to develop or maintain effective internal controls, or difficulties encountered in implementing or improving our internal controls, could harm our operating results or cause us to fail to meet our reporting obligations. Ineffective internal controls could also cause investors to lose confidence in our reported financial information, which would likely have a negative effect on the trading price of our common units.
The NYSE does not require a publicly traded partnership like us to comply with certain of its corporate governance requirements.
Because we are a publicly traded partnership, the NYSE does not require us to have a majority of independent directors on our general partner’s board of directors or to establish a compensation committee or a nominating and corporate governance committee. In addition, because we are a publicly traded partnership, the NYSE does not require us to obtain unitholder approval prior to certain unit issuances. Accordingly, unitholders will not have the same protections afforded to stockholders of certain corporations that are subject to all of the NYSE’s corporate governance requirements.
Our partnership agreement includes exclusive forum, venue, and jurisdiction provisions. By purchasing a common unit, a limited partner is irrevocably consenting to these provisions regarding claims, suits, actions, or proceedings, and submitting to the exclusive jurisdiction of Delaware courts.
Our partnership agreement is governed by Delaware law. Our partnership agreement includes exclusive forum, venue, and jurisdiction provisions designating Delaware courts as the exclusive venue for all claims, suits, actions, or proceedings arising out of or relating in any way to the partnership agreement, brought in a derivative manner on behalf of the partnership, asserting a claim of breach of a fiduciary or other duty owed by any director, officer, or other employee of the partnership or the general partner, or owed by the general partner to the partnership or the partners, asserting a claim arising pursuant to any provision of the Delaware Act, or asserting a claim governed by the internal affairs doctrine. By purchasing a common unit, a limited partner is irrevocably consenting to these provisions regarding claims, suits, actions, or proceedings and submitting to the exclusive jurisdiction of Delaware courts. If a
40
dispute were to arise between a limited partner and us or our officers, directors, or employees, the limited partner may be required to pursue its legal remedies in Delaware, which may be an inconvenient or distant location and which is considered to be a more corporate-friendly environment.
If a unitholder is not an Eligible Holder, the common units of such unitholder may be subject to redemption.
We have adopted certain requirements regarding those investors who may own our units. Eligible Holders are limited partners (a) whose, or whose owners’, federal income tax status does not have or is not reasonably likely to have a material adverse effect on the rates chargeable by us to customers and (b) whose ownership could not result in our loss of ownership in any material part of our assets, as determined by our general partner with the advice of counsel. If an investor is not an Eligible Holder, in certain circumstances as set forth in our partnership agreement, units by such investor may be redeemed by us at the then-current market price. The redemption price will be paid in cash or by delivery of a promissory note, as determined by our general partner.
Tax Risks to Common Unitholders
Our tax treatment depends on our status as a partnership for federal income tax purposes, as well as our not being subject to a material amount of entity-level taxation by individual states. If the Internal Revenue Service (“IRS”) were to treat us as a corporation for federal income tax purposes or we were to become subject to entity-level taxation for state tax purposes, then our cash distributions to unitholders could be substantially reduced.
The anticipated after-tax economic benefit of an investment in our common units depends largely on our being treated as a partnership for federal income tax purposes.
Despite the fact that we are organized as a limited partnership under Delaware law, we will be treated as a corporation for federal income tax purposes unless we satisfy a “qualifying income” requirement. Based upon our current operations, we believe we satisfy the qualifying income requirement. However, we have not requested, and do not plan to request, a ruling from the IRS on this or any other matter affecting us. Failing to meet the qualifying income requirement or a change in current law could cause us to be treated as a corporation for federal income tax purposes or otherwise subject us to taxation as an entity.
If we were treated as a corporation for federal income tax purposes, we would pay federal income tax on our taxable income at the corporate tax rate, which is currently a maximum of 35%. Distributions to our unitholders would generally be taxed again as corporate distributions, and no income, gains, losses, or deductions would flow through to our unitholders. Because a tax would be imposed upon us as a corporation, cash distributions to our unitholders would be substantially reduced. In addition, changes in current state law may subject us to additional entity-level taxation by individual states. Because of widespread state budget deficits and other reasons, several states are evaluating ways to subject partnerships to entity-level taxation through the imposition of state income, franchise, and other forms of taxation. Imposition of any of those taxes may substantially reduce the cash distributions to our unitholders. Therefore, treatment of us as a corporation or the assessment of a material amount of entity-level taxation would result in a material reduction in the anticipated cash generated from operations and after-tax return to the unitholders, likely causing a substantial reduction in the value of our common units.
The tax treatment of publicly traded partnerships or an investment in our common units could be subject to potential legislative, judicial, or administrative changes and differing interpretations, possibly applied on a retroactive basis.
The present federal income tax treatment of publicly traded partnerships, including us, or an investment in our common units may be modified by administrative, legislative, or judicial changes or differing interpretations at any time. For example, the Obama administration’s budget proposal for fiscal year 2017 recommends that certain publicly traded partnerships earning income from activities related to fossil fuels be taxed as corporations beginning in 2022. From time to time, members of Congress propose and consider similar substantive changes to the existing federal income tax laws that affect publicly traded partnerships. If successful, such proposals could eliminate the qualifying income exception to the treatment of all publicly traded partnerships as corporations upon which we rely for our treatment as a partnership for federal income tax purposes.
In addition, the IRS, on May 5, 2015, issued proposed regulations concerning which activities give rise to qualifying income within the meaning of Section 7704(d)(1)(E) of the Internal Revenue Code. The proposed regulations provide an exclusive list of industry-specific rules regarding the qualifying income exception, including whether an activity constitutes the exploration, development, production, and marketing of natural resources. Income earned from a royalty interest is not specifically enumerated as a qualifying income activity in the proposed regulations. However, notwithstanding the proposed regulations, our external counsel has advised us that royalty income is qualifying income for purposes of Section 7704 of the Internal Revenue Code since it is “derived” from the exploration, development, production, and marketing of natural resources. The U.S. Treasury Department and the IRS may clarify that royalty income is qualifying income for purposes of Section 7704 of the Internal Revenue Code; however, there are no assurances that the proposed regulations, when published as final regulations, will not take a position that is contrary to our interpretation of Section 7704 of the Internal Revenue Code.
41
Any modification to the federal income tax laws may be applied retroactively and could make it more difficult or impossible for us to meet the exception for certain publicly traded partnerships to be treated as partnerships for federal income tax purposes. We are unable to predict whether any of these changes or other proposals will ultimately be enacted or adopted. Any such changes could negatively impact the value of an investment in our common units.
Our partnership agreement provides that if a law is enacted or existing law is modified or interpreted in a manner that subjects us to taxation as a corporation or otherwise subjects us to entity-level taxation for federal income tax purposes, the minimum quarterly distribution may be adjusted to reflect the impact of that law on us.
Future legislation may result in the elimination of certain U.S. federal income tax deductions currently available with respect to oil and natural gas exploration and production. Additionally, future federal or state legislation may impose new or increased taxes or fees on oil and natural gas extraction.
Potential legislation, if enacted into law, could make significant changes to U.S. federal and state income tax laws, including the elimination of certain key U.S. federal income tax incentives currently available to oil and gas exploration and production companies. These changes include, but are not limited to, (i) the repeal of the percentage depletion allowance for oil and natural gas properties; (ii) the elimination of current deductions for intangible drilling and development costs; (iii) the elimination of the deduction for certain U.S. production activities; and (iv) an extension of the amortization period for certain geological and geophysical expenditures. It is unclear whether these or similar changes will be enacted and, if enacted, how soon any such changes could become effective. The passage of this legislation or any other similar changes in U.S. federal and state income tax laws could eliminate or postpone certain tax deductions that are currently available with respect to oil and natural gas exploration and development, and any such change could negatively impact the value of an investment in our common units. Additionally, legislation could be enacted that increases the taxes states impose on oil and natural gas extraction. Moreover, President Obama has proposed, as part of the Budget of the United States Government for Fiscal Year 2017, to impose an “oil fee” of $10.25 on a per barrel equivalent of crude oil. This fee would be collected on domestically produced and imported petroleum products. The fee would be phased in evenly over five years, beginning October 1, 2016. The adoption of this, or similar proposals, could result in increased operating costs and/or reduced consumer demand for petroleum products, which in turn could affect our financial position and cash flows.
If the IRS were to contest the federal income tax positions we take, it may adversely affect the market for our common units, and the costs of any such contest would reduce cash distributions to our unitholders. Recently enacted legislation alters the procedures for assessing and collecting taxes due for taxable years beginning after December 31, 2017, in a manner that could substantially reduce cash available for distribution to our unitholders.
We have not requested a ruling from the IRS with respect to our treatment as a partnership for federal income tax purposes or any other matter affecting us. The IRS may adopt positions that differ from the positions we take. It may be necessary to resort to administrative or court proceedings to sustain some or all of the positions we take. A court may not agree with some or all of the positions we take. Any contest with the IRS may materially and adversely affect the market for our common units and the price at which they trade. Moreover, the costs of any contest between us and the IRS will result in a reduction in cash distributions to our unitholders and thus will be borne indirectly by our unitholders.
Recently enacted legislation, applicable to us for taxable years beginning after December 31, 2017, alters the procedures for auditing large partnerships and also alters the procedures for assessing and collecting taxes due (including applicable penalties and interest) as a result of an audit. Under the new rules, unless we are eligible to, and do, elect to issue revised Schedules K-1 to our partners with respect to an audited and adjusted return, the IRS may assess and collect taxes (including any applicable penalties and interest) directly from us in the year in which the audit is completed. If we are required to pay taxes, penalties and interest as the result of audit adjustments, cash available for distribution to our unitholders may be substantially reduced. In addition, because payment would be due for the taxable year in which the audit is completed, unitholders during that taxable year would bear the expense of the adjustment even if they were not unitholders during the audited taxable year.
Even if you, as a unitholder, do not receive any cash distributions from us, you will be required to pay taxes on your share of our taxable income.
You will be required to pay federal income taxes and, in some cases, state and local income taxes, on your share of our taxable income, whether or not you receive cash distributions from us. For example, if we sell assets and use the proceeds to repay existing debt or fund capital expenditures, you may be allocated taxable income and gain resulting from the sale and our cash available for distribution would not increase. Similarly, taking advantage of opportunities to reduce our existing debt, such as debt exchanges, debt repurchases, or modifications of our existing debt could result in “cancellation of indebtedness income” being allocated to our unitholders as taxable income without any increase in our cash available for distribution. You may not receive cash distributions from us equal to your share of our taxable income or even equal to the actual tax due from you with respect to that income.
42
Tax gain or loss on disposition of our common units could be more or less than expected.
If you sell your common units, you will recognize a gain or loss equal to the difference between the amount realized and your tax basis in those common units. Because distributions in excess of your allocable share of our net taxable income decrease your tax basis in your common units, the amount, if any, of prior excess distributions with respect to the units you sell will, in effect, become taxable income to you if you sell your units at a price greater than your tax basis in those units, even if the price you receive is less than your original cost. In addition, because the amount realized includes a unitholder’s share of our nonrecourse liabilities, if you sell your common units, you may incur a tax liability in excess of the amount of cash you receive from the sale.
A substantial portion of the amount realized from the sale of your units, whether or not representing gain, may be taxed as ordinary income to you due to potential recapture items, including depreciation recapture. Thus, you may recognize both ordinary income and capital loss from the sale of your units if the amount realized on a sale of your units is less than your adjusted basis in the units. Net capital loss may only offset capital gains and, in the case of individuals, up to $3,000 of ordinary income per year. In the taxable period in which you sell your units, you may recognize ordinary income from our allocations of income and gain to you prior to the sale and from recapture items that generally cannot be offset by any capital loss recognized upon the sale of units.
Tax-exempt entities and non-U.S. persons face unique tax issues from owning our common units that may result in adverse tax consequences to them.
Investment in common units by tax-exempt entities, such as employee benefit plans and individual retirement accounts (known as IRAs), and non-U.S. persons raises issues unique to them. For example, a portion of our income allocated to organizations that are exempt from federal income tax, including IRAs and other retirement plans, may be unrelated business taxable income and may be taxable to them. Distributions to non-U.S. persons will be subject to withholding taxes imposed at the highest effective tax rate applicable to such non-U.S. persons, and each non-U.S. person may be required to file United States federal tax returns and pay tax on their share of our taxable income if it is treated as effectively connected income. If you are a tax-exempt entity or a non-U.S. person, you should consult your tax advisor before investing in our common units.
We treat each purchaser of common units as having the same tax benefits without regard to the common units actually purchased. The IRS may challenge this treatment, which could adversely affect the value of the common units.
Because we cannot match transferors and transferees of our common units and because of other reasons, we have adopted depreciation and amortization positions that may not conform to all aspects of existing Treasury Regulations. A successful IRS challenge to those positions could adversely affect the amount of tax benefits available to you. It also could affect the timing of these tax benefits or the amount of gain from your sale of common units and could have a negative impact on the value of our common units or result in audit adjustments to your tax returns.
We prorate our items of income, gain, loss, and deduction between transferors and transferees of our common units each month based upon the ownership of our common units on the first day of each month, instead of on the basis of the date a particular unit is transferred. The IRS may challenge this treatment, which could change the allocation of items of income, gain, loss, and deduction among our unitholders.
We prorate our items of income, gain, loss, and deduction between transferors and transferees of our units each month based upon the ownership of our units on the first day of each month, instead of on the basis of the date a particular unit is transferred. The U.S. Department of the Treasury recently adopted final Treasury Regulations allowing a similar monthly simplifying convention for taxable years beginning on or after August 3, 2015. However, such regulations do not specifically authorize the use of the proration method we have adopted for our 2015 taxable year and may not specifically authorize all aspects of our proration method thereafter. If the IRS were to challenge our proration method, we may be required to change the allocation of items of income, gain, loss, and deduction among our unitholders.
A unitholder whose units are the subject of a securities loan (e.g., a loan to a “short seller” to cover a short sale of units) may be considered to have disposed of those units. If so, he would no longer be treated for tax purposes as a partner with respect to those units during the period of the loan and could recognize gain or loss from the disposition.
Because there are no specific rules governing the federal income tax consequences of loaning a partnership interest, a unitholder whose units are the subject of a securities loan may be considered to have disposed of the loaned units. In that case, the unitholder may no longer be treated for tax purposes as a partner with respect to those units during the period of the loan to the short seller and the unitholder may recognize gain or loss from this disposition. Moreover, during the period of the loan, any of our income, gain, loss, or deduction with respect to those units may not be reportable by the unitholder and any cash distributions received by the unitholder as to those units could be fully taxable as ordinary income. Unitholders desiring to assure their status as partners and avoid the risk of gain recognition from a securities loan are urged to modify any applicable brokerage account agreements to prohibit their brokers from borrowing their units.
43
The sale or exchange of 50% or more of our capital and profits interests during any twelve-month period will result in the termination of our partnership for federal income tax purposes.
We will be considered to have terminated for federal income tax purposes if there is a sale or exchange of 50% or more of the total interests in our capital and profits within a twelve-month period. Our termination would, among other things, result in the closing of our taxable year for all unitholders, which would result in us filing two tax returns for one calendar year and could result in a significant deferral of depreciation deductions allowable in computing our taxable income. In the case of a unitholder reporting on a taxable year other than a calendar year, the closing of our taxable year may also result in more than twelve months of our taxable income or loss being includable in taxable income for the unitholder’s taxable year that includes our termination. Our termination would not affect our classification as a partnership for federal income tax purposes, but it would result in our being treated as a new partnership for federal income tax purposes following the termination. If we were treated as a new partnership, we would be required to make new tax elections and could be subject to penalties if we were unable to determine that a termination occurred. The IRS has announced a relief procedure whereby if a publicly traded partnership that has technically terminated requests and the IRS grants special relief, among other things, the partnership may be permitted to provide only a single Schedule K-1 to unitholders for the two short tax periods included in the year in which the termination occurs.
You, as a unitholder, may be subject to state and local taxes and return filing requirements in states where you do not live as a result of investing in our common units.
In addition to federal income taxes, you likely will be subject to other taxes, including state and local taxes, unincorporated business taxes and estate, inheritance, or intangible taxes that are imposed by the various jurisdictions in which we conduct business or own property now or in the future, even if you do not live in any of those jurisdictions. We will initially own assets and conduct business in several states, many of which impose a personal income tax and also impose income taxes on corporations and other entities. You may be required to file state and local income tax returns and pay state and local income taxes in these jurisdictions. Further, you may be subject to penalties for failure to comply with those requirements. As we make acquisitions or expand our business, we may own assets or conduct business in additional states or foreign jurisdictions that impose a personal income tax. It is your responsibility to file all U.S. federal, foreign, state, and local tax returns.
ITEM 1B. UNRESOLVED STAFF COMMENTS
None.
Although we may, from time to time, be involved in various legal claims arising out of our operations in the normal course of business, we do not believe that the resolution of these matters will have a material adverse impact on our financial condition or results of operations.
ITEM 4. MINE SAFETY DISCLOSURES
Not applicable.
44
ITEM 5. MARKET FOR REGISTRANT’S COMMON EQUITY, RELATED UNITHOLDER MATTERS AND ISSUER PURCHASES OF EQUITY SECURITIES
Our common units are listed on the NYSE under the symbol “BSM.” Our common units began trading on the NYSE on May 1, 2015 at an initial public offering price of $19.00 per common unit. The following table sets forth the daily high and low sales price for our common units as reported by the NYSE, as well as the quarterly distributions per common and subordinated unit paid subsequent to the completion of our initial public offering on May 6, 2015.
|
|
|
Price Range of Common Units |
|
|
Distributions1 |
|
||||||||||
|
|
|
High |
|
|
Low |
|
|
Per Common Unit |
|
|
Per Subordinated Unit |
|
||||
|
2015 |
|
|
|
|
|
|
|
|
|
|
|
|
|
|
|
|
|
Second Quarter2 |
|
$ |
19.00 |
|
|
$ |
16.59 |
|
|
$ |
0.1615 |
|
|
$ |
0.1615 |
|
|
Third Quarter |
|
|
17.50 |
|
|
|
13.27 |
|
|
$ |
0.2625 |
|
|
$ |
0.2625 |
|
|
Fourth Quarter |
|
|
16.50 |
|
|
|
12.03 |
|
|
$ |
0.2625 |
|
|
$ |
0.18375 |
|
|
1 |
Represents cash distributions attributable to the quarter. Cash distributions declared in respect of a quarter are paid in the following quarter. |
|
2 |
The price range of our common units includes our $19.00 per common unit initial public offering price on April 30, 2015. Distributions were prorated for the period from the completion of our initial public offering on May 6, 2015 through June 30, 2015. |
As of March 4, 2016, there were 96,965,879 common units outstanding held by 486 holders of record. Because many of our common units are held by brokers and other institutions on behalf of unitholders, we are unable to estimate the total number of unitholders represented by these holders of record. As of March 4, 2016, we had also outstanding 95,002,347 subordinated units, and 77,216 preferred units. There is no established public market in which the subordinated units or the preferred units are traded.
45
The graph below compares our cumulative total unitholder return on our common units beginning on April 30, 2015, the date of pricing for our IPO, through December 31, 2015 with the S&P 500 index and the Alerian MLP index. The graph assumes that the value of the investment in our common units was $100.00 on April 30, 2015. Cumulative return is computed assuming reinvestment of distributions.
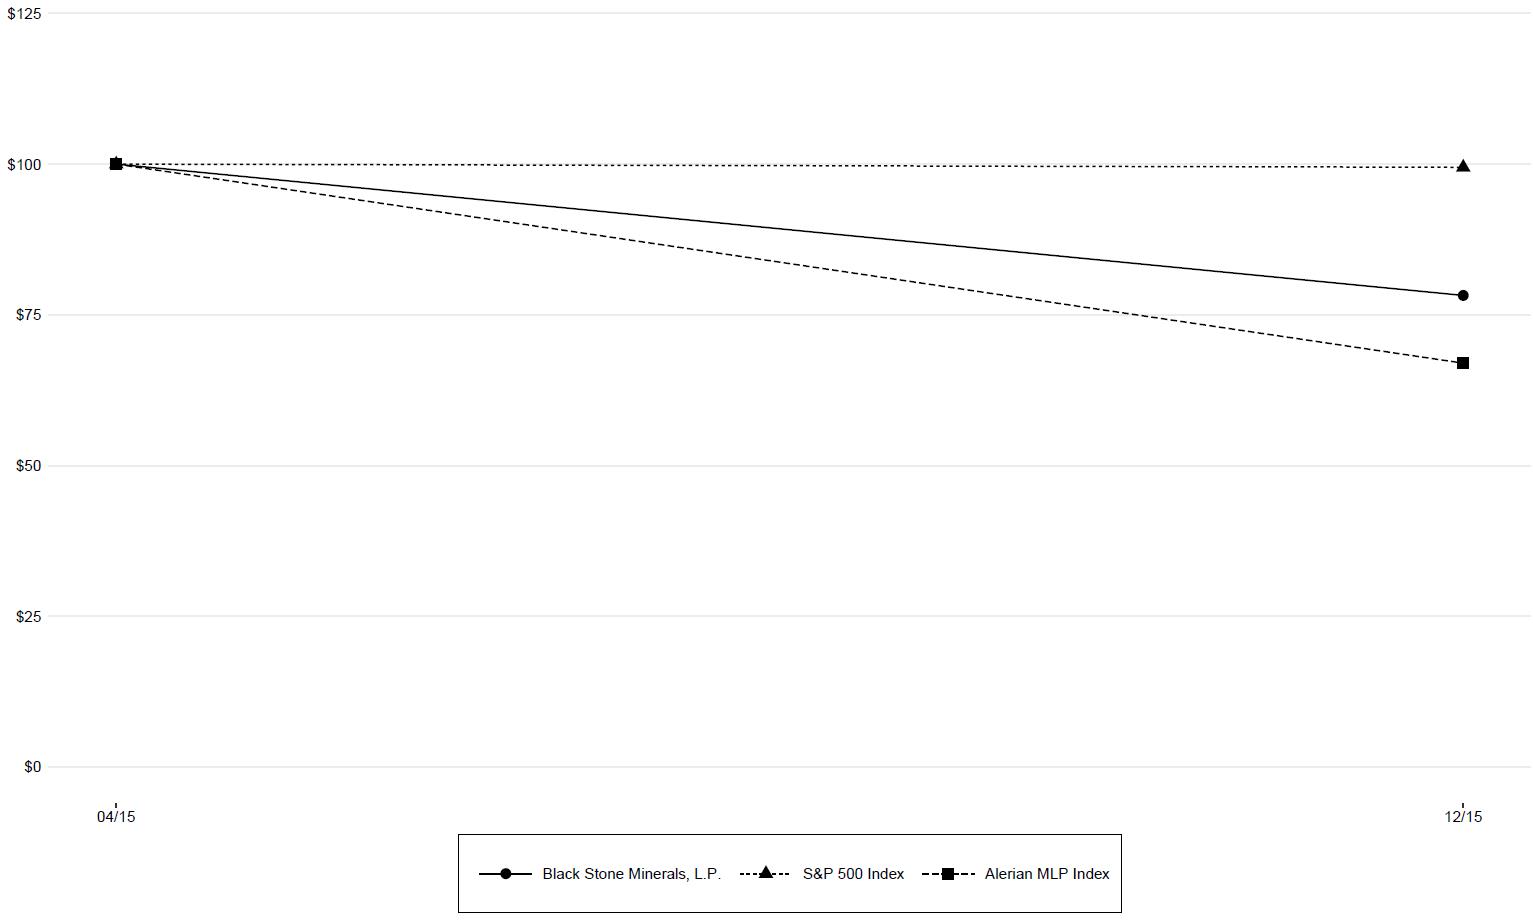 Comparison of Cumulative Total Return
Assumes Initial Investment of $100
As of December 31, 2015
|
|
|
As of April 30, 2015 |
|
As of December 31, 2015 |
||
|
Black Stone Minerals, L.P. |
|
$ |
100.00 |
|
$ |
78.22 |
|
S&P 500 Index |
|
|
100.00 |
|
|
99.47 |
|
Alerian MLP Index |
|
|
100.00 |
|
|
66.99 |
The information in this report appearing under the heading “Common Unit Performance Graph” is being furnished pursuant to Item 2.01(e) of Regulation S-K and shall not be deemed to be “soliciting material” or to be “filed” with the SEC or subject to Regulation 14A or 14C, other than as provided in Item 2.01(e) of Regulation S-K, or to the liabilities of Section 18 of the Exchange Act.
Securities Authorized for Issuance under Equity Compensation Plans
See the information incorporated by reference under “Item 12. Security Ownership of Certain Beneficial Owners and Management and Related Unitholder Matters” regarding securities authorized for issuance under our equity compensation plans.
46
Purchases of Equity Securities by the Issuer and Affiliated Purchasers
The following table sets forth purchases made by us of our preferred units during the three months ended December 31, 2015. Our preferred units may be converted, at the option of the holder thereof, at any time, and without the payment of additional consideration, into common units and subordinated units at the then-effective conversion rate. The preferred units have a conversion rate of 30.3431 common units and 39.7427 subordinated units per preferred unit, subject to adjustment.
|
Period |
|
Total Number of Preferred Units Purchased |
|
|
Average Price Paid Per Unit |
|
|
Total Number of Preferred Units Purchased as Part of Publicly Announced Plans or Programs |
|
|
Maximum Number of Preferred Units That May Yet Be Purchased Under the Plans or Programs |
|
||||
|
December 1 - December 31, 20151 |
|
|
40,747 |
|
|
$ |
1,019.45 |
|
|
|
40,747 |
|
|
|
— |
|
|
1 |
On November 6, 2015, we commenced a tender offer to purchase up to 100% of the 117,963 then outstanding preferred units from our preferred unitholders at the units’ par value of $1,000.00 per preferred unit, plus unpaid accrued yield. The tender offer expired on December 10, 2015. We purchased and cancelled 40,747 preferred units, representing 34.5% of our then outstanding preferred units. The tendered units were purchased for $1,019.45 per preferred unit for a total cost of approximately $41.5 million, excluding fees and expenses relating to the tender offer. |
Cash Distribution Policy
Our partnership agreement generally provides that we will pay any distributions each quarter during the subordination period in the following manner:
|
|
· |
first, to the holders of preferred units in an amount of approximately $25.00 per preferred unit; |
|
|
· |
second, to the holders of common units, until each common unit has received the applicable minimum quarterly distribution in the amounts specified below plus any arrearages from prior quarters; and |
|
|
· |
third, to the holders of subordinated units, until each subordinated unit has received the applicable minimum quarterly distribution. |
If the distributions to our common and subordinated unitholders exceed the applicable minimum quarterly distribution per unit, then such excess amounts will be distributed pro rata on the common and subordinated units as if they were a single class. The preferred units have a right to further participate (on an as-converted basis) in quarterly distributions in excess of the quarterly preferred distribution amount under certain circumstances that we do not expect to occur. Even if those additional distributions do occur, considering that the outstanding preferred units are convertible into only a relatively small number of our total outstanding common and subordinated units, we believe these additional distributions payable under those circumstances would not materially adversely affect the per unit distribution rate we would otherwise pay on our common and subordinated units. The applicable minimum quarterly distribution for the periods specified below is as follows:
|
|
|
Minimum Quarterly Distribution (per unit) |
|
|||||
|
Four Quarters Ending March 31, |
|
Per Quarter |
|
|
Annualized |
|
||
|
2016 |
|
$ |
0.2625 |
|
|
$ |
1.05 |
|
|
2017 |
|
|
0.2875 |
|
|
|
1.15 |
|
|
2018 |
|
|
0.3125 |
|
|
|
1.25 |
|
|
2019 and thereafter |
|
|
0.3375 |
|
|
|
1.35 |
|
After March 31, 2019, the minimum quarterly distribution shall be the same as it is for each of the four quarters ending March 31, 2019. The minimum quarterly distribution does not provide the common unitholders the right to require payment of any distributions. It merely reflects the specified priority right of our common unitholders to distributions before the subordinated unitholders receive distributions, if distributions are paid.
The amount of cash to be distributed each quarter will be determined by the board of directors of our general partner following the end of that quarter after a review of our cash generated from operations for such quarter. We expect that we will distribute a substantial majority of the cash generated from our operations each quarter. The cash generated from operations for each quarter will generally equal our Adjusted EBITDA for the quarter, less cash needed for debt service, other contractual obligations, fixed charges, and reserves for future operating or capital needs that the board of directors may determine are appropriate. It is our intent, for at least the next several years, to finance most of our acquisitions and working-interest capital needs with cash generated from operations,
47
borrowings under our credit facility, and, in certain circumstances, proceeds from future equity and debt issuances. We may also borrow to make distributions to our unitholders where, for example, we believe that the distribution level is sustainable over the long term, but short-term factors may cause cash generated from operations to be insufficient to pay distributions at the applicable minimum quarterly distribution level on our common and subordinated units. The board of directors of our general partner can change the amount of the quarterly distributions, if any, at any time and from time to time. Our partnership agreement does not require us to pay cash distributions on a quarterly or other basis. Please read Part I, Item 1A. “Risk Factors—Risks Inherent in an Investment in Us—The board of directors of our general partner may modify or revoke our cash distribution policy at any time at its discretion. Our partnership agreement does not require us to pay any distributions at all. Therefore, the fact that our partnership agreement includes the concept of a minimum quarterly distribution does not provide any assurance that a distribution will be paid on the common units. If we make distributions, our preferred unitholders have priority with respect to rights to share in those distributions over our common and subordinated unitholders for so long as our preferred units are outstanding.” For a description of the relative rights and privileges of our preferred units to distributions, please read “—Preferred Units.”
Replacement capital expenditures are expenditures necessary to replace our existing oil and natural gas reserves or otherwise maintain our asset base over the long term. Like a number of other master limited partnerships, we are required by our partnership agreement to retain cash from our operations in an amount equal to our estimated replacement capital requirements. We believe the level of our distribution rate will allow us to retain in our business sufficient cash generated from our operations to satisfy our replacement capital expenditures needs and to fund a portion of our growth capital expenditures. The board of directors of our general partner is responsible for establishing the amount of our estimated replacement capital expenditures.
Limitations on Cash Distributions and Our Ability to Change Our Cash Distribution Policy
There is no guarantee that we will make cash distributions to our unitholders. Our cash distribution policy may be changed at any time by the board of directors of our general partner and is subject to certain restrictions, including the following:
|
|
· |
Our common and subordinated unitholders have no contractual or other legal right to receive cash distributions from us on a quarterly or other basis, and if distributions are paid, common and subordinated unitholders will receive distributions only to the extent the distribution amount exceeds distributions that are required to be paid to our preferred unitholders. |
|
|
· |
Our credit facility restricts our distributions if there is a default under our credit facility or if our borrowing base is lower than the outstanding loans under our credit facility. Among other covenants, our credit facility requires we maintain a ratio of total debt to EBITDAX of 3.50:1.00 or less and a current ratio of 1.00:1.00 or greater. If we are unable to comply with these financial covenants or if we breach any other covenant under our credit facility or any future debt agreements, we could be prohibited from making distributions notwithstanding our stated distribution policy. |
|
|
· |
Our general partner will have the authority to establish cash reserves for the prudent conduct of our business, and the establishment of, or increase in, those reserves could result in a reduction in cash distributions to our unitholders. Our partnership agreement does not limit the amount of cash reserves that our general partner may establish. Any decision to establish cash reserves made by our general partner will be binding on our unitholders. |
|
|
· |
Under Section 17-607 of the Delaware Act, we may not make a distribution if the distribution would cause our liabilities to exceed the fair value of our assets. |
|
|
· |
We may lack sufficient cash to pay distributions to our unitholders due to shortfalls in cash generated from operations attributable to a number of operational, commercial, or other factors as well as increases in our operating or general and administrative expenses, principal and interest payments on our outstanding debt, working-capital requirements, and anticipated cash needs. |
We expect to continue to distribute a substantial majority of our cash from operations to our unitholders on a quarterly basis, after, among other things, the establishment of cash reserves. To fund our growth, we may eventually need capital in excess of the amounts we may retain in our business or borrow under our credit facility. To the extent efforts to access capital externally are unsuccessful, our ability to grow could be significantly impaired.
Any distributions paid on our common and subordinated units with respect to a quarter will be paid within 60 days after the end of such quarter.
Subordinated Units
The limited partners of BSM’s Predecessor own all of our subordinated units. The principal difference between our common and subordinated units is that, for any quarter during the subordination period, holders of the subordinated units are not entitled to receive any distribution until the holders of the common units have received the applicable minimum quarterly distribution for such
48
quarter plus any arrearages in the payment of the minimum quarterly distribution from prior quarters. Subordinated units will not accrue arrearages. Our common unitholders are only entitled to arrearages in the payment of the minimum quarterly distribution from prior quarters during the subordination period. To the extent we have cash generated from operations available for distribution in any quarter during the subordination period in excess of the amount necessary to pay the applicable minimum quarterly distribution to holders of our common units, we will use this excess cash to pay any distribution arrearages on the common units related to prior quarters before any cash distribution is made on our subordinated units. Please read “Cash Distribution Policy.”
The subordination period will end on the first business day after we have earned and paid an aggregate amount of at least $1.35 (the annualized minimum quarterly distribution applicable for quarterly periods ending March 31, 2019 and thereafter) multiplied by the total number of outstanding common and subordinated units for a period of four consecutive, non-overlapping quarters ending on or after March 31, 2019, and there are no outstanding arrearages on our common units. When the subordination period ends as a result of our having met the test described above, all subordinated units will convert into common units on a one-to-one basis, and common units will thereafter no longer be entitled to arrearages.
Preferred Units
Prior to our liquidation, and while any of our preferred units remain outstanding, cash or other property of the partnership will be distributed 100% to our preferred unitholders until the aggregate Unpaid Preferred Yield (as defined below) of each preferred unit accrued through the last day of the immediately preceding calendar quarter has been reduced to zero. Distributions in excess of the aggregate Unpaid Preferred Yield will be distributed 100% to common and subordinated unitholders, until there has been distributed an aggregate amount in respect of such calendar year equal to 10% of the aggregate Interest Fair Market Value of the outstanding common and subordinated units as of the first day of such calendar year. Any additional distributions shall be distributed to the common and subordinated unitholders, on the one hand, and the preferred unitholders, on the other hand, pro rata on an as-is-converted basis.
The terms “Interest Fair Market Value,” “Preferred Yield,” and “Unpaid Preferred Yield” have the following meanings:
“Interest Fair Market Value” means, as of any date, the amount which would be received by the holder of a common unit or subordinated unit, as applicable, if (a) all of the preferred units were converted into or exchanged or exercised for common units and, during the subordinated units, subordinated units, (b) the fair market value of the assets of the Partnership in excess of its liabilities as of the date of determination of Interest Fair Market Value equaled the value as of such date, adjusted to reflect any increases in equity value resulting from the deemed conversion, exchange or exercise of convertible securities, and (c) an amount equal to such value, as so adjusted, were distributed to the unitholders in accordance with the liquidation distribution provisions of the partnership agreement.
“Preferred Yield” means a yield on the outstanding preferred units equivalent to a 10% per annum interest rate (subject to adjustment following certain events of default by the partnership) on an initial investment of $1,000, calculated based on a 365-day year and compounded quarterly.
“Unpaid Preferred Yield” means, with respect to each preferred unit and as of any date of determination, an amount equal to the excess, if any, of (a) the cumulative Preferred Yield from the closing of this offering through the date established, over (b) the cumulative amount of distributions made as of the date established in respect of the preferred unit.
49
ITEM 6. SELECTED FINANCIAL DATA
The financial information below should be read in conjunction with “Item 7. Management’s Discussion and Analysis of Financial Condition and Results of Operations” and “Item 8. Financial Statements and Supplementary Data” of this Annual Report.
|
|
|
At December 31, |
|
|||||||||
|
|
|
2015 |
|
|
2014 |
|
|
2013 |
|
|||
|
|
|
(In thousands, except per unit amounts) |
|
|||||||||
|
Total revenue |
|
$ |
392,924 |
|
|
$ |
548,321 |
|
|
$ |
463,559 |
|
|
Net income (loss) |
|
|
(101,305 |
) |
|
|
169,187 |
|
|
|
168,963 |
|
|
Net loss attributable to the general partner and common units and subordinated units subsequent to initial public offering |
|
|
(108,017 |
) |
|
* |
|
|
* |
|
||
|
Net loss attributable to limited partners per common and subordinated unit (basic)1 |
|
|
|
|
|
|
|
|
|
|
|
|
|
Per common unit (basic) |
|
|
(0.56 |
) |
|
* |
|
|
* |
|
||
|
Per subordinated unit (basic) |
|
|
(0.56 |
) |
|
* |
|
|
* |
|
||
|
Net loss attributable to limited partners per common and subordinated unit (diluted)1 |
|
|
|
|
|
|
|
|
|
|
|
|
|
Per common unit (diluted) |
|
|
(0.56 |
) |
|
* |
|
|
* |
|
||
|
Per subordinated unit (diluted) |
|
|
(0.56 |
) |
|
* |
|
|
* |
|
||
|
Cash distributions declared per common and subordinated unit |
|
|
|
|
|
|
|
|
|
|
|
|
|
Per common unit |
|
|
0.4240 |
|
|
* |
|
|
* |
|
||
|
Per subordinated unit |
|
|
0.4240 |
|
|
* |
|
|
* |
|
||
|
Total assets2 |
|
|
1,061,436 |
|
|
|
1,326,782 |
|
|
|
1,444,413 |
|
|
Long-term debt |
|
|
66,000 |
|
|
|
394,000 |
|
|
|
451,000 |
|
|
Total mezzanine equity |
|
|
79,162 |
|
|
|
161,165 |
|
|
|
161,392 |
|
|
* |
Information is not applicable for the periods prior to our initial public offering. |
|
1 |
See Note 15 – Earnings Per Unit in the consolidated financial statements included elsewhere in this Annual Report. |
|
2 |
We recorded noncash impairments of oil and natural gas properties in the amounts of $249.6 million, $117.9 million, and $57.1 million, for the years ended December 31, 2015, 2014, and 2013, respectively. |
50
ITEM 7. MANAGEMENT’S DISCUSSION AND ANALYSIS OF FINANCIAL CONDITION AND RESULTS OF OPERATIONS
The following discussion and analysis of our financial condition and results of operations should be read in conjunction with our consolidated financial statements and notes thereto presented elsewhere in this Annual Report. This discussion and analysis contains forward-looking statements that involve risks, uncertainties, and assumptions. Actual results may differ materially from those anticipated in these forward-looking statements as a result of a number of factors, including those set forth under “Cautionary Note Regarding Forward-Looking Statements” and “Part I, Item 1A. Risk Factors.”
Overview
We are one of the largest owners of oil and natural gas mineral interests in the United States. Our principal business is maximizing the value of our existing portfolio of mineral and royalty assets through active management and expanding our asset base through acquisitions of additional mineral and royalty interests. We maximize value through the marketing of our mineral assets for lease, creative structuring of those leases to encourage and accelerate drilling activity, and selectively participating alongside our lessees on a working-interest basis. Our primary business objective is to grow our reserves, production, and cash generated from operations over the long term, while paying, to the extent practicable, a growing quarterly distribution to our unitholders.
On May 1, 2015 our common units began trading on the New York Stock Exchange under the symbol “BSM.” On May 6, 2015, we completed our initial public offering of 22,500,000 common units representing limited partner interests.
Our mineral and royalty interests consist of mineral interests in approximately 14.6 million acres, with an average 47.8% ownership interest in that acreage, NPRIs in 1.3 million acres, and ORRIs in 1.4 million acres. These non-cost-bearing interests include ownership in over 45,000 producing wells. We also own non-operated working interests, a significant portion of which are on positions where we also have a mineral and royalty interest. We recognize oil and natural gas revenue from our mineral and royalty and non-operated working interests in producing wells when the oil and natural gas production from the associated acreage is sold. Our other sources of revenue include mineral lease bonus and delay rentals, which are recognized as revenue according to the terms of the lease agreements.
Recent Developments
Common Unit Repurchase Program
On March 4, 2016, the board of directors of our general partner authorized the repurchase of up to $50.0 million in common units over the next six months. The repurchase program authorizes us to make repurchases on a discretionary basis as determined by management, subject to market conditions, applicable legal requirements, available liquidity, and other appropriate factors. All or a portion of any repurchases may be made under a Rule 10b5-1 plan, which would permit common units to be repurchased when we might otherwise be precluded from doing so under insider trading laws. The repurchase program does not obligate us to acquire any particular amount of common units and may be modified or suspended at any time and could be terminated prior to completion. We will periodically report the number of common units repurchased. The repurchase program will be funded from our cash on hand or available revolving credit facility. Any repurchased common units will be cancelled.
Cash Tender Offer
On November 6, 2015, we commenced a tender offer to purchase up to 100% of the 117,963 then outstanding preferred units from our preferred unitholders at the units’ par value of $1,000.00 per preferred unit, plus unpaid accrued yield. The tender offer expired on December 10, 2015. We purchased and cancelled 40,747 preferred units, representing 34.5% of our then outstanding preferred units. The preferred units were purchased at a purchase price of $1,019.45 per preferred unit for a total cost of approximately $41.5 million, excluding fees and expenses relating to the tender offer.
Acquisitions
We closed five separate transactions to acquire unproved oil and natural gas properties in the Permian Basin during 2015 for a total $51.7 million. We acquired acreage in the Eagle Ford Shale play through two transactions totaling $9.7 million during 2015, and we also acquired an overriding royalty interest in the Utica Shale and Marcellus plays for $1.8 million.
Business Environment
The information below is designed to give a broad overview of the oil and natural gas business environment as it affects us.
51
Oil and natural gas prices have been historically volatile based upon the dynamics of supply and demand. During 2015, oil and natural gas prices have remained significantly below prices seen over the past five years as global concerns of long-term supply imbalances and slowing demand growth have continued to weigh on prices. West Texas Intermediate (“WTI”) spot prices ranged from a low of $34.55 per Bbl on December 21, 2015 to a high of $61.36 per Bbl on June 10, 2015. Oil prices have continued to be pressured downward following the end of the year, reaching a low of $26.19 per Bbl on February 11, 2016. During 2015, Henry Hub spot natural gas prices ranged from a low of $1.63 per MMBtu on December 23, 2015 to a high of $3.32 per MMBtu on January 15, 2015. The Henry Hub spot price closed at $1.62 per MMBtu on February 29, 2016. To manage the variability in cash flows associated with the projected sale of our oil and natural gas production, we use various derivative instruments, which have generally consisted of fixed-price swaps and costless collars.
The following table reflects commodity prices at the end of each of the four quarters for the most recently completed fiscal year:
|
|
|
2015 |
|
|||||||||||||
|
Benchmark Prices |
|
First Quarter |
|
|
Second Quarter |
|
|
Third Quarter |
|
|
Fourth Quarter |
|
||||
|
WTI spot oil price ($/Bbl) |
|
$ |
47.72 |
|
|
$ |
59.48 |
|
|
$ |
45.06 |
|
|
$ |
37.13 |
|
|
Henry Hub spot natural gas ($/MMBtu) |
|
$ |
2.65 |
|
|
$ |
2.80 |
|
|
$ |
2.47 |
|
|
$ |
2.28 |
|
Source: EIA
Rig Count
Since we are not an operator, drilling on our acreage is dependent upon the exploration and production companies that lease our acreage. In addition to drilling plans that we seek from our operators, we monitor rig counts in an effort to identify existing and future leasing and drilling activity on our acreage.
The following table shows the rig count at the end of each of the four quarters for the most recently completed fiscal year:
|
|
|
2015 |
|
|||||||||||||
|
U.S. Rotary Rig Count |
|
First Quarter |
|
|
Second Quarter |
|
|
Third Quarter |
|
|
Fourth Quarter |
|
||||
|
Oil |
|
|
813 |
|
|
|
628 |
|
|
|
641 |
|
|
|
536 |
|
|
Natural gas |
|
|
233 |
|
|
|
228 |
|
|
|
197 |
|
|
|
162 |
|
|
Other |
|
|
2 |
|
|
|
3 |
|
|
|
— |
|
|
|
— |
|
|
Total |
|
|
1,048 |
|
|
|
859 |
|
|
|
838 |
|
|
|
698 |
|
Source: Baker Hughes Incorporated
Natural Gas Storage
A substantial portion of our revenue is derived from sales of oil production attributable to our interests; however, the majority of our production is natural gas. Natural gas prices are significantly influenced by storage levels throughout the year. Accordingly, we monitor the natural gas storage reports regularly in the evaluation of our business and its outlook.
Historically, natural gas supply and demand fluctuates on a seasonal basis. From April to October, when the weather is warmer and natural gas demand is lower, natural gas storage levels generally increase. From November to March, storage levels typically decline as utility companies draw natural gas from storage to meet increased heating demand due to colder weather. In order to maintain sufficient storage levels for increased seasonal demand, a portion of natural gas production during the summer months must be used for storage injection. The portion of production used for storage varies from year to year depending on the demand from the previous winter and the demand for electricity used for cooling during the summer months.
52
The following table shows natural gas storage volumes by region at the end of each of the four quarters for the most recently completed fiscal year:
|
|
|
2015 |
|
|||||||||||||
|
Region |
|
First Quarter |
|
|
Second Quarter |
|
|
Third Quarter |
|
|
Fourth Quarter |
|
||||
|
|
|
(Bcf) |
|
|||||||||||||
|
East |
|
|
255 |
|
|
|
552 |
|
|
|
837 |
|
|
|
876 |
|
|
Midwest |
|
|
261 |
|
|
|
546 |
|
|
|
952 |
|
|
|
1,025 |
|
|
Mountain |
|
|
114 |
|
|
|
155 |
|
|
|
201 |
|
|
|
195 |
|
|
Pacific |
|
|
269 |
|
|
|
333 |
|
|
|
355 |
|
|
|
338 |
|
|
South Central |
|
|
562 |
|
|
|
993 |
|
|
|
1,192 |
|
|
|
1,322 |
|
|
Total |
|
|
1,461 |
|
|
|
2,579 |
|
|
|
3,537 |
|
|
|
3,756 |
|
Source: EIA
How We Evaluate Our Operations
We use a variety of operational and financial measures to assess our performance. Among the measures considered by management are the following:
|
|
· |
volumes of oil and natural gas produced; |
|
|
· |
commodity prices including the effect of hedges; and |
|
|
· |
EBITDA, Adjusted EBITDA, and cash available for distribution. |
Volumes of Oil and Natural Gas Produced
In order to assess and track the performance of our assets, we monitor and analyze production volumes from the various basins and plays that comprise our extensive asset base. We also regularly compare projected volumes to actual reported volumes and investigate unexpected variations.
Commodity Prices
Factors Affecting the Sales Price of Oil and Natural Gas
The prices we receive for oil, natural gas, and NGLs vary by geographical area. The relative prices of these products are determined by the factors affecting global and regional supply and demand dynamics, such as economic conditions, production levels, availability of transportation, weather cycles, and other factors. In addition, realized prices are influenced by product quality and proximity to consuming and refining markets. Any differences between realized prices and NYMEX prices are referred to as differentials. All of our production is derived from properties located in the United States. As a result of our geographic diversification, we are not exposed to concentrated differential risks associated with any single play, trend, or basin.
|
|
· |
Oil. The substantial majority of our oil production is sold at prevailing market prices, which fluctuate in response to many factors that are outside of our control. NYMEX light sweet crude oil, commonly referred to as WTI, is the prevailing domestic oil pricing index. The majority of our oil production is priced at the prevailing market price with the final realized price affected by both quality and location differentials. |
The chemical composition of crude oil plays an important role in its refining and subsequent sale as petroleum products. As a result, variations in chemical composition relative to the benchmark crude oil, usually WTI, will result in price adjustments, which are often referred to as quality differentials. The characteristics that most significantly affect quality differentials include the density of the oil, as characterized by its API gravity, and the presence and concentration of impurities, such as sulfur.
Location differentials generally result from transportation costs based on the produced oil’s proximity to consuming and refining markets and major trading points.
53
Quality differentials result from the heating value of natural gas measured in Btus and the presence of impurities, such as hydrogen sulfide, carbon dioxide, and nitrogen. Natural gas containing ethane and heavier hydrocarbons has a higher Btu value and will realize a higher volumetric price than natural gas made up of predominantly methane, which has a lower Btu value. Natural gas with a higher concentration of impurities will realize a lower volumetric price due to the presence of the impurities in the natural gas when sold or the cost of treating the natural gas to meet pipeline quality specifications.
Natural gas, which currently has a limited global transportation system, is subject to price variances based on local supply and demand conditions and the cost to transport natural gas to end user markets.
Hedging
We enter into derivative instruments to partially mitigate the impact of commodity price volatility on our cash generated from operations. From time to time, such instruments may include fixed-price swaps, costless collars, fixed-price contracts, and other contractual arrangements. We currently employ a “rolling hedge” strategy whereby we hedge a significant portion of our proved developed producing reserves 18 to 24 months into the future. The impact of these derivative instruments could affect the amount of revenue we ultimately realize. Throughout 2014, we entered into costless collars to allow us the ability to participate in upward movements in commodity prices while also setting a price floor for a portion of our production. Costless collars are a combination of a purchased put option and a sold call option, in which the premiums paid and received net to zero. During the fourth quarter of 2014 and all of 2015, we also entered into fixed-price swap contracts. Under fixed-price swap contracts, a counterparty is required to make a payment to us if the settlement price for any settlement period is less than the swap strike price; conversely, we are required to make a payment to the counterparty if the settlement price for any settlement period is greater than the swap strike price. We may employ contractual arrangements other than costless collars and fixed-price swap contracts in the future to mitigate the impact of price fluctuations. If commodity prices decline in the future, our hedging contracts will partially mitigate the effect of lower prices on our future revenue.
Our open oil and natural gas derivative contracts as of December 31, 2015 are detailed in Note 5 – Derivatives and Financial Instruments to our consolidated financial statements included elsewhere in this Annual Report. Our credit facility agreement limits the extent to which we can hedge our future production. Under the terms of our credit facility agreement, we are able to hedge estimated production from our proved developed producing reserves based on our most recently completed reserve report provided to our lenders. We do not enter into derivative instruments for speculative purposes. Including derivative contracts entered into subsequent to December 31, 2015, we have hedged 91.7%, and 44.2% of our estimated oil and condensate production and 92.5%, and 46.5% of our estimated natural gas production from our proved developed producing reserves for 2016 and 2017, respectively.
Non-GAAP Financial Measures
EBITDA, Adjusted EBITDA, and cash available for distribution are supplemental non-GAAP financial measures used by our management and external users of our financial statements such as investors, research analysts, and others, to assess the financial performance of our assets and our ability to sustain distributions over the long term without regard to financing methods, capital structure, or historical cost basis.
We define EBITDA as net income (loss) before interest expense, income taxes and depreciation, depletion, and amortization. We define Adjusted EBITDA as EBITDA adjusted for impairment of oil and natural gas properties, accretion of ARO, unrealized gains and losses on derivative instruments, and non-cash equity-based compensation. We define cash available for distribution as Adjusted EBITDA plus or minus amounts for certain non-cash operating activities, borrowings for capital expenditures, capital expenditures, cash interest expense, and distributions to noncontrolling interests and preferred unitholders.
EBITDA, Adjusted EBITDA, and cash available for distribution should not be considered an alternative to, or more meaningful than, net income (loss), income (loss) from operations, cash flows from operating activities, or any other measure of financial performance presented in accordance with GAAP as measures of our financial performance. EBITDA, Adjusted EBITDA, and cash available for distribution have important limitations as analytical tools because they exclude some but not all items that affect net income (loss), the most directly comparable GAAP financial measure. Our computation of EBITDA, Adjusted EBITDA, and cash available for distribution may differ from computations of similarly titled measures of other companies.
54
The following table presents a reconciliation of EBITDA, Adjusted EBITDA, and cash available for distribution to net income, the most directly comparable GAAP financial measure, for the periods indicated.
|
|
|
Year Ended December 31, |
|
|||||||||
|
|
|
2015 |
|
|
2014 |
|
|
2013 |
|
|||
|
|
|
(In thousands) |
|
|||||||||
|
Net income (loss) |
|
$ |
(101,305 |
) |
|
$ |
169,187 |
|
|
$ |
168,963 |
|
|
Adjustments to reconcile to Adjusted EBITDA: |
|
|
|
|
|
|
|
|
|
|
|
|
|
Add: |
|
|
|
|
|
|
|
|
|
|
|
|
|
Depreciation, depletion and amortization |
|
|
104,298 |
|
|
|
111,962 |
|
|
|
102,442 |
|
|
Interest expense |
|
|
6,418 |
|
|
|
13,509 |
|
|
|
11,342 |
|
|
EBITDA |
|
|
9,411 |
|
|
|
294,658 |
|
|
|
282,747 |
|
|
Add: |
|
|
|
|
|
|
|
|
|
|
|
|
|
Impairment of oil and natural gas properties |
|
|
249,569 |
|
|
|
117,930 |
|
|
|
57,109 |
|
|
Accretion of asset retirement obligations |
|
|
1,075 |
|
|
|
1,060 |
|
|
|
588 |
|
|
Equity-based compensation |
|
|
18,000 |
|
|
|
11,340 |
|
|
|
6,782 |
|
|
Unrealized loss on commodity derivative instruments |
|
|
— |
|
|
|
— |
|
|
|
7,350 |
|
|
Less: |
|
|
|
|
|
|
|
|
|
|
|
|
|
Unrealized gain on commodity derivative instruments |
|
|
(27,063 |
) |
|
|
(39,283 |
) |
|
|
— |
|
|
Adjusted EBITDA |
|
|
250,992 |
|
|
|
385,705 |
|
|
|
354,576 |
|
|
Adjustments to reconcile to cash generated from operations: |
|
|
|
|
|
|
|
|
|
|
|
|
|
Add: |
|
|
|
|
|
|
|
|
|
|
|
|
|
Borrowings/cash used to fund additions to and acquisitions of oil and natural gas properties |
|
|
116,522 |
|
|
|
119,753 |
|
|
|
195,212 |
|
|
Restructuring charges |
|
|
4,208 |
|
|
|
— |
|
|
|
— |
|
|
Incremental general and administrative related to initial public offering |
|
|
1,303 |
|
|
|
— |
|
|
|
— |
|
|
Loss on sales of assets, net |
|
|
— |
|
|
|
32 |
|
|
|
— |
|
|
Less: |
|
|
|
|
|
|
|
|
|
|
|
|
|
Deferred revenue |
|
|
(660 |
) |
|
|
(2,589 |
) |
|
|
— |
|
|
Cash interest expense |
|
|
(5,483 |
) |
|
|
(12,544 |
) |
|
|
(10,374 |
) |
|
Gain on sales of assets, net |
|
|
(4,873 |
) |
|
|
— |
|
|
|
(18 |
) |
|
Additions to oil and natural gas properties |
|
|
(54,244 |
) |
|
|
(74,201 |
) |
|
|
(73,650 |
) |
|
Acquisitions of oil and natural gas properties |
|
|
(62,278 |
) |
|
|
(45,552 |
) |
|
|
(121,562 |
) |
|
Cash generated from operations |
|
|
245,487 |
|
|
|
370,604 |
|
|
|
344,184 |
|
|
Less: |
|
|
|
|
|
|
|
|
|
|
|
|
|
Cash paid to noncontrolling interests |
|
|
(208 |
) |
|
|
(307 |
) |
|
|
(767 |
) |
|
Redeemable preferred unit distributions |
|
|
(11,562 |
) |
|
|
(15,720 |
) |
|
|
(15,742 |
) |
|
Cash generated from operations available for distribution on common and subordinated units and reinvestment in our business |
|
$ |
233,717 |
|
|
$ |
354,577 |
|
|
$ |
327,675 |
|
Factors Affecting the Comparability of Our Financial Results
Our financial condition and results of operations for the periods presented may not be comparable, either from period to period or going forward, because we will incur higher general and administrative expenses than in prior periods as a result of operating as a publicly traded partnership. These incremental expenses include costs associated with SEC reporting requirements, including annual and quarterly reports to unitholders; tax return and Schedule K-1 preparation and distribution; Sarbanes-Oxley Act compliance; New York Stock Exchange listing fees; independent registered public accounting firm fees; legal fees, investor-relations activities, registrar and transfer agent fees; director-and-officer insurance; and additional compensation. These direct, incremental general and administrative expenses are not included in our historical results of operations for periods prior to our IPO.
55
Year Ended December 31, 2015 Compared to Year Ended December 31, 2014
The following table shows our production, revenues, and expenses for the periods presented:
|
|
|
Year Ended December 31, |
|
|||||||||||||
|
|
|
2015 |
|
|
2014 |
|
|
Variance |
|
|||||||
|
|
|
(Dollars in thousands, except for realized prices and per BOE data) |
|
|||||||||||||
|
Production: |
|
|
|
|
|
|
|
|
|
|
|
|
|
|
|
|
|
Oil and condensate (MBbls)1 |
|
|
3,565 |
|
|
|
3,005 |
|
|
|
560 |
|
|
|
18.6 |
% |
|
Natural gas (MMcf)1 |
|
|
41,389 |
|
|
|
42,273 |
|
|
|
(884 |
) |
|
|
(2.1 |
%) |
|
Equivalents (MBoe) |
|
|
10,463 |
|
|
|
10,051 |
|
|
|
|
|
|
|
|
|
|
Revenue: |
|
|
|
|
|
|
|
|
|
|
|
|
|
|
|
|
|
Oil and condensate sales |
|
$ |
163,538 |
|
|
$ |
257,390 |
|
|
$ |
(93,852 |
) |
|
|
(36.5 |
%) |
|
Natural gas and natural gas liquids sales |
|
|
116,018 |
|
|
|
207,456 |
|
|
|
(91,438 |
) |
|
|
(44.1 |
%) |
|
Gain on commodity derivative instruments |
|
|
90,288 |
|
|
|
37,336 |
|
|
|
52,952 |
|
|
|
141.8 |
% |
|
Lease bonus and other income |
|
|
23,080 |
|
|
|
46,139 |
|
|
|
(23,059 |
) |
|
|
(50.0 |
%) |
|
Total revenue |
|
$ |
392,924 |
|
|
$ |
548,321 |
|
|
|
|
|
|
|
|
|
|
Realized prices: |
|
|
|
|
|
|
|
|
|
|
|
|
|
|
|
|
|
Oil and condensate ($/Bbl) |
|
$ |
45.87 |
|
|
$ |
85.65 |
|
|
$ |
(39.78 |
) |
|
|
(46.4 |
%) |
|
Natural gas ($/Mcf)1 |
|
$ |
2.80 |
|
|
$ |
4.91 |
|
|
$ |
(2.11 |
) |
|
|
(43.0 |
%) |
|
Equivalents ($/Boe) |
|
$ |
26.72 |
|
|
$ |
46.25 |
|
|
|
|
|
|
|
|
|
|
Operating expenses: |
|
|
|
|
|
|
|
|
|
|
|
|
|
|
|
|
|
Lease operating expense |
|
$ |
21,583 |
|
|
$ |
21,233 |
|
|
$ |
350 |
|
|
|
1.6 |
% |
|
Production costs and ad valorem taxes |
|
|
35,767 |
|
|
|
49,575 |
|
|
|
(13,808 |
) |
|
|
(27.9 |
%) |
|
Exploration expense |
|
|
2,592 |
|
|
|
631 |
|
|
|
1,961 |
|
|
|
310.8 |
% |
|
Depreciation, depletion, and amortization |
|
|
104,298 |
|
|
|
111,962 |
|
|
|
(7,664 |
) |
|
|
(6.8 |
%) |
|
Impairment of oil and natural gas properties |
|
|
249,569 |
|
|
|
117,930 |
|
|
|
131,639 |
|
|
|
111.6 |
% |
|
General and administrative |
|
|
77,175 |
|
|
|
62,765 |
|
|
|
14,410 |
|
|
|
23.0 |
% |
|
Per Boe: |
|
|
|
|
|
|
|
|
|
|
|
|
|
|
|
|
|
Lease operating expense |
|
$ |
2.06 |
|
|
$ |
2.11 |
|
|
$ |
(0.05 |
) |
|
|
(2.4 |
%) |
|
Production costs and ad valorem taxes |
|
|
3.42 |
|
|
|
4.93 |
|
|
|
(1.51 |
) |
|
|
(30.6 |
%) |
|
Depreciation, depletion, and amortization |
|
|
9.97 |
|
|
|
11.14 |
|
|
|
(1.17 |
) |
|
|
(10.5 |
%) |
|
General and administrative |
|
|
7.38 |
|
|
|
6.24 |
|
|
|
1.14 |
|
|
|
18.3 |
% |
|
1 |
As a mineral-and-royalty-interest owner, we are often provided insufficient and inconsistent data by our operators. As a result, we are unable to reliably determine the total volumes of NGLs associated with the production of natural gas on our acreage. As such, the realized prices account for all sales attributable to NGLs. The oil and condensate production volumes and natural gas production volumes do not include NGL volumes. |
Revenues
The decrease in total revenues for the year ended December 31, 2015 compared to the year ended December 31, 2014 was due to a decrease of $228.9 million from lower realized commodity prices and $23.1 million of reduced lease bonus activity, partially offset by $52.9 million of gains attributable to commodity derivative instruments and $43.6 million related to higher oil and condensate production volumes.
Oil and condensate sales. Oil and condensate sales during 2015 were lower than the corresponding period in 2014 primarily due to a steep decline in realized prices. Our mineral-and-royalty-interest oil volumes accounted for 76.8% and 74.7% of total oil and condensate volumes for the year ended December 31, 2015 and the year ended December 31, 2014, respectively. Our mineral-and-royalty-interest oil volumes increased in 2015 relative to 2014 primarily driven by production increases from new wells in the Bakken/Three Forks and Eagle Ford plays. Our working-interest oil and condensate volumes increased during 2015 versus 2014 primarily due to volumes added from new wells in the Bakken/Three Forks and Wilcox plays.
Natural gas and natural gas liquids sales. Natural gas revenues decreased for the year ended December 31, 2015 as compared to 2014. A significant decline in the realized natural gas and NGL prices for the year ended December 31, 2015 versus the corresponding period in 2014 was primarily responsible for the decrease in our natural gas and NGL revenues. Mineral-and-royalty-
56
interest production made up 67.3% and 67.8% of our natural gas volumes for the year ended December 31, 2015 and 2014, respectively.
Gain on commodity derivative instruments. In 2015, we recognized $57.7 million of gains from oil commodity contracts, of which $15.9 million were realized, compared to $27.5 million of combined gains in 2014, virtually all of which were unrealized. In 2015, we recognized $32.6 million of gains from natural gas commodity contracts, of which $11.2 million were unrealized, compared to $9.8 million of net gains in 2014, of which $11.8 million were unrealized gains.
Lease bonus and other income. Lease bonus and delay rental revenue decreased for the year ended December 31, 2015 as compared to 2014. In 2014, we successfully closed several large leases in the Canyon Lime and Canyon Wash plays in north Texas, the Permian Basin in west Texas, the Austin Chalk and Woodbine play in east Texas, the Tuscaloosa Marine Shale play in Mississippi and the Bakken play in North Dakota. While we closed large lease transactions in 2015 in the Wolfcamp, the Eagle Ford Shale, various plays in East Texas and in Southern Mississippi, the total number of leases was down significantly from 2014.
Operating Expenses
Lease operating expenses. Lease operating expense includes normally recurring expenses necessary to produce hydrocarbons from our non-operated working interests in oil and natural gas wells, as well as certain nonrecurring expenses, such as well repairs. Lease operating expense increased slightly for the year ended December 31, 2015 as compared to 2014, primarily due to higher oil and condensate production.
Production costs and ad valorem taxes. Production taxes include statutory amounts deducted from our production revenues by various state taxing entities. Depending on the regulations of the states where the production originates, these taxes may be based on a percentage of the realized value or a fixed amount per production unit. This category also includes the costs to process and transport our production to applicable sales points. Ad valorem taxes are jurisdictional taxes levied on the value of oil and natural gas minerals and reserves. Rates, methods of calculating property values, and timing of payments vary between taxing authorities. For the year ended December 31, 2015, production and ad valorem taxes decreased over the year ended December 31, 2014, generally as a result of lower realized commodity prices and estimated mineral reserve valuations.
Exploration expense. Exploration expense typically consists of dry-hole expenses and geological and geophysical costs, including seismic costs, and is expensed as incurred under the successful efforts method of accounting. Exploration expense for the year ended December 31, 2015 increased from the year ended December 31, 2014, primarily due to costs incurred to acquire 3-D seismic information related to our mineral and royalty interests from a third-party service provider.
Depreciation, depletion, and amortization. Depletion is the amount of cost basis of oil and natural gas properties attributable to the volume of hydrocarbons extracted during such period, calculated on a units-of-production basis. Estimates of proved developed producing reserves are a major component of the calculation of depletion. We adjust our depletion rates semi-annually based upon the mid-year and year-end reserve reports, except when circumstances indicate that there has been a significant change in reserves or costs. Depreciation, depletion, and amortization expense decreased for the year ended December 31, 2015 as compared to 2014, primarily due to higher production rates offset by the impact of a reduced cost basis resulting from impairment charges related to prior periods.
Impairment of oil and natural gas properties. Individual categories of oil and natural gas properties are assessed periodically to determine if the net book value for these properties has been impaired. Management periodically conducts an in-depth evaluation of the cost of property acquisitions, successful exploratory wells, development activities, unproved leasehold, and mineral interests to identify impairments. Impairments for the years ended December 31, 2015 and 2014 primarily resulted from changes in reserve values due to declines in future expected realized net cash flows as a result of lower commodity prices.
General and administrative. General and administrative expenses are costs not directly associated with the production of oil and natural gas and include the cost of employee salaries and related benefits, office expenses, and fees for professional services. For the year ended December 31, 2015, general and administrative expenses increased compared to 2014. In 2015, personnel costs and costs attributable to our long-term incentive plans were $12.3 million higher primarily due to an increase in incentive compensation awards granted subsequent to our IPO and certain restructuring costs. We also incurred an additional $2.5 million for our Sarbanes-Oxley Act compliance project and other consulting work during 2015.
Interest expense. Interest expense decreased due to lower average outstanding borrowing under our credit facility. Outstanding borrowings during 2015 were lower than 2014, primarily due to payments made towards the outstanding balance of our credit facility with proceeds from our IPO.
57
Year Ended December 31, 2014 Compared to Year Ended December 31, 2013
The following table shows our production, revenues, and expenses for the periods presented:
|
|
|
Year Ended December 31, |
|
|||||||||||||
|
|
|
2014 |
|
|
2013 |
|
|
Variance |
|
|||||||
|
|
|
(Dollars in thousands, except for realized prices and per BOE data) |
|
|||||||||||||
|
Production: |
|
|
|
|
|
|
|
|
|
|
|
|
|
|
|
|
|
Oil and condensate (MBbls)1 |
|
|
3,005 |
|
|
|
2,626 |
|
|
|
379 |
|
|
|
14.4 |
% |
|
Natural gas (MMcf)1 |
|
|
42,273 |
|
|
|
45,400 |
|
|
|
(3,127 |
) |
|
|
(6.9 |
%) |
|
Equivalents (MBoe) |
|
|
10,051 |
|
|
|
10,193 |
|
|
|
|
|
|
|
|
|
|
Revenue: |
|
|
|
|
|
|
|
|
|
|
|
|
|
|
|
|
|
Oil and condensate sales |
|
$ |
257,390 |
|
|
$ |
252,742 |
|
|
$ |
4,648 |
|
|
|
1.8 |
% |
|
Natural gas and natural gas liquids sales |
|
|
207,456 |
|
|
|
184,868 |
|
|
|
22,588 |
|
|
|
12.2 |
% |
|
Gain (loss) on commodity derivative instruments |
|
|
37,336 |
|
|
|
(5,860 |
) |
|
|
43,196 |
|
|
NM |
|
|
|
Lease bonus and other income |
|
|
46,139 |
|
|
|
31,809 |
|
|
|
14,330 |
|
|
|
45.1 |
% |
|
Total revenue |
|
$ |
548,321 |
|
|
$ |
463,559 |
|
|
|
|
|
|
|
|
|
|
Realized prices: |
|
|
|
|
|
|
|
|
|
|
|
|
|
|
|
|
|
Oil and condensate ($/Bbl) |
|
$ |
85.65 |
|
|
$ |
96.25 |
|
|
$ |
(10.60 |
) |
|
|
(11.0 |
%) |
|
Natural gas ($/Mcf)1 |
|
$ |
4.91 |
|
|
$ |
4.07 |
|
|
$ |
0.84 |
|
|
|
20.6 |
% |
|
Equivalents ($/Boe) |
|
$ |
46.25 |
|
|
$ |
42.93 |
|
|
|
|
|
|
|
|
|
|
Operating expenses: |
|
|
|
|
|
|
|
|
|
|
|
|
|
|
|
|
|
Lease operating expense |
|
$ |
21,233 |
|
|
$ |
21,142 |
|
|
$ |
91 |
|
|
|
0.4 |
% |
|
Production costs and ad valorem taxes |
|
|
49,575 |
|
|
|
42,813 |
|
|
|
6,762 |
|
|
|
15.8 |
% |
|
Exploration expense |
|
|
631 |
|
|
|
174 |
|
|
|
457 |
|
|
|
262.6 |
% |
|
Depreciation, depletion, and amortization |
|
|
111,962 |
|
|
|
102,442 |
|
|
|
9,520 |
|
|
|
9.3 |
% |
|
Impairment of oil and natural gas properties |
|
|
117,930 |
|
|
|
57,109 |
|
|
|
60,821 |
|
|
|
106.5 |
% |
|
General and administrative |
|
|
62,765 |
|
|
|
59,501 |
|
|
|
3,264 |
|
|
|
5.5 |
% |
|
Per Boe: |
|
|
|
|
|
|
|
|
|
|
|
|
|
|
|
|
|
Lease operating expense |
|
$ |
2.11 |
|
|
$ |
2.07 |
|
|
$ |
0.04 |
|
|
|
1.9 |
% |
|
Production costs and ad valorem taxes |
|
|
4.93 |
|
|
|
4.20 |
|
|
|
0.73 |
|
|
|
17.4 |
% |
|
Depreciation, depletion, and amortization |
|
|
11.14 |
|
|
|
10.05 |
|
|
|
1.09 |
|
|
|
10.8 |
% |
|
General and administrative |
|
|
6.24 |
|
|
|
5.84 |
|
|
|
0.40 |
|
|
|
6.8 |
% |
|
1 |
As a mineral-and-royalty-interest owner, we are often provided insufficient and inconsistent data by our operators. As a result, we are unable to reliably determine the total volumes of NGLs associated with the production of natural gas on our acreage. As such, the realized prices account for all sales attributable to NGLs. The oil and condensate production volumes and natural gas production volumes do not include NGL volumes. |
Revenues
Total revenue. The increase in total revenues for the year ended December 31, 2014 compared to the year ended December 31, 2013 was made up of $43.2 million from commodity derivative instruments, $23.8 million resulting from higher production volumes, $14.3 million from higher lease bonus, and $3.4 million from higher realized commodity prices.
Oil and condensate sales. Oil and condensate sales during the period were higher than the corresponding period in 2013 primarily due to an increase in production volumes. Our mineral-and-royalty-interest oil volumes accounted for 74.7% and 73.7% of total oil and condensate volumes for the year ended December 31, 2014 and the year ended December 31, 2013, respectively. The 16.1% increase in mineral-and-royalty-interest oil volumes, in 2014 relative to 2013 was driven primarily by production increases from new wells in the Eagle Ford Shale. Our working-interest oil volumes increased by 9.8% during 2014 versus 2013 primarily due to volumes added from new wells in the Bakken/Three Forks plays. The decrease in realized oil prices partially offset the impact on revenues from the increase in oil and condensate production.
Natural gas and natural gas liquids sales. An increase in the realized natural gas price for the twelve months of 2014 versus the same period in 2013 was responsible for the growth in our natural gas revenues. The favorable price variance was partially offset by a decrease in produced volumes. As we expected, natural gas production declined from period to period. The decline in both mineral-and-royalty-interest and working-interest volumes was primarily driven by the run-off in production in the Hayneville/Bossier Shale
58
plays. In 2008 and 2009, we entered into lease agreements which covered the majority of our Hayneville/Bossier Shale acreage in Louisiana and Texas. As operators drilled wells to hold acreage, our natural gas production increased significantly in the plays, with volumes peaking in 2012. With most acreage now held by production, many operators have moved drilling rigs out of the plays. Although these wells initially produce at high rates, they tend to decline rapidly. Without consistent drilling activity to replace the high decline rates of the individual wells, the overall production rate from the plays has declined. While operators have recently begun to increase the drilling activity on our acreage, production from these new wells has not yet reached the point of offsetting declines in existing wells. Mineral-and-royalty-interest production made up 67.8% and 62.7% of our natural gas volumes for the period ending December 31, 2014 and 2013, respectively.
Gain (loss) on commodity derivative instruments. In 2014, global oil inventories increased to the largest level since 2008. Supply and demand imbalances caused oil prices to decline sharply during the latter half of the year. In addition, robust domestic natural gas production coupled with a warmer than normal winter contributed to lower than average natural gas storage withdrawals. Natural gas prices reflected the abundant supplies. We used derivative instruments to mitigate the risk and resulting impact of such volatility. In 2014, we recognized $27.5 million of combined gains from oil commodity contracts, virtually all of which were unrealized, compared to $3.5 million of combined losses in 2013. In 2014, we recognized $9.8 million of net gains from natural gas commodity contracts, of which $11.8 million were unrealized, compared to $2.4 million of net losses in 2013.
Lease bonus and other income. The increase in lease bonus and other income for the year ended December 31, 2014 as compared to the same period in 2013 was primarily due to the successful closing of several significant leases in the Canyon Lime and Canyon Wash plays in north Texas and the Permian Basin during 2014.
Operating Expenses
Lease operating expense. Lease operating expense was substantially consistent between periods.
Production costs and ad valorem taxes. For the year ended December 31, 2014, production and ad valorem taxes increased over the year ended December 31, 2013 as a result of higher oil and natural gas sales.
Exploration expense. Exploration expense for the year ended December 31, 2014 increased from the same period in 2013 due to costs related to a dry hole that was drilled during 2014.
Depreciation, depletion, and amortization. Depreciation, depletion, and amortization increased primarily due to an increase in our overall average depletion rate by field. The average depletion rate increased because of downward reserve revisions, which resulted from adjustments to estimates made by NSAI for projected lease operating expenses and natural gas shrinkage. In addition, during the second half of 2014, we experienced higher depletion expense for certain working-interest wells due to rapidly declining reservoir characteristics. Lower natural gas production volumes served to partially mitigate this increase in depletion rates.
Impairment of oil and natural gas properties. Impairments totaled $117.9 million for the year ended December 31, 2014 primarily due to changes in reserve values resulting from the drop in commodity prices and other factors. Impairments totaled $57.1 million for the year ended December 31, 2013 primarily due to the impact that changes in price had on the value of our reserve estimates.
General and administrative. For the year ended December 31, 2014, general and administrative expenses increased as compared to 2013 primarily due to higher personnel costs and costs attributable to our long-term incentive plans. While our overall general and administrative expenses increased for 2014, our 2014 legal and broker fees were lower due to nonrecurring costs incurred to consummate our 2013 exchange offer and a one-time acquisition-related broker fee payment incurred in the prior period.
Interest expense. Interest expense increased due to additional borrowings under our credit facility. Outstanding borrowings during 2014 were higher than 2013, primarily due to increased expenditures for acquisitions, drilling activity, and common equity repurchases during 2013.
Liquidity and Capital Resources
Overview
Our primary sources of liquidity are cash generated from operations, borrowings under our credit facility, and proceeds from any future issuances of equity and debt. Our primary uses of cash are for distributions to our unitholders and for investing in our
59
business, specifically the acquisition of mineral-and-royalty and working interests and the development of our oil and natural gas properties.
The board of directors of our general partner has adopted a policy pursuant to which distributions equal in amount to the applicable minimum quarterly distribution will be paid on each common and subordinated unit for each quarter to the extent we have sufficient cash generated from our operations after establishment of cash reserves, if any, and after we have made the required distributions to the holders of our outstanding preferred units. However, we do not have a legal or contractual obligation to pay distributions quarterly or on any other basis, at the applicable minimum quarterly distribution rate or at any other rate, and there is no guarantee that we will pay distributions to our unitholders in any quarter. Our minimum quarterly distribution provides the common unitholders a specified priority right to distributions over the subordinated unitholders. The board of directors of our general partner may change the foregoing distribution policy at any time and from time to time.
We intend to finance our future acquisitions and working-interest capital needs with cash generated from operations, borrowings from our credit facility, and proceeds from any future issuances of equity and debt. Replacement capital expenditures are expenditures necessary to replace our existing oil and natural gas reserves or otherwise maintain our asset base over the long-term. Like a number of other master limited partnerships, we are required by our partnership agreement to retain cash from our operations in an amount equal to our estimated replacement capital requirements. We have set our distribution rate at a level we believe will allow us to retain in our business sufficient cash generated from our operations to satisfy our replacement capital expenditures needs and to fund a portion of our growth capital expenditures. The board of directors of our general partner is responsible for establishing the amount of our estimated replacement capital expenditures.
Cash Flows
The following table shows our cash flows for the periods presented:
|
|
|
Year Ended December 31, |
|
|||||||||
|
|
|
2015 |
|
|
2014 |
|
|
2013 |
|
|||
|
|
|
(In thousands) |
|
|||||||||
|
Cash flows provided by operating activities |
|
$ |
284,735 |
|
|
$ |
396,125 |
|
|
$ |
320,764 |
|
|
Cash flows used in investing activities |
|
|
(90,998 |
) |
|
|
(101,110 |
) |
|
|
(195,631 |
) |
|
Cash flows used in financing activities |
|
|
(195,307 |
) |
|
|
(310,335 |
) |
|
|
(142,311 |
) |
Year Ended December 31, 2015 Compared to Year Ended December 31, 2014
Operating Activities. Our operating cash flow is dependent, in large part, on our production, realized commodity prices, leasing revenues, and operating expenses. For the year ended December 31, 2015, cash flows from operating activities decreased by $111.4 million. This decrease was primarily due to lower cash collections of $190.0 million related to oil and natural gas sales and lease bonus revenue as compared to 2014; the impact of $65.2 million in higher cash collections related to the settlement of commodity derivative instruments partially offset the decrease resulting from lower oil and natural gas sales and lease bonus.
Investing Activities. The net cash used in investing activities decreased by $10.1 million in 2015 as compared to 2014 primarily due to a reduction of $26.2 million in capital expenditures for our working interests, net of proceeds from the sales of oil and natural gas properties and a contractual termination payment related to a leasehold prospect. An increase of $16.7 million spent on acquisitions partially offset the overall decrease in net cash used in investing activities.
Financing Activities. For the year ended December 31, 2015, the net cash used in financing activities decreased $115.0 million compared to 2014. During 2015, we used net proceeds from our IPO to repay substantially all of our outstanding indebtedness under our credit facility. The proceeds received in excess of our net repayments resulted in a decrease in net cash used in financing activities from 2014. Monies borrowed to fund a $41.5 million cash tender offer for our preferred units plus unpaid accrued yield partially offset the overall decrease in net cash used in financing activities.
Year Ended December 31, 2014 Compared to Year Ended December 31, 2013
Operating Activities. For the year ended December 31, 2014, cash flows from operating activities increased by $75.4 million as compared to the same period in 2013 due to increased realized natural gas prices, higher oil and condensate volumes, and higher lease bonus revenue.
Investing Activities. The net cash used in investing activities decreased by $94.5 million in 2014 as compared to 2013 primarily due to reduced capital spent on acquisitions and lower capital expenditures under our working-interest participation program. For the
60
year ended December 31, 2014, our cash expenditures for acquisitions totaled $45.6 million versus $121.6 million for the same period in 2013. Capital expenditures for our working interests, net of sale proceeds, decreased by $13.4 million for the year ended December 31, 2014 versus the comparable period of 2013.
Financing Activities. For the year ended December 31, 2014, the net cash used in financing activities increased $168.0 million compared to the same period in 2013. During 2014, we made distributions to unitholders of $224.9 million, distributions on redeemable preferred units of $15.7 million, $57.0 million of credit facility repayments, and equity repurchases of $5.2 million, and we paid $7.6 million of consulting and other costs directly related to our initial public offering. During 2013, we received $191.6 million in equity contributions as a result of our exchange offer and borrowed $134.0 million under our credit facility. These activities were partially offset by distributions to unitholders of $225.7 million, distributions on redeemable preferred units of $15.7 million, equity repurchases of $118.1 million, repayments under our credit facility of $46.1 million, and purchases of noncontrolling interests of $60.7 million. Please read the notes to the consolidated financial statements included elsewhere in this Annual Report for additional information regarding our exchange and equity offerings.
Capital Expenditures
At the beginning of each calendar year, we establish a capital budget and then monitor it throughout the year. Our capital budgets are created based upon our estimate of internally generated cash flows and the ability to borrow and raise additional capital. Actual capital expenditure levels will vary, in part, based on actual internally generated cash, actual wells proposed by our operators for our participation, and the successful closing of acquisitions. The timing, size, and nature of acquisitions are unpredictable.
During 2015, we spent approximately $63.2 million on eight acquisitions. We also incurred approximately $60.1 million related to drilling and completion costs, the majority of which was in the Haynesville/Bossier, Bakken/Three Forks, and Wilcox plays. Our 2016 capital budget for drilling expenditures is approximately $60.0 million. Approximately 95% of our drilling capital budget will be spent in the Haynesville/Bossier and Bakken/Three Forks plays, respectively, with the remainder spent in various plays including the Wolfcamp and Wilcox plays.
During 2014, we spent $45.6 million on three cash acquisitions and completed another acquisition for $2.3 million with an issuance of equity securities. In 2014, we spent approximately $67.7 million on drilling and completion costs.
Credit Facility
On January 23, 2015, we amended and restated our $1.0 billion senior secured revolving credit agreement. Under this third amended and restated credit facility, the commitment of the lenders equals the lesser of the aggregate maximum credit amounts of the lenders or the borrowing base, which is determined based on the lenders’ estimated value of our oil and natural gas properties. On October 28, 2015, the third amended and restated credit facility was further amended to extend the term of the agreement from February 3, 2017 to February 4, 2019. Borrowings under the third amended and restated credit facility may be used for the acquisition of properties, cash distributions, and other general corporate purposes. Our semi-annual borrowing base redetermination process resulted in a decrease of the borrowing base from $600.0 million to $550.0 million, effective October 28, 2015. Our next borrowing base redetermination is scheduled for April 2016. As of December 31, 2015, we had outstanding borrowings of $66.0 million at a weighted-average interest rate of 1.92%. We used net proceeds from our IPO in May 2015 to repay substantially all indebtedness then outstanding under our third amended and restated credit facility.
The borrowing base under the third amended and restated credit agreement is redetermined semi-annually, on April 1 and October 1 of each year, by the administrative agent, taking into consideration the estimated loan value of our oil and natural gas properties consistent with the administrative agent’s normal oil and natural gas lending criteria. The administrative agent’s proposed redetermined borrowing base must be approved by all lenders to increase our existing borrowing base, and by two-thirds of the lenders to maintain or decrease our existing borrowing base. In addition, we and the lenders (at the election of two-thirds of the lenders) each have discretion once in between scheduled redeterminations, to have the borrowing base redetermined.
Outstanding borrowings under the third amended and restated credit facility bear interest at a floating rate elected by us equal to an alternative base rate (which is equal to the greatest of the Prime rate, the Federal Funds effective rate plus 0.5%, or 1-month LIBOR plus 1.0%) or LIBOR, in each case plus the applicable margin. The applicable margin ranges from 0.50% to 1.50% in the case of the alternative base rate and from 1.50% to 2.50% in the case of LIBOR, in each case depending on the amount of borrowings outstanding in relation to the borrowing base. We are obligated to pay a quarterly commitment fee ranging from 0.375% to 0.500% per year on the unused portion of the borrowing base, depending on the amount of the borrowings outstanding in relation to the borrowing base. Principal may be optionally repaid from time to time without premium or penalty, other than customary LIBOR breakage, and is required to be paid (a) if the amount outstanding exceeds the borrowing base, whether due to a borrowing base redetermination or otherwise, in some cases subject to a cure period or (b) at the maturity date. The third amended and restated credit facility is secured by liens on substantially all of our properties.
61
The third amended and restated credit agreement contains various affirmative, negative, and financial maintenance covenants. These covenants, among other things, limit additional indebtedness, additional liens, sales of assets, mergers and consolidations, dividends and distributions, transactions with affiliates and entering into certain swap agreements, as well as require the maintenance of certain financial ratios. The third amended and restated credit agreement contains two financial covenants: total debt to EBITDAX of 3.5:1.0 or less; and a modified current ratio of 1.0:1.0 or greater. Distributions are not permitted if there is a default under the third amended and restated credit agreement (including due to a failure to satisfy one of the financial covenants) or during any time that our borrowing base is lower than the loans outstanding under the third amended and restated credit facility. The lenders have the right to accelerate all of the indebtedness under the third amended and restated credit facility upon the occurrence and during the continuance of any event of default, and the third amended and restated credit agreement contains customary events of default, including non-payment, breach of covenants, materially incorrect representations, cross-default, bankruptcy, and change of control. There are no cure periods for events of default due to non-payment of principal and breaches of negative and financial covenants, but non-payment of interest and breaches of certain affirmative covenants are subject to customary cure periods. As of December 31, 2015, we were in compliance with all debt covenants.
Contractual Obligations
The following table summarizes our minimum payments as of December 31, 2015 (in thousands):
|
|
Payments due by period |
|
|||||||||||||||||
|
|
Total |
|
|
Less Than 1 Year |
|
|
1-3 Years |
|
|
3-5 Years |
|
|
More Than 5 Years |
|
|||||
|
Credit facility |
$ |
66,000 |
|
|
$ |
— |
|
|
$ |
— |
|
|
$ |
66,000 |
|
|
$ |
— |
|
|
Operating lease obligations |
|
4,751 |
|
|
|
1,416 |
|
|
|
3,334 |
|
|
|
1 |
|
|
|
— |
|
|
Purchase commitments |
|
602 |
|
|
|
557 |
|
|
|
45 |
|
|
|
— |
|
|
|
— |
|
|
Total |
$ |
71,353 |
|
|
$ |
1,973 |
|
|
$ |
3,379 |
|
|
$ |
66,001 |
|
|
$ |
— |
|
Off-Balance Sheet Arrangements
At December 31, 2015, we did not have any material off-balance sheet arrangements.
Critical Accounting Policies and Related Estimates
The discussion and analysis of our financial condition and results of operations are based upon the consolidated financial statements, which have been prepared in accordance with GAAP. Certain of our accounting policies involve judgments and uncertainties to such an extent that there is a reasonable likelihood that materially different amounts would have been reported under different conditions, or if different assumptions had been used. The following discussions of critical accounting estimates, including any related discussion of contingencies, address all important accounting areas where the nature of accounting estimates or assumptions could be material due to the levels of subjectivity and judgment necessary to account for highly uncertain matters or the susceptibility of such matters to change. We have provided expanded discussion of our more significant accounting estimates below.
Please read the notes to the consolidated financial statements included elsewhere in this Annual Report for additional information regarding our accounting policies.
Successful Efforts Method of Accounting
We use the successful efforts method of accounting for oil and natural gas operations. Under this method, costs to acquire interests in oil and natural gas properties are capitalized. The cost of property acquisitions, successful exploratory wells, development costs, and support equipment and facilities are initially capitalized when incurred. DD&A of producing oil and natural gas properties is recorded based on a units-of-production methodology. Acquisition costs of proved properties are amortized on the basis of all proved reserves, developed and undeveloped, and capitalized development costs are amortized on the basis of proved developed reserves. Proved reserves are quantities of oil and natural gas that can be estimated with reasonable certainty to be economically producible from a given date forward, from known reservoirs, under existing economic conditions, operating methods, and government regulations. A sustained low price environment could decrease our estimate of proved reserves, which would increase the rate at which we record depletion expense and reduce net income. Additionally, a decline in proved reserve estimates may impact the outcome of our assessment of producing properties for impairment. We are unable to predict future commodity prices with any greater precision than the futures market. The impact of commodity prices can be illustrated as follows. If we assumed the average 12-month forward strip pricing as of December 31, 2015 was held constant in determining our reserves, our estimated proved reserves on a Boe basis as of December 31, 2015 would have declined by approximately 2%.
62
Other exploratory costs, including annual delay rentals and geological and geophysical costs, are expensed when incurred. Mineral and royalty interests and working interests are recorded at cost at the time of acquisition. Upon sale or retirement of depreciable or depletable property, the cost and related accumulated DD&A are eliminated from the accounts and the resulting gain or loss is recognized.
The costs of unproved leaseholds and mineral interests are capitalized as unproved properties pending the results of exploration efforts. As unproved leaseholds are determined to be proved, the related costs are transferred to proved properties. Unproved and non-producing property costs are assessed periodically, on a property-by-property basis, and an impairment loss is recognized to the extent, if any, the recorded value has been impaired. Mineral interests are recorded at cost at the time of acquisition. Mineral interests are assessed for impairment when facts and circumstances indicate that their carrying value may not be recoverable. This assessment is performed by comparing carrying values to valuation estimates and impairment is recognized to the extent that book value exceeds estimated recoverable value. Any impairment will generally be based on geographic or geologic data and our estimated future cash flows related to our properties.
We evaluate impairment of producing properties whenever events or changes in circumstances indicate that the carrying amount of an asset may not be recoverable. We estimate the undiscounted future cash flows expected in connection with the properties and compare such undiscounted future cash flows to the carrying amount of the properties to determine if the carrying amount is recoverable. When the carrying amount of a property exceeds its estimated undiscounted future cash flows, the carrying amount is reduced to its fair value. Fair value is calculated as the present value of estimated future discounted cash flows of such properties. The factors used to determine fair value include estimates of proved reserves, future commodity prices, timing of future production, future capital expenditures, and a risk-adjusted discount rate. The markets for oil and natural gas have a history of significant price volatility. However, a sustained low price environment could result in lower NYMEX forward strip prices and lower estimates of future cash flows expected from our properties. Such decrease in cash flow estimates could result in recording additional impairment for our properties if such circumstances indicated the carrying amount of the asset may not be recoverable.
Asset Retirement Obligations
Under various contracts, permits, and regulations, we have legal obligations to restore the land at the end of operations at certain properties where we own non-operated working interests. Estimating the future restoration costs necessary for this accounting calculation is difficult. Most of these restoration obligations are many years, or decades, in the future and the contracts and regulations often have vague descriptions of what practices and criteria must be met when the event actually occurs. Asset-restoration technologies and costs, regulatory and other compliance considerations, expenditure timing, and other inputs into the valuation of the obligation, including discount and inflation rates, are also subject to change.
Fair values of legal obligations to retire and remove long-lived assets are recorded when the obligation is incurred and becomes determinable. When the liability is initially recorded, we capitalize this cost by increasing the carrying amount of the related property and equipment. Over time, the liability is accreted for the change in its present value, and the capitalized cost in oil and natural gas properties is depleted based on units of production consistent with the related asset.
Revenue Recognition
We recognize revenue when it is realized or realizable and earned. Revenues are considered realized or realizable and earned when: (i) persuasive evidence of an arrangement exists, (ii) delivery has occurred or services have been rendered, (iii) the seller’s price to the buyer is fixed or determinable, and (iv) collectability is reasonably assured. We recognize oil and natural gas revenue from our interests in producing wells when the associated production is sold. To the extent actual volumes and prices of oil and natural gas are unavailable for a given reporting period because of timing or information not received from third parties, the expected sales volume and prices for these properties are estimated and recorded within accounts receivable. Crude oil is priced on the delivery date based upon prevailing prices published by purchasers with certain adjustments related to oil quality and physical location. Natural gas contracts’ pricing provisions are tied to a market index, with certain adjustments based on, among other factors, whether a well delivers to a gathering or transmission line, quality and heat content of natural gas, and prevailing supply and demand conditions, so that the price of natural gas fluctuates to remain competitive with other available natural gas supplies. These market indices are determined on a monthly basis.
Our other sources of revenue include mineral lease bonus and delay rentals, which are recognized as revenue according to the terms of the lease agreements. We generate lease bonus revenue from leasing our mineral interests to exploration and production companies. The lease agreements transfer the rights to any oil or natural gas discovered to the operators, grant us a right to a specified royalty interest, and require that drilling and completion operations be done within a specified time period. We recognize such lease bonus revenue at which time the lease agreement has been executed, payment is determined to be collectable, and we have no further
63
obligation to refund the payment. We also recognize revenue from delay rentals to the extent drilling has not started within the specified period, payment has been collected, and we have no further obligation to refund the payment.
Derivatives and Financial Instruments
Our ongoing operations expose us to changes in the market price for oil and natural gas. To mitigate the given commodity price risk associated with its operations, we use derivative instruments. From time to time, such instruments may include fixed-price contracts, variable to fixed price swaps, costless collars, and other contractual arrangements. We do not enter into derivative instruments for speculative purposes. In addition, we currently employ a “rolling hedge” strategy whereby we generally hedge our proved developed producing reserves 18 to 24 months into the future. The impact of these derivative instruments could affect the amount of revenue we ultimately record.
Derivative instruments are recognized at fair value. If a right of offset exists under master netting arrangements and certain other criteria are met, derivative assets and liabilities with the same counterparty are netted on the consolidated balance sheet. Gains and losses arising from changes in the fair value of derivatives are recognized on a net basis in the accompanying consolidated statements of operations within gain (loss) on commodity derivative instruments. Although these derivative instruments may expose us to credit risk, we monitor the creditworthiness of our counterparties.
Equity-Based Compensation
We recognize equity-based compensation expense for unit-based awards granted to our employees and the board of directors of our general partner. Total compensation expense for unit-based awards is calculated based on the number of units granted multiplied by the grant-date fair value per unit. Compensation expense for time-based restricted unit awards with graded vesting requirements are recognized using straight-line attribution over the requisite service period. Compensation expense related to the restricted performance unit awards is determined by multiplying the number of common units underlying such awards that, based on our estimates, are likely to vest, by the grant-date fair value and recognized using the accelerated attribution method. Equity-based compensation expense related to unit-based awards is included in general and administrative expense within the consolidated statements of operations. Distribution equivalent rights for the restricted performance unit awards that are expected to vest are charged to partners’ capital. Please read Note 10 – Incentive Compensation within the consolidated financial statements included elsewhere in this Annual Report for additional information.
Prior to our initial public offering, the board of directors of our Predecessor determined the fair value of unit-based awards by considering various objective and subjective factors, along with input from management, and using the same methodology as required under our Predecessor’s partnership agreement for purposes of repurchasing Predecessor common units from those limited partners who exercise their right to annually sell a portion of their units. To determine the fair value of the unit-based awards, the board of directors of our Predecessor considered information provided by third-party consultants and relied on generally accepted valuation techniques, which included the net asset value method under the asset approach, the guideline public company method under the market approach, and the dividend discount method of the income approach. Estimates of value using the net asset value method were derived using assumptions including commodity prices, estimated development timing of our acreage, and market-based discount rates. The value conclusion using the guideline public company method was estimated by considering peer company performance metrics, comparability of the peer company portfolio and risk profiles, and implied forward distribution yields and multiples. To estimate the value of the awards using the transaction method, publicly available data related to acquisitions of mineral properties and applied the implied deal metrics to our performance measures were reviewed. The dividend discount method was developed based on assumptions including our projected distributions, anticipated long-term distribution growth rates, and near- and long-term cost of capital estimates. In determining the fair value of the awards, the board of directors of our Predecessor also considered our historical transactions and performance in making these estimates.
New and Revised Financial Accounting Standards
The effects of new accounting pronouncements are discussed in Note 2 – Summary of Significant Accounting Policies within the consolidated financial statements included elsewhere in this Annual Report.
Item 7A. QUANTITATIVE AND QUALITATIVE DISCLOSURES ABOUT MARKET RISK
Commodity Price Risk
Our major market risk exposure is the pricing of oil, natural gas, and natural gas liquids produced by our operators. Realized prices are primarily driven by the prevailing worldwide price for oil and U.S. spot market prices for natural gas and natural gas
64
liquids. Prices for oil, natural gas, and natural gas liquids are volatile, and we expect this unpredictability to continue in the future. The prices that our operators receive for production depend on many factors outside of our or their control.
To reduce the impact of fluctuations in oil and natural gas prices on our revenues, we use commodity derivative instruments to reduce our exposure to price risk in the spot market for oil and natural gas. The counterparties to the contracts are unrelated third parties. The contracts settle monthly in cash based on a designated index price. The designated index price has been based off the NYMEX benchmark for oil and natural gas. We have not designated any of our contracts as fair value or cash flow hedges. Accordingly, the changes in fair value of the contracts are included in net income in the period of the change. An average increase in the commodity price of $10.00 per barrel of oil and $1.00 per MMBtu of natural gas from the commodity prices at December 31, 2015 would have resulted in a decrease in the fair value of our commodity derivative assets of approximately $18.5 million.
A decrease in the average forward NYMEX oil and natural gas prices below those at December 31, 2015 would increase the fair value of our commodity derivative assets from their recorded balance at December 31, 2015. Changes in the recorded fair value of our commodity derivative instruments are marked to market through earnings as gains or losses. The potential increase in our commodity derivative assets would be recorded in earnings as a gain. However, an increase in the average forward NYMEX oil and natural gas prices above those at December 31, 2015, would decrease the fair value of our commodity derivative assets from their recorded balance at December 31, 2015. The potential decrease would be recorded in earnings as a loss. We are unable to estimate the effects on future-period earnings resulting from changes in the market value of our commodity derivative instruments. See Note 5 – Derivatives and Financial Instruments and Note 6 – Fair Value Measurement within the consolidated financial statements included elsewhere in this Annual Report for additional information.
Counterparty and Customer Credit Risk
Our derivative contracts expose us to credit risk in the event of nonperformance by counterparties. While we do not require our counterparties to our derivative contracts to post collateral, we do evaluate the credit standing of such counterparties as we deem appropriate. This evaluation includes reviewing a counterparty’s credit rating and latest financial information. As of December 31, 2015, we had ten counterparties, all of which are rated Baa2 or better by Moody’s. Seven of our counterparties are lenders under our credit facility.
Our principal exposure to credit risk results from receivables generated by the production activities of our operators. The inability or failure of our significant operators to meet their obligations to us or their insolvency or liquidation may adversely affect our financial results. However, we believe the credit risk associated with our operators and customers is acceptable.
Interest Rate Risk
We have exposure to changes in interest rates on our indebtedness. As of December 31, 2015, we had $66.0 million of outstanding borrowings under our credit facility, bearing interest at a weighted-average interest rate of 1.92%. The impact of a 1% increase in the interest rate on this amount of debt would have resulted in an increase in interest expense, and a corresponding decrease in our results of operations, of $0.7 million for the year ended December 31, 2015, assuming that our indebtedness remained constant throughout the period. We may use certain derivative instruments to hedge our exposure to variable interest rates in the future, but we do not currently have any interest rate hedges in place.
ITEM 8. FINANCIAL STATEMENTS AND SUPPLEMENTARY DATA
The information required here is included in this Annual Report beginning on page F-1.
ITEM 9. CHANGES IN AND DISAGREEMENTS WITH ACCOUNTANTS ON ACCOUNTING AND FINANCIAL DISCLOSURE
None.
ITEM 9A. CONTROLS AND PROCEDURES
Evaluation of Disclosure Controls and Procedures
As required by Rule 13a-15(b) under the Exchange Act, we have evaluated, under the supervision and with the participation of management of our general partner, including our general partner’s principal executive officer and principal financial officer, the effectiveness of the design and operation of our disclosure controls and procedures (as defined in Rules 13a-15(e) and 15d-15(e) under
65
the Exchange Act) as of the end of the period covered by this Annual Report. Our disclosure controls and procedures are designed to provide reasonable assurance that the information required to be disclosed by us in reports that we file or submit under the Exchange Act is accumulated and communicated to management, including our general partner’s principal executive officer and principal financial officer, as appropriate, to allow timely decisions regarding required disclosure and is recorded, processed, summarized, and reported within the time periods specified in the rules and forms of the SEC. Based upon that evaluation, our general partner’s principal executive officer and principal financial officer concluded that our disclosure controls and procedures were effective as of December 31, 2015.
Management’s Annual Report on Internal Control over Financial Reporting
This Annual Report does not include a report of management’s assessment regarding internal control over financial reporting due to a transition period established by the rules of the SEC for newly public companies.
Attestation Report of the Independent Registered Public Accounting Firm
This Annual Report does not include an attestation report of our independent registered public accounting firm due to a transition period established by the rules of the SEC for newly public companies. Further, our independent registered public accounting firm will not be required to formally attest to the effectiveness of our internal control over financial reporting for as long as we are an “emerging growth company” pursuant to the provisions of the JOBS Act.
Changes in Internal Control over Financial Reporting
There were no changes in our internal control over financial reporting during the quarter ended December 31, 2015 that materially affected, or are reasonably likely to materially affect, our internal control over financial reporting.
None.
66
ITEM 10. DIRECTORS, EXECUTIVE OFFICERS AND CORPORATE GOVERNANCE
Information required by this item is incorporated by reference to the material appearing in our Proxy Statement for the 2016 Annual Meeting of Limited Partners (“2016 Proxy Statement”), which will be filed with the SEC not later than 120 days after December 31, 2015.
We have a Code of Business Conduct and Ethics that applies to our directors, officers, and employees as well as a Financial Code of Ethics that applies to our Chief Executive Officer, Chief Financial Officer, Chief Accounting Officer and the other senior financial officers, each as required by SEC and NYSE rules. Each of the foregoing is available on our website at www.blackstoneminerals.com in the “Corporate Governance” section. We will provide copies, free of charge, of any of the foregoing upon receipt of a written request to Black Stone Minerals, L.P., 1001 Fannin Street, Suite 2020, Houston, Texas 77002, Attn: Investor Relations. We intend to disclose amendments to and waivers from our Financial Code of Ethics, if any, on our website, www.blackstoneminerals.com, promptly following the date of any such amendment or waiver.
ITEM 11. EXECUTIVE COMPENSATION
Information required by this item is incorporated by reference to the 2016 Proxy Statement, which will be filed with the SEC not later than 120 days after December 31, 2015.
ITEM 12. SECURITY OWNERSHIP OF CERTAIN BENEFICIAL OWNERS AND MANAGEMENT AND RELATED UNITHOLDER MATTERS
Information required by this item is incorporated by reference to the 2016 Proxy Statement, which will be filed with the SEC not later than 120 days after December 31, 2015.
ITEM 13. CERTAIN RELATIONSHIPS AND RELATED TRANSACTIONS AND DIRECTOR INDEPENDENCE
Information required by this item is incorporated by reference to the 2016 Proxy Statement, which will be filed with the SEC not later than 120 days after December 31, 2015.
ITEM 14. PRINCIPAL ACCOUNTING FEES AND SERVICES
Information required by this item is incorporated by reference to the 2016 Proxy Statement, which will be filed with the SEC not later than 120 days after December 31, 2015.
67
ITEM 15. EXHIBITS AND FINANCIAL STATEMENT SCHEDULES
(a)(1) Financial Statements
Our Consolidated Financial Statements are included under Part II, Item 8 of this Annual Report. For a listing of these statements and accompanying notes, please read “Index to Financial Statements” on page F-1 of this Annual Report.
(a)(2) Financial Statement Schedules
All schedules have been omitted because they are either not applicable, not required or the information called for therein appears in the consolidated financial statements or notes thereto.
68
The following documents are filed as a part of this Annual Report or incorporated by reference:
|
Exhibit Number |
|
Description |
|
|
|
|
|
3.1 |
|
Certificate of Limited Partnership of Black Stone Minerals, L.P. (incorporated herein by reference to Exhibit 3.1 to Black Stone Minerals, L.P.’s Registration Statement on Form S-1 filed on March 19, 2015 (SEC File No. 333-202875)). |
|
|
|
|
|
3.2 |
|
Certificate of Amendment to Certificate of Limited Partnership of Black Stone Minerals, L.P. (incorporated herein by reference to Exhibit 3.2 to Black Stone Minerals, L.P.’s Registration Statement on Form S-1 filed on March 19, 2015 (SEC File No. 333-202875)). |
|
|
|
|
|
3.3 |
|
First Amended and Restated Agreement of Limited Partnership of Black Stone Minerals, L.P., dated May 6, 2015, by and among Black Stone Minerals GP, L.L.C. and Black Stone Minerals Company, L.P. (incorporated herein by reference to Exhibit 3.1 of Black Stone Minerals, L.P.’s Current Report on Form 8-K filed on May 6, 2015 (SEC File No. 001-37362)). |
|
|
|
|
|
10.1^ |
|
Black Stone Minerals, L.P. Long-Term Incentive Plan, dated May 6, 2015, by Black Stone Minerals GP, L.L.C. (incorporated herein by reference to Exhibit 10.1 Black Stone Minerals, L.P.’s Current Report on Form 8-K filed on May 6, 2015 (SEC File No. 001-37362)). |
|
|
|
|
|
10.2 |
|
First Amendment to Third Amended and Restated Credit Agreement, dated as of October 28, 2015, among Black Stone Minerals Company, L.P., as Borrower, Wells Fargo Bank, National Association, as Administrative Agent, Bank of America, N.A. and Compass Bank, as Co-Syndication Agents, Wells Fargo Bank, N.A. and Amegy Bank National Association, as Co-Documentation Agents, and a syndicate of lenders (incorporated herein by reference to Exhibit 10.1 of Black Stone Minerals, L.P.’s Current Report on Form 8-K filed on October 28, 2015 (SEC File No. 001-37362)). |
|
|
|
|
|
10.3 |
|
Third Amended and Restated Credit Agreement among Black Stone Minerals Company, L.P., as Borrower, Wells Fargo Bank, National Association, as Administrative Agent, Bank of America, N.A. and Compass Bank, as Co-Syndication Agents, Wells Fargo Bank, N.A. and Amegy Bank National Association, as Co-Documentation Agents, and a syndicate of lenders dated as of January 23, 2015 (incorporated herein by reference to Exhibit 10.2 to Black Stone Minerals, L.P.’s Registration Statement on Form S-1 filed on March 19, 2015 (SEC File No. 333-202875)). |
|
|
|
|
|
10.4^ |
|
Employment Agreement by and between Black Stone Minerals Company, L.P. and Thomas L. Carter, Jr. effective as of April 1, 2009 (incorporated herein by reference to Exhibit 10.3 to Black Stone Minerals, L.P.’s Registration Statement on Form S-1 filed on March 19, 2015 (SEC File No. 333-202875)). |
|
|
|
|
|
10.5^
|
|
First Amendment to Employment Agreement by and between Black Stone Minerals Company, L.P. and Thomas L. Carter, Jr. effective as of June 25, 2014 (incorporated herein by reference to Exhibit 10.4 to Black Stone Minerals, L.P.’s Registration Statement on Form S-1 filed on March 19, 2015 (SEC File No. 333-202875)). |
|
|
|
|
|
10.6^ |
|
Black Stone Minerals Company, L.P. 2012 Executive Incentive Plan (incorporated herein by reference to Exhibit 10.5 to Black Stone Minerals, L.P.’s Registration Statement on Form S-1 filed on March 19, 2015 (SEC File No. 333-202875)). |
|
|
|
|
|
10.7^
|
|
Restricted Unit Award Agreement by and between Black Stone Minerals Company, L.P. and Thomas L. Carter, Jr. effective as of January 1, 2012 (incorporated herein by reference to Exhibit 10.6 to Black Stone Minerals, L.P.’s Registration Statement on Form S-1 filed on March 19, 2015 (SEC File No. 333-202875)). |
|
|
|
|
|
10.8^ |
|
Restricted Unit Award Agreement by and between Black Stone Minerals Company, L.P. and Marc Carroll effective as of January 1, 2012 (incorporated herein by reference to Exhibit 10.7 to Black Stone Minerals, L.P.’s Registration Statement on Form S-1 filed on March 19, 2015 (SEC File No. 333-202875)). |
|
|
|
|
|
10.9^ |
|
Restricted Unit Award Agreement by and between Black Stone Minerals Company, L.P. and Holbrook F. Dorn effective as of January 1, 2012 (incorporated herein by reference to Exhibit 10.8 to Black Stone Minerals, L.P.’s Registration Statement on Form S-1 filed on March 19, 2015 (SEC File No. 333-202875)). |
69
|
Exhibit Number |
|
Description |
|
|
|
|
|
10.10^ |
|
Form of IPO Award Grant Notice and Award Agreement for Senior Management (Restricted Units) (incorporated herein by reference to Exhibit 10.9 to Black Stone Minerals, L.P.’s Registration Statement on Form S-1 filed on April 13, 2015 (SEC File No. 333-202875)). |
|
|
|
|
|
10.11^ |
|
Form of IPO Award Grant Notice and Award Agreement for Senior Management (Performance Units) (incorporated herein by reference to Exhibit 10.10 to Black Stone Minerals, L.P.’s Registration Statement on Form S-1 filed on April 13, 2015 (SEC File No. 333-202875)). |
|
|
|
|
|
10.12^ |
|
Form of Non-Employee Director Unit Grant Notice and Award Agreement (incorporated herein by reference to Exhibit 10.11 to Black Stone Minerals, L.P.’s Registration Statement on Form S-1 filed on April 13, 2015 (SEC File No. 333-202875)). |
|
|
|
|
|
10.13^ |
|
Form of Severance Agreement for Thomas L. Carter, Jr. (incorporated herein by reference to Exhibit 10.12 to Black Stone Minerals, L.P.’s Registration Statement on Form S-1 filed on April 13, 2015 (SEC File No. 333-202875)). |
|
|
|
|
|
10.14^ |
|
Form of Severance Agreement for Senior Vice Presidents (incorporated herein by reference to Exhibit 10.13 to Black Stone Minerals, L.P.’s Registration Statement on Form S-1 filed on April 13, 2015 (SEC File No. 333-202875)). |
|
|
|
|
|
10.15^ |
|
Form of STI Award Grant Notice and STI Award Agreement (Leadership) under the Black Stone Minerals, L.P. Long-Term Incentive Plan (incorporated herein by reference to Exhibit 10.1 to Black Stone Minerals, L.P.’s Current Report on Form 8-K filed on February 2, 2016 (SEC File No. 001-37362). |
|
|
|
|
|
10.16^ |
|
Form of LTI Award Grant Notice and LTI Award Agreement (Leadership) under the Black Stone Minerals, L.P. Long-Term Incentive Plan (incorporated herein by reference to Exhibit 10.2 to Black Stone Minerals, L.P.’s Current Report on Form 8-K filed on February 2, 2016 (SEC File No. 001-37362). |
|
|
|
|
|
21.1* |
|
List of Subsidiaries of Black Stone Minerals, L.P. |
|
|
|
|
|
23.1* |
|
Consent of BDO USA, LLP |
|
|
|
|
|
23.2* |
|
Consent of UHY LLP |
|
|
|
|
|
23.3* |
|
Consent of Netherland, Sewell & Associates, Inc. |
|
|
|
|
|
31.1* |
|
Certification of Chief Executive Officer of Black Stone Minerals, L.P. pursuant to Section 302 of the Sarbanes-Oxley Act of 2002 |
|
|
|
|
|
31.2* |
|
Certification of Chief Financial Officer of Black Stone Minerals, L.P. pursuant to Section 302 of the Sarbanes-Oxley Act of 2002 |
|
|
|
|
|
32.1* |
|
Certification of Chief Executive Officer and Chief Financial Officer of Black Stone Minerals, L.P. pursuant to 18 U.S.C. Section 1350, as adopted pursuant to Section 906 of the Sarbanes-Oxley Act of 2002 |
|
|
|
|
|
99.1* |
|
Report of Netherland, Sewell & Associates, Inc. |
|
|
|
|
|
101.INS* |
|
XBRL Instance Document. |
|
|
|
|
|
101.SCH* |
|
XBRL Taxonomy Schema Document. |
|
|
|
|
|
101.CAL* |
|
XBRL Taxonomy Calculation Linkbase Document. |
|
|
|
|
|
101.DEF* |
|
XBRL Taxonomy Definition Linkbase Document. |
|
|
|
|
|
101.LAB* |
|
XBRL Taxonomy Label Linkbase Document. |
|
|
|
|
|
101.PRE* |
|
XBRL Taxonomy Presentation Linkbase Document. |
|
|
* |
Filed herewith. |
|
|
^ |
Management contract or compensatory plan or arrangement. |
70
Pursuant to the requirements of the Securities Exchange Act of 1934, the registrant has duly caused this report to be signed on its behalf by the undersigned, thereunto duly authorized.
|
|
|
|
|
BLACK STONE MINERALS, L.P. |
||
|
|
|
|
|
|
||
|
|
|
By: |
|
Black Stone Minerals GP, L.L.C., its general partner |
||
|
|
|
|
|
|
|
|
|
Date: March 8, 2016 |
|
By: |
|
|
/s/ Thomas L. Carter, Jr. |
|
|
|
|
|
|
|
Thomas L. Carter, Jr. |
|
|
|
|
|
|
|
President, Chief Executive Officer, and Chairman |
|
|
|
|
|
|
|
|
|
Pursuant to the requirements of the Securities Exchange Act of 1934, this Annual Report has been signed below by the following persons on behalf of the registrant and in the capacities and on the dates indicated.
|
Signature |
|
Title |
|
Date |
|
|
|
|
|
|
|
/s/ Thomas L. Carter, Jr. |
|
President, Chief Executive Officer, and Chairman |
|
March 8, 2016 |
|
Thomas L. Carter, Jr. |
|
(Principal Executive Officer) |
|
|
|
|
|
|
|
|
|
/s/ Marc Carroll |
|
Senior Vice President and Chief Financial Officer |
|
March 8, 2016 |
|
Marc Carroll |
|
(Principal Financial Officer) |
|
|
|
|
|
|
|
|
|
/s/ Dawn K. Smajstrla |
|
Vice President and Chief Accounting Officer |
|
March 8, 2016 |
|
Dawn K. Smajstrla |
|
(Principal Accounting Officer) |
|
|
|
|
|
|
|
|
|
/s/ William G. Bardel |
|
Director |
|
March 8, 2016 |
|
William G. Bardel |
|
|
|
|
|
|
|
|
|
|
|
/s/ Carin M. Barth |
|
Director |
|
March 8, 2016 |
|
Carin M. Barth |
|
|
|
|
|
|
|
|
|
|
|
/s/ D. Mark DeWalch |
|
Director |
|
March 8, 2016 |
|
D. Mark DeWalch |
|
|
|
|
|
|
|
|
|
|
|
/s/ Ricky J. Haeflinger |
|
Director |
|
March 8, 2016 |
|
Ricky J. Haeflinger |
|
|
|
|
|
|
|
|
|
|
|
/s/ Jerry V. Kyle, Jr. |
|
Director |
|
March 8, 2016 |
|
Jerry V. Kyle, Jr. |
|
|
|
|
|
|
|
|
|
|
|
/s/ Michael C. Linn |
|
Director |
|
March 8, 2016 |
|
Michael C. Linn |
|
|
|
|
|
|
|
|
|
|
|
/s/ John H. Longmaid |
|
Director |
|
March 8, 2016 |
|
John H. Longmaid |
|
|
|
|
|
|
|
|
|
|
|
/s/ William N. Mathis |
|
Director |
|
March 8, 2016 |
|
William N. Mathis |
|
|
|
|
|
|
|
|
|
|
|
/s/ Robert E. W. Sinclair |
|
Director |
|
March 8, 2016 |
|
Robert E. W. Sinclair |
|
|
|
|
|
|
|
|
|
|
|
/s/ Alexander D. Stuart |
|
Director |
|
March 8, 2016 |
|
Alexander D. Stuart |
|
|
|
|
|
|
|
|
|
|
|
/s/ Alison K. Thacker |
|
Director |
|
March 8, 2016 |
|
Alison K. Thacker |
|
|
|
|
71
INDEX TO CONSOLIDATED FINANCIAL STATEMENTS
BLACK STONE MINERALS, L.P.
F-1
REPORT OF INDEPENDENT REGISTERED PUBLIC ACCOUNTING FIRM
The Partners of
Black Stone Minerals, L.P.
Houston, Texas
We have audited the accompanying consolidated balance sheets of Black Stone Minerals, L.P. and subsidiaries (the “Partnership”) as of December 31, 2015 and 2014, and the related consolidated statements of operations, equity, and cash flows for the years then ended. These consolidated financial statements are the responsibility of the Partnership’s management. Our responsibility is to express an opinion on these consolidated financial statements based on our audits.
We conducted our audits in accordance with the standards of the Public Company Accounting Oversight Board (United States). Those standards require that we plan and perform the audit to obtain reasonable assurance about whether the consolidated financial statements are free of material misstatement. The Partnership is not required to have, nor were we engaged to perform, an audit of its internal control over financial reporting. Our audits included consideration of internal control over financial reporting as a basis for designing audit procedures that are appropriate in the circumstances, but not for the purpose of expressing an opinion on the effectiveness of the Partnership’s internal control over financial reporting. Accordingly, we express no such opinion. An audit also includes examining, on a test basis, evidence supporting the amounts and disclosures in the consolidated financial statements, assessing the accounting principles used and significant estimates made by management, as well as evaluating the overall consolidated financial statement presentation. We believe that our audits provide a reasonable basis for our opinion.
In our opinion, the consolidated financial statements referred to above present fairly, in all material respects, the financial position of Black Stone Minerals, L.P. and subsidiaries at December 31, 2015 and 2014, and the results of its operations and its cash flows for the years then ended, in conformity with accounting principles generally accepted in the United States of America.
/s/ BDO USA, LLP
Houston, Texas
March 8, 2016
F-2
REPORT OF INDEPENDENT REGISTERED PUBLIC ACCOUNTING FIRM
The General Partner of
Black Stone Minerals, L.P.
Houston, Texas
We have audited the accompanying consolidated statements of operations, equity, and cash flows of Black Stone Minerals Company, L.P. and subsidiaries (the “Company”), the predecessor to Black Stone Minerals, L.P., for the year ended December 31, 2013. These consolidated financial statements are the responsibility of the Company’s management. Our responsibility is to express an opinion on these consolidated financial statements based on our audit.
We conducted our audit in accordance with the standards of the Public Company Accounting Oversight Board (United States). Those standards require that we plan and perform the audit to obtain reasonable assurance about whether the consolidated financial statements are free of material misstatement. The Company is not required to have, nor were we engaged to perform, an audit of its internal control over financial reporting. Our audit included consideration of internal control over financial reporting as a basis for designing audit procedures that are appropriate in the circumstances, but not for the purpose of expressing an opinion on the effectiveness of the Company’s internal control over financial reporting. Accordingly, we express no such opinion. An audit also includes examining, on a test basis, evidence supporting the amounts and disclosures in the consolidated financial statements, assessing the accounting principles used and significant estimates made by management, as well as evaluating the overall consolidated financial statement presentation. We believe that our audit provides a reasonable basis for our opinion.
In our opinion, the consolidated financial statements referred to above present fairly, in all material respects, the results of the Company’s operations and its cash flows for the year ended December 31, 2013 in conformity with accounting principles generally accepted in the United States of America.
/s/ UHY LLP
Houston, Texas
October 7, 2014
F-3
BLACK STONE MINERALS, L.P. AND SUBSIDIARIES
(in thousands)
|
|
|
As of December 31, |
|
|||||
|
|
|
2015 |
|
|
2014 |
|
||
|
ASSETS |
|
|
|
|
|
|
|
|
|
CURRENT ASSETS |
|
|
|
|
|
|
|
|
|
Cash and cash equivalents |
|
$ |
13,233 |
|
|
$ |
14,803 |
|
|
Accounts receivable |
|
|
41,246 |
|
|
|
74,092 |
|
|
Commodity derivative assets |
|
|
48,260 |
|
|
|
37,471 |
|
|
Prepaid expenses and other current assets |
|
|
856 |
|
|
|
8,538 |
|
|
TOTAL CURRENT ASSETS |
|
|
103,595 |
|
|
|
134,904 |
|
|
PROPERTY AND EQUIPMENT |
|
|
|
|
|
|
|
|
|
Oil and natural gas properties, at cost, using the successful efforts method of accounting, includes unproved properties of $524,563 and $626,376 at December 31, 2015 and 2014, respectively |
|
|
2,482,211 |
|
|
|
2,379,543 |
|
|
Accumulated depreciation, depletion, amortization, and impairment |
|
|
(1,543,796 |
) |
|
|
(1,191,861 |
) |
|
Oil and natural gas properties, net |
|
|
938,415 |
|
|
|
1,187,682 |
|
|
Other property and equipment, net of accumulated depreciation of $14,660 and $12,994 at December 31, 2015 and 2014, respectively |
|
|
179 |
|
|
|
1,664 |
|
|
NET PROPERTY AND EQUIPMENT |
|
|
938,594 |
|
|
|
1,189,346 |
|
|
DEFERRED CHARGES AND OTHER LONG-TERM ASSETS |
|
|
19,247 |
|
|
|
2,532 |
|
|
TOTAL ASSETS |
|
$ |
1,061,436 |
|
|
$ |
1,326,782 |
|
|
LIABILITIES, MEZZANINE EQUITY AND EQUITY |
|
|
|
|
|
|
|
|
|
CURRENT LIABILITIES |
|
|
|
|
|
|
|
|
|
Accounts payable |
|
$ |
5,036 |
|
|
$ |
5,434 |
|
|
Accrued liabilities |
|
|
58,003 |
|
|
|
40,233 |
|
|
Accrued distribution payable to Predecessor unitholders |
|
|
— |
|
|
|
52,905 |
|
|
TOTAL CURRENT LIABILITIES |
|
|
63,039 |
|
|
|
98,572 |
|
|
LONG-TERM LIABILITIES |
|
|
|
|
|
|
|
|
|
Credit facility |
|
|
66,000 |
|
|
|
394,000 |
|
|
Accrued incentive compensation |
|
|
7,902 |
|
|
|
6,530 |
|
|
Deferred revenue |
|
|
3,257 |
|
|
|
3,917 |
|
|
Asset retirement obligations |
|
|
10,585 |
|
|
|
9,381 |
|
|
TOTAL LIABILITIES |
|
|
150,783 |
|
|
|
512,400 |
|
|
COMMITMENTS AND CONTINGENCIES (Note 12) |
|
|
|
|
|
|
|
|
|
MEZZANINE EQUITY |
|
|
|
|
|
|
|
|
|
Partners' equity - redeemable preferred units, 77 and 157 units outstanding at December 31, 2015 and 2014, respectively |
|
|
79,162 |
|
|
|
161,165 |
|
|
EQUITY |
|
|
|
|
|
|
|
|
|
Predecessor equity - common limited partner units, no units and 164,484 units outstanding at December 31, 2015 and 2014, respectively |
|
|
— |
|
|
|
653,217 |
|
|
Partners' equity - general partner interest |
|
|
— |
|
|
|
— |
|
|
Partners' equity - common units, 96,162 and no units outstanding at December 31, 2015 and 2014, respectively |
|
|
574,648 |
|
|
|
— |
|
|
Partners' equity - subordinated units, 95,057 and no units outstanding at December 31, 2015 and 2014, respectively |
|
|
255,699 |
|
|
|
— |
|
|
Noncontrolling interests |
|
|
1,144 |
|
|
|
— |
|
|
TOTAL EQUITY |
|
|
831,491 |
|
|
|
653,217 |
|
|
TOTAL LIABILITIES, MEZZANINE EQUITY AND EQUITY |
|
$ |
1,061,436 |
|
|
$ |
1,326,782 |
|
The accompanying notes to consolidated financial statements are an integral part of these financial statements.
F-4
BLACK STONE MINERALS, L.P. AND SUBSIDIARIES
CONSOLIDATED STATEMENTS OF OPERATIONS
(in thousands, except per unit amounts)
|
|
Year Ended December 31, |
|
|||||||||
|
|
2015 |
|
|
2014 |
|
|
2013 |
|
|||
|
REVENUE |
|
|
|
|
|
|
|
|
|
|
|
|
Oil and condensate sales |
$ |
163,538 |
|
|
$ |
257,390 |
|
|
$ |
252,742 |
|
|
Natural gas and natural gas liquids sales |
|
116,018 |
|
|
|
207,456 |
|
|
|
184,868 |
|
|
Gain (loss) on commodity derivative instruments |
|
90,288 |
|
|
|
37,336 |
|
|
|
(5,860 |
) |
|
Lease bonus and other income |
|
23,080 |
|
|
|
46,139 |
|
|
|
31,809 |
|
|
TOTAL REVENUE |
|
392,924 |
|
|
|
548,321 |
|
|
|
463,559 |
|
|
OPERATING (INCOME) EXPENSE |
|
|
|
|
|
|
|
|
|
|
|
|
Lease operating expense |
|
21,583 |
|
|
|
21,233 |
|
|
|
21,142 |
|
|
Production costs and ad valorem taxes |
|
35,767 |
|
|
|
49,575 |
|
|
|
42,813 |
|
|
Exploration expense |
|
2,592 |
|
|
|
631 |
|
|
|
174 |
|
|
Depreciation, depletion and amortization |
|
104,298 |
|
|
|
111,962 |
|
|
|
102,442 |
|
|
Impairment of oil and natural gas properties |
|
249,569 |
|
|
|
117,930 |
|
|
|
57,109 |
|
|
General and administrative |
|
77,175 |
|
|
|
62,765 |
|
|
|
59,501 |
|
|
Accretion of asset retirement obligations |
|
1,075 |
|
|
|
1,060 |
|
|
|
588 |
|
|
(Gain) loss on sale of assets, net |
|
(4,873 |
) |
|
|
32 |
|
|
|
(18 |
) |
|
Other expense |
|
1,593 |
|
|
|
1,424 |
|
|
|
— |
|
|
TOTAL OPERATING EXPENSE |
|
488,779 |
|
|
|
366,612 |
|
|
|
283,751 |
|
|
INCOME (LOSS) FROM OPERATIONS |
|
(95,855 |
) |
|
|
181,709 |
|
|
|
179,808 |
|
|
OTHER INCOME (EXPENSE) |
|
|
|
|
|
|
|
|
|
|
|
|
Interest and investment income |
|
58 |
|
|
|
28 |
|
|
|
90 |
|
|
Interest expense |
|
(6,418 |
) |
|
|
(13,509 |
) |
|
|
(11,342 |
) |
|
Other income |
|
910 |
|
|
|
959 |
|
|
|
407 |
|
|
TOTAL OTHER EXPENSE |
|
(5,450 |
) |
|
|
(12,522 |
) |
|
|
(10,845 |
) |
|
NET INCOME (LOSS) |
|
(101,305 |
) |
|
|
169,187 |
|
|
|
168,963 |
|
|
NET INCOME ATTRIBUTABLE TO PREDECESSOR |
|
(450 |
) |
|
|
(169,187 |
) |
|
|
(168,963 |
) |
|
NET LOSS ATTRIBUTABLE TO NONCONTROLLING INTERESTS SUBSEQUENT TO INITIAL PUBLIC OFFERING |
|
1,260 |
|
|
|
— |
|
|
|
— |
|
|
DISTRIBUTIONS ON REDEEMABLE PREFERRED UNITS SUBSEQUENT TO INITIAL PUBLIC OFFERING |
|
(7,522 |
) |
|
|
— |
|
|
|
— |
|
|
NET LOSS ATTRIBUTABLE TO THE GENERAL PARTNER AND COMMON AND SUBORDINATED UNITS SUBSEQUENT TO INITIAL PUBLIC OFFERING |
$ |
(108,017 |
) |
|
$ |
— |
|
|
$ |
— |
|
|
ALLOCATION OF LOSS SUBSEQUENT TO INITIAL PUBLIC OFFERING ATTRIBUTABLE TO: |
|
|
|
|
|
|
|
|
|
|
|
|
General partner interest |
$ |
— |
|
|
|
|
|
|
|
|
|
|
Common units |
|
(54,326 |
) |
|
|
|
|
|
|
|
|
|
Subordinated units |
|
(53,691 |
) |
|
|
|
|
|
|
|
|
|
|
$ |
(108,017 |
) |
|
|
|
|
|
|
|
|
|
NET LOSS ATTRIBUTABLE TO LIMITED PARTNERS PER COMMON AND SUBORDINATED UNIT: |
|
|
|
|
|
|
|
|
|
|
|
|
Per common unit (basic and diluted) |
$ |
(0.56 |
) |
|
|
|
|
|
|
|
|
|
Weighted average common units outstanding (basic and diluted) |
|
96,182 |
|
|
|
|
|
|
|
|
|
|
Per subordinated unit (basic and diluted) |
$ |
(0.56 |
) |
|
|
|
|
|
|
|
|
|
Weighted average subordinated units outstanding (basic and diluted) |
|
95,057 |
|
|
|
|
|
|
|
|
|
|
DISTRIBUTIONS DECLARED AND PAID SUBSEQUENT TO INITIAL PUBLIC OFFERING: |
|
|
|
|
|
|
|
|
|
|
|
|
Per common unit |
$ |
0.4240 |
|
|
|
|
|
|
|
|
|
|
Per subordinated unit |
$ |
0.4240 |
|
|
|
|
|
|
|
|
|
The accompanying notes to consolidated financial statements are an integral part of these financial statements.
F-5
BLACK STONE MINERALS, L.P. AND SUBSIDIARIES
CONSOLIDATED STATEMENTS OF EQUITY
(in thousands)
|
|
|
Predecessor |
|
|
Black Stone Minerals, L.P. |
|
||||||||||||||||||||||||||
|
|
|
Predecessor units |
|
|
Partners' equity |
|
|
Common units |
|
|
Subordinated units |
|
|
Partners' equity— common units |
|
|
Partners' equity— subordinated units |
|
|
Noncontrolling interests |
|
|
Total equity |
|
||||||||
|
BALANCE AT DECEMBER 31, 2012 |
|
|
93,498 |
|
|
$ |
326,663 |
|
|
|
— |
|
|
|
— |
|
|
$ |
— |
|
|
$ |
— |
|
|
$ |
— |
|
|
$ |
326,663 |
|
|
Contributions—cash |
|
|
18,801 |
|
|
|
412,233 |
|
|
|
— |
|
|
|
— |
|
|
|
— |
|
|
|
— |
|
|
|
— |
|
|
|
412,233 |
|
|
Contributions—limited partner interests |
|
|
46,481 |
|
|
|
1,019,340 |
|
|
|
— |
|
|
|
— |
|
|
|
— |
|
|
|
— |
|
|
|
— |
|
|
|
1,019,340 |
|
|
Issuance of Predecessor units for acquisition of oil and natural gas properties |
|
|
10,359 |
|
|
|
227,119 |
|
|
|
— |
|
|
|
— |
|
|
|
— |
|
|
|
— |
|
|
|
— |
|
|
|
227,119 |
|
|
Repurchase of Predecessor units |
|
|
(5,410 |
) |
|
|
(118,108 |
) |
|
|
— |
|
|
|
— |
|
|
|
— |
|
|
|
— |
|
|
|
— |
|
|
|
(118,108 |
) |
|
Restricted Predecessor units granted, net of forfeitures |
|
|
404 |
|
|
|
— |
|
|
|
— |
|
|
|
— |
|
|
|
— |
|
|
|
— |
|
|
|
— |
|
|
|
— |
|
|
Equity-based compensation |
|
|
— |
|
|
|
6,782 |
|
|
|
— |
|
|
|
— |
|
|
|
— |
|
|
|
— |
|
|
|
— |
|
|
|
6,782 |
|
|
Distributions to Predecessor unitholders and noncontrolling interests |
|
|
— |
|
|
|
(235,078 |
) |
|
|
— |
|
|
|
— |
|
|
|
— |
|
|
|
— |
|
|
|
— |
|
|
|
(235,078 |
) |
|
Distributions—property |
|
|
— |
|
|
|
(19,029 |
) |
|
|
— |
|
|
|
— |
|
|
|
— |
|
|
|
— |
|
|
|
— |
|
|
|
(19,029 |
) |
|
Purchases of Predecessor noncontrolling interests |
|
|
— |
|
|
|
(37,400 |
) |
|
|
— |
|
|
|
— |
|
|
|
— |
|
|
|
— |
|
|
|
— |
|
|
|
(37,400 |
) |
|
Exchange of Predecessor noncontrolling interests |
|
|
— |
|
|
|
(1,019,340 |
) |
|
|
— |
|
|
|
— |
|
|
|
— |
|
|
|
— |
|
|
|
— |
|
|
|
(1,019,340 |
) |
|
Net income attributable to Predecessor |
|
|
— |
|
|
|
168,963 |
|
|
|
— |
|
|
|
— |
|
|
|
— |
|
|
|
— |
|
|
|
— |
|
|
|
168,963 |
|
|
Distributions on Predecessor redeemable preferred units |
|
|
— |
|
|
|
(15,742 |
) |
|
|
— |
|
|
|
— |
|
|
|
— |
|
|
|
— |
|
|
|
— |
|
|
|
(15,742 |
) |
|
BALANCE AT DECEMBER 31, 2013 |
|
|
164,133 |
|
|
|
716,403 |
|
|
|
— |
|
|
|
— |
|
|
|
— |
|
|
|
— |
|
|
|
— |
|
|
|
716,403 |
|
|
Conversion of Predecessor redeemable preferred units |
|
|
15 |
|
|
|
221 |
|
|
|
— |
|
|
|
— |
|
|
|
— |
|
|
|
— |
|
|
|
— |
|
|
|
221 |
|
|
Issuance of Predecessor units for acquisition of oil and natural gas properties |
|
|
104 |
|
|
|
2,258 |
|
|
|
— |
|
|
|
— |
|
|
|
— |
|
|
|
— |
|
|
|
— |
|
|
|
2,258 |
|
|
Repurchase of Predecessor units |
|
|
(239 |
) |
|
|
(5,199 |
) |
|
|
— |
|
|
|
— |
|
|
|
— |
|
|
|
— |
|
|
|
— |
|
|
|
(5,199 |
) |
|
Restricted Predecessor units granted, net of forfeitures |
|
|
471 |
|
|
|
— |
|
|
|
— |
|
|
|
— |
|
|
|
— |
|
|
|
— |
|
|
|
— |
|
|
|
— |
|
|
Equity-based compensation |
|
|
— |
|
|
|
11,340 |
|
|
|
— |
|
|
|
— |
|
|
|
— |
|
|
|
— |
|
|
|
— |
|
|
|
11,340 |
|
|
Distributions to Predecessor unitholders and noncontrolling interests |
|
|
— |
|
|
|
(225,273 |
) |
|
|
— |
|
|
|
— |
|
|
|
— |
|
|
|
— |
|
|
|
— |
|
|
|
(225,273 |
) |
|
Net income attributable to Predecessor |
|
|
— |
|
|
|
169,187 |
|
|
|
— |
|
|
|
— |
|
|
|
— |
|
|
|
— |
|
|
|
— |
|
|
|
169,187 |
|
|
Distributions on Predecessor redeemable preferred units |
|
|
— |
|
|
|
(15,720 |
) |
|
|
— |
|
|
|
— |
|
|
|
— |
|
|
|
— |
|
|
|
— |
|
|
|
(15,720 |
) |
|
BALANCE AT DECEMBER 31, 2014 |
|
|
164,484 |
|
|
|
653,217 |
|
|
|
— |
|
|
|
— |
|
|
|
— |
|
|
|
— |
|
|
|
— |
|
|
|
653,217 |
|
|
Conversion of Predecessor redeemable preferred units |
|
|
2,750 |
|
|
|
39,240 |
|
|
|
— |
|
|
|
— |
|
|
|
— |
|
|
|
— |
|
|
|
— |
|
|
|
39,240 |
|
|
Restricted Predecessor units granted |
|
|
562 |
|
|
|
— |
|
|
|
— |
|
|
|
— |
|
|
|
— |
|
|
|
— |
|
|
|
— |
|
|
|
— |
|
|
Repurchases of Predecessor units |
|
|
(164 |
) |
|
|
(3,015 |
) |
|
|
— |
|
|
|
— |
|
|
|
— |
|
|
|
— |
|
|
|
— |
|
|
|
(3,015 |
) |
|
Distributions to Predecessor unitholders and noncontrolling interests |
|
|
— |
|
|
|
(73,205 |
) |
|
|
— |
|
|
|
— |
|
|
|
— |
|
|
|
— |
|
|
|
— |
|
|
|
(73,205 |
) |
|
Distributions on Predecessor redeemable preferred units |
|
|
— |
|
|
|
(4,040 |
) |
|
|
— |
|
|
|
— |
|
|
|
— |
|
|
|
— |
|
|
|
— |
|
|
|
(4,040 |
) |
|
Net income attributable to Predecessor |
|
|
— |
|
|
|
450 |
|
|
|
— |
|
|
|
— |
|
|
|
— |
|
|
|
— |
|
|
|
— |
|
|
|
450 |
|
|
Allocation of Predecessor units and equity |
|
|
(167,632 |
) |
|
|
(612,647 |
) |
|
|
72,575 |
|
|
|
95,057 |
|
|
|
264,235 |
|
|
|
345,875 |
|
|
|
2,537 |
|
|
|
— |
|
|
Issuance of common units for initial public offering, net of offering costs |
|
|
— |
|
|
|
— |
|
|
|
22,500 |
|
|
|
— |
|
|
|
391,500 |
|
|
|
— |
|
|
|
— |
|
|
|
391,500 |
|
|
Restricted common units granted, net of forfeitures |
|
|
— |
|
|
|
— |
|
|
|
1,087 |
|
|
|
— |
|
|
|
— |
|
|
|
— |
|
|
|
— |
|
|
|
— |
|
|
Equity-based compensation |
|
|
— |
|
|
|
— |
|
|
|
— |
|
|
|
— |
|
|
|
14,181 |
|
|
|
3,819 |
|
|
|
— |
|
|
|
18,000 |
|
|
Distributions |
|
|
— |
|
|
|
— |
|
|
|
— |
|
|
|
— |
|
|
|
(40,783 |
) |
|
|
(40,304 |
) |
|
|
(133 |
) |
|
|
(81,220 |
) |
|
Charges to partners' equity for accrued distribution equivalent rights |
|
|
— |
|
|
|
— |
|
|
|
— |
|
|
|
— |
|
|
|
(159 |
) |
|
|
— |
|
|
|
— |
|
|
|
(159 |
) |
|
Net loss subsequent to initial public offering |
|
|
— |
|
|
|
— |
|
|
|
— |
|
|
|
— |
|
|
|
(50,543 |
) |
|
|
(49,952 |
) |
|
|
(1,260 |
) |
|
|
(101,755 |
) |
|
Distributions on redeemable preferred units |
|
|
— |
|
|
|
— |
|
|
|
— |
|
|
|
— |
|
|
|
(3,783 |
) |
|
|
(3,739 |
) |
|
|
— |
|
|
|
(7,522 |
) |
|
BALANCE AT DECEMBER 31, 2015 |
|
|
— |
|
|
$ |
— |
|
|
|
96,162 |
|
|
|
95,057 |
|
|
$ |
574,648 |
|
|
$ |
255,699 |
|
|
$ |
1,144 |
|
|
$ |
831,491 |
|
The accompanying notes to consolidated financial statements are an integral part of these financial statements.
F-6
BLACK STONE MINERALS, L.P. AND SUBSIDIARIES
CONSOLIDATED STATEMENTS OF CASH FLOWS
(in thousands)
|
|
|
Year Ended December 31, |
|
|||||||||
|
|
|
2015 |
|
|
2014 |
|
|
2013 |
|
|||
|
CASH FLOWS FROM OPERATING ACTIVITIES |
|
|
|
|
|
|
|
|
|
|
|
|
|
Net income (loss) |
|
$ |
(101,305 |
) |
|
$ |
169,187 |
|
|
$ |
168,963 |
|
|
Adjustments to reconcile net income (loss) to net cash provided by operating activities: |
|
|
|
|
|
|
|
|
|
|
|
|
|
Depreciation, depletion, and amortization |
|
|
104,298 |
|
|
|
111,962 |
|
|
|
102,442 |
|
|
Impairment of oil and natural gas properties |
|
|
249,569 |
|
|
|
117,930 |
|
|
|
57,109 |
|
|
Accretion of asset retirement obligations |
|
|
1,075 |
|
|
|
1,060 |
|
|
|
588 |
|
|
Amortization of deferred charges |
|
|
935 |
|
|
|
965 |
|
|
|
968 |
|
|
Gain (loss) on commodity derivative instruments |
|
|
(90,288 |
) |
|
|
(37,336 |
) |
|
|
5,860 |
|
|
Net cash received (paid) on settlement of commodity derivative instruments |
|
|
63,225 |
|
|
|
(1,947 |
) |
|
|
1,490 |
|
|
Equity-based compensation |
|
|
18,000 |
|
|
|
11,340 |
|
|
|
6,782 |
|
|
(Gain) loss on sale of assets, net |
|
|
(4,873 |
) |
|
|
32 |
|
|
|
(18 |
) |
|
Changes in operating assets and liabilities: |
|
|
|
|
|
|
|
|
|
|
|
|
|
Accounts receivable |
|
|
33,586 |
|
|
|
17,210 |
|
|
|
(15,046 |
) |
|
Prepaid expenses and other current assets |
|
|
95 |
|
|
|
453 |
|
|
|
(1,256 |
) |
|
Accounts payable and accrued liabilities |
|
|
11,221 |
|
|
|
8,003 |
|
|
|
(7,085 |
) |
|
Deferred revenue |
|
|
(660 |
) |
|
|
(2,589 |
) |
|
|
— |
|
|
Settlement of asset retirement obligations |
|
|
(143 |
) |
|
|
(145 |
) |
|
|
(33 |
) |
|
NET CASH PROVIDED BY OPERATING ACTIVITIES |
|
|
284,735 |
|
|
|
396,125 |
|
|
|
320,764 |
|
|
CASH FLOWS FROM INVESTING ACTIVITIES |
|
|
|
|
|
|
|
|
|
|
|
|
|
Additions to oil and natural gas properties |
|
|
(54,244 |
) |
|
|
(74,201 |
) |
|
|
(73,650 |
) |
|
Purchase of other property and equipment |
|
|
(181 |
) |
|
|
(827 |
) |
|
|
(493 |
) |
|
Proceeds from the sale of oil and natural gas properties |
|
|
25,705 |
|
|
|
19,470 |
|
|
|
74 |
|
|
Acquisitions of oil and natural gas properties |
|
|
(62,278 |
) |
|
|
(45,552 |
) |
|
|
(121,562 |
) |
|
NET CASH USED IN INVESTING ACTIVITIES |
|
|
(90,998 |
) |
|
|
(101,110 |
) |
|
|
(195,631 |
) |
|
CASH FLOWS FROM FINANCING ACTIVITIES |
|
|
|
|
|
|
|
|
|
|
|
|
|
Proceeds from issuance of common units of Black Stone Minerals, L.P., net of offering costs |
|
|
399,087 |
|
|
|
(7,587 |
) |
|
|
— |
|
|
Net (repayments) borrowings under senior line of credit |
|
|
(328,000 |
) |
|
|
(57,000 |
) |
|
|
134,000 |
|
|
Distributions to Predecessor unitholders |
|
|
(126,383 |
) |
|
|
(224,926 |
) |
|
|
(225,704 |
) |
|
Distributions to Black Stone Minerals, L.P. common and subordinated unitholders |
|
|
(81,087 |
) |
|
|
— |
|
|
|
— |
|
|
Distributions to preferred unitholders |
|
|
(13,578 |
) |
|
|
(15,724 |
) |
|
|
(15,732 |
) |
|
Distributions to noncontrolling interests |
|
|
(208 |
) |
|
|
— |
|
|
|
— |
|
|
Redemption of redeemable preferred units |
|
|
(40,747 |
) |
|
|
— |
|
|
|
— |
|
|
Repurchases of Predecessor units |
|
|
(3,015 |
) |
|
|
(5,199 |
) |
|
|
(118,108 |
) |
|
Debt issuance costs |
|
|
(1,376 |
) |
|
|
— |
|
|
|
(1,660 |
) |
|
Note receivable-officers |
|
|
— |
|
|
|
101 |
|
|
|
101 |
|
|
Repayments of revolving credit facilities |
|
|
— |
|
|
|
— |
|
|
|
(46,100 |
) |
|
Contributions from Predecessor unitholders |
|
|
— |
|
|
|
— |
|
|
|
191,611 |
|
|
Purchases of noncontrolling interests |
|
|
— |
|
|
|
— |
|
|
|
(60,719 |
) |
|
NET CASH USED IN FINANCING ACTIVITIES |
|
|
(195,307 |
) |
|
|
(310,335 |
) |
|
|
(142,311 |
) |
|
NET CHANGE IN CASH AND CASH EQUIVALENTS |
|
|
(1,570 |
) |
|
|
(15,320 |
) |
|
|
(17,178 |
) |
|
CASH AND CASH EQUIVALENTS - beginning of the year |
|
|
14,803 |
|
|
|
30,123 |
|
|
|
47,301 |
|
|
CASH AND CASH EQUIVALENTS - end of the year |
|
$ |
13,233 |
|
|
$ |
14,803 |
|
|
$ |
30,123 |
|
|
SUPPLEMENTAL DISCLOSURE |
|
|
|
|
|
|
|
|
|
|
|
|
|
Interest paid |
|
$ |
5,478 |
|
|
$ |
12,754 |
|
|
$ |
10,344 |
|
|
NON-CASH ACTIVITIES |
|
|
|
|
|
|
|
|
|
|
|
|
|
Accrued Predecessor distributions payable |
|
$ |
(53,248 |
) |
|
$ |
347 |
|
|
$ |
9,374 |
|
|
Conversion of redeemable preferred units |
|
$ |
(39,240 |
) |
|
$ |
(221 |
) |
|
$ |
— |
|
|
Accrued distributions payable for redeemable preferred units |
|
$ |
(2,016 |
) |
|
$ |
(4 |
) |
|
$ |
10 |
|
|
Property additions and acquisitions financed through accounts payable and accrued liabilities |
|
$ |
21,496 |
|
|
$ |
14,130 |
|
|
$ |
23,029 |
|
|
Public offering costs capitalized and offset against proceeds from initial public offering |
|
$ |
7,587 |
|
|
$ |
— |
|
|
$ |
— |
|
|
Asset retirement obligations incurred |
|
$ |
272 |
|
|
$ |
2,505 |
|
|
$ |
164 |
|
|
Accrued distribution equivalent rights |
|
$ |
159 |
|
|
$ |
— |
|
|
$ |
— |
|
|
Liabilities assumed as consideration for oil and natural gas properties acquired |
|
$ |
— |
|
|
$ |
7,000 |
|
|
$ |
— |
|
|
Acquisition of oil and natural gas properties financed through issuance of Predecessor units |
|
$ |
— |
|
|
$ |
2,258 |
|
|
$ |
227,119 |
|
|
Deferred revenue (settled) assumed through acquisition of oil and natural gas properties |
|
$ |
— |
|
|
$ |
(2,657 |
) |
|
$ |
902 |
|
|
Contributions through exchange of noncontrolling interests |
|
$ |
— |
|
|
$ |
— |
|
|
$ |
1,019,340 |
|
|
Distributions—property |
|
$ |
— |
|
|
$ |
— |
|
|
$ |
19,029 |
|
The accompanying notes to consolidated financial statements are an integral part of these financial statements.
F-7
BLACK STONE MINERALS, L.P. AND SUBSIDIARIES
NOTES TO CONSOLIDATED FINANCIAL STATEMENTS
NOTE 1—BUSINESS AND BASIS OF PRESENTATION
Description of the business: Black Stone Minerals, L.P. (“BSM” or the “Partnership”) is a publicly traded Delaware limited partnership formed on September 16, 2014. On May 6, 2015, BSM completed its initial public offering (the “IPO”) of 22,500,000 common units representing limited partner interests at a price to the public of $19.00 per common unit. BSM received proceeds of $391.5 million from the sale of its common units, net of underwriting discount, structuring fee, and offering expenses (including costs previously incurred and capitalized). BSM used the net proceeds from the IPO to repay substantially all indebtedness outstanding under its credit facility. On May 1, 2015, BSM’s common units began trading on the New York Stock Exchange under the symbol “BSM.”
Black Stone Minerals Company, L.P., a Delaware limited partnership, and its subsidiaries (collectively referred to as “BSMC” or the “Predecessor”) own oil and natural gas mineral interests in the United States. In connection with the IPO, BSMC was merged into a wholly owned subsidiary of BSM, with BSMC as the surviving entity. Pursuant to the merger, the Class A and Class B common units representing limited partner interests of the Predecessor were converted into an aggregate of 72,574,715 common units and 95,057,312 subordinated units of BSM at a conversion ratio of 12.9465:1 for 0.4329 common units and 0.5671 subordinated units, and the preferred units of BSMC were converted into an aggregate of 117,963 preferred units of BSM at a conversion ratio of one to one. The merger is accounted for as a combination of entities under common control with assets and liabilities transferred at their carrying amounts in a manner similar to a pooling of interests. Unless otherwise stated or the context otherwise indicates, all references to the “Partnership” or similar expressions for time periods prior to the IPO refer to Black Stone Minerals Company, L.P. and its subsidiaries, the Predecessor, for accounting purposes. For time periods subsequent to the IPO, these terms refer to Black Stone Minerals, L.P. and its subsidiaries.
The Partnership’s assets include mineral interests, nonparticipating royalty interests, and overriding royalty interests. These non-cost-bearing interests are collectively referred to as “mineral and royalty interests.” The Partnership’s mineral and royalty interests are located in most of the major onshore oil and natural gas producing basins spread across 41 states and 61 onshore oil and natural gas producing basins of the continental U.S. The Partnership also owns non-operated working interests in certain oil and natural gas properties.
Basis of presentation: The accompanying financial statements of the Partnership have been prepared in accordance with generally accepted accounting principles (“GAAP”) in the United States. The financial statements include the consolidated results of the Partnership. All intercompany balances and transactions have been eliminated.
The Partnership evaluates the significant terms of its investments to determine the method of accounting to be applied to each respective investment. Investments in which the Partnership has less than a 20% ownership interest and does not have control or exercise significant influence are accounted for under the cost method. The Partnership’s cost method investment is included in deferred charges and other long-term assets in the consolidated balance sheets. Investments in which the Partnership exercises control are consolidated, and the noncontrolling interests of such investments, which are not attributable directly or indirectly to the Partnership, are presented as a separate component of net income and equity in the accompanying consolidated financial statements.
The consolidated financial statements include undivided interests in oil and natural gas property rights. The Partnership accounts for its share of oil and natural gas property rights by reporting its proportionate share of assets, liabilities, revenues, costs and cash flows within the relevant lines on the accompanying consolidated balance sheets, statements of operations, and statements of cash flows.
Certain reclassifications have been made to the prior periods presented to conform to the current period financial statement presentation. The reclassifications have no effect on the consolidated financial position, results of operations, or cash flows of the Partnership.
Segment reporting: The Partnership operates in a single operating and reportable segment. Operating segments are defined as components of an enterprise for which separate financial information is evaluated regularly by the chief operating decision maker in deciding how to allocate resources and assess performance. The Partnership’s chief operating decision maker allocates resources and assesses performance based upon financial information at the consolidated level.
F-8
BLACK STONE MINERALS, L.P. AND SUBSIDIARIES
NOTES TO CONSOLIDATED FINANCIAL STATEMENTS
NOTE 2—SUMMARY OF SIGNIFICANT ACCOUNTING POLICIES
Use of estimates: The preparation of consolidated financial statements in conformity with GAAP requires management to make estimates and assumptions that affect the reported amounts of assets and liabilities and disclosure of contingent assets and liabilities at the date of the consolidated financial statements and the reported amounts of revenues and expenses during the reporting periods. Actual results could differ from those estimates.
The Partnership’s consolidated financial statements are based on a number of significant estimates including oil and natural gas reserve quantities that are the basis for the calculations of depreciation, depletion, amortization (“DD&A”) and impairment of oil and natural gas properties. Reservoir engineering is a subjective process of estimating underground accumulations of oil and natural gas. There are numerous uncertainties inherent in estimating quantities of proved oil and natural gas reserves. The accuracy of any reserve estimate is a function of the quality of available data and of engineering and geological interpretation and judgment. As a result, reserve estimates may differ from the quantities of oil and natural gas that are ultimately recovered. The Partnership’s reserve estimates are determined by an independent petroleum engineering firm. Other items subject to significant estimates and assumptions include the carrying amount of oil and natural gas properties, valuation of derivative instruments, revenue accruals, asset retirement obligation (“ARO”) liabilities, and determination of the fair value of equity-based awards.
The Partnership evaluates estimates and assumptions on an ongoing basis using historical experience and other factors, including the current economic and commodity price environment. The volatility of commodity prices results in increased uncertainty inherent in such estimates and assumptions. A significant decline in natural gas or oil prices could result in a reduction in the Partnership’s fair value estimates and cause the Partnership to perform analyses to determine if its oil and natural gas properties are impaired. As future commodity prices cannot be determined accurately, actual results could differ significantly from estimates.
Cash and cash equivalents: The Partnership considers all highly liquid investments purchased with an original maturity of three months or less to be cash equivalents.
Concentration of credit risk: Financial instruments that potentially subject the Partnership to credit risk consist principally of cash and cash equivalent balances, accounts receivable, and commodity derivative financial instruments. The Partnership maintains cash and cash equivalent balances with major financial institutions. At times, those balances exceed federally insured limits; however, no losses have been incurred. The Partnership attempts to limit the amount of credit exposure to any one company through procedures that include credit approvals, credit limits and terms, and prepayments. The Partnership’s customer base is made up of its lessees, which are primarily major integrated and international oil and natural gas companies and other operators, though the Partnership’s credit risk may extend to the eventual purchasers of oil and natural gas produced from the Partnership’s properties. The Partnership believes the credit quality of its customer base is high and has not experienced significant write-offs in its accounts receivable balances. See Note 8 – Significant Customers for further discussion. Derivative instruments may expose the Partnership to credit risk. However, the Partnership monitors the creditworthiness of its counterparties.
Accounts receivable: The Partnership’s accounts receivable balance results primarily from operators’ sales of oil and natural gas to their customers. Accounts receivable is recorded at the contractual amounts and do not bear interest. Any concentration of customers may impact the Partnership’s overall credit risk, either positively or negatively, in that these entities may be similarly affected by changes in economic or other conditions impacting the oil and natural gas industry.
Derivatives and financial instruments: The Partnership’s ongoing operations expose it to changes in the market price for oil and natural gas. To mitigate the given commodity price risk associated with its operations, the Partnership uses derivative instruments. From time to time, such instruments may include variable–to-fixed-price swaps, costless collars, fixed-price contracts, and other contractual arrangements. The Partnership does not enter into derivative instruments for speculative purposes.
Derivative instruments are recognized at fair value. If a right of offset exists under master netting arrangements and certain other criteria are met, derivative assets and liabilities with the same counterparty are netted on the consolidated balance sheet. The Partnership does not specifically designate derivative instruments as cash flow hedges, even though they reduce its exposure to changes in oil and natural gas prices; therefore, gains and losses arising from changes in the fair value of derivatives are recognized on a net basis in the accompanying consolidated statements of operations within gain (loss) on commodity derivative instruments.
Prepaid expenses and other current assets: Prepaid expenses and other current assets as of December 31, 2014 included $7.6 million of capitalized issuance costs, including underwriting, legal, and accounting fees, directly related to the Partnership’s IPO.
F-9
BLACK STONE MINERALS, L.P. AND SUBSIDIARIES
NOTES TO CONSOLIDATED FINANCIAL STATEMENTS
Oil and natural gas properties: The Partnership follows the successful efforts method of accounting for oil and natural gas operations. Under this method, costs to acquire interests in oil and natural gas properties, property acquisitions, successful exploratory wells, development costs, and support equipment and facilities are capitalized when incurred. Exploration dry holes are charged to expense when it is determined that no commercial reserves exist. Other exploratory costs, including annual delay rentals and geological and geophysical costs, are expensed when incurred. Acquired mineral and royalty interests and working interests are recorded at cost at the time of acquisition.
The costs of unproved leaseholds and mineral interests are capitalized as unproved properties pending the results of exploration and leasing efforts. As unproved leaseholds are determined to be proved, the related costs are transferred to proved properties. Unproved and non-producing property costs are assessed periodically, on a property-by-property basis, and an impairment loss is recognized to the extent, if any, the recorded value has been impaired. Mineral interests are assessed for impairment when facts and circumstances indicate that their carrying value may not be recoverable. This assessment is performed by comparing carrying values to valuation estimates and impairment is recognized to the extent that book value exceeds estimated recoverable value. Any impairment will generally be based on geographic or geologic data and our estimated future cash flows related to our properties.
As exploration and development work progresses and the reserves associated with the Partnership’s properties become proven, capitalized costs attributed to the properties are charged as an operating expense through DD&A. DD&A of producing oil and natural gas properties is recorded based on the units-of-production method. Acquisition costs of proved properties are amortized on the basis of all proved reserves, both developed and undeveloped, and capitalized development costs are amortized on the basis of proved developed reserves. Proved reserves are quantities of oil and natural gas that can be estimated with reasonable certainty to be economically producible from a given date forward, from known reservoirs, under existing economic conditions, operating methods, and government regulations. DD&A expense related to the Partnership’s producing oil and natural gas properties was $102.7 million, $109.9 million and $100.6 million for the years ended December 31, 2015, 2014, and 2013, respectively.
The Partnership evaluates impairment of producing properties whenever events or changes in circumstances indicate that the carrying amount of an asset may not be recoverable. This evaluation is performed on a field-by-field basis. The Partnership compares the undiscounted projected future cash flows expected in connection with a field to the carrying amount to determine recoverability. When the carrying amount of a field exceeds its estimated undiscounted future cash flows, the carrying amount is written down to its fair value, which is measured as the present value of the projected future cash flows of such properties. The factors used to determine fair value include estimates of proved reserves, future commodity prices, timing of future production, future capital expenditures, and a risk-adjusted discount rate.
Impairment of proved oil and natural gas properties was $127.8 million, $117.9 million and $57.1 million for the years ended December 31, 2015, 2014, and 2013, respectively. The impairment primarily resulted from declines in future expected realizable net cash flows. The charges are included in impairment of oil and natural gas properties on the consolidated statements of operations and reflected in the net book value of oil and natural gas properties.
The carrying value of unproved properties, including unleased mineral rights, is periodically assessed for impairment using management’s assessment of fair value. The factors used to determine fair value are similar to those previously noted for proved properties. Impairment of unproved properties was $121.8 million for the year ended December 31, 2015. There was no impairment of unproved properties for the years ended December 31, 2014 and 2013.
Upon the sale of complete fields of depreciable or depletable property, the book value thereof, less proceeds or salvage value is charged to income. On sale or retirement of an individual well, the proceeds are credited to accumulated DD&A.
Other property and equipment: Other property and equipment includes furniture, fixtures, office equipment, leasehold improvements, and computer software and is stated at historical cost. Depreciation and amortization are calculated using the straight-line method over expected useful lives ranging from three to seven years. Depreciation and amortization expense totaled $1.6 million, $2.1 million, and $1.8 million for the years ended December 31, 2015, 2014, and 2013, respectively.
Repairs and maintenance: The cost of normal maintenance and repairs is charged to expense as incurred. Material expenditures that increase the life of an asset are capitalized and depreciated over the shorter of the estimated remaining useful life of the asset or the term of the lease, if applicable.
Accrued distribution payable to Predecessor unitholders: Accrued distribution payable to Predecessor unitholders consisted of distributions due to the Predecessor’s partners based on the partnership agreement that have not been paid out as of the respective balance sheet dates.
F-10
BLACK STONE MINERALS, L.P. AND SUBSIDIARIES
NOTES TO CONSOLIDATED FINANCIAL STATEMENTS
Debt issuance costs: Debt issuance costs consist of costs directly associated with obtaining credit with financial institutions. These costs are capitalized and are generally amortized on a straight-line basis over the life of the credit agreement, which approximates the effective-interest method. Any unamortized debt issue costs are expensed in the year when the associated debt instrument is terminated. Amortization expense for debt issue costs was $0.9 million, $1.0 million, and $1.0 million for the years ended December 31, 2015, 2014, and 2013, respectively, and is included in interest expense in the consolidated statements of operations.
Asset retirement obligations: Fair values of legal obligations to retire and remove long-lived assets are recorded when the obligation is incurred and becomes determinable. When the liability is initially recorded, the Partnership capitalizes this cost by increasing the carrying amount of the related property and equipment. Over time, the liability is accreted for the change in its present value, and the capitalized cost in oil and natural gas properties is depleted based on units of production consistent with the related asset.
Revenue recognition: The Partnership recognizes revenue when it is realized or realizable and earned. Revenues are considered realized or realizable and earned when: (i) persuasive evidence of an arrangement exists, (ii) delivery has occurred or services have been rendered, (iii) the seller’s price to the buyer is fixed or determinable, and (iv) collectability is reasonably assured.
The Partnership recognizes oil and natural gas revenue from its interests in producing wells when the associated production is sold. The volumes of natural gas sold may differ from the volumes to which the Partnership is entitled based on its interests in the properties. These differences create imbalances that are recognized as a liability only when the properties’ estimated remaining reserves, net to the Partnership, will not be sufficient to enable the under-produced owner to recoup its entitled share through production; however, such amounts are de minimis at December 31, 2015 and 2014. To the extent actual volumes and prices of oil and natural gas are unavailable for a given reporting period because of timing or information not received from third parties, the expected sales volume and prices for these properties are estimated and recorded within accounts receivable in the accompanying consolidated balance sheets. Crude oil is priced on the delivery date based upon prevailing prices published by purchasers with certain adjustments related to oil quality and physical location. Natural gas contracts’ pricing provisions are tied to a market index, with certain adjustments based on, among other factors, whether a well delivers to a gathering or transmission line, quality and heat content of natural gas, and prevailing supply and demand conditions, so that the price of natural gas fluctuates to remain competitive with other available natural gas supplies. These market indices are determined on a monthly basis.
Other sources of revenue received by the Partnership includes mineral lease bonuses and delay rentals. The Partnership generates lease bonus revenue by leasing its mineral interests to other exploration and production companies. The lease agreements generally transfer the rights to any oil or natural gas discovered, grant the Partnership a right to a specified royalty interest, and require that drilling and completion operations commence within a specified time period. The Partnership recognizes such lease bonus revenue at which time the lease agreement has been executed, payment is determined to be collectable, and the Partnership has no further obligation to refund the payment. The Partnership also recognizes revenue from delay rentals to the extent drilling has not started within the specified period, payment has been collected, and the Partnership has no further obligation to refund the payment.
Income taxes: The Partnership is organized as a pass-through entity for income tax purposes. As a result, the Partnership’s unitholders are responsible for federal and state income taxes attributable to their share of the Partnership’s taxable income. The Partnership is subject to other state-based taxes; however, those taxes are not material.
Limited partnerships that receive at least 90% of their gross income from designated passive sources, including royalties from mineral properties and other non-operated mineral interest income, and do not receive more than 10% of their income from operating an active trade or business, are classified as “passive entities” and are generally exempt from the Texas margin tax. The Partnership believes that it meets the requirements for being considered a “passive entity” for Texas margin tax purposes and, therefore, it is exempt from the Texas margin tax. As a result, each unitholder that is considered a taxable entity under the Texas margin tax would generally be required to include its portion of the Partnership’s revenues in its own Texas margin tax computation. The Texas Administrative Code provides such income is sourced according to the principal place of business of the Partnership, which would be the state of Texas.
Fair value of financial instruments: The carrying values of the Partnership’s current financial instruments, which include cash and cash equivalents, accounts receivable and accounts payable, approximate their fair value at December 31, 2015 and 2014 due to the short-term maturity of these instruments. See Note 6 – Fair Value Measurement for further discussion.
Incentive compensation: Incentive compensation includes both equity-based awards and liability awards. The Partnership recognizes compensation expense associated with its equity-based compensation awards using either straight-line or accelerated
F-11
BLACK STONE MINERALS, L.P. AND SUBSIDIARIES
NOTES TO CONSOLIDATED FINANCIAL STATEMENTS
attribution over the requisite service period (generally the vesting period of the awards) depending on the given terms of the award, based on their grant-date fair values, in general and administrative expense.
Liability awards are awards that are expected to be settled in cash on their vesting dates. Liability awards are recorded as accrued liabilities based on the vested portion of the estimated fair value of the awards as of the grant date, which is subject to revision based on the impact of certain performance conditions associated with the incentive plans. The Partnership may also recognize liability awards as a result of repurchase options given to the recipients participating in certain incentive plans.
Compensation expense for unit-based awards subsequent to the Partnership’s initial public offering is measured by the price of the unit at the measurement date, which is generally the date of grant, and is recognized in general and administrative expense over the requisite service period. Prior to the initial public offering, the Predecessor was privately held and determining the fair value required the Predecessor to make complex and subjective judgments. The Board determined the fair value of the equity-based awards’ unit price prior to the Partnership’s initial public offering by considering various objective and subjective factors, along with input from management. To determine the fair value of the Predecessor, the Predecessor considered information provided by third-party consultants and relied on generally accepted valuation techniques, which included, but were not limited to, the net asset value method under the asset approach, the guideline public company method under the market approach, and the dividend discount method of the income approach. These methods were dependent upon various assumptions to develop the estimates in the Predecessor’s operating results, commodity prices, and market-based discount rates. The Predecessor also considered publicly available information on comparable public companies and the Predecessor’s historical transactions and performance in making these estimates. The Predecessor’s limited partnership agreement contained an annual repurchase obligation of 1% of the outstanding units. An annual valuation of the Predecessor was required to establish a value basis for the repurchase obligation. The Predecessor utilized the same valuation for repurchases and issuances of equity, if any, and as the basis for calculating the fair value of its equity awards under its long-term incentive plans.
New accounting pronouncements: The JOBS Act provides that an emerging growth company can delay adopting new or revised accounting standards until such time as those standards apply to private companies. We have irrevocably elected to “opt out” of this exemption and therefore will be subject to the same new or revised accounting standards as other public companies that are not emerging growth companies.
In May 2014, the Financial Accounting Standards Board (the “FASB”) issued an accounting standards update on a comprehensive new revenue recognition standard that will supersede Accounting Standards Codification (“ASC”) 605, Revenue Recognition. The new accounting guidance creates a framework under which an entity will allocate the transaction price to separate performance obligations and recognize revenue when each performance obligation is satisfied. Under the new standard, entities will be required to use judgment and make estimates, including identifying performance obligations in a contract, estimating the amount of variable consideration to include in the transaction price, allocating the transaction price to each separate performance obligation, and determining when an entity satisfies its performance obligations. The standard allows for either “full retrospective” adoption, meaning that the standard is applied to all of the periods presented with a cumulative catch-up as of the earliest period presented, or “modified retrospective” adoption, meaning the standard is applied only to the most current period presented in the financial statements with a cumulative catch-up as of the current period. In July 2015, the FASB decided to defer the original effective date by one year to be effective for annual reporting periods beginning after December 15, 2017 instead of December 15, 2016 for public entities. The Partnership is still evaluating the impact that the new accounting guidance will have on its consolidated financial statements and related disclosures and has not yet determined the method by which it will adopt the standard.
In November 2014, the FASB issued an accounting standards update that clarifies how U.S. GAAP should be applied in determining whether the nature of a host contract is more akin to debt or equity and in evaluating whether the economic characteristics and risks of an embedded feature are "clearly and closely related" to its host contract. The guidance is effective for fiscal years, and interim periods within those fiscal years, beginning after December 15, 2015. The Partnership adopted this guidance on January 1, 2016, and there was no material impact to the Partnership’s consolidated financial statements and related disclosures.
In April 2015, the FASB issued an accounting standards update that requires debt issuance costs related to a recognized debt liability to be presented in the balance sheet as a direct deduction from the carrying value of that debt liability, consistent with debt discounts. The guidance is effective retrospectively for fiscal years, and interim periods within those years, beginning after December 15, 2015. Early adoption is permitted for financial statements that have not been previously issued. The Partnership does not expect the impact of adopting this guidance will be material to the Partnership’s consolidated financial statements and related disclosures.
In September 2015, the FASB issued an accounting standards update that requires that adjustments to provisional amounts identified during the measurement period of a business combination be recognized in the reporting period in which those adjustments
F-12
BLACK STONE MINERALS, L.P. AND SUBSIDIARIES
NOTES TO CONSOLIDATED FINANCIAL STATEMENTS
are determined, including the effect on earnings, if any, calculated as if the accounting had been completed at the acquisition date. This eliminates the previous requirement to retrospectively account for such adjustments. The new standard also requires additional disclosures related to the income statement effects of adjustments to provisional amounts identified during the measurement period. The guidance is effective for public companies during interim and annual reporting periods beginning after December 15, 2015. Early adoption is permitted. The Partnership does not expect the impact of adopting this guidance will be material to the Partnership’s consolidated financial statements and related disclosures.
NOTE 3—ASSET RETIREMENT OBLIGATIONS
The ARO liability reflects the present value of estimated costs of dismantlement, removal, site reclamation, and similar activities associated with the Partnership’s oil and natural gas properties. The Partnership utilizes current retirement costs to estimate the expected cash outflows for retirement obligations. The Partnership estimates the ultimate productive life of the properties, a risk-adjusted discount rate, and an inflation factor in order to determine the current present value of this obligation. To the extent future revisions to these assumptions impact the present value of the existing ARO liability, a corresponding adjustment is made to the oil and natural gas property balance.
The following table describes changes to the Partnership’s ARO liability:
|
|
For the year ended December 31, |
|
|||||
|
|
2015 |
|
|
2014 |
|
||
|
|
(In thousands) |
|
|||||
|
Beginning asset retirement obligations |
$ |
9,381 |
|
|
$ |
5,961 |
|
|
Liabilities incurred |
|
272 |
|
|
|
167 |
|
|
Liabilities settled |
|
(143 |
) |
|
|
(145 |
) |
|
Accretion expense |
|
1,075 |
|
|
|
1,060 |
|
|
Revisions in estimated costs |
|
— |
|
|
|
2,338 |
|
|
Ending asset retirement obligations |
$ |
10,585 |
|
|
$ |
9,381 |
|
NOTE 4—ACQUISITIONS
Acquisitions of proved oil and natural gas properties and working interests are considered business combinations and are recorded at their estimated fair value as of the acquisition date. Acquisitions of unproved oil and natural gas properties are considered asset acquisitions and are recorded at historical cost.
The Partnership acquired mineral and royalty interests in the Permian Basin throughout 2015. Separate transactions were closed on June 30, 2015 ($14.4 million), July 15, 2015 ($7.8 million), August 5, 2015 ($20.3 million), August 21, 2015 ($5.8 million), and September 22, 2015 ($3.4 million).
The Partnership acquired acreage in the Eagle Ford Shale play through two transactions: mineral and royalty interests in June of 2015 for $0.5 million and mineral and royalty and non-operated working interests on September 24, 2015 for $9.2 million.
On June 2, 2015, the Partnership also acquired overriding royalty interests in the Utica Shale and Marcellus plays for $1.8 million.
During 2014, the Predecessor acquired mineral and royalty interests in the Permian Basin for $16.0 million and the Eagle Ford Shale play for $11.9 million. The Predecessor also acquired non-operated working interests in the Haynesville play for $24.6 million and mineral and royalty interests and non-operated working interests in various states for $2.3 million through the issuance of Predecessor units.
In 2004, the Predecessor and third-party investors acquired an interest in the producing and non-producing oil and natural gas properties of Pure Partners, L.P. and Pure Resources, L.P. (“Pure”). As of December 31, 2012, the Predecessor owned 86.4% of the oil and natural gas properties of Pure. Third-party investors owned the remaining 13.6% of the oil and natural gas properties. Effective January 1, 2013, the Predecessor purchased the remaining ownership interest in the Pure oil and natural gas properties through the issuance of $227.1 million of Predecessor units. The fair value of the assets acquired was determined based on discounted cash flows, including assumptions as to the estimated ultimate recovery of oil and natural gas reserves, expectations for timing of future
F-13
BLACK STONE MINERALS, L.P. AND SUBSIDIARIES
NOTES TO CONSOLIDATED FINANCIAL STATEMENTS
development and operating costs, and risk-adjusted discount rates. The following table summarizes the fair values assigned to the assets acquired as of January 1, 2013:
|
|
(In thousands) |
|
|
|
Proved oil and natural gas properties |
$ |
51,573 |
|
|
Unproved oil and natural gas properties |
|
169,150 |
|
|
Net working capital |
|
6,396 |
|
|
Total net assets acquired |
$ |
227,119 |
|
NOTE 5—DERIVATIVES AND FINANCIAL INSTRUMENTS
The Partnership’s ongoing operations expose it to changes in the market price for oil and natural gas. To mitigate the given commodity price risk associated with its operations, the Partnership uses derivative instruments. From time to time, such instruments may include fixed price contracts, variable to fixed price swaps, costless collars, and other contractual arrangements. The Partnership does not enter into derivative instruments for speculative purposes.
A fixed-price-swap contract between the Partnership and the counterparty specifies a fixed commodity price and a future settlement date. The Partnership will receive from, or pay to, the counterparty the difference between the fixed swap price and the market price on the settlement date. Costless collars are a combination of a purchased put option and a sold call option, in which the premiums net to zero. With a costless collar, the counterparty is required to make a payment to the Partnership if the settlement price for any settlement period is below the exercise price of the purchased put. The Partnership is required to make a payment to the counterparty if the settlement price for any settlement period is above the exercise price for the sold call of the collar. The settlement paid or received is the difference between the market price on the settlement date and the related exercise price. All derivative instruments that have not yet been settled in cash are reflected as either derivative assets or liabilities in the Partnership’s accompanying consolidated balance sheets as of December 31, 2015 and 2014, respectively. See Note 6 – Fair Value Measurement for further discussion.
The table below summarizes the fair value and classification of the Partnership’s derivative instruments:
|
As of December 31, 2015 |
|
|||||||||||||
|
Classification |
|
Balance Sheet Location |
|
Gross Fair Value |
|
|
Effect of Counterparty Netting |
|
|
Net Carrying Value on Balance Sheet |
|
|||
|
|
|
|
|
|
|
|
|
(In thousands) |
|
|
|
|
|
|
|
Assets: |
|
|
|
|
|
|
|
|
|
|
|
|
|
|
|
Current asset |
|
Commodity derivative assets |
|
$ |
48,260 |
|
|
$ |
— |
|
|
$ |
48,260 |
|
|
Long-term asset |
|
Deferred charges and other long-term assets |
|
|
16,274 |
|
|
|
— |
|
|
|
16,274 |
|
|
Total assets |
|
|
|
$ |
64,534 |
|
|
$ |
— |
|
|
$ |
64,534 |
|
|
Liabilities: |
|
|
|
|
|
|
|
|
|
|
|
|
|
|
|
Current liability |
|
Commodity derivative liabilities |
|
$ |
— |
|
|
$ |
— |
|
|
$ |
— |
|
|
Long-term liability |
|
Commodity derivative liabilities |
|
|
— |
|
|
|
— |
|
|
|
— |
|
|
Total liabilities |
|
|
|
$ |
— |
|
|
$ |
— |
|
|
$ |
— |
|
F-14
BLACK STONE MINERALS, L.P. AND SUBSIDIARIES
NOTES TO CONSOLIDATED FINANCIAL STATEMENTS
|
As of December 31, 2014 |
|
|||||||||||||
|
Classification |
|
Balance Sheet Location |
|
Gross Fair Value |
|
|
Effect of Counterparty Netting |
|
|
Net Carrying Value on Balance Sheet |
|
|||
|
|
|
|
|
|
|
|
|
(In thousands) |
|
|
|
|
|
|
|
Assets: |
|
|
|
|
|
|
|
|
|
|
|
|
|
|
|
Current asset |
|
Commodity derivative assets |
|
$ |
37,656 |
|
|
$ |
(185 |
) |
|
$ |
37,471 |
|
|
Long-term asset |
|
Deferred charges and other long-term assets |
|
|
— |
|
|
|
— |
|
|
|
— |
|
|
Total assets |
|
|
|
$ |
37,656 |
|
|
$ |
(185 |
) |
|
$ |
37,471 |
|
|
Liabilities: |
|
|
|
|
|
|
|
|
|
|
|
|
|
|
|
Current liability |
|
Commodity derivative liabilities |
|
$ |
185 |
|
|
$ |
(185 |
) |
|
$ |
— |
|
|
Long-term liability |
|
Commodity derivative liabilities |
|
|
— |
|
|
|
— |
|
|
|
— |
|
|
Total liabilities |
|
|
|
$ |
185 |
|
|
$ |
(185 |
) |
|
$ |
— |
|
Changes in the fair values of the Partnership’s derivative instruments (both assets and liabilities) are presented on a net basis in the accompanying consolidated statements of operations. Changes in the fair value of the Partnership’s commodity derivative instruments (both assets and liabilities) are as follows:
|
|
|
For the year ended December 31, |
|
|||||||||
|
Derivatives not designated as hedging instruments |
|
2015 |
|
|
2014 |
|
|
2013 |
|
|||
|
|
|
(In thousands) |
|
|||||||||
|
Beginning fair value of commodity derivative instruments |
|
$ |
37,471 |
|
|
$ |
(1,812 |
) |
|
$ |
5,538 |
|
|
Gain on oil derivative instruments |
|
|
57,681 |
|
|
|
27,548 |
|
|
|
(3,469 |
) |
|
Gain on natural gas derivative instruments |
|
|
32,607 |
|
|
|
9,788 |
|
|
|
(2,391 |
) |
|
Net cash received on settlements of oil derivative instruments |
|
|
(41,786 |
) |
|
|
(46 |
) |
|
|
505 |
|
|
Net cash (received) paid on settlements of natural gas derivative instruments |
|
|
(21,439 |
) |
|
|
1,993 |
|
|
|
(1,995 |
) |
|
Net change in fair value of commodity derivative instruments |
|
|
27,063 |
|
|
|
39,283 |
|
|
|
(7,350 |
) |
|
Ending fair value of commodity derivative instruments |
|
$ |
64,534 |
|
|
$ |
37,471 |
|
|
$ |
(1,812 |
) |
The Partnership had the following open derivative contracts for oil as of December 31, 2015:
|
|
|
Volume |
|
|
Weighted Average |
|
|
Range (Per Bbl) |
|
|||||||
|
Period and Type of Contract |
|
(Bbl) |
|
|
(Per Bbl) |
|
|
Low |
|
|
High |
|
||||
|
Oil Collar Contracts: |
|
|
|
|
|
|
|
|
|
|
|
|
|
|
|
|
|
Q4 2015 |
|
|
|
|
|
|
|
|
|
|
|
|
|
|
|
|
|
Call Options |
|
|
10,000 |
|
|
$ |
102.00 |
|
|
$ |
102.00 |
|
|
$ |
102.00 |
|
|
Put Options |
|
|
10,000 |
|
|
|
85.00 |
|
|
|
85.00 |
|
|
|
85.00 |
|
|
Oil Swap Contracts: |
|
|
|
|
|
|
|
|
|
|
|
|
|
|
|
|
|
Q4 2015 |
|
|
173,000 |
|
|
|
59.67 |
|
|
|
48.65 |
|
|
|
61.71 |
|
|
Q1 2016 |
|
|
502,000 |
|
|
|
55.88 |
|
|
|
48.54 |
|
|
|
61.34 |
|
|
Q2 2016 |
|
|
455,000 |
|
|
|
57.30 |
|
|
|
50.14 |
|
|
|
61.96 |
|
|
Q3 2016 |
|
|
424,000 |
|
|
|
58.38 |
|
|
|
51.27 |
|
|
|
62.53 |
|
|
Q4 2016 |
|
|
398,000 |
|
|
|
59.43 |
|
|
|
52.40 |
|
|
|
63.07 |
|
|
FY 2017 |
|
|
703,000 |
|
|
|
58.50 |
|
|
|
52.73 |
|
|
|
63.65 |
|
F-15
BLACK STONE MINERALS, L.P. AND SUBSIDIARIES
NOTES TO CONSOLIDATED FINANCIAL STATEMENTS
The Partnership had the following open derivative contracts for natural gas as of December 31, 2015:
|
|
|
Volume |
|
|
Weighted Average |
|
|
Range (Per MMBtu) |
|
|||||||
|
Period and Type of Contract |
|
(MMBtu) |
|
|
(Per MMBtu) |
|
|
Low |
|
|
High |
|
||||
|
Natural Gas Swap Contracts: |
|
|
|
|
|
|
|
|
|
|
|
|
|
|
|
|
|
Q1 2016 |
|
|
6,780,000 |
|
|
$ |
3.26 |
|
|
$ |
3.16 |
|
|
$ |
3.38 |
|
|
Q2 2016 |
|
|
6,240,000 |
|
|
|
3.07 |
|
|
|
3.00 |
|
|
|
3.14 |
|
|
Q3 2016 |
|
|
5,830,000 |
|
|
|
3.13 |
|
|
|
3.06 |
|
|
|
3.17 |
|
|
Q4 2016 |
|
|
5,400,000 |
|
|
|
3.25 |
|
|
|
3.10 |
|
|
|
3.41 |
|
|
FY 2017 |
|
|
9,650,000 |
|
|
|
3.33 |
|
|
|
3.14 |
|
|
|
3.52 |
|
The Partnership entered into the following derivative contracts for oil subsequent to December 31, 2015:
|
|
|
Volume |
|
|
Weighted Average |
|
|
Range (Per Bbl) |
|
|||||||
|
Period and Type of Contract |
|
(Bbl) |
|
|
(Per Bbl) |
|
|
Low |
|
|
High |
|
||||
|
Oil Swap Contracts: |
|
|
|
|
|
|
|
|
|
|
|
|
|
|
|
|
|
Q1 2016 |
|
|
28,000 |
|
|
$ |
29.56 |
|
|
$ |
29.07 |
|
|
$ |
29.79 |
|
|
Q2 2016 |
|
|
81,000 |
|
|
|
32.60 |
|
|
|
31.25 |
|
|
|
33.93 |
|
|
Q3 2016 |
|
|
65,000 |
|
|
|
35.20 |
|
|
|
34.41 |
|
|
|
36.09 |
|
|
Q4 2016 |
|
|
50,000 |
|
|
|
37.00 |
|
|
|
36.31 |
|
|
|
37.73 |
|
The Partnership entered into the following derivative contracts for natural gas subsequent to December 31, 2015:
|
|
|
Volume |
|
|
Weighted Average |
|
|
Range (Per MMBtu) |
|
|||||||
|
Period and Type of Contract |
|
(MMBtu) |
|
|
(Per MMBtu) |
|
|
Low |
|
|
High |
|
||||
|
Natural Gas Swap Contracts: |
|
|
|
|
|
|
|
|
|
|
|
|
|
|
|
|
|
Q1 2016 |
|
|
340,000 |
|
|
$ |
1.98 |
|
|
$ |
1.96 |
|
|
$ |
1.99 |
|
|
Q2 2016 |
|
|
970,000 |
|
|
|
2.10 |
|
|
|
2.03 |
|
|
|
2.19 |
|
|
Q3 2016 |
|
|
780,000 |
|
|
|
2.26 |
|
|
|
2.23 |
|
|
|
2.28 |
|
|
Q4 2016 |
|
|
550,000 |
|
|
|
2.42 |
|
|
|
2.29 |
|
|
|
2.61 |
|
NOTE 6—FAIR VALUE MEASUREMENT
Fair value is defined as the amount at which an asset (or liability) could be bought (or incurred) or sold (or settled) in an orderly transaction between market participants at the measurement date. Further, ASC 820 establishes a framework for measuring fair value, establishes a fair value hierarchy based on the quality of inputs used to measure fair value, and includes certain disclosure requirements. Fair value estimates are based on either (i) actual market data or (ii) assumptions that other market participants would use in pricing an asset or liability, including estimates of risk.
ASC 820 establishes a three-level valuation hierarchy for disclosure of fair value measurements. The valuation hierarchy categorizes assets and liabilities measured at fair value into one of three different levels depending on the observability of the inputs employed in the measurement. The three levels are defined as follows:
Level 1—Unadjusted quoted prices for identical assets or liabilities in active markets.
Level 2—Quoted prices for similar assets or liabilities in non-active markets, and inputs that are observable for the asset or liability, either directly or indirectly, for substantially the full term of the financial instrument.
Level 3—Inputs that are unobservable and significant to the fair value measurement (including the Partnership’s own assumptions in determining fair value).
A financial instrument’s categorization within the valuation hierarchy is based upon the lowest level of input that is significant to the fair value measurement. The Partnership’s assessment of the significance of a particular input to the fair value measurement in its entirety requires judgment and considers factors specific to the asset or liability. There were no transfers into, or out of, the three levels of the fair value hierarchy for the years ended December 31, 2015 and 2014.
F-16
BLACK STONE MINERALS, L.P. AND SUBSIDIARIES
NOTES TO CONSOLIDATED FINANCIAL STATEMENTS
Assets and Liabilities Measured at Fair Value on a Recurring Basis
The Partnership estimated the fair value of derivative instruments using the market approach via a model that uses inputs that are observable in the market or can be derived from, or corroborated by, observable data. See Note 5 – Derivatives and Financial Instruments for further discussion.
The following table presents information about the Partnership’s assets and liabilities measured at fair value on a recurring basis:
|
|
|
Fair Value Measurements Using |
|
|
Effect of Counterparty |
|
|
|
|
|
||||||||||
|
|
|
Level 1 |
|
|
Level 2 |
|
|
Level 3 |
|
|
Netting |
|
|
Total |
|
|||||
|
|
|
(In thousands) |
|
|||||||||||||||||
|
As of December 31, 2015 |
|
|
|
|
|
|
|
|
|
|
|
|
|
|
|
|
|
|
|
|
|
Financial Assets |
|
|
|
|
|
|
|
|
|
|
|
|
|
|
|
|
|
|
|
|
|
Commodity derivative instruments |
|
$ |
— |
|
|
$ |
64,534 |
|
|
$ |
— |
|
|
$ |
— |
|
|
$ |
64,534 |
|
|
Financial Liabilities |
|
|
|
|
|
|
|
|
|
|
|
|
|
|
|
|
|
|
|
|
|
Commodity derivative instruments |
|
|
— |
|
|
|
— |
|
|
|
— |
|
|
|
— |
|
|
|
— |
|
|
As of December 31, 2014 |
|
|
|
|
|
|
|
|
|
|
|
|
|
|
|
|
|
|
|
|
|
Financial Assets |
|
|
|
|
|
|
|
|
|
|
|
|
|
|
|
|
|
|
|
|
|
Commodity derivative instruments |
|
$ |
— |
|
|
$ |
37,656 |
|
|
$ |
— |
|
|
$ |
(185 |
) |
|
$ |
37,471 |
|
|
Financial Liabilities |
|
|
|
|
|
|
|
|
|
|
|
|
|
|
|
|
|
|
|
|
|
Commodity derivative instruments |
|
|
— |
|
|
|
185 |
|
|
|
— |
|
|
|
(185 |
) |
|
|
— |
|
Assets and Liabilities Measured at Fair Value on a Non-Recurring Basis
Nonfinancial assets and liabilities measured at fair value on a non-recurring basis include certain nonfinancial assets and liabilities as may be acquired in a business combination, measurements of oil and natural gas property impairments, and the initial recognition of ARO, for which fair value is used. These ARO estimates are derived from historical costs as well as management’s expectation of future cost environments. As there is no corroborating market activity to support the assumptions used, the Partnership has designated these measurements as Level 3.
The determination of the fair values of proved and unproved properties acquired in business combinations are prepared by estimating discounted cash flow projections. The factors used to determine fair value include estimates of: economic reserves, future operating and development costs, future commodity prices, and a market-based weighted average cost of capital. The Partnership has designated these measurements as Level 3.
Oil and natural gas properties are measured at fair value on a nonrecurring basis using the income approach when measuring impairment. Proved and unproved oil and natural gas properties are reviewed for impairment when events and circumstances indicate a possible decline in the recoverability of the carrying value of those properties. Significant Level 3 assumptions used to determine fair value include estimates of proved reserves, future commodity prices, the timing and amount of future production and capital expenditures, and a discount rate commensurate with the risk associated with the respective oil and natural gas properties.
The Partnership’s estimates of fair value have been determined at discrete points in time based on relevant market data. These estimates involve uncertainty and cannot be determined with precision. There were no significant changes in valuation techniques or related inputs for the years ended December 31, 2015 and 2014.
F-17
BLACK STONE MINERALS, L.P. AND SUBSIDIARIES
NOTES TO CONSOLIDATED FINANCIAL STATEMENTS
The following table presents information about the Partnership’s assets measured at fair value on a non-recurring basis:
|
|
|
Fair Value Measurements Using |
|
|
Net Book |
|
|
|
|
|
||||||||||
|
|
|
Level 1 |
|
|
Level 2 |
|
|
Level 3 |
|
|
Value1 |
|
|
Impairment |
|
|||||
|
|
|
(In thousands) |
|
|||||||||||||||||
|
Year Ended December 31, 2015 |
|
|
|
|
|
|
|
|
|
|
|
|
|
|
|
|
|
|
|
|
|
Impaired oil and natural gas properties |
|
$ |
— |
|
|
$ |
— |
|
|
$ |
156,689 |
|
|
$ |
406,258 |
|
|
$ |
249,569 |
|
|
Year Ended December 31, 2014 |
|
|
|
|
|
|
|
|
|
|
|
|
|
|
|
|
|
|
|
|
|
Impaired oil and natural gas properties |
|
$ |
— |
|
|
$ |
— |
|
|
$ |
81,864 |
|
|
$ |
199,794 |
|
|
$ |
117,930 |
|
|
Year Ended December 31, 2013 |
|
|
|
|
|
|
|
|
|
|
|
|
|
|
|
|
|
|
|
|
|
Impaired oil and natural gas properties |
|
$ |
— |
|
|
$ |
— |
|
|
$ |
56,318 |
|
|
$ |
113,427 |
|
|
$ |
57,109 |
|
|
1 |
Amount represents net book value at the date of assessment. |
The carrying value of all debt as of December 31, 2015 and 2014 approximates fair value due to variable market rates of interest. These fair values, which are Level 3 measurements, were estimated based on the Partnership’s incremental borrowing rates for similar types of borrowing arrangements, when quoted market prices were not available. The estimated fair values of the Partnership’s financial instruments are not necessarily indicative of the amounts that would be realized in a current market exchange.
NOTE 7—RELATED PARTY TRANSACTIONS
The Predecessor executed promissory notes dated April 15, 2010, in the amount of $0.5 million to certain officers of the Predecessor. The promissory notes related to the acquisition of a partnership interest in a former affiliate by the officers, and the notes were collateralized by a security interest in the Predecessor. The aggregate outstanding note balance and interest receivable of $0.1 million was received during the year ended December 31, 2014.
NOTE 8—SIGNIFICANT CUSTOMERS
The Partnership leases mineral interests to exploration and production companies and participates in non-operated working interests when economic conditions are favorable. No customer represented 10.0% or more of total revenue for the year ended December 31, 2015. One company, Chesapeake Energy Corporation, represented 10.0% and 10.9% of total revenue for the years ended December 31, 2014 and 2013, respectively.
If the Partnership lost a significant customer, such loss could impact revenue derived from its mineral and royalty interests and working interests. The loss of any single customer is mitigated by the Partnership’s diversified customer base.
NOTE 9—CREDIT FACILITIES
Senior Line of Credit
The Partnership maintains a senior secured revolving credit agreement, as amended, (the “Senior Line of Credit”). The Senior Line of Credit has a maximum credit amount of $1.0 billion. On October 28, 2015, the Senior Line of Credit was further amended to extend the term of the agreement from February 3, 2017 to February 4, 2019. The amount of the borrowing base is derived from the value of the Partnership’s oil and natural gas properties determined by the lender syndicate using pricing assumptions that often differ from strip prices. The borrowing base was $700.0 million at December 31, 2014. The Partnership’s semi-annual borrowing base redetermination process resulted in a decrease of the borrowing base to $600.0 million, effective April 10, 2015. Effective October 28, 2015, the borrowing base was further decreased to $550.0 million. Drawings on the Senior Line of Credit are used for the acquisition of oil and natural gas properties and for other general business purposes.
Borrowings under the Senior Line of Credit bear interest at LIBOR plus a margin between 1.50% and 2.50%, or prime rate plus a margin between 0.50% and 1.50%, with the margin depending on the borrowing base utilization percentage of the loan, as detailed in the table below. The prime rate is determined to be the higher of the financial institution’s prime rate or the federal funds effective rate plus 0.50% per annum.
F-18
BLACK STONE MINERALS, L.P. AND SUBSIDIARIES
NOTES TO CONSOLIDATED FINANCIAL STATEMENTS
|
|
|
Borrowing Base Utilization |
|
|||||||||||||||||
|
Borrowing type |
|
<25% |
|
|
≥25% <50% |
|
|
≥50% <75% |
|
|
≥75% <90% |
|
|
≥90% |
|
|||||
|
Eurodollar Margin |
|
|
1.50 |
% |
|
|
1.75 |
% |
|
|
2.00 |
% |
|
|
2.25 |
% |
|
|
2.50 |
% |
|
Base Rate Margin |
|
|
0.50 |
% |
|
|
0.75 |
% |
|
|
1.00 |
% |
|
|
1.25 |
% |
|
|
1.50 |
% |
The weighted-average interest rate of the Senior Line of Credit was 1.92% and 2.41% as of December 31, 2015 and 2014, respectively. Accrued interest is payable at the end of each calendar quarter or at the end of each interest period, unless the interest period is longer than 90 days in which case interest is payable at the end of every 90-day period. In addition, a commitment fee is payable at the end of each calendar quarter based on either a rate of 0.375% if the borrowing base utilization percentage is less than 50%, or 0.500% per annum if the borrowing base utilization percentage is equal to or greater than 50%. The Senior Line of Credit is secured by a majority of the Partnership’s oil and natural gas production and assets.
The Senior Line of Credit contains various limitations on future borrowings, leases, hedging, and sales of assets. Additionally, the Senior Line of Credit requires the Partnership to maintain a current ratio of not less than 1.0:1.0 and a ratio of total debt to EBITDAX (Earnings before Interest, Taxes, Depreciation, Amortization, and Exploration) of not more than 3.5:1.0. As of December 31, 2015, the Partnership was in compliance with all financial covenants in the Senior Line of Credit.
The aggregate principal balance outstanding was $66.0 million and $394.0 million at December 31, 2015 and 2014, respectively. The unused portion of the available borrowings under the Senior Line of Credit was $484.0 million and $306.0 million at December 31, 2015 and 2014, respectively. Refer to Note 1 – Business and Basis of Presentation for a discussion of the use of proceeds from the IPO.
BSNR II-B Revolving Credit Facility
Black Stone Natural Resources II-B, L.P., a consolidated subsidiary of the Predecessor, obtained a $50.0 million five-year revolving credit facility dated November 9, 2005, as amended, on November 3, 2010, (“BSNR II-B Revolving Credit Facility”) with a financial institution as the administrative agent and the lender. The Predecessor repaid the outstanding principal balance of $19.1 million on March 28, 2013, and the BSNR II-B Revolving Credit Facility was terminated on April 30, 2013.
BSNR III-B Revolving Credit Facility
Black Stone Natural Resources III-B, L.P., a consolidated subsidiary of the Predecessor, obtained a $100.0 million revolving credit facility dated October 10, 2008 (“BSNR III-B Revolving Credit Facility”), with a financial institution as the administrative agent and the lender. On December 27, 2012, the BSNR III-B Revolving Credit Facility was amended and extended through November 30, 2017. The Predecessor repaid the outstanding principal balance of $27.0 million and terminated the BSNR III-B Revolving Credit Facility on May 15, 2013.
NOTE 10—INCENTIVE COMPENSATION
Overview
The Board of Directors of the Partnership’s general partner (“the Board”) adopted a long-term incentive plan (the “2015 LTIP”), pursuant to which non-employee directors of the Partnership’s general partner and certain employees and consultants of the Partnership and its affiliates are eligible to receive awards with respect to the Partnership’s common or subordinated units. On May 6, 2015, the Partnership registered 17,420,310 common and subordinated units that are issuable under the 2015 LTIP. The 2015 LTIP permits the grant of unit options, unit appreciation rights, restricted units, unit awards, phantom units, distribution equivalent rights either in tandem with an award or as a separate award, cash awards, and other unit-based awards. Any vesting terms associated with incentive awards will be based on a predetermined schedule as approved by the Board.
Incentive compensation expense is included in general and administrative expense on the consolidated statements of operations. The total compensation expense related to the common and subordinated unit grants is measured as the number of units granted that are expected to vest multiplied by the grant-date fair value per unit. Incentive compensation expense is recognized using straight-line or accelerated attribution depending on the specific terms of the award agreements over the requisite service periods (generally equivalent to the vesting period).
F-19
BLACK STONE MINERALS, L.P. AND SUBSIDIARIES
NOTES TO CONSOLIDATED FINANCIAL STATEMENTS
The Partnership provides cash long-term incentive awards annually for its executive officers and certain other employees. In 2012, the Predecessor adopted a long-term incentive plan that combined both its management and senior management long-term incentive plans (the “2012 LTI Plan”). Under the 2012 LTI Plan, executive officers and certain other members of management are granted fifty percent of their incentive compensation in performance cash awards determined based on achieving specific production and reserves targets as set by the Board. Cash award compensation cliff vests on the third anniversary of the grant date, subject to satisfaction of the applicable performance targets so long as the employee remains employed through the vesting date. Certain other employees are entitled to earn cash bonuses based on service criteria over a four-year requisite service period. Payments are disbursed one-third per year over three years beginning on the first anniversary following December 31 of the service year.
On May 6, 2015, cash awards totaling $2.7 million with service-based graded vesting requirements through March 31, 2019 were also granted to certain other employees.
Unit Grant Awards
The remaining fifty percent of incentive compensation was paid in the form of restricted common units of the Predecessor under the 2012 LTI Plan to executive officers and certain other members of management. Restricted common units of the Predecessor that were outstanding as of the date of the IPO were converted into restricted common and subordinated units of the Partnership in connection with the IPO as set forth in the table below. The converted restricted units awarded are subject to restrictions on transferability, customary forfeiture provisions, and time vesting provisions. Each converted award vests pursuant to the original vesting schedule applicable to the restricted unit award of the Predecessor. Award recipients have all the rights of a unitholder in the Partnership with respect to the converted restricted units, including the right to receive distributions thereon, if and when distributions are made by the Partnership to its limited partners. For awards granted prior to December 31, 2014, recipients could request that the Partnership, at its discretion, repurchase up to fifty percent of the restricted common units that are scheduled to vest. As a result of the repurchase option, fifty percent of the equity awards to be vested on each vesting date were classified as a liability during the corresponding year prior to the vesting date until a request for the Partnership to repurchase was made by the recipient, or the repurchase option period ended, which was 30 days prior to the vesting date. The liability was measured periodically at fair value. In conjunction with the adoption of the 2015 LTIP, the provision in certain of the Predecessor’s restricted unit agreements that allowed award recipients to request cash settlement for up to 50% of their restricted unit awards was removed; as such, these awards are no longer classified as liability awards. Non-employee directors of the Partnership’s general partner received compensation under the 2015 LTIP in the form of fully vested common units granted after each year of service.
On May 6, 2015, in conjunction with the adoption of the 2015 LTIP, the Board approved a grant of awards to each of the Partnership’s executive officers, certain other employees, and each of the non-employee directors of the Partnership’s general partner. The grants included 1,034,013 restricted common units subject to limitations on transferability, customary forfeiture provisions, and service-based graded vesting requirements through April 1, 2019. The holders of restricted common unit awards have all of the rights of a common unitholder, including non-forfeitable distribution rights with respect to their restricted common units. The grant-date fair value of these awards, net of estimated forfeitures, is recognized ratably using the straight-line attribution method. Additionally, non-employee directors of the Partnership’s general partner received a one-time grant totaling 63,156 fully vested common units.
The following table summarizes information about restricted units for the year ended December 31, 2015.
|
|
|
Units |
|
|
Weighted-Average Grant-Date Fair Value per Unit |
|
||||||||||||||||||
|
Units |
|
Predecessor |
|
|
Common |
|
|
Subordinated |
|
|
Predecessor |
|
|
Common |
|
|
Subordinated |
|
||||||
|
Unvested at December 31, 2014 |
|
|
668,119 |
|
|
|
— |
|
|
|
— |
|
|
$ |
20.81 |
|
|
$ |
— |
|
|
$ |
— |
|
|
Granted |
|
|
441,900 |
|
|
|
1,110,877 |
|
|
|
— |
|
|
|
18.30 |
|
|
|
18.98 |
|
|
|
— |
|
|
Vested |
|
|
(329,190 |
) |
|
|
(63,156 |
) |
|
|
— |
|
|
|
20.87 |
|
|
|
19.00 |
|
|
|
— |
|
|
Converted1 |
|
|
(780,829 |
) |
|
|
338,051 |
|
|
|
442,778 |
|
|
|
19.36 |
|
|
|
19.36 |
|
|
|
19.36 |
|
|
Forfeited |
|
|
— |
|
|
|
(23,681 |
) |
|
|
— |
|
|
|
— |
|
|
|
19.00 |
|
|
|
— |
|
|
Unvested at December 31, 2015 |
|
|
— |
|
|
|
1,362,091 |
|
|
|
442,778 |
|
|
$ |
— |
|
|
$ |
19.08 |
|
|
$ |
19.36 |
|
|
1 |
Consistent with all outstanding Predecessor units, the Predecessor restricted unit award agreements were converted into common and subordinated units of the Partnership at a conversion ratio of 12.9465:1 for 0.4329 common units and 0.5671 subordinated units as described in Note 1 – Business and Basis of Presentation. |
F-20
BLACK STONE MINERALS, L.P. AND SUBSIDIARIES
NOTES TO CONSOLIDATED FINANCIAL STATEMENTS
The weighted-average grant-date fair value for unit-based awards was $18.79, $20.73, and $20.78 for the years ended December 31, 2015, 2014, and 2013, respectively. Unrecognized compensation cost associated with restricted common and subordinated unit awards was $19.6 million and $4.7 million, respectively, as of December 31, 2015, which the Partnership expects to recognize over a weighted-average period of 2.99 years and 1.86 years for common units and subordinated units, respectively. The fair value of units vested for the years ended December 31, 2015, 2014, and 2013 was $9.4 million, $8.6 million, and $4.3 million, respectively. Cash payments of $0.4 million were made for vested units in 2014. There were no cash payments made for vested units during the years ended December 31, 2015 and 2013.
Performance Unit Grant Awards
On May 6, 2015, the Board also approved a grant of 947,142 restricted performance units that are subject to both performance-based and service-based vesting provisions. The number of common units issued to a recipient upon vesting of a restricted performance unit will be calculated based on performance against certain metrics that relate to the Partnership’s performance over each of the four 12-month performance periods commencing April 1, 2015. The target number of common units subject to each restricted performance unit is one; however, based on the achievement of performance criteria, the number of common units that may be received in settlement of each restricted performance unit can range from zero to two times the target number. The restricted performance units are eligible to become earned as follows: 16.66%, 16.67%, and 16.67% of the performance units may become earned in each of the 12-month performance periods that end on March 31, 2016, March 31, 2017, and March 31, 2018, respectively. The remaining 50% of the restricted performance units are eligible to become earned during the final 12-month performance period that ends on March 31, 2019. If the performance criteria are not met for the final performance period, the awards allow for a make-up period ending on March 31, 2020. Compensation expense related to the restricted performance unit awards is determined by multiplying the number of common units underlying such awards that, based on the Partnership’s estimate, are likely to vest, by the grant-date fair value and recognized using the accelerated attribution method. Distribution equivalent rights for the restricted performance unit awards that are expected to vest are charged to partners’ capital.
The following table summarizes information about performance units for the year ended December 31, 2015.
|
Performance units |
|
Units |
|
|
Weighted- Average Grant- Date Fair Value per Unit |
|
||
|
Unvested at December 31, 2014 |
|
|
— |
|
|
$ |
— |
|
|
Granted |
|
|
947,142 |
|
|
|
19.00 |
|
|
Vested |
|
|
— |
|
|
|
— |
|
|
Forfeited |
|
|
— |
|
|
|
— |
|
|
Unvested at December 31, 2015 |
|
|
947,142 |
|
|
$ |
19.00 |
|
Unrecognized compensation cost associated with performance unit awards was $2.4 million as of December 31, 2015, which the Partnership expects to recognize over a weighted-average period of 0.56 years. No performance units have vested as of December 31, 2015.
Incentive Compensation Summary
The table below summarizes incentive compensation expense recorded in general and administrative expenses in the consolidated statements of operations for the years ended December 31, 2015, 2014, and 2013.
|
|
|
Year Ended December 31, |
|
|||||||||
|
Incentive compensation expense |
|
2015 |
|
|
2014 |
|
|
2013 |
|
|||
|
|
|
(In thousands) |
|
|||||||||
|
Cash—long-term incentive plan |
|
$ |
15,064 |
|
|
$ |
13,927 |
|
|
$ |
10,205 |
|
|
Equity-based compensation—restricted common and subordinated units |
|
|
10,137 |
|
|
|
7,194 |
|
|
|
4,754 |
|
|
Equity-based compensation—restricted performance units |
|
|
4,743 |
|
|
|
— |
|
|
|
— |
|
|
Board of Directors incentive plan |
|
|
3,120 |
|
|
|
4,146 |
|
|
|
2,028 |
|
|
Total incentive compensation expense |
|
$ |
33,064 |
|
|
$ |
25,267 |
|
|
$ |
16,987 |
|
F-21
BLACK STONE MINERALS, L.P. AND SUBSIDIARIES
NOTES TO CONSOLIDATED FINANCIAL STATEMENTS
NOTE 11—EMPLOYEE BENEFIT PLANS
The Partnership sponsors a defined contribution 401(k) Profit Sharing Plan (the “401(k) Plan”) for the benefit of substantially all employees of the Partnership. The 401(k) Plan became effective on January 1, 2001 and allows eligible employees to make tax-deferred contributions up to 100% of their annual compensation, not to exceed annual limits established by the Internal Revenue Service. The Partnership makes matching contributions of 100% of employee contributions, up to 5% of compensation. These matching contributions are subject to a graded vesting schedule, with 33% vested after one year, 66% vested after two years and 100% vested after three years of employment with the Partnership. Following three years of employment, future Partnership matching contributions vest immediately. The Partnership’s contributions were $0.6 million, $0.6 million, and $0.5 million for the years ended December 31, 2015, 2014, and 2013, respectively.
NOTE 12—COMMITMENTS AND CONTINGENCIES
Leases
The Partnership leases certain office space and equipment under cancelable and non-cancelable operating leases that end at various dates through 2019. The Partnership recognizes rent expense on a straight-line basis over the lease term. Rent expense under such arrangements was $1.8 million for the year ended December 31, 2015 and $1.9 million for both of the years ended December 31, 2014 and 2013. Such amounts are included in general and administrative expense on the consolidated statements of operations.
Future minimum lease commitments under non-cancelable leases are as follows:
|
Year Ending December 31, |
|
(In thousands) |
|
|
|
2016 |
|
$ |
1,416 |
|
|
2017 |
|
|
1,651 |
|
|
2018 |
|
|
1,683 |
|
|
2019 |
|
|
1 |
|
|
2020 |
|
|
— |
|
|
Total |
|
$ |
4,751 |
|
Environmental Matters
The Partnership’s business includes activities that are subject to U.S. federal, state and local environmental regulations with regard to air, land, and water quality and other environmental matters.
The Partnership does not consider the potential remediation costs that could result from issues identified in any environmental site assessments to be significant to the consolidated financial statements and no provision for potential remediation costs has been made.
Litigation
From time to time, the Partnership is involved in legal actions and claims arising in the ordinary course of business. The Partnership believes existing claims as of December 31, 2015 will be resolved without material adverse effect on the Partnership’s financial condition or results of operations.
NOTE 13—REDEEMABLE PREFERRED UNITS
The Partnership has outstanding 77,216 and 157,203 Series A preferred units (the “Redeemable Preferred Units”) with a book value of $79.2 million and $161.2 million as of December 31, 2015 and 2014, respectively. The aforementioned amounts include accrued distributions of $1.9 million and $4.0 million as of December 31, 2015 and 2014, respectively. The Redeemable Preferred Units are classified as mezzanine equity on the consolidated balance sheets since redemption can occur outside the control of the Partnership. The Redeemable Preferred Units are entitled to an annual distribution of 10% of the funded capital of the Redeemable Preferred Units, payable on a quarterly basis in arrears.
The Redeemable Preferred Units are convertible into common and subordinated units at the option of the preferred unitholders. The Redeemable Preferred Units have an adjusted conversion price of $14.2683 and an adjusted conversion rate of 30.3431 common
F-22
BLACK STONE MINERALS, L.P. AND SUBSIDIARIES
NOTES TO CONSOLIDATED FINANCIAL STATEMENTS
units and 39.7427 subordinated units per Redeemable Preferred Unit, which reflects the reverse split described in Note 1 – Business and Basis of Presentation and the capital restructuring related to the IPO. The unitholders of the Redeemable Preferred Units can elect to have the Partnership redeem up to 25% per year of their initial balance of Redeemable Preferred Units at face value, plus any accrued and unpaid distributions, on December 31 of each year from 2014 to 2017. The Partnership shall have the right, at its sole option, to redeem an amount of Redeemable Preferred Units equal to the units being redeemed by an owner of Redeemable Preferred Units on each December 31. Any amount of a given year’s 25% of Redeemable Preferred Units not redeemed on December 31 shall automatically convert to common and subordinated units on January 1 of the following year.
For the year ended December 31, 2015, 39,240 Redeemable Preferred Units totaling $39.2 million were converted into 2,750,166 Predecessor units, which included units automatically converted on January 1, 2015. For the year ended December 31, 2014, 221 Redeemable Preferred Units totaling $0.2 million were converted into 15,489 Predecessor units.
On November 6, 2015, the Partnership commenced a tender offer to purchase up to 100% of the then outstanding Redeemable Preferred Units at par value plus unpaid accrued yield. The tender offer expired on December 10, 2015. The Partnership purchased and cancelled 40,747 Redeemable Preferred Units for $1,019.45 per unit for a total cost of $41.5 million, excluding fees and expenses related to the tender offer.
NOTE 14—PREDECESSOR EXCHANGE AND EQUITY OFFERINGS
During 2012, the Predecessor presented a proposal to purchase the noncontrolling interests in certain subsidiaries in exchange for cash or common units of the Predecessor (the “Predecessor Exchange Offer”). The Predecessor Exchange Offer resulted in a majority of the noncontrolling investors electing to exchange their interests in the subsidiaries for cash or common units of the Predecessor. The Predecessor Exchange Offer consisted of the issuance of $1,019.3 million of Predecessor units on January 1, 2013. The Predecessor used borrowings under the Senior Line of Credit and proceeds from a concurrent $412.2 million unit offering (“Predecessor Equity Offering”), effective January 1, 2013, to fund the purchase of the noncontrolling interests. Cash from the Predecessor Equity Offering in excess of the amounts needed for the Predecessor Exchange Offer was used to repay a portion of the Senior Line of Credit and provided additional capital for future acquisitions.
NOTE 15—EARNINGS PER UNIT
The Partnership applies the two-class method for purposes of calculating earnings per unit (“EPU”). The holders of the Partnership’s restricted common and subordinated units have all the rights of a unitholder, including non-forfeitable distribution rights. As participating securities, the restricted common and subordinated units are included in the calculation of basic earnings per unit. For the periods presented, the amount of earnings allocated to these participating units was not material. Net income (loss) attributable to the Partnership is allocated to our general partner and the common and subordinated unitholders in proportion to their pro rata ownership after giving effect to distributions, if any, declared during the period. The Redeemable Preferred Units could be converted into 2.3 million common units and 3.1 million subordinated units as of December 31, 2015. At December 31, 2015, if the redeemable preferred units were converted to common and subordinated units, the effect would be anti-dilutive. Therefore, the redeemable preferred units are not included in the diluted EPU calculation. The Partnership’s restricted performance unit awards are contingently issuable units that are considered in the calculation of diluted EPU. The Partnership assesses the number of units that would be issuable, if any, under the terms of the arrangement if the end of the reporting period were the end of the contingency period. As of December 31, 2015, there were no units related to the Partnership’s restricted performance unit awards included in the calculation of diluted EPU as the inclusion of these units would be antidilutive.
F-23
BLACK STONE MINERALS, L.P. AND SUBSIDIARIES
NOTES TO CONSOLIDATED FINANCIAL STATEMENTS
The following table sets forth the computation of basic and diluted earnings per unit:
|
|
|
For the Year Ended December 31, |
|
|||||||||
|
|
|
2015 |
|
|
2014 |
|
|
2013 |
|
|||
|
|
|
(In thousands, except per unit amounts) |
|
|||||||||
|
Net income (loss) |
|
$ |
(101,305 |
) |
|
$ |
169,187 |
|
|
$ |
168,963 |
|
|
Net income attributable to Predecessor |
|
|
(450 |
) |
|
|
(169,187 |
) |
|
|
(168,963 |
) |
|
Net loss attributable to noncontrolling interests subsequent to initial public offering |
|
|
1,260 |
|
|
|
— |
|
|
|
— |
|
|
Distributions on redeemable preferred units subsequent to initial public offering |
|
|
(7,522 |
) |
|
|
— |
|
|
|
— |
|
|
Net loss attributable to the general partner and common and subordinated units subsequent to initial public offering |
|
$ |
(108,017 |
) |
|
$ |
— |
|
|
$ |
— |
|
|
Allocation of net loss subsequent to initial public offering attributable to: |
|
|
|
|
|
|
|
|
|
|
|
|
|
General partner interest |
|
$ |
— |
|
|
|
|
|
|
|
|
|
|
Common units |
|
|
(54,326 |
) |
|
|
|
|
|
|
|
|
|
Subordinated units |
|
|
(53,691 |
) |
|
|
|
|
|
|
|
|
|
|
|
$ |
(108,017 |
) |
|
|
|
|
|
|
|
|
|
Net loss attributable to common and subordinated units per unit: |
|
|
|
|
|
|
|
|
|
|
|
|
|
Per common unit (basic and diluted) |
|
$ |
(0.56 |
) |
|
|
|
|
|
|
|
|
|
Weighted average common units outstanding (basic and diluted) |
|
|
96,182 |
|
|
|
|
|
|
|
|
|
|
Per subordinated unit (basic and diluted) |
|
$ |
(0.56 |
) |
|
|
|
|
|
|
|
|
|
Weighted average subordinated units outstanding (basic and diluted) |
|
|
95,057 |
|
|
|
|
|
|
|
|
|
NOTE 16—SUBSEQUENT EVENTS
On January 8, 2016, the Partnership acquired mineral and royalty interests in the Permian Basin for $10.0 million.
On February 9, 2016, the Board approved a distribution for the period October 1, 2015 to December 31, 2015 of $0.2625 per common unit and $0.18375 per subordinated unit. Distributions were paid on February 26, 2016 to unitholders of record at the close of business on February 19, 2016.
On February 19, 2016, the Board granted 717,654 restricted common units and 717,654 restricted performance units at a grant-date fair value of $11.25 per unit under the 2015 LTIP.
On March 4, 2016, the Board authorized the repurchase of up to $50.0 million in common units over the next six months.
F-24
BLACK STONE MINERALS, L.P. AND SUBSIDIARIES
SUPPLEMENTAL OIL AND NATURAL GAS DISCLOSURES—UNAUDITED
All of the Partnership’s proved reserves are located within the continental U.S., with the majority concentrated in Kentucky, Louisiana, North Dakota, Oklahoma, Pennsylvania, Texas, West Virginia, and Wyoming. However, the Partnership also owns mineral and royalty interests and non-operated working interests in various producing and non-producing oil and natural gas properties in several other areas throughout the United States. Therefore, the following disclosures about the Partnership’s costs incurred and proved reserves are presented on a consolidated basis.
Costs Incurred in Oil and Natural Gas Property Acquisitions, Exploration, and Development Activities
Costs incurred in oil and natural gas property acquisition, exploration and development, whether capitalized or expensed, are presented below:
|
|
Year Ended December 31, |
|
|||||||||
|
|
2015 |
|
|
2014 |
|
|
2013 |
|
|||
|
|
(In thousands) |
|
|||||||||
|
Acquisition Costs of Properties:1 |
|
|
|
|
|
|
|
|
|
|
|
|
Proved |
$ |
2,302 |
|
|
$ |
13,215 |
|
|
$ |
77,580 |
|
|
Unproved |
|
60,994 |
|
|
|
35,706 |
|
|
|
264,710 |
|
|
Exploration Costs |
|
2,592 |
|
|
|
631 |
|
|
|
174 |
|
|
Development Costs |
|
60,056 |
|
|
|
50,595 |
|
|
|
50,440 |
|
|
Total |
$ |
125,944 |
|
|
$ |
100,147 |
|
|
$ |
392,904 |
|
|
1 |
See Note 4 – Acquisitions for further discussion. Unproved properties also include purchases of leasehold prospects. |
Property acquisition costs include costs incurred to purchase, lease, or otherwise acquire a property. Development costs include costs incurred to gain access to and prepare development well locations for drilling, to drill and equip development wells, and to provide facilities to extract, treat, and gather natural gas. Refer below for total capitalized costs and associated accumulated DD&A and impairment.
Oil and Natural Gas Capitalized Costs
Aggregate capitalized costs related to oil and natural gas production activities with applicable accumulated depreciation, depletion, and amortization, including impairments, are presented below:
|
|
As of December 31, |
|
|||||
|
|
2015 |
|
|
2014 |
|
||
|
|
(In thousands) |
|
|||||
|
Proved properties |
$ |
1,957,648 |
|
|
$ |
1,753,167 |
|
|
Unproved properties |
|
524,563 |
|
|
|
626,376 |
|
|
Total |
|
2,482,211 |
|
|
|
2,379,543 |
|
|
Accumulated depreciation, depletion, amortization, and impairment |
|
(1,543,796 |
) |
|
|
(1,191,861 |
) |
|
Oil and natural gas properties, net |
$ |
938,415 |
|
|
$ |
1,187,682 |
|
F-25
BLACK STONE MINERALS, L.P. AND SUBSIDIARIES
SUPPLEMENTAL OIL AND NATURAL GAS DISCLOSURES—UNAUDITED
Oil and Natural Gas Reserve Information—Unaudited
The following table sets forth estimated net quantities of the Partnership’s proved, proved developed, and proved undeveloped oil and natural gas reserves. These reserve estimates exclude insignificant natural gas liquid quantities owned by the Partnership. Estimated reserves for the periods presented are based on the unweighted average of first-day-of-the-month commodity prices over the period January through December for the year in accordance with definitions and guidelines set forth by the SEC and the FASB.
|
|
Crude Oil (MBbl) |
|
|
Natural Gas (MMcf) |
|
|
Total (MBoe) |
|
|||
|
Net proved reserves at December 31, 2012 |
|
14,811 |
|
|
|
273,800 |
|
|
|
60,444 |
|
|
Revisions of previous estimates1 |
|
1,616 |
|
|
|
(16,760 |
) |
|
|
(1,177 |
) |
|
Purchases of minerals in place2 |
|
883 |
|
|
|
5,472 |
|
|
|
1,795 |
|
|
Extensions, discoveries and other additions3 |
|
4,265 |
|
|
|
22,848 |
|
|
|
8,073 |
|
|
Production |
|
(2,626 |
) |
|
|
(45,400 |
) |
|
|
(10,193 |
) |
|
Net proved reserves at December 31, 2013 |
|
18,949 |
|
|
|
239,960 |
|
|
|
58,942 |
|
|
Revisions of previous estimates1 |
|
(1,904 |
) |
|
|
(20,764 |
) |
|
|
(5,365 |
) |
|
Purchases of minerals in place4 |
|
89 |
|
|
|
7,439 |
|
|
|
1,329 |
|
|
Extensions, discoveries and other additions5 |
|
2,938 |
|
|
|
19,894 |
|
|
|
6,254 |
|
|
Production |
|
(3,005 |
) |
|
|
(42,273 |
) |
|
|
(10,051 |
) |
|
Net proved reserves at December 31, 2014 |
|
17,067 |
|
|
|
204,256 |
|
|
|
51,109 |
|
|
Revisions of previous estimates1 |
|
(197 |
) |
|
|
(17,043 |
) |
|
|
(3,037 |
) |
|
Purchases of minerals in place6 |
|
8 |
|
|
|
367 |
|
|
|
69 |
|
|
Extensions, discoveries and other additions7 |
|
2,529 |
|
|
|
57,484 |
|
|
|
12,110 |
|
|
Production |
|
(3,565 |
) |
|
|
(41,389 |
) |
|
|
(10,463 |
) |
|
Net proved reserves at December 31, 2015 |
|
15,842 |
|
|
|
203,675 |
|
|
|
49,788 |
|
|
Net Proved Developed Reserves8 |
|
|
|
|
|
|
|
|
|
|
|
|
December 31, 2013 |
|
17,290 |
|
|
|
232,777 |
|
|
|
56,086 |
|
|
December 31, 2014 |
|
16,700 |
|
|
|
202,888 |
|
|
|
50,514 |
|
|
December 31, 2015 |
|
15,497 |
|
|
|
174,555 |
|
|
|
44,590 |
|
|
Net Proved Undeveloped Reserves9 |
|
|
|
|
|
|
|
|
|
|
|
|
December 31, 2013 |
|
1,659 |
|
|
|
7,183 |
|
|
|
2,856 |
|
|
December 31, 2014 |
|
367 |
|
|
|
1,368 |
|
|
|
595 |
|
|
December 31, 2015 |
|
345 |
|
|
|
29,120 |
|
|
|
5,198 |
|
|
1 |
Revisions of previous estimates include technical revisions due to changes in commodity prices, historical and projected performance and other factors. The most notable technical revisions are related to well performance in certain Haynesville/Bossier wells. |
|
2 |
Includes the acquisition of mineral interests primarily in the Haynesville/Bossier plays as part of the Predecessor Exchange Offer and additional mineral acreage located in the Eagle Ford Shale in Texas. Additionally, this line includes adjustments to reserves related to the pro rata distribution of assets to unrelated third-party investors who chose to take their interests in-kind rather than participate in the Predecessor Exchange Offer. |
|
3 |
Includes discoveries and additions primarily related to active drilling in the Haynesville/Bossier, Bakken/Three Forks, Wilcox, Granite Wash, and Fayetteville plays. |
|
4 |
Includes the acquisition of mineral-and-royalty reserves primarily located throughout Texas, including in the Eagle Ford Shale and Wolfcamp plays and working interest reserves, the substantial majority of which is located in the Haynesville/Bossier play in San Augustine County, Texas. |
|
5 |
Includes discoveries and additions primarily related to active drilling in the Haynesville/Bossier, Bakken/Three Forks, Eagle Ford Shale, Wilcox, Granite Wash, and Fayetteville plays. |
|
6 |
Includes the acquisition of mineral-and-royalty reserves primarily in the Marcellus and Wolfcamp plays. |
|
7 |
Includes discoveries and additions primarily related to active drilling in the Haynesville/Bossier, Bakken/Three Forks, Wilcox, Eagle Ford, and Fayetteville plays. |
|
8 |
Proved developed reserves of 84 MBoe, 87 MBoe, and 119 MBoe as of December 31, 2015, 2014, and 2013, respectively, were attributable to noncontrolling interests in the Partnership’s consolidated subsidiaries. |
|
9 |
As of December 31, 2015, 2014, and 2013, no proved undeveloped reserves were attributable to noncontrolling interests. |
F-26
BLACK STONE MINERALS, L.P. AND SUBSIDIARIES
SUPPLEMENTAL OIL AND NATURAL GAS DISCLOSURES—UNAUDITED
Standardized Measure of Discounted Future Net Cash Flows—Unaudited
Future cash inflows represent expected revenues from production of period-end quantities of proved reserves based on the 12-month unweighted average of first-day-of-the-month commodity prices for the periods presented. All prices are adjusted by field for quality, transportation fees, energy content and regional price differentials. Future cash inflows are computed by applying applicable prices relating to the Partnership’s proved reserves to the year-end quantities of those reserves. Future production, development, site restoration and abandonment costs are derived based on current costs assuming continuation of existing economic conditions. There are no future income tax expenses deducted from future production revenues in the calculation of the standardized measure because the Partnership is not subject to federal income taxes. The Partnership is subject to certain state based taxes; however, these amounts are not material. See Note 2 – Summary of Significant Accounting Policies for further discussion.
|
|
Year Ended December 31, |
|
|||||||||
|
|
2015 |
|
|
2014 |
|
|
2013 |
|
|||
|
|
(In thousands) |
|
|||||||||
|
Future cash inflows |
$ |
1,211,290 |
|
|
$ |
2,493,294 |
|
|
$ |
2,693,511 |
|
|
Future production costs |
|
(205,861 |
) |
|
|
(405,833 |
) |
|
|
(393,347 |
) |
|
Future development costs |
|
(84,746 |
) |
|
|
(64,968 |
) |
|
|
(53,160 |
) |
|
Future net cash flows (undiscounted) |
|
920,683 |
|
|
|
2,022,493 |
|
|
|
2,247,004 |
|
|
Annual discount 10% for estimated timing |
|
(365,711 |
) |
|
|
(879,399 |
) |
|
|
(1,061,747 |
) |
|
Total1 |
$ |
554,972 |
|
|
$ |
1,143,094 |
|
|
$ |
1,185,257 |
|
|
1 |
Includes standardized measure of discounted future net cash flows of approximately $0.7 million for December 31, 2015 and $1.4 million for both December 31, 2014 and 2013, attributable to noncontrolling interests in the Partnership’s consolidated subsidiaries. |
The following summarizes the principal sources of change in the standardized measure of discounted future net cash flows:
|
|
Year Ended December 31, |
|
|||||||||
|
|
2015 |
|
|
2014 |
|
|
2013 |
|
|||
|
|
(In thousands) |
|
|||||||||
|
Standardized measure, beginning of year |
$ |
1,143,094 |
|
|
$ |
1,185,257 |
|
|
$ |
928,518 |
|
|
Sales, net of production costs |
|
(222,206 |
) |
|
|
(391,983 |
) |
|
|
(373,655 |
) |
|
Net changes in prices and production costs related to future production |
|
(621,065 |
) |
|
|
75,284 |
|
|
|
208,291 |
|
|
Extensions, discoveries and improved recovery, net of future production and development costs |
|
165,020 |
|
|
|
209,651 |
|
|
|
223,482 |
|
|
Previously estimated development costs incurred during the period |
|
7,084 |
|
|
|
12,162 |
|
|
|
22,456 |
|
|
Revisions of estimated future development costs |
|
669 |
|
|
|
7,854 |
|
|
|
1,620 |
|
|
Revisions of previous quantity estimates, net of related costs |
|
(67,911 |
) |
|
|
(110,431 |
) |
|
|
(22,687 |
) |
|
Accretion of discount |
|
114,309 |
|
|
|
118,526 |
|
|
|
92,852 |
|
|
Purchases of reserves in place, less related costs |
|
584 |
|
|
|
24,210 |
|
|
|
62,887 |
|
|
Other |
|
35,394 |
|
|
|
12,564 |
|
|
|
41,493 |
|
|
Standardized measure, end of year |
$ |
554,972 |
|
|
$ |
1,143,094 |
|
|
$ |
1,185,257 |
|
The data presented should not be viewed as representing the expected cash flow from, or current value of, existing proved reserves since the computations are based on a significant amount of estimates and assumptions. The required projection of production and related expenditures over time requires further estimates with respect to pipeline availability, rates of demand and governmental control. Actual future prices and costs are likely to be substantially different from historical prices and costs utilized in the computation of reported amounts. Any analysis or evaluation of the reported amounts should give specific recognition to the computational methods utilized and the limitations inherent therein.
F-27
BLACK STONE MINERALS, L.P. AND SUBSIDIARIES
SELECTED QUARTERLY FINANCIAL INFORMATION—UNAUDITED
Selected Quarterly Financial Information—Unaudited
Quarterly financial data was as follows for the periods indicated.
|
|
|
First Quarter |
|
|
Second Quarter |
|
|
Third Quarter |
|
|
Fourth Quarter |
|
||||
|
|
|
(In thousands, except for per unit data) |
|
|||||||||||||
|
2015 |
|
|
|
|
|
|
|
|
|
|
|
|
|
|
|
|
|
Total revenue |
|
$ |
91,061 |
|
|
$ |
64,803 |
|
|
$ |
137,020 |
|
|
$ |
100,040 |
|
|
Net income (loss) |
|
|
17,299 |
|
|
|
(122,766 |
) |
|
|
53,892 |
|
|
|
(49,730 |
) |
|
Net income (loss) attributable to the general partner and common and subordinated units subsequent to initial public offering |
|
* |
|
|
|
(107,587 |
) |
|
|
50,916 |
|
|
|
(51,346 |
) |
|
|
Net income (loss) attributable to common and subordinated units per unit (basic)1 |
|
|
|
|
|
|
|
|
|
|
|
|
|
|
|
|
|
Per common unit (basic) |
|
* |
|
|
|
(0.56 |
) |
|
|
0.27 |
|
|
|
(0.27 |
) |
|
|
Per subordinated unit (basic) |
|
* |
|
|
|
(0.56 |
) |
|
|
0.27 |
|
|
|
(0.27 |
) |
|
|
Net income (loss) attributable to common and subordinated units per unit (diluted)1 |
|
|
|
|
|
|
|
|
|
|
|
|
|
|
|
|
|
Per common unit (diluted) |
|
* |
|
|
|
(0.56 |
) |
|
|
0.27 |
|
|
|
(0.27 |
) |
|
|
Per subordinated unit (diluted) |
|
* |
|
|
|
(0.56 |
) |
|
|
0.27 |
|
|
|
(0.27 |
) |
|
|
Cash distributions declared and paid per limited partner unit |
|
|
|
|
|
|
|
|
|
|
|
|
|
|
|
|
|
Per common unit |
|
* |
|
|
* |
|
|
|
0.1615 |
|
|
|
0.2625 |
|
||
|
Per subordinated unit |
|
* |
|
|
* |
|
|
|
0.1615 |
|
|
|
0.2625 |
|
||
|
Total assets |
|
|
1,274,291 |
|
|
|
1,118,569 |
|
|
|
1,161,446 |
|
|
|
1,061,436 |
|
|
Long-term debt |
|
|
389,000 |
|
|
|
6,000 |
|
|
|
43,000 |
|
|
|
66,000 |
|
|
Total mezzanine equity |
|
|
120,889 |
|
|
|
120,904 |
|
|
|
120,936 |
|
|
|
79,162 |
|
|
2014 |
|
|
|
|
|
|
|
|
|
|
|
|
|
|
|
|
|
Total revenue |
|
$ |
127,412 |
|
|
$ |
118,937 |
|
|
$ |
132,795 |
|
|
$ |
169,177 |
|
|
Net income (loss) |
|
|
69,884 |
|
|
|
62,111 |
|
|
|
57,905 |
|
|
|
(20,713 |
) |
|
Net income (loss) attributable to the general partner and common and subordinated units subsequent to initial public offering |
|
* |
|
|
* |
|
|
* |
|
|
* |
|
||||
|
Net income (loss) attributable to common and subordinated units per unit (basic)1 |
|
|
|
|
|
|
|
|
|
|
|
|
|
|
|
|
|
Per common unit (basic) |
|
* |
|
|
* |
|
|
* |
|
|
* |
|
||||
|
Per subordinated unit (basic) |
|
* |
|
|
* |
|
|
* |
|
|
* |
|
||||
|
Net income (loss) attributable to common and subordinated units per unit (diluted)1 |
|
|
|
|
|
|
|
|
|
|
|
|
|
|
|
|
|
Per common unit (diluted) |
|
* |
|
|
* |
|
|
* |
|
|
* |
|
||||
|
Per subordinated unit (diluted) |
|
* |
|
|
* |
|
|
* |
|
|
* |
|
||||
|
Cash distributions declared per limited partner unit |
|
|
|
|
|
|
|
|
|
|
|
|
|
|
|
|
|
Per common unit |
|
* |
|
|
* |
|
|
* |
|
|
* |
|
||||
|
Per subordinated unit |
|
* |
|
|
* |
|
|
* |
|
|
* |
|
||||
|
Total assets |
|
|
1,468,856 |
|
|
|
1,466,769 |
|
|
|
1,444,467 |
|
|
|
1,326,782 |
|
|
Long-term debt |
|
|
462,500 |
|
|
|
453,000 |
|
|
|
430,000 |
|
|
|
394,000 |
|
|
Total mezzanine equity |
|
|
161,306 |
|
|
|
161,122 |
|
|
|
161,165 |
|
|
|
161,165 |
|
|
* |
Information is not applicable for the periods prior to the initial public offering. |
|
1 |
See Note 15 – Earnings Per Unit in the consolidated financial statements. |
F-28