Attached files
| file | filename |
|---|---|
| EX-31.2 - EX-31.2 - Arcadia Biosciences, Inc. | rkda-ex312_103.htm |
| EX-32.2 - EX-32.2 - Arcadia Biosciences, Inc. | rkda-ex322_105.htm |
| EX-31.1 - EX-31.1 - Arcadia Biosciences, Inc. | rkda-ex311_102.htm |
| EX-32.1 - EX-32.1 - Arcadia Biosciences, Inc. | rkda-ex321_104.htm |
UNITED STATES
SECURITIES AND EXCHANGE COMMISSION
Washington, D.C. 20549
FORM 10-K
(Mark One)
|
x |
ANNUAL REPORT PURSUANT TO SECTION 13 OR 15(d) OF THE SECURITIES EXCHANGE ACT OF 1934 |
For the fiscal year ended December 31, 2015
OR
|
o |
TRANSITION REPORT PURSUANT TO SECTION 13 OR 15(d) OF THE SECURITIES EXCHANGE ACT OF 1934 FOR THE TRANSITION PERIOD FROM TO |
Commission File Number 001-37383
Arcadia Biosciences, Inc.
(Exact name of Registrant as specified in its Charter)
|
Delaware |
81-0571538 |
|
(State or other jurisdiction of |
(I.R.S. Employer |
|
|
|
|
202 Cousteau Place, Suite 105 Davis, CA |
95618 |
|
(Address of principal executive offices) |
(Zip Code) |
(530) 756-7077
(Registrant’s Telephone Number, Including Area Code)
Securities registered pursuant to Section 12(b) of the Act:
|
Title of each class |
|
Name of each exchange on which registered |
|
Common Stock, par value $0.001 per share |
|
The NASDAQ Global Market |
Securities registered pursuant to Section 12(g) of the Act: None
Indicate by check mark if the Registrant is a well-known seasoned issuer, as defined in Rule 405 of the Securities Act. YES o NO x
Indicate by check mark if the Registrant is not required to file reports pursuant to Section 13 or 15(d) of the Act. YES o NO x
Indicate by check mark whether the Registrant: (1) has filed all reports required to be filed by Section 13 or 15(d) of the Securities Exchange Act of 1934 during the preceding 12 months (or for such shorter period that the Registrant was required to file such reports), and (2) has been subject to such filing requirements for the past 90 days. YES x NO o
Indicate by check mark whether the Registrant has submitted electronically and posted on its corporate Web site, if any, every Interactive Data File required to be submitted and posted pursuant to Rule 405 of Regulation S-T (§232.405 of this chapter) during the preceding 12 months (or for such shorter period that the Registrant was required to submit and post such files). YES x NO o
Indicate by check mark if disclosure of delinquent filers pursuant to Item 405 of Regulation S-K (§229.405) is not contained herein, and will not be contained, to the best of Registrant’s knowledge, in definitive proxy or information statements incorporated by reference in Part III of this Form 10-K or any amendment to this Form 10-K. o
Indicate by check mark whether the Registrant is a large accelerated filer, an accelerated filer, a non-accelerated filer, or a smaller reporting company. See the definition of “large accelerated filer”, “accelerated filer”, and “smaller reporting company” in Rule 12b-2 of the Exchange Act. (Check one):
|
Large accelerated filer |
|
o |
|
Accelerated filer |
|
o |
|
|
|
|
|
|||
|
Non-accelerated filer |
|
o (Do not check if a smaller reporting company) |
|
Smaller reporting company |
|
x |
Indicate by check mark whether the Registrant is a shell company (as defined in Rule 12b-2 of the Exchange Act). YES o NO x
The aggregate market value of the voting and non-voting common equity held by non-affiliates of the Registrant as of June 30, 2015, the last business day of the Registrant’s most recently completed second fiscal quarter, was approximately $41,500,000 (based on the closing price of $6.37 on June 30, 2015 on the NASDAQ Global Market).
The number of shares outstanding of the Registrant's common stock on March 1, 2016, was 44,220,620 shares.
DOCUMENTS INCORPORATED BY REFERENCE
Information required by Part III of this Annual Report on Form 10-K is incorporated by reference to the Registrant's Definitive Proxy Statement for its 2016 Annual Meeting of Stockholders, which proxy statement will be filed with the Securities and Exchange Commission within 120 days after the end of the fiscal year covered by this Form 10-K.
“Arcadia,” “the Company,” “we,” “our” and “us” are used interchangeably to refer to Arcadia Biosciences, Inc. or to Arcadia Biosciences, Inc. and its subsidiary, as appropriate to the context.
SPECIAL NOTE REGARDING FORWARD-LOOKING STATEMENTS
This Annual Report on Form 10-K contains forward-looking statements within the meaning of the federal securities laws, which statements involve substantial risks and uncertainties. Forward-looking statements generally relate to future events, our future financial or operating performance, growth strategies, anticipated trends in our industry, and our potential opportunities, plans, and objectives. In some cases, you can identify forward-looking statements because they contain words such as "may," "will," "should," "expects," "plans," "anticipates," "could," "intends," "target," "projects," "contemplates," "believes," "estimates," "predicts," "potential," or "continue" or the negative of these words or other similar terms or expressions that concern our expectations, strategy, plans, or intentions. Forward-looking statements contained in this Annual Report on Form 10-K include, but are not limited to, statements about:
|
|
· |
our or our collaborators' ability to develop commercial products that incorporate our traits and complete the regulatory process for such products; |
|
|
· |
our ability to earn revenues from the sale of products that incorporate our traits; |
|
|
· |
our ability to maintain our strategic collaborations and joint ventures and enter into new arrangements; |
|
|
· |
estimated commercial value for traits; |
|
|
· |
market conditions for products, including competitive factors and the supply and pricing of competing products; |
|
|
· |
compliance with laws and regulations that impact our business, and changes to such laws and regulations; |
|
|
· |
our ability to license patent rights from third parties for development as potential traits; |
|
|
· |
our ability to maintain, protect, and enhance our intellectual property; |
|
|
· |
our future capital requirements and our ability to satisfy our capital needs; |
|
|
· |
industry conditions and market conditions; |
|
|
· |
the preceding and other factors discussed in Part I, Item 1A, “Risk Factors,” and other reports we may file with the Securities and Exchange Commission from time to time; and |
|
|
· |
the factors set forth in Part II, Item 7, “Management’s Discussion and Analysis of Financial Condition and Results of Operations.” |
We caution you that the foregoing list may not contain all of the forward-looking statements made in this Annual Report on Form 10-K.
You should not rely upon forward-looking statements as predictions of future events. We have based the forward-looking statements contained in this Annual Report on Form 10-K primarily on our current expectations and projections about future events and trends that we believe may affect our business, financial condition, results of operations and prospects. The outcome of the events described in these forward-looking statements is subject to risks, uncertainties and other factors described in the section titled "Risk Factors" and elsewhere in this Annual Report on Form 10-K. Moreover, we operate in a very competitive and rapidly changing environment. New risks and uncertainties emerge from time to time and it is not possible for us to predict all risks and uncertainties that could have an impact on the forward-looking statements contained in this Annual Report on Form 10-K. We cannot assure you that the results, events and circumstances reflected in the forward-looking statements will be achieved or occur, and actual results, events or circumstances could differ materially from those described in the forward-looking statements.
The forward-looking statements made in this Annual Report on Form 10-K relate only to events as of the date on which the statements are made. We undertake no obligation to update any forward-looking statements to reflect events or circumstances or to reflect new information or the occurrence of unanticipated events, except as required by law.
TABLE OF CONTENTS FOR FORM 10-K
|
|
|
Page |
|
|
|
|
|
Item 1. |
2 |
|
|
Item 1A. |
28 |
|
|
Item 1B. |
50 |
|
|
Item 2. |
50 |
|
|
Item 3. |
50 |
|
|
Item 4. |
50 |
|
|
|
|
|
|
|
|
|
|
Item 5. |
51 |
|
|
Item 6. |
52 |
|
|
Item 7. |
Management’s Discussion and Analysis of Financial Condition and Results of Operations |
54 |
|
Item 7A. |
70 |
|
|
Item 8. |
71 |
|
|
Item 9. |
Changes in and Disagreements With Accountants on Accounting and Financial Disclosure |
101 |
|
Item 9A. |
101 |
|
|
Item 9B. |
101 |
|
|
|
|
|
|
|
|
|
|
Item 10. |
101 |
|
|
Item 11. |
102 |
|
|
Item 12. |
Security Ownership of Certain Beneficial Owners and Management and Related Stockholder Matters |
102 |
|
Item 13. |
Certain Relationships and Related Transactions, and Director Independence |
102 |
|
Item 14. |
102 |
|
|
|
|
|
|
|
|
|
|
Item 15. |
103 |
i
Overview
We are a leading agricultural biotechnology trait company with an extensive and diversified portfolio of late-stage yield and product quality traits addressing multiple crops that supply the global food and feed markets. Our traits are focused on high-value enhancements that increase crop yields by enabling plants to more efficiently manage environmental and nutrient stresses, and that enhance the quality and value of agricultural products. Our traits increase value not only for farmers, but also for users of agricultural products throughout the supply chain. We have a robust pipeline of products in development incorporating our traits, including products that are in advanced stages of development or on the market.
Our crop yield traits are being utilized by our commercial partners to develop higher yielding seeds for the most widely grown global crops, including wheat, rice, soybean, corn, and sugarcane, as well as for other crops such as cotton, turf, and trees. Our business model positions us at the nexus of basic research and commercial product development, as we apply our strong product development and regulatory capabilities to collaborate with, and leverage the skills and investments of, upstream basic research institutions and downstream commercial partners. We believe our approach significantly reduces risk and capital requirements, while simplifying and expediting the product development process. We also believe that our collaboration strategy leverages our internal capabilities, enabling us to capture much higher value than would otherwise be the case, and enabling our commercial partners to develop and commercialize products more cost-effectively.
In recent decades, agricultural biotechnology has been a major driving force for improving farm economics by introducing genetically modified, or GM, seeds, with traits that reduce the cost of managing crop biotic stresses such as weeds, insects, and microbial pests. The first agricultural biotechnology traits, herbicide tolerance and insect resistance, were developed primarily by companies with deep expertise and a long heritage in crop protection chemistry and pest management. Seeds with these traits have achieved rapid growth and strong commercial success, reaching market share in excess of 90% in key crops and countries as of 2013.
We believe the next generation of advancements in agricultural biotechnology involves increasing yields by making crops which perform significantly better under a wide range of abiotic stresses, including drought, heat, salinity, and variable availability of key nutrients such as nitrogen. Our target market is the $40.5 billion global seed market. Our goal is to increase the value of this market significantly by increasing yields in the more than $1.0 trillion market for the five largest global crops, and to capture a portion of the increased value.
Our business model focuses on creating value by leveraging collaborator investments and capabilities upstream in basic research, and downstream in product development and commercialization. We bridge the gap between basic research and commercial development, reducing risk and adding value as a result. We reduce risk and avoid most of the costs associated with basic research by acquiring trait technologies that have already completed initial feasibility screening, thus achieving proof of concept, through basic research carried out elsewhere. We further develop these technologies by optimizing function and validating performance through intensive field trial testing in multiple crops. We then form collaborations with major seed and consumer product companies who develop and commercialize products incorporating our traits. In select instances, we also work with our commercial partners to make any regulatory filings required to support commercial launch of the trait in order to increase our share of the value created by the trait.
By licensing later stage de-risked technologies to our commercial partners, we expect to achieve significantly greater value than generally earned for access to early stage traits. Our license agreements typically include upfront and annual license fees, as well as multiple milestone payments for key product development stages such as demonstration of greenhouse efficacy, demonstration of field efficacy, regulatory submission, regulatory approval, and commercial launch. Following commercialization of a product utilizing one or more of our traits, we share in the value of the traits realized by our commercial partners. We believe that this broad and balanced approach diversifies and reduces risk, allowing us to address multiple end markets through strong established channels.
2
We use both GM and non-GM technologies to develop our traits, which enable us to select the approach most suited for the particular trait, crop and market. Our agricultural yield traits are designed to substantially increase crop yields and farmer income. They do so either by improving efficiency in the use of key inputs, such as fertilizer and water, or by increasing tolerance to environmental stresses, such as drought, heat and salinity. Our current portfolio of agricultural yield traits includes Nitrogen Use Efficiency, or NUE, Water Use Efficiency, or WUE, Drought Tolerance, Salinity Tolerance, Heat Tolerance, and Herbicide Tolerance. Field trial results have demonstrated significant yield improvements resulting from our agricultural yield traits in multiple crops and geographies. As one example, field trials in multiple environments conducted by an independent testing organization with our NUE trait in rice resulted in a consistent yield improvement that on average was 30% above the controls over a four-year period from 2012 to 2015. Rice is the world’s most valuable crop, with a harvest value of $316 billion in 2014, and the third most widely grown crop, according to the FAO. Our agricultural product quality traits increase the value of harvested products by improving specific compositional qualities of oilseeds and grains. These traits include Enhanced Nutrition Grains and High Value Nutritional Oils, including Sonova 400 GLA safflower oil and Sonova Ultra GLA safflower oil, which we refer to as our Sonova products.
We have formed strategic partnerships and developed strong relationships with global agricultural leaders for development and commercialization of our traits in major crops and consumer products. Our collaborators include Limagrain (Vilmorin & Cie), Mahyco (Maharashtra Hybrid Seeds Company Limited), Dow AgroSciences, DuPont Pioneer (E.I. du Pont de Nemours and Company), SES Vanderhave, Genective (a joint venture between Limagrain and KWS SAAT), Scotts, U.S. Sugar, Abbott, Ardent Mills, Bioceres, and others. Additionally, in order to increase our participation in the value of two major crops, wheat and soybean, we have formed two joint ventures. Limagrain Cereal Seeds LLC is our joint venture with Limagrain for the development and commercialization of wheat products for North America. Limagrain is the world’s fourth-largest seed company. Verdeca LLC is our joint venture with Bioceres for the development and deregulation of soybean traits globally. Bioceres is an agricultural investment and development company owned by approximately 250 shareholders, including some of South America’s largest soybean growers.
The strength of our internal capabilities and collaboration strategy enables us to quickly identify and develop valuable traits and bring them to market, as we have demonstrated through commercializing Sonova 400 GLA safflower oil in less than six years from technology acquisition to commercial launch. Sonova 400 GLA safflower oil is a key ingredient in multiple branded nutritional supplements marketed through GNC stores and other U.S. retailers.
Our Strengths
We believe we are strategically positioned to capitalize on the need to increase crop yields and quality of agricultural products globally. Our competitive strengths include:
|
|
· |
We hold a competitive position in an attractive and fast-growing industry. According to Phillips McDougall, during 2014 the overall value of the commercial seed market increased by 2.8% to reach an estimated $40.5 billion. Within this overall outcome, the global market for genetically modified seeds increased by 4.7% to $21 billon. The GM seed sector has shown year-on-year growth since its inception, and in 2014 represented 51.9% of the global seed market. We believe that addressing opportunities to increase yield in the much larger market for agricultural products will dramatically expand the size of the GM seed market, and that we are well-positioned to take advantage of this with our portfolio of late-stage, high-value traits, and our ability to reduce product development risk and leverage the capabilities of our licensees and partners. We believe the yield-enhancing benefits of our agricultural yield traits provide significant value to farmers, based on field trials to date. We carefully select our collaborators and partners and license our traits to leading seed and consumer product companies. This allows us to leverage their substantial development capabilities and market presence, creating a highly scalable and capital light platform. |
3
|
|
that our established relationships with multiple global agricultural and consumer product leaders, such as Limagrain, Mahyco, Dow AgroSciences, DuPont Pioneer, SES Vanderhave, Abbott, Ardent Mills, and others, improve our ability to monetize the benefits of our traits. Importantly, in most cases our technologies and traits are additive to, rather than competitive with, the efforts of our collaborators. As a result, we and our collaborators mutually benefit from a strong alignment of interests. Additionally, we have entered into a number of collaborations and joint ventures with regard to major crops, such as wheat, soybean and corn. Limagrain Cereal Seeds LLC is our joint venture with Limagrain for the development and commercialization of wheat products for North America. Verdeca LLC is our joint venture with Bioceres for the development and deregulation of soybean traits globally. In April 2015, we entered into a strategic collaboration with Dow AgroSciences and Bioceres under which our Verdeca joint venture will collaborate with Dow AgroSciences on the development and deregulation of soybean traits on a global basis. In December 2015, Arcadia announced a strategic collaboration with Dow AgroSciences to develop and commercialize traits in corn. |
|
|
· |
The development stage of our products substantially reduces the risk and time to market. We reduce risk and avoid most of the costs associated with basic research by acquiring trait technologies that have already achieved proof of concept and have started Phase 2 of development through basic research carried out elsewhere. We then optimize and validate trait performance through intensive field trials in multiple crops, and license the further de-risked traits to selected collaborators globally. The majority of the products being developed with our traits, including those based on NUE and WUE trait technologies, are in Phase 2, Phase 3, or later stages of development. The efficacy of these traits has been demonstrated through field testing over multiple years in a variety of major crops. According to the Monsanto 2011 Investor Toolkit, products in Phase 2 and Phase 3 of development have a 50% and 75% probability of reaching commercialization, respectively, and this metric is used commonly in the industry. Commercial launch of the first seed products containing our proprietary agricultural yield traits is expected within the next few years. |
|
|
· |
We have demonstrated independent product development and regulatory capabilities. Our execution risk is significantly reduced by our in-house scientific and product development expertise, which affords us substantial control over the product development process. Our regulatory expertise enables us to capture additional value in selected instances, and also to expedite the development of products containing our traits. For example, we independently developed and commercialized our first commercial product, Sonova 400 GLA safflower oil, in less than six years from technology acquisition. This is significantly less than the 13 years it takes, on average, to commercialize a seed using advanced breeding or biotechnology, according to Phillips McDougall. Our regulatory team’s expertise in bringing traits through the regulatory process quickly and cost-effectively is a key differentiating factor. For example, by working closely with federal and state regulatory authorities, we have designed and implemented robust protocols for conducting field trials in California with GM rice. To our knowledge, we are the only company currently permitted to conduct such trials. Coupled with strong in-house intellectual property law expertise, our technology development process has resulted in a portfolio of over 130 issued patents that are either owned or exclusively controlled by us. |
|
|
· |
We have a seasoned executive team with a diverse blend of technical and commercial experience. Our executive team has extensive experience specific to agricultural biotechnology, including management of research, regulatory matters, business development, product commercialization, finance and intellectual property. Several members of our executive team previously worked at Calgene and Monsanto, and all of our executive team members have worked together for more than ten years. Our executive team has a strong track record of acquiring and developing valuable trait technologies and forging sustainable partnerships. Our scientific advisory board brings substantial, relevant experience in the analysis, research and development, regulatory review, and commercialization of next generation seed traits. |
4
We believe that there are significant opportunities to grow our business globally by executing the following elements of our strategy:
|
|
· |
Accelerate and broaden the commercialization of our high-impact agricultural yield traits. One of our highest priorities is to accelerate and broaden the commercialization of our key agricultural yield traits, such as NUE, WUE, and Drought Tolerance, that are in advanced stages of development with our commercial partners and joint ventures. We intend to do this by working with our collaborators to expand the scope of development activities and execute against predetermined technical and regulatory milestones in our joint work plans. |
|
|
· |
Increase the value we capture in selected crops by managing and investing in the regulatory process. For certain crops, including wheat, soybean, cotton, and sugarbeets, we have the opportunity to invest incrementally in the management of regulatory activities. By doing so, we will increase our share of the trait value from a base range of 15 to 20% to a range of 37 to 50%, depending on the specific crop and trait. We believe that investment in the regulatory process is highly de-risked because it occurs after clear evidence of trait efficacy has been demonstrated and, as a result, will bring highly favorable economic returns. |
|
|
· |
Execute on a range of near-term opportunities in areas that we believe will be materially beneficial. In addition to developing agricultural yield traits for major global crops, we develop such traits for secondary crops, and also develop product quality traits. Our product quality trait programs, including specialty oils and improved grains, provide opportunities for near-term revenue growth. In particular, our programs for nutritional oils and resistant starch wheat are at advanced development stages and we intend to accelerate our efforts in these programs. |
|
|
· |
Continue to build our pipeline of next generation and innovative traits. We maintain strong relationships with leading basic research institutions and other industry participants, and will continue to partner with them to gain access to new traits and technologies with demonstrated efficacy. Our independence, broad technical product development, and regulatory expertise position us to collaborate effectively with parties throughout the value chain to reduce risk and leverage the resources. We have a strong track record of working effectively and transparently with third parties and are a sought-after partner for independent trait development and regulatory work. We believe that opportunities exist to expand such relationships in the future. |
|
|
· |
Continue to invest in our human resources and technology infrastructure on a global basis. Our highly-skilled and technical employees are critical to our success, and we will continue to invest in development and retention in order to build upon this strength. We will continue to invest in best-in-class technology and research and development capabilities that will enable us to continue advancing our position in the agricultural biotechnology marketplace. |
Our Products and Product Development Pipeline
We currently have a robust pipeline of products in development incorporating our traits, including products that are either in advanced stages of development or on the market. Our use of both GM and non-GM technologies to develop our traits enables us to select the approach most suited for the particular trait, crop, and market. Our agricultural yield traits are designed to substantially increase crop yields and farmer income. They do so either by improving efficiency in the use of key inputs, such as fertilizer and water, or by increasing tolerance to environmental stresses, such as drought, heat, and salinity. Our existing portfolio of agricultural yield traits includes NUE, WUE, Drought Tolerance, Salinity Tolerance, Heat Tolerance, and Herbicide Tolerance as further described below. Our traits are developed as individual offerings and as stacks that incorporate several different traits, and can be designed for use in a variety of crops and end markets.
5
The following table summarizes our current commercial product and our pipeline of products in development.
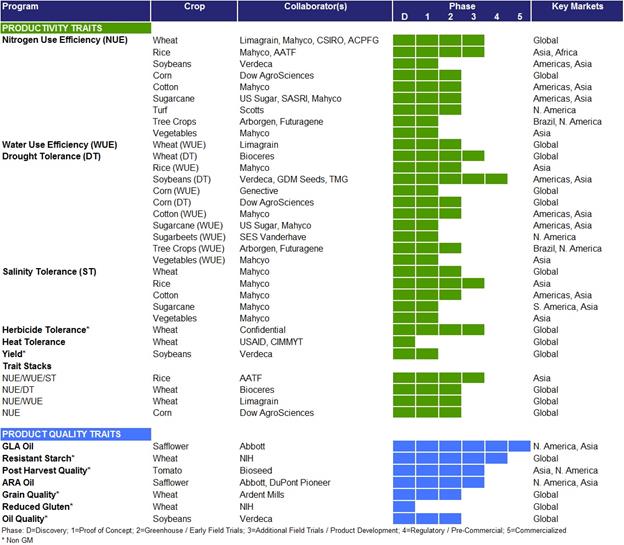
Program Crop Collaborator(s) Phase Key Markets D 1 2 3 4 5 PRODUCTIVITY TRAITS Nitrogen Use Efficiency (NUE) Wheat Limagrain, Mahyco, CSIRO, ACPFG Global Rice Mahyco, AATF Asia Soybeans Verdeca Americas, Asia Corn Dow AgroSciences Global Cotton Mahyco Americas, Asia Sugarcane US Sugar, SASRI, Mahyco Americas, Asia Turf Scotts N. America Tree Crops Arborgen, Futuragene Brazil, N. America Vegetables Mahyco Asia Water Use Efficiency (WUE) Drought Tolerance (DT) Wheat (WUE) Limagrain Global Wheat (DT) Bioceres Global Rice (WUE) Mahyco Asia Soybeans (DT) Verdeca Americas, Asia Corn (WUE) Genective Global Corn (DT) Dow AgroSciences Global Cotton (WUE) Mahyco Americas, Asia Sugarcane (WUE) US Sugar, Mahyco Americas, Asia Sugarbeets (WUE) SES Vanderhave N. America Tree Crops (WUE) Arborgen, Futuragene Brazil, N. America Vegetables (WUE) Mahcyo Asia Salinity Tolerance (ST) Wheat Mahyco Global Rice Mahyco Asia Cotton Mahyco Americas, Asia Africa Sugarcane Mahyco S. America, Asia Vegetables Mahyco Asia Herbicide Tolerance* Wheat Confidential Global Heat Tolerance Wheat USAID, CIMMYT Global Yield* Soybeans Verdeca Global Trait Stacks NUE/WUE/ST Rice AATF Asia NUE/DT Wheat Bioceres Global NUE/WUE Wheat Limagrain Global NUE Corn Dow AgroSciences Global PRODUCT QUALITY TRAITS GLA Oil Safflower Abbott N. America, Asia Resistant Starch* Wheat NIH Global Post Harvest Quality* Tomato Bioseed Asia, N. America ARA Oil Safflower Abbott, DuPont Pioneer N. America, Asia Grain Quality* Wheat Ardent Mills Global Reduced Gluten* Wheat NIH Global Oil Quality* Soybeans Verdeca Global Phase: D=Discovery; 1=Proof of Concept; 2=Greenhouse / Early Field Trials; 3=Additional Field Trials / Product Development; 4=Regulatory / Pre-Commercial; 5=Commercialized * Non GM GDM Seeds, TMG
Agricultural Yield Traits
Nitrogen Use Efficiency (NUE)
Our NUE technology enables plants to absorb and utilize nitrogen fertilizer much more efficiently than conventional plants. This allows crops to achieve significantly higher yields under normally applied levels of nitrogen fertilizer, or to achieve the same yields as conventional crops while using 30 to 50% less nitrogen fertilizer.
Nitrogen fertilizer is a primary plant nutrient and key driver of crop yield. Nitrogen fertilizer is a significant component of crop production cost and was a $104.6 billion product within the $183.3 billion market for all fertilizers in 2012, according to an industry-specific report by MarketLine. Research published in Plant Biotechnology Journal reported that only 30 to 50% of added nitrogen fertilizer is taken up by agricultural crops, with the remainder left unutilized and potentially becoming a significant environmental pollutant.
6
Our NUE technology platform was initially based on a trait discovered at the University of Alberta (Canada), and we hold an exclusive, global license to the technology for use in all crops, with unlimited sublicense rights. Efficacy of this NUE technology has been demonstrated in field-grown rice, wheat, and canola by multiple groups. NUE cotton lines will be field tested in the United States in 2016, and related NUE cotton lines are expected to be field tested in India in the near term.
Our research team has also been developing and evaluating a number of different and novel genetic traits to effect NUE in crop plants. Three of these candidate technologies have been introduced into wheat and were first planted in 2015. We expect to review the first yield data in the spring of 2016. These traits also have been engineered into rice, and these materials will be evaluated as well.
Most recently, we have collaborated with Dow AgroSciences on development of NUE in corn, which we announced in December 2015. Dow AgroSciences is currently evaluating this technology by means of multiple-location U.S. field efficacy tests in hybrid corn. We anticipate having those results collected and analyzed later this year.
Positive field test results for our Dow AgroSciences corn collaboration will help our research team determine whether to apply this NUE technology to additional crops like wheat and soybean. We plan to use a combination of our original and proven NUE technology platform with one or more of the new NUE traits in stacks that will help us maintain and extend our technical and commercial advantage for this important trait area.
The target crops and markets for NUE include all major agricultural crops and markets. Our NUE technology has now been incorporated, or is under development by our commercial partners, in major global crops, including rice, wheat, soybean, cotton, canola, sugarbeets, sugarcane, vegetables, turf grass, and multiple forestry species. Specific crops, collaborators, stages of development, and target markets for our NUE technology are shown in the following table.
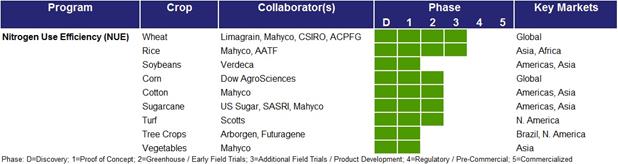
Program Crop Collaborator(s) Phase Key Markets D 1 2 3 4 5 Nitrogen Use Efficiency (NUE) Wheat Limagrain, Mahyco, CSIRO, ACPFG Global Rice Mahyco, AATF Asia Soybeans Verdeca Americas, Asia Corn Dow AgroSciences Global Cotton Mahyco Americas, Asia Sugarcane US Sugar, SASRI, Mahyco Americas, Asia Turf Scotts N. America Tree Crops Arborgen, Futuragene Brazil, N. America Vegetables Mahyco Asia Phase: D=Discovery; 1=Proof of Concept; 2=Greenhouse / Early Field Trials; 3=Additional Field Trials / Product Development; 4=Regulatory / Pre-Commercial; 5=Commercialized Africa
Field trial data to date in multiple major commodity crops has shown yield improvements attributable to our NUE trait of greater than 10%. For example, we and Limagrain have independently conducted field trials of NUE in wheat at multiple locations across multiple crop seasons, and the leading NUE wheat line has shown an average yield improvement relative to the control of 10%.
7
In another example, multiple research partners including the International Center for Tropical Agriculture, or CIAT, have conducted field trials of NUE in a major type of rice for four years (2012-2015) under both lowland (flood irrigated) and upland (rain irrigated) locations. Of the six NUE rice lines tested, two consistently showed significant yield benefits across all field trials and treatments. The leading line out-yielded the control by an average of 30% over four years for the two locations and for three rates of nitrogen fertilizer in the lowland location. The table below summarizes the average yield increase over four years, relative to the control, for the two lead lines, as reported by CIAT.
NUE Rice Field Trial Results 2012-2015 (increase in grain yield)
|
Production Environment |
|
Nitrogen Application Rate (% of normally applied N) |
|
|
NUE Rice vs. Control #1 (% yield increase) |
|
|
NUE Rice vs. Control #2 (% yield increase) |
|
|
NUE Rice Mean (% yield increase) |
|
||||
|
|
|
|
0% |
|
|
|
25% |
|
|
|
24% |
|
|
|
25% |
|
|
Lowland |
|
|
50% |
|
|
|
23% |
|
|
|
29% |
|
|
|
26% |
|
|
|
|
|
100% |
|
|
|
26% |
|
|
|
25% |
|
|
|
25% |
|
|
Upland |
|
|
50% |
|
|
|
32% |
|
|
|
32% |
|
|
|
32% |
|
|
|
|
|
17% |
|
|
|
47% |
|
|
|
39% |
|
|
|
43% |
|
|
|
|
Mean |
|
|
|
31% |
|
|
|
30% |
|
|
|
30% |
|
|
We have also created a methodology to quantify and document changes in greenhouse gas emissions resulting from changes in nitrogen use. This methodology, approved by the Intergovernmental Panel on Climate Change in 2012, is the first of its kind to link crop genetics with carbon emissions. We believe this may encourage the adoption of crops with NUE technology by enabling farmers to further increase revenue through the sale of carbon credits.
Water Use Efficiency (WUE)/Drought Tolerance
Our WUE trait technology enables plants to better tolerate two distinct types of stress: reduced or inconsistent water and severe drought. The WUE trait has been demonstrated to improve crop yield under conditions of episodic water stress and to help crops recover from severe drought conditions. A related but distinct technology, Drought Tolerance, helps plants maintain yields under conditions of prolonged water stress.
In 2012, the United Nations Educational, Scientific, and Cultural Organization, or UNESCO, reported that modern agriculture is highly water intensive, using approximately 70% of world water withdrawals. UNESCO also estimates that future global agricultural water consumption will increase by about 19% by 2050 and could be even higher if crop yields and the efficiency of agricultural production do not improve dramatically. The irregular availability of suitable water is one the leading causes of reduced crop yield globally. Loss due to drought in the United States, as reported to the USDA Risk Management Agency, averaged $4.7 billion from 2009 through 2013 and was $12.9 billion in 2012.
Water-limiting conditions can result from prolonged drought, leading to severe reductions in crop yields, or can result from periodic dry conditions, leading to reduced crop yields. Whenever water limitations occur, economic losses and impairment of the food supply result.
8
Our WUE trait technology was jointly discovered by researchers at the University of California, Davis and Technion—Israel Institute of Technology. We hold an exclusive, global license to the technology, with sublicense rights, for use in all crops. Target crop markets for WUE technology include most major crops, such as rice, wheat, corn, soybean, sugarcane, cotton, and canola. Target geographies are global, based on regions where water availability can limit productivity in the target crops. Our Drought Tolerance technology was discovered by researchers at National Scientific and Technical Research Council (Argentina), and further developed by Bioceres, S.A. We hold an exclusive license to this technology for use in wheat globally outside of South America. Verdeca, our joint venture with Bioceres, Inc., holds exclusive global rights and is developing and commercializing this technology in soybeans. Our WUE technology has now been incorporated, or is under development by our commercial partners, in major global and secondary crops, including those shown in the following table. Our Drought Tolerance technology is being applied in wheat, and soybeans with this technology are in the regulatory approval process in Argentina. Specific crops, collaborators, stages of development, and target markets for our WUE and Drought Tolerance technologies are shown in the following table.

Program Crop Collaborator(s) Phase Key Markets D 1 2 3 4 5 Water Use Efficiency (WUE) Drought Tolerance (DT) Wheat (WUE) Limagrain Global Wheat (DT) Bioceres Global Rice (WUE) Mahyco Asia Soybeans (DT) Verdeca Americas, Asia Corn (WUE) Genective Global Corn (DT) Dow AgroSciences Global Cotton (WUE) Mahyco Americas, Asia Sugarcane (WUE) US Sugar, Mahyco Americas, Asia Sugarbeets (WUE) SES Vanderhave N. America Tree Crops (WUE) Arborgen, Futuragene Brazil, N. America Vegetables Mahyco Asia Phase: D=Discovery; 1=Proof of Concept; 2=Greenhouse / Early Field Trials; 3=Additional Field Trials / Product Development; 4=Regulatory / Pre-Commercial; 5=Commercialized GDM Seeds, TMG
9
Greenhouse and field trials of our WUE traits have been completed in agronomic crops such as rice, cotton, peanuts and alfalfa. We are currently working with collaborators in additional crops, including wheat, sugarbeets, sugarcane, and multiple tree species. Recent collaborator results in rice show significant yield improvement under water-limited conditions. Our Drought Tolerance technology is most advanced in soybeans under our Verdeca joint venture. Multiple seasons of field trials under reduced yield conditions that represent the average yield of soybean production in North and South America have shown yield improvements relative to controls of up to 14%, with no decrease in yield under optimal conditions, as illustrated in the following chart. The Early Food Safety Evaluation process has been completed by the U.S. Food and Drug Administration, or FDA, for the plant protein responsible for our Drought Tolerance trait. The trait event has full approval for food safety and international commerce in Argentina from the National Advisory Commission on Agricultural Biotechnology and the Biotechnology Directorate of the Ministry of Agriculture, Livestock and Fisheries, in conjunction with the Servicio Nacional de Sanidad y Calidad Agoalimentaria and the Agricultural Market Directorate. Additionally, regulatory approval applications have been submitted in Uruguay and are pending final approval.
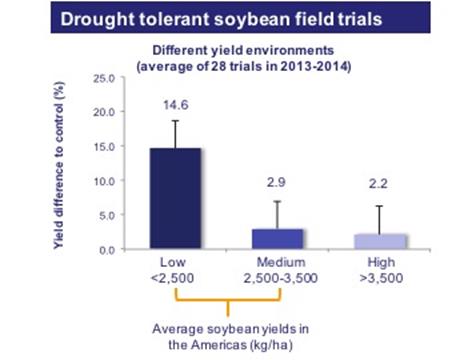
Drought Tolerant soybean field trialsDifferent yield environments (average of 28 trials in 2013-2014) Yield difference to control (%) 25.0 20.0 15.0 10.0 5.0 0.0 14.6 2.9 2.2 Low <2,500 Medium 2,500-3,500 High >3,500 Average soybean yields in the Americas (kg/ha)
Salinity Tolerance
Our Salinity Tolerance trait allows plants to produce increased yields under conditions of elevated salinity and is applicable to a wide range of crops, including wheat, rice, soybean, cotton, and vegetables. Our salt-tolerant plants have also been demonstrated to bind excess salt from the soil into the plant, potentially providing the benefit of rehabilitating salinized land over time.
The global cost of lost crop yield to salt-induced land degradation is estimated to be $27.3 billion according to the United Nations Natural Resources Forum. Of the current 230.0 million hectares of irrigated land, 45.0 million hectares, or about 20%, are salt-affected. Crops grown under salt-affected conditions may be inhibited in two ways. First, the presence of salt in the soil reduces the ability of the plant to take up water, leading to reductions in growth rate. Second, if excessive amounts of salt enter the plant, there can be injury to the cells, which may cause further reductions in growth. Modern agriculture is highly water intensive and the ability to manage crops in saline environments will reduce agricultural demand on critical fresh water supplies.
10
Our most advanced Salinity Tolerance trait technology is being developed based on basic research conducted at the University of Toronto, the University of California, Davis, and the National Institute of Agrobiological Sciences (Japan), all of which have granted us exclusive licenses for all crops. We are conducting early stage research on additional salinity tolerance genes under a funded research agreement with the United States Agency for International Development, or USAID.
Target markets for the Salinity Tolerance trait are those areas where water or soil salinity decrease crop yield. Such areas occur globally where irrigation is prevalent, where ground water supplies are salinized due to seawater intrusion, and where soils are salinized due to mineral deposits. Such areas are common in North America, India, China, additional countries in Asia, Australia, and other major crop production countries. Our Salinity Tolerance trait has been licensed to partners for use in rice, wheat, corn, cotton, canola, sugarcane, and vegetable crops. Specific crops, collaborators, stages of development, and target markets for our Salinity Tolerance technologies are shown in the following table.
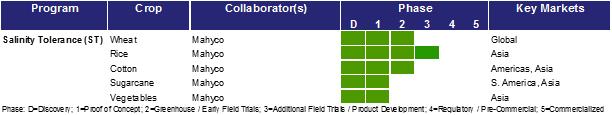
Program Crop Collaborator(s) Phase Key Markets D 1 2 3 4 5 Salinity Tolerance (ST) Wheat Mahyco Global Rice Mahyco Asia Cotton Mahyco Americas, Asia Sugarcane Mahyco S. America, Asia Vegetables Mahyco Asia Phase: D=Discovery; 1=Proof of Concept; 2=Greenhouse / Early Field Trials; 3=Additional Field Trials / Product Development; 4=Regulatory / Pre-Commercial; 5=Commercialized
Crops with tolerance to soil and water salinity are in different degrees of development with our primary licensee and partner for the Salinity Tolerance trait technology. Our partner previously had tested the most promising rice lines with our trait in a field in which controlled amounts of salt were applied to the replicated plots. In 2015, a field trial was executed on naturally high saline farmlands in India, where grain yields typically are very low, and we saw results similar to those in prior trials. Our partner has developed wheat lines that show significant salinity tolerance under greenhouse conditions, with some lines outperforming the controls by more than 30%, and additional wheat lines are in development to expand the scope of our partner’s first field evaluations. For salt tolerant cotton, our partner is preparing to conduct outdoor field trials in India, and we are making concurrent preparations in the United States with a U.S. cotton variety.
Heat Tolerance
Our Heat Tolerance technology program is carrying out discovery research funded by USAID in collaboration with the International Maize and Wheat Improvement Center, or CIMMYT, and the Indian National Bureau of Plant Genetic Resources, or NBPGR. Our work targets metabolic approaches to reduce the heat sensitivity of starch synthesis in wheat and increase membrane thermostability. We are pyramiding the CIMMYT-identified natural genetic diversity that affects membrane thermostability and induced genetic diversity in starch synthesis, developed by us, in order to improve wheat heat adaptation in a fundamental way.
Among major staple crops, global wheat yields may be the most impacted by climate change, according to a number of climate change models. And while wheat is the most drought-adapted of major crops, improving heat adaptation would make wheat a climate resilient staple. Developing countries are both significant producers and importers of wheat. According to CIMMYT, an estimated 1.2 billion poor people depend on wheat and 81% of wheat in the developing world is produced and consumed in the same country. At the same time, wheat accounts for 43% of food imports in developing countries, underscoring the importance of global wheat trade to food security. CIMMYT estimates that demand for wheat will increase by 60% by 2050 in developing countries. As we saw with the global food price crisis in 2008, poor yields in major wheat exporting countries such as Australia can have a significant impact on global prices.
11
Wheat has been shown to lose three to four percent of yield per degree Celsius above the optimum daytime temperature of 15 C. Since the 1980s, global wheat productivity is estimated to have been reduced by as much as five percent due to increasing temperature, and wheat yields in South Asia could decline about 50% by 2050. Recent research in India suggests that most crop models have underestimated the impact of extreme heat on yield losses by as much as 50%.
This technology is being developed in collaboration with CIMMYT and NBPGR, under funding provided by USAID and is currently in the discovery stage. The initial target crop for this technology is wheat, where the impacts from heat stress are among the most severe of all major crops. Target commercial geographies are global. It is expected that discoveries under this program are likely to lead to improvements in heat stability of major crops other than wheat as well.

Program Crop Collaborator(s) Phase Key Markets D 1 2 3 4 5 Heat Tolerance Wheat USAID, CIMMYT Global Phase: D=Discovery; 1=Proof of Concept; 2=Greenhouse / Early Field Trials; 3=Additional Field Trials / Product Development; 4=Regulatory / Pre-Commercial; 5=Commercialized
Herbicide Tolerance
Our Herbicide Tolerance program is currently focused on wheat and we have developed a non-GM source of tolerance to glyphosate, a widely used non-selective herbicide. We believe that the discoveries under this program are likely to result in similar opportunities in other major crops.
According to ISAAA, from 1996 to 2013, herbicide tolerant crops consistently occupied the largest planting area of biotech crops. In 2013 alone, herbicide tolerant crops occupied 99.4 million hectares, or 57%, of the 175.2 million hectares of biotech crops planted globally. For the first 17 years of commercialization (1996 to 2012), benefits from herbicide tolerant crops were valued at $47.7 billion, which accounted for 41% of global biotech crop value. For 2012 alone, herbicide tolerant crops were valued at $6.6 billion or 35% of global biotech crop value.
Our Herbicide Tolerance technology is in Phase 3 of development and was developed using our proprietary non-GM research platform, TILLING, which enabled us to find and further develop valuable rare genes within our wheat genetic diversity collection. This work is fully funded by a collaborator who has the option to obtain a non-exclusive commercial license to this trait in certain countries. We retain the right to further license this technology to additional collaborators in global wheat markets.
Testing results have shown tolerance in multiple wheat lines to levels of glyphosate herbicide, which may be sufficient to control many weed species in wheat production. Individual glyphosate tolerant wheat lines are being combined via plant breeding to combine sources of tolerance and create products with increasing levels of tolerance.
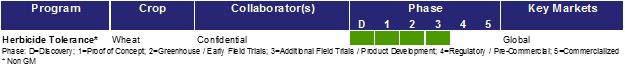
Program Crop Collaborator(s) Phase Key Markets D 1 2 3 4 5 Herbicide Tolerance* Wheat Confidential Global Phase: D=Discovery; 1=Proof of Concept; 2=Greenhouse / Early Field Trials; 3=Additional Field Trials / Product Development; 4=Regulatory / Pre-Commercial; 5=Commercialized * Non GM
Agronomic Trait Stacks
Trait stacks are combinations of multiple individual traits. Trait stacks can be made by using conventional plant breeding to cross plants with different traits, and can also be made by combining multiple traits in a molecular stack that is then inserted into a target crop. Our collaborators are generally allowed to combine multiple traits of ours either by breeding or molecular stacks. Deep portfolios of agronomic stress tolerance traits are rare in the industry, and the ability to pyramid multiples of such traits is even rarer. In order to validate the efficacy of particular trait stacks, we carry out our own research and field trials.
12
We have developed three molecular trait stacks, and have field-tested them in example crops, as shown in the table below. Efficacy of a trait stack in one crop suggests the probability that the stack will also work in other key crops. The history of single traits functioning in multiple crops, along with the evidence of stacked traits working in more than one crop, suggest that stacked traits are likely to function in multiple crops. Thus, we believe that our trait stacks have market opportunities well beyond the specific demonstration crops and geographies shown in the table.
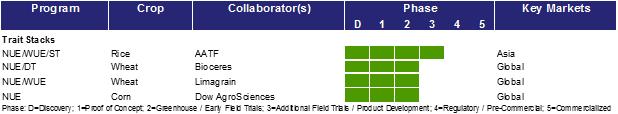
Program Crop Collaborator(s) Phase Key Markets D 1 2 3 4 5 Trait Stacks NUE/WUE/ST Rice AATF Asia NUE/DT Wheat Bioceres Global NUE/WUE Wheat Limagrain Global NUE Corn Dow AgroSciences Global Phase: D=Discovery; 1=Proof of Concept; 2=Greenhouse / Early Field Trials; 3=Additional Field Trials / Product Development; 4=Regulatory / Pre-Commercial; 5=Commercialized
Our most advanced and tested trait stack—the combination of NUE, WUE, and Salinity Tolerance—has been field tested in rice over multiple seasons. We have tested this trait stack under varying levels of nitrogen, water availability, and salinity. Rice plants with this stack out-yielded control plants by five to 22% under different levels of nitrogen fertilizer, by 19 to 32% under different types of water stress, and by 27 to 42% under high salinity conditions. The table below summarizes the results from a field trial conducted by us in 2012, with similar results obtained in a field trial conducted in 2013.
|
|
|

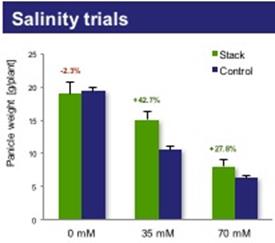
Nitrogen and Drought Trials Rice Grain Yield [g/plot, total] 4500 4000 3500 3000 2500 2000 +21.6% +22.6% +5.6% +19.6% +32.5% Stack Control N50 N75 N100 Late Drought Early Treatment Salinity Trials Panicle weight [g/plant] 25 20 15 5 0 -2.3% +42.7% +27.8% Stack Control 0mM 35mM 70mM
We have a strategic collaboration to develop and commercialize new yield traits and trait stacks in corn with Dow AgroSciences. Under the collaboration, we and Dow AgroSciences will jointly develop and commercialize agronomic yield traits, such as nutrient efficiency and water use efficiency, including several traits that already have completed advanced field trials in corn. These traits would then be combined with Dow AgroSciences’ input traits to create highly competitive trait stacks. As part of the agreement, we can use the agronomic traits in other major crops.
Agricultural Product Quality Traits
Gamma Linolenic Acid (GLA) Oil
Under the license agreement we have with Abbott, we developed a new source of vegetable oil with very high levels of gamma linolenic acid, or GLA, an omega-6 fatty acid. Our GLA safflower oil product has the highest concentration of GLA available in any plant oil at 65%; conventional plant oils range from 10 to 22% GLA. We sell the oil in the United States and Canada to manufacturers of nutritional supplements, medical foods, and other products. Our key customers include significant participants in those markets, such as GNC, Lindora Nutrition, and others.
13
GLA has multiple clinically-demonstrated nutritional and medical benefits, including anti-inflammation effects, improved skin condition, and healthy weight management. Multiple parties have expressed commercial interest in incorporating an enhanced GLA oil into their foods, dietary supplements, or medical products where conventional sources of GLA are not sufficiently concentrated to deliver amounts that are cost- and performance-effective.
Against a commercial target of 40% GLA concentration, we developed, deregulated, and commercialized GLA safflower oil containing up to 65% GLA concentration in less than six years. This is significantly less than the 13 years it takes, on average, to commercialize a seed using advanced breeding or biotechnology, according to Phillips McDougall. We produce GLA safflower oil by contracting with farmers in Idaho and process the seed under contract with a manufacturer in California to make refined oil. We sell GLA safflower oil under the brand name Sonova with multiple concentrations and formulations.

Program Crop Collaborator(s) Phase Key Markets D 1 2 3 4 5 GLA Oil Safflower Abbott N. America, Asia Phase: D=Discovery; 1=Proof of Concept; 2=Greenhouse / Early Field Trials; 3=Additional Field Trials / Product Development; 4=Regulatory / Pre-Commercial; 5=Commercialized
Arachidonic Acid (ARA) Oil
Our Arachidonic Acid (ARA) Oil has high levels of the fatty acid ARA, which is a key ingredient in more than 90% of U.S. infant nutrition products. ARA contributes to benefits such as fostering infant eye and brain development. We estimate the global market for ARA at $160 million and believe that our ARA product will cost significantly less than currently available sources of ARA.
Our ARA Oil is being developed under agreements with Abbott and DuPont Pioneer, each of which licensed intellectual property to us for this program. In exchange for licenses to intellectual property, these agreements provide product access rights to Abbott and DuPont Pioneer, as well as certain royalty payments on product sales to third parties.
Our ARA Oil is in Phase 3 of development. We have multiple safflower lines with oil compositions that offer the opportunity of being direct replacements for current sources of ARA in infant nutrition products.

Program Crop Collaborator(s) Phase Key Markets D 1 2 3 4 5 ARA Oil Safflower Abbott, DuPont Pioneer N. America, Asia Phase: D=Discovery; 1=Proof of Concept; 2=Greenhouse / Early Field Trials; 3=Additional Field Trials / Product Development; 4=Regulatory / Pre-Commercial; 5=Commercialized
Enhanced Quality Grains
We have multiple programs aimed at developing wheat and other small grains with improved nutritional qualities. One such program generated bread and pasta wheat lines with high levels of resistant starch. Resistant starch increases the total dietary fiber content of wheat and reduces its glycemic index, which are both desirable nutritional qualities that are important in the management of diabetes and healthy blood glucose levels. In 2012, the average American consumed 40% of the recommended level of daily dietary fiber, with whole grain consumption representing only 15% of targeted fiber intake and 80% of teenagers eating no whole grains. A second program increases specific quality targets in wheat, and is funded by Ardent Mills, which combines the operations of ConAgra Mills and Horizon Milling, a Cargill-CHS joint venture. A third program, funded by the National Institutes of Health, or NIH, is aimed at reducing gluten in wheat and other grains. All three of these programs utilize our proprietary TILLING platform, and the resulting products are non-GM.
14
Our resistant starch wheat provides a source of wheat with inherently high levels of resistant starch, increasing the total dietary fiber content of resulting food products without the need for fiber additives from other sources such as corn, potato and cassava. Resistant starch is a key product in two market segments: dietary fiber additives and modified starch additives. According to MarketsandMarkets, the fiber additives market was estimated to be $2.2 billion in 2013 and the modified starch market was estimated to be $12.8 billion in 2012, with food and beverage applications accounting for approximately 50% of this market. Major growth in these markets is being driven by the convenience health food sector and functional food sector. Flour from our resistant starch wheat lines has resistant starch levels that are 12 to 20 times higher than the control wheat, and total dietary fiber, or TDF, which is more than eight times higher than the control. Resistant starch wheat flour has been tested in applications in bread, where loaf quality was comparable to bread made with conventional wheat flour, and pasta, where it had the highest consumer preference rankings in tests carried out by a major consumer products company.
|
|
|


Resistant Starch & TDF Content Levels by Wheat Line Refined Flour Resistant Starch Content (% by wt) 35% 30% 25% 20% 15% 10% 5% 0% 37.8% 15.1% 16.0% 29.0% 33.0% 40% 35% 30% 25% 20% 15% 10% 5% 0% Parent RS14 RS83 RS100 Whole Grain Flour Total Dietary Fiber Content (% by wt) Refined Flour Resistant Starch Whole Grain Flour TDF Parent ID 2014 RS14 CA 2013 RS 14 ID 2014 RS18 CA 2013 Bread made with 50% RS Bread Wheat
Resistant starch wheat flour is currently being tested in a range of additional bakery products with industrial partners. We have several resistant starch wheat lines that are being evaluated for optimal quality and agronomic characteristics.
The global gluten-free market was estimated to be $2.1 billion in 2014 by Euromonitor, with the United States representing approximately 24%, or $500.0 million, of this market. This figure only includes products that have been formulated to replace wheat flour and does not include products that are naturally gluten-free or have undergone minor formulation changes. Consumers in this market are composed of people with celiac disease (approximately 1% of the population), people with non-celiac gluten intolerance (approximately 6% of the population) and people who choose to eat less gluten because they are in households with individuals with a gluten-free diet or choose to eat gluten- free food. According to Euromonitor, in 2014 bakery products and pasta represented 78% of all gluten-free sales, with a forecasted CAGR in this category in North America and Australasia of eight to 16%. Our wheat with reduced gluten will provide options for wheat products in the low gluten product category and additional options for blending wheat flour to meet the FDA standard for gluten-free products.

Program Crop Collaborator(s) Phase Key Markets D 1 2 3 4 5 Resistant Starch* Wheat NIH Global Grain Quality* Wheat Ardent Mills Global Reduced Gluten* Wheat NIH Global Phase: D=Discovery; 1=Proof of Concept; 2=Greenhouse / Early Field Trials; 3=Additional Field Trials / Product Development; 4=Regulatory / Pre-Commercial; 5=Commercialized * Non GM
15
Our post harvest quality program for tomatoes has resulted in tomato lines with significantly increased post harvest storage life. These tomato lines were developed using our proprietary TILLING platform and are non-GM. Our early research program was funded by the U.S. Department of Defense, due to their interest in being able to procure quantities of fresh fruit with extended storage life for deployment on board ships and submarines and for overseas missions. The global market for fresh tomatoes is estimated by the FAO at $84.5 billion per year. Our initial collaborator for this product is Bioseed, a vegetable seed company based in India, and the product is in Phase 4 of development. Additional collaborations in North America are in development.
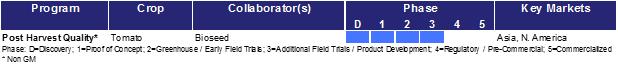
Program Crop Collaborator(s) Phase Key Markets D 1 2 3 4 5 Post Harvest Quality* Tomato Bioseed Asia, N. America Phase: D=Discovery; 1=Proof of Concept; 2=Greenhouse / Early Field Trials; 3=Additional Field Trials / Product Development; 4=Regulatory / Pre-Commercial; 5=Commercialized * Non GM
Our Product Development Capabilities
The diagram below illustrates the key steps in our technology identification and product development process.
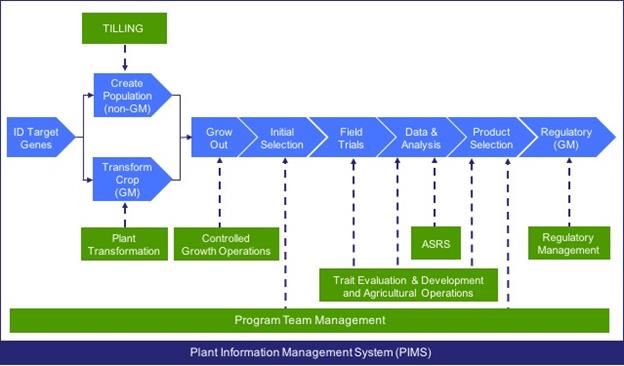
Tilling Create Population (non-GM) ID Target Genes Transform Crop (GM) Plant Transformation Grow Out Controlled Growth Operations Initial Selection Field Trials Data & Analysis Product Selection Regulatory (GM) ASRS Regulatory Management Trait Evaluation & Development and Agricultural Operations Program Team Management Plan Information Management Systems (PIMS)
16
Identification of New Technology Programs
Because our business model is based on leveraging upstream investment in basic research to expand our product development pipeline, we actively seek out and participate in collaborative programs with external partners for the early-stage exploration and identification of promising plant technologies, particularly those related to abiotic stress tolerance in plants. The results of these collaborations directly feed innovation and often drive the progress of our ongoing programs. Some of these key early-stage collaborations include programs with the ARC Centre of Excellence in Plant Cell Walls (Australia), the University of Adelaide (Australia), CIMMYT (Mexico), the University of California, Davis (United States), Tulane University (United States), the University of California, Berkeley (United States), the International Center for Research in Semi-Arid Tropics (India), the Bangladesh Rice Research Institute (Bangladesh), and ICABIOGRAD (Indonesia). Many of these collaborative programs are funded by U.S. government grants that we have secured either ourselves or in connection with our collaboration partners, including grants by USAID, the NIH, the National Science Foundation, and the USDA. Other early-stage technologies are introduced to us by commercial entities engaged in basic research who may be seeking to partner with us to advance their discoveries to further validation and product development. In some cases, such commercial entities are technology start-ups, and in other cases they include some of the largest companies involved in agricultural and food technology research. The diagram below illustrates our technology development model.

Public Institutions Activities Gene Targets Probability of success Time Gene Discovery 5% Discovery 24-48 months Proof of Concept De-risking 25% Phase 1 12-24 months Arcadia Transform into crops Monocot Dicot 25% Phase 2 12-24 months Field trial data Monocot Dicot 50% Phase 2 12-24 months Licensees Transform into target crops Rice Wheat Barley Corn Sugarcane Sugarbeets Cotton Canola Soybeans 50% Product development 75% Phase 3 12-24 months Regulatory approval 90% Phase 4 12-36 months Seed marketing and sales 100% Commercial Commercial
We have a formal team and process for evaluating new technology opportunities. This team has multi-disciplinary membership, and reviews promising new technologies with regard to mission fit, scientific feasibility, intellectual property, business opportunity, and other considerations. Generally, we accept less than 10% of the potential opportunities we evaluate. Once a promising new trait technology has been accepted, we negotiate an agreement with the technology provider that, at a minimum, enables us to further evaluate the technology for a suitable period of time, or, in some cases, secures rights that enable full research and commercial exploitation of the technology.
17
Our technology program teams include scientists who are leaders in their respective fields. These teams contribute to the initial evaluation of new technologies and are responsible for development of technologies brought onboard. Each of our technology programs involves multiple gene, trait, and crop targets, and our process focuses on rapid development of the most promising combinations. In the development of any particular technology, we carry out a series of steps including the direct evaluation of target gene function, and the specific evaluation of results in key representative crop species. While common core scientific services are provided by specialized groups, the technology program team manages overall progress and remains directly involved throughout the development cycle, internally as well as externally with our collaborators.
GM and Non-GM Product Development Platforms
Transformation—GM Traits. For projects involving GM traits, the genetic construct for insertion into plants is designed and built by the relevant program team, and then the gene transfer step is accomplished by our plant transformation functional group. This group consists of six members with more than 100 years of combined experience in plant transformation. The group has developed a complete physical and methodological infrastructure at our laboratory facility in Davis, California to efficiently transfer genetic materials into key crop species. Our plant transformation team has demonstrated transformation capabilities in all primary and some secondary agricultural crops, including rice (japonica, indica, and NERICA types), wheat, corn, canola, cotton, soybean, safflower, barley, sorghum, alfalfa, tomato, and grapes.
Targeting Induced Local Lesions in Genomes (TILLING)—Non-GM Traits. Our proprietary TILLING platform enables us to develop value-added crops without the use of GM methods. The TILLING platform is primarily managed by a dedicated team of scientists at our laboratory in Seattle, Washington. TILLING technology was originally invented by a member of our science team and utilizes specialized laboratory equipment to carry out high-throughput allele screening of DNA samples from genetic diversity populations created in major crops. Our populations include wheat, rice, soybean, canola, tomato, and lettuce. These populations include numerous native and induced gene function alterations, which can be discovered and exploited rapidly at low cost and with minimal regulatory requirements. While the TILLING approach is also practiced elsewhere, we believe that the combination of our specialized background in the technology, highly refined skills in developing and screening genetic diversity plant populations, and proprietary TILLING software makes us the leader in commercial applications of TILLING.
Controlled Growth Operation. Our controlled growth operations group manages our growth chamber facility, where plants transitioning out of the plant transformation group are grown under precisely controlled conditions, and our greenhouse facility, consisting of approximately 26,000 square feet of high quality greenhouse space, both at our headquarters in Davis, California. The controlled growth operations group uses these facilities to manage plant experiments and grow-outs under rigorously controlled conditions. They also carry out the initial seed increases and first stages of plant breeding for some projects. For certain projects, such as those relating to oil quality and resistant starch wheat, this group also manages crop breeding programs to develop plant varieties for the production of commercial products.
Field Trials and Commercial Production. Our trait evaluation and development group is based in Davis, California and manages remote field operations in American Falls, Idaho and Brawley, California. The group conducts field trials throughout the United States with specialized contractors, and elsewhere globally with our collaborators and joint venture partners. The trait evaluation and development group has extensive field and specialized statistical analytical capabilities that we deploy to support their field trial execution and data analysis internally and with our collaborators.
Our agricultural operations group manages late-stage and regulatory field trials and, in the case of GLA safflower, commercial crop production. Late-stage field trials are intended to develop extensive data on a limited number of potential commercial plant varieties. These trials may be used to test new varieties developed by our collaborators containing our traits, and to test our own commercial varieties for oil quality and grain quality programs. Similarly, regulatory trials develop data for use in submissions for regulatory review and may involve plant varieties developed by our collaborators or our own oil quality and grain quality programs.
18
Regulatory Data Generation. Our Analytical Services and Regulatory Science, or ASRS, group is located in Davis, California and provides automated DNA preparations, genomic blot analyses, lipid profiling, metabolomics, and protein purification services and develops data for use in product selection and validation, certification of Sonova product specifications, and regulatory submissions. These data support regulatory submissions and provide core trait regulatory packages to our collaborators for use in their crop-specific regulatory applications.
Biological Materials Inventory and Tracking. Our proprietary Pedigree and Inventory Management System, or PIMS, tracks the genetic, phenotypic, and location information for all of our plant materials. PIMS encompasses genetic elements such as genes and promoters, GM seeds, and plant material received by us, as well as seeds and plants developed by us and used in trait development. The performance of our plant materials is recorded through a variety of laboratory and field observations, and the data are stored within PIMS. The location of all plant materials is tracked throughout the plant life cycle. This includes specific seeds planted within a specific plot of a specific field trial, harvest, seed storage location, and use by, or distribution of plant material to, our collaborators or elsewhere. PIMS interfaces with our Biotechnology Quality Management System, or BQMS, to manage all movement and release of regulated GM plant materials. This ensures that all of our plant materials are accounted for, tracked, and inventoried, which enables us to maintain control over and documentation of all plant materials.
Regulatory Matters
Our regulatory management group provides regulatory services for all of our product development programs, as well as for joint ventures and selected collaborations. These services include establishing protocols, completing regulatory permits as necessary, and monitoring regulatory and stewardship compliance for all products at all stages. Our regulatory group includes key employees who are directly responsible for leading all regulatory agency interactions and providing tactical and strategic regulatory direction. Our group collectively has more than 70 years of regulatory experience, with nearly 60 years of direct involvement in the development and approvals of GM crops. Members of our regulatory group were responsible for completing the first FDA and USDA deregulation of a GM whole food. The interactions and processes associated with these first USDA and FDA processes established benchmarks for the regulation of GM products that remain applicable today.
Our regulatory management and compliance activities encompass three broad categories: stewardship, authorization, and deregulation. In the United States, these activities are regulated by various government agencies, including the USDA, the FDA, and the U.S. Environmental Protection Agency, or EPA.
Stewardship
Stewardship, or the careful and responsible management of assets, forms the foundation of our regulatory compliance programs associated with GM plants. Our stewardship framework for GM plants is defined by government regulations and related internal policies. The USDA requirements and internal procedures for regulatory stewardship are embodied in our Biotechnology Quality Management System, or BQMS, which was developed by us and approved by the USDA Animal and Plant Health Inspection Service, Biotechnology Regulatory Service.
Our BQMS program was developed to address all conditions required under USDA authority to ensure containment of regulated plant material. The BQMS includes standard operating procedures, or SOPs, recording and reporting forms, instructions for managing all compliance related activities, and training requirements for all individuals handling GM plant materials. SOPs are highly detailed and consider all elements of each relevant activity or process. Each field trial site is accompanied by a field compliance guide and record containing multiple SOPs and associated forms for each activity. For example, a GM wheat trial requires 19 SOPs and associated verification forms.
Our BQMS is audited annually both internally and independently by an auditor trained and supervised by the USDA. Since our BQMS program was first recognized by the USDA in 2011, each annual independent audit has confirmed that our program is functioning as intended. Our BQMS manager has attended BQMS training programs at the request of the USDA to assist in training personnel at other companies, to share our experience and the SOPs that form the basis of our program.
19
Compliance with the specific parameters of regulatory requirements is only one element of stewardship. Additional activities within each functional group throughout the company are integral to the overall stewardship program. Each of our employees is trained on, and must comply with, relevant stewardship guidelines as defined and described in our BQMS.
Authorization
The USDA Biotechnology Regulatory Service, or BRS, has legal and regulatory authority over the movement and release of GM plants and seeds. “Movement” includes movement of regulated GM plant material between states and the importation of regulated GM plant material from outside the United States. “Release” includes field trials of any size and any other use of regulated GM plant material outside of contained greenhouses.
We have obtained more than 200 authorizations from the BRS for the movement, importation or release of GM plants under development. General and specific conditions to maintain containment during all activities associated with the movement or release are a requirement of each authorization. These conditions are defined and applied in the context of the BQMS.
Deregulation
Our business is subject to regulations related to agriculture, food, and the environment. Plant products produced using GM technology are subject to laws and regulations in countries where the plants are grown and in countries where the GM plant-derived food and feed are consumed by humans or animals. Commodity products utilizing our GM traits may require approvals in multiple countries prior to commercialization, whereas our identity-preserved GM products (for example, GLA safflower and resulting Sonova products) may require approvals only in the limited geographies where the products are marketed and sold. Such products must be appropriately channeled in the food and feed markets to ensure that the products are not exported to geographies where necessary approvals have not been obtained.
U.S. Regulatory Agencies
U.S. Department of Agriculture. We must obtain USDA authorizations and permits in order to conduct the field releases of regulated materials that are necessary to advance the development of GM crops. Obtaining such authorizations and permits is generally routine and delays impacting the planned movement or release of GM material are uncommon. The USDA provides detailed regulations and guidance for obtaining a so-called “Determination of Deregulated Status,” which authorizes the commercial and uncontained growing of GM plants. For regulated GM plants, the USDA requires that a company petition the agency to demonstrate that the product is unlikely to pose a risk. Based on the information provided, the USDA prepares an Environmental Assessment, or EA, and/or an Environmental Impact Statement, or EIS, in order to make its determination. These procedures afford the public an opportunity to submit written comments on the draft EA or EIS for consideration by the USDA before the final version of the EA or EIS is published. For any GM plant product, there may be delays or requests for additional information based on the USDA’s review or the public comments. Submissions received by the USDA from all applicants in August 2011 and thereafter averaged 27 months to completion; however, the USDA has announced proposed rules intended to significantly shorten this time period.
20
U.S. Food and Drug Administration. The FDA is responsible for food safety under the Federal Food, Drug and Cosmetic Act. The FDA recommended in its 1992 Statement of Policy: Foods Derived from New Plant Varieties that developers of GM plant products consult with the agency about the safety of GM products under development. In 1996, the FDA provided additional guidance to the industry on procedures for these consultations. These procedures require a developer intending to commercialize a food or feed product derived from a GM plant to first meet with the agency to identify and discuss relevant safety, nutritional, and other regulatory issues regarding the product. Subsequently, the developer must submit to the FDA a scientific and regulatory assessment supporting proposed product safety. The FDA evaluates the submission and engages with the developer to resolve any questions, requests for additional data, or other informational requirements. Once the FDA has determined that all requirements have been satisfied, the FDA concludes the consultation process by issuing a letter to the developer acknowledging completion of the consultation process with the addition of the product to the list of completed consultations on the FDA website. The completed consultation acknowledges product safety for use as food and feed. To date, over 150 GM products have completed this process. This process may have delays if the FDA requires additional data and information for its consultation and to resolve any questions the FDA may have. The FDA completed nine consultations in 2013 and 2014, with consultation time periods ranging from 13 to 40 months and averaging 21 months from first submission to conclusion.
Environmental Protection Agency. Certain products may also be regulated by the EPA, including plants that contain a plant-incorporated protectant, such as a pesticides or herbicide, or plants engineered to be treated with industrial chemicals.
International Regulation
In certain instances, commercialization of GM crops in the United States may require approvals in those jurisdictions into which crops or derivative materials, such as oil or meal, will be exported. The laws and regulations for GM plant products are well defined in several commercially significant jurisdictions, including Australia, South America, India, and the European Union, and are in various stages of evolution in others, such as Africa and China. Typically, our collaborators are responsible for obtaining all regulatory permits and approvals relevant to product development and commercialization in their licensed countries and for generating crop and transformation event-specific data required by jurisdictions of interest. We provide basic safety data on trait expression products in accordance with generally accepted standards and may serve as a regulatory consultant and participate in the design of regulatory data generation protocols and development of regulatory submissions beyond the basic safety data package. In certain countries, we may develop strategic business relationships or employ independent consultants with geography-specific knowledge and expertise to support and obtain required approvals.
Intellectual Property
We rely on patents and other proprietary right protections, including trade secrets and contractual protection of our proprietary know-how and confidential information, to preserve our competitive position.
As of December 31, 2015, we owned or exclusively controlled 133 issued patents and 42 pending patent applications worldwide. As of this date, we owned seven and exclusively in-licensed 19 U.S. patents and we owned six and exclusively in-licensed one pending non-provisional U.S. patent applications relating to our trait technologies and business methods. Also, as of this date, we owned 11 and exclusively in-licensed 96 foreign patents and owned 14 and exclusively in-licensed 17 pending foreign patent applications. With respect to all of the foregoing patent assets, our exclusive licenses afford us control over the prosecution and maintenance of the licensed patents and patent applications. These numbers do not include in-licensed patents for which we either do not have exclusive rights (such as certain enabling technology licenses), or for which we have exclusive rights only in a limited field of use or do not control prosecution and maintenance of the licensed patents.
As of December 31, 2015, we had eight registered trademarks in the United States. As of this date, we also had eight registered trademarks and had one trademark application pending in various other countries.
21
We also have entered into in-license agreements enabling the use and commercialization of our traits, including NUE, WUE, and Salinity Tolerance, and certain products that we have commercialized or are under development, including GLA safflower oil and ARA safflower oil. Under these licensing arrangements, we are obligated to pay royalty fees on sublicense revenue and net product sales ranging between low single digit percentages and percentages in the mid-teens, subject in certain cases to aggregate dollar caps. The exclusivity and royalty provisions of these agreements are generally tied to the expiration of underlying patents. After the termination of these provisions, we and our collaborators may continue to produce and sell products utilizing the technology under the expired patents. While third parties thereafter may develop products using the technology under the expired patents, in many cases, we have incremental patent rights covering our most important technologies, which we believe mitigate the impact of the expiration of these patents, or the related exclusivity provisions, on our business. We also have numerous in-licenses relating to enabling technologies utilized in our development programs, such as transformation methods (e.g., Japan Tobacco, DuPont Pioneer), genome editing tools (e.g., Dow), promoters (e.g., Dow, Louisiana State University) and selectable marker technologies (e.g., Bayer). These in-licenses are non-exclusive and include some combination of upfront and annual license fees, milestone fees, and commercial royalty obligations consisting of low single-digit percentages or a low single-digit dollars per acre fee.
Below is a summary of those in-license agreements that we believe are most significant for our more advanced product development programs.
University of Alberta. We hold an exclusive license from University of Alberta to the patent portfolio that formed the basis of our NUE program, which began in 2002. In exchange for an upfront license fee and royalties on sublicense revenues and net product sales (which are capped at an aggregate amount in the mid-seven figures), and subject to the University’s right to perform academic research using the technology, we exclusively control all research, development, commercialization, and sublicensing of the patented technology globally for all crops.
Blue Horse Labs. In conjunction with a sponsored research and development agreement entered into in 2003, we obtained an exclusive license from Blue Horse Labs, an affiliate entity of our majority stockholder, Moral Compass Corporation, for technology related to several of our development programs. Under the sponsored research and development agreement, Blue Horse Labs has an ownership right in patents covering technology that was developed using Blue Horse Labs funds, including certain NUE and GLA safflower patents. In the corresponding license agreement, in exchange for a single-digit royalty on net revenues and management of all aspects of the patent portfolio, we exclusively control all research, development, commercialization, and sublicensing of the patented technology globally for all crops.
University of California. Our WUE technology was developed under an exclusive option agreement with the University of California, pursuant to which we exercised our right to secure an exclusive license in 2010. In exchange for an upfront license fee, license maintenance fees, and royalties on sublicense revenues and net product sales, we exclusively control all for-profit research, development, commercialization, and sublicensing of the patented technology globally for all crops.
University of Toronto. We hold an exclusive license from University of Toronto to the patent portfolio that forms the basis of our Salinity Tolerance program. In exchange for an upfront license fee, a low single-digit royalty on revenues, and payment of all costs associated with the patent portfolio, and subject to the University’s right to use the technology for research and teaching purposes, we exclusively control all for-profit research, development, commercialization, and sublicensing of the patented technology globally for all crops.
Abbott. We entered into a license and development agreement with Abbott in 2003 under which we have been granted limited exclusive rights to Abbott’s portfolio of U.S. and foreign patents relating to the development of plant-based sources of GLA, ARA, and essential fatty acids. Under this agreement, we provide Abbott with preferential access to commercial products from our GLA and ARA safflower programs, as well as the right to receive low single-digit royalty payments on product sales to third parties, in exchange for the licenses to Abbott’s intellectual property rights.
22
Since our founding in 2002, we have established numerous trait collaborations and have developed deep relationships with industry-leading seed and consumer product companies. Our partnerships with global strategic seed and consumer product players enable us to further participate in the development and commercialization of innovative products that promise to play significant roles in improving global crop efficiency and enhancing human health. The results of these collaborations directly feed innovation and drive the progress of our ongoing programs. Moreover, the expertise and opportunities created by the collaborations represent important assets to our business. While our collaboration- focused business model has resulted in numerous strategically significant relationships, below is a summary of selected collaborative partnerships that we view as key to the achievement of our near-term and mid-term business objectives.
Mahyco
We have multiple collaborative agreements with Mahyco covering more than 15 programs, using our most advanced traits in multiple major crops, and have been working with Mahyco as a key partner since 2007. Our collaborations in NUE rice and salt tolerant rice are in advanced stages of development.
Under our various agreements relating to our NUE, WUE, and Salinity Tolerance traits, Mahyco has exclusive research and commercial rights in all licensed geographies and must timely meet certain diligence milestones in order to maintain their exclusivity. Each of our collaboration agreements with Mahyco includes an upfront technology access fee, technical and regulatory milestone fees, and, once products utilizing our traits are commercialized, we are entitled to receive a portion of the commercial value of seeds sold by Mahyco incorporating our traits. Rights to new intellectual property developed under a collaboration agreement are owned by the inventing party or parties.
Vilmorin & Cie (Limagrain)
We selected Limagrain as our strategic partner and collaborator in wheat—the world’s largest crop by area grown and the third most valuable at $186.4 billion annual value—due to their position as the leading global breeder and marketer of wheat seeds. In 2009, we executed an agreement with Limagrain under which we partnered to develop and commercialize NUE wheat in all countries of the world except Australia, India, Pakistan, Bangladesh and Sri Lanka. Under our agreement, Limagrain has exclusive research and commercial rights in all licensed geographies except North America and South America, in which we retained co-exclusive rights, and Limagrain must timely meet diligence milestones to maintain exclusivity. Our agreement with Limagrain includes an upfront technology access fee, annual maintenance fees, and technical and regulatory milestone fees, and once an NUE wheat product is commercialized, we are entitled to receive a portion of the commercial value of the trait in the marketplace. We and Limagrain have since coordinated with collaborators in Australia to align development efforts in NUE wheat on a global basis.
In 2010, we further expanded our relationship with Limagrain from collaborator to stockholder and joint venture partner. Contemporaneously with Limagrain’s $25.0 million equity investment in our company, we formed Limagrain Cereal Seeds LLC, a joint venture company focused on the development and commercialization of improved wheat seed in North America, of which a U.S. wholly owned subsidiary of Limagrain owns 65% and we own 35%. This joint venture strengthens a close strategic relationship between us and Limagrain, and increases the share of net trait value that we will recognize on traits commercialized in wheat.
As a key strategic partner, Limagrain has a right of first offer to license—on an arm’s-length basis—new technologies that we develop or acquire that are applicable to wheat or barley. This right of first offer extends to Limagrain Cereal Seeds for the United States and Canada. Pursuant to the right of first offer, we formed a global collaboration with Limagrain and Limagrain Cereal Seeds in 2011 to develop and commercialize WUE wheat. Our agreement with Limagrain and Limagrain Cereal Seeds includes an upfront technology access fee, technical and regulatory milestone fees, and, once a product is commercialized, we are entitled to receive a portion of the commercial value of the WUE trait in the marketplace.
23
In 2012, we partnered with Bioceres, an Argentina-based technology company, to form Verdeca LLC, a U.S.-based joint venture company engaged in the development and deregulation of soybean traits, of which we own 50%. We selected Bioceres as our partner in soybeans—the world’s fourth largest crop by area grown and the fourth most valuable at $119.0 billion annual value—due to their desirable trait portfolio, their presence in key South American markets, and the significant presence of large soybean growers in their ownership structure.
Our joint venture agreement provides for each of the joint venture partners to license its trait technologies to Verdeca for use in soybeans, with product development and regulatory efforts equitably divided and managed by us and Bioceres under standalone service agreements that are executed annually. The first product in the Verdeca pipeline is a drought and abiotic stress tolerance trait that has already completed extensive validation trials and is now in the regulatory phase of development. This trait has been demonstrated to confer a seven to 14% yield advantage over conventional soybeans grown under the same suboptimal conditions. In April 2015, Verdeca received the first regulatory approval of its stress tolerance trait in soybeans in Argentina. This is the world’s first regulatory approval of an abiotic stress tolerance trait in soybeans, which we believe is an important initial step in pursuing additional regulatory approvals that Verdeca intends to seek in multiple geographies globally. Verdeca has successfully negotiated favorable market access in South America through established players and is working on adding market channel partners in the United States, India, and China.
In addition to those agreements with Bioceres directly associated with Verdeca, we also have negotiated exclusive access to Bioceres’ drought and abiotic stress tolerance trait for use globally, outside of South America, in wheat. Our agreement with Bioceres provides for sharing of trait value once a product is commercialized.
In April 2015, we entered into a collaboration agreement with Dow AgroSciences and Bioceres under which our Verdeca joint venture will collaborate with Dow AgroSciences on the development and deregulation of soybean traits on a global basis.
Dow AgroSciences
In December 2015, we announced the entry into a strategic collaboration with Dow AgroSciences to develop and commercialize new yield traits and trait stacks in corn. The collaboration leverages our platform of abiotic stress traits with Dow AgroSciences’ enabling technology platforms, input traits, regulatory capabilities, and commercial channels.
Under the collaboration, we and Dow AgroSciences will jointly develop and commercialize agronomic yield traits, such as nutrient efficiency and water use efficiency, including several traits that already are in advanced field trials in corn. These traits would then be combined with Dow AgroSciences’ input traits to create highly competitive trait stacks that maximize farmer revenue and efficiency.
As part of the strategic partnership, we negotiated non-exclusive access to Dow AgroSciences’ EXZACT™ Precision Technology Platform to enhance and accelerate the development of trait stacks. Dow AgroSciences has developed the EXZACT™ Precision Technology Platform under an exclusive license and collaboration agreement in plants with Sangamo BioSciences, Inc.
Under the collaboration agreement, certain development costs will be co-funded, and commercial value of resulting traits in corn will be shared.
24
We maintain a scientific advisory board consisting of the members identified below. Our scientific advisory board meets on a quarterly basis and is comprised of industry and academic experts that have extensive experience in the analysis, research and development, and commercialization of biotech plants, including experience relating to discovery, transformation, and field trials. We consult with our scientific advisory board on a variety of matters pertaining to our current and future pipeline of products in development, including, for example, trait selection and development, transformation and TILLING methodologies, field trials, regulatory matters, and intellectual property evaluation.
We currently have a scientific advisory board that consists of six members as follows:
Eduardo Blumwald, Ph.D. is a professor at the University of California, Davis. Dr. Blumwald’s research program is multidisciplinary in nature, combining physiology, biochemistry, molecular biology, genomics, and proteomics. The general objectives of his work are: (i) the cellular and molecular mechanisms that regulate ion homeostasis in plants; (ii) the cellular and molecular mechanisms mediating the responses of plants to abiotic stress (e.g., salt, drought, and heat); (iii) the biochemical and molecular basis of sugar and acid accumulation in fruits; and (iv) the development of genomic and proteomic resources for the improvement of fruit quality. Dr. Blumwald has worked closely with our scientists from the time of his former position with the University of Toronto.
Vicki Chandler, Ph.D. is Chief Program Officer, Science, at the Gordon and Betty Moore Foundation. She studied biochemistry for her undergraduate and doctoral degrees at the University of California, Berkeley, and the University of California, San Francisco, respectively. She then pursued postdoctoral research at Stanford University and was on the faculty at the University of Oregon and the University of Arizona. Dr. Chandler’s research on paramutation, an epigenetic process, has implications not only for corn, which she used for the majority of her research, but also for animal and human genetics and genetic diseases. Dr. Chandler is president of the Genetics Society of America, a member of the National Academy of Sciences, and a member of the National Science Board. Her many honors include the Presidential Young Investigator Award, Searle Scholar Award, and American Association for the Advancement of Science Fellow. She has served on advisory boards and panels for the National Research Council, National Science Foundation, Department of Energy, and National Institutes of Health. Dr. Chandler has chaired numerous conferences and served on the editorial boards of several journals, including Genetics, Plant Physiology, PNAS, and Science.
Luca Comai, Ph.D. is a professor at the Genome Center in University of California, Davis. Dr. Comai’s lab is involved in two areas pertinent to breeding. In the first, they study genome regulation, hybridization, and heterosis responses in chromosome copy number variants and interspecific hybridization. In the second, they develop and make available to the plant community a functional genomic discovery tool called TILLING that allows targeted inactivation of genes in crop plants. The research combines plant genetics and genomics with the use of next-generation sequencing and bioinformatics to identify genes responsible for traits of interest as well as to discover and use natural and induced variation. Dr. Comai is known for his pioneering work creating glyphosate tolerant crops, and as a founding scientist in Calgene Pacific, Targeted Growth, Inc., and Tilligen.
Georges Freyssinet, Ph.D. is recently retired after many years in the plant biotechnology industry in France. He is the former CEO of RhoBio, a joint venture between Rhône-Poulenc Agro and Biogemma, and served as the Scientific Advisor for Life Sciences for the RP Group. Dr. Freyssinet is the former director of plant genomics for Aventis, which was later acquired by BayerCropScience. He joined Biogemma in 2003 to lead their genomic and bioinformatics platform, and in 2006 he joined the Scientific Direction of Groupe Limagrain, serving as Scientific Director from 2008-2011. Dr. Freyssinet is the founder and former CEO of LemnaGene, a biomanufacturing company, and the former CEO of Genective, a joint venture between Groupe Limagrain and KWS. Retired since 2014, he continues his independent consulting activities in plant biotechnology.
25
Jim Petersen, Ph.D. is Vice President for Research at Limagrain Cereal Seeds, a U.S. joint venture between Groupe Limagrain and our company, where he currently oversees all U.S. breeding operations. Prior to joining Limagrain, Dr. Peterson spent 27 years in public sector wheat research, including 12 years as the Krondstadt Professor of Wheat Breeding and Genetics at Oregon State University. Dr. Peterson served as Chair of the National Wheat Improvement Committee and is a recipient of the Weatherford Award for Entrepreneurship and Innovation from the College of Business at Oregon State University. He is noted for his fundamental research on wheat end-use quality and GxE interactions impacting quality. Dr. Peterson received his B.S. in agronomy from Washington State University and his M.S. and Ph.D. in agronomy and plant breeding from the University of Nebraska.
Peter Quail, Ph.D. is a professor of Plant and Microbial Biology at the University of California, Berkeley where he also serves as Research Director of the Plant Gene Expression Center (U.S. Department of Agriculture/Albany, California). Dr. Quail has been a pioneer in the study of phytochromes, photoreceptor proteins that play a major regulatory role in plant growth and development. Dr. Quail was elected to the National Academy of Sciences in 2004, as a Fellow of the American Association of Science in 2004, and was the recipient of the Stephen Hales Prize, American Society of Plant Biologists, 2008. He received a B.S. and Ph.D. from the University of Sydney, Australia.
Competition
The markets for seed traits and agricultural biotechnology products are highly competitive, and we face significant direct and indirect competition in several aspects of our business. Competition for improving plant genetics comes from conventional and advanced plant breeding techniques, as well as from the development of advanced biotechnology traits. Other potentially competitive sources of improvement in crop yields include improvements in crop protection chemicals, fertilizer formulations, farm mechanization, other biotechnology, and information management. Programs to improve genetics and chemistry are generally concentrated within a relatively small number of large companies, while non-genetic approaches are underway with broader set of companies.
In general, we believe that our competitors generally fall into the following categories:
|
|
· |
Large Agricultural Biotechnology, Seed, and Chemical Companies: According to Phillips McDougall, the leading 11 seed and trait companies as a group invested $4.1 billion in seed and trait research and development in 2013. This includes conventional and advanced plant breeding, as well as biotechnology trait development. According to Phillips McDougall, only a limited number of companies have been actively involved in new trait discovery, development, and commercialization: Monsanto, DuPont Pioneer, Syngenta, BASF, Bayer, Dow, KWS, and Genective (a joint venture between KWS and Limagrain). Many of these companies have substantially larger budgets for gene discovery, research, development, and product commercialization than we do. Some of these companies also have substantial resources and experience managing the regulatory process for new GM seed traits. Each of Monsanto, DuPont Pioneer, Syngenta, Dow, and Bayer, which accounted for 85% of the 2013 seed trait research and development spend noted above, also have significant chemical crop protection background and businesses. The trait pipelines of these companies are heavily weighted toward biotic stress traits, although they also have significant programs aimed at development of abiotic stress traits. While these companies have internal programs that may compete with our own, they also seek new traits externally and, as such, some of them either currently are, or may in the future be, our collaborators. In addition, some of these companies are currently among our sources for new trait technologies. |
|
|
· |
Trait Research and Development Companies: There are a number of companies that specialize in research and development of agricultural yield and product quality traits, and we believe that a dozen or more companies, including Evogene, Ceres, and Keygene, among others, are competitors in our field. We believe that these companies typically focus on a limited number of traits, and do not generally have the product development and regulatory infrastructure necessary to bring traits to market. Therefore, they typically license trait technologies to large industry players with in-house development and regulatory capabilities at a relatively early stage of development. |
26
|
|
· |
Companies Focused on Farming Data Management, or Precision Agriculture: Within the past several years there has been a rapid increase in technologies and companies focused on acquiring, analyzing, and acting upon data in ways that may improve farm economics via increased crop yield and more efficient management of crop production inputs. Technical approaches include weather prediction and monitoring, high-density field and crop imaging systems, precision field soil and yield mapping, and others. Companies focusing on this space include Trimble, Planet Labs, Ceres Imaging, Blue River, and others. While these products are potentially competitive with us for increasing crop yields, we believe that certain of these products could also be additive or synergistic with our traits. |
|
|
· |
Agricultural Research Universities and Institutions: Given the global importance of agriculture, numerous agricultural research universities and institutions around the world focus on basic and applied research aimed at increasing crop yield. According to the Agricultural Science and Technology Indicators, global public spending on agricultural research and development in 2008 totaled $31.7 billion, having increased by 22% during the years from 2000 to 2008. Spending in 2008 in high income countries accounted for approximately 51% of the total, while spending in low and middle income countries accounted for 49% of the total. The United States was the largest contributor of public agriculture funding in 2008 with a total investment of $4.8 billion. Most of this publicly funded research is focused on basic research. Many public research programs aim to understand basic biological processes and do not necessarily engage in further development and commercialization of discovered traits. While these programs are potentially competitive with us, we view them primarily as sources of innovation that fit with our business model. We have an established track record of working closely and effectively with public research programs, including a number from the U.S., Canada, Japan, Australia, Spain, Ireland, and elsewhere. |
We believe that we are uniquely positioned at the nexus of basic research and commercial product development. Unlike many companies in our space, we generally do not compete in the area of basic research. Our focus is on development and validation and, therefore, we provide a value-added link by which basic research can be brought to market. Public research institutions provide us with a source of innovative new technologies and traits and while such basic research programs are competitive with in-house programs at the largest seed and technology companies, global public investment in basic research in 2008 at more than $31.0 billion was more than seven times greater than industry spending in 2013. We believe that these public programs are valuable and sustainable sources of new technologies for us and we have earned a reputation in our industry as a trustworthy and effective partner based on our demonstrated ability to manage the development and regulatory processes for GM seeds and capture additional value for ourselves and our basic research collaborators. While internal programs at the largest seed and technology companies are competitive with ours in some cases, we are technology providers to some of these companies, and we have numerous collaborations with many of them. To remain competitive, we plan to pursue multiple strategies, including further building our pipeline of new technologies from basic research programs, increasing the scope and range of our field testing activities, and continuing to protect our intellectual property rights in key jurisdictions globally.
27
As of December 31, 2015, we had 48 full-time employees dedicated to research and development, nine of whom are development and field personnel focused on demonstration and research field trials. Our research and development team has technical expertise in molecular biology, biochemistry, genetics and genetic engineering, analytical chemistry, plant physiology, plant virology, molecular pathogenesis, and soil and water science. Our research and development activities are conducted principally at our Davis, California and Seattle, Washington facilities, with ongoing field trials conducted in American Falls, Idaho; Brawley, California; and numerous other locations throughout the United States and at locations managed by our collaborators worldwide. We have made, and will continue to make, substantial investments in research and development. Our research and development expenses were $9.0 million and $10.0 million in the years ended December 31, 2015 and 2014, respectively.
Employees
As of December 31, 2015, we had 80 full-time employees, of whom 12 hold Ph.D. degrees. Approximately 48 employees are engaged in research and development activities, three in business development, three in regulatory management, and 26 in management, operations, accounting/finance, legal, and administration. We consider our employee relations to be good. None of our employees is represented by a labor union or collective bargaining agreement.
Facilities
Our corporate headquarters are located in Davis, California, in a facility consisting of approximately 20,775 square feet of office, laboratory, and growth chamber space under a lease that expires on June 30, 2018, pursuant to which we have an option to renew the lease for an additional three-year term. This facility accommodates research and development, operations, analytical services, regulatory, and administrative activities. We also lease approximately 4,381 square feet of office and laboratory space in Seattle, Washington, where our team of scientists executes our TILLING technology platform, under a lease that expires on December 31, 2016. Our administrative offices in Phoenix, Arizona consist of 2,976 square feet under a lease that expires on June 30, 2018 and accommodate finance, legal, and other administrative activities, as well as sales and marketing activities for our Sonova products. We also lease greenhouse space and farm land for agricultural use in Northern California as well as farmland in Idaho. We also lease grain bin and office space in Idaho under a lease that expires on March 3, 2019.
We believe that our leased facilities are adequate to meet our current needs and that, if needed, suitable additional or alternative space will be available to accommodate our operations.
Legal Proceedings
We currently are not a party to any material litigation or other material legal proceedings. From time to time, we may be subject to legal proceedings and claims in the ordinary course of business.
You should carefully consider the following risk factors, in addition to the other information contained in this report on Form 10K, including the section of this report titled “Management’s Discussion and Analysis of Financial Condition and Results of Operations” and our financial statements and related notes. If any of the events described in the following risk factors and the risks described elsewhere in this report occurs, our business, operating results and financial condition could be seriously harmed. This report on Form 10K also contains forwardlooking statements that involve risks and uncertainties. Our actual results could differ materially from those anticipated in the forwardlooking statements as a result of factors that are described below and elsewhere in this report.
28
Risks Related to Our Business and Our Industry
We or our collaborators may not be successful in developing commercial products that incorporate our traits.
Our future growth depends on our ability to identify genes that will improve selected crop traits and license these genes to our collaborators to develop and commercialize seeds that contain the genes. Our longterm growth strategy is based on our expectation that revenues related to the sale of seeds containing our traits will comprise a significant portion of our future revenues. Pursuant to our collaboration agreements, we are entitled to share in the revenues from the sale of products that integrate our trait. We expect that it will take several years before the first seeds integrating our agricultural yield traits complete the development process and become commercially available for sale, resulting in revenues for us. However, the development process could take longer than we anticipate or could ultimately fail to succeed in commercialization for any of the following reasons:
|
|
· |
our traits may not be successfully validated in one or more target crops; |
|
|
· |
our traits may not have the desired effect sought by our collaborators in the relevant crop or geography, or under certain environmental conditions; |
|
|
· |
relevant milestones under our agreements with collaborators may not be achieved; and |
|
|
· |
we or our collaborators may be unable to complete the regulatory process for the products containing our traits. |
If products containing our traits are never commercialized, or are commercialized on a slower timeline than we anticipate, our ability to generate revenues and become profitable, as well as our longterm growth strategy, would be materially and adversely affected.
Even if we or our collaborators are successful in developing commercial products that incorporate our traits, such products may not achieve commercial success.
Our longterm growth strategy is dependent upon our or our collaborators’ ability to incorporate our traits into a wide range of crops with global scope. Even if we or our collaborators are able to develop commercial products that incorporate our traits, any such products may not achieve commercial success as quickly as we project, or at all, for one or more of the following reasons, among others:
|
|
· |
products may fail to be effective in particular crops, geographies, or circumstances, limiting their commercialization potential; |
|
|
· |
our competitors may launch competing or more effective traits or products; |
|
|
· |
the market for abiotic seed traits is evolving and not well established, and the market opportunities for any product we or our collaborators develop may be smaller than we or our collaborators believe; |
|
|
· |
as we do not have a sales or marketing infrastructure for our agricultural yield traits, we depend entirely on our collaborators to commercialize our products, and they may fail to devote the necessary resources and attention to sell, market, and distribute our current or any future products effectively; |
|
|
· |
significant fluctuations in market prices for agricultural inputs and crops could have an adverse effect on the value of our traits; |
|
|
· |
farmers are generally cautious in their adoption of new products and technologies, with conservative initial purchases and proof of product required prior to widespread deployment, and accordingly, it may take several growing seasons for farmers to adopt our or our collaborators’ products on a large scale; |
|
|
· |
farmers may reuse certain nonhybrid GM seeds from prior growing seasons in violation of applicable seed license agreements; |
|
|
· |
our collaborators may not be able to produce highquality seeds in sufficient amounts to meet demand; and |
|
|
· |
our collaborators may decide, for whatever reason, not to commercialize products containing our traits. |
29
Our financial condition and results of operations could be materially and adversely affected if any of the above were to occur.
Our product development cycle is lengthy and uncertain, and we may never earn revenues from the sale of products containing our traits.
Research and development in the seed, agricultural biotechnology, and larger agriculture industries is expensive and prolonged and entails considerable uncertainty. We and our collaborators may spend many years and dedicate significant financial and other resources, including the proceeds from our recent initial public offering, developing traits that will never be commercialized. The process of discovering, developing, and commercializing a seed trait through either genetic modification or advanced breeding involves multiple phases, and it may require from six to thirteen years or more from discovery to commercialization. The length of the process may vary depending on one or more of the complexity of the trait, the particular crop, and the intended geographical market involved. This long product development cycle is in large part attributable to the naturedriven breeding period for a commercial product, as well as a lengthy regulatory process.
There are currently more than 40 products in development incorporating our traits, each of which consists of the application of a specific seed trait to a specific crop. Although our Sonova products are on the market currently, we expect that it will take several years before the first products containing our agricultural yield traits complete the development process and become commercially available. However, we have little to no certainty as to which, if any, of these products will eventually reach commercialization in this timeframe or at all. Because of the long product development cycle and the complexities and uncertainties associated with agricultural biotechnology research, there is significant uncertainty as to whether we will ever generate revenues from the sale of products containing one of our traits and, even if such products reach commercialization, any resulting revenues may come at a later time than we currently anticipate.
We have a history of significant losses, which we expect to continue, and we may never achieve or maintain profitability.
We have incurred significant net losses since our formation in 2002 and expect to continue to incur net losses for the foreseeable future. We incurred a net loss of $18.0 million and $18.3 million for the years ended December 31, 2015 and 2014, respectively. As of December 31, 2015, we had an accumulated deficit of $131.9 million. We expect to continue to incur losses until we begin generating revenues from our collaborators’ sale of products containing traits we are currently developing, which we expect will not occur for several years, if at all. Because we have incurred and will continue to incur significant costs and expenses for these efforts before we obtain any incremental revenues from the sale of seeds incorporating our traits, our losses in future periods could be even more significant. In addition, we may find our development efforts are more expensive than we anticipate or that they do not generate revenues in the time period we anticipate, which would further increase our losses. If we are unable to adequately control the costs associated with operating our business, including costs of development and commercialization of our traits, our business, financial condition, operating results, and prospects will suffer.
In addition, our ability to generate meaningful revenues and achieve and maintain profitability depends on our ability, alone or with strategic collaborators, to successfully complete the development of and complete the regulatory process to commercialize our traits. Most of our revenues since inception have consisted of upfront and milestone payments associated with our contract research and license agreements. Additional revenues from these agreements are largely dependent on successful development of our traits by us or our collaborators. To date, we have not generated any significant revenues from product sales other than from our Sonova products, and we do not otherwise anticipate generating revenues from product sales other than from sales of our Sonova products for the next several years. If products containing our traits fail to achieve market acceptance or generate significant revenues, we may never become profitable.
30
We may require additional financing in the future and may not be able to obtain such financing on favorable terms, if at all, which could force us to delay, reduce, or eliminate our research and development activities.
We will continue to need capital to fund our research and development projects and to provide working capital to fund other aspects of our business. If our capital resources are insufficient to meet our capital requirements, we will have to raise additional funds. If future financings involve the issuance of equity securities, our existing stockholders would suffer dilution. If we are able to raise additional debt financing, which will require the consent of our current debt holder, we may be subject to additional restrictive covenants that limit our operating flexibility. We may not be able to raise sufficient additional funds on terms that are favorable to us, if at all. If we fail to raise sufficient funds and continue to incur losses, our ability to fund our operations, take advantage of strategic opportunities, develop and commercialize products or technologies, or otherwise respond to competitive pressures could be significantly limited. If this happens, we may be forced to delay or terminate research and development programs or the commercialization of products, or curtail operations. If adequate funds are not available, we will not be able to successfully execute on our business strategy or continue our business.
If ongoing or future field trials by us or our collaborators are unsuccessful, we may be unable to complete the regulatory process for, or commercialize, our products in development on a timely basis.
The successful completion of field trials in United States and foreign locations is critical to the success of product development and marketing efforts for products containing our traits. If our ongoing or future field trials, or those of our collaborators, are unsuccessful or produce inconsistent results or unanticipated adverse effects on crops or on nontarget organisms, or if we or our collaborators are unable to collect reliable data, regulatory review of products in development containing our traits could be delayed or commercialization of products in development containing our traits may not be possible. In addition, more than one growing season may be required to collect sufficient data to develop or market a product containing our traits, and it may be necessary to collect data from different geographies to prove performance for customer adoption. Even in cases where field trials are successful, we cannot be certain that additional field trials conducted on a greater number of acres, or in different crops or geographies, will be successful. Generally, our collaborators conduct these field trials or we pay third parties, such as farmers, consultants, contractors, and universities, to conduct field trials on our behalf. Poor trial execution or data collection, failure to follow required agronomic practices, regulatory requirements, or mishandling of products in development by our collaborators or these third parties could impair the success of these field trials.
Many factors that may adversely affect the success of our field trials are beyond our control, including weather and climatic variations, such as drought or floods, severe heat or frost, hail, tornadoes and hurricanes, uncommon pests and diseases, or acts of protest or vandalism. For example, if there was prolonged or permanent disruption to the electricity, climate control, or water supply operating systems in our greenhouses or laboratories, the crops in which we or our collaborators are testing our traits and the samples we or our collaborators store in freezers, both of which are essential to our research and development activities, could be severely damaged or destroyed, adversely affecting these activities and thereby our business and results of operations. Unfavorable weather conditions can also reduce both acreage planted and incidence, or timing of, certain crop diseases or pest infestations, each of which may halt or delay our field trials. We have also experienced crop failures in the past for thenunknown reasons, causing delays in our achievement of milestones and delivery of results and necessitating that we repeat the impacted field trials. Any field test failure we may experience may not be covered by insurance and, therefore, could result in increased cost for the field trials and development of our traits, which may negatively impact our business and results of operations. Additionally, we are subject to U.S. Department of Agriculture, or USDA, regulations, which may require us to abandon a field trial or to purchase and destroy neighboring crops that are planted after our field trials have commenced. For example, while conducting early field trials for GLA safflower oil, we were forced to purchase and destroy an adjacent safflower crop when the placement of bee hives by a third party altered the required isolation distance between our crop and the neighboring crop, requiring us to either purchase and destroy the adjacent crop or abandon our field trial. In order to prevent the significant delays that would result from terminating our field trial, we decided to purchase and destroy the neighboring crop at a cost of approximately $30,000. Similar factors outside of our control can create substantial volatility relating to our business and results of operations.
31
Competition in traits and seeds is intense and requires continuous technological development, and, if we are unable to compete effectively, our financial results will suffer.
We face significant competition in the markets in which we operate. The markets for traits and agricultural biotechnology products are intensely competitive and rapidly changing. In most segments of the seed and agricultural biotechnology market, the number of products available to consumers is steadily increasing as new products are introduced. At the same time, the expiration of patents covering existing products reduces the barriers to entry for competitors. We may be unable to compete successfully against our current and future competitors, which may result in price reductions, reduced margins and the inability to achieve market acceptance for products containing our traits. In addition, several of our competitors have substantially greater financial, marketing, sales, distribution, research and development, and technical resources than us, and some of our collaborators have more experience in research and development, regulatory matters, manufacturing, and marketing. We anticipate increased competition in the future as new companies enter the market and new technologies become available. Our technologies may be rendered obsolete or uneconomical by technological advances or entirely different approaches developed by one or more of our competitors, which will prevent or limit our ability to generate revenues from the commercialization of our traits being developed.
We derive a significant portion of our current revenues from government agencies, which may not continue in the future and which may expose us to government audits and potential penalties.
We historically have derived a significant portion of our revenues from grants from U.S. government agencies. Our ability to obtain grants is subject to the availability of funds under applicable government programs and approval of our applications to participate in such programs. The application process for these grants is highly competitive. We may not be successful in obtaining any additional grants. Once we successfully obtain a grant, the awarding U.S. government agency has the right to discontinue funding on such a grant at any time. The recent political focus on reducing spending at the U.S. federal and state levels may reduce the scope and amount of funds dedicated to seed and agricultural biotechnology innovations, if such funds continue to be available at all. To the extent that we are unsuccessful in obtaining any additional government grants in the future or if funding is discontinued on an existing grant, we would lose a significant source of our current revenues.
To the extent that we do not comply with the specific requirements of a grant, our expenses incurred may not be reimbursed and any of our existing grants or new grants that we may obtain in the future may be terminated or modified. In addition, our activities funded by our government grants may be subject to audits by U.S. government agencies. As part of an audit, these agencies may review our performance, cost structures and compliance with applicable laws, regulations and standards, and the terms and conditions of the grant. An audit could result in a material adjustment to our results of operations and financial condition. Moreover, if an audit uncovers improper or illegal activities, we may also be subject to civil and criminal penalties and administrative sanctions, including termination of contracts, forfeiture of profits, suspension of payments, or fines, and we may be suspended or prohibited from doing business with the government. In addition, serious reputational harm or significant adverse financial effects could occur if allegations of impropriety are made against us, even if we are ultimately found to have done no wrong.
A significant portion of our revenues to date are from a limited number of strategic collaborations, and the termination of these collaborations would have a material adverse effect on our results of operations.
We derive a substantial amount of our revenues from a limited number of strategic collaborations, under which we generate revenues through licensing arrangements such as research and development payments, upfront payments, milestone payments, and, once a product is commercialized, a portion of the commercial value of the trait. A small number of commercial partners are expected to continue to account for a substantial amount of our revenues for the next several years, most notably among them, Mahyco. Our agreements with Mahyco are terminable by Mahyco at will upon 90 days’ notice. The termination or nonrenewal of our arrangements with Mahyco or our other commercial partners would have a material adverse effect on our business, financial condition, results of operations, and prospects.
32
We expect to derive a substantial portion of our future revenues from commercial products sold outside the United States, which subjects us to additional business risks.
A significant number of our research and collaboration agreements include products under development for markets outside the United States. Our collaborators’ operations in these regions are subject to a variety of risks, including different regulatory requirements, uncertainty of contract and intellectual property rights, unstable political and regulatory environments, economic and fiscal instability, tariffs and other import and trade restrictions, restrictions on the ability to repatriate funds, business cultures accepting of various levels of corruption, and the impact of anticorruption laws. These risks could result in additional cost, loss of materials, and delays in our commercialization timeline in international markets and have a negative effect on our operating results.
Revenues generated outside the United States could also be subject to increased difficulty in collecting delinquent or unpaid accounts receivables, adverse tax consequences, currency and exchange rate fluctuations, relatively high inflation, exchange control regulations, and governmental pricing directives. Acts of terror or war may impair our ability to operate in particular countries or regions and may impede the flow of goods and services between countries. Customers in these and other markets may be unable to purchase our products if their economies deteriorate, or it could become more expensive for them to purchase imported products in their local currency or sell their commodities at prevailing international prices, and we may be unable to collect receivables from such customers. If any of these risks materialize, our results of operations and profitability could be harmed.
We or our collaborators may fail to perform our respective obligations under contract research and collaboration agreements.
We are obligated under certain contract research agreements to perform research activities over a particular period of time. If we fail to perform our obligations under these agreements, in some cases our collaborators may terminate our agreements with them and in other cases our collaborators’ obligations may be reduced and, as a result, our anticipated revenues may decrease. In addition, any of our collaborators may fail to perform their obligations under the diligence timelines in our collaboration agreements, which may delay development and commercialization of products containing our traits and materially and adversely affect our future results of operations.
Furthermore, the various payments we receive from our collaborators are a significant source of our current revenues and are expected to be the largest source of our revenues in the future. If our collaborators do not make these payments, either due to financial hardship, disagreement as to whether such payments are owed under the relevant collaboration agreement, or for any other reason, our results of operations and business could be materially and adversely affected. If disagreements with a collaborator arise, any dispute with such collaborator may negatively affect our relationship with one or more of our other collaborators and may hinder our ability to enter into future collaboration agreements, each of which could negatively impact our business and results of operations.
Our prospects for successful development and commercialization of our products are dependent upon the research, development, commercialization, and marketing efforts of our collaborators.
We primarily rely on third parties for research, development, commercialization, and marketing of our products and products in development. Other than as provided for in our collaboration agreements, we have no control over the resources, time and effort that our collaborators may devote to the development of products incorporating our traits, and have limited access to information regarding or resulting from such programs. We are dependent on our third party collaborators to fund and conduct the research and development of product candidates, to complete the regulatory process, and for the successful marketing and commercialization of one or more of such products or products in development. Such success will be subject to significant uncertainty.
33
Our ability to recognize revenues from successful collaborations may be impaired by multiple factors including:
|
|
· |
a collaborator may shift its priorities and resources away from our programs due to a change in business strategies, or a merger, acquisition, sale, or downsizing of its company or business unit; |
|
|
· |
a collaborator may cease development in a specific crop area that is the subject of a collaboration agreement; |
|
|
· |
a collaborator may change the success criteria for a particular program or product in development, thereby delaying or ceasing development of such program or product in development; |
|
|
· |
a significant delay in initiation of certain development activities by a collaborator will also delay payment of milestones tied to such activities, thereby impacting our ability to fund our own activities; |
|
|
· |
a collaborator could develop or acquire a product that competes, either directly or indirectly, with our current products or any future products; |
|
|
· |
a collaborator with commercialization obligations may not commit sufficient financial or human resources to the marketing, distribution, or sale of a product; |
|
|
· |
a collaborator with manufacturing responsibilities may encounter regulatory, resource, or quality issues and be unable to meet demand requirements; |
|
|
· |
a collaborator may exercise its rights under the agreement to terminate our collaboration; |
|
|
· |
a dispute may arise between us and a collaborator concerning the development and commercialization of a product in development, resulting in a delay in milestones, royalty payments, or termination of a program and possibly resulting in costly litigation or arbitration that may divert management attention and resources; |
|
|
· |
a collaborator may not adequately protect the intellectual property rights associated with a product or product in development; and |
|
|
· |
a collaborator may use our proprietary information or intellectual property in such a way as to expose us to litigation from a third party. |
If our collaborators do not perform in the manner we expect or fulfill their responsibilities in a timely manner, or at all, the development, regulatory, and commercialization process could be delayed, terminated, or otherwise unsuccessful. Conflicts between us and our collaborators may arise. In the event of termination of one or more of our collaboration agreements, it may become necessary for us to assume the responsibility for any terminated products or products in development at our own expense or seek new collaborators. In that event, we likely would be required to limit the size and scope of one or more of our independent programs or increase our expenditures and seek additional funding, which may not be available on acceptable terms or at all, and our business may be materially and adversely affected.
We rely on third parties to conduct, monitor, support, and oversee field trials and, in some cases, to maintain regulatory files for those products in development, and any performance issues by third parties, or our inability to engage third parties on acceptable terms, may impact our or our collaborators’ ability to complete the regulatory process for or commercialize such products.
We rely on third parties, including farmers, to conduct, monitor, support, and oversee field trials. As a result, we have less control over the timing and cost of these trials than if we conducted these trials with our own personnel. If we are unable to maintain or enter into agreements with these third parties on acceptable terms, or if any such engagement is terminated prematurely, we may be unable to conduct and complete our trials in the manner we anticipate. In addition, there is no guarantee that these third parties will devote adequate time and resources to our studies or perform as required by our contract or in accordance with regulatory requirements, including maintenance of field trial information regarding our products in development. If these third parties fail to meet expected deadlines, fail to transfer to us any regulatory information in a timely manner, fail to adhere to protocols, or fail to act in accordance with regulatory requirements or our agreements with them, or if they otherwise perform
34
in a substandard manner or in a way that compromises the quality or accuracy of their activities or the data they obtain, then field trials of our products in development may be extended or delayed with additional costs incurred, or our data may be rejected by the USDA, the U.S. Food and Drug Administration, or FDA, the U.S. Environmental Protection Agency, or EPA, or other regulatory agencies. Ultimately, we are responsible for ensuring that each of our field trials is conducted in accordance with the applicable protocol, legal, regulatory and scientific standards, and our reliance on third parties does not relieve us of our responsibilities.
If our relationship with any of these third parties is terminated, we may be unable to enter into arrangements with alternative parties on commercially reasonable terms, or at all. Switching or adding farmers or other suppliers can involve substantial cost and require extensive management time and focus. In addition, there is a natural transition period when a new farmer or other third party commences work. As a result, delays may occur, which can materially impact our ability to meet our desired development timelines. If we are required to seek alternative supply arrangements, the resulting delays and potential inability to find a suitable replacement could materially and adversely impact our business.
In addition, recently there has been an increasing trend towards consolidation in the agricultural biotechnology industry. For example, in April 2015, DuPont acquired Taxon Biosciences. Other potential transactions, such as Syngenta’s proposed takeover by ChemChina and the proposed merger of Dow and DuPont, would further consolidate our industry if consummated. Consolidation among our competitors and third parties upon whom we rely could lead to a changing competitive landscape, capabilities, and market share allocations, which could have an adverse effect on our business and operations.
Most of our collaborators have significant resources and development capabilities and may develop their own products that compete with or negatively impact the advancement or sale of products containing our traits.
Most of our collaborators are significantly larger than us and may have substantially greater resources and development capabilities. As a result, we are subject to competition from many of our collaborators, who could develop or pursue competing products and traits that may ultimately prove more commercially viable than our traits. In addition, former collaborators, by virtue of having had access to our proprietary technology, may utilize this insight for their own development efforts, despite the fact that our collaboration agreements prohibit such use. The development or launch of a competing product by a collaborator may adversely affect the advancement and commercialization of any traits we develop and any associated research and development and milestone payments and valuesharing payments we receive from the sale of products containing our traits.
Our joint venture agreements could present a number of challenges that may have a material adverse effect on our business, financial condition, and results of operations.
We currently participate in two joint ventures, Limagrain Cereal Seeds LLC, which focuses on the development and commercialization of improved wheat seeds, and Verdeca LLC, which focuses on the development and deregulation of soybean traits, and we may enter into additional joint ventures in the future. Our joint venture arrangements may present financial, managerial, and operational challenges, including potential disputes, liabilities, or contingencies and may involve risks not otherwise present when operating independently, including:
|
|
· |
our joint venture partners may have business interests, goals, or cultures that are or become inconsistent with our business interests, goals, or culture; |
|
|
· |
our joint venture partners may share certain approval rights, or in some cases, as with Limagrain Cereal Seeds LLC, have control over major decisions; |
|
|
· |
our joint venture partners may not pay their share of the joint venture’s obligations, potentially leaving us liable for their share of such obligations, or we may be unable to pay our share of the joint venture’s obligations, which may result in a reduction of our ownership interest; |
|
|
· |
we may incur liabilities or losses as a result of an action taken by the joint venture or our joint venture partners; |
35
|
|
· |
disputes between us and our joint venture partners may result in delays, litigation, or operational impasses. |
The risks described above or the failure to continue any joint venture or joint development arrangement or to resolve disagreements with our current or future joint venture partners could materially and adversely affect our ability to transact the business that is the subject of such joint venture, which would in turn negatively affect our financial condition and results of operations.
We and our collaborators may disagree over our right to receive payments under our collaboration agreements, potentially resulting in costly litigation and loss of reputation.
Our ability to receive payments under our collaboration agreements depends on our ability to clearly delineate our rights under those agreements. We typically license our intellectual property to our collaborators, who then develop and commercialize seeds with improved traits. However, a collaborator may use our intellectual property without our permission, dispute our ownership of certain intellectual property rights, or argue that our intellectual property does not cover, or add value to, their marketed product. If a dispute arises, it may result in costly patent office procedures and litigation, and our collaborator may refuse to pay us while the dispute is ongoing. Furthermore, regardless of any resort to legal action, a dispute with a collaborator over intellectual property rights may damage our relationship with that collaborator and may also harm our reputation in the industry.
Even if we are entitled to payments from our collaborators, we may not actually receive these payments, or we may experience difficulties in collecting the payments to which we believe we are entitled. After our collaborators launch commercial products containing our licensed traits, we will need to rely on the good faith of our collaborators to report to us the sales they earn from these products and to accurately calculate the payments we are entitled to, a process that will involve complicated and difficult calculations. Although we seek to address these concerns in our collaboration agreements by reserving our right to audit financial records, such provisions may not be effective.
Our business is subject to various government regulations and if we or our collaborators are unable to timely complete the regulatory process for our products in development, our or our collaborators’ ability to market our traits could be delayed, prevented or limited.
Our business is generally subject to two types of regulations: regulations that apply to how we and our collaborators operate and regulations that apply to products containing our traits. We apply for and maintain the regulatory permits necessary for our operations, particularly those covering our field trials, while we or our collaborators apply for and maintain regulatory approvals necessary for the commercialization of products containing our seed traits. The largescale field trials that our collaborators conduct during advanced stages of product development are subject to regulations similar to those to which we are subject. Even if we and our collaborators make timely and appropriate applications for regulatory permits for our field trials, government delays in issuing such permits can significantly affect the development timelines for our products, particularly if the planting period for a crop growing season expires before the necessary permits are obtained. For example, our collaborator in India has encountered delays in obtaining necessary regulatory permits for field trials, and these delays are expected to negatively impact the commercialization timelines for certain of our products. Pursuant to our collaboration agreements, our collaborators also apply for the requisite regulatory approvals prior to commercialization of products containing our traits. In most of our key target markets, regulatory approvals must be received prior to the importation of genetically modified products. These regulatory processes may be complex; for example, the U.S. federal government’s regulation of biotechnology is divided among the EPA, which regulates activity related to the use of plant pesticides and herbicides, the USDA, which regulates the import, field testing, and interstate movement of specific technologies that may be used in the creation of genetically modified plants, and the FDA, which regulates foods derived from new plant varieties.
36
In addition to regulation by the U.S. government, products containing our biotech traits may be subject to regulation in each country in which such products are tested or sold. International regulations may vary from country to country and from those of the United States. The difference in regulations under U.S. law and the laws of foreign countries may be significant and, in order to comply with the laws of foreign countries, we may have to implement global changes to our products or business practices. Such changes may result in additional expense to us and either reduce or delay product development or sales. Additionally, we or our collaborators may be required to obtain certifications or approvals by foreign governments to test and sell the products in foreign countries.
The regulatory process is expensive and timeconsuming, and the time required to complete the process is difficult to predict and depends upon numerous factors, including the substantial discretion of the regulatory authorities. Other than our Sonova products and Stress Tolerant soybeans in Argentina through Verdeca, our joint venture with Bioceres, Inc., neither we nor our collaborators have completed all phases of the regulatory process for any of our products in development. Our traits could require a significantly longer time to complete the regulatory process than expected, or may never gain approval, even if we and our collaborators expend substantial time and resources seeking such approval. A delay or denial of regulatory approval could delay or prevent our ability to generate revenues and to achieve profitability. For example, we are currently awaiting completion of the regulatory process for one of our Sonova products to be used in pet food, which has taken longer than expected. Changes in regulatory review policies during the development period of any of our traits, changes in, or the enactment of, additional regulations or statutes, or changes in regulatory review practices for a submitted product application may cause a delay in obtaining approval or result in the rejection of an application for regulatory approval. Regulatory approval, if obtained, may be made subject to limitations on the indicated uses for which we or our collaborators may market a product. These limitations could adversely affect our potential revenues. Failure to comply with applicable regulatory requirements may, among other things, result in fines, suspensions of regulatory approvals, product recalls, product seizures, operating restrictions, and criminal prosecution. We have on certain occasions notified the USDA of instances of noncompliance with regulations. Although these occasions did not result in any enforcement actions, we may have occasions of noncompliance in the future that result in USDA or other governmental agency enforcement action.
Consumer resistance to genetically modified organisms may negatively affect our public image and reduce sales of seeds containing our traits.
We are active in the field of agricultural biotechnology research and development in seeds and crop protection, including GM seeds. Foods made from such seeds are not accepted by many consumers due to concerns over such products’ effects on food safety and the environment. The high public profile of biotechnology in food production and lack of consumer acceptance of products to which we have devoted substantial resources could negatively affect our public image and results of operations. The current resistance from consumer groups, particularly in Europe, to GM crops not only limits our access to such markets, but also has the potential to spread to and influence the acceptance of products developed through biotechnology in other regions of the world. For example, we have temporarily suspended certain initiatives in response to recent legislative requirements in Vermont related to labeling of food products containing GM ingredients until such time as we determine that there is clarity and uniformity in nationwide food labeling requirements. Certain labelingrelated initiatives have heightened consumer awareness of GM crops generally and may make consumers less likely to purchase food products containing GM ingredients, which could have a negative impact on the commercial success of products that incorporate our traits and materially and adversely affect our financial condition and results of operations.
37
Governmental restrictions on the testing and production of GM crops may negatively affect our business and results of operations.
The production of certain GM crops is effectively prohibited in certain countries, including throughout the European Union, which limits our commercial opportunities and may influence regulators in other countries to limit or ban the testing or production of GM crops. Our GM crops are grown principally in North America, South America, India and Australia, where there are fewer restrictions on the production of GM crops. If these or other countries where our GM crops are grown enact laws or regulations that ban the production of such crops or make regulations more stringent, we could experience a longer product development cycle for our products, encounter difficulty obtaining intellectual property protection, and may even have to abandon projects related to certain crops or geographies, any of which would negatively affect our business and results of operations. Furthermore, any changes in such laws and regulations or consumer acceptance of our GM crops could negatively impact our collaborators, who in turn might terminate or reduce the scope of their collaborations with us or seek to alter the financial terms of our agreements with them.
Changes in laws and regulations to which we are subject, or to which we may become subject in the future, may materially increase our costs of operation, decrease our operating revenues, and disrupt our business.
Laws and regulatory standards and procedures that impact our business are continuously changing. Responding to these changes and meeting existing and new requirements may be costly and burdensome. Changes in laws and regulations could:
|
|
· |
impair or eliminate our ability, or increase our cost, to develop our traits, including validating our products in development through field trials; |
|
|
· |
increase our compliance and other costs of doing business through increases in the cost to patent or otherwise protect our intellectual property or increases in the cost to our collaborators to complete the regulatory process to commercialize and market the products we develop with them; |
|
|
· |
render any products less profitable, obsolete, or less attractive compared to competing products; |
|
|
· |
affect our collaborators’ willingness to do business with us; |
|
|
· |
reduce the amount of revenues we receive from our collaborators; and |
|
|
· |
discourage our collaborators from offering, and consumers from purchasing, products that incorporate our traits. |
Any of these events could have a material adverse effect on our business, results of operations, and financial condition. Legislators and regulators have increased their focus on plant biotechnology in recent years, with particular attention paid to GM crops.
Our future growth relies on the ability of our collaborators to commercialize and market our products in development, and any restrictions on such activities could materially and adversely impact our business and results of operations. Any changes in regulations in countries where GM crops are grown or imported could result in our collaborators being unable or unwilling to develop, commercialize, or sell products that incorporate our traits. Any changes to these existing laws and regulations may also materially increase our costs of operation, decrease our operating revenues, and disrupt our business.
The unintended presence of our traits in other products or plants may negatively affect us.
Trace amounts of our traits may unintentionally be found outside our containment area in the products of third parties, which may result in negative publicity and claims of liability brought by such third parties against us. Furthermore, in the event of an unintended dissemination of our genetically engineered materials to the environment or the presence of unintended but unavoidable trace amounts, sometimes called “adventitious presence,” of our traits in conventional seed, or in the grain or products produced from conventional or organic crops, we could be subject to claims by multiple parties, including environmental advocacy groups, as well as governmental actions such as mandated crop destruction, product recalls, or additional stewardship practices and environmental cleanup or monitoring.
38
Loss of or damage to our germplasm collection would significantly slow our product development efforts.
We have developed and maintain a comprehensive collection of germplasm through strategic collaborations with leading institutions, which we utilize in our nonGM programs. Germplasm comprises collections of genetic resources covering the diversity of a crop, the attributes of which are inherited from generation to generation. Germplasm is a key strategic asset since it forms the basis of seed development programs. To the extent that we lose access to such germplasm because of the termination or breach of our collaboration agreements, our product development capabilities would be severely limited. In addition, loss of or damage to these germplasm collections would significantly impair our research and development activities. Although we restrict access to our germplasm at our research facilities to protect this valuable resource, we cannot guarantee that our efforts to protect our germplasm collection will be successful. The destruction or theft of a significant portion of our germplasm collection would adversely affect our business and results of operations.
We depend on our key personnel and, if we are not able to attract and retain qualified scientific and business personnel, we may not be able to grow our business or develop and commercialize our products.
Our future performance depends on the continued services and contributions of our management team and other key employees, the loss of whose services might significantly delay or prevent the achievement of our scientific or business objectives. The replacement of any member of our management team would involve significant time and costs and such loss could significantly delay or prevent the achievement of our business objectives. Many members of our executive team have been our employees for many years and therefore have significant experience and understanding of our business that would be difficult to replace.
Additionally, the vast majority of our workforce is involved in research, development, and regulatory activities. Our business is therefore dependent on our ability to recruit and maintain a highly skilled and educated workforce with expertise in a range of disciplines, including molecular biology, biochemistry, plant genetics, agronomics, mathematics, agribusiness, and other subjects relevant to our operations. All of our current employees are atwill employees, and the failure to retain or hire skilled and highly educated personnel could limit our growth and hinder our research and development efforts.
Many of our employees have become vested in a substantial number of stock options. Our employees may be more likely to leave us if the shares they own or the shares underlying their vested options have significantly appreciated in value relative to the original purchase prices of the shares or the exercise prices of the options.
Our business is subject to the risks of earthquakes, fire, flood, and other catastrophic natural events, and security breaches, including cybersecurity incidents.
Our headquarters, certain research and development operations and our seed storage warehouse are located in Davis, California. We also conduct certain research and development operations and store certain biomaterials in Seattle, Washington. The safflower grain used in the production of our Sonova products is grown in several locations throughout Idaho and is stored in a single facility in Idaho. Our production of our Sonova products takes place at a single facility in Northern California, and the inventory is stored in a single cold storage facility in Northern California. We take precautions to safeguard our facilities, including insurance, health and safety protocols, and offsite storage of critical research results and computer data. However, a natural disaster, such as a fire, flood, or earthquake, could cause substantial delays in our operations, damage or destroy our equipment, inventory, or development projects, and cause us to incur additional expenses. The insurance we maintain against natural disasters may not be adequate to cover our losses in any particular case.
We utilize and critically rely upon information technology systems in all aspects of our business, including increasingly large amounts of data to support our products and advance our research and development. Failure to effectively prevent, detect, and recover from the increasing number and sophistication of information security threats could result in theft, misuse, modification, and destruction of information, including trade secrets and confidential business information, and cause business disruptions, delays in research and development, and reputational damage, which could significantly affect our results of operations and financial condition.
39
Disruption to our IT system could adversely affect our reputation and have a material adverse effect on our business and results of operations.
Our technologies rely on our IT system to collect and analyze our genomic data, including TILLING and other experimental data, and manage our plant inventory system, which tracks every plant that we have ever produced. We can provide no assurance that our current IT system is fully protected against thirdparty intrusions, viruses, hacker attacks, information, or data theft, or other similar threats. Furthermore, we store significant amounts of data and, though we are developing backup storage for our stored data, we cannot assure you that our backup storage arrangements will be effective if it becomes necessary to rely on them.
If our IT system does not function properly or proves incompatible with new technologies, we could experience interruptions in data transmissions and slow response times, preventing us from completing routine research and business activities. Furthermore, disruption or failure of our IT system due to technical reasons, natural disaster, or other unanticipated catastrophic events, including power interruptions, storms, fires, floods, earthquakes, terrorist attacks, and wars could significantly impair our ability to deliver data related to our projects to our collaborators on schedule and materially and adversely affect the outcome of our collaborations, our relationships with our collaborators, our business, and our results of operations.
Our use of hazardous materials exposes us to potential liabilities.
Certain of our operations involve the storage and controlled use of hazardous materials, including herbicides and pesticides. This requires us to conduct our operations in compliance with applicable environmental and safety standards, and we cannot completely eliminate the risk of accidental contamination from hazardous materials. In the event of such contamination, we may be held liable for significant damages or fines, which could have a material adverse effect on our business and operating results.
Most of the licenses we grant to our collaborators to use our proprietary genes in certain crops are exclusive within certain jurisdictions, which limits our licensing opportunities.
Most of the licenses we grant our collaborators to use our proprietary genes in certain crops are exclusive within specified jurisdictions, so long as our collaborators comply with certain diligence requirements. That means that once genes are licensed to a collaborator in a specified crop or crops, we are generally prohibited from licensing those genes to any third party. The limitations imposed by these exclusive licenses could prevent us from expanding our business and increasing our product development initiatives with new collaborators, both of which could adversely affect our business and results of operations.
Our business model for discovery of genes is dependent on licensing patent rights from third parties, and any disruption of this licensing process could adversely affect our competitive position and business prospects.
Our business model involves acquiring technologies that have achieved proof of concept through rigorous development and testing by thirdparty basic researchers in order to avoid the significant risks and high costs associated with basic research. Only a small number of the genes we evaluate for acquisition are likely to provide viable commercial candidates and an even more limited number, if any, are likely to be commercialized by us or our collaborators. A failure by us to continue identifying genes that improve specific crop traits could make it difficult to grow our business. If we are unable to identify additional genes, we may be unable to develop new traits, which may negatively impact our ability to generate revenues.
If we are unable to enter into licensing arrangements to acquire rights to these potentially viable genes on favorable terms in the future, it may adversely affect our business. In addition, if the owners of the patents we license do not properly maintain or enforce the patents underlying such licenses, our competitive position and business prospects could be harmed. Without protection for the intellectual property we license, other companies might be able to offer substantially similar or identical products for sale, which could adversely affect our competitive business position and harm our business prospects.
40
If we fail to comply with our obligations under license agreements, our counterparties may have the right to terminate these agreements, in which event we may not be able to develop, manufacture, register, or market, or may be forced to cease developing, manufacturing, registering, or marketing, any product that is covered by these agreements or may face other penalties under such agreements. Such an occurrence could materially adversely affect the value of the applicable products to us and have an adverse effect on our business and result of operations.
Our success depends on our ability to protect our intellectual property and our proprietary technologies.
Our commercial success depends, in part, on our ability to obtain and maintain patent and trade secret protection for our proprietary technologies, our traits, and their uses, as well as our ability to operate without infringing upon the proprietary rights of others. If we do not adequately protect our intellectual property, competitors may be able to use our technologies and erode or negate any competitive advantage we may have, which could harm our business and ability to achieve profitability.
If we are unable to protect the confidentiality of our trade secrets, the value of our technology could be materially and adversely affected and our business could be harmed.
We treat our proprietary technologies, including unpatented knowhow and other proprietary information, as trade secrets. We seek to protect these trade secrets, in part, by entering into nondisclosure and confidentiality agreements with any third parties who have access to them, such as our consultants, independent contractors, advisors, corporate collaborators, and outside scientific collaborators. We also enter into confidentiality and invention or patent assignment agreements with employees and certain consultants. Any party with whom we have executed such an agreement could breach that agreement and disclose our proprietary information, including our trade secrets, and we may not be able to obtain adequate remedies for such breaches. Enforcing a claim that a party illegally disclosed or misappropriated a trade secret is difficult, expensive, and time consuming, and the outcome is unpredictable. In addition, if any of our trade secrets were to be lawfully obtained or independently developed by a competitor, we would have no right to prevent such third party, or those to whom they communicate such technology or information, from using that technology or information to compete with us. If any of our trade secrets were to be disclosed to or independently developed by a competitor, or if we otherwise lose protection for our trade secrets or proprietary knowhow, the value of this information may be greatly reduced and our business and competitive position could be harmed.
Changes in U.S. patent law could diminish the value of patents in general, thereby impairing our ability to protect our products in development.
As an agricultural biotechnology company, our success is heavily dependent on intellectual property, particularly patents. Obtaining and enforcing patents involves technological and legal complexity, and is costly, time consuming, and inherently uncertain. In addition, the U.S. Supreme Court has ruled on several patent cases in recent years, either narrowing the scope of patent protection available in certain circumstances or weakening the rights of patent owners in certain situations. In addition to increasing uncertainty with regard to our ability to obtain patents in the future, this combination of events has created uncertainty with respect to the value of patents once obtained. Depending on decisions by the U.S. Congress, the federal courts, and the U.S. Patent and Trademark Office, the laws and regulations governing patents could change in unpredictable ways that may weaken or undermine our ability to obtain new patents or to enforce our existing patents and patents we might obtain in the future.
We may not be able to protect our intellectual property rights throughout the world.
Filing, prosecuting, maintaining, and defending patents on products in development in all countries throughout the world would be prohibitively expensive, and our intellectual property rights in some countries outside the United States are less extensive than those in the United States. In addition, the laws of some foreign countries do not protect intellectual property rights to the same extent as federal and state laws in the United States. For example, several countries outside the United States prohibit patents on plants and seeds entirely. In addition, we may at times license thirdparty technologies for which limited international patent protection exists and for which the time period for filing international patent applications has passed. Consequently, we are unable to prevent third parties from using intellectual property we develop or license in all countries outside the United States, or from selling or importing products made using our intellectual property in and into the jurisdictions in which we do not have patent
41
protection. Competitors may use our technologies in jurisdictions where we have not obtained patent protection to develop their own products, and we may be unable to prevent such competitors from importing those infringing products into territories where we have patent protection, but where enforcement is not as strong as in the United States. These products may compete with our products in development and our patents and other intellectual property rights may not be effective or sufficient to prevent them from competing in those jurisdictions. Moreover, farmers or others in the chain of commerce may raise legal challenges to our intellectual property rights or may infringe upon our intellectual property rights, including through means that may be difficult to prevent or detect, and local regulators may choose to not enforce our intellectual property rights.
Many companies have encountered significant problems in protecting and defending intellectual property rights in foreign jurisdictions where we have filed patent applications. The legal systems of certain countries have not historically favored the enforcement of patents or other intellectual property rights, which could hinder us from preventing the infringement of our patents or other intellectual property rights and result in substantial risks to us. Proceedings to enforce our patent rights in the United States or foreign jurisdictions could result in substantial costs and divert our efforts and attention from other aspects of our business, could put our patents at risk of being invalidated or interpreted narrowly and our patent applications at risk of not issuing and could provoke third parties to assert patent infringement or other claims against us. We may not prevail in any lawsuits that we initiate and the damages or other remedies awarded, if any, may not be commercially meaningful or even cover our associated legal costs. Accordingly, our efforts to enforce our intellectual property rights around the world may be inadequate to obtain a significant commercial advantage from the intellectual property that we develop or license from third parties.
If we or one of our collaborators are sued for infringing the intellectual property rights of a third party, such litigation could be costly and time consuming and could prevent us or our collaborators from developing or commercializing our products.
Our ability to generate significant revenues from our products depends on our and our collaborators’ ability to develop, market and sell our products and utilize our proprietary technology without infringing the intellectual property and other rights of any third parties. In the United States and abroad there are numerous thirdparty patents and patent applications that may be applied toward our proprietary technology, business processes, or developed traits, some of which may be construed as containing claims that cover the subject matter of our products or intellectual property. Because of the rapid pace of technological change, the confidentiality of patent applications in some jurisdictions (including U.S. provisional patent applications), and the fact that patent applications can take many years to issue, there may be currently pending applications that are unknown to us that may later result in issued patents upon which our products in development or proprietary technologies infringe. Similarly, there may be issued patents relevant to our products in development of which we are not aware. These patents could reduce the value of the traits we develop or the genetically modified plants containing our traits or, to the extent they cover key technologies on which we have unknowingly relied, require that we seek to obtain licenses or cease using the technology, no matter how valuable to our business. We may not be able to obtain such a license on commercially reasonable terms. If any third party patent or patent application covers our intellectual property or proprietary rights and we are not able to obtain a license to it, we and our collaborators may be prevented from commercializing products containing our traits.
As the agricultural biotechnology industry continues to develop, we may become party to, or threatened with, litigation or other adverse proceedings regarding intellectual property or proprietary rights in our technology, processes, or developed traits. Third parties may assert claims based on existing or future intellectual property rights and the outcome of any proceedings is subject to uncertainties that cannot be adequately quantified in advance. Any litigation proceedings could be costly and time consuming, and negative outcomes could result in liability for monetary damages, including treble damages and attorneys’ fees, if we are found to have willfully infringed a patent. There is also no guarantee that we would be able to obtain a license under such infringed intellectual property on commercially reasonable terms or at all. A finding of infringement could prevent us or our collaborators from developing, marketing or selling a product or force us to cease some or all of our business operations. Even if we are successful in these proceedings, we may incur substantial costs and the time and attention of our management and scientific personnel may be diverted as a result of these proceedings, which could have a material adverse effect on us. Claims that we have misappropriated the confidential information or trade secrets of third parties could similarly have a negative impact on our business.
42
Our results of operations will be affected by the level of royalty payments that we are required to pay to third parties.
We are a party to license agreements that require us to remit royalty payments and other payments related to inlicensed intellectual property. Under our inlicense agreements, we may pay upfront fees and milestone payments and be subject to future royalties. We cannot precisely predict the amount, if any, of royalties we will owe in the future, and if our calculations of royalty payments are incorrect, we may owe additional royalties, which could negatively affect our results of operations. As our product sales increase, we may, from time to time, disagree with our thirdparty collaborators as to the appropriate royalties owed and the resolution of such disputes may be costly and may consume management’s time. Furthermore, we may enter into additional license agreements in the future, which may also include royalty, milestone and other payments.
We are subject to governmental export and import controls that could impair our ability to compete in international markets due to licensing requirements and subject us to liability if we are not in compliance with applicable laws.
Our products and products in development are subject to export control and import laws and regulations, including the U.S. Export Administration Regulations, U.S. Customs regulations, and various economic and trade sanctions regulations administered by the U.S. Treasury Department’s Office of Foreign Assets Controls. Exports of our products and technology must be made in compliance with these laws and regulations. If we fail to comply with these laws and regulations, we and certain of our employees could be subject to substantial civil or criminal penalties, including the possible loss of export or import privileges; fines, which may be imposed on us and responsible employees or managers; and, in extreme cases, the incarceration of responsible employees or managers.
In addition, changes in our products or solutions or changes in applicable export or import laws and regulations may create delays in the introduction and sale of our products and solutions in international markets, prevent our customers from deploying our products and solutions or, in some cases, prevent the export or import of our products and solutions to certain countries, governments or persons altogether. Any change in export or import laws and regulations, shift in the enforcement or scope of existing laws and regulations, or change in the countries, governments, persons or technologies targeted by such laws and regulations, could also result in decreased use of our products and solutions, or in our decreased ability to export or sell our products and solutions to existing or potential customers. Any decreased use of our products and solutions or limitation on our ability to export or sell our products and solutions would likely adversely affect our business, financial condition and results of operations.
We are subject to anticorruption and antimoney laundering laws with respect to both our domestic and international operations, and noncompliance with such laws can subject us to criminal and civil liability and harm our business.
We are subject to the U.S. Foreign Corrupt Practices Act of 1977, as amended, the U.S. domestic bribery statute contained in 18 U.S.C. § 201, the U.S. Travel Act, the USA PATRIOT Act, and possibly other antibribery and antimoney laundering laws in countries in which we conduct activities. Anticorruption laws are interpreted broadly and prohibit us and our collaborators from authorizing, offering, or directly or indirectly providing improper payments or benefits to recipients in the public or private sector. We or our collaborators may have direct and indirect interactions with government agencies and stateaffiliated entities and universities in the course of our business. We may also have certain matters come before public international organizations such as the United Nations. We use thirdparty collaborators, joint venture and strategic partners, law firms, and other representatives for regulatory compliance, patent registration, lobbying, deregulation advocacy, field testing, and other purposes in a variety of countries, including those that are known to present a high corruption risk such as India, China, and Latin American countries. We can be held liable for the corrupt or other illegal activities of these thirdparty collaborators, our employees, representatives, contractors, partners, and agents, even if we do not explicitly authorize such activities. In addition, although we have implemented policies and procedures to ensure compliance with anticorruption and related laws, there can be no assurance that all of our employees, representatives, contractors, partners, or agents will comply with these laws at all times. Noncompliance with these laws could subject us to whistleblower complaints, investigations, sanctions, settlements, prosecution, other enforcement actions, disgorgement of profits, significant fines, damages, other civil and criminal penalties or injunctions, suspension and debarment from contracting with certain governments or other persons, the loss of export privileges, reputational
43
harm, adverse media coverage, and other collateral consequences. If any subpoenas or investigations are launched, or governmental or other sanctions are imposed, or if we do not prevail in any possible civil or criminal litigation, our business, results of operations, and financial condition could be materially harmed. In addition, responding to any action will likely result in a materially significant diversion of management’s attention and resources and significant defense costs and other professional fees. Enforcement actions and sanctions could further harm our business, results of operations, and financial condition.
Adverse outcomes in future legal proceedings could subject us to substantial damages and adversely affect our results of operations and profitability.
We may become party to legal proceedings, including matters involving personnel and employment issues, personal injury, environmental matters, and other proceedings. Some of these potential proceedings could result in substantial damages or payment awards that exceed our insurance coverage. We will estimate our exposure to any future legal proceedings and establish provisions for the estimated liabilities where it is reasonably possible to estimate and where an adverse outcome is probable. Assessing and predicting the outcome of these matters will involve substantial uncertainties. Furthermore, even if the outcome is ultimately in our favor, our costs associated with such litigation may be material. Adverse outcomes in future legal proceedings or the costs and expenses associated therewith could have an adverse effect on our results of operations.
We may be required to pay substantial damages as a result of product liability claims for which insurance coverage is not available.
We are subject to product liability claims with respect to our Sonova products, and as additional products integrating our traits reach commercialization, product liability claims will increasingly be a commercial risk for our business, particularly as we are involved in the supply of biotechnological products, some of which may be harmful to humans and the environment. Product liability claims against us or our collaborators selling products that contain our traits, or allegations of product liability relating to seeds containing traits developed by us, could damage our reputation, harm our relationships with our collaborators, and materially and adversely affect our business, results of operations, financial condition, and prospects. Furthermore, while our collaboration agreements typically require that our collaborators indemnify us for the cost of product liability claims brought against us as a result of our collaborator’s misconduct, such indemnification provisions may not always be enforced, and we may receive no indemnification if our own misconduct contributed to the claims.
We may seek to expand through acquisitions of and investments in other brands, businesses, and assets. These acquisition activities may be unsuccessful or divert management’s attention.
We may consider strategic and complementary acquisitions of and investments in other agricultural biotechnology brands, businesses or other assets, and such acquisitions or investments are subject to risks that could affect our business, including risks related to:
|
|
· |
the necessity of coordinating geographically disparate organizations; |
|
|
· |
implementing common systems and controls; |
|
|
· |
integrating personnel with diverse business and cultural backgrounds; |
|
|
· |
integrating acquired manufacturing and production facilities, technology and products; |
|
|
· |
combining different corporate cultures and legal systems; |
|
|
· |
unanticipated expenses related to integration, including technical and operational integration; |
|
|
· |
increased costs and unanticipated liabilities, including with respect to registration, environmental, health and safety matters, that may affect sales and operating results; |
|
|
· |
retaining key employees; |
|
|
· |
obtaining required government and thirdparty approvals; |
|
|
· |
legal limitations in new jurisdictions; |
44
|
|
· |
issuing common stock that could dilute the interests of our existing stockholders; |
|
|
· |
spending cash and incurring debt; |
|
|
· |
assuming contingent liabilities; and |
|
|
· |
creating additional expenses. |
We may not be able to identify opportunities or complete transactions on commercially reasonable terms, or at all, or actually realize any anticipated benefits from such acquisitions or investments. Similarly, we may not be able to obtain financing for acquisitions or investments on attractive terms. In addition, the success of any acquisitions or investments also will depend, in part, on our ability to integrate the acquisition or investment with our existing operations.
We have recently experienced changes in our management team, which may cause transition problems in our business.
We recently have had significant changes in executive leadership, and more could occur. Effective February 11, 2016, Eric J. Rey resigned as our President and Chief Executive Officer, and as a member of our board of directors. In connection with Mr. Rey’s resignation, Roger Salameh, who was then serving as our Vice President of Business Development, was appointed as our Interim President and Chief Executive Officer. On February 10, 2016, Mark W. Wong resigned a member of our board of directors and as our Acting President and Chief Executive Officer, which he had been serving as effective as of January 12, 2016 while Mr. Rey took a medical leave of absence. Effective October 16, 2015, Steven F. Brandwein, who was then serving as our Vice President of Finance and Administration, was appointed as our Interim Chief Financial Officer.
As a result of the recent changes in our management team, Messrs. Salameh and Brandwein have taken on substantially more responsibility for the management of our business and our financial reporting, which has resulted in greater workload demands and could divert their attention away from certain key areas of our business. For instance, Mr. Salameh has taken on the role of Interim President and Chief Executive Officer in addition to his existing responsibilities as our Vice President of Business Development, positions that were previously filled by two persons. Disruption to our organization as a result of executive management transition could have a material adverse effect on our business, financial condition and results of operations.
We incur significant costs and devote substantial management time as a result of operating as a public company, and our management team has limited experience managing a public company.
As a public company, we incur significant legal, accounting, and other expenses that we did not incur as a private company. For example, we are subject to the reporting requirements of the Securities Exchange Act of 1934, as amended, or the Exchange Act, and are required to comply with the applicable requirements of the SarbanesOxley Act and the DoddFrank Wall Street Reform and Consumer Protection Act, as well as rules and regulations subsequently implemented by the SEC and The NASDAQ Stock Market, including the establishment and maintenance of effective disclosure and financial controls and corporate governance practices. Compliance with these requirements has increased and will continue to increase our legal and financial compliance costs and has made and will continue to make some activities more time consuming and costly. Our management and other personnel has had to and will continue to divert attention from operational and other business matters to devote substantial time to these public company requirements, which could adversely affect our business, financial condition, and operating results. While we have recently increased our resources, we may still need to hire additional accounting and financial staff with appropriate public company experience and technical accounting knowledge.
45
Most members of our management team have limited experience managing a publiclytraded company, interacting with public company investors, and complying with the increasingly complex laws pertaining to public companies. Our management team’s inexperience in dealing with these complex laws could be a significant disadvantage to us, because it is likely that an increasing amount of their time will be devoted to these activities, which may result in them spending less time on the management and growth of our company. In addition, our management team may not successfully or efficiently manage our transition to being a public company subject to significant regulatory oversight and reporting obligations under the federal securities laws and the continuous scrutiny of securities analysts and investors, which could adversely affect our business, financial condition, and operating results.
As a result of being a public company, we are obligated to develop and maintain proper and effective internal control over financial reporting. We may not complete our analysis of our internal control over financial reporting in a timely manner, or these internal controls may not be determined to be effective, which may adversely affect investor confidence in our company and, as a result, the value of our common stock.
Pursuant to Section 404 of the SarbanesOxley Act and the related rules adopted by the SEC and the Public Company Accounting Oversight Board, starting with the second annual report that we file with the SEC after the consummation of our public offering, our management will be required to report on the effectiveness of our internal control over financial reporting. In addition, once we no longer qualify as an emerging growth company under the JOBS Act and lose the ability to rely on the exemptions related thereto, our independent registered public accounting firm will also need to attest to the effectiveness of our internal control over financial reporting under Section 404. We are starting the process of determining whether our existing internal controls over financial reporting systems are compliant with Section 404. This process will require the investment of substantial time and resources, including by members of our senior management. As a result, this process may divert internal resources and take a significant amount of time and effort to complete. In addition, we cannot predict the outcome of this determination and whether we will need to implement remedial actions in order to implement effective internal control over financial reporting.
The magnitude of our recent executive management changes (described above) and the short time interval in which they have occurred could add to the risk of control failures, including a failure in the effective operation of our internal control over financial reporting or our disclosure controls and procedures. Additionally, as we hire new executives, it might take the newly constituted management team some time to become sufficiently familiar with our business and each other to effectively develop and implement our business strategies.
In connection with the preparation of our financial statements for the years ended December 31, 2015 and 2014, we identified certain internal control deficiencies that did not rise to the level of a material weakness, on an individual basis or in the aggregate. For the year ended December 31, 2014, those control deficiencies represented significant deficiencies in our internal control over financial reporting. One deficiency related to our information technology access controls and the other related to the timeliness of our accounting and disclosure procedures. We successfully remediated the deficiency relating to the timeliness of our accounting and disclosure procedures during the year ended December 31, 2014. For the year ended December 31, 2015, we did not have any control deficiencies, which on an individual basis or in the aggregate arose to the level of a significant deficiency. We are currently working to improve our internal control environment. As a result, we may experience higher than anticipated operating expenses, as well as higher auditor fees during and after the implementation of these changes. If we are unable to implement any of the required changes to our internal control over financial reporting effectively or efficiently or are required to do so earlier than anticipated, it could adversely affect our operations, financial reporting, and results of operations and could result in an adverse opinion on internal controls from our independent registered public accounting firm.
46
Our ability to use our net operating loss carryforwards to offset future taxable income may be subject to certain limitations.
Under Section 382 of the Internal Revenue Code of 1986, as amended, or the Code, a corporation that undergoes an “ownership change” is subject to limitations on its ability to utilize its NOLs to offset future taxable income. Our existing NOLs may be subject to limitations arising from previous ownership changes, and if we undergo an ownership change in the future, our ability to utilize NOLs could be further limited by Section 382 of the Code. Future changes in our stock ownership, some of which are outside of our control, could result in an ownership change under Section 382 of the Code. Furthermore, our ability to utilize NOLs of companies that we may acquire in the future may be subject to limitations. There is also a risk that, due to regulatory changes, such as suspensions on the use of NOLs, or other unforeseen reasons, our existing NOLs could expire or otherwise be unavailable to offset future income tax liabilities. For these reasons, we may not be able to realize a tax benefit from the use of our NOLs, whether or not we obtain profitability.
Risks Related to Ownership of Our Common Stock
Sales of a substantial number of shares of our common stock in the public market, or the perception that these sales might occur, could cause our stock price to decline.
Sales of a substantial number of our common stock in the public market, or the perception that these sales might occur, could cause the market price of our common stock to decline and could impair our ability to raise capital through the sale of additional equity securities. As of December 31, 2015, there were 44,184,195 shares of our common stock outstanding, of which, approximately 6,800,000 shares were freely tradable.
The holders of an aggregate of 9,587,764 shares of our common stock as of December 31, 2015 have rights, subject to certain conditions, to require us to file registration statements covering their shares or to include their shares in registration statements that we may file for ourselves or our stockholders. In addition, we have registered shares of our common stock that we may issue under 2015 Omnibus Equity Incentive Plan and 2015 Employee Stock Purchase Plan, and they may be sold freely in the public market upon issuance.
Our stock price has been and may continue to be volatile, and you could lose all or part of your investment.
The market price of our common stock since our initial public offering has been and may continue to be volatile. Since shares of our common stock were sold in our initial public offering in May 2015 at a price of $8.00 per share, our stock price has ranged from $2.02 to $8.80, through December 31, 2015. The market price of our common stock is subject to wide fluctuations in response to various risk factors, some of which are beyond our control and may not be related to our operating performance, including:
|
|
· |
addition or loss of significant customers, collaborators, or distributors; |
|
|
· |
changes in laws or regulations applicable to our industry or traits; |
|
|
· |
additions or departures of key personnel; |
|
|
· |
the failure of securities analysts to cover our common stock after this offering; |
|
|
· |
actual or anticipated changes in expectations regarding our performance by investors or securities analysts; |
|
|
· |
price and volume fluctuations in the overall stock market; |
|
|
· |
volatility in the market price and trading volume of companies in our industry or companies that investors consider comparable; |
|
|
· |
share price and volume fluctuations attributable to inconsistent trading volume levels of our shares; |
|
|
· |
our ability to protect our intellectual property and other proprietary rights; |
|
|
· |
sales of our common stock by us or our stockholders; |
|
|
· |
the expiration of contractual lockup agreements; |
47
|
|
· |
major catastrophic events; and |
|
|
· |
general economic and market conditions and trends. |
Further, the stock markets have experienced extreme price and volume fluctuations that have affected and continue to affect the market prices of equity securities of many companies. These fluctuations often have been unrelated or disproportionate to the operating performance of those companies. In addition, the stock prices of many seed and agricultural biotechnology companies have experienced wide fluctuations that have often been unrelated to the operating performance of those companies. These broad market and industry fluctuations, as well as general economic, political, and market conditions such as recessions, interest rate changes, or international currency fluctuations, may cause the market price of our common stock to decline. If the market price of our common stock fluctuates or declines, you may not realize any return on your investment and may lose some or all of your investment.
Insiders have substantial control over us, which could limit your ability to influence the outcome of key transactions, including a change of control.
Our executive officers, directors, and their affiliates, in the aggregate, beneficially own approximately 72.3% of the outstanding shares of our common stock. As a result, these stockholders, if acting together, would be able to influence or control matters requiring approval by our stockholders, including the election of directors and the approval of mergers, acquisitions or other extraordinary transactions. They may have interests that differ from yours and may vote in a way with which you disagree and that may be adverse to your interests. This concentration of ownership may have the effect of delaying, preventing or deterring a change of control of our company, could deprive our stockholders of an opportunity to receive a premium for their common stock as part of a sale of our company and might affect the market price of our common stock.
Moral Compass Corporation, our largest stockholder, beneficially owns approximately 51.0% of our outstanding common stock, and Moral Compass Corporation and Mandala Capital together beneficially own approximately 71.5% of our outstanding common stock. For so long as Moral Compass Corporation continues to own a significant percentage of our outstanding shares, they will be able to significantly influence the composition of our board of directors and the approval of actions requiring stockholder approval. Accordingly, for such period of time, Moral Compass Corporation may be able to exercise control over our management, business plans, and policies, including the appointment and removal of our officers, and may be able to cause or prevent a change of control of our company or a change in the composition of our board of directors and could preclude any unsolicited acquisition of our company. This concentration of ownership could deprive you of an opportunity to receive a premium for your shares as part of a sale of our company and ultimately might affect the market price of our common stock.
We expect our operating results to vary significantly from quarter to quarter, which may cause our stock price to fluctuate widely.
We expect our quarterly operating results to fluctuate widely and unpredictably for the following reasons, among others:
|
|
· |
our significant customer concentration; |
|
|
· |
our uncertain ability to obtain government grant funding, which affects the timing and amounts of our payments from the U.S. government; |
|
|
· |
the variable timing, stage, and results of our and our collaborators’ research, development, and regulatory activities; |
|
|
· |
the impact of seasonality in agricultural operations on our field trials and sales of products that incorporate our seed traits; |
48
|
|
· |
variance in the timing of customer and distributor orders for our Sonova products. |
Further, a large proportion of our costs are fixed, due in part to our significant research and development costs and general and administrative expenses. Thus, even a small decline in revenues could disproportionately affect our quarterly operating results and could cause such results to differ materially from expectations. Any unanticipated change in revenues or operating results is likely to cause our stock price to fluctuate since such changes reflect new information available to investors and analysts.
Provisions in our amended and restated certificate of incorporation and amended and restated bylaws and under Delaware law might discourage, delay or prevent a change of control of our company or changes in our management and, therefore, depress the trading price of our common stock.
Our amended and restated certificate of incorporation and amended and restated bylaws contain provisions that could depress the trading price of our common stock by discouraging, delaying or preventing a change of control of our company or changes in our management that the stockholders of our company may believe advantageous. These provisions include:
|
|
· |
establishing a classified board of directors so that not all members of our board of directors are elected at one time; |
|
|
· |
authorizing “blank check” preferred stock that our board of directors could issue to increase the number of outstanding shares to discourage a takeover attempt; |
|
|
· |
eliminating the ability of stockholders to call a special stockholder meeting; |
|
|
· |
eliminating the ability of stockholders to act by written consent; |
|
|
· |
the requirement that, to the fullest extent permitted by law and unless we consent to an alternate form, certain proceedings against or involving us or our directors, officers, or employees be brought exclusively in the Court of Chancery in the State of Delaware; |
|
|
· |
providing that the board of directors is expressly authorized to make, alter, or repeal our bylaws; and |
|
|
· |
establishing advance notice requirements for nominations for elections to our board of directors or for proposing matters that can be acted upon by stockholders at stockholder meetings. |
If securities or industry analysts do not publish or cease publishing research or reports about us, our business, or our market, or if they change their recommendations regarding our stock adversely, our stock price and trading volume could decline.
The trading market for our common stock is influenced by the research and reports that industry or securities analysts may publish about us, our business, our market or our competitors. If any of the analysts who may cover us make adverse changes to their recommendation regarding our stock, or provide more favorable relative recommendations about our competitors, our stock price would likely decline. If any analyst who may cover us were to cease coverage of our company or fail to regularly publish reports on us, we could lose visibility in the financial markets, which in turn could cause our stock price or trading volume to decline.
As an emerging growth company within the meaning of the Securities Act, we utilize certain modified disclosure requirements, and we cannot be certain if these reduced requirements will make our common stock less attractive to investors.
We are an emerging growth company within the meaning of the rules under the Securities Act and we plan in future filings with the SEC to utilize, the modified disclosure requirements available to emerging growth companies, including reduced disclosure about our executive compensation and omission of compensation discussion and analysis, and an exemption from the requirement of holding a nonbinding advisory vote on executive compensation. In addition, we are not subject to certain requirements of Section 404 of the SarbanesOxley Act, including the additional testing of our internal control over financial reporting as may occur when outside auditors attest as to our
49
internal control over financial reporting. As a result, our stockholders may not have access to certain information they may deem important. We cannot predict if investors will find our common stock less attractive because we rely on these exemptions. If some investors find our common stock less attractive as a result, there may be a less active trading market for our common stock and our stock price may be more volatile.
We could remain an emerging growth company for up to five years, or until the earliest of (i) the last day of the first fiscal year in which our annual gross revenues exceed $1.0 billion, (ii) the date that we become a large accelerated filer as defined in Rule 12b2 under the Exchange Act, which would occur if the market value of our common stock that is held by nonaffiliates exceeds $700 million as of the last business day of our most recently completed second fiscal quarter, or (iii) the date on which we have issued more than $1.0 billion in nonconvertible debt during the preceding threeyear period.
Because we do not expect to pay any dividends for the foreseeable future, investors may be forced to sell their stock to realize a return on their investment.
We do not anticipate that we will pay any dividends to holders of our common stock for the foreseeable future. Any payment of cash dividends will be at the discretion of our board of directors and will depend on, among other things, our results of operations, cash requirements, financial condition, contractual restrictions including compliance with covenants under our debt agreements, and other factors that our board of directors may deem relevant. Our ability to pay dividends might be restricted by the terms of any indebtedness that we incur in the future. In addition, certain of our current outstanding debt agreements prohibit us from paying cash dividends on our common stock. Consequently, you should not rely on dividends to receive a return on your investment.
Item 1B. Unresolved Staff Comments.
Not applicable.
Our corporate headquarters are located in Davis, California, in a facility consisting of approximately 20,775 square feet of office, laboratory, and growth chamber space under a lease that expires on June 30, 2018. This facility accommodates research and development, operations, analytical services, regulatory, and administrative activities. We also lease approximately 4,381 square feet of office and laboratory space in Seattle, Washington, where our team of scientists executes our TILLING technology platform, under a lease that expires on December 31, 2016. Our administrative offices in Phoenix, Arizona consist of 2,976 square feet under a lease that expires on June 30, 2018 and accommodate finance, legal, and other administrative activities, as well as sales and marketing activities for our Sonova products. We also lease greenhouse space and farm land for agricultural use in Northern California as well as farmland in Idaho. We also lease grain bin and office space in Idaho under a lease that expires on March 3, 2019.
We believe that our leased facilities are adequate to meet our current needs and that, if needed, suitable additional or alternative space will be available to accommodate our operations.
We currently are not a party to any material litigation or other material legal proceedings. From time to time, we may be subject to legal proceedings and claims in the ordinary course of business.
Item 4. Mine Safety Disclosures.
Not applicable.
50
Item 5. Market for Registrant’s Common Equity, Related Stockholder Matters and Issuer Purchases of Equity Securities.
Our common stock has been listed on the NASDAQ Global Market under the symbol “RKDA” since May 15, 2015. Prior to May 15, 2015, there was no public trading for our common stock. The following table sets forth for the periods indicated the high and low sales price per share of our common stock as reported on the NASDAQ Global Market:
|
YEAR ENDED DECEMBER 31, 2015 |
|
HIGH |
|
|
LOW |
|
||
|
Second Quarter (beginning May 15, 2015) |
|
$ |
8.80 |
|
|
$ |
6.01 |
|
|
Third Quarter |
|
$ |
6.97 |
|
|
$ |
3.02 |
|
|
Fourth Quarter |
|
$ |
4.82 |
|
|
$ |
2.02 |
|
Holders of Record
As of March 1, 2016, we had 55 holders of record of our common stock. Because many of our shares of common stock are held by brokers and other institutions on behalf of stockholders, we are unable to estimate the total number of stockholders represented by these record holders.
Dividend Policy
We have never declared or paid cash dividends on our capital stock. We currently intend to retain all available funds and any future earnings for use in the operation of our business and do not anticipate paying any cash dividends in the foreseeable future. Any decision to declare and pay cash dividends in the future will be made at the discretion of our board of directors and will depend on, among other things, our results of operations, cash requirements, financial condition, contractual restrictions including compliance with covenants under our debt agreements, and other factors that our board of directors may deem relevant. Certain of our current outstanding debt agreements prohibit us from paying cash dividends on our capital stock.
Recent Sales of Unregistered Securities
None.
Use of Proceeds
Use of Proceeds from Public Offering of Common Stock
On May 20, 2015, we completed our initial public offering, or IPO, of our common stock, and on June 17, 2015, we completed the sale of additional shares upon exercise of the underwriters’ overallotment option. In connection with the IPO, we issued and sold 8,528,306 shares of common stock, including the overallotment shares, at a price to the public of $8.00 per share. As a result of the IPO, we received $68.2 million in gross proceeds, and $58.4 million in net proceeds after deducting underwriting discounts and commissions of $4.8 million and offering expenses of $5.0 million payable by us. None of the expenses associated with the IPO were paid to directors, officers, persons owning 10% or more of any class of our equity securities, or to their associates, or to our affiliates. Credit Suisse Securities (USA) LLC and J.P. Morgan Securities LLC acted as joint lead bookrunning managers for the IPO, and Piper Jaffray & Co. acted as an additional bookrunning manager. The offering terminated after all of the shares of common stock were sold.
We registered the shares under the Securities Act of 1933 on a Registration Statement on Form S1 (Registration No. 333202124), which was filed with the Securities and Exchange Commission, or SEC, on February 17, 2015 and declared effective on May 14, 2015.
51
There has been no material change in the planned use of proceeds from our IPO as described in our final prospectus filed with the SEC on May 15, 2015 pursuant to Rule 424(b).
Purchases of Equity Securities by the Issuer and Affiliated Purchasers
We did not repurchase any of our equity securities during the year ended December 31, 2015.
Item 6. Selected Financial Data.
The following selected Consolidated Statements of Operations and Comprehensive Loss data for the years ended December 31, 2015 and 2014 and the Consolidated Balance Sheets data as of December 31, 2015 and 2014 are derived from our audited consolidated financial statements included herein, and should be read together with our consolidated financial statements, the notes to our consolidated financial statements and “Management’s Discussion and Analysis of Financial Condition and Results of Operations.”
|
|
|
Year Ended December 31, |
|
|||||
|
|
|
2015 |
|
|
2014 |
|
||
|
|
|
(in thousands, except share and per share amounts) |
|
|||||
|
Revenues: |
|
|
|
|
|
|
|
|
|
Product |
|
$ |
466 |
|
|
$ |
355 |
|
|
License |
|
|
1,216 |
|
|
|
2,325 |
|
|
Contract research and government grants |
|
|
3,732 |
|
|
|
4,302 |
|
|
Total revenues |
|
|
5,414 |
|
|
|
6,982 |
|
|
Operating expenses: |
|
|
|
|
|
|
|
|
|
Cost of product revenues |
|
|
892 |
|
|
|
1,997 |
|
|
Research and development(1) |
|
|
8,966 |
|
|
|
10,012 |
|
|
Selling, general, and administrative(1) |
|
|
11,119 |
|
|
|
10,126 |
|
|
Total operating expenses |
|
|
20,977 |
|
|
|
22,135 |
|
|
Loss from operations |
|
|
(15,563 |
) |
|
|
(15,153 |
) |
|
Interest expense |
|
|
(2,658 |
) |
|
|
(1,394 |
) |
|
Other income (expense), net |
|
|
521 |
|
|
|
(597 |
) |
|
Loss on extinguishment of debt |
|
|
(230 |
) |
|
|
— |
|
|
Loss before income taxes and equity in loss of unconsolidated entity |
|
|
(17,930 |
) |
|
|
(17,144 |
) |
|
Income tax provision |
|
|
(26 |
) |
|
|
(263 |
) |
|
Equity in loss of unconsolidated entity |
|
|
— |
|
|
|
(932 |
) |
|
Net loss |
|
|
(17,956 |
) |
|
|
(18,339 |
) |
|
Accretion of redeemable convertible preferred stock to redemption value |
|
|
(2,574 |
) |
|
|
(3,738 |
) |
|
Deemed dividends to warrant holder |
|
|
(197 |
) |
|
|
— |
|
|
Net loss attributable to common stockholders |
|
$ |
(20,727 |
) |
|
$ |
(22,077 |
) |
|
Net loss per share attributable to common stockholders, basic and diluted(2) |
|
$ |
(0.73 |
) |
|
$ |
(10.71 |
) |
|
Weighted-average number of shares used in per share calculations, basic and diluted(2) |
|
|
28,559,119 |
|
|
|
2,061,278 |
|
52
|
|
|
Year Ended December 31, |
|
|||||
|
|
|
2015 |
|
|
2014 |
|
||
|
|
|
(in thousands) |
|
|||||
|
Research and development |
|
$ |
607 |
|
|
$ |
249 |
|
|
Selling, general, and administrative |
|
|
785 |
|
|
|
727 |
|
|
Total stock-based compensation |
|
$ |
1,392 |
|
|
$ |
976 |
|
|
(2) |
See Note 16 of the notes to our consolidated financial statements for a description of how we compute net loss per share attributable to common stockholders, basic and diluted, and pro forma net loss per share attributable to common stockholders, basic and diluted. |
|
|
|
As of December 31, |
|
|||||
|
|
|
2015 |
|
|
2014 |
|
||
|
|
|
(in thousands) |
|
|||||
|
Consolidated Balance Sheets Data: |
|
|
|
|
|
|
|
|
|
Cash and cash equivalents |
|
$ |
23,973 |
|
|
$ |
16,571 |
|
|
Working capital |
|
|
48,567 |
|
|
|
7,426 |
|
|
Total assets |
|
|
74,242 |
|
|
|
24,889 |
|
|
Total indebtedness |
|
|
24,930 |
|
|
|
14,475 |
|
|
Redeemable convertible preferred stock |
|
|
— |
|
|
|
34,098 |
|
|
Convertible preferred stock |
|
|
— |
|
|
|
48,783 |
|
|
Additional paid-in capital |
|
|
172,222 |
|
|
|
29,204 |
|
|
Accumulated deficit |
|
|
(131,926 |
) |
|
|
(113,970 |
) |
|
Total stockholder's equity (deficit) |
|
|
40,225 |
|
|
|
(84,766 |
) |
53
Item 7. Management’s Discussion and Analysis of Financial Condition and Results of Operations.
The following discussion and analysis of our financial condition and results of operations should be read in conjunction with our consolidated financial statements and the related notes to those statements included herein. In addition to historical financial information, the following discussion and analysis contains forward-looking statements that involve risks, uncertainties and assumptions. Our actual results and timing of selected events may differ materially from those anticipated in these forward-looking statements as a result of many factors, including those discussed under “Risk Factors.”
Overview
We are a leading agricultural biotechnology trait company with an extensive and diversified portfolio of late-stage yield and product quality traits addressing multiple crops that supply the global food and feed markets. Our traits are focused on high-value enhancements that increase crop yields by enabling plants to more efficiently manage environmental and nutrient stresses, and that enhance the quality and value of agricultural products. Our traits increase value not only for farmers, but also for users of agricultural products. Our target market is the $40.5 billion global seed market. Our goal is to increase the value of this market significantly by increasing yields in the more than $1.0 trillion market for the five largest global crops, and to capture a portion of the increased value.
Our crop yield traits are being utilized by our commercial partners to develop higher yielding seeds for the most widely grown global crops, including wheat, rice, soybean, corn, and sugarcane, as well as for other crops such as cotton, turf and trees. Our business model positions us at the nexus of basic research and commercial product development, as we apply our strong product development and regulatory capabilities to collaborate with, and leverage the skills and investments of, upstream basic research institutions and downstream commercial partners. We believe our approach significantly reduces risk and capital requirements, while simplifying and expediting the product development process. We also believe that our collaboration strategy leverages our internal capabilities, enabling us to capture much higher value than would otherwise be the case, and enabling our commercial partners to develop and commercialize products more cost-effectively.
We were incorporated in 2002 to pursue agricultural-based biotechnology business opportunities that improve the environment and human health, and in 2004, we entered into our first collaboration agreement with a potential commercial partner. In 2009, we completed the U.S. Food and Drug Administration, or FDA, regulatory process for our Sonova brand gamma linolenic acid safflower oil, called Sonova 400 GLA safflower oil, just six years after we first began developing the trait under a research and commercial agreement with Abbott. We introduced this product commercially in late 2010, and in 2014, we introduced Sonova Ultra GLA safflower oil, a more concentrated version of our Sonova 400 GLA safflower oil. We refer to these products as our Sonova products.
We have formed strategic partnerships and developed strong relationships with global agricultural leaders for development and commercialization of our traits in major crops and consumer products. Our collaborators include Limagrain (Vilmorin & Cie), Mahyco (Maharashtra Hybrid Seeds Company Limited), Dow AgroSciences, DuPont Pioneer (E.I. du Pont de Nemours and Company), SES Vanderhave, Genective (a joint venture between Limagrain and KWS SAAT), Scotts, U.S. Sugar, Abbott, Ardent Mills, Bioceres, and others. Additionally, in order to increase our participation in the value of two major crops, wheat and soybean, we have formed two joint ventures. Limagrain Cereal Seeds LLC is our joint venture with Limagrain for the development and commercialization of wheat products for North America. Verdeca LLC is our joint venture with Bioceres for the development and deregulation of soybean traits globally. In April 2015, we entered into a collaboration agreement with Dow AgroSciences and Bioceres under which our Verdeca joint venture will collaborate with Dow AgroSciences on the development and deregulation of soybean traits on a global basis. In December 2015, we announced a strategic collaboration with Dow AgroSciences to develop traits in corn. We intend to enter into future collaboration agreements and joint ventures depending on our assessment of which structure provides the best ratio of risk to investment return.
54
The process of developing and commercializing innovative traits and seed products requires significant time and investment. Our business model focuses on creating value by leveraging collaborator investments and capabilities upstream in basic research, and downstream in product development and commercialization. We bridge the gap between basic research and commercial development, reducing risk and adding value as a result. We reduce risk and avoid most of the costs associated with basic research by acquiring trait technologies that have already completed initial feasibility screening, thus achieving proof of concept, through basic research carried out elsewhere. We further develop these technologies by optimizing function and validating performance through intensive field trial testing in multiple crops. We then form collaborations with major seed and consumer product companies that develop and commercialize products incorporating our traits. As a result of our expertise and this additional development work, we are positioned to capture significantly greater payments in our downstream license and collaboration agreements than we believe is otherwise typical in our industry.
In certain instances, we may also work to complete the regulatory process to support the commercial launch of products containing our traits. We would do this in order to obtain a greater share of the economics of the commercial product. We intend to pace any regulatory investments so that we only make such investments after the performance risk for the seed trait has been significantly reduced through extensive field testing. We may pursue regulatory investments in these instances if we believe that they will result in a highly positive rate of return due to increased payments from our commercial partners or joint ventures.
Our commercial strategy aims to balance our near-term revenue goals with long-term value capture. Our trait license agreements with our commercial partners contain two main types of financial components:
|
|
· |
A set of pre-commercialization payments from our commercial partners that are linked to their pursuit of technical and regulatory milestones under a well-defined diligence plan. The pre-commercialization payments typically include upfront and annual license fees, as well as multiple payments for key technical and development milestones such as demonstration of greenhouse efficacy, demonstration of field efficacy, regulatory submission, regulatory approval, and commercial launch. Under most of our license agreements, failure of our commercial partners to adhere to the diligence plan may result in a reduction, or elimination, of their license rights. The combination of diligence requirements and milestone payments motivates our commercial partners to develop and commercialize products containing our traits, while providing us with revenue to fund our development programs. |
|
|
· |
Once a product containing one or more of our traits is commercialized, we are entitled to receive a portion of the revenue that it generates for our commercial partner. For seeds incorporating valuable traits, farmers typically pay either a premium for the seed or a trait fee. This premium or trait fee represents the additional value generated for our commercial partner by our trait(s), and we receive a percentage of this additional value. Typically, our share of this value ranges from 15 to 20%, and it can increase to a range of 37 to 50% under certain agreements if we elect to co-invest in product development and/or deregulation. We expect that our participation in joint ventures will provide us with an opportunity to recognize additional value from our traits. While we seek patent protection on our technologies and traits, we have structured our commercial agreements so that we receive our percentage of additional commercial value whether or not patent protection is in effect at any particular time or place. Nearly all of our agreements provide that access to our traits, and our right to receive a share of commercial value, continue for a set number of years after products containing our traits are commercialized. While the exclusive rights afforded by patents may enable our commercial partners to realize greater commercial value attributable to our traits, our right to receive a portion of that increased commercial value is not dependent on the existence of patent rights in a particular geography. |
While we seek patent protection on our technologies and traits, we have structured our commercial agreements so that we receive our percentage of additional commercial value whether or not patent protection is in effect at any particular time or place. Nearly all of our agreements provide that access to our traits, and our right to receive a share of commercial value, continue for a set number of years after products containing our traits are commercialized. While the exclusive rights afforded by patents may enable our commercial partners to realize greater commercial value attributable to our traits, our right to receive a portion of that increased commercial value is not dependent on the existence of patent rights in a particular geography.
55
Most of our agreements include the grant of exclusive rights to a particular trait for use in a particular crop within a defined geography. To date, we have not granted exclusive rights to all of our traits for use in a particular crop to a single partner and, likewise, we have not granted exclusive rights to utilize a particular trait in all crops to a single partner. Our approach to selecting commercial partners involves careful consideration of their market channels and capabilities to ensure that they are well matched to the trait, crop, and geography that form the foundation of our commercial relationship.
The process of discovering, developing, and commercializing a seed trait through either genetic modification or advanced breeding involves multiple phases and takes an average of 13 years from discovery to commercialization. The length of the process may vary depending on both the complexity of the trait and the type of crop involved. This long product development cycle is in large part attributable to the limitations of natural growing seasons and the impact of this on the time it takes to breed commercial seed products. For genetically modified, or GM, seeds, there is also a rigorous and lengthy regulatory process that operates in parallel to the later stages of the seed breeding process.
Since our inception, we have devoted substantially all of our efforts to research and development activities, including the discovery, development, and testing of our traits and products in development incorporating our traits. To date, we have not generated revenues from sales of commercial products, other than limited revenues from our Sonova products, and we do not anticipate generating any revenues from commercial product sales other than from sales of our Sonova products for at least the next three to five years. We do receive revenues from fees associated with the licensing of our traits to commercial partners. Our long-term business plan and growth strategy is based in part on our expectation that revenues from products that incorporate our traits will comprise a significant portion of our future revenues.
We have never been profitable and had an accumulated deficit of $131.9 million as of December 31, 2015. We incurred net losses of $18.0 million and $18.3 million for the years ended December 31, 2015 and 2014, respectively. We expect to incur substantial costs and expenses before we obtain any revenues from the sale of seeds incorporating our traits. As a result, our losses in future periods could become even more significant, and we may need additional funding to support our operating activities.
Components of Our Statements of Operations Data
Revenues
We derive our revenues from product revenues, licensing agreements, contract research agreements, and government grants. We expect that over the next several years, a substantial majority of our revenues will consist of license revenues and contract research and government grant revenues until our license revenues increase with the introduction of our seed trait products to the market, if and when they are commercially available. Further, we expect that our license revenues will vary as we enter into new license agreements and with the timing of milestone payments and recognition of deferred upfront license fees under existing license agreements.
Product Revenues
Our product revenues to date have consisted solely of sales of our Sonova products. We generally recognize revenue from product sales upon delivery to our third-party distributors or customers. Our revenues will fluctuate depending on the timing of orders from our customers and distributors.
License Revenues
Our license revenues to date consist of up-front, nonrefundable license fees, annual license fees, and subsequent milestone payments that we receive under our research and license agreements. We generally recognize nonrefundable up-front license fees and guaranteed, time-based payments as revenue proportionally over the expected development period. We recognize annual license fees proportionally over the related term subject to cancellation provisions.
56
We recognize milestone payments as revenue when the related performance criteria are achieved. Milestones typically consist of significant stages of development for our traits in a potential commercial product, such as achievement of specific technological targets, completion of field trials, filing with regulatory agencies, completion of the regulatory process, and commercial launch of a product containing our traits. Given the seasonality of agriculture and time required to progress from one milestone to the next, achievement of milestones is inherently uneven, and our license revenues are likely to fluctuate significantly from period to period.
Contract Research and Government Grant Revenues
Contract research revenues consist of amounts earned from performing contracted research primarily related to breeding programs or the genetic engineering of plants for third parties. We generally recognize revenue as these services are provided. In addition, we are entitled to receive a portion of the revenues generated from sales of products that incorporate our seed traits. Products expected to result from such contract research are in various stages of the product development cycle and we do not expect to generate any revenues from the sale of any such products for at least the next three to five years.
We receive payments from government entities in the form of government grants. Government grant revenues are recognized as eligible research and development expenses are incurred. Our obligation with respect to these agreements is to perform the research on a best-efforts basis. Given the nature and uncertain timing of receipt of government grants and timing of eligible research and development expenses, such revenues are likely to fluctuate significantly from period to period.
Operating Expenses
Cost of Product Revenues
Cost of product revenues relates to the sale of our Sonova products and consists of in-licensing and royalty fees, any adjustments to inventory reserve, as well as the cost of raw materials, including inventory and third-party services costs related to procuring, processing, formulating, packaging, and shipping our Sonova products.
Research and Development Expenses
Research and development expenses consist of costs incurred in the discovery, development, and testing of our products and products in development incorporating our traits. These expenses consist primarily of employee salaries and benefits, fees paid to subcontracted research providers, fees associated with in-licensing technology, land leased for field trials, chemicals and supplies, and other external expenses. These costs are expensed as incurred. Additionally, we are required from time to time to make certain milestone payments in connection with the development of technologies in-licensed from third parties. We expense these milestone payments at the time the milestone is achieved and deemed payable. We expect our research and development expenses to increase on an absolute dollar basis for the foreseeable future, although our research and development expenses may increase significantly if we choose to accelerate certain research and development programs or if we elect to take a greater role in the regulatory and commercialization process with respect to one or more of our seed traits or products in development incorporating our seed traits. Our research and development expenses may also fluctuate from period to period as a result of the timing of various research and development projects.
Selling, General, and Administrative Expenses
Selling, general, and administrative expenses consist primarily of employee costs, professional service fees, and overhead costs. In addition, in the first half of 2014, we also incurred costs of $2.1 million paid to an advisor related to our financing efforts that ultimately resulted in the issuance of our Series D preferred stock. Our selling, general, and administrative expenses may fluctuate from period to period.
Interest Expense
Interest expense consists primarily of contractual interest and amortization of debt discounts on the borrowings under loan agreements.
57
Other income (expense), net, consists of changes in the fair value of our derivative liabilities related to our convertible promissory notes, the release of warrant and derivative liabilities related to notes payable, interest income and the amortization of investment premiums on our cash and cash equivalents and investments.
Loss on Extinguishment of Debt
From time to time, the Company may refinance its debts if it is reasonable to do so, which may result in a gain or loss on the extinguishment of debt. Loss on extinguishment of debt is composed of the release of derivative liabilities associated with the convertible promissory notes, as well as amounts related to early payoff fees, end of term fees, deferred issuance costs and unamortized debt discounts.
Equity in Loss of Unconsolidated Entity
We use the equity method to account for our investment in Limagrain Cereal Seeds LLC, or LCS, a joint venture we formed with an affiliate of Limagrain and in which we hold a 35% interest. We account for LCS as an unconsolidated entity, as we exercise significant influence but do not have a controlling interest.
Income Tax Provision
Our income tax provision has not been historically significant, as we have incurred losses since our inception. The provision for income taxes consists of state and foreign income taxes. Due to cumulative losses, we maintain a valuation allowance against our U.S. deferred tax assets as of December 31, 2015 and 2014. We consider all available evidence, both positive and negative, including but not limited to, earnings history, projected future outcomes, industry and market trends and the nature of each of the deferred tax assets in assessing the extent to which a valuation allowance should be applied against our U.S. deferred tax assets.
58
Results of Operations
Comparison of the Years Ended December 31, 2015 and 2014
|
|
|
Year Ended December 31, |
|
|||||
|
|
|
2015 |
|
|
2014 |
|
||
|
|
|
(in thousands) |
|
|||||
|
Revenues: |
|
|
|
|
|
|
|
|
|
Product |
|
$ |
466 |
|
|
$ |
355 |
|
|
License |
|
|
1,216 |
|
|
|
2,325 |
|
|
Contract research and government grants |
|
|
3,732 |
|
|
|
4,302 |
|
|
Total revenues |
|
|
5,414 |
|
|
|
6,982 |
|
|
Operating expenses: |
|
|
|
|
|
|
|
|
|
Cost of product revenues |
|
|
892 |
|
|
|
1,997 |
|
|
Research and development |
|
|
8,966 |
|
|
|
10,012 |
|
|
Selling, general and administrative |
|
|
11,119 |
|
|
|
10,126 |
|
|
Total operating expenses |
|
|
20,977 |
|
|
|
22,135 |
|
|
Loss from operations |
|
|
(15,563 |
) |
|
|
(15,153 |
) |
|
Interest expense |
|
|
(2,658 |
) |
|
|
(1,394 |
) |
|
Other income (expense), net |
|
|
521 |
|
|
|
(597 |
) |
|
Loss on extinguishment of debt |
|
|
(230 |
) |
|
|
— |
|
|
Loss before income taxes |
|
|
(17,930 |
) |
|
|
(17,144 |
) |
|
Income tax provision |
|
|
(26 |
) |
|
|
(263 |
) |
|
Equity in loss of unconsolidated entity |
|
|
— |
|
|
|
(932 |
) |
|
Net loss |
|
$ |
(17,956 |
) |
|
$ |
(18,339 |
) |
|
Accretion of redeemable convertible preferred stock to redemption value |
|
|
(2,574 |
) |
|
|
(3,738 |
) |
|
Deemed dividends to warrant holder |
|
|
(197 |
) |
|
|
— |
|
|
Net loss attributable to common stockholders |
|
$ |
(20,727 |
) |
|
$ |
(22,077 |
) |
Revenues
Product revenues accounted for 9% and 5% of our total revenues for the years ended December 31, 2015 and 2014, respectively. The $0.1 million, or 31%, increase in product revenues was primarily driven by the launch of new products by several of our customers.
License revenues accounted for 22% and 33% of our total revenues for the years ended December 31, 2015 and 2014, respectively. The $1.1 million, or 48%, decrease in license revenue was primarily driven by the recognition of a significant milestone during 2014. The remaining decrease in license revenues was attributable to the contractual termination of an annual license fee and the timing of recognition of deferred upfront license fees.
Contract research and government grant revenues comprise a significant portion of our total revenues, accounting for 69% and 62% of our total revenues for the years ended December 31, 2015 and 2014, respectively. The $0.6 million, or 13%, decrease in grant and contract research revenues was primarily driven by a $1.2 million reduction in government grant revenue due to the timing of activities and the winding down of several grants. Partially offsetting this decrease was a $0.6 million increase in contract research revenues generated by new contracts obtained during 2015.
59
Cost of product revenues decreased by $1.1 million, or 55%, for the year ended December 31, 2015 compared to the year ended December 31, 2014. The decrease was primarily due to a reduction in recorded inventory reserves as a result of changes to conditions of specific customers and regulatory delays related to the use of our Sonova products by certain new industries.
Research and Development
Research and development expenses decreased by $1.0 million, or 10%, for the year ended December 31, 2015 compared to the year ended December 31, 2014. The decrease in research and development costs was primarily related to a one-time charge of $1.5 million in 2014 related to a surrender of Bioceres S.A. shares. Also contributing to the decrease was a reduction in subcontracting services associated with the winding down of several government grants, partially offset by $0.7 million of additional research services in support of Verdeca in 2015.
Selling, General, and Administrative
Selling, general, and administrative expenses increased by $1.0 million, or 10%, for the year ended December 31, 2015 compared to the year ended December 31, 2014. The increase in SG&A costs was primarily driven by additional employee expenses, as well as increased accounting and outside services associated with operating as a public company.
Interest Expense
Interest expense increased $1.3 million, or 91%, in 2015 compared to 2014. The increase was primarily related to the contractual interest amount and accretion of debt discount on the $20.0 million term loan borrowings that occurred in April 2015.
Other Income (Expense), Net
Other income (expense), net, increased $1.1 million, or 187%, in 2015 compared to 2014. This increase primarily consisted of the $0.4 million gain on expiration of warrant and derivative liabilities associated with the $20.0 million of term loan borrowings, as well as $0.2 million of interest income earned on investments.
Loss on Extinguishment of Debt
The loss on extinguishment of debt of $0.2 million was related to the debt consolidation activity that occurred in December 2015.
Income Tax Provision
The income tax provision decreased by $0.2 million, or 90%, in 2015 compared to 2014. The decrease was the result of lower revenue generated from India, payments from which require income tax withholding.
Equity in Loss of Unconsolidated Entity
Our share of equity in loss of unconsolidated entity due to Limagrain Cereal Seeds LLC’s net loss was zero in 2015, as our share of cumulative losses exceeded our investments in June 2014. As our investment balance remained at $0 in 2015, no additional losses of LCS were recorded in our Consolidated Statements of Operations and Comprehensive Loss.
Accretion of Redeemable Convertible Preferred Stock to Redemption Value
Accretion of Series D redeemable convertible preferred stock to redemption value decreased by $1.2 million, or 31%, in 2015 compared to 2014. Our Series D redeemable convertible preferred stock converted into common stock upon the completion of our initial public offering in May 2015.
60
Deemed Dividend to Warrant Holder
In March 2015, the Company accounted for the amendment of a warrant as a modification with the incremental increase in fair value of $0.2 million.
Seasonality
We and our commercial partners operate in different geographies around the world and conduct field trials that are used for data generation, which must be conducted during the appropriate growing seasons of particular crops and markets. Often, there is only one crop-growing season per year for certain crops and markets. Similarly, climate conditions and other variables on which development and sales of our products are dependent may vary from season to season and year to year. In particular, weather conditions, including natural disasters such as heavy rains, hurricanes, hail, floods, tornadoes, freezing conditions, drought, or fire, may affect the timing and outcome of field trials, which may delay milestone payments and the commercialization of products incorporating our seed traits. In the future, sales of commercial products that incorporate our seed traits will vary based on crop growing seasons and weather patterns in particular regions. The level of seasonality in our business overall is difficult to evaluate at this time due to our relatively early stage of development, our relatively limited number of commercialized products, our expansion into new geographical markets, and our introduction of new products and traits.
Liquidity and Capital Resources
Since our inception, we have funded our operations primarily with the net proceeds from our initial public offering and from private placements of equity and debt securities, as well as proceeds from the sale of our Sonova products and payments under license agreements, contract research agreements, and government grants. Our principal use of cash is to fund our operations, which are primarily focused on progressing our agricultural yield and product quality seed traits through the regulatory process and to commercialization. This includes conducting replicated field trials, coordinating with our partners on their development programs, and collecting, analyzing, and submitting field trial data to regulatory authorities. As of December 31, 2015, we had cash and cash equivalents of $24.0 million, short-term investments of $26.3 million, and $19.7 million of long-term investments.
In May 2015, we completed our initial public offering. In connection with this offering, we issued and sold 8,528,306 shares of common stock at a price to the public of $8.00 per share and received $58.4 million in net proceeds, after deducting underwriting discounts and commissions of $4.8 million and offering expenses of $5.0 million.
In December 2015, we obtained additional debt financing in the form of a $25.0 million senior secured term loan, allowing us to prepay all existing debt with a more favorable interest rate and maturity.
We believe that our existing cash and cash equivalents will be sufficient to meet our anticipated cash requirements for at least the next 12 months.
We may seek to raise further funds through additional debt or equity financings, if necessary. We may also consider entering into additional partner arrangements or pursuing additional government grants. Our sale of additional equity would result in dilution to our stockholders. Our incurrence of additional debt would result in increased debt service obligations, and the instruments governing our debt could provide for additional operating and financing covenants that would restrict our operations. If we are not able to secure adequate additional funding, we may be forced to reduce our spending, extend payment terms with our suppliers, liquidate assets, or suspend or curtail planned development programs. Any of these actions could materially harm our business, results of operations and financial condition.
61
In July 2012, a 36-month $8.0 million term note was executed with Moral Compass Corporation (“MCC”), our largest stockholder, and was subordinate to existing promissory notes and convertible promissory notes. The interest rate on the loan was prime plus 2%, with interest only paid monthly in arrears. The principal was due in full at maturity in July 2015. On November 10, 2014, we and MCC entered into an amendment to the term loan under which the maturity date was extended to the first to occur of the following dates: (i) April 1, 2016, (ii) the date of an Event of Default, or (iii) a date designated by MCC, by notice to us, no earlier than the 20th day following consummation by us of an equity financing with gross proceeds to us of at least $50 million. In addition, the interest rate remained at prime plus 2% through December 31, 2014, and was amended to increase to 11% per annum thereafter until maturity. The balance of the note, inclusive of accrued interest, was approximately $8.0 million as of December 31, 2014. Accrued interest of $36,000 was recorded in amounts due to related parties on the balance sheet as of December 31, 2014. This term note, including the principal balance of $8.0 million and accrued interest and prepayment fee of $0.1 million, was paid in full in April 2015. The $80,000 prepayment fee was recorded as a loss on extinguishment of debt.
Promissory Notes
Promissory notes were executed with an unrelated party in August 2013 and November 2013 in the amounts of $2.0 million and $1.1 million, respectively. The interest rate on the notes was 10% with principal and interest due in 36 equal monthly installments over the course of their respective three-year terms. These notes, including the aggregate outstanding principal balance of $1.6 million and accrued interest and prepayment fee of $44,000, were paid in full in April 2015. The $37,000 prepayment fee was recorded as a loss on extinguishment of debt.
Convertible Promissory Notes
In September 2013, we entered into a note and warrant purchase agreement in the amount of $5.0 million with an affiliate of Mahyco, one of our commercial partners with which we have several research and license agreements. We issued a convertible promissory note under this agreement in exchange for $0.5 million in September 2013 and issued a second convertible promissory note in exchange for $4.5 million in December 2013. The interest rate on the notes was prime plus 2%, compounded monthly over the course of the five-year terms ending in September and December 2018, respectively. At any time during the term, Mahyco could convert all or part of the aggregate outstanding balance of the notes (including principal and accrued but unpaid interest) into shares of our common stock at $16.52 per share. Mahyco had the right, at its option, to place another $5.0 million of convertible debt with us during the five-year term. Mahyco, at its option, could offset future fee payments to us due under any license agreements or contract research and development agreements with us against the outstanding balance of the note, including principal and accrued but unpaid interest. With the exception of such offset payments, no principal or interest was due until the end of the term. Under this note and warrant purchase agreement, we also issued Mahyco warrants to purchase 75,666 shares of our common stock at an exercise price of $16.52 per share. The warrants were issued in December 2013, vested immediately, and remain exercisable.
In March 2015, the parties amended the warrant to clarify the interpretation of a reorganization event. The Company accounted for the amendment as a modification with the incremental increase in fair value of $0.2 million as of the amendment date, which was accounted for as a deemed dividend to the warrant holder.
Term Loans
In April 2015, we entered into a loan and security agreement with lenders that are affiliates of Tennenbaum Capital Partners, LLC. Obsidian Agency Services, Inc. acted as administrative agent for the lenders under this agreement. Under the agreement, the lenders committed to advance term loans in an aggregate principal amount of up to $20.0 million, and we borrowed the entire $20.0 million of term loan commitments on the loan closing date.
62
Under this loan and security agreement, interest on the term loans accrued at a rate per annum equal to the greater of (i) 9.0% and (ii) a fluctuating rate of interest equal to three-month LIBOR as in effect from time to time plus 8.74%. We were required to make interest-only payments under this agreement from the drawdown dates through April 30, 2016, subject to certain conditions for extension to October 31, 2016. After this date, we would have been required to make equal monthly payments of principal and interest so that all outstanding principal amounts and accrued interest would have been repaid by November 1, 2018. This agreement provided for a right of prepayment with associated prepayment fees and an additional end-of-term payment of $0.6 million due upon maturity or when the terms loans are prepaid whole or in part to the lenders.
In December 2015, we entered into a new loan and security agreement with Silicon Valley Bank (the “Bank”) providing for a senior secured term loan facility in the amount of $25.0 million. Proceeds were used by us to repay all existing debt including the Tennenbaum term loans’ principal balance of $20.0 million and related accrued interest, prepayment and other fees in the amount of $1.3 million and the Mahyco convertible promissory notes’ principal balance of $3.7 million and associated accrued interest of $154,000. The Tennenbaum term loans’ prepayment and end of term fees of $1.2 million were recorded as a loss on extinguishment of debt, along with the $427,000 unamortized debt discount and $58,000 of deferred loan issuance fees. In addition, Mahyco’s option to place another $5.0 million of convertible debt was surrendered with the repayment and the related derivative liabilities totaling $1.6 million were released and recorded as a gain on extinguishment of debt.
Under this new loan and security agreement with the Bank, interest accrues at a floating annual rate equal to nine tenths of one percentage point (0.90%) above the prime rate published from time to time in The Wall Street Journal. The agreement requires us to make monthly interest-only payments through December 2017. After this date, we are required to make thirty-six (36) equal monthly installments of principal, plus accrued interest. Our final payment, due on the maturity date of December 1, 2020, shall include all outstanding principal and accrued and unpaid interest plus a final end of term payment equal to $0.6 million. Should the loan be repaid prior to the maturity date, a prepayment fee is equal to 3% of the outstanding principal amount if prepayment occurs after December 29, 2016 but on or before December 29, 2017, and 1% of the outstanding principal amount if the prepayment occurs after December 29, 2017.
This loan and security agreement contains customary events of default and covenants, including a financial covenant that requires us to maintain either a liquidity ratio (defined as the ratio of our cash, cash equivalents and net accounts receivable to our obligation owed to the Bank) of at least 1.4:1.0, or to cash collateralize 100% of our obligations to the Bank. Our obligations to the Bank are secured by substantially all of our assets, excluding intellectual property.
63
The following table summarizes our cash flows for the periods indicated (in thousands):
|
|
|
Year Ended December 31, |
|
|||||
|
|
|
2015 |
|
|
2014 |
|
||
|
Net cash provided by (used in): |
|
|
|
|
|
|
|
|
|
Operating activities |
|
$ |
(15,109 |
) |
|
$ |
(14,787 |
) |
|
Investing activities |
|
|
(46,360 |
) |
|
|
(1,591 |
) |
|
Financing activities |
|
|
68,871 |
|
|
|
30,114 |
|
|
Net increase in cash and cash equivalents |
|
$ |
7,402 |
|
|
$ |
13,736 |
|
Cash Flows from Operating Activities
Cash used in operating activities for the year ended December 31, 2015 was $15.1 million. Our net loss of $18.0 million and gain on expiration of warrant and derivative liabilities related to notes payable upon our initial public offering of $0.4 million were partly offset by non-cash charges of $1.4 million for stock-based compensation, $0.8 million for accretion of debt discount, $0.5 million for payment of research and development fees with shares, $0.3 million for depreciation and amortization, $0.2 million of loss on extinguishment of debt, and $0.1 million of net amortization of investment premium.
Cash used in operating activities for the year ended December 31, 2014 was $14.8 million. Our net loss of $18.3 million and decrease in net operating assets of $1.3 million were partly offset by non-cash charges of $1.5 million relating to the amendment of our Bioceres funding agreement, $1.0 million for stock-based compensation, $0.9 million for equity in loss of unconsolidated entity, $0.6 million change in fair value of derivative liabilities, $0.5 million for accretion of debt discount, and $0.4 million for depreciation and amortization.
Cash Flows from Investing Activities
Cash used in investing activities for the year ended December 31, 2015 of $46.4 million primarily consisted of $48.7 million of net investments purchased with proceeds generated from our initial public offering and $0.2 million of property and equipment purchases, which were partially offset by $2.5 million of proceeds from sales of investments.
Cash used in investment activities for the year ended December 31, 2014 of $1.6 million consisted primarily of our investment in Bioceres in accordance with our agreements concerning Verdeca.
Cash Flows from Financing Activities
Cash provided by financing activities for the year ended December 31, 2015 of $68.9 million was primarily from $60.0 million net proceeds in 2015 from our issuance of common stock as a result of the completed initial public offering in May 2015 and our additional sale of shares upon the exercise of the underwriters’ over-allotment option in June 2015. The increase was also a result of $44.6 million of net proceeds generated from loans executed in April and December 2015, partially offset by $34.8 million of payments on notes payable and convertible promissory notes and $1.3 million of debt extinguishment payments.
Cash from financing activities for the year ended December 31, 2014 of $30.1 million was related to the $32.8 million of net proceeds from our issuance of Series D preferred stock and common stock warrants in 2014, partially offset by $2.7 million of payments on notes payable, convertible promissory notes, and deferred offering costs.
64
Contractual Obligations and Other Commitments
Our future contractual obligations at December 31, 2015 were as follows (in thousands):
|
|
|
Payments Due by Period(2)(3) |
|
|||||||||||||||||
|
|
|
Less than 1 year |
|
|
1 to 3 Years |
|
|
3 to 5 Years |
|
|
More than 5 years |
|
|
Total |
|
|||||
|
Non-cancelable operating leases |
|
$ |
967 |
|
|
$ |
1,090 |
|
|
$ |
— |
|
|
$ |
— |
|
|
$ |
2,057 |
|
|
Notes payable (1) |
|
|
— |
|
|
|
16,667 |
|
|
|
8,958 |
|
|
|
— |
|
|
|
25,625 |
|
|
Total contractual obligations |
|
$ |
967 |
|
|
$ |
17,757 |
|
|
$ |
8,958 |
|
|
$ |
— |
|
|
$ |
27,682 |
|
|
(1) |
Years 3 to 5 years include an end of term payment of $625. |
|
(2) |
Does not include any amounts related to contract research or other agreements with unrelated parties that require us to pay certain funding commitments, as these agreements are cancelable by us. |
|
(3) |
Does not include any payments we may have to make under the contingent liability related to the Anawah acquisition, as the amount and timing of the ultimate payments are unknown. Please see Note 12 of the notes to our consolidated financial statements for more information. |
We are obligated to make future payments to related and unrelated parties under in-license agreements, including certain license fees, royalties, and milestone fees. In addition, certain royalty payments ranging from the low single digits to mid-teens are payable on net revenue amounts as defined in the in-licensing agreements. Milestone payments under these agreements may also be payable upon the successful development or implementation of various technologies. The amount and timing of these payments are uncertain and have been excluded from the above table.
Off-Balance Sheet Arrangements
Since our inception, we have not engaged in any off-balance sheet arrangements, including the use of structured finance, special purpose entities, or variable interest entity other than Verdeca, which is discussed in the footnotes.
Critical Accounting Polices and Estimates
Our management’s discussion and analysis of our financial condition and results of operations is based on our financial statements, which have been prepared in accordance with generally accepted accounting principles in the United States, or U.S. GAAP. The preparation of these financial statements requires us to make estimates and assumptions that affect the reported amounts of assets and liabilities and the disclosure of contingent assets and liabilities at the date of the financial statements, as well as the reported revenue generated and expenses incurred during the reporting periods. Our estimates are based on our historical experience and on various other factors that we believe are reasonable under the circumstances, the results of which form the basis for making judgments about the carrying value of assets and liabilities that are not readily apparent from other sources. Actual results may differ from these estimates under different assumptions or conditions. We believe that the accounting policies discussed below are critical to understanding our historical and future performance, as these policies relate to the more significant areas involving management’s judgments and estimates.
Revenue Recognition
We generate revenues through sales of product, license agreements, contract research agreements, and government grants. Revenue generated from our license agreements may include up-front, nonrefundable license fees, annual license fees, milestone payments, and future value-sharing payments subsequent to commercialization by our partners. We recognize revenue when the following criteria have been met: persuasive evidence of an arrangement with the customer exists, price and terms of the arrangement are fixed or determinable, delivery of the product has occurred or the service has been performed in accordance with the terms of the arrangement, and collectability is reasonably assured.
65
We generally recognize product revenues once passage of title has occurred. Shipping and handling costs charged to customers are recorded as revenues and included in cost of product revenues at the time the sale is recognized.
For revenue agreements with multiple-element arrangements, such as license and contract research agreements, we evaluate the arrangements to determine whether the deliverables can be separated or whether they must be accounted for as a single unit of accounting. This determination is generally based on whether any deliverable has stand-alone value to the customer. This analysis also establishes a selling price hierarchy for determining how to allocate arrangement consideration to identified units of accounting. When deliverables are separable, consideration received is allocated to the separate units of accounting based on the relative selling price method and the appropriate revenue recognition principles are applied to each unit. The selling price used for each unit of accounting is based on estimated selling price as neither vendor-specific nor third-party evidence is available. When we determine that an arrangement should be accounted for as a single unit of accounting, we must determine the period over which the performance obligations will be performed and revenue will be recognized over the performance period.
We have determined that, at the inception of each license agreement, there is only one deliverable for the license for, access to, and assistance with the development of the specified intellectual property. We recognize revenue from upfront payments proportionally over the term of our estimated period of performance under the agreement. On a quarterly basis, we review our estimated period of performance for our license agreements based on the progress under the arrangement and account for the impact of any changes on a prospective basis. We recognize annual license fees proportionally over the related term subject to cancellation provisions.
We recognize revenue related to milestone payments when the contractually specified performance obligations are achieved. Performance obligations typically consist of significant milestones in the development life cycle of the related technology, such as achievement of specific technological targets, successful results from field trials, filing for approval with regulatory agencies, approvals granted by regulatory agencies and commercial launch of a product utilizing the licensed technology.
Contract research revenue consists of amounts earned from performing contracted research activities for third parties. Activities performed are related to breeding programs or the genetic engineering of plants and are subject to an executed agreement. We generally recognize fees for research activities ratably over the contractually specified performance period.
Grant revenues are recognized as eligible research and development expenses are incurred using a proportional performance recognition methodology.
Deferred revenue represents the portion of payments received that has not been recognized.
Inventories
Inventory costs are tracked on a lot-identified basis, valued at the lower of cost or market and are included as cost of product sales when sold. We compare the cost of inventories with market value and write down inventories to market value, if lower. We provide for inventory reserves when conditions indicate that the selling price may be less than cost due to physical deterioration, obsolescence, changes in price levels, or other factors. Additionally, we provide reserves for excess and slow-moving inventory to its estimated net realizable value. The reserves are based upon estimates about future demand from our customers and distributors and market conditions. Future events that could significantly influence our judgment and related estimates include conditions in target markets, introduction of new products or changes to current or future competitor products.
66
We recognize compensation expense related to the employee stock purchase plan and stock options granted to employees and directors based on the estimated fair value of the awards on the date of grant, net of estimated forfeitures. We estimate the grant date fair value, and the resulting stock-based compensation expense, using the Black-Scholes option-pricing model. The grant date fair value of the stock-based awards is generally recognized on a straight-line basis over the requisite service period, which is generally the vesting period of the respective awards.
We recognize compensation expense for equity instruments issued to non-employees based on the estimated fair value of the equity instrument. The fair value of the non-employee awards is subject to re-measurement at each reporting period until services required under the arrangement are completed, which is the vesting date.
We recorded stock-based compensation expense related to equity awards of $1.4 million and $1.0 million for the years ended December 31, 2015 and 2014, respectively.
In February and March 2015, our Board of Directors granted options to purchase an aggregate of 307,493 shares of common stock with an exercise price of $7.20 per share. In May 2015, our Board of Directors granted options to purchase 45,000 shares of common stock with an exercise price of $8.00 per share.
In determining the fair value of stock-based awards, we use the Black-Scholes option-pricing model and assumptions discussed below. Each of these inputs is subjective and generally requires significant judgment to determine.
Expected Term—The expected term represents the period that stock-based awards are expected to be outstanding and was estimated based on historical and anticipated future exercise activity.
Expected Volatility—Since we were privately held and do not have any trading history for our common stock, the expected volatility was estimated based on the average historical volatilities of common stock of comparable publicly traded entities over a period equal to the expected term of the stock option grants. The comparable companies were chosen based on their similar size, stage in the life cycle, or area of specialty. We will continue to apply this process until a sufficient amount of historical information regarding the volatility of our own stock price becomes available.
Risk-Free Interest Rate—The risk-free interest rate is based on the U.S. Treasury zero coupon issues in effect at the time of grant for periods corresponding with the expected term of option.
Expected Dividend—We have never paid dividends on our common stock and have no plans to pay dividends on our common stock. Therefore, we used an expected dividend yield of zero.
In addition to the Black-Scholes assumptions, we estimate our forfeiture rate based on an analysis of our actual forfeitures and will continue to evaluate the adequacy of the forfeiture rate based on actual forfeiture experience, analysis of employee turnover behavior, and other factors. The impact from any forfeiture rate adjustment would be recognized in full in the period of adjustment and if the actual number of future forfeitures differs from our estimates, we might be required to record adjustments to stock-based compensation in future periods.
67
Historically, for all periods prior to this initial public offering, the fair value of the shares of common stock underlying our share-based awards were estimated on each grant date by our board of directors, which intended all stock options granted to be exercisable at a price per share not less than the per share fair market value of our common stock underlying those options on the date of grant. Given the previous absence of a public trading market for our common stock, our board of directors exercised reasonable judgment and considered a number of objective and subjective factors to determine the best estimate of the fair value of our common stock, including our stage of development; progress of our research and development efforts; the rights, preferences and privileges of our preferred stock relative to those of our common stock; equity market conditions affecting comparable public companies and the lack of marketability of our common stock. To assist our board of directors in this determination and in order to set the exercise price of each stock option grant, our management team informed them of the most recent available valuation analysis prior to the dates of grant.
For purposes of our February and March 2015 option grants, our board of directors determined the fair market value of our common stock after consideration of the factors listed above, including the third-party valuations as of December 31, 2014 and March 31, 2015. The valuations used the income approach and the market approach. The income approach estimates the fair value of a company based on the present value of the company’s future estimated cash flows. These future cash flows are discounted to their present values using an appropriate discount rate, to reflect the risks inherent in the company achieving these estimated cash flows. The discount rate used in our valuation was based primarily on benchmark venture capital studies of other companies in similar stages of development. The market approach determines the fair value of the company by estimating the value of the business based on projecting a future value under an initial public offering scenario, referencing recent biotechnology initial public offerings, and an estimate of value under a merger and acquisition scenario. The estimated enterprise value is then allocated to the common stock using both the Option Pricing Method, or OPM, and the Probability Weighted Expected Return Method, or PWERM, or the hybrid method. The hybrid method applies the PWERM utilizing the probability of two exit scenarios, an initial public offering or an acquisition, and the OPM was utilized in the continuing as a private company scenario.
For future stock options and other equity awards, our board of directors will determine the fair value of each share of underlying common stock based on the closing price of our common stock as reported on the NASDAQ Global Market on the date of grant.
Income Taxes
We use the asset and liability method of accounting for income taxes. Under this method, deferred tax assets and liabilities are determined based on the differences between the financial reporting and the tax bases of assets and liabilities and are measured using the enacted tax rates and laws that will be in effect when the differences are expected to reverse. A valuation allowance is provided when it is more likely than not that some portion or all of a deferred tax asset will not be realized.
Recent Accounting Pronouncements
In May 2014, the Financial Accounting Standards Board (“FASB”) issued Accounting Standards Update (“ASU”) 2014-09, Revenue from Contracts with Customers, which requires an entity to recognize the amount of revenue to which it expects to be entitled for the transfer of promised goods or services to customers. The ASU will replace most existing revenue recognition guidance in U.S. GAAP when it becomes effective. In August 2015, FASB issued ASU 2015-14, Revenue from Contracts with Customers, which defers the effective date by one year. The new standard will be effective for the Company on January 1, 2018, which is the effective date for public companies. Early application with an effective date of January 1, 2017 is permitted. The standard permits the use of either the retrospective or cumulative effect transition method. The Company is evaluating the effect that ASU 2014-09 and ASU 2015-14 will have on its consolidated financial statements and related disclosures. The Company has not yet selected a transition method nor has it determined the effect of the standard on its ongoing financial reporting.
68
In August 2014, the FASB issued ASU 2014-15, Disclosure of Uncertainties about an Entity’s Ability to Continue as a Going Concern, which provides guidance on determining when and how to disclose going-concern uncertainties in the consolidated financial statements. The new standard requires management to perform interim and annual assessments of an entity’s ability to continue as a going concern within one year of the date the consolidated financial statements are issued. An entity must provide certain disclosures if “conditions or events raise substantial doubt about the entity’s ability to continue as a going concern.” The ASU applies to all entities and is effective for annual periods ending after December 15, 2016, and interim periods thereafter, with early adoption permitted. The Company does not anticipate a material change to its consolidated financial statements upon the adoption of this ASU. However, it will be required to evaluate and determine if further disclosure is necessary at each balance sheet date.
In February 2015, the FASB issued ASU 2015-02, Consolidation (Topic 810): Amendments to the Consolidation Analysis. The amendments significantly change the consolidation analysis required under U.S. GAAP. Reporting entities will need to reevaluate all their previous consolidation conclusions. ASU 2015-02 will be effective for fiscal years, and for interim periods within those fiscal years, beginning after December 15, 2015. Early adoption is permitted, including adoption in an interim period. If an entity early adopts the amendments in an interim period, any adjustments should be reflected as of the beginning of the fiscal year that includes that interim period. The Company does not anticipate that the adoption of this ASU will materially change the presentation of our consolidated financial statements.
In April 2015, the FASB issued ASU 2015-03, Interest-Imputation of Interest (Subtopic 835-30): Simplifying the Presentation of Debt Issuance Costs, which requires debt issuance costs to be presented in the balance sheet as a direct deduction from the associated debt liability. ASU 2015-03 will not change the amortization of debt issuance costs, which will continue to follow the existing accounting guidance. ASU 2015-03 will be effective for interim and annual reporting periods beginning after December 15, 2015. Early application is permitted. The reporting entity must retrospectively apply ASU 2015-03. The Company had adopted ASU 2015-03 for the annual reporting period of December 31, 2015. Based on the Company’s analysis to assess the impact on prior periods in accordance with the retrospective application, debt issuance costs were immaterial thus no adjustments were made on the balance sheet classification.
In July 2015, the FASB issued ASU 2015-11, Inventory (Topic 330): Simplifying the Measurement of Inventory, which applies guidance on subsequent measurement of inventory. An entity should measure inventory at the lower of cost and net realizable value. Net realizable value is the estimated selling prices in the ordinary course of business, less reasonable predictable costs of completion, disposal and transportation. The guidance excludes inventory measured using LIFO or the retail inventory method. ASU 2015-11 will be effective for interim and annual reporting periods beginning after December 15, 2016. Early application is permitted. The Company does not anticipate that the adoption of this ASU will materially change the presentation of its consolidated financial statements.
In November 2015, the FASB issued ASU 2015-17, Income Taxes (Topic 740). Current GAAP requires an entity to separate deferred income tax liabilities and assets into current and noncurrent amounts in a classified statement of financial position. The amendment in this update requires that deferred tax liabilities and assets be classified as noncurrent in a classified statement of financial position. This standard is effective for fiscal years, and interim periods within those fiscal years, beginning after December 15, 2016, with early adoption permitted. The Company had prospectively adopted ASU 2015-17 for the annual reporting period of December 31, 2015.
In January 2016, the FASB issued ASU 2016-01, Financial Instruments – Overall (Subtopic 825-10): Recognition and Measurement of Financial Assets and Financial Liabilities. The amendments in this update impacts classification, additional fair value measurement, impairment assessment of equity investments and current required disclosures. This standard is effective for fiscal years, and interim periods within those fiscal years, beginning after December 15, 2017, with early adoption permitted if the entity meets certain early application guidance. The Company is currently evaluating the impact of the adoption of ASU 2015-03 on its operating results and financial position.
69
Item 7A. Quantitative and Qualitative Disclosures About Market Risk.
The primary objective of our investment activities is to preserve our capital to fund our operations. We also seek to maximize income from our investments without assuming significant risk. To achieve our objectives, we maintain a portfolio of cash equivalents and investments in a variety of securities of high credit quality. As of December 31, 2015, we had cash and cash equivalents of $24.0 million, short-term investments of $26.3 million and long-term investments of $19.7 million, consisting primarily of cash equivalents and other liquid investments deposited in highly rated financial institutions in the United States. A portion of our investments may be subject to interest rate risk and could fall in value if market interest rates increase. However, because our investments are primarily shortterm in duration, we believe that our exposure to interest rate risk is not significant and a 1% movement in market interest rates would not have a significant impact on the total value of our portfolio. We actively monitor changes in interest rates.
70
Item 8. Financial Statements and Supplementary Data.
INDEX TO CONSOLIDATED FINANCIAL STATEMENTS
|
72 |
|
|
|
|
|
73 |
|
|
|
|
|
Consolidated Statements of Operations and Comprehensive Loss |
74 |
|
|
|
|
Consolidated Statements of Redeemable and Convertible Preferred Stock and Stockholders’ Deficit |
75 |
|
|
|
|
76 |
|
|
|
|
|
77 |
71
Report of Independent Registered Public Accounting Firm
The Board of Directors and Stockholders of
Arcadia Biosciences, Inc.
Davis, California
We have audited the accompanying consolidated balance sheets of Arcadia Biosciences, Inc. and its subsidiary (the “Company”) as of December 31, 2015 and 2014, and the related consolidated statements of operations and comprehensive loss, redeemable and convertible preferred stock and stockholders’equity (deficit), and cash flows for each of the two years in the period ended December 31, 2015. These financial statements are the responsibility of the Company’s management. Our responsibility is to express an opinion on the financial statements based on our audits.
We conducted our audits in accordance with the standards of the Public Company Accounting Oversight Board (United States). Those standards require that we plan and perform the audit to obtain reasonable assurance about whether the financial statements are free of material misstatement. The Company is not required to have, nor were we engaged to perform, an audit of its internal control over financial reporting. Our audits included consideration of internal control over financial reporting as a basis for designing audit procedures that are appropriate in the circumstances, but not for the purpose of expressing an opinion on the effectiveness of the Company’s internal control over financial reporting. Accordingly, we express no such opinion. An audit also includes examining, on a test basis, evidence supporting the amounts and disclosures in the financial statements, assessing the accounting principles used and significant estimates made by management, as well as evaluating the overall financial statement presentation. We believe that our audits provide a reasonable basis for our opinion.
In our opinion, such consolidated financial statements present fairly, in all material respects, the financial position of Arcadia Biosciences, Inc. and subsidiary at December 31, 2015 and 2014, and the results of their operations and their cash flows for each of the two years in the period ended December 31, 2015, in conformity with accounting principles generally accepted in the United States of America.
/s/ Deloitte & Touche LLP
March 8, 2016
Phoenix, Arizona
72
(In thousands, except share data)
|
|
As of December 31, |
|
||||
|
|
2015 |
|
2014 |
|
||
|
Assets |
|
|
|
|
|
|
|
Current assets: |
|
|
|
|
|
|
|
Cash and cash equivalents |
$ |
23,973 |
|
$ |
16,571 |
|
|
Short-term investments |
|
26,270 |
|
|
— |
|
|
Accounts receivable |
|
706 |
|
|
1,042 |
|
|
Unbilled revenue |
|
82 |
|
|
380 |
|
|
Inventories — current |
|
294 |
|
|
424 |
|
|
Prepaid expenses and other current assets |
|
692 |
|
|
278 |
|
|
Total current assets |
|
52,017 |
|
|
18,695 |
|
|
Property and equipment, net |
|
585 |
|
|
728 |
|
|
Inventories — noncurrent |
|
1,867 |
|
|
2,149 |
|
|
Cost method investment |
|
— |
|
|
500 |
|
|
Long-term investments |
|
19,748 |
|
|
— |
|
|
Other noncurrent assets |
|
25 |
|
|
2,817 |
|
|
Total assets |
$ |
74,242 |
|
$ |
24,889 |
|
|
Liabilities, redeemable and convertible preferred stock and stockholders’ equity (deficit) |
|
|
|
|
|
|
|
Current liabilities: |
|
|
|
|
|
|
|
Accounts payable and accrued expenses |
$ |
2,423 |
|
$ |
3,197 |
|
|
Amounts due to related parties |
|
19 |
|
|
56 |
|
|
Promissory notes — current |
|
— |
|
|
1,055 |
|
|
Convertible promissory notes |
|
— |
|
|
4,551 |
|
|
Unearned revenue — current |
|
1,008 |
|
|
830 |
|
|
Derivative liabilities related to convertible promissory notes |
|
— |
|
|
1,580 |
|
|
Total current liabilities |
|
3,450 |
|
|
11,269 |
|
|
Notes payable |
|
24,930 |
|
|
— |
|
|
Note payable to related party |
|
— |
|
|
8,000 |
|
|
Promissory notes — noncurrent |
|
— |
|
|
869 |
|
|
Unearned revenue — noncurrent |
|
2,637 |
|
|
3,636 |
|
|
Other noncurrent liabilities |
|
3,000 |
|
|
3,000 |
|
|
Total liabilities |
|
34,017 |
|
|
26,774 |
|
|
Redeemable convertible preferred stock, no par value—0 and 10,553,770 shares authorized as of December 31, 2015 and December 31, 2014; 0 and 9,587,764 issued and outstanding as of December 31, 2015 and December 31, 2014 |
|
— |
|
|
34,098 |
|
|
Convertible preferred stock, no par value—0 and 94,586,346 shares authorized as of December 31, 2015 and December 31, 2014; 0 and 23,385,029 issued and outstanding as of December 31, 2015 and December 31, 2014 |
|
— |
|
|
48,783 |
|
|
Stockholders’ equity (deficit): |
|
|
|
|
|
|
|
Preferred stock, $0.001 par value—20,000,000 and 0 shares authorized as of December 31, 2015 and December 31, 2014; no shares issued and outstanding as of December 31, 2015 and December 31, 2014 |
|
— |
|
|
— |
|
|
Common stock, $0.001 par value—400,000,000 and 140,000,000 shares authorized as of December 31, 2015 and December 31, 2014; 44,184,195 and 2,074,030 shares issued and outstanding as of December 31, 2015 and December 31, 2014 |
|
44 |
|
|
— |
|
|
Additional paid-in capital |
|
172,222 |
|
|
29,204 |
|
|
Accumulated deficit |
|
(131,926 |
) |
|
(113,970 |
) |
|
Accumulated other comprehensive loss |
|
(115 |
) |
|
— |
|
|
Total stockholders’ equity (deficit) |
|
40,225 |
|
|
(84,766 |
) |
|
Total liabilities, redeemable and convertible preferred stock and stockholders’ equity (deficit) |
$ |
74,242 |
|
$ |
24,889 |
|
The accompanying notes are an integral part of these consolidated financial statements.
73
Consolidated Statements of Operations and Comprehensive Loss
(In thousands, except share and share data)
|
|
|
Year Ended December 31, |
|
|||||
|
|
|
2015 |
|
|
2014 |
|
||
|
Revenues: |
|
|
|
|
|
|
|
|
|
Product |
|
$ |
466 |
|
|
$ |
355 |
|
|
License |
|
|
1,216 |
|
|
|
2,325 |
|
|
Contract research and government grants |
|
|
3,732 |
|
|
|
4,302 |
|
|
Total revenues (which includes $91 and $191 from related parties — Note 17) |
|
|
5,414 |
|
|
|
6,982 |
|
|
Operating expenses: |
|
|
|
|
|
|
|
|
|
Cost of product revenues |
|
|
892 |
|
|
|
1,997 |
|
|
Research and development |
|
|
8,966 |
|
|
|
10,012 |
|
|
Selling, general and administrative |
|
|
11,119 |
|
|
|
10,126 |
|
|
Total operating expenses |
|
|
20,977 |
|
|
|
22,135 |
|
|
Loss from operations |
|
|
(15,563 |
) |
|
|
(15,153 |
) |
|
Interest expense |
|
|
(2,658 |
) |
|
|
(1,394 |
) |
|
Other income (expense), net |
|
|
521 |
|
|
|
(597 |
) |
|
Loss on extinguishment of debt |
|
|
(230 |
) |
|
|
— |
|
|
Net loss before income taxes and equity in loss of unconsolidated entity |
|
|
(17,930 |
) |
|
|
(17,144 |
) |
|
Income tax provision |
|
|
(26 |
) |
|
|
(263 |
) |
|
Equity in loss of unconsolidated entity |
|
|
— |
|
|
|
(932 |
) |
|
Net loss |
|
|
(17,956 |
) |
|
|
(18,339 |
) |
|
Accretion of redeemable convertible preferred stock to redemption value |
|
|
(2,574 |
) |
|
|
(3,738 |
) |
|
Deemed dividends to warrant holder |
|
|
(197 |
) |
|
|
— |
|
|
Net loss attributable to common stockholders |
|
$ |
(20,727 |
) |
|
$ |
(22,077 |
) |
|
Net loss per share attributable to common stockholders: |
|
|
|
|
|
|
|
|
|
Basic and diluted |
|
$ |
(0.73 |
) |
|
$ |
(10.71 |
) |
|
Weighted-average number of shares used in per share calculations: |
|
|
|
|
|
|
|
|
|
Basic and diluted |
|
|
28,559,119 |
|
|
|
2,061,278 |
|
|
Other comprehensive loss, net of tax |
|
|
|
|
|
|
|
|
|
Unrealized losses on available-for-sale securities |
|
|
(115 |
) |
|
|
— |
|
|
Other comprehensive loss |
|
|
(115 |
) |
|
|
— |
|
|
Comprehensive loss attributable to common stockholders |
|
$ |
(20,842 |
) |
|
$ |
(22,077 |
) |
The accompanying notes are an integral part of these consolidated financial statements.
74
Consolidated Statements of Redeemable and Convertible Preferred Stock and Stockholders’ Equity (Deficit)
(In thousands, except share data)
|
|
|
Redeemable Convertible Preferred Stock |
|
|
Convertible Preferred Stock |
|
|
Preferred Stock |
|
|
Common Stock |
|
|
Additional Paid-In Capital |
|
|
Accumulated Deficit |
|
|
Accumulated Other Comprehensive (Loss) |
|
|
Total Stockholders’ Equity (Deficit) |
|
||||||||||||||||||||||||
|
|
|
Shares |
|
|
Amount |
|
|
Shares |
|
|
Amount |
|
|
Shares |
|
|
Amount |
|
|
Shares |
|
|
Amount |
|
|
|
|
|
|
|
|
|
|
|
|
|
|
|
|
|
||||||||
|
Balance at January 1, 2014 |
|
|
— |
|
|
$ |
— |
|
|
|
— |
|
|
$ |
— |
|
|
|
23,385,029 |
|
|
$ |
— |
|
|
|
2,056,557 |
|
|
$ |
— |
|
|
$ |
78,334 |
|
|
$ |
(95,631 |
) |
|
|
— |
|
|
$ |
(17,297 |
) |
|
Exercise of stock options |
|
|
— |
|
|
|
— |
|
|
|
— |
|
|
|
— |
|
|
|
— |
|
|
|
— |
|
|
|
17,473 |
|
|
|
— |
|
|
|
19 |
|
|
|
— |
|
|
|
— |
|
|
|
19 |
|
|
Preferred stock reclassification |
|
|
— |
|
|
|
— |
|
|
|
23,385,029 |
|
|
|
48,783 |
|
|
|
(23,385,029 |
) |
|
|
— |
|
|
|
— |
|
|
|
— |
|
|
|
(48,783 |
) |
|
|
— |
|
|
|
— |
|
|
|
(48,783 |
) |
|
Stock-based compensation |
|
|
— |
|
|
|
— |
|
|
|
— |
|
|
|
— |
|
|
|
— |
|
|
|
— |
|
|
|
— |
|
|
|
— |
|
|
|
976 |
|
|
|
— |
|
|
|
— |
|
|
|
976 |
|
|
Issuance of preferred stock, net of issuance cost of $194 |
|
|
9,587,764 |
|
|
|
30,360 |
|
|
|
— |
|
|
|
— |
|
|
|
— |
|
|
|
— |
|
|
|
— |
|
|
|
— |
|
|
|
— |
|
|
|
— |
|
|
|
— |
|
|
|
— |
|
|
Issuance of common stock warrants |
|
|
— |
|
|
|
— |
|
|
|
— |
|
|
|
— |
|
|
|
— |
|
|
|
— |
|
|
|
— |
|
|
|
— |
|
|
|
2,396 |
|
|
|
— |
|
|
|
— |
|
|
|
2,396 |
|
|
Accretion of redeemable convertible preferred stock to redemption value |
|
|
|
|
|
|
3,738 |
|
|
|
— |
|
|
|
— |
|
|
|
— |
|
|
|
— |
|
|
|
— |
|
|
|
— |
|
|
|
(3,738 |
) |
|
|
— |
|
|
|
— |
|
|
|
(3,738 |
) |
|
Net loss |
|
|
— |
|
|
|
— |
|
|
|
— |
|
|
|
— |
|
|
|
— |
|
|
|
— |
|
|
|
— |
|
|
|
— |
|
|
|
— |
|
|
|
(18,339 |
) |
|
|
— |
|
|
|
(18,339 |
) |
|
Balance at December 31, 2014 |
|
|
9,587,764 |
|
|
|
34,098 |
|
|
|
23,385,029 |
|
|
|
48,783 |
|
|
|
— |
|
|
|
— |
|
|
|
2,074,030 |
|
|
|
— |
|
|
|
29,204 |
|
|
|
(113,970 |
) |
|
|
|
|
|
|
(84,766 |
) |
|
Exercise of stock options |
|
|
— |
|
|
|
— |
|
|
|
— |
|
|
|
— |
|
|
|
— |
|
|
|
— |
|
|
|
609,066 |
|
|
|
1 |
|
|
|
360 |
|
|
|
— |
|
|
|
— |
|
|
|
361 |
|
|
Stock-based compensation |
|
|
— |
|
|
|
— |
|
|
|
— |
|
|
|
— |
|
|
|
— |
|
|
|
— |
|
|
|
— |
|
|
|
— |
|
|
|
1,392 |
|
|
|
|
|
|
|
— |
|
|
|
1,392 |
|
|
Accretion of redeemable convertible preferred stock to redemption value |
|
|
— |
|
|
|
2,574 |
|
|
|
— |
|
|
|
— |
|
|
|
— |
|
|
|
— |
|
|
|
— |
|
|
|
— |
|
|
|
(2,574 |
) |
|
|
— |
|
|
|
— |
|
|
|
(2,574 |
) |
|
Preferred stock conversion to common stock upon the IPO |
|
|
(9,587,764 |
) |
|
|
(36,672 |
) |
|
|
(23,385,029 |
) |
|
|
(48,783 |
) |
|
|
— |
|
|
|
— |
|
|
|
32,972,793 |
|
|
|
33 |
|
|
|
85,422 |
|
|
|
— |
|
|
|
— |
|
|
|
85,455 |
|
|
Issuance of common stock upon the IPO, net of issuance costs of $9,799 |
|
|
— |
|
|
|
— |
|
|
|
— |
|
|
|
— |
|
|
|
— |
|
|
|
— |
|
|
|
8,528,306 |
|
|
|
8 |
|
|
|
58,420 |
|
|
|
— |
|
|
|
— |
|
|
|
58,428 |
|
|
Reclassification due to re- incorporation upon the IPO |
|
|
— |
|
|
|
— |
|
|
|
— |
|
|
|
— |
|
|
|
— |
|
|
|
— |
|
|
|
— |
|
|
|
2 |
|
|
|
(2 |
) |
|
|
— |
|
|
|
— |
|
|
|
— |
|
|
Deemed dividend to common stock warrant holder |
|
|
— |
|
|
|
— |
|
|
|
— |
|
|
|
— |
|
|
|
— |
|
|
|
— |
|
|
|
— |
|
|
|
— |
|
|
|
(197 |
) |
|
|
— |
|
|
|
— |
|
|
|
(197 |
) |
|
Increase in value of common stock warrant due to modification |
|
|
— |
|
|
|
— |
|
|
|
— |
|
|
|
— |
|
|
|
— |
|
|
|
— |
|
|
|
— |
|
|
|
— |
|
|
|
197 |
|
|
|
— |
|
|
|
— |
|
|
|
197 |
|
|
Other comprehensive loss |
|
|
|
|
|
|
|
|
|
|
|
|
|
|
|
|
|
|
|
|
|
|
— |
|
|
|
— |
|
|
|
— |
|
|
|
— |
|
|
|
— |
|
|
|
(115 |
) |
|
|
(115 |
) |
|
Net loss |
|
|
— |
|
|
|
— |
|
|
|
— |
|
|
|
— |
|
|
|
— |
|
|
|
— |
|
|
|
— |
|
|
|
— |
|
|
|
— |
|
|
|
(17,956 |
) |
|
|
— |
|
|
|
(17,956 |
) |
|
Balance at December 31, 2015 |
|
|
— |
|
|
$ |
— |
|
|
|
— |
|
|
$ |
— |
|
|
|
— |
|
|
$ |
— |
|
|
|
44,184,195 |
|
|
$ |
44 |
|
|
$ |
172,222 |
|
|
$ |
(131,926 |
) |
|
$ |
(115 |
) |
|
$ |
40,225 |
|
The accompanying notes are an integral part of these consolidated financial statements.
75
Consolidated Statements of Cash Flows
(In thousands)
|
|
|
Year Ended December 31, |
|
|||||
|
|
|
2015 |
|
|
2014 |
|
||
|
CASH FLOWS FROM OPERATING ACTIVITIES: |
|
|
|
|
|
|
|
|
|
Net loss |
|
$ |
(17,956 |
) |
|
$ |
(18,339 |
) |
|
Adjustments to reconcile net loss to cash used in operating activities: |
|
|
|
|
|
|
|
|
|
Depreciation and amortization |
|
|
294 |
|
|
|
358 |
|
|
(Gain) Loss on disposal of equipment |
|
|
(10 |
) |
|
|
3 |
|
|
Net amortization of investment premium |
|
|
85 |
|
|
|
— |
|
|
Payment of research and develop fees with cost investment |
|
|
500 |
|
|
|
— |
|
|
Equity in loss of unconsolidated entity |
|
|
— |
|
|
|
932 |
|
|
Loss related to amendment of Bioceres funding agreement |
|
|
— |
|
|
|
1,450 |
|
|
Stock-based compensation |
|
|
1,392 |
|
|
|
976 |
|
|
Common stock warrants issued for services |
|
|
— |
|
|
|
93 |
|
|
Change in fair value of derivative liabilities related to convertible promissory notes |
|
|
9 |
|
|
|
611 |
|
|
Gain on expiration of warrant and derivative liability related to notes payable upon IPO |
|
|
(437 |
) |
|
|
— |
|
|
Accretion of debt discount |
|
|
837 |
|
|
|
468 |
|
|
Loss on extinguishment of debt |
|
|
230 |
|
|
|
— |
|
|
Changes in operating assets and liabilities: |
|
|
|
|
|
|
|
|
|
Accounts receivable |
|
|
336 |
|
|
|
(393 |
) |
|
Amounts due from related parties |
|
|
— |
|
|
|
100 |
|
|
Unbilled revenue |
|
|
298 |
|
|
|
(105 |
) |
|
Inventories |
|
|
412 |
|
|
|
412 |
|
|
Prepaid expenses and other current assets |
|
|
(415 |
) |
|
|
(27 |
) |
|
Other noncurrent assets |
|
|
49 |
|
|
|
8 |
|
|
Accounts payable and accrued expenses |
|
|
125 |
|
|
|
(216 |
) |
|
Amounts due to related parties |
|
|
(37 |
) |
|
|
(140 |
) |
|
Unearned revenue |
|
|
(821 |
) |
|
|
(978 |
) |
|
Net cash used in operating activities |
|
|
(15,109 |
) |
|
|
(14,787 |
) |
|
CASH FLOWS FROM INVESTING ACTIVITIES: |
|
|
|
|
|
|
|
|
|
Cost method investment |
|
|
— |
|
|
|
(1,450 |
) |
|
Proceeds from sale of property and equipment |
|
|
10 |
|
|
|
7 |
|
|
Purchases of property and equipment |
|
|
(151 |
) |
|
|
(148 |
) |
|
Purchases of investments |
|
|
(48,719 |
) |
|
|
— |
|
|
Proceeds from sales of investments |
|
|
2,500 |
|
|
|
— |
|
|
Net cash used in investing activities |
|
|
(46,360 |
) |
|
|
(1,591 |
) |
|
CASH FLOWS FROM FINANCING ACTIVITIES: |
|
|
|
|
|
|
|
|
|
Proceeds from issuance of common stock upon IPO |
|
|
68,227 |
|
|
|
— |
|
|
Payments of IPO issuance costs |
|
|
(8,205 |
) |
|
|
(1,594 |
) |
|
Proceeds from issuance of notes payable |
|
|
45,000 |
|
|
|
— |
|
|
Payments of debt issuance costs |
|
|
(396 |
) |
|
|
— |
|
|
Payments of debt extinguishment costs |
|
|
(1,319 |
) |
|
|
— |
|
|
Proceeds from exercise of stock options |
|
|
360 |
|
|
|
19 |
|
|
Proceeds from issuance of redeemable convertible preferred stock and common stock warrants, net of issuance costs |
|
|
— |
|
|
|
32,845 |
|
|
Payments on notes payable to related party |
|
|
(8,000 |
) |
|
|
— |
|
|
Payments on notes payable and convertible promissory notes |
|
|
(26,796 |
) |
|
|
(1,084 |
) |
|
Capital lease payments |
|
|
— |
|
|
|
(72 |
) |
|
Net cash provided by financing activities |
|
|
68,871 |
|
|
|
30,114 |
|
|
Net increase in cash and cash equivalents |
|
|
7,402 |
|
|
|
13,736 |
|
|
Cash and cash equivalents — beginning of period |
|
|
16,571 |
|
|
|
2,835 |
|
|
Cash and cash equivalents — end of period |
|
$ |
23,973 |
|
|
$ |
16,571 |
|
|
SUPPLEMENTAL DISCLOSURES OF CASH FLOW INFORMATION: |
|
|
|
|
|
|
|
|
|
Cash paid for interest |
|
$ |
2,050 |
|
|
$ |
736 |
|
|
Cash paid for income taxes |
|
$ |
149 |
|
|
$ |
103 |
|
|
NONCASH INVESTING AND FINANCING ACTIVITIES: |
|
|
|
|
|
|
|
|
|
Accretion of redeemable convertible preferred stock |
|
$ |
2,574 |
|
|
$ |
3,738 |
|
|
Debt issuance costs included in accounts payable and accrued expenses |
|
$ |
46 |
|
|
$ |
— |
|
|
Deferred offering costs included in accounts payable and accrued expenses |
|
$ |
— |
|
|
$ |
1,165 |
|
|
Reclassification of deferred IPO costs to equity |
|
$ |
5,022 |
|
|
$ |
— |
|
|
Deemed dividend to common stock warrant holder |
|
$ |
197 |
|
|
$ |
— |
|
|
Issuance of warrants and derivatives in connection with notes payable issuance |
|
$ |
437 |
|
|
$ |
— |
|
|
Stock option exercise cost included in accounts receivable |
|
$ |
1 |
|
|
$ |
— |
|
|
Conversion of preferred stock to common stock upon IPO |
|
$ |
85,455 |
|
|
$ |
— |
|
The accompanying notes are an integral part of these consolidated financial statements.
76
Notes to Consolidated Financial Statements
Note 1. Description of Business
Organization
Arcadia Biosciences, Inc. (the "Company"), was incorporated in the state of Arizona in 2002 and maintains its headquarters in Davis, California, with additional facilities in Seattle, Washington; Phoenix, Arizona; and American Falls, Idaho. The Company was reincorporated in Delaware in March 2015.
The Company pursues agriculture-based biotechnology business opportunities that improve the environment and human health. The Company is an agricultural biotechnology trait company with an extensive and diversified portfolio of late-stage crop productivity and product quality traits addressing multiple crops that supply the global food and feed markets. Its traits are focused on high-value enhancements that increase crop yields by enabling plants to more efficiently manage environmental and nutrient stresses, and that enhance the quality and value of agricultural products.
In February 2012, the Company formed Verdeca LLC ("Verdeca", see Note 7), which is jointly owned with Bioceres, Inc. ("Bioceres USA"), a U.S. wholly owned subsidiary of Bioceres, S.A. ("Bioceres"), an Argentine corporation. Bioceres is an agricultural investment and development cooperative. Verdeca was formed to develop and deregulate soybean varieties using both partners’ agricultural technologies.
Reverse Stock Split
In April 2015, the Company’s board of directors approved an amended and restated certificate of incorporation to effect a reverse split on the Company’s issued and outstanding common stock at a one-for-four ratio. In May 2015, the Company’s stockholders approved the certificate of amendment, which the Company filed on May 8, 2015 with the Secretary of State of Delaware to effect the reverse split. The par value and authorized shares of common stock and convertible preferred stock were not adjusted as a result of the reverse split. All issued and outstanding common stock, options to purchase common stock and per share amounts contained in the consolidated financial statement have been retroactively adjusted to reflect the reverse stock split for all periods presented. The consolidated financial statements have also been retroactively adjusted to reflect a proportional adjustment for the conversion ratio for each series of redeemable convertible preferred stock and convertible preferred stock.
Initial Public Offering
In May 2015, the Company completed an initial public offering (“IPO”) and subsequently in June 2015, the Company completed the sale of additional shares upon exercise of the underwriters’ over-allotment option. In connection with the IPO, the Company issued 8,528,306 shares of common stock at $8.00 per share, which raised $58.4 million in proceeds, net of underwriting discounts and commissions of $4.8 million and offering expenses of $5.0 million. At the closing of the IPO, all of the outstanding shares of convertible preferred stock and redeemable convertible preferred stock were automatically converted into 32,972,793 shares of common stock. Following the IPO, there were no shares of preferred stock outstanding.
In connection with the IPO, the Company filed an Amended and Restated Certificate of Incorporation to change the authorized capital stock to 400,000,000 shares designated as common stock and 20,000,000 shares designated as preferred stock, all with a par value of $0.001 per share.
77
Arcadia Biosciences, Inc.
Notes to Consolidated Financial Statements (Continued)
Note 2. Summary of Significant Accounting Policies
Basis of Presentation and Principles of Consolidation
The consolidated financial statements include the accounts of the Company and Verdeca LLC. All intercompany balances and transactions have been eliminated in consolidation. The Company prepares its consolidated financial statements in conformity with accounting principles generally accepted in the United States of America, or U.S. GAAP (“GAAP”), and with the rules of the Securities and Exchange Commission. The Company uses a qualitative approach in assessing the consolidation requirement for variable interest entities ("VIEs"). This approach focuses on determining whether the Company has the power to direct the activities of the VIE that most significantly affect the VIE’s economic performance and whether the Company has the obligation to absorb losses, or the right to receive benefits, that could potentially be significant to the VIE. For all periods presented, the Company has determined that it is the primary beneficiary of Verdeca, which is a VIE. The Company evaluates its relationships with the VIEs upon the occurrence of certain significant events that affect the design, structure or other factors pertinent to the primary beneficiary determination.
Use of Estimates
The preparation of consolidated financial statements in conformity with GAAP requires management to make estimates and assumptions in the Company’s consolidated financial statements and notes thereto. Significant estimates and assumptions made by management included the determination of the provision for income taxes, costs to complete government grants and research contracts, reserves for inventory, and the development period of revenue-generating technologies. Management bases its estimates on historical experience and on various other market-specific and relevant assumptions that management believes to be reasonable under the circumstances. Actual results could differ from those estimates.
Cash and Cash Equivalents
The Company considers any liquid investments with a stated maturity of three months or less at the date of purchase to be cash equivalents. Cash and cash equivalents consist of cash on deposit with banks. The Company limits cash investments to financial institutions with high credit standings; therefore, management believes that there is no significant exposure to any credit risk in the Company’s cash and cash equivalents. However, as of December 31, 2015 and 2014, a substantial portion of the Company’s cash in depository accounts is in excess of the federal deposit insurance limits.
Investments in Equity and Debt Securities
The Company uses the equity method to account for investments in equity securities if the investment provides the Company the ability to exercise significant influence over operating and financial policies of the investee. The Company includes its proportionate share of earnings and/or losses of the equity method investee in its Consolidated Statements of Operations and Comprehensive Loss. The carrying value of the equity investments is reported using the equity method in the Consolidated Balance Sheets. As of December 31, 2015 and 2014, the Company’s investment in LCS is $0. See Note 6 – Investments in Unconsolidated Entity for additional information.
Investments in equity securities in which the Company holds less than 20% voting interest and on which the Company does not have the ability to exercise significant influence or account for under the equity method and do not have readily determinable fair values for are accounted for under the cost method. Cost method investments are originally recorded at cost and are reported on the Consolidated Balance Sheets.
78
Arcadia Biosciences, Inc.
Notes to Consolidated Financial Statements (Continued)
Investments in debt securities are carried at fair value and classified as available-for-sale. Realized gains and losses on available-for-sale securities are included in other income (loss) — net in our Consolidated Statements of Operations and Comprehensive Loss. Unrealized gains and losses, net of deferred taxes, on available-for-sale securities are included in our Consolidated Balance Sheets as a component of accumulated other comprehensive income (loss) ("AOCI”). Securities classified as available-for-sale are reported as cash and cash equivalent, short-term investments or long-term investments in the Consolidated Balance Sheets based on the nature of the investments and maturity period. Short-term investments have maturities of less than a year and long-term investments have maturities of a year and greater from the balance sheet date. The Company’s debt securities are primarily comprised of U.S. government securities, U.S. government agency securities, commercial paper, certificates of deposit, and money markets. These available-for-sale investments are held in the custody of a major financial institution.
Other-than-Temporary Impairments on Investment
The Company regularly reviews each of its investments for impairment by determining if the investment has sustained an other-than-temporary decline in its value, in which case the investment is written down to its fair value by a charge to earnings. Factors that are considered by the Company in determining whether an other-than-temporary decline in value has occurred include (i) the market value of the investment in relation to its cost basis, (ii) the financial condition of the investment, and (iii) the Company’s intent and ability to retain the investment for a sufficient period of time to allow for recovery of the market value of the investment. As of December 31, 2015 and 2014, there was no impairment of the Company’s investments.
Accounts Receivable
Accounts receivable represents amounts owed to the Company from product sales, licenses and contract research and government grants. The carrying value of the Company’s receivables represents estimated net realizable values. The Company generally does not require collateral and estimates any required allowance for doubtful accounts based on historical collection trends, the age of outstanding receivables, and existing economic conditions. If events or changes in circumstances indicate that specific receivable balances may be impaired, further consideration is given to the collectability of those balances and the allowance is recorded accordingly. Past-due receivable balances are written off when the Company’s internal collection efforts have been unsuccessful in collecting the amounts due. The Company had no amounts reserved for doubtful accounts at December 31, 2015 and 2014 as the Company expected full collection of the accounts receivable balances as of each of these dates.
SONOVA® Gamma Linolenic Acid (“GLA”) Safflower Oil Inventory
Proprietary safflower plants are grown, producing seed with a high-GLA content. This seed is used for subsequent plantings or processed, and sold as GLA oil, including Sonova 400 GLA safflower oils and Sonova Ultra GLA safflower oil, which we refer to as our Sonova products. Amounts inventoried consist primarily of fees paid to contracted cooperators to grow the crops and costs to process and store harvested seed. Inventory costs are tracked on a lot-identified basis, valued at the lower of cost or market, and are included as cost of product revenues when sold. The Company provides for inventory reserves when conditions indicate that the selling price may be less than cost due to physical deterioration, obsolescence, changes in price levels, or other factors. Additionally, the Company provides reserves for excess and slow-moving inventory on hand that is not expected to be sold within a reasonable timeframe to reduce the carrying amount to its estimated net realizable value. The reserves are based upon estimates about future demand from the Company’s customers and distributors and market conditions. The Company had inventory reserves for excess and slow-moving inventory of $2.3 million and $1.7 million as of December 31, 2015 and 2014, respectively, relating to reserves recorded primarily as a result of changes in conditions of specific customers and regulatory delays for the use of its Sonova products by certain new industries.
The inventories—current line item in the balance sheet consists of the cost of oil inventory forecasted to be sold in the next 12 months, as of the balance sheet date. The inventories—noncurrent line item consists of oil and seed inventory expected to be used in production or sold beyond the next 12 months, as of the balance sheet date.
79
Arcadia Biosciences, Inc.
Notes to Consolidated Financial Statements (Continued)
Raw materials inventories consist primarily of seed production costs incurred by our contracted cooperators. Finished goods inventories consist of GLA oil that is available for sale. Inventories consist of the following (in thousands):
|
|
|
As of December 31, |
|
|||||
|
|
|
2015 |
|
|
2014 |
|
||
|
Raw Materials |
|
$ |
665 |
|
|
$ |
1,004 |
|
|
Finished Goods |
|
|
1,496 |
|
|
|
1,569 |
|
|
Inventories |
|
$ |
2,161 |
|
|
$ |
2,573 |
|
Property and Equipment
Property and equipment acquisitions are recorded at cost. Provisions for depreciation are calculated using the straight-line method over the following average estimated useful lives of the assets:
|
|
|
Years |
|
|
Laboratory equipment |
|
5 |
|
|
Software and computer equipment |
|
3 |
|
|
Furniture and fixtures |
|
7 |
|
|
Vehicles |
|
5 |
|
|
Leasehold improvements |
|
2-10 |
* |
|
* |
Leasehold improvements are depreciated over the shorter of the estimated life of the asset or the remaining life of the lease. |
Impairment of Long-Lived Assets
The Company evaluates if events and circumstances have occurred that indicate the remaining estimated useful life of long-lived assets and identifiable intangible assets may warrant revision or that the remaining balance of these assets may not be recoverable. In evaluating for recoverability, the Company estimates the future undiscounted cash flows expected to result from the use of the assets and their eventual disposition. In the event that the balance of any asset exceeds the future undiscounted cash flow estimate, impairment is recognized based on the excess of the carrying amounts of the asset above its estimated fair value. As of December 31, 2015 and 2014, there was no impairment of the Company’s long-lived assets.
Fair Value of Financial Instruments
Fair value accounting is applied for all financial assets and liabilities and non-financial assets and liabilities that are recognized or disclosed at fair value in the consolidated financial statements on a recurring basis (at least annually). Assets and liabilities recorded at fair value in the consolidated financial statements are categorized based upon the level of judgment associated with the inputs used to measure their fair value. Hierarchical levels, which are directly related to the amount of subjectivity, associated with the inputs to the valuation of these assets or liabilities are as follows:
|
|
· |
Level 1 inputs are quoted prices (unadjusted) in active markets for identical assets or liabilities that the Company can access at the measurement date. |
|
|
· |
Level 2 inputs are observable inputs other than quoted prices in active markets for identical assets and liabilities, quoted prices for identical or similar assets or liabilities in inactive markets, or other inputs that are observable or can be corroborated by observable market data for substantially the full term of the assets or liabilities. |
|
|
· |
Level 3 inputs are unobservable inputs for the asset or liability. |
80
Arcadia Biosciences, Inc.
Notes to Consolidated Financial Statements (Continued)
Cash and cash equivalents are maintained with several financial institutions. Deposits held with banks may exceed the amount of insurance provided on such deposits. Generally, these deposits may be redeemed upon demand and are maintained with financial institutions with reputable credit and therefore bear minimal credit risk. The Company seeks to mitigate its credit risks by spreading such risks across multiple counterparties and monitoring the risk profiles of these counterparties.
Customer Concentration
Significant customers are those that represent greater than 10% of the Company’s total revenues or gross accounts receivable balance at each respective balance sheet date.
Customers representing greater than 10% of accounts receivable were as follows (in percentages):
|
|
|
As of December 31, |
|
|||||
|
|
|
2015 |
|
|
2014 |
|
||
|
Customer A |
|
|
32 |
|
|
|
94 |
|
|
Customer E |
|
|
32 |
|
|
|
— |
|
|
Customer F |
|
|
25 |
|
|
|
— |
|
Customers representing greater than 10% of total revenues were as follows (in percentages):
|
|
|
For Year Ended December 31, |
|
|||||
|
|
|
2015 |
|
|
2014 |
|
||
|
Customer A |
|
|
12 |
|
|
|
29 |
|
|
Customer D |
|
|
22 |
|
|
|
36 |
|
|
Customer F |
|
|
14 |
|
|
|
— |
|
|
Customer G |
|
|
13 |
|
|
|
— |
|
Deferred Offering Costs
Deferred offering costs consisting of direct incremental legal, consulting, banking and accounting fees relating to the initial public offering completed in May 2015 ("IPO") of $9.8 million were capitalized and offset against the gross IPO proceeds of $68.2 million. The Company recorded $0 and $2.8 million of deferred offering costs in other noncurrent assets on the Consolidated Balance Sheets as of December 31, 2015 and December 31, 2014, respectively.
Stock-Based Compensation
The Company recognizes compensation expense related to employee stock purchase plan and the cost of stock-based compensation awards made to employees and directors on a straight-line basis over the requisite service period, net of estimated forfeitures. Judgment is required in estimating the amount of stock-based awards that will be forfeited prior to vesting. Compensation expense could be revised in subsequent periods if actual forfeitures differ from those estimates. The Company has selected the Black-Scholes option-pricing model and various inputs to estimate the fair value of its stock-based awards. See Note 11 for additional information.
The Company accounts for compensation expense related to stock options granted to non-employees based on the fair values estimated using the Black-Scholes model. Stock options granted to non-employees are re-measured at each reporting date until the award is vested.
81
Arcadia Biosciences, Inc.
Notes to Consolidated Financial Statements (Continued)
The Company uses the asset and liability method of accounting for income taxes. Under this method, deferred tax assets and liabilities are determined based on the differences between the financial reporting and the tax bases of assets and liabilities and are measured using the enacted tax rates and laws that will be in effect when the differences are expected to reverse. A valuation allowance is provided when it is more likely than not that some portion or all of a deferred tax asset will not be realized.
Net Loss per Share
Basic net loss per share, which excludes dilution, is computed by dividing the net loss attributable to common stockholders by the weighted-average number of shares of common stock outstanding during the period. Diluted net loss per share reflects the potential dilution that could occur if securities or other contracts to issue common stock, such as stock options, convertible promissory notes, convertible preferred stock, redeemable convertible preferred stock and warrants, result in the issuance of common stock which share in the losses of the Company. Certain potential shares of common stock have been excluded from the computation of diluted net loss per share as their effect would be anti-dilutive. Such potentially dilutive shares are excluded when the effect would be to reduce the loss per share. The Company’s convertible preferred stock are considered to be participating securities as they are entitled to participate in undistributed earnings with shares of common stock. Due to net losses, there is no impact on earnings per share calculation in applying the two-class method since the participating securities have no legal requirement to share in any losses.
Revenue Recognition
Revenue is generated through product sales, license agreements, contract research agreements, and government grants. The Company recognizes revenue when the following criteria have been met: persuasive evidence of an arrangement with the customer exists; price and terms of the arrangement are fixed or determinable; delivery of the product has occurred or the service has been performed in accordance with the terms of the arrangement; and collectability is reasonably assured.
For revenue agreements with multiple-element arrangements, such as license and contract agreements, the Company analyzes the arrangements to determine whether the deliverables can be separated or whether they must be accounted for as a single unit of accounting. This determination is generally based on whether any deliverable has stand-alone value to the customer. This analysis also establishes a selling price hierarchy for determining how to allocate arrangement consideration to identified units of accounting. When deliverables are separable, consideration received is allocated to the separate units of accounting based on the relative selling price method and the appropriate revenue recognition principles are applied to each unit. The selling price used for each unit of accounting is based on estimated selling price as neither vendor-specific nor third-party evidence is available. When the Company determines that an arrangement should be accounted for as a single unit of accounting, it must determine the period over which the performance obligations will be performed and revenue will be recognized over the performance period.
Product Revenues
Product revenues consist of sales of our Sonova products. Product revenues are recognized once passage of title has occurred, contractually specified acceptance criteria have been met, and all other revenue recognition criteria have been met. Shipping and handling costs charged to customers are recorded as revenues and included in cost of product revenues at the time the sale is recognized.
License Revenues
The Company’s license agreements generally include up-front, nonrefundable license fees, annual license fees, and subsequent milestone payments. Upon commercialization of a product utilizing a licensed technology, the Company receives certain value-sharing payments associated with the incremental revenue attributable to the licensed technology.
82
Arcadia Biosciences, Inc.
Notes to Consolidated Financial Statements (Continued)
The Company has determined that, at the inception of each license agreement, there is only one deliverable for the license for, access to, and assistance with the development of the specified intellectual property. The up-front nonrefundable license fees are recognized as revenue proportionally over the development period, which approximates the expected efforts by the Company. The development period is estimated based upon factors such as type of traits, nature of crops and geographies, which are used to establish the initial deferral period. The Company continually reviews such estimates based on progress toward product commercialization. If the deferral period estimate changes, the amount of revenue recognized during the period is adjusted to reflect the updated deferred balances as of the current period-end. The annual license fees are payable at the end of the annual period and such fees typically are not required to be paid if the agreement is cancelled prior to the due date. Therefore, annual license fees are only recognized when they become due.
The Company’s license agreements generally include contingent milestone payments in the development life cycle of the related technology, such as achievement of specific technological targets, successful results from field trials, filing for approval with regulatory agencies, approvals granted by regulatory agencies and commercial launch of a product utilizing the licensed technology. The Company evaluates whether each milestone is substantive and at risk at the time the agreement is executed. This evaluation includes an assessment of whether (a) the consideration is commensurate with either (i) the entity’s performance to achieve the milestone or (ii) the enhancement of the value of the delivered item(s) as a result of a specific outcome resulting from the entity’s performance to achieve the milestone; (b) the consideration relates solely to past performance; and (c) the consideration is reasonable relative to all of the deliverables and payment terms within the arrangement. The Company generally considers non-refundable milestones that the Company expects to be achieved as a result of the Company’s efforts during the period of the Company’s performance obligations under the license agreement to be substantive and recognizes them as revenue upon the achievement of the milestone, assuming all other revenue recognition criteria are met.
Once a product containing one or more of the Company’s traits is commercialized, the Company is entitled to receive a portion of the incremental revenue that the trait generates for its commercial partner. These value-sharing payments will be recorded on the accrual basis when results are reliably measurable, collectability is reasonably assured, and all other revenue recognition criteria are met. None have been received to date.
Contract Research Revenues
Contract research revenues consist of amounts earned from performing contracted research activities for third parties. Activities performed are related to breeding programs or the genetic engineering of plants and are subject to an executed agreement. Generally, fees for research and development activities are recognized as the services are performed over the performance period, as specified in the respective agreements, assuming all other revenue recognition criteria are met.
Similar to the license agreements, under the contract research agreements, once a product containing one or more of the Company’s traits is commercialized, the Company is entitled to receive a portion of the incremental revenue that the trait generates for its commercial partner. These value-sharing payments will be recorded on the accrual basis when results are reliably measurable, collectability is reasonably assured, and all other revenue recognition criteria are met.
Government Grant Revenues
Based on the terms of the government grant, the Company recognizes revenue from payments received from government entities for research and development activities over a contractually defined period. Revenues from government grants are recognized in the period during which the related costs are incurred, provided that the conditions under which the government grants were provided have been met.
Unearned Revenue
The Company defers revenue to the extent that cash received in conjunction with a license agreement, contract or grant exceeds the revenue recognized in accordance with Company policies.
83
Arcadia Biosciences, Inc.
Notes to Consolidated Financial Statements (Continued)
Research and Development Expenses
Research and development expenses consist of costs incurred in the discovery, development, and testing of the Company’s product candidates. These expenses consist primarily of employee salaries and benefits, including stock-based compensation, fees paid to subcontracted research providers, fees associated with in-licensing technology, royalty agreements, land leased for field trials, chemicals and supplies and other external expenses. These costs are expensed as incurred. Additionally, as disclosed in Note 12, the Company is required from time to time to make certain milestone payments in connection with the development of technologies. These milestone payments are expensed at the time the milestone is achieved and deemed payable.
Note 3. Recent Accounting Pronouncements
In May 2014, the Financial Accounting Standards Board (“FASB”) issued Accounting Standards Update (“ASU”) 2014-09, Revenue from Contracts with Customers, which requires an entity to recognize the amount of revenue to which it expects to be entitled for the transfer of promised goods or services to customers. The ASU will replace most existing revenue recognition guidance in U.S. GAAP when it becomes effective. In August 2015, FASB issued ASU 2015-14, Revenue from Contracts with Customers, which defers the effective date by one year. The new standard will be effective for the Company on January 1, 2018, which is the effective date for public companies. Early application with an effective date of January 1, 2017 is permitted. The standard permits the use of either the retrospective or cumulative effect transition method. The Company is evaluating the effect that ASU 2014-09 and ASU 2015-14 will have on its consolidated financial statements and related disclosures. The Company has not yet selected a transition method nor has it determined the effect of the standard on its ongoing financial reporting.
In August 2014, the FASB issued ASU 2014-15, Disclosure of Uncertainties about an Entity’s Ability to Continue as a Going Concern, which provides guidance on determining when and how to disclose going-concern uncertainties in the consolidated financial statements. The new standard requires management to perform interim and annual assessments of an entity’s ability to continue as a going concern within one year of the date the consolidated financial statements are issued. An entity must provide certain disclosures if "conditions or events raise substantial doubt about the entity’s ability to continue as a going concern." The ASU applies to all entities and is effective for annual periods ending after December 15, 2016, and interim periods thereafter, with early adoption permitted. The Company does not anticipate a material change to its consolidated financial statements upon the adoption of this ASU. However, it will be required to evaluate and determine if further disclosure is necessary at each balance sheet date.
In February 2015, the FASB issued ASU 2015-02, Consolidation (Topic 810): Amendments to the Consolidation Analysis. The amendments significantly change the consolidation analysis required under U.S. GAAP. Reporting entities will need to reevaluate all their previous consolidation conclusions. ASU 2015-02 will be effective for fiscal years, and for interim periods within those fiscal years, beginning after December 15, 2015. Early adoption is permitted, including adoption in an interim period. If an entity early adopts the amendments in an interim period, any adjustments should be reflected as of the beginning of the fiscal year that includes that interim period. The Company does not anticipate that the adoption of this ASU will materially change the presentation of our consolidated financial statements.
In April 2015, the FASB issued ASU 2015-03, Interest-Imputation of Interest (Subtopic 835-30): Simplifying the Presentation of Debt Issuance Costs, which requires debt issuance costs to be presented in the balance sheet as a direct deduction from the associated debt liability. ASU 2015-03 will not change the amortization of debt issuance costs, which will continue to follow the existing accounting guidance. ASU 2015-03 will be effective for interim and annual reporting periods beginning after December 15, 2015. Early application is permitted. The reporting entity must retrospectively apply ASU 2015-03. The Company adopted ASU 2015-03 for the annual reporting period of December 31, 2015. Based on the Company’s analysis to assess the impact on prior periods in accordance with the retrospective application, debt issuance costs were immaterial thus no adjustments were made to the balance sheet classification.
84
Arcadia Biosciences, Inc.
Notes to Consolidated Financial Statements (Continued)
In July 2015, the FASB issued ASU 2015-11, Inventory (Topic 330): Simplifying the Measurement of Inventory, which applies guidance on subsequent measurement of inventory. An entity should measure inventory at the lower of cost and net realizable value. Net realizable value is the estimated selling prices in the ordinary course of business, less reasonable predictable costs of completion, disposal and transportation. The guidance excludes inventory measured using LIFO or the retail inventory method. ASU 2015-11 will be effective for interim and annual reporting periods beginning after December 15, 2016. Early application is permitted. The Company does not anticipate that the adoption of this ASU will materially change the presentation of its consolidated financial statements.
In November 2015, the FASB issued ASU 2015-17, Income Taxes (Topic 740). Current GAAP requires an entity to separate deferred income tax liabilities and assets into current and noncurrent amounts in a classified statement of financial position. The amendment in this update requires that deferred tax liabilities and assets be classified as noncurrent in a classified statement of financial position. This standard is effective for fiscal years, and interim periods within those fiscal years, beginning after December 15, 2016, with early adoption permitted. The Company had prospectively adopted ASU 2015-17 for the annual reporting period of December 31, 2015.
In January 2016, the FASB issued ASU 2016-01, Financial Instruments – Overall (Subtopic 825-10): Recognition and Measurement of Financial Assets and Financial Liabilities. The amendments in this update impacts classification, additional fair value measurement, impairment assessment of equity investments and current required disclosures. This standard is effective for fiscal years, and interim periods within those fiscal years, beginning after December 15, 2017, with early adoption permitted if the entity meets certain early application guidance. The Company is currently evaluating the impact of the adoption of ASU 2016-01 on its operating results and financial position.
Note 4. Property and Equipment, Net
Property and equipment, net consisted of the following (in thousands):
|
|
|
As of December 31, |
|
|||||
|
|
|
2015 |
|
|
2014 |
|
||
|
Laboratory equipment |
|
$ |
2,528 |
|
|
$ |
2,697 |
|
|
Software and computer equipment |
|
|
441 |
|
|
|
465 |
|
|
Furniture and fixtures |
|
|
153 |
|
|
|
151 |
|
|
Vehicles |
|
|
204 |
|
|
|
188 |
|
|
Leasehold improvements |
|
|
1,900 |
|
|
|
1,882 |
|
|
Assets under construction |
|
|
18 |
|
|
|
— |
|
|
Property and equipment, gross |
|
|
5,244 |
|
|
|
5,383 |
|
|
Less accumulated depreciation and amortization |
|
|
(4,659 |
) |
|
|
(4,655 |
) |
|
Property and equipment, net |
|
$ |
585 |
|
|
$ |
728 |
|
Depreciation and amortization expense is $294,000 and $358,000 for the years ended December 31, 2015 and 2014, respectively.
Note 5. Investments and Fair Value Measurements
Available-for-Sale Investments
The Company classified cash equivalents, short-term and long-term investments as “available-for-sale.” Investments are free of trading restrictions. The investments are carried at fair value, based on quoted market prices or other readily available market information. Unrealized gains and losses, net of taxes, are included in accumulated other comprehensive income (loss), which is reflected as a separate component of stockholder’s equity (deficit) in the Consolidated Balance Sheets. Gains and losses are recognized when realized in the Consolidated Statements of Operations and Comprehensive Loss. The Company did not have available-for-sale securities prior to the third quarter of 2015.
85
Arcadia Biosciences, Inc.
Notes to Consolidated Financial Statements (Continued)
The Company’s investments in fixed income securities consisted of the following as of December 31, 2015:
|
(Dollars in thousands) |
|
Amortized Cost |
|
|
Unrealized Gains |
|
|
Unrealized Losses |
|
|
Estimated Fair Value |
|
||||
|
Assets at Fair Value |
|
|
|
|
|
|
|
|
|
|
|
|
|
|
|
|
|
Cash equivalents: |
|
|
|
|
|
|
|
|
|
|
|
|
|
|
|
|
|
Money market funds |
|
$ |
12,799 |
|
|
$ |
— |
|
|
$ |
— |
|
|
$ |
12,799 |
|
|
Commercial paper |
|
|
5,949 |
|
|
|
— |
|
|
|
— |
|
|
|
5,949 |
|
|
U.S. government agency securities |
|
|
3,049 |
|
|
|
— |
|
|
|
— |
|
|
|
3,049 |
|
|
Short-term investments: |
|
|
|
|
|
|
|
|
|
|
|
|
|
|
|
|
|
Certificates of Deposit |
|
|
3,374 |
|
|
|
— |
|
|
|
— |
|
|
|
3,374 |
|
|
Commercial paper |
|
|
3,598 |
|
|
|
— |
|
|
|
— |
|
|
|
3,598 |
|
|
U.S. government securities |
|
|
13,678 |
|
|
|
— |
|
|
|
(30 |
) |
|
|
13,648 |
|
|
U.S. government agency securities |
|
|
5,653 |
|
|
|
1 |
|
|
|
(4 |
) |
|
|
5,650 |
|
|
Long-term investments: |
|
|
|
|
|
|
|
|
|
|
|
|
|
|
|
|
|
Certificates of Deposit |
|
|
3,049 |
|
|
|
— |
|
|
|
— |
|
|
|
3,049 |
|
|
U.S. government securities |
|
|
11,780 |
|
|
|
— |
|
|
|
(52 |
) |
|
|
11,728 |
|
|
U.S. government agency securities |
|
|
5,001 |
|
|
|
— |
|
|
|
(30 |
) |
|
|
4,971 |
|
|
Total Assets at Fair Value |
|
$ |
67,930 |
|
|
$ |
1 |
|
|
$ |
(116 |
) |
|
$ |
67,815 |
|
The Company did not have any investment categories that were in a continuous unrealized loss position for more than twelve months as of December 31, 2015. The unrealized gains and losses amounts above are included in AOCI as of December 31, 2015. All long-term investments will mature in 2017.
As of December 31, 2015, for fixed income securities that were in unrealized loss positions, the Company has determined that (i) it does not have the intent to sell any of these investments, and (ii) it is not more likely than not that it will be required to sell any of these investments before recovery of the entire amortized cost basis. The Company anticipates that it will recover the entire amortized cost basis of such fixed income securities and has determined that no other-than-temporary impairments associated with credit losses were required to be recognized during the year ended December 31, 2015.
Fair Value Measurement
The fair value of the available-for-sale investments at December 31, 2015 were as follows:
|
|
|
Fair Value Measurements at December 31, 2015 |
|
|||||||||||||
|
(Dollars in thousands) |
|
Level 1 |
|
|
Level 2 |
|
|
Level 3 |
|
|
Total |
|
||||
|
Assets at Fair Value |
|
|
|
|
|
|
|
|
|
|
|
|
|
|
|
|
|
Cash equivalents: |
|
|
|
|
|
|
|
|
|
|
|
|
|
|
|
|
|
Money market funds |
|
$ |
12,799 |
|
|
$ |
— |
|
|
$ |
— |
|
|
$ |
12,799 |
|
|
Commercial paper |
|
|
— |
|
|
|
5,949 |
|
|
|
— |
|
|
|
5,949 |
|
|
U.S. government agency securities |
|
|
— |
|
|
|
3,049 |
|
|
|
— |
|
|
|
3,049 |
|
|
Short-term investments: |
|
|
|
|
|
|
|
|
|
|
|
|
|
|
|
|
|
Certificates of Deposit |
|
|
— |
|
|
|
3,374 |
|
|
|
— |
|
|
|
3,374 |
|
|
Commercial paper |
|
|
— |
|
|
|
3,598 |
|
|
|
— |
|
|
|
3,598 |
|
|
U.S. government securities |
|
|
13,648 |
|
|
|
— |
|
|
|
— |
|
|
|
13,648 |
|
|
U.S. government agency securities |
|
|
— |
|
|
|
5,650 |
|
|
|
— |
|
|
|
5,650 |
|
|
Long-term investments: |
|
|
|
|
|
|
|
|
|
|
|
|
|
|
|
|
|
Certificates of Deposit |
|
|
— |
|
|
|
3,049 |
|
|
|
— |
|
|
|
3,049 |
|
|
U.S. government securities |
|
|
11,728 |
|
|
|
— |
|
|
|
— |
|
|
|
11,728 |
|
|
U.S. government agency securities |
|
|
— |
|
|
|
4,971 |
|
|
|
— |
|
|
|
4,971 |
|
|
Total Assets at Fair Value |
|
$ |
38,175 |
|
|
$ |
29,640 |
|
|
$ |
— |
|
|
$ |
67,815 |
|
86
Arcadia Biosciences, Inc.
Notes to Consolidated Financial Statements (Continued)
The carrying values of the Company’s financial instruments, including cash equivalents, accounts receivable, and accounts payable, approximated their fair values due to the short period of time to maturity or repayment.
The carrying values of the Company’s promissory notes, convertible promissory notes, and notes payable approximate their fair values for the years ended December 31, 2015 and 2014 as the market rates currently available to the Company and other assumptions have not changed significantly. These were classified as Level 2.
The Company’s Level 3 liabilities, which were measured and recorded on a recurring basis, consist of derivative liabilities related to the convertible promissory note. The following table sets forth a summary of the changes in the fair value and other adjustments of these derivative liabilities (in thousands):
|
|
|
Year Ended December 31, |
|
|||||
|
|
|
2015 |
|
|
2014 |
|
||
|
Beginning balance |
|
$ |
1,580 |
|
|
$ |
1,192 |
|
|
Change in fair value and other adjustments |
|
|
9 |
|
|
|
388 |
|
|
Derecognition of derivative liabilities upon debt extinguishment |
|
|
(1,589 |
) |
|
|
— |
|
|
Ending balance |
|
$ |
— |
|
|
$ |
1,580 |
|
Note 6. Investment in Unconsolidated Entity
Limagrain Cereal Seeds LLC
The Company owns a 35% ownership position in Limagrain Cereal Seeds LLC (“LCS”). The remaining 65% of LCS is owned by Vilmorin & Cie (“Limagrain”), a major global producer and marketer of field crop and vegetable seeds, through its wholly owned subsidiary, Vilmorin USA (“VUSA”). LCS improves and develops new wheat and barley varieties utilizing genetic and breeding resources, as well as advanced technologies from Limagrain and the Company. Funding for LCS comes from an initial pro rata equity investment from each partner and with subsequent financing in the form of debt from VUSA. As of December 31, 2015, the debt balance was $19.0 million with a maturity date of April 15, 2016. While it is the Company’s expectation that VUSA will provide LCS with additional debt financing and extend maturity for payment as needed, should additional capital in the form of equity be necessary to support the operations of LCS, the Company has the option to fund its pro rata share of such cash or elect to have its ownership percentage diluted. As of December 31, 2015 and December 31, 2014, the Company’s investment in LCS has been reduced to $0 as a result of its equity method loss recognition.
87
Arcadia Biosciences, Inc.
Notes to Consolidated Financial Statements (Continued)
Summarized condensed financial information related to the unconsolidated entity, accounted for using the equity method is as follows (in thousands):
|
|
|
As of and for the year ended December 31, |
|
|||||
|
|
|
2015 |
|
|
2014 |
|
||
|
Assets: |
|
|
|
|
|
|
|
|
|
Current assets |
|
$ |
2,104 |
|
|
$ |
1,614 |
|
|
Non-current assets |
|
|
9,864 |
|
|
|
10,368 |
|
|
Total assets |
|
|
11,968 |
|
|
|
11,982 |
|
|
Liabilities and equity: |
|
|
|
|
|
|
|
|
|
Current liabilities |
|
|
20,807 |
|
|
|
15,080 |
|
|
Equity of Arcadia Biosciences, Inc.(1) |
|
|
(3,002 |
) |
|
|
(993 |
) |
|
Equity of VUSA |
|
|
(5,837 |
) |
|
|
(2,105 |
) |
|
Total liabilities and equity |
|
$ |
11,968 |
|
|
$ |
11,982 |
|
|
Revenue |
|
$ |
3,630 |
|
|
$ |
2,671 |
|
|
Gross profit |
|
|
1,328 |
|
|
|
1,696 |
|
|
Loss from continuing operations |
|
|
(5,509 |
) |
|
|
(5,301 |
) |
|
Net loss |
|
|
(5,741 |
) |
|
|
(5,499 |
) |
|
Arcadia Biosciences, Inc.’s share of pretax loss(2) |
|
|
— |
|
|
|
(932 |
) |
|
(1) |
Effective June 2014, the investment balance has been reduced to $0. |
|
(2) |
The Company’s share of the pretax loss is recorded as an equity method loss in the statements of operations. |
Note 7. Variable Interest Entity
In February 2012, the Company formed Verdeca LLC, which is jointly owned with Bioceres, Inc. ("Bioceres"), a U.S. wholly owned subsidiary of Bioceres, S.A., an Argentine corporation. Bioceres, S.A. is an agricultural investment and development company owned by approximately 250 shareholders, including some of South America’s largest soybean growers. Verdeca was formed to develop and deregulate soybean varieties using both partners’ agricultural technologies.
Both the Company and Bioceres incur expenses in support of specific activities agreed, as defined by joint work plans, which apply fair market value to each partner’s activities. Unequal contributions of services are equalized by the partners through cash payments. Verdeca is not the primary obligor for these activities performed by the Company or Bioceres. An agreement executed in conjunction with the formation of Verdeca specified that if Bioceres determines it requires cash to fund its contributed services (subject to certain annual limits), Bioceres, S.A. may elect to sell shares of its common stock to the Company for an amount not exceeding $5.0 million in the aggregate over a four-year period. The Company determined that its commitment to purchase common stock in Bioceres, S.A. as a means to provide capital to Verdeca resulted in a de facto agency relationship between the Company and Bioceres. The Company considers qualitative factors in assessing the primary beneficiary which include understanding the purpose and design of the VIE, associated risks that the VIE creates, activities that could be directed by the Company, and the expected relative impact of those activities on the economic performance of the VIE. Based on an evaluation of these factors, the Company concluded that it is the primary beneficiary of Verdeca.
As a result of the agreement to fund future contributions by Bioceres, Inc., the Company purchased common stock of Bioceres, S.A. in the aggregate amount of $2.0 million between January 2013 and August 2014. The Company’s maximum commitment to purchase stock in Bioceres, S.A. under the original funding agreement amounted to $2.0 million for 2014 and $1.2 million for 2015. In September 2014, the Company and Bioceres, S.A. entered into an agreement to reduce the annual commitment for 2014 to $500,000 and to eliminate the 2015 commitment. In consideration for these amendments, the Company surrendered 1,832 shares of Bioceres, S.A. held by the Company. The Company recorded an expense of $1.5 million related to this agreement, which is classified as research and development expense in the Consolidated Statement of Operations and Comprehensive Loss for the year ended December 31, 2014.
88
Arcadia Biosciences, Inc.
Notes to Consolidated Financial Statements (Continued)
In addition, the Company had a right to require Bioceres, S.A. to repurchase any shares of common stock then owned by the Company upon the occurrence of certain events specified in the agreement, and similarly, Bioceres, S.A. had the right to require the Company to sell back any shares of common stock owned by the Company under certain circumstances. The Company entered into a subcontracted research agreement in 2015 with Bioceres S.A. and Bioceres Semillas, S.A., a subsidiary of Bioceres S.A. Per the agreement, the Company could pay for these services with a combination of cash and Bioceres S.A. shares. As of December 31, 2015, the liability for the aforementioned research agreement was settled with $205,000 of cash and the remaining 632 Bioceres S.A. shares with a fair value of $500,000 held by the Company, thus reducing the cost investment on the Consolidated Balance Sheet to $0.
Under the terms of the joint development agreement, the Company has incurred direct expenses and allocated overhead in the amount of $1.3 million and $1.0 million for the year ended December 31, 2015 and 2014, respectively.
Note 8. Accounts Payable and Accrued Expenses
Accounts payable and accrued expenses consisted of the following (in thousands):
|
|
|
As of December 31, |
|
|||||
|
|
|
2015 |
|
|
2014 |
|
||
|
Accounts payable—trade |
|
$ |
424 |
|
|
$ |
244 |
|
|
Payroll and benefits |
|
|
1,050 |
|
|
|
864 |
|
|
Accrued offering costs |
|
|
— |
|
|
|
1,165 |
|
|
Research and development |
|
|
323 |
|
|
|
227 |
|
|
Royalty fees |
|
|
157 |
|
|
|
231 |
|
|
Accrued interest on notes payable |
|
|
9 |
|
|
|
10 |
|
|
Consulting |
|
|
152 |
|
|
|
101 |
|
|
Rent and utilities |
|
|
77 |
|
|
|
27 |
|
|
Legal |
|
|
57 |
|
|
|
7 |
|
|
Accrued withholding taxes |
|
|
24 |
|
|
|
147 |
|
|
Other |
|
|
150 |
|
|
|
174 |
|
|
Total accounts payable and accrued expenses |
|
$ |
2,423 |
|
|
$ |
3,197 |
|
Note 9. Long-Term Debt and Other Financing Arrangements
Longterm debt consisted of the following (in thousands):
|
|
|
December 31, 2015 |
|
|
December 31, 2014 |
|
||
|
Notes payable |
|
$ |
24,930 |
|
|
$ |
— |
|
|
Note payable to related party |
|
|
— |
|
|
|
8,000 |
|
|
Promissory note |
|
|
— |
|
|
|
1,924 |
|
|
Total |
|
$ |
24,930 |
|
|
$ |
9,924 |
|
|
Less current portion |
|
|
— |
|
|
|
(1,055 |
) |
|
Long-term portion |
|
$ |
24,930 |
|
|
$ |
8,869 |
|
In July 2012, a 36month $8.0 million term note was executed with Moral Compass Corporation (“MCC”), the Company’s largest stockholder, and was subordinate to existing promissory notes and convertible promissory notes. The interest rate on the loan was prime plus 2%, with interest only paid monthly in arrears. The principal was due in full at maturity in July 2015. On November 10, 2014, the Company and MCC entered into an amendment to the term loan under which the maturity date was extended to the first to occur of the following dates: (i) April 1, 2016, (ii) the date of an Event of Default, or (iii) a date designated by MCC, by notice to the Company, no earlier than the 20th day following consummation by the Company of an equity financing with gross proceeds to the Company of at least $50 million. In addition, the interest rate remained at prime plus 2% through December 31,
89
Arcadia Biosciences, Inc.
Notes to Consolidated Financial Statements (Continued)
2014, and was amended to increase to 11% per annum thereafter until maturity. The balance of the note, inclusive of accrued interest, was approximately $8.0 million as of December 31, 2014. Accrued interest of $36,000 was recorded in amounts due to related parties on the balance sheet as of December 31, 2014. This term note, including the principal balance of $8.0 million and accrued interest and prepayment fee of $148,000 was paid in full in April 2015. A prepayment fee of $80,000 was recorded as a loss on extinguishment of debt.
Promissory notes were executed with an unrelated party in August 2013 and November 2013 in the amounts of $2.0 million and $1.1 million, respectively. The interest rate on the notes was 10% with principal and interest due in 36 equal monthly installments over the course of their respective threeyear terms. These notes, including the aggregate outstanding principal balance of $1.6 million and accrued interest and prepayment fee of $44,000, were paid in full in April 2015. A prepayment fee of $37,000 was recorded as a loss on extinguishment of debt.
In April 2015, the Company entered into a loan and security agreement with an unrelated party, under which the Company incurred an aggregate principal amount of $20.0 million in term loan borrowings (the “Term Loans”), proceeds of which were used to repay existing debt with MCC and an unrelated party as described above. Under this loan agreement, interest on the Term Loans accrued at a rate per annum equal to the greater of (i) 9.0% and (ii) a fluctuating rate of interest equal to threemonth LIBOR as in effect from time to time plus 8.74%. The Company was required to make interestonly payments under this agreement from the drawdown dates through April 30, 2016, subject to certain conditions for extension to October 31, 2016. After this date, equal monthly payments of principal and interest would have been required so that all outstanding principal amounts and accrued interest would have been repaid by November 1, 2018. This agreement provided for a right of prepayment with associated prepayment fees and an additional end-of-term payment of $600,000 due upon maturity or when the Term Loans are prepaid in whole or in part to the lenders.
In July 2015, the Company amended the Term Loans to include collateral of certain intellectual property rights in exchange for a waiver of the Company’s obligation to obtain a subordination agreement from Mahyco International Pte, Ltd. (“Mahyco International”) with respect to the indebtedness the Company owed to Mahyco International. If any of these events of default were to occur, the lenders could have accelerated and declared to be immediately due and payable the outstanding principal amount of the Term Loans and the Company’s other payment obligations under the agreement. In the case of a bankruptcy or insolvency event of default, the outstanding principal amount of the Term Loans and the Company’s other payment obligations under the loan agreement automatically would have accelerated and become due and payable. In addition, if an event of default occurred and continued under the loan agreement, the lenders could have exercised certain additional secured creditor remedies against the Company and against the assets that secured the Company’s obligations under the agreement.
As part of the Term Loans, the Company also issued the lenders warrants to purchase 1,503,760 shares of its common stock at an exercise price of $5.32 per share, which were only exercisable in the event that an IPO was not completed prior to September 30, 2015 and would have remained exercisable until November 1, 2018. The Company initially recorded $356,000 for the fair value of the warrants as a liability in the Consolidated Balance Sheets, which was subject to subsequent remeasurement for changes in fair value until exercise or expiration. In addition, the Company concluded that the interest rate adjustment upon nonoccurrence of an IPO was an embedded derivative and recorded $81,000 for the fair value of the embedded derivative as a liability, which was subject to subsequent remeasurement for changes in fair value until exercise or expiration. The proceeds received under the Term Loans, less fees paid to the lender of $290,000, were allocated to the warrant liability and the embedded derivative liability based on their initial fair values with the residual amount recorded as notes payable. The resulting debt discount was to be amortized as interest expense over the term of the Term Loans using the effective interest method. The interest expense related to the debt discount was $301,000 for the year ended December 31, 2015.
In May 2015, upon the completion of the IPO, the warrants were terminated and the right to adjust the interest rate upon nonoccurrence of an IPO was relinquished. As such, the Company released the initial fair value of the warrants and the embedded derivative of $437,000 to other income. The Company recognized interest expense inclusive of the debt discount related to the combined Term Loans of $1.5 million for the year ended December 31, 2015.
90
Arcadia Biosciences, Inc.
Notes to Consolidated Financial Statements (Continued)
Two notes and a warrant purchase agreement (“Convertible Promissory Notes”) were executed in September 2013 and December 2013 with Mahyco International, an affiliate of Maharashtra Hybrid Seeds Company Ltd. (“Mahyco”), which is a licensee of the Company’s technologies. The notes under this agreement were issued in the amounts of $500,000 in September 2013 and $4.5 million in December 2013. The interest rate on the notes was prime plus 2%, compounded monthly over the course of the fiveyear terms ending September and December 2018, and was payable in full on the maturity dates. At any time during the term, the lender could convert all or part of the outstanding balance of the notes (including principal and accrued but unpaid interest) into common stock of the Company at $16.52 per share through December 2016 and at 90% of the most recent offering thereafter.
At its option, Mahyco International could offset future fee payments due from Mahyco to the Company against the outstanding balance of the notes (including principal and accrued but unpaid interest). Mahyco International had the right to demand immediate settlement of a portion of the outstanding balance of the convertible promissory notes, subject to mutual agreement by the Company. The Company recorded a derivative liability for the initial fair value of the settlement obligation. In addition, the lender had the right, at its option, to place another $5.0 million of convertible debt with the Company during the fiveyear term. The Company recorded an additional derivative liability for the initial fair value of the Company’s obligation to issue the additional $5.0 million of convertible promissory notes. Changes in the fair value of the derivative liabilities were recorded to other income (expense), net in the Consolidated Statement of Operations and Comprehensive Loss.
In conjunction with the notes, the Company issued to the lender a warrant to purchase 75,666 shares of common stock at an exercise price of $16.52. The warrant was issued in December 2013, vested immediately and remains exercisable throughout the original fiveyear term. The Company allocated the gross proceeds from the notes to the derivative liabilities based on their initial fair values and the remainder of the proceeds to the convertible promissory note and warrants on a relative fair value basis. The amount allocated to the common stock warrant was recorded as a debt discount to be amortized as interest expense over the estimated term of the loan agreement using the effective interest rate method. The Company recognized interest expense related to the convertible promissory note of $747,000 and $725,000 for the years ended December 31, 2015 and 2014, respectively. Of the total interest expense recognized, $536,000 and $483,000 were related to the debt discount for the years ended December 31, 2015 and 2014, respectively. In March 2015, the parties amended the warrant to clarify certain terms relating to expiration. The Company accounted for the amendment as a modification with the incremental increase in fair value of $197,000 as of the amendment date, which was accounted for as a deemed dividend to the warrant holder.
In December 2015, the Company entered into a new loan and security agreement with Silicon Valley Bank (the “Bank”) providing for a senior secured term loan facility in the amount of $25.0 million. Proceeds were used by the Company to repay all existing debt including the Term Loans’ principal balance of $20.0 million and related accrued interest, prepayment and other fees in the amount of $1.3 million and the Convertible Promissory Notes’ principal balance of $3.7 million and associated accrued interest of $154,000. The Term Loans’ prepayment and end of term fees of $1.2 million were recorded as a loss on extinguishment of debt, along with the $427,000 unamortized debt discount and $58,000 of deferred loan issuance fees. In addition, Mahyco International’s option to place another $5.0 million of convertible debt was surrendered with the repayment and the related derivative liabilities totaling $1.6 million were released and recorded as a gain on extinguishment of debt.
Under this new loan and security agreement, interest accrues at a floating rate per annual rate equal to nine tenths of one percentage point (0.90%) above the prime rate published from time to time in The Wall Street Journal. The agreement requires the Company to make monthly interest-only payments through December 2017. After this date, the Company is required to make thirty-six (36) equal monthly installments of principal, plus accrued interest. The Company’s final payment, due on the maturity date of December 1, 2020, shall include all outstanding principal and accrued and unpaid interest plus a final payment equal to $600,000. In the event the loan is repaid prior to its maturity, a prepayment fee is due equal to 3% of the outstanding principal amount if prepayment occurs after December 29, 2016 but on or before December 29, 2017, and 1% of the outstanding principal amount if the prepayment occurs after December 29, 2017. The loan has been recorded on the Consolidated Balance Sheet as of December 31, 2015, net of issuance fees.
91
Arcadia Biosciences, Inc.
Notes to Consolidated Financial Statements (Continued)
This loan and security agreement contains customary events of default and covenants, including a financial covenant that requires the Company to maintain either a liquidity ratio (defined as the ratio of the Company’s cash, cash equivalents and net accounts receivable to the Company’s obligation owed to the Bank) or at least 1.4:1.0, or to cash collateralize 100% of the Company’s obligations to the Bank. The Company’s obligations to the Bank are secured by substantially all of the Company’s assets, excluding intellectual property.
Minimum principal payments on the Company’s outstanding debt related to the new term loan as of December 31, 2015 are as follows (in thousands):
|
|
|
December 31, 2015 |
|
|
|
2016 |
|
$ |
— |
|
|
2017 |
|
|
— |
|
|
2018 |
|
|
8,333 |
|
|
2019 |
|
|
8,333 |
|
|
2020 |
|
|
8,334 |
|
|
Total |
|
$ |
25,000 |
|
Loss on Debt Extinguishment
The Company recognized a loss on debt extinguishment of $230,000 and $0 for the years ended December 31, 2015 and December 31, 2014, respectively. The loss was comprised of prepayment fees, deferred issuance fees and the release of derivative liabilities related to repaid debts noted above.
Note 10. Common Stock, Redeemable Convertible and Convertible Preferred Stock
Redeemable convertible and convertible preferred stock as of December 31, 2014 consisted of the following:
|
|
|
Shares Authorized |
|
|
Shares Issued and Outstanding |
|
|
Net Carrying Value |
|
|
Aggregate Liquidation Preference |
|
||||
|
|
|
(In thousands, except share data) |
|
|||||||||||||
|
Series A |
|
|
68,000,000 |
|
|
|
16,765,775 |
|
|
$ |
23,324 |
|
|
$ |
67,063 |
|
|
Series B |
|
|
17,000,000 |
|
|
|
4,222,670 |
|
|
|
15,202 |
|
|
|
16,891 |
|
|
Series C |
|
|
9,586,346 |
|
|
|
2,396,584 |
|
|
|
10,257 |
|
|
|
9,586 |
|
|
Series D |
|
|
10,553,770 |
|
|
|
9,587,764 |
|
|
|
34,098 |
|
|
|
36,503 |
|
|
Total redeemable convertible and convertible preferred stock |
|
|
105,140,116 |
|
|
|
32,972,793 |
|
|
$ |
82,881 |
|
|
$ |
130,043 |
|
On March 28, 2014, the Company entered into an agreement with certain investors to issue 9,587,764 shares of its Series D redeemable convertible preferred stock at an original issue price of $3.36 per share, and closings that were scheduled to be completed within 90 days from the initial closing date. The holders of the Series D stock also received warrants for the purchase of an aggregate of 1,227,783 shares of common stock, with an exercise price of $18.16 per share, and exercisable at any time within five years from the date of issuance. The warrants issued to Series D stockholders were freestanding instruments that were classified within equity. The proceeds from the issuance of the Series D stock and common stock warrants were allocated based on their relative fair values. The resulting discount from the issuance of the common stock warrants was adjusted against the Series D stock with a corresponding increase in additional paid-in capital. The Company incurred direct and incremental issuance costs of approximately $194,000 related to the Series D stock. The Company recorded the proceeds from the Series D stock, as well as Series A, Series B and Series C convertible preferred stock, net of issuance costs and common stock warrants issued.
92
Arcadia Biosciences, Inc.
Notes to Consolidated Financial Statements (Continued)
The Company also incurred transaction costs for an advisor of approximately $2.1 million, which included a warrant for the purchase of 33,445 shares of common stock issued to the advisor with a fair value of approximately $93,000. This common stock warrant has an exercise price of $13.44 per share, is exercisable anytime within five years from the date of issuance and is recorded within the Company’s equity. As these transaction costs are not considered direct issuance costs, the $2.1 million is included in selling, general and administrative expenses for the year ended December 31, 2014.
In connection with the issuance of the Series D stock and the subsequent amendment to the Articles of Incorporation, the Company reclassified the Series A, Series B and Series C stock outside of stockholders’ deficit because, in the event of certain deemed liquidation events that are not solely within its control, the shares would have become redeemable at the option of the holders. The Company did not adjust the carrying values of the Series A, Series B, Series C stock to the liquidation values of such shares, since a liquidation event was not probable at any of the balance sheet dates.
As the Series D stock was redeemable at the request of the holder on or after the eight-year anniversary from the original issuance date, the Company classified the Series D shares outside of stockholders’ deficit because of the date of redemption that was not within the control of the Company. The Company accreted the carrying value of the Series D stock to the redemption amount on the eighth anniversary using the interest method through periodic charges to additional paid-in capital, which amounted to $2.6 million and $3.7 million for the years ended December 31, 2015 and 2014, respectively. The redemption amount was to be the greater of (i) two times the original issue price of the Series D stock plus accrued and unpaid dividends through the redemption date, or (ii) the fair market value of the Series D stock. The redemption value also included dividends which were payable in arrears upon redemption and would aggregate to $97.0 million over the redemption period of eight years. The redemption amount of outstanding Series A, Series B and Series C stock was equal to its liquidation value, or $4.00 per share.
Note 11. Stock-Based Compensation
Stock Incentive Plans
The Company has two equity incentive plans: the 2006 Stock Plan (“2006 Plan”) and the 2015 Omnibus Equity Incentive Plan (“2015 Plan”).
In February 2006, the Company adopted the 2006 Plan, which provided for the granting of stock options to executives, employees, and other service providers under the terms and provisions established by the Board of Directors. The Company granted options under the 2006 Plan until May 2015, at which time it was terminated with respect to future awards, although it continues to govern the terms of options that remain outstanding under the plan. Certain options vested upon completion of the IPO and the remaining unvested options vest over original service periods between two-and-a-quarter and four years.
In May 2015, the 2015 Plan became effective upon the IPO and all shares that were reserved, but not issued, under the 2006 Plan were assumed by the 2015 Plan. Upon effectiveness, the 2015 Plan had 3,087,729 shares of common stock reserved for future issuance, which included 212,729 shares under the 2006 Plan that were transferred to and assumed by the 2015 Plan. The 2015 Plan provides for automatic annual increases in shares available for grant, beginning on January 1, 2016. In addition, shares subject to awards under the 2006 Plan that are forfeited or terminated will be added to the 2015 Plan.
The 2015 Plan provides for the grant of incentive stock options (“ISOs”), within the meaning of Section 422 of the Code, to our employees and for the grant of nonstatutory stock options (“NSOs”), stock appreciation rights, restricted stock, restricted stock units, performance units, and performance shares to our employees, directors, and consultants. The ISOs and NSOs will be granted at a price per share not less than the fair value at date of grant. Options granted generally vest over a four-year period, with 25% vesting at the end of one year and the remaining vesting monthly thereafter. Options granted generally are exercisable for 10 years, the maximum contractual period.
As of December 31, 2015, a total of 3,153,265 shares of common stock were reserved for issuance under the 2015 Plan, of which 3,108,265 shares of common stock are available for future grant. In connection with the IPO,
93
Arcadia Biosciences, Inc.
Notes to Consolidated Financial Statements (Continued)
and as contemplated by the Company’s Director Compensation Policy, the Company granted options to purchase an aggregate of 45,000 shares to three new members of the Board of Directors who joined the Board in connection with the IPO. As of December 31, 2015, a total of 3,382,509 and 45,000 options are outstanding under the 2006 and 2015 Plans, respectively.
The following is a summary of stock option information and weighted average exercise prices under the Company’s stock incentive plans (in thousands, except share data and price per share):
|
|
|
Shares Subject to Outstanding Options |
|
|
Weighted- Average Exercise Price Per Share |
|
|
Aggregate Intrinsic Value |
|
|||
|
Outstanding — Balance at December 31, 2013 |
|
|
3,682,815 |
|
|
$ |
2.88 |
|
|
$ |
39,346 |
|
|
Options granted |
|
|
125,000 |
|
|
|
6.12 |
|
|
|
|
|
|
Options exercised |
|
|
(17,473 |
) |
|
|
1.12 |
|
|
|
|
|
|
Options cancelled and forfeited |
|
|
(30,503 |
) |
|
|
3.56 |
|
|
|
|
|
|
Outstanding — Balance at December 31, 2014 |
|
|
3,759,839 |
|
|
$ |
3.00 |
|
|
$ |
12,499 |
|
|
Options granted |
|
|
352,494 |
|
|
|
7.30 |
|
|
|
|
|
|
Options exercised |
|
|
(609,066 |
) |
|
|
0.59 |
|
|
|
|
|
|
Options cancelled and forfeited |
|
|
(75,758 |
) |
|
|
7.33 |
|
|
|
|
|
|
Outstanding — Balance at December 31, 2015 |
|
|
3,427,509 |
|
|
$ |
3.76 |
|
|
$ |
3,707 |
|
|
Options vested and exercisable — December 31, 2015 |
|
|
3,114,037 |
|
|
$ |
3.41 |
|
|
$ |
3,707 |
|
Aggregate intrinsic value represents the difference between the exercise price of the options and the estimated fair value of the Company’s common stock determined by the board of directors for each of the respective periods. The intrinsic value of options exercised was $1.5 million and $74,000 for the years ended December 31, 2015 and 2014, respectively.
As of December 31, 2015, there was $698,000 of unrecognized compensation cost related to unvested stock-based compensation grants that will be recognized over the weighted-average remaining recognition period of 2.04 years.
In determining the fair value of the stock-based awards, the Company uses the Black-Scholes option-pricing model and assumptions discussed below. Each of these inputs is subjective and generally requires significant judgment to determine.
Expected Term—The expected term is the estimated period of time outstanding for stock options granted and was estimated based on historical, as well as anticipated future, exercise activity.
Expected Volatility—Since the Company was privately held and does not have a long trading history for its common stock, the expected volatility was estimated based on the average volatility for comparable publicly traded biotechnology companies over a period equal to the expected term of the stock option grants. When selecting comparable publicly traded biotechnology companies on which it has based its expected stock price volatility, the Company selected companies with comparable characteristics to it, including enterprise value, risk profiles, position within the industry, and with historical share price information sufficient to meet the expected life of the stock-based awards. The historical volatility data was computed using the daily closing prices for the selected companies’ shares during the equivalent period of the calculated expected term of the stock-based awards. The Company will continue to apply this process until a sufficient amount of historical information regarding the volatility of its own stock price becomes available.
Risk-Free Interest Rate—The risk-free interest rate is based on the interest rate of U.S. Treasuries of comparable maturities on the date the options were granted.
Expected Dividend—The expected dividend yield is based on the Company’s expectation of future dividend payouts to common stockholders.
94
Arcadia Biosciences, Inc.
Notes to Consolidated Financial Statements (Continued)
The fair value of stock option awards to employees was estimated at the date of grant using a Black-Scholes option-pricing model with the following weighted-average assumption:
|
|
|
Year Ended December 31, |
|
|||||
|
Assumptions |
|
2015 |
|
|
2014 |
|
||
|
Expected term (years) |
|
|
5.52 |
|
|
|
5.50 |
|
|
Expected volatility |
|
|
100 |
% |
|
|
129 |
% |
|
Risk-free interest rate |
|
|
1.61 |
% |
|
|
1.75 |
% |
|
Expected dividend yield |
|
|
— |
% |
|
|
— |
% |
The weighted- average, estimated grant-date fair value of employee stock options granted during the year ended December 31, 2015 and December 31, 2014 was $4.64 and $4.32, respectively. The Company recognized $1.3 million and $976,000 of compensation expense for stock options to employees and nonemployees for the years ended December 31, 2015 and 2014, respectively.
Employee Stock Purchase Plan
In May 2015, the Company’s 2015 Employee Stock Purchase Plan (“ESPP”) was introduced. The ESPP allows eligible employees to purchase shares of the Company’s common stock at a discount through payroll deductions of up to 15% of their eligible compensation, subject to any plan limitations. After the first offering period, which began on May 14, 2015 and ended on February 1, 2016, the ESPP provides for six-month offering periods, and at the end of each offering period, employees are able to purchase shares at 85% of the lower of the fair market value of the Company’s common stock on the first trading day of the offering period or on the last day of the offering period. The initial number of shares of common stock reserved for issuance under the ESPP is 625,000, and the ESPP provides for automatic annual increases in the shares available for purchase beginning on January 1, 2016. As of December 31, 2015, no shares had been issued under the ESPP. The Company recorded $69,000 of compensation expense and $145,000 of current liability from employee contributions related to the ESPP for the year ended December 31, 2015.
Note 12. Commitments and Contingencies
Leases
The Company leases office and laboratory space, greenhouse space, grain storage bins, warehouse space, and equipment under operating lease agreements having initial lease terms ranging from three to five years, including certain renewal options available to the Company at market rates. The Company also leases land for field trials on a short-term basis. Future minimum payments under non-cancelable operating leases in effect as of December 31, 2015, are presented below (in thousands):
|
Years Ending December 31, |
|
Amounts |
|
|
|
2016 |
|
$ |
967 |
|
|
2017 |
|
|
761 |
|
|
2018 |
|
|
329 |
|
|
Total future minimum payments under non- cancelable operating leases |
|
$ |
2,057 |
|
Rent expense under all operating leases totaled $1.3 million and $1.0 million for the years ended December 31, 2015 and 2014, respectively.
Legal Matters
From time to time, in the ordinary course of business, the Company may become involved in certain legal proceedings. As of December 31, 2015 and 2014, the Company was not involved in any legal proceedings.
95
Arcadia Biosciences, Inc.
Notes to Consolidated Financial Statements (Continued)
Contingent Liability Related to the Anawah Acquisition
On June 15, 2005, the Company completed its agreement and plan of merger and reorganization with Anawah, Inc. ("Anawah" or "Sellers"), to purchase the Sellers’ food and agricultural research company through a stock purchase. Pursuant to the merger with Anawah, and in accordance with the ASC 805 - Business Combinations, the Company incurred a contingent liability not to exceed $5.0 million. This liability represents amounts to be paid to Anawah’s previous stockholders for cash collected on revenue recognized by the Company upon commercial sale of certain specific products developed using technology acquired in the purchase. As of December 31, 2010, the Company ceased activities relating to three of the six Anawah product programs and, as a result, reduced the contingent liability to $3.0 million. The Company believes the contingent liability is appropriate as it continues to pursue three development programs using this technology as of December 31, 2015.
Contracts
The Company has entered into contract research agreements with unrelated parties that require the Company to pay certain funding commitments. The initial terms of these agreements range from one to three years in duration and in certain cases are cancelable.
The Company licenses certain technologies via executed agreements (“In-Licensing Agreements”) that are used to develop and advance the Company’s own technologies. The Company has entered into various In-Licensing Agreements with related and unrelated parties that require the Company to pay certain license fees, royalties, and/or milestone fees. In addition, certain royalty payments ranging from 2% to 15% of net revenue amounts as defined in the In-Licensing Agreements will be due.
There is no minimum payment for non-cancelable annual license fees due during the year ended December 31, 2014. Royalties on licensed revenue accrued as of December 31, 2015 and 2014, were $177,000 and $252,000, respectively. Royalties are included within research and development on the Consolidated Statements of Operations and Comprehensive Loss.
Milestone payments are contingent upon the successful development or implementation of various technologies. Payments for milestones yet to be achieved totaled $2.0 million and $2.1 million for the years ended December 31, 2015 and 2014, respectively. The timing of the payments is not determinable at this time pending research and development currently in progress; however, no significant payments were made during the years ended December 31, 2015 and 2014.
The Company could be adversely affected by certain actions by the government as it relates to government contract revenue received in prior years. Government agencies, such as the Defense Contract Audit Agency routinely audit and investigate government contractors. These agencies review a contractor’s performance under its agreements; cost structure; and compliance with applicable laws, regulations, and standards. The agencies also review the adequacy of, and a contractor’s compliance with, its internal control systems and policies, including the contractor’s purchasing, property, estimating, compensation, and management information systems. While the Company’s management anticipates no adverse result from an audit, should any costs be found to be improperly allocated to a government agreement, such costs will not be reimbursed, or if already reimbursed, may need to be refunded. If an audit uncovers improper or illegal activities, civil and criminal penalties and administrative sanctions, including termination of contracts, forfeiture of profits, suspension of payments or fines, and suspension or prohibition from doing business with the government could occur. In addition, serious reputational harm or significant adverse financial effects could occur if allegations of impropriety were made against the Company. There currently are routine audits in process relating to government grant revenues.
96
Arcadia Biosciences, Inc.
Notes to Consolidated Financial Statements (Continued)
The components of loss before income taxes are as follows:
|
|
|
Year Ended December 31, |
|
|||||
|
|
|
2015 |
|
|
2014 |
|
||
|
Domestic |
|
$ |
(17,930 |
) |
|
$ |
(18,076 |
) |
|
Foreign |
|
|
— |
|
|
|
— |
|
|
Loss before income taxes |
|
$ |
(17,930 |
) |
|
$ |
(18,076 |
) |
The components of the provision for income taxes for the years ended December 31, 2015 and 2014 are as follows (in thousands):
|
|
|
Year Ended December 31, |
|
|||||
|
|
|
2015 |
|
|
2014 |
|
||
|
Current: |
|
|
|
|
|
|
|
|
|
Federal |
|
$ |
— |
|
|
$ |
— |
|
|
State |
|
|
2 |
|
|
|
2 |
|
|
Foreign |
|
|
24 |
|
|
|
261 |
|
|
Total current tax expense |
|
|
26 |
|
|
|
263 |
|
|
Deferred: |
|
|
|
|
|
|
|
|
|
Federal |
|
|
— |
|
|
|
— |
|
|
State |
|
|
— |
|
|
|
— |
|
|
Foreign |
|
|
— |
|
|
|
— |
|
|
Total deferred tax benefit |
|
|
— |
|
|
|
— |
|
|
Total tax expense |
|
$ |
26 |
|
|
$ |
263 |
|
The Company operates in only one federal jurisdiction, the United States. The following is a reconciliation of the statutory federal income tax rate to the Company’s effective tax rate is as follows:
|
|
|
Year Ended December 31, |
|
|||||
|
|
|
2015 |
|
|
2014 |
|
||
|
Expected income tax provision at the federal statutory rate |
|
|
34.0 |
% |
|
|
34.0 |
% |
|
State taxes, net of federal benefit |
|
|
4.5 |
% |
|
|
4.6 |
% |
|
Change in valuation allowance |
|
|
(36.8 |
)% |
|
|
(34.7 |
)% |
|
Nondeductible expenses |
|
|
(1.8 |
)% |
|
|
(3.4 |
)% |
|
Withholding taxes |
|
|
(0.1 |
)% |
|
|
(1.4 |
)% |
|
Other |
|
|
— |
% |
|
|
(0.5 |
)% |
|
Income tax provision |
|
|
(0.2 |
)% |
|
|
(1.4 |
)% |
The total income tax expense for the years ended December 31, 2015 and 2014 was $26,000 and $263,000, respectively, and is comprised of current state taxes and foreign taxes withheld by governmental agencies outside of the United States.
97
Arcadia Biosciences, Inc.
Notes to Consolidated Financial Statements (Continued)
Deferred income taxes reflect the net tax effects of temporary differences between the carrying amounts of assets and liabilities for financial reporting purposes and the amounts used for income tax purposes, net operating loss carryforwards (“NOLs”), and other tax credits. Significant components of the Company’s deferred tax assets are as follows (in thousands):
|
|
|
As of December 31, |
|
|||||
|
|
|
2015 |
|
|
2014 |
|
||
|
Deferred tax assets: |
|
|
|
|
|
|
|
|
|
Net operating loss carryforwards |
|
$ |
41,807 |
|
|
$ |
35,227 |
|
|
Unearned revenue |
|
|
1,421 |
|
|
|
1,741 |
|
|
Stock-based compensation |
|
|
2,485 |
|
|
|
1,971 |
|
|
Accrued payroll and benefits |
|
|
226 |
|
|
|
221 |
|
|
Derivative instrument |
|
|
— |
|
|
|
616 |
|
|
Research and development credits |
|
|
106 |
|
|
|
75 |
|
|
Capital loss carryover |
|
|
16 |
|
|
|
18 |
|
|
Fixed asset basis difference |
|
|
192 |
|
|
|
196 |
|
|
Inventory reserve |
|
|
912 |
|
|
|
680 |
|
|
Charitable contributions |
|
|
7 |
|
|
|
8 |
|
|
Total deferred tax assets |
|
|
47,172 |
|
|
|
40,753 |
|
|
Deferred tax liabilities: |
|
|
|
|
|
|
|
|
|
Convertible note discount |
|
|
— |
|
|
|
(188 |
) |
|
Less valuation allowance |
|
|
(47,172 |
) |
|
|
(40,565 |
) |
|
Net deferred tax assets |
|
$ |
— |
|
|
$ |
— |
|
Realization of the deferred tax assets is dependent upon future taxable income, if any, the amount and timing of which are uncertain. Accordingly, the net deferred tax assets have been offset by a valuation allowance. The net valuation allowance increased by $6.6 million and $6.3 million during the years ended December 31, 2015 and 2014, respectively.
At December 31, 2015, the Company had federal and state NOLs aggregating approximately $118.2 million and $89.1 million, respectively. At December 31, 2015, the utilization of a portion of our NOLs is subject to an annual limitation under Section 382 of the Internal Revenue Code (IRC). Of the $118.2 million generated, $7.2 million will not be available to be utilized within the carryforward period. These federal NOLs will begin to expire in 2020 and these state NOLs will begin to expire in 2016, if not utilized. The Company continues to evaluate IRC Section 382, which may limit NOLs generated in future years.
The Company’s deferred tax asset at December 31, 2015 does not include $2.7 million of excess tax deductions from employee stock option exercises included in its NOLs. The Company’s stockholders’ deficit will be decreased by up to $1.0 million if and when the Company ultimately realizes these excess tax benefits. The Company uses tax law ordering to determine when excess tax benefits have been realized.
The Company evaluates deferred tax assets, including the benefit from NOLs, to determine if a valuation allowance is required. Such evaluation is based on consideration of all available evidence using a “more likely than not” standard with significant weight being given to evidence that can be objectively verified. This assessment considers, among other matters, the nature, frequency, and severity of current and cumulative losses; forecasts of future profitability; the length of statutory carryforward periods; the Company’s experience with operating losses; and tax-planning alternatives. The significant piece of objective negative evidence evaluated was the cumulative loss incurred over the three-period ended December 31, 2015. Given this evidence and the expectation to incur operating losses in the foreseeable future, a full valuation allowance has been recorded against net deferred tax asset. The Company will continue to maintain a full valuation allowance against the entire amount of its net deferred tax asset, until such time as the Company has determined that the weight of the objectively verifiable positive evidence exceeds that of the negative evidence and it is likely that the Company will be able to utilize all of its net deferred tax asset relating to its federal and state NOL carryforwards. Although the Company has established a full valuation allowance on its net deferred tax asset, it has not forfeited the right to carryforward tax losses up to 20 years and apply such tax losses against taxable income in such years, thereby reducing its future tax obligations. The Company
98
Arcadia Biosciences, Inc.
Notes to Consolidated Financial Statements (Continued)
is subject to taxation in the United States and various state jurisdictions. As of December 31, 2015, the Company’s tax years for 2005 through 2015 are generally subject to examination by the tax authorities.
The Company applies the provisions of ASC 740 related to accounting for uncertain tax positions and concluded there were no such positions associated with the Company requiring accrual of a liability. As of December 31, 2015, the Company has not accrued for any such positions. The Company is currently not under audit for federal or state purposes. The Company does not expect a significant change to occur within the next 12 months.
Note 14. Retirement Benefits
The Company has a 401(k) retirement plan (the “Plan”) available for participation by all regular full-time employees who have completed three months of service with the Company. The Company established the Plan in 2008. The Plan provides for a discretionary matching contribution equal to 50% of the amount of the employee’s salary deduction, not to exceed 3% of the salary per employee. Highly compensated employees are excluded from receiving any discretionary matching contribution. Employees’ rights to employer contributions vest on the one-year anniversary of their date of employment. The Company has the option to make discretionary matching contributions. The Company did not make discretionary matching contributions during the years ended December 31, 2015 and 2014.
Note 15. Segment and Geographic Information
Management has determined that it has one business activity and operates in one segment as it only reports financial information on an aggregate and consolidated basis to its Chief Executive Officer, who is the Company’s chief operating decision maker.
Revenues based on the location of the customers, are as follows (in percentages):
|
|
|
Year Ended December 31, |
|
|||||
|
|
|
2015 |
|
|
2014 |
|
||
|
United States |
|
|
72 |
% |
|
|
66 |
% |
|
India |
|
|
12 |
% |
|
|
29 |
% |
|
Africa |
|
|
6 |
% |
|
|
— |
% |
|
United Arab Emirates |
|
|
4 |
% |
|
|
— |
% |
|
Belgium |
|
|
2 |
% |
|
|
1 |
% |
|
France |
|
|
2 |
% |
|
|
3 |
% |
|
Canada |
|
|
1 |
% |
|
|
— |
% |
|
Other |
|
|
1 |
% |
|
|
1 |
% |
|
Total |
|
|
100 |
% |
|
|
100 |
% |
Note 16. Net Loss per Share
Basic net loss per share is calculated by dividing net loss attributable to common stockholders by the weightedaverage number of common shares outstanding during the period and excludes any dilutive effects of stockbased awards and warrants. Diluted net loss per share attributable to common stockholders is computed giving effect to all potentially dilutive common shares, including common stock issuable upon exercise of stock options and warrants and conversion of convertible promissory notes, redeemable convertible preferred stock and convertible preferred stock. As the Company had net losses for the years ended December 31, 2015 and 2014, all potentially dilutive common shares were determined to be antidilutive.
99
Arcadia Biosciences, Inc.
Notes to Consolidated Financial Statements (Continued)
Securities that were not included in the diluted per share calculations because they would be antidilutive were as follows (in shares):
|
|
|
Year Ended December 31, |
|
|||||
|
|
|
2015 |
|
|
2014 |
|
||
|
Convertible preferred stock |
|
|
— |
|
|
|
23,385,029 |
|
|
Redeemable convertible preferred stock |
|
|
— |
|
|
|
9,587,764 |
|
|
Options to purchase common stock |
|
|
3,427,509 |
|
|
|
3,759,839 |
|
|
Warrants to purchase common stock |
|
|
1,336,894 |
|
|
|
1,336,894 |
|
|
Convertible notes |
|
|
— |
|
|
|
308,150 |
|
|
Total |
|
|
4,764,403 |
|
|
|
38,377,676 |
|
Note 17. Related Party Transactions
The Company’s related parties include MCC, Blue Horse Labs, Inc. (“BHL”), and Limagrain. BHL is deemed a related party as a result of its existing contractual relationship with the Company and because a Director of the Company also serves as the Treasurer of BHL and as an Officer and Director of MCC, the Company’s controlling stockholder as of December 31, 2015.
Transactions with related parties are reflected in the consolidated financial statements under amounts due to related parties and notes payable to related party. Outlined below are details of agreements between the Company and its related parties:
A term note was executed with MCC in July 2012 for $8.0 million (see Note 9). The principal balance is included in the December 31, 2014 Consolidated Balance Sheet as notes payable to related party and the related accrued interest is included in amounts due to related parties. This note was repaid in full in April 2015.
Under a license agreement executed in 2003 and amended in 2009, BHL receives a singledigit royalty from the Company when revenue has been collected on product sales or for license payments from third parties that involve certain intellectual property developed under research funding from BHL. Royalty fees due to BHL were $19,000 and $21,000 as of December 31, 2015 and December 31, 2014, respectively, and are included in the Consolidated Balance Sheets as amounts due to related parties.
License agreements were executed with Limagrain, a stockholder of the Company, in September 2009 and February 2011. The agreements license certain of the Company’s traits to Limagrain and include upfront license fees, annual license fees, milestone fees and valuesharing payments. The Company recognized $91,000 and $191,000 of revenue under these agreements for the years ended December 31, 2015 and 2014. No amounts were due from Limagrain as of December 31, 2015 and 2014.
100
Item 9. Changes in and Disagreements With Accountants on Accounting and Financial Disclosure.
None.
Item 9A. Controls and Procedures.
Evaluation of Disclosure Controls and Procedures
Arcadia maintains “disclosure controls and procedures,” as such term is defined in Rule 13a15(e) under the Securities Exchange Act of 1934, or Exchange Act, that are designed to ensure that information required to be disclosed by us in reports that the Company files or submits under the Exchange Act is recorded, processed, summarized, and reported within the time periods specified in Securities and Exchange Commission rules and forms, and that such information is accumulated and communicated to our management, including our Interim Chief Executive Officer and Interim Chief Financial Officer, as appropriate, to allow timely decisions regarding required disclosure. In designing and evaluating our disclosure controls and procedures, management recognized that disclosure controls and procedures, no matter how well conceived and operated, can provide only reasonable, not absolute, assurance that the objectives of the disclosure controls and procedures are met. Our disclosure controls and procedures have been designed to meet reasonable assurance standards. Additionally, in designing disclosure controls and procedures, our management necessarily was required to apply its judgment in evaluating the costbenefit relationship of possible disclosure controls and procedures. The design of any disclosure controls and procedures also is based in part upon certain assumptions about the likelihood of future events, and there can be no assurance that any design will succeed in achieving its stated goals under all potential future conditions.
Based on their evaluation as of the end of the period covered by this Annual Report on Form 10K, our Interim Chief Executive Officer and Interim Chief Financial Officer have concluded that, as of such date, our disclosure controls and procedures were effective at the reasonable assurance level. The Company has a one-year deferral on management’s assessment of its internal controls.
Changes in Internal Control over Financial Reporting
There were no changes in our internal control over financial reporting (as such term is defined in Rule 13a15(f) under the Exchange Act) identified in connection with the evaluation identified above that occurred as of December 31, 2015 that have materially affected, or are reasonably likely to materially affect, our internal control over financial reporting.
None.
Item 10. Directors, Executive Officers and Corporate Governance.
The information required by this item will be contained in our definitive proxy statement to be filed with the Securities and Exchange Commission on Schedule 14A in connection with our 2016 Annual Meeting of Stockholders (the “Proxy Statement”), which is expected to be filed no later than 120 days after the end of our fiscal year ended December 31, 2015, under the headings “Executive Officers,” “Election of Directors,” “Corporate Governance,” and “Section 16(a) Beneficial Ownership Reporting Compliance,” and is incorporated herein by reference.
101
The Company has adopted a written code of business conduct and ethics that applies to our directors, officers, and employees, including our principal executive officer, principal financial officer, principal accounting officer or controller, or persons performing similar functions. A current copy of the code is posed on the Corporate Governance section of our website, which is located at www.arcadiabio.com. If Arcadia makes any substantive amendments to, or grant any waivers from, the code of business conduct and ethics for our principal executive officer, principal financial officer, principal accounting officer, controller or persons performing similar functions, or any officer or director, the Company will disclose the nature of such amendment or waiver on our website or in a current report on Form 8-K.
Item 11. Executive Compensation.
The information required by this item will be contained in Proxy Statement under the headings “Executive Compensation” and “Director Compensation,” and is incorporated herein by reference.
Item 12. Security Ownership of Certain Beneficial Owners and Management and Related Stockholder Matters.
The information required by this item will be contained in Proxy Statement under the headings “Security Ownership of Certain Beneficial Owners and Management” and “Equity Compensation Plan Information,” and is incorporated herein by reference.
Item 13. Certain Relationships and Related Transactions, and Director Independence.
The information required by this item will be contained in Proxy Statement under the headings “Certain Relationships and Related Party Transactions” and “Corporate Governance,” and is incorporated herein by reference.
Item 14. Principal Accounting Fees and Services.
The information required by this item will be contained in Proxy Statement under the heading “Ratification of Independent Registered Public Accounting Firm-Principal Accounting Fees and Services,” and is incorporated herein by reference.
102
Item 15. Exhibits, Financial Statement Schedules.
The financial statements schedules and exhibits filed as part of this Annual Report on Form 10-K are as follows:
(a)(1) Financial Statements
Reference is made to the financial statements included in Item 8 of Part II hereof.
(a)(2) Financial Statement Schedules
All other schedules are omitted because they are not required or the required information is included in the statements or notes thereto.
(a)(3) Exhibits
Reference is made to the Exhibit Index accompanying this Annual Report on Form 10-K.
103
Pursuant to the requirements of Section 13 or 15(d) of the Securities Exchange Act of 1934, as amended, the Registrant has duly caused this Report to be signed on its behalf by the undersigned, thereunto duly authorized.
|
|
ARCADIA BIOSCIENCES, INC. |
|
|
|
|
|
|
Date: March 8, 2016 |
By: |
/s/ ROGER J. SALAMEH |
|
|
|
Roger J. Salameh |
|
|
|
Interim President and Chief Executive Officer (Principal Executive Officer) |
|
|
|
|
|
Date: March 8, 2016 |
By: |
/s/ STEVEN F. BRANDWEIN |
|
|
|
Steven F. Brandwein |
|
|
|
Interim Chief Financial Officer (Principal Financial and Accounting Officer) |
Each person whose individual signature appears below hereby authorizes and appoints Steven F. Brandwein and Wendy S. Neal, and each of them, with full power of substitution and resubstitution and full power to act without the other, as his or her true and lawful attorney-in-fact and agent to act in his or her name, place and stead and to execute in the name and on behalf of each person, individually and in each capacity stated below, and to file any and all amendments to this Annual Report on Form 10-K, and to file the same, with all exhibits thereto, and other documents in connection therewith, with the Securities and Exchange Commission, granting unto said attorneys-in-fact and agents, and each of them, full power and authority to do and perform each and every act and thing, ratifying and confirming all that said attorneys-in-fact and agents or any of them or their or his substitute or substitutes may lawfully do or cause to be done by virtue thereof.
Pursuant to the requirements of the Securities Exchange Act of 1934, as amended, this Report has been signed below by the following persons on behalf of the registrant in the capacities and on the dates indicated.
|
Name |
|
Title |
|
Date |
|
|
|
|
|
|
|
/s/ DARBY E. SHUPP |
|
|
|
|
|
Darby E. Shupp |
|
Director |
|
March 8, 2016 |
|
|
|
|
|
|
|
/s/ MATTHEW A. ANKRUM |
|
|
|
|
|
Matthew A. Ankrum |
|
Director |
|
March 8, 2016 |
|
|
|
|
|
|
|
/s/ UDAY GARG |
|
|
|
|
|
Uday Garg |
|
Director |
|
March 8, 2016 |
|
|
|
|
|
|
|
/s/ GEORGE F.J. GOSBEE |
|
|
|
|
|
George F.J. Gosbee |
|
Director |
|
March 8, 2016 |
|
|
|
|
|
|
|
/s/ VIC C. KNAUF |
|
|
|
|
|
Vic C. Knauf |
|
Director |
|
March 8, 2016 |
|
|
|
|
|
|
|
/s/ JAMES R. REIS |
|
|
|
|
|
James R. Reis |
|
Director |
|
March 8, 2016 |
|
|
|
|
|
|
|
/s/ RAJIV SHAH |
|
|
|
|
|
Rajiv Shah |
|
Director |
|
March 8, 2016 |
104
|
|
|
|
|
Incorporated by Reference |
|
|
||||||
|
Exhibit Number |
|
Exhibit Description |
|
Form |
|
File No. |
|
Exhibit |
|
Filing Date |
|
Filed Herewith |
|
3.1 |
|
Amended and Restated Certificate of Incorporation of Registrant. |
|
8-K |
|
001-37383 |
|
3.1 |
|
5/26/2015 |
|
|
|
3.2 |
|
Amended and Restated Bylaws of Registrant. |
|
8-K |
|
001-37383 |
|
3.2 |
|
5/26/2015 |
|
|
|
4.1 |
|
Form of Registrant’s common stock certificate. |
|
S-1/A |
|
333-202124 |
|
4.1 |
|
4/6/2015 |
|
|
|
4.2 |
|
Investors’ Rights Agreement dated March 28, 2014 among the Registrant and certain holders of its capital stock. |
|
S-1 |
|
333-202124 |
|
4.2 |
|
2/17/2015 |
|
|
|
4.3 |
|
Amended and Restated Investors’ Rights Agreement dated April 30, 2010 among the Registrant and certain holders of its capital stock. |
|
S-1 |
|
333-202124 |
|
4.3 |
|
2/17/2015 |
|
|
|
4.4 |
|
Note and Warrant Purchase Agreement dated September 27, 2013 between the Registrant and Mahyco International Pte Ltd., as amended. |
|
S-1/A |
|
333-202124 |
|
4.4 |
|
4/30/2015 |
|
|
|
4.5 |
|
Amended and Restated Stock Purchase Warrant dated December 11, 2013 between the Registrant and Mahyco International Pte Ltd. |
|
S-1/A |
|
333-202124 |
|
4.7 |
|
4/30/2015 |
|
|
|
4.6 |
|
Form of Common Stock Purchase Warrant between the Registrant and certain purchasers of its Series D Preferred Stock. |
|
S-1 |
|
333-202124 |
|
4.8 |
|
2/17/2015 |
|
|
|
10.1† |
|
License Agreement dated October 2, 2006 between the Registrant and The Governors of the University of Alberta. |
|
S-1 |
|
333-202124 |
|
10.1 |
|
2/17/2015 |
|
|
|
10.2† |
|
Intellectual Property License Agreement dated January 1, 2003 between the Registrant and Blue Horse Labs, Inc., as amended. |
|
8-K |
|
001-37383 |
|
10.2 |
|
6/10/2015 |
|
|
|
10.3† |
|
Exclusive License Agreement for Drought-Resistant Plants dated July 2, 2010 between the Registrant and The Regents of the University of California, as amended. |
|
S-1/A |
|
333-202124 |
|
10.3 |
|
4/6/2015 |
|
|
|
10.4† |
|
License Agreement dated February 14, 2002 between the Registrant and The University of Toronto Innovations Foundation. |
|
S-1 |
|
333-202124 |
|
10.4 |
|
2/17/2015 |
|
|
|
10.5† |
|
Amended and Restated License Agreement dated July 25, 2007 between the Registrant and Ross Products Division of Abbott Laboratories, as amended. |
|
S-1/A |
|
333-202124 |
|
10.5 |
|
4/6/2015 |
|
|
|
10.6† |
|
Collaborative Research and Development Agreement dated July 31, 2009 between the Registrant and Maharashtra Hybrid Seeds Co. Ltd. |
|
S-1 |
|
333-202124 |
|
10.6 |
|
2/17/2015 |
|
|
|
10.7† |
|
Cooperative Agreement dated September 30, 2008 between the Registrant and the United States Agency for International Development, as amended. |
|
S-1 |
|
333-202124 |
|
10.13 |
|
2/17/2015 |
|
|
105
|
* |
Filed herewith. |
106