Attached files
| file | filename |
|---|---|
| EX-99.1 - EX-99.1 - Lumos Networks Corp. | d155297dex991.htm |
| 8-K - 8-K - Lumos Networks Corp. | d155297d8k.htm |
Exhibit 99.2
|
|

Company Presentation March 2016
|
|
Use of Non-GAAP Financial Measures
Included in this presentation are certain non-GAAP financial measures that are not determined in accordance with US generally accepted accounting principles. These financial performance measures are not indicative of cash provided or used by operating activities and exclude the effects of certain operating, capital and financing costs and may differ from comparable information provided by other companies, and they should not be considered in isolation, as an alternative to, or more meaningful than measures of financial performance determined in accordance with US generally accepted accounting principles. These financial performance measures are commonly used in the industry and are presented because Lumos Networks Corp. believes they provide relevant and useful information to investors. The Company utilizes these financial performance measures to assess its ability to meet future capital expenditure and working capital requirements, to incur indebtedness if necessary, and to fund continued growth. Lumos Networks Corp. also uses these financial performance measures to evaluate the performance of its business, for budget planning purposes and as factors in its employee compensation programs.
Special Note Regarding Forward-Looking Statements
Any statements contained in this presentation that are not statements of historical fact, including statements about our beliefs and expectations, are forward-looking statements and should be evaluated as such. The words “anticipates,” “believes,” “expects,” “intends,” “plans,” “estimates,”
“targets,” “projects,” “should,” “may,” “will” and similar words and expressions are intended to identify forward-looking statements. Such forward-looking statements reflect, among other things, our current expectations, plans and strategies, and anticipated financial results, all of which are subject to known and unknown risks, uncertainties and factors that may cause our actual results to differ materially from those expressed or implied by these forward-looking statements. Many of these risks are beyond our ability to control or predict. Because of these risks, uncertainties and assumptions, you should not place undue reliance on these forward-looking statements. Furthermore, forward-looking statements speak only as of the date they are made. We do not undertake any obligation to update or review any forward-looking information, whether as a result of new information, future events or otherwise. Important factors with respect to any such forward-looking statements, including certain risks and uncertainties that could cause actual results to differ from those contained in the forward-looking statements, include, but are not limited to: rapid development and intense competition in the telecommunications and high speed data transport industry; our ability to grow our data business on an organic or inorganic basis in order to offset expected revenue declines in legacy voice and access products; our ability to divest our legacy business on a timely basis; our ability to effectively allocate capital and implement our network expansion plans in a timely manner; our ability to complete customer installations in a timely manner; adverse economic conditions; operating and financial restrictions imposed by our senior credit facility and our unsecured debt obligations; our cash and capital requirements; our ability to maintain and enhance our network; the potential to experience a high rate of customer turnover; federal and state regulatory fees, requirements and developments; our reliance on certain suppliers and vendors; and other unforeseen difficulties that may occur. These risks and uncertainties are not intended to represent a complete list of all risks and uncertainties inherent in our business, and should be read in conjunction with the more detailed cautionary statements and risk factors included in our SEC filings, including our Annual Report filed on Form 10-K.
| 1 |
|
|
|
Advanced Fiber Network Driving Value for Our Customers
| 2 |
|
|
|
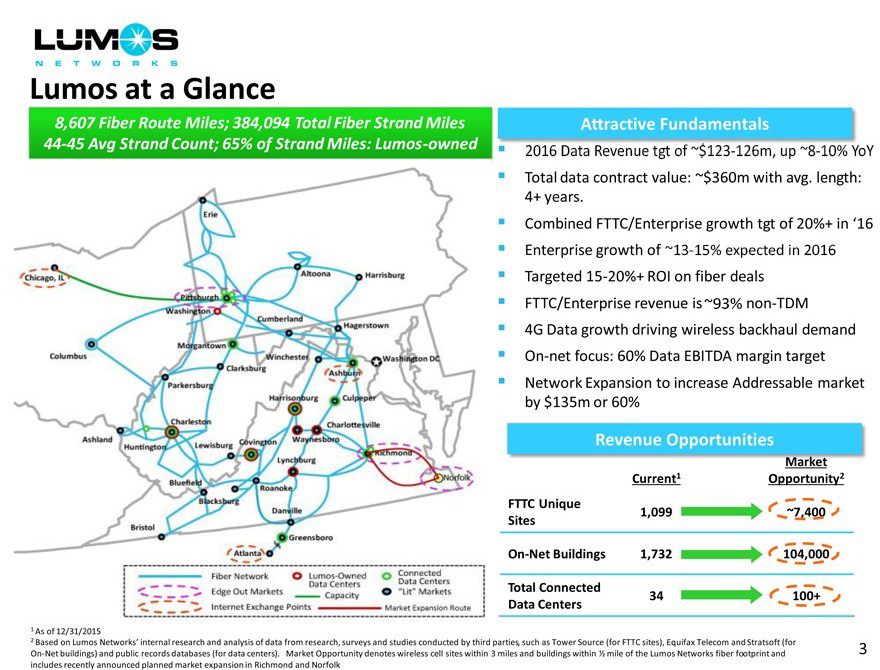
Lumos at a Glance
8,607 Fiber Route Miles; 384,094 Total Fiber Strand Miles 44-45 Avg Strand Count; 65% of Strand Miles: Lumos-owned
Attractive Fundamentals
2016 Data Revenue tgt of ~$123-126m, up ~8-10% YoY
Total data contract value: ~$360m with avg. length: 4+ years.
Combined FTTC/Enterprise growth tgt of 20%+ in ‘16
Enterprise growth of ~13-15% expected in 2016
Targeted 15-20%+ ROI on fiber deals
FTTC/Enterprise revenue is ~93% non-TDM
4G Data growth driving wireless backhaul demand
On-net focus: 60% Data EBITDA margin target
Network Expansion to increase Addressable market by $135m or 60%
Revenue Opportunities
Current1 Opportunity2
FTTC Unique
1,099 ~7,400
Sites
On-Net Buildings 1,732 104,000
Total Connected
34 100+
Data Centers
| 1 |
|
As of 12/31/2015 |
2 Based on Lumos Networks’ internal research and analysis of data from research, surveys and studies conducted by third parties, such as Tower Source (for FTTC sites), Equifax Telecom and Stratsoft (for
On-Net buildings) and public records databases (for data centers). Market Opportunity denotes wireless cell sites within 3 miles and buildings within 1/2 mile of the Lumos Networks fiber footprint and includes recently announced planned market expansion in Richmond and Norfolk
| 3 |
|
|
|
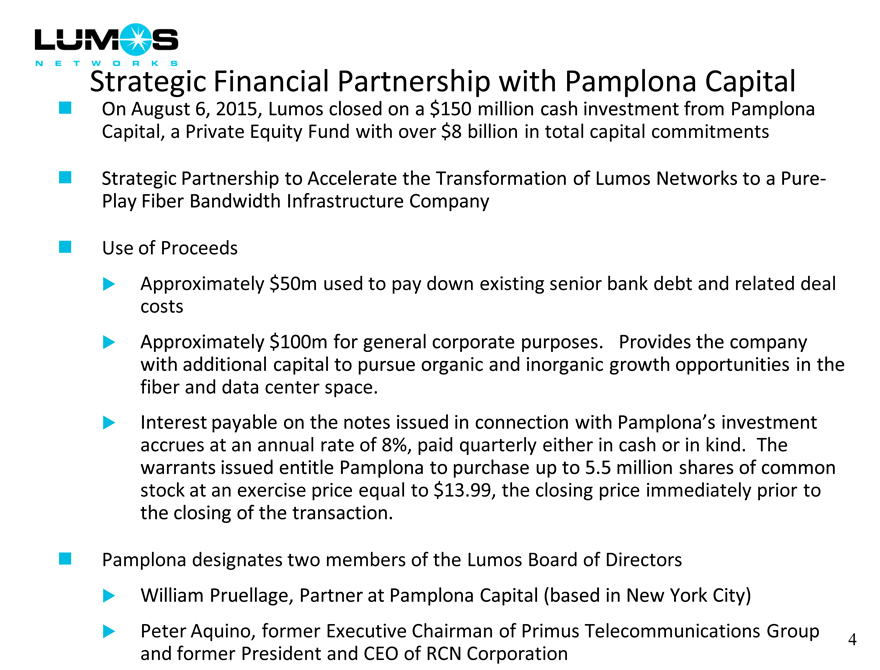
Strategic Financial Partnership with Pamplona Capital
On August 6, 2015, Lumos closed on a $150 million cash investment from Pamplona
Capital, a Private Equity Fund with over $8 billion in total capital commitments
Strategic Partnership to Accelerate the Transformation of Lumos Networks to a Pure-Play Fiber Bandwidth Infrastructure Company
Use of Proceeds
Approximately $50m used to pay down existing senior bank debt and related deal costs
Approximately $100m for general corporate purposes. Provides the company with additional capital to pursue organic and inorganic growth opportunities in the fiber and data center space.
Interest payable on the notes issued in connection with Pamplona’s investment accrues at an annual rate of 8%, paid quarterly either in cash or in kind. The warrants issued entitle Pamplona to purchase up to 5.5 million shares of common stock at an exercise price equal to $13.99, the closing price immediately prior to the closing of the transaction.
Pamplona designates two members of the Lumos Board of Directors
William Pruellage, Partner at Pamplona Capital (based in New York City)
Peter Aquino, former Executive Chairman of Primus Telecommunications Group and former President and CEO of RCN Corporation
| 4 |
|
|
|
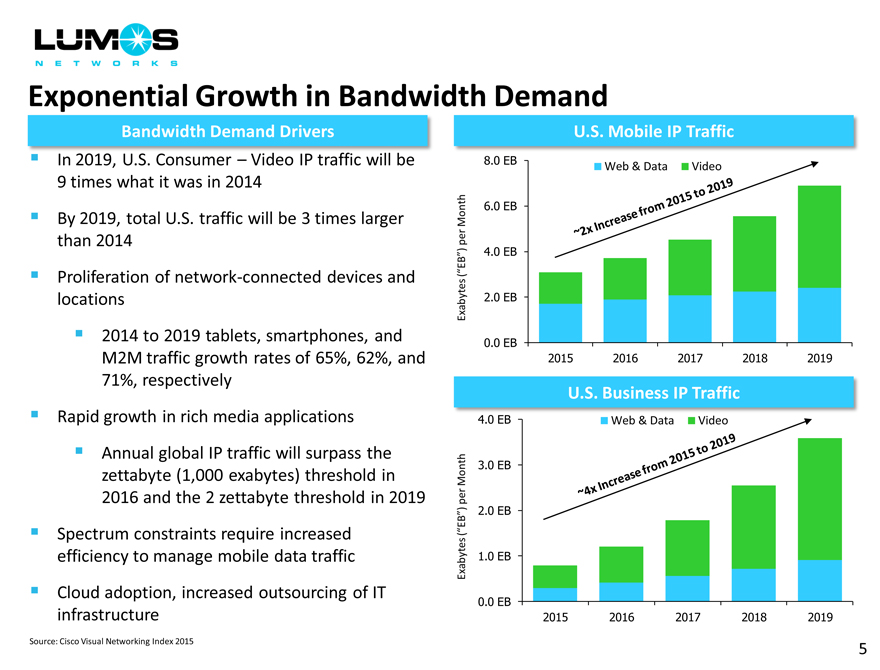
Exponential Growth in Bandwidth Demand 1 EB
Bandwidth Demand Drivers
In 2019, U.S. Consumer – Video IP traffic will be
times what it was in 2014
By 2019, total U.S. traffic will be 3 times larger than 2014
Proliferation of network-connected devices and locations
2014 to 2019 tablets, smartphones, and M2M traffic growth rates of 65%, 62%, and 71%, respectively
Rapid growth in rich media applications
Annual global IP traffic will surpass the zettabyte (1,000 exabytes) threshold in 2016 and the 2 zettabyte threshold in 2019
Spectrum constraints require increased efficiency to manage mobile data traffic
Cloud adoption, increased outsourcing of IT infrastructure
U.S. Mobile IP Traffic
8.0 EB Web & Data Video File Sharing
| 5 |
|
EB |
6.0 EB
Month 4 EB
per
4.0 EB
(“EB”) 3 EB
Exabytes 2.0 EB2 EB
0.0 EB1 EB
2015 2016 2017 2018 2019
U.S. Business IP Traffic
4.0 EB Web & Data Video File Sharing
Month 3.0 EB
per
(“EB”) 2.0 EB
Exabytes 1.0 EB
0.0 EB
2015 2016 2017 2018 2019
Source: Cisco Visual Networking Index 2015
| 5 |
|
|
|
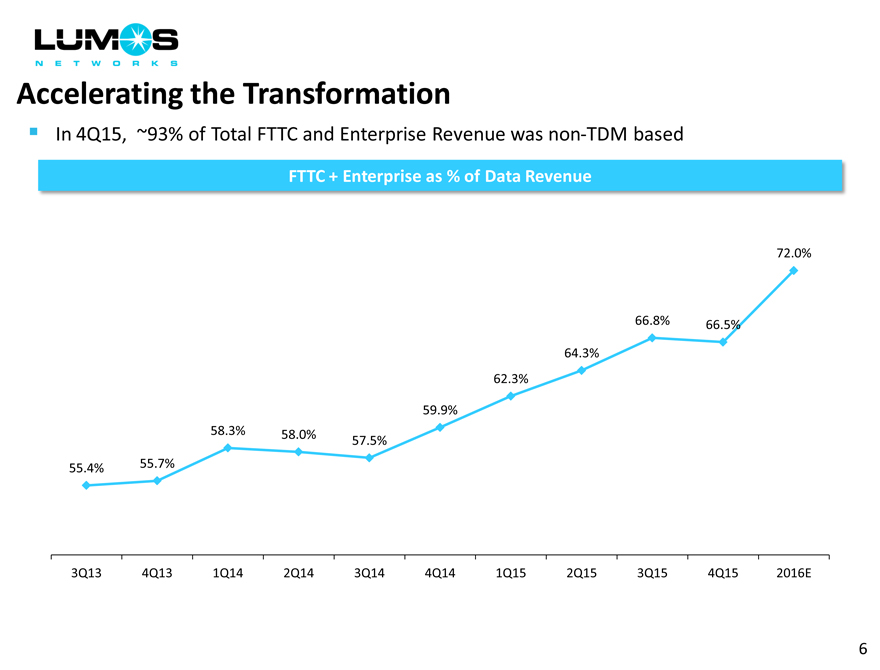
Accelerating the Transformation
In 4Q15, ~93% of Total FTTC and Enterprise Revenue was non-TDM based
FTTC + Enterprise as % of Data Revenue
72.0%
66.8% 66.5%
64.3%
62.3%
59.9%
58.3% 58.0%
57.5%
55.4% 55.7%
3Q13 4Q13 1Q14 2Q14 3Q14 4Q14 1Q15 2Q15 3Q15 4Q15 2016E
| 6 |
|
|
|
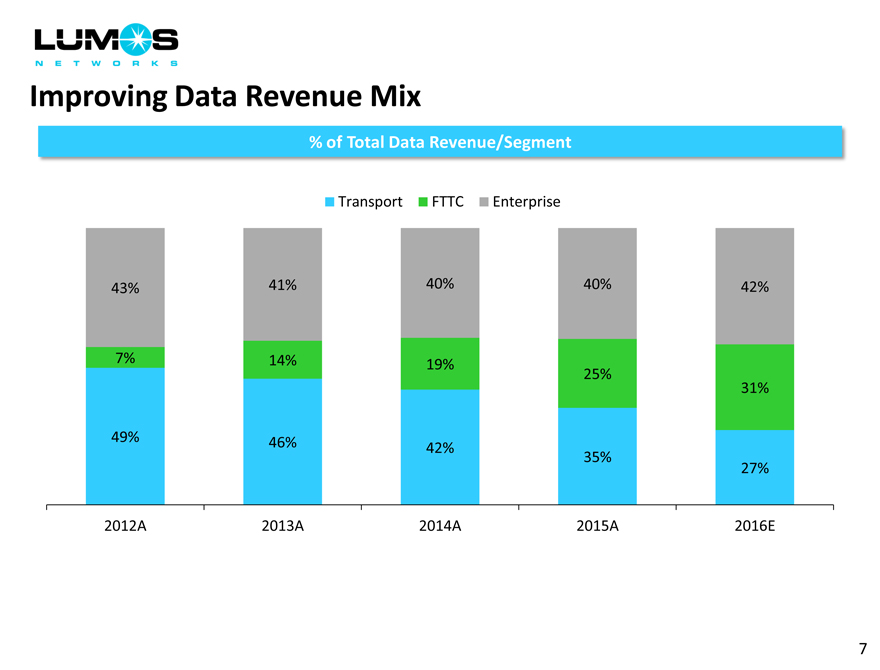
Improving Data Revenue Mix
% of Total Data Revenue/Segment
Transport FTTC Enterprise
43% 41% 40% 40% 42%
7% 14% 19%
25%
31%
49% 46%
42% 35%
27%
2012A 2013A 2014A 2015A 2016E
| 7 |
|
|
|
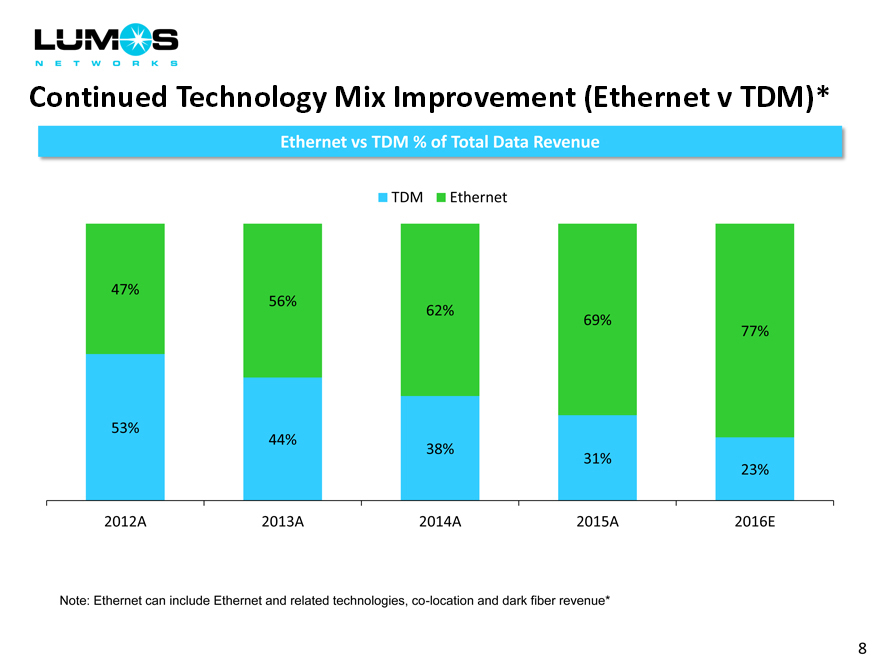
Continued Technology Mix Improvement (Ethernet v TDM)*
Ethernet vs TDM % of Total Data Revenue
TDM Ethernet
47%
56%
62%
69%
77%
53%
44%
38%
31%
23%
2012A 2013A 2014A 2015A 2016E
Note: Ethernet can include Ethernet and related technologies, co-location and dark fiber revenue*
| 8 |
|
|
|
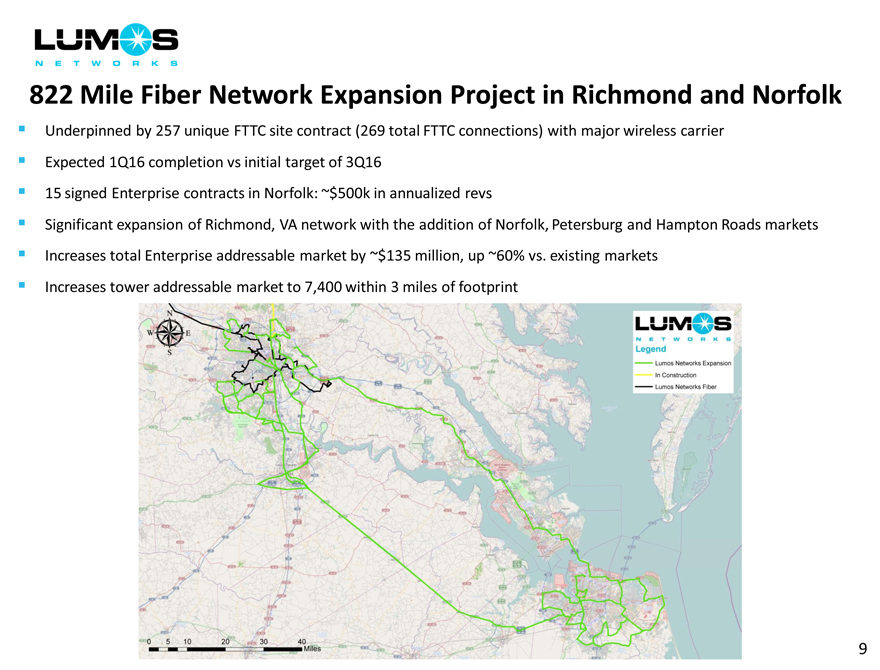
822 Mile Fiber Network Expansion Project in Richmond and Norfolk
Underpinned by 257 unique FTTC site contract (269 total FTTC connections) with major wireless carrier
Expected 1Q16 completion vs initial target of 3Q16
15 signed Enterprise contracts in Norfolk: ~$500k in annualized revs
Significant expansion of Richmond, VA network with the addition of Norfolk, Petersburg and Hampton Roads markets
Increases total Enterprise addressable market by ~$135 million, up ~60% vs. existing markets
Increases tower addressable market to 7,400 within 3 miles of footprint
9
|
|
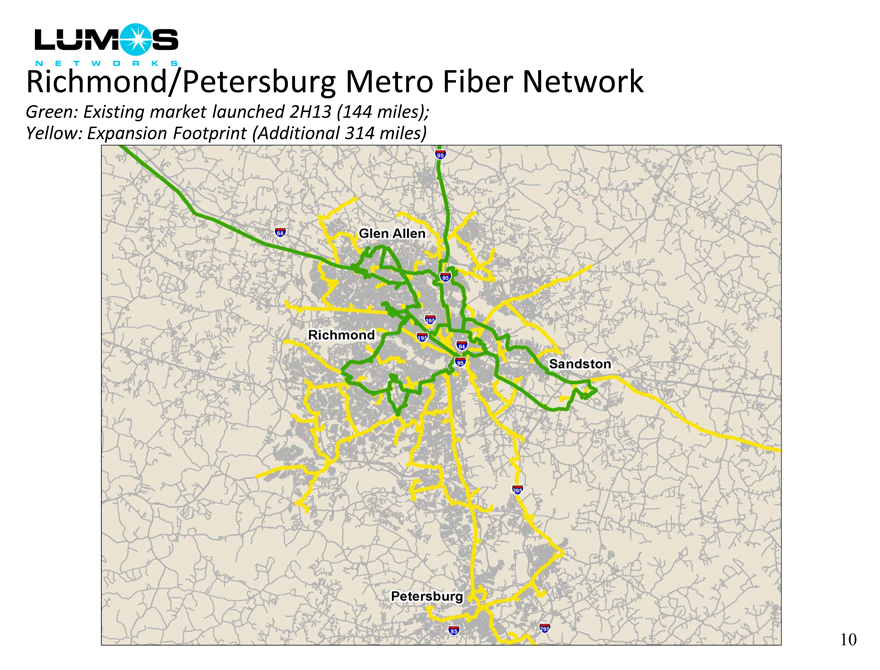
Richmond/Petersburg Metro Fiber Network
Green: Existing market launched 2H13 (144 miles);
Yellow: Expansion Footprint (Additional 314 miles)
10
|
|
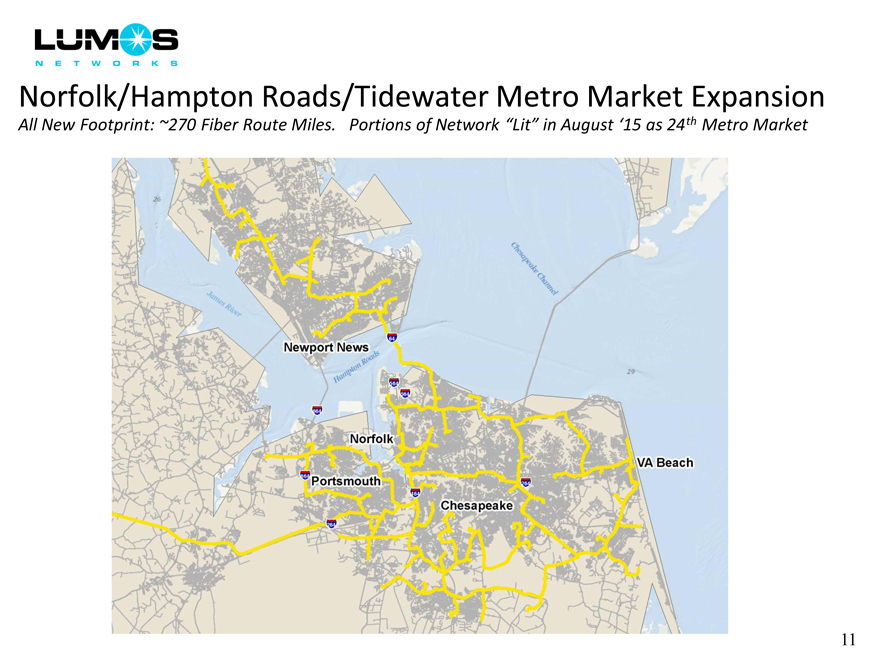
Norfolk/Hampton Roads/Tidewater Metro Market Expansion
All New Footprint: ~270 Fiber Route Miles. Portions of Network “Lit” in August ‘15 as 24th Metro Market
11
|
|
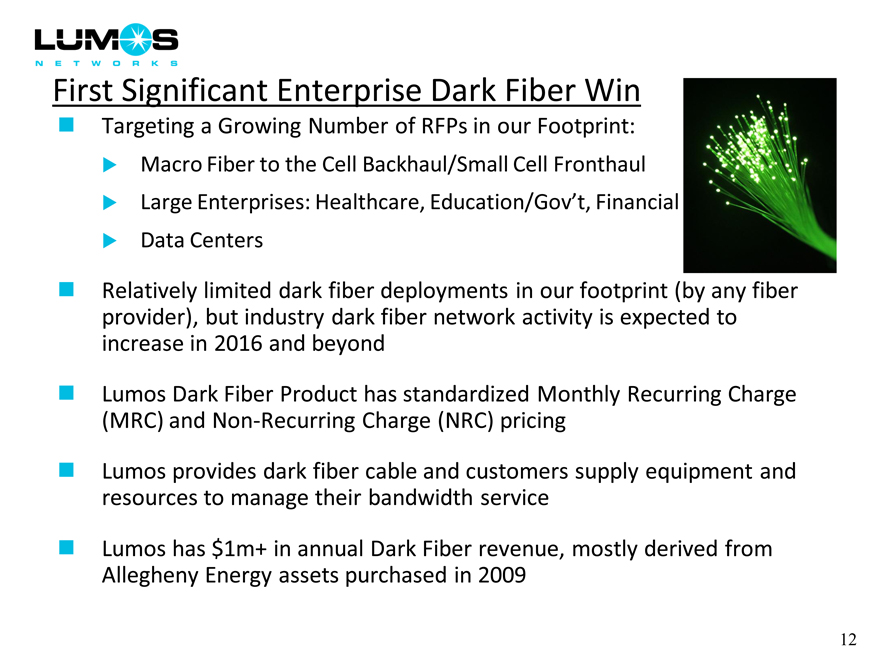
First Significant Enterprise Dark Fiber Win
Targeting a Growing Number of RFPs in our Footprint:
Macro Fiber to the Cell Backhaul/Small Cell Fronthaul
Large Enterprises: Healthcare, Education/Gov’t, Financial
Data Centers
Relatively limited dark fiber deployments in our footprint (by any fiber provider), but industry dark fiber network activity is expected to increase in 2016 and beyond
Lumos Dark Fiber Product has standardized Monthly Recurring Charge (MRC) and Non-Recurring Charge (NRC) pricing
Lumos provides dark fiber cable and customers supply equipment and resources to manage their bandwidth service
Lumos has $1m+ in annual Dark Fiber revenue, mostly derived from Allegheny Energy assets purchased in 2009
12
|
|
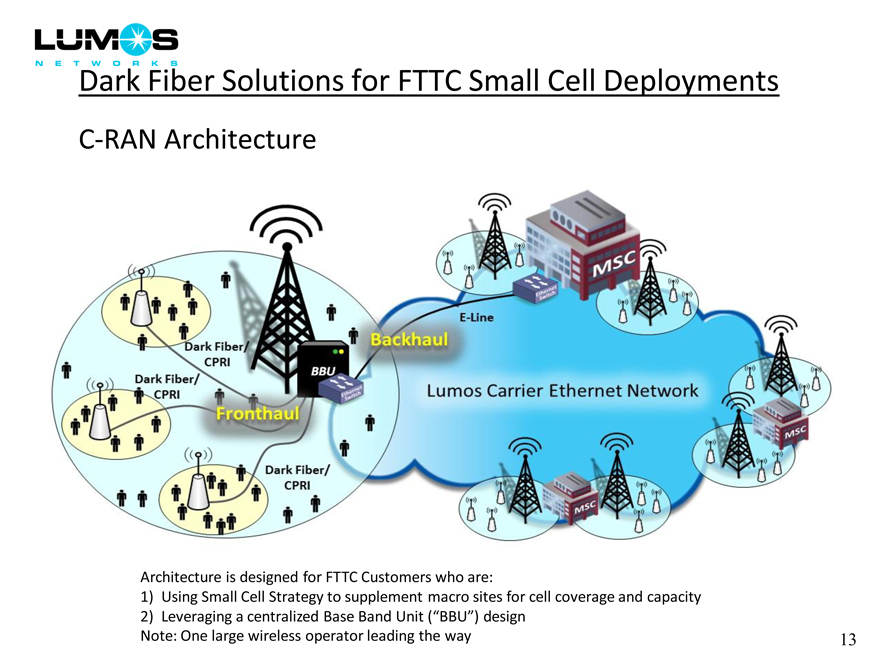
Dark Fiber Solutions for FTTC Small Cell Deployments
C-RAN Architecture
Architecture is designed for FTTC Customers who are:
1) Using Small Cell Strategy to supplement macro sites for cell coverage and capacity
2) Leveraging a centralized Base Band Unit (“BBU”) design
Note: One large wireless operator leading the way
13
|
|
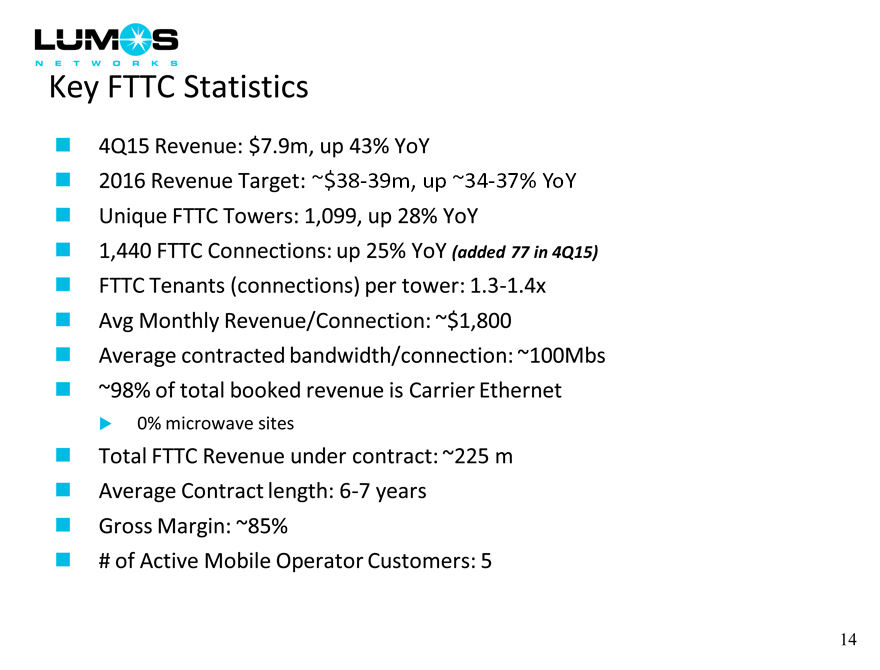
Key FTTC Statistics
4Q15 Revenue: $7.9m, up 43% YoY
2016 Revenue Target: $39m, up 38% YoY
Unique FTTC Towers: 1,099, up 28% YoY
1,440 FTTC Connections: up 25% YoY (added 77 in 4Q15)
FTTC Tenants (connections) per tower: 1.3-1.4x
Avg Monthly Revenue/Connection: ~$1,800
Average contracted bandwidth/connection: ~100Mbs
~98% of total booked revenue is Carrier Ethernet
0% microwave sites
Total FTTC Revenue under contract: ~225 m
Average Contract length: 6-7 years
Gross Margin: ~85%
# of Active Mobile Operator Customers: 5
14
|
|
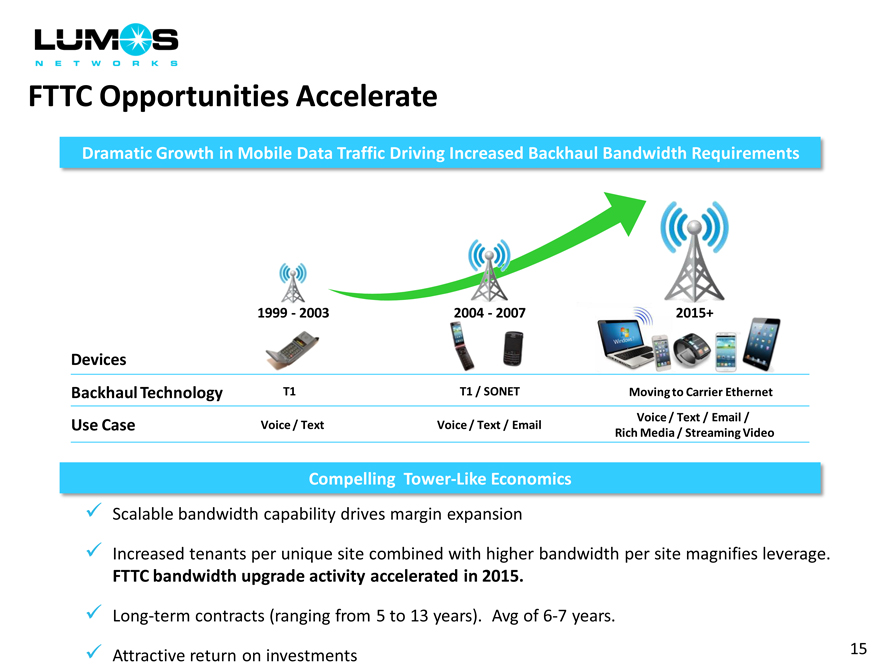
FTTC Opportunities Accelerate
Dramatic Growth in Mobile Data Traffic Driving Increased Backhaul Bandwidth Requirements
1999—2003 2004—2007 2015+
Devices
Backhaul Technology T1 T1 / SONET Moving to Carrier Ethernet
Use Case Voice / Text Voice / Text / Email Voice / Text / Email /
Rich Media / Streaming Video
Compelling Tower-Like Economics
Scalable bandwidth capability drives margin expansion
Increased tenants per unique site combined with higher bandwidth per site magnifies leverage.
FTTC bandwidth upgrade activity accelerated in 2015.
Long-term contracts (ranging from 5 to 13 years). Avg of 6-7 years.
Attractive return on investments
15
|
|
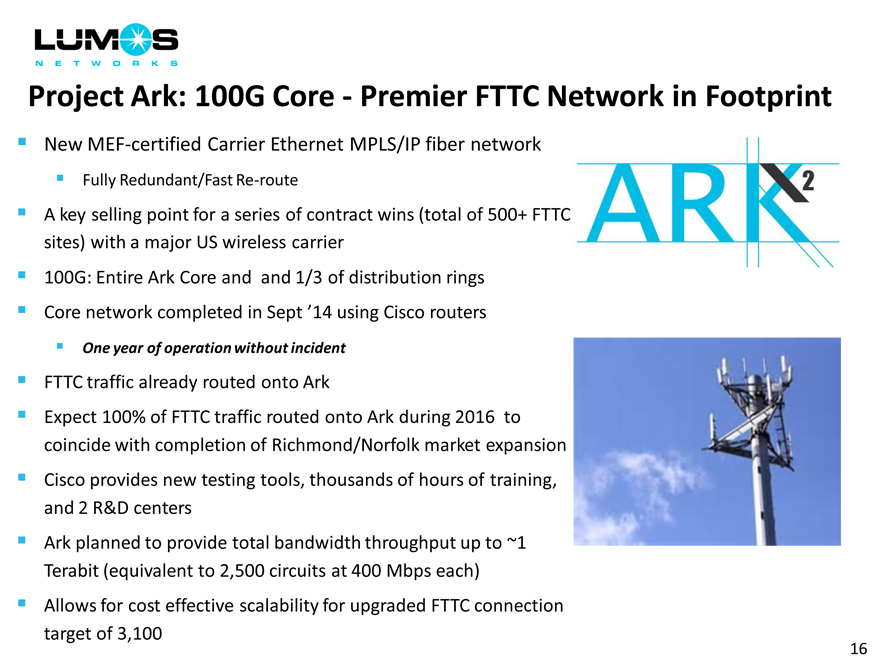
Project Ark: 100G Core—Premier FTTC Network in Footprint
New MEF-certified Carrier Ethernet MPLS/IP fiber network
Fully Redundant/Fast Re-route
A key selling point for a series of contract wins (total of 500+ FTTC sites) with a major US wireless carrier
100G: Entire Ark Core and and 1/3 of distribution rings
Core network completed in Sept ’14 using Cisco routers
One year of operation without incident
FTTC traffic already routed onto Ark
Expect 100% of FTTC traffic routed onto Ark during 2016 to coincide with completion of Richmond/Norfolk market expansion
Cisco provides new testing tools, thousands of hours of training, and 2 R&D centers
Ark planned to provide total bandwidth throughput up to ~1 Terabit (equivalent to 2,500 circuits at 400 Mbps each)
Allows for cost effective scalability for upgraded FTTC connection target of 3,100
16
|
|
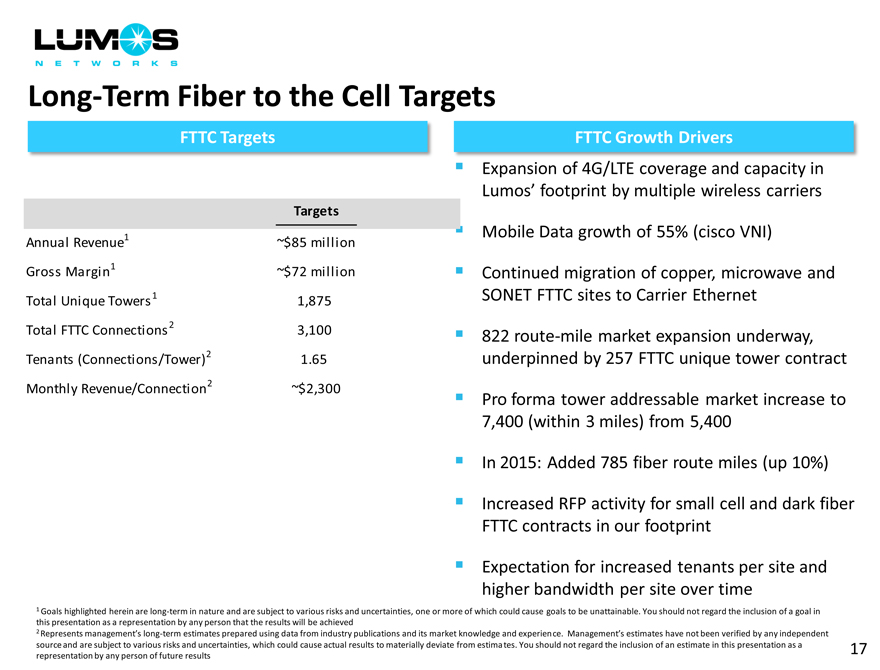
Long-Term Fiber to the Cell Targets
FTTC Targets
Targets
Annual Revenue1 ~$85 million
Gross Margin1 ~$72 million
Total Unique Towers 1 1,875
Total FTTC Connections 2 3,100
Tenants (Connections/Tower)2 1.65
Monthly Revenue/Connection2 ~$2,300
FTTC Growth Drivers
Expansion of 4G/LTE coverage and capacity in
Lumos’ footprint by multiple wireless carriers
Mobile Data growth of 55% (cisco VNI)
Continued migration of copper, microwave and SONET FTTC sites to Carrier Ethernet
822 route-mile market expansion underway, underpinned by 257 FTTC unique tower contract
Pro forma tower addressable market increase to 7,400 (within 3 miles) from 5,400
In 2015: Added 785 fiber route miles (up 10%)
Increased RFP activity for small cell and dark fiber FTTC contracts in our footprint
Expectation for increased tenants per site and higher bandwidth per site over time
1 Goals highlighted herein are long-term in nature and are subject to various risks and uncertainties, one or more of which could cause goals to be unattainable. You should not regard the inclusion of a goal in this presentation as a representation by any person that the results will be achieved
2 Represents management’s long-term estimates prepared using data from industry publications and its market knowledge and experience. Management’s estimates have not been verified by any independent source and are subject to various risks and uncertainties, which could cause actual results to materially deviate from estimates. You should not regard the inclusion of an estimate in this presentation as a representation by any person of future results
17
|
|
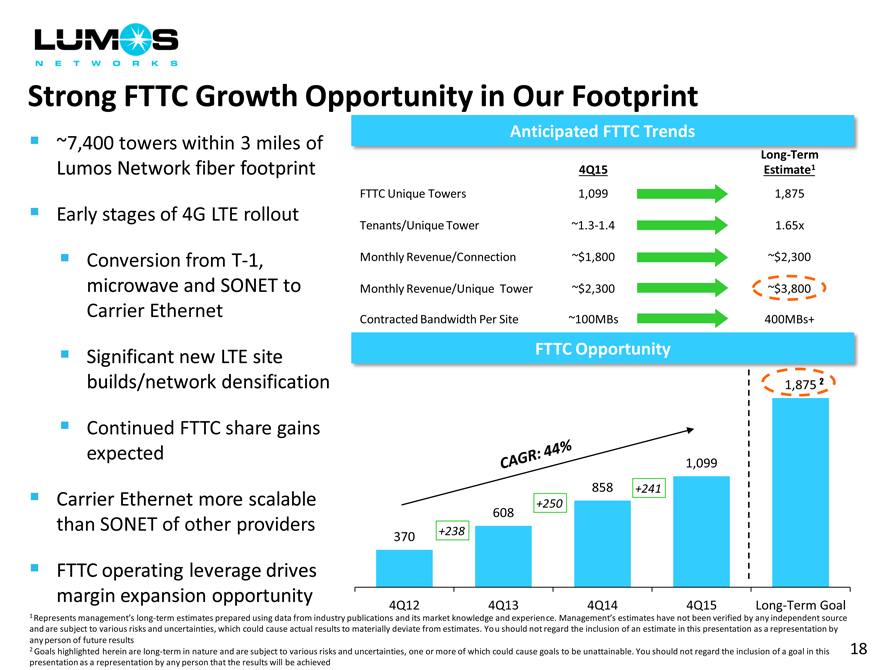
Strong FTTC Growth Opportunity in Our Footprint
~7,400 towers within 3 miles of
Lumos Network fiber footprint
Early stages of 4G LTE rollout
Conversion from T-1, microwave and SONET to
Carrier Ethernet
Significant new LTE site builds/network densification
Continued FTTC share gains expected
Carrier Ethernet more scalable than SONET of other providers
FTTC operating leverage drives margin expansion opportunity
Anticipated FTTC Trends
4Q15 Estimate1
FTTC Unique Towers 1,099 1,875
Tenants/Unique Tower ~1.3-1.4 1.65x
Monthly Revenue/Connection ~$ 1,800 ~$ 2,300
Monthly Revenue/Unique Tower ~$ 2,300 ~$ 3,800
Contracted Bandwidth Per Site ~100MBs 400MBs+
FTTC Opportunity
1,875 2
1,099
858 +241
+250
608
370 +238
4Q12 4Q13 4Q14 4Q15 Long-Term Goal
1 Represents management’s long-term estimates prepared using data from industry publications and its market knowledge and experience. Management’s estimates have not been verified by any independent source and are subject to various risks and uncertainties, which could cause actual results to materially deviate from estimates. You should not regard the inclusion of an estimate in this presentation as a representation by any person of future results 2 Goals highlighted herein are long-term in nature and are subject to various risks and uncertainties, one or more of which could cause goals to be unattainable. You should not regard the inclusion of a goal in this presentation as a representation by any person that the results will be achieved
18
|
|
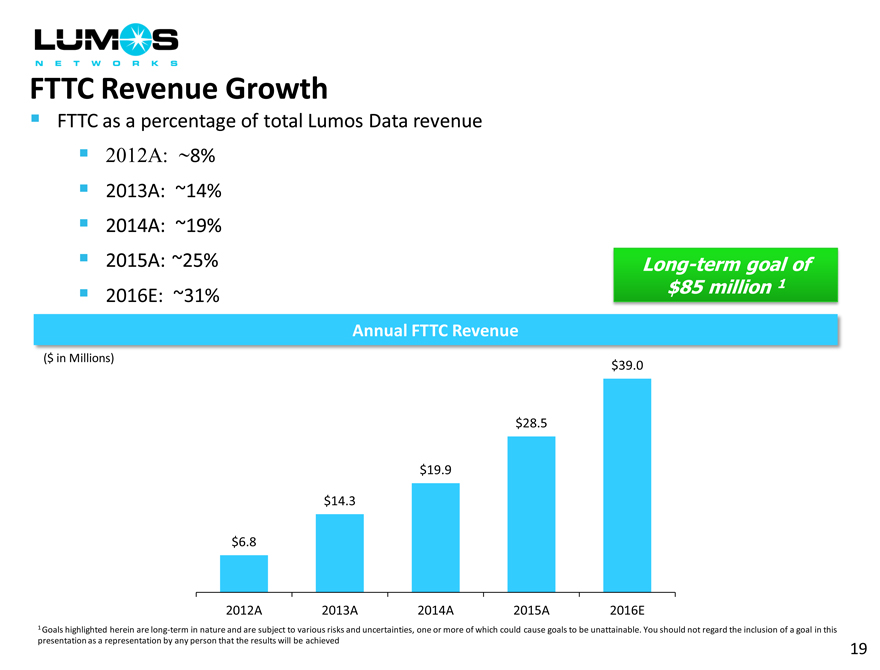
FTTC Revenue Growth
FTTC as a percentage of total Lumos Data revenue
2012A: ~8%
2013A: ~14%
2014A: ~19%
2015A: ~25%
2016E: ~31%
Long-term goal of $85 million 1
Annual FTTC Revenue
($ in Millions)
$39.0
$28.5
$19.9
$14.3
$6.8
2012A 2013A 2014A 2015A 2016E
1 Goals highlighted herein are long-term in nature and are subject to various risks and uncertainties, one or more of which could cause goals to be unattainable. You should not regard the inclusion of a goal in this presentation as a representation by any person that the results will be achieved
19
|
|

Key Enterprise Accounts
20
|
|
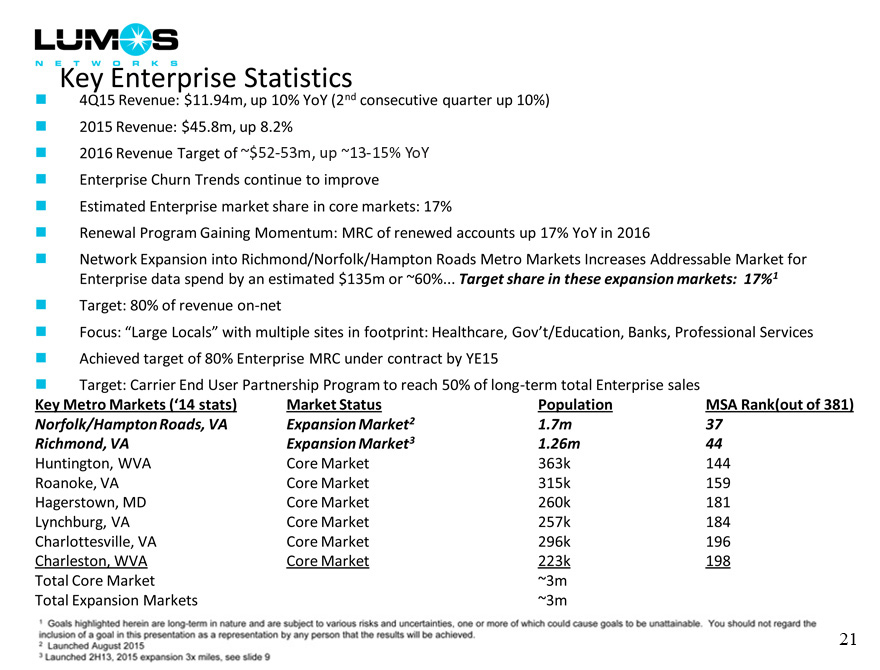
Key Enterprise Statistics
4Q15 Revenue: $11.94m, up 10% YoY (2nd consecutive quarter up 10%)
2015 Revenue: $45.8m, up 8.2%
2016 Revenue Target of ~$52-53m, up ~13%-15% yoy
Enterprise Churn Trends continue to improve
Estimated Enterprise market share in core markets: 17%
Renewal Program Gaining Momentum: MRC of renewed accounts up 17% YoY in 2016
Network Expansion into Richmond/Norfolk/Hampton Roads Metro Markets Increases Addressable Market for Enterprise data spend by an estimated $135m or ~60%. Target share in these expansion markets: 17%1
Target: 80% of revenue on-net
Focus: “Large Locals” with multiple sites in footprint: Healthcare, Gov’t/Education, Banks, Professional Services
Achieved target of 80% Enterprise MRC under contract by YE15
Target: Carrier End User Partnership Program to reach 50% of long-term total Enterprise sales
Key Metro Markets (‘14 stats) Market Status Population MSA Rank(out of 381)
Norfolk/Hampton Roads, VA Expansion Market2 1.7m 37
Richmond, VA Expansion Market3 1.26m 44
Huntington, WVA Core Market 363k 144
Roanoke, VA Core Market 315k 159
Hagerstown, MD Core Market 260k 181
Lynchburg, VA Core Market 257k 184
Charlottesville, VA Core Market 296k 196
Charleston, WVA Core Market 223k 198
Total Core Market ~3m
Total Expansion Markets ~3m
1 Goals highlighted herein are long-term in nature and are subject to various risks and uncertainties, one or more of which could cause goals to be unattainable. You should not regard the inclusion of a goal in this presentation as a representation by any person that the results will be achieved.
| 2 |
|
Launched August 2015 |
| 3 |
|
Launched 2H13, 2015 expansion 3x miles, see slide 9 |
21
|
|
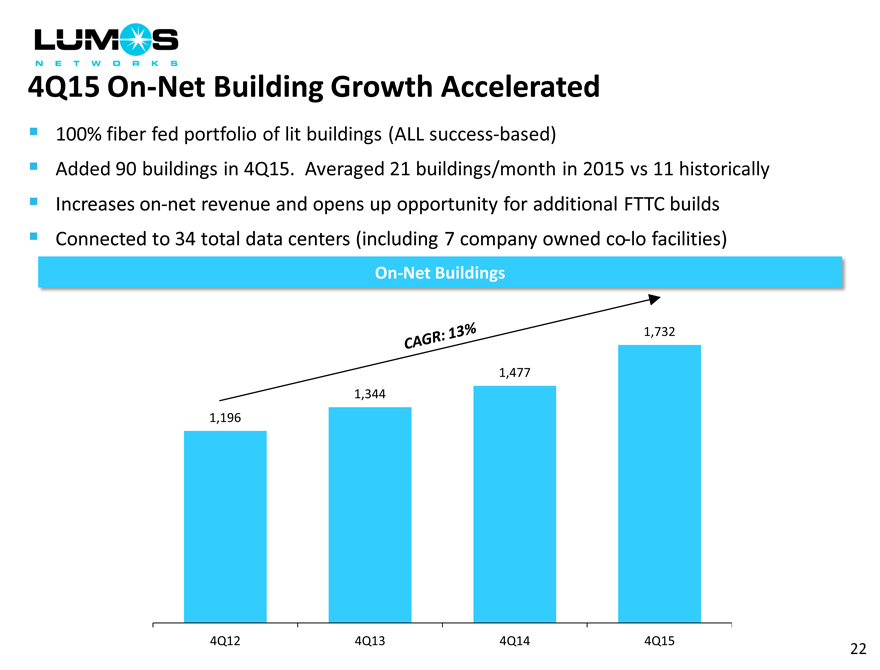
4Q15 On-Net Building Growth Accelerated
100% fiber fed portfolio of lit buildings (ALL success-based)
Added 90 buildings in 4Q15. Averaged 21 buildings/month in 2015 vs 11 historically
Increases on-net revenue and opens up opportunity for additional FTTC builds
Connected to 34 total data centers (including 7 company owned co-lo facilities)
On-Net Buildings
1,732
1,477
1,344
1,196
4Q12 4Q13 4Q14 4Q15
22
|
|
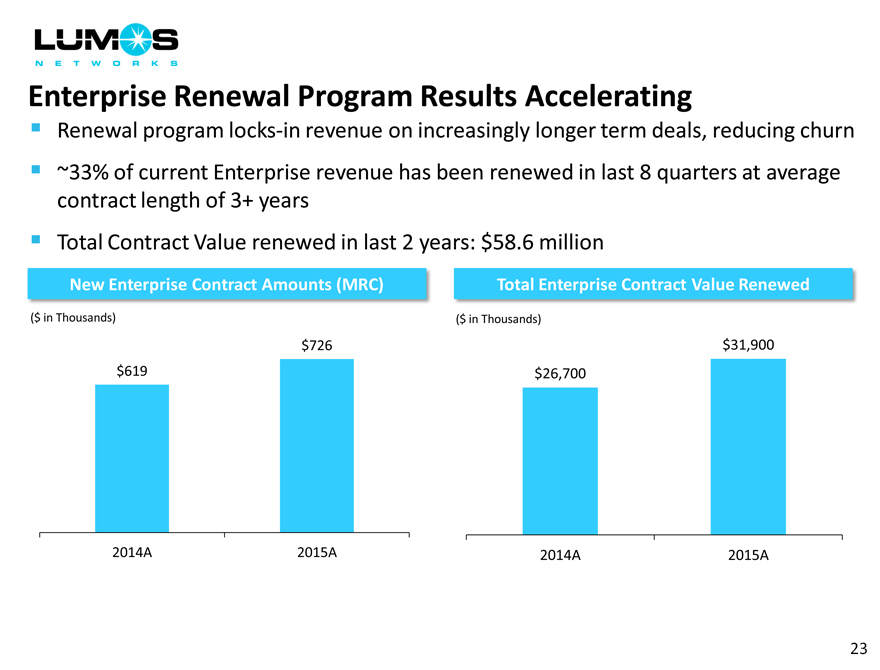
Enterprise Renewal Program Results Accelerating
Renewal program locks-in revenue on increasingly longer term deals, reducing churn
~33% of current Enterprise revenue has been renewed in last 8 quarters at average contract length of 3+ years
Total Contract Value renewed in last 2 years: $58.6 million
New Enterprise Contract Amounts (MRC)
($ in Thousands)
$726
$619
2014A 2015A
Total Enterprise Contract Value Renewed
($ in Thousands)
$31,900
$26,700
2014A 2015A
23
|
|
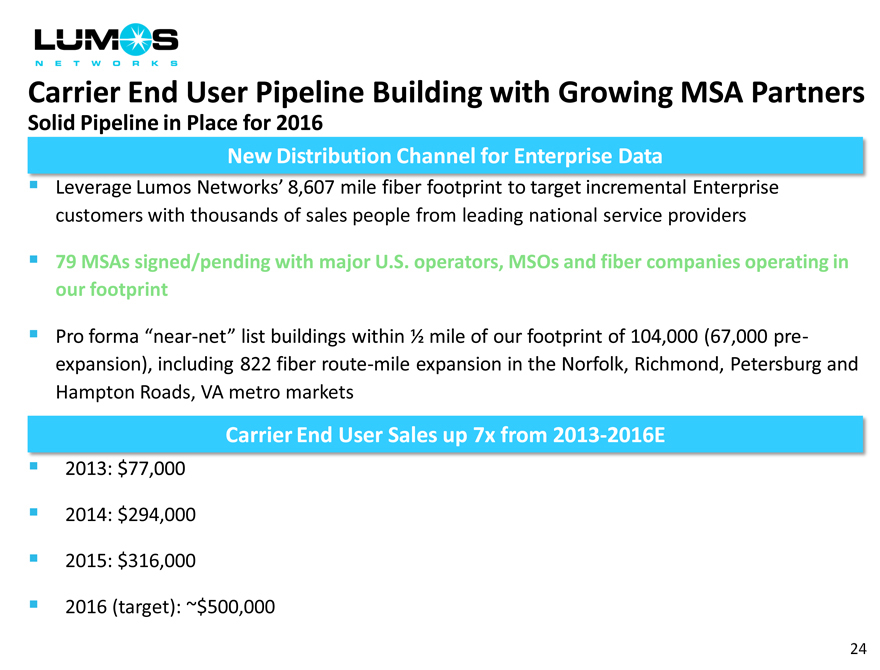
Carrier End User Pipeline Building with Growing MSA Partners
Solid Pipeline in Place for 2016
New Distribution Channel for Enterprise Data
Leverage Lumos Networks’ 8,607 mile fiber footprint to target incremental Enterprise customers with thousands of sales people from leading national service providers
79 MSAs signed/pending with major U.S. operators, MSOs and fiber companies operating in our footprint
Pro forma “near-net” list buildings within ? mile of our footprint of 104,000 (67,000 pre- expansion), including 822 fiber route-mile expansion in the Norfolk, Richmond, Petersburg and
Hampton Roads, VA metro markets
Carrier End User Sales up 7x from 2013-2016E
2013: $77,000
2014: $294,000
2015: $316,000
2016 (target): ~$500,000
24
|
|
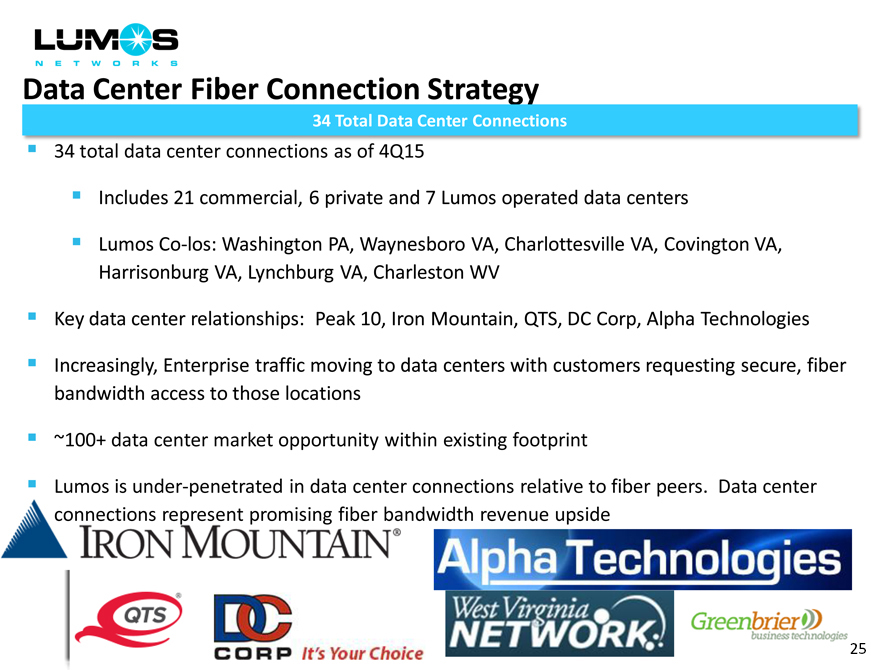
Data Center Fiber Connection Strategy
34 Total Data Center Connections
34 total data center connections as of 4Q15
Includes 21 commercial, 6 private and 7 Lumos operated data centers
Lumos Co-los: Washington PA, Waynesboro VA, Charlottesville VA, Covington VA, Harrisonburg VA, Lynchburg VA, Charleston WV
Key data center relationships: Peak 10, Iron Mountain, QTS, DC Corp, Alpha Technologies Increasingly, Enterprise traffic moving to data centers with customers requesting secure, fiber bandwidth access to those locations
~100+ data center market opportunity within existing footprint
Lumos is under-penetrated in data center connections relative to fiber peers. Data center andwidth revenue upside
25
|
|
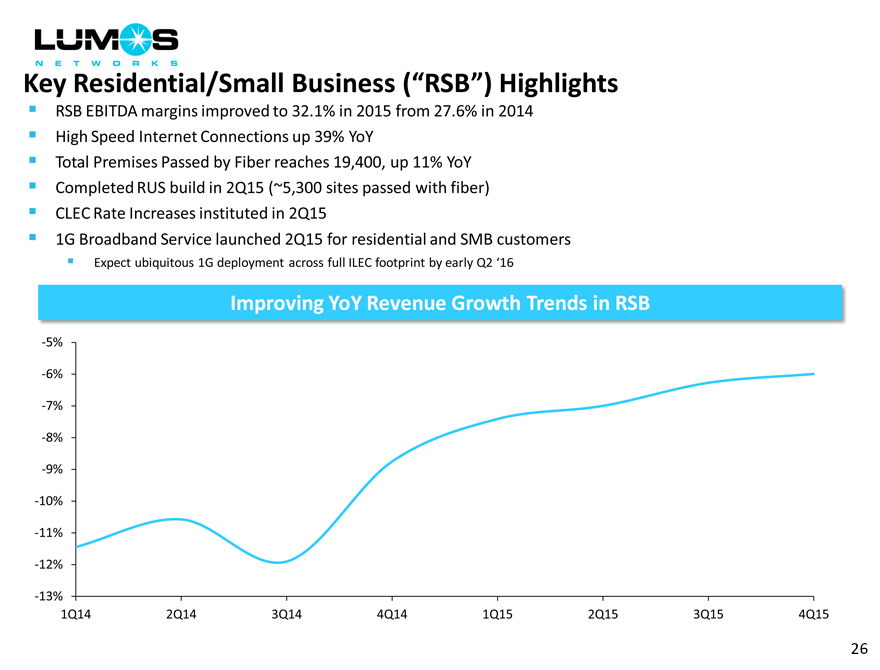
Key Residential/Small Business (“RSB”) Highlights
RSB EBITDA margins improved to 32.1% in 2015 from 27.6% in 2014
High Speed Internet Connections up 39% YoY
Total Premises Passed by Fiber reaches 19,400, up 11% YoY
Completed RUS build in 2Q15 (~5,300 sites passed with fiber)
CLEC Rate Increases instituted in 2Q15
1G Broadband Service launched 2Q15 for residential and SMB customers
Expect ubiquitous 1G deployment across full ILEC footprint by early Q2 ‘16
Improving YoY Revenue Growth Trends in RSB
-5%
-6%
-7%
-8%
-9%
-10%
-11%
-12%
-13%
1Q14 2Q14 3Q14 4Q14 1Q15 2Q15 3Q15 4Q15
26
|
|
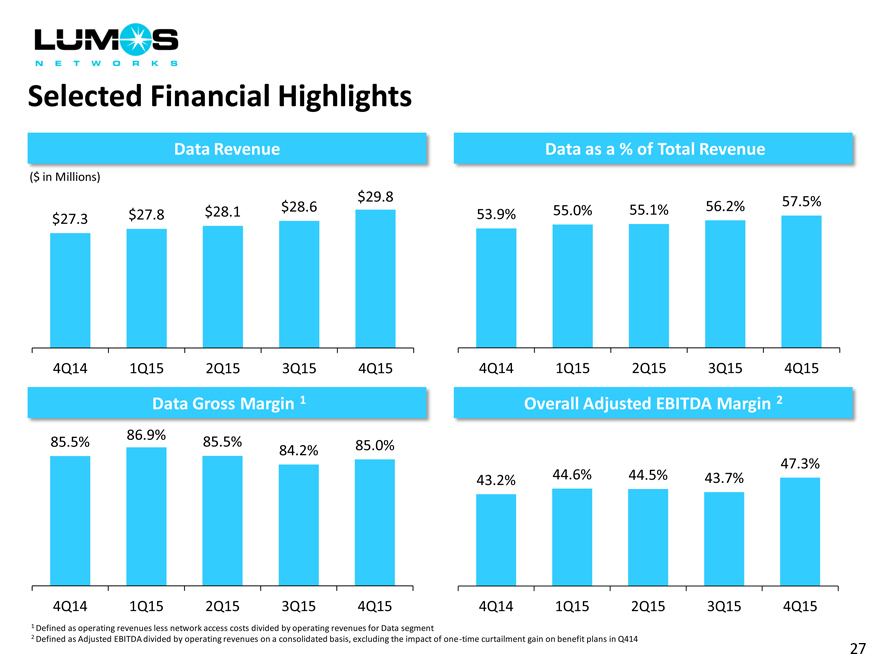
Selected Financial Highlights
Data Revenue
($ in Millions)
$29.8
$28.6
$27.3 $27.8 $28.1
4Q14 1Q15 2Q15 3Q15 4Q15
Data as a % of Total Revenue
53.9% 55.0% 55.1% 56.2% 57.5%
4Q14 1Q15 2Q15 3Q15 4Q15
Data Gross Margin 1
86.9%
85.5% 85.5% 84.2% 85.0%
4Q14 1Q15 2Q15 3Q15 4Q15
Overall Adjusted EBITDA Margin 2
47.3%
43.2% 44.6% 44.5% 43.7%
4Q14 1Q15 2Q15 3Q15 4Q15
| 1 |
|
Defined as operating revenues less network access costs divided by operating revenues for Data segment |
2 Defined as Adjusted EBITDA divided by operating revenues on a consolidated basis, excluding the impact of one-time curtailment gain on benefit plans in Q414
27
|
|
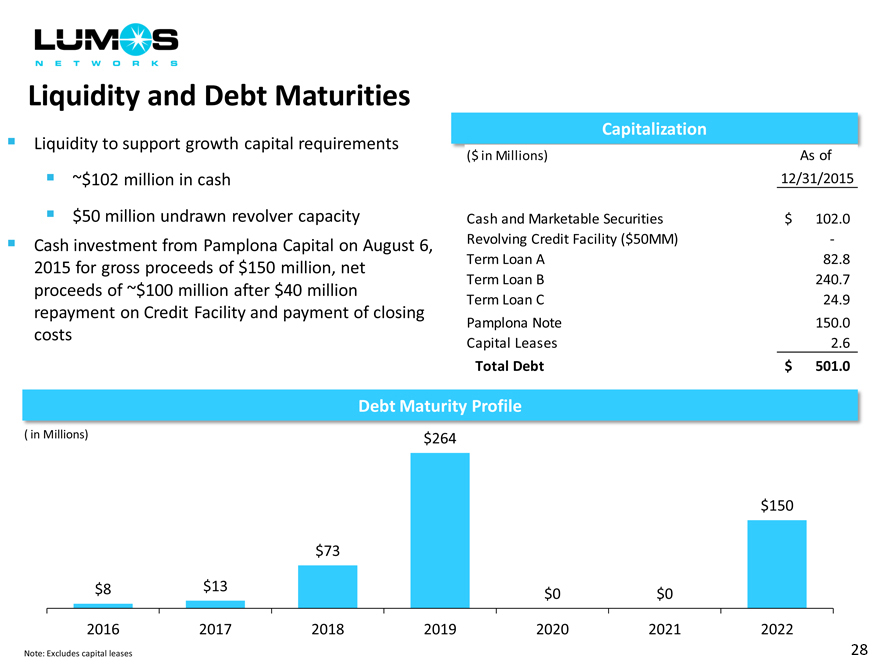
Liquidity and Debt Maturities
Liquidity to support growth capital requirements
~$102 million in cash
$50 million undrawn revolver capacity
Cash investment from Pamplona Capital on August 6, 2015 for gross proceeds of $150 million, net proceeds of ~$100 million after $40 million repayment on Credit Facility and payment of closing costs
Capitalization
($ in Millions) As of
12/31/2015
Cash and Marketable Securities $ 102.0
Revolving Credit Facility ($50MM) -
Term Loan A 82.8
Term Loan B 240.7
Term Loan C 24.9
Pamplona Note 150.0
Capital Leases 2.6
Total Debt $ 501.0
Debt Maturity Profile
( in Millions) $264
$150
$73
$8 $13 $0 $0
2016 2017 2018 2019 2020 2021 2022
Note: Excludes capital leases
28
|
|
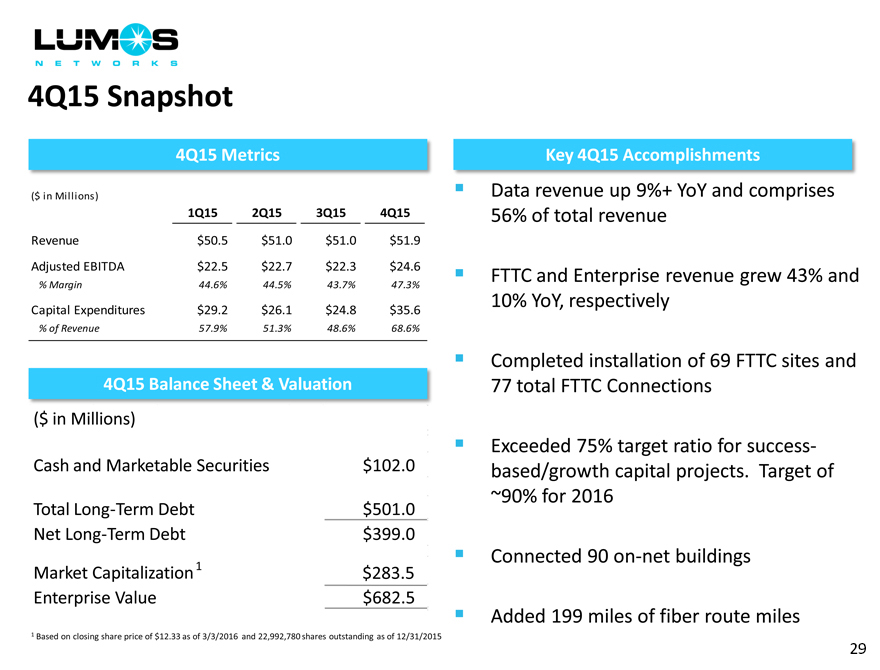
4Q15 Snapshot
4Q15 Metrics
($ in Millions)
1Q15 2Q15 3Q15 4Q15
Revenue $50.5 $51.0 $51.0 $51.9
Adjusted EBITDA $22.5 $22.7 $22.3 $24.6
% Margin 44.6% 44.5% 43.7% 47.3%
Capital Expenditures $29.2 $26.1 $24.8 $35.6
% of Revenue 57.9% 51.3% 48.6% 68.6%
4Q15 Balance Sheet & Valuation
($ in Millions)
Cash and Marketable Securities $ 102.0
Total Long-Term Debt $ 501.0
Net Long-Term Debt $ 399.0
Market Capitalization1 $283.5
Enterprise Value $682.5
Key 4Q15 Accomplishments
Data revenue up 9%+ YoY and comprises
56% of total revenue
FTTC and Enterprise revenue grew 43% and 10% YoY, respectively
Completed installation of 69 FTTC sites and 77 total FTTC Connections
Exceeded 75% target ratio for success- based/growth capital projects. Target of
~90% for 2016
Connected 90 on-net buildings
Added 199 miles of fiber route miles
| 1 |
|
Based on closing share price of $11.82 as of 3/3/2016 and 22,992,780 shares outstanding as of 12/31/2015 |
29
|
|
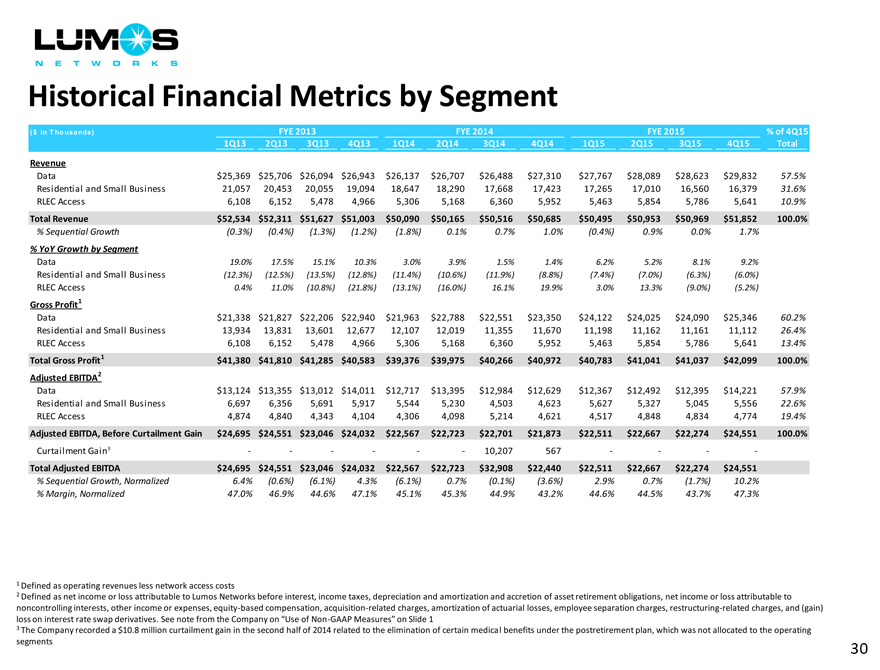
Historical Financial Metrics by Segment
( $ in T ho usands) FYE 2013 FYE 2014 FYE 2015 % of 4Q15
1Q13 2Q13 3Q13 4Q13 1Q14 2Q14 3Q14 4Q14 1Q15 2Q15 3Q15 4Q15 Total
Revenue
Data $25,369 $25,706 $26,094 $26,943 $26,137 $26,707 $26,488 $27,310 $27,767 $28,089 $28,623 $29,832 57.5%
Residential and Small Business 21,057 20,453 20,055 19,094 18,647 18,290 17,668 17,423 17,265 17,010 16,560 16,379 31.6%
RLEC Access 6,108 6,152 5,478 4,966 5,306 5,168 6,360 5,952 5,463 5,854 5,786 5,641 10.9%
Total Revenue $52,534 $52,311 $51,627 $51,003 $50,090 $50,165 $50,516 $50,685 $50,495 $50,953 $50,969 $51,852 100.0%
% Sequential Growth (0.3%) (0.4%) (1.3%) (1.2%) (1.8%) 0.1% 0.7% 1.0% (0.4%) 0.9% 0.0% 1.7%
% YoY Growth by Segment
Data 19.0% 17.5% 15.1% 10.3% 3.0% 3.9% 1.5% 1.4% 6.2% 5.2% 8.1% 9.2%
Residential and Small Business (12.3%) (12.5%) (13.5%) (12.8%) (11.4%) (10.6%) (11.9%) (8.8%) (7.4%) (7.0%) (6.3%) (6.0%)
RLEC Access 0.4% 11.0% (10.8%) (21.8%) (13.1%) (16.0%) 16.1% 19.9% 3.0% 13.3% (9.0%) (5.2%)
Gross Profit1
Data $21,338 $21,827 $22,206 $22,940 $21,963 $22,788 $22,551 $23,350 $24,122 $24,025 $24,090 $25,346 60.2%
Residential and Small Business 13,934 13,831 13,601 12,677 12,107 12,019 11,355 11,670 11,198 11,162 11,161 11,112 26.4%
RLEC Access 6,108 6,152 5,478 4,966 5,306 5,168 6,360 5,952 5,463 5,854 5,786 5,641 13.4%
Total Gross Profit1 $41,380 $41,810 $41,285 $40,583 $39,376 $39,975 $40,266 $40,972 $40,783 $41,041 $41,037 $42,099 100.0%
Adjusted EBITDA2
Data $13,124 $13,355 $13,012 $14,011 $12,717 $13,395 $12,984 $12,629 $12,367 $12,492 $12,395 $14,221 57.9%
Residential and Small Business 6,697 6,356 5,691 5,917 5,544 5,230 4,503 4,623 5,627 5,327 5,045 5,556 22.6%
RLEC Access 4,874 4,840 4,343 4,104 4,306 4,098 5,214 4,621 4,517 4,848 4,834 4,774 19.4%
Adjusted EBITDA, Before Curtailment Gain $24,695 $24,551 $23,046 $24,032 $22,567 $22,723 $22,701 $21,873 $22,511 $22,667 $22,274 $24,551 100.0%
Curtailment Gain3 10,207 567
Total Adjusted EBITDA $24,695 $24,551 $23,046 $24,032 $22,567 $22,723 $32,908 $22,440 $22,511 $22,667 $22,274 $24,551
% Sequential Growth, Normalized 6.4% (0.6%) (6.1%) 4.3% (6.1%) 0.7% (0.1%) (3.6%) 2.9% 0.7% (1.7%) 10.2%
% Margin, Normalized 47.0% 46.9% 44.6% 47.1% 45.1% 45.3% 44.9% 43.2% 44.6% 44.5% 43.7% 47.3%
| 1 |
|
Defined as operating revenues less network access costs |
2 Defined as net income or loss attributable to Lumos Networks before interest, income taxes, depreciation and amortization and accretion of asset retirement obligations, net income or loss attributable to noncontrolling interests, other income or expenses, equity-based compensation, acquisition-related charges, amortization of actuarial losses, employee separation charges, restructuring-related charges, and (gain) loss on interest rate swap derivatives. See note from the Company on “Use of Non-GAAP Measures” on Slide 1
3 The Company recorded a $10.8 million curtailment gain in the second half of 2014 related to the elimination of certain medical benefits under the postretirement plan, which was not allocated to the operating segments
30
|
|
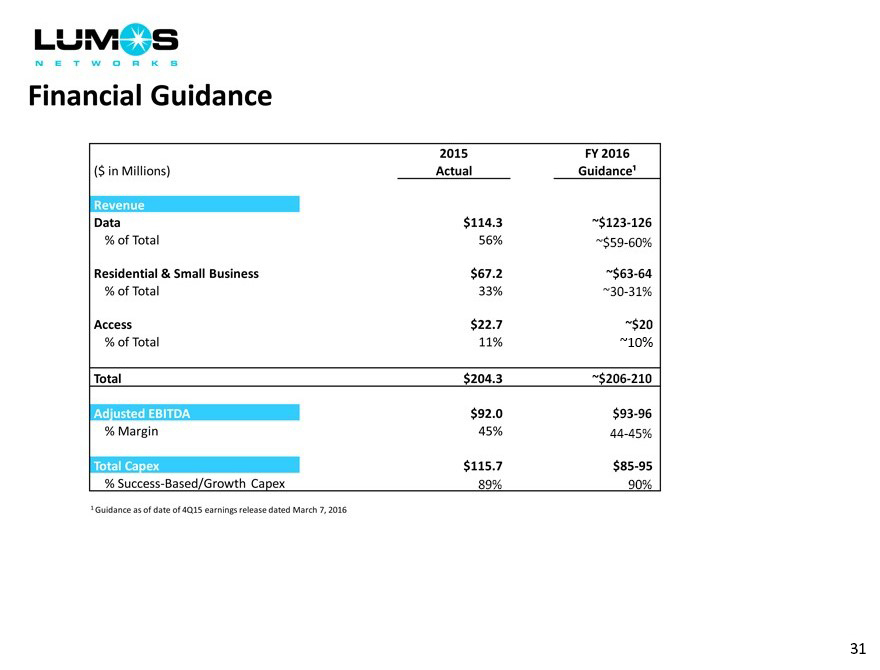
Financial Guidance
2015 FY 2016
($ in Millions) Actual Guidance¹
Revenue
Data $114.3 ~$123-126
% of Total 56% ~$59-60%
Residential & Small Business $67.2 ~$63-64
% of Total 33% ~30-31%
Access $22.7 ~$20
% of Total 11% ~10%
Total $204.3 ~$206-210
Adjusted EBITDA $92.0 $93-96
% Margin 45% ~44-45%
Total Capex $115.7 $85-95
% Success-Based/Growth Capex 89% ~90%
| 1 |
|
Guidance as of date of 4Q15 earnings release dated March 7, 2016 |
31
|
|
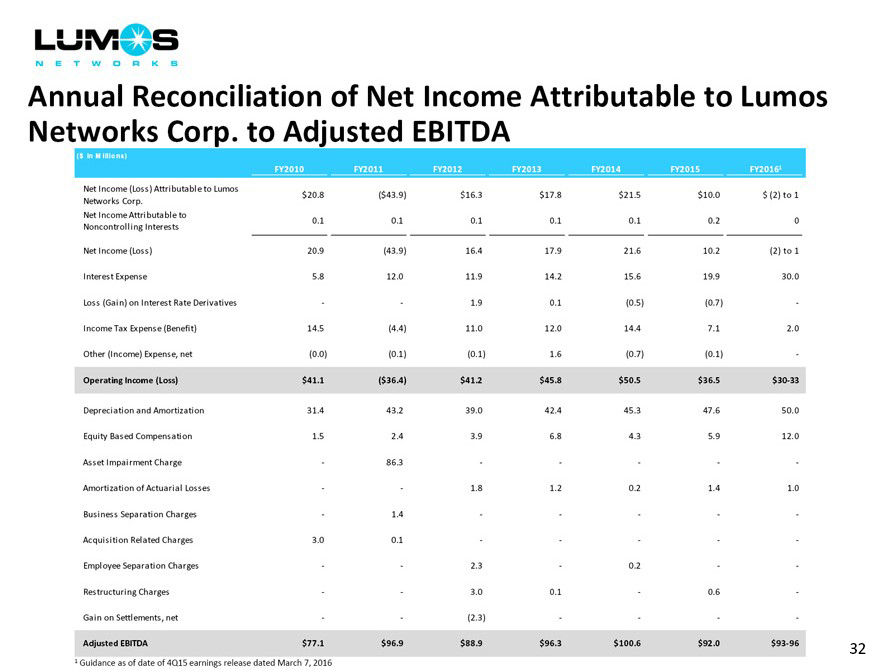
Annual Reconciliation of Net Income Attributable to Lumos Networks Corp. to Adjusted EBITDA
( $ in M illio ns)
FY2010 FY2011 FY2012 FY2013 FY2014 FY2015 FY20161
Net Income (Loss) Attributable to Lumos
$ 20.8 ($43.9) $ 16.3 $ 17.8 $21.5 $ 10.0
Networks Corp.
Net Income Attributable to
0.1 0.1 0.1 0.1 0.1 0.2
Noncontrolling Interests
Net Income (Loss) 20.9 (43.9) 16.4 17.9 21.6 10.2
Interest Expense 5.8 12.0 11.9 14.2 15.6 19.9
Loss (Gain) on Interest Rate Derivatives —— 1.9 0.1 (0.5) (0.7)
Income Tax Expense (Benefit) 14.5 (4.4) 11.0 12.0 14.4 7.1
Other (Income) Expense, net (0.0) (0.1) (0.1) 1.6 (0.7) (0.1)
Operating Income (Loss) $ 41.1 ($36.4) $ 41.2 $ 45.8 $50.5 $ 36.5
Depreciation and Amortization 31.4 43.2 39.0 42.4 45.3 47.6
Equity Based Compensation 1.5 2.4 3.9 6.8 4.3 5.9
Asset Impairment Charge — 86.3 — —— -
Amortization of Actuarial Losses —— 1.8 1.2 0.2 1.4
Business Separation Charges — 1.4 — —— -
Acquisition Related Charges 3.0 0.1 — —— -
Employee Separation Charges —— 2.3 — 0.2 -
Restructuring Charges —— 3.0 0.1 — 0.6
Gain on Settlements, net —— (2.3) —— -
Adjusted EBITDA $ 77.1 $96.9 $ 88.9 $ 96.3 $100.6 $ 92.0
$ (2) to 1 0 (2) to 1 30.0 — 2.0 — $30-33 50.0 12.0 — 1.0 ————— $93-96
1 Guidance as of date of 4Q15 earnings release dated March 7, 2016
32
|
|
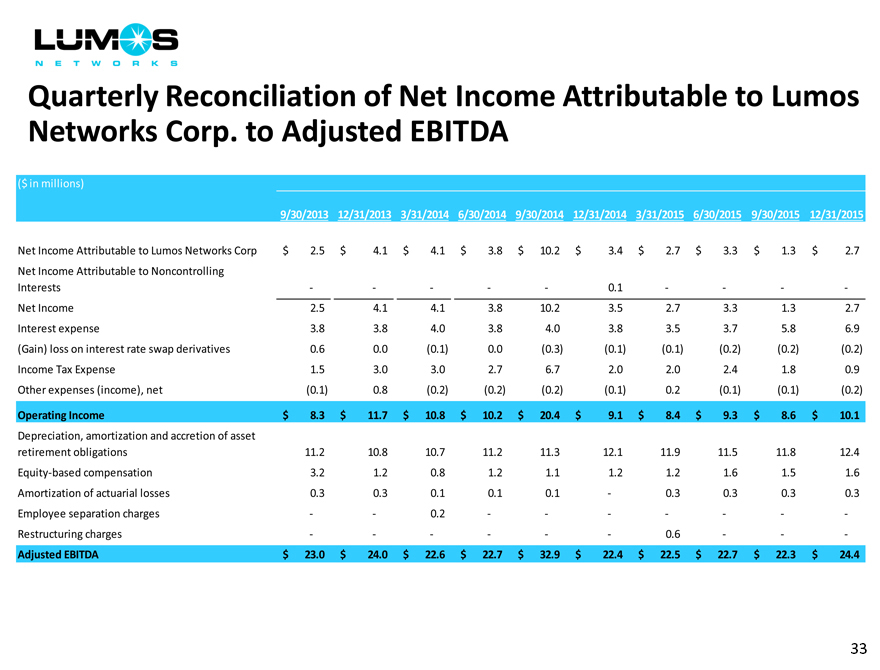
Quarterly Reconciliation of Net Income Attributable to Lumos Networks Corp. to Adjusted EBITDA
($ in millions)
9/30/2013 12/31/2013 3/31/2014 6/30/2014 9/30/2014 12/31/2014 3/31/2015 6/30/2015 9/30/2015 12/31/2015
Net Income Attributable to Lumos Networks Corp $ 2.5 $ 4.1 $ 4.1 $ 3.8 $ 10.2 $ 3.4 $ 2.7 $ 3.3 $ 1.3 $ 2.7
Net Income Attributable to Noncontrolling
Interests ————— 0.1 ——— -
Net Income 2.5 4.1 4.1 3.8 10.2 3.5 2.7 3.3 1.3 2.7
Interest expense 3.8 3.8 4.0 3.8 4.0 3.8 3.5 3.7 5.8 6.9
(Gain) loss on interest rate swap derivatives 0.6 0.0 (0.1) 0.0 (0.3) (0.1) (0.1) (0.2) (0.2) (0.2)
Income Tax Expense 1.5 3.0 3.0 2.7 6.7 2.0 2.0 2.4 1.8 0.9
Other expenses (income), net (0.1) 0.8 (0.2) (0.2) (0.2) (0.1) 0.2 (0.1) (0.1) (0.2)
Operating Income $ 8.3 $ 11.7 $ 10.8 $ 10.2 $ 20.4 $ 9.1 $ 8.4 $ 9.3 $ 8.6 $ 10.1
Depreciation, amortization and accretion of asset
retirement obligations 11.2 10.8 10.7 11.2 11.3 12.1 11.9 11.5 11.8 12.4
Equity-based compensation 3.2 1.2 0.8 1.2 1.1 1.2 1.2 1.6 1.5 1.6
Amortization of actuarial losses 0.3 0.3 0.1 0.1 0.1 — 0.3 0.3 0.3 0.3
Employee separation charges —— 0.2 —————— -
Restructuring charges —————— 0.6 —— -
Adjusted EBITDA $ 23.0 $ 24.0 $ 22.6 $ 22.7 $ 32.9 $ 22.4 $ 22.5 $ 22.7 $ 22.3 $ 24.4
33