Attached files
| file | filename |
|---|---|
| EX-21.1 - EX-21.1 - UNITED STATES LIME & MINERALS INC | uslm-20151231ex2113a21d7.htm |
| EX-32.2 - EX-32.2 - UNITED STATES LIME & MINERALS INC | uslm-20151231ex3228da208.htm |
| EX-32.1 - EX-32.1 - UNITED STATES LIME & MINERALS INC | uslm-20151231ex3215ec58b.htm |
| EX-23.2 - EX-23.2 - UNITED STATES LIME & MINERALS INC | uslm-20151231ex232adf652.htm |
| EX-23.1 - EX-23.1 - UNITED STATES LIME & MINERALS INC | uslm-20151231ex23189a273.htm |
| EX-99.1 - EX-99.1 - UNITED STATES LIME & MINERALS INC | uslm-20151231ex991968d4a.htm |
| EX-31.1 - EX-31.1 - UNITED STATES LIME & MINERALS INC | uslm-20151231ex311dc03f8.htm |
| EX-95.1 - EX-95.1 - UNITED STATES LIME & MINERALS INC | uslm-20151231ex95174abe8.htm |
| EX-31.2 - EX-31.2 - UNITED STATES LIME & MINERALS INC | uslm-20151231ex3122752b7.htm |
UNITED STATES
SECURITIES AND EXCHANGE COMMISSION
Washington, D.C. 20549
FORM 10‑K
|
(Mark One) |
|
|
☒ |
ANNUAL REPORT PURSUANT TO SECTION 13 OR 15(d) OF THE SECURITIES EXCHANGE ACT OF 1934 |
|
For the fiscal year ended December 31, 2015 |
|
|
OR |
|
|
☐ |
TRANSITION REPORT PURSUANT TO SECTION 13 OR 15(d) OF THE SECURITIES EXCHANGE ACT OF 1934 |
Commission File Number 000‑4197
United States Lime & Minerals, Inc.
(Exact name of Registrant as specified in its charter)
|
Texas |
75‑0789226 |
|
5429 LBJ Freeway, Suite 230, Dallas, Texas |
75240 |
Registrant’s telephone number, including area code: (972) 991‑8400
SECURITIES REGISTERED PURSUANT TO SECTION 12(b) OF THE ACT:
|
Title of Each Class |
Name of Each Exchange on Which Registered |
|
Common Stock, $0.10 par value |
The NASDAQ Stock Market LLC |
SECURITIES REGISTERED PURSUANT TO SECTION 12(g) OF THE ACT: None
Indicate by check mark if the Registrant is a well‑known seasoned issuer, as defined in Rule 405 of the Securities Act. Yes ☐ No ☒
Indicate by check mark if the Registrant is not required to file reports pursuant to Section 13 or Section 15(d) of the Exchange Act. Yes ☐ No ☒
Indicate by check mark whether the Registrant (1) has filed all reports required to be filed by Section 13 or 15(d) of the Exchange Act during the preceding 12 months (or for such shorter period that the Registrant was required to file such reports), and (2) has been subject to such filing requirements for the past 90 days. Yes ☒ No ☐
Indicate by check mark whether the Registrant has submitted electronically and posted on its corporate Web site, if any, every Interactive Data File required to be submitted and posted pursuant to Rule 405 of Regulation S‑T (§232.405 of this chapter) during the preceding 12 months (or for such shorter period that the registrant was required to submit and post such files). Yes ☒ No ☐
Indicate by a check mark if disclosure of delinquent filers pursuant to Item 405 of Regulation S‑K is not contained herein, and will not be contained, to the best of Registrant’s knowledge, in definitive proxy or information statements incorporated by reference in Part III of this Form 10‑K or any amendment of this Form 10‑K. ☐
Indicate by check mark whether the Registrant is a large accelerated filer, an accelerated filer, non‑accelerated filer, or a smaller reporting company. See the definitions of “large accelerated filer,” “accelerated filer” and “smaller reporting company” in Rule 12b‑2 of the Exchange Act. (Check one):
|
Large Accelerated Filer ☐ |
Accelerated Filer ☒ |
Non‑accelerated Filer ☐ |
Smaller Reporting Company ☐ |
Indicate by check mark whether the Registrant is a shell company (as defined in Rule 12b‑2 of the Exchange Act). Yes ☐ No ☒
The aggregate market value of Common Stock held by non‑affiliates computed as of the last business day of the Registrant’s quarter ended June 30, 2015: $118,877,546.
Number of shares of Common Stock outstanding as of March 3, 2016: 5,563,669.
DOCUMENTS INCORPORATED BY REFERENCE
Part III incorporates information by reference from the Registrant’s definitive Proxy Statement to be filed for its 2016 Annual Meeting of Shareholders. Part IV incorporates certain exhibits by reference from the Registrant’s previous filings.
|
|
|
Page |
|
|
Part I |
|
|
1 |
||
|
12 |
||
|
17 |
||
|
17 |
||
|
17 |
||
|
17 |
||
|
|
Part II |
|
|
18 |
||
|
20 |
||
|
MANAGEMENT’S DISCUSSION AND ANALYSIS OF FINANCIAL CONDITION AND RESULTS OF OPERATIONS |
20 |
|
|
30 |
||
|
31 |
||
|
CHANGES IN AND DISAGREEMENTS WITH ACCOUNTANTS ON ACCOUNTING AND FINANCIAL DISCLOSURE |
57 |
|
|
57 |
||
|
57 |
||
|
|
Part III |
|
|
58 |
||
|
58 |
||
|
SECURITY OWNERSHIP OF CERTAIN BENEFICIAL OWNERS AND MANAGEMENT AND RELATED STOCKHOLDER MATTERS |
58 |
|
|
CERTAIN RELATIONSHIPS AND RELATED TRANSACTIONS, AND DIRECTOR INDEPENDENCE |
58 |
|
|
58 |
||
|
|
Part IV |
|
|
59 |
||
|
62 |
||
ii
General.
United States Lime & Minerals, Inc. (the “Company,” the “Registrant,” “We” or “Our”), which was incorporated in 1950, conducts its business through two segments, Lime and Limestone Operations and Natural Gas Interests.
The Company’s principal corporate office is located at 5429 LBJ Freeway, Suite 230, Dallas, Texas 75240. The Company’s telephone number is (972) 991‑8400, and its internet address is www.uslm.com. The Company’s annual reports on Form 10‑K, quarterly reports on Form 10‑Q, current reports on Form 8‑K and amendments to those reports filed or furnished pursuant to Section 13(a) or 15(d) of the Securities Exchange Act of 1934, as amended (the “Exchange Act”), as well as the Company’s definitive proxy statement filed pursuant to Section 14(a) of the Exchange Act, are available free of charge on the Company’s website as soon as reasonably practicable after the Company electronically files such material with, or furnishes it to, the Securities and Exchange Commission (the “SEC”).
Lime and Limestone Operations.
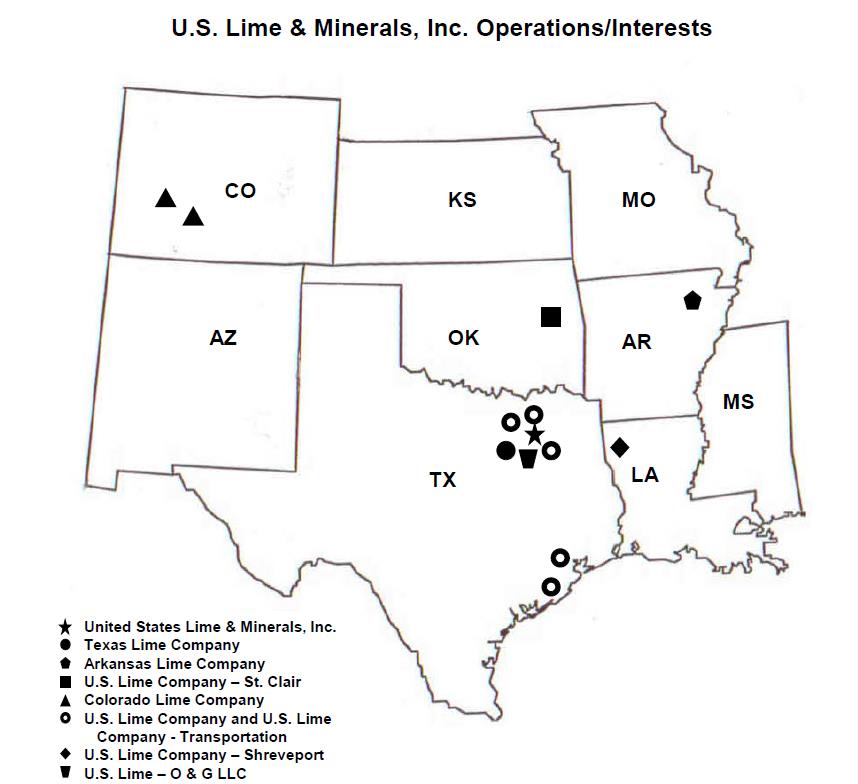
Business and Products. The Company, through its Lime and Limestone Operations, is a manufacturer of lime and limestone products, supplying primarily the construction (including highway, road and building contractors), environmental (including municipal sanitation and water treatment facilities and flue gas treatment processes), industrial (including paper and glass manufacturers), metals (including steel producers), roof shingle, oil and gas services and agriculture (including poultry and cattle feed producers) industries. The Company is headquartered in Dallas, Texas and operates lime and limestone plants and distribution facilities in Arkansas, Colorado, Louisiana, Oklahoma and Texas through its wholly owned subsidiaries, Arkansas Lime Company, Colorado Lime Company, Texas Lime Company, U.S. Lime Company, U.S. Lime Company—Shreveport, U.S. Lime Company—St. Clair and U.S. Lime Company—Transportation.
The Company extracts high‑quality limestone from its open‑pit quarries and an underground mine and then processes it for sale as pulverized limestone, quicklime, hydrated lime and lime slurry. Pulverized limestone (also referred to as ground calcium carbonate) (“PLS”) is produced by applying heat to dry the limestone, which is then ground to granular and finer sizes. Quicklime (calcium oxide) is produced by heating limestone to very high temperatures in kilns in a process called calcination. Hydrated lime (calcium hydroxide) is produced by reacting quicklime with water in a controlled process. Lime slurry (milk of lime) is a suspended solution of calcium hydroxide produced by mixing quicklime with water in a lime slaker.
PLS is used in the production of construction materials such as roof shingles and asphalt paving, as an additive to agriculture feeds, in the production of glass, as a soil enhancement, in flue gas treatment for utilities and other industries requiring scrubbing of emissions for environmental purposes and for mine safety dust in coal mining operations. Quicklime is used primarily in metal processing, in flue gas treatment, in soil stabilization for highway, road and building construction, as well as for oilfield roads and drill sites, in the manufacturing of paper products and in municipal sanitation and water treatment facilities. Hydrated lime is used primarily in municipal sanitation and water treatment facilities, in soil stabilization for highway, road and building construction, in flue gas treatment, in asphalt as an anti‑stripping agent, as a conditioning agent for oil and gas drilling mud, in the production of chemicals and in the production of construction materials such as stucco, plaster and mortar. Lime slurry is used primarily in soil stabilization for highway, road and building construction.
Product Sales. In 2015, the Company sold almost all of its lime and limestone products in the states of Arizona, Arkansas, Colorado, Illinois, Indiana, Iowa, Kansas, Kentucky, Louisiana, Mississippi, Missouri, New Mexico, Oklahoma, Pennsylvania, Tennessee, and Texas. Sales were made primarily by the Company’s nine sales employees who call on current and potential customers and solicit orders, which are generally made on a purchase‑order basis. The Company also receives orders in response to bids that it prepares and submits to current and potential customers.
1
Principal customers for the Company’s lime and limestone products are construction customers (including highway, road and building contractors), environmental customers (including municipal sanitation and water treatment facilities and flue gas treatment processes), industrial customers (including paper manufacturers and glass manufacturers), metals producers (including steel producers), roof shingle manufacturers, oil and gas services companies, and poultry and cattle feed producers. During 2015, the strongest demand for the Company’s lime and limestone products was from construction customers, environmental customers, industrial customers, metals producers, roof shingle manufacturers and oil and gas services companies.
Approximately 700 customers accounted for the Company’s sales of lime and limestone products during 2015. No single customer accounted for more than 10% of such sales. The Company is generally not subject to significant customer demand and credit risks as its customers are considerably diversified as to geographic location and industry concentration. However, given the nature of the lime and limestone industry, the Company’s profits are very sensitive to changes in sales volume and prices.
Lime and limestone products are transported by truck and rail to customers generally within a radius of 400 miles of each of the Company’s plants. All of the Company’s 2015 sales were made within the United States.
Order Backlog. The Company does not believe that backlog information accurately reflects anticipated annual revenues or profitability from year to year.
Seasonality. The Company’s sales have typically reflected seasonal trends, with the largest percentage of total annual shipments and revenues normally being realized in the second and third quarters. Lower seasonal demand normally results in reduced shipments and revenues in the first and fourth quarters. Inclement weather conditions generally have a negative impact on the demand for lime and limestone products supplied to construction‑related customers, as well as on the Company’s open‑pit quarrying operations.
Limestone Reserves. The Company’s limestone reserves contain at least 96% calcium carbonate (CaCO3). The Company has two subsidiaries that extract limestone from open‑pit quarries: Texas Lime Company (“Texas Lime”), which is located near Cleburne, Texas, and Arkansas Lime Company (“Arkansas Lime”), which is located near Batesville, Arkansas. U.S. Lime Company—St. Clair (“St. Clair”) extracts limestone from an underground mine located near Marble City, Oklahoma. Colorado Lime Company (“Colorado Lime”) owns property containing limestone deposits at Monarch Pass, located 15 miles west of Salida, Colorado. Existing crushed stone stockpiles on the property are being used to provide feedstock to the Company’s plants in Salida and Delta, Colorado. Access to all properties is provided by paved roads and, in the case of Arkansas Lime and St. Clair, also by rail.
Texas Lime operates a quarry, located on approximately 3,200 acres of land that contains known high‑quality limestone reserves in a bed averaging 28 feet in thickness, with an overburden that ranges from 0 to 50 feet. Texas Lime also has mineral interests in approximately 560 acres of land adjacent to the northwest boundary of its property. The reserves, as of December 31, 2015, were approximately 18 million tons of proven recoverable reserves plus approximately 75 million tons of probable recoverable reserves. Assuming the current level of production and recovery rate is maintained, the Company estimates that these reserves are sufficient to sustain operations for more than 75 years.
Arkansas Lime operates two quarries and has hydrated lime and limestone production facilities on a second site linked to the quarries by its own standard‑gauge railroad. The quarries cover approximately 1,050 acres of land located in Independence County, Arkansas containing a known deposit of high‑quality limestone reserves (the “Batesville Quarry”). The average thickness of the high‑quality limestone bed is approximately 60 feet, with an average overburden thickness of approximately 30 feet. The reserves for the Batesville Quarry, as of December 31, 2015, were approximately 15 million tons of proven recoverable reserves. In 2005, the Company acquired approximately 2,500 acres of land in nearby Izard County, Arkansas (the “North Quarry”). The high‑quality reserves on these 2,500 acres, as of December 31, 2015, were approximately 76 million tons of probable recoverable reserves. The Company continues to assess the costs required to improve the transportation infrastructure between the North Quarry and Arkansas Lime’s production facilities and other development costs to prepare the North Quarry for mining. Assuming the current level of production and recovery rate is maintained, the Company estimates that its total reserves in Arkansas are sufficient to sustain operations for more than 60 years.
2
St. Clair, acquired by the Company in December 2005, operates an underground mine located on approximately 700 acres it owns containing high‑quality limestone reserves. The reserves, as of December 31, 2015, were approximately 12 million tons of probable recoverable reserves on the 500 acres. Assuming the current level of production and recovery rate is maintained, the Company estimates that the probable recoverable reserves are sufficient to sustain operations for more than 25 years. In addition, St. Clair also has the right to mine the high‑quality limestone contained in approximately 1,500 adjacent acres pursuant to long‑term mineral leases. Although limestone is being mined from a portion of the leased properties, the Company has not conducted a drilling program to identify and categorize reserves on the 1,500 leased acres.
During 2015, the Company produced approximately 3 million tons of limestone from its quarries and mine.
Colorado Lime acquired the Monarch Pass Quarry in November 1995 and has not carried out any mining on the property. A review of the potential limestone resources has been completed by independent geologists; however, the Company has not initiated a drilling program. Consequently, it is not possible to identify and categorize reserves. The Monarch Pass Quarry, which had been operated for many years until the early 1990s, contains a mixture of limestone types, including high‑quality calcium limestone and dolomite. Assuming the current level of production is maintained, the Company estimates that the remaining crushed stone stockpiles on the property are sufficient to supply its plants in Salida and Delta, Colorado for approximately 15 years.
Quarrying and Mining. The Company extracts limestone by the open‑pit method at its Texas and Arkansas quarries. The Monarch Pass Quarry is also an open‑pit quarry, but is not being mined at this time. The open‑pit method consists of removing any overburden comprising soil and other substances, including inferior limestone, and then extracting the exposed high‑quality limestone. The Company removes such overburden by utilizing both its own employees and equipment and those of outside contractors. Open‑pit mining is generally less expensive than underground mining. The principal disadvantage of the open‑pit method is that operations are subject to inclement weather and overburden removal. The limestone is extracted by drilling and blasting, utilizing standard mining equipment. At its St. Clair underground mine, the Company mines limestone using room and pillar mining. The Company has no knowledge of any recent changes in the physical quarrying or mining conditions on any of its properties that have materially affected its quarrying or mining operations, and no such changes are anticipated.
Plants and Facilities. After extraction, limestone is crushed and screened and, in the case of PLS, ground and dried, or, in the case of quicklime, processed in kilns. Quicklime may then be further processed in hydrators and slakers to produce hydrated lime and lime slurry. The Company processes and distributes lime and/or limestone products at five plants, four lime slurry facilities and two terminal facilities. All of its plants and facilities are accessible by paved roads, and, in the case of the Arkansas Lime and St. Clair plants and the terminal facilities, also by rail.
The Texas Lime plant has an annual capacity of approximately 470 thousand tons of quicklime from two preheater rotary kilns. The plant also has PLS equipment, which, depending on the product mix, has the capacity to produce approximately 800 thousand tons of PLS annually.
The Arkansas plant is situated at the Batesville Quarry. Utilizing three preheater rotary kilns, this plant has an annual capacity of approximately 630 thousand tons of quicklime. Arkansas Lime’s PLS and hydrating facilities are situated on a tract of 290 acres located approximately two miles from the Quarry, to which it is connected by a Company‑owned, standard‑gauge railroad. The PLS equipment, depending on the product mix, has the capacity to produce approximately 300 thousand tons of PLS annually.
The St. Clair plant has an annual capacity of approximately 180 thousand tons of quicklime from two rotary kilns, one of which is not a preheater kiln. The plant also has PLS equipment, which has the capacity to produce approximately 150 thousand tons of PLS annually. In the fourth quarter 2013, the Company received the necessary air permit from the Oklahoma Department of Environmental Quality to replace the non‑preheater kiln with the construction of a new, more fuel‑efficient kiln. The Company continues to assess technical feasibility, economics and market demand before making a decision regarding the modernization of the St. Clair plant.
The Company also maintains lime hydrating and bagging equipment at the Texas, Arkansas and St. Clair plants. Storage facilities for lime and limestone products at each plant consist primarily of cylindrical tanks, which are
3
considered by the Company to be adequate to protect its lime and limestone products and to provide an available supply for customers’ needs at the expected volumes of shipments. Equipment is maintained at each plant to load trucks and, at the Arkansas Lime and St. Clair plants, to load railroad cars.
Colorado Lime operates a limestone grinding and bagging facility with an annual capacity of approximately 125 thousand tons, located on approximately three and one‑half acres of land in Delta, Colorado, and a limestone drying, grinding and bagging facility, with an annual capacity of approximately 40 thousand tons, located on eight acres of land in Salida, Colorado. The Salida property is leased from the Union Pacific Railroad for a five‑year term ending June 2019.
During 2015, the Company’s utilization rate was approximately 57% of its aggregate approximate annual production capacity for the plants in its Lime and Limestone Operations.
U.S. Lime Company (“US Lime”) uses quicklime to produce lime slurry and has two facilities, including a new distribution terminal, which is connected to a railroad, established in 2015 southwest of Houston, Texas, to serve the Greater Houston area construction market and three facilities to serve the Dallas‑Ft. Worth Metroplex. The Company established U.S. Lime Company—Transportation (“Transportation”) primarily to deliver the Company’s products to its customers and facilities in the Dallas‑Ft. Worth Metroplex. In December 2014, US Lime acquired the land and buildings, and Transportation acquired the trucks, trailers and other equipment, owned by a Houston, Texas trucking company operation that had exclusively delivered the Company’s products to its customers and slurry facilities. The land purchased included the site leased for US Lime’s Houston slurry facility. Transportation utilizes the acquired assets to deliver its products to the Company’s customers and facilities and does not haul for third parties.
U.S. Lime Company—Shreveport operates a distribution terminal in Shreveport, Louisiana, which is connected to a railroad, to provide lime storage, hydrating, slurrying and distribution capacity to service markets in Louisiana and East Texas.
The Company believes that its plants and facilities are adequately maintained and insured.
Employees. At December 31, 2015, the Company employed 323 persons and is a party to two collective bargaining agreements. The collective bargaining agreements for our Arkansas and Texas facilities expire in January and November 2017, respectively. The Company believes that its employee relations are good.
Competition. The lime industry is highly regionalized and competitive, with price, quality, ability to meet customer demands and specifications, proximity to customers, personal relationships and timeliness of deliveries being the prime competitive factors. The Company’s competitors are predominantly private companies.
The lime industry is characterized by high barriers to entry, including: the scarcity of high‑quality limestone deposits on which the required zoning and permitting for extraction can be obtained; the need for lime plants and facilities to be located close to markets, paved roads and railroad networks to enable cost‑effective production and distribution; clean air and anti‑pollution regulations, including those related to greenhouse gas emissions, which make it more difficult to obtain permitting for new sources of emissions, such as lime kilns; and the high capital cost of the plants and facilities. These considerations reinforce the premium value of operations having permitted, long‑term, high‑quality limestone reserves and good locations and transportation relative to markets.
Lime producers tend to be concentrated on known high‑quality limestone formations where competition takes place principally on a regional basis. The industry as a whole has expanded its customer base, and while the steel industry and environmental‑related users, including utility plants, are the largest market sectors, it also counts chemical users and other industrial users, including paper manufacturers and highway, road and building contractors, among its major customers.
However, in recent years, the lime industry has experienced reduced demand from certain industries, including the steel industry. In addition, utility plants are, in some instances, choosing to use more natural gas for power generation instead of coal, which reduces their demand for lime and limestone for flue gas treatment processes. These reductions in demand have resulted in increased competitive pressures, including pricing competition, in the industry.
4
Consolidation in the lime industry has left the three largest companies accounting for more than two‑thirds of North American production capacity. In addition to the consolidations, and often in conjunction with them, many lime producers have undergone modernization and expansion and development projects to upgrade their processing equipment in an effort to improve operating efficiency. The Company’s Texas and Arkansas modernization and expansion projects, its acquisitions of the St. Clair operations in Oklahoma and the lime slurry operations in Texas, and its development projects in Arkansas should allow the Company to continue to remain competitive, protect its markets and position itself for the future. In addition, the Company will continue to evaluate internal and external opportunities for expansion, growth and increased profitability, as conditions warrant or opportunities arise. The Company may have to revise its strategy or otherwise find ways to enhance the value of the Company, including entering into strategic partnerships, mergers or other transactions.
Impact of Environmental Laws. The Company owns or controls large areas of land, upon which it operates limestone quarries, an underground mine, lime plants and other facilities with inherent environmental responsibilities and environmental compliance costs and liabilities, including capital, maintenance and operating costs with respect to pollution control equipment, the cost of ongoing monitoring programs, the cost of reclamation and remediation efforts and other similar environmental costs and liabilities.
The Company’s operations are subject to various federal, state, and local laws and regulations relating to the environment, health and safety, and other regulatory matters, including the Clean Air Act, the Clean Water Act, the Resource Conservation and Recovery Act and the Comprehensive Environmental Response, Compensation, and Liability Act (“Environmental Laws”). These Environmental Laws grant the United States Environmental Protection Agency (the “EPA”) and state governmental agencies the authority to promulgate and enforce regulations that could result in substantial expenditures on pollution control, waste management, permitting and compliance activities. The failure to comply with Environmental Laws may result in administrative and civil penalties, injunctive relief, and criminal prosecution. The Company has not been named as a potentially responsible party in any federal superfund cleanup site or state-led cleanup site.
The rate of change of Environmental Laws continues to be rapid, and compliance can require significant expenditures. For example, federal legislation required the Company’s plants with operating kilns to apply for Title V operating permits that have significant ongoing compliance monitoring costs. In addition to the Title V permits, other environmental operating permits are required for the Company’s operations, and such permits are subject to modification during the permit renewal process, and to revocation. Raw materials and fuels used to manufacture lime products contain chemicals and compounds, such as trace metals, that may be classified as hazardous substances. In October 2015, the EPA issued a final rule lowering the National Ambient Air Quality Standards (“NAAQS”) for ground-level ozone from 75 parts per billion to 70 parts per billion. The final rule requires states to revise their State Implementation Plans (“SIP”) to achieve the new standard. At this point, it is unclear what specific SIP revisions will be proposed. It is possible, however, that the EPA could adopt new SIP revisions that would result in increased compliance costs and liabilities and make permitting of major modifications more difficult. In 2010, the EPA adopted new NAAQS for sulfur dioxide and nitrogen dioxide. If the Company makes major modifications of any of its lime plants, the New Source Review (discussed below) permitting process may entail modeling and, potentially, installation of additional emission controls to demonstrate compliance with those new NAAQS.
As of January 1, 2010, the EPA required large emitters of greenhouse gases, including the Company’s plants, to collect and report greenhouse gas emissions data. The EPA indicated it will use the data collected through the greenhouse gas reporting rules to decide whether to promulgate future greenhouse gas emission limits or possible taxes. On May 13, 2010, the EPA issued a final rule “tailoring” its New Source Review permitting and Federal Operating Permit programs to apply to facilities with certain thresholds of greenhouse gas emissions. This “Tailoring Rule” was challenged in court, and on June 23, 2014, the United States Supreme Court struck down the Tailoring Rule in Utility Air Regulatory Group v. Environmental Protection Agency. In its decision, the Court held that the EPA may not impose permitting requirements on facilities based solely on their emissions of greenhouse gasses. But, the Court also held that the EPA may regulate greenhouse gas emissions if a facility is otherwise subject to permitting based on the emissions of conventional, non-greenhouse gas pollutants. Thus, any new facilities or major modifications to existing facilities that exceed the federal New Source Review emission thresholds for conventional pollutants may be required to use “best available control technology” and energy efficiency measures to minimize greenhouse gas emissions. On December 19, 2014, the EPA issued guidance stating that the agency would exercise its enforcement discretion to not pursue
5
enforcement of the terms and conditions of the portion of the permitting regulations struck down by the Supreme Court in Utility Air Regulatory Group.
Although the timing and impact of climate change legislation and of regulations limiting greenhouse gas emissions are uncertain, the consequences of such legislation and regulation are potentially significant for the Company because the production of CO2 is inherent in the manufacture of lime through the calcination of limestone and combustion of fossil fuels. Future rulemaking following the Utility Air Regulatory Group decision could affect New Source Review permitting and, thereby, increase the time and costs of plant upgrades and expansions. The passage of climate change legislation, and other regulatory initiatives by the Congress, the states or the EPA that restrict or tax emissions of greenhouse gases, could also adversely affect the Company. There is no assurance that changes in the law or regulations will not be adopted, such as the imposition of a carbon tax, a cap-and-trade program requiring the Company to purchase carbon credits, or other measures that would require reductions in emissions or changes to raw materials, fuel use or production rates that could have a material adverse effect on the Company’s financial condition, results of operations, cash flows and competitive position.
In the courts, several cases have been filed and decisions issued that may increase the risk of claims being filed by third parties against companies for their greenhouse gas emissions. Such cases may seek to challenge air permits, to force reductions in greenhouse gas emissions or to recover damages for alleged climate change impacts to the environment, people and property.
The Company incurred capital expenditures related to environmental matters of approximately $0.5 million, $1.0 million and $0.4 million in 2015, 2014 and 2013, respectively. The Company’s recurring costs associated with managing environmental permitting and waste recycling and disposal (e.g., used oil and lubricants) and maintaining pollution control equipment amounted to approximately $1.0 million, $0.9 million and $0.8 million in 2015, 2014 and 2013, respectively.
The Company recognizes legal reclamation and remediation obligations associated with the retirement of long‑lived assets at their fair value at the time the obligations are incurred (“Asset Retirement Obligations” or “AROs”). Over time, the liability for AROs is recorded at its present value each period through accretion expense, and the capitalized cost is amortized over the useful life of the related asset. Upon settlement of the liability, the Company either settles the ARO for its recorded amount or recognizes a gain or loss. AROs are estimated based on studies and the Company’s process knowledge and estimates, and are discounted using an appropriate interest rate. The AROs are adjusted when further information warrants an adjustment. The Company believes its accrual of $2.1 million for AROs at December 31, 2015 is reasonable.
6
Map of United States Lime & Minerals, Inc. Operations/Interests.
Natural Gas Interests.
Interests. The Company, through its wholly owned subsidiary, U.S. Lime Company—O & G, LLC (“U.S. Lime O & G”), has royalty interests ranging from 15.4% to 20% and a 20% non‑operating working interest with respect to oil and gas rights on the Company’s approximately 3,800 acres of land located in Johnson County, Texas, in the Barnett Shale Formation. These interests are derived from the Company’s May 2004 oil and gas lease agreement (the “O & G Lease”) with EOG Resources, Inc. (“EOG”) with respect to oil and gas rights on its Texas Lime property that will continue on currently producing wells so long as EOG is producing natural gas from such wells as set forth in the O & G Lease.
During the fourth quarter 2005, drilling of the first natural gas well under the O & G Lease was completed, and natural gas production began in February 2006. A total of 34 wells have been drilled under the O & G Lease, but one of
7
the wells ceased production in 2011 and has been plugged and abandoned. The Company’s overall average revenue interest is 34.7% in the 33 wells currently producing under the O & G Lease.
In November 2006, through U.S. Lime O & G, the Company entered into a drillsite and production facility lease agreement and subsurface easement (the “Drillsite Agreement”) with XTO Energy Inc. (“XTO”), which has an oil and gas lease covering approximately 538 acres of land contiguous to the Company’s Johnson County, Texas property. Pursuant to the Drillsite Agreement, the Company receives a 3% royalty interest and a 12.5% non-operating working interest, resulting in a 12.4% revenue interest, in the six XTO wells drilled from a padsite located on the Company’s property.
U.S. Lime O & G has no direct employees and is not the operator of any wells drilled on the properties subject to either the O & G Lease or the Drillsite Agreement (the “O & G Properties”). The only decision that the Company has the right to make is whether to participate as a non‑operating working interest owner and pay its proportionate share of the costs of drilling, completing, working over and operating a well.
No wells have been completed on the O & G Properties since 2011. Given current market prices for natural gas and natural gas liquids, there are no present plans to drill additional wells on the O & G Properties.
Regulation. Many aspects of the production, pricing and marketing of natural gas are regulated by federal and state agencies. Legislation affecting the natural gas industry is under constant review for amendment or expansion, which frequently increases the regulatory burden on affected members of the industry.
Oil and gas development and production operations are subject to various types of regulation at the federal, state and local levels that may impact the Company’s royalty and non‑operating working interests. Such regulation includes:
|
· |
requiring permits for the drilling of wells; |
|
· |
numerous federal and state safety requirements; |
|
· |
environmental requirements; |
|
· |
property taxes and severance taxes; and |
|
· |
specific state and federal income tax provisions. |
The TCEQ has adopted regulations limiting air emissions from oil and natural gas production in the Barnett Shale, where the O & G Properties are located. The EPA has adopted greenhouse gas monitoring and reporting regulations applicable to the petroleum and natural gas industry that require persons that hold state drilling permits that will result in annual greenhouse gas emissions of 25,000 metric tons or more to report annually those emissions from certain sources. The EPA has indicated that it will use data collected through the reporting rules to decide whether to promulgate future greenhouse gas emission limits. Future changes to greenhouse gas regulations could affect the relative competitiveness of, and therefore the demand for, natural gas and other fossil fuels.
Hydraulic fracturing is a technique used to produce oil and natural gas from shale, including the Barnett Shale Formation. The drilling on the Company’s O & G Properties has involved hydraulic fracturing. On April 18, 2012, the EPA issued new final regulations under the New Source Performance Standards and National Emission Standards for Hazardous Air Pollutants. Since January 2015, these regulations have required owners and operators of newly hydraulically fractured wells to use so-called “green completion” technology to reduce methane and volatile organic compound emissions during completion activities. On August 18, 2015, the EPA proposed a suite of regulations that would reduce methane and volatile organic compound emissions from oil and gas wells and associated equipment. If finalized, these regulations could increase the costs of oil and gas exploration and production activities.
Hydraulic fracturing has historically been regulated by state oil and natural gas commissions. However, the EPA has asserted federal regulatory authority over certain hydraulic fracturing activities involving diesel under the Safe Drinking Water Act (“SDWA”). In February 2014, the EPA issued permitting guidance for oil and gas hydraulic fracturing activities using diesel fuels, which included a broad definition of diesel covering a variety of oils that are not
8
diesel but that have similar carbon-chain molecules. The EPA has also stated that it plans to investigate the treatment of wastewater from hydraulic fracturing for the purpose of setting new standards for discharges from natural gas drilling to publicly owned treatment works. In addition, certain other governmental reviews have been conducted or are underway that focus on environmental aspects of hydraulic fracturing practices, including a four-year study by the EPA that concluded in 2015. Other agencies, including the Department of Energy, the Council on Environmental Quality, the Energy Information Administration, and the Department of the Interior, have also conducted hydraulic fracturing studies. These completed and ongoing reviews, depending on their scope and results, could spur initiatives to further regulate hydraulic fracturing under the SDWA or other regulatory programs.
Additionally, the Congress, the EPA and various states have proposed or adopted legislation regulating or requiring disclosure regarding hydraulic fracturing in connection with drilling operations. For example, pursuant to legislation adopted by the State of Texas in June 2011, the Texas Railroad Commission enacted a rule in December 2011, requiring disclosure of certain information regarding additives, chemical ingredients, concentrations and water volumes used in hydraulic fracturing. Local governments have, in recent years, increased regulatory scrutiny of oil and gas operations. For example, in November 2014, the City of Denton, Texas, which lies within the Barnett Shale Formation area, passed a ballot initiative banning hydraulic fracturing. While the Denton initiative is currently being challenged in court, other local governments may attempt to pass similar measures in the future. These new laws or regulations affecting hydraulic fracturing could adversely affect the cost of drilling and production from the O & G Properties.
Customers and Pricing. The pricing of natural gas sales is primarily determined by supply and demand in the marketplace and can fluctuate considerably. As the Company is not the operator of the wells drilled on the O & G Properties, it has limited access to timely information, involvement and operational control over the volumes of natural gas produced and sold and the terms and conditions, including price, on which such volumes are marketed and sold, all of which is controlled by the operators. Although the Company has the right to take its portion of natural gas production in kind, it currently has elected to have its natural gas production marketed by the operators.
The prices that the Company receives for its natural gas production is also affected by the amount of natural gas liquids included in the natural gas and the prices for those liquids. There has been a general decline in prices for natural gas and natural gas liquids in recent years due principally to increased supply.
Drilling Activity. No new wells have been completed since 2011, and there are no present plans to drill additional wells on the O & G Properties. The Company cannot predict the number of additional wells that ultimately will be drilled, if any, or their results.
Production Activity. The number of gross and net producing wells and production activity for the years ended December 31, 2015, 2014 and 2013 are as follows:
|
|
|
2015 |
|
2014 |
|
2013 |
|
|||||||||
|
|
|
Gross |
|
Net(2) |
|
Gross |
|
Net(2) |
|
Gross |
|
Net(2) |
|
|||
|
Producing wells(1) |
|
|
|
|
|
|
|
|
|
|
|
|
|
|
|
|
|
O & G Lease |
|
|
33 |
|
6.6 |
|
|
33 |
|
6.6 |
|
|
33 |
|
6.6 |
|
|
Drillsite Agreement |
|
|
6 |
|
0.8 |
|
|
6 |
|
0.8 |
|
|
6 |
|
0.8 |
|
|
Total |
|
|
39 |
|
7.4 |
|
|
39 |
|
7.4 |
|
|
39 |
|
7.4 |
|
|
Natural gas production volume (BCF) |
|
|
0.7 |
|
|
|
|
0.8 |
|
|
|
|
1.0 |
|
|
|
|
Average sales price per MCF(3) |
|
$ |
3.41 |
|
|
|
$ |
6.28 |
|
|
|
$ |
5.86 |
|
|
|
|
Total cost of revenues per MCF(4) |
|
$ |
2.97 |
|
|
|
$ |
2.91 |
|
|
|
$ |
2.92 |
|
|
|
|
(1) |
Although a total of 34 wells have been drilled under the O & G Lease, one well ceased production in 2011 and has been plugged and abandoned. |
|
(2) |
The number of net wells is required to be calculated based on the Company’s non-operating working interests percentages multiplied by the number of gross wells and does not consider the Company’s royalty interests percentages in each well. |
|
(3) |
Average sales price per MCF includes sales prices of natural gas liquids contained in the natural gas. |
9
|
(4) |
Includes taxes other than income taxes. |
Delivery Commitments. There are no delivery commitments for the Company’s natural gas production to which U.S. Lime O & G is a party.
Internal Controls Over Reserves Estimates. The Company’s policies regarding internal controls over the recording of reserve estimates require reserves to be in compliance with the SEC definitions and guidance and prepared in accordance with generally accepted petroleum engineering principles. In each of the years 2015, 2014 and 2013, the Company retained DeGolyer and MacNaughton, independent third‑party petroleum engineers, to perform appraisals of 100% of its proved reserves in compliance with these standards.
Reserves. The following table reflects the proved developed, proved undeveloped and total proved reserves (all of which are located in Johnson County, Texas), future estimated net revenues and standardized measure at December 31, 2015, 2014 and 2013. The reserves and future estimated net revenues are based on the reports prepared by DeGolyer and MacNaughton. Proved developed reserves included 39 producing wells at each of December 31, 2015, 2014 and 2013, respectively. The Company’s proved reserves have not been filed with, or included in, any reports to any federal agency, other than those filed with the SEC.
|
|
|
2015(2) |
|
2014(2) |
|
2013(2) |
|
|||||||||||||||||||||
|
|
|
Developed |
|
Undeveloped |
|
Total |
|
Developed |
|
Undeveloped |
|
Total |
|
Developed |
|
Undeveloped |
|
Total |
|
|||||||||
|
Proved natural gas reserves (BCF) |
|
|
5.3 |
|
|
— |
|
|
5.3 |
|
|
6.7 |
|
|
— |
|
|
6.7 |
|
|
7.6 |
|
|
— |
|
|
7.6 |
|
|
Proved natural gas liquids and condensate reserves (MMBBLS) |
|
|
0.7 |
|
|
— |
|
|
0.7 |
|
|
1.0 |
|
|
— |
|
|
1.0 |
|
|
1.1 |
|
|
— |
|
|
1.1 |
|
|
Future estimated net revenues (in thousands) |
|
$ |
13,897 |
|
$ |
— |
|
$ |
13,897 |
|
$ |
36,830 |
|
$ |
— |
|
$ |
36,830 |
|
$ |
37,597 |
|
$ |
— |
|
$ |
37,597 |
|
|
Standardized measure(1) (in thousands) |
|
$ |
5,286 |
|
$ |
— |
|
$ |
5,286 |
|
$ |
13,288 |
|
$ |
— |
|
$ |
13,288 |
|
$ |
13,578 |
|
$ |
— |
|
$ |
13,578 |
|
|
(1) |
This present value data should not be construed as representative of fair market value, since such data is based upon projected cash flows, which do not provide for escalation or reduction of natural gas prices or for escalation or reduction of expenses and capital costs. |
|
(2) |
The reserve estimates as of December 31, 2015, 2014 and 2013 utilized 12‑month average pricing, as required by accounting principles generally accepted in the United States of America, of $2.80, $4.61 and $3.88 per MCF of natural gas and $14.92, $30.20 and $29.95 per BBL of natural gas liquids, respectively. |
Undeveloped Acreage. Since the Company is not the operator, it has limited information regarding undeveloped acreage and does not know how many acres the operators classify as undeveloped acreage, if any, or the number of wells that ultimately will be drilled on the O & G Properties.
Glossary of Certain Oil and Gas Terms. The definitions set forth below shall apply to the indicated terms as used in this Report. All volumes of natural gas referred to herein are stated at the legal pressure base of the state or area where the reserves exist and at 60 degrees Fahrenheit and in most instances are rounded to the nearest major multiple.
“BBL” means a standard barrel containing 42 United States gallons.
“BCF” means one billion cubic feet under prescribed conditions of pressure and temperature and represents a basic unit for measuring the production of natural gas.
“Depletion” means (i) the volume of hydrocarbons extracted from a formation over a given period of time, (ii) the rate of hydrocarbon extraction over a given period of time expressed as a percentage of the reserves existing at the beginning of such period, or (iii) the amount of cost basis at the beginning of a period attributable to the volume of hydrocarbons extracted during such period.
10
“Formation” means a distinct geologic interval, sometimes referred to as the strata, which has characteristics (such as permeability, porosity and hydrocarbon saturations) that distinguish it from surrounding intervals.
“Future estimated net revenues” means the result of applying current prices of oil and natural gas to future estimated production from oil and natural gas proved reserves, reduced by future estimated expenditures, based on current costs to be incurred, in developing and producing the proved reserves, excluding overhead.
“MCF” means one thousand cubic feet under prescribed conditions of pressure and temperature and represents a basic unit for measuring the production of natural gas.
“MMBBLS” means one million BBLS.
“Operator” means the individual or company responsible for the exploration, development and production of an oil or natural gas well or lease.
“Proved oil and gas reserves” are those quantities of oil and natural gas, which, by analysis of geoscience and engineering data, can be estimated with reasonable certainty to be economically producible from a given date forward, from known reservoirs, and under existing economic conditions, operating methods, and government regulations, prior to the time at which contracts providing the right to operate expire, unless evidence indicates that renewal is reasonably certain, regardless of whether deterministic or probabilistic methods are used for the estimation. The project to extract the hydrocarbons must have commenced or the operator must be reasonably certain that it will commence the project within a reasonable time.
|
(i) |
The area of the reservoir considered as proved includes: (A) The area identified by drilling and limited by fluid contacts, if any, and (B) Adjacent undrilled portions of the reservoir that can, with reasonable certainty, be judged to be continuous with it and to contain economically producible oil or gas on the basis of available geoscience and engineering data. |
|
(ii) |
In the absence of data on fluid contacts, proved quantities in a reservoir are limited by the lowest known hydrocarbons as seen in a well penetration unless geoscience, engineering, or performance data and reliable technology establishes a lower contact with reasonable certainty. |
|
(iii) |
Where direct observation from well penetrations has defined a highest known oil elevation and the potential exists for an associated gas cap, proved oil reserves may be assigned in the structurally higher portions of the reservoir only if geoscience, engineering, or performance data and reliable technology establish the higher contact with reasonable certainty. |
|
(iv) |
Reserves that can be produced economically through application of improved recovery techniques (including, but not limited to, fluid injection) are included in the proved classification when: (A) Successful testing by a pilot project in an area of the reservoir with properties no more favorable than in the reservoir as a whole, the operation of an installed program in the reservoir or an analogous reservoir, or other evidence using reliable technology establishes the reasonable certainty of the engineering analysis on which the project or program was based; and (B) The project has been approved for development by all necessary parties and entities, including governmental entities. |
|
(v) |
Existing economic conditions include prices and costs at which economic producibility from a reservoir is to be determined. The price shall be the average price during the 12‑month period prior to the ending date of the period covered by the report, determined as an unweighted arithmetic average of the first‑day‑of‑the‑month price for each month within such period, unless prices are defined by contractual arrangements, excluding escalations based upon future conditions. |
“Royalty” means an interest in an oil and gas lease that gives the owner of the interest the right to receive a portion of the production from the leased acreage (or of the proceeds of the sale thereof), but generally does not require the owner to pay any portion of the costs of drilling or operating the wells on the leased acreage.
11
“Severance tax” means an amount of tax, surcharge or levy recovered by governmental agencies from the gross proceeds of oil and natural gas sales. Severance tax may be determined as a percentage of proceeds or as a specific amount per volumetric unit of sales. Severance tax is usually withheld from the gross proceeds of oil and natural gas sales by the first purchaser (e.g., pipeline or refinery) of production.
“Standardized measure of discounted future net cash flows” (also referred to as “standardized measure”) means the value of future estimated net revenues, calculated in accordance with SEC guidelines, to be generated from the production of proved reserves net of estimated production and future development costs, using prices and costs at the date of estimation, without future escalation, and estimated income taxes, and without giving effect to non‑property related expenses such as general and administrative expenses, debt service and depreciation, depletion and amortization, and discounted using an annual discount rate of 10%.
“Undeveloped acreage” means acreage on which wells have not been drilled or completed to a point that would permit the production of commercial quantities of oil and natural gas regardless of whether such acreage contains proved reserves.
“Working interest” means a real property interest entitling the owner to receive a specified percentage of the proceeds of the sale of oil and natural gas production or a percentage of the production, but requires the owner of the working interest to bear the cost to explore for, develop and produce such oil and natural gas.
General.
Both of our business segments are affected by general economic conditions in the U.S. and specific economic conditions in particular industries.
General economic conditions in the United States in recent years have reduced demand for our lime and limestone products. Specifically, demand from our oil and gas services, steel and industrial customers decreased during 2015. The significant decreases in oil and natural gas prices have resulted in a substantial decline in drilling activity, which has reduced demand from our oil and gas services customers for our lime products. Our steel customers have reduced their purchase volumes due to the ongoing difficult economic conditions in that industry, including a reduced demand for drill pipe and casing from the oil and gas industry. The overall reduction in demand for lime and limestone products has also resulted in increased competitive pressures, including pricing pressures, from other lime producers.
Reduced prices for natural gas and natural gas liquids have also resulted in drastically reduced revenues from our Natural Gas Interests. However, we have benefited from lower energy costs in our Lime and Limestone Operations segment.
For us to maintain or increase our profitability, we must maintain or increase our revenues and improve cash flows and continue to control our operational and selling, general and administrative expenses. If we are unable to maintain our revenues and control our costs in these difficult economic times, our financial condition, results of operations, cash flows and competitive position could be materially adversely affected.
We may be adversely affected by any disruption in, or failure of, our information technology systems, including due to cybersecurity risks and incidents.
We rely upon the capacity, reliability and security of our information technology (“IT”) systems for our manufacturing, financial and administrative functions. We also face the challenge of supporting our IT systems and implementing upgrades when necessary.
Our IT systems security measures are focused on the prevention, detection and remediation of damage from computer viruses, natural disasters, unauthorized access, cyber‑attack and other similar disruptions. However, our IT systems may remain vulnerable to damage despite our implementation of security measures that we feel protect our IT systems. Any failure, accident or security breach involving our IT systems could result in disruption to our operations. A
12
material breach in the security of our IT systems could negatively impact our manufacturing operations or financial and administrative functions, or result in the compromise of personal information of our employees, customers or suppliers. To the extent any such failure, accident or security breach results in disruption to our operations or loss or disclosure of, or damage to, our data or confidential information, our reputation, business, results of operations and financial condition could be materially adversely affected.
Lime and Limestone Operations.
In the normal course of our Lime and Limestone Operations, we face various business and financial risks that could have a material adverse effect on our financial position, results of operations, cash flows and competitive position. Not all risks are foreseeable or within our ability to control.
These risks arise from various factors, including, but not limited to, fluctuating demand for our lime and limestone products, including as a result of downturns in the economy and construction, industrial and steel industries, and possible reduced demand from coal-fired utility plants, increased competitive pressures from other lime producers, changes in legislation and regulations, including Environmental Laws, health and safety regulations and requirements to renew or obtain operating permits, our ability to produce and store quantities of lime and limestone products sufficient in amount and quality to meet customer demands and specifications, the success of our modernization, expansion and development strategies, including our ability to sell our increased lime capacity at acceptable prices, our ability to execute our strategies and complete projects on time and within budget, our ability to integrate, refurbish and/or improve acquired facilities, our access to capital, volatile costs, especially fuel, electricity, transportation and freight costs, inclement weather and the effects of seasonal trends.
We receive most of our coal and petroleum coke by rail, so the availability of sufficient solid fuels to run our plants could be diminished significantly in the event of major rail disruptions. Domestic coal and petroleum coke may also be exported, which can increase competition and prices for the domestic supply. In addition, our freight costs to deliver our lime and limestone products are high relative to the value of our products, and although our freight costs declined slightly during 2015, they have mostly increased in recent years. Our costs for delivery of solid fuels, as well as our products, also increase as demand for rail and trucking by other industries increases, and recent Department of Transportation rules reduce the availability of rail cars and trucks to deliver solid fuels to our plants and deliver our products to our customers. If we are unable to continue to pass along our variable coal, petroleum coke, diesel, natural gas, electricity, transportation and freight costs to our customers, our financial condition, results of operations, cash flows and competitive position could be materially adversely affected.
We quote on a delivered price basis to certain customers, which requires us to estimate future delivery costs. Our actual delivery costs may exceed these estimates, which would reduce our profitability.
Delivery costs are impacted by the price of diesel. Although diesel prices declined during 2015, when they do increase we incur additional fuel surcharges from freight companies that cannot be passed on to our customers that have been quoted a delivered price. A material increase in the price of diesel could have a material adverse effect on the Company’s profitability.
Governmental fiscal and budgetary constraints and legislative impasses have in the past, and may in the future, adversely impact our financial condition and results of operations in various ways.
Governmental fiscal and budgetary constraints and legislative impasses may adversely impact our financial condition and results of operations in various ways, including possibly reduced funding for transportation programs by federal, state and local governmental agencies, which could reduce demand for our lime and limestone products from our construction customers.
Our mining and other operations are subject to operating risks that are beyond our control, which could result in materially increased operating expenses and decreased production and shipment levels that could materially adversely affect our Lime and Limestone Operations and their profitability.
We mine limestone in open pit and underground mining operations and process and distribute that limestone through our plants and other facilities. Certain factors beyond our control could disrupt our operations, adversely affect
13
production and shipments and increase our operating costs, all of which could have a material adverse effect on our results of operations. These include geological formation problems that may cause poor mining conditions, variability of chemical or physical properties of our limestone, an accident or other major incident at a site that may cause all or part of our operations to cease for some period of time and increase our expenses, mining, processing and plant equipment failures and unexpected maintenance problems that may cause disruptions and added expenses, strikes, job actions or other work stoppages that may disrupt our operations or those of our suppliers, contractors or customers and increase our expenses, and adverse weather conditions and natural disasters, such as heavy rains, flooding, ice storms, freezing weather, drought and other natural events, that may affect operations, transportation or customers.
If any of these conditions or events occurs, our operations may be disrupted, we could experience a delay or halt of production or shipments, our operating costs could increase significantly and we could be exposed to fines, penalties, assessments and other liabilities. If our insurance coverage is limited or excludes a given condition or event, we may not be able to recover in full the losses that may incur as a result of such conditions or events, some of which may be substantial.
We incur environmental compliance costs and liabilities, including capital, maintenance and operating costs, with respect to pollution control equipment, the cost of ongoing monitoring programs, the cost of reclamation and remediation efforts and other similar costs and liabilities relating to our compliance with Environmental Laws, and we expect these costs and liabilities to continue to increase, including possible new costs, taxes and limitations on operations such as those related to possible climate change initiatives, including regulation of greenhouse gas emissions. Similar environmental costs and liabilities may also be faced by our customers.
The rate of change of Environmental Laws has been rapid over the last decade, and we may face possible new costs and liabilities, taxes and limitations on operations, including those related to climate change initiatives. We believe our expenditure requirements for future environmental compliance, including complying with the new nitrogen dioxide, sulfur dioxide and particulate matter emission limitations under the NAAQS and regulation of greenhouse gas emissions, will continue to increase as operating, reporting and other environmental standards increase. Discovery of currently unknown conditions and unforeseen costs and liabilities could require additional expenditures.
The regulation of greenhouse gas emissions remains an issue for the Company and some of its customers. There is no assurance that changes in the law or regulations will not be adopted, such as the imposition of a carbon tax, a cap-and-trade program requiring companies to purchase carbon credits, or other measures that would require reductions in emissions or changes to raw materials, fuel use or production rates, that could have a material adverse effect on the Company’s financial condition, results of operations, cash flows and competitive position. More stringent regulation of greenhouse gas emissions could also adversely affect the competitiveness of some of the Company’s customers, including coal-fired power plants, and indirectly the demand for our lime and limestone products. For example, our utility customers may switch from coal to natural gas for power generation for environmental regulatory as well as cost reasons, thus reducing demand for our lime and limestone products for flue gas treatment processes.
We intend to comply with all Environmental Laws and believe our accrual for environmental costs and liabilities at December 31, 2015 is reasonable. Because many of the requirements are subjective and therefore not quantifiable or presently determinable, or may be affected by additional legislation and rulemaking, including those related to climate change and greenhouse gas emissions, there is no assurance or certainty that we will be able to continue or renew our operating permits, or to successfully secure new permits in connection with our modernization and expansion and development projects, and it is not possible to accurately predict the aggregate future costs and liabilities relating to environmental compliance and their effect on our financial condition, results of operations, cash flows and competitive position.
To maintain our competitive position, we may need to continue to increase the efficiency of our operations and expand production capacity, obtain financing for any such projects and acquisitions at reasonable interest rates and acceptable terms and sell any resulting increased production at acceptable prices.
We may undertake various modernization and expansion and development projects and acquisitions. These may require that we incur additional debt, which may not be available to us at all or at reasonable interest rates or on acceptable terms. Given current and projected demand for lime and limestone products, we cannot guarantee that any
14
such project or acquisition would be successful, that we would be able to sell any resulting increased production at acceptable prices or that any such sales would be profitable.
Although prices for our lime and limestone products have been relatively firm in recent years, pricing competition has increased. We are unable to predict future demand and prices, given the general economic conditions in the U.S. and specific economic conditions in particular industries, and cannot provide any assurance that current levels of demand and prices will continue or that any future increases in demand or prices can be maintained.
The lime industry is highly regionalized and competitive.
Our competitors are predominately large private companies. The primary competitive factors in the lime industry are price, quality, ability to meet customer demands and specifications, proximity to customers, personal relationships and timeliness of deliveries, with varying emphasis on these factors depending upon the specific product application. To the extent that one or more of our competitors becomes more successful with respect to any key competitive factor, our financial condition, results of operations, cash flows and competitive position could be materially adversely affected.
Natural Gas Interests.
Our natural gas reserves are depleting assets, and we have no ability to explore for new reserves, nor at current market prices are there any present plans to drill additional wells on the O&G Properties.
Revenues from our Natural Gas Interests depend in large part on the quantity of natural gas produced from the O & G Properties. Our 39 producing wells will naturally experience declines in production rates due to depletion of their natural gas reserves, and the operators may determine to temporarily shut in or to plug and abandon a producing well if they believe that it is no longer economical to continue production from the well. We have no ability to explore for new reserves, and at current market prices for natural gas and natural gas liquids, there are no present plans to drill additional wells on the O & G Properties, thus limiting our Natural Gas Interests revenues to production from our existing wells.
Historically, the markets for natural gas have been volatile and may continue to be volatile in the future.
Various factors that are beyond our control will affect the demand for, and prices of, natural gas, such as:
|
· |
the worldwide and domestic supplies of natural gas; |
|
· |
the development of new technologies and reserves of natural gas in the United States; |
|
· |
the price and level of U.S. exports and imports; |
|
· |
the level of consumer and industrial demand; |
|
· |
the price and availability of alternative fuels; |
|
· |
the availability of pipeline capacity; |
|
· |
weather conditions; |
|
· |
domestic and foreign governmental regulations and taxes; and |
|
· |
the overall economic environment. |
The natural gas industry is cyclical in nature and tends to reflect general economic and gas supply and demand conditions. Recent technological advances, such as hydraulic fracturing, have enabled the industry to access additional reserves and have greatly increased the current supply of natural gas in the United States and elsewhere, resulting in lower natural gas and natural gas liquids prices. Lower natural gas prices may reduce the amount of natural gas that is economical for our operators to produce on the O & G Properties, or cause them to shut in wells for extended periods of time or to plug and abandon wells. Reduced prices and production could further reduce our revenues and cash flows from our Natural Gas Interests and thus could have an adverse effect on our gross profit from our Natural Gas Interests.
15
We do not control production operations on the O & G Properties, which could impact our Natural Gas Interests.
As the owner of royalty and non‑operating working interests, our ability to influence production from the O & G Properties is severely limited. All decisions related to production on the O & G Properties will be made by the operators and may be influenced by factors beyond our control, including but not limited to natural gas prices, pipeline capacities, interest rates, budgetary considerations and general industry and economic conditions.
The occurrence of an operational risk or uncertainty that materially impacts the operations of the operators of the O & G Properties could have an adverse effect on the amount we receive in connection with our interests in production from the O & G Properties, which could have an adverse effect on our gross profit from our Natural Gas Interests.
Our natural gas gross profit is affected by production and other costs, some of which are outside of our control, and possible unitizations.
The Natural Gas Interests gross profit that comes from our non-operating working interests, and to a lesser extent our royalty interests, is directly affected by increases in production and other costs, as well as unitizations of existing wells. Some of these costs are outside our control, including production costs, costs of regulatory compliance and severance and other similar taxes. Other expenditures are dictated by business necessity, such as working over existing wells to increase recovery rates.
A natural disaster, accident or catastrophe could damage pipelines, gathering systems and other facilities that service wells on the O & G Properties, which could substantially limit operations and adversely affect our gross profit from our Natural Gas Interests.
If pipelines, gathering systems or other facilities that serve the O & G Properties are damaged by any natural disaster, accident, catastrophe or other event, revenues from our Natural Gas Interests could be significantly interrupted. Any event that interrupts the production, gathering or transportation of our natural gas, or which causes us to share in significant expenditures not covered by insurance, could adversely impact our gross profit from our Natural Gas Interests. We do not carry business interruption insurance on our Natural Gas Interests.
The O & G Properties are geographically concentrated, which could cause our gross profit from our Natural
Gas Interests to be adversely impacted by regional events, including natural disasters and reduced pipeline capacity resulting from production from other wells in the area.
The O & G Properties are all natural gas properties located exclusively in the Barnett Shale Formation. Because of this geographic concentration, any regional events, including natural disasters and production from other wells in the area, that increase costs, reduce availability of equipment, supplies or pipeline capacity, reduce demand or limit production could adversely impact our gross profit from our Natural Gas Interests more than if the Properties were more geographically diversified.
The number of prospective natural gas purchasers and methods of delivery for our gas are also considerably less than would otherwise exist from a more geographically diverse group of interests.
Governmental policies, laws and regulations could have an adverse impact on the O & G Properties and our natural gas business.
The O & G Properties and our natural gas business are subject to federal, state and local laws and regulations relating to the oil and natural gas industry, as well as regulations relating to health and safety matters. These laws and regulations can have a significant impact on the costs and amount of our production.
16
Environmental costs and liabilities and changing environmental regulation associated with the O & G Properties could adversely affect our gross profit from our Natural Gas Interests.
As with other companies engaged in the ownership and production of natural gas, we expect to have some risk of exposure to environmental costs and liabilities. The costs and liabilities associated with environmental compliance or remediation could reduce the gross profits we would receive from our Natural Gas Interests. The O & G Properties are subject to extensive federal, state and local regulatory requirements relating to environmental affairs, health and safety and waste management.
Increased regulation of natural gas production could increase our production costs on the O & G Properties and adversely affect our gross profit from our Natural Gas Interests. Third parties could also pursue legal actions to enforce compliance or assert claims for damages. Further, under certain environmental laws and regulations, the operators and owners of the underlying properties could also be subject to joint and several, strict liability for the removal or remediation of released materials or property contamination from drilling, including hydraulic fracturing, or waste disposal, regardless of whether the operators or owners were responsible for the release or contamination or if the operations were in compliance with all applicable laws.
It is likely that our expenditures in connection with environmental matters, as part of normal capital expenditure programs, will affect the profitability of the O & G Properties. Future Environmental Law developments, such as stricter laws, regulations or enforcement policies, including climate change legislation mandating specific near‑term and long‑range reductions in greenhouse gas emissions, could significantly increase the costs of production from the O & G Properties and adversely affect our gross profit from our Natural Gas Interests.
ITEM 1B. UNRESOLVED STAFF COMMENTS.
None
Reference is made to Item 1 of this Report for a description of the properties of the Company, and such description is hereby incorporated by reference in answer to this Item 2. As disclosed in Note 3 of Notes to Consolidated Financial Statements, the Company’s plants and facilities and reserves are subject to encumbrances to secure the Company’s loans.
Information regarding legal proceedings is set forth in Note 9 of Notes to Consolidated Financial Statements and is hereby incorporated by reference in answer to this Item 3.
ITEM 4. MINE SAFETY DISCLOSURES.
Under Section 1503(a) of the Dodd‑Frank Wall Street Reform and Consumer Protection Act and Item 104 of Regulation S‑K, each operator of a coal or other mine is required to include disclosures regarding certain mine safety results in its periodic reports filed with the SEC. The operation of the Company’s quarries, underground mine and plants is subject to regulation by the federal Mine Safety and Health Administration (“MSHA”) under the Federal Mine Safety and Health Act of 1977. The required information regarding certain mining safety and health matters, broken down by mining complex, for the year ended December 31, 2015 is presented in Exhibit 95.1 to this Report.
The Company believes it is responsible to employees to provide a safe and healthy workplace environment. The Company seeks to accomplish this by: training employees in safe work practices; openly communicating with employees; following safety standards and establishing and improving safe work practices; involving employees in safety processes; and recording, reporting and investigating accidents, incidents and losses to avoid reoccurrence.
17
Following passage of the Mine Improvement and New Emergency Response Act of 2006, MSHA significantly increased the enforcement of mining safety and health standards on all aspects of mining operations. There has also been an increase in the dollar penalties assessed for citations and orders issued in recent years.
PART II
ITEM 5. MARKET FOR REGISTRANT’S COMMON EQUITY, RELATED STOCKHOLDER MATTERS AND ISSUER PURCHASES OF EQUITY SECURITIES.
The Company’s common stock is listed on the Nasdaq Global Market® under the symbol “USLM.” As of March 3, 2016, the Company had approximately 350 shareholders of record.
As of March 3, 2016, the Company had 500,000 shares of $5.00 par value preferred stock authorized; however, none has been issued.
The low and high sales prices for the Company’s common stock for the periods indicated were:
|
|
|
2015 |
|
2014 |
|
||||||||
|
|
|
Low |
|
High |
|
Low |
|
High |
|
||||
|
First Quarter |
|
$ |
62.12 |
|
$ |
73.83 |
|
$ |
53.44 |
|
$ |
60.48 |
|
|
Second Quarter |
|
$ |
58.12 |
|
$ |
68.71 |
|
$ |
53.66 |
|
$ |
67.96 |
|
|
Third Quarter |
|
$ |
45.65 |
|
$ |
58.70 |
|
$ |
55.56 |
|
$ |
65.57 |
|
|
Fourth Quarter |
|
$ |
46.40 |
|
$ |
55.64 |
|
$ |
58.72 |
|
$ |
74.53 |
|
The Company declared and paid a cash dividend of $0.125 (12.5 cents) per share of common stock in each of the 2015 and 2014 quarters. On January 28, 2016, the Company declared a quarterly cash dividend of $0.125 (12.5 cents) per share of common stock payable on March 18, 2016 to shareholders of record at the close of business on February 26, 2016.
PERFORMANCE GRAPH
The graph below compares the cumulative 5-year total shareholders’ return on the Company’s common stock with the cumulative total return on the NASDAQ Composite Index and a peer group index consisting of Eagle Materials, Inc., Monarch Cement Co., U.S. Concrete, Inc. and Martin Marietta Materials, Inc. The graph assumes that the value of the investment in the Company’s common stock and each index was $100 on December 31, 2010, and that all dividends have been reinvested.
18
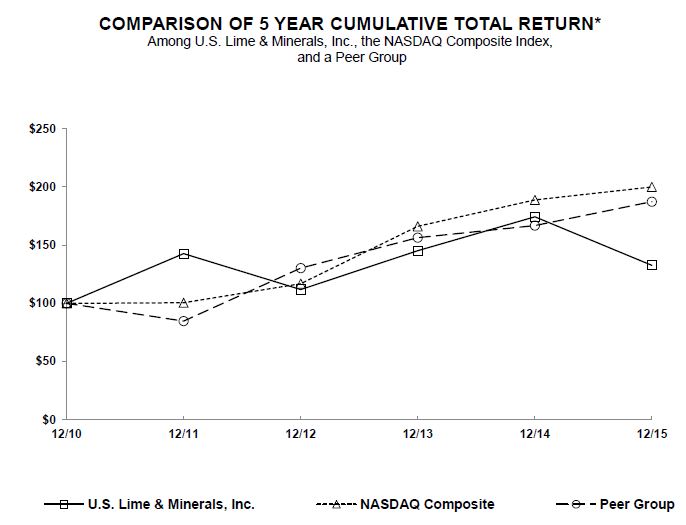
|
|
|
2010 |
|
2011 |
|
2012 |
|
2013 |
|
2014 |
|
2015 |
|
|
U.S. LIME & MINERALS, INC. |
|
100 |
|
142.68 |
|
111.84 |
|
145.19 |
|
174.35 |
|
132.67 |
|
|
NASDAQ COMPOSITE INDEX |
|
100 |
|
100.53 |
|
116.92 |
|
166.19 |
|
188.78 |
|
199.95 |
|
|
PEER GROUP |
|
100 |
|
84.79 |
|
130.35 |
|
156.49 |
|
166.79 |
|
187.35 |
|
ISSUER PURCHASES OF EQUITY SECURITIES
In December 2015, the Company commenced a publicly announced share repurchase program to repurchase up to $10,000,000 of its common stock. The following table sets forth, for the periods indicated, the Company’s share repurchase activity under this program:
|
|
|
|
|
|
|
|
Total Number of |
|
|
|
|
|
|
|
|
|
|
|
|
Shares Purchased |
|
Maximum |
|
|
|
|
|
|
|
|
|
|
as Part of Publicly |
|
Remaining |
|
|
|
|
|
Total Number of |
|
Average Price |
|
Announced |
|
Amount Available |
|
||
|
Period |
|
Shares Purchased |
|
Paid Per Share |
|
Program |
|
Under the Program |
|
||
|
October 1 – 31, 2015 |
|
— |
|
|
— |
|
— |
|
|
— |
|
|
November 1 – 30, 2015 |
|
— |
|
|
— |
|
— |
|
|
— |
|
|
December 1 – 31, 2015 |
|
3,086 |
|
$ |
54.79 |
|
3,086 |
|
$ |
9,830,918 |
|
|
Total |
|
3,086 |
|
$ |
54.79 |
|
3,086 |
|
$ |
9,830,918 |
|
19
In addition, the Company’s Amended and Restated 2001 Long‑Term Incentive Plan allows employees and directors to pay the exercise price upon the exercise of stock options and the tax withholding liability upon the lapse of restrictions on restricted stock by payment in cash and/or delivery of shares of the Company’s common stock to the Company. Pursuant to these provisions, the Company repurchased 1,367 shares at a price of $54.96 per share, the fair market value of one share on the date they were tendered to the Company in the fourth quarter 2015 for payment of tax withholding liability upon the lapse of restrictions on restricted stock.
ITEM 6. SELECTED FINANCIAL DATA.
|
|
|
Years Ended December 31, |
|
|||||||||
|
|
|
2015 |
|
2014 |
|
2013 |
|
2012 |
|
2011 |
|
|
|
|
|
(dollars in thousands, except per share amounts) |
|
|||||||||
|
Operating results |
|
|
|
|
|
|
|
|
|
|
|
|
|
Lime and limestone revenues |
|
$ |
128,390 |
|
144,567 |
|
128,003 |
|
131,404 |
|
129,704 |
|
|
Natural gas revenues |
|
|
2,447 |
|
5,274 |
|
5,762 |
|
7,121 |
|
12,878 |
|
|
Total revenues |
|
$ |
130,837 |
|
149,841 |
|
133,765 |
|
138,525 |
|
142,582 |
|
|
Gross profit |
|
$ |
28,714 |
|
36,791 |
|
30,800 |
|
33,438 |
|
41,349 |
|
|
Operating profit |
|
$ |
19,086 |
|
27,322 |
|
21,651 |
|
24,245 |
|
32,503 |
|
|
Income before income taxes |
|
$ |
17,481 |
|
25,922 |
|
19,833 |
|
22,101 |
|
30,144 |
|
|
Net income |
|
$ |
12,886 |
|
19,367 |
|
14,800 |
|
16,423 |
|
22,186 |
|
|
Net income per share of common stock: |
|
|
|
|
|
|
|
|
|
|
|
|
|
Basic |
|
$ |
2.30 |
|
3.47 |
|
2.66 |
|
2.88 |
|
3.50 |
|
|
Diluted |
|
$ |
2.30 |
|
3.47 |
|
2.66 |
|
2.87 |
|
3.49 |
|
|
|
|
As of December 31, |
|
|||||||||
|
|
|
2015 |
|
2014 |
|
2013 |
|
2012 |
|
2011 |
|
|
|
Total assets |
|
$ |
196,499 |
|
199,986 |
|
187,526 |
|
174,246 |
|
203,073 |
|
|
Current installments of debt |
|
$ |
— |
|
16,667 |
|
5,000 |
|
5,000 |
|
6,250 |
|
|
Debt, excluding current installments |
|
$ |
— |
|
— |
|
16,667 |
|
21,667 |
|
26,667 |
|
|
Stockholders’ equity per outstanding common share |
|
$ |
29.72 |
|
27.65 |
|
24.54 |
|
21.44 |
|
22.94 |
|
|
Employees |
|
|
323 |
|
313 |
|
297 |
|
294 |
|
301 |
|
ITEM 7. MANAGEMENT’S DISCUSSION AND ANALYSIS OF FINANCIAL CONDITION AND RESULTS OF OPERATIONS.
FORWARD‑LOOKING STATEMENTS.
Any statements contained in this Report that are not statements of historical fact are forward‑looking statements as defined in the Private Securities Litigation Reform Act of 1995. Forward‑looking statements in this Report, including without limitation statements relating to the Company’s plans, strategies, objectives, expectations, intentions, and adequacy of resources, are identified by such words as “will,” “could,” “should,” “would,” “believe,” “possible,” “potential,” “expect,” “intend,” “plan,” “schedule,” “estimate,” “anticipate,” and “project.” The Company undertakes no obligation to publicly update or revise any forward‑looking statements. The Company cautions that forward‑looking statements involve risks and uncertainties that could cause actual results to differ materially from expectations, including without limitation the following: (i) the Company’s plans, strategies, objectives, expectations, and intentions are subject to change at any time at the Company’s discretion; (ii) the Company’s plans and results of operations will be affected by its ability to maintain and increase its revenues and manage its growth; (iii) the Company’s ability to meet short‑term and long‑term liquidity demands, including meeting the Company’s operating and capital needs, including for possible modernization and expansion and development projects and acquisitions, repurchasing the Company’s common stock and paying dividends, conditions in the credit and equity markets, including the ability of the Company’s customers to meet their obligations; (iv) interruptions to operations and increased expenses at the Company’s facilities resulting from changes in mining methods or conditions, variability of chemical or physical properties of the Company’s limestone and its impact on process equipment and product quality, inclement weather conditions, natural disasters, accidents, IT systems failures or disruptions, including due to cybersecurity incidents, or regulatory requirements; (v) volatile coal, petroleum coke, diesel, natural gas, electricity, transportation and freight costs and the consistent availability of trucks
20
and rail cars to deliver the Company’s products to its customers and solid fuels to its plants on a timely basis; (vi) unanticipated delays, technical feasibility issues or cost overruns in completing modernization and expansion and development projects; (vii) the Company’s ability to expand its Lime and Limestone Operations through acquisitions of businesses with related or similar operations, including obtaining financing for such acquisitions, and to successfully integrate acquired operations and sell any resulting increased production at acceptable prices; (viii) inadequate demand and/or prices for the Company’s lime and limestone products due to conditions in the U.S. economy, recessionary pressures in particular industries, including construction, steel, industrial and oil and gas services, reduced demand from utility plants, increased competition from competitors, effects of governmental fiscal and budgetary constraints, including the level of highway construction funding, and legislative impasses, and inability to continue to increase or maintain prices for the Company’s products; (ix) uncertainties of prices and regulations with respect to the Company’s Natural Gas Interests, including the absence of drilling activities on the Company’s O & G Properties, inability to explore for new reserves, unitization of existing wells, declines in production rates and plugging and abandoning of existing wells; (x) ongoing and possible new regulations, investigations, enforcement actions and costs, legal expenses, penalties, fines, assessments, litigation, judgments and settlements, taxes and disruptions and limitations of operations, including those related to climate change and health and safety and those that could impact the Company’s ability to continue or renew its operating permits or successfully secure new permits in connection with its modernization and expansion and development projects; and (xi) other risks and uncertainties set forth in this Report or indicated from time to time in the Company’s filings with the SEC, including the Company’s Quarterly Reports on Form 10‑Q.
OVERVIEW.
General.
We have identified two business segments based on the distinctness of their activities and products: Lime and Limestone Operations and Natural Gas Interests. All operations are in the United States. In evaluating the operating results of our segments, management primarily reviews revenues and gross profit. We do not allocate corporate overhead or interest costs to our business segments.
Our Lime and Limestone Operations represent our principal business. Our Natural Gas Interests consist of royalty and non‑operating working interests under the O & G Lease and the Drillsite Agreement with two separate operators related to our Johnson County, Texas property, located in the Barnett Shale Formation, on which Texas Lime conducts its lime and limestone operations. Our principal management decisions related to our Natural Gas Interests involve whether to participate as a non‑operating working interest owner by contributing our proportional costs for drilling proposed wells or workovers of existing wells under the O & G Lease and the Drillsite Agreement. While we intend to continue to participate in future natural gas wells drilled and workovers of existing wells on our O & G Properties, if any, we are not in the business of drilling for or producing natural gas, and have no personnel expert in that field.
Revenues from our Lime and Limestone Operations decreased 11.2% in 2015 compared to 2014. The decreased sales volumes of our lime and limestone products, which accounted for a revenue decrease of approximately 12.4% for 2015 compared to 2014, resulted principally from decreased sales volumes to our oil and gas services, steel and industrial customers. In addition, revenues in 2014 included sales to another lime producer for delivery to its customers, which sales did not recur in 2015. Although our sales volumes to our construction customers in 2015 were basically flat compared to 2014, demand from our construction customers in the first half 2015 was substantially lower due to unusually persistent adverse weather conditions, including ice and snow storms in the first quarter, and, in our construction market areas, rainfall in the second quarter was among the highest in more than 100 years. The decrease in sales volumes was partially offset by an increase in average product prices for our lime and limestone products of approximately 1.2% in 2015 compared to 2014.
Revenues from our Natural Gas Interests decreased 53.6% in 2015 from compared to 2014 due to decreased average prices for natural gas and natural gas liquids, as well as decreased production volumes resulting from the normal declines in production rates on the Company’s existing natural gas wells. The decrease in revenues from our Natural Gas Interests in 2015 resulted from price decreases of approximately 45.8% and decreases in production volumes of approximately 7.8%.
21
Gross profit decreased 22.0% in 2015 compared to 2014. Gross profit from our Lime and Limestone Operations in 2015 decreased 16.4% compared to 2014, primarily due to the decreased revenues discussed above, partially offset by lower energy costs as well as less discretionary outside contractor stripping costs. Gross profit from our Natural Gas Interests decreased 88.9% in 2015 compared to 2014, primarily due to the decreased revenues discussed above.
Interest expense decreased $0.5 million, or 32.2%, in 2015 compared to 2014, primarily as a result of our repayment of the $15.4 million then-outstanding balance of our term loans in the second quarter 2015. In connection with such repayment, we repurchased our interest rate hedges associated with the term loans.
During the second quarter 2015, we also terminated the Corson Pension Plan (the “Corson Plan”), which required a cash payment of $0.2 million and resulted in a second quarter expense of $0.9 million ($0.6 million, net of tax benefit), included in other expense (income), net for 2015 that was previously included in accumulated other comprehensive loss. As a result of the termination of the Corson Plan, the Company will not have to make any future contributions to the Plan.
The decrease in gross profit and the cost to terminate the Corson Plan were the primary reasons for a $6.5 million, or 33.5%, decrease in our net income in 2015 compared to 2014. Even with the decrease in net income, cash flows from operations during 2015 enabled us to repay our $16.7 million in term loans, make $11.5 million of capital investments, pay $2.8 million in dividends, and terminate the Corson Plan, and left us with cash balances of $59.9 million at December 31, 2015, compared to $58.3 million at December 31, 2014.
On May 7, 2015, we amended our credit agreement to, among other things, provide for a $75 million revolving credit facility, maturing on May 7, 2020, and reduce our interest rate margins and commitment fees (the “Amendment”). The Amendment also provides for an incremental four-year accordion feature to borrow up to an additional $50 million on the same terms, subject to approval by the lender or another lender selected by us.
In December 2015, we commenced a publicly announced share repurchase program to repurchase up to $10 million of our common stock. Pursuant to that program, we repurchased 3,086 shares in December at a weighted-average price of $54.79 per share. In 2016, through March 3, 2016, we have repurchased 50,068 shares at a weighted-average price of $53.52 per share.
Absent a significant acquisition opportunity arising during 2016, we anticipate funding our operating and capital needs, including possible modernization and expansion and development projects, paying cash dividends and repurchasing the remainder of our $10 million of share repurchase program from our cash on hand and cash flows from operations.
Lime and Limestone Operations.
In our Lime and Limestone Operations, we produce and sell PLS, quicklime, hydrated lime and lime slurry. The principal factors affecting our success are the level of demand and prices for our products and whether we are able to maintain sufficient production levels and product quality while controlling costs.
Inclement weather conditions, such as the winter ice and snow storms, cold weather and excessive rainfalls that we experienced in the first half 2015, generally reduce the demand for lime and limestone products supplied to construction‑related customers that account for a significant amount of our revenues. Inclement weather also interferes with our open‑pit mining operations and can disrupt our plant production. In addition to weather, various maintenance, environmental, accident and other operational issues can also disrupt our operations and increase our operating expenses.
Demand for our products in our market areas is also affected by general economic conditions, the pace of construction, the demand for steel, level of oil and gas drilling in our markets, as well as the level of governmental and private funding for highway construction and utility plant usage of coal for power generation. Demand for our lime and limestone products from the construction industry was basically flat in 2015, although in the fourth quarter 2015 we saw construction demand increase, with such increase in demand carrying into 2016. However, demand for our lime and limestone products from our oil and gas services, steel and industrial customers declined during 2015. The decrease in oil and gas drilling activities in 2015, as a result of declining oil and natural gas prices, reduced demand from our oil and gas services customers, and decreased steel production resulted in lower demand from our steel customers. At the same time,
22
we also benefited from lower oil and gas prices, through lower transportation, freight and fuel costs during 2015, which somewhat offset the lower revenues resulting from reduced sales to our oil and gas services and steel customers.
On December 4, 2015, the President signed into law the Fixing America’s Surface Transportation Act (the “FAST Act”), the first multi‑year transportation authorization enacted in over ten years. The FAST Act authorizes $305 billion over fiscal years 2016 through 2020 that provides long-term funding certainty for surface transportation projects. Its enactment should allow states and local governments to move forward with critical transportation projects, like new highways, with confidence that the Highway Trust Fund will meet its obligations through 2020. Also, in Texas, recently approved constitutional amendments authorized a portion of oil and gas tax revenues to be deposited into the State Highway Fund and certain other sales and use tax revenues to be dedicated to the State Highway Fund. With these funding improvements, we expect to see continued increases in demand from our construction customers.
Our modernization and expansion and development projects in Texas and Arkansas, including the construction of a third kiln in Arkansas (completed in December 2006), our development projects in Arkansas, our acquisitions of U. S. Lime Company—St. Clair and our Texas slurry operations, the December 2014 acquisition of the assets of a trucking company operation in Houston, Texas and the establishment of a new distribution terminal facility southwest of Houston, Texas, have positioned us to meet the demand for high‑quality lime and limestone products in our markets. Our modernization and expansion and development projects have also equipped us with up‑to‑date, fuel‑efficient plant facilities, which has resulted in lower production costs and greater operating efficiencies, thus enhancing our competitive position. All of our kilns are fuel‑efficient preheater kilns, except for one kiln at St. Clair.
For our plants to operate at peak efficiency, we must meet operational challenges that arise from time to time, including bringing new facilities on line and refurbishing and/or improving acquired facilities, such as St. Clair, which we acquired with the intention of modernizing and expanding, subject to permitting, technical feasibility, economics and market demand, as well as operating existing facilities efficiently. We also incur ongoing costs for maintenance and to remain in compliance with rapidly changing Environmental Laws and health and safety and other regulations.
Our primary variable cost is energy. Although we have seen reductions in our energy costs over the past year, prices for coal, petroleum coke, diesel, natural gas, electricity, transportation and freight are volatile and have generally increased over the past few years. In addition, our freight costs, including diesel prices, to deliver our products can be high relative to the value of our products and have generally increased in recent years, although diesel prices have decreased recently as oil prices have decreased. We have been able to mitigate to some degree the adverse impact of volatile energy costs by varying the mixes of fuel used in our kilns, and by passing on some of any increase in costs to our customers through higher prices and/or surcharges on certain products. We have not engaged in any significant hedging activity in an effort to control our energy costs, but may do so in the future.
We have financed our modernization and expansion and development projects and acquisitions through a combination of debt financing and cash flows from operations. We must generate sufficient cash flows to cover ongoing capital requirements, including possible modernization and expansion and development projects.
For us to maintain or increase our profitability in our Lime and Limestone Operations in the face of reduced demand from some of our customers, competitive pressures and increased costs, we must improve our revenues and control our operational and selling, general and administrative expenses. To maintain or improve our gross profit margins, we are focusing on maintaining, and increasing where possible, our lime and limestone prices to offset our increased costs, which is a challenging task in the current economic environment, with increased competition from other lime and limestone producers. In addition, we will continue to explore ways to increase the operating efficiency of our plants and other facilities, including the possible modernization of our St. Clair plant, and expand our production capacity through acquisitions as conditions warrant or opportunities arise.
We continue to believe the enhanced efficiency and production capacity resulting from our modernization and expansion and development projects at Texas and Arkansas, our acquisitions and the operational strategies we have implemented have allowed us to increase our efficiency, grow production capacity, improve product quality, better serve existing customers, attract new customers and control costs. To date, however, demand and prices for our lime and limestone products have not been sufficient to fully utilize our additional production capacity. In addition, there can be no assurance that our efficiency and production will not be adversely affected by weather, maintenance, accident or other
23
operational issues; that we can successfully invest in improvements to our existing facilities; that our results will not be adversely affected by increases in fuel, natural gas, electricity, transportation and freight costs or new environmental, health and safety or other regulatory requirements; or, that with increasing competition with other lime and limestone producers, our revenues, gross profit, net income and cash flows can be maintained or improved.
Natural Gas Interests.
In 2004, we entered into the O & G Lease with EOG with respect to oil and gas rights on our Cleburne, Texas property, located in the Barnett Shale Formation. Pursuant to the O & G Lease, we have royalty interests ranging from 15.4% to 20% in oil and gas produced from any successful wells drilled on the leased property and an option to participate in any well drilled on the leased property as a 20% non‑operating working interest owner. Our overall average revenue interest is 34.7% in the 33 wells drilled under the O & G Lease that are currently producing.
In November 2006, we also entered into a Drillsite Agreement with XTO that has an oil and gas lease covering approximately 538 acres of land contiguous to our Johnson County, Texas property. Pursuant to this Agreement, we have a 3% royalty interest and an optional 12.5% non‑operating working interest, resulting in a 12.4% interest in revenues in the six XTO wells drilled and producing from a padsite located on our property.
No new wells have been completed since 2011, and there are no present plans to drill additional wells on the O&G Properties. We cannot predict the number of additional wells that ultimately will be drilled on the O & G Properties, if any, or their results.
The pricing of natural gas sales is primarily determined by supply and demand in the marketplace and can fluctuate considerably. The prices that the Company receives for its natural gas production is also affected by the amount of natural gas liquids included in the natural gas, and the prices for those liquids is also subject to supply and demand factors. Prices of both natural gas and natural gas liquids have declined drastically in recent years, principally due to increased supply. In addition, if estimates of our proved oil and gas reserves decline due to further declines in prices for natural gas and natural gas liquids or other reasons, the rate at which we record depletion expense would increase.
CRITICAL ACCOUNTING POLICIES.
The discussion and analysis of our financial condition and results of operations are based upon our consolidated financial statements, which have been prepared in accordance with accounting principles generally accepted in the United States of America (“US GAAP”). The preparation of these financial statements requires us to make estimates and judgments that affect the reported amounts of assets, liabilities, revenues and expenses, and related disclosures of contingent assets and liabilities, at the date of our financial statements. Actual results may differ from these estimates and judgments under different assumptions or conditions and historical trends.
Critical accounting policies are defined as those that are reflective of significant management judgments and uncertainties and potentially result in materially different results under different assumptions and conditions. We believe the following critical accounting policies require the most significant management estimates and judgments used in the preparation of our consolidated financial statements.
Accounts receivable. We estimate the collectability of our trade receivables. A considerable amount of judgment is required in assessing the ultimate realization of these receivables and determining our allowance for doubtful accounts. Uncollected trade receivables are charged‑off when identified by management to be unrecoverable. The majority of our trade receivables are unsecured. Payment terms for our trade receivables are based on underlying purchase orders, contracts or purchase agreements. Credit losses relating to these receivables have generally been within management expectations and historical trends.
Successful‑efforts method for Natural Gas Interests. We use the successful‑efforts method to account for development expenditures related to our Natural Gas Interests. Under this method, drilling and completion costs of development wells are capitalized and depleted using the units‑of‑production method. Costs to drill exploratory wells, if any, that do not find proved reserves are expensed.
24
Reserve estimates. Proved oil and gas reserves are those quantities of oil and gas, which, by analysis of geoscience and engineering data, can be estimated with reasonable certainty to be economically producible from a given date forward, from known reservoirs, and under existing economic conditions, operating methods, and government regulations, prior to the time at which contracts providing the right to operate expire, unless evidence indicates that renewal is reasonably certain, regardless of whether deterministic or probabilistic methods are used for the estimation. The project to extract the hydrocarbons must have commenced or the operator must be reasonably certain it will commence the project within a reasonable time.
The volumes of our reserves are estimates that, by their nature, are subject to revision. The estimates are made using geological and reservoir data, as well as production performance data. These estimates will be reviewed annually and revised, either upward or downward, as warranted by additional performance data. If the estimates of proved reserves were to decline, the rate at which we record depletion expense would increase.
Environmental costs and liabilities. We record environmental accruals in other liabilities, based on studies and estimates, when it is probable we have incurred a reasonably estimable cost or liability. The accruals are adjusted when further information warrants an adjustment. Environmental expenditures that extend the life, increase the capacity or improve the safety or efficiency of Company‑owned assets or are incurred to mitigate or prevent future possible environmental issues are capitalized. Other environmental costs are expensed when incurred.
Contingencies. We are party to proceedings, lawsuits and claims arising in the normal course of business relating to regulatory, labor, product and other matters. We are required to estimate the likelihood of any adverse judgments or outcomes with respect to these matters, as well as potential ranges of possible losses. A determination of the amount of reserves required, if any, for these contingencies is made after careful analysis of each individual matter, including coverage under our insurance policies. This determination may change in the future because of new information or developments.
Derivatives. Prior to repurchasing our interest rate hedges, we recorded their fair value on our Consolidated Balance Sheets and included any changes in fair value in comprehensive income. We determined fair value utilizing the cash flows valuation technique.
Stock‑based compensation. We expense all stock‑based payments to employees and directors, including grants of stock options and restricted stock, in our Consolidated Statements of Income based on their fair values. Compensation cost is recognized ratably over the vesting period for all stock‑based awards.
25
RESULTS OF OPERATIONS.
The following table sets forth certain financial information expressed as a percentage of revenues for the periods indicated:
|
|
|
Year Ended December 31, |
|
|
||||
|
|
|
2015 |
|
2014 |
|
2013 |
|
|
|
Lime and Limestone Operations |
|
98.1 |
% |
96.5 |
% |
95.7 |
% |
|
|
Natural Gas Interests |
|
1.9 |
|
3.5 |
|
4.3 |
|
|
|
Total revenues |
|
100.0 |
% |
100.0 |
% |
100.0 |
% |
|
|
Cost of revenues |
|
|
|
|
|
|
|
|
|
Labor and other operating expenses |
|
(66.0) |
|
(65.6) |
|
(66.3) |
|
|
|
Depreciation, depletion and amortization |
|
(12.1) |
|
(9.8) |
|
(10.7) |
|
|
|
Gross profit |
|
21.9 |
|
24.6 |
|
23.0 |
|
|
|
Selling, general and administrative expenses |
|
(7.4) |
|
(6.4) |
|
(6.8) |
|
|
|
Operating profit |
|
14.5 |
|
18.2 |
|
16.2 |
|
|
|
Other (expense) income: |
|
|
|
|
|
|
|
|
|
Interest expense |
|
(0.8) |
|
(1.0) |
|
(1.4) |
|
|
|
Other (expense) income, net |
|
(0.4) |
|
0.1 |
|
0.0 |
|
|
|
Income tax expense |
|
(3.5) |
|
(4.4) |
|
(3.7) |
|
|
|
Net income |
|
9.8 |
% |
12.9 |
% |
11.1 |
% |
|
2015 vs. 2014
Revenues for 2015 decreased to $130.8 million from $149.8 million in 2014, a decrease of $19.0 million, or 12.7%. Revenues from our Lime and Limestone Operations for 2015 decreased $16.2 million, or 11.2%, to $128.4 million from $144.6 million in 2014. The decrease in revenues from our Lime and Limestone Operations was primarily due to decreased sales volumes of our lime and limestone products, principally to our oil and gas services, steel and industrial customers, partially offset by increased sales volumes to our construction customers and a slight increase in prices realized for our lime and limestone products in 2015, compared to 2014.
Revenues from our Natural Gas Interests for 2015 decreased $2.8 million, or 53.6%, to $2.4 million from $5.3 million in 2014. The decrease in revenues from our Natural Gas Interests resulted from lower prices and the normal declines in production rates on existing wells.
Gross profit decreased to $28.7 million for 2015 from $36.8 million for 2014, a decrease of $8.1 million, or 22.0%. Gross profit from our Lime and Limestone Operations for 2015 was $28.4 million, compared to $34.0 million in 2014, a decrease of $5.6 million, or 16.4%. The decrease in gross profit from our Lime and Limestone Operations in 2015 compared to 2014 resulted primarily from the decreased revenues discussed above, partially offset by lower energy and discretionary outside contractor stripping costs in 2015.
Gross profit for 2015 also included $0.3 million from our Natural Gas Interests, compared to $2.8 million in 2014, a decrease of $2.5 million, or 88.9%. The decrease in gross profit from our Natural Gas Interests resulted primarily from the decreased revenue discussed above. Production volumes for 2015 from our Natural Gas Interests totaled 0.7 BCF, sold at an average price per MCF of $3.41, compared to 2014 when 0.8 BCF was produced and sold at an average price of $6.28 per MCF.
Selling general and administrative expenses (“SG&A”) increased to $9.6 million for 2015 from $9.5 million in 2014, an increase of $0.2 million, or 1.7%. The increase in SG&A was primarily due to an increase of $0.1 million in non‑cash stock‑based compensation costs which was primarily due to increases in the price per share of the Company’s common stock grant dates in 2014 and the first half 2015, compared to the prices per share on previous grant dates. As a
26
percentage of revenues, SG&A increased to 7.4% in 2015 from 6.4% in 2014, primarily due to the decrease in revenues for 2015.
Interest expense for 2015 decreased to $1.0 million from $1.5 million in 2014, a decrease of $0.5 million, or 32.2%. Interest expense in 2015 included $0.2 million paid in quarterly settlement payments pursuant to our interest rate hedges, compared to $0.9 million paid in 2014. Interest expense for 2015 also included $0.5 million payment to repurchase our interest rate hedges in the second quarter 2015 in conjunction with the repayment of the then-outstanding balance on our term loans. The decrease in interest expense in 2015 primarily resulted from the repayment of our debt.
Other expense (income), net was an expense of $0.6 million in 2015, compared to income of $0.1 million in 2014. The net change of $0.8 million expense primarily resulted from the $0.9 million expense in 2015 for the termination of the Corson Plan discussed above, compared to an expense of $0.1 million for the Corson Plan in 2014.
Income tax expense decreased to $4.6 million for 2015 from $6.6 million in 2014, a decrease of $2.0 million, or 29.9%. The decrease in income tax expense in 2015 compared to 2014 was primarily due to the decrease in our income before taxes. Our effective income tax rate for 2015 increased to 26.2%, compared to our 2014 rate of 25.3%, primarily due to an increase in state income taxes, net of federal income tax benefits, as a result of the full realization of the Company’s net operating loss carryforwards in one state.
Net income decreased by $6.5 million, or 33.5%, to $12.9 million ($2.30 per share diluted), compared to net income of $19.4 million ($3.47 per share diluted) in 2014.
2014 vs. 2013
Revenues for 2014 increased to $149.8 million from $133.8 million in 2013, an increase of $16.1 million, or 12.0%. Revenues from our Lime and Limestone Operations increased $16.6 million, or 12.9%, to $144.6 million from $128.0 million in 2013. The increase in revenues from our Lime and Limestone Operations was primarily due to increased sales volumes of our lime and limestone products, principally to our construction, industrial, oil and gas services and environmental customers, and sales to another lime producer for delivery to its customers, partially offset by decreased sales volumes to our steel customers. In addition, we realized a slight increase in prices for our lime and limestone products in 2014, compared to 2013.
Revenues from our Natural Gas Interests for 2014 decreased $0.5 million, or 8.5%, to $5.3 million from $5.8 million in the prior year. The decrease in revenues from our Natural Gas Interests resulted from the normal declines in production rates on existing wells, partially offset by slightly higher prices.
Our gross profit increased to $36.8 million for 2014 from $30.8 million for 2013, an increase of $6.0 million, or 19.5%. Gross profit from our Lime and Limestone Operations for 2014 was $34.0 million, compared to $27.9 million in 2013, an increase of $6.0 million, or 21.7%. The increase in gross profit in 2014 compared to 2013 resulted primarily from the increased revenues discussed above.
Gross profit for 2014 also included $2.8 million from our Natural Gas Interests, compared to $2.9 million in 2013, a decrease of $0.1 million or 1.9%. Production volumes for 2014 from our Natural Gas Interests totaled 0.8 BCF, sold at an average price per MCF of $6.28, compared to 2013 when 1.0 BCF was produced and sold at an average price of $5.86 per MCF.
SG&A increased to $9.5 million in 2014 from $9.2 million in 2013, an increase of $0.3 million, or 3.5%. As a percentage of revenues, SG&A decreased to 6.4% in 2014 from 6.8% in 2013 due to the increase in revenues in 2014. The increase in SG&A in 2014 compared to 2013 included increases in credit card fees, which increased approximately $0.2 million, and in non‑cash stock‑based compensation costs, which also increased approximately $0.2 million. The increase in credit card fees resulted primarily from more of the Company’s customers making payments by credit card, while the increase in stock‑based compensation costs was primarily due to increases in the price per share of the Company’s common stock in 2013 and first half 2014, compared to the prices per share on previous grant dates.
Interest expense in 2014 decreased to $1.5 million from $1.9 million in 2013, a decrease of $0.3 million, or 17.4%. Interest expense in 2014 and 2013 included $0.9 million and $1.1 million, respectively, paid in aggregate
27
quarterly settlement payments pursuant to our interest rate hedges. The decrease in interest expense in 2014 resulted from decreased average outstanding debt.
Income tax expense increased to $6.6 million in 2014 from $5.0 million in 2013, an increase of $1.5 million, or 30.2%. The increase in income tax expense in 2014 compared to 2013 was primarily due to the increase in our income before taxes. Our effective income tax rate for 2014 decreased slightly to 25.3% compared to our 2013 rate of 25.4%.
Net income increased to $19.4 million ($3.47 per share diluted) in 2014, compared to $14.8 million ($2.66 per share diluted) in 2013, an increase of $4.6 million, or 30.9%.
FINANCIAL CONDITION.
Capital Requirements. We require capital primarily for normal recurring capital and re‑equipping projects, modernization and expansion and development projects and acquisitions. Our capital needs are expected to be met principally from cash on hand, cash flows from operations and our $75 million revolving credit facility.
We expect to spend approximately $8.0 to $10.0 million per year over the next several years in our Lime and Limestone Operations for normal recurring capital and re‑equipping projects at our plants and facilities to maintain or improve efficiency, ensure compliance with Environmental Laws, meet customer needs and reduce costs. As of December 31, 2015, we had approximately $0.8 million in open orders or contractual commitments for our Lime and Limestone Operations and none for our Natural Gas Interests.
Liquidity and Capital Resources. Net cash provided by operations was $32.5 million in 2015, compared to $32.0 million in 2014, an increase of $0.5 million, or 1.6%. Our net cash provided by operating activities is composed of net income, depreciation, depletion and amortization (“DD&A”), other non‑cash items included in net income and changes in working capital. In 2015, net cash provided by operating activities was principally composed of $12.9 million net income, $16.0 million DD&A, $1.2 million stock‑based compensation and $2.5 million increase from changes in operating assets and liabilities. The increase in net cash provided by operations in 2015 compared to 2014 was primarily the result of a $1.5 million decrease in trade receivables, net, compared to a $3.3 million increase in 2014, a $0.7 decrease in prepaid expenses and other current assets in 2015, compared to a $0.9 million increase in 2014, a $1.1 million increase in DD&A in 2015 compared to 2014 and a $0.2 million increase in accounts payable and accrued expenses in 2015, compared to a $1.0 million decrease in 2014. These changes were partially offset by the $6.5 million decrease in net income in 2015 and a $1.3 million increase in inventories in 2015, compared to a $0.3 million decrease in 2014. The decrease in trade receivables, net in 2015 resulted from the $4.1 million decrease in revenues in the fourth quarter 2015 compared to the fourth quarter 2014, while the increase in trade receivables, net in 2014 resulted from the $5.3 million increase in revenues in the fourth quarter 2014 compared to the fourth quarter 2013.
Net cash used in investing activities was $11.1 million for 2015 compared to $15.1 million in 2014, primarily for normal recurring capital and re‑equipping projects at our plants and facilities, other than $3.7 million paid at closing in 2014 for the acquisition of the assets of a trucking company operation in Houston, Texas. Net cash used in financing activities primarily consisted of $16.7 and $5.0 million to repay term loans in 2015 and 2014, respectively, $2.8 million for dividend payments in each of 2015 and 2014 and $0.4 and $0.3 million to repurchase shares of our common stock in 2015 and 2014, respectively. Such share repurchases included $0.2 million in 2015 repurchases pursuant to the Company’s publicly announced $10 million share repurchase program, leaving up to $9.8 million for such repurchases in 2016.
Our cash and cash equivalents at December 31, 2015 increased to $59.9 million from $58.3 million at December 31, 2014. In 2016, through March 3, 2016, we have spent $2.7 million to repurchase shares pursuant to our $10 million share repurchase program.
Banking Facilities and Other Debt. On May 7, 2015, we amended our credit agreement with Wells Fargo Bank, N.A. (the “Lender”) to, among other things, provide for a $75 million revolving credit facility (the “New Revolving Facility”) and reduced interest rate margins and commitment fees (the “Amendment”). The Amendment also provides for an incremental four-year accordion feature to borrow up to an additional $50 million on the same terms, subject to approval by the Lender or another lender selected by us. The terms of the Amendment provide for a final
28
maturity of the New Revolving Facility and any incremental loan on May 7, 2020; interest rates, at our option, of LIBOR plus a margin of 1.000% (previously 1.750%) to 2.000% (previously 2.750%), or the Lender’s Prime Rate plus a margin of 0.000% to plus 1.000%; and a commitment fee range of 0.200% (previously 0.250%) to 0.350% (previously 0.400%) on the undrawn portion of the New Revolving Facility. The New Revolving Facility interest rate margins and commitment fee are determined quarterly in accordance with a pricing grid based upon the Company’s Cash Flow Leverage Ratio, defined as the ratio of the Company’s total funded senior indebtedness to earnings before interest, taxes, depreciation, depletion, amortization and stock-based compensation expense (“EBITDA”) for the 12 months ended on the last day of the most recent calendar quarter, plus pro forma EBITDA from any businesses acquired during the period. Pursuant to a security agreement, dated August 25, 2004, the New Revolving Facility is secured by the Company’s existing and hereafter acquired tangible assets, intangible assets and real property. The maturity of the New Revolving Facility and any incremental loans can be accelerated if any event of default, as defined under the credit agreement, occurs. Our maximum Cash Flow Leverage Ratio is 3.50 to 1 (previously 3.25 to 1).
We may pay dividends so long as we remain in compliance with the provisions of our credit agreement, and may purchase, redeem or otherwise acquire shares of our common stock so long as our pro forma Cash Flow Leverage Ratio is less than 3.00 to 1.00 and no default or event of default exists or would exist after giving effect to such stock repurchase.
Prior to the Amendment, our credit agreement included a ten‑year $40 million term loan (the “Term Loan”), a ten‑year $20 million multiple draw term loan (the “Draw Term Loan”) and a $30 million revolving credit facility (the “Revolving Facility”) (collectively, the “Credit Facilities”). The Term Loan required quarterly principal payments of $0.8 million, with a final principal payment of $7.5 million due on December 31, 2015. The Draw Term Loan required quarterly principal payments of $0.4 million, with a final principal payment of $5.4 million due on December 31, 2015. The Revolving Facility was scheduled to mature on June 1, 2015. The maturity of the Term Loan, the Draw Term Loan and the Revolving Facility could have been accelerated if any event of default, as defined under the Credit Facilities, occurs.
We had interest rate hedges, with the Lender as the counterparty to the hedges that fixed LIBOR through maturity at 4.695%, 4.875% and 5.500% on the outstanding balance of the Term Loan, 75% of the outstanding balance of the Draw Term Loan and 25% of the outstanding balance of the Draw Term Loan, respectively. Based on our LIBOR margin of 1.750% prior to the Amendment, our interest rates had been: 6.445% on the outstanding balance of the Term Loan; 6.625% on 75% of the outstanding balance of the Draw Term Loan; and 7.250% on 25% of the outstanding balance of the Draw Term Loan.
The hedges had been effective as defined under applicable accounting rules. Therefore, changes in fair value of the interest rate hedges were reflected in comprehensive income. We would have been exposed to credit losses in the event of non‑performance by the counterparty to the hedges. Due to interest rate declines, the mark to market of our interest rate hedges, at December 31, 2014, resulted in liability of $0.7 million, which was included in accrued expenses on our Consolidated Balance Sheets. We paid $0.2 and $0.9 million in aggregate quarterly settlement payments pursuant to the hedges in 2015 and 2014, respectively. These payments were included in interest expense in our Consolidated Statements of Income.
On May 7, 2015, we paid off the $15.4 million balance then outstanding on the Term Loan and Draw Term Loan, as well as paid $0.5 million to repurchase the related hedges, from cash on hand. The cost to repurchase the hedges was included in interest expense.
We had $0.7 million of letters of credit issued under the Revolving Facility as of December 31, 2015, which count as draws against the available commitment under the New Revolving Facility, but no cash draws.
Capital Expenditures. We have made a substantial amount of capital investments over the past several years to modernize our plants and facilities and expand our lime and limestone operations, and to fund the drilling and completion of 40 natural gas wells.
Capital expenditure activities totaled $11.5 and $15.4 million, in 2015 and 2014, respectively. Activities in 2014 included $3.7 million for the acquisition of the assets of a trucking company operation in Houston, Texas (with $50
29
thousand deferred and paid in 2015 and another $50 thousand deferred to be paid in 2016), including $1.7 million for land and buildings and $2.1 million for trucks, trailers and other equipment. Prior to the purchase, the trucking company exclusively delivered the Company’s products to its customers and slurry facilities, and the land purchased included the site leased for our slurry facility. We utilize the acquired assets to deliver our products to our customers and facilities and do not haul for third parties.
Common Stock Buybacks. We spent $0.4, $0.3 and $0.2 million in 2015, 2014 and 2013, respectively, to repurchase treasury shares. Included in the 2015 expenditures is $0.2 spent as part of our publicly announced share repurchase program commenced in December 2015 to repurchase up to $10 million of our common stock.
Contractual Obligations. The following table sets forth our contractual obligations as of December 31, 2015 (in thousands):
|
|
|
Payments Due by Period |
|
|||||||||
|
|
|
|
|
|
|
|
|
|
|
|
More Than |
|
|
Contractual Obligations |
|
Total |
|
1 Year |
|
2 - 3 Years |
|
4 - 5 Years |
|
5 Years |
|
|
|
Debt, including current installments |
|
$ |
— |
|
— |
|
— |
|
— |
|
— |
|
|
Operating leases(1) |
|
$ |
4,984 |
|
1,718 |
|
2,004 |
|
1,065 |
|
197 |
|
|
Limestone mineral leases |
|
$ |
1,727 |
|
77 |
|
155 |
|
154 |
|
1,341 |
|
|
Purchase obligations(2) |
|
$ |
2,075 |
|
2,075 |
|
— |
|
— |
|
— |
|
|
Other liabilities |
|
$ |
2,058 |
|
171 |
|
340 |
|
452 |
|
1,095 |
|
|
Total |
|
$ |
10,844 |
|
4,041 |
|
2,499 |
|
1,671 |
|
2,633 |
|
|
(1) |
Represents operating leases for railcars, corporate office space and some equipment that are either non‑cancelable or subject to significant penalty upon cancellation. |
|
(2) |
$1,309 of these obligations are recorded on the Consolidated Balance Sheet at December 31, 2015. |
As of December 31, 2015, we had $0.7 million of letters of credit outstanding and no other draws on our New Revolving Facility. We believe that cash on hand and cash flows from operations will be sufficient to meet our operating needs, ongoing capital needs, including our possible modernization and expansion and development projects, and liquidity needs and allow us to continue to repurchase our common stock under our publicly announced share repurchase program as well as pay cash dividends for the near future.
Off‑Balance Sheet Arrangements. We do not utilize off‑balance sheet financing arrangements; however, we lease railcars, corporate office space and some equipment used in our operations under operating lease agreements that are either non‑cancelable or subject to significant penalty upon cancellation, and have various limestone mineral leases. As of December 31, 2015, the total future lease payments under our various operating and mineral leases totaled $5.0 million and $1.7 million, respectively, and are due in payments as summarized in the table above.
ITEM 7A. QUANTITATIVE AND QUALITATIVE DISCLOSURES ABOUT MARKET RISK.
INTEREST RATE RISK.
We could be exposed to changes in interest rates, primarily as a result of floating interest rates on the New Revolving Facility. There was no outstanding balance on the New Revolving Facility subject to interest rate risk at December 31, 2015. Any future borrowings under the New Revolving Facility would be subject to interest rate risk. See Note 3 of Notes to Consolidated Financial Statements.
30
ITEM 8. FINANCIAL STATEMENTS AND SUPPLEMENTARY DATA.
Index to Consolidated Financial Statements.
31
REPORT OF INDEPENDENT REGISTERED PUBLIC ACCOUNTING FIRM
Board of Directors and Shareholders
United States Lime & Minerals, Inc. and Subsidiaries
We have audited the accompanying consolidated balance sheets of United States Lime & Minerals, Inc. and Subsidiaries (the “Company”) as of December 31, 2015 and 2014, and the related consolidated statements of income, comprehensive income, stockholders’ equity, and cash flows for each of the three years in the period ended December 31, 2015. These financial statements are the responsibility of the Company’s management. Our responsibility is to express an opinion on these financial statements based on our audits.
We conducted our audits in accordance with the standards of the Public Company Accounting Oversight Board (United States). Those standards require that we plan and perform the audit to obtain reasonable assurance about whether the financial statements are free of material misstatement. An audit includes examining, on a test basis, evidence supporting the amounts and disclosures in the financial statements. An audit also includes assessing the accounting principles used and significant estimates made by management, as well as evaluating the overall financial statement presentation. We believe that our audits provide a reasonable basis for our opinion.
In our opinion, the consolidated financial statements referred to above present fairly, in all material respects, the financial position of United States Lime & Minerals, Inc. and Subsidiaries as of December 31, 2015 and 2014, and the results of their operations and their cash flows for each of the three years in the period ended December 31, 2015 in conformity with accounting principles generally accepted in the United States of America.
As discussed in Note 2 to the consolidated financial statements, the Company adopted new accounting guidance in 2015 and 2014, related to the presentation of deferred income taxes.
We also have audited, in accordance with the standards of the Public Company Accounting Oversight Board (United States), the Company’s internal control over financial reporting as of December 31, 2015, based on criteria established in the 2013 Internal Control—Integrated Framework issued by the Committee of Sponsoring Organizations of the Treadway Commission (COSO), and our report dated March 4, 2016 expressed an unqualified opinion thereon.
|
/s/ GRANT THORNTON LLP |
|
|
|
|
|
Dallas, Texas |
|
32
REPORT OF INDEPENDENT REGISTERED PUBLIC ACCOUNTING FIRM
Board of Directors and Shareholders
United States Lime & Minerals, Inc. and Subsidiaries
We have audited the internal control over financial reporting of United States Lime & Minerals, Inc. and Subsidiaries (the “Company”) as of December 31, 2015, based on criteria established in the 2013 Internal Control—Integrated Framework issued by the Committee of Sponsoring Organizations of the Treadway Commission (COSO). The Company’s management is responsible for maintaining effective internal control over financial reporting and for its assessment of the effectiveness of internal control over financial reporting, included in the accompanying Management’s Report on Internal Control over Financial Reporting. Our responsibility is to express an opinion on the Company’s internal control over financial reporting based on our audit.
We conducted our audit in accordance with the standards of the Public Company Accounting Oversight Board (United States). Those standards require that we plan and perform the audit to obtain reasonable assurance about whether effective internal control over financial reporting was maintained in all material respects. Our audit included obtaining an understanding of internal control over financial reporting, assessing the risk that a material weakness exists, testing and evaluating the design and operating effectiveness of internal control based on the assessed risk, and performing such other procedures as we considered necessary in the circumstances. We believe that our audit provides a reasonable basis for our opinion.
A company’s internal control over financial reporting is a process designed to provide reasonable assurance regarding the reliability of financial reporting and the preparation of financial statements for external purposes in accordance with generally accepted accounting principles. A company’s internal control over financial reporting includes those policies and procedures that (1) pertain to the maintenance of records that, in reasonable detail, accurately and fairly reflect the transactions and dispositions of the assets of the company; (2) provide reasonable assurance that transactions are recorded as necessary to permit preparation of financial statements in accordance with generally accepted accounting principles, and that receipts and expenditures of the company are being made only in accordance with authorizations of management and directors of the company; and (3) provide reasonable assurance regarding prevention or timely detection of unauthorized acquisition, use, or disposition of the company’s assets that could have a material effect on the financial statements.
Because of its inherent limitations, internal control over financial reporting may not prevent or detect misstatements. Also, projections of any evaluation of effectiveness to future periods are subject to the risk that controls may become inadequate because of changes in conditions, or that the degree of compliance with the policies or procedures may deteriorate.
In our opinion, the Company maintained, in all material respects, effective internal control over financial reporting as of December 31, 2015, based on criteria established in the 2013 Internal Control—Integrated Framework issued by COSO.
We also have audited, in accordance with the standards of the Public Company Accounting Oversight Board (United States), the consolidated financial statements of the Company as of and for the year ended December 31, 2015, and our report dated March 4, 2016 expressed an unqualified opinion on those financial statements.
|
/s/ GRANT THORNTON LLP |
|
|
|
|
|
Dallas, Texas |
|
33
United States Lime & Minerals, Inc.
(dollars in thousands, except per share amounts)
|
|
|
December 31, |
|
||||
|
|
|
2015 |
|
2014 |
|
||
|
ASSETS |
|
|
|
|
|
|
|
|
Current assets: |
|
|
|
|
|
|
|
|
Cash and cash equivalents |
|
$ |
59,926 |
|
$ |
58,332 |
|
|
Trade receivables, net |
|
|
15,889 |
|
|
17,444 |
|
|
Inventories, net |
|
|
14,728 |
|
|
13,436 |
|
|
Prepaid expenses and other current assets |
|
|
1,418 |
|
|
2,116 |
|
|
Total current assets |
|
|
91,961 |
|
|
91,328 |
|
|
Property, plant and equipment: |
|
|
|
|
|
|
|
|
Mineral reserves and land |
|
|
20,196 |
|
|
20,030 |
|
|
Proved natural gas properties, successful-efforts method |
|
|
18,398 |
|
|
18,384 |
|
|
Buildings and building and leasehold improvements |
|
|
5,523 |
|
|
5,466 |
|
|
Machinery and equipment |
|
|
222,812 |
|
|
214,194 |
|
|
Furniture and fixtures |
|
|
961 |
|
|
887 |
|
|
Automotive equipment |
|
|
3,796 |
|
|
3,501 |
|
|
Property, plant and equipment |
|
|
271,686 |
|
|
262,462 |
|
|
Less accumulated depreciation and depletion |
|
|
(167,308) |
|
|
(153,949) |
|
|
Property, plant and equipment, net |
|
|
104,378 |
|
|
108,513 |
|
|
Other assets, net |
|
|
160 |
|
|
145 |
|
|
Total assets |
|
$ |
196,499 |
|
$ |
199,986 |
|
|
LIABILITES AND STOCKHOLDERS’ EQUITY |
|
|
|
|
|
|
|
|
Current liabilities: |
|
|
|
|
|
|
|
|
Current installments of debt |
|
$ |
— |
|
$ |
16,667 |
|
|
Accounts payable |
|
|
6,022 |
|
|
5,166 |
|
|
Accrued expenses |
|
|
2,720 |
|
|
3,132 |
|
|
Total current liabilities |
|
|
8,742 |
|
|
24,965 |
|
|
Debt, excluding current installments |
|
|
— |
|
|
— |
|
|
Deferred tax liabilities, net |
|
|
19,184 |
|
|
18,825 |
|
|
Other liabilities |
|
|
1,946 |
|
|
1,505 |
|
|
Total liabilities |
|
|
29,872 |
|
|
45,295 |
|
|
Commitments and contingencies |
|
|
|
|
|
|
|
|
Stockholders’ equity: |
|
|
|
|
|
|
|
|
Preferred stock, $5.00 par value; authorized 500,000 shares; none issued or outstanding |
|
|
— |
|
|
— |
|
|
Common stock, $0.10 par value; authorized 15,000,000 shares; 6,541,049 and 6,499,403 shares issued at December 31, 2015 and 2014, respectively |
|
|
655 |
|
|
652 |
|
|
Additional paid-in capital |
|
|
21,642 |
|
|
20,418 |
|
|
Accumulated other comprehensive loss |
|
|
— |
|
|
(1,024) |
|
|
Retained earnings |
|
|
194,798 |
|
|
184,710 |
|
|
Less treasury stock, at cost, 935,368 and 928,469 shares at December 31, 2015 and 2014, respectively |
|
|
(50,468) |
|
|
(50,065) |
|
|
Total stockholders’ equity |
|
|
166,627 |
|
|
154,691 |
|
|
Total liabilities and stockholders’ equity |
|
$ |
196,499 |
|
$ |
199,986 |
|
The accompanying notes are an integral part of these consolidated financial statements.
34
United States Lime & Minerals, Inc.
Consolidated Statements of Income
(dollars in thousands, except per share amounts)
|
|
|
Years Ended December 31, |
|
|||||||
|
|
|
2015 |
|
2014 |
|
2013 |
|
|||
|
Revenues |
|
|
|
|
|
|
|
|
|
|
|
Lime and limestone operations |
|
$ |
128,390 |
|
$ |
144,567 |
|
$ |
128,003 |
|
|
Natural gas interests |
|
|
2,447 |
|
|
5,274 |
|
|
5,762 |
|
|
|
|
|
130,837 |
|
|
149,841 |
|
|
133,765 |
|
|
Cost of revenues: |
|
|
|
|
|
|
|
|
|
|
|
Labor and other operating expenses |
|
|
|
|
|
|
|
|
|
|
|
Lime and limestone operations |
|
|
85,080 |
|
|
96,798 |
|
|
86,754 |
|
|
Natural gas interests |
|
|
1,259 |
|
|
1,546 |
|
|
1,920 |
|
|
Depreciation, depletion and amortization |
|
|
15,784 |
|
|
14,706 |
|
|
14,291 |
|
|
|
|
|
102,123 |
|
|
113,050 |
|
|
102,965 |
|
|
Gross profit |
|
|
28,714 |
|
|
36,791 |
|
|
30,800 |
|
|
Selling, general and administrative expenses, including depreciation and amortization expense of $249, $197 and $207 in 2015, 2014 and 2013, respectively |
|
|
9,628 |
|
|
9,469 |
|
|
9,149 |
|
|
Operating profit |
|
|
19,086 |
|
|
27,322 |
|
|
21,651 |
|
|
Other expense (income): |
|
|
|
|
|
|
|
|
|
|
|
Interest expense |
|
|
1,036 |
|
|
1,529 |
|
|
1,852 |
|
|
Other expense (income), net |
|
|
569 |
|
|
(129) |
|
|
(34) |
|
|
|
|
|
1,605 |
|
|
1,400 |
|
|
1,818 |
|
|
Income before income taxes |
|
|
17,481 |
|
|
25,922 |
|
|
19,833 |
|
|
Income tax expense |
|
|
4,595 |
|
|
6,555 |
|
|
5,033 |
|
|
Net income |
|
$ |
12,886 |
|
$ |
19,367 |
|
$ |
14,800 |
|
|
Net income per share of common stock: |
|
|
|
|
|
|
|
|
|
|
|
Basic |
|
$ |
2.30 |
|
$ |
3.47 |
|
$ |
2.66 |
|
|
Diluted |
|
$ |
2.30 |
|
$ |
3.47 |
|
$ |
2.66 |
|
|
Cash dividends per share of common stock |
|
$ |
0.50 |
|
$ |
0.50 |
|
$ |
— |
|
The accompanying notes are an integral part of these consolidated financial statements.
35
United States Lime & Minerals, Inc.
Consolidated Statements of Comprehensive Income
(dollars in thousands)
|
|
|
Years Ended December 31, |
|
|||||||
|
|
|
2015 |
|
2014 |
|
2013 |
|
|||
|
Net income |
|
$ |
12,886 |
|
$ |
19,367 |
|
$ |
14,800 |
|
|
Other comprehensive income |
|
|
|
|
|
|
|
|
|
|
|
Mark to market of interest rate hedges, net of tax expense of $241, $317 and $398 for 2015, 2014 and 2013, respectively |
|
|
422 |
|
|
555 |
|
|
697 |
|
|
Minimum pension liability adjustments, net of tax expense (benefit) of $344, $(46) and $112 for 2015, 2014 and 2013, respectively |
|
|
602 |
|
|
(81) |
|
|
197 |
|
|
Total other comprehensive income |
|
|
1,024 |
|
|
474 |
|
|
894 |
|
|
Comprehensive income |
|
$ |
13,910 |
|
$ |
19,841 |
|
$ |
15,694 |
|
The accompanying notes are an integral part of these consolidated financial statements.
36
United States Lime & Minerals, Inc.
Consolidated Statements of Stockholders’ Equity
(dollars in thousands)
|
|
|
|
|
|
|
|
|
|
|
Accumulated |
|
|
|
|
|
|
|
|
|
|
|
|
|
|
Common Stock |
|
Additional |
|
Other |
|
|
|
|
|
|
|
|
|
|
|||||
|
|
|
Shares |
|
|
|
|
Paid-In |
|
Comprehensive |
|
Retained |
|
Treasury |
|
|
|
|
||||
|
|
|
Outstanding |
|
Amount |
|
Capital |
|
(Loss) Income |
|
Earnings |
|
Stock |
|
Total |
|
||||||
|
Balances at December 31, 2012 |
|
5,558,008 |
|
$ |
648 |
|
$ |
18,353 |
|
$ |
(2,392) |
|
$ |
153,333 |
|
$ |
(49,587) |
|
$ |
120,355 |
|
|
Stock options exercised |
|
5,262 |
|
|
1 |
|
|
33 |
|
|
— |
|
|
— |
|
|
— |
|
|
34 |
|
|
Stock-based compensation |
|
16,425 |
|
|
1 |
|
|
933 |
|
|
— |
|
|
— |
|
|
— |
|
|
934 |
|
|
Treasury shares purchased |
|
(4,563) |
|
|
— |
|
|
— |
|
|
— |
|
|
— |
|
|
(212) |
|
|
(212) |
|
|
Net income |
|
— |
|
|
— |
|
|
— |
|
|
— |
|
|
14,800 |
|
|
— |
|
|
14,800 |
|
|
Minimum pension liability adjustment, net of $112 tax expense |
|
— |
|
|
— |
|
|
— |
|
|
197 |
|
|
— |
|
|
— |
|
|
197 |
|
|
Mark to market of interest rate hedges, net of $398 tax expense |
|
— |
|
|
— |
|
|
— |
|
|
697 |
|
|
— |
|
|
— |
|
|
697 |
|
|
Comprehensive income |
|
— |
|
|
— |
|
|
— |
|
|
894 |
|
|
14,800 |
|
|
— |
|
|
15,694 |
|
|
Balances at December 31, 2013 |
|
5,575,132 |
|
|
650 |
|
|
19,319 |
|
|
(1,498) |
|
|
168,133 |
|
|
(49,799) |
|
|
136,805 |
|
|
Stock options exercised |
|
9,117 |
|
|
— |
|
|
(1) |
|
|
— |
|
|
— |
|
|
— |
|
|
(1) |
|
|
Stock-based compensation |
|
15,268 |
|
|
2 |
|
|
1,100 |
|
|
— |
|
|
— |
|
|
— |
|
|
1,102 |
|
|
Treasury shares purchased |
|
(4,198) |
|
|
— |
|
|
— |
|
|
— |
|
|
— |
|
|
(266) |
|
|
(266) |
|
|
Cash dividends paid |
|
— |
|
|
— |
|
|
— |
|
|
— |
|
|
(2,790) |
|
|
— |
|
|
(2,790) |
|
|
Net income |
|
— |
|
|
— |
|
|
— |
|
|
— |
|
|
19,367 |
|
|
— |
|
|
19,367 |
|
|
Minimum pension liability adjustment, net of $46 tax benefit |
|
— |
|
|
— |
|
|
— |
|
|
(81) |
|
|
— |
|
|
— |
|
|
(81) |
|
|
Mark to market of interest rate hedges, net of $317 tax expense |
|
— |
|
|
— |
|
|
— |
|
|
555 |
|
|
— |
|
|
— |
|
|
555 |
|
|
Comprehensive income |
|
— |
|
|
— |
|
|
— |
|
|
474 |
|
|
19,367 |
|
|
— |
|
|
19,841 |
|
|
Balances at December 31, 2014 |
|
5,595,319 |
|
|
652 |
|
|
20,418 |
|
|
(1,024) |
|
|
184,710 |
|
|
(50,065) |
|
|
154,691 |
|
|
Stock options exercised |
|
1,000 |
|
|
0 |
|
|
28 |
|
|
— |
|
|
— |
|
|
— |
|
|
28 |
|
|
Stock-based compensation |
|
16,261 |
|
|
3 |
|
|
1,196 |
|
|
— |
|
|
— |
|
|
— |
|
|
1,199 |
|
|
Treasury shares purchased |
|
(6,899) |
|
|
— |
|
|
— |
|
|
— |
|
|
— |
|
|
(403) |
|
|
(403) |
|
|
Cash dividends paid |
|
— |
|
|
— |
|
|
— |
|
|
— |
|
|
(2,798) |
|
|
— |
|
|
(2,798) |
|
|
Net income |
|
— |
|
|
— |
|
|
— |
|
|
— |
|
|
12,886 |
|
|
— |
|
|
12,886 |
|
|
Minimum pension liability adjustment, net of $344 tax expense |
|
— |
|
|
— |
|
|
— |
|
|
602 |
|
|
— |
|
|
— |
|
|
602 |
|
|
Mark to market of interest rate hedges, net of $241 tax expense |
|
— |
|
|
— |
|
|
— |
|
|
422 |
|
|
— |
|
|
— |
|
|
422 |
|
|
Comprehensive income |
|
— |
|
|
— |
|
|
— |
|
|
1,024 |
|
|
12,886 |
|
|
— |
|
|
13,910 |
|
|
Balances at December 31, 2015 |
|
5,605,681 |
|
$ |
655 |
|
$ |
21,642 |
|
$ |
— |
|
$ |
194,798 |
|
$ |
(50,468) |
|
$ |
166,627 |
|
The accompanying notes are an integral part of these consolidated financial statements.
37
United States Lime & Minerals, Inc.
Consolidated Statements of Cash Flows
(dollars in thousands)
|
|
|
Years Ended December 31, |
|
|||||||
|
|
|
2015 |
|
2014 |
|
2013 |
|
|||
|
OPERATING ACTIVITIES: |
|
|
|
|
|
|
|
|
|
|
|
Net income |
|
$ |
12,886 |
|
$ |
19,367 |
|
$ |
14,800 |
|
|
Adjustments to reconcile net income to net cash provided by operating activities: |
|
|
|
|
|
|
|
|
|
|
|
Depreciation, depletion and amortization |
|
|
16,033 |
|
|
14,903 |
|
|
14,498 |
|
|
Amortization of deferred financing costs |
|
|
29 |
|
|
34 |
|
|
46 |
|
|
Deferred income taxes |
|
|
(227) |
|
|
1,059 |
|
|
1,793 |
|
|
Loss on sale of property, plant and equipment |
|
|
39 |
|
|
78 |
|
|
86 |
|
|
Stock-based compensation |
|
|
1,199 |
|
|
1,102 |
|
|
934 |
|
|
Changes in operating assets and liabilities: |
|
|
|
|
|
|
|
|
|
|
|
Trade receivables, net |
|
|
1,555 |
|
|
(3,347) |
|
|
455 |
|
|
Inventories, net |
|
|
(1,292) |
|
|
252 |
|
|
439 |
|
|
Prepaid expenses and other current assets |
|
|
698 |
|
|
(882) |
|
|
(249) |
|
|
Other assets |
|
|
(47) |
|
|
16 |
|
|
4 |
|
|
Accounts payable and accrued expenses |
|
|
198 |
|
|
(952) |
|
|
637 |
|
|
Other liabilities |
|
|
1,423 |
|
|
344 |
|
|
89 |
|
|
Net cash provided by operating activities |
|
|
32,494 |
|
|
31,974 |
|
|
33,532 |
|
|
INVESTING ACTIVITIES: |
|
|
|
|
|
|
|
|
|
|
|
Purchase of property, plant and equipment |
|
|
(11,459) |
|
|
(11,672) |
|
|
(8,921) |
|
|
Acquisition of assets of a business |
|
|
(50) |
|
|
(3,705) |
|
|
— |
|
|
Proceeds from sale of property, plant and equipment |
|
|
449 |
|
|
316 |
|
|
255 |
|
|
Net cash used in investing activities |
|
|
(11,060) |
|
|
(15,061) |
|
|
(8,666) |
|
|
FINANCING ACTIVITIES: |
|
|
|
|
|
|
|
|
|
|
|
Repayments of term loans |
|
|
(16,667) |
|
|
(5,000) |
|
|
(5,000) |
|
|
Cash dividends paid |
|
|
(2,798) |
|
|
(2,790) |
|
|
— |
|
|
Proceeds from exercise of stock options |
|
|
28 |
|
|
— |
|
|
34 |
|
|
Purchase of treasury shares |
|
|
(403) |
|
|
(266) |
|
|
(212) |
|
|
Net cash used in financing activities |
|
|
(19,840) |
|
|
(8,056) |
|
|
(5,178) |
|
|
Net increase in cash and cash equivalents |
|
|
1,594 |
|
|
8,857 |
|
|
19,688 |
|
|
Cash and cash equivalents at beginning of year |
|
|
58,332 |
|
|
49,475 |
|
|
29,787 |
|
|
Cash and cash equivalents at end of year |
|
$ |
59,926 |
|
$ |
58,332 |
|
$ |
49,475 |
|
The accompanying notes are an integral part of these consolidated financial statements.
38
United States Lime & Minerals, Inc.
Notes to Consolidated Financial Statements
(dollars in thousands, except per share amounts)
Years Ended December 31, 2015, 2014 and 2013
(1) Summary of Significant Accounting Policies
(a) Organization
United States Lime & Minerals, Inc. (the “Company”) is a manufacturer of lime and limestone products, supplying primarily the construction (including highway, road and building contractors), environmental (including municipal sanitation and water treatment facilities and flue gas treatment processes), industrial (including paper and glass manufacturers), metals (including steel producers), roof shingle, oil and gas services and agriculture (including poultry and cattle feed producers) industries. The Company is headquartered in Dallas, Texas and operates lime and limestone plants and distribution facilities in Arkansas, Colorado, Louisiana, Oklahoma and Texas through its wholly owned subsidiaries, Arkansas Lime Company, Colorado Lime Company, Texas Lime Company, U.S. Lime Company, U.S. Lime Company – Shreveport, U.S. Lime Company – St. Clair and U.S. Lime Company – Transportation. In addition, the Company, through its wholly owned subsidiary, U.S. Lime Company - O & G, LLC, has royalty and non‑operating working interests in natural gas wells located in Johnson County, Texas, in the Barnett Shale Formation.
(b) Principles of Consolidation
The consolidated financial statements include the accounts of the Company and its subsidiaries. All intercompany balances and transactions have been eliminated.
(c) Use of Estimates
The preparation of financial statements in conformity with accounting principles generally accepted in the United States of America (“US GAAP”) requires management to make estimates and judgments that affect the amounts reported in the financial statements and accompanying notes. Actual results could differ from those estimates and judgments.
(d) Statements of Cash Flows
For purposes of reporting cash flows, the Company considers all certificates of deposit and highly‑liquid debt instruments, such as U.S. Treasury bills and notes, with maturities, at the time of purchase, of three months or less to be cash equivalents. Cash equivalents are carried at cost plus accrued interest, which approximates fair market value. Supplemental cash flow information is presented below:
|
|
|
Years Ended December 31, |
|
|||||||
|
|
|
2015 |
|
2014 |
|
2013 |
|
|||
|
Cash paid during the year for: |
|
|
|
|
|
|
|
|
|
|
|
Interest |
|
$ |
948 |
|
$ |
1,495 |
|
$ |
1,746 |
|
|
Income taxes |
|
$ |
4,152 |
|
$ |
5,870 |
|
$ |
3,750 |
|
(e) Revenue Recognition
The Company recognizes revenue for its lime and limestone operations in accordance with the terms of its purchase orders, contracts or purchase agreements, which are generally upon shipment, and when payment is considered probable. Revenues include external freight billed to customers with related costs in cost of revenues. The Company’s returns and allowances are minimal. External freight billed to customers included in revenues was $23,219, $27,055 and $25,536 for 2015, 2014 and 2013, respectively, which approximates the
39
United States Lime & Minerals, Inc.
Notes to Consolidated Financial Statements (Continued)
(dollars in thousands, except per share amounts)
Years Ended December 31, 2015, 2014 and 2013
amount of external freight billed to customers included in cost of revenues. Sales taxes billed to customers are not included in revenues. For its natural gas interests, the Company recognizes revenue in the month of production and delivery.
(f) Fair Values of Financial Instruments
Fair value is defined as “the price that would be received to sell an asset or paid to transfer a liability in an orderly transaction between market participants at the measurement date.” The Company uses a three‑tier fair value hierarchy, which classifies the inputs used in measuring fair values, in determining the fair value of its financial assets and liabilities. These tiers include: Level 1, defined as observable inputs such as quoted prices for identical instruments in active markets; Level 2, defined as observable inputs other than Level 1 prices such as quoted prices for similar assets or liabilities, quoted prices in markets that are not active, or other inputs that are observable or can be corroborated by observable market data for substantially the full term of the assets or liabilities; and Level 3, defined as unobservable inputs in which little or no market data exists, therefore requiring an entity to develop its own assumptions. Specific inputs that had been used to value the Company’s interest rate swap liabilities included quoted three-month LIBOR rates for the remaining life of the interest rate swaps. There were no changes in the methods and assumptions used in measuring fair value during the period.
The carrying values of cash and cash equivalents, trade receivables, other current assets, accounts payable and accrued expenses approximate fair value due to the short maturity of these instruments. Prior to their repurchase, the Company’s interest rate hedges were carried at fair value at December 31, 2014. See Notes 1(p), 3 and 4. Financial liabilities measured at fair value on a recurring basis are summarized below:
|
|
|
Fair Value Measurements as of December 31, |
|
|
|
||||||||||
|
|
|
|
|
|
|
|
|
Significant Other |
|
|
|
||||
|
|
|
|
|
|
|
|
|
Observable Inputs |
|
|
|
||||
|
|
|
|
|
|
|
|
|
(Level 2) |
|
|
|
||||
|
|
|
December 31, |
|
December 31, |
|
December 31, |
|
December 31, |
|
|
|
||||
|
|
|
2015 |
|
2014 |
|
2015 |
|
2014 |
|
Valuation Technique |
|
||||
|
Interest rate swap liabilities |
|
$ |
— |
|
$ |
(661) |
|
$ |
— |
|
$ |
(661) |
|
Cash flows approach |
|
(g) Concentration of Credit Risk and Trade Receivables
Financial instruments that potentially subject the Company to a concentration of credit risk consist principally of cash and cash equivalents, trade receivables and derivative financial instruments. The Company places its cash and cash equivalents with high credit quality financial institutions and its derivative financial instruments with financial institutions and other firms that management believes have high credit ratings. The Company’s cash and cash equivalents at commercial banking institutions normally exceed federally insured limits. For a discussion of the credit risks associated with the Company’s derivative financial instruments, see Note 3.
The majority of the Company’s trade receivables are unsecured. Payment terms for all trade receivables are based on the underlying purchase orders, contracts or purchase agreements. Credit losses relating to trade receivables have generally been within management expectations and historical trends. Uncollected trade receivables are charged‑off when identified by management to be unrecoverable. Trade receivables are presented net of the related allowance for doubtful accounts, which totaled $400 and $350 at December 31,
40
United States Lime & Minerals, Inc.
Notes to Consolidated Financial Statements (Continued)
(dollars in thousands, except per share amounts)
Years Ended December 31, 2015, 2014 and 2013
2015 and 2014, respectively. Additions and write‑offs to the Company’s allowance for doubtful accounts during the years ended December 31 are as follows:
|
|
|
2015 |
|
2014 |
|
||
|
Beginning balance |
|
$ |
350 |
|
$ |
238 |
|
|
Additions |
|
|
63 |
|
|
148 |
|
|
Write-offs |
|
|
(13) |
|
|
(36) |
|
|
Ending balance |
|
$ |
400 |
|
$ |
350 |
|
(h) Inventories, Net
Inventories are valued principally at the lower of cost, determined using the average cost method, or market. Costs for raw materials and finished goods include materials, labor and production overhead. A summary of inventories is as follows:
|
|
|
December 31, |
|
December 31, |
|
||
|
|
|
2015 |
|
2014 |
|
||
|
Lime and limestone inventories: |
|
|
|
|
|
|
|
|
Raw materials |
|
$ |
6,627 |
|
$ |
5,693 |
|
|
Finished goods |
|
|
2,049 |
|
|
2,283 |
|
|
|
|
$ |
8,676 |
|
$ |
7,976 |
|
|
Service parts inventories |
|
|
6,052 |
|
|
5,460 |
|
|
|
|
$ |
14,728 |
|
$ |
13,436 |
|
(i) Property, Plant and Equipment
For major constructed assets, the capitalized cost includes the price paid by the Company for labor and materials plus interest and internal and external project management costs that are directly related to the constructed assets. Machinery and equipment at December 31, 2015 and 2014 included $4,113 and $3,157, respectively, of construction in progress for various capital projects. No interest costs were capitalized for the years ended December 31, 2015 and 2014. Depreciation of property, plant and equipment is being provided for by the straight‑line method over estimated useful lives as follows:
|
Buildings and building and leasehold improvements |
|
3 |
- |
20 |
years |
|
|
Machinery and equipment |
|
2 |
- |
20 |
years |
|
|
Furniture and fixtures |
|
3 |
- |
10 |
years |
|
|
Automotive equipment |
|
3 |
- |
10 |
years |
|
Maintenance and repairs are charged to expense as incurred; renewals and betterments are capitalized. When units of property are retired or otherwise disposed of, their cost and related accumulated depreciation are removed from the accounts, and any resulting gain or loss is credited or charged to income.
The Company expenses all exploration costs as incurred as well as costs incurred at an operating quarry or mine, other than capital expenditures and inventory. Costs to acquire mineral reserves or mineral interests are capitalized upon acquisition. Development costs incurred to develop new mineral reserves, to expand the capacity of a quarry or mine, or to develop quarry or mine areas substantially in advance of current production are capitalized once proven and probable reserves exist and can be economically produced. For each quarry or mine, capitalized costs to acquire and develop mineral reserves are depleted using the units‑of‑production method based on the proven and probable reserves for such quarry or mine.
41
United States Lime & Minerals, Inc.
Notes to Consolidated Financial Statements (Continued)
(dollars in thousands, except per share amounts)
Years Ended December 31, 2015, 2014 and 2013
The Company reviews its long‑lived assets for impairment and, when events or circumstances indicate the carrying amount of an asset may not be recoverable, the Company determines if impairment of value exists. If the estimated undiscounted future net cash flows are less than the carrying amount of the asset, an impairment exists, and an impairment loss must be calculated and recorded. If an impairment exists, the impairment loss is calculated based on the excess of the carrying amount of the asset over the asset’s fair value. Any impairment loss is treated as a permanent reduction in the carrying value of the asset. Through December 31, 2015, no events or circumstances arose that would require the Company to record a provision for impairment of its long‑lived assets.
(j) Successful‑Efforts Method Used for Natural Gas Interests
The Company uses the successful‑efforts method to account for oil and gas exploration and development expenditures. Under this method, drilling, completion and workover costs for successful exploratory wells and all development well costs are capitalized and depleted using the units‑of‑production method. Costs to drill exploratory wells that do not find proved reserves are expensed.
(k) Asset Retirement Obligations
The Company recognizes legal obligations for reclamation and remediation associated with the retirement of long‑lived assets at their fair value at the time the obligations are incurred (“AROs”). Over time, the liability for AROs is recorded at its present value each period through accretion expense, and the capitalized cost is depreciated over the useful life of the related asset. Upon settlement of the liability, the Company either settles the AROs for the recorded amount or recognizes a gain or loss. As of December 31, 2015 and 2014, the Company’s AROs included in other liabilities and accrued expenses were $2,058 and $1,261, respectively. As of December 31, 2015, $1,041 of assets associated with the Company’s AROs are not fully depreciated. During 2015 and 2014, the Company spent $140 and $113 on its AROs and recognized accretion expense of $60, $57 and $61 in 2015, 2014 and 2013, respectively, on its AROs.
The AROs were estimated based on studies and the Company’s process knowledge and estimates, and are discounted using a credit adjusted risk-free interest rate. The AROs are adjusted when further information warrants an adjustment. The Company estimates annual expenditures of approximately $100 to $200 each in years 2016 through 2020 relating to its AROs.
(l) Other Assets
Other assets consist of the following:
|
|
|
December 31, |
|
||||
|
|
|
2015 |
|
2014 |
|
||
|
Deferred financing costs |
|
$ |
63 |
|
$ |
45 |
|
|
Other |
|
|
97 |
|
|
100 |
|
|
|
|
$ |
160 |
|
$ |
145 |
|
(m) Environmental Expenditures
Environmental expenditures that relate to current operations are expensed or capitalized as appropriate. Expenditures that relate to an existing condition caused by past operations, and which do not contribute to current or future revenue generation, are expensed. Liabilities are recorded at their present value when environmental assessments and/or remedial efforts are probable and the costs can be reasonably estimated.
42
United States Lime & Minerals, Inc.
Notes to Consolidated Financial Statements (Continued)
(dollars in thousands, except per share amounts)
Years Ended December 31, 2015, 2014 and 2013
Generally, the timing of these accruals will coincide with completion of a feasibility study or the Company’s commitment to a formal plan of action.
The Company incurred capital expenditures related to environmental matters of approximately $455 in 2015, $1,038 in 2014 and $395 in 2013.
(n) Income Per Share of Common Stock
The following table sets forth the computation of basic and diluted income per common share:
|
|
|
Years Ended December 31, |
|
|||||||
|
|
|
2015 |
|
2014 |
|
2013 |
|
|||
|
Net income for basic and diluted income per common share |
|
$ |
12,886 |
|
$ |
19,367 |
|
$ |
14,800 |
|
|
Weighted-average shares for basic income per common share |
|
|
5,598,805 |
|
|
5,578,784 |
|
|
5,561,429 |
|
|
Effect of dilutive securities: |
|
|
|
|
|
|
|
|
|
|
|
Employee and director stock options(1) |
|
|
5,423 |
|
|
10,459 |
|
|
9,850 |
|
|
Adjusted weighted-average shares and assumed exercises for diluted income per common share |
|
|
5,604,228 |
|
|
5,589,243 |
|
|
5,571,279 |
|
|
Basic net income per common share |
|
$ |
2.30 |
|
$ |
3.47 |
|
$ |
2.66 |
|
|
Diluted net income per common share |
|
$ |
2.30 |
|
$ |
3.47 |
|
$ |
2.66 |
|
|
(1) |
Excludes 24,225, 7,500 and 15,000 stock options in 2015, 2014 and 2013, respectively, as antidilutive because the exercise price exceeded the average per share market price for the periods presented. |
(o) Stock‑Based Compensation
The Company expenses all stock‑based payments to employees and directors, including grants of stock options and restricted stock, in the Company’s Consolidated Statements of Income based on their fair values. Compensation cost is recognized on a straight-line basis over the vesting period.
(p) Derivative Instruments and Hedging Activities
Every derivative instrument (including certain derivative instruments embedded in other contracts) was recorded on the Company’s Consolidated Balance Sheets as either an asset or liability measured at its fair value. Changes in the derivative’s fair value were recognized currently in earnings unless specific hedge accounting criteria were met. If the derivative was designated as a cash flow hedge, changes in fair value were recognized in comprehensive income until the hedged item was recognized in earnings. The Company estimated fair value utilizing the cash flows valuation technique. The fair values of derivative contracts that expired in less than one year were recognized as current assets or liabilities. Those that expired in more than one year were recognized as long-term assets or liabilities. See Notes 1(f), 3 and 4.
(q) Income Taxes
The Company utilizes the asset and liability approach in its reporting for income taxes. Deferred income tax assets and liabilities are computed for differences between the financial statement and tax bases of assets and liabilities that will result in taxable or deductible amounts in the future based on enacted tax laws and rates applicable to the periods in which the differences are expected to affect taxable income. Valuation allowances
43
United States Lime & Minerals, Inc.
Notes to Consolidated Financial Statements (Continued)
(dollars in thousands, except per share amounts)
Years Ended December 31, 2015, 2014 and 2013
are established when necessary to reduce deferred tax assets to the amount more likely than not to be realized. Income tax related interest and penalties are included in income tax expense.
The Company also assesses individual tax positions to determine if they meet the criteria for some or all of the benefits of that position to be recognized in the Company’s financial statements. The Company only recognizes tax positions that meet the more‑likely‑than‑not recognition threshold.
(r) Comprehensive Income
Accounting principles generally require that recognized revenue, expenses, gains and losses be included in net income. Certain changes in assets and liabilities, such as mark‑to‑market gains or losses of interest rate hedges and minimum pension liability adjustments, are reported as a separate component of the stockholders’ equity section of the balance sheet. Such items, along with net income, are components of comprehensive income. See Notes 1(p), 3, 4 and 6.
(2) New Accounting Pronouncements
In May 2014, the Financial Accounting Standards Board (the “FASB”) issued Accounting Standards Update No. 2014-09 (“ASU 2014-09”), “Revenue from Contracts with Customers,” which stipulates that an entity should recognize revenue to depict the transfer of promised goods or services to customers in an amount that reflects the consideration to which the entity expects to be entitled in exchange for those goods or services. To achieve this core principle, an entity should apply the following steps: (1) identify the contract(s) with a customer; (2) identify the performance obligations in the contract(s); (3) determine the transaction price; (4) allocate the transaction price to the performance obligations in the contract(s); and (5) recognize revenue when (or as) the entity satisfies a performance obligation. The new guidance will be effective for the Company beginning January 1, 2018, with early adoption permitted for annual periods beginning after December 15, 2016. The Company is currently evaluating the impact of the adoption of ASU 2014-09 on the Company’s Consolidated Financial Statements.
In August 2014, the FASB issued Accounting Standards Update No. 2014-15 (“ASU 2014-15”), “Disclosure of Uncertainties About an Entity’s Ability to Continue as a Going Concern.” ASU 2014-15 requires management to perform interim and annual assessments of an entity’s ability to continue as a going concern for a period of one year after the date the financial statements are issued and provides guidance on determining when and how to disclose going concern uncertainties in the financial statements. Certain disclosures will be required if conditions give rise to substantial doubt about an entity’s ability to continue as a going concern. ASU 2014-15 applies to all entities and is effective for the Company beginning January 1, 2017, with early adoption permitted. The Company does not expect that the adoption of this standard will have a material effect on the Company’s Consolidated Financial Statements.
In August 2015, the FASB issued Accounting Standards Update No. 2015-17 (“ASU 2015-17”), “Balance Sheet Classification of Deferred Taxes,” which no longer requires separate disclosure of current and noncurrent deferred income tax assets and liabilities. ASU 2015-17 is effective for fiscal years beginning after December 15, 2017, with early adoption permitted. Because the Company believes it simplifies the presentation of deferred income taxes, it adopted ASU 2015-17 retrospectively in 2015. As a result, $434 of current deferred tax assets that were included in prepaid expenses and other current assets at December 31, 2014 have been reclassified to deferred tax liabilities, net on the Company’s Consolidated Balance Sheets.
(3) Banking Facilities and Debt
On May 7, 2015, the Company amended its credit agreement with Wells Fargo Bank, N.A. (the “Lender”) to, among other things, provide for a $75,000 revolving credit facility (the “New Revolving Facility”) and reductions to
44
United States Lime & Minerals, Inc.
Notes to Consolidated Financial Statements (Continued)
(dollars in thousands, except per share amounts)
Years Ended December 31, 2015, 2014 and 2013
interest rate margins and commitment fees (the “Amendment”). The Amendment also provides for an incremental four-year accordion feature to borrow up to an additional $50,000 on the same terms, subject to approval by the Lender or another lender selected by the Company. The terms of the Amendment provide for a final maturity of the New Revolving Facility and any incremental loan on May 7, 2020; interest rates, at the Company’s option, of LIBOR plus a margin of 1.000% (previously 1.750%) to 2.000% (previously 2.750%), or the Lender’s Prime Rate plus a margin of 0.000% to plus 1.000%; and a commitment fee range of 0.200% (previously 0.250%) to 0.350% (previously 0.400%) on the undrawn portion of the New Revolving Facility. The New Revolving Facility interest rate margins and commitment fee are determined quarterly in accordance with a pricing grid based upon the Company’s Cash Flow Leverage Ratio, defined as the ratio of the Company’s total funded senior indebtedness to earnings before interest, taxes, depreciation, depletion, amortization and stock-based compensation expense (“EBITDA”) for the 12 months ended on the last day of the most recent calendar quarter, plus pro forma EBITDA from any businesses acquired during the period. Pursuant to a security agreement, dated August 25, 2004, the New Revolving Facility is secured by the Company’s existing and hereafter acquired tangible assets, intangible assets and real property. The maturity of the New Revolving Facility and any incremental loans can be accelerated if any event of default, as defined under the credit agreement, occurs. The Company’s maximum Cash Flow Leverage Ratio is 3.50 to 1 (previously 3.25 to 1).
At December 31, 2015, the Company had $710 of letters of credit issued, which count as draws against the available commitment under the New Revolving Facility.
The Company may pay dividends so long as it remains in compliance with the provisions of the Company’s credit agreement, and may purchase, redeem or otherwise acquire shares of its common stock so long as its pro forma Cash Flow Leverage Ratio is less than 3.00 to 1.00 and no default or event of default exists or would exist after giving effect to such stock repurchase.
Prior to the Amendment, the Company’s credit agreement included a ten‑year $40,000 term loan (the “Term Loan”), a ten‑year $20,000 multiple draw term loan (the “Draw Term Loan”) and a $30,000 revolving credit facility (the “Revolving Facility”) (collectively, the “Credit Facilities”). The Term Loan required quarterly principal payments of $833, with a final principal payment of $7,500 due on December 31, 2015. The Draw Term Loan required quarterly principal payments of $417, with a final principal payment of $5,400 due on December 31, 2015. The Revolving Facility was scheduled to mature on June 1, 2015. The maturity of the Term Loan, the Draw Term Loan and the Revolving Facility could have been accelerated if any event of default, as defined under the Credit Facilities, occurs.
The Company had interest rate hedges, with the Lender as the counterparty to the hedges that fixed LIBOR through maturity at 4.695%, 4.875% and 5.500% on the outstanding balance of the Term Loan, 75% of the outstanding balance of the Draw Term Loan and 25% of the outstanding balance of the Draw Term Loan, respectively. Based on the current LIBOR margin of 1.750% prior to the Amendment, the Company’s interest rates had been: 6.445% on the outstanding balance of the Term Loan; 6.625% on 75% of the outstanding balance of the Draw Term Loan; and 7.250% on 25% of the outstanding balance of the Draw Term Loan.
The hedges had been effective as defined under applicable accounting rules. Therefore, changes in fair value of the interest rate hedges were reflected in comprehensive income. The Company would have been exposed to credit losses in the event of non‑performance by the counterparty to the hedges. Due to interest rate declines, the Company’s mark to market of its interest rate hedges, at December 31, 2014, resulted in liability of $661, which was included in accrued expenses on the Company’s Consolidated Balance Sheets. The Company paid $191 and $920 in aggregate quarterly settlement payments pursuant to the hedges in 2015 and 2014, respectively. These payments were included in interest expense in the Company’s Consolidated Statements of Income.
45
United States Lime & Minerals, Inc.
Notes to Consolidated Financial Statements (Continued)
(dollars in thousands, except per share amounts)
Years Ended December 31, 2015, 2014 and 2013
On May 7, 2015, the Company paid off the $15,400 balance then outstanding on the Term Loan and Draw Term Loan, as well as paid $500 to repurchase the related hedges, from cash on hand. The cost to repurchase the hedges was included in interest expense.
A summary of outstanding debt at the dates indicated is as follows:
|
|
|
December 31, |
|
December 31, |
|
||
|
|
|
2015 |
|
2014 |
|
||
|
Term Loan |
|
$ |
— |
|
$ |
10,000 |
|
|
Draw Term Loan |
|
|
— |
|
|
6,667 |
|
|
Revolving Facility(1) |
|
|
— |
|
|
— |
|
|
Subtotal |
|
|
— |
|
|
16,667 |
|
|
Less current installments |
|
|
— |
|
|
16,667 |
|
|
Debt, excluding current installments |
|
$ |
— |
|
$ |
— |
|
|
(1) |
The Company had letters of credit totaling $710 issued under the New Revolving Facility at December 31, 2015. |
As the Company’s debt bore interest at floating rates, the Company estimates that the carrying values of its debt at December 31, 2014 approximated fair value.
(4) Accumulated Other Comprehensive Loss
The components of comprehensive income for the years ended December 31 are as follows:
|
|
|
2015 |
|
2014 |
|
2013 |
|
|||
|
Net income |
|
$ |
12,886 |
|
$ |
19,367 |
|
$ |
14,800 |
|
|
Minimum pension liability adjustments |
|
|
946 |
|
|
(127) |
|
|
309 |
|
|
Reclassification to interest expense |
|
|
678 |
|
|
921 |
|
|
1,141 |
|
|
Deferred income tax expense |
|
|
(585) |
|
|
(271) |
|
|
(510) |
|
|
Mark to market of interest rate hedges |
|
|
(15) |
|
|
(49) |
|
|
(46) |
|
|
Comprehensive income |
|
$ |
13,910 |
|
$ |
19,841 |
|
$ |
15,694 |
|
Amounts reclassified to interest expense were for payments made by the Company pursuant to the Company’s interest rate hedges.
Accumulated other comprehensive loss consists of the following:
|
|
|
December 31, |
|
|
|
December 31, |
|
|
|
|
2015 |
|
|
|
2014 |
|
|
Mark to market of interest rate hedges, net of tax benefit |
|
$ |
— |
|
$ |
(422) |
|
|
Minimum pension liability adjustments, net of tax benefit |
|
|
— |
|
|
(602) |
|
|
Accumulated other comprehensive loss |
|
$ |
— |
|
$ |
(1,024) |
|
46
United States Lime & Minerals, Inc.
Notes to Consolidated Financial Statements (Continued)
(dollars in thousands, except per share amounts)
Years Ended December 31, 2015, 2014 and 2013
(5) Income Taxes
Income tax expense for the years ended December 31 is as follows:
|
|
|
2015 |
|
2014 |
|
2013 |
|
|||
|
Current income tax expense |
|
$ |
4,822 |
|
$ |
5,282 |
|
$ |
3,240 |
|
|
Deferred income tax (benefit) expense |
|
|
(227) |
|
|
1,273 |
|
|
1,793 |
|
|
Income tax expense |
|
$ |
4,595 |
|
$ |
6,555 |
|
$ |
5,033 |
|
A reconciliation of income taxes computed at the federal statutory rate to income tax expense for the years ended December 31 is as follows:
|
|
|
2015 |
|
2014 |
|
2013 |
|
|
|||||||||
|
|
|
|
|
|
Percent of |
|
|
|
|
Percent of |
|
|
|
|
Percent of |
|
|
|
|
|
|
|
|
Pretax |
|
|
|
|
Pretax |
|
|
|
|
Pretax |
|
|
|
|
|
Amount |
|
Income |
|
Amount |
|
Income |
|
Amount |
|
Income |
|
|
|||
|
Income taxes computed at the federal statutory rate |
|
$ |
6,118 |
|
35.0 |
% |
$ |
9,073 |
|
35.0 |
% |
$ |
6,942 |
|
35.0 |
% |
|
|
(Reduction) increase in taxes resulting from: |
|
|
|
|
|
|
|
|
|
|
|
|
|
|
|
|
|
|
Statutory depletion in excess of cost depletion |
|
|
(1,708) |
|
(9.8) |
|
|
(2,139) |
|
(8.2) |
|
|
(1,965) |
|
(9.9) |
|
|
|
Manufacturing deduction |
|
|
(548) |
|
(3.1) |
|
|
(574) |
|
(2.2) |
|
|
(299) |
|
(1.5) |
|
|
|
State income taxes, net of federal income tax benefit |
|
|
309 |
|
1.8 |
|
|
104 |
|
0.4 |
|
|
132 |
|
0.7 |
|
|
|
Other |
|
|
424 |
|
2.4 |
|
|
91 |
|
0.3 |
|
|
223 |
|
1.1 |
|
|
|
Income tax expense |
|
$ |
4,595 |
|
26.3 |
% |
$ |
6,555 |
|
25.3 |
% |
$ |
5,033 |
|
25.4 |
% |
|
Generally, US GAAP requires deferred tax assets to be reduced by a valuation allowance if, based on the weight of available evidence, it is “more likely than not” that some portion or all of the deferred tax assets will not be realized. US GAAP requires an assessment of all available evidence, both positive and negative, to determine the amount of any required valuation allowance.
47
United States Lime & Minerals, Inc.
Notes to Consolidated Financial Statements (Continued)
(dollars in thousands, except per share amounts)
Years Ended December 31, 2015, 2014 and 2013
Components of the Company’s deferred tax liabilities and assets are as follows:
|
|
|
December 31, |
|
December 31, |
|
||
|
|
|
2015 |
|
2014 |
|
||
|
Deferred tax liabilities |
|||||||
|
Lime and limestone property, plant and equipment |
|
$ |
18,833 |
|
$ |
20,089 |
|
|
Natural gas interests drilling costs and equipment |
|
|
3,101 |
|
|
3,387 |
|
|
Other |
|
|
— |
|
|
292 |
|
|
|
|
|
21,934 |
|
|
23,768 |
|
|
Deferred tax assets |
|
|
|
|
|
|
|
|
Alternative minimum tax credit carry forwards |
|
|
2,259 |
|
|
3,887 |
|
|
Minimum pension liability |
|
|
— |
|
|
346 |
|
|
Fair value liability of interest rate hedges |
|
|
— |
|
|
240 |
|
|
Other |
|
|
491 |
|
|
470 |
|
|
|
|
|
2,750 |
|
|
4,943 |
|
|
Deferred tax liabilities, net |
|
$ |
19,184 |
|
$ |
18,825 |
|
Current income taxes are classified on the Company’s Consolidated Balance Sheets as follows:
|
Prepaid expenses and other current assets |
|
$ |
286 |
|
$ |
881 |
|
The Company had no federal net operating loss carry forwards at December 31, 2015. At December 31, 2015, the Company had determined that, because of its recent income history and expectations of income in the future, its deferred tax assets were fully realizable. The Company’s federal income tax returns for the year ended December 31, 2012 and subsequent years remain subject to examination. The Company’s income tax returns in certain state income tax jurisdictions remain subject to examination for various periods for the year ended December 31, 2012 and subsequent years. The Company treats interest and penalties on income tax liabilities as income tax expense.
(6) Employee Retirement Plans
During the second quarter 2015, after receipt of a favorable determination letter from the Internal Revenue Service, the Company terminated a noncontributory defined benefit plan that, prior to the termination, covered substantially all of the union employees previously employed by its wholly owned subsidiary, Corson Lime Company (the “Plan”). In 1997, the Company sold substantially all of the assets of Corson Lime Company, and all benefits for participants in the Plan were frozen. During 1997 and 1998, the Company made contributions to the Plan that were intended to fully fund the benefits earned by the participants. The unfunded projected benefit obligation was $0 and $275 at December 31, 2015 and 2014, respectively. The Company recorded comprehensive income of $602, net of $344 tax expense, and comprehensive expense of $81, net of $46 tax benefit, and comprehensive income of $197, net of $112 tax expense, for the years ended December 31, 2015, 2014 and 2013, respectively. The Company made contributions of $233, $0 and $0 to the Plan in 2015, 2014 and 2013, respectively. As a result of the termination, the Company will not be required to make any further contributions to the Plan.
In the first quarter 2014, the Company, based on the underfunded status of the Plan being only $10 at December 31, 2013, started the process of terminating the Plan, including requesting a determination letter from the Internal Revenue Service as to the qualified status of the Plan upon termination of the Plan. To that end, the administrative committee, consisting of management employees appointed by the Company’s Board of Directors, consulted with the investment advisor for the Plan and reallocated the Plan’s assets into stable assets consisting of cash and cash equivalents and short-term fixed income investments.
48
United States Lime & Minerals, Inc.
Notes to Consolidated Financial Statements (Continued)
(dollars in thousands, except per share amounts)
Years Ended December 31, 2015, 2014 and 2013
The following table sets forth the asset allocation at December 31 for the Plan:
|
|
|
2015 |
|
2014 |
|
|
|
Pooled fixed income funds |
|
— |
% |
42.1 |
% |
|
|
Cash and cash equivalents |
|
— |
|
57.9 |
|
|
|
|
|
— |
% |
100.0 |
% |
|
The fair values of the Plan assets at December 31 by asset category are as follows:
|
|
|
2015 |
|
2014 |
|
||
|
Pooled fixed income funds |
|
$ |
— |
|
$ |
785 |
|
|
Cash and cash equivalents |
|
|
— |
|
|
1,077 |
|
|
|
|
$ |
— |
|
$ |
1,862 |
|
All fair values of the Plan assets were determined by quoted prices on active markets for identical assets (Level 1).
The following table sets forth the funded status at December 31 of the Plan accrued pension benefit obligation:
|
|
|
2015 |
|
2014 |
|
||
|
Change in projected benefit obligation: |
|
|
|
|
|
|
|
|
Projected benefit obligation at beginning of year |
|
$ |
2,137 |
|
$ |
1,991 |
|
|
Interest cost |
|
|
44 |
|
|
87 |
|
|
Actuarial (gain) loss on plan assets |
|
|
(93) |
|
|
171 |
|
|
Benefits paid |
|
|
(2,088) |
|
|
(112) |
|
|
Projected benefit obligation at end of year |
|
$ |
— |
|
$ |
2,137 |
|
|
Change in plan assets: |
|
|
|
|
|
|
|
|
Fair value of plan assets at beginning of year |
|
$ |
1,862 |
|
$ |
1,981 |
|
|
Employer contribution |
|
|
233 |
|
|
— |
|
|
Actual loss on plan assets |
|
|
(7) |
|
|
(7) |
|
|
Benefits paid |
|
|
(2,088) |
|
|
(112) |
|
|
Fair value of plan assets at end of year |
|
$ |
— |
|
$ |
1,862 |
|
|
Underfunded status |
|
$ |
— |
|
$ |
(275) |
|
|
Accumulated benefit obligation |
|
$ |
— |
|
$ |
2,137 |
|
The following table sets forth the Pre-Settlement, Settlement and Post-Settlement funded status of the Plan as of June 30, 2015 (the termination date):
|
|
|
June 30, 2015 |
|
|||||||
|
|
|
Pre‑Settlement |
|
Settlement |
|
Post‑Settlement |
|
|||
|
Projected benefit obligation |
|
$ |
2,039 |
|
$ |
(2,039) |
|
$ |
— |
|
|
Fair value of plan assets |
|
|
2,039 |
|
|
(2,039) |
|
|
— |
|
|
Underfunded status |
|
$ |
— |
|
$ |
— |
|
$ |
— |
|
49
United States Lime & Minerals, Inc.
Notes to Consolidated Financial Statements (Continued)
(dollars in thousands, except per share amounts)
Years Ended December 31, 2015, 2014 and 2013
The liability recognized for the Plan, which is included in other liabilities on the Company’s Consolidated Balance Sheets at December 31, consists of the following:
|
|
|
December 31, |
|
December 31, |
|
||
|
|
|
2015 |
|
2014 |
|
||
|
Accrued benefit cost |
|
$ |
— |
|
$ |
275 |
|
The weighted‑average assumptions used in the measurement of the Plan benefit obligation at December 31 are as follows:
|
|
|
2015 |
|
2014 |
|
|
|
Discount rate |
|
— |
% |
3.75 |
% |
|
|
Expected long-term return on plan assets |
|
— |
% |
2.00 |
% |
|
The following table provides the components of the Plan net periodic benefit cost:
|
|
|
Years Ended December 31, |
|
|||||||
|
|
|
2015 |
|
2014 |
|
2013 |
|
|||
|
Interest cost |
|
$ |
44 |
|
$ |
87 |
|
$ |
77 |
|
|
Expected return on plan assets |
|
|
(18) |
|
|
(38) |
|
|
(128) |
|
|
Amortization of net actuarial loss |
|
|
65 |
|
|
65 |
|
|
80 |
|
|
Net periodic benefit cost |
|
$ |
91 |
|
$ |
114 |
|
$ |
29 |
|
|
Settlement charge |
|
|
814 |
|
|
— |
|
|
— |
|
|
Total net periodic benefit cost |
|
$ |
905 |
|
$ |
114 |
|
$ |
29 |
|
The Company has a contributory retirement (401(k)) savings plans for non‑union employees and for union employees of Arkansas Lime Company and Texas Lime Company. Company contributions to these plans were $174, $184 and $156 in 2015, 2014 and 2013, respectively.
(7) Stock‑Based Compensation
The Company has implemented the Amended and Restated 2001 Long‑Term Incentive Plan (the “2001 Plan”). The 2001 Plan provides for stock options, restricted stock and dollar‑denominated cash awards, including performance‑based awards. In addition to stock options, restricted stock and cash awards, the 2001 Plan provides for the grant of stock appreciation rights, deferred stock and other stock‑based awards to directors, officers, employees and consultants.
The number of shares of common stock that may be subject to outstanding awards granted under the 2001 Plan (determined immediately after the grant of any award) may not exceed 741,413 from the inception of the 2001 Plan. In addition, no individual may receive awards in any one calendar year of more than 100,000 shares of common stock. Stock options granted under the 2001 Plan expire ten years from the date of grant and generally become exercisable, or vest, immediately. Restricted stock generally vests over periods of one‑half to three years. Upon the exercise of stock options, the Company issues common stock from its non‑issued authorized or treasury shares that have been reserved for issuance pursuant to the 2001 Plan. At December 31, 2015, the number of shares of common stock remaining available for future grants of stock options, restricted stock or other forms of stock‑based compensation under the 2001 Plan was 126,912.
50
United States Lime & Minerals, Inc.
Notes to Consolidated Financial Statements (Continued)
(dollars in thousands, except per share amounts)
Years Ended December 31, 2015, 2014 and 2013
The Company recorded $1,199, $1,102 and $934 for stock‑based compensation expense related to stock options and shares of restricted stock for 2015, 2014 and 2013, respectively. The amounts included in cost of revenues were $154, $185 and $174 and in selling, general and administrative expense were $1,045, $916 and $760, for 2015, 2014 and 2013, respectively.
A summary of the Company’s stock option and restricted stock activity and related information for the year ended December 31, 2015 and certain other information for the years ended December 31, 2015, 2014 and 2013 are as follows:
|
|
|
|
|
Weighted- |
|
|
|
|
|
|
Weighted- |
|
||
|
|
|
|
|
Average |
|
Aggregate |
|
|
|
Average |
|
|||
|
|
|
Stock |
|
Exercise |
|
Intrinsic |
|
Restricted |
|
Grant-Date |
|
|||
|
|
|
Options |
|
Price |
|
Value |
|
Stock |
|
Fair Value |
|
|||
|
Outstanding (stock options); non-vested (restricted stock) at December 31, 2014 |
|
47,700 |
|
$ |
51.52 |
|
$ |
1,018 |
|
17,290 |
|
$ |
65.46 |
|
|
Granted |
|
9,900 |
|
|
57.80 |
|
|
— |
|
16,346 |
|
|
60.48 |
|
|
Exercised (stock options); vested (restricted stock) |
|
(1,000) |
|
|
27.98 |
|
|
(30) |
|
(16,140) |
|
|
68.10 |
|
|
Forfeited |
|
— |
|
|
— |
|
|
— |
|
(85) |
|
|
64.05 |
|
|
Outstanding (stock options); non-vested (restricted stock) at December 31, 2015 |
|
56,600 |
|
$ |
53.03 |
|
$ |
357 |
|
17,411 |
|
$ |
57.75 |
|
|
Exercisable at December 31, 2015 |
|
56,600 |
|
$ |
53.03 |
|
$ |
357 |
|
n/a |
|
|
n/a |
|
|
|
|
2015 |
|
2014 |
|
2013 |
|
|||
|
Weighted-average fair value of stock options granted during the year |
|
$ |
10.79 |
|
$ |
14.62 |
|
$ |
12.47 |
|
|
Weighted-average remaining contractual life for stock options in years |
|
|
6.32 |
|
|
6.46 |
|
|
6.04 |
|
|
Total fair value of stock options vested during the year |
|
$ |
107 |
|
$ |
145 |
|
$ |
123 |
|
|
Total intrinsic value of stock options exercised during the year |
|
$ |
30 |
|
$ |
657 |
|
$ |
263 |
|
|
Total fair value of restricted stock vested during the year |
|
$ |
1,099 |
|
$ |
955 |
|
$ |
811 |
|
There were no non‑vested stock options at December 31, 2015, and the weighted‑average remaining contractual life of the outstanding and exercisable stock options at such date was 6.46 years. The total compensation cost not yet recognized for restricted stock at December 31, 2015 was $929, which will be recognized over the weighted average of 1.08 years.
The fair value for the stock options was estimated at the date of grant using a lattice‑based option valuation model, with the following weighted‑average assumptions for the 2015, 2014 and 2013 grants: risk‑free interest rates of 0.98% to 1.28% (weighted average 1.05%) in 2015, 0.89% to 1.17% (weighted average 1.10%) in 2014, and 0.34% to 0.77% (weighted average 0.65%) in 2013; a dividend yield of 0.80% to 0.91% (weighted average 0.83%) in 2015 and 0.70% to 0.90% (weighted average of 0.75%) in 2014 and 0% in 2013; and a volatility factor of .272 to .284 (weighted average .275) in 2015, .294 to .316 (weighted average .299) in 2014, and .304 to .307 (weighted average .306) in 2013, based on the monthly per‑share closing prices for three years preceding the date of issuance. In addition, the fair value of these options was estimated based on an expected life of three years. The fair value of restricted stock is based on the closing per‑share price of the Company’s common stock on the date of grant.
51
United States Lime & Minerals, Inc.
Notes to Consolidated Financial Statements (Continued)
(dollars in thousands, except per share amounts)
Years Ended December 31, 2015, 2014 and 2013
(8) Share Repurchases
In December 2015, the Company commenced a publicly announced share repurchase program to repurchase up to $10,000 of its common stock. During December 2015, the Company spent $169 to repurchase 3,086 shares at a weighted-average price of $54.79 per share. Pursuant to the share repurchase program, in 2016, through March 3, 2016, the Company has repurchased 50,068 shares at a weighted-average price of $53.52 per share.
In addition, during 2015, pursuant to provisions in the 2001 Plan that allows employees and directors to pay the tax withholding liability upon the lapse of restrictions on restricted stock in either cash and/or delivery of shares of the Company’s common stock, the Company repurchased 3,813 shares at a weighted-average price of $61.20 per share.
(9) Commitments and Contingencies
The Company leases some of the equipment used in its operations under operating leases. Generally, the leases are for periods varying from one to five years and are renewable at the option of the Company. The Company also has a lease for corporate office space. Total lease and rent expense was $2,307, $2,227 and $2,000 for 2015, 2014 and 2013, respectively. As of December 31, 2015, future minimum payments under operating leases that were either non‑cancelable or subject to significant penalty upon cancellation were $1,718 for 2016, $1,242 for 2017, $762 for 2018, $688 for 2019, $377 for 2020 and $197 thereafter.
The Company is party to lawsuits and claims arising in the normal course of business, none of which, in the opinion of management, is expected to have a material adverse effect on the Company’s financial condition, results of operations, cash flows or competitive position.
The Company is not contractually committed to any planned capital expenditures until actual orders are placed for equipment or services.
(10) Business Segments
The Company has identified two business segments based on the distinctness of their activities and products: lime and limestone operations and natural gas interests. All operations are in the United States. In evaluating the operating results of the Company’s segments, management primarily reviews revenues and gross profit. The Company does not allocate corporate overhead or interest costs to its business segments.
52
United States Lime & Minerals, Inc.
Notes to Consolidated Financial Statements (Continued)
(dollars in thousands, except per share amounts)
Years Ended December 31, 2015, 2014 and 2013
Operating results and certain other financial data for the years ended December 31, 2015, 2014 and 2013 for the Company’s two business segments are as follows:
|
|
|
2015 |
|
2014 |
|
2013 |
|
|||
|
Revenues |
|
|
|
|
|
|
|
|
|
|
|
Lime and limestone operations |
|
$ |
128,390 |
|
$ |
144,567 |
|
$ |
128,003 |
|
|
Natural gas interests |
|
|
2,447 |
|
|
5,274 |
|
|
5,762 |
|
|
Total revenues |
|
$ |
130,837 |
|
$ |
149,841 |
|
$ |
133,765 |
|
|
Depreciation, depletion and amortization |
|
|
|
|
|
|
|
|
|
|
|
Lime and limestone operations |
|
$ |
14,910 |
|
$ |
13,811 |
|
$ |
13,336 |
|
|
Natural gas interests |
|
|
874 |
|
|
895 |
|
|
955 |
|
|
Total depreciation, depletion and amortization |
|
$ |
15,784 |
|
$ |
14,706 |
|
$ |
14,291 |
|
|
Gross profit |
|
|
|
|
|
|
|
|
|
|
|
Lime and limestone operations |
|
$ |
28,400 |
|
$ |
33,958 |
|
$ |
27,913 |
|
|
Natural gas interests |
|
|
314 |
|
|
2,833 |
|
|
2,887 |
|
|
Total gross profit |
|
$ |
28,714 |
|
$ |
36,791 |
|
$ |
30,800 |
|
|
Identifiable assets, at year end |
|
|
|
|
|
|
|
|
|
|
|
Lime and limestone operations |
|
$ |
125,703 |
|
$ |
128,961 |
|
$ |
124,839 |
|
|
Natural gas interests |
|
|
8,540 |
|
|
9,762 |
|
|
10,910 |
|
|
Unallocated corporate assets and cash items |
|
|
62,256 |
|
|
61,263 |
|
|
51,777 |
|
|
Total identifiable assets |
|
$ |
196,499 |
|
$ |
199,986 |
|
$ |
187,526 |
|
|
Capital expenditures |
|
|
|
|
|
|
|
|
|
|
|
Lime and limestone operations |
|
$ |
11,444 |
|
$ |
15,352 |
|
$ |
8,863 |
|
|
Natural gas interests |
|
|
15 |
|
|
25 |
|
|
58 |
|
|
Total capital expenditures |
|
$ |
11,459 |
|
$ |
15,377 |
|
$ |
8,921 |
|
(11) Acquisition
In December 2014, the Company acquired the assets of a trucking company operation in Houston, Texas for a cash purchase price of $3,800, including $1,700 for land and buildings and $2,100 for trucks, trailers and other equipment. Acquisition-related costs of approximately $31 were expensed in 2014. Prior to the purchase, the Company utilized the trucking company exclusively to deliver the Company’s products to its customers and slurry facilities, and the land purchased included the site leased for the slurry facility.
(12) Supplementary Financial Information for Oil and Gas Producing Activities (Unaudited)
Results of Operations from Oil and Gas Producing Activities
The Company’s natural gas interests consist of royalty and non‑operating working interests in wells drilled on the Company’s approximately 3,800 acres of land located in Johnson County, Texas in the Barnett Shale Formation. The Company also has royalty and non‑operating working interests in wells drilled from drillsites on the Company’s property under a lease covering approximately 538 acres of land contiguous to the Company’s Johnson County, Texas property.
53
United States Lime & Minerals, Inc.
Notes to Consolidated Financial Statements (Continued)
(dollars in thousands, except per share amounts)
Years Ended December 31, 2015, 2014 and 2013
The following sets forth certain information with respect to the Company’s results of operations and costs incurred for its natural gas interests for the years ended December 31, 2015, 2014 and 2013:
|
|
|
2015 |
|
2014 |
|
2013 |
|
|||
|
Results of Operations |
|
|
|
|
|
|
|
|
|
|
|
Revenues |
|
$ |
2,447 |
|
$ |
5,274 |
|
$ |
5,762 |
|
|
Production and operating costs |
|
|
1,259 |
|
|
1,546 |
|
|
1,920 |
|
|
Depreciation and depletion |
|
|
874 |
|
|
895 |
|
|
955 |
|
|
Results of operations before income taxes |
|
|
314 |
|
|
2,833 |
|
|
2,887 |
|
|
Income tax (benefit) expense |
|
|
(19) |
|
|
742 |
|
|
736 |
|
|
Results of operations (excluding corporate overhead and interest costs) |
|
$ |
333 |
|
$ |
2,091 |
|
$ |
2,151 |
|
|
Costs Incurred |
|
|
|
|
|
|
|
|
|
|
|
Development costs incurred |
|
$ |
14 |
|
$ |
25 |
|
$ |
58 |
|
|
Exploration costs |
|
|
— |
|
|
— |
|
|
— |
|
|
Capitalized asset retirement costs |
|
|
— |
|
|
— |
|
|
— |
|
|
Property acquisition costs |
|
|
— |
|
|
— |
|
|
— |
|
|
Capitalized Costs |
|
|
|
|
|
|
|
|
|
|
|
Natural gas properties-proved |
|
$ |
18,398 |
|
$ |
18,384 |
|
$ |
18,359 |
|
|
Less: accumulated depreciation and depletion |
|
|
10,030 |
|
|
9,153 |
|
|
8,256 |
|
|
Net capitalized costs for natural gas properties |
|
$ |
8,368 |
|
$ |
9,231 |
|
$ |
10,103 |
|
Unaudited Oil and Natural Gas Reserve and Standardized Measure Information
The independent petroleum engineering firm of DeGolyer and MacNaughton has been retained by the Company to estimate its proved natural gas reserves as of December 31, 2015. No events have occurred since December 31, 2015 that would have a material effect on the estimated proved reserves.
The following information is presented with regard to the Company’s natural gas reserves, all of which are proved and located in the United States. These rules require inclusion, as a supplement to the basic financial statements, of a standardized measure of discounted future net cash flows relating to proved natural gas reserves. The standardized measure, in management’s opinion, should be examined with caution. The basis for these disclosures is the independent petroleum engineers’ reserve studies, which contain imprecise estimates of quantities and rates of production of reserves. Revision of estimates can have a significant impact on the results. Also, development and production improvement costs in one year may significantly change previous estimates of proved reserves and their valuation. Values of unproved properties and anticipated future price and cost increases or decreases are not considered. Therefore, the standardized measure is not necessarily a “best estimate” of the fair value of gas properties or of future net cash flows.
In calculating the future net cash flows for its royalty and non‑operating working interests in the table below as of December 31, 2015, 2014 and 2013, the Company utilized 12‑month average prices of $2.80, $4.61 and $3.88 per MCF of natural gas and $14.92, $30.20 and $29.95 per BBL of natural gas liquids, respectively.
54
United States Lime & Minerals, Inc.
Notes to Consolidated Financial Statements (Continued)
(dollars in thousands, except per share amounts)
Years Ended December 31, 2015, 2014 and 2013
Unaudited Summary of Changes in Proved Reserves
|
|
|
|
|
Natural Gas |
|
|
|
Natural Gas |
|
|
|
Natural Gas |
|
|
|
|
Natural |
|
Liquids |
|
Natural Gas |
|
Liquids |
|
Natural Gas |
|
Liquids |
|
|
|
|
Gas (BCF) |
|
(MMBBLS) |
|
(BCF) |
|
(MMBBLS) |
|
(BCF) |
|
(MMBBLS) |
|
|
|
|
2015 |
|
2015 |
|
2014 |
|
2014 |
|
2013 |
|
2013 |
|
|
Proved reserves - beginning of year |
|
6.7 |
|
1.0 |
|
7.6 |
|
1.1 |
|
8.3 |
|
1.1 |
|
|
Revisions of previous estimates |
|
(0.9) |
|
(0.2) |
|
(0.3) |
|
— |
|
— |
|
0.1 |
|
|
Extensions and discoveries |
|
— |
|
— |
|
— |
|
— |
|
— |
|
— |
|
|
Production |
|
(0.5) |
|
(0.1) |
|
(0.6) |
|
(0.1) |
|
(0.7) |
|
(0.1) |
|
|
Proved reserves - end of year |
|
5.3 |
|
0.7 |
|
6.7 |
|
1.0 |
|
7.6 |
|
1.1 |
|
|
Proved developed reserves - end of year |
|
5.3 |
|
0.7 |
|
6.7 |
|
1.0 |
|
7.6 |
|
1.1 |
|
Unaudited Standardized Measure of Discounted Future Net Cash Flows
|
|
|
2015 |
|
2014 |
|
2013 |
|
|||
|
Future estimated gross revenues |
|
$ |
25,916 |
|
$ |
60,073 |
|
$ |
61,873 |
|
|
Future estimated production and development costs |
|
|
(12,019) |
|
|
(23,243) |
|
|
(24,276) |
|
|
Future estimated net revenues |
|
|
13,897 |
|
|
36,830 |
|
|
37,597 |
|
|
Future estimated income tax expense |
|
|
(3,642) |
|
|
(10,105) |
|
|
(10,286) |
|
|
Future estimated net cash flows |
|
|
10,255 |
|
|
26,725 |
|
|
27,311 |
|
|
10% annual discount for estimated timing of cash flows |
|
|
(4,969) |
|
|
(13,437) |
|
|
(13,733) |
|
|
Standardized measure of discounted future estimated net cash flows |
|
$ |
5,286 |
|
$ |
13,288 |
|
$ |
13,578 |
|
Unaudited Changes in Standardized Measure of Discounted Future Net Cash Flows
|
|
|
2015 |
|
2014 |
|
2013 |
|
|||
|
Standardized measure - beginning of year |
|
$ |
13,288 |
|
$ |
13,578 |
|
$ |
12,764 |
|
|
Net change in sales prices and production costs |
|
|
(12,535) |
|
|
2,180 |
|
|
4,227 |
|
|
Sales of natural gas produced, net of production costs |
|
|
(1,188) |
|
|
(3,730) |
|
|
(3,842) |
|
|
Net change due to changes in quantity estimates |
|
|
(2,625) |
|
|
(586) |
|
|
430 |
|
|
Previously estimated development costs incurred |
|
|
14 |
|
|
21 |
|
|
56 |
|
|
Net change in income taxes |
|
|
3,147 |
|
|
90 |
|
|
(380) |
|
|
Accretion of discount |
|
|
1,570 |
|
|
1,594 |
|
|
1,486 |
|
|
Timing of production of reserves and other |
|
|
3,615 |
|
|
141 |
|
|
(1,163) |
|
|
Standardized measure - end of year |
|
$ |
5,286 |
|
$ |
13,288 |
|
$ |
13,578 |
|
55
United States Lime & Minerals, Inc.
Notes to Consolidated Financial Statements (Continued)
(dollars in thousands, except per share amounts)
Years Ended December 31, 2015, 2014 and 2013
(13) Summary of Quarterly Financial Data (unaudited)
|
|
|
2015 |
|
||||||||||
|
|
|
March 31, |
|
June 30, |
|
September 30, |
|
December 31, |
|
||||
|
Revenues |
|
|
|
|
|
|
|
|
|
|
|
|
|
|
Lime and limestone operations |
|
$ |
29,362 |
|
$ |
31,779 |
|
$ |
36,452 |
|
$ |
30,797 |
|
|
Natural gas interests |
|
|
702 |
|
|
671 |
|
|
577 |
|
|
497 |
|
|
|
|
$ |
30,064 |
|
$ |
32,450 |
|
$ |
37,029 |
|
$ |
31,294 |
|
|
Gross profit (loss) |
|
|
|
|
|
|
|
|
|
|
|
|
|
|
Lime and limestone operations |
|
$ |
5,697 |
|
$ |
6,809 |
|
$ |
10,320 |
|
$ |
5,575 |
|
|
Natural gas interests |
|
|
167 |
|
|
204 |
|
|
47 |
|
|
(105) |
|
|
|
|
$ |
5,864 |
|
$ |
7,013 |
|
$ |
10,367 |
|
$ |
5,470 |
|
|
Net income |
|
$ |
2,365 |
|
$ |
2,559 |
|
$ |
5,676 |
|
$ |
2,286 |
|
|
Basic income per common share |
|
$ |
0.42 |
|
$ |
0.46 |
|
$ |
1.01 |
|
$ |
0.41 |
|
|
Diluted income per common share |
|
$ |
0.42 |
|
$ |
0.46 |
|
$ |
1.01 |
|
$ |
0.41 |
|
|
|
|
2014 |
|
||||||||||
|
|
|
March 31, |
|
June 30, |
|
September 30, |
|
December 31, |
|
||||
|
Revenues |
|
|
|
|
|
|
|
|
|
|
|
|
|
|
Lime and limestone operations |
|
$ |
35,051 |
|
$ |
37,320 |
|
$ |
37,855 |
|
$ |
34,341 |
|
|
Natural gas interests |
|
|
1,640 |
|
|
1,356 |
|
|
1,218 |
|
|
1,060 |
|
|
|
|
$ |
36,691 |
|
$ |
38,676 |
|
$ |
39,073 |
|
$ |
35,401 |
|
|
Gross profit |
|
|
|
|
|
|
|
|
|
|
|
|
|
|
Lime and limestone operations |
|
$ |
7,662 |
|
$ |
9,704 |
|
$ |
9,271 |
|
$ |
7,321 |
|
|
Natural gas interests |
|
|
930 |
|
|
719 |
|
|
612 |
|
|
572 |
|
|
|
|
$ |
8,592 |
|
$ |
10,423 |
|
$ |
9,883 |
|
$ |
7,893 |
|
|
Net income |
|
$ |
4,492 |
|
$ |
5,718 |
|
$ |
5,426 |
|
$ |
3,731 |
|
|
Basic income per common share |
|
$ |
0.81 |
|
$ |
1.03 |
|
$ |
0.97 |
|
$ |
0.67 |
|
|
Diluted income per common share |
|
$ |
0.80 |
|
$ |
1.03 |
|
$ |
0.97 |
|
$ |
0.67 |
|
(14) Subsequent Events
On January 28, 2016, the Company declared a regular quarterly cash dividend of $0.125 (12.5 cents) per share on the Company’s common stock. This dividend is payable on March 18, 2016 to shareholders of record at the close of business on February 26, 2016.
56
ITEM 9. CHANGES IN AND DISAGREEMENTS WITH ACCOUNTANTS ON ACCOUNTING AND FINANCIAL DISCLOSURE.
None
ITEM 9A. CONTROLS AND PROCEDURES.
Evaluation of disclosure controls and procedures. The Company’s management, with the participation of the Company’s Chief Executive Officer (“CEO”) and Chief Financial Officer (“CFO”), evaluated the effectiveness of the Company’s disclosure controls and procedures as of the end of the period covered by this Report. Based on that evaluation, the CEO and CFO concluded that the Company’s disclosure controls and procedures as of the end of the period covered by this Report were effective.
MANAGEMENT’S REPORT ON INTERNAL CONTROL OVER FINANCIAL REPORTING
The management of the Company is responsible for establishing and maintaining adequate internal control over financial reporting. The Company’s internal control over financial reporting is a process designed under the supervision of the Company’s CEO and CFO to provide reasonable assurance regarding the reliability of financial reporting and the preparation of the Company’s financial statements for external purposes in accordance with generally accepted accounting principles.
Because of its inherent limitations, internal control over financial reporting may not prevent or detect misstatements. All internal control systems, no matter how well designed, have inherent limitations. Therefore, even those systems determined to be effective can provide only reasonable assurance with respect to financial statement preparation and presentation. Additionally, projections of any evaluation of effectiveness to future periods are subject to the risk that controls may become inadequate because of changes in conditions or that the degree of compliance with the policies or procedures may deteriorate.
As of December 31, 2015, management assessed the effectiveness of the Company’s internal control over financial reporting based on the criteria for effective internal control over financial reporting established in the 2013 “Internal Control—Integrated Framework,” issued by the Committee of Sponsoring Organizations of the Treadway Commission (the “COSO criteria”). Based on the assessment, management determined that the Company maintained effective internal control over financial reporting as of December 31, 2015, based on the COSO criteria.
Grant Thornton LLP, the Company’s independent registered public accounting firm, has issued an audit report on the effectiveness of the Company’s internal control over financial reporting, which appears elsewhere in this Report on Form 10‑K.
Changes in internal control over financial reporting. No change in the Company’s internal control over financial reporting occurred during the Company’s most recent fiscal quarter that has materially affected, or is reasonably likely to materially affect, the Company’s internal control over financial reporting.
None
57
PART III
ITEM 10. DIRECTORS, EXECUTIVE OFFICERS AND CORPORATE GOVERNANCE.
The information appearing under “Election of Directors,” “Nominees for Director,” “Executive Officers Who Are Not Directors” and “Corporate Governance” in the definitive Proxy Statement for the Company’s 2016 Annual Meeting of Shareholders (the “2016 Proxy Statement”) is hereby incorporated by reference in answer to this Item 10. The Company anticipates that it will file the 2016 Proxy Statement with the SEC on or before April 1, 2016.
ITEM 11. EXECUTIVE COMPENSATION.
The information appearing under “Executive Compensation” and “Compensation of Directors” in the 2016 Proxy Statement is hereby incorporated by reference in answer to this Item 11.
ITEM 12. SECURITY OWNERSHIP OF CERTAIN BENEFICIAL OWNERS AND MANAGEMENT AND RELATED STOCKHOLDER MATTERS.
The information appearing under “Voting Securities and Principal Shareholder,” “Shareholdings of Company Directors and Executive Officers” and “Executive Compensation” in the 2016 Proxy Statement is hereby incorporated by reference in answer to this Item 12.
ITEM 13. CERTAIN RELATIONSHIPS AND RELATED TRANSACTIONS, AND DIRECTOR INDEPENDENCE.
The information appearing under “Voting Securities and Principal Shareholder” and “Corporate Governance” in the 2016 Proxy Statement is hereby incorporated by reference in answer to this Item 13.
ITEM 14. PRINCIPAL ACCOUNTANT FEES AND SERVICES.
The information appearing under “Independent Auditors” in the 2016 Proxy Statement is hereby incorporated by reference in answer to this Item 14.
58
PART IV
ITEM 15. EXHIBITS AND FINANCIAL STATEMENT SCHEDULES.
(a)1. The following financial statements are included in Item 8:
|
Reports of Independent Registered Public Accounting Firm |
|
|
Consolidated Financial Statements: |
|
|
Consolidated Balance Sheets as of December 31, 2015 and 2014; |
|
|
Consolidated Statements of Income for the Years Ended December 31, 2015, 2014 and 2013; |
|
|
Consolidated Statements of Comprehensive Income for the Years Ended December 31, 2015, 2014 and 2013; |
|
|
Consolidated Statements of Stockholders’ Equity for the Years Ended December, 31, 2015, 2014 and 2013; |
|
|
Consolidated Statements of Cash Flows for the Years Ended December 31, 2015, 2014 and 2013; and |
|
|
Notes to Consolidated Financial Statements. |
|
2.All financial statement schedules are omitted because they are not applicable or are immaterial or the required information is presented in the consolidated financial statements or the related notes.
(b)The following exhibits are filed with or incorporated by reference into this Report:
| 3.1 |
Articles of Amendment to the Articles of Incorporation of Scottish Heritable, Inc. dated as of January 25, 1994 (incorporated by reference to Exhibit 3(a) to the Company’s Annual Report on Form 10‑K for the fiscal year ended December 31, 1993, File Number 000‑4197). |
|
|
|
| 3.2 |
Restated Articles of Incorporation of the Company dated as of May 14, 1990 (incorporated by reference to Exhibit 3(b) to the Company’s Annual Report on Form 10‑K for the fiscal year ended December 31, 1993, File Number 000‑4197). |
|
|
|
| 3.3 |
Amended and Restated Bylaws of United States Lime & Minerals, Inc. as of April 26, 2013 (incorporated by reference to Exhibit 3.1 to the Company’s Current Report on Form 8‑K filed May 1, 2013, File Number 000‑4197). |
|
|
|
|
10.1.1 |
Form of stock option grant agreement under the United States Lime & Minerals, Inc. 2001 Long‑Term Incentive Plan, as Amended and Restated (incorporated by reference to Exhibit 10.2.1 to the Company’s Annual Report on Form 10‑K for the fiscal year ended December 31, 2006, File Number 000‑4197). |
|
|
|
|
10.1.2 |
Form of restricted stock grant agreement under the United States Lime & Minerals, Inc. 2001 Long‑Term Incentive Plan, as Amended and Restated (incorporated by reference to Exhibit 10.2.2 to the Company’s Annual Report on Form 10‑K for the fiscal year ended December 31, 2006, File Number 000‑4197). |
|
|
|
|
10.1.3 |
United States Lime & Minerals, Inc. 2001 Long‑Term Incentive Plan, as Amended and Restated (incorporated by reference to Exhibit A to the Company’s definitive Proxy Statement for its Annual Meeting of Shareholders held on May 1, 2009, File Number 000‑4197). |
|
|
|
|
10.1.3 |
United States Lime & Minerals, Inc. 2001 Long‑Term Incentive Plan, as Amended and Restated (incorporated by reference to Exhibit A to the Company’s definitive Proxy Statement for its Annual Meeting of Shareholders held on May 2, 2014, File Number 000‑4197). |
|
|
|
59
|
10.2.1 |
Employment Agreement effective as of January 1, 2009 between United States Lime & Minerals, Inc. and Timothy W. Byrne, including Cash Performance Bonus Award Agreement dated as of January 1, 2009 between United States Lime and Minerals, Inc. and Timothy W. Byrne, set forth as Exhibit A thereto (incorporated by reference to Exhibit 10.1 to the Company’s Current Report on Form 8‑K dated December 19, 2008, File Number 000‑4197). |
|
|
|
|
10.2.2 |
Employment Agreement effective as of January 1, 2015 between United States Lime & Minerals, Inc. and Timothy W. Byrne, including Cash Performance Bonus Award Agreement dated as of January 1, 2015 between United States Lime and Minerals, Inc. and Timothy W. Byrne, set forth as Exhibit A thereto (incorporated by reference to Exhibit 10.1 to the Company’s Quarterly Report on Form 10‑Q for the quarter ended June 30, 2014, File Number 000‑4197). |
|
|
|
| 10.3 |
Oil and Gas Lease Agreement dated as of May 28, 2004 between Texas Lime Company and EOG Resources, Inc. (incorporated by reference to Exhibit 10.1 to the Company’s Quarterly Report on Form 10‑Q for the quarter ended June 30, 2004, File Number 000‑4197). |
|
|
|
| 10.4 |
Credit Agreement dated as of August 25, 2004 among United States Lime & Minerals, Inc., each Lender from time to time a party thereto, and Wells Fargo Bank, N.A., as Administrative Agent, Swing Line Lender and L/C Issuer (incorporated by reference to Exhibit 10.1 to the Company’s Current Report on Form 8‑K dated August 31, 2004, File Number 000‑4197). |
|
|
|
| 10.5 |
Security Agreement dated as of August 25, 2004 among United States Lime & Minerals, Inc., Arkansas Lime Company, Colorado Lime Company, Texas Lime Company and U. S. Lime Company—Houston, in favor of Wells Fargo Bank, N. A., as Administrative Agent (incorporated by reference to Exhibit 10.2 to the Company’s Current Report on Form 8‑K dated August 31, 2004, File Number 000‑4197). |
|
|
|
| 10.6 |
Second Amendment to Credit Agreement dated as of October 19, 2005 among United States Lime & Minerals, Inc., each Lender from time to time a party thereto, and Wells Fargo Bank, N.A., as Administrative Agent (incorporated by reference to Exhibit 10.2 to the Company’s Current Report on Form 8‑K dated October 20, 2005, File Number 000‑4197). |
|
|
|
| 10.7 |
Amended and Restated Confirmation dated October 14, 2005 entered into by and between United States Lime & Minerals, Inc. and Wells Fargo Bank, N.A. (incorporated by reference to Exhibit 10.3 to the Company’s Current Report on Form 8‑K dated October 20, 2005, File Number 000‑4197). |
|
|
|
| 10.8 |
Third Amendment to Credit Agreement dated as of March 30, 2007 among United States Lime & Minerals, Inc., each Lender from time to time a party thereto, and Wells Fargo Bank, N.A., as Administrative Agent (incorporated by reference to Exhibit 10.1 to the Company’s Current Report on Form 8‑K dated March 30, 2007, File Number 000‑4197). |
|
|
|
| 10.9 |
Fourth Amendment to Credit Agreement dated as of June 1, 2010 among United States Lime & Minerals, Inc., each Lender from time to time a party thereto, and Wells Fargo Bank, N.A., as Administrative Agent (incorporated by reference to Exhibit 10.1 to the Company’s Current Report on Form 8‑K dated June 1, 2010, File Number 000‑4197). |
|
|
|
| 10.10 |
Fifth Amendment to Credit Agreement dated as of May 7, 2015 among United States Lime & Minerals, Inc., each lender from time to time a party thereto, and Wells Fargo Bank, N.A., as Administrative Agent (incorporated by reference to Exhibit 10.1 to the Company’s Quarterly Report on Form 10-Q for the quarter ended March 31, 2015, File Number 000-4197). |
| 21.1 |
Subsidiaries of the Company. |
60
|
|
|
| 23.1 |
Consent of Independent Registered Public Accounting Firm. |
|
|
|
| 23.2 |
Consent of Independent Petroleum Engineers. |
|
|
|
| 31.1 |
Rule 13a‑14(a)/15d‑14(a) Certification by Chief Executive Officer. |
|
|
|
| 31.2 |
Rule 13a‑14(a)/15d‑14(a) Certification by Chief Financial Officer. |
|
|
|
| 32.1 |
Section 1350 Certification by Chief Executive Officer. |
|
|
|
| 32.2 |
Section 1350 Certification by Chief Financial Officer. |
|
|
|
| 95.1 |
Mine Safety Disclosures. |
|
|
|
| 99.1 |
Report of Independent Petroleum Engineers. |
|
|
|
| 101 |
Interactive Data Files. |
Exhibits 10.1.1 through 10.2.2 are management contracts or compensatory plans or arrangements required to be filed as exhibits.
61
Pursuant to the requirements of Section 13 or 15(d) of the Securities Exchange Act of 1934, the Registrant has duly caused this Report to be signed on its behalf by the undersigned, thereunto duly authorized.
|
|
UNITED STATES LIME & MINERALS, INC. |
|
|
|
|
|
|
Date: March 4, 2016 |
By: |
/s/ Timothy W. Byrne |
|
|
|
Timothy W. Byrne, |
|
|
|
President and Chief Executive Officer |
Pursuant to the requirements of the Securities Exchange Act of 1934, this Report has been signed below by the following persons on behalf of the Registrant and in the capacities and on the dates indicated.
|
Date: March 4, 2016 |
By: |
/s/ Timothy W. Byrne |
|
|
|
Timothy W. Byrne, |
|
|
|
President, Chief Executive Officer, and Director (Principal Executive Officer) |
|
|
|
|
|
Date: March 4, 2016 |
By: |
/s/ M. Michael Owens |
|
|
|
M. Michael Owens, |
|
|
|
Vice President and Chief Financial Officer (Principal Financial and Accounting Officer) |
|
|
|
|
|
Date: March 4, 2016 |
By: |
/s/ Antoine M. Doumet |
|
|
|
Antoine M. Doumet, |
|
|
|
Director and Chairman of the Board |
|
|
|
|
|
Date: March 4, 2016 |
By: |
/s/ Richard W. Cardin |
|
|
|
Richard W. Cardin, |
|
|
|
Director |
|
|
|
|
|
Date: March 4, 2016 |
By: |
/s/ Billy R. Hughes |
|
|
|
Billy R. Hughes, |
|
|
|
Director |
|
|
|
|
|
Date: March 4, 2016 |
By: |
/s/ Edward A. Odishaw |
|
|
|
Edward A. Odishaw, |
|
|
|
Director and Vice Chairman of the Board |
62
EXHIBIT INDEX
| 21.1 |
SUBSIDIARIES OF THE COMPANY. |
|
|
|
| 23.1 |
CONSENT OF INDEPENDENT REGISTERED PUBLIC ACCOUNTING FIRM. |
|
|
|
| 23.2 |
CONSENT OF INDEPENDENT PETROLEUM ENGINEERS. |
|
|
|
| 31.1 |
RULE 13a‑14(a)/15d‑14(a) CERTIFICATION BY CHIEF EXECUTIVE OFFICER. |
|
|
|
| 31.2 |
RULE 13a‑14(a)/15d‑14(a) CERTIFICATION BY CHIEF FINANCIAL OFFICER. |
|
|
|
| 32.1 |
SECTION 1350 CERTIFICATION BY CHIEF EXECUTIVE OFFICER. |
|
|
|
| 32.2 |
SECTION 1350 CERTIFICATION BY CHIEF FINANCIAL OFFICER. |
|
|
|
| 95.1 |
MINE SAFETY DISCLOSURES. |
|
|
|
| 99.1 |
REPORT OF INDEPENDENT PETROLEUM ENGINEERS. |
|
|
|
| 101 |
INTERACTIVE DATA FILES. |
63