Attached files
| file | filename |
|---|---|
| EX-21 - SUBSIDIARIES OF TUPPERWARE BRANDS CORPORATION - TUPPERWARE BRANDS CORP | tup10k122615ex21.htm |
| EX-24 - POWERS OF ATTORNEY - TUPPERWARE BRANDS CORP | tup10k122615ex24.htm |
| EX-31.2 - SECTION 302 CERTIFICATION OF THE CHIEF FINANCIAL OFFICER - TUPPERWARE BRANDS CORP | tup10k122615ex312.htm |
| EX-32.1 - SECTION 906 CERTIFICATION OF THE CHIEF EXECUTIVE OFFICER - TUPPERWARE BRANDS CORP | tup10k122615ex321.htm |
| EX-23 - CONSENT OF INDEPENDENT REGISTERED CERTIFIED PUBLIC ACCOUNTING FIRM - TUPPERWARE BRANDS CORP | tup10k122615ex23.htm |
| EX-31.1 - SECTION 302 CERTIFICATION OF THE CHIEF EXECUTIVE OFFICER - TUPPERWARE BRANDS CORP | tup10k122615ex311.htm |
| EX-32.2 - SECTION 906 CERTIFICATION OF THE CHIEF FINANCIAL OFFICER - TUPPERWARE BRANDS CORP | tup10k122615ex322.htm |
UNITED STATES
SECURITIES AND EXCHANGE COMMISSION
WASHINGTON, D.C. 20549
________________________________________
FORM 10-K
(Mark One) | |
x | ANNUAL REPORT PURSUANT TO SECTION 13 OR 15(d) OF THE SECURITIES EXCHANGE ACT OF 1934 |
For the fiscal year ended December 26, 2015
OR
o | TRANSITION REPORT PURSUANT TO SECTION 13 OR 15(d) OF THE SECURITIES EXCHANGE ACT OF 1934 |
For the Transition period from to
Commission file number 1-11657
________________________________________
TUPPERWARE BRANDS CORPORATION
(Exact name of registrant as specified in its charter)
Delaware | 36-4062333 |
(State or other jurisdiction of incorporation or organization) | (I.R.S. Employer Identification No.) |
14901 South Orange Blossom Trail, Orlando, Florida | 32837 |
(Address of principal executive offices) | (Zip Code) |
Registrant's telephone number, including area code: (407) 826-5050 | |
Securities registered pursuant to Section 12(b) of the Act: | |
Title of Each Class | Name of Each Exchange on Which Registered |
Common Stock, $0.01 par value | New York Stock Exchange |
Securities registered pursuant to Section 12(g) of the Act: None | |
________________________________________
Indicate by check mark if the Registrant is a well-known seasoned issuer, as defined in Rule 405 of the Securities Act. Yes x No o
Indicate by check mark if the Registrant is not required to file reports pursuant to Section 13 or Section 15(d) of the Act. Yes o No x
Indicate by check mark whether the Registrant (1) has filed all reports required to be filed by Section 13 or 15(d) of the Securities Exchange Act of 1934 during the preceding 12 months (or for such shorter period that the Registrant was required to file such reports), and (2) has been subject to such filing requirements for the past 90 days. Yes x No o
Indicate by check mark whether the Registrant has submitted electronically and posted on its corporate Website, if any, every Interactive Data File required to be submitted and posted pursuant to Rule 405 of Regulation S-T during the preceding 12 months (or for such shorter period that the Registrant was required to submit and post such files). Yes x No o
Indicate by check mark if disclosure of delinquent filers pursuant to Item 405 of Regulation S-K is not contained herein, and will not be contained, to the best of Registrant's knowledge, in definitive proxy or information statements incorporated by reference in Part III of this Form 10-K or any amendment to this Form 10-K. x
Indicate by check mark whether the Registrant is a large accelerated filer, an accelerated filer, a non-accelerated filer, or a smaller reporting company. See definitions of "large accelerated filer," "accelerated filer" and "smaller reporting company" in Rule 12b-2 of the Exchange Act.
Large accelerated filer x Accelerated filer o Non-accelerated filer o Smaller reporting company o
Indicate by check mark whether the registrant is a shell company (as defined in Rule 12b-2 of the Exchange
Act). Yes o No x
The aggregate market value of the voting and non-voting common equity held by non-affiliates on the New York Stock Exchange-Composite Transaction Listing on June 26, 2015 (the last business day of the registrant's most recently completed second fiscal quarter) was $3,312,415,604. For the purposes of making this calculation only, the registrant included all of its directors, executive officers and beneficial owners of more than ten percent of its common stock.
As of February 29, 2016, 50,500,182 shares of the common stock, $0.01 par value, of the registrant were outstanding.
Documents Incorporated by Reference:
Portions of the Proxy Statement relating to the Annual Meeting of Shareholders to be held May 24, 2016 are incorporated by reference into Part III of this Report.
Table of Contents | ||
Item | Page | |
Part I | ||
Item 1 | ||
Item 1A | ||
Item 1B | ||
Item 2 | ||
Item 3 | ||
Item 4 | ||
Part II | ||
Item 5 | ||
Item 5a | ||
Item 5c | ||
Item 6 | ||
Item 7 | ||
Item 7A | ||
Item 8 | ||
Item 9 | ||
Item 9A | ||
Item 9B | ||
Part III | ||
Item 10 | ||
Item 11 | ||
Item 12 | ||
Item 13 | ||
Item 14 | ||
Part IV | ||
Item 15 | ||
PART I
Item 1. | Business. |
(a) General Development of Business
Tupperware Brands Corporation (“Registrant”, “Tupperware Brands” or the “Company”) is a global direct-to-consumer marketer of premium, innovative products across multiple brands and categories through an independent sales force of 3.1 million. Product brands and categories include design-centric preparation, storage and serving solutions for the kitchen and home through the Tupperware® brand and beauty and personal care products through the Avroy Shlain®, BeautiControl®, Fuller®, NaturCare®, Nutrimetics® and Nuvo® brands. The Registrant is a Delaware corporation that was organized on February 8, 1996 in connection with the corporate reorganization of Premark International, Inc. (“Premark”).
(b) New York Stock Exchange-Required Disclosures
General. The address of the Registrant's principal office is 14901 South Orange Blossom Trail, Orlando, Florida 32837. The names of the Registrant's directors are Catherine A. Bertini, Susan M. Cameron, Kriss Cloninger, III, Meg Crofton, E.V. Goings, Joe R. Lee, Angel R. Martinez, Antonio Monteiro de Castro, Robert J. Murray, David R. Parker, Richard T. Riley, Joyce M. Roché and M. Anne Szostak. Members of the Audit, Finance and Corporate Responsibility Committee of the Board of Directors are Mr. Monteiro de Castro (Chair), Mses. Bertini and Szostak and Messrs. Lee, Murray and Riley. The members of the Compensation and Management Development Committee of the Board of Directors are Mr. Parker (Chair), Mses. Cameron, Crofton and Roché and Messrs. Cloninger and Martinez. The members of the Nominating and Governance Committee of the Board of Directors are Mr. Murray (Chair), Ms. Roché and Messrs. Cloninger, Monteiro de Castro and Parker. The members of the Executive Committee of the Board of Directors are Mr. Goings (Chair) and Messrs. Cloninger, Monteiro de Castro, Murray and Parker. The Chairman and Chief Executive Officer is Mr. Goings and the Presiding Director is Mr. Murray. The Registrant's executive officers and the number of its employees are set forth below in Part I of this Report. The name and address of the Registrant's transfer agent and registrar is Wells Fargo Bank, N.A., c/o Wells Fargo Shareowner Services, 1110 Centre Pointe Curve, Suite 101, MAC N9173-010, Mendota Heights, MN 55120. The number of the Registrant's shareholders is set forth below in Part II, Item 5 of this Report. The Registrant is satisfying its annual distribution requirement to shareholders under the New York Stock Exchange (“NYSE”) rules by the distribution of its Annual Report on Form 10-K as filed with the United States Securities and Exchange Commission (“SEC”) in lieu of a separate annual report.
Corporate Governance. Investors can obtain access to periodic reports and corporate governance documents, including board committee charters, corporate governance principles and codes of conduct and ethics for financial executives, and information regarding the Registrant's transfer agent and registrar through the Registrant's website free of charge (as soon as reasonably practicable after reports are filed with the SEC, in the case of periodic reports) by going to www.tupperwarebrands.com and searching under Investor Relations / SEC Filings and Governance Documents. The Chief Executive Officer of the Registrant has certified to the NYSE that he is not aware of any violation by the Registrant of NYSE corporate governance listing standards.
BUSINESS OF TUPPERWARE BRANDS CORPORATION
The Registrant is a worldwide direct-to-consumer company engaged in the manufacture and sale of Tupperware® products and cosmetics and personal care products under a variety of trade names, including Avroy Shlain®, BeautiControl®, Fuller®, NaturCare®, Nutrimetics® and Nuvo®. Each business manufactures and/or markets a broad line of high quality products.
1
I. PRINCIPAL PRODUCTS
Tupperware. The core of the Tupperware product line consists of design-centric preparation, storage, and serving solutions for the kitchen and home. Tupperware also has established lines of cookware, knives, microwave products, microfiber textiles, water-filtration related items and an array of products for on-the-go consumers. The Company has continued to refresh its traditional kitchen and home products, such as the Salad Spinner and Measuring Cups, as well as the EZ Mix n Stor and EZ Shaker*, with updated designs and incremental technological enhancements while evolving towards more lifestyle-oriented products. These new lifestyle solutions are based on consumer insights from the Company's market and product leaders around the globe. In 2015, key launches to contemporize the Tupperware product offering included the efficient Tupperware Click Series* Peeler System and the introduction of the Warmie-Tup* Serving Range, which insulates foods to maintain serving temperatures for longer. Other key launches and line extensions introduced included the fun and versatile Silicone Baking Forms Football Sheet with Rim, the Microwave Rice Maker Large, the Eco Prep Fruit Juicer and the Click to Go Containers. The successful Fusion Master* System was expanded to include the new Chef Press* Dicer for added functionality and the Freezer Mates* range was also extended to include new size options. A new knife range, Chef Series Pure Knives, was introduced last year featuring a Bread Knife, a Chef Knife, a Paring Knife and a Utility Knife. A new generation of Eco Bottles, now printable, was also introduced in 2015, while the Kids' Eco Bottle range was further expanded.
The Company continues to introduce new materials, designs, colors and decoration in its product lines, to vary its offerings including by season and to extend existing products into new markets. The development of new products varies across markets in order to address differences in cultures, lifestyles, tastes and needs, although most products are offered in a large number of markets.
Research and development and the resultant new products will continue to be an important part of the Company's strategy going forward.
Beauty. In Beauty, the Company manufactures and distributes skin and hair care products, cosmetics, bath and body care, toiletries, fragrances, jewelry and nutritional products. There were a number of key product launches by brand in 2015:
Beauticontrol saw several key product launches that expanded the Regeneration* Tight, Firm & Fill* range. These included Regeneration* Tight, Firm & Fill*, Dramatic New Anti-Aging Crème, Regeneration* Tight, Firm & Fill* PM Miracle Complex with Retinol, Regeneration* Tight, Firm & Fill* PM Intensive Moisturizing Lip Treatment and Regeneration* Tight, Firm & Fill* PM Intensive Moisturizing Eye Elixir. The Beauticontrol Lovely Eyes Palette was added in the color cosmetics category.
Fuller Cosmetics expanded its fragrance lines by introducing Azul Life* fragrance for Father’s Day, Exclusive by Armand Dupree* for him and Armand Dupree Glam* for her fragrances for the winter holiday season and a new Hello Kitty scent, under license, for the summer. The Hola Bebe fragrance for her was also introduced in 2015, under license, featuring popular Mexican pop star, Espinoza Paz.
Tupperware Brands Brazil introduced the Nutrimetics* brand by launching a new range of cosmetics, fragrances and skin care products. Major launches included Nutrimetics Nutri-Rich Oil with Apricot Kernel Oil and 5 fragrances: Miami, Paris, NYC, London and Rouge, all under the Nutrimetics* brand.
Tupperware Brands Philippines redesigned its top 2 women’s fragrances: Ivana* and A Little Romance*. The fragrances were reintroduced to the sales force via product roadshows.
Nutrimetics Australia’s Ultra Care+ Platinum Skin Care range continues to rank in their top 10 products. The launch of the Ultra Care+ Platinum Skin Care Hand Crème helped to support the sale of the other key products within this range. A similar strategy was used in the color category with the introduction of the Nutrimetics Professional* Colour Range, which featured 5 products in 2015, with the most popular being the Nutrimetics Professional* Nude Color Palette.
2
Avroy Shlain relaunched its daily skincare ranges with 2 variants, the Nucelle* range for dry skin and Tahlita* range, which features more advanced ingredients, for combination skin. In the technologically advanced skincare range, Cell Revitalization Therapy (CRT*), they introduced CRT* Youth Gel Eye Serum, CRT* Hydration Serum and CRT* Anti-wrinkle Serum. Their fragrance category’s key launches included Adrenalin* for men and Inspired Dreams* for ladies fragrances, and the introduction of the Destination Collection New York fragrance. Gel Nails and CC Creams were introduced to the Coppelia Colour* range.
(Words followed by * are registered or unregistered trademarks of the Registrant.)
II. MARKETS
The Company operates its business under five reporting segments in three broad geographic regions: Europe (Europe, Africa and the Middle East), Asia Pacific and the Americas. Market penetration varies throughout the world. Several areas that have low penetration, such as Latin America, Asia and Eastern and Central Europe, provide the Company significant growth potential. The Company's strategy continues to include greater penetration in markets throughout the world.
Tupperware Brands' products are sold around the world under seven brands: Tupperware, Avroy Shlain, BeautiControl, Fuller, NaturCare, Nutrimetics and Nuvo. The Company defines its established market economy units as those in Western Europe (including Scandinavia), Australia, Canada, Japan, New Zealand and the United States. All other units are classified as operating in emerging market economies. Businesses operating in emerging markets accounted for 66 percent of 2015 sales, while businesses operating in established markets accounted for the other 34 percent. For the past five fiscal years, 90 to 92 percent of total revenues from the sale of Tupperware Brands' products have been in international markets.
See Note 15 to the Consolidated Financial Statements for further details regarding segments and geographic areas.
III. DISTRIBUTION OF PRODUCTS
The Company's products are distributed worldwide primarily through the “direct-to-consumer” method, under which products are sold by an independent sales force to consumers outside traditional retail store locations. The system facilitates the timely distribution of products to consumers, without having to work through retail intermediaries, and establishes uniform practices regarding the use of Tupperware Brands' trademarks and administrative arrangements, such as order entry, delivery and payment, along with the addition and training of new sales force members.
Products are primarily sold directly to distributors, directors, managers and dealers (“sales force”) throughout the world. Where distributorships are granted, they have the right to market the Company's products using parties and other non-retail methods and to utilize Tupperware Brands' trademarks. The vast majority of the sales force members are independent contractors and not employees of Tupperware. In certain limited circumstances, the Company has acquired ownership of distributorships for a period of time, until an independent distributor can be installed, in order to maintain market presence.
In addition to the introduction of new products and development of new geographic markets, a key element of the Company's strategy is expanding its business by increasing the size of its sales force. Under the system, distributors, directors, team leaders and managers, and dealers add, train, and motivate a large number of dealers. Managers are developed from among the dealer group and promoted to assist in adding, training and motivating dealers, while continuing to sell products.
As of December 26, 2015, the Company's distribution system had approximately 2,000 distributors, 101,700 managers (including directors and team leaders) and 3.1 million dealers worldwide.
3
Tupperware has traditionally relied upon the group presentation method of sales, which is designed to enable purchasers to appreciate, through demonstration, the features and benefits of the Company's products. Parties are held in homes, offices, social clubs and other locations. Products are also promoted through brochures mailed or given to people invited to attend parties and various other types of demonstrations. Some business units utilize a campaign merchandising system, whereby sales force members sell through brochures generated every two or three weeks, to their friends, neighbors and relatives. Sales of products are supported through programs of sales promotions, sales and training aids and motivational conferences for the sales force. In addition, to support its sales force, the Company utilizes catalogs and television and magazine advertising, which help to increase its sales levels with hard-to-reach customers and generate leads for sales and new dealers. A significant portion of the Company's business is operated through distributors, many of whom stock inventory and fulfill orders of the sales force that are generally placed after orders have been received from end consumers. In other cases, the Company sells directly to the sales force, also generally after they have received a consumer order.
In 2015, the Company continued to sell directly, and/or through its sales force, to end consumers via the Internet. It also entered into a limited number of business-to-business transactions, in which it sells products to a partner company for sale to consumers through the partner's distribution channel, with a link back to the core business. Internet and business-to-business transactions do not constitute a significant portion of the Company's sales.
IV. COMPETITION
There are many competitors to Tupperware Brands' businesses both domestically and internationally. The principal bases of competition generally are marketing, price, quality and innovation of products, as well as competition with other “direct-to-consumer” companies for sales personnel and demonstration dates. Due to the nature of the direct-to-consumer industry, it is critical that the Company provides a compelling earnings opportunity for the sales force, along with developing new and innovative products. The Company maintains its competitive position, in part, through the use of strong incentives and promotional programs.
Through its Tupperware® brand, the Company competes in the food storage, serving and preparation, containers, toys and gifts categories. Through its beauty and personal care brands, the Company also competes in the skin care, cosmetics, toiletries, fragrances and nutritionals categories. The Company works to differentiate itself from its competitors through its brand names, product innovation, quality, value-added services, celebrity endorsements, technological sophistication, new product introductions and its channel of distribution, including the training, motivation and compensation arrangements for its independent sales forces.
V. EMPLOYEES
The Registrant employs approximately 13,000 people, of whom approximately 1,000 are based in the United States.
VI. RESEARCH AND DEVELOPMENT
The Registrant incurred $18.1 million, $19.3 million and $20.0 million for fiscal years 2015, 2014 and 2013, respectively, on research and development activities for new products and production processes.
VII. RAW MATERIALS
Many of the products manufactured by and for the Company require plastic resins that meet its specifications. These resins are purchased through various arrangements with a number of large chemical companies located throughout the Company's markets. As a result, the Company has not experienced difficulties in obtaining adequate supplies and generally has been successful in obtaining favorable resin prices on a relative basis. Research and development relating to resins used in Tupperware® products is performed by both the Company and its suppliers.
Materials used in the Company's skin care, cosmetic and bath and body care products consist primarily of readily available ingredients, containers and packaging materials. Such raw materials and components used in goods manufactured and assembled by the Company and through outsource arrangements are available from a number of sources. To date, the Company has been able to secure an adequate supply of raw materials for its products, and it endeavors to maintain relationships with backup suppliers in an effort to ensure that no interruptions occur in its operations.
4
VIII. TRADEMARKS AND PATENTS
Tupperware Brands considers its trademarks and patents to be of material importance to its business; however, except for the Tupperware® trademark, Tupperware Brands is not dependent upon any single patent or trademark, or group of patents or trademarks. The Tupperware® trademark, as well as its other trademarks, are registered on a country-by-country basis. The current duration for such registration ranges from five years to ten years; however, each such registration may be renewed an unlimited number of times. The patents used in Tupperware Brands' business are registered and maintained on a worldwide basis, with a variety of durations. Tupperware Brands has followed the practice of applying for design and utility patents with respect to most of its significant patentable developments.
IX. ENVIRONMENTAL LAWS
Compliance with federal, state and local environmental protection laws has not had in the past, and is not expected to have in the future, a material effect upon the Registrant's capital expenditures, liquidity, earnings or competitive position.
X. OTHER
Sales do not vary significantly on a quarterly basis; however, third quarter sales are generally lower than the other quarters in any year due to vacations by dealers and their customers, as well as reduced promotional activities during this quarter. Sales generally increase in the fourth quarter, as it includes traditional gift-giving occasions in many markets and as children return to school and households refocus on activities that include party plan sales events and the use of the Company's housewares products, along with increased promotional activities supporting these opportunities.
Generally, there are no working capital practices or backlog conditions which are material to an understanding of the Registrant's business, although the Company generally seeks to minimize its net working capital position at the end of each fiscal year and normally generates a significant portion of its annual cash flow from operating activities in its fourth quarter. The Registrant's business is not dependent on a small number of customers, nor is any of its business subject to renegotiation of profits or termination of contracts or subcontracts at the election of the United States government.
XI. EXECUTIVE OFFICERS OF THE REGISTRANT
Following is a list of the names and ages of all the Executive Officers of the Registrant, indicating all positions and offices held by each such person with the Registrant, and each such person's principal occupations or employment during the past five years. Each such person has been elected to serve until the next annual election of officers of the Registrant (expected to occur on May 24, 2016).
5
Name and Age | Positions and Offices Held and Principal Occupations of Employment- During Past Five Years | |
Allen Dando, age 62 | Group President, Tupperware Europe, Africa & Middle East since September 2015, after serving as its Area Vice President since January 2015 and prior thereto in various leadership positions in Europe and Africa. | |
Lillian D. Garcia, age 59 | Executive Vice President and Chief Human Resources Officer, after serving as Executive Vice President and Area Vice President, Argentina, Uruguay, Venezuela and Ecuador from January 2011 to December 2012, and as Executive Vice President and President, Fuller Argentina since January 2010. | |
E.V. Goings, age 70 | Chairman and Chief Executive Officer since October 1997. | |
Asha Gupta, age 44 | Group President, Asia Pacific since January 1, 2014 after serving as Area Vice President, India, Philippines and Nutrimetics Australia since January 2012. Prior thereto she served as Managing Director, Tupperware India. | |
Josef Hajek, age 57 | Senior Vice President, Tax and Governmental Affairs since February 2006. | |
Simon C. Hemus, age 66 | President and Chief Operating Officer since January 2007. | |
Georg H. Jaggy, age 58 | Executive Vice President and Chief Global Marketing Officer since January 2015, after serving as President, Tupperware Germany and Area Vice President, Northern Europe since March 2013, and President & Area Vice President, Tupperware Germany since November 2008. | |
Michael S. Poteshman, age 52 | Executive Vice President and Chief Financial Officer since August 2004. | |
Nicholas K. Poucher, age 54 | Senior Vice President and Controller since November 2014, after serving as Vice President and Controller since August 2007. | |
Thomas M. Roehlk, age 65 | Executive Vice President, Chief Legal Officer & Secretary since August 2005. | |
Patricia A. Stitzel, age 50 | Group President, Americas since January 2014 after serving as Senior Area Vice President, Central Europe since 2012 and prior thereto in various leadership positions in Europe. | |
William J. Wright, age 53 | Executive Vice President, Supply Chain Worldwide since October 2015, after serving as Senior Vice President, Global Supply Chain since October 2014, Senior Vice President, Global Product Development, Tupperware since March 2013, and Senior Vice President, Global Product Marketing since October 2010. | |
Item 1A. Risk Factors.
The risks and uncertainties described below are not the only ones facing the Company. Other events that the Company does not currently anticipate or that the Company currently deems immaterial also may affect results of operations and financial condition.
Sales Force Factors
The Company’s products are marketed and sold through the "direct-to-consumer" method of distribution, in which products are primarily marketed and sold to consumers, without the use of retail establishments, by a sales force made up of independent contractors. This distribution system depends upon the successful addition, activation and retention of a large force of sales personnel to grow and compensate for a high turnover rate. The addition and retention of sales force members is dependent upon the competitive environment among direct-to-consumer companies and upon the general labor market, unemployment levels, general economic conditions, and demographic and cultural changes in the workforce. The activation of the sales force is dependent, in part, upon the effectiveness of compensation and promotional programs of the Company, the competitiveness of the same compared with other direct-to-consumer companies, the introduction of new products and the ability to advance through the sales force structure.
6
The Company’s sales are directly tied to the activity levels of its sales force, which is in large part a temporary working activity for many sales force members. Activity levels may be affected by the degree to which a market is penetrated by the presence of the Company’s sales force, the amount of average sales per order, the amount of sales per sales force member, the mix of high-margin and low-margin products sold at parties and elsewhere, and the activities and actions of the Company’s product line and channel competitors. In addition, the Company’s sales force members may be affected by initiatives undertaken by the Company to grow its revenue base that may lead to the inaccurate perception that the independent sales force system is at risk of being phased out.
International Operations
A significant portion of the Company’s sales and profit comes from its international operations. Although these operations are geographically dispersed, which partially mitigates the risks associated with operating in particular countries, the Company is subject to the usual risks associated with international operations. Amongst others, these risks include local political and economic environments, adverse new tax regulations and relations between the U.S. and foreign governments.
The Company derived 91 percent of its net sales from operations outside the United States in 2015. As a result, movement in exchange rates has had and may continue to have a significant impact on the Company’s earnings, cash flows and financial position. The Company’s most significant exposures are to the Brazilian real, Chinese renminbi, euro, Indonesian rupiah and Mexican peso. Business units in which the Company generated at least $100 million of sales in 2015 included Brazil, China, Fuller Mexico, Germany, Indonesia, Tupperware Mexico and Tupperware United States and Canada. Of these units, sales in Brazil and Indonesia exceeded $200 million. Although the Company's currency risk is partially mitigated by the natural hedge arising from its local product sourcing in many markets, a strengthening U.S. dollar generally has a negative impact on the Company. In response to this fact, the Company continues to implement foreign currency hedging and risk management strategies to reduce the exposure to fluctuations in earnings associated with changes in foreign currency exchange rates. The Company generally does not seek to hedge the impact of currency fluctuations on the translated value of the sales, profit or cash flow generated by its operations. Some of the hedging strategies implemented have a positive or negative impact on cash flows as foreign currencies fluctuate versus the U.S. dollar. There can be no assurance that foreign currency fluctuations and related hedging activities will not have a material adverse impact on the Company’s results of operations, cash flows and/or financial condition.
Another risk associated with the Company’s international operations is restrictions foreign governments may impose on currency remittances. Due to the possibility of government restrictions on transfers of cash out of countries and control of exchange rates and currency convertibility, the Company may not be able to immediately access its cash at the exchange rate used to translate its financial statements. This has been a particular issue in Argentina, Egypt, and Venezuela. See Item 7, Management's Discussion and Analysis of Financial Condition and Results of Operations for further discussion regarding Egypt, as well as the impacts of the Venezuelan government's currency restrictions on the Company's operations.
Legal and Regulatory Issues
The Company's business may also be affected by actions of domestic and foreign governments to restrict the activities of direct-to-consumer companies for various reasons, including the limitation on the ability of direct-to-consumer companies to operate without the involvement of a traditional retail channel. Foreign governments may also introduce other forms of protectionist legislation, such as limitations on the products which can be produced locally or requirements that non-domestic companies doing or seeking to do business place a certain percentage of ownership of legal entities in the hands of local nationals to protect the commercial interests of its citizens. Customs laws, tariffs, import duties, export and import quotas and restrictions on repatriation of foreign earnings and/or other methods of accessing cash generated internationally, may negatively affect the Company's international operations. Governments may seek either to impose taxes on independent sales force members or to classify independent sales force members as employees of direct-to-consumer companies with whom they may be associated, triggering employment-related taxes on the part of the direct-to-consumer companies. Additionally, some governments prohibit or impose limitations on the requirement to purchase demonstration products upon joining a direct-to-consumer business and/or the types of activities for which a direct-to-consumer sales force can be compensated.The U.S. government may impose restrictions on the Company's ability to engage in business in a foreign country in connection with the foreign policy of the United States.
7
Product Safety
Certain of the materials used in the Company’s product lines may give rise to concerns of consumers based upon scientific theories which are espoused from time to time, including the risk of certain materials leaching out of plastic containers used for their intended purposes or the ingredients used in cosmetics, personal care or nutritional products causing harm to human health. This includes polycarbonate, which contains the chemical Bisphenol A, and polyethersulfone, which contains the chemical Bisphenol S. It is the Company’s policy to market products in each of its business units containing only those materials or ingredients that are approved by relevant regulatory authorities for contact with food or skin or for ingestion by consumers, as applicable.
Technology and Cyber-Security
The Company relies extensively on information technology systems, some of which are managed by third-party service providers, to conduct its business. These systems include, but are not limited to, programs and processes relating to internal communications and communications with other parties, ordering and managing materials from suppliers, converting materials to finished products, receiving orders and shipping product to customers, billing customers and receiving and applying payment, processing transactions, summarizing and reporting results of operations, complying with regulatory, legal or tax requirements, collecting and storing certain customer, employee, investor, and other stakeholder information and personal data, and other processes necessary to manage the Company’s business. Increased information technology security threats and more sophisticated computer crime, including advanced persistent threats, pose a potential risk to the security of the information technology systems, networks, and services of the Company, its customers and other business partners, as well as the confidentiality, availability, and integrity of the data of the Company, its customers and other business partners. As a result, the Company’s information technology systems, networks or service providers could be damaged or cease to function properly or the Company could suffer a loss or disclosure of business, personal or stakeholder information, due to any number of causes, including catastrophic events, power outages and security breaches. Although the Company has business continuity plans in place, if these plans do not provide effective alternative processes on a timely basis, the Company may suffer interruptions in its ability to manage or conduct its operations, which may adversely affect its business. The Company may need to expend additional resources in the future to continue to protect against, or to address problems caused by, any business interruptions or data security breaches. Any business interruptions or data security breaches, including cyber-security breaches resulting in private data disclosure, could result in lawsuits or regulatory proceedings, damage the Company’s reputation or adversely impact the Company’s results of operations and cash flows. While the Company maintains insurance coverage that could cover some of these types of issues, the coverage has limitations and includes deductibles such that it may not be adequate to offset losses incurred.
General Business Factors
The Company’s business can be affected by a wide range of factors that affect other businesses. Weather, natural disasters, strikes, epidemics/pandemics, political instability, terrorist activity and public scrutiny of the direct-to-consumer channel, may have a significant impact on the willingness or ability of consumers to attend parties or otherwise purchase the Company’s products. The supply and cost of raw materials, particularly petroleum and natural gas-based resins, may have an impact on the availability or cost of the Company’s plastic products. The Company is also subject to frequent product counterfeiting and other intellectual property infringement, which may be difficult to police and prevent, depending upon the ability to identify infringers and the availability and/or enforceability of intellectual property rights. Other risks, as discussed under the sub-heading “Forward-Looking Statements” contained in Part II, Item 7A of this Report, may be relevant to performance as well.
Item 1B. Unresolved Staff Comments.
None.
8
Item 2. Properties.
The principal executive office of the Registrant is owned by the Registrant and is located in Orlando, Florida. The Registrant owns and maintains significant manufacturing and distribution facilities in Brazil, France, Greece, Indonesia, Japan, Korea, Mexico, New Zealand, Portugal, South Africa and the United States, and leases significant manufacturing and distribution facilities in Belgium, China, India and Venezuela. The Registrant owns and maintains the BeautiControl headquarters and leases its manufacturing and distribution facility in Texas. The Registrant conducts a continuing program of new product design and development at its facilities in Florida, Texas, Australia, Belgium and Mexico. None of the owned principal properties is subject to any encumbrance material to the consolidated operations of the Company. The Registrant considers the condition and extent of utilization of its plants, warehouses and other properties to be good, the capacity of its plants and warehouses generally to be adequate for its needs, and the nature of the properties to be suitable for its needs.
In addition to the above-described improved properties, the Registrant owns unimproved real estate surrounding its corporate headquarters in Orlando, Florida. The Registrant prepared certain portions of this real estate for a variety of development purposes and, in 2002, began selling parts of this property. To date, approximately 263 acres have been sold and about 290 acres remain to be sold in connection with this project that is expected to continue for a number of years.
Item 3. Legal Proceedings.
A number of ordinary-course legal and administrative proceedings against the Registrant or its subsidiaries are pending. In addition to such proceedings, there are certain proceedings that involve the discharge of materials into, or otherwise relating to the protection of, the environment. Certain of such proceedings involve federal environmental laws such as the Comprehensive Environmental Response, Compensation and Liability Act of 1980, as well as state and local laws. The Registrant has established reserves with respect to certain of such proceedings. Because of the involvement of other parties and the uncertainty of potential environmental impacts, the eventual outcomes of such actions and the cost and timing of expenditures cannot be determined with certainty. It is not expected that the outcome of such proceedings, either individually or in the aggregate, will have a material adverse effect upon the Registrant.
As part of the 1986 reorganization involving the formation of Premark, Premark was spun-off by Dart & Kraft, Inc., and Kraft Foods, Inc. assumed any liabilities arising out of any legal proceedings in connection with certain divested or discontinued former businesses of Dart Industries Inc., a subsidiary of the Registrant, including matters alleging product and environmental liability. The assumption of liabilities by Kraft Foods, Inc. remains effective subsequent to the distribution of the equity of the Registrant to Premark shareholders in 1996.
As part of the 2005 acquisition of the direct-to-consumer businesses of Sara Lee Corporation (which has since changed its name to Hillshire Brands Co.), that company indemnified the Registrant for any liabilities arising out of any existing litigation at that time and for certain legal and tax matters arising out of circumstances that might relate to periods before or after the date of that acquisition.
Item 4. Mine Safety Procedures.
Not applicable.
9
PART II
Item 5. | Market for Registrant’s Common Equity, Related Stockholder Matters and Issuer Purchases of Equity Securities. |
The Registrant has not sold any securities in 2013 through 2015 that were not registered under the Securities Act of 1933 as amended. As of February 29, 2016, the Registrant had 78,689 shareholders of record and beneficial holders. The principal United States market on which the Registrant’s common stock is being traded is the New York Stock Exchange. The stock price and dividend information set forth in Note 19 to the Consolidated Financial Statements, entitled “Quarterly Financial Summary (Unaudited),” is included in Item 8 of Part II of this Report and is incorporated by reference into this Item 5.
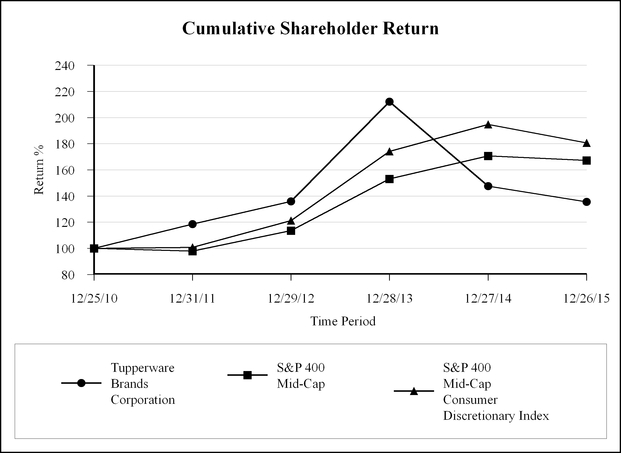
Item 5a. | Performance Graph. |
The following performance graph compares the performance of the Company's common stock to the Standard & Poor's 400 Mid-Cap Stock Index and the Standard & Poor's 400 Mid-Cap Consumer Discretionary Index. The graph assumes that the value of the investment in the Company's common stock and each index was $100 at December 25, 2010 and that all dividends were reinvested. The Company's stock is included in both indices.
10
Measurement Period (Fiscal Year Ended) | Tupperware Brands Corporation | S&P 400 Mid-Cap | S&P 400 Mid-Cap Consumer Discretionary Index | |||||
12/25/2010 | 100.00 | 100.00 | 100.00 | |||||
12/31/2011 | 118.51 | 97.92 | 100.72 | |||||
12/29/2012 | 135.95 | 113.53 | 121.29 | |||||
12/28/2013 | 212.08 | 153.18 | 174.22 | |||||
12/27/2014 | 147.67 | 170.63 | 194.86 | |||||
12/26/2015 | 135.62 | 167.20 | 180.68 | |||||
Item 5c. | Changes in Securities, Use of Proceeds and Issuer Purchases of Equity Securities. |
None.
11
Item 6. | Selected Financial Data. |
The following table presents the Company’s selected historical financial information for the last five years. The selected financial information has been derived from the Company's audited consolidated financial statements which, for the data presented for fiscal years 2015 and 2014 and for some data presented for 2013, are included as Item 8 of this Report. This data should be read in conjunction with the Company's other financial information, including "Management's Discussion and Analysis of Financial Condition and Results of Operations" (MD&A) and the Consolidated Financial Statements and Notes to the Consolidated Financial Statements included as Items 7 and 8, respectively, in this report. The Company's fiscal year ends on the last Saturday of December and, as a result, the 2011 fiscal year contained 53 weeks as compared with 52 weeks for the other fiscal years presented.
During 2015, the Company adopted Accounting Standards Update (ASU) 2015-17, Balance Sheet Classification of Deferred Taxes. As a result, previously reported amounts related to working capital and the current ratio have been re-calculated to exclude deferred tax assets and liabilities in order to conform with the new ASU.
(In millions, except per share amounts) | 2015 | 2014 | 2013 | 2012 | 2011 | ||||||||||||||
Operating results | |||||||||||||||||||
Net sales: | |||||||||||||||||||
Europe | $ | 604.9 | $ | 730.3 | $ | 771.5 | $ | 780.0 | $ | 835.9 | |||||||||
Asia Pacific | 779.0 | 849.9 | 848.1 | 792.1 | 727.0 | ||||||||||||||
Tupperware North America | 353.7 | 349.9 | 358.0 | 344.8 | 352.0 | ||||||||||||||
Beauty North America | 240.0 | 290.9 | 320.1 | 348.3 | 395.5 | ||||||||||||||
South America | 306.2 | 385.1 | 373.9 | 318.6 | 274.6 | ||||||||||||||
Total net sales | $ | 2,283.8 | $ | 2,606.1 | $ | 2,671.6 | $ | 2,583.8 | $ | 2,585.0 | |||||||||
Segment profit: | |||||||||||||||||||
Europe | $ | 93.3 | $ | 118.2 | $ | 130.6 | $ | 132.0 | $ | 148.4 | |||||||||
Asia Pacific | 175.0 | 191.0 | 187.5 | 172.3 | 146.9 | ||||||||||||||
Tupperware North America | 67.4 | 68.3 | 65.9 | 63.7 | 58.4 | ||||||||||||||
Beauty North America | 2.3 | 1.3 | 16.1 | 30.2 | 37.9 | ||||||||||||||
South America | 46.5 | 27.1 | 68.9 | 61.0 | 48.6 | ||||||||||||||
Unallocated expenses | (72.8 | ) | (55.9 | ) | (62.4 | ) | (62.6 | ) | (58.9 | ) | |||||||||
Gain on disposal of assets including insurance recoveries, net (a),(b) | 13.7 | 2.7 | 0.7 | 7.9 | 3.8 | ||||||||||||||
Re-engineering and impairment charges | (20.3 | ) | (11.0 | ) | (9.3 | ) | (22.4 | ) | (7.9 | ) | |||||||||
Impairment of goodwill and intangible assets (c) | — | — | — | (76.9 | ) | (36.1 | ) | ||||||||||||
Interest expense, net (d) | (45.2 | ) | (43.5 | ) | (37.6 | ) | (32.4 | ) | (45.8 | ) | |||||||||
Income before income taxes | 259.9 | 298.2 | 360.4 | 272.8 | 295.3 | ||||||||||||||
Provision for income taxes | 74.1 | 83.8 | 86.2 | 79.8 | 77.0 | ||||||||||||||
Net income | $ | 185.8 | $ | 214.4 | $ | 274.2 | $ | 193.0 | $ | 218.3 | |||||||||
Basic earnings per common share | $ | 3.72 | $ | 4.28 | $ | 5.28 | $ | 3.49 | $ | 3.63 | |||||||||
Diluted earnings per common share | $ | 3.69 | $ | 4.20 | $ | 5.17 | $ | 3.42 | $ | 3.55 | |||||||||
See footnotes beginning on the following page.
12
(Dollars in millions, except per share amounts) | 2015 | 2014 | 2013 | 2012 | 2011 | ||||||||||||||
Profitability ratios | |||||||||||||||||||
Segment profit as a percent of sales: | |||||||||||||||||||
Europe | 15 | % | 16 | % | 17 | % | 17 | % | 18 | % | |||||||||
Asia Pacific | 22 | 22 | 22 | 22 | 20 | ||||||||||||||
Tupperware North America | 19 | 20 | 18 | 19 | 17 | ||||||||||||||
Beauty North America | 1 | — | 5 | 9 | 10 | ||||||||||||||
South America | 15 | 7 | 18 | 19 | 18 | ||||||||||||||
Return on average equity (e) | 107.8 | 77.7 | 76.1 | 37.4 | 30.0 | ||||||||||||||
Return on average invested capital (f) | 21.2 | 21.2 | 26.0 | 18.7 | 20.5 | ||||||||||||||
Financial Condition | |||||||||||||||||||
Cash and cash equivalents | $ | 79.8 | $ | 77.0 | $ | 127.3 | $ | 119.8 | $ | 138.2 | |||||||||
Net working capital | (63.5 | ) | (105.0 | ) | (53.8 | ) | (22.0 | ) | 2.4 | ||||||||||
Property, plant and equipment, net | 253.6 | 290.3 | 300.9 | 298.8 | 273.1 | ||||||||||||||
Total assets | 1,598.2 | 1,769.8 | 1,843.9 | 1,821.8 | 1,822.6 | ||||||||||||||
Short-term borrowings and current portion of long-term obligations | 162.5 | 221.4 | 235.4 | 203.4 | 195.7 | ||||||||||||||
Long-term obligations | 608.2 | 612.1 | 619.9 | 414.4 | 415.2 | ||||||||||||||
Shareholders’ equity | 161.0 | 185.8 | 252.9 | 479.1 | 500.8 | ||||||||||||||
Current ratio | 0.90 | 0.86 | 0.93 | 0.97 | 1.00 | ||||||||||||||
Other Data | |||||||||||||||||||
Net cash provided by operating activities | $ | 225.7 | $ | 284.1 | $ | 323.5 | $ | 298.7 | $ | 274.7 | |||||||||
Net cash used in investing activities | (43.1 | ) | (62.3 | ) | (60.1 | ) | (64.8 | ) | (68.9 | ) | |||||||||
Net cash used in financing activities | (157.1 | ) | (211.0 | ) | (237.6 | ) | (252.5 | ) | (300.9 | ) | |||||||||
Capital expenditures | 61.1 | 69.4 | 69.0 | 75.6 | 73.9 | ||||||||||||||
Depreciation and amortization | 62.4 | 63.7 | 54.8 | 49.6 | 49.8 | ||||||||||||||
Common Stock Data | |||||||||||||||||||
Dividends declared per share | $ | 2.72 | $ | 2.72 | $ | 2.48 | $ | 1.44 | $ | 1.20 | |||||||||
Dividend payout ratio (g) | 73.1 | % | 63.6 | % | 47.0 | % | 41.3 | % | 33.1 | % | |||||||||
Average common shares outstanding (thousands): | |||||||||||||||||||
Basic | 49,947 | 50,131 | 51,892 | 55,271 | 60,046 | ||||||||||||||
Diluted | 50,401 | 51,011 | 53,079 | 56,413 | 61,432 | ||||||||||||||
Period-end book value per share (h) | $ | 3.19 | $ | 3.64 | $ | 4.76 | $ | 8.49 | $ | 8.15 | |||||||||
Period-end price/earnings ratio (i) | 15.1 | 15.2 | 18.4 | 18.3 | 15.8 | ||||||||||||||
Period-end market/book ratio (j) | 17.5 | 17.5 | 19.9 | 7.4 | 6.9 | ||||||||||||||
(a) | In 2002, the Company began to sell land held for development near its Orlando, Florida headquarters. During 2015, 2014, 2013 and 2011, in connection with this program, pretax gains of $12.9 million, $1.3 million, $0.9 million and $0.7 million, respectively, were included in gains on disposal of assets including insurance recoveries, net. There were no land sales under this program in 2012. |
(b) | Included in gain on disposal of assets including insurance recoveries, net are: |
• | Pretax gains of $0.2 million in 2012 and $3.0 million in 2011, as a result of respective insurance recoveries from flood damage in Venezuela in 2012 and Australia in 2011; and |
• | Pretax gains from the sale of property in Australia of $1.1 million in 2014 and $0.2 million in 2013, a pretax gain of $7.5 million in 2012 from the sale of a facility in Belgium and a pretax gain of $0.2 million of equipment sales in 2012. |
(c) | Valuations completed on the Company’s intangible assets resulted in the conclusion that certain tradenames and goodwill values were impaired. This resulted in non-cash charges of $76.9 million and $36.1 million in 2012 and 2011, respectively. See Note 6 to the Consolidated Financial Statements. |
13
(d) | In 2011, the Company entered into certain credit agreements, which resulted in a non-cash write-off of deferred debt costs to interest expense of $0.9 million. In connection with the termination of the previous credit facilities, the Company also impaired certain floating-to-fixed interest rate swaps resulting in interest expense of $18.9 million. |
(e) | Return on average equity is calculated by dividing net income by the average monthly balance of shareholders’ equity. |
(f) | Return on average invested capital is calculated by dividing net income plus net interest expense multiplied by one minus the estimated marginal tax rate of 37%, by average shareholders’ equity plus debt, for the last five quarters. |
(g) | The dividend payout ratio is dividends declared per share divided by basic earnings per share. |
(h) | Period-end book value per share is calculated as year-end shareholders’ equity divided by full-year diluted shares. |
(i) | Period-end price/earnings ratio is calculated as the year-end market price of the Company’s common stock divided by full year diluted earnings per share. |
(j) | Period-end market/book ratio is calculated as the period-end market price of the Company’s common stock divided by period-end book value per share. |
14
Item 7. Management's Discussion and Analysis of Financial Condition and Results of Operations.
The following is a discussion of the results of operations for 2015 compared with 2014 and 2014 compared with 2013, and changes in financial condition during 2015. The Company’s fiscal year ends on the last Saturday of December and included 52 weeks during 2015, 2014 and 2013. Its 2016 fiscal year will include 53 weeks. This information should be read in conjunction with the consolidated financial information provided in Item 8 of this Annual Report.
The Company's primary means of distributing its products is through independent sales organizations and individuals, which in many cases are also its customers. The vast majority of the Company's products are, in turn, sold to end customers who are not members of its sales force. The Company is largely dependent upon these independent sales organizations and individuals to reach end consumers, and any significant disruption of this distribution network would have a negative financial impact on the Company and its ability to generate sales, earnings and operating cash flows. The Company's primary business drivers are the size, activity, diversity and productivity of its independent sales organizations.
As the impacts of foreign currency translation are an important factor in understanding period-to-period comparisons, the Company believes the presentation of results on a local currency basis, as a supplement to reported results, helps improve readers' ability to understand the Company's operating results and evaluate performance in comparison with prior periods. The Company presents local currency information that compares results between periods as if current period exchange rates had been the exchange rates in the prior period. The Company uses results on a local currency basis as one measure to evaluate performance. The Company generally refers to such amounts as calculated on a "local currency" basis or "excluding the impact of foreign currency." These results should be considered in addition to, not as a substitute for, results reported in accordance with generally accepted accounting principles in the United States ("GAAP"). Results on a local currency basis may not be comparable to similarly titled measures used by other companies.
Estimates included herein are those of the Company’s management and are subject to the risks and uncertainties as described in the Forward Looking Statements caption included in Item 7A.
Overview
(Dollars in millions, except per share amounts)
Total Company Results 2015 vs. 2014
52 weeks ended | Change | Change excluding the impact of foreign exchange | Foreign exchange impact | ||||||||||||||
December 26, 2015 | December 27, 2014 | ||||||||||||||||
Net sales | $ | 2,283.8 | $ | 2,606.1 | (12 | )% | 4 | % | $ | (413.1 | ) | ||||||
Gross margin as a percent of sales | 67.4 | % | 66.1 | % | 1.3 | pp | na | na | |||||||||
DS&A as a percent of sales | 53.3 | % | 51.7 | % | 1.6 | pp | na | na | |||||||||
Operating income | $ | 315.2 | $ | 367.7 | (14 | )% | 14 | % | $ | (91.7 | ) | ||||||
Net income | $ | 185.8 | $ | 214.4 | (13 | )% | 28 | % | $ | (69.3 | ) | ||||||
Net income per diluted share | $ | 3.69 | $ | 4.20 | (12 | )% | 30 | % | $ | (1.36 | ) | ||||||
15
Total Company Results 2014 vs. 2013
52 weeks ended | Change | Change excluding the impact of foreign exchange | Foreign exchange impact | ||||||||||||||
December 27, 2014 | December 28, 2013 | ||||||||||||||||
Net sales | $ | 2,606.1 | $ | 2,671.6 | (2 | )% | 5 | % | $ | (188.8 | ) | ||||||
Gross margin as a percent of sales | 66.1 | % | 66.7 | % | (0.6 | ) pp | na | na | |||||||||
DS&A as a percent of sales | 51.7 | % | 51.3 | % | 0.4 | pp | na | na | |||||||||
Operating income | $ | 367.7 | $ | 403.5 | (9 | )% | 2 | % | $ | (44.1 | ) | ||||||
Net income | $ | 214.4 | $ | 274.2 | (22 | )% | (11 | )% | $ | (33.5 | ) | ||||||
Net income per diluted share | $ | 4.20 | $ | 5.17 | (19 | )% | (7 | )% | $ | (0.64 | ) | ||||||
____________________
na not applicable
pp percentage points
Net Sales
Reported sales decreased 12 percent in 2015 compared with 2014. Excluding the impact of changes in foreign currency exchange rates, sales increased 4 percent, reflecting strong local currency growth in the Company’s emerging market economy businesses, while its sales in established market economy businesses decreased slightly compared with 2014. The Company defines established markets as those in Western Europe including Scandinavia, Australia, Canada, Japan, New Zealand, and the United States. All other markets are classified as emerging markets.
The Company’s units operating in emerging markets accounted for 66 percent of reported sales in both 2015 and 2014. Reported sales in the emerging markets were down 12 percent in 2015 compared with 2014, including a negative translation impact of $303.9 million from changes in foreign currency exchange rates. Excluding the impact of foreign currency, these units had strong growth of 8 percent. The average impact of higher prices in these markets was 4 percent. The strong increase in local currency sales in the Company's emerging market units was primarily in Brazil, due to a significant increase in sales force size and its productivity, and China, reflecting continued growth in the number of experience studios along with higher sales per studio. Also contributing to the local currency sales increase was inflation related pricing in Argentina, the benefit of larger sales forces in Tupperware Mexico and the Company's businesses in the Middle East and North Africa, as well as from significantly increased sales force activity in Tupperware South Africa. The local currency sales growth in these units was partially offset by decreases in Malaysia/Singapore and Turkey, reflecting less active and less productive sales forces. Local currency sales in Indonesia, the Company's largest business unit, decreased slightly in 2015 compared with 2014.
Reported sales in the Company’s units operating in established market economies were down 14 percent, including a negative translation impact of $109.2 million from changes in foreign currency exchange rates. Excluding the impact of foreign currency, sales by these units decreased 2 percent, primarily in France, reflecting lingering impacts on sales force additions and party scheduling from terrorist attacks and changes in the structure of compensation for sales force managers in 2015, Italy, due to less activity and lower productivity, and BeautiControl due to the impacts of a revised sales force compensation plan launched at the beginning of the second quarter. These decreases were partially offset by a strong increase in the United States and Canada, reflecting increased sales volume through a larger sales force from strong additions. The average price increase in the established market units was 1 percent.
Reported sales decreased 2 percent in 2014 compared with 2013. Excluding the impact of changes in foreign currency exchange rates, sales increased 5 percent, reflecting strong growth in the Company’s emerging market economy businesses, while its sales in established market economy businesses decreased compared with 2013.
16
The Company’s emerging markets accounted for 66 and 65 percent of reported sales in 2014 and 2013, respectively. Reported 2014 sales in the emerging markets were down 1 percent compared with 2013, including a negative $173.1 million translation impact on the comparison from changes in foreign currency exchange rates. Excluding the impact of foreign currency, these units had strong growth of 10 percent. The average impact of higher prices in these markets was 9 percent. The strong local currency results in the emerging markets were led by Argentina, Brazil, China, Indonesia, Turkey and Venezuela. This primarily reflected larger and more productive sales forces, significant growth in the number of experience studios and studio productivity in China and significant inflation related price increases in some of the units, as well as a product mix benefit in Argentina. Venezuela contributed to the local currency sales increase, primarily reflecting inflation related price increases, despite government restrictions reducing the prices that would otherwise have been charged, as well as higher volume of products sold through a more productive sales force. Among the emerging market units, those with notable declines in local currency sales were Fuller Mexico, due to a smaller sales force resulting from lower additions of sales force members, mainly from high field manager turnover; India, reflecting a smaller and less active sales force; as well as in Russia due to the external political and economic situation and continuing challenges in additions and activation of sales force members. The Company’s established market businesses' sales were down 5 percent, including a negative $15.8 million translation impact on the comparison from changes in foreign currency exchange rates. Excluding the impact of foreign currency, sales by these units decreased 4 percent. The average price increase in the established market units was 2 percent. Among these units, there was a larger local currency decrease in Germany, due to a less active sales force, along with the loss of sales in light of the decision to cease operating the Armand Dupree business in the United States in the second quarter of 2014.
Specific segment impacts are further discussed in the Segment Results section.
Gross Margin
Gross margin as a percentage of sales was 67.4 percent in 2015 and 66.1 percent in 2014. The increase of 1.3 percentage points ("pp") primarily reflected better pricing and mix (1.0 pp), favorable resin pricing (0.5 pp), a lower year-over-year impact of inventory in Venezuela being included in cost of goods sold at its stronger, historical exchange rate rather than the rate used to translate its sales (0.4 pp), the translation impact of changes in foreign currency exchange rates (0.3 pp). These were partially offset by the mix impact from relatively higher sales in certain units with lower than average gross margins, primarily in South America (0.6 pp) and increased manufacturing costs (0.5 pp).
Gross margin as a percentage of sales was 66.1 percent in 2014 and 66.7 percent in 2013. The decrease of 0.6 percentage points primarily reflected the net year-over-year impact of inventory in Venezuela being included in cost of goods sold at its stronger, historical exchange rate rather than the rate used to translate sales (0.6 pp). Also contributing to the decrease in gross margin were higher resin costs (0.5 pp), the mix impact from relatively higher sales in certain units with lower than average gross margins, primarily in South America (0.2 pp), and higher obsolescence, particularly in Beauty North America due to the decision to cease operating the Armand Dupree business in the United States (0.2 pp). These decreases were partially offset by the impact of product mix in light of changes in manufacturing costs and related price increases that had a positive impact on the gross margin comparison (0.7 pp) and the translation impact of changes in foreign currency exchange rates, mainly in South America (0.2 pp).
Operating Expenses
Delivery, sales and administrative expense ("DS&A") as a percentage of sales was 53.3 percent in 2015, compared with 51.7 percent in 2014. The higher DS&A expense was primarily due to the translation effect of changes in foreign currency exchange rates, particularly the impact of overall dollar denominated costs as a ratio of sales in light of weaker foreign exchange rates (1.5 pp), as well as increased unallocated corporate expenses related to global initiative investments and management incentive accruals (0.3 pp) and higher freight costs, mainly in Tupperware North America (0.1 pp). These were partially offset by lower commission expense due to the mix of sales performances in units that pay commissions versus those that do not (0.2 pp) and decreased promotional costs in Beauty North America and Europe (0.1 pp).
17
DS&A as a percentage of sales was 51.7 percent in 2014, compared with 51.3 percent in 2013. The higher DS&A percentage in 2014 was primarily due to mix in light of weaker foreign currency exchange rates in units that have relatively low DS&A expenses as a percentage of sales, particularly in Venezuela, as well as the impact of overall dollar costs as a ratio of sales that are higher in light of weaker foreign exchange rates (0.8 pp), higher warehousing costs in Brazil (0.4 pp), amortization of the Company's definite-lived tradename intangible asset that began in September 2013 (0.3 pp) and higher freight costs in Asia and Tupperware North America (0.2 pp). These were partially offset by lower unallocated corporate expenses, mainly for lower accruals under the Company's incentive plans (0.3 pp), lower promotional spending in Asia and Tupperware North America (0.3 pp), lower marketing costs in Asia (0.3 pp), lower selling costs in Beauty North America (0.2 pp) and lower commission expense due to the mix of sales performances in units that pay commissions versus those that do not (0.2 pp).
The Company segregates corporate operating expenses into allocated and unallocated components based upon the estimated time spent managing segment operations. The allocated costs are then apportioned on a local currency basis to each segment based primarily upon segment revenues. The unallocated expenses reflect amounts unrelated to segment operations. Operating expenses to be allocated are determined at the beginning of the year based upon estimated expenditures. Total unallocated expenses in 2015 increased $16.9 million compared with 2014, reflecting higher incentive and equity compensation costs and the impact from variations in foreign exchange rates.
Total unallocated expenses in 2014 decreased $6.5 million compared with 2013, reflecting lower incentive and equity compensation costs and the impact from variations in foreign exchange rates.
As discussed in Note 1 to the Consolidated Financial Statements, the Company includes costs related to the distribution of its products in DS&A expense. As a result, the Company’s gross margin may not be comparable with other companies that include these elements in cost of products sold.
Re-engineering Costs
As the Company continuously evaluates its operating structure in light of current business conditions and strives to maintain the most efficient possible structure, it periodically implements actions designed to reduce costs and improve operating efficiency. These actions often result in re-engineering costs related to headcount reductions and to facility downsizing and closure, as well as related asset write downs and other costs that may be necessary in light of the revised operating landscape. In addition, the Company may recognize gains or losses upon disposal of closed facilities or other activities directly related to its re-engineering efforts. Included in 2015 net income were pretax charges of $6.8 million for re-engineering and impairment charges, compared with $11.0 million and $9.3 million in 2014 and 2013, respectively.
Over the past three years, the Company has incurred such costs as detailed below that were included in the following income statement captions:
(In millions) | 2015 | 2014 | 2013 | ||||||||
Re-engineering and impairment charges | $ | 6.8 | $ | 11.0 | $ | 9.3 | |||||
Cost of products sold | — | 2.3 | — | ||||||||
Total pretax re-engineering costs | $ | 6.8 | $ | 13.3 | $ | 9.3 | |||||
The severance costs incurred were associated with headcount reductions in several of the Company's operations in connection with changes in its management and organizational structures, and in 2014, the decision to cease operating the Armand Dupree business in the United States, the Nutrimetics business in Thailand and a manufacturing plant in India. In 2014, this also included a write-off of $1.1 million in capitalized software in connection with a new information systems project, and in 2013 amounts related to changes in the Company's European operations.
See also Note 2 to the Consolidated Financial Statements, regarding the Company's re-engineering actions.
18
Fixed Asset Impairment
In February 2015, the Venezuelan government launched an overhaul of its foreign currency exchange structure, eliminating the SICAD 2 mechanism that the Company had referenced for translating and measuring its financial statements, replacing it with a new exchange mechanism called Simadi. During the first quarter of 2015, Simadi published a rate that was approximately 75 percent lower than the final SICAD 2 rate, which was expected to, and subsequently has, severely reduced the unit’s sales and profit. As a result, the Company deemed this change to be a triggering event to evaluate the $15.7 million of long-term fixed assets in Venezuela at that time, which had continued to be included on the balance sheet at the historical rates in effect when the assets were purchased. As a result of this evaluation, the Company recorded an impairment charge of $13.5 million to reduce the carrying value of its long-term fixed assets in Venezuela in the first quarter of 2015. This impairment charge was included in the re-engineering and impairment charge caption of the Company's consolidated income statement.
A more detailed description of the changes in the Venezuelan exchange mechanisms and the resulting impacts on the Company is provided below in the discussion of the South America segment.
See Note 2 to the Consolidated Financial Statements for further details regarding the circumstances leading to the triggering event and the impairment conclusion.
Goodwill and Intangible Assets
In the third quarters of 2015 and 2014, the Company completed the annual impairment assessments for all of its reporting units and indefinite-lived intangible assets, concluding there were no impairments. The Company only considers the 2015 goodwill balances of $88.6 million and $23.5 million associated with the Fuller Mexico and NaturCare reporting units, respectively, to be significant relative to total equity.
The Company completed a step 1 analysis related to Fuller Mexico, for which the significant assumptions included annual revenue changes ranging from negative 2 percent to positive 5 percent with an average growth rate of 3 percent, including a 3 percent growth rate used in calculating the terminal value. The discount rate used in Fuller Mexico was 14.6 percent. As the forecast results of Fuller Mexico at the time the step 1 analysis was completed were below the expectations used in completing the step 1 analysis done in 2014, the amount by which the estimated fair value of the Fuller Mexico reporting unit exceeded its carrying value, at 13 percent, was smaller in the third quarter of 2015 than in the 2014 assessment. This decrease reflected lower than expected additions of sales force members in light of high field manager turnover. Along with a difficult competitive environment, this led to worse 2015 operating performance than foreseen in 2014. Field managers are those directly responsible for sales force additions, motivating and training sales force members. Local currency sales and operating profit have been declining since 2011, at which time the fair value of Fuller Mexico exceeded the carrying value by 77 percent. Since 2011, local currency sales declined 9 percent in 2012, 7 percent in 2013 and 3 percent in 2014. Continuing this trend of sequential improvements, local currency sales declined 2 percent in 2015. Over this same time period, operating profit as a percentage of sales declined from 15 percent in 2012 to 10 percent in 2015. This operating performance has led to decreases in the estimated fair value over time, but have been offset by lower discount rates and a lower entity carrying value from amortization of the definite lived Fuller tradename asset that began in the third quarter of 2013, as well as a net asset position that has, over time, been reduced in light of the smaller scope of the business. As of the end of the third quarter, Fuller Mexico had a year-over-year sales force size advantage of 1 percent, despite less new seller additions, reflecting new programs aimed at higher rates of retention. There are also programs intended to create a pipeline of strong candidates who can be trained and motivated for promotion to field manager, a critical component of growth going forward. While the sales force size advantage evolved to a slight deficit as of the end of 2015, at least in part due to a competitor's promotional activity, the Company anticipates it will be able to improve its key performance indicators going forward. As a result of these factors including the assumptions made, the fair value exceeded the carrying value as of the end of the third quarter of 2015. Despite these positive performance indicators in the business and the amount by which the estimated fair value of the reporting unit exceeded its carrying value, a smaller sales force size, reversal of retention rates, operating performance significantly below current expectations, including changes in projected future revenue, profitability and cash flow, as well as higher working capital, interest rates or cost of capital, could have a further negative effect on the estimated fair value of the reporting unit and therefore reduce the estimated fair value below the carrying value. This could result in recording an impairment to the goodwill of Fuller Mexico, including prior to the 2016 annual assessment.
19
A step 1 analysis was also performed for NaturCare, which had significant assumptions including annual revenue growth ranging from 3 percent to 5 percent with an average growth rate of 4 percent, including a 3 percent growth rate used in calculating the terminal value. The discount rate used in NaturCare was 10 percent. The estimated fair value of the NaturCare reporting unit exceeded the carrying value by 130 percent. Based on the Company's evaluation of the assumptions and sensitivities associated with the step 1 analysis for NaturCare, the Company concluded that the fair value substantially exceeded its carrying value as of the end of the third quarter of 2015.
Other than for the Fuller Mexico reporting unit, management has concluded there is no significant foreseeable risk of failing a future step 1 impairment evaluation, nor is there significant foreseeable risk of the fair value of the indefinite-lived intangible assets falling below their respective carrying values. Given the sensitivity of fair value valuations to changes in cash flow or market multiples, the Company may be required to recognize an impairment of goodwill or indefinite-lived intangible assets in the future due to changes in market conditions or other factors related to the Company’s performance. Actual results below forecasted results or a decrease in the forecasted future results of the Company’s business plans or changes in discount rates could also result in an impairment charge, as could changes in market characteristics including declines in valuation multiples of comparable publicly-traded companies. Impairment charges would have an adverse impact on the Company’s net income and shareholders' equity.
Refer to Note 6 of the Consolidated Statements.
Gains on Disposal of Assets
The Company continues with its program to sell land for development near its Orlando, Florida headquarters, which began in 2002, recognizing gains of $12.9 million and $1.3 million under this program in 2015 and 2014, respectively. There were no land sales under this program in 2013. Included in this caption in 2013 was $0.9 million related to the collection of proceeds on land sold in 2006. Gains on land transactions are recorded based upon when the transactions close and proceeds are collected. Transactions in one period may not be representative of what may occur in future periods. Since the Company began this program in 2002, cumulative proceeds from these sales have totaled $88.0 million with an additional $55 to $80 million expected as the program is completed. The carrying value of the remaining land included in the Company's land sales program was $18.4 million as of December 26, 2015. Of this amount, $2.1 million has been classified in other short-term assets as the Company expects to sell certain parcels within the next twelve months for amounts exceeding the carrying value. The remaining carrying value of land was included in property, plant and equipment held for use within the Consolidated Balance Sheet as it is not considered probable that any significant land sales will be completed within one year. The Company has concluded that the fair value of the land under this program significantly exceeded the carrying value as of the end of 2015 and will continue to do so into the foreseeable future. Also in 2014, the Company recognized gains of $1.1 million from the sale of land in Australia.
In addition, during the fourth quarter of 2015 and first quarter of 2014, the Company entered into two joint ventures with a real estate development partner. The Company contributed $0.8 million and $3.1 million in land from the Company's Orlando land program to the respective joint ventures in 2015 and 2014, respectively, in exchange for 50 percent ownership of each joint venture. The Company's ownership interest in the joint ventures are accounted for using the equity method and was included at a carrying value of $4.8 million in short-term other assets on the December 26, 2015 balance sheet as the Company expects to sell its interest in the joint ventures within the next 12 months at an amount that exceeds the carrying value. While the Company has contributed a limited amount of cash to the joint ventures, the Company does not expect to have any significant cash inflows or outflows related to these joint ventures until such time as the joint ventures complete and sell their respective developments.
Net Interest Expense
Net interest expense was $45.2 million in 2015, compared with $43.5 million in 2014. Interest expense increased in the year-over-year comparison reflecting relative changes in forward points related to the Company's cash flow hedges, partially offset by lower interest expense on lower average borrowings and lower interest rates during the year.
20
Net interest expense was $43.5 million in 2014, compared with $37.6 million in 2013. Interest expense increased in the year-over-year comparison primarily as a result of a higher level of debt in 2014, reflecting increased borrowings over the course of 2013 to achieve the Company's leverage target announced at the beginning of that year, as well as a higher amount of forward points related to the Company's cash flow hedging activities in 2014. Also contributing to the increase in 2014 interest was the issuance of senior notes at the end of the first quarter of 2013 at a higher fixed interest rate than the floating rate revolving credit borrowings that were replaced.
Tax Rate
The effective tax rates for 2015, 2014 and 2013 were 28.5, 28.1 and 23.9 percent, respectively. During the fourth quarter of 2013, a change in Mexican tax law resulted in additional foreign tax costs that were offset by tax credit benefits that netted to a benefit of $6.8 million. The effective tax rates for 2015, 2014 and 2013 are below the U.S. statutory rate, reflecting the availability of excess foreign tax credits, as well as lower foreign effective tax rates.
Tax rates are affected by many factors, including the global mix of earnings, changes in tax legislation, acquisitions or dispositions as well as the tax characteristics of income. The Company is required to make judgments on the need to record deferred tax assets and liabilities, uncertain tax positions and assessments regarding the realizability of deferred tax assets in determining the income tax provision. The Company has recognized deferred tax assets based upon its analysis of the likelihood of realizing the benefits inherent in them. At December 26, 2015 and December 27, 2014, the Company had valuation allowances against certain deferred tax assets totaling $23.1 million and $40.2 million, respectively. The reduction in valuation allowance balance related to a $10.0 million write off of net operating losses for which a valuation allowance had already been recorded and $7.1 million related to currency translation. These valuation allowances relate to tax assets in jurisdictions where it is management's best estimate that there is not a greater than 50 percent probability that the benefit of the assets will be realized in the associated tax returns. This assessment is based upon expected future domestic results, future foreign dividends from then current year earnings and cash flows and other foreign source income, including rents and royalties, as well as anticipated gains related to future sales of land held for development near the Company's Orlando, Florida headquarters. In addition, certain tax planning transactions may be entered into to facilitate realization of these benefits. In evaluating uncertain tax positions, the Company makes determinations regarding the application of complex tax rules, regulations and practices. Uncertain tax positions are evaluated based on many factors including but not limited to changes in tax laws, new developments and the impact of settlements on future periods. Refer to the critical accounting policies section and Note 12 to the Consolidated Financial Statements for additional discussions of the Company's methodology for evaluating deferred tax assets.
As of December 26, 2015 and December 27, 2014, the Company's gross unrecognized tax benefit was $21.8 million and $22.5 million, respectively. During the year ended December 26, 2015, the accrual for uncertain tax positions decreased by $1.1 million primarily as a result of the Company agreeing to tax settlements in various foreign jurisdictions, as well as a $3.2 million decrease of accruals for uncertain tax positions due to the expiration of the statute of limitations in various jurisdictions. During the year, increases in uncertain positions being taken during the year in various foreign tax jurisdictions were partially offset by the impact of foreign exchange rate translation.
The Company estimates that it may settle one or more foreign and domestic audits in the next twelve months that may result in a decrease in the amount of accrual for uncertain tax positions of up to $1.0 million. For the remaining balance as of December 26, 2015, the Company is not able to reliably estimate the timing or ultimate settlement amount. While the Company does not currently expect material changes, it is possible that the amount of unrecognized benefit with respect to the uncertain tax positions will significantly increase or decrease related to audits in various foreign jurisdictions that may conclude during that period or new developments that could also, in turn, impact the Company's assessment relative to the establishment of valuation allowances against certain existing deferred tax assets. At this time, the Company is not able to make a reasonable estimate of the range of impact on the balance of unrecognized tax benefits or the impact on the effective tax rate related to these items.
21
Net Income
For 2015, operating income decreased 14 percent compared with 2014, which included a 28 percent negative translation impact on the comparison from changes in foreign currency exchange rates. Net income decreased 13 percent on a reported basis. Excluding the translation impact of foreign exchange rates, net income was 28 percent higher than 2014. The increase in local currency net income came primarily in South America, reflecting an improved gross margin and the contribution margin on increased sales in Brazil, as well as $27.5 million in lower expenses related to inventory and net monetary assets in connection with the devaluation of the currency exchange rates in Venezuela during the first half of 2014 and 2015. Venezuela is accounted for as hyperinflationary. Higher sales in Asia and Tupperware North America also contributed to the local currency net income increase, while Beauty North America, despite lower sales, benefited from value chain improvements in BeautiControl that were launched in the second quarter of 2015. In addition, the Company had $11.0 million higher gains in connection with land transactions near the Company's Orlando headquarters. These local currency increases were partially offset by lower segment profit in Europe, despite being even in sales, higher unallocated corporate costs, primarily reflecting higher incentive accruals under the Company's incentive plans, as well as increased tax expense on significantly higher local currency pretax income.
For 2014, operating income decreased 9 percent compared with 2013, which included an 11 percent negative translation impact on the comparison from changes in foreign currency exchange rates. Net income decreased 22 percent on a reported basis. Excluding the translation impact of foreign exchange rates, net income was 11 percent lower than 2013. The decrease in local currency net income came primarily in South America, reflecting the negative impact on pretax income of $46.2 million related to inventory and net monetary assets on the balance sheet of Venezuela when the Venezuelan bolivar devalued. Excluding these amounts and the other translation impacts of changes in foreign exchange rates, net income increased 8 percent in 2014. This increase was due to the contribution margin on higher sales in Asia and a more efficient value chain in Tupperware North America, higher gains on the sale of land near the Orlando headquarters and in Australia, as well as the benefit of lower pension settlement costs in 2014. In addition, the Company recorded $4.6 million in foreign exchange gains in connection with purchasing U.S. dollars with Venezuelan bolivars at rates more favorable than the rates used to translate those bolivars. These increases were partially offset by decreases in segment profit from lower sales in Beauty North America and Europe, higher supply chain costs in Brazil, higher interest expense from higher debt and increased levels of cash flow hedges, as well as higher Fuller tradename amortization cost in connection with the change in its classification from being indefinite-lived to definite-lived near the end of the third quarter of 2013.
International operations accounted for 91 percent of the Company's sales in 2015 and 2013, and 92 percent in 2014. They accounted for 99 percent of the Company's segment profit in 2015 and 100 percent in 2014 and 2013.
22
Segment Results 2015 vs. 2014
(Dollars in millions) | 2015 | 2014 | Change | Change excluding the translation impact of foreign exchange | Translation foreign exchange impact | Percent of total | |||||||||||||||||||||
Dollar | Percent | 2015 | 2014 | ||||||||||||||||||||||||
Net Sales | |||||||||||||||||||||||||||
Europe | $ | 604.9 | $ | 730.3 | $ | (125.4 | ) | (17)% | — | $ | (125.3 | ) | 27 | % | 28 | % | |||||||||||
Asia Pacific | 779.0 | 849.9 | (70.9 | ) | (8 | ) | 1 | (81.3 | ) | 34 | 32 | ||||||||||||||||
Tupperware North America | 353.7 | 349.9 | 3.8 | 1 | 11 | (30.4 | ) | 15 | 14 | ||||||||||||||||||
Beauty North America | 240.0 | 290.9 | (50.9 | ) | (17 | ) | (6 | ) | (35.9 | ) | 11 | 11 | |||||||||||||||
South America | 306.2 | 385.1 | (78.9 | ) | (20 | ) | 25 | (140.2 | ) | 13 | 15 | ||||||||||||||||
Total net sales | $ | 2,283.8 | $ | 2,606.1 | $ | (322.3 | ) | (12)% | 4% | $ | (413.1 | ) | 100 | % | 100 | % | |||||||||||
Segment profit | |||||||||||||||||||||||||||
Europe | $ | 93.3 | $ | 118.2 | $ | (24.9 | ) | (21)% | (5)% | $ | (19.6 | ) | 24 | % | 29 | % | |||||||||||
Asia Pacific | 175.0 | 191.0 | (16.0 | ) | (8 | ) | 1 | (17.7 | ) | 45 | 47 | ||||||||||||||||
Tupperware North America | 67.4 | 68.3 | (0.9 | ) | (1 | ) | 12 | (8.3 | ) | 18 | 17 | ||||||||||||||||
Beauty North America | 2.3 | 1.3 | 1.0 | 82 | + | (4.6 | ) | 1 | — | ||||||||||||||||||
South America | 46.5 | 27.1 | 19.4 | 71 | + | (33.8 | ) | 12 | 7 | ||||||||||||||||||
Segment profit as a percent of sales | |||||||||||||||||||||||||||
Europe | 15.4 | % | 16.2 | % | na | (0.8 | )pp | (0.9 | )pp | 0.1 | pp | na | na | ||||||||||||||
Asia Pacific | 22.5 | 22.5 | na | — | — | — | na | na | |||||||||||||||||||
Tupperware North America | 19.1 | 19.5 | na | (0.4 | ) | 0.3 | (0.7 | ) | na | na | |||||||||||||||||
Beauty North America | 1.0 | 0.4 | na | 0.6 | 2.3 | (1.7 | ) | na | na | ||||||||||||||||||
South America | 15.2 | 7.0 | na | 8.2 | 17.9 | (9.7 | ) | na | na | ||||||||||||||||||
____________________
pp Percentage points
na Not applicable
+ Increase is greater than 100 percent
Europe
Reported sales decreased 17 percent in 2015 compared with 2014. Excluding the translation impact of foreign currency exchange rates, sales were even with 2014. The average price increase was 3 percent in 2015.
Emerging markets accounted for $221.7 and $246.6 million of reported net sales in this segment in 2015 and 2014, respectively, which represented 37 percent of sales in each period. On a local currency basis, the emerging market units' sales increased by 10 percent, primarily reflecting a significant increase in Tupperware South Africa due to significantly increased sales force activity in connection with successful sales force promotional programs and a significantly larger sales force in the Middle East and North Africa resulting from strong sales force additions and retention. As well, Avroy Shlain, the Company's beauty business in South Africa, had a significant increase in sales due to strong sales force additions that increased the sales force size and consequently the volume of products sold. These were partially offset by decreased sales in Turkey from lower productivity in connection with reduced consumer spending in light of political instability and terrorist and military activity.
23
Local currency sales in the Company’s established markets, which the Company defines as Western Europe, including Scandinavia, decreased by 5 percent, reflecting a smaller, less active sales force in France in light of the lingering impacts on sales force additions and party scheduling from terrorist attacks in 2015 and changes in the structure of compensation for sales force managers, as well as a less active and less productive sales force in Italy. These decreases were partially offset by a slight increase in Germany from a larger sales force and its increased productivity.
Segment profit decreased $24.9 million, or 21 percent in 2015 compared with 2014. Segment profit as a percentage of sales was 15.4 percent in 2015 compared with 16.2 percent in 2014. Excluding the translation impact of foreign currency exchange rates, segment profit decreased 5 percent compared with 2014. On a local currency basis, the decrease in local currency segment profit was primarily due to lower sales in units with relatively high contribution margins compared with the units that had increased sales, except in Turkey where the operating margin was lower than would be expected in light of increased distribution and promotional costs to support future sales growth, as well as increased administration costs.
The negative translation impact of foreign currency rates on the year-over-year comparison of sales versus the U.S. dollar was primarily attributable to the weaker euro, Russian ruble, South African rand and Turkish lira, while only the euro, South African rand and the Turkish lira had a significant impact on the profit comparison.
The Company's business in Egypt performed well in 2015, generating meaningful sales and profit increases and cash in Egyptian pounds. Product for this business is sourced primarily from the Company’s manufacturing facilities in Europe, and due to the imposition of stricter currency controls in 2015, the intercompany amount owed by the Egyptian business for the product and related costs totaled $8.8 million as of December 26, 2015. This amount could grow further due to additional currency controls in 2016, notwithstanding that the Egyptian subsidiary held $9.1 million worth of Egyptian pounds as of the end of 2015. The cash balance in Egyptian pounds could also increase in light of amounts due from customers at the end of 2015, and from future sales. In light of the currency control structure in Egypt, the Company is not able to predict, at this time, whether it will be able to exchange Egyptian pounds into a more accessible currency, such as euro or U.S. dollars in order to pay down the existing intercompany payable balance or future amounts generated. This could impact the level at which the Company chooses to operate in Egypt in the near future and may negatively impact sales and segment profit.
Asia Pacific
Reported sales in Asia Pacific in 2015 decreased 8 percent compared with 2014. Excluding the translation impact of foreign currency exchange rates, the segment's sales increased 1 percent, reflecting growth in the emerging market businesses, primarily due to higher volume in China. The average price increase for the segment was 1 percent.
Emerging markets include Bangladesh, China, India, Indonesia, Korea, Malaysia/Singapore, the Philippines and Vietnam, and accounted for $646.6 million and $691.1 million, or 83 and 81 percent, of the sales in this segment in 2015 and 2014, respectively. Total emerging market sales decreased $44.5 million, or 6 percent, in 2015 compared with 2014. The comparison was negatively impacted by changes in foreign currency exchange rates totaling $57.7 million. Excluding the impact of foreign currencies, these markets' sales increased by 2 percent in 2015. The most significant contribution to the overall increase was in China, where at the end of 2015, the Company operated 5,200 experience studios through independent distributors. The increase in China primarily related to significant growth in the number of experience studios due to a positive response to new distributor and studio incentive programs, along with higher productivity in the studios located in more residential areas. The increase in China was partially offset by a decrease in Malaysia/Singapore, due to a less active and less productive sales force, despite a larger sales force from strong additions, reflecting high turnover in independent sales force leaders that are responsible for sales force additions, training and motivation. Indonesia, the Company's largest business unit, was down slightly due to poor response to consumer offers in light of an economic slowdown and a decrease in consumer spending.
Reported sales in the established markets decreased 17 percent. Excluding the impact of foreign currencies, these markets' sales decreased 2 percent, primarily from a lower volume of products sold.
Total segment profit decreased $16.0 million, or 8 percent, in 2015. Segment profit as a percentage of sales at 22.5 percent was even with 2014. The segment profit comparison was negatively impacted by changes in foreign currency, and excluding this impact, segment profit increased 1 percent compared with 2014, which generally follows the local currency net sales increase performance of the respective units.
24
The Australian dollar, Indonesian rupiah, Japanese yen and Malaysian ringgit were the most significant currencies that led to the negative translation impact from foreign currencies on the year-over-year sales comparison. The Indonesian rupiah and Malaysian ringgit were the main currencies that had a negative translation impact on the profit comparison.
Tupperware North America
Reported sales increased 1 percent in 2015 compared with 2014. Excluding the translation impact of foreign currency exchange rates, sales increased 11 percent with the prior year, reflecting strong growth in both Mexico and the United States and Canada. The increase in Mexico was primarily due to increased volume from a larger sales force from programs geared towards the addition and training of new sales force members, as well as improved productivity in connection with higher pricing. The United States and Canada also increased sales volume through a larger sales force on strong additions, despite having to manage through modifications to the sales force compensation plan in Canada and the announcement, in the fourth quarter of 2015, that similar changes will occur in the United States. The average price increase in this segment was 3 percent.
Segment profit decreased $0.9 million, or 1 percent, in 2015 compared with 2014. Segment profit as a percentage of sales at 19.1 percent was 0.4 percentage points lower in 2015 than in 2014. Excluding the impact of changes in foreign currency exchange rates, segment profit grew 12 percent, reflecting the contribution margin from higher sales along with an improved gross margin and favorable product mix in Mexico. The segment profit in the United States and Canada decreased slightly due to increased operating expenses, as well as incremental expenses in connection with implementation and communication to the sales force of the compensation plan modifications.
The Mexican peso was the main foreign currency that impacted the year-over-year comparisons.
Beauty North America
Reported sales for this segment were down 17 percent in 2015. Excluding the impact of foreign currency exchange rates, sales decreased 6 percent reflecting a smaller, less active sales force in Fuller Mexico due to lower than expected additions and retention of sales force members in light of the competitive environment and macroeconomic conditions in that market, as well as high field manager turnover. Field managers are those directly responsible for sales force additions, motivating and training sales force members. BeautiControl also had lower sales due to a smaller and less productive sales force, due in part to the updated sales force compensation plan that began in the second quarter of 2015. In addition, the decision in April 2014, to cease operating the Armand Dupree business in the United States had a 1 percentage point impact on the comparison. On average, prices increased in this segment by 5 percent.
Segment profit increased $1.0 million, or 82 percent, in 2015 compared with 2014. Segment profit as a percentage of sales, at 1.0 percent, was 0.6 percentage points higher than 2014. Foreign currency exchange rates negatively impacted the comparison by $4.6 million. The increase in local currency profit reflected a lower loss by BeautiControl in connection with value chain improvements connected to the new sales force compensation model, which included an improved gross margin from changes to the pricing structure, more efficient promotional spending and lower overall operating costs. This increase to segment profit was partially offset by lower profit at Fuller Mexico from lower sales with a lower gross margin percentage. The closure of Armand Dupree did not significantly impact the profit comparison.
The Mexican peso was the main foreign currency that impacted the year-over-year comparisons.
South America
Reported sales for this segment decreased 20 percent in 2015 compared with 2014. Excluding the translation impact of changes in foreign currency exchange rates, sales increased 25 percent. Of the 25 percent increase in sales in local currency, approximately half of the increase reflected the impact of higher prices, mainly in Argentina and Brazil. The remaining increase was the result of higher volume of products sold.
The most significant increase in local currency sales was in Brazil, the largest unit in South America, primarily from higher volume of products sold along with increased prices. The volume improvement reflected a significant sales force size advantage, the launch of new, attractive products that energized the sales force and created demand from end consumers, driving higher productivity and electronic point-of-sales offers to the sales force. Argentina's sales also increased significantly due to higher prices in light of significant inflation.
25
Segment profit increased $19.4 million, or 71 percent, in 2015 compared with 2014, including a negative $33.8 million impact from changes in foreign currency exchange rates. Segment profit as a percentage of sales, at 15.2 percent, was 8.2 percentage points higher than in 2014. The most significant increase in local currency segment profit was in Brazil from the higher sales, an improved gross margin and the benefit of not incurring incremental warehousing and distribution costs experienced in 2014. Argentina also contributed to the increased local currency profit due to higher sales and an improved gross margin. In addition, there was $27.5 million less expense in 2015 in connection with items on the Venezuelan balance sheet that were impacted by the weakening of the currency exchange rate in Venezuela that occurred in 2014 and the first half of 2015. In addition, the negative translation impact on the segment profit comparison from the devaluation of the Venezuelan bolivar to U.S. dollar rate used in 2015 versus 2014 was $19.1 million.
The Brazilian real and Venezuelan bolivar were the main currencies with significant negative translation impacts on the year-over-year comparisons.
The bolivar to U.S. dollar exchange rates used in translating the Company’s 2014 operating activity was 6.3 in the first quarter, 10.8 in the second quarter and 50.0 in the second half of 2014 and in January 2015. In February 2015, the Venezuelan government launched an overhaul of its foreign currency exchange structure for obtaining U.S. dollars, eliminating the SICAD 2 auction process and introducing the Simadi mechanism. As a result, the Company used 172.0 bolivars to the U.S. dollar to translate its February 2015 operating activity and 190.0 to translate its March 2015 operating activity and to remeasure the end of March balance sheet. The Company used a rate of about 199 as of the end of 2015. The Company continues to expect to use the Simadi rate to translate future operating activity. In 2015, sales and operating profit in Venezuela were $8.9 million and $1.6 million, respectively, notwithstanding the fixed asset impairment of $13.5 million. The translation impact on each of the year-over-year comparisons of weaker exchange rates in 2015 versus 2014 was $61.4 million and $19.1 million, which was primarily realized during the first half of 2015. The impact in 2015 of re-measuring the net monetary assets and recording in cost of sales inventory at the exchange rate when it was purchased or manufactured was $14.9 million and $42.4 million in 2015 and 2014, respectively.
In light of the currency exchange mechanism, the Company is not able to predict, at this time, whether it will be able to exchange Venezuelan bolivars into U.S. dollars or what rate will be available in the future as the rate is expected to fluctuate on a daily basis. If the exchange rate used by the Company to translate its Venezuelan results remains at approximately 200 bolivars to the U.S. dollar in 2016, there will be negative translation impacts of $1.4 million and $0.5 million on sales and segment profit, respectively from the weaker rate compared with 2015.
As of the end of 2015, the Company had $1 million in net monetary assets denominated in Venezuelan bolivars (measured at the Simadi rate), including $1 million in cash and cash equivalents, which would be directly impacted by any changes in the exchange rate. In addition, there were $25.5 million in cumulative foreign currency translation losses related to Venezuela included in equity within the consolidated balance sheets.
The business model in Venezuela is largely the same as in the Company's other business units around the world, in which the Company utilizes direct-to-consumer marketing to sell its products through local, independent sales force members. The most significant portion of products sold in Venezuela are manufactured in the Company's local manufacturing plant. While the unit generally has obtained raw materials from local sources, it has at times needed to import raw materials from other subsidiaries owned by the Company. The Company has recorded $24.9 million in intercompany payables on the Venezuelan balance sheet in connection with the procurement of such raw materials and, to a lesser extent, finished goods, as well as intercompany royalties, mold rent and dividends. These payables were eliminated in consolidating the Company's results. The Venezuelan subsidiary has not been able to pay these intercompany amounts, though it was able to obtain U.S. dollars in the latter part of 2014 to procure and pay for raw materials. Given the economic situation and currency convertibility limitations in Venezuela, the Company generally considers any unpaid intercompany amounts to represent contributed capital to the Venezuelan subsidiary, particularly since there is no current expectation of obtaining U.S. dollars to pay these amounts. In the future, the Company may contribute further resources to the Venezuelan subsidiary in order to support operations, though these amounts are not expected to be material to the Company or to significantly impact overall liquidity. Sales and operating profit in Venezuela, measured at the current Simadi rate, represent less than half a percent of total Company sales, segment profit and assets. As such, the impact of any future changes in the U.S. dollar and Venezuelan bolivar is not expected to have a material impact on the Company's results.
26
Segment Results 2014 vs. 2013
(Dollars in millions) | 2014 | 2013 | Change | Change excluding the translation impact of foreign exchange | Translation foreign exchange impact | Percent of total | |||||||||||||||||||||
Dollar | Percent | 2014 | 2013 | ||||||||||||||||||||||||
Net Sales | |||||||||||||||||||||||||||
Europe | $ | 730.3 | $ | 771.5 | $ | (41.2 | ) | (5 | )% | (1 | )% | $ | (32.9 | ) | 28 | % | 29 | % | |||||||||
Asia Pacific | 849.9 | 848.1 | 1.8 | — | 6 | (48.3 | ) | 32 | 31 | ||||||||||||||||||
Tupperware North America | 349.9 | 358.0 | (8.1 | ) | (2 | ) | — | (8.2 | ) | 14 | 14 | ||||||||||||||||
Beauty North America | 290.9 | 320.1 | (29.2 | ) | (9 | ) | (6 | ) | (9.5 | ) | 11 | 12 | |||||||||||||||
South America | 385.1 | 373.9 | 11.2 | 3 | 36 | (89.9 | ) | 15 | 14 | ||||||||||||||||||
Total net sales | $ | 2,606.1 | $ | 2,671.6 | $ | (65.5 | ) | (2)% | 5% | $ | (188.8 | ) | 100 | % | 100 | % | |||||||||||
Segment profit | |||||||||||||||||||||||||||
Europe | $ | 118.2 | $ | 130.6 | $ | (12.4 | ) | (10)% | (5)% | $ | (6.3 | ) | 29 | % | 28 | % | |||||||||||
Asia Pacific | 191.0 | 187.5 | 3.5 | 2 | 9 | (12.7 | ) | 47 | 40 | ||||||||||||||||||
Tupperware North America | 68.3 | 65.9 | 2.4 | 4 | 7 | (2.0 | ) | 17 | 14 | ||||||||||||||||||
Beauty North America | 1.3 | 16.1 | (14.8 | ) | (92 | ) | (91 | ) | (1.2 | ) | — | 3 | |||||||||||||||
South America | 27.1 | 68.9 | (41.8 | ) | (61 | ) | (46 | ) | (18.9 | ) | 7 | 15 | |||||||||||||||
Segment profit as a percent of sales | |||||||||||||||||||||||||||
Europe | 16.2 | % | 16.9 | % | na | (0.7 | )pp | (0.6 | )pp | (0.1 | )pp | na | na | ||||||||||||||
Asia Pacific | 22.5 | 22.1 | na | 0.4 | 0.6 | (0.2 | ) | na | na | ||||||||||||||||||
Tupperware North America | 19.5 | 18.4 | na | 1.1 | 1.2 | (0.1 | ) | na | na | ||||||||||||||||||
Beauty North America | 0.4 | 5.0 | na | (4.6 | ) | (4.4 | ) | (0.2 | ) | na | na | ||||||||||||||||
South America | 7.0 | 18.4 | na | (11.4 | ) | (10.6 | ) | (0.8 | ) | na | na | ||||||||||||||||
____________________
pp Percentage points
na Not applicable
Europe
Reported sales decreased 5 percent in 2014 compared with 2013. Excluding the translation impact of foreign currency exchange rates, sales were slightly less than in 2013, primarily reflecting reduced volume of products sold. This was partially offset by an average increase in pricing of 3 percent compared with 2013.
Local currency sales in the Company’s established markets decreased by 3 percent, reflecting a decrease in sales volume in Germany due to a lower number of active sellers.
Emerging markets accounted for $246.6 and $268.6 million of reported net sales in this segment in 2014 and 2013, respectively, which represented 34 percent of sales in each period. On a local currency basis, the emerging market units' sales increased by 4 percent, reflecting significant growth in Turkey from a larger sales force due to higher additions, as well as increased productivity, resulting from attractive hostess gifts and sales force promotions, despite significant price increases in light of consumer inflation and the impact on costs of a weaker currency. This growth was partially offset by a decrease in Russia due to the external political and economic situation and continuing challenges in the addition and activation of sales force members.
27
For 2014, compared with 2013, segment profit decreased $12.4 million, or 10 percent. Excluding the translation impact of foreign currency exchange rates, segment profit decreased 5 percent compared with 2013. On a local currency basis, the decrease in segment profit was primarily due to the lost contribution margin from lower sales and increased promotional spending in Germany, as well as the impact of a weaker Turkish lira on product and services procured in euro. These decreases were partially offset by more efficient supply chain management.
The negative translation impact of foreign currency rates on the year-over-year comparison of sales and profit versus the U.S. dollar was primarily attributable to the weaker euro, Russian ruble, South African rand and Turkish lira.
Asia Pacific
Reported sales in Asia Pacific in 2014 were even compared with 2013. Excluding the translation impact of foreign currency exchange rates, the segment's sales increased 6 percent, reflecting strong growth in the emerging market businesses, primarily due to higher volume in Indonesia and China, as well as increased prices. The average price increase for the segment was 6 percent, though there was a slight increase in volume for the overall segment.
Emerging markets accounted for $691.1 million and $675.2 million, or 81 and 80 percent, of the sales in this segment in 2014 and 2013, respectively. Total emerging market sales increased $15.9 million, or 2 percent, in 2014 compared with 2013. The comparison was negatively impacted by changes in foreign currency exchange rates totaling $37.7 million. Excluding the impact of foreign currencies, these markets' sales increased by 8 percent in 2014. The most significant contribution to the overall increase was in Indonesia as a result of a larger sales force from strong additions, and sales force incentives programs along with attractive new product offerings. The other significant increase in sales was in China. The increase primarily related to higher volume of products sold from a positive response to new distributor and studio incentive programs and promotional offerings, including a continued focus on water-related products some of which have higher price points, in conjunction with the continued growth in the total number of experience studios. These were partially offset by a decrease in India, due to a smaller and less active sales force, reflecting high turnover in unit managers that are responsible for sales force additions, training and motivating the sales force.
Reported sales in the established markets decreased 8 percent. Excluding the impact of foreign currencies, these markets' sales decreased 2 percent, primarily from a lower volume of products sold.
Total segment profit increased $3.5 million, or 2 percent, in 2014. The segment profit comparison was negatively impacted by changes in foreign currency, and excluding this impact, segment profit increased 9 percent compared with 2013. The increase was mainly related to the contribution margin from the higher sales in Indonesia and China and the leverage this had on the fixed components of DS&A spending, as well as the benefit of not incurring pension settlement costs in 2014. This was partially offset by decreased profit in India from the contribution margin on lower sales.
The Australian dollar, Indonesian rupiah and Japanese yen were the most significant currencies that led to the negative translation impact from foreign currencies on the year-over-year sales comparison. The Indonesian rupiah was the main currency that had a negative translation impact on the profit comparison.
Tupperware North America
Reported sales decreased 2 percent in 2014 compared with 2013. Excluding the translation impact of foreign currency exchange rates, sales were even with the prior year. Despite challenges from the macroeconomic and personal safety conditions impacting sales force members and consumers in Mexico, local currency sales increased slightly, due to a slightly larger sales force, reflecting solid promotional programs aimed at retention, partially offset by lower business-to-business sales. Sales in United States and Canada decreased slightly in 2014 due to a less active and less productive sale force during the first half of the year due to higher than normal party cancellations from poor weather and to a more normalized promotional approach in 2014 compared with 2013, partially offset by increasing sales in the second half of the year from a higher number of active sellers. The average price increase for the segment was 3 percent.
Segment profit increased $2.4 million, or 4 percent, in 2014 compared with 2013. The higher profit was from the contribution margin on the higher sales in Mexico, as well as higher profit in United States and Canada, despite lower sales, reflecting a more normal promotional spending approach in 2014 after being overly aggressive in 2013.
28
The Mexican peso was the main foreign currency that impacted the year-over-year comparisons.
Beauty North America
Reported sales for this segment were down 9 percent in 2014. Excluding the impact of foreign currency exchange rates, sales decreased 6 percent reflecting the decision in April 2014, to cease operating the Armand Dupree business in the United States and a smaller sales force in Fuller Mexico due to less additions and retention of sales force members in light of the competitive environment and macroeconomic conditions in that country, as well as high field manager turnover. BeautiControl also had lower sales due to a smaller and less productive sales force. On average, prices increased in this segment by 4 percent.
Segment profit decreased $14.8 million, or 92 percent, in 2014 compared with 2013. Foreign currency exchange rates negatively impacted the comparison by $1.2 million. The decrease in profit primarily reflected $5.2 million more of amortization of the Fuller tradename in connection with a September 2013 change in classification from indefinite-lived to definite-lived, and the lost contribution margin from lower sales at both BeautiControl and Fuller Mexico. The closure of Armand Dupree did not significantly impact the profit comparison.
The Mexican peso was the main foreign currency that impacted the year-over-year comparisons.
South America
Reported sales for this segment increased 3 percent in 2014 compared with 2013. Excluding the translation impact of changes in foreign currency exchange rates, sales increased 36 percent. Of the 36 percent increase in sales in local currency, approximately 20 percentage points reflected the impact of higher prices, mainly in Venezuela and Argentina. The remaining increase was the result of higher volume of products sold.
The most significant increase was in Brazil, reflecting both higher volume and prices. The volume improvement reflected a significant sales force size advantage and the launch of new attractive products that energized the sales force and created demand from end consumers, overcoming service issues experienced as a result of challenges in the supply chain. Venezuela generated about a third of the segment's local currency sales increase with about two-thirds of its increase coming from higher pricing, reflecting inflation. This was primarily in the first and second quarters when sales and profit were translated at exchange rates of 6.3 and 10.8 bolivars to the U.S. dollar, respectively, as opposed to the 50.0 bolivar to U.S. dollar rate used in the second half. Additionally, beginning in mid-June, prices were lowered following a government price audit. Argentina's sales increased significantly, primarily from higher prices in light of significant inflation, as well as from a mix benefit as the unit shifted its focus to selling a greater share of housewares products that have higher price points than beauty and personal care products.
Segment profit decreased $41.8 million, or 61 percent, in 2014 compared with 2013. Segment profit as a percentage of sales, at 7.0 percent, was 11.4 percentage points lower than in 2013. Excluding the translation impact of foreign currency exchange rates, segment profit decreased 46 percent. This decrease was due to the $29.2 million impact from re-measuring the net monetary assets on the Venezuelan balance sheet at the end of March and June at 10.8 bolivars to the U.S. dollar and 50.0 bolivars to the U.S. dollar, respectively, versus the respective 6.3 and 10.8 rates used previously. There was also a $17.0 million impact of recording in income during 2014 the sale of inventory at the 6.3 and 10.8 exchange rates at which the inventory was purchased, or manufactured, rather than the 10.8 and 50.0 exchanges rate in use when those amounts were included in cost of sales later in the year. These amounts were partially offset by $4.6 million in foreign exchange gains in connection with purchasing U.S. dollars with Venezuelan bolivars at rates more favorable than the rates previously used to translate those bolivars in 2014. This exchange gain was recorded in Other Income on the Company's Consolidated Statements of Income. Notwithstanding its good sales growth, segment profit in Brazil reflected a lower than normal contribution margin due to costs associated with the supply chain challenges in that unit.
The Argentine peso, Brazilian real and Venezuelan bolivar had significant negative translation impacts on the year-over-year sales comparison, while the Brazilian real and Venezuelan bolivar impacted the profit comparison.
The Company used the "banded" exchange rate of 5.3 to translate the value of the Venezuelan bolivar versus the U.S. dollar until February 2013, when the Venezuelan government set a new official exchange rate of 6.3 bolivars to the U.S. dollar ("Official Rate") and abolished the banded exchange rate. As a result of the change to the Official Rate, the Company's first quarter earnings in 2013 were reduced by $3.9 million.
29
In March 2013, the Venezuelan government created the Complimentary System of Foreign Currency Acquirement ("SICAD 1"). In January 2014, the Venezuelan government expanded the SICAD 1 auction process to be used for payments related to "international investment," while further restricting the availability of the Official Rate. In late March 2014, the Company was invited to participate, for the first time, in the SICAD 1 auction process at a rate of 10.8 bolivars to the U.S. dollar ("SICAD 1 Rate") in order to purchase raw materials. The Company did not exchange money through the SICAD 1 mechanism in the first quarter of 2014, though it did exchange currency at the Official Rate. On March 24, 2014, the Venezuelan government launched an additional foreign exchange mechanism known as SICAD 2. The SICAD 2 rate was 50.0 bolivars to the U.S. dollar from the end of June 2014 until January 2015.
In the first, second, third and fourth quarters of 2014, sales in Venezuela were $32.9 million, $23.7 million, $5.2 million and $4.9 million, respectively. The translation impact on each of the year-over-year quarterly comparisons of weaker exchange rates in 2014 versus 2013 was $0.8 million, $8.9 million, $21.1 million and $24.5 million, respectively. Operating profit from Venezuela in the first, second, third and fourth quarters of 2014 was $9.2 million, $9.5 million, $0.8 million and $0.6 million, respectively, and the translation impact on each of the year-over-year quarterly comparisons from the changes in rates was $0.1 million, $2.5 million, $7.1 million and $5.2 million, respectively.
Financial Condition
Liquidity and Capital Resources
During 2015, the Company adopted Accounting Standards Update (ASU) 2015-17, Balance Sheet Classification of Deferred Taxes. As a result, previously reported amounts related to working capital and the current ratio have been re-calculated to exclude deferred tax assets and liabilities in order to conform with the new ASU. Net working capital was negative $63.5 million as of December 26, 2015, compared with negative $105.0 million as of December 27, 2014 and negative $53.8 million as of December 28, 2013. The current ratio was 0.9 to 1 at the end of 2015, 2014 and 2013.
The Company’s reported net working capital increased $41.5 million in 2015 compared with 2014. Excluding the negative $7.8 million impact due to changes in foreign currency exchange rates, working capital increased $49.3 million, primarily reflecting, in local currency, a $36.9 million decrease in short-term borrowings, an $11.7 million decrease in accounts payable and accrued liabilities due to the timing of payments around year-end, as well as differences in accruals for management incentives, and an increase in cash of $12.4 million. These were partially offset by a decrease of $11.2 million in local currency in non-trade receivables, mainly from hedging activities, and a slight decrease in inventory.
The most significant components in the Company’s $51.2 million reduction in net working capital in 2014 compared with 2013 were a net $25.1 million negative impact on the remeasurement of net monetary assets on the balance sheet related to the 2014 changes in foreign currency exchange rates in Venezuela, a $16.9 million translation impact on working capital (excluding cash) due to other weaker foreign currency exchange rates in relation to the U.S. dollar and an increase in accounts payable and accrued liabilities, due to the timing of payments around the end of 2014. These decreases were partially offset by a $14 million decrease in short-term borrowings and an increase in non-trade receivables. In addition, on a local currency basis, there were increases in accounts receivable, reflecting the level and timing of sales around the end of each period, and an increase in inventory, reflecting expectations for future sales by certain units and, in some cases, a lower than expected sell through.
In June 2011, the Company completed the sale of $400 million in aggregate principal amount of 4.750% Senior Notes due June 1, 2021. On March 11, 2013, the Company issued and sold an additional $200.0 million in aggregate principal amount of these notes (both issuances together, the "Senior Notes"). The Senior Notes form a single series under the Indenture. The proceeds received from the March 2013 issuance were used to repay a 90-day $75 million promissory note entered into on February 1, 2013, as well as a portion of outstanding borrowings under the Company's multicurrency credit agreement in place at that time. The remaining net proceeds were used to fund 2013 share repurchases under the Company's common stock repurchase authorization.
30
On June 9, 2015, the Company and its wholly owned subsidiary Tupperware International Holdings B.V. (the “Subsidiary Borrower”), entered into Amendment No. 2 (the "Amendment”) to their multicurrency Amended and Restated Credit Agreement dated September 11, 2013, as amended by Amendment No. 1 dated June 2, 2014 (as so amended, the “Credit Agreement”). The terms and structure of the Credit Agreement remained largely the same. The Amendment (i) reduced the aggregate amount available to the Company and the Subsidiary Borrower under the Credit Agreement from $650.0 million to $600 million (the “Facility Amount”), (ii) extended the final maturity date of the Credit Agreement from September 11, 2018 to June 9, 2020, and (iii) amended the applicable margins for borrowings and the commitment fee to be generally more favorable for the Company. The Credit Agreement continues to provide (a) a revolving credit facility, available up to the full amount of the Facility Amount, (b) a letter of credit facility, available up to $50 million of the Facility Amount, and (c) a swingline facility, available up to $100 million of the Facility Amount. Each of such facilities is fully available to the Company and is available to the Subsidiary Borrower up to an aggregate amount not to exceed $325 million. The Company is permitted to increase, on up to three occasions, the Facility Amount by a total of up to $200 million (for a maximum aggregate Facility Amount of $800 million), subject to certain conditions including the agreement of the lenders. As of December 26, 2015, the Company had total borrowings of $155.8 million outstanding under its Credit Agreement, with $153.7 million of that amount denominated in euros. The Company routinely increases its revolver borrowings under the Credit Agreement and uncommitted lines during each quarter to fund operating, investing and financing activities and uses cash available at the end of each quarter to reduce borrowing levels. As a result, the Company incurs more interest expense and has higher foreign exchange exposure on the value of its cash during each quarter than would relate solely to the quarter end cash and debt balances.
Loans taken under the Credit Agreement bear interest under a formula that includes, at the Company's option, one of three different base rates, plus an applicable spread. The Company generally selects the London Interbank Offered Rate ("LIBOR"). As of December 26, 2015, the Credit Agreement dictated a base rate spread of 150 basis points, which gave the Company a weighted average interest rate on LIBOR based borrowings of 1.50 percent on borrowings under the Credit Agreement.
The Credit Agreement contains customary covenants, including financial covenants requiring minimum interest coverage and allowing a maximum amount of leverage. As of December 26, 2015, and currently, the Company had considerable cushion under its financial covenants. However, economic conditions, adverse changes in foreign exchange rates, lower than foreseen sales, profit and/or cash flow generation, the ability to access cash generated internationally in Argentina, Egypt or elsewhere, share repurchases or the occurrence of other events discussed under “Forward Looking Statements” and elsewhere could cause noncompliance.
In February 2014, the Company entered into a $75.0 million uncommitted line of credit with Credit Agricole Corporate and Investment Bank ("Credit Agricole"). This line of credit dictates an interest rate of LIBOR plus 125 basis points. In July 2014, the Company entered into a $100.0 million uncommitted line of credit with HSBC Bank USA ("HSBC"). This line of credit dictates an interest rate of LIBOR plus 100 basis points. Both Credit Agricole and HSBC are participating banks in the Company's Credit Agreement. As of December 26, 2015, there were no amounts outstanding under these uncommitted lines of credit.
See Note 7 to the Consolidated Financial Statements for further details regarding the Company's debt.
The Company monitors the financial stability of third-party depository institutions that hold its cash and cash equivalents and diversifies its cash and cash equivalents among counterparties, which minimizes exposure to any one of these entities. Furthermore, the Company is exposed to financial market risk resulting from changes in interest rates, foreign currency rates and the possible liquidity and credit risks of its counterparties. The Company believes that it has sufficient liquidity to fund its working capital and capital spending needs and its current dividend. This liquidity includes its year-end 2015 cash and cash equivalents balance of $79.8 million, cash flows from operating activities, and access to its $600 million Credit Agreement and other uncommitted lines of credit. As of December 26, 2015, the Company had $700.5 million of unused lines of credit, including $442.5 million available under its Credit Agreement and $258.0 million available under other uncommitted lines of credit, including the uncommitted lines of credit with Credit Agricole and HSBC. The Company has not experienced any limitations on its ability to access its committed facility.
31
Cash and cash equivalents (“cash”) totaled $79.8 million as of December 26, 2015. Of this amount, $78.5 million was held by foreign subsidiaries; of which about half was not currently eligible for repatriation due to the level of past statutory earnings by the foreign unit in which the cash was held or other local restrictions. The remaining cash is subject to repatriation tax effects with about 10 percent of cash being held in countries that were provided for in the Company's current year income tax provision. The remaining cash was generally held in countries in which the Company's current intent is to indefinitely reinvest these funds in its foreign units, as the cash is needed to fund ongoing operations. In the event circumstances change, leading to the conclusion that these funds will not be indefinitely reinvested, the Company would need to provide at that time for the income taxes that would be triggered upon their repatriation.
The Company’s most significant foreign currency exposures are to the Brazilian real, Chinese renminbi, euro, Indonesian rupiah and Mexican peso. Business units in which the Company generated at least $100 million of sales in 2015 included Brazil, China, Fuller Mexico, Germany, Indonesia, Tupperware Mexico and Tupperware United States and Canada. Of these units, sales by Brazil and Indonesia exceeded $200 million. A significant downturn in the Company’s business in these units would adversely impact its ability to generate operating cash flows. Operating cash flows would also be adversely impacted by significant difficulties in the additions, retention and activity of the Company’s independent sales force or the success of new products, promotional programs and/or possibly changes in sales force compensation programs.
Operating Activities
Net cash provided by operating activities in 2015 was $225.7 million, compared with $284.1 million in 2014. The unfavorable comparison was primarily due to a decrease in reported net income, reflecting the $69.3 million impact of weaker foreign currency exchange rates in relation to the U.S. dollar during 2015. These weaker foreign exchange rates had a greater impact on the annual cash flow than net income for the period as the Company generated a significant share of its cash flow from operating activities during the fourth quarter of 2015 when foreign exchange rates were significantly weaker than the 2015 average. There were also cash outflows in connection with the Company's hedging activities, a smaller increase in accounts payable and accrued liabilities due to the timing of distributions around the ending of each year and higher income tax payments in light of higher income on a local currency basis, as well as incremental cash paid in connection with tax law reform in Mexico in 2013. These outflows were partially offset by inflows in 2015 from a reduction in accounts receivable and inventory balances compared with outflows in these items in 2014.
Net cash provided by operating activities in 2014 was $284.1 million, compared with $323.5 million in 2013. The unfavorable comparison primarily reflected a decrease in net income as a result of weaker foreign currency exchange rates in relation to the U.S. dollar. These weaker foreign exchange rates had a greater impact on the annual cash flow than net income for the period as the Company generated a significant share of its cash flow from operating activities during the fourth quarter of 2014 when foreign exchange rates were significantly weaker than the 2014 average. There was also a larger increase in accounts receivable from higher December sales in 2014 than 2013 and a larger increase in inventory during 2014, reflecting expectations for future sales by certain units and, in some cases, a lower than expected sell through. The Company also made large income tax payments related to fiscal year 2013 after the Company's fiscal year-end, but prior to the end of the calendar year, whereas similar 2012 payments occurred prior to the end of fiscal year-end 2012. These decreases were partially offset by the timing of distributions of accounts payables and accrued liabilities around the ending of each fiscal year.
Investing Activities
In 2015, 2014 and 2013, the Company spent $61.1 million, $69.4 million and $69.0 million, respectively, for capital expenditures. The most significant type of spending in all years was for molds for new products. The Company also spent $18 million, $20 million and $16 million in each respective year for the expansion of manufacturing capacity and supply chain capabilities, most significantly in Brazil, and $7 million, $11 million and $14 million in those years on marketing offices to support expanding operations, as well as capital spent for various global information technology projects and vehicles in South Africa. In addition, in 2015 and 2014, the Company spent capital for land development near its Orlando headquarters.
32
Partially offsetting the capital spending were $18.0 million, $7.1 million and $8.9 million of proceeds related to the sale of certain property, plant and equipment and insurance recoveries in 2015, 2014 and 2013, respectively. In all years, there were proceeds related to the sale of vehicles that had been purchased for the sales force, primarily in South Africa. In 2015 and 2014, proceeds of $16.2 million and $4.2 million, respectively, related to land transactions under the Company's program to sell land near its Orlando, Florida headquarters. In 2014 and 2013, there were proceeds related to the sale of property in Australia for $1.1 million and $6.2 million, respectively.
Financing Activities
In 2015, 2014 and 2013, the Company made net payments on long-term debt of $2.6 million, $3.0 million and $2.5 million, respectively, mainly related to its scheduled lease payments. In addition, the Company had net outflows of $36.4 million and $2.2 million and net inflows of $27.8 million under its revolving credit agreements in each of these respective periods. In 2013, the Company also issued the $200 million of Senior Notes as part of its decision to operate with a higher level of leverage, as announced at the beginning of that year.
Dividends
During 2015 and 2014, the Company declared dividends of $2.72 per share of common stock totaling $138.0 million and $135.5 million, respectively. In 2013, the Company declared dividends of $2.48 per share of common stock totaling $116.8 million.
Going forward, the Company expects its Board of Directors to evaluate its dividend rate annually with its declaration in the first quarter of each year. In the first quarter of 2016, the Board voted to keep the regular quarterly dividend rate even with 2015 and 2014, at $0.68. In the first quarter of 2014, the Board increased the regular quarterly dividend per share to $0.68 per share from the $0.62 per share declared in 2013. The payment of a dividend on common shares is a discretionary decision and subject to a significant event that would require cash, the ability to continue to comply with debt covenants, cash needed to finance operations, making necessary investments in the future growth of the business, required or discretionary debt repayment obligations, the impacts of changes in foreign currency exchange rates, the ability to access internationally generated cash or other cash needs, as well as compliance with Delaware law regarding capital surplus. As well, if there is an event requiring the use of cash, such as a strategic acquisition, the Company would need to reevaluate whether to maintain its dividend payout.
Stock Option Exercises
During 2015, 2014 and 2013, the Company received proceeds of $16.1 million, $15.7 million and $21.0 million, respectively, related to the exercise of stock options. The corresponding shares were issued out of the Company’s balance held in treasury.
Stock Repurchases
Open market share repurchases are permitted under an authorization that runs until February 1, 2017 and allows up to $2.0 billion to be spent. During 2014 and 2013 the Company repurchased in the open market 1.2 million and 4.6 million shares under this program at an aggregate cost of $84.3 million and $374.9 million, respectively. There were no share repurchases under this program during 2015. Since inception of the program in May 2007, and through December 26, 2015, the Company repurchased 21.3 million shares at an aggregate cost of $1.29 billion. Going forward, in setting share repurchase amounts, the Company expects to target over time a debt-to-EBITDA ratio of 1.75 times consolidated funded debt (as defined in the Company's Credit Agreement). Based on the Company’s current debt level, its expected disbursements for dividends and its projected 2016 cash flow and EBITDA that have been negatively impacted versus 2015 by strengthening of the U.S. dollar, the Company does not currently plan to make open market share repurchases in 2016.
Employees are also allowed to use shares to pay withholding taxes, up to the minimum statutory amount, related to activity under all of the Company's stock incentive plans. For 2015, 2014 and 2013, the value of shares used for withholding taxes was $1.5 million, $8.0 million and $4.5 million, respectively, which is included as stock repurchases in the Consolidated Statement of Cash Flows.
33
Contractual Obligations
The following summarizes the Company’s contractual obligations at December 26, 2015 and the effect such obligations are expected to have on its liquidity and cash flow in future periods.
(In millions) | Total | Less than 1 year | 1-3 years | 3-5 years | More than 5 years | ||||||||||||||
Debt obligations | $ | 770.7 | $ | 162.5 | $ | 3.9 | $ | 2.7 | $ | 601.6 | |||||||||
Interest payments on long term obligations | 158.5 | 29.2 | 57.7 | 57.3 | 14.3 | ||||||||||||||
Pension benefits | 152.5 | 18.9 | 37.5 | 28.1 | 68.0 | ||||||||||||||
Post-employment medical benefits | 18.3 | 1.9 | 3.5 | 3.1 | 9.8 | ||||||||||||||
Income tax payments (a) | 1.0 | 1.0 | — | — | — | ||||||||||||||
Capital commitments (b) | 3.4 | 3.4 | — | — | — | ||||||||||||||
Operating lease obligations | 96.7 | 35.7 | 36.7 | 14.9 | 9.4 | ||||||||||||||
Total contractual obligations (c) | $ | 1,201.1 | $ | 252.6 | $ | 139.3 | $ | 106.1 | $ | 703.1 | |||||||||
____________________
(a) | Other than the amount presented, the Company has not included in the above table amounts related to its other unrecognized tax positions, as it is unable to make a reliable estimate of the amount and period in which these items might lead to payments. As of December 26, 2015 the Company’s total gross unrecognized tax positions were $21.8 million. It is reasonably possible that the amount of uncertain tax positions could materially change within the next 12 months based on the results of tax examinations, expiration of statutes of limitations in various jurisdictions and additions due to ongoing transactions and activity. However, the Company is unable to estimate the impact of such events. |
(b) | Capital commitments represent signed agreements as of December 26, 2015 on relatively minor capital projects in process at the Company’s various units, mainly Brazil. |
(c) | The table excludes information on recurring purchases of inventory as these purchase orders are non-binding, are generally consistent from year to year, and are short-term in nature. |
Application of Critical Accounting Policies and Estimates
Management’s Discussion and Analysis of Financial Condition and Results of Operations is based upon the Company’s Consolidated Financial Statements that have been prepared in accordance with accounting principles generally accepted in the United States of America. The preparation of these financial statements requires management to make estimates and assumptions that affect the reported and disclosed amounts. Actual results may differ from these estimates under different assumptions or conditions. The Company believes the implementation of the following critical accounting policies are the most significantly affected by its judgments and estimates.
Allowance for Doubtful Accounts.
The Company maintains current receivable amounts with most of its independent distributors and sales force in certain markets. It also maintains long-term receivable amounts with certain of these customers. The Company regularly monitors and assesses its risk of not collecting amounts owed to it by customers. This evaluation is based upon an analysis of amounts current and past due, along with relevant history and facts particular to the customer. It is also based upon estimates of distributor business prospects, particularly related to the evaluation of the recoverability of long-term amounts due. This evaluation is performed market by market and account by account, based upon historical experience, market penetration levels and similar factors. It also considers collateral of the customer that could be recovered to satisfy debts. The Company records its allowance for doubtful accounts based on the results of this analysis. The analysis requires the Company to make significant estimates and as such, changes in facts and circumstances could result in material changes in the allowance for doubtful accounts. The Company considers any receivable balance not collected within its contractual terms past due.
34
Inventory Valuation
The Company writes down its inventory for obsolescence or unmarketability in an amount equal to the difference between the cost of the inventory and estimated market value based upon expected future demand and pricing. The demand and pricing is estimated based upon the historical success of product lines as well as the projected success of promotional programs, new product introductions and new markets or distribution channels. The Company prepares projections of demand and pricing on an item by item basis for all of its products. If inventory on hand exceeds projected demand or the expected market value is less than the carrying value, the excess is written down to its net realizable value. However, if actual demand or the estimate of market decreases, additional write-downs would be required.
Income Taxes
Deferred tax assets and liabilities are recognized for the future tax consequences attributable to temporary differences between the financial statement carrying amounts of assets and liabilities and their respective tax bases. Deferred tax assets also are recognized for credit carryforwards. Deferred tax assets and liabilities are measured using the enacted rates applicable to taxable income in the years in which the temporary differences are expected to reverse and the credits are expected to be used. The effect on deferred tax assets and liabilities of a change in tax rates is recognized in income in the period that includes the enactment date. At December 26, 2015 and December 27, 2014, the Company had valuation allowances against certain deferred tax assets totaling $23.1 million and $40.2 million, respectively. These valuation allowances relate to tax assets in jurisdictions where it is management's best estimate that there is not a greater than 50 percent probability that the benefit of the assets will be realized in the associated tax returns. At the end of 2015, the Company had gross domestic deferred tax assets of approximately $429.7 million against which a valuation allowance of $4.0 million has been provided. Of these total assets, approximately $97.7 million relates to recurring type temporary differences which reverse regularly and are replaced by newly originated items. The balance included assets of $78.9 million related to advanced payment agreements, which are expected to reverse over the next three years, and other deferred tax assets. The balance also included approximately $209.8 million of net foreign tax credits most of which would expire in the years 2018 through 2025 if not utilized, $12.1 million of federal net operating losses which would expire in the years 2020 through 2035 if not utilized, and $3.6 million of federal tax credits and other assets that have no expiration date. The balance also included $3.6 million of net state operating losses and other book versus tax asset differences of approximately $20.0 million.
The Company expects to have sufficient capacity to utilize all of the foreign tax credits through the generation of significant foreign source taxable income generated by intercompany royalties, mold rentals and future foreign dividends from then current earnings and cash flows. During 2015, the Company anticipates utilizing $72.5 million of foreign tax credits. The actual utilization amount will be finalized once the U.S. tax return is filed. In order to utilize the existing net foreign tax credits, the Company will be required to generate approximately $600 million of U.S. taxable foreign source income over the next nine years. As of the end of 2016, the Company expects to have excess foreign tax credits totaling $218 million, of which it estimates to utilize $85 million by 2018. The Company is projecting to generate US taxable foreign source income in excess of the required amount to utilize existing and newly generated foreign tax credits associated with future foreign dividend repatriations. The Company expects to realize all of these assets in the normal course of business. In addition, certain tax planning transactions are available to the Company in order to facilitate realization of these benefits should they become necessary. The federal net operating losses are related to a subsidiary that is excluded from the federal consolidated tax return and is engaged in land sales and development near the Company's Orlando, Florida headquarters. As such, the federal net operating losses do not impact the utilization of foreign tax credits. The Company believes the anticipated gains related to future sales of land and other income will be sufficient to realize, before they expire, the $12.1 million net operating loss credits of this subsidiary. These estimates are made based upon the Company's business plans and growth strategies in each market and are made on an ongoing basis; consequently, future material changes in the valuation allowance are possible. Any change in valuation allowance amounts are reflected in the period in which the change occurs.
As of December 26, 2015 and December 27, 2014, the Company's gross unrecognized tax benefit was $21.8 million and $22.5 million, respectively. During the year ended December 26, 2015, the accrual for uncertain tax positions decreased by $1.1 million primarily as a result of the Company agreeing to tax settlements in various foreign jurisdictions, as well as a $3.2 million decrease of accruals for uncertain tax positions due to the expiration of the statute of limitations in various jurisdictions. During the year, increases in uncertain positions being taken during the year in various foreign tax jurisdictions were partially offset by the impact of foreign exchange rate translation.
35
Interest and penalties related to uncertain tax positions in the Company's global operations are recorded as a component of the provision for income taxes. Accrued interest and penalties were $6.0 million and $6.5 million as of December 26, 2015 and December 27, 2014, respectively. Interest and penalties included in the provision for income taxes totaled $0.9 million and $0.5 million for 2014 and 2013, respectively and no significant interest and penalties included in the provision for income taxes for 2015.
The Company estimates that it may settle one or more foreign and domestic audits in the next twelve months that may result in a decrease in the amount of accrual for uncertain tax positions of up to $1.0 million. For the remaining balance as of December 26, 2015, the Company is not able to reliably estimate the timing or ultimate settlement amount. While the Company does not currently expect material changes, it is possible that the amount of unrecognized benefit with respect to the uncertain tax positions will significantly increase or decrease related to audits in various foreign jurisdictions that may conclude during that period or new developments that could also, in turn, impact the Company's assessment relative to the establishment of valuation allowances against certain existing deferred tax assets. At this time, the Company is not able to make a reasonable estimate of the range of impact on the balance of unrecognized tax benefits or the impact on the effective tax rate related to these items.
Promotional Accruals
The Company frequently makes promotional offers to its independent sales force to encourage them to meet specific goals or targets for sales levels, party attendance, addition of new sales force members or other business critical activities. The awards offered are in the form of product awards, special prizes or trips. The cost of these awards is recorded during the period over which the sales force qualifies for the award. These accruals require estimates as to the cost of the awards based upon estimates of achievement and actual cost to be incurred. The Company makes these estimates on a market by market and program by program basis. It considers the historical success of similar programs, current market trends and perceived enthusiasm of the sales force when the program is launched. During the promotion qualification period, actual results are monitored and changes to the original estimates that are necessary are made when known.
Goodwill and Intangible Assets
The Company’s goodwill and intangible assets relate primarily to the December 2005 acquisition of the direct-to-consumer businesses of Sara Lee Corporation. The Company does not amortize its goodwill or indefinite-lived tradename intangible assets. Instead, the Company performs an annual impairment assessment of these assets, or more frequently if events or changes in circumstances indicate they may be impaired. The Company only considers the goodwill balances of $88.6 million and $23.5 million associated with the Fuller Mexico and NaturCare reporting units, respectively, to be significant relative to total equity. In 2015, the Company performed a step 1 impairment evaluation for the goodwill associated with the Fuller Mexico and NaturCare reporting units. Refer to Note 1 and Note 6 of the Consolidated Financial Statements regarding the annual process for evaluating goodwill and intangible assets and the specific assumptions used in the 2015 evaluations, respectively.
36
At the time the step 1 evaluation was performed, in light of year-to-date results of Fuller Mexico being below previous expectations and current expectations for future results, the amount by which the estimated fair value of the Fuller Mexico reporting unit exceeded its carrying value, at 13 percent, was smaller in 2015 than in previous assessments. Despite the positive performance indicators in the business and the amount by which the estimated fair value of the reporting unit exceeded its carrying value, the estimates are sensitive to many changes in key performance indicators such as a smaller sales force size, reversal of retention rates, operating performance significantly below current expectations, including changes in projected future revenue, profitability and cash flow, as well as higher working capital, interest rates or cost of capital. As of the date of the last valuation, holding all other assumptions constant, a one percent increase to the discount rate would reduce the amount by which the estimated fair value of the Fuller Mexico reporting unit exceeded its carrying value to 5 percent. Similarly, if the sales growth rates were reduced so that the average growth rate were 2 percent, the amount by which the estimated fair value exceeded its carrying value at September 2015 would be 2 percent.
Also in 2015, the Company performed a step 1 assessment for the goodwill associated with the NaturCare reporting unit. The estimated fair value of the NaturCare reporting unit exceeded the carrying value by 130 percent. Based on the Company's evaluation of the assumptions and sensitivities associated with the step 1 analysis for NaturCare, the Company has concluded that the fair value substantially exceeded its carrying value as of September 2015. Given the significant cushion, 1 percent increase in the discount rate or 1 percent decrease in the average sales growth assumptions would not significantly change the conclusions of the step 1 assessment.
Retirement Obligations
Pensions
The Company records pension costs and the funded status of its defined benefit pension plans using the applicable accounting guidance for defined benefit pension and other post-retirement plans. This guidance requires that amounts recognized in the financial statements be determined on an actuarial basis. The measurement of the retirement obligations and costs of providing benefits under the Company’s pension plans involves various factors, including several assumptions. The Company believes the most critical of these assumptions are the discount rate and the expected long-term rate of return on plan assets.
The Company determines the discount rate primarily by reference to rates of high-quality, long-term corporate and government bonds that mature in a pattern similar to the expected payments to be made under the plans. The discount rate assumptions used to determine pension expense for the Company’s U.S. and foreign plans were as follows:
Discount Rate | 2015 | 2014 | 2013 | |||||
U.S. Plans | 3.6 | % | 3.9 | % | 3.3 | % | ||
Foreign Plans | 2.4 | 2.6 | 3.5 | |||||
The Company has established strategic asset allocation percentage targets for significant asset classes with the aim of achieving an appropriate balance between risk and return. The Company periodically revises asset allocations, where appropriate, in an effort to improve return and manage risk. The estimated rate of return is based on long-term expectations given current investment objectives and historical results. The expected rate of return assumptions used by the Company for its U.S. and foreign plans were as follows:
Expected rate of return | 2015 | 2014 | 2013 | |||||
U.S. Plans | 8.3 | % | 8.3 | % | 8.3 | % | ||
Foreign Plans | 3.4 | 3.8 | 4.4 | |||||
The following table highlights the potential impact on the Company’s pension expense due to changes in certain key assumptions with respect to the Company’s pension plans, based on assets and liabilities at December 26, 2015:
(In millions) | Increase | Decrease | |||||
Discount rate change by 50 basis points | $ | (2.2 | ) | $ | 1.9 | ||
Expected rate of return on plan assets change by 50 basis points | (0.5 | ) | 0.5 | ||||
37
Other Post Retirement Benefits
The Company accounts for its post-retirement benefit plan in accordance with applicable accounting guidance, which requires that amounts recognized in financial statements be determined on an actuarial basis. This determination requires the selection of various assumptions, including a discount rate, to value benefit obligations. The Company determines the discount rate primarily by reference to rates of return on high-quality, long term corporate bonds that mature in a pattern similar to the expected payments to be made under the plan. The discount rate assumptions used by the Company to determine other post-retirement benefit expense were 3.8 percent, 4.5 percent, and 3.5 percent for the 2015, 2014 and 2013 fiscal years, respectively. A change in discount rate of 50 basis points would not materially change the annual expense associated with the plan.
Revenue Recognition
Revenue is recognized when the price is fixed, the title and risks and rewards of ownership have passed to the customer who, in most cases, is one of the Company’s independent distributors or a member of its independent sales force, and when collection is reasonably assured. Depending on the contractual arrangements for each business, revenue is recognized upon either delivery or shipment, which is when title and risk and rewards of ownership have passed to the customer. When revenue is recorded, estimates of returns are made and recorded as a reduction of revenue. Discounts earned based on promotional programs in place, volume of purchases or other factors are also estimated at the time of revenue recognition and recorded as a reduction of that revenue.
Stock-Based Compensation
The Company measures compensation cost for stock-based awards at fair value and recognizes compensation over the service period for awards expected to vest. The Company uses the Black-Scholes option-pricing model to value stock options, which requires the input of assumptions, including dividend yield, risk-free interest rate, the estimated length of time employees will retain their vested stock options before exercising them (expected term) and the estimated volatility of the Company's common stock price over the expected term. Furthermore, in calculating compensation expense for these awards, the Company is also required to estimate the extent to which options will be forfeited prior to vesting (forfeitures). Many factors are considered when estimating expected forfeitures, including employee class and historical experience.
Impact of Inflation
Inflation, as measured by consumer price indices, has continued at a low level in most of the countries in which the Company operates, except in South America, particularly in Argentina and Venezuela.
New Pronouncements
Refer to Note 1 to the Consolidated Financial Statements for a discussion of new accounting pronouncements.
Item 7A. Quantitative and Qualitative Disclosures About Market Risk.
One of the Company's market risks is its exposure to the impact of interest rate changes on its borrowings. The Company has elected to manage this risk through the maturity structure of its borrowings and the currencies in which it borrows.
Loans taken under the Credit Agreement are of a short duration and bear interest under a formula that includes, at the Company's option, one of three different base rates, plus an applicable spread. The Company generally selects the London interbank offered rate ("LIBOR"). As of December 26, 2015, the Credit Agreement dictated a spread of 150 basis points, which gave the Company a weighted average interest rate on its LIBOR based borrowings under the Credit Agreement of 1.50 percent.
As of December 26, 2015, the Company had total borrowings of $155.8 million outstanding under its Credit Agreement, with $153.7 million denominated in euro. If short-term interest rates varied by 10 percent, with all other variables remaining constant, the Company's annual interest expense would not be significantly impacted.
38
The Company routinely increases its revolver borrowings under the Credit Agreement and uncommitted lines during each quarter to fund operating, investing and financing activities and uses cash available at the end of each quarter to reduce borrowing levels. As a result, the Company incurs more interest expense and has higher foreign exchange exposure on the value of its cash during each quarter than would relate solely to the quarter end cash and debt balances.
A significant portion of the Company's sales and profit come from its international operations. Although these operations are geographically dispersed, which partially mitigates the risks associated with operating in particular countries, the Company is subject to the usual risks associated with international operations. These risks include local political and economic environments and relations between foreign and U.S. governments.
Another economic risk of the Company is exposure to changes in foreign currency exchange rates on the earnings, cash flows and financial position of its international operations. The Company is not able to project, in any meaningful way, the possible effect of these fluctuations on translated amounts or future earnings. This is due to the Company's constantly changing exposure to various currencies, the fact that all foreign currencies do not react in the same manner in relation to the U.S. dollar and the large number of currencies involved, although the Company's most significant exposures are to the Brazilian real, Chinese renminbi, euro, Indonesian rupiah and Mexican peso.
Although this currency risk is partially mitigated by the natural hedge arising from the Company's local product sourcing in many markets, a strengthening U.S. dollar generally has a negative impact on the Company. In response to this fact, the Company uses financial instruments, such as forward contracts and certain euro denominated borrowings under the Company's Credit Agreement, to hedge its exposure to certain foreign exchange risks associated with a portion of its investment in international operations. In addition to hedging against the balance sheet impact of changes in exchange rates, the hedge of investments in international operations also has the effect of hedging a portion of cash flows from those operations. The Company also hedges, with these instruments, certain other exposures to various currencies arising from amounts payable and receivable, non-permanent intercompany loans and a portion of purchases forecasted for up to 15 months. The Company generally does not seek to hedge the impact of currency fluctuations on the translated value of the sales, profit or cash flow generated by its operations.
While the Company's hedges of its equity in its foreign subsidiaries and its fair value hedges of balance sheet risks all work together to mitigate its exposure to foreign exchange gains or losses, they result in an impact to operating cash flows as they are settled. The net cash flow impact of these currency hedges was an outflow of $17.0 million and inflows of $4.6 million and $3.2 million in 2015, 2014 and 2013, respectively.
The U.S. dollar equivalent of the Company's most significant net open foreign currency hedge positions as of December 26, 2015 were to purchase U.S. dollars $107.4 million and to sell Mexican pesos $41.3 million. In agreements to sell foreign currencies in exchange for U.S. dollars, for example, an appreciating dollar versus the opposing currency would generate a cash inflow for the Company at settlement, with the opposite result in agreements to buy foreign currencies for U.S. dollars. The notional amounts change based upon changes in the Company's outstanding currency exposures. Based on rates existing as of December 26, 2015, the Company was in a net receivable position of approximately $6.9 million related to its currency hedges, which, upon settlement, could have a significant impact on the Company's cash flow. The Company records the impact of forward points in net interest expense.
A precise calculation of the impact of currency fluctuations is not practical since some of the contracts are between non-U.S. dollar currencies. The Company continuously monitors its foreign currency exposure and may enter into additional contracts to hedge exposure in the future. See further discussion regarding the Company's hedging activities for foreign currency in Note 8 to the Consolidated Financial Statements.
The Company is subject to credit risks relating to the ability of counterparties of hedging transactions to meet their contractual payment obligations. The risks related to creditworthiness and nonperformance have been considered in the determination of fair value for the Company's foreign currency forward exchange contracts. The Company continues to closely monitor its counterparties and will take action, as appropriate and possible, to further manage its counterparty credit risk.
39
The Company is also exposed to changing material prices in its manufacturing operations and, in particular, the cost of oil and natural gas-based resins, including the fact that in some cases resin prices are actually in, or are based on, currencies other than that of the unit buying the resin, which introduces a currency exposure that is incremental to the exposure to changing market prices. This is the primary material used in production of most Tupperware® products, and the Company estimates that 2016 cost of sales will include about $127 million for the cost of resin in the Tupperware® brand products it produces and has contract manufactured. The Company uses many different kinds of resins in its products. About three-fourths of its resins are “polyolefins” (simple chemical structure, easily refined from oil), and as such, the price of these is strongly affected by the underlying price of oil and natural gas. The remaining one-fourth of its resins is more highly engineered, where the price of oil and natural gas plays a less direct role in determining price. With a comparable product mix and exchange rates, a 10 percent fluctuation in the cost of resin would impact the Company's annual cost of sales by approximately $13 million compared with the prior year. For 2015, the Company estimates its cost of sales of the Tupperware® products it produced and had contract manufactured was positively impacted by about $12 million in local currency due to resin cost changes, as compared with 2014. For the full year of 2016, assuming prices remain unchanged from January 2016, resin cost changes on a local currency basis included in the Company's cost of sales of the Tupperware® products it produces and contract manufactures is expected to be a favorable impact of $8 million, as compared with 2015. In addition to the impact of the price of oil and natural gas and changes in exchange rates, the U.S. dollar value the Company pays for its resins is also impacted by the relative changes in supply and demand. The Company partially manages its risk associated with rising resin costs by utilizing a centralized procurement function that is able to take advantage of bulk discounts while maintaining multiple suppliers and also enters into short-term pricing arrangements. It also manages its margin through cash flow hedges in some cases when it purchases resin in currencies, or effectively in currencies, other than that of the purchasing unit and through the pricing of its products, with price increases on its product offerings generally in line with consumer inflation in each market, and its mix of sales through its promotional programs and promotionally priced offers. It also, on occasion, makes advance material purchases to take advantage of current favorable pricing. At this point in time, the Company has determined that entering into forward contracts for resin is not practical or cost beneficial and has no such contracts in place. However, should circumstances warrant, the Company may consider such contracts in the future.
The Company has a program to sell land held for development around its Orlando, Florida headquarters ("Orlando Land"). This program is exposed to the risks inherent in the real estate development process. Included among these risks is the ability to obtain all government approvals, the success of attracting tenants for commercial or residential developments in the Orlando real estate market, obtaining financing and general economic conditions, such as interest rate increases. Based on the variety of factors that impact the Company's ability to close sales transactions, it cannot predict when the program will be completed.
Forward-Looking Statements
Certain written and oral statements made or incorporated by reference from time to time by the Company or its representatives in this report, other reports, filings with the Securities and Exchange Commission, press releases, conferences or otherwise are “forward-looking statements” within the meaning of the Private Securities Litigation Reform Act of 1995. Statements in this report or elsewhere that are not based on historical facts or information are forward-looking statements. Such forward-looking statements involve risks and uncertainties which may cause actual results to differ materially from those projected in forward-looking statements. Such risks and uncertainties include, among others, the following:
• | successful recruitment, retention and productivity levels of the Company's independent sales forces; |
• | disruptions caused by the introduction of new or revised distributor operating models or sales force compensation systems or allegations by equity analysts, former distributors or sales force members, government agencies or others as to the legality or viability of the Company's business model, particularly in India; |
• | success of new products and promotional programs; |
• | the ability to implement appropriate product mix and pricing strategies; |
• | governmental regulation of materials used in products coming into contact with food (e.g. polycarbonate), as well as beauty, personal care and nutritional products; |
40
• | the ability to procure and pay for at reasonable economic cost, sufficient raw materials and/or finished goods to meet current and future consumer demands at reasonable suggested retail pricing levels in certain markets, particularly Argentina, Ecuador, Egypt and Venezuela due to government regulations and restrictions; |
• | the impact of changes in consumer spending patterns and preferences, particularly given the global nature of the Company's business; |
• | the value of long-term assets, particularly goodwill and indefinite and definite lived intangibles associated with acquisitions, and the realizability of the value of recognized tax assets; |
• | changes in plastic resin prices, other raw materials and packaging components, the cost of converting such items into finished goods and procured finished products and the cost of delivering products to customers; |
• | the introduction of Company operations in new markets outside the United States; |
• | general social, economic and political conditions in markets, such as in Argentina, Ecuador, Egypt, Greece, Kazakhstan, Russia, Turkey, Ukraine and Venezuela and other countries impacted by such events; |
• | issues arising out of the sovereign debt in the countries in which the Company operates, such as in Argentina and those in the Euro zone, resulting in potential economic and operational challenges for the Company's supply chains, heightened counterparty credit risk due to adverse effects on customers and suppliers, exchange controls (such as in Argentina, Egypt, and Venezuela) and translation risks due to potential impairments of investments in affected markets and the potential for banks with which the Company maintains lines of credit to be unable to fulfill their commitments; |
• | disruptions resulting from either internal or external labor strikes, work stoppages, or similar difficulties; |
• | changes in cash flow resulting from changes in operating results, including from changes in foreign exchange rates, working capital management, debt payments, share repurchases and hedge settlements; |
• | the impact of currency fluctuations on the value of the Company's operating results, assets, liabilities and commitments of foreign operations generally, including their cash balances during and at the end of quarterly reporting periods, the results of those operations, the cost of sourcing products across geographies and the success of foreign hedging and risk management strategies; |
• | the impact of natural disasters, terrorist activities and epidemic or pandemic disease outbreaks; |
• | the ability to repatriate, or otherwise make available, cash in the United States and to do so at a favorable foreign exchange rate and with favorable tax ramifications; |
• | the ability to obtain all government approvals on, and to control the cost of infrastructure obligations associated with, property, plant and equipment; |
• | the ability to timely and effectively implement, transition, maintain and protect necessary information technology systems and infrastructure; |
• | the ability to attract and retain certain executive officers and key management personnel; |
• | the success of land buyers in attracting tenants for commercial and residential development and obtaining financing; |
• | the costs and covenant restrictions associated with the Company's credit arrangements; |
• | integration of non-traditional product lines into Company operations; |
• | the effect of legal, regulatory and tax proceedings, as well as restrictions imposed on the Company's operations or Company representatives by foreign governments, including exposure to tax responsibilities imposed on the sales force and their potential impact on the sales force's value chain and resulting disruption to the business and actions taken by governments to set or restrict the freedom of the Company to set its own prices or its suggested retail prices for product sales by its sales force to end consumers and actions taken by governments to restrict the ability to convert local currency to other currencies in order to satisfy obligations outside the country generally, and in particular Argentina, Egypt and Venezuela; |
41
• | the effect of competitive forces in the markets in which the Company operates, particularly related to sales of beauty, personal care and nutritional products, where there are a greater number of competitors; |
• | the impact of counterfeit and knocked-off products in the markets in which the Company operates and the effect this can have on the confidence of the Company's sales force members; |
• | the impact of changes in U.S. federal, state and foreign tax or other laws; |
• | the Company's access to, and the costs of, financing; and |
• | other risks discussed in Item 1A, Risk Factors, as well as the Company's Consolidated Financial Statements, Notes, other financial information appearing elsewhere in this report and the Company's other filings with the United States Securities and Exchange Commission. |
Other than updating for changes in foreign currency exchange rates through its monthly website updates, the Company does not intend to update forward-looking information, except through its quarterly earnings releases, unless it expects diluted earnings per share for the current quarter, excluding items impacting comparability and changes versus its guidance of the impact of changes in foreign exchange rates, to be significantly below its previous guidance.
Investors should also be aware that while the Company does, from time to time, communicate with securities analysts, it is against the Company's policy to disclose to them any material non-public information or other confidential commercial information. Accordingly, it should not be assumed that the Company agrees with any statement or report issued by any analyst irrespective of the content of the confirming financial forecasts or projections issued by others.
42
Item 8. | Financial Statements and Supplementary Data. |
Tupperware Brands Corporation
Consolidated Statements of Income
Year Ended | |||||||||||
(In millions, except per share amounts) | December 26, 2015 | December 27, 2014 | December 28, 2013 | ||||||||
Net sales | $ | 2,283.8 | $ | 2,606.1 | $ | 2,671.6 | |||||
Cost of products sold | 744.4 | 884.0 | 889.8 | ||||||||
Gross margin | 1,539.4 | 1,722.1 | 1,781.8 | ||||||||
Delivery, sales and administrative expense | 1,217.6 | 1,346.1 | 1,369.7 | ||||||||
Re-engineering and impairment charges | 20.3 | 11.0 | 9.3 | ||||||||
Gains on disposal of assets | 13.7 | 2.7 | 0.7 | ||||||||
Operating income | 315.2 | 367.7 | 403.5 | ||||||||
Interest income | 2.4 | 3.0 | 2.6 | ||||||||
Interest expense | 47.6 | 46.5 | 40.2 | ||||||||
Other expense | 10.1 | 26.0 | 5.5 | ||||||||
Income before income taxes | 259.9 | 298.2 | 360.4 | ||||||||
Provision for income taxes | 74.1 | 83.8 | 86.2 | ||||||||
Net income | $ | 185.8 | $ | 214.4 | $ | 274.2 | |||||
Basic earnings per common share | $ | 3.72 | $ | 4.28 | $ | 5.28 | |||||
Diluted earnings per common share | $ | 3.69 | $ | 4.20 | $ | 5.17 | |||||
The accompanying notes are an integral part of these financial statements.
43
Tupperware Brands Corporation
Consolidated Statements of Comprehensive Income
Year Ended | |||||||||||
(In millions) | December 26, 2015 | December 27, 2014 | December 28, 2013 | ||||||||
Net income | $ | 185.8 | $ | 214.4 | $ | 274.2 | |||||
Other comprehensive income (loss): | |||||||||||
Foreign currency translation adjustments | (122.3 | ) | (85.2 | ) | (64.9 | ) | |||||
Deferred gain (loss) on cash flow hedges, net of tax benefit (provision) of $1.1, ($1.3) and ($0.8), respectively | (3.5 | ) | 5.6 | 2.4 | |||||||
Pension and other post-retirement income (costs), net of tax benefit (provision) of ($6.2), $4.7 and ($9.3), respectively | 12.5 | (12.3 | ) | 17.0 | |||||||
Other comprehensive income (loss) | (113.3 | ) | (91.9 | ) | (45.5 | ) | |||||
Total comprehensive income | $ | 72.5 | $ | 122.5 | $ | 228.7 | |||||
The accompanying notes are an integral part of these financial statements.
44
Tupperware Brands Corporation
Consolidated Balance Sheets
(In millions, except share amounts) | December 26, 2015 | December 27, 2014 | |||||
ASSETS | |||||||
Cash and cash equivalents | $ | 79.8 | $ | 77.0 | |||
Accounts receivable, less allowances of $32.7 and $34.5, respectively | 142.7 | 168.1 | |||||
Inventories | 254.6 | 306.0 | |||||
Non-trade amounts receivable, net | 45.5 | 61.8 | |||||
Prepaid expenses and other current assets | 27.9 | 21.6 | |||||
Total current assets | 550.5 | 634.5 | |||||
Deferred income tax benefits, net | 524.9 | 525.3 | |||||
Property, plant and equipment, net | 253.6 | 290.3 | |||||
Long-term receivables, less allowances of $11.2 and $13.1, respectively | 13.2 | 17.3 | |||||
Tradenames, net | 82.7 | 104.2 | |||||
Other intangible assets, net | — | 1.5 | |||||
Goodwill | 146.3 | 164.7 | |||||
Other assets, net | 27.0 | 32.0 | |||||
Total assets | $ | 1,598.2 | $ | 1,769.8 | |||
LIABILITIES AND SHAREHOLDERS' EQUITY | |||||||
Accounts payable | $ | 126.7 | $ | 142.8 | |||
Short-term borrowings and current portion of long-term debt and capital lease obligations | 162.5 | 221.4 | |||||
Accrued liabilities | 324.8 | 375.3 | |||||
Total current liabilities | 614.0 | 739.5 | |||||
Long-term debt and capital lease obligations | 608.2 | 612.1 | |||||
Other liabilities | 215.0 | 232.4 | |||||
Shareholders' equity: | |||||||
Preferred stock, $0.01 par value, 200,000,000 shares authorized; none issued | — | — | |||||
Common stock, $0.01 par value, 600,000,000 shares authorized; 63,607,090 shares issued | 0.6 | 0.6 | |||||
Paid-in capital | 205.5 | 190.7 | |||||
Retained earnings | 1,371.2 | 1,348.2 | |||||
Treasury stock, 13,170,517 and 13,924,568 shares, respectively, at cost | (894.3 | ) | (945.0 | ) | |||
Accumulated other comprehensive loss | (522.0 | ) | (408.7 | ) | |||
Total shareholders' equity | 161.0 | 185.8 | |||||
Total liabilities and shareholders' equity | $ | 1,598.2 | $ | 1,769.8 | |||
The accompanying notes are an integral part of these financial statements.
45
Tupperware Brands Corporation
Consolidated Statements of Shareholders' Equity
Common Stock | Treasury Stock | Paid-In Capital | Retained Earnings | Accumulated Other Comprehensive Loss | Total Shareholders' Equity | |||||||||||||||||||||||
(In millions, except per share amounts) | Shares | Dollars | Shares | Dollars | ||||||||||||||||||||||||
December 29, 2012 | 63.6 | $ | 0.6 | 9.6 | $ | (573.8 | ) | $ | 151.2 | $ | 1,172.4 | $ | (271.3 | ) | $ | 479.1 | ||||||||||||
Net income | 274.2 | 274.2 | ||||||||||||||||||||||||||
Other comprehensive income | (45.5 | ) | (45.5 | ) | ||||||||||||||||||||||||
Cash dividends declared ($2.48 per share) | (129.8 | ) | (129.8 | ) | ||||||||||||||||||||||||
Repurchase of common stock | 4.6 | (374.9 | ) | (374.9 | ) | |||||||||||||||||||||||
Income tax benefit from stock and option awards | 14.5 | 14.5 | ||||||||||||||||||||||||||
Stock and options issued for incentive plans | (0.9 | ) | 50.3 | 12.6 | (27.6 | ) | 35.3 | |||||||||||||||||||||
December 28, 2013 | 63.6 | $ | 0.6 | 13.3 | $ | (898.4 | ) | $ | 178.3 | $ | 1,289.2 | $ | (316.8 | ) | $ | 252.9 | ||||||||||||
Net income | 214.4 | 214.4 | ||||||||||||||||||||||||||
Other comprehensive loss | (91.9 | ) | (91.9 | ) | ||||||||||||||||||||||||
Cash dividends declared ($2.72 per share) | (137.8 | ) | (137.8 | ) | ||||||||||||||||||||||||
Repurchase of common stock | 1.2 | (84.3 | ) | (84.3 | ) | |||||||||||||||||||||||
Income tax benefit from stock and option awards | 6.3 | 6.3 | ||||||||||||||||||||||||||
Stock and options issued for incentive plans | (0.6 | ) | 37.7 | 6.1 | (17.6 | ) | 26.2 | |||||||||||||||||||||
December 27, 2014 | 63.6 | $ | 0.6 | 13.9 | $ | (945.0 | ) | $ | 190.7 | $ | 1,348.2 | $ | (408.7 | ) | $ | 185.8 | ||||||||||||
Net income | 185.8 | 185.8 | ||||||||||||||||||||||||||
Other comprehensive loss | (113.3 | ) | (113.3 | ) | ||||||||||||||||||||||||
Cash dividends declared ($2.72 per share) | (137.5 | ) | (137.5 | ) | ||||||||||||||||||||||||
Repurchase of common stock | — | — | — | |||||||||||||||||||||||||
Income tax benefit from stock and option awards | 6.0 | 6.0 | ||||||||||||||||||||||||||
Stock and options issued for incentive plans | (0.7 | ) | 50.7 | 8.8 | (25.3 | ) | 34.2 | |||||||||||||||||||||
December 26, 2015 | 63.6 | $ | 0.6 | 13.2 | $ | (894.3 | ) | $ | 205.5 | $ | 1,371.2 | $ | (522.0 | ) | $ | 161.0 | ||||||||||||
The accompanying notes are an integral part of these financial statements.
46
Tupperware Brands Corporation
Consolidated Statements of Cash Flow
Year Ended | |||||||||||
(In millions) | December 26, 2015 | December 27, 2014 | December 28, 2013 | ||||||||
Operating Activities: | |||||||||||
Net income | $ | 185.8 | $ | 214.4 | $ | 274.2 | |||||
Adjustments to reconcile net income to net cash provided by operating activities: | |||||||||||
Depreciation and amortization | 62.4 | 63.7 | 54.8 | ||||||||
Equity compensation | 20.0 | 18.9 | 19.5 | ||||||||
Unrealized foreign exchange losses | 7.2 | 29.2 | 2.5 | ||||||||
Amortization and write-off of deferred debt costs | 0.8 | 0.6 | 0.7 | ||||||||
Premium on senior notes | — | — | 6.3 | ||||||||
Net gains on disposal of assets, including insurance recoveries | (13.1 | ) | (2.5 | ) | (0.3 | ) | |||||
Provision for bad debts | 12.8 | 13.5 | 11.8 | ||||||||
Write-down of inventories | 14.3 | 17.8 | 13.3 | ||||||||
Non-cash impact of impairment costs and re-engineering | 13.5 | 1.6 | — | ||||||||
Net change in deferred income taxes | (45.2 | ) | (59.9 | ) | (29.6 | ) | |||||
Excess tax benefits from share-based payment arrangements | (6.0 | ) | (6.3 | ) | (14.5 | ) | |||||
Changes in assets and liabilities: | |||||||||||
Accounts and notes receivable | (10.7 | ) | (28.2 | ) | (16.8 | ) | |||||
Inventories | (8.2 | ) | (39.5 | ) | (33.2 | ) | |||||
Non-trade amounts receivable | (1.6 | ) | 1.4 | (2.5 | ) | ||||||
Prepaid expenses | (8.0 | ) | (2.8 | ) | 3.2 | ||||||
Other assets | 4.7 | (1.1 | ) | 2.8 | |||||||
Accounts payable and accrued liabilities | 11.4 | 25.5 | 15.7 | ||||||||
Income taxes payable | (2.5 | ) | 24.9 | 7.8 | |||||||
Other liabilities | 5.1 | 8.4 | 4.6 | ||||||||
Net cash impact from hedging activity | (17.0 | ) | 4.6 | 3.2 | |||||||
Other | — | (0.1 | ) | — | |||||||
Net cash provided by operating activities | 225.7 | 284.1 | 323.5 | ||||||||
Investing Activities: | |||||||||||
Capital expenditures | (61.1 | ) | (69.4 | ) | (69.0 | ) | |||||
Proceeds from disposal of property, plant and equipment | 18.0 | 7.1 | 8.9 | ||||||||
Net cash used in investing activities | (43.1 | ) | (62.3 | ) | (60.1 | ) | |||||
Financing Activities: | |||||||||||
Dividend payments to shareholders | (138.0 | ) | (135.5 | ) | (116.8 | ) | |||||
Net proceeds from issuance of senior notes | — | — | 200.0 | ||||||||
Proceeds from exercise of stock options | 16.1 | 15.7 | 21.0 | ||||||||
Repurchase of common stock | (1.5 | ) | (92.3 | ) | (379.4 | ) | |||||
Repayment of long-term debt and capital lease obligations | (2.6 | ) | (3.0 | ) | (2.5 | ) | |||||
Net change in short-term debt | (36.4 | ) | (2.2 | ) | 27.8 | ||||||
Debt issuance costs | (0.7 | ) | — | (2.2 | ) | ||||||
Excess tax benefits from share-based payment arrangements | 6.0 | 6.3 | 14.5 | ||||||||
Net cash used in financing activities | (157.1 | ) | (211.0 | ) | (237.6 | ) | |||||
Effect of exchange rate changes on cash and cash equivalents | (22.7 | ) | (61.1 | ) | (18.3 | ) | |||||
Net change in cash and cash equivalents | 2.8 | (50.3 | ) | 7.5 | |||||||
Cash and cash equivalents at beginning of year | 77.0 | 127.3 | 119.8 | ||||||||
Cash and cash equivalents at end of year | $ | 79.8 | $ | 77.0 | $ | 127.3 | |||||
The accompanying notes are an integral part of these financial statements.
47
Notes to the Consolidated Financial Statements
Note 1: | Summary of Significant Accounting Policies |
Principles of Consolidation. The Consolidated Financial Statements include the accounts of Tupperware Brands Corporation and all of its subsidiaries (Tupperware Brands or the Company). All significant intercompany accounts and transactions have been eliminated. The Company’s fiscal year ends on the last Saturday of December and included 52 weeks during 2015, 2014 and 2013. Its 2016 fiscal year will include 53 weeks.
Use of Estimates. The preparation of financial statements in conformity with accounting principles generally accepted in the United States of America requires management to make estimates and assumptions. These estimates and assumptions affect the reported amounts of assets and liabilities and disclosure of contingent liabilities at the date of the financial statements, as well as the reported amounts of revenues and expenses during the reporting period. Actual results could differ materially from these estimates.
Cash and Cash Equivalents. The Company considers all highly liquid investments with a maturity of three months or less when purchased to be cash equivalents. As of December 26, 2015 and December 27, 2014, $7.4 million and $15.9 million, respectively, of the cash and cash equivalents included on the Consolidated Balance Sheets were held in the form of time deposits, certificates of deposit or similar instruments.
Allowance for Doubtful Accounts. The Company maintains current receivable amounts with most of its independent distributors and sales force in certain markets. It also maintains long-term receivable amounts with certain of these customers. The Company regularly monitors and assesses its risk of not collecting amounts owed to it by customers. This evaluation is based upon an analysis of amounts current and past due, along with relevant history and facts particular to the customer. It is also based upon estimates of distributor business prospects, particularly related to the evaluation of the recoverability of long-term amounts due. This evaluation is performed market by market and account by account, based upon historical experience, market penetration levels and similar factors. It also considers collateral of the customer that could be recovered to satisfy debts. The Company records its allowance for doubtful accounts based on the results of this analysis. The analysis requires the Company to make significant estimates and as such, changes in facts and circumstances could result in material changes in the allowance for doubtful accounts. The Company considers any receivable balance not collected within its contractual terms past due.
Inventories. Inventories are valued at the lower of cost or market on a first-in, first-out basis. Inventory cost includes cost of raw material, labor and overhead. The Company writes down its inventory for obsolescence or unmarketability in an amount equal to the difference between the cost of the inventory and estimated market value based upon expected future demand and pricing. The demand and pricing is estimated based upon the historical success of product lines as well as the projected success of promotional programs, new product introductions and new markets or distribution channels. The Company prepares projections of demand and pricing on an item by item basis for all of its products. If inventory on hand exceeds projected demand or the expected market value is less than the carrying value, the excess is written down to its net realizable value. However, if actual demand or the estimate of market decreases, additional write-downs would be required.
Internal Use Software Development Costs. The Company capitalizes internal use software development costs as they are incurred and amortizes such costs over their estimated useful lives of three to five years, beginning when the software is placed in service. Net unamortized costs of such amounts included in property, plant and equipment were $20.1 million and $14.9 million at December 26, 2015 and December 27, 2014, respectively. Amortization cost related to internal use software development costs totaled $5.7 million, $4.4 million and $4.5 million in 2015, 2014 and 2013, respectively.
48
Property, Plant and Equipment. Property, plant and equipment is initially stated at cost. Depreciation is recorded on a straight-line basis over the following estimated useful lives of the assets:
Years | |
Building and improvements | 10 - 40 |
Molds | 4 - 10 |
Production equipment | 10 - 20 |
Distribution equipment | 5 - 10 |
Computer/telecom equipment | 3 - 5 |
Capitalized software | 3 - 5 |
Depreciation expense was $46.5 million, $47.3 million and $45.5 million in 2015, 2014 and 2013, respectively. The Company considers the need for an impairment review when events occur that indicate that the book value of a long-lived asset may exceed its recoverable value. Upon the sale or retirement of property, plant and equipment, a gain or loss is recognized equal to the difference between sales price and net book value. Expenditures for maintenance and repairs are charged to cost of products sold or delivery, sales and administrative (DS&A) expense, depending on the asset to which the expenditure relates.
Goodwill. The Company's recorded goodwill relates primarily to the December 2005 acquisition of the direct-to-consumer businesses of Sara Lee Corporation. The Company does not amortize its goodwill. Instead, the Company performs an annual assessment during the third quarter of each year to evaluate the assets in each of its reporting units for impairment, or more frequently if events or changes in circumstances indicate that a triggering event for an impairment evaluation has occurred.
The annual process for evaluating goodwill begins with an assessment for each entity of qualitative factors to determine whether the two-step goodwill impairment evaluation is appropriate. The qualitative factors evaluated by the Company include: macro-economic conditions of the local business environment, overall financial performance, sensitivity analysis from the most recent step 1 fair value evaluation ("step 1"), as prescribed under ASC 350, Intangibles - Goodwill and Other, and other entity specific factors as deemed appropriate. When the Company determines the two-step goodwill impairment evaluation is appropriate, the step 1 involves comparing the fair value of a reporting unit to its carrying amount, including goodwill, after any long-lived asset impairment charges. If the carrying amount of the reporting unit exceeds its fair value, a second step is performed to determine whether there is a goodwill impairment, and if so, its amount. This step revalues all assets and liabilities of the reporting unit to their current fair value and then compares the implied fair value of the reporting unit's goodwill to the carrying amount of that goodwill. If the carrying amount of the reporting unit's goodwill exceeds the implied fair value of the goodwill, an impairment loss is recognized in an amount equal to the excess.
When a determination of fair value of the Company's reporting units is necessary, it is determined by using either the income approach or a combination of the income and market approaches, with generally a greater weighting on the income approach (75 percent). The income approach, or discounted cash flow approach, requires significant assumptions to estimate the fair value of each reporting unit. These include assumptions regarding future operations and the ability to generate cash flows including projections of revenue, costs, utilization of assets and capital requirements, along with an appropriate discount rates to be used. Goodwill is further discussed in Note 6 to the Consolidated Financial Statements.
Intangible Assets. Intangible assets are recorded at their fair market values at the date of acquisition and definite-lived intangibles are amortized over their estimated useful lives. The intangible assets included in the Company's Consolidated Financial Statements at December 26, 2015 and December 27, 2014 were related to the acquisition of the Sara Lee direct-to-consumer businesses in December 2005. The weighted average estimated useful lives of the Company's intangible assets were as follows:
Weighted Average Estimated Useful Life | |
Indefinite-lived tradenames | Indefinite |
Definite-lived tradenames | 10 years |
Sales force relationships | 6 - 10 years |
49
The Company's indefinite-lived tradename intangible assets are evaluated for impairment annually similarly to goodwill. The annual process for assessing the carrying value of indefinite-lived tradename intangible assets begins with a qualitative assessment that is similar to the assessment performed for goodwill. When the Company determines it is appropriate, the quantitative impairment evaluation for the Company's indefinite-lived tradenames involves comparing the estimated fair value of the assets to the carrying amounts, to determine if fair value is lower and a write-down required. If the carrying amount of a tradename exceeds its estimated fair value, an impairment charge is recognized in an amount equal to the excess. The fair value of these assets is determined using the relief from royalty method, which is a form of the income approach. In this method, the value of the asset is calculated by selecting royalty rates, which estimate the amount a company would be willing to pay for the use of the asset. These rates are applied to the Company's projected revenue, tax affected and discounted to present value using an appropriate rate.
The Company's definite-lived intangible assets consist of the value of the acquired independent sales forces, as well as the Fuller tradename since August 2013. The Fuller tradename is being amortized over the period that it is estimated that the tradename will contribute directly to the Company's revenue. The sales force relationships have been fully amortized as of the end of 2015. Definite-lived intangible assets are reviewed for impairment in a similar manner as property, plant and equipment as discussed above. Amortization related to definite-lived intangible assets is included in DS&A on the Consolidated Statements of Income.
Intangible assets are further discussed in Note 6 to the Consolidated Financial Statements.
Promotional and Other Accruals. The Company frequently makes promotional offers to members of its independent sales force to encourage them to fulfill specific goals or targets for sales levels, party attendance, additions of new sales force members or other business-critical functions. The awards offered are in the form of product awards, special prizes or trips.
Programs are generally designed to recognize sales force members for achieving a primary objective. An example is to reward the independent sales force for holding a certain number of group demonstrations. In this situation, the Company offers a prize to sales force members that achieve the targeted number of group demonstrations over a specified period. The period runs from a couple of weeks to several months. The prizes are generally graded, in that meeting one level may result in receiving a piece of jewelry, with higher achievement resulting in more valuable prizes such as a television set or a trip. Similar programs are designed to reward current sales force members who reach certain goals by promoting them to a higher level in the organization where their earning opportunity would be expanded, and they would take on additional responsibilities for adding new sales force members and providing training and motivation to new and existing sales force members. Other business drivers, such as scheduling group demonstrations, increasing the number of sales force members, holding group demonstrations or increasing end consumer attendance at group demonstrations, may also be the focus of a program.
The Company also offers commissions for achieving targeted sales levels. These types of awards are generally based upon the sales achievement of at least a mid-level member of the sales force and her or his down-line members. The down-line consists of those sales force members that have been directly added to the sales force by a given sales force member, as well as those added by her or his down-line member. In this manner, sales force members can build an extensive organization over time if they are committed to adding and developing their units. In addition to the commission, the positive performance of a unit may also entitle its leader to the use of a company-provided vehicle and in some cases, the permanent awarding of a vehicle. Similar to the prize programs noted earlier, these programs generally offer varying levels of vehicles that are dependent upon performance.
The Company accrues for the costs of these awards during the period over which the sales force qualifies for the award and reports these costs primarily as a component of DS&A expense. These accruals require estimates as to the cost of the awards, based upon estimates of achievement and actual cost to be incurred. During the qualification period, actual results are monitored and changes to the original estimates are made when known. Promotional and other sales force compensation expenses included in DS&A expense totaled $378.7 million, $430.1 million and $445.9 million in 2015, 2014 and 2013, respectively.
Like promotional accruals, other accruals are recorded over the time period that a liability is incurred and is both probable and reasonably estimable. Adjustments to amounts previously accrued are made when changes occur in the facts and circumstances that generated the accrual.
50
Revenue Recognition. Revenue is recognized when the price is fixed, the title and risks and rewards of ownership have passed to the customer who, in most cases, is one of the Company’s independent distributors or a member of its independent sales force, and when collection is reasonably assured. Depending on the contractual arrangements for each business, revenue is recognized upon either delivery or shipment, which is when title and risk and rewards of ownership have passed to the customer. When revenue is recorded, estimates of returns are made and recorded as a reduction of revenue. Discounts earned based on promotional programs in place, volume of purchases or other factors are also estimated at the time of revenue recognition and recorded as a reduction of that revenue.
Shipping and Handling Costs. The cost of products sold line item includes costs related to the purchase and manufacture of goods sold by the Company. Among these costs are inbound freight charges, duties, purchasing and receiving costs, inspection costs, depreciation expense, internal transfer costs and warehousing costs of raw material, work in process and packing materials. The warehousing and distribution costs of finished goods are included in DS&A expense. Distribution costs are comprised of outbound freight and associated labor costs. Fees billed to customers associated with the distribution of products are classified as revenue. The distribution costs included in DS&A expense in 2015, 2014 and 2013 were $139.3 million, $156.6 million and $156.7 million, respectively.
Advertising and Research and Development Costs. Advertising and research and development costs are charged to expense as incurred. Advertising expense totaled $13.4 million, $19.9 million and $25.7 million in 2015, 2014 and 2013, respectively. Research and development costs totaled $18.1 million, $19.3 million and $20.0 million, in 2015, 2014 and 2013, respectively. Research and development expenses primarily include salaries, contractor costs and facility costs. Both advertising and research and development costs are included in DS&A expense.
Accounting for Stock-Based Compensation. The Company has several stock-based employee and director compensation plans, which are described more fully in Note 14 to the Consolidated Financial Statements. Compensation cost for share-based awards is recorded on a straight line basis over the required service period, based on the fair value of the award. The fair value of the stock option grants is estimated using the Black-Scholes option-pricing model, which requires assumptions, including dividend yield, risk-free interest rate, the estimated length of time employees will retain their stock options before exercising them (expected term) and the estimated volatility of the Company's common stock price over the expected term. These assumptions are generally based on historical averages of the Company. Furthermore, in calculating compensation expense for these awards, the Company is also required to estimate the extent to which options will be forfeited prior to vesting. Many factors are considered when estimating expected forfeitures, including types of awards, employee class and historical experience. To the extent actual results or updated estimates of forfeiture differ from current estimates, such amounts are recorded as a cumulative adjustment to the previously recorded amounts.
Compensation expense associated with restricted stock, restricted stock units and performance-vested share awards is equal to the market value of the Company's common stock on the date of grant and is recorded pro rata over the required service period. The fair value of market-vested awards is based on a Monte-Carlo simulation that estimates the fair value based on the Company's share price activity between the beginning of the year and the grant date relative to a defined comparative group of companies, expected term of the award, risk-free interest rate, expected dividends, and the expected volatility of the stock of the Company and those in the comparative group. For those awards with performance vesting criteria, the expense is recorded based on an assessment of achieving the criteria. The grant date fair value per share of market-vested awards already reflects the probability of achieving the market condition, and is therefore used to record expense straight line over the performance period regardless of actual achievement.
51
The Company reports as a financing cash flow the tax benefits from share-based payment arrangements. For 2015, 2014 and 2013, the Company generated $6.0 million, $6.3 million and $14.5 million of excess tax benefits, respectively.
Accounting for Asset Retirement Obligations. Asset retirement obligations refer to the Company's legal obligation to perform an asset retirement activity in which the timing and (or) method of settlement are conditional on a future event that may or may not be within its control. The obligation to perform the asset retirement activity is considered unconditional even when uncertainty exists about the timing and (or) method of settlement. Thus, the timing and (or) method of settlement may be conditional on a future event. Accordingly, the Company recognizes a liability for the fair value of a conditional asset retirement obligation if the fair value of the liability can be reasonably estimated. The fair value of a liability for the conditional asset retirement obligation is recognized when incurred-generally upon acquisition, construction, or development and (or) through the normal operation of the asset. Uncertainty about the timing and (or) method of settlement of a conditional asset retirement obligation is factored into the measurement of the liability when sufficient information exists. The Company has recognized a liability for the fair market value of conditional future obligations associated with environmental issues in the United States that the Company will be required to remedy at some future date, when these assets are retired. The Company performs an annual evaluation of its obligations regarding this matter and records depreciation and costs associated with accretion of the obligation. This was not material in 2015, 2014 and 2013, and is not expected to be material in the future.
Income Taxes. Deferred tax assets and liabilities are recognized for the future tax consequences attributable to temporary differences between the financial statement carrying amounts of assets and liabilities and their respective tax bases. Deferred tax assets also are recognized for credit carryforwards. Deferred tax assets and liabilities are measured using the enacted rates applicable to taxable income in the years in which the temporary differences are expected to reverse and the credits are expected to be used. The effect on deferred tax assets and liabilities of a change in tax rates is recognized in income in the period that includes the enactment date. An assessment is made as to whether or not a valuation allowance is required to offset deferred tax assets. This assessment requires estimates as to future operating results, as well as an evaluation of the effectiveness of the Company's tax planning strategies. These estimates are made on an ongoing basis based upon the Company's business plans and growth strategies in each market and consequently, future material changes in the valuation allowance are possible.
The Company accounts for uncertain tax positions in accordance with ASC 740, Income Taxes. This guidance prescribes a minimum probability threshold that a tax position must meet before a financial statement benefit is recognized. The minimum threshold is defined as a tax position that is more likely than not to be sustained upon examination by the applicable taxing authority, including resolution of any related appeals or litigation processes, based on the technical merits of the position. The tax benefit to be recognized is measured as the largest amount of benefit that is greater than 50 percent likely of being realized upon ultimate settlement.
Interest and penalties related to tax contingency or settlement items are recorded as a component of the provision for income taxes in the Company's Consolidated Statements of Income. The Company records accruals for tax contingencies as a component of accrued liabilities or other long-term liabilities on its balance sheet.
Net Income Per Common Share. Basic per share information is calculated by dividing net income by the weighted average number of shares outstanding. Diluted per share information is calculated by also considering the impact of potential common stock on both net income and the weighted average number of shares outstanding. The Company's potential common stock consists of employee and director stock options, restricted stock, restricted stock units and performance share units. Performance share awards are included in the diluted per share calculation when the performance criteria are achieved. The Company's potential common stock is excluded from the basic per share calculation and is included in the diluted per share calculation when doing so would not be anti-dilutive.
52
The elements of the earnings per share computations were as follows:
(In millions, except per share amounts) | 2015 | 2014 | 2013 | ||||||||
Net income | $ | 185.8 | $ | 214.4 | $ | 274.2 | |||||
Weighted-average shares of common stock outstanding | 49.9 | 50.1 | 51.9 | ||||||||
Common equivalent shares: | |||||||||||
Assumed exercise of dilutive options, restricted shares, restricted stock units and performance share units | 0.5 | 0.9 | 1.2 | ||||||||
Weighted-average common and common equivalent shares outstanding | 50.4 | 51.0 | 53.1 | ||||||||
Basic earnings per share | $ | 3.72 | $ | 4.28 | $ | 5.28 | |||||
Diluted earnings per share | $ | 3.69 | $ | 4.20 | $ | 5.17 | |||||
Shares excluded from the determination of potential common stock because inclusion would have been anti-dilutive | 0.9 | 0.4 | 0.1 | ||||||||
Derivative Financial Instruments. The Company recognizes in its Consolidated Balance Sheets the asset or liability associated with all derivative instruments and measures those assets and liabilities at fair value. If certain conditions are met, a derivative may be specifically designated as a hedge. The accounting for changes in the value of a derivative accounted for as a hedge depends on the intended use of the derivative and the resulting designation of the hedge exposure. Depending on how the hedge is used and the designation, the gain or loss due to changes in value is reported either in earnings, or initially in other comprehensive income. Gains or losses that are reported in other comprehensive income are eventually recognized in earnings, with the timing of this recognition governed by ASC 815, Derivatives and Hedging.
The Company uses derivative financial instruments, principally over-the-counter forward exchange contracts with major international financial institutions, to offset the effects of exchange rate changes on net investments in certain foreign subsidiaries, certain forecasted purchases, certain intercompany loan transactions, and certain accounts payable. The Company also uses euro denominated borrowings under its Credit Agreement to hedge a portion of its net investment in foreign subsidiaries. Gains and losses on instruments designated as net equity hedges of net investments in a foreign subsidiary or on intercompany transactions that are permanent in nature are accrued as exchange rates change, and are recognized in shareholders' equity as a component of foreign currency translation adjustments within accumulated other comprehensive loss. Gains and losses on contracts designated as fair value hedges of accounts receivable, accounts payable and non-permanent intercompany transactions are accrued as exchange rates change and are recognized in income. Gains and losses on contracts designated as cash flow hedges of identifiable foreign currency forecasted purchases are deferred and initially included in other comprehensive income. In assessing hedge effectiveness, the Company excludes forward points, which are included as a component of interest expense. See Note 8 to the Consolidated Financial Statements.
Fair Value Measurements. The Company applies the applicable accounting guidance for fair value measurements. This guidance provides the definition of fair value, describes the method used to appropriately measure fair value in accordance with generally accepted accounting principles and outlines fair value disclosure requirements.
The fair value hierarchy established under this guidance prioritizes the inputs used to measure fair value. The hierarchy gives the highest priority to unadjusted quoted prices in active markets for identical assets or liabilities (Level 1 measurement) and the lowest priority to unobservable inputs (Level 3 measurement). The three levels of the fair value hierarchy are as follows:
Level 1 - Quoted prices are available in active markets for identical assets or liabilities as of the reporting date. Active markets are those in which transactions for the asset or liability occur in sufficient frequency and volume to provide pricing information on an ongoing basis.
53
Level 2 - Pricing inputs are other than quoted prices in active markets included in Level 1, which are either directly or indirectly observable as of the reporting date. Level 2 includes those financial instruments that are valued using models or other valuation methodologies. These models are primarily industry-standard models that consider various assumptions, including quoted prices, time value, volatility factors, and current market and contractual prices for the underlying instruments, as well as other relevant economic measures. Substantially all of these assumptions are observable in the marketplace throughout the full term of the instrument, can be derived from observable data or are supported by observable levels at which transactions are executed in the marketplace.
Level 3 - Pricing inputs include significant inputs that are generally less observable from objective sources. These inputs may be used with internally developed methodologies that result in management's best estimate of fair value from the perspective of a market participant. The Company does not have any recurring Level 3 fair value measurements.
Foreign Currency Translation. Results of operations of foreign subsidiaries are translated into U.S. dollars using average exchange rates during the year. The assets and liabilities of those subsidiaries, other than those of operations in highly inflationary countries, are translated into U.S. dollars using exchange rates at the balance sheet date. The related translation adjustments are included in accumulated other comprehensive loss. Foreign currency transaction gains and losses, as well as re-measurement of financial statements of subsidiaries in highly inflationary countries, are included in income.
Inflation in Venezuela has been at relatively high levels over the past few years. The Company uses a blended index of the Consumer Price Index and National Consumer Price Index for determining highly inflationary status in Venezuela. This blended index reached cumulative three-year inflation in excess of 100 percent at November 30, 2009 and as such, the Company transitioned to highly inflationary status at the beginning of its 2010 fiscal year. Gains and losses resulting from the translation of the financial statements of subsidiaries operating in highly inflationary economies are recorded in earnings.
The bolivar to U.S. dollar exchange rates used in translating the Company’s operating activity were 6.3 in the first quarter of 2014, 10.8 in the second quarter and 50.0 in the second half of 2014 and in January 2015. In February 2015, the Venezuelan government launched an overhaul of its foreign currency exchange structure for obtaining U.S. dollars, introducing the Simadi mechanism. The Company used rates determined under this mechanism of 172.0 bolivars to the U.S. dollar to translate its February 2015 operating activity and 190.0 to translate March 2015 operating activity and the end of March balance sheet of Venezuela. The Company used a rate of 199.0 beginning in May 2015 through the end of 2015. The Company expects to continue to use the Simadi rate to translate future operating activity. In 2015 and 2014, the net expense in connection with re-measuring net monetary assets and recording in cost of sales inventory at the exchange rate when it was purchased or manufactured compared to when it was sold was $14.9 million and $42.4 million, respectively. The amounts related to remeasurement are included in other expense.
As of the end of 2015, the Company had approximately $1 million of net monetary assets in Venezuela, which were of a nature that would generate income or expense associated with future exchange rate fluctuations versus the U.S. dollar. In addition, there was $25.5 million in cumulative foreign currency translation losses related to Venezuela included in equity within the consolidated balance sheets.
Product Warranty. Tupperware® brand products are guaranteed against chipping, cracking, breaking or peeling under normal non-commercial use of the product with certain limitations. The cost of replacing defective products is not material.
New Accounting Pronouncements. In May 2014, the FASB issued an amendment to existing guidance regarding revenue from contracts with customers. The amendment outlines a single comprehensive model for entities to use in accounting for revenue arising from contracts with customers. In August 2015, the FASB issued an amendment to defer the effective date by one year to December 15, 2017 for annual reporting periods beginning after that date. The amendment also allows early adoption of the revenue standard, but not before the original effective date of December 15, 2016. The Company is currently evaluating the impact of the adoption of this amendment on its Consolidated Financial Statements.
54
In February 2015, the FASB issued an amendment to existing guidance regarding consolidation for reporting organizations such as limited partnerships and other similar entities that are required to evaluate whether they should consolidate certain legal entities. This guidance is effective for fiscal years beginning after December 15, 2015. Early adoption is permitted. The Company does not expect adoption of this amendment to have an impact on its Consolidated Financial Statements.
In April and June 2015, the FASB issued amendments to existing guidance which requires that debt issuance costs related to a recognized debt liability be presented in the balance sheet as a direct deduction from the carrying amount of that debt liability, consistent with debt discounts, while debt issuance costs associated with revolving lines of credit may continue to be deferred assets. The Company adopted these amendments retrospectively effective March 28, 2015. The adoption of this amendment did not have a material impact on the Consolidated Financial Statements.
In April 2015, the FASB issued an amendment to existing guidance providing a practical expedient for entities with fiscal year-ends that do not fall on a month-end by permitting those entities to measure defined benefit plan assets and obligations as of the month-end that is closest to the entity's fiscal year-end. The Company adopted this amendment prospectively effective March 28, 2015. The adoption of this amendment did not have a material impact on the Consolidated Financial Statements.
In April 2015, the FASB issued an amendment to existing guidance regarding accounting for fees in a cloud computing arrangement. Under the amendment, if a cloud computing arrangement includes a software license, then the entity should account for the software license element of the arrangement consistent with the acquisition of other software licenses. If the arrangement does not include a software license, the entity should account for the arrangement as a service contract. The Company adopted this amendment prospectively effective March 28, 2015. The adoption of this amendment did not have a material impact on the Consolidated Financial Statements.
In July 2015, the FASB issued an amendment to existing guidance simplifying the measurement of inventory. Under the amendment, inventory should be measured at the lower of cost and net realizable value. Net realizable value is the estimated selling prices in the ordinary course of business, less reasonably predictable costs of completion, disposal and transportation. This guidance is effective for fiscal years beginning after December 15, 2016. Early adoption is permitted. The Company does not expect the adoption of this amendment to have an impact on its Consolidated Financial Statements.
In November 2015, the FASB issued an amendment to existing guidance in order to simplify the presentation of deferred income taxes. Under the amendment, in a classified consolidated balance sheet, companies are required to classify all deferred tax assets and liabilities as non-current. The Company adopted these amendments retrospectively for all periods presented. As a result, the Company reclassified for the 2014 reporting period, $118.8 million of current deferred tax assets and $2.1 million of current deferred tax liabilities to non-current deferred tax assets and liabilities.
In January 2016, the FASB issued an amendment to existing guidance regarding Financial Instruments. The amendment principally affects accounting for equity investments and financial liabilities where the fair value option has been selected. The amendment is effective for interim and annual periods beginning after December 15, 2017. The Company does not expect adoption of this amendment to have an impact on its Consolidated Financial Statements.
Reclassifications. Certain prior year amounts have been reclassified in the Consolidated Financial Statements to conform to current year presentation.
Note 2: | Re-engineering Costs |
The Company continually reviews its business models and operating methods for opportunities to increase efficiencies and/or align costs with business performance. Pretax costs incurred in the re-engineering and impairment charges caption by category were as follows:
(In millions) | 2015 | 2014 | 2013 | ||||||||
Severance | $ | 5.0 | $ | 7.4 | $ | 7.3 | |||||
Other | 1.8 | 3.6 | 2.0 | ||||||||
Total re-engineering charges | $ | 6.8 | $ | 11.0 | $ | 9.3 | |||||
55
The severance costs incurred were associated with headcount reductions in several of the Company's operations in connection with changes in its management and organizational structures, and in 2014, the decision to cease operating the Armand Dupree business in the United States, the Nutrimetics business in Thailand and a manufacturing plant in India. In 2014, the Other caption included a write-off of $1.1 million in capitalized software in connection with a new information systems project, and in 2013 related to changes in the Company's European operations.
Pretax costs incurred in connection with the re-engineering program included above and other amounts allocated to cost of products sold were as follows:
(In millions) | 2015 | 2014 | 2013 | ||||||||
Re-engineering charges | $ | 6.8 | $ | 11.0 | $ | 9.3 | |||||
Cost of products sold | — | 2.3 | — | ||||||||
Total pretax re-engineering costs | $ | 6.8 | $ | 13.3 | $ | 9.3 | |||||
The balances included in accrued liabilities related to re-engineering and impairment charges as of December 26, 2015, December 27, 2014, and December 28, 2013 were as follows:
(In millions) | 2015 | 2014 | 2013 | ||||||||
Beginning balance | $ | 2.4 | $ | 2.6 | $ | 1.5 | |||||
Provision | 6.8 | 11.0 | 9.3 | ||||||||
Non-cash charges | (0.2 | ) | (1.8 | ) | (0.1 | ) | |||||
Cash expenditures: | |||||||||||
Severance | (5.8 | ) | (7.1 | ) | (6.1 | ) | |||||
Other | (1.5 | ) | (2.3 | ) | (2.0 | ) | |||||
Ending balance | $ | 1.7 | $ | 2.4 | $ | 2.6 | |||||
The accrual balance as of December 26, 2015, related primarily to severance payments to be made by the end of the second quarter of 2016. In connection with the decision to cease operating the Armand Dupree business in the United States and the Nutrimetics business in Thailand, the Company recorded in 2014 charges of $1.9 million and $0.4 million, respectively, in cost of sales for inventory obsolescence.
In February 2015, the Venezuelan government launched an overhaul of its foreign currency exchange structure and created a new exchange mechanism called Simadi that has provided an exchange rate significantly lower than the rate available to the Company under the previous SICAD 2 mechanism. As a result, and based on the perceived impact of this change to the operations of its Venezuelan unit, the Company deemed this change to be a triggering event to evaluate the $15.7 million of long-term fixed assets in Venezuela at that time. This evaluation involved performing an undiscounted cash flow analysis to determine if the carrying value of the assets were recoverable and whether the amount included on the balance sheet was greater than fair value. The Company considered many economic and operating factors, including uncertainty surrounding the interpretation and enforcement of certain product pricing restrictions in Venezuela, the inability at that time to obtain the necessary raw materials locally to meet production demands and the significant decline in the global price of oil. Due, at least in part, to the decline of the global price of oil, the Venezuelan government has not made U.S. dollars widely available through any of the exchange mechanisms it has had in place. Given the devaluation of the Venezuelan bolivar compared with the U.S. dollar, and the lack of U.S dollars available to use for the purchase of raw materials for on-going operations, the Company did not believe it would be able to operate the business profitably. As a result, the Company concluded that the carrying value of the long-term fixed assets in Venezuela was not recoverable. The Company then estimated the fair value of the long-term fixed assets using estimated selling prices available in Venezuela. The primary assets that were considered to continue to maintain a marketable value in Venezuela included commercial office space, a show room and parking spaces. As a result of this evaluation in the first quarter of 2015, the Company recorded an impairment charge of $13.5 million to reduce the long-term fixed asset carrying value in Venezuela to the estimated fair value at that time of $2.2 million, which is considered a non-recurring Level 3 measurement within the fair value hierarchy.
56
Note 3: | Inventories |
(In millions) | 2015 | 2014 | |||||
Finished goods | $ | 203.2 | $ | 242.5 | |||
Work in process | 21.0 | 26.8 | |||||
Raw materials and supplies | 30.4 | 36.7 | |||||
Total inventories | $ | 254.6 | $ | 306.0 | |||
Note 4: | Property, Plant and Equipment |
(In millions) | 2015 | 2014 | |||||
Land | $ | 35.3 | $ | 41.1 | |||
Buildings and improvements | 194.1 | 213.3 | |||||
Molds | 624.7 | 636.0 | |||||
Production equipment | 270.6 | 308.5 | |||||
Distribution equipment | 36.3 | 38.6 | |||||
Computer/telecom equipment | 46.2 | 51.9 | |||||
Furniture and fixtures | 10.9 | 16.3 | |||||
Capitalized software | 76.0 | 69.3 | |||||
Construction in progress | 26.6 | 36.4 | |||||
Total property, plant and equipment | 1,320.7 | 1,411.4 | |||||
Less accumulated depreciation | (1,067.1 | ) | (1,121.1 | ) | |||
Property, plant and equipment, net | $ | 253.6 | $ | 290.3 | |||
Note 5: | Accrued and Other Liabilities |
Accrued Liabilities
(In millions) | 2015 | 2014 | |||||
Income taxes payable | $ | 25.0 | $ | 42.9 | |||
Compensation and employee benefits | 83.4 | 83.8 | |||||
Advertising and promotion | 62.1 | 68.8 | |||||
Taxes other than income taxes | 22.3 | 26.7 | |||||
Pensions | 4.0 | 4.0 | |||||
Post-retirement benefits | 1.9 | 2.1 | |||||
Dividends payable | 34.3 | 33.7 | |||||
Foreign currency contracts | 14.6 | 30.3 | |||||
Other | 77.2 | 83.0 | |||||
Total accrued liabilities | $ | 324.8 | $ | 375.3 | |||
57
Other Liabilities
(In millions) | 2015 | 2014 | |||||
Post-retirement benefits | $ | 16.4 | $ | 18.4 | |||
Pensions | 126.4 | 146.4 | |||||
Income taxes | 18.7 | 16.5 | |||||
Deferred income tax | 16.9 | 14.3 | |||||
Other | 36.6 | 36.8 | |||||
Total other liabilities | $ | 215.0 | $ | 232.4 | |||
Note 6: | Goodwill and Intangible Assets |
The Company's goodwill and intangible assets relate primarily to the December 2005 acquisition of the direct-to-consumer businesses of Sara Lee Corporation.
In the third quarters of 2015 and 2014, the Company completed the annual impairment assessments for all of its reporting units and indefinite-lived intangible assets, concluding there were no impairments. The Company only considers the goodwill balances of $88.6 million and $23.5 million associated with the Fuller Mexico and NaturCare reporting units, respectively, to be significant relative to total equity.
The Company performed in 2015, step 1 impairment evaluations for the goodwill associated with the Fuller Mexico and NaturCare reporting units as prescribed under ASC 350, Intangibles - Goodwill and Other. The fair value analysis for Fuller Mexico and NaturCare were completed using a combination of the income and market approach with a 75 percent weighting on the income approach. The significant assumptions used in the income approach included estimates regarding future operations and the ability to generate cash flows, including projections of revenue, costs, utilization of assets and capital requirements. The income approach, or discounted cash flow approach, also requires an estimate as to the appropriate discount rate to be used for each entity. The most sensitive estimate in this valuation is the projection of operating cash flows, as these provide the basis for the estimate of fair market value. The Company’s cash flow model used a forecast period of 10 years and a terminal value. The growth rates were determined by reviewing historical results of the respective operating units and the historical results of the Company’s other similar business units, along with the expected contribution from growth strategies being implemented in the respective reporting units. The market approach relies on an analysis of publicly-traded companies similar to Tupperware and deriving a range of revenue and profit multiples. The publicly-traded companies used in the market approach were selected based on their having similar product lines of consumer goods, beauty products and/or companies using a direct-to-consumer distribution method. The resulting multiples were then applied to the respective reporting units to determine fair value.
The significant assumptions for the Fuller Mexico step 1 analysis included annual revenue growth rates ranging from negative 2.0 to positive 5.0 percent with an average growth rate of 3.0 percent, including a 3.0 percent growth rate used in calculating the terminal value. The discount rate used for Fuller Mexico was 14.6 percent. As the forecasted results of Fuller Mexico were below the expectations for the step 1 analysis done in 2014, the amount by which the estimated fair value of the Fuller Mexico reporting unit exceeded its carrying value, at 13 percent, was smaller in the third quarter of 2015 than in the 2014 assessment. This decrease reflected lower than expected additions of sales force members in light of high field manager turnover. Along with a difficult competitive environment, this led to worse 2015 operating performance than foreseen in 2014. This was partially offset by a lower discount rate and a lower entity carrying value from amortization of the definite lived Fuller tradename asset that began in the third quarter of 2013. Though the estimated fair value of the reporting unit exceeded its carrying value in the annual assessment, a smaller sales force size and/or operating performance significantly below current expectations, including changes in projected future revenue, profitability and cash flow, as well as higher working capital, interest rates or cost of capital, could have a further negative effect on the fair value of the reporting unit and therefore reduce the fair value below the carrying value. This could result in recording an impairment to the goodwill of Fuller Mexico.
58
The significant assumptions for the NaturCare step 1 analysis included annual revenue changes ranging from 3.0 to 5.0 percent with an average growth rate of 4.0 percent, as well as a 3.0 percent growth rate used in calculating the terminal value. The discount rate used for Naturcare was 10.0 percent. The estimated fair value of the NaturCare reporting unit exceeded the carrying value by 130 percent. Based on the Company's evaluation of the assumptions and sensitivities associated with the step 1 analysis for NaturCare, the Company concluded that the fair value substantially exceeded its carrying value as of the end of the third quarter of 2015.
In August of 2013, the Company concluded it should reclassify its Fuller tradename from indefinite-lived to definite-lived. This conclusion was primarily reached in light of a long-term transition in the Fuller Mexico business to a new brand name. The reclassification of the Fuller tradename from an indefinite-lived to definite-lived asset triggered an impairment review similar to that performed during an annual assessment, as described above. The results of the impairment evaluation demonstrated that the estimated fair value of the Fuller tradename exceeded its carrying value. As a result of this transition, the Company has estimated that the Fuller tradename has a 10 year useful life with amortization to be recorded on a straight-line basis. Amortization expense recorded in 2015, 2014 and 2013 related to the Fuller tradename was $8.8 million, $10.2 million, and $3.4 million, respectively.
The following table reflects gross goodwill and accumulated impairments allocated to each reporting segment at December 26, 2015, December 27, 2014 and December 28, 2013:
(In millions) | Europe | Asia Pacific | TW North America | Beauty North America | South America | Total | |||||||||||||||||
Gross goodwill balance at December 28, 2013 | $ | 31.0 | $ | 79.0 | $ | 16.3 | $ | 154.4 | $ | 5.5 | $ | 286.2 | |||||||||||
Effect of changes in exchange rates | (0.7 | ) | (3.6 | ) | — | (11.8 | ) | (0.7 | ) | (16.8 | ) | ||||||||||||
Gross goodwill balance at December 27, 2014 | 30.3 | 75.4 | 16.3 | 142.6 | 4.8 | 269.4 | |||||||||||||||||
Effect of changes in exchange rates | (1.4 | ) | (0.7 | ) | — | (15.1 | ) | (1.2 | ) | (18.4 | ) | ||||||||||||
Gross goodwill balance at December 26, 2015 | $ | 28.9 | $ | 74.7 | $ | 16.3 | $ | 127.5 | $ | 3.6 | $ | 251.0 | |||||||||||
(In millions) | Europe | Asia Pacific | TW North America | Beauty North America | South America | Total | |||||||||||||||||
Cumulative impairments as of December 28, 2013 | $ | 24.5 | $ | 41.3 | $ | — | $ | 38.9 | $ | — | $ | 104.7 | |||||||||||
Goodwill impairment | — | — | — | — | — | — | |||||||||||||||||
Cumulative impairments as of December 27, 2014 | 24.5 | 41.3 | — | 38.9 | — | 104.7 | |||||||||||||||||
Goodwill impairment | — | — | — | — | — | — | |||||||||||||||||
Cumulative impairments as of December 26, 2015 | $ | 24.5 | $ | 41.3 | $ | — | $ | 38.9 | $ | — | $ | 104.7 | |||||||||||
The gross carrying amount and accumulated amortization of the Company's intangible assets, other than goodwill, were as follows:
December 26, 2015 | |||||||||||
(In millions) | Gross Carrying Value | Accumulated Amortization | Net | ||||||||
Indefinite-lived tradenames | $ | 20.1 | $ | — | $ | 20.1 | |||||
Definite-lived tradenames | 81.7 | 19.1 | 62.6 | ||||||||
Sales force relationships | 46.6 | 46.6 | — | ||||||||
Total intangible assets | $ | 148.4 | $ | 65.7 | $ | 82.7 | |||||
59
December 27, 2014 | |||||||||||
(In millions) | Gross Carrying Value | Accumulated Amortization | Net | ||||||||
Indefinite-lived tradenames | $ | 22.2 | $ | — | $ | 22.2 | |||||
Definite-lived tradenames | 94.6 | 12.6 | 82.0 | ||||||||
Sales force relationships | 49.6 | 48.1 | 1.5 | ||||||||
Total intangible assets | $ | 166.4 | $ | 60.7 | $ | 105.7 | |||||
A summary of the identifiable intangible asset account activity is as follows:
Year Ended | |||||||
(In millions) | December 26, 2015 | December 27, 2014 | |||||
Beginning balance | $ | 166.4 | $ | 184.4 | |||
Effect of changes in exchange rates | (18.0 | ) | (18.0 | ) | |||
Ending balance | $ | 148.4 | $ | 166.4 | |||
Amortization expense was $10.2 million, $11.8 million and $4.8 million in 2015, 2014 and 2013, respectively. The estimated annual amortization expense associated with the above intangibles for each of the five succeeding years is $8.2 million.
Note 7: | Financing Obligations |
Debt Obligations
Debt obligations consisted of the following:
(In millions) | 2015 | 2014 | |||||
Fixed rate Senior Notes due 2021 | $ | 599.3 | $ | 599.2 | |||
Five year Revolving Credit Agreement | 155.8 | 209.0 | |||||
Belgium facility capital lease | 10.6 | 13.9 | |||||
Other | 5.0 | 11.4 | |||||
Total debt obligations | 770.7 | 833.5 | |||||
Less current portion | (162.5 | ) | (221.4 | ) | |||
Long-term debt and capital lease obligations | $ | 608.2 | $ | 612.1 | |||
(Dollars in millions) | 2015 | 2014 | |||||
Total short-term borrowings at year-end | $ | 160.4 | $ | 219.1 | |||
Weighted average interest rate at year-end | 1.5 | % | 1.8 | % | |||
Average short-term borrowings during the year | $ | 394.9 | $ | 448.8 | |||
Weighted average interest rate for the year | 1.5 | % | 1.7 | % | |||
Maximum short-term borrowings during the year | $ | 444.8 | $ | 530.3 | |||
Senior Notes
On June 2, 2011, the Company completed the sale of $400 million in aggregate principal amount of 4.750% Senior Notes due June 1, 2021 under an indenture (the "Indenture"), entered into by the Company and its 100% subsidiary, Dart Industries Inc. (the “Guarantor”). These Senior Notes were sold at a discount.
60
On March 11, 2013, the Company issued and sold an additional $200 million in aggregate principal amount of these notes (both issuances together, the "Senior Notes") in a registered public offering. As a result of the 2013 issuance, the Company recorded a premium of $7.6 million to be amortized over the life of the Senior Notes. The Company also incurred $1.5 million in deferred financing costs, of which $1.3 million was netted with the premium on the Consolidated Statement of Cash Flows.
The Senior Notes were issued under an Indenture between the Company, the Guarantor and Wells Fargo Bank, N.A., as trustee. As security for its obligations under the guarantee of the Senior Notes, the Guarantor has granted a security interest in certain "Tupperware" trademarks and service marks. The guarantee and the lien securing the guarantee may be released under certain customary circumstances specified in the Indenture. These customary circumstances include:
• | payment in full of principal of and premium, if any, and interest on the Senior Notes; |
• | satisfaction and discharge of the Indenture; |
• | upon legal defeasance or covenant defeasance of the Senior Notes as set forth in the Indenture; |
• | as to any property or assets constituting Collateral owned by the Guarantor that is released from its Guarantee in accordance with the Indenture; |
• | with the consent of the Holders of the requisite percentage of Senior Notes in accordance with the Indenture; and |
• | if the rating on the Senior Notes is changed to investment grade in accordance with the Indenture. |
Prior to March 1, 2021, the Company may redeem the Senior Notes, at its option, at a redemption price equal to accrued and unpaid interest and the greater of i) 100 percent of the principal amount to be redeemed; and ii) the present value of the remaining scheduled payments of principal and interest. In determining the present value of the remaining scheduled payments, such payments shall be discounted to the redemption date using a discount rate equal to the Treasury Rate (as defined in the Indenture) plus 30 basis points. On or after March 1, 2021, the redemption price will equal 100 percent of the principal amount of the Senior Notes redeemed.
The Indenture includes covenants which, subject to certain exceptions, limit the ability of the Company and its subsidiaries to, among other things, (i) incur indebtedness secured by liens on real property, (ii) enter into sale and leaseback transactions, (iii) consolidate or merge with another entity, or sell or transfer all or substantially all of their properties and assets, and (iv) sell the capital stock of the Guarantor. In addition, upon a change of control, as defined in the Indenture, the Company may be required to make an offer to repurchase the Senior Notes at 101 percent of their principal amount, plus accrued and unpaid interest. The Indenture also contains customary events of default. These restrictions are not expected to impact the Company's operations. As of December 26, 2015, the Company was in compliance with all of its covenants.
61
Credit Agreement
On June 9, 2015, the Company and its wholly owned subsidiary Tupperware International Holdings B.V. (the “Subsidiary Borrower”), entered into Amendment No. 2 (the "Amendment”) to their multicurrency Amended and Restated Credit Agreement dated September 11, 2013, as amended by Amendment No. 1 dated June 2, 2014 (as so amended, the “Credit Agreement”). The terms and structure of the Credit Agreement remain largely the same. The Amendment (i) reduced the aggregate amount available to the Company and the Subsidiary Borrower under the Credit Agreement from $650 million to $600 million (the “Facility Amount”), (ii) extended the final maturity date of the Credit Agreement from September 11, 2018 to June 9, 2020, and (iii) amended the applicable margins for borrowings and the commitment fee to be generally more favorable for the Company. The Credit Agreement continues to provide (a) a revolving credit facility, available up to the full amount of the Facility Amount, (b) a letter of credit facility, available up to $50 million of the Facility Amount, and (c) a swingline facility, available up to $100 million of the Facility Amount. Each of such facilities is fully available to the Company and is available to the Subsidiary Borrower up to an aggregate amount not to exceed $325 million. The Company is permitted to increase, on up to three occasions, the Facility Amount by a total of up to $200 million (for a maximum aggregate Facility Amount of $800 million), subject to certain conditions including the agreement of the lenders. As of December 26, 2015, the Company had total borrowings of $155.8 million outstanding under its Credit Agreement, with $153.7 million of that amount denominated in euros. The Company routinely increases its revolver borrowings under the Credit Agreement and uncommitted lines during each quarter to fund operating, investing and financing activities and uses cash available at the end of each quarter to reduce borrowing levels. As a result, the Company incurs more interest expense and has higher foreign exchange exposure on the value of its cash during each quarter than would relate solely to the quarter end cash and debt balances.
Loans made under the Credit Agreement bear interest under a formula that includes, at the Company's option, one of three different base rates. The Company generally selects the London Interbank Offered Rate ("LIBOR") for the applicable currency and interest period as its base for its interest rate. As provided in the Credit Agreement, a margin is added to the base. The applicable margin is determined by a pricing schedule and is based upon the better for the Company of (a) the ratio (the "Consolidated Leverage Ratio") of the consolidated funded indebtedness of the Company and its subsidiaries to the consolidated EBITDA (as defined in the Credit Agreement) of the Company and its subsidiaries for the four fiscal quarters then most recently ended, or (b) the Company’s then existing long-term debt securities rating by Moody’s Investor Service, Inc. or Standard and Poor’s Financial Services, Inc. As of December 26, 2015, the Credit Agreement dictated a base rate spread of 150 basis points, which gave the Company a weighted average interest rate on LIBOR based borrowings of 1.50 percent on borrowings under the Credit Agreement.
The Credit Agreement contains customary covenants that, among other things, generally restrict the Company's ability to incur subsidiary indebtedness, create liens on and sell assets, engage in liquidation or dissolutions, engage in mergers or consolidations, or change lines of business. These covenants are subject to significant exceptions and qualifications. The agreement also has customary financial covenants related to interest coverage and leverage. These restrictions are not expected to impact the Company's operations. As of December 26, 2015, and currently, the Company had considerable cushion under its financial covenants.
The Guarantor unconditionally guarantees all obligations and liabilities of the Company and the Subsidiary Borrower relating to the Credit Agreement as well as the Senior Notes, supported by a security interest in certain "Tupperware" trademarks and service marks.
In February 2014, the Company entered into a $75.0 million uncommitted line of credit with Credit Agricole Corporate and Investment Bank ("Credit Agricole"). This line of credit dictates an interest rate of LIBOR plus 125 basis points. In July 2014, the Company entered into a $100.0 million uncommitted line of credit with HSBC Bank USA ("HSBC"). This line of credit dictates an interest rate of LIBOR plus 100 basis points. Both Credit Agricole and HSBC are participating banks in the Company's Credit Agreement. As of December 26, 2015, there were no amounts outstanding under these uncommitted lines of credit.
At December 26, 2015, the Company had $700.5 million of unused lines of credit, including $442.5 million under the committed, secured Credit Agreement, and $258.0 million available under various uncommitted lines around the world, including the uncommitted lines of credit with Credit Agricole and HSBC. Interest paid on total debt, including forward points on foreign currency contracts, in 2015, 2014 and 2013 was $47.8 million, $44.0 million and $38.9 million, respectively.
62
Contractual Maturities
Contractual maturities for debt obligations at December 26, 2015 are summarized by year as follows (in millions):
Year ending: | Amount | ||
December 31, 2016 | $ | 162.5 | |
December 30, 2017 | 2.1 | ||
December 29, 2018 | 1.8 | ||
December 28, 2019 | 1.5 | ||
December 26, 2020 | 1.2 | ||
Thereafter | 601.6 | ||
Total | $ | 770.7 | |
Capital Leases
In 2007, the Company completed construction of its Tupperware center of excellence manufacturing facility in Belgium. Costs related to the new facility and equipment totaled $24.0 million and were financed through a sale lease-back transaction under two separate leases. The two leases are being accounted for as capital leases and have initial terms of 10 years and 15 years and interest rates of 5.1 percent. In 2010, the Company extended a lease on an additional building in Belgium that was previously accounted for as an operating lease. As a result of renegotiating the terms of the agreement, the lease is now classified as capital and had an initial value of $3.8 million with an initial term of 10 years and an interest rate of 2.9 percent.
Following is a summary of significant capital lease obligations at December 26, 2015 and December 27, 2014:
(In millions) | December 26, 2015 | December 27, 2014 | |||||
Gross payments | $ | 12.2 | $ | 16.3 | |||
Less imputed interest | 1.6 | 2.4 | |||||
Total capital lease obligation | 10.6 | 13.9 | |||||
Less current maturity | 1.8 | 2.0 | |||||
Capital lease obligation - long-term portion | $ | 8.8 | $ | 11.9 | |||
Note 8: | Derivative Financial Instruments |
The Company is exposed to fluctuations in foreign currency exchange rates on the earnings, cash flows and financial position of its international operations. Although this currency risk is partially mitigated by the natural hedge arising from the Company's local manufacturing in many markets, a strengthening U.S. dollar generally has a negative impact on the Company. In response to this fact, the Company uses financial instruments to hedge certain of its exposures and to manage the foreign exchange impact to its financial statements. At its inception, a derivative financial instrument used for hedging is designated as a fair value, cash flow or net equity hedge as described in Note 1 to the Consolidated Financial Statements.
For derivative instruments that are designated and qualify as fair value hedges, the gain or loss on the derivative, as well as the offsetting gain or loss on the hedged item attributable to the hedged risk, are recognized in current earnings. In assessing hedge effectiveness, the Company excludes forward points, which are considered to be a component of interest expense. In 2015, 2014 and 2013, forward points on fair value hedges resulted in pretax gains of $14.1 million, $10.3 million and $11.1 million, respectively.
63
At initiation, the Company's cash flow hedge contracts are for periods ranging from one to fifteen months. The effective portion of the gain or loss on the hedging instrument is recorded in other comprehensive loss and is reclassified into earnings as the transactions being hedged are recorded. As such, the balance at the end of the reporting period in other comprehensive loss related to cash flow hedges will be reclassified into earnings within the next twelve months. The associated asset or liability on the open hedges is recorded in other current assets or accrued liabilities, as applicable. The balance in accumulated other comprehensive loss, net of tax, resulting from open foreign currency hedges designated as cash flow hedges was a deferred gain of $4.3 million, $7.8 million and $2.2 million as of December 26, 2015, December 27, 2014 and December 28, 2013, respectively. In 2015, 2014 and 2013, the Company recorded in other comprehensive loss, net of tax, net (losses)/gains associated with cash flow hedges of $(3.5) million, $5.6 million and $2.4 million, respectively, which represents the net change to accumulated other comprehensive income on the Company's balance sheet related to these type of hedges.
In 2015, 2014 and 2013, the Company recorded, net of tax, net gains associated with net equity hedges of $54.6 million, $25.5 million and $13.3 million, respectively, in other comprehensive loss. Due to the permanent nature of these investments, the Company does not anticipate reclassifying any portion of these amounts to the income statement in the next twelve months.
While the Company's foreign currency contracts designated as net equity and fair value hedges of non-permanent intercompany balances mitigate its exposure to foreign exchange gains or losses, other than the euro borrowings designated as a hedge, they result in an impact to operating cash flows as they are settled, whereas the hedged items do not generate offsetting cash flows. The net cash flow impact of these currency hedges was an outflow of $17.0 million and inflows of $4.6 million and $3.2 million for the years ended in 2015, 2014 and 2013, respectively.
The Company considers the total notional value of its forward contracts as the best measure of the volume of derivative transactions. As of December 26, 2015 and December 27, 2014, the notional amounts of outstanding forward contracts to purchase currencies were $141.9 million and $185.1 million, respectively, and the notional amounts of outstanding forward contracts to sell currencies were $137.4 million and $184.2 million, respectively. As of December 26, 2015, the notional values of the largest positions outstanding were to purchase U.S. dollars $107.4 million and to sell Mexican pesos $41.3 million.
The following tables summarize the Company's derivative positions, representing the Company's only fair value measurements performed on a recurring basis, and the impact they had on the Company's financial position as of December 26, 2015 and December 27, 2014. Fair values were determined based on third party quotations (Level 2 fair value measurement):
Asset derivatives | Liability derivatives | |||||||||||||||||||
Fair value | Fair value | |||||||||||||||||||
Derivatives designated as hedging instruments (in millions) | Balance sheet location | 2015 | 2014 | Balance sheet location | 2015 | 2014 | ||||||||||||||
Foreign exchange contracts | Non-trade amounts receivable | $ | 21.5 | $ | 35.0 | Accrued liabilities | $ | 14.6 | $ | 30.3 | ||||||||||
The following table summarizes the Company's derivative positions and the impact they had on the Company's results of operations for the years ended December 26, 2015, December 27, 2014 and December 28, 2013:
Derivatives designated as fair value hedges (in millions) | Location of gain or (loss) recognized in income on derivatives | Amount of gain or (loss) recognized in income on derivatives | Location of gain or (loss) recognized in income on related hedged items | Amount of gain or (loss) recognized in income on related hedged items | ||||||||||||||||||||
2015 | 2014 | 2013 | 2015 | 2014 | 2013 | |||||||||||||||||||
Foreign exchange contracts | Other expense | ($83.6 | ) | ($36.6 | ) | ($17.4 | ) | Other expense | $83.8 | $35.0 | $16.7 | |||||||||||||
64
The following table summarizes the impact of Company's hedging activities on comprehensive income for the years ended December 26, 2015, December 27, 2014 and December 28, 2013:
Derivatives designated as cash flow and net equity hedges (in millions) | Amount of gain or (loss) recognized in OCI on derivatives (effective portion) | Location of gain or (loss) reclassified from accumulated OCI into income (effective portion) | Amount of gain or (loss) reclassified from accumulated OCI into income (effective portion) | Location of gain or (loss) recognized in income on derivatives (ineffective portion and amount excluded from effectiveness testing) | Amount of gain or (loss) recognized in income on derivatives (ineffective portion and amounts excluded from effectiveness testing) | |||||||||||||||||||||||||||||
Cash flow hedging relationships | 2015 | 2014 | 2013 | 2015 | 2014 | 2013 | 2015 | 2014 | 2013 | |||||||||||||||||||||||||
Foreign exchange contracts | $ | 14.5 | $ | 15.9 | $ | 6.5 | Cost of products sold | $ | 19.2 | $ | 9.1 | $ | 3.2 | Interest expense | $ | (7.7 | ) | $ | (4.9 | ) | $ | (2.9 | ) | |||||||||||
Net equity hedging relationships | ||||||||||||||||||||||||||||||||||
Foreign exchange contracts | 74.2 | 38.8 | 20.8 | Other expense | — | — | — | Interest expense | (16.8 | ) | (13.3 | ) | (13.2 | ) | ||||||||||||||||||||
Euro denominated debt | 11.1 | 1.1 | — | Other expense | — | — | — | Interest expense | — | — | — | |||||||||||||||||||||||
The Company's theoretical credit risk for each derivative instrument is its replacement cost, but management believes that the risk of incurring credit losses is remote and such losses, if any, would not be material. The Company is also exposed to market risk on its derivative instruments due to potential changes in foreign exchange rates; however, such market risk would be fully offset by changes in the valuation of the underlying items being hedged. For all outstanding derivative instruments, the net accrued gain was $6.9 million, $4.7 million and $1.1 million at December 26, 2015, December 27, 2014 and December 28, 2013, respectively, and were recorded either in other assets or accrued liabilities, depending upon the net position of the individual contracts. While certain of its fair value hedges of non-permanent intercompany loans mitigate its exposure to foreign exchange gains or losses, they result in an impact to operating cash flows as the hedges are settled. However, the cash flow impact of certain of these exposures is in turn partially offset by certain hedges of net equity. The notional amounts shown above change based upon the Company's outstanding exposure to fair value fluctuations.
Note 9: | Fair Value Measurements |
Due to their short maturities or their insignificance, the carrying amounts of cash and cash equivalents, accounts and notes receivable, accounts payable, accrued liabilities and short-term borrowings approximated their fair values at December 26, 2015 and December 27, 2014. The Company estimates that, based on current market conditions, the value of its 4.75% 2021 Senior Notes debt was $619.2 million at December 26, 2015 compared with the carrying value of $599.3 million. The higher fair value resulted from changes, since issuance, in the corporate bond market and investor preferences. The fair value of debt is classified as a Level 2 liability and is estimated using quoted market prices as provided in secondary markets that consider the Company's specific credit risk and market related conditions.
65
Note 10: | Accumulated Other Comprehensive Loss |
(In millions, net of tax) | Foreign Currency Items | Cash Flow Hedges | Pension and Other Post-retirement Items | Total | |||||||||||
December 29, 2012 | $ | (218.2 | ) | $ | (0.2 | ) | $ | (52.9 | ) | $ | (271.3 | ) | |||
Other comprehensive income (loss) before reclassifications | (64.9 | ) | 4.4 | 10.4 | (50.1 | ) | |||||||||
Amounts reclassified from accumulated other comprehensive loss | — | (2.0 | ) | 6.6 | 4.6 | ||||||||||
Net other comprehensive income (loss) | (64.9 | ) | 2.4 | 17.0 | (45.5 | ) | |||||||||
December 28, 2013 | $ | (283.1 | ) | $ | 2.2 | $ | (35.9 | ) | $ | (316.8 | ) | ||||
Other comprehensive income (loss) before reclassifications | (85.2 | ) | 12.7 | (14.9 | ) | (87.4 | ) | ||||||||
Amounts reclassified from accumulated other comprehensive loss | — | (7.1 | ) | 2.6 | (4.5 | ) | |||||||||
Net other comprehensive income (loss) | (85.2 | ) | 5.6 | (12.3 | ) | (91.9 | ) | ||||||||
December 27, 2014 | $ | (368.3 | ) | $ | 7.8 | $ | (48.2 | ) | $ | (408.7 | ) | ||||
Other comprehensive income (loss) before reclassifications | (122.3 | ) | 11.3 | 8.9 | (102.1 | ) | |||||||||
Amounts reclassified from accumulated other comprehensive loss | — | (14.8 | ) | 3.6 | (11.2 | ) | |||||||||
Net other comprehensive income (loss) | (122.3 | ) | (3.5 | ) | 12.5 | (113.3 | ) | ||||||||
December 26, 2015 | $ | (490.6 | ) | $ | 4.3 | $ | (35.7 | ) | $ | (522.0 | ) | ||||
Pretax amounts reclassified from accumulated other comprehensive loss that relate to cash flow hedges consisted of net gains of $19.2 million, $9.1 million and $3.2 million in 2015, 2014 and 2013, respectively. Associated with these items were tax provisions of $4.4 million, $2.0 million and $1.2 million in 2015, 2014 and 2013, respectively. See Note 8 for further discussion of derivatives.
In 2015, 2014 and 2013, pretax amounts reclassified from accumulated other comprehensive loss related to pension and other post-retirement items consisted of prior service benefits of $1.3 million, $0.8 million and $0.7 million, respectively, and pension settlement costs of $1.6 million, $1.8 million and $4.0 million, respectively, and actuarial losses of $4.5 million, $2.6 million and $5.4 million, respectively. Associated with these items were tax benefits of $1.2 million, $1.0 million and $2.1 million, respectively. See Note 13 for further discussion of pension and other post-retirement benefit costs.
Note 11: | Statements of Cash Flows Supplemental Disclosure |
Under the Company's stock incentive programs, employees are allowed to use shares retained by the Company to satisfy U.S. minimum statutorily required withholding taxes. In 2015, 2014 and 2013, 22,344, 102,405 and 56,856 shares, respectively, were retained to fund withholding taxes, with values totaling $1.5 million, $8.0 million and $4.5 million, respectively, which were included as a component of stock repurchases in the Consolidated Statement of Cash Flows.
During the first quarter of 2014 and the fourth quarter of 2015, the Company entered into joint ventures with a real estate development partner. The Company contributed land to each joint venture in exchange for 50 percent ownership in each joint venture. The carrying value of the land contributed in 2015 and 2014 was $0.8 million and $3.1 million, respectively. The Company's ownership interest in the joint ventures is accounted for using the equity method and was included in long-term other assets on the December 26, 2015 balance sheet. The Company does not expect to have any significant cash inflows or outflows related to the joint ventures until such time as the joint ventures complete and sell their developments.
66
In 2013, the Company acquired $0.3 million of property, plant and equipment under capital lease arrangements. There were no such capital lease arrangements initiated in 2015 and 2014. During the third quarter of 2015, the Company acquired $2.5 million in internal use software, included in property, plant and equipment, under a non-cash financing arrangement under which the Company will make the final payment in less than twelve months from the balance sheet date.
Also in 2013, the Company acquired $1.4 million in property, plant and equipment under a non-cash financing arrangement under which the Company is paying three equal annual installments.
In relation to the issuance of the Senior Notes in the first quarter of 2013, the proceeds related to the $7.6 million debt premium were reduced by $1.3 million of non-cash debt issuance costs.
Note 12: | Income Taxes |
For income tax purposes, the domestic and foreign components of income (loss) before taxes were as follows:
(In millions) | 2015 | 2014 | 2013 | ||||||||
Domestic | $ | (67.5 | ) | $ | (35.5 | ) | $ | (18.9 | ) | ||
Foreign | 327.4 | 333.7 | 379.3 | ||||||||
Total | $ | 259.9 | $ | 298.2 | $ | 360.4 | |||||
The domestic and foreign components of income (loss) before taxes reflect adjustments as required under certain advanced pricing agreements and exclude repatriation of foreign earnings to the United States.
The provision (benefit) for income taxes was as follows:
(In millions) | 2015 | 2014 | 2013 | ||||||||
Current: | |||||||||||
Federal | $ | (22.8 | ) | $ | 11.5 | $ | 2.5 | ||||
Foreign | 92.6 | 114.8 | 106.3 | ||||||||
State | (0.8 | ) | 1.5 | 0.7 | |||||||
69.0 | 127.8 | 109.5 | |||||||||
Deferred: | |||||||||||
Federal | (13.8 | ) | (40.6 | ) | 4.6 | ||||||
Foreign | 18.2 | (1.9 | ) | (28.0 | ) | ||||||
State | 0.7 | (1.5 | ) | 0.1 | |||||||
5.1 | (44.0 | ) | (23.3 | ) | |||||||
Total | $ | 74.1 | $ | 83.8 | $ | 86.2 | |||||
67
The differences between the provision for income taxes and income taxes computed using the U.S. federal statutory rate were as follows:
(In millions) | 2015 | 2014 | 2013 | ||||||||
Amount computed using statutory rate | $ | 91.0 | $ | 104.4 | $ | 126.1 | |||||
Increase (reduction) in taxes resulting from: | |||||||||||
Net impact from repatriating foreign earnings and direct foreign tax credits | (7.9 | ) | (17.7 | ) | (14.7 | ) | |||||
Foreign income taxes | (4.6 | ) | (20.6 | ) | (26.1 | ) | |||||
Impact of non-deductible currency translation losses | 3.1 | 19.0 | 1.3 | ||||||||
Impact of changes in Mexican legislation and revaluation of tax assets | — | — | (6.8 | ) | |||||||
Other changes in valuation allowances for deferred tax assets | (0.4 | ) | (0.5 | ) | 4.6 | ||||||
Foreign and domestic tax audit settlement and adjustments | (2.4 | ) | — | (1.4 | ) | ||||||
Other | (4.7 | ) | (0.8 | ) | 3.2 | ||||||
Total | $ | 74.1 | $ | 83.8 | $ | 86.2 | |||||
The effective tax rates are below the U.S. statutory rate, primarily reflecting the availability of excess foreign tax credits, as well as lower foreign effective tax rates. During 2014, the tax rate was impacted by the devaluation of the Venezuelan bolivar for which there was no tax benefit.
During 2013, a change in Mexican tax law resulted in additional foreign tax costs that were offset by tax credit benefits resulting in a net benefit of $6.8 million. Additionally, the Company entered into a statutory restructuring transaction in a foreign jurisdiction during the fourth quarter of 2013, which resulted in a reduction in valuation allowance balances of $59.3 million, of which $19.0 million related to a write off in net operating losses for which a valuation allowance had already been recorded. The restructuring transaction also resulted in the incurrence of repatriation costs of $43.5 million.
Deferred tax assets (liabilities) were composed of the following:
(In millions) | 2015 | 2014 | |||||
Purchased intangibles | $ | (26.6 | ) | $ | (32.2 | ) | |
Other | (9.2 | ) | (9.9 | ) | |||
Gross deferred tax liabilities | (35.8 | ) | (42.1 | ) | |||
Credit and net operating loss carry forwards (net of unrecognized tax benefits) | 293.6 | 284.4 | |||||
Employee benefits accruals | 63.2 | 65.2 | |||||
Deferred costs | 80.7 | 107.5 | |||||
Fixed assets basis differences | 33.6 | 33.1 | |||||
Capitalized intangibles | 32.7 | 31.5 | |||||
Other accruals | 27.8 | 28.0 | |||||
Accounts receivable | 10.5 | 11.3 | |||||
Post-retirement benefits | 7.5 | 8.2 | |||||
Depreciation | 7.2 | 11.2 | |||||
Inventory | 10.0 | 12.9 | |||||
Gross deferred tax assets | 566.8 | 593.3 | |||||
Valuation allowances | (23.1 | ) | (40.2 | ) | |||
Net deferred tax assets | $ | 507.9 | $ | 511.0 | |||
68
At December 26, 2015, the Company had domestic federal and state net operating loss carry forwards of $75.8 million, separate state net operating loss carry forwards of $113.5 million, and foreign net operating loss carry forwards of $218.2 million, of which the Company had included in recognized net deferred tax assets $15.2 million, $0.5 million and $41.9 million, respectively. Of the total foreign and domestic net operating loss carry forwards, $353.5 million expire at various dates from 2016 to 2035, while the remainder have unlimited lives. This balance included net deferred tax assets of $12.1 million for federal net operating losses, which would expire in the years 2020 through 2035 if not utilized, $30.5 million of foreign net operating losses which would expire in 2026 if not utilized and no foreign net operating losses which would expire in 2016 if not utilized. During 2015, the Company realized net cash benefits of $24.2 million related to foreign net operating loss carry forwards. At December 26, 2015 and December 27, 2014, the Company had estimated gross foreign tax credit carry forwards of $218.6 million and $174.7 million, respectively, most of which would expire in 2018 through 2025 if not utilized. Deferred costs in 2015 include assets of $78.9 million related to advanced payment agreements entered into by the Company with its foreign subsidiaries, which are expected to reverse during the next three years.
At December 26, 2015 and December 27, 2014, the Company had valuation allowances against certain deferred tax assets totaling $23.1 million and $40.2 million, respectively. The reduction in valuation allowance balance related to $10.0 million of a write off in net operating losses for which a valuation allowance had already been recorded and $7.1 million related to currency translation. These valuation allowances relate to tax assets in jurisdictions where it is management's best estimate that there is not a greater than 50 percent probability that the benefit of the assets will be realized in the associated tax returns. This assessment is based upon expected future domestic results, future foreign dividends from then current year earnings and cash flows and other foreign source income, including rents and royalties, as well as anticipated gains related to future sales of land held for development near the Company's Orlando, Florida headquarters. In addition, certain tax planning transactions may be entered into to facilitate realization of these benefits. The likelihood of realizing the benefit of deferred tax assets is assessed on an ongoing basis. Consequently, future material changes in the valuation allowance are possible. The credit and net operating loss carry forwards increased by $9.2 million, primarily due to an increase in the balance of federal foreign tax credits. The decrease in deferred costs of $26.8 million is due to reversals of prior year advanced payments.
The Company paid income taxes in 2015, 2014 and 2013 of $106.4 million, $117.0 million and $102.7 million, respectively. The Company has a foreign subsidiary which receives a tax holiday that expires in 2020. The net benefit of this and other expired tax holidays was $2.6 million, $3.4 million and $2.6 million in 2015, 2014 and 2013, respectively.
As of December 26, 2015 and December 27, 2014, the Company's gross unrecognized tax benefit was $21.8 million and $22.5 million, respectively. The Company estimates that approximately $20.7 million of the unrecognized tax benefits, if recognized, would impact the effective tax rate. A reconciliation of the beginning and ending amount of unrecognized tax benefits is as follows:
(In millions) | 2015 | 2014 | 2013 | ||||||||
Balance, beginning of year | $ | 22.5 | $ | 27.4 | $ | 24.9 | |||||
Additions based on tax positions related to the current year | 3.3 | 3.9 | 6.0 | ||||||||
Additions for tax positions of prior year | 3.4 | 1.2 | 4.4 | ||||||||
Reduction for tax positions of prior years | (1.6 | ) | (3.1 | ) | (1.9 | ) | |||||
Settlements | (1.1 | ) | (1.9 | ) | (1.3 | ) | |||||
Reductions for lapse in statute of limitations | (3.2 | ) | (3.7 | ) | (4.4 | ) | |||||
Impact of foreign currency rate changes versus the U.S. dollar | (1.5 | ) | (1.3 | ) | (0.3 | ) | |||||
Balance, end of year | $ | 21.8 | $ | 22.5 | $ | 27.4 | |||||
Interest and penalties related to uncertain tax positions in the Company's global operations are recorded as a component of the provision for income taxes. Accrued interest and penalties were $6.0 million and $6.5 million as of December 26, 2015 and December 27, 2014, respectively. Interest and penalties included in the provision for income taxes totaled $0.9 million and $0.5 million for 2014 and 2013, respectively and no significant interest and penalties included in the provision for income taxes for 2015.
69
During the year ended December 26 2015, the accrual for uncertain tax positions decreased by $1.1 million primarily as a result of the Company agreeing to tax settlements in various foreign jurisdictions, as well as a $3.2 million decrease of accruals for uncertain tax positions due to the expiration of the statute of limitations in various jurisdictions. During the year, increases in uncertain positions being taken during the year in various foreign tax jurisdictions were partially offset by the impact of foreign exchange rate translation.
During the year ended December 27, 2014, the accrual for uncertain tax positions decreased by $1.9 million primarily as a result of the Company agreeing to a transfer pricing settlement in various foreign jurisdictions and entering into an Advanced Pricing Agreement, as well as a $3.7 million decrease of accruals for uncertain tax positions due to the expiration of the statute of limitations in various jurisdictions. During the year, increases in uncertain positions being taken in various foreign tax jurisdictions were partially offset by the impact of foreign exchange rate translation.
During the year ended December 28, 2013, the accrual for uncertain tax positions primarily increased due to uncertain positions being taken during the year in various foreign tax jurisdictions, partially offset by a $4.4 million decrease of accruals for uncertain tax positions due to the expiration of the statute of limitations in various jurisdictions. The accrual was further impacted by changes in foreign exchange rates.
The Company operates globally and files income tax returns in the United States federal, various state, and foreign jurisdictions. In the normal course of business, the Company is subject to examination by taxing authorities throughout the world. The Company is no longer subject to income tax examination in the following major jurisdictions: for U.S. tax for years before 2002, Australia (2010), Brazil (2005), China (2004), France (2010), Germany (2011), Greece (2009), India (2002), Indonesia (2008), Italy (2010), Malaysia (2008), Mexico (2005), and South Africa (2009), with limited exceptions.
The Company estimates that it may settle one or more foreign and domestic audits in the next twelve months that may result in a decrease in the amount of accrual for uncertain tax positions of up to $1.0 million. For the remaining balance as of December 26, 2015, the Company is not able to reliably estimate the timing or ultimate settlement amount. While the Company does not currently expect material changes, it is possible that the amount of unrecognized benefit with respect to the uncertain tax positions will significantly increase or decrease related to audits in various foreign jurisdictions that may conclude during that period or new developments that could also, in turn, impact the Company's assessment relative to the establishment of valuation allowances against certain existing deferred tax assets. At this time, the Company is not able to make a reasonable estimate of the range of impact on the balance of unrecognized tax benefits or the impact on the effective tax rate related to these items.
As of December 26, 2015, the Company had foreign undistributed earnings of $1.4 billion where it is the Company's intent that the earnings be reinvested indefinitely. Consequently, the Company has not provided for U.S. deferred income taxes on these undistributed earnings. The determination of the amount of unrecognized deferred U.S. income tax liability associated with these undistributed earnings is not practicable because of the complexities associated with the calculation.
The Company recognized $6.0 million, $6.3 million and $14.5 million of benefits for deductions associated with the exercise of employee stock options in 2015, 2014 and 2013, respectively. These benefits were added directly to paid-in capital, and were not reflected in the provision for income taxes.
Note 13: | Retirement Benefit Plans |
The Company has various defined benefit pension plans covering substantially all domestic employees employed as of June 30, 2005, except those employed by BeautiControl, and certain employees in other countries. In addition to providing pension benefits, the Company provides certain post-retirement healthcare and life insurance benefits for selected U.S. and Canadian employees. Employees may become eligible for these benefits if they reach normal retirement age while working for the Company or satisfy certain age and years of service requirements. The medical plans are contributory for most retirees with contributions adjusted annually, and contain other cost-sharing features, such as deductibles and coinsurance. The medical plans include an allowance for Medicare for post-65 age retirees. Most employees and retirees outside the United States are covered by government healthcare programs.
70
The Company uses its fiscal year end as the measurement date for its plans. The funded status of all of the Company's plans was as follows:
U.S. plans | Foreign plans | ||||||||||||||||||||||
Pension benefits | Post-retirement benefits | Pension benefits | |||||||||||||||||||||
(In millions) | 2015 | 2014 | 2015 | 2014 | 2015 | 2014 | |||||||||||||||||
Change in benefit obligations: | |||||||||||||||||||||||
Beginning balance | $ | 67.6 | $ | 55.9 | $ | 20.4 | $ | 28.9 | $ | 197.7 | $ | 190.4 | |||||||||||
Service cost | 0.3 | 0.3 | 0.1 | 0.1 | 10.3 | 10.7 | |||||||||||||||||
Interest cost | 2.3 | 2.1 | 0.7 | 1.1 | 4.5 | 6.4 | |||||||||||||||||
Actuarial loss (gain) | (8.6 | ) | 11.5 | (1.0 | ) | (7.8 | ) | (0.6 | ) | 25.1 | |||||||||||||
Benefits paid | (2.2 | ) | (2.2 | ) | (1.8 | ) | (1.8 | ) | (11.1 | ) | (12.1 | ) | |||||||||||
Impact of exchange rates | — | — | (0.1 | ) | (0.1 | ) | (16.8 | ) | (21.3 | ) | |||||||||||||
Plan participant contributions | — | — | — | — | 4.2 | 1.8 | |||||||||||||||||
Settlements/Curtailments | (0.2 | ) | — | — | — | (4.9 | ) | (3.3 | ) | ||||||||||||||
Ending balance | $ | 59.2 | $ | 67.6 | $ | 18.3 | $ | 20.4 | $ | 183.3 | $ | 197.7 | |||||||||||
Change in plan assets at fair value: | |||||||||||||||||||||||
Beginning balance | $ | 35.5 | $ | 32.3 | $ | — | $ | — | $ | 79.3 | $ | 82.6 | |||||||||||
Actual return on plan assets | 0.3 | 3.9 | — | — | 3.1 | 4.7 | |||||||||||||||||
Company contributions | 0.8 | 1.8 | 1.8 | 1.8 | 12.1 | 13.4 | |||||||||||||||||
Plan participant contributions | — | — | — | — | 4.2 | 1.8 | |||||||||||||||||
Benefits and expenses paid | (2.5 | ) | (2.5 | ) | (1.8 | ) | (1.8 | ) | (11.1 | ) | (12.0 | ) | |||||||||||
Impact of exchange rates | — | — | — | — | (4.6 | ) | (7.6 | ) | |||||||||||||||
Settlements | (0.2 | ) | — | — | — | (4.8 | ) | (3.6 | ) | ||||||||||||||
Ending balance | $ | 33.9 | $ | 35.5 | $ | — | $ | — | $ | 78.2 | $ | 79.3 | |||||||||||
Funded status of plans | $ | (25.3 | ) | $ | (32.1 | ) | $ | (18.3 | ) | $ | (20.4 | ) | $ | (105.1 | ) | $ | (118.4 | ) | |||||
Amounts recognized in the balance sheet consisted of:
(In millions) | December 26, 2015 | December 27, 2014 | |||||
Accrued benefit liability | $ | (148.7 | ) | $ | (170.9 | ) | |
Accumulated other comprehensive loss (pretax) | 47.6 | 66.2 | |||||
Items not yet recognized as a component of pension expense as of December 26, 2015 and December 27, 2014 consisted of:
2015 | 2014 | ||||||||||||||
(In millions) | Pension Benefits | Post-retirement Benefits | Pension Benefits | Post-retirement Benefits | |||||||||||
Transition obligation | $ | 2.1 | $ | — | $ | 1.3 | $ | — | |||||||
Prior service cost (benefit) | 1.2 | (8.7 | ) | 3.6 | (10.6 | ) | |||||||||
Net actuarial loss | 51.7 | 1.3 | 69.0 | 2.9 | |||||||||||
Accumulated other comprehensive loss(income) pretax | $ | 55.0 | $ | (7.4 | ) | $ | 73.9 | $ | (7.7 | ) | |||||
71
Components of other comprehensive loss (income) for the years ended December 26, 2015 and December 27, 2014 consisted of the following:
2015 | 2014 | ||||||||||||||
(In millions) | Pension Benefits | Post-retirement Benefits | Pension Benefits | Post-retirement Benefits | |||||||||||
Net prior service cost (benefit) | (0.1 | ) | 1.9 | (0.3 | ) | (7.0 | ) | ||||||||
Net actuarial loss (gain) | (13.2 | ) | (1.6 | ) | 30.2 | (0.2 | ) | ||||||||
Impact of exchange rates | (5.6 | ) | — | (5.8 | ) | — | |||||||||
Other comprehensive loss (income) | $ | (18.9 | ) | $ | 0.3 | $ | 24.1 | $ | (7.2 | ) | |||||
In 2016, the Company expects to recognize a prior service benefit of approximately $1.4 million and a net actuarial loss of $1.7 million as components of pension and post-retirement expense.
The accumulated benefit obligation for all defined benefit pension plans at December 26, 2015 and December 27, 2014 was $211.1 million and $218.5 million, respectively. At December 26, 2015 and December 27, 2014, the accumulated benefit obligations of certain pension plans exceeded those respective plans' assets. For those plans, the accumulated benefit obligations were $185.3 million and $191.8 million, and the fair value of their assets was $83.7 million and $74.3 million as of December 26, 2015 and December 27, 2014, respectively. At December 26, 2015 and December 27, 2014, the benefit obligations of the Company's significant pension plans exceeded those respective plans' assets. The accrued benefit cost for the pension plans is reported in accrued liabilities and other long-term liabilities.
The costs associated with all of the Company's plans were as follows:
Pension benefits | Post-retirement benefits | ||||||||||||||||||||||
(Dollars in millions) | 2015 | 2014 | 2013 | 2015 | 2014 | 2013 | |||||||||||||||||
Components of net periodic benefit cost: | |||||||||||||||||||||||
Service cost and expenses | $ | 10.8 | $ | 10.8 | $ | 11.5 | $ | 0.1 | $ | 0.1 | $ | 0.2 | |||||||||||
Interest cost | 6.9 | 8.6 | 8.4 | 0.7 | 1.1 | 1.1 | |||||||||||||||||
Return on plan assets | (5.3 | ) | (5.8 | ) | (5.7 | ) | — | — | — | ||||||||||||||
Settlement/Curtailment | 1.7 | 1.8 | 4.0 | — | — | — | |||||||||||||||||
Employee contributions | (0.2 | ) | (0.3 | ) | (0.3 | ) | — | — | — | ||||||||||||||
Net deferral | 4.5 | 2.7 | 5.0 | (1.3 | ) | (0.6 | ) | (0.4 | ) | ||||||||||||||
Net periodic benefit cost (income) | $ | 18.4 | $ | 17.8 | $ | 22.9 | $ | (0.5 | ) | $ | 0.6 | $ | 0.9 | ||||||||||
Weighted average assumptions: | |||||||||||||||||||||||
U.S. plans | |||||||||||||||||||||||
Discount rate, net periodic benefit cost | 3.6 | % | 3.9 | % | 3.3 | % | 3.8 | % | 4.5 | % | 3.5 | % | |||||||||||
Discount rate, benefit obligations | 3.9 | 3.5 | 4.0 | 4.0 | 3.8 | 4.5 | |||||||||||||||||
Return on plan assets | 8.3 | 8.3 | 8.3 | n/a | n/a | n/a | |||||||||||||||||
Salary growth rate, net periodic benefit cost | 3.0 | 3.0 | 3.0 | n/a | n/a | n/a | |||||||||||||||||
Salary growth rate, benefit obligations | — | 3.0 | 3.0 | n/a | n/a | n/a | |||||||||||||||||
Foreign plans | |||||||||||||||||||||||
Discount rate | 2.4 | % | 2.6 | % | 3.5 | % | n/a | n/a | n/a | ||||||||||||||
Return on plan assets | 3.4 | 3.8 | 4.4 | n/a | n/a | n/a | |||||||||||||||||
Salary growth rate | 3.1 | 3.2 | 3.3 | n/a | n/a | n/a | |||||||||||||||||
____________________
na Not applicable
72
The Company has established strategic asset allocation percentage targets for significant asset classes with the aim of achieving an appropriate balance between risk and return. The Company periodically revises asset allocations, where appropriate, in an effort to improve return and/or manage risk. The expected return on plan assets is determined based on the expected long-term rate of return on plan assets and the market-related value of plan assets. The market-related value of plan assets is based on long-term expectations given current investment objectives and historical results. The expected rate of return assumption used by the Company to determine the benefit obligation for its U.S. and foreign plans for 2015 was 8.3 percent and 3.4 percent, respectively, and 8.3 percent and 3.8 percent for 2014, respectively.
The Company determines the discount rate primarily by reference to rates on high-quality, long term corporate and government bonds that mature in a pattern similar to the expected payments to be made under the various plans. The weighted average discount rates used to determine the benefit obligation for its U.S. and foreign plans for 2015 was 3.9 percent and 2.4 percent, respectively, and 3.5 percent and 2.6 percent for 2014, respectively.
Effective January 1, 2015, Medicare eligible participants were moved from the self-insured employer plan to a private Medicare exchange, receiving a fixed subsidy from the Company. The Company no longer uses the assumed healthcare cost trends to value its post-retirement benefits obligation.
The Company sponsors a number of pension plans in the United States and in certain foreign countries. There are separate investment strategies in the United States and for each unit operating internationally that depend on the specific circumstances and objectives of the plans and/or to meet governmental requirements. The Company's overall strategic investment objectives are to preserve the desired funded status of its plans and to balance risk and return through a wide diversification of asset types, fund strategies and investment managers. The asset allocation depends on the specific strategic objectives for each plan and is rebalanced to obtain the target asset mix if the percentages fall outside of the range considered acceptable. The investment policies are reviewed from time to time to ensure consistency with long-term objectives. Options, derivatives, forward and futures contracts, short positions, or margined positions may be held in reasonable amounts as deemed prudent. For plans that are tax-exempt, any transactions that would jeopardize this status are not allowed. Lending of securities is permitted in some cases in which appropriate compensation can be realized. While the Company's plans do not invest directly in its own stock, it is possible that the various plans' investments in mutual, commingled or indexed funds or insurance contracts (GIC's) may hold ownership of Company securities. The investment objectives of each unit are more specifically outlined below.
The Company's weighted-average asset allocations at December 26, 2015 and December 27, 2014, by asset category, were as follows:
2015 | 2014 | ||||||||||
Asset category | U.S. plans | Foreign plans | U.S. plans | Foreign plans | |||||||
Equity securities | 63 | % | 27 | % | 64 | % | 29 | % | |||
Fixed income securities | 37 | 16 | 36 | 17 | |||||||
Cash and money market investments | — | 6 | — | 7 | |||||||
Guaranteed contracts | — | 50 | — | 46 | |||||||
Other | — | 1 | — | 1 | |||||||
Total | 100 | % | 100 | % | 100 | % | 100 | % | |||
73
The fair value of the Company's pension plan assets at December 26, 2015 by asset category was as follows:
Description of assets (in millions) | December 26, 2015 | Quoted Prices in Active Markets for Identical Assets (Level 1) | Significant Other Observable Inputs (Level 2) | Significant Unobservable Inputs (Level 3) | ||||||||||||
Domestic plans: | ||||||||||||||||
Common/collective trust (a) | $ | 33.9 | $ | — | $ | 33.9 | $ | — | ||||||||
Foreign plans: | ||||||||||||||||
Australia | Investment fund (b) | 2.3 | — | 2.3 | — | |||||||||||
Switzerland | Guaranteed insurance contract (c) | 30.9 | — | — | 30.9 | |||||||||||
Germany | Guaranteed insurance contract (c) | 5.0 | — | — | 5.0 | |||||||||||
Belgium | Mutual fund (d) | 21.8 | 21.8 | — | — | |||||||||||
Austria | Guaranteed insurance contract (c) | 0.4 | — | — | 0.4 | |||||||||||
Korea | Guaranteed insurance contract (c) | 2.4 | — | — | 2.4 | |||||||||||
Japan | Common/collective trust (e) | 11.1 | — | 11.1 | — | |||||||||||
Philippines | Fixed income securities (f) | 1.4 | 1.4 | — | — | |||||||||||
Equity fund (f) | 2.9 | 2.9 | — | — | ||||||||||||
Total | $ | 112.1 | $ | 26.1 | $ | 47.3 | $ | 38.7 | ||||||||
The fair value of the Company's pension plan assets at December 27, 2014 by asset category was as follows:
Description of assets (in millions) | December 27, 2014 | Quoted Prices in Active Markets for Identical Assets (Level 1) | Significant Other Observable Inputs (Level 2) | Significant Unobservable Inputs (Level 3) | ||||||||||||
Domestic plans: | ||||||||||||||||
Common/collective trust (a) | $ | 35.5 | $ | — | $ | 35.5 | $ | — | ||||||||
Foreign plans: | ||||||||||||||||
Australia | Investment fund (b) | 2.9 | — | 2.9 | — | |||||||||||
Switzerland | Guaranteed insurance contract (c) | 27.6 | — | — | 27.6 | |||||||||||
Germany | Guaranteed insurance contract (c) | 5.5 | — | — | 5.5 | |||||||||||
Belgium | Mutual funds (d) | 22.8 | 22.8 | — | — | |||||||||||
Austria | Guaranteed insurance contract (c) | 0.5 | — | — | 0.5 | |||||||||||
Korea | Guaranteed insurance contract (c) | 3.1 | — | — | 3.1 | |||||||||||
Japan | Common/collective trust (e) | 11.9 | — | 11.9 | — | |||||||||||
Philippines | Fixed income securities (f) | 1.6 | 1.6 | — | — | |||||||||||
Equity fund (f) | 3.4 | 3.4 | — | — | ||||||||||||
Total | $ | 114.8 | $ | 27.8 | $ | 50.3 | $ | 36.7 | ||||||||
____________________
(a) | The investment strategy of the U.S. pension plan for each period presented was to achieve a return greater than or equal to the return that would have been earned by a portfolio invested approximately 60 percent in equity securities and 40 percent in fixed income securities. As of the years ended December 26, 2015 and December 27, 2014, the common trusts held 63 percent and 64 percent of its assets in equity securities and 37 percent and 36 percent in fixed income securities, respectively. The percentage of funds invested in equity securities at the end of 2015 and 2014, included: 33 percent in large U.S. stocks, 10 percent in international stocks in each year, and 20 percent and 21 percent in small U.S. stocks, respectively. The common trusts are comprised of shares or units in commingled funds that are not publicly traded. The underlying assets in these funds (equity securities and fixed income securities) are valued using quoted market prices. |
74
(b) | For each period presented, the strategy of this fund is to achieve a long-term net return of at least 4 percent above inflation based on the Australian consumer price index over a rolling five-year period. The investment strategy is to invest mainly in equities and property, which are expected to earn relatively higher returns over the long term. The fair value of the fund is determined using the net asset value per share using quoted market prices or other observable inputs in active markets. As of December 26, 2015 and December 27, 2014, the percentage of funds held in investments included: Australian equities of 29 percent and 30 percent, cash of 7 percent and 6 percent, other equities of listed companies outside of Australia of 42 percent and 43 percent, real estate of 10 percent and 9 percent, respectively, and government and corporate bonds of 12 percent in each year. |
(c) | The strategy of the Company's plans in Austria, Germany, Korea and Switzerland is to seek to ensure the future benefit payments of their participants and manage market risk. This is achieved by funding the pension obligations through guaranteed insurance contracts. The plan assets operate similar to investment contracts whereby the interest rate, as well as the surrender value, is guaranteed. The fair value is determined as the contract value, using a guaranteed rate of return which will increase if the market performance exceeds that return. |
(d) | The strategy of the Belgian plan in each period presented is to seek to achieve a return greater than or equal to the return that would have been earned by a portfolio invested approximately 62 percent in equity securities and 38 percent in fixed income securities. The fair value of the fund is calculated using the net asset value per share as determined by the quoted market prices of the underlying investments. As of December 26, 2015 and December 27, 2014, the percentage of funds held in various asset classes included: large-cap equities of European companies of 24 percent and 26 percent, small-cap equities of European companies of 19 percent and 17 percent, bonds, primarily from European and U.S. governments, of 31 percent and 30 percent, and money market fund of 18 percent and 19 percent, respectively, and equities outside of Europe, mainly in the U.S. and emerging markets, 8 percent in each year. |
(e) | The Company's strategy for each period presented is to invest approximately 57 percent of assets to benefit from the higher expected returns from long-term investments in equities and to invest 43 percent of assets in short-term low investment risk instruments to fund near term benefits payments. The target allocation for plan assets to implement this strategy is 50 percent equities in Japanese listed securities, 7 percent in equities outside of Japan, 3 percent in cash and other short-term investments and 40 percent in domestic Japanese bonds. This strategy has been achieved through a collective trust that held 100 percent of total funded assets as of December 26, 2015 and December 27, 2014. As of the end of 2015 and 2014, the allocation of funds within the common collective trust included: 50 percent and 51 percent in Japanese equities, 3 percent and 4 percent in cash and other short term investments, 40 percent and 38 percent in Japanese bonds, respectively, and 7 percent in equities of companies based outside of Japan in each year. The fair value of the collective trust is determined by the market value of the underlying shares, which are traded in active markets. |
(f) | In both years, the investment strategy in the Philippines was to achieve an appropriate balance between risk and return, from a diversified portfolio of Philippine peso denominated bonds and equities. The target asset class allocations is 57 percent in equity securities, 38 percent fixed income securities and 5 percent in cash and deposits. The fixed income securities at year end included assets valued using a weighted average of completed deals on similarly termed government securities, as well as balances invested in short term deposit accounts. The equity index fund was valued at the closing price of the active market in which it was traded. |
The following table presents a reconciliation of the beginning and ending balances of the fair value measurements using significant unobservable inputs (Level 3):
Year Ending | |||||||
(In millions) | December 26, 2015 | December 27, 2014 | |||||
Beginning balance | $ | 36.7 | $ | 36.4 | |||
Realized gains | 0.7 | 0.7 | |||||
Purchases, sales and settlements, net | 2.5 | 2.6 | |||||
Impact of exchange rates | (1.2 | ) | (3.0 | ) | |||
Ending balance | $ | 38.7 | $ | 36.7 | |||
75
The Company expects to contribute $11.3 million to its U.S. and foreign pension plans and $1.9 million to its other U.S. post-retirement benefit plan in 2016.
The Company also has several savings, thrift and profit-sharing plans. Its contributions to these plans are in part based upon various levels of employee participation. The total cost of these plans was $7.4 million, $8.7 million and $10.5 million for 2015, 2014 and 2013, respectively.
The following benefit payments, which reflect expected future service, as appropriate, are expected to be paid from the Company's U.S. and foreign plans (in millions):
Years | Pension benefits | Post-retirement benefits | Total | |||||||||
2016 | $18.9 | $1.9 | $20.8 | |||||||||
2017 | 12.5 | 1.8 | 14.3 | |||||||||
2018 | 25.0 | 1.7 | 26.7 | |||||||||
2019 | 15.3 | 1.6 | 16.9 | |||||||||
2020 | 12.8 | 1.5 | 14.3 | |||||||||
2021-2025 | 68.0 | 6.2 | 74.2 | |||||||||
Note 14: | Incentive Compensation Plans |
On May 12, 2010, the shareholders of the Company approved the adoption of the Tupperware Brands Corporation 2010 Incentive Plan (the “2010 Incentive Plan”). The 2010 Incentive Plan provides for the issuance of cash and stock-based incentive awards to employees, directors and certain non-employee participants. Stock-based awards may be in the form of stock options, restricted stock, restricted stock units, performance vesting and market vesting awards. Under the plan, awards that are canceled or expire are added back to the pool of available shares. When the 2010 Incentive Plan was approved, the number of shares of the Company's common stock available for stock-based awards under the plan totaled 4,750,000, plus remaining shares available for issuance under the Tupperware Brands Corporation 2006 Incentive Plan and the Tupperware Brands Corporation Director Stock Plan. Shares may no longer be granted under these plans. The total number of shares available for grant under the 2010 Incentive Plan as of December 26, 2015 was 1,753,445.
Under the 2010 Incentive Plan, non-employee directors receive one-half of their annual retainers in the form of stock and may elect to receive the balance of their annual retainers in the form of stock or cash. In addition, each non-employee director is eligible to receive a stock award in such form, at such time and in such amount as may be determined by the Nominating and Governance Committee of the Board of Directors.
Stock Options
Stock options to purchase the Company's common stock are granted to employees and directors, upon approval by the Company's Board of Directors, with an exercise price equal to the fair market value of the stock on the date of grant. Options generally become exercisable in three years, in equal installments beginning one year from the date of grant, and generally expire 10 years from the date of grant. The fair value of the Company's stock options is estimated on the date of grant using the Black-Scholes option-pricing model with the following weighted average assumptions used in the last three years:
2015 | 2014 | 2013 | ||||||
Dividend yield | 4.3 | % | 3.3 | % | 2.9 | % | ||
Expected volatility | 36 | % | 40 | % | 41 | % | ||
Risk-free interest rate | 2.1 | % | 2.1 | % | 2.0 | % | ||
Expected life | 7 years | 7 years | 7 years | |||||
76
Stock option activity for 2015, under all of the Company's incentive plans, is summarized in the following table:
Shares subject to option | Weighted average exercise price per share | Aggregate Intrinsic Value (in millions) | ||||||||
Outstanding at December 27, 2014 | 2,192,136 | $48.95 | ||||||||
Granted | 533,433 | 55.64 | ||||||||
Expired/Forfeited | (17,155 | ) | 68.38 | |||||||
Exercised | (607,936 | ) | 26.72 | |||||||
Outstanding at December 26, 2015 | 2,100,478 | $56.92 | $8.1 | |||||||
Exercisable at December 26, 2015 | 1,260,167 | $54.62 | $8.0 | |||||||
The intrinsic value of options exercised during 2015, 2014 and 2013 totaled $20.8 million, $20.4 million and $38.5 million, respectively. The average remaining contractual life on outstanding and exercisable options was 7.1 and 5.7, respectively, at the end of 2015. The weighted average estimated grant date fair value of 2015, 2014 and 2013 option grants was $13.13, $19.17 and $27.61 per share, respectively.
Performance Awards, Restricted Stock and Restricted Stock Units
The Company also grants restricted stock, restricted stock units, performance-vested awards and market-vested awards to employees and directors, which typically have initial vesting periods ranging from one to three years. Compensation expense associated with time-vested grants of restricted stock and restricted stock units is equal to the market value of the Company's common stock on the grant date, and is recorded straight-line over the required service period. For performance-vested awards, expense is determined by the market value of the Company's common stock on the grant date and the number of shares ultimately earned as described below and is recorded over the required service period, subject to a probability assessment of achieving the performance criteria. The grant date fair value per share of market-vested awards already reflect the probability of achieving the market condition, and is therefore used to record expense straight line over the performance period regardless of actual achievement.
The incentive program for the performance and market-vested awards are based upon a target number of share units, although the actual number of performance and market-vested shares ultimately earned can vary from zero to 150 percent of target depending on the Company's achievement under the performance criteria of the grants. The payouts, if earned, will be settled in Tupperware common stock after the end of the three year performance period.
The Company's performance-vested awards, granted under its performance share plan, provide incentive opportunity based on the overall success of the Company over a three year performance period, as reflected through a measure of diluted earnings per share in the 2013 through 2015 grants, as well as cash flow in the 2013 grant.
In 2014, the Company began granting market-vested awards under the Company's performance share plan. These awards provide incentive opportunity based on the relative total shareholder return ("rTSR") of the Company's common stock against a group of companies composed of the S&P 400 Mid-cap Consumer Discretionary index and the Company's Compensation Peer Group (collectively, the "Comparative Group") over a three year performance period. The fair value per share of rTSR grants in 2015 and 2014 was $64.21 and $70.85, respectively. The fair value was determined using a Monte-Carlo simulation, which estimated the fair value based on the Company's share price activity between the beginning of the year and the grant date relative to the Comparative Group, expected term of the award, risk-free interest rate, expected dividends, and the expected volatility of the stock of the Company and that of the Comparative Group.
In 2015, as a result of the Company's performance, the estimated number of shares expected to vest decreased by 1,802 shares for the three performance share plans running during 2015.
77
Restricted stock, restricted stock units, performance-vested and market-vested share award activity for 2015 under all of the Company's incentive plans is summarized in the following table:
Non-vested Shares outstanding | Weighted average grant date fair value | |||||
Outstanding at December 27, 2014 | 651,849 | $59.76 | ||||
Time-vested shares granted | 148,526 | 57.00 | ||||
Market-vested shares granted | 23,637 | 64.21 | ||||
Performance shares granted | 62,722 | 72.61 | ||||
Performance share adjustments | (1,802 | ) | 78.33 | |||
Vested | (324,307 | ) | 43.84 | |||
Forfeited | (10,158 | ) | 74.42 | |||
Outstanding at December 26, 2015 | 550,467 | $69.71 | ||||
The vesting date fair value of restricted stock, restricted stock units and performance-vested awards that vested in 2015, 2014 and 2013 was $20.9 million, $26.8 million and $14.8 million, respectively. The weighted-average grant-date fair value per share of these types of awards in 2015, 2014 and 2013 was $61.89, $72.86 and $82.62, respectively.
For awards which are paid in cash, compensation expense is remeasured each reporting period based on the market value of the shares outstanding and is included as a liability on the Consolidated Balance Sheets. Shares outstanding under cash settled awards totaled 27,582, 23,986 and 19,099 shares as of the end of 2015, 2014 and 2013, respectively. These outstanding cash settled awards had a fair value of $1.5 million at the end of 2015 and 2014 and $1.8 million as of the end of 2013.
Compensation expense associated with all stock-based compensation was $20.0 million, $18.9 million and $19.5 million in 2015, 2014 and 2013, respectively. The estimated tax benefit associated with this compensation expense was $7.2 million, $6.8 million and $7.0 million in 2015, 2014 and 2013, respectively. As of December 26, 2015, total unrecognized stock based compensation expense related to all stock based awards was $25.1 million, which is expected to be recognized over a weighted average period of 25 months.
Expense related to earned cash performance awards of $21.5 million, $13.2 million and $19.4 million was included in the Consolidated Statements of Income for 2015, 2014 and 2013, respectively.
The Company's Board of Directors has authorized up to $2 billion of open market share repurchases under a program that began in 2007 and expires on February 1, 2017. During 2014 and 2013, under this program, the Company repurchased 1.2 million and 4.6 million shares at an aggregate cost of $84.3 million and $374.9 million, respectively. There were no share repurchases under this program in 2015. Since inception of the program, the Company has repurchased 21.3 million shares at an aggregate cost of $1.29 billion.
Note 15: | Segment Information |
The Company manufactures and distributes a broad portfolio of products, primarily through independent direct sales consultants. Certain operating segments have been aggregated based upon consistency of economic substance, geography, products, production process, class of customers and distribution method.
The Company's reportable segments include the following:
Europe | Primarily design-centric preparation, storage and serving solutions for the kitchen and home through the Tupperware® brand. Europe also includes Avroy Shlain®, which sells beauty and personal care products. Asia Pacific also sells beauty and personal care products in some of its units under the NaturCare®, Nutrimetics® and Fuller® brands. |
Asia Pacific | |
Tupperware North America | |
Beauty North America | Premium cosmetics, skin care and personal care products marketed under the BeautiControl® brand in the United States, Canada and Puerto Rico and the Armand Dupree® and Fuller Cosmetics® brands in Mexico and Central America. |
South America | Both housewares and beauty products under the Armand Dupree, Fuller®, Nuvo® and Tupperware® brands. |
78
Worldwide sales of beauty and personal care products totaled $428.8 million, $510.8 million and $557.0 million in 2015, 2014 and 2013, respectively.
(In millions) | 2015 | 2014 | 2013 | ||||||||
Net sales: | |||||||||||
Europe | $ | 604.9 | $ | 730.3 | $ | 771.5 | |||||
Asia Pacific | 779.0 | 849.9 | 848.1 | ||||||||
Tupperware North America | 353.7 | 349.9 | 358.0 | ||||||||
Beauty North America | 240.0 | 290.9 | 320.1 | ||||||||
South America | 306.2 | 385.1 | 373.9 | ||||||||
Total net sales | $ | 2,283.8 | $ | 2,606.1 | $ | 2,671.6 | |||||
Segment profit: | |||||||||||
Europe | $ | 93.3 | $ | 118.2 | $ | 130.6 | |||||
Asia Pacific | 175.0 | 191.0 | 187.5 | ||||||||
Tupperware North America | 67.4 | 68.3 | 65.9 | ||||||||
Beauty North America | 2.3 | 1.3 | 16.1 | ||||||||
South America | 46.5 | 27.1 | 68.9 | ||||||||
Total segment profit | $ | 384.5 | $ | 405.9 | $ | 469.0 | |||||
Unallocated expenses | (72.8 | ) | (55.9 | ) | (62.4 | ) | |||||
Re-engineering and impairment charges (a) | (20.3 | ) | (11.0 | ) | (9.3 | ) | |||||
Gains on disposal of assets (b) | 13.7 | 2.7 | 0.7 | ||||||||
Interest expense, net | (45.2 | ) | (43.5 | ) | (37.6 | ) | |||||
Income before taxes | $ | 259.9 | $ | 298.2 | $ | 360.4 | |||||
79
(In millions) | 2015 | 2014 | 2013 | ||||||||
Depreciation and amortization: | |||||||||||
Europe | $ | 17.1 | $ | 20.3 | $ | 20.7 | |||||
Asia Pacific | 15.1 | 13.0 | 10.6 | ||||||||
Tupperware North America | 10.5 | 9.6 | 8.4 | ||||||||
Beauty North America | 10.8 | 11.8 | 7.5 | ||||||||
South America | 4.1 | 4.2 | 2.8 | ||||||||
Corporate | 4.8 | 4.8 | 4.8 | ||||||||
Total depreciation and amortization | $ | 62.4 | $ | 63.7 | $ | 54.8 | |||||
Capital expenditures: | |||||||||||
Europe | $ | 18.2 | $ | 18.9 | $ | 19.5 | |||||
Asia Pacific | 12.3 | 19.3 | 18.8 | ||||||||
Tupperware North America | 9.2 | 11.8 | 10.7 | ||||||||
Beauty North America | 3.4 | 3.1 | 3.7 | ||||||||
South America | 8.9 | 12.6 | 12.9 | ||||||||
Corporate | 9.1 | 3.7 | 3.4 | ||||||||
Total capital expenditures | $ | 61.1 | $ | 69.4 | $ | 69.0 | |||||
Identifiable assets: | |||||||||||
Europe | $ | 271.6 | $ | 337.3 | $ | 360.8 | |||||
Asia Pacific | 295.1 | 321.4 | 315.2 | ||||||||
Tupperware North America | 121.2 | 137.1 | 148.4 | ||||||||
Beauty North America | 254.0 | 317.0 | 356.7 | ||||||||
South America | 96.9 | 131.1 | 127.6 | ||||||||
Corporate | 559.4 | 525.9 | 535.2 | ||||||||
Total identifiable assets | $ | 1,598.2 | $ | 1,769.8 | $ | 1,843.9 | |||||
____________________
(a) | See Note 2 to the unaudited Consolidated Financial Statements for a discussion of re-engineering and impairment charges. |
(b) | Gains on disposal of assets in 2015 and 2014 include $12.9 million and $1.3 million from land transactions near the Orlando, FL headquarters. In 2014, this caption also included $1.1 million from the sale of a facility in Australia. Gains on disposal of assets in 2013 primarily related to the collection of proceeds on Orlando land sold in 2006. |
Sales and segment profit in the preceding table are from transactions with customers, with inter-segment profit eliminated. Sales generated by product line, except beauty and personal care, as opposed to Tupperware®, are not captured in the financial statements, and disclosure of the information is impractical. Sales to a single customer did not exceed 10 percent of total sales in any segment. Sales of Tupperware® and beauty products to customers in Mexico were $338.9 million, $387.7 million and $407.6 million in 2015, 2014 and 2013, respectively. There was no other foreign country in which sales were individually material to the Company's total sales. Sales of Tupperware® and beauty products to customers in the United States were $209.4 million, $210.4 million and $229.3 million in 2015, 2014 and 2013, respectively. Unallocated expenses are corporate expenses and other items not directly related to the operations of any particular segment.
Corporate assets consist of cash and buildings and assets maintained for general corporate purposes. As of the end of 2015, 2014 and 2013, respectively, long-lived assets in the United States were $86.6 million, $88.7 million and $90.4 million.
As of December 26, 2015 and December 27, 2014, the Company's net investment in international operations was $429.0 million and $503.4 million, respectively. The Company is subject to the usual economic, business and political risks associated with international operations; however, these risks are partially mitigated by the broad geographic dispersion of the Company's operations.
80
Note 16: | Commitments and Contingencies |
The Company and certain subsidiaries are involved in litigation and various legal matters that are being defended and handled in the ordinary course of business. Included among these matters are environmental issues. The Company does not include estimated future legal costs in accruals recorded related to these matters. The Company believes that it is remote that the Company's contingencies will have a material adverse effect on its financial position, results of operations or cash flow.
Kraft Foods, Inc., which was formerly affiliated with Premark International, Inc., the Company's former parent, has assumed any liabilities arising out of certain divested or discontinued businesses. The liabilities assumed include matters alleging product liability, environmental liability and infringement of patents. As part of the acquisition of the direct-to-consumer businesses of Sara Lee Corporation (which has since changed its name to Hillshire Brands Co.) in December 2005, that company indemnified the Company for any liabilities arising out of any existing litigation at that time and for certain legal matters arising out of circumstances that might relate to periods before or after the date of the acquisition.
Leases. Rental expense for operating leases totaled $34.0 million in 2015, $38.0 million in 2014 and $31.7 million in 2013. Approximate minimum rental commitments under non-cancelable operating leases in effect at December 26, 2015 were: 2016-$35.7 million; 2017-$22.5 million; 2018-$14.2 million; 2019-$9.3 million; 2020-$5.6 million; and after 2020-$9.4 million. Leases included in the minimum rental commitments for 2016 and 2017 primarily relate to lease agreements for automobiles which generally have a lease term of two to three years with the remaining leases related to office, manufacturing and distribution space. It is common for lease agreements to contain various provisions for items such as step rent or other escalation clauses and lease concessions, which may offer a period of no rent payment. These types of items are considered by the Company, and are recorded into expense on a straight line basis over the minimum lease terms. There are no material lease agreements containing renewal options. Certain leases require the Company to pay property taxes, insurance and routine maintenance.
Note 17: | Allowance for Long-Term Receivables |
As of December 26, 2015, $11.4 million of long-term receivables from both active and inactive customers were considered past due, the majority of which were reserved through the Company's allowance for uncollectible accounts.
The balance of the allowance for long-term receivables as of December 26, 2015 was as follows:
(In millions) | |||
December 27, 2014 | $ | 13.1 | |
Write-offs | (1.6 | ) | |
Provision (a) | 1.9 | ||
Currency translation adjustment | (2.2 | ) | |
December 26, 2015 | $ | 11.2 | |
____________________
(a) Provision includes $0.2 million of reclassifications from current receivables.
81
Note 18: | Guarantor Information |
The Company's payment obligations under the Senior Notes are fully and unconditionally guaranteed, on a senior secured basis, by the Guarantor. The guarantee is secured by certain "Tupperware" trademarks and service marks owned by the Guarantor, as discussed in Note 7 to the Consolidated Financial Statements.
Condensed consolidated financial information as of December 26, 2015 and December 27, 2014 and for the years ended December 26, 2015, December 27, 2014 and December 28, 2013 for Tupperware Brands Corporation (the "Parent"), Dart Industries Inc. (the "Guarantor") and all other subsidiaries (the "Non-Guarantors") is as follows. Each entity in the consolidating financial information follows the same accounting policies as described in the consolidated financial statements, except for the use by the Parent and Guarantor of the equity method of accounting to reflect ownership interests in subsidiaries that are eliminated upon consolidation. The Guarantor is 100% owned by the Parent, and there are certain entities within the Non-Guarantors classification which the Parent owns directly. There are no significant restrictions on the ability of either the Parent or the Guarantor from obtaining adequate funds from their respective subsidiaries by dividend or loan that should interfere with their ability to meet their operating needs or debt repayment obligations.
Consolidating Statement of Income
Year ended December 26, 2015 | |||||||||||||||||||
(In millions) | Parent | Guarantor | Non-Guarantors | Eliminations | Total | ||||||||||||||
Net sales | $ | — | $ | — | $ | 2,288.6 | $ | (4.8 | ) | $ | 2,283.8 | ||||||||
Other revenue | — | 123.9 | 31.6 | (155.5 | ) | — | |||||||||||||
Cost of products sold | — | 31.6 | 864.0 | (151.2 | ) | 744.4 | |||||||||||||
Gross margin | — | 92.3 | 1,456.2 | (9.1 | ) | 1,539.4 | |||||||||||||
Delivery, sales and administrative expense | 20.6 | 78.6 | 1,127.5 | (9.1 | ) | 1,217.6 | |||||||||||||
Re-engineering and impairment charges | — | — | 20.3 | — | 20.3 | ||||||||||||||
Gains on disposal of assets including insurance recoveries, net | — | — | 13.7 | — | 13.7 | ||||||||||||||
Operating income (loss) | (20.6 | ) | 13.7 | 322.1 | — | 315.2 | |||||||||||||
Interest income | 19.6 | 22.5 | 7.4 | (47.1 | ) | 2.4 | |||||||||||||
Interest expense | 36.4 | 37.7 | 20.6 | (47.1 | ) | 47.6 | |||||||||||||
Income from equity investments in subsidiaries | 208.1 | 203.6 | — | (411.7 | ) | — | |||||||||||||
Other expense | — | 0.6 | 9.5 | — | 10.1 | ||||||||||||||
Income before income taxes | 170.7 | 201.5 | 299.4 | (411.7 | ) | 259.9 | |||||||||||||
Provision (benefit) for income taxes | (15.1 | ) | (4.0 | ) | 93.2 | — | 74.1 | ||||||||||||
Net income | $ | 185.8 | $ | 205.5 | $ | 206.2 | $ | (411.7 | ) | $ | 185.8 | ||||||||
Comprehensive income | $ | 72.5 | $ | 84.0 | $ | 104.0 | $ | (188.0 | ) | $ | 72.5 | ||||||||
82
Consolidating Statement of Income
Year ended December 27, 2014 | |||||||||||||||||||
(In millions) | Parent | Guarantor | Non-Guarantors | Eliminations | Total | ||||||||||||||
Net sales | $ | — | $ | — | $ | 2,613.9 | $ | (7.8 | ) | $ | 2,606.1 | ||||||||
Other revenue | — | 138.5 | 25.9 | (164.4 | ) | — | |||||||||||||
Cost of products sold | — | 25.9 | 1,020.8 | (162.7 | ) | 884.0 | |||||||||||||
Gross margin | — | 112.6 | 1,619.0 | (9.5 | ) | 1,722.1 | |||||||||||||
Delivery, sales and administrative expense | 19.5 | 67.1 | 1,269.0 | (9.5 | ) | 1,346.1 | |||||||||||||
Re-engineering and impairment charges | — | 0.1 | 10.9 | — | 11.0 | ||||||||||||||
Gains on disposal of assets including insurance recoveries, net | — | — | 2.7 | — | 2.7 | ||||||||||||||
Operating income (loss) | (19.5 | ) | 45.4 | 341.8 | — | 367.7 | |||||||||||||
Interest income | 0.4 | 28.9 | 4.4 | (30.7 | ) | 3.0 | |||||||||||||
Interest expense | 36.3 | 20.7 | 20.2 | (30.7 | ) | 46.5 | |||||||||||||
Income from equity investments in subsidiaries | 250.3 | 217.4 | — | (467.7 | ) | — | |||||||||||||
Other expense (income) | — | 0.2 | 25.8 | — | 26.0 | ||||||||||||||
Income before income taxes | 194.9 | 270.8 | 300.2 | (467.7 | ) | 298.2 | |||||||||||||
Provision (benefit) for income taxes | (19.5 | ) | 20.8 | 82.5 | — | 83.8 | |||||||||||||
Net income | $ | 214.4 | $ | 250.0 | $ | 217.7 | $ | (467.7 | ) | $ | 214.4 | ||||||||
Comprehensive income | $ | 122.5 | $ | 160.9 | $ | 166.4 | $ | (327.3 | ) | $ | 122.5 | ||||||||
Consolidating Statement of Income
Year ended December 28, 2013 | |||||||||||||||||||
(In millions) | Parent | Guarantor | Non-Guarantors | Eliminations | Total | ||||||||||||||
Net sales | $ | — | $ | — | $ | 2,679.0 | $ | (7.4 | ) | $ | 2,671.6 | ||||||||
Other revenue | — | 124.6 | 18.3 | (142.9 | ) | — | |||||||||||||
Cost of products sold | — | 18.3 | 1,012.3 | (140.8 | ) | 889.8 | |||||||||||||
Gross margin | — | 106.3 | 1,685.0 | (9.5 | ) | 1,781.8 | |||||||||||||
Delivery, sales and administrative expense | 20.8 | 72.0 | 1,286.4 | (9.5 | ) | 1,369.7 | |||||||||||||
Re-engineering and impairment charges | — | — | 9.3 | — | 9.3 | ||||||||||||||
Gains on disposal of assets including insurance recoveries, net | — | — | 0.7 | — | 0.7 | ||||||||||||||
Operating income (loss) | (20.8 | ) | 34.3 | 390.0 | — | 403.5 | |||||||||||||
Interest income | 0.4 | 30.9 | 7.4 | (36.1 | ) | 2.6 | |||||||||||||
Interest expense | 33.8 | 19.8 | 22.7 | (36.1 | ) | 40.2 | |||||||||||||
Income from equity investments in subsidiaries | 308.9 | 280.9 | — | (589.8 | ) | — | |||||||||||||
Other expense (income) | — | (0.1 | ) | 5.6 | — | 5.5 | |||||||||||||
Income before income taxes | 254.7 | 326.4 | 369.1 | (589.8 | ) | 360.4 | |||||||||||||
Provision (benefit) for income taxes | (19.5 | ) | 18.7 | 87.0 | — | 86.2 | |||||||||||||
Net income | $ | 274.2 | $ | 307.7 | $ | 282.1 | $ | (589.8 | ) | $ | 274.2 | ||||||||
Comprehensive income | $ | 228.7 | $ | 262.7 | $ | 249.4 | $ | (512.1 | ) | $ | 228.7 | ||||||||
83
Condensed Consolidating Balance Sheet
December 26, 2015 | |||||||||||||||||||
(In millions) | Parent | Guarantor | Non-Guarantors | Eliminations | Total | ||||||||||||||
ASSETS | |||||||||||||||||||
Cash and cash equivalents | $ | — | $ | — | $ | 79.8 | $ | — | $ | 79.8 | |||||||||
Accounts receivable, net | — | — | 142.7 | — | 142.7 | ||||||||||||||
Inventories | — | — | 254.6 | — | 254.6 | ||||||||||||||
Non-trade amounts receivable, net | 0.1 | 30.1 | 109.6 | (94.3 | ) | 45.5 | |||||||||||||
Intercompany receivables | 11.8 | 754.2 | 228.8 | (994.8 | ) | — | |||||||||||||
Prepaid expenses and other current assets | 1.1 | 3.3 | 118.1 | (94.6 | ) | 27.9 | |||||||||||||
Total current assets | 13.0 | 787.6 | 933.6 | (1,183.7 | ) | 550.5 | |||||||||||||
Deferred income tax benefits, net | 143.5 | 219.9 | 161.5 | — | 524.9 | ||||||||||||||
Property, plant and equipment, net | — | 46.6 | 207.0 | — | 253.6 | ||||||||||||||
Long-term receivables, net | — | 0.1 | 13.1 | — | 13.2 | ||||||||||||||
Tradenames, net | — | — | 82.7 | — | 82.7 | ||||||||||||||
Other intangible assets, net | — | — | — | — | — | ||||||||||||||
Goodwill | — | 2.9 | 143.4 | — | 146.3 | ||||||||||||||
Investments in subsidiaries | 1,164.8 | 1,190.1 | — | (2,354.9 | ) | — | |||||||||||||
Intercompany notes receivable | 462.0 | 90.5 | 579.7 | (1,132.2 | ) | — | |||||||||||||
Other assets, net | 1.6 | 0.6 | 108.1 | (83.3 | ) | 27.0 | |||||||||||||
Total assets | $ | 1,784.9 | $ | 2,338.3 | $ | 2,229.1 | $ | (4,754.1 | ) | $ | 1,598.2 | ||||||||
LIABILITIES AND SHAREHOLDERS' EQUITY | |||||||||||||||||||
Accounts payable | $ | — | $ | 3.3 | $ | 123.5 | $ | (0.1 | ) | $ | 126.7 | ||||||||
Short-term borrowings and current portion of long-term debt and capital lease obligations | 90.4 | 1.2 | 70.9 | — | 162.5 | ||||||||||||||
Intercompany payables | 688.2 | 224.2 | 82.4 | (994.8 | ) | — | |||||||||||||
Accrued liabilities | 155.1 | 111.5 | 247.1 | (188.9 | ) | 324.8 | |||||||||||||
Total current liabilities | 933.7 | 340.2 | 523.9 | (1,183.8 | ) | 614.0 | |||||||||||||
Long-term debt and capital lease obligations | 599.3 | — | 8.9 | — | 608.2 | ||||||||||||||
Intercompany notes payable | 78.5 | 768.1 | 285.6 | (1,132.2 | ) | — | |||||||||||||
Other liabilities | 12.4 | 107.8 | 178.0 | (83.2 | ) | 215.0 | |||||||||||||
Shareholders' equity | 161.0 | 1,122.2 | 1,232.7 | (2,354.9 | ) | 161.0 | |||||||||||||
Total liabilities and shareholders' equity | $ | 1,784.9 | $ | 2,338.3 | $ | 2,229.1 | $ | (4,754.1 | ) | $ | 1,598.2 | ||||||||
84
Condensed Consolidating Balance Sheet
December 27, 2014 | |||||||||||||||||||
(In millions) | Parent | Guarantor | Non-Guarantors | Eliminations | Total | ||||||||||||||
ASSETS | |||||||||||||||||||
Cash and cash equivalents | $ | — | $ | — | $ | 77.0 | $ | — | $ | 77.0 | |||||||||
Accounts receivable, net | — | — | 168.1 | — | 168.1 | ||||||||||||||
Inventories | — | — | 306.0 | — | 306.0 | ||||||||||||||
Non-trade amounts receivable, net | 0.1 | 9.2 | 90.7 | (38.2 | ) | 61.8 | |||||||||||||
Intercompany receivables | 11.8 | 755.2 | 227.6 | (994.6 | ) | — | |||||||||||||
Prepaid expenses and other current assets | 1.1 | 1.8 | 101.8 | (83.1 | ) | 21.6 | |||||||||||||
Total current assets | 13.0 | 766.2 | 971.2 | (1,115.9 | ) | 634.5 | |||||||||||||
Deferred income tax benefits, net | 103.6 | 226.1 | 195.6 | — | 525.3 | ||||||||||||||
Property, plant and equipment, net | — | 43.7 | 246.6 | — | 290.3 | ||||||||||||||
Long-term receivables, net | — | 0.1 | 17.2 | — | 17.3 | ||||||||||||||
Tradenames, net | — | — | 104.2 | — | 104.2 | ||||||||||||||
Other intangible assets, net | — | — | 1.5 | — | 1.5 | ||||||||||||||
Goodwill | — | 2.9 | 161.8 | — | 164.7 | ||||||||||||||
Investment in subsidiaries | 1,479.0 | 575.0 | — | (2,054.0 | ) | — | |||||||||||||
Intercompany notes receivable | 48.4 | 554.1 | 236.5 | (839.0 | ) | — | |||||||||||||
Other assets, net | 1.5 | 0.6 | 160.1 | (130.2 | ) | 32.0 | |||||||||||||
Total assets | $ | 1,645.5 | $ | 2,168.7 | $ | 2,094.7 | $ | (4,139.1 | ) | $ | 1,769.8 | ||||||||
LIABILITIES AND SHAREHOLDERS' EQUITY | |||||||||||||||||||
Accounts payable | $ | — | $ | 2.6 | $ | 140.2 | $ | — | $ | 142.8 | |||||||||
Short-term borrowings and current portion of long-term debt and capital lease obligations | 110.9 | 2.3 | 108.2 | — | 221.4 | ||||||||||||||
Intercompany payables | 632.0 | 225.0 | 137.6 | (994.6 | ) | — | |||||||||||||
Accrued liabilities | 66.4 | 144.1 | 286.1 | (121.3 | ) | 375.3 | |||||||||||||
Total current liabilities | 809.3 | 374.0 | 672.1 | (1,115.9 | ) | 739.5 | |||||||||||||
Long-term debt and capital lease obligations | 599.2 | — | 12.9 | — | 612.1 | ||||||||||||||
Intercompany notes payable | 32.5 | 204.0 | 602.5 | (839.0 | ) | — | |||||||||||||
Other liabilities | 18.7 | 155.5 | 188.4 | (130.2 | ) | 232.4 | |||||||||||||
Shareholders' equity | 185.8 | 1,435.2 | 618.8 | (2,054.0 | ) | 185.8 | |||||||||||||
Total liabilities and shareholders' equity | $ | 1,645.5 | $ | 2,168.7 | $ | 2,094.7 | $ | (4,139.1 | ) | $ | 1,769.8 | ||||||||
85
Condensed Consolidating Statement of Cash Flows
Year ended December 26, 2015 | |||||||||||||||||||
(In millions) | Parent | Guarantor | Non-Guarantors | Eliminations | Total | ||||||||||||||
Operating Activities: | |||||||||||||||||||
Net cash provided by (used in) operating activities | $ | 438.9 | $ | 230.6 | $ | 66.4 | $ | (510.2 | ) | $ | 225.7 | ||||||||
Investing Activities: | |||||||||||||||||||
Capital expenditures | — | (14.7 | ) | (46.4 | ) | — | (61.1 | ) | |||||||||||
Proceeds from disposal of property, plant and equipment | — | — | 18.0 | — | 18.0 | ||||||||||||||
Net intercompany loans | (335.7 | ) | 296.3 | 492.0 | (452.6 | ) | — | ||||||||||||
Return of capital | — | 105.5 | — | (105.5 | ) | — | |||||||||||||
Net cash provided by (used in) investing activities | (335.7 | ) | 387.1 | 463.6 | (558.1 | ) | (43.1 | ) | |||||||||||
Financing Activities: | |||||||||||||||||||
Dividend payments to shareholders | (138.0 | ) | — | — | — | (138.0 | ) | ||||||||||||
Dividend payments to parent | — | (400.0 | ) | (103.1 | ) | 503.1 | — | ||||||||||||
Net proceeds from issuance of senior notes | 0.1 | — | (0.1 | ) | — | — | |||||||||||||
Proceeds from exercise of stock options | 16.1 | — | — | — | 16.1 | ||||||||||||||
Repurchase of common stock | (1.5 | ) | — | — | — | (1.5 | ) | ||||||||||||
Repayment of long-term debt and capital lease obligations | — | — | (2.6 | ) | — | (2.6 | ) | ||||||||||||
Net change in short-term debt | (9.5 | ) | (2.3 | ) | (24.6 | ) | — | (36.4 | ) | ||||||||||
Debt issuance costs | (0.7 | ) | — | — | — | (0.7 | ) | ||||||||||||
Excess tax benefits from share-based payment arrangements | 6.0 | — | — | — | 6.0 | ||||||||||||||
Net intercompany borrowings | 24.3 | (215.3 | ) | (268.8 | ) | 459.8 | — | ||||||||||||
Return of capital to parent | — | — | (105.5 | ) | 105.5 | — | |||||||||||||
Net cash provided by (used in) financing activities | (103.2 | ) | (617.6 | ) | (504.7 | ) | 1,068.4 | (157.1 | ) | ||||||||||
Effect of exchange rate changes on cash and cash equivalents | — | (0.1 | ) | (22.5 | ) | (0.1 | ) | (22.7 | ) | ||||||||||
Net change in cash and cash equivalents | — | — | 2.8 | — | 2.8 | ||||||||||||||
Cash and cash equivalents at beginning of year | — | — | 77.0 | — | 77.0 | ||||||||||||||
Cash and cash equivalents at end of period | $ | — | $ | — | $ | 79.8 | $ | — | $ | 79.8 | |||||||||
86
Condensed Consolidating Statement of Cash Flows
Year ended December 27, 2014 | |||||||||||||||||||
(In millions) | Parent | Guarantor | Non-Guarantors | Eliminations | Total | ||||||||||||||
Operating Activities: | |||||||||||||||||||
Net cash provided by (used in) operating activities | $ | 306.7 | $ | 1,482.7 | $ | 96.5 | $ | (1,601.8 | ) | $ | 284.1 | ||||||||
Investing Activities: | |||||||||||||||||||
Capital expenditures | — | (14.7 | ) | (54.7 | ) | — | (69.4 | ) | |||||||||||
Proceeds from disposal of property, plant and equipment | — | — | 7.1 | — | 7.1 | ||||||||||||||
Return of capital | — | 604.3 | — | (604.3 | ) | — | |||||||||||||
Net intercompany loans | 5.1 | (190.8 | ) | 1,839.9 | (1,654.2 | ) | — | ||||||||||||
Net cash provided by (used in) investing activities | 5.1 | 398.8 | 1,792.3 | (2,258.5 | ) | (62.3 | ) | ||||||||||||
Financing Activities: | |||||||||||||||||||
Dividend payments to shareholders | (135.5 | ) | — | — | — | (135.5 | ) | ||||||||||||
Dividend payments to parent | — | (352.0 | ) | (1,281.5 | ) | 1,633.5 | — | ||||||||||||
Net proceeds from issuance of senior notes | — | — | — | — | — | ||||||||||||||
Proceeds from exercise of stock options | 15.7 | — | — | — | 15.7 | ||||||||||||||
Repurchase of common stock | (92.3 | ) | — | — | — | (92.3 | ) | ||||||||||||
Repayment of long-term debt and capital lease obligations | — | — | (3.0 | ) | — | (3.0 | ) | ||||||||||||
Net change in short-term debt | (9.1 | ) | 2.3 | 4.6 | — | (2.2 | ) | ||||||||||||
Debt issuance costs | — | — | — | — | — | ||||||||||||||
Excess tax benefits from share-based payment arrangements | 6.3 | — | — | — | 6.3 | ||||||||||||||
Net intercompany borrowings | (96.9 | ) | (1,530.4 | ) | 4.9 | 1,622.4 | — | ||||||||||||
Return of capital to parent | — | — | (604.3 | ) | 604.3 | — | |||||||||||||
Net cash provided by (used in) financing activities | (311.8 | ) | (1,880.1 | ) | (1,879.3 | ) | 3,860.2 | (211.0 | ) | ||||||||||
Effect of exchange rate changes on cash and cash equivalents | — | (1.5 | ) | (59.7 | ) | 0.1 | (61.1 | ) | |||||||||||
Net change in cash and cash equivalents | — | (0.1 | ) | (50.2 | ) | — | (50.3 | ) | |||||||||||
Cash and cash equivalents at beginning of year | — | 0.1 | 127.2 | — | 127.3 | ||||||||||||||
Cash and cash equivalents at end of period | $ | — | $ | — | $ | 77.0 | $ | — | $ | 77.0 | |||||||||
87
Condensed Consolidating Statement of Cash Flows
Year ended December 28, 2013 | |||||||||||||||||||
(In millions) | Parent | Guarantor | Non-Guarantors | Eliminations | Total | ||||||||||||||
Operating Activities: | |||||||||||||||||||
Net cash provided by (used in) operating activities | $ | (66.7 | ) | $ | 53.7 | $ | 410.9 | $ | (74.4 | ) | $ | 323.5 | |||||||
Investing Activities: | |||||||||||||||||||
Capital expenditures | — | (14.2 | ) | (54.8 | ) | — | (69.0 | ) | |||||||||||
Proceeds from disposal of property, plant and equipment | — | — | 8.9 | — | 8.9 | ||||||||||||||
Return of capital | — | — | — | — | — | ||||||||||||||
Net intercompany loans | 27.9 | (223.9 | ) | (193.3 | ) | 389.3 | — | ||||||||||||
Net cash provided by (used in) investing activities | 27.9 | (238.1 | ) | (239.2 | ) | 389.3 | (60.1 | ) | |||||||||||
Financing Activities: | |||||||||||||||||||
Dividend payments to shareholders | (116.8 | ) | — | — | — | (116.8 | ) | ||||||||||||
Dividend payments to parent | — | — | (94.9 | ) | 94.9 | — | |||||||||||||
Net proceeds from issuance of senior notes | 200.0 | — | — | — | 200.0 | ||||||||||||||
Proceeds from exercise of stock options | 21.0 | — | — | — | 21.0 | ||||||||||||||
Repurchase of common stock | (379.4 | ) | — | — | — | (379.4 | ) | ||||||||||||
Repayment of long-term debt and capital lease obligations | — | — | (2.5 | ) | — | (2.5 | ) | ||||||||||||
Net change in short-term debt | 84.0 | — | (56.2 | ) | — | 27.8 | |||||||||||||
Debt issuance costs | (2.2 | ) | — | — | — | (2.2 | ) | ||||||||||||
Excess tax benefits from share-based payment arrangements | 14.5 | — | — | — | 14.5 | ||||||||||||||
Net intercompany borrowings | 217.7 | 184.3 | 7.8 | (409.8 | ) | — | |||||||||||||
Return of capital to parent | — | — | — | — | — | ||||||||||||||
Net cash provided by (used in) financing activities | 38.8 | 184.3 | (145.8 | ) | (314.9 | ) | (237.6 | ) | |||||||||||
Effect of exchange rate changes on cash and cash equivalents | — | — | (18.3 | ) | — | (18.3 | ) | ||||||||||||
Net change in cash and cash equivalents | — | (0.1 | ) | 7.6 | — | 7.5 | |||||||||||||
Cash and cash equivalents at beginning of year | — | 0.2 | 119.6 | — | 119.8 | ||||||||||||||
Cash and cash equivalents at end of period | $ | — | $ | 0.1 | $ | 127.2 | $ | — | $ | 127.3 | |||||||||
88
Note 19: | Quarterly Financial Summary (Unaudited) |
Following is a summary of the unaudited interim results of operations for each quarter in the years ended December 26, 2015 and December 27, 2014.
(In millions, except per share amounts) | First quarter | Second quarter | Third quarter | Fourth quarter | |||||||||||
Year ended December 26, 2015 | |||||||||||||||
Net sales | $ | 581.8 | $ | 588.9 | $ | 521.0 | $ | 592.1 | |||||||
Gross margin | 390.2 | 399.8 | 348.5 | 400.9 | |||||||||||
Net income | 29.5 | 62.0 | 36.2 | 58.1 | |||||||||||
Basic earnings per share | 0.59 | 1.24 | 0.72 | 1.16 | |||||||||||
Diluted earnings per share | 0.59 | 1.23 | 0.72 | 1.15 | |||||||||||
Dividends declared per share | 0.68 | 0.68 | 0.68 | 0.68 | |||||||||||
Composite stock price range: | |||||||||||||||
High | 72.93 | 70.78 | 67.35 | 62.02 | |||||||||||
Low | 59.35 | 64.35 | 47.85 | 48.73 | |||||||||||
Close | $ | 70.25 | $ | 67.36 | $ | 50.06 | $ | 55.89 | |||||||
Year ended December 27, 2014 | |||||||||||||||
Net sales | $ | 663.2 | $ | 674.3 | $ | 588.7 | $ | 679.9 | |||||||
Gross margin | 441.6 | 448.6 | 379.5 | 452.4 | |||||||||||
Net income | 52.2 | 47.6 | 32.3 | 82.3 | |||||||||||
Basic earnings per share | 1.04 | 0.95 | 0.64 | 1.65 | |||||||||||
Diluted earnings per share | 1.02 | 0.93 | 0.63 | 1.63 | |||||||||||
Dividends declared per share | 0.68 | 0.68 | 0.68 | 0.68 | |||||||||||
Composite stock price range: | |||||||||||||||
High | 96.22 | 89.57 | 85.82 | 71.57 | |||||||||||
Low | 74.65 | 81.03 | 69.84 | 58.19 | |||||||||||
Close | $ | 82.25 | $ | 82.92 | $ | 70.29 | $ | 63.68 | |||||||
Certain items impacting quarterly comparability for 2015 and 2014 were as follows:
• | Pretax re-engineering and impairment costs of $2.7 million, $1.5 million, $0.3 million and $2.3 million were recorded in the first through fourth quarters of 2015, respectively, as well as $13.5 million in the first quarter of 2015 for the impairment charge of fixed assets in Venezuela. Pretax re-engineering and impairment costs of $2.3 million, $3.4 million, $2.6 million and $2.7 million were recorded in the first through fourth quarters of 2014, respectively. Refer to Note 2 to the Consolidated Financial Statements for further discussion. |
• | In connection with re-measuring net monetary assets and recording in cost of sales inventory at the exchange rate when it was purchased or manufactured compared to when it was sold, the Company had impacts of $9.3 million, $1.8 million, $2.0 million and $1.8 million in the first, second, third and fourth quarters of 2015, respectively, and impacts of $13.4 million, $22.2 million, $6.0 million and $0.2 million in the same quarters of 2014. See Note 1 of the Consolidated Financial Statements for further details. |
• | Pretax gains on disposal of assets, primarily related to land transactions near the Company's Orlando headquarters, were $0.6 million, $10.8 million, $2.0 million and $0.3 million in the first through fourth quarters of 2015, respectively. They were $1.8 million, $0.5 million and $0.4 million in the first, second and fourth quarters of 2014, respectively. There were no such amounts in the third quarter of 2014. |
89
Report of Independent Registered Certified Public Accounting Firm
To the Board of Directors and Shareholders of Tupperware Brands Corporation
In our opinion, the consolidated financial statements listed in the index appearing under Item 15(a)(1) present fairly, in all material respects, the financial position of Tupperware Brands Corporation and its subsidiaries at December 26, 2015 and December 27, 2014, and the results of their operations and their cash flows for each of the three years in the period ended December 26, 2015 in conformity with accounting principles generally accepted in the United States of America. In addition, in our opinion, the financial statement schedule listed in the index appearing under Item 15(a)(2) presents fairly, in all material respects, the information set forth therein when read in conjunction with the related consolidated financial statements. Also in our opinion, the Company maintained, in all material respects, effective internal control over financial reporting as of December 26, 2015, based on criteria established in Internal Control-Integrated Framework (2013) issued by the Committee of Sponsoring Organizations of the Treadway Commission (COSO). The Company's management is responsible for these financial statements and the financial statement schedule, for maintaining effective internal control over financial reporting and for its assessment of the effectiveness of internal control over financial reporting, included in Management's Report on Internal Control Over Financial Reporting appearing under Item 9A. Our responsibility is to express opinions on these financial statements, on the financial statement schedule, and on the Company's internal control over financial reporting based on our integrated audits. We conducted our audits in accordance with the standards of the Public Company Accounting Oversight Board (United States). Those standards require that we plan and perform the audits to obtain reasonable assurance about whether the financial statements are free of material misstatement and whether effective internal control over financial reporting was maintained in all material respects. Our audits of the financial statements included examining, on a test basis, evidence supporting the amounts and disclosures in the financial statements, assessing the accounting principles used and significant estimates made by management, and evaluating the overall financial statement presentation. Our audit of internal control over financial reporting included obtaining an understanding of internal control over financial reporting, assessing the risk that a material weakness exists, and testing and evaluating the design and operating effectiveness of internal control based on the assessed risk. Our audits also included performing such other procedures as we considered necessary in the circumstances. We believe that our audits provide a reasonable basis for our opinions.
A company's internal control over financial reporting is a process designed to provide reasonable assurance regarding the reliability of financial reporting and the preparation of financial statements for external purposes in accordance with generally accepted accounting principles. A company's internal control over financial reporting includes those policies and procedures that (i) pertain to the maintenance of records that, in reasonable detail, accurately and fairly reflect the transactions and dispositions of the assets of the company; (ii) provide reasonable assurance that transactions are recorded as necessary to permit preparation of financial statements in accordance with generally accepted accounting principles, and that receipts and expenditures of the company are being made only in accordance with authorizations of management and directors of the company; and (iii) provide reasonable assurance regarding prevention or timely detection of unauthorized acquisition, use, or disposition of the company's assets that could have a material effect on the financial statements.
Because of its inherent limitations, internal control over financial reporting may not prevent or detect misstatements. Also, projections of any evaluation of effectiveness to future periods are subject to the risk that controls may become inadequate because of changes in conditions, or that the degree of compliance with the policies or procedures may deteriorate.
PricewaterhouseCoopers LLP
Orlando, Florida
March 4, 2016
90
Item 9. | Changes in and Disagreements With Accountants on Accounting and Financial Disclosure. |
None.
Item 9A. | Controls and Procedures. |
Evaluation of Disclosure Controls and Procedures
The Company maintains disclosure controls and procedures (as defined in Exchange Act Rules 13a-15(e) and 15(d)-15(e)) that are designed to ensure that information required to be disclosed in the Company's reports filed or submitted under the Exchange Act is recorded, processed, summarized and reported within the time periods specified in the Securities and Exchange Commission's rules and forms, and that such information is accumulated and communicated to the Company's management, including the Chief Executive Officer and the Chief Financial Officer, as appropriate to allow timely decisions regarding required disclosure. In designing and evaluating the disclosure controls and procedures, management recognized that controls and procedures, no matter how well designed and operated, can provide only reasonable assurance of achieving the desired control objectives.
As of the end of the period covered by this report, management, under the supervision of the Company's Chief Executive Officer and Chief Financial Officer, evaluated the effectiveness of the design and operation of the Company's disclosure controls and procedures. Based upon that evaluation, the Chief Executive Officer and Chief Financial Officer concluded that the disclosure controls and procedures were effective as of December 26, 2015.
Management's Report on Internal Control Over Financial Reporting
The Company's management is also responsible for establishing and maintaining adequate internal control over financial reporting as defined in Exchange Act Rule 13a-15(f). As of the end of the period covered by this report, management, under the supervision of the Company's Chief Executive Officer and Chief Financial Officer, evaluated the effectiveness of the Company's internal control over financial reporting based on the framework in Internal Control-Integrated Framework (2013) issued by the Committee of Sponsoring Organizations of the Treadway Commission. Based upon that evaluation, the Chief Executive Officer and Chief Financial Officer concluded that the Company's internal control over financial reporting was effective as of the end of the period covered by this report. The effectiveness of the Company's internal control over financial reporting as of December 26, 2015 has been audited by PricewaterhouseCoopers LLP, an independent registered certified public accounting firm, as stated in its report which is included herein.
Changes in Internal Controls
There have been no significant changes in the Company's internal control over financial reporting during the Company's fourth quarter that have materially affected or are reasonably likely to materially affect its internal control over financial reporting, as defined in Rule 13a-15(f) promulgated under the Securities Exchange Act of 1934, as amended.
Item 9B.Other Information.
None.
91
PART III
Item 10.Directors, Executive Officers and Corporate Governance.
Certain information with regard to the directors of the Registrant as required by Item 401 of Regulation S-K is set forth under the sub-caption “Board of Directors” appearing under the caption “Election of Directors” in the Proxy Statement related to the 2016 Annual Meeting of Shareholders to be held on May 24, 2016 and is incorporated herein by reference.
The information as to the executive officers of the Registrant is included in Part I hereof under the caption “Executive Officers of the Registrant” in reliance upon General Instruction G to Form 10-K and Instruction 3 to Item 401(b) of Regulation S-K.
The section entitled “Section 16(a) Beneficial Ownership Reporting Compliance” appearing in the Registrant's Proxy Statement for the 2016 Annual Meeting of Shareholders to be held on May 24, 2016 sets forth certain information as required by Item 405 of Regulation S-K and is incorporated herein by reference.
The section entitled “Corporate Governance” appearing in the Registrant's Proxy Statement for the 2016 Annual Meeting of Shareholders to be held on May 24, 2016 sets forth certain information with respect to the Registrant's code of conduct and ethics as required by Item 406 of Regulation S-K and is incorporated herein by reference.
There were no material changes to the procedures by which security holders may recommend nominees to the registrant's board of directors during 2015, as set forth by Item 407(c)(3).
The sections entitled “Corporate Governance” and “Board Committees” appearing in the Registrant's Proxy Statement for the 2016 Annual Meeting of Shareholders to be held on May 24, 2016 sets forth certain information regarding the Audit, Finance and Corporate Responsibility Committee, including the members of the Committee and the financial experts, as set forth by Item 407(d)(4) and (d)(5) of Regulation S-K and is incorporated herein by reference.
Item 11.Executive Compensation.
The information set forth under the caption “Compensation of Directors and Executive Officers” of the Proxy Statement relating to the 2016 Annual Meeting of Shareholders to be held on May 24, 2016, and the information in such Proxy Statement relating to executive officers' and directors' compensation is incorporated herein by reference.
The information set forth under the captions “Board Committees” and “Compensation and Management Development Committee Report” of the Proxy Statement relating to the 2016 Annual Meeting of Shareholders to be held on May 24, 2016 sets forth certain information as required by Item 407(e)(4) and Item 407(e)(5) of Regulation S-K and is incorporated herein by reference.
Item 12. | Security Ownership of Certain Beneficial Owners and Management and Related Stockholder Matters. |
The information set forth under the captions “Security Ownership of Certain Beneficial Owners”, “Security Ownership of Management” and “Equity Compensation Plan Information” in the Proxy Statement relating to the 2016 Annual Meeting of Shareholders to be held on May 24, 2016, is incorporated herein by reference.
Item 13.Certain Relationships and Related Transactions and Director Independence.
The information set forth under the captions “Transactions with Related Persons” and “Corporate Governance” appearing in the Registrant's Proxy Statement for the 2016 Annual Meeting of Shareholders to be held on May 24, 2016 is incorporated herein by reference.
Item 14.Principal Accounting Fees and Services.
The information set forth under the captions “Audit Fees,” “Audit-Related Fees,” “Tax Fees,” “All Other Fees,” and “Approval of Services” in the Proxy Statement related to the 2016 Annual Meeting of Shareholders to be held on May 24, 2016 is incorporated herein by reference.
92
PART IV
Item 15. | Exhibits, Financial Statement Schedules. |
(a) (1) List of Financial Statements
The following Consolidated Financial Statements of Tupperware Brands Corporation and Report of Independent Registered Public Accounting Firm are included in this Report under Item 8:
Consolidated Statements of Income, Comprehensive Income, Shareholders' Equity and Cash Flows - Years ended December 26, 2015, December 27, 2014 and December 28, 2013;
Consolidated Balance Sheets - December 26, 2015 and December 27, 2014;
Notes to the Consolidated Financial Statements; and
Report of Independent Registered Certified Public Accounting Firm.
(a) (2) List of Financial Statement Schedules
The following Consolidated Financial Statement Schedule (numbered in accordance with Regulation S-X) of Tupperware Brands Corporation is included in this Report:
Schedule II-Valuation and Qualifying Accounts for each of the three years ended December 26, 2015.
All other schedules for which provision is made in the applicable accounting regulations of the Securities and Exchange Commission (SEC or the Commission) are not required under the related instructions, are inapplicable or the information called for therein is included elsewhere in the financial statements or related notes contained or incorporated by reference herein.
(a) (3) List of Exhibits: (numbered in accordance with Item 601 of Regulation S-K)
Exhibit Number | Description |
*3.1 | Restated Certificate of Incorporation of the Registrant (Attached as Exhibit 3.1 to Form 10-Q, filed with the Commission on August 5, 2008 and incorporated herein by reference). |
*3.2 | Amended and Restated By-laws of the Registrant as amended August 28, 2008 (Attached as Exhibit 3.2 to Form 8-K, filed with the Commission on August 28, 2008 and incorporated herein by reference). |
*4 | Indenture dated June 2, 2011 (Attached as Exhibit 4.1 to Form 8-K, filed with the Commission on June 7, 2011 and incorporated herein by reference). |
*10.1 | 1996 Incentive Plan as amended through January 26, 2009 (Attached as Exhibit 10.1 to Form 10-K, filed with the Commission on February 25, 2009 and incorporated herein by reference). |
*10.2 | Directors' Stock Plan as amended through January 26, 2009 (Attached as Exhibit 10.2 to Form 10-K, filed with the Commission on February 25, 2009 and incorporated herein by reference). |
*10.3 | Form of Change of Control Employment Agreement (Attached as Exhibit 10.3 for Form 10-K, filed with the Commission on February 25, 2009 and incorporated herein by reference). |
*10.4 | Securities and Asset Purchase Agreement between the Registrant and Sara Lee Corporation (now known as Hillshire Brands Co.) dated as of August 10, 2005 (Attached as Exhibit 10.01 to Form 8-K/A, filed with the Commission on August 15, 2005 and incorporated herein by reference). |
*10.5 | Forms of stock option, restricted stock and restricted stock unit agreements utilized with the Registrant's officers and directors under certain stock-based incentive plans (Attached as Exhibit 10.6 to Form 10-K, filed with the Commission on February 25, 2009 and incorporated herein by reference). |
*10.6 | Chief Executive Officer Severance Agreement between the Registrant and E.V. Goings amended and restated effective February 17, 2010 (Attached as Exhibit 10.8 to From 10-K, filed with the Commission on February 23, 2010 and incorporated herein by reference). |
93
Exhibit Number | Description |
*10.7 | Supplemental Executive Retirement Plan, amended and restated effective February 2, 2010 (Attached as Exhibit 10.9 to Form 10-K, filed with the Commission on February 23, 2010 and incorporated herein by reference). |
*10.8 | Supplemental Plan, amended and restated effective January 1, 2009 (Attached as Exhibit 10.11 to Form 10-K, filed with the Commission on February 25, 2009 and incorporated herein by reference). |
*10.9 | 2006 Incentive Plan as amended through January 26, 2009 (Attached as Exhibit 10.12 to Form 10-K, filed with the Commission on February 25, 2009 and incorporated herein by reference). |
*10.10 | 2010 Incentive Plan (Attached as Exhibit 4.3 to Form S-8, filed with the Commission on November 3, 2010 and incorporated herein by reference). |
*10.11 | 2010 Incentive Plan Restricted Stock Agreement (Attached as Exhibit 4.4 to Form S-8, filed with the Commission on November 3, 2010 and incorporated herein by reference). |
*10.12 | Credit Agreement, as amended through June 9, 2015 (Attached as Exhibit 10.1 and 10.2 to Form 10-Q, filed with the Commission on August 5, 2014 and as Exhibit 10.1 to Form 8-K as filed with the Commission on June 9, 2015 and incorporated herein by reference). |
21 | Subsidiaries of Tupperware Brands Corporation as of February 24, 2016. |
23 | Consent of Independent Registered Certified Public Accounting Firm. |
24 | Powers of Attorney. |
31.1 | Rule 13a-14(a)/15d-14(a) Certification of the Chief Executive Officer. |
31.2 | Rule 13a-14(a)/15d-14(a) Certification of the Chief Financial Officer. |
32.1 | Certification Pursuant to Section 1350 of Chapter 63 of Title 18 of the United States Code by the Chief Executive Officer. |
32.2 | Certification Pursuant to Section 1350 of Chapter 63 of Title 18 of the United States Code by the Chief Financial Officer. |
101 | The following financial statements from Tupperware Brands Corporation's Annual Report on Form 10-K for the year ended December 26, 2015, formatted in XBRL (eXtensible Business Reporting Language): (i) Consolidated Statements of Income, (ii) Consolidated Statements of Comprehensive Income, (iii) Consolidated Balance Sheets, (iv) Consolidated Statements of Shareholders' Equity, (v) Consolidated Statements of Cash Flows, (vi) Notes to the Consolidated Financial Statements, tagged in detail, and (vii) Schedule II. Valuation and Qualifying Accounts. |
* Document has heretofore been filed with the SEC and is incorporated by reference and made a part hereof.
The Registrant agrees to furnish, upon request of the SEC, a copy of all constituent instruments defining the rights of holders of long-term debt of the Registrant and its consolidated subsidiaries.
94
TUPPERWARE BRANDS CORPORATION
SCHEDULE II-VALUATION AND QUALIFYING ACCOUNTS
FOR THE THREE YEARS ENDED DECEMBER 26, 2015
(In millions)
Col. A | Col. B | Col. C | Col. D | Col. E | ||||||||||||||||
Additions | ||||||||||||||||||||
Balance at Beginning of Period | Charged to Costs and Expenses | Charged to Other Accounts | Deductions | Balance at End of Period | ||||||||||||||||
Allowance for doubtful accounts, current and long term: | ||||||||||||||||||||
Year ended December 26, 2015 | $ | 48.4 | $ | 12.8 | $ | — | $ | (8.0 | ) | /F1 | $ | 45.2 | ||||||||
(8.0 | ) | /F2 | ||||||||||||||||||
Year ended December 27, 2014 | 54.4 | 13.5 | — | (11.6 | ) | /F1 | 48.4 | |||||||||||||
(7.9 | ) | /F2 | ||||||||||||||||||
Year ended December 28, 2013 | 53.9 | 11.8 | — | (9.9 | ) | /F1 | 54.4 | |||||||||||||
(1.4 | ) | /F2 | ||||||||||||||||||
Valuation allowance for deferred tax assets: | ||||||||||||||||||||
Year ended December 26, 2015 | $ | 40.2 | $ | — | $ | — | $ | (7.1 | ) | /F2 | $ | 23.1 | ||||||||
(10.0 | ) | /F4 | ||||||||||||||||||
Year ended December 27, 2014 | 34.8 | — | — | (4.2 | ) | /F2 | 40.2 | |||||||||||||
(0.4 | ) | /F3 | ||||||||||||||||||
10.0 | /F4 | |||||||||||||||||||
Year ended December 28, 2013 | 103.1 | — | — | (4.4 | ) | /F2 | 34.8 | |||||||||||||
(39.0 | ) | /F3 | ||||||||||||||||||
(24.9 | ) | /F4 | ||||||||||||||||||
____________________
F1 | Represents write-offs, less recoveries. |
F2 | Foreign currency translation adjustment. |
F3 Represents release of valuation allowance as reduction of costs and expenses. See Note 12 to the consolidated financial statements for additional information.
F4 Represents additions and write-offs of net operating losses for which a valuation allowance was already recorded. See Note 12 to the consolidated financial statements for additional information.
95
SIGNATURES
Pursuant to the requirements of Section 13 or 15(d) of the Securities Exchange Act of 1934, the Registrant has duly caused this Report to be signed on its behalf by the undersigned, thereunto duly authorized.
TUPPERWARE BRANDS CORPORATION | ||
(Registrant) | ||
By: | /S/ E.V. GOINGS | |
E.V. Goings | ||
Chairman and Chief Executive Officer | ||
March 4, 2016
Pursuant to the requirements of the Securities Exchange Act of 1934, this Report has been signed below by the following persons on behalf of the Registrant and in the capacities and on the date indicated.
Signature | Title | |
/s/ E.V. GOINGS | Chairman and Chief Executive Officer and Director (Principal Executive Officer) | |
E.V. Goings | ||
/s/ MICHAEL S. POTESHMAN | Executive Vice President and Chief Financial Officer (Principal Financial Officer) | |
Michael S. Poteshman | ||
/s/ NICHOLAS K. POUCHER | Senior Vice President and Controller (Principal Accounting Officer) | |
Nicholas K. Poucher | ||
* | Director | |
Catherine A. Bertini | ||
* | Director | |
Susan M. Cameron | ||
* | Director | |
Kriss Cloninger III | ||
* | Director | |
Meg Crofton | ||
* | Director | |
Joe R. Lee | ||
* | Director | |
Angel R. Martinez | ||
* | Director | |
Antonio Monteiro de Castro | ||
* | Director | |
Robert J. Murray | ||
96
* | Director | |
David R. Parker | ||
* | Director | |
Richard T. Riley | ||
* | Director | |
Joyce M. Roche | ||
* | Director | |
M. Anne Szostak | ||
By: | /s/ THOMAS M. ROEHLK |
Thomas M. Roehlk | |
Attorney-in-fact | |
March 4, 2016
97