Attached files
| file | filename |
|---|---|
| EX-32.1 - EXHIBIT 32.1 SECTION 906 CEO CERTIFICATION - KOPIN CORP | kopn-ex321_12262015.htm |
| EX-31.1 - EXHIBIT 31.1 SECTION 302 CEO CERTIFICATION - KOPIN CORP | kopn-ex311_12262015.htm |
| EX-23.1 - EXHIBIT 23.1 CONSENT OF INDEPENDENT REGISTERED PUBLIC ACCOUNTING FIRM - KOPIN CORP | kopn-ex231_12262015.htm |
| EX-32.2 - EXHIBIT 32.2 SECTION 906 CFO CERTIFICATION - KOPIN CORP | kopn-ex322_12262015.htm |
| EX-31.2 - EXHIBIT 31.2 SECTION 302 CFO CERTIFICATION - KOPIN CORP | kopn-ex312_12262015.htm |
| EX-21.1 - EXHIBIT 21.1 SUBSIDIARIES OF KOPIN CORPORATION - KOPIN CORP | kopn-ex211_12262015.htm |
UNITED STATES
SECURITIES AND EXCHANGE COMMISSION
WASHINGTON, DC 20549
FORM 10-K
x | ANNUAL REPORT PURSUANT TO SECTION 13 OR 15(d) OF THE SECURITIES EXCHANGE ACT OF 1934 |
For the fiscal year ended December 26, 2015
OR
¨ | TRANSITION REPORT PURSUANT TO SECTION 13 OR 15(d) OF THE SECURITIES EXCHANGE ACT OF 1934 |
For the transition period from to
Commission file number 0-19882
KOPIN CORPORATION
(Exact Name of Registrant as Specified in its Charter)
Delaware | 04-2833935 |
(State or other jurisdiction of incorporation or organization) | (I.R.S. Employer Identification No.) |
125 North Drive, Westborough, MA | 01581-3335 |
(Address of principal executive offices) | (Zip Code) |
Registrant’s telephone number, including area code: | (508) 870-5959 |
Securities registered pursuant to Section 12(b) of the Act: | Common Stock, par value $.01 per share |
(Title of Class) | |
Name of each exchange on which registered | NASDAQ Global Market |
Securities registered pursuant to Section 12(g) of the Act: | None |
Indicate by check mark if the registrant is a well-known seasoned issuer, as defined in Rule 405 of the Securities Act. Yes ¨ No x
Indicate by check mark if the registrant is not required to file reports pursuant to Section 13 or Section 15(d) of the Act. Yes ¨ No x
Indicate by check mark whether the registrant (1) has filed all reports required to be filed by Section 13 or 15(d) of the Securities Exchange Act of 1934 during the preceding 12 months (or for such shorter period that the registrant was required to file such reports), and (2) has been subject to such filing requirements for the past 90 days. Yes x No ¨
Indicate by check mark whether the registrant has submitted electronically and posted on its corporate Web site, if any, every Interactive Data File required to be submitted and posted pursuant to Rule 405 of Regulation S-T (§232.405 of this chapter) during the preceding 12 months (or for such shorter period that the registrant was required to submit and post such files). x Yes ¨ No
Indicate by check mark if disclosure of delinquent filers pursuant to Item 405 of Regulation S-K is not contained herein, and will not be contained, to the best of registrant’s knowledge, in definitive proxy or information statements incorporated by reference in Part III of this Form 10-K or any amendment to this Form 10-K. ¨
Indicate by check mark whether the Registrant is a large accelerated filer, an accelerated filer, a non-accelerated filer, or a smaller reporting company. See definitions of “large accelerated filer”, “accelerated filer” and “smaller reporting company” in Rule 12b-2 of the Exchange Act. (Check one):
Large Accelerated Filer | ¨ | Accelerated Filer | x | Non-Accelerated Filer | ¨ | Smaller Reporting Company | ¨ |
Indicate by check mark whether the registrant is a shell company (as defined in rule 12b-2 of the Exchange Act). Yes ¨ No x
As of June 27, 2015 (the last business day of the registrant's most recent second fiscal quarter) the aggregate market value of outstanding shares of voting stock held by non-affiliates of the registrant was $239,599,673.
As of February 26, 2016, 66,673,905 shares of the registrant’s Common Stock, par value $.01 per share, were issued and outstanding.
DOCUMENTS INCORPORATED BY REFERENCE
Portions of the registrant’s definitive Proxy Statement relating to its 2015 Annual Meeting of Stockholders are incorporated by reference into Part III of this Annual Report on Form 10-K where indicated.
1
Part I
Forward Looking Statements
This Annual Report on Form 10-K contains forward-looking statements within the meaning of the United States Private Securities Litigation Reform Act of 1995, including, without limitation, statements made relating to our expectation that we will offer the Whisper Chip in 2016; our expectation that we will offer Solos, an augmented wearable headset designed for the consumer fitness market in 2016; our expectation that the market for wireless communications devices, including personal entertainment systems, will continue to grow; our belief that Kopin’s Wearable technology will enable easier and more convenient access to the content individuals carry in their smartphones or “in the cloud”, and will be embraced by both consumers and commercial users; our belief that our understanding of the needs associated with wearable headset systems and our customers’ products has been an important reason we have previously been successful in developing customer relationships; our belief that our system know-how is a compelling reason customers choose us as their supplier; our belief that small form factor displays will be a critical component in the development of military, consumer electronic and augmented and virtual reality markets must provide high resolution images without compromising the portability of the product; our expectation that we will have negative cash flow from operating activities in 2016; our expectation that we will continue to pursue other U.S. government development contracts for applications that relate to our commercial product applications; our expectation that we will prosecute and defend our proprietary technology aggressively; our belief that it is important to retain personnel with experience and expertise relevant to our business; our belief that our products are targeted towards markets that are still developing and our competitive strength is creating new technologies; our belief that it is important to invest in research and development to achieve profitability even during periods when we are not profitable; our belief that we are a leading developer and manufacturer of advanced miniature displays; our belief that our products enable our customers to develop and market an improved generation of products; our belief that that the technical nature of our products and markets demands a commitment to close relationships with our customers; our belief that continued introduction of new products in our target markets is essential to our growth; our belief that our wearable technology will be embraced by consumers and commercial users and our ability to develop and expand our wearable technologies and to market and license our wearable technologies will be important for our revenue growth and ability to achieve profitability and positive cash flow; the impact of the timing of development of the market segment for our wearable computing products on our ability to grow revenues; our expectation that we will incur significant development and marketing costs in 2016 to commercialize our wearable technologies; our statement that we may make equity investments in companies; our expectation that the cash and marketable debt securities held by Kowon will eventually be remitted back to the U.S.; our expectation that the U.S. government will significantly reduce funding for programs through which we sell high margin military products; our belief that a strengthening of the U.S. dollar could increase the price of our products in foreign markets; the impact of new regulations relating to conflict minerals on customer demands and increased costs related to compliance with such regulations; our belief that our future success will depend primarily upon the technical expertise, creative skills and management abilities of our officers and key employees rather than on patent ownership; our belief that our extensive portfolio of patents, trade secrets and non-patented know-how provides us with a competitive advantage in the wearable technologies market; our belief that our ability to develop innovative products enhances our opportunity to grow within our targeted markets; our belief that continued introduction of new products in our target markets is essential to our growth; our expectation that our display products will benefit from further general technological advances in the design and production of integrated circuits and active matrix LCDs, resulting in further improvements in resolution and miniaturization; our belief that our manufacturing process offers greater miniaturization, reduced cost, higher pixel density, full color capability and lower power consumption compared to conventional active matrix LCD manufacturing approaches; our expectation not to pay cash dividends for the foreseeable future and to retain earnings for the development of our businesses; our expectation that we will expend between $2.0 million and $3.0 million on capital expenditures over the next twelve months; our expectation that competition will increase; our belief that small form factor displays will be a critical component in the development of advanced wireless communications systems; our belief that wireless handset makers are looking to create products that complement or eventually replace wireless handsets; our belief that general technological advances in the design and fabrication of integrated circuits, LCD technology and LCD manufacturing processes will allow us to continue to enhance our display product manufacturing process; our belief that continued introduction of new products in our target markets is essential to our growth; our belief that our available cash resources will support our operations and capital needs for at least the next twelve months; our expectation that we will have taxes based on federal alternative minimum tax rules and on our foreign operations in 2016; our expectation that we will have a state tax provision in 2016; our expectation that the adoption of certain accounting standards will not have a material impact on our financial position or results of operations; our belief that our business is not disproportionately affected by climate change regulations; our belief that our operations have not been materially affected by inflation; and our belief that the effect, if any, of reasonably possible near-term changes in interest rates on our financial position, results of operations, and cash flows should not be material. These forward-looking statements are based on current expectations, estimates, forecasts and projections about the industries in which we operate, management's beliefs, and assumptions made by management. In addition, other written or oral statements, which constitute forward-looking statements, may be made by or on behalf of us.
2
Words such as “expects”, “anticipates”, “intends”, “plans”, “believes”, “could”, “seeks”, “estimates”, and variations of such words and similar expressions are intended to identify such forward-looking statements. These statements are not guarantees of future performance and involve certain risks, uncertainties and assumptions, which are difficult to predict. Therefore, actual outcomes and results may differ materially from what is expressed or forecasted in such forward-looking statements, whether as a result of new information, future events or otherwise. Factors that could cause or contribute to such differences in outcomes and results include, but are not limited to, those discussed below in Item 1A and those set forth in our other periodic filings filed with the Securities and Exchange Commission. Except as required by law, we do not intend to update any forward-looking statements even if new information becomes available or other events occur in the future.
Item 1. | Business |
Introduction
On January 16, 2013, we completed the sale of our III-V product line, including all of the outstanding equity interest in KTC Wireless, LLC (KTC), a wholly-owned subsidiary of the Company, to IQE KC, LLC (IQE) and IQE plc (Parent, and collectively with IQE, the Buyer). Upon agreement of the final working capital and other adjustments the net purchase price was $70.2 million, and the gain on the sale, net of tax, was $20.1 million. Under the terms of the Purchase Agreement, the final $15 million of the purchase price was paid on January 16, 2016. We have revised the prior period amounts in our consolidated financial statements for the impact of the sale of the III-V product line, which is reflected as discontinued operations.
We were incorporated in Delaware in 1984 and are a leading inventor, developer, manufacturer and seller of Wearable technologies which include components and systems.
The components that we offered for sale in 2015 consisted of our proprietary miniature active-matrix liquid crystal displays (AMLCD), liquid crystal on silicon (LCOS) displays, application specific integrated circuits (ASICs), backlights and optical lenses. In 2016, we also anticipate offering our proprietary noise cancellation chip which we refer to as “Whisper™ Chip". Our transmissive AMLCDs and reflective LCOS micro-displays are manufactured by us in our facilities in Westborough Massachusetts, USA and Dalgety Bay, Scotland, U.K, respectively, provide either color or monochrome images and are offered in a variety of sizes and resolutions. The ASICs we offer are designed by us and are the electronic interfaces between our displays and the product into which the displays are incorporated. The optical lenses and backlights we offer are based on either our proprietary designs or designs we license from third parties. Our licensed optical lenses are subject to agreements that have termination dates and are therefore subject to renewals. Our Whisper Chip was developed internally. The ASICs, optical lenses, and backlights are manufactured by third parties based on our purchased orders. The Whisper Chip is planned to be manufactured by third parties based on our purchase orders.
Our components are sold separately or in various configurations. For example, we offer a display module which includes an optical lens and backlight contained in either plastic or metal housings, a binocular display module which has two displays, lenses and backlight or a higher-level assembly which has additional components for military applications. Current products which include our components are augmented reality consumer wearable devices for sports and fitness, virtual reality consumer products such as First Person Viewers for recreational drones, consumer devices such as digital cameras; military soldier devices, such as thermal weapon sights, military pilot devices such as integrated flight helmets, and devices that are capable of accessing the Internet or digital storage devices for viewing data or video. When our reflective display products are configured as spatial light modulators, the applications include industrial equipment for 3D Automated Optical Inspection. We have sold our AMLCD products to Rockwell Collins, Elbit, Raytheon Company, DRS RSTA Inc., BAE Systems (directly and through a third party QiOptiq), and ITT for use in military applications, to Google for consumer wearable products, and to Samsung Electronics Co., Ltd. (Samsung), and Olympus Corporation (Olympus) for digital still cameras.
We have designed and offer systems that are focused on the emerging enterprise and consumer markets for head-worn, hands-free voice and gesture controlled wireless computing and communication devices. Our systems connect via Bluetooth or WiFi to a smartphone or similar device in order to access or transmit information from or to the internet or devices that are in close proximity. A unique feature of these systems is the ability to contact a resource, referred to as the “Remote Expert”, who can help in solving problems. The system user and the Remote Expert can be in different locations so while the system user may be in a hazardous outside location the Remote Expert may be in an in-house location. This allows companies that purchase enterprise systems the ability to leverage their in-house experts to the system technicians in the field. We currently license our systems under agreements which include a royalty to us and a purchase and supply agreement which requires our customer to buy our components for the system. These systems include our components and a variety of commercially available software packages and our proprietary software. Our business model is to license our concept systems to branded OEM customers who
3
wish to develop and market head-worn products for both mobile enterprise and consumer applications. We have licensed our wearable systems to Motorola Inc. and Fujitsu Limited for enterprise wearable systems.
In 2016, we anticipate offering Solos™, an augmented wearable headset designed for the consumer fitness market. Solos contains our display, optic, ASIC and Whisper Chip technologies. Solos is a hands-free head worn device which allows the user to access information either from the internet through a smartphone or from the various Bluetooth, WiFi or ANT+ enabled devices. For example, a cyclist user can see the information being provided by the bike computer such as speed or watts, can access the internet for GPS location or can access an internet training application.
For fiscal years 2015, 2014 and 2013, significant display customers are shown below. The caption “Military Customers in Total” in the table below excludes research and development contracts. We sell our displays to Japanese customers through Ryoden Trading Company. (“*” denotes that the customer's revenues were less than 10% of our total company revenues)
Percent of Total Revenues | ||||||
Customer | 2015 | 2014 | 2013 | |||
Military Customers in Total | 32% | 45% | 38% | |||
Raytheon Company | 18% | 26% | 14% | |||
Google Inc. | 22% | 11% | * | |||
Ryoden Trading Company | * | * | 18% | |||
U.S. Government funded research and development contracts | 3% | 4% | 10% | |||
Our fiscal year ends on the last Saturday in December. The fiscal years ended December 26, 2015, December 27, 2014, and December 28, 2013 are referred to herein as fiscal years 2015, 2014 and 2013, respectively. Our principal executive offices are located at 125 North Drive, Westborough, Massachusetts. Our telephone number is (508) 870-5959.
Industry Overview
Wearable Computing/Communicating
The amount of data being created is increasing at a historic rate. Billions of dollars worth of wireless devices, mainly smart phones and tablets, are sold annually to communicate, input, store and retrieve this data via the Internet. In addition thousands of software applications, “Apps”, are available which enable users to access this data to enable them to perform functions, play games, or improve the quality of their life such as setting-up personal wellness programs. A new category of “wearable” products, Smart Headsets, is emerging that provides access to data and these Apps, through the use of voice activate hands-free technology. This emerging category of Wearable systems can be used for hundreds of different applications by both enterprise workers and consumers, bringing ever-increasing productivity, fun and convenience. Through the use of Smart Headsets both workers and consumers can have access to their digital files, the Internet, phone, e-mail etc., enabling an “always connected” work-style and lifestyle. We believe that advances in wearables will continue to make the “always connected” life increasingly convenient and more productive by providing easier access to and control of the information accessible through our electronic devices.
Wearable products also include body-worn devices such as sensors, scanners and terminals which are sold to enterprise markets to improve worker productivity and the consumer market to monitor health and fitness metrics such as heart rate, speed and temperature. The user interface for these devices is typically either a key pad or a touch screen. Some Wearable products include voice recognition software as an additional feature to allow the user to navigate the device’s interface “hands-free” instead of using a traditional mouse, touch screen or keypad. We believe wireless smartphone makers are looking to create products that work as a complement to the smartphone or to eventually replace the smartphone with more convenient configurations. Wireless network companies are encouraging the development of more products that utilize their network capacity and other companies are developing products which provide continuous access to social media outlets. In order for the markets for these new products to develop, further advances in the devices and application software will be required. Device improvements include smaller higher resolution displays, lower power processors, longer-life batteries, compact optics and software including voice recognition and noise cancellation. In order for the market for these devices to grow, application software must be developed that exploit their new features and functions.
Our Solution
Kopin Wearable Technology
4
Kopin Wearable technology includes component technologies which can be integrated to create products and proprietary headset systems which use voice as the primary user interface and through the use of wireless technologies can contact other users, devices in close proximity or information from the cloud.
Components
The components we offer for sale primarily consist of our displays, backlights, ASICs and optical lenses. In 2016, we also anticipate offering our proprietary noise cancellation chip which we refer to as “Whisper Chip”.
Display Products
Small form factor displays are used in military, consumer, electronic and industrial products such as thermal weapon sights, digital cameras, virtual and augmented reality gaming, training and simulation products and metrology tools. We expect the market for wireless communications devices, including personal entertainment systems, will continue to grow. In order for these markets to develop, advances and investment in application software, optics and wireless communications systems with greater bandwidth and increased functionality will be necessary. We believe small form factor displays will be a critical component in the development of these markets as these systems must provide high resolution images without compromising the portability of the product.
There are several display technologies commercially available including transmissive, reflective and emissive. The most commonly used technology in portable applications is based on the traditional liquid crystal display, or LCD, which is now in widespread use. These displays form an image by either transmitting or reflecting light emitted from a source located either behind or in front of the LCD. The principal LCD technologies are passive and active matrix.
• | Passive Matrix Liquid Crystal Display. These displays are primarily used in calculators, simple watches and wireless handsets because of their relatively low cost and low power consumption. Their relatively low image quality, slow response time and limited viewing angle, however, make them inadequate for many demanding applications. |
• | Active Matrix Liquid Crystal Display. These displays are used primarily in wireless handsets, headsets, tablets, laptop computers, televisions and projection systems. In contrast to passive matrix LCDs, color active matrix LCDs incorporate transistors at every pixel location. This arrangement allows each sub-pixel to be turned on and off independently which improves image quality and response time and also provides an improved side-to-side viewing angle of the display. |
Our principal display products are miniature high density color or monochrome Active Matrix Liquid Crystal Displays (AMLCDs) with resolutions which range from approximately 320 x 240 resolution to 2048 x 2048 resolution sold in either a transmissive or reflective format. We sell our displays individually or in combination with our other components assembled in a unit. For example we sell a module unit which includes a single display, backlight and optics in a plastic housing, a binocular display module unit which includes two displays, backlights and optics in a plastic housing or in a Higher-Level Assembly (HLA) which contains a display, light emitting diode based illumination, optics, and electronics in a sealed housing, primarily for military applications.
Our transmissive display products, which we refer to as CyberDisplay™ products, utilize high quality, single crystal silicon-the same high quality silicon used in conventional integrated circuits. This single crystal silicon is not grown on glass; rather, it is first formed on a silicon wafer and patterned into an integrated circuit (including the active matrix, driver circuitry and other logic circuits) in an integrated circuit foundry. The silicon wafer is then sent to our facilities and the integrated circuit is lifted off as a thin film and transferred to glass using our proprietary Wafer™ Engineering technology, so that the transferred layer is a fully functional active matrix integrated circuit which now resides on a transparent substrate.
Our proprietary technology enables the production of transparent circuits on a transparent substrate, in contrast to conventional silicon circuits, which are on an opaque substrate. Our CyberDisplay products' imaging properties are a result of the inclusion of a liquid crystal layer between the active matrix integrated circuit glass and the transparent cover glass. We believe our manufacturing process offers several advantages over conventional active matrix LCD manufacturing approaches with regard to small form factor displays, including:
• | Greater miniaturization; |
• | Higher pixel density; |
• | Full color capability; and |
• | Lower power consumption. |
5
Our use of high quality single crystal silicon in the manufacture of our CyberDisplay products offers several performance advantages. The color CyberDisplay products we sell generate colors by using color filters with a white backlight. Color filter technology is a process in which display pixels are patterned with materials, which selectively absorb or transmit the red, green or blue colors of light.
Our CyberDisplay displays have the additional advantage of being fabricated using conventional silicon integrated circuit lithography processes. These processes enable the manufacture of miniature active matrix circuits, resulting in comparable or higher resolution displays relative to passive and other active matrix displays that are fabricated on glass. Our foundry partners fabricate integrated circuits for our CyberDisplay displays in their foundries in Taiwan and Korea. The fabricated wafers are then returned to our facilities, where we lift the integrated circuits off the silicon wafers and transfer them to glass using our proprietary technology. The transferred integrated circuits are then processed, packaged with liquid crystal and assembled into display panels at our Display Manufacturing Center in Westborough, Massachusetts.
For military applications which use our CyberDisplay, the display is fabricated, tested and incorporated into a HLA. We offer a variety of models with varying levels of complexity but common to all is our display, illuminations source, optics and electronics in a sealed unit.
Our reflective LCOS displays products are miniature high density dual mode color sequential/monochrome reflective micro displays with resolutions which range from approximately 1280 x 720 pixels (720P) resolution to 2048 x 1536 pixels (QXGA) resolution. These displays are manufactured at our facility in Scotland, U.K. Our reflective displays are based on a proprietary, very high-speed, ferroelectric liquid crystal on silicon (FLCOS) platform. Our digital software and logic based drive electronics combined with the very fast switching binary liquid crystal enables our micro display to process images purely digitally and create red, green and blue gray scale in the time domain. This architecture has major advantages in visual performance over other liquid crystal, organic light-emitting diode and MEMS based technologies: precisely controlled full color or monochrome gray scale is achieved on a matrix of undivided high fill factor pixels, motion artifacts are reduced to an insignificant level and there are no sub-pixels, no moving mirrors and no analog conversions to detract from the quality of the image.
The FLCOS device is comprised of two substrates. The first is a pixelated silicon-based CMOS substrate which is manufactured by our foundry partner using conventional silicon integrated circuit lithography processes. The silicon substrate forms the display's backplane, serving as both the active matrix to drive individual pixels and as a reflective mirror. The second substrate is a front glass plate. Between the backplane and the front glass substrate is the ferroelectric liquid crystal material which, when switched, enables the incoming illumination to be modulated.
Optical Lenses and Backlights
We offer a variety of optical lenses some of which we have developed internally and others we license the rights to sell the lenses. We also offer a variety of backlights some of which we have developed internally and are “off the shelf” components. The lenses come in a variety of sizes starting with the smallest being our Pupil lens, followed by our Pearl lenses and then our largest being our Prism lenses. The different sizes of lenses give us and our customers design flexibility when creating headset systems. There is a trade-off between the lens size and the size of the perceived image to the viewer. For example, a Pearl lens will provide the viewer with an image approximately equivalent to what the viewer would see looking at a Smart Phone, whereas as a Prism lens will provide the viewer with an image approximately equivalent to what the viewer would see looking at a tablet. However a Pearl lens is smaller than a Prism which would enable a more fashionable design. Therefore a customer designing a consumer-oriented product may choose a Pearl Lens but a customer designing an enterprise-oriented product might choose a Prism Lens. We use third parties to manufacture these lenses.
Whisper Chip
The Whisper Chip is designed to enhance the performance of existing audio systems and speech recognition engines by allowing the speaker’s voice to be clearly “heard” by the listener, whether the “listener” is a person or a machine. The Whisper chip incorporates our Voice Extraction™ Filter (VEF). VEF is a patented approach to singulating the voice signal without distorting it. The Whisper Chip is an all-digital solution that runs at 16MHz, consumes less than 12mW of power and replaces the CODEC so no ADC or DAC is needed. The Whisper Chip is 4 x 4 mm in size and accepts up to four (4) digital microphone inputs. We use third parties to manufacture the Whisper Chip.
Headset Systems
6
Our headset systems include:
• | Consumer-oriented headsets which resemble typical eyeglasses but include voice and audio capabilities allowing the user to communicate with other users and a Pupil display module; |
• | Augmented reality health and fitness sunglasses, called Solos, that have voice and audio capabilities, a Pupil display module which overlays situational information on the glasses, our Whisper Chip; and |
• | Industrial headset reference design, called Golden-i, which is essentially a complete head-worn computer that includes an optical pod with one of our display products, a microprocessor, battery, camera, memory and various commercially available software packages that we license. |
Our headsets receive or transmit data from or to the internet by interfacing with a Smartphone or similar device via WiFi or Bluetooth. They can also receive information from devices in close proximity using ANT+. The display module or optical pod allows users to view the information such as WEB data, emails, text messages, maps or biometric data (heart rate), situational data (speed, distance traveled, Watts produced) at a “normal” size because of our specialized optics. Our industrial headset Golden-i provides the capability of viewing technical diagrams, by enabling the user to zoom in to see finer details or zoom out to see a larger perspective. The Golden-i is equipped with a camera to enable a picture to be taken, video to be streamed or face-to-face communication to occur. The camera enables users to send pictures or stream live video to a remote subject matter expert so that both the user and expert can analyze an issue at the same time and collaboratively identify and implement a solution. Our headset reference designs utilize operating system software we developed.
We believe Kopin’s wearable technology will enable easier and more convenient access to the content individuals carry in their smartphones or “in the cloud” and will be embraced by both consumers and commercial users. For commercial users, we believe increased productivity, safety and improved manufacturing quality through more efficient issue resolution and improved communication will drive adoption. Kopin Wearable reference designs are targeted for markets where the user needs a much greater range of functionality than is typically provided by wireless devices such as handsets, smart phones, tablets or Bluetooth headsets and either due to the requirements of their usage patterns, occupation, or for improved productivity the user is better served with voice recognition as the primary interface as opposed to a touch screen or keyboard.
Strategy
Our commercial products strategy is to invent, develop, manufacture and sell the leading-edge critical components that enable our customers to create differentiated wearable products in their respective markets and to license wearable headset computing system designs to customers who wish to offer products that enable a better “always connected” experience. The core components we offer for sale are: displays and optics, along with headset system software and compact system designs. In 2016, we anticipate also offering our noise cancellation chip, Whisper. Our military strategy is to work with primarily the U.S. military to determine their program needs several years in the future and develop products which meet those needs. Our commercial business model is to enable our customers to move into the market quickly by either licensing our system designs and entering into agreements for the purchase and sale of our components or just selling our components separately. The critical elements of our strategy include:
• | Broad Portfolio of Intellectual Property. We believe that our extensive portfolio of patents, trade secrets and non-patented know-how provides us with a competitive advantage in the wearable computing industry and we have been accumulating, either by internal efforts or through acquisition, a significant patent and know-how portfolio. We own, exclusively license or have the sole right to sublicense approximately 300 patents and patent applications issued and pending worldwide. An important piece of our strategy is to continue to accumulate valuable patented and non-patented technical know-how relating to our micro displays as well as other critical technologies for advanced wearable services. |
• | Maintain Our Technological Leadership. We are a recognized leader in the design, development and manufacture of high resolution micro displays and modules which incorporate our micro displays with optics and ASICs. We plan on introducing noise canceling technology in 2016, which we anticipate marketing in our Whisper Chip. We believe our ability to develop components, software and noise canceling technology and innovative headset system designs enhances our opportunity to grow within our targeted markets. By continuing to invest in research and development, we are able to add to our expertise as a system and components supplier for our OEM customers, and we intend to continue to focus our development efforts on proprietary wearable computing systems. |
7
• | Develop Headset Systems. The Wearable device market is just beginning and part of our strategy is to develop headset systems which we will either sell directly or license to our customers in order to facilitate our customers’ design-in process of our components into their finished products. We believe our understanding of the needs associated with wearable headset systems and our customers’ products has been an important reason we have previously been successful in developing customer relationships.. We believe our system know-how is a compelling reason customers choose us as their supplier. |
• | Internally Manufactured Products and Use of Third Party Manufacturing. We manufacture our display products in facilities that we lease and manage. Our optical lenses, backlights and ASICs are manufactured by third parties who are only authorized to manufacture and to supply us. We plan on using third parties to manufacture and supply us with Whisper Chips. The use of these third party manufacturers reduces our investments in plant and equipment and working capital for new products and enables us to update designs as trends change. |
• | Strong U.S. Government Program Support. We perform under research and development contracts with U.S. government agencies, such as the U.S. Night Vision Laboratory and the U.S. Department of Defense. Under these contracts, the U.S. Government funds a portion of our efforts to develop next-generation micro-display related technologies. This enables us to supplement our internal research and development budget with additional funding. |
Markets and Customers
Wearable products
Our business model is to generate revenues by selling components to customers who develop and manufacture, or distribute, products based on our technology and licensing, for a royalty fee, our system designs and know-how, which includes the operating software and patented product designs, and to sell Solos directly. We may also receive development fees from customers to help them integrate our technology into their products. The licensing aspect of our business model is relatively new and to date the revenues have been de minimis and we anticipate offering Solos in 2016.
Display Products
We currently sell our display products to our customers in configurations including but not limited to as either a single display component, as a module which includes a display, lens, backlight and focus mechanism and electronics, a binocular display module which includes two displays, lenses, and backlights, and as higher level assemblies or HLA for military customers. A HLA is similar to a module but includes additional components such as an eye cup specific to a military application.
We have sold our AMLCD products to Rockwell Collins, Elbit, Raytheon Company, DRS RSTA Inc., BAE Systems (directly and through a third party QiOptiq), and ITT for use in military applications, to Google for consumer wearable products, and to Samsung Electronics Co., Ltd. (Samsung), and Olympus Corporation (Olympus) for digital still cameras. We have licensed our wearable systems to Motorola Inc. and Fujitsu Limited for enterprise wearable systems.
In order for our display products to function properly in their intended applications, ASICs generally are required. Several companies have designed ASICs to work with our display products and our customers can procure these chip sets directly from the manufacturer or through us.
For fiscal years 2015, 2014 and 2013, sales to military customers, excluding research and development contracts, as a percentage of total revenue were 32%, 45% and 38%, respectively.
For fiscal years 2015, 2014 and 2013, research and development revenues, primarily from multiple contracts with various U.S. governmental agencies, accounted for approximately 12%, 15% and 10%, respectively, of our total revenues.
For additional information with respect to our operating segments including sales and geographical information, see Note 15 to our financial statements for the year ended December 26, 2015, included with this Annual Report on Form 10-K.
Sales and Marketing
Our strategy is to sell our components both directly and through distributors to original equipment manufacturers. We sell our military display products directly to prime contractors of the U.S. government or to foreign companies. For our component products we historically have had a few customers who purchase in large volumes and many customers who buy in small
8
volumes as part of their product development efforts. “Large volume” is a relative term. For consumer display customers, purchases may be in the tens of thousands per week, whereas industrial and military customers may purchase less than a hundred per month. We plan on selling our Solos headset directly via the Internet and to license our other headset system designs to customers who will develop end user products that include our components and software. Other than Solos, our system designs are not finished products because we do not know the specific end user case that our customers are targeting. As a result there are typically additional development efforts which we work with our customers on and we may be reimbursed for these efforts.
We believe that the technical nature of our products and markets demands a commitment to close relationships with our customers. Our sales and marketing staff, assisted by our technical staff and senior management, visit prospective and existing customers worldwide on a regular basis. We believe these contacts are vital to the development of a close, long-term working relationship with our customers, and in obtaining regular forecasts, market updates and information regarding technical and market trends. We also participate in industry specific trade shows and conferences.
Our design and engineering staff are actively involved with customers during all phases of prototype design through production by providing engineering data, up-to-date product application notes, regular follow-up and technical assistance. In most cases, our technical staff work with each customer in the development stage to identify potential improvements to the design of the customer's product in parallel with the customer's effort. We have established a prototype product design group in Scotts Valley, California to assist our military product customers and in Santa Clara, California to assist our Whisper Chip product customers. These groups assist customers with incorporating our technologies and products into our customer's products and to accelerate the design process, achieving cost-effective and manufacturable products, and ensuring a smooth transition into high volume production. Our group in Scotts Valley is also actively involved with research and development contracts for military applications.
Product Development
We believe that continued introduction of new products in our target markets is essential to our growth. Our commercial products tend to have one to three year life cycles. We have assembled a group of highly skilled engineers who work internally as well as with our customers to continue our product development efforts. Our primary development efforts are focused on displays, noise cancellation, optics and headset system designs. For fiscal years 2015, 2014 and 2013 we incurred total research and development expenses of $17.6 million, $20.7 million and $17.5 million, respectively.
Component Products
Our display product development efforts are focused towards continually enhancing the resolution, performance and manufacturability of our display products. A principal focus of this effort is the improvement of manufacturing processes for very small active matrix pixels with our eight-inch manufacturing line. The pixel size of our current transmissive display products ranges from 6.8 to 15 microns. These pixel sizes are much smaller than a pixel size of approximately 100 microns in a typical laptop computer display. The resolutions of our current commercially available display products are 320 x 240, 432 x 240, 640x360, 640 x 480, 854 x 480, 800 x 600, 1,280 x 720 and 1,280 x 1,024. In addition, we have demonstrated 2,048 x 2,048 resolution displays in a 0.96-inch diagonal size. We are also working on further decreasing the power consumption of our display products. The pixel size of our current reflective display products ranges from 8.2 to 13.6 microns. The resolutions of our current commercially available reflective display products are 1,280 x 768, 1,280 x 1,024 and 2,048 x 1,536 pixels. Additional display development efforts include expanding the resolutions offered, increasing the quantity of display active matrix pixel arrays processed on each wafer by further reducing the display size, increasing the light throughput of our pixels, increasing manufacturing yields, and increasing the functionality of our HLA products.
We offer components such as our optical lenses, backlights and ASICs, which we have manufactured to our specifications, that we buy and resell. The components which are made to order include either intellectual property we developed or licensed from third parties.
Headset System Design Products
Our headset system efforts are primarily focused on operating and application software development, improving the optics in the display pod and reducing the size and power consumption of the unit and improving the overall fit and style of the system.
Funded Research and Development
9
We have entered into various development contracts with agencies and prime contractors of the U.S. government and commercial customers. These contracts help support the continued development of our core technologies. We intend to continue to pursue development contracts for applications that relate to our commercial and military product applications. Our contracts contain certain milestones relating to technology development and may be terminated prior to completion of funding. Our policy is to retain our proprietary rights with respect to the principal commercial applications of our technology however we are not always able to retain our proprietary rights. To the extent technology development has been funded by a U.S. federal agency, under applicable U.S. federal laws the federal agency has the right to obtain a non-exclusive, non-transferable, irrevocable, fully paid license to practice or have practiced this technology for governmental use. For our commercial development agreements customers often obtain exclusive rights to a particular display or technology that is developed either permanently or for some period of time. Revenues attributable to research and development contracts for fiscal years 2015, 2014 and 2013 totaled $3.9 million, $4.9 million and $2.3 million, respectively.
Competition
Component Products
The commercial display market is highly competitive and is currently dominated by large Asian-based electronics companies including AUO, Himax, LG Display, Samsung, Sharp, Seiko and Sony. The display market consists of multiple segments, each focusing on different end-user applications applying different technologies. Competition in the display field is based on price and performance characteristics, product quality and the ability to deliver products in a timely fashion. The success of our display product offerings will also depend upon the adoption of our display products by consumers as an alternative to traditional active matrix LCDs and upon our ability to compete against other types of well-established display products and new emerging display products. Particularly significant is the consumer's willingness to use a near eye display device, as opposed to a direct view display which may be viewed from a distance of several inches to several feet. We cannot be certain that we will be able to compete against these companies and technologies, or that the consumer will accept the use of such eyewear in general or our partners' form factor specifically.
There are also a number of active matrix LCD and alternative display technologies in development and production. These technologies include plasma, organic light emitting diode (OLEDs) and virtual retinal displays, some of which target the high performance small form factor display markets in which our military display products are sold. There are many large and small companies that manufacture or have in development products based on these technologies. Our display products will compete with other displays utilizing these and other competing display technologies.
There are many companies whose sole business is the development and manufacture of optical lenses, backlights, ASICs and software. These companies may have significantly more intellectual property and experience than we do in the design and development of these components. We do not manufacture optical lenses, backlights, or ASICs but we either have them made to our specifications or buy standard off-the-shelf products.
Headset Concept Design Products
The markets for our headset systems are targeted at currently used smartphones, laptop computers, personal computers, tablets, ruggedized portable computers referred to as "tough books”, and a variety of hand-held devices. This market is extremely competitive and is served by companies such as Panasonic, Toshiba, Dell, HTC, Hewlett Packard, Apple, Sony and Samsung. These companies are substantially larger than Kopin from revenue, cash flow and asset perspectives.
Patents, Proprietary Rights and Licenses
An important part of our product development strategy is to seek, when appropriate, protection for our products and proprietary technology through the use of various United States and foreign patents and contractual arrangements. We intend to prosecute and defend our proprietary technology aggressively. Many of our United States patents and applications have counterpart foreign patents, foreign applications or international applications through the Patent Cooperation Treaty. In addition, we have licensed United States patents and some foreign counterparts to these United States patents from MIT.
The process of seeking patent protection can be time consuming and expensive and we cannot be certain that patents will be issued from currently pending or future applications or that our existing patents or any new patents that may be issued will be sufficient in scope or strength to provide meaningful protection or any commercial advantage to us. We may be subject to or may initiate contested patent proceedings in the United States Patent and Trademark Office, foreign patent offices or the courts, which can demand significant financial and management resources. Patent applications in the United States typically are
10
maintained in secrecy until they are published about eighteen months after their earliest claim to priority; and since publication of discoveries in the scientific and patent literature lags behind actual discoveries, we cannot be certain that we were the first to conceive of inventions covered by pending patent applications or the first to file patent applications on such inventions. We cannot be certain that our pending patent applications or those of our licensor's will result in issued patents or that any issued patents will afford protection against a competitor. In addition, we cannot be certain that others will not obtain patents that we would need to license, circumvent or cease manufacturing and sales of products covered by these patents, nor can we be sure that licenses, if needed, would be available to us on favorable terms, if at all.
We cannot be certain that foreign intellectual property laws will protect our intellectual property rights or that others will not independently develop similar products, duplicate our products or design around any patents issued or licensed to us. Our products might infringe the patent rights of others, whether existing now or in the future. For the same reasons, the products of others could infringe our patent rights. We may be notified, from time to time, that we could be or we are infringing certain patents or other intellectual property rights of others. Litigation, which could be very costly and lead to substantial diversion of our resources, even if the outcome is favorable, may be necessary to enforce our patents or other intellectual property rights or to defend us against claimed infringement of the rights of others. These problems can be particularly severe in foreign countries. In the event of an adverse ruling in litigation against us for patent infringement, we might be required to discontinue the use of certain processes, cease the manufacture, use and sale of infringing products, expend significant resources to develop non-infringing technology or obtain licenses to patents of third parties covering the infringing technology. We cannot be certain that licenses will be obtainable on acceptable terms, if at all, or that damages for infringement will not be assessed or that litigation will not occur. The failure to obtain necessary licenses or other rights or litigation arising out of any such claims could adversely affect our ability to conduct our business as we presently conduct it.
We also attempt to protect our proprietary information with contractual arrangements and under trade secret laws. We believe that our future success will depend primarily upon the technical expertise, creative skills and management abilities of our officers and key employees in addition to patent ownership. Our employees and consultants generally enter into agreements containing provisions with respect to confidentiality and employees generally assign rights to us for inventions made by them while in our employ. Agreements with consultants generally provide that rights to inventions made by them while consulting for us will be assigned to us unless the assignment of rights is prohibited by the terms of any agreements with their regular employers. Agreements with employees, consultants and collaborators contain provisions intended to further protect the confidentiality of our proprietary information. To date, we have had no experience in enforcing these agreements. We cannot be certain that these agreements will not be breached or that we would have adequate remedies for any breaches. Our trade secrets may not be secure from discovery or independent development by competitors.
Government Regulations
We are subject to a variety of federal, state and local governmental regulations related to the use, storage, discharge and disposal of toxic, volatile or otherwise hazardous chemicals used in our manufacturing process. The failure to comply with present or future regulations could result in fines being imposed on us, suspension of production or cessation of operations. Any failure on our part to control the use of, or adequately restrict the discharge of, hazardous substances, or otherwise comply with environmental regulations, could subject us to significant future liabilities. In addition, we cannot be certain that we have not in the past violated applicable laws or regulations, which violations could result in required remediation or other liabilities. We also cannot be certain that past use or disposal of environmentally sensitive materials in conformity with then existing environmental laws and regulations will protect us from required remediation or other liabilities under current or future environmental laws or regulations.
We are also subject to federal International Traffic in Arms Regulations (ITAR) laws which regulate the export of technical data and export of products to other nations which may use these products for military purposes. The failure to comply with present or future regulations could result in fines being imposed on us, suspension of production, or a cessation of operations. Any failure on our part to control the use of, or adequately restrict the discharge of, hazardous substances, or otherwise comply with environmental regulations, could subject us to significant future liabilities. Any failure on our part to obtain any required licenses for the export of technical data and/or export of our products or to otherwise comply with ITAR, could subject us to significant future liabilities. In addition, we cannot be certain that we have not in the past violated applicable laws or regulations, which violations could result in required remediation or other liabilities.
We are also subject to federal importation laws which regulate the importation of raw materials and equipment from other nations which are used in our products. The failure to comply with present or future regulations could result in fines being imposed on us, suspension of production, or a cessation of operations.
11
Investments in Related Businesses
We own 100% of the outstanding common stock of Forth Dimension Displays Ltd. (FDD) and we consolidate the financial results of FDD within our consolidated financial statements.
In the fourth quarter of 2015, we increased our ownership in Kopin Software Ltd. (formerly Intoware Ltd.) from 58% to 100% and acquired 17.5% of a new company by paying GBP 1 to a former employee and transferring the rights of certain software programs to the new company. The former employee is a co-founder of the new company.
In 2015, we entered into an agreement with the intent to purchase approximately 2% of a company for approximately $2.5 million, subject to certain government approvals and agreement on valuation.
We had a 12% interest in KoBrite, and accounted for our ownership interest using the equity method. We recorded equity losses from our investment in KoBrite of $0.4 million and $0.6 million in fiscal years 2014 and 2013, respectively. During the second quarter of 2014, we wrote off our $1.3 million investment in Kobrite.
In 2013, we increased our ownership of Kowon Technology Co. LTD (Kowon) from 78% to 93% by purchasing stock from the minority stockholders for $3.7 million as part of a plan to cease Kowon’s operations. We closed Kowon’s manufacturing operations in 2013.
In 2013, we acquired 51% of the outstanding stock of eMDT America, Inc. (eMDT), a private company, for $0.4 million and began consolidating eMDT into our financial statements in the second quarter of that year. During the second quarter of 2014, we paid approximately $0.3 million to acquire an additional 29% ownership in eMDT.
We had a 23% interest in Ask Ziggy which we determined was impaired and we wrote off our investment in 2013.
On January 16, 2013, we completed the sale of our III-V product line, including all of our interest in Kopin Taiwan Corp (KTC). Previously we owned approximately 90% of KTC and consolidated the financial statements of KTC as part of our financial statements. The Buyer renamed KTC to IQE Taiwan. One of our Directors is a chairman of IQE Taiwan and owns approximately 1% of the outstanding common stock of IQE Taiwan.
We may from time to time make further equity investments in these and other companies engaged in certain aspects of the display, electronics, optical and software industries as part of our business strategy. In addition, the wearable computing product market is relatively new and there may be other technologies we need to invest in to enhance our product offering. These investments may not provide us with any financial return or other benefit and any losses by these companies or associated losses in our investments may negatively impact our operating results. Three of our Directors have invested in a publicly-held company in which we have invested. The investment is recorded on our consolidated balance sheet at approximately $200,000.
Employees
As of December 26, 2015, our consolidated business employed 175 full-time individuals and 1 part-time individual. Of these, 10 hold Ph.D. degrees in Material Science, Electrical Engineering or Physics. Our management and professional employees have significant prior experience in semiconductor materials, device transistor and display processing, manufacturing and other related technologies. However, our employees are located in the U.S., Europe and Asia and the laws regarding employee relationships are different by jurisdiction. None of our employees are covered by a collective bargaining agreement. We consider relations with our employees to be good.
Sources and Availability of Raw Materials and Components
We rely on third party independent contractors for certain integrated circuit chip sets and other critical raw materials such as special glasses, wafers and chemicals. In addition, our higher-level CyberDisplay assemblies, binocular display module, and other modules include lenses, backlights, printed circuit boards and other components that we purchase from third party suppliers. Some of these third party contractors and suppliers are small companies with limited financial resources. In addition, relative to the commercial market, the military buys a small number of units which prevents us from qualifying and buying
12
components economically from multiple vendors. As a result, we are highly dependent on a select number of third party contractors and suppliers.
In addition, we also are subject to rules promulgated by the Securities Exchange Commission (SEC) in 2012 pursuant to the Dodd-Frank Wall Street Reform and Consumer Protection Act of 2010 that require us to conduct due diligence on and disclose if we are able to determine whether certain materials (including tantalum, tin, gold and tungsten), known as conflict minerals, that originate from mines in the Democratic Republic of the Congo or certain adjoining countries (DRC), are used in our products. The DRC minerals report for a calendar year is due by the second quarter of the next calendar year and we are conducting appropriate diligence measures to comply with such requirements.
Web Availability
We make available free of charge through our website, www.kopin.com, our Annual Reports on Form 10-K and other reports that we file with the Securities and Exchange Commission, as well as certain of our corporate governance policies, including the charters for the Board of Directors' audit, compensation and nominating and corporate governance committees and our code of ethics, corporate governance guidelines and whistleblower policy. We will also provide to any person without charge, upon request, a copy of any of the foregoing materials. Any such request must be made in writing to us, c/o Investor Relations, Kopin Corporation, 125 North Drive, Westborough, MA, 01581.
Executive Officers of the Registrant
The following sets forth certain information with regard to our executive officers as of March 4, 2016 (ages are as of December 26, 2015):
John C.C. Fan, age 72 | Bor-Yeu Tsaur, age 60 | |||||
Ÿ | President, Chief Executive Officer and Chairman | Ÿ | Executive Vice President—Display Operations | |||
Ÿ | Founded Kopin in 1984 | Ÿ | Joined Kopin in 1997 | |||
Richard A. Sneider, age 55 | ||||||
Ÿ | Treasurer and Chief Financial Officer | |||||
Ÿ | Joined Kopin in 1998 | |||||
Hong Choi, age 64 | ||||||
Ÿ | Vice President and Chief Technology Officer | |||||
Ÿ | Joined Kopin in 2000 | |||||
Item 1A. | Risk Factors |
We have experienced a history of losses and have a significant accumulated deficit. In addition, we have had negative cash flow from operating activities in 2015 and 2014 and we expect to have negative cash flow from operating activities in 2016. Since inception, we have incurred significant net operating losses. As of December 26, 2015, we have an accumulated deficit of $190.6 million. At December 26, 2015 and December 27, 2014, we had $80.7 million and $90.9 million of cash and equivalents and marketable securities, respectively. The decline in our cash and equivalents and marketable securities is partially a result of our research and development investments in Wearable products. Our products are targeted towards the wearable market which we believe is still developing and we cannot predict how long the wearable market will take to develop or if our products will be accepted if the market is created. Accordingly, we believe it is important to continue to invest in research and development even during periods when we are not profitable. Our philosophy and strategies may result in our incurring losses from operations and negative cash flow.
The market segment for our Wearable products may not develop or may take longer to develop than we anticipate which may impact our ability to grow revenues. We have developed head-worn, voice and gesture controlled, hands-free cloud computing headset systems which we intend to license to customers and various components for wearable devices which we intend to sell to customers as either a part of the license arrangement or separately. We refer to our headset systems and components sold to customers for use in wearable applications as our Wearable products. Our success will depend on the
13
acceptance of wearable products by consumers and in particular the widespread adoption of the headset format. We are unable to predict when or if consumers will adopt wearable products. Customers may determine that the headset is not comfortable, weighs too much, costs too much or provides too little functionality. In addition, the wearable headset products may be accepted by consumers but Wearable product manufactures may choose to use our competitors products. Our success in commercializing our Wearable products is very important in our ability to achieve positive cash flow and profitability. If we are unable to commercialize our wearable computing products we may not be able to increase revenues, achieve profitability or positive cash flow.
Our revenues and cash flows could be negatively affected if sales of our Display products for military applications significantly decline. Over the last several years a primary source of our military revenues has been the sale of our display products to the military for use in thermal weapon sights. We expect the sale of our products for use in thermal weapon sights to decline due to competition and our belief that the government will procure fewer thermal weapon sights. We currently are in qualification for the Family Weapon Sight (FWS) programs, which we believe are the next significant government procurement programs that use our technology. We may not be awarded any of the FWS programs or we may only be awarded a portion of the program. Even if we are awarded the program we do not expect that the program will generate significant revenues in 2016. In addition the government could postpone or cancel the programs. Our ability to generate revenues and cash flow from sales to the U.S. military is dependent on our display products being qualified and remaining qualified in the FWS and other U.S. military programs and the U.S. military funding these programs. Our ability to generate revenues and cash flow from sales to the U.S. military is also dependent on winning contracts in competition against our competitors. If we are unable to be qualified into new U.S. military programs, remain qualified in existing programs, win orders against our competition or military programs are not funded our ability to generate revenues, achieve profitability and positive cash flow will be negatively impacted.
Our ability to manufacture and distribute our Display products would be severely limited if the foundries that we rely on to manufacture integrated circuits for our Display products fail to provide those services. We depend principally on a Taiwanese foundry for the fabrication of integrated circuits for our display products. We have no long-term contracts with this foundry and from time to time we have been put on allocation which means the foundry will limit the amount of wafers they will process for us. If the foundry was to terminate its arrangement with us or become unable to provide the required capacity and quality on a timely basis, we may not be able to manufacture and ship our display products or we may be forced to manufacture them in limited quantities until replacement foundry services can be obtained. Furthermore, we cannot assure investors that we would be able to establish alternative manufacturing and packaging relationships on acceptable terms.
Our reliance on this foundry involves certain risks, including but not limited to:
• | Lack of control over production capacity and delivery schedules; |
• | Limited control over quality assurance, manufacturing yields and production costs; |
• | The risks associated with international commerce, including unexpected changes in legal and regulatory requirements, changes in tariffs and trade policies and political and economic instability; and |
• | Natural disasters such as earthquakes, tsunami, mudslides, drought, hurricanes and tornadoes. |
Due to natural disasters such as earthquakes and typhoons that have occasionally occurred in Taiwan, many Taiwanese companies, including the Taiwanese foundry we use, have experienced related business interruptions. Our business could suffer significantly if either of the foundries we use had operations which were disrupted for an extended period of time due to natural disaster, political unrest or financial instability.
We depend on third parties to provide integrated circuit chip sets and critical raw materials for use with our headset systems and components and we periodically receive “end of life” notices from suppliers that they will no longer be providing a raw material. We do not manufacture the integrated circuit chip sets which are used to electronically interface between our display products and our customer's products. Instead, we rely on third party independent contractors for these integrated circuit chip sets. We purchase critical raw materials such as special glasses, special SOI wafers, adhesives, chemicals, lenses, backlights, printed circuit boards and other components from third party suppliers. Some of these third party contractors and suppliers are small companies with limited financial resources. In addition, relative to the commercial market, the military buys a small number of units which prevents us from qualifying and buying components economically from multiple vendors. We periodically receive notices from suppliers of our critical raw materials regarding their plans to to stop selling the raw materials. This requires us to identify another raw material and/or raw material supplier, to replace the discontinued item/supplier. We then have to internally re-qualify the product with the new material and we may be required to re-qualify the product with our customer. If any of these third party contractors or suppliers were unable or unwilling to supply these integrated circuit chip sets or critical raw materials to us, we would be unable to manufacture and sell our display products until a replacement material
14
could be found. We may not be able to find a replacement material or if we are able to find a replacement material we may be unable to sell our products until they have been qualified both internally and with the customer. The U.S. military is expected to reduce its purchases which may result in lower demand for our products. Lower volume purchases may make it uneconomical for some of our suppliers to provide raw materials we need. We cannot assure investors that a replacement third party contractor or supplier could be found on reasonable terms or in a timely manner. Any interruption in our ability to manufacture and distribute our display products could cause our display business to be unsuccessful and the value of investors' investment in us may decline.
The markets in which we operate are highly competitive and rapidly changing and we may be unable to compete successfully. There are a number of companies that develop or may develop products that compete in our targeted markets.
The individual components that we offer for sale (displays, optical lenses, backlights and ASICs) ) and plan to offer in 2016 (Whisper Chip) are also offered by companies whose sole business is the individual component. For example, there are companies whose sole business is to sell optical lenses. Accordingly, our strategy requires us to develop technologies and to compete in multiple markets. Some of our competitors are much larger than we are and have significantly greater financial, development and marketing resources than we do. The competition in these markets could adversely affect our operating results by reducing the volume of the products we sell or the prices we can charge. These competitors may be able to respond more rapidly than we can to new or emerging technologies or changes in customer requirements. They may also devote greater resources to the development, promotion and sale of their products than we do.
Our success will depend substantially upon our ability to enhance our products and technologies and to develop and introduce, on a timely and cost-effective basis, new products and features that meet changing customer requirements and incorporate technological enhancements. If we are unable to develop new products and enhance functionalities or technologies to adapt to these changes, our business will suffer.
Disruptions of our production of our Display products would adversely affect our operating results. If we were to experience any significant disruption in the operation of our facilities, we would be unable to supply our display products to our customers. Many of our sales contracts include financial penalties for late delivery. In the past, we experienced several power outages at our facilities which ranged in duration from one to four days. We have certain critical pieces of equipment necessary to operate the facility which are no longer offered for sale and we may not have service contracts or spare parts for the equipment. Additionally, as we introduce new equipment into our manufacturing processes, our display products could be subject to especially wide variations in manufacturing yields and efficiency. We may experience manufacturing problems that would result in delays in product introduction and delivery or yield fluctuations.
A disruption to our information technology systems could significantly impact our operations and impact our revenue and profitability. Our data processing systems are cloud based and hosted by a third party. We also use software packages which are no longer supported by their developer. An interruption to the third party systems or in the infrastructure which allows us to connect to the third party systems for an extended period may impact our ability to operate the businesses and process transactions which could result in a decline in sales and affect our ability to achieve or maintain profitability.
Our headset system is dependent on software which we have limited experience in developing, marketing or licensing. Our headset systems include a combination of commercially available software and operating and speech enhancement software that we internally developed or acquired. In addition we anticipate offering Whisper Chip in 2016 which is a chip that contains software developed by us. We have little experience in developing, marketing or licensing software. If we are unable to integrate internally developed and or acquired software in our headset system we may not be able to license the designs. The market demand for our headset systems or the products our customers may develop based on our head set systems is dependent on our ability to collaborate with software developers who write application software in order to create utility in our customer's products. If we are unable to develop, license or acquire software or if we or the market in general does not create a sufficient body of application software our systems may not be accepted by the market and we may not be able to increase revenues, achieve profitability or positive cash flow.
We license intellectual property rights of others. Included in our headset concept systems is software which we license from other companies. Should we violate the terms of a license, our license could be canceled. The companies may decide to stop supporting the software we license or new versions of the software may not be compatible with our software which would require us to rewrite our software which we may not be able to do. The license fees we pay may be increased which would negatively affect our ability to achieve profitability and positive cash flow. If we are unable to obtain and or maintain existing software license relationships our ability to grow revenue and achieve profitability and positive cash flow may be negative affected.
15
Our headset systems use software that we license from other companies (Licensors) and requires us to access the Licensor's data centers and interruptions or delays in service from data center hosting facilities could impair our customer's products. Any damage to, or failure of, the systems of our Licensors generally could result in interruptions in service to our customers. Interruptions in service to our customers may reduce our revenue, cause us to issue credits or pay penalties, cause customers to terminate their contracts and reduce our ability to attract new customers.
The market for cloud-based applications may develop more slowly than we expect. Our success will depend, to some extent, on the willingness of businesses to accept cloud-based services for applications that they view as critical to the success of their business. Many companies have invested substantial effort and financial resources to integrate traditional enterprise software into their businesses and may be reluctant or unwilling to switch to a different application or to migrate these applications to cloud-based services. Other factors that may affect market acceptance of our application include:
• | the security capabilities, reliability and availability of cloud-based services; |
• | our ability to implement upgrades and other changes to our software without disrupting our service; |
• | the level of customization or configuration we offer; and |
• | the price, performance and availability of competing products and services. |
The market for these services may not develop further, or may develop more slowly than we expect, either of which would negatively affect our ability to grow revenues, achieve profitability and generate positive cash flow.
We may not be successful in protecting our intellectual property and proprietary rights and we may incur substantial costs in defending our intellectual property. Our success depends in part on our ability to protect our intellectual property and proprietary rights. We have obtained certain domestic and foreign patents and we intend to continue to seek patents on our inventions when appropriate. We also attempt to protect our proprietary information with contractual arrangements and under trade secret laws. Our employees and consultants generally enter into agreements containing provisions with respect to confidentiality and the assignment of rights to us for inventions made by them while in our employ. These measures may not adequately protect our intellectual and proprietary rights. Existing trade secret, trademark and copyright laws afford only limited protection and our patents could be invalidated or circumvented. Moreover, the laws of certain foreign countries in which our products are or may be manufactured or sold may not fully protect our intellectual property rights. Misappropriation of our technology and the costs of defending our intellectual property rights from misappropriation could substantially impair our business. If we are unable to protect our intellectual property and proprietary rights, our business may not be successful and the value of investors' investment in us may decline.
Our products could infringe on the intellectual property rights of others. Companies in wearable computing and display industries steadfastly pursue and protect their intellectual property rights. This has resulted in considerable and costly litigation to determine the validity of patents and claims by third parties of infringement of patents or other intellectual property. Our products could be found to infringe on the intellectual property rights of others. Other companies may hold or obtain patents on inventions or other proprietary rights in technology necessary for our business. Periodically companies inquire about our products and technology in their attempts to assess whether we violate their intellectual property rights. If we are forced to defend against infringement claims, we may face costly litigation, diversion of technical and management personnel, and product shipment delays, even if the allegations of infringement are unwarranted. If there is one or more successful claims of infringement against us and we are unable to develop non-infringing technology or license the infringed or similar technology on a timely basis, or if we are required to cease using one or more of our business or product names due to a successful trademark infringement claim against us, our business could be adversely affected.
Our business could suffer if we lose the services of, or fail to attract, key personnel. In order to continue to provide quality products in our rapidly changing business, we believe it is important to retain personnel with experience and expertise relevant to our business. Our success depends in large part upon a number of key management and technical employees. The loss of the services of one or more key employees, including Dr. John C.C. Fan, our President and Chief Executive Officer, could seriously impede our success. We do not maintain any “key-man” insurance policies on Dr. Fan or any other employees. In addition, due to the level of technical and marketing expertise necessary to support our existing and new customers, our success will depend upon our ability to attract and retain highly skilled management, technical, and sales and marketing personnel. Competition for highly skilled personnel is intense and there may be only a limited number of persons with the requisite skills to serve in these positions. If the display markets experience an upturn, we may need to increase our workforce. Due to the competitive nature of the labor markets in which we operate, we may be unsuccessful in attracting and retaining these personnel. Our inability to attract and retain key personnel could adversely affect our ability to develop and manufacture our products.
16
Our customers who purchase display products for military applications typically incorporate our products into their products which are sold to the U.S. government under contracts. U.S. government contracts generally are not fully funded at inception and may be terminated or modified prior to completion, which could adversely affect our business. Congress funds the vast majority of the federal budget on an annual basis, and Congress often does not provide agencies with all the money requested in their budget. Many of our customers' contracts cover multiple years and, as such, are not fully funded at contract award. If Congress or a U.S. government agency chooses to spend money on other programs, our customer contracts may be terminated for convenience. Federal laws, collectively called the Anti-Deficiency Act, prohibit involving the government in any obligation to pay money before funds have been appropriated for that purpose, unless otherwise allowed by law. Therefore, the Anti-Deficiency Act indirectly regulates how the agency awards our contracts and pays our invoices. Federal government contracts generally contain provisions, and are subject to laws and regulations, that provide the federal government rights and remedies not typically found in commercial contracts, including provisions permitting the federal government to, among other provisions: terminate our existing contracts; modify some of the terms and conditions in our existing contracts; subject the award to protest or challenge by competitors; suspend work under existing multiple year contracts and related delivery orders; and claim rights in technologies and systems invented, developed or produced by us.
The federal government may terminate a contract with us or our customer either “for convenience” (for instance, due to a change in its perceived needs) or if we default due to our failure or the failure of a subcontractor to perform under the contract. If the federal government terminates a contract with our customer our contract with our customers generally would entitle us to recover only our incurred or committed costs, settlement expenses and profit on the work completed prior to termination. However, under certain circumstances, our recovery costs upon termination for convenience of such a contract may be limited. As is common with government contractors, we have experienced occasional performance issues under some of our contracts. We may in the future receive show-cause or cure notices under contracts that, if not addressed to the federal government's satisfaction, could give the government the right to terminate those contracts for default or to cease procuring our services under those contracts.
In addition, U.S. government contracts and subcontracts typically involve long purchase and payment cycles, competitive bidding, qualification requirements, delays or changes in funding, extensive specification and performance requirements, price negotiations and milestone requirements. Each U.S. government agency often also maintains its own rules and regulations with which we must comply and which can vary significantly among agencies.
Most of our military sales are on a fixed-price basis, which could subject us to losses if there are cost overruns. Under a fixed-price contract, we receive only the amount indicated in the contract, regardless of the actual cost to produce the goods. While firm fixed-price contracts allow us to benefit from potential cost savings, they also expose us to the risk of cost overruns. If the initial estimates that we use to calculate the sales price and the cost to perform the work prove to be incorrect, we could incur losses. In addition, some of our contracts have specific provisions relating to cost, scheduling, and performance. If we fail to meet the terms specified in those contracts, then our cost to perform the work could increase, which would adversely affect our financial position and results of operations. Some of the contracts we bid on have “Indefinite Delivery, Indefinite Quantity” or IDIQ provisions. This means we are bidding a fixed price but are not assured of the quantity the government will buy or when it will buy during the term of the contract. This means we are exposed to the risk of price increases for labor, overhead and raw materials during the term of the contract. We may incur losses on fixed-price and IDIQ contracts that we had expected to be profitable, or such contracts may be less profitable than expected, which could have a material adverse effect on our business, financial condition, results of operations, and cash flows.
We generally do not have long-term contracts with our customers, which makes forecasting our revenues and operating results difficult. We generally do not enter into long-term agreements with our customers obligating them to purchase our products. Our business is characterized by short-term purchase orders and shipment schedules and we generally permit orders to be canceled or rescheduled before shipment without significant penalty. As a result, our customers may cease purchasing our products at any time, which makes forecasting our revenues difficult. In addition, due to the absence of substantial non-cancelable backlog, we typically plan our production and inventory levels based on internal forecasts of customer demand, which are highly unpredictable and can fluctuate substantially. Our operating results are difficult to forecast because we are continuing to invest in capital equipment and increasing our operating expenses for new product development. If we fail to accurately forecast our revenues and operating results, our business may not be successful and the value of investors' investment in us may decline.
If we fail to keep pace with changing technologies, we may lose customers. Rapidly changing customer requirements, evolving technologies and industry standards characterize our industries. To achieve our goals, we need to enhance our existing products and develop and market new products that keep pace with continuing changes in industry standards, requirements and customer preferences. If we cannot keep pace with these changes, our business could suffer.
17
If our security systems are penetrated and confidential and or proprietary information were taken we could be subject to fines, law suits and loss of customers. We rely on our electronic information systems to perform the routine transactions to run our business. We transact business over the Internet with customers, vendors and our subsidiaries. We have implemented security measures to protect unauthorized access to this information. We have also implemented security policies which limit access via the Internet from the company to the outside world based on the individual's position in the company. We routinely receive security patches for the software we use from the software providers. Our primary concerns are inappropriate access to personnel information, information covered under the International Traffic in Arms Regulation, product designs and manufacturing information, financial information and our intellectual property, trade secrets and know-how. If our security systems are penetrated and confidential and or proprietary information were taken we could be subject to fines, law suits and loss of customers.
Fluctuations in operating results make financial forecasting difficult and could adversely affect the price of our common stock. Our quarterly and annual revenues and operating results may fluctuate significantly for numerous reasons, including:
• | The timing of the initial selection of our Wearable technology and display products as component in our customers' new products; |
• | Availability of interface electronics for our display products; |
• | Competitive pressures on selling prices of our products; |
• | The timing and cancellation of customer orders; |
• | Our ability to introduce new products and technologies on a timely basis; |
• | Our ability to successfully reduce costs; |
• | The cancellation of U.S. government contracts; and |
• | Our ability to secure agreements from our major customers for the purchase of our products. |
We typically plan our production and inventory levels based on internal forecasts of customer demand, which are highly unpredictable and can fluctuate substantially. Our operating results are difficult to forecast because the markets for our products are developing and we lack historical results from which to project demand.
As a result of these and other factors, investors should not rely on our revenues and our operating results for any one quarter or year as an indication of our future revenues or operating results. If our quarterly revenues or results of operations fall below expectations of investors or public market analysts, the price of our common stock could fall substantially.
If we fail to comply with complex procurement laws and regulations, we could lose business and be liable for various penalties or sanctions. We must comply with laws and regulations relating to the formation, administration and performance of federal government contracts. These laws and regulations affect how we conduct business with our federal government contracts. In complying with these laws and regulations, we may incur additional costs, and non-compliance may also allow for the assignment of fines and penalties, including contractual damages. Among the more significant laws and regulations affecting our business are the following:
• | The Federal Acquisition Regulation, which comprehensively regulates the formation, administration and performance of federal government contracts; |
• | The Truth in Negotiations Act, which requires certification and disclosure of all cost and pricing data in connection with contract negotiations; |
• | The Cost Accounting Standards and Cost Principles, which impose accounting requirements that govern our right to reimbursement under certain cost-based federal government contracts; and |
• | Laws, regulations and executive orders restricting the use and dissemination of information classified for national security purposes and the export of certain products, services and technical data. We engage in international work falling under the jurisdiction of U.S. export control laws. Failure to comply with these control regimes can lead to severe penalties, both civil and criminal, and can include debarment from contracting with the U.S. government. |
Our contracting agency customers may review our performance under and compliance with the terms of our federal government contracts. If a government review or investigation uncovers improper or illegal activities, we may be subject to civil or criminal penalties or administrative sanctions, including
• | Termination of contracts; |
• | Forfeiture of profits; |
• | Cost associated with triggering of price reduction clauses; |
• | Suspension of payments; |
•Fines; and
•Suspension or debarment from doing business with federal government agencies.
18
Additionally, the False Claims Act provides for potentially substantial civil penalties where, for example, a contractor presents a false or fraudulent claim to the government for payment or approval. Actions under the civil False Claims Act may be brought by the government or by other persons on behalf of the government (who may then share a portion of any recovery).
If we fail to comply with these laws and regulations, we may also suffer harm to our reputation, which could impair our ability to win awards of contracts in the future or receive renewals of existing contracts. If we are subject to civil and criminal penalties and administrative sanctions or suffer harm to our reputation, our current business, future prospects, financial condition, or operating results could be materially harmed.
The government may also revise its procurement practices or adopt new contracting rules and regulations, including cost accounting standards, at any time. Any new contracting methods could be costly to satisfy, be administratively difficult for us to implement and could impair our ability to obtain new contracts.
A decline in the U.S. government defense budget, changes in spending or budgetary priorities, prolonged U.S. government shutdown or delays in contract awards may significantly and adversely affect our future revenues, cash flow and financial results. The Budget Control Act of 2011 enacted 10-year discretionary spending caps which are expected to generate savings for the U.S. government, a substantial portion of which comes from Department of Defense baseline spending reductions. There remains much uncertainty about the level of cuts that will be required for government fiscal year 2016 and the impact those cuts will have on contractors supporting the government. In light of the current uncertainty, we are not able to predict the potential impact of reduced military expenditures on our Company or our financial results.
Customer demands and new regulations related to conflict-free minerals may adversely affect us. The Dodd-Frank Wall Street Reform and Consumer Protection Act (the “Act”) imposes new disclosure requirements regarding the use of “conflict” minerals mined from the Democratic Republic of Congo and adjoining countries in products, whether or not these products are manufactured by third parties. These new requirements could affect the pricing, sourcing and availability of minerals used in the manufacture of semiconductor devices (including our products). We will incur additional costs associated with complying with the disclosure requirements, such as costs related to determining the source of any conflict minerals used in our products. Our supply chain is complex and we may be unable to verify the origins for all metals used in our products. We purchase materials from foreign sources and they may not cooperate and provide us with the necessary information to allow us to comply with the Act. This may require us to find alternative sources which could delay product shipments. We may also encounter challenges with our customers and stockholders if we are unable to certify that our products are conflict free.
We may incur significant liabilities if we fail to comply with stringent environmental laws and regulations and the International Traffic in Arms Regulations (ITAR) or if we did not comply with these regulations in the past. We are subject to a variety of federal, state and local governmental regulations related to the use, storage, discharge and disposal of toxic or otherwise hazardous chemicals used in our manufacturing process. We are also subject to federal ITAR laws which regulate the export of technical data and export of products to other nations which may use these products for military purposes. The failure to comply with present or future regulations could result in fines being imposed on us, suspension of production, or a cessation of operations. Any failure on our part to control the use of, or adequately restrict the discharge of, hazardous substances, or otherwise comply with environmental regulations, could subject us to significant future liabilities. Any failure on our part to obtain any required licenses for the export of technical data and/or export of our products or to otherwise comply with ITAR, could subject us to significant future liabilities. In addition, we cannot be certain that we have not in the past violated applicable laws or regulations, which violations could result in required remediation or other liabilities. We also cannot be certain that past use or disposal of environmentally sensitive materials in conformity with then existing environmental laws and regulations will protect us from required remediation or other liabilities under current or future environmental laws or regulations.
We may be unable to modify our products to meet regulatory or customer requirements. From time to time our display products are subject to new domestic and international requirements such as the European Union's Restriction on Hazardous Substances (RoHS) Directive. Our customers are requiring that we are in compliance with “all laws” in their terms and conditions. If we are unable to comply with these regulations we may not be permitted to ship our products, which would adversely affect our revenue and ability to maintain profitability. In addition if we are found to be in violation of laws we may be subject to fines and penalties.
19
We may pursue acquisitions and investments that could adversely affect our business. In the past we have made, and in the future we may make, acquisitions of, and investments in, businesses, products and technologies that could complement or expand our business. If we identify an acquisition candidate, we may not be able to successfully integrate the acquired businesses, products or technologies into our existing business and products. Future acquisitions could result in potentially dilutive issuances of equity securities, the incurrence of debt and contingent liabilities, amortization expenses and write-downs of acquired assets. In 2014, 2012 and 2011 we acquired 29% of the outstanding shares of eMDT Inc. for 80% ownership, 58% of the outstanding shares of Kopin Software Ltd. (formerly Intoware Ltd.) and 100% of the outstanding shares of Forth Dimension Displays Ltd. (FDD), respectively. In 2015 we increased our ownership of Kopin Software Ltd. to 100%. If we are unable to operate eMDT, Kopin Software Ltd. and FDD profitably, our results of operations will be negatively affected. We perform periodic reviews to determine if these investments are impaired, but such reviews are difficult and rely on significant judgment about the company’s technology, ability to obtain customers, and ability to become cash flow positive and profitable. We may take future impairment charges which will have an adverse impact of on our results of operations.
Investors should not expect to receive dividends from us. We have not paid cash dividends in the past, however, in the future we may determine it is in the best interest of the stockholders to do so. Historically our earnings, if any, have been retained for the development of our businesses.
Our stock price may be volatile in the future. The trading price of our common stock has been subject to wide fluctuations in response to quarter-to-quarter variations in results of operations, announcements of technological innovations or new products by us or our competitors, general conditions in the wireless communications, semiconductor and display markets, changes in earnings estimates by analysts or other events or factors. In addition, the public stock markets recently have experienced extreme price and trading volatility. This volatility has significantly affected the market prices of securities of many technology companies for reasons frequently unrelated to the operating performance of the specific companies. These broad market fluctuations may adversely affect the market price of our common stock.
Item 1B. | Unresolved Staff Comments |
None.
Item 2. | Properties |
We lease our 74,000 square foot production facility in Westborough, Massachusetts, of which 10,000 square feet is contiguous environmentally controlled production clean rooms operated between Class 10 and Class 1,000 levels. The lease expires in 2023. In addition to our Massachusetts facility, we lease a 5,800 square foot design facility in Scotts Valley, California for developing prototypes of products incorporating our CyberDisplay product and a 6,300 square foot facility in Santa Clara, California which houses our wearable computing Tech center and ASIC development. These facility leases expire in 2018 and 2016, respectively.
Our subsidiary Kowon Technology Co., LTD, (Kowon) owns two adjacent facilities in Kyungii-Do, South Korea, in which it manufactured its products and in which its corporate headquarters are located. These facilities occupy an aggregate of 28,000 square feet. Production ceased at the Kowon facility in 2013. Forth Dimension Displays, our subsidiary in Scotland, leases 20,000 square feet in Dalgety Bay. This facility’s lease expires in 2016. Kopin Software Ltd., our subsidiary in the United Kingdom, leases two properties which occupy an aggregate of 7,000 square feet. These leases expire in 2016 and 2017.
At this time we believe these properties are suitable for our needs for the foreseeable future.
Item 3. | Legal Proceedings |
We may engage in legal proceedings arising in the ordinary course of business. Claims, suits, investigations and proceedings are inherently uncertain and it is not possible to predict the ultimate outcome of such matters and our business, financial condition, results of operations or cash flows could be affected in any particular period.
Item 4. | Mine Safety Disclosures |
Not applicable.
20
Part II
Item 5. Market for Registrant's Common Equity, Related Stockholder Matters and Issuer Purchases of Equity Securities.
Our common stock is traded on the NASDAQ Global Market under the symbol “KOPN.” The following table sets forth, for the quarters indicated, the range of high and low sale prices for the Company’s common stock as reported on the NASDAQ Global Market for the periods indicated.
High | Low | ||||||
Fiscal Year Ended December 26, 2015 | |||||||
First Quarter | $ | 4.36 | $ | 3.37 | |||
Second Quarter | 3.77 | 3.30 | |||||
Third Quarter | 3.45 | 2.60 | |||||
Fourth Quarter | 3.18 | 2.67 | |||||
Fiscal Year Ended December 27, 2014 | |||||||
First Quarter | $ | 4.49 | $ | 3.56 | |||
Second Quarter | 3.82 | 2.92 | |||||
Third Quarter | 4.32 | 3.03 | |||||
Fourth Quarter | 3.80 | 3.10 | |||||
As of February 26, 2016, there were approximately 396 stockholders of record of our common stock, which does not reflect those shares held beneficially or those shares held in “street” name.
In the past three years we have not sold any securities which were not registered under the Securities Act.
We have not paid cash dividends in the past, nor do we expect to pay cash dividends for the foreseeable future. We anticipate that earnings, if any, will be retained for the development of our businesses.
Equity Compensation Plan Information
The following table sets forth information as of December 26, 2015 about shares of the Company’s common stock issuable upon exercise of outstanding options, warrants and rights and available for issuance under our existing equity compensation plans.
Plan Category | Number of securities to be issued upon exercise of outstanding options, warrants and rights (a) | Weighted-average exercise price of outstanding options, warrants and rights | Number of securities remaining available for future issuance under equity compensation plans (excluding securities reflected in column a) | |||||||
Total equity compensation plans approved by security holders (1) | — | $ | — | 2,232,758 | (2) | |||||
(1) | Consists of the 2010 Equity Incentive Plan. |
(2) | Shares available under the 2010 Equity Incentive Plan. |
21
Company Stock Performance
The following graph shows a five-year comparison of cumulative total shareholder return for the Company, the NASDAQ US Benchmark TR Index and the S&P 500 Information Technology index. The graph assumes $100 was invested in each of the Company’s common stock, the NASDAQ US Benchmark TR Index and the S&P 500 Information Technology index on December 25, 2010. Data points on the graph are annual. Note that historical price performance is not necessarily indicative of future performance.
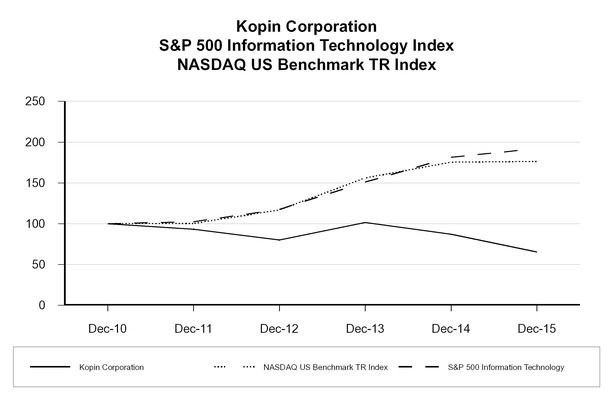
22
Item 6. | Selected Financial Data |
This information should be read in conjunction with our consolidated financial statements and notes thereto, and our “Management’s Discussion and Analysis of Financial Condition and Results of Operations” in Item 7 of this Annual Report on Form 10-K. We have revised the prior period amounts for the sale of the III-V product line, which is reflected as discontinued operations.
Fiscal Year Ended | |||||||||||||||||||
2015 | 2014 | 2013 | 2012 | 2011 | |||||||||||||||
(in thousands, except per share data) | |||||||||||||||||||
Statement of Operations Data: | |||||||||||||||||||
Revenues: | |||||||||||||||||||
Net component revenues | $ | 28,163 | $ | 26,957 | $ | 20,575 | $ | 31,299 | $ | 59,509 | |||||||||
Research and development revenues | 3,891 | 4,851 | 2,323 | 3,343 | 5,150 | ||||||||||||||
Total revenues | 32,054 | 31,808 | 22,898 | 34,642 | 64,659 | ||||||||||||||
Expenses: | |||||||||||||||||||
Cost of component revenues | 21,610 | 19,638 | 20,655 | 22,042 | 34,659 | ||||||||||||||
Research and development—funded programs | 3,006 | 5,237 | 1,551 | 2,178 | 3,341 | ||||||||||||||
Research and development—internal | 14,625 | 15,499 | 15,983 | 12,121 | 13,218 | ||||||||||||||
Selling, general and administrative | 18,135 | 19,909 | 19,125 | 17,166 | 15,991 | ||||||||||||||
Impairment of intangible assets and goodwill | — | — | 1,511 | 1,705 | 5,000 | ||||||||||||||
57,376 | 60,283 | 58,825 | 55,212 | 72,209 | |||||||||||||||
Loss from operations | (25,322 | ) | (28,475 | ) | (35,927 | ) | (20,570 | ) | (7,550 | ) | |||||||||
Other income and (expense): | |||||||||||||||||||
Interest income | 758 | 966 | 1,119 | 1,126 | 1,291 | ||||||||||||||
Other income and (expense), net | 128 | 271 | 235 | 174 | 143 | ||||||||||||||
Foreign currency transaction gains (losses) | 408 | 92 | (387 | ) | (1,032 | ) | 10 | ||||||||||||
Impairment of investments | — | (1,319 | ) | (5,000 | ) | — | — | ||||||||||||
Loss on remeasurement of investment in Kopin Software Ltd. | — | — | — | (558 | ) | — | |||||||||||||
Other-than-temporary impairment of marketable debt securities | — | — | — | — | (151 | ) | |||||||||||||
Gain on sales of investments | 9,207 | — | 1,899 | 856 | 369 | ||||||||||||||
Gain on sales of patents | — | — | — | — | 156 | ||||||||||||||
10,501 | 10 | (2,134 | ) | 566 | 1,818 | ||||||||||||||
Loss before benefit (provision) for income taxes, equity losses in unconsolidated affiliates and net loss (income) of noncontrolling interest | (14,821 | ) | (28,465 | ) | (38,061 | ) | (20,004 | ) | (5,732 | ) | |||||||||
Tax benefit (provision) | 25 | 180 | 12,933 | (1,099 | ) | — | |||||||||||||
Loss before equity losses in unconsolidated affiliates and net loss (income) of noncontrolling interest | (14,796 | ) | (28,285 | ) | (25,128 | ) | (21,103 | ) | (5,732 | ) | |||||||||
Equity losses in unconsolidated affiliates | (47 | ) | (386 | ) | (625 | ) | (680 | ) | (297 | ) | |||||||||
Loss from continuing operations | $ | (14,843 | ) | $ | (28,671 | ) | $ | (25,753 | ) | $ | (21,783 | ) | $ | (6,029 | ) | ||||
Income from discontinued operations, net of tax | — | — | 20,147 | 2,789 | 9,713 | ||||||||||||||
Net (loss) income | (14,843 | ) | (28,671 | ) | (5,606 | ) | (18,994 | ) | 3,684 | ||||||||||
23
Net loss (income) attributable to the noncontrolling interest | 150 | 459 | 896 | 632 | (605 | ) | |||||||||||||
Net (loss) income attributable to the controlling interest | $ | (14,693 | ) | $ | (28,212 | ) | $ | (4,710 | ) | $ | (18,362 | ) | $ | 3,079 | |||||
Net (loss) income per share: | |||||||||||||||||||
Basic: | |||||||||||||||||||
Continuing operations | $ | (0.23 | ) | $ | (0.45 | ) | $ | (0.40 | ) | $ | (0.33 | ) | $ | (0.10 | ) | ||||
Discontinued operations | — | — | 0.32 | 0.04 | 0.15 | ||||||||||||||
Net (loss) income per share: | $ | (0.23 | ) | $ | (0.45 | ) | $ | (0.08 | ) | $ | (0.29 | ) | $ | 0.05 | |||||
Diluted: | |||||||||||||||||||
Continuing operations | $ | (0.23 | ) | $ | (0.45 | ) | $ | (0.40 | ) | $ | (0.33 | ) | $ | (0.10 | ) | ||||
Discontinued operations | — | — | 0.32 | 0.04 | 0.15 | ||||||||||||||
Net (loss) income per share: | $ | (0.23 | ) | $ | (0.45 | ) | $ | (0.08 | ) | $ | (0.29 | ) | $ | 0.05 | |||||
Weighted average number of common shares outstanding: | |||||||||||||||||||
Basic | 63,466 | 62,639 | 62,348 | 63,618 | 64,406 | ||||||||||||||
Diluted | 63,466 | 62,639 | 62,348 | 63,618 | 65,234 | ||||||||||||||
Fiscal Year Ended | |||||||||||||||||||
2015 | 2014 | 2013 | 2012 | 2011 | |||||||||||||||
Balance Sheet Data: | |||||||||||||||||||
Cash and equivalents and marketable debt securities | $ | 80,711 | $ | 90,859 | $ | 112,729 | $ | 92,485 | $ | 105,419 | |||||||||
Working capital | 89,879 | 86,682 | 108,369 | 106,791 | 123,257 | ||||||||||||||
Total assets | 106,060 | 122,941 | 146,132 | 176,209 | 193,872 | ||||||||||||||
Long-term obligations | 298 | 311 | 329 | 946 | 1,296 | ||||||||||||||
Total stockholders’ equity | 94,741 | 109,847 | 134,563 | 155,086 | 170,097 | ||||||||||||||
24
Item 7. | Management’s Discussion and Analysis of Financial Condition and Results of Operations |
The following discussion should be read in conjunction with our consolidated financial statements and notes to those statements and other financial information appearing elsewhere in this Annual Report on Form 10-K. The following discussion contains forward looking information that involves risks and uncertainties. Our actual results could differ materially from those anticipated in the forward looking statements as a result of a number of factors, including the risks discussed in Item 1A “Risk Factors”, and elsewhere in this Annual Report on Form 10-K.
Management's discussion and analysis of our financial condition and results of operations are based upon our audited consolidated financial statements. The preparation of these financial statements requires us to make estimates and judgments that affect the reported amount of assets, liabilities, revenues and expenses and related disclosure of contingent assets and liabilities. On an on-going basis, we evaluate our estimates, including those related to revenue recognition under the percentage-of-completion method, bad debts, inventories, warranty reserves, investment valuations, valuation of stock compensation awards, recoverability of deferred tax assets, liabilities for uncertain tax positions and contingencies. We base our estimates on historical experience and on various other assumptions that are believed to be reasonable under the circumstances, the results of which form the basis for making judgments about carrying values of assets and liabilities that are not apparent from other sources. Actual results may differ from these estimates under different assumptions.
The prior period amounts have been revised for the impact of discontinued operations due to the sale of our III-V product line, including our KTC subsidiary. Our financial results for prior periods have also been revised, in accordance with U.S. GAAP, to reflect certain changes to the business and other matters.
We believe the following critical accounting policies are most affected by our more significant judgments and estimates used in the preparation of our consolidated financial statements:
Revenue Recognition
We recognize revenue if four basic criteria have been met: (1) persuasive evidence of an arrangement exists; (2) delivery has occurred and services rendered; (3) the price to the buyer is fixed or determinable; and (4) collectability is reasonably assured. We do not recognize revenue for products prior to customer acceptance unless we believe the product meets all customer specifications and has a history of consistently achieving customer acceptance of the product. Provisions for product returns and allowances are recorded in the same period as the related revenues. We analyze historical returns, current economic trends and changes in customer demand and acceptance of product when evaluating the adequacy of sales returns and other allowances. Certain product sales are made to distributors under agreements allowing for a limited right of return on unsold products. Sales to distributors are primarily made for sales to the distributors' customers and not for stocking of inventory. We delay revenue recognition for our estimate of distributor claims of right of return on unsold products based upon our historical experience with our products and specific analysis of amounts subject to return based upon discussions with our distributors or their customers.
We recognize revenues from long-term research and development government contracts on the percentage-of-completion method of accounting as work is performed, based upon the ratio of costs or hours already incurred to the estimated total cost of completion or hours of work to be performed. Revenue recognized at any point in time is limited to the amount funded by the U.S. government or contracting entity. We recognize revenue for product development and research contracts that have established prices for distinct phases when delivery and acceptance of the deliverable for each phase has occurred. In some instances, we are contracted to create a deliverable which is anticipated to go into full production. In those cases, we discontinue the percentage-of-completion method after formal qualification of the deliverable has been completed and revenue is then recognized based on the criteria established for sale of products. In certain instances qualification may be achieved and delivery of production units may commence however our customer may have either identified new issues to be resolved or wish to incorporate a newer display technology. In these circumstances new units delivered will continue to be accounted for under the criteria established for sale of products. Under certain of our research and development contracts, we recognize revenue using a milestone methodology. This revenue is recognized when we achieve specified milestones based on our past performance.
We classify amounts earned on contracts in progress that are in excess of amounts billed as unbilled receivables and we classify amounts received in excess of amounts earned as billings in excess of revenues earned. We invoice based on dates specified in the related agreement or in periodic installments based upon our invoicing cycle. We recognize the entire amount of an estimated ultimate loss in our financial statements at the time the loss on a contract becomes known.
Accounting for design, development and production contracts requires judgment relative to assessing risks, estimating contract revenues and costs, and making assumptions for schedule and technical issues. Due to the size and nature of the work
25
required to be performed on many of our contracts, the estimation of total revenue and cost at completion is complicated and subject to many variables. Contract costs include material, labor and subcontracting costs, as well as an allocation of indirect costs. We have to make assumptions regarding the number of labor hours required to complete a task, the complexity of the work to be performed, the availability and cost of materials, and performance by our subcontractors. For contract change orders, claims or similar items, we apply judgment in estimating the amounts and assessing the potential for realization. These amounts are only included in contract value when they can be reliably estimated and realization is considered probable. We have accounting policies in place to address these as well as other contractual and business arrangements to properly account for long-term contracts. If our estimate of total contract costs or our determination of whether the customer agrees that a milestone is achieved is incorrect, our revenue could be overstated and profits would be negatively impacted.
Bad Debt
We maintain allowances for doubtful accounts for estimated losses resulting from the inability of our customers to make required payments. This estimate is based on an analysis of specific customer creditworthiness and historical bad debts experience. If the financial condition of our customers were to deteriorate, resulting in their inability to make future payments, additional allowances may be required.
Inventory
We provide a reserve for estimated obsolete or unmarketable inventory based on assumptions about future demand and market conditions and our production plans. Inventories that are obsolete or slow moving are generally fully reserved (representing the estimated net realizable value) as such information becomes available. Our display products are manufactured based upon production plans whose critical assumptions include non-binding demand forecasts provided by our customers, lead times for raw materials, lead times for wafer foundries to perform circuit processing and yields. If a customer were to cancel an order or actual demand was lower than forecasted demand, we may not be able to sell the excess display inventory and additional reserves would be required. If we were unable to sell the excess inventory, we would establish reserves to reduce the inventory to its estimated realizable value (generally zero).
Investment Valuation
We periodically make equity investments in private companies, accounted for on the cost or equity method, whose values are difficult to determine. When assessing investments in private companies for an other-than-temporary decline in value, we consider such factors as, among other things, the share price from the investee's latest financing round, the performance of the investee in relation to its own operating targets and its business plan, the investee's revenue and cost trends, the liquidity and cash position, including its cash burn rate and market acceptance of the investee's products and services. Because these are private companies which we do not control we may not be able to obtain all of the information we would want in order to make a complete assessment of the investment on a timely basis. Accordingly, our estimates may be revised if other information becomes available at a later date.
In addition to the above we make investments in government and agency-backed securities and corporate debt securities. For all of our investments we provide for an impairment valuation if we believe a decline in the value of an investment is other-than-temporary, which may have an adverse impact on our results of operations. The determination of whether a decline in value is other-than-temporary requires that we estimate the cash flows we expect to receive from the security. We use publicly available information such as credit ratings and financial information of the entity that issued the security in the development of our expectation of the cash flows to be received. Historically, we have periodically recorded other than temporary impairment losses.
Product Warranty
We generally sell products with a limited warranty of product quality and a limited indemnification of customers against intellectual property infringement claims related to our products. We accrue for known warranty and indemnification issues if a loss is probable and can be reasonably estimated. As of December 26, 2015, we had a warranty reserve of $0.5 million, which represents the estimated liabilities for warranty claims in process, potential warranty issues customers have notified us about and an estimate based on historical failure rates. For the fiscal years 2015, 2014 and 2013, our warranty claims and reversals were approximately $0.8 million, $0.4 million and $0.8 million, respectively. If our estimates for warranty claims are incorrect, our profits would be impacted.
Income Taxes
We have historically incurred domestic operating losses from both a financial reporting and tax return standpoint. We establish valuation allowances if it appears more likely than not that our deferred tax assets will not be realized. These
26
judgments are based on our projections of taxable income and the amount and timing of our tax operating loss carryforwards and other deferred tax assets. Given our federal operating tax loss carryforwards, we do not expect to pay domestic federal taxes in the near term. It is possible that we could pay domestic alternative minimum taxes and state income taxes. We are also subject to foreign taxes from our Korean and U.K. subsidiary operations.
Our income tax provision is based on calculations and assumptions that will be subject to examination by tax authorities. Despite our history of operating losses there can be exposures for state taxes, federal alternative minimum taxes or foreign tax that may be due. We regularly assess the potential outcomes of these examinations and any future examinations for the current or prior years in determining the adequacy of our provision for income taxes. Should the actual results differ from our estimates, we would have to adjust the income tax provision in the period in which the facts that give rise to the revision become known. Such adjustment could have a material impact on our results of operations. We have historically established valuation allowances against all of our net deferred tax assets because of our history of generating operating losses and restrictions on the use of certain items. Our evaluation of the recoverability of deferred tax assets has also included analysis of the expiration dates of net operating loss carryforwards. In forming our conclusions as to whether the deferred tax assets are more likely than not to be realized we consider the sources of our income and the projected stability of those sources and product life cycles.
Stock Compensation
There were no stock options granted in fiscal years 2015, 2014 or 2013. The fair value of nonvested restricted common stock awards is generally the market value of the Company's equity shares on the date of grant. The nonvested common stock awards require the employee to fulfill certain obligations, including remaining employed by the Company for certain periods of time (the vesting period) and in certain cases meeting performance or market criteria. The performance or market criteria may consist of the achievement of the Company's annual incentive plan goals, technology development or the Company’s stock attaining a certain price for a period of time. For nonvested restricted common stock awards which solely require the recipient to remain employed with the Company, the stock compensation expense is amortized over the anticipated service period. For nonvested restricted common stock awards which require the achievement of performance criteria, the Company reviews the probability of achieving the performance goals on a periodic basis. If the Company determines that it is probable that the performance criteria will be achieved, the amount of compensation cost derived for the performance goal is amortized over the service period. If the performance criteria are not met, no compensation cost is recognized and any previously recognized compensation cost is reversed. The Company recognizes compensation costs on a straight-line basis over the requisite service period for time vested awards. For awards that vest upon our stock price achieving a certain price for a period of time the compensation expense associated with this award is recognized over the derived service period.
Results of Operations
On January 16, 2013, we completed the sale of our III-V product line, including all of the outstanding equity interest in KTC Wireless, LLC (KTC) a wholly-owned subsidiary of the Company, to IQE KC, LLC (IQE) and IQE plc (Parent, and collectively with IQE, the Buyer). The aggregate purchase price was approximately $70.2 million, after certain adjustments, including working capital adjustments. The gain on the sale, net of tax, was $20.1 million. Under the terms of the purchase agreement, $55 million was paid to us in January 2013, $0.2 million was paid in April 2013 and the remaining $15 million was paid on January 15, 2016.
We are a leading developer, manufacturer and seller of miniature displays, optical lenses, ASICs (our “components”) and software for integration into wearable products and for sale as individual components. We use our proprietary semiconductor material technology to design, manufacture and market our component products for use in highly demanding high-resolution portable military, enterprise and consumer electronic applications, training and simulation equipment and 3D metrology equipment. Our products enable our customers to develop and market an improved generation of products for these target applications.
We have two principal sources of revenues: component revenues and research and development revenues. Research and development revenues consist primarily of development contracts with agencies or prime contractors of the U.S. government and commercial enterprises. Research and development revenues were $3.9 million, or 12.1% of total 2015 revenues, $4.9 million, or 15.3% of total 2014 revenues and $2.3 million, or 10.0% of total 2013 revenues.
We manufacture transmissive microdisplays and reflective microdisplays. Our commercial and military transmissive display production is being performed entirely in our Westborough, Massachusetts facility. Forth Dimension Displays (FDD),
27
our wholly-owned subsidiary, manufactures our reflective micro-displays in its facility located in Scotland and it is a reportable segment.
Because our fiscal year ends on the last Saturday of December every seven years we have a fiscal year with 53 weeks. Our fiscal years 2015, 2014 and 2013 were all 52 week years.
Fiscal Year 2015 Compared to Fiscal Year 2014
Revenues. Our revenues, which include product sales and amounts earned from research and development contracts, for fiscal years 2015 and 2014, by category, were as follows:
Revenues by Category (in millions) | 2015 | 2014 | |||||
Military Applications | $ | 10.2 | $ | 14.3 | |||
Wearable Applications | 12.3 | 6.2 | |||||
Industrial Applications | 4.0 | 3.7 | |||||
Consumer Applications | 1.7 | 2.8 | |||||
Research & Development | 3.9 | 4.8 | |||||
Total | $ | 32.1 | $ | 31.8 | |||
Sales of our products for military applications decreased in 2015 because of a decrease in demand from the U.S. government, primarily for our products used in thermal weapon sights.
We offer headworn, voice and gesture controlled, hands-free systems for consumer and enterprise applications that include our microdisplay, optics, and software that can connect to data sources through the use of Wi-Fi, Bluetooth or ANT+. In 2016 we anticipate offering a speech enhancement technology we refer to as the Whisper Chip. We refer to the various technologies we have developed as Kopin Wearable technologies. Our Kopin Wearable technologies encompass both component and software technologies. The component technologies include our displays, optical lenses, application specific integrated circuits (ASICs), backlights and ergonomic designs. The software technology includes but is not limited to voice and gesture control, noise cancellation, and operating systems. Our strategy is to license the headset concept systems and sell the various components included in the reference design as a group and also sell the components individually. Some of the technologies included in our concept systems are components and software which we license from other companies. We believe our ability to develop and expand the Kopin Wearable technologies and to market and license our concept systems and components will be critical for us to achieve revenue growth, positive cash flow and profitability. The markets the Kopin Wearable technologies can be used in already have a number of existing product offerings such as ruggedized lap-top computers and tablets and companies such as Intel and Oculus are offering headset systems. The companies that offer these products are significantly larger than we are. The increase in revenues from the Wearables category primarily increased from sales of our component products to customers who are developing new products for this category. Additional orders to us from these customers will be dependent on how successful our customers are in marketing their products.
The increase in sales of our product for Industrial applications in 2015 as compared to 2014 is the result of an increase in sales of our products to manufacturers of 3D metrology equipment. Our 3D metrology customers are primarily located in Asia, and Chinese contract manufactures represent a significant market for 3D metrology equipment. Accordingly, sales of 3D metrology equipment are tied to the strength of the Chinese manufacturing sector.
The decrease in the Consumer Applications is the result of a decrease in sales of our products for use in digital still cameras (DSCs). We believe the overall market for DSCs has been declining due to an increase in use of cameras in smartphones. We expect revenues from this category to continue to further decline in 2016. The decrease in Research and Development revenues is the result a decrease in funding from the U.S. government partially offset by an increase in funding by customers to develop wearable technologies.
International sales represented 32% and 38% of product revenues for fiscal years 2015 and 2014, respectively. Our international sales are primarily denominated in U.S. currency. Consequently, a strengthening of the U.S. dollar could increase the price in local currencies of our products in foreign markets and make our products relatively more expensive than competitors' products that are denominated in local currencies, leading to a reduction in sales or profitability in those foreign markets. In addition, our Korean subsidiary, Kowon, holds U.S. dollars in order to pay various expenses. As a result, our financial position and results of operations are subject to exchange rate fluctuation in transactional and functional currency. We have not taken any protective measures against exchange rate fluctuations, such as purchasing hedging instruments with respect to such fluctuations, because of the historically stable exchange rate between the Japanese yen, Korean won and the U.S. dollar.
28
Cost of Component Revenues.
2015 | 2014 | ||||||
Cost of component revenues (in millions) | $ | 21.6 | $ | 19.6 | |||
Cost of component revenues as a % of net component revenues | 76.7 | % | 72.9 | % | |||
Cost of component revenues, which is comprised of materials, labor and manufacturing overhead related to the production of our products increased as a percentage of revenues in 2015 as compared to 2014 due to a decrease in the sale of our display products for military applications, which have higher margins than our other products.
Research and Development.
(in millions) | 2015 | 2014 | |||||
Funded | $ | 3.0 | $ | 5.2 | |||
Internal | 14.6 | 15.5 | |||||
Total | $ | 17.6 | $ | 20.7 | |||
Research and development (R&D) expenses are incurred in support of internal display development programs or programs funded by agencies or prime contractors of the U.S. government and commercial partners. In fiscal year 2016, our R&D expenditures will be related to our display products, over lay weapon sights and Kopin Wearable technologies. R&D revenues associated with funded programs are presented separately in revenue in the statement of operations. R&D costs include staffing, purchases of materials and laboratory supplies, circuit design costs, fabrication and packaging of display products, and overhead.
Funded R&D expense for 2015 decreased as compared to the prior year due to a reduction in programs with customers developing products for Wearable Applications. The decrease occurred because the customers either discontinued the programs or the products moved into the commercialization phase.
Selling, General and Administrative. Selling, general and administrative (S,G&A) expenses consist of the expenses incurred by our sales and marketing personnel and related expenses, and administrative and general corporate expenses.
2015 | 2014 | ||||||
Selling, general and administrative expense (in millions) | $ | 18.1 | $ | 19.9 | |||
Selling, general and administrative expense as a % of revenues | 56.6 | % | 62.6 | % | |||
The decrease in S,G&A expenses in 2015 as compared to 2014 is primarily attributable to a decrease in deferred compensation expense, professional fees and intangible amortization partially offset by an increase in patent expense.
Other Income and Expense.
(in millions) | 2015 | 2014 | |||||
Interest income | $ | 0.8 | $ | 0.9 | |||
Other income and expense, net | 0.1 | 0.3 | |||||
Foreign currency transaction gains | 0.4 | 0.1 | |||||
Subtotal | 1.3 | 1.3 | |||||
Gain on sales of investments | 9.2 | — | |||||
Impairment of investments | — | (1.3 | ) | ||||
Other income and expense | $ | 10.5 | $ | — | |||
Other income and expense, net, as shown above, is composed of interest income, foreign currency transactions and remeasurement gains and losses incurred by our Korean and United Kingdom subsidiaries, gains on sales of investments and the impairment of cost based investments. For 2015, we recorded $0.4 million of foreign currency gains as compared to $0.1 million foreign currency gains for 2014. This was primarily attributable to increased fluctuations in the U.S. dollar and Korean won currency exchange rate. In 2015, we recorded a gain on the sale of investments of $9.2 million consisting of gains from the
29
sale of investments in Vuzix and Recon of $3.7 million and $5.5 million, respectively. In 2014, we recorded an impairment of $1.3 million related to the write-off of our equity investment in KoBrite.
Equity losses in unconsolidated affiliates. Our equity losses in unconsolidated affiliates for 2014 consists of our approximate 12% share of the losses of KoBrite for the first quarter of 2014, incurred prior to writing our investment down to zero in the second quarter. During the twelve months ended December 27, 2014, we funded the operations of one of our investments. The impact of this funding for the twelve month periods ended December 27, 2014 was approximately $0.3 million.
Tax provision. The benefit for income taxes for the fiscal year ended 2015 of $25,000 represents the net of state tax and foreign withholding tax related to closing our Korean facilities. For 2016, we expect to have movement in the foreign withholding tax relating to conversion rate changes. We also expect to have a state tax provision in 2016.
Net (income) loss attributable to noncontrolling interest. We own approximately 93% of the equity of Kowon and 80% of the equity of eMDT. In the fourth quarter of 2015, we increased our investment in Kopin Software Ltd. from 58% to 100%. Net loss attributable to noncontrolling interest on our consolidated statement of operations represents the portion of the results of operations of our majority owned subsidiaries which is allocated to the shareholders of the equity interests not owned by us. The change in net loss attributable to noncontrolling interest is the result of the change in the results of operations of Kowon, and eMDT for the twelve month period ended December 26, 2015 and for the period of time during 2015 when we owned 58% of Kopin Software Ltd.
(in millions) | 2015 | 2014 | |||||
Kopin Software Ltd. | $ | 0.1 | $ | 0.3 | |||
eMDT | — | 0.1 | |||||
Total | $ | 0.1 | $ | 0.4 | |||
Fiscal Year 2014 Compared to Fiscal Year 2013
Revenues. Our revenues, which include product sales and amounts earned from research and development contracts, for fiscal years 2014 and 2013, by category, were as follows:
Revenues by Category (in millions) | 2014 | 2013 | |||||
Military Applications | $ | 14.3 | $ | 8.6 | |||
Wearable Applications | 6.2 | 4.3 | |||||
Industrial Applications | 3.7 | 2.4 | |||||
Consumer Electronic Applications | 2.8 | 5.3 | |||||
Research & Development | 4.8 | 2.3 | |||||
Total | $ | 31.8 | $ | 22.9 | |||
Sales of our products for military applications increased in 2014 because of an increase in demand from the U.S. government. In the beginning of 2014 we expected military revenues to decline due to a decrease in demand from a military customer who had decided to source displays from a competitor. In the second quarter of 2014 we received additional orders from this military customer because of issues with the displays offered by our competitor. This resulted in additional military revenues for us in the third and fourth quarter of 2014.
The decrease in the Consumer Applications is the result of a decrease in sales of our products for use in digital still cameras (DSCs). We believe the overall market for DSCs has been declining due to an increase in use of cameras in smartphones. We expect revenues from this category to continue to further decline in 2015.The increase in Wearable Applications revenues in 2014 as compared to 2013 is a result of both an increase in sales to existing customers and obtaining new customers. Wearable Applications represents sales of our components for products for use in head mounted computing systems for other than military applications. The increase in Research and Development revenues is the result of funding by customers to develop wearable technologies partially offset by a decrease in funding from the U.S. government.
We offer headworn, voice and gesture controlled, hands-free cloud computing concept systems for consumer and enterprise applications that have an optical pod with our microdisplay and uses Windows CE or Android software. We refer to the various technologies we have developed as Kopin Wearable technologies. Our Kopin Wearable technologies encompass both component and software and technologies. The component technologies include our displays, optical lenses, application specific integrated circuits (ASICs), backlights and ergonomic designs. The software technology includes but is not limited to
30
voice and gesture control, noise cancellation, Android and Windows CE based operating systems and web browsing. Our strategy is to license the headset concept systems and sell the various components included in the reference design as a group and also sell the components individually. Some of the technologies included in our concept systems are components and software which we license from other companies. We believe our ability to develop and expand the Kopin Wearable technologies and to market and license our concept systems and components will be critical for us to achieve revenue growth, positive cash flow and profitability. The markets the Kopin Wearable technologies can be used in already have a number of existing product offerings such as ruggedized lap-top computers and tablets. The companies that offer these products are significantly larger than we are.
International sales represented 38% and 48% of product revenues for fiscal years 2014 and 2013, respectively. Our international sales are primarily denominated in U.S. currency. Consequently, a strengthening of the U.S. dollar could increase the price in local currencies of our products in foreign markets and make our products relatively more expensive than competitors' products that are denominated in local currencies, leading to a reduction in sales or profitability in those foreign markets. In addition, our Korean subsidiary, Kowon, holds U.S. dollars in order to pay various expenses. As a result, our financial position and results of operations are subject to exchange rate fluctuation in transactional and functional currency. We have not taken any protective measures against exchange rate fluctuations, such as purchasing hedging instruments with respect to such fluctuations, because of the historically stable exchange rate between the Japanese yen, Korean won and the U.S. dollar.
Cost of Product Revenues.
2014 | 2013 | ||||||
Cost of component revenues (in millions) | $ | 19.6 | $ | 20.7 | |||
Cost of product revenues as a % of revenues | 72.9 | % | 100.4 | % | |||
Cost of component revenues, which is comprised of materials, labor and manufacturing overhead related to the production of our products decreased as a percentage of revenues in 2014 as compared to 2013 due to an increase in the sale of our display products for military applications and the usage of certain raw materials used in military programs that were previously written-off as excess but were used in the 2014 production. In 2013, we compared forecasted demand for our military programs against inventory on-hand and provided reserves for estimated excess inventory. In the second quarter of 2014, we received additional orders for military products and we have been using the inventory reserved as excess in the fulfillment of the orders. In addition, military products historically have higher gross margins than commercial products.
Research and Development.
(in millions) | 2014 | 2013 | |||||
Funded | $ | 5.2 | $ | 1.5 | |||
Internal | 15.5 | 16.0 | |||||
Total | $ | 20.7 | $ | 17.5 | |||
Research and development (R&D) expenses are incurred in support of internal display development programs or programs funded by agencies or prime contractors of the U.S. government and commercial partners. In fiscal year 2015 our R&D expenditures will be related to our display products, over lay weapon sights and Kopin Wearable technologies. R&D revenues associated with funded programs are presented separately in revenue in the statement of operations. R&D costs include staffing, purchases of materials and laboratory supplies, circuit design costs, fabrication and packaging of display products, and overhead.
R&D expense increased in 2014 as compared to the prior year primarily because of investments made to develop our wearable technologies and develop manufacturing and quality control processes, including display development and software costs, partially offset by a decrease in government funded product development.
Selling, General and Administrative. Selling, general and administrative (S,G&A) expenses consist of the expenses incurred by our sales and marketing personnel and related expenses, and administrative and general corporate expenses.
2014 | 2013 | ||||||
Selling, general and administrative expense (in millions) | $ | 19.9 | $ | 19.1 | |||
Selling, general and administrative expense as a % of revenues | 62.6 | % | 82.3 | % | |||
31
The increase in S,G&A expenses in 2015 as compared to 2014 is primarily attributable to increase in compensation expense partially offset by a decline in public relations expense.
Impairment. In 2013, we performed an impairment analysis of our finite-lived intangible assets related to FDD and Kopin Software Ltd. We performed our analysis of our finite-lived intangible assets based on the income approach. As a result we recorded a non-cash charge of $1.5 million to write down FDD's finite-lived intangible assets.
(in millions) | Intangible Assets |
As of December 31, 2011 | $1.9 |
Amortization | (0.3) |
Foreign currency translation | 0.1 |
As of December 29, 2012 | $1.7 |
Amortization | (0.4) |
Impairment of goodwill | (1.2) |
Foreign currency translation | 0.1 |
As of December 28, 2013 | $0.2 |
Amortization | (0.2) |
As of December 27, 2014 | $— |
Other Income and Expense.
(in millions) | 2014 | 2013 | |||||
Interest income | $ | 0.9 | $ | 1.1 | |||
Other income and expense, net | 0.3 | 0.3 | |||||
Foreign currency transaction losses | 0.1 | (0.4 | ) | ||||
Subtotal | 1.3 | 1.0 | |||||
Gain on sales of investments | — | 1.9 | |||||
Impairment of investments | $ | (1.3 | ) | (5.0 | ) | ||
Other income and expense | $ | — | $ | (2.1 | ) | ||
Other income and expense, net, as shown above, is composed of interest income, foreign currency transactions and remeasurement gains and losses incurred by our Korean and United Kingdom subsidiaries, gains on sales of investments and license fees and the impairment of cost based investments. For 2014, we recorded $0.1 million of foreign currency gains as compared to $0.4 million foreign currency losses for 2013. This was primarily attributable to increased fluctuations in the U.S. dollar and Korean won currency exchange rate. In 2014 we recorded an impairment of $1.3 million related to the write-off of our equity investment in KoBrite. In 2013, we recorded a $5.0 million impairment charge for two cost basis investments due their experiencing liquidity issues.
As our marketable debt securities have matured we have been reinvesting in securities which, due to current interest rates and shorter maturities, have lower yields than the securities which matured. As a result of these factors and our cash usage rate we anticipate that our interest income will decline in 2015.
Equity losses in unconsolidated affiliates. Our equity losses in unconsolidated affiliates for 2014 consists of our approximate 12% share of the losses of KoBrite for the first quarter of 2014, incurred prior to writing our investment down to zero in the second quarter. During the twelve months ended December 27, 2014, we funded the operations of one of our investments. The impact of this funding for the twelve month periods ended December 27, 2014 was approximately $0.3 million. Our equity losses in unconsolidated affiliates for 2013 consists of our approximate 23% share of the losses of Ask Ziggy, totaling $0.2 million, and our approximate 12% share of the losses of KoBrite totaling $0.4 million.
Tax provision. The benefit for income taxes for the fiscal year ended 2014 of $0.2 million represents the net of state tax and foreign withholding tax related to closing our Korean facilities.
Net (income) loss attributable to noncontrolling interest. We own approximately 93% of the equity of Kowon, 58% of the equity of Kopin Software Ltd, and 80% of the equity of eMDT. Net loss attributable to noncontrolling interest on our
32
consolidated statement of operations represents the portion of the results of operations of our majority owned subsidiaries which is allocated to the shareholders of the equity interests not owned by us. The change in net loss attributable to noncontrolling interest is the result of the change in the results of operations of Kowon, Kopin Software Ltd and eMDT for the twelve month period ended December 27, 2014.
2014 | 2013 | ||||||
Kopin Software Ltd. | $ | 0.3 | $ | 0.5 | |||
eMDT | 0.1 | 0.3 | |||||
Kowon | — | $ | 0.1 | ||||
Total | $ | 0.4 | $ | 0.9 | |||
Liquidity and Capital Resources
As of December 26, 2015, we had cash and equivalents and marketable debt securities of $80.7 million and working capital of $89.9 million compared to $90.9 million and $86.7 million, respectively, as of December 27, 2014. The change in cash and equivalents and marketable securities was primarily due to cash used in operating activities of $17.1 million and the repurchase of our common stock for withholding tax purposes of $1.1 million which was partially offset by the sale of investments of $9.2 million.
As of December 27, 2014, we had cash and equivalents and marketable debt securities of $90.9 million and working capital of $86.7 million compared to $112.7 million and $108.4 million, respectively, as of December 28, 2013. The change in cash and equivalents and marketable securities was primarily due to cash used in operating activities of $19.6 million and the repurchase of our common stock of $0.3 million.
On January 15, 2016, we received the $15 million note receivable which was the final payment associated with the sale of our III-V product line and investment in Kopin Taiwan Corporation.
Cash and marketable debt securities held in U.S. dollars at December 26, 2015 were:
Domestic | $ | 68,793,347 | |
Foreign | 10,418,827 | ||
Subtotal cash and marketable debt securities | 79,212,174 | ||
Cash and marketable debt securities held in other currencies and converted to U.S. dollars | 1,498,606 | ||
Total cash and marketable debt securities | $ | 80,710,780 | |
We have no plans to repatriate the cash and marketable debt securities held in our foreign subsidiaries FDD and Kopin Software Ltd. and as such we have not recorded any deferred tax liability. In 2013, we ceased operations at our Korean facility, Kowon. Kowon has approximately $11.5 million of cash and marketable debt securities which we anticipate will eventually be remitted to the U.S. and accordingly we have recorded deferred tax liabilities associated with its unremitted earnings.
We lease facilities located in Westborough, Massachusetts, Santa Clara, California and Scotts Valley, California, under non-cancelable operating leases. The Westborough lease expires in 2023, the Santa Clara lease expires in 2016 and the Scotts Valley lease expires in February 2018.
We lease a facility in Dalgety Bay, Scotland which expires in 2016, and also lease two facilities in Nottingham, United Kingdom, which expire in 2016 and 2017.
We expect to expend between $2.0 million and $3.0 million on capital expenditures over the next twelve months, primarily for the acquisition of equipment to support some of our production and research facilities.
In 2015, we entered into an agreement with the intent to purchase approximately 2% of a company for approximately $2.5 million, subject to certain government approvals and agreement on valuation.
As of December 26, 2015, we had substantial tax loss carry-forwards, which may be used to offset future federal taxes due. We may record a tax provision in our financial statements but we may be able to offset some or all of the amounts that are payable with our tax loss carry-forwards. We may be subject to alternative minimum taxes, foreign taxes and state income taxes depending on our taxable income and sources of taxable income.
33
Historically we have financed our operations primarily through public and private placements of our equity securities. Over the past several years we have used our cash and marketable securities on hand to fund the business. We believe our available cash resources will support our operations and capital needs for at least the next twelve months.
Off-Balance Sheet Arrangements
We have no off-balance sheet arrangements.
Seasonality
Our revenues have not followed a seasonal pattern for the past two years and we do not anticipate any seasonal trend to our revenues in 2016.
Climate Change
We do not believe there is anything unique to our business which would result in climate change regulations having a disproportional effect on us as compared to U.S. industry overall.
Inflation
We do not believe our operations have been materially affected by inflation in the last three fiscal years.
Contractual Obligations
The following is a summary of our contractual payment obligations for operating leases as of December 26, 2015:
Contractual Obligations | Total | Less than 1 year | 1-3 Years | 3-5 years | More than 5 years | ||||||||||||||
Operating Lease Obligations | $ | 5,331,000 | $ | 1,097,000 | $ | 2,105,000 | $ | 1,916,000 | $ | 213,000 | |||||||||
Item 7A. | Quantitative and Qualitative Disclosures About Market Risk |
We invest our excess cash in high-quality U.S. government, government-backed (Fannie Mae, FDIC guaranteed bonds and certificates of deposit) and corporate debt instruments, which bear lower levels of relative risk. We believe that the effect, if any, of reasonably possible near-term changes in interest rates on our financial position, results of operations and cash flows should not be material to our cash flows or income. It is possible that interest rate movements would increase our unrecognized gain or loss on interest rate securities.
We are exposed to changes in foreign currency exchange rates primarily through our translation of our foreign subsidiary’s financial positions, results of operations, and transaction gains and losses as a result of non-U.S. dollar denominated cash flows related to business activities in Asia and the United Kingdom, and remeasurement of U.S. dollars to the functional currency of our foreign subsidiaries. We are also exposed to the effects of exchange rates in the purchase of certain raw materials whose price is in U.S. dollars but the price on future purchases is subject to change based on the relationship of the Japanese Yen to the U.S. dollar. We do not currently hedge our foreign currency exchange rate risk. We estimate that any market risk associated with our international operations is unlikely to have a material adverse effect on our business, financial condition or results of operation. Our portfolio of marketable debt securities is subject to interest rate risk although our intent is to hold securities until maturity. The credit rating of our investments may be affected by the underlying financial health of the guarantors of our investments. We use Silicon wafers but do not enter into forward or futures hedging contracts.
Item 8. | Financial Statements and Supplementary Data |
The financial statements required by this Item are included in this Report on pages 45 through 68. Reference is made to Item 15 of this Report.
Item 9. | Changes in and Disagreements with Accountants on Accounting and Financial Disclosure |
Not applicable.
34
Item 9A. | Controls and Procedures |
Evaluation of Disclosure Controls and Procedures
We conducted an evaluation of the effectiveness of the design and operation of our “disclosure controls and procedures” (Disclosure Controls), as defined in Rules 13a-15(e) and 15d-15(e) under the Exchange Act, as of December 26, 2015. The controls evaluation was conducted under the supervision and with the participation of management, including our Chief Executive Officer and Chief Financial Officer. Disclosure Controls are controls and procedures designed to reasonably assure that information required to be disclosed in our reports filed under the Exchange Act, such as this Form 10-K, is recorded, processed, summarized and reported within the time periods specified in the U.S. Securities and Exchange Commission’s (SEC’s) rules and forms. Disclosure Controls are also designed to reasonably assure that such information is accumulated and communicated to our management, including the Chief Executive Officer and Chief Financial Officer, as appropriate to allow timely decisions regarding required disclosure. Our quarterly evaluation of Disclosure Controls includes an evaluation of some components of our internal control over financial reporting, and internal control over financial reporting is also separately evaluated on an annual basis for purposes of providing the management report which is set forth below.
Our Chief Executive Officer and Chief Financial Officer have concluded that, as of the end of the period covered by this Annual Report on Form 10-K, our disclosure controls and procedures were effective.
Management’s Annual Report on Internal Control Over Financial Reporting
Our management is responsible for establishing and maintaining adequate internal control over financial reporting as defined in Rules 13a-15(f) and 15d-15(f) under the Exchange Act. A company’s internal control over financial reporting is a process designed by, or under the supervision of, the company’s principal executive and principal financial officers, or persons performing similar functions, and effected by the Company’s Board of Directors, management, and other personnel to provide reasonable assurance regarding the reliability of financial reporting and the preparation of financial statements for external purposes in accordance with generally accepted accounting principles and include those policies and procedures that:
• | Pertain to the maintenance of records that, in reasonable detail, accurately and fairly reflect the transactions and dispositions of the assets of the company. |
• | Provide reasonable assurance that transactions are recorded as necessary to permit preparation of financial statements in accordance with generally accepted accounting principles, and that receipts and expenditures of the company are being made in accordance with authorizations of management and directors of the company; and |
• | Provide reasonable assurance regarding prevention or timely detection of unauthorized acquisition, use or disposition of the company's assets that could have a material effect on the financial statements. |
Because of its inherent limitations, internal control over financial reporting may not prevent or detect misstatements. Projections of any evaluation of effectiveness to future periods are subject to the risk that controls may become inadequate because of changes in conditions, or that the degree of compliance with the policies or procedures may deteriorate.
Our management assessed the effectiveness of our internal control over financial reporting as of December 26, 2015, based on the criteria outlined in Internal Control-Integrated Framework (2013) issued by the Committee of Sponsoring Organizations of the Treadway Commission.
Based on their assessment, management concluded that, as of December 26, 2015, the Company’s internal control over financial reporting were effective based on those criteria.
Our independent registered public accounting firm that audited our consolidated financial statements included in this Form 10-K has issued an attestation report on our internal control over financial reporting. This report appears below.
Attestation Report of the Independent Registered Public Accounting Firm.
Our internal control over financial reporting as of December 26, 2015, has been audited by Deloitte & Touche LLP, an independent registered public accounting firm, as stated in their report, which follows below.
35
Changes in Internal Control Over Financial Reporting
In Item 9A of the 2014 Form 10-K, management concluded that there was a material weakness in internal controls over financial reporting related to information technology general controls in the areas of access security, program change management, and monitoring of outsourced service providers. The following remedial actions were taken to improve these controls:
• | Improved the design, operation and monitoring of control activities and procedures associated with user and administrator access to the affected IT systems, including both preventive and detective control activities. |
• | Improved the design, operation and monitoring of control activities and procedures associated with program change management of the affected IT systems, including both preventive and detective control activities. |
• | Implemented appropriate control activities and procedures associated with monitoring of outsourced service providers related to the affected IT systems. |
The Company believes the actions taken have improved the effectiveness of our internal control over financial reporting. As of December 26, 2015, testing of both the design and operating effectiveness of the new and improved controls was completed, and management concluded that the material weakness in internal controls over financial reporting related to information technology general controls in the areas of access security, program change management, and monitoring of outsourced service providers has been fully remediated.
36
REPORT OF INDEPENDENT REGISTERED PUBLIC ACCOUNTING FIRM
To the Board of Directors and Stockholders of
Kopin Corporation
Westborough, Massachusetts
We have audited the internal control over financial reporting of Kopin Corporation and subsidiaries (the “Company”) as of December 26, 2015, based on criteria established in Internal Control-Integrated Framework (2013) issued by the Committee of Sponsoring Organizations of the Treadway Commission. The Company’s management is responsible for maintaining effective internal control over financial reporting and for their assessment of the effectiveness of internal control over financial reporting, included in the accompanying Management’s Annual Report on Internal Control over Financial Reporting. Our responsibility is to express an opinion on the Company’s internal control over financial reporting based on our audit.
We conducted our audit in accordance with the standards of the Public Company Accounting Oversight Board (United States). Those standards require that we plan and perform the audit to obtain reasonable assurance about whether effective internal control over financial reporting was maintained in all material respects. Our audit included obtaining an understanding of internal control over financial reporting, assessing the risk that a material weakness exists, testing and evaluating the design and operating effectiveness of internal control based on the assessed risk, and performing such other procedures as we considered necessary in the circumstances. We believe that our audit provides a reasonable basis for our opinion.
A company’s internal control over financial reporting is a process designed by, or under the supervision of, the company’s principal executive and principal financial officers, or persons performing similar functions, and effected by the company’s board of directors, management, and other personnel to provide reasonable assurance regarding the reliability of financial reporting and the preparation of financial statements for external purposes in accordance with generally accepted accounting principles. A company’s internal control over financial reporting includes those policies and procedures that (1) pertain to the maintenance of records that, in reasonable detail, accurately and fairly reflect the transactions and dispositions of the assets of the company; (2) provide reasonable assurance that transactions are recorded as necessary to permit preparation of financial statements in accordance with generally accepted accounting principles, and that receipts and expenditures of the company are being made only in accordance with authorizations of management and directors of the company; and (3) provide reasonable assurance regarding prevention or timely detection of unauthorized acquisition, use, or disposition of the company’s assets that could have a material effect on the financial statements.
Because of the inherent limitations of internal control over financial reporting, including the possibility of collusion or improper management override of controls, material misstatements due to error or fraud may not be prevented or detected on a timely basis. Also, projections of any evaluation of the effectiveness of the internal control over financial reporting to future periods are subject to the risk that the controls may become inadequate because of changes in conditions, or that the degree of compliance with the policies or procedures may deteriorate.
In our opinion, the Company maintained, in all material respects, effective internal control over financial reporting as of December 26, 2015, based on the criteria established in Internal Control-Integrated Framework (2013) issued by the Committee of Sponsoring Organizations of the Treadway Commission.
We have also audited, in accordance with the standards of the Public Company Accounting Oversight Board (United States), the consolidated financial statements and financial statement schedule as of and for the year ended December 26, 2015, of the Company and our report dated March 4, 2016 expressed an unqualified opinion on those financial statements and financial statement schedule and included an explanatory paragraph regarding the Company's sale of its III-V product line, including its investment in subsidiary Kopin Taiwan Corporation.
/s/ Deloitte & Touche LLP
Boston, Massachusetts
March 4, 2016
37
None
Part III
Item 10. | Directors, Executive Officers and Corporate Governance |
The information required under this item is incorporated herein by reference from our Proxy Statement relating to our 2016 Annual Meeting of Stockholders (the Proxy Statement). In addition to the disclosures made in our Proxy Statement and incorporated by reference herein, information with respect to executive officers required by this item is set forth in Part I of this Report.
Code of Ethics. We have adopted a Code of Business Conduct and Ethics (the Code) that applies to all of our employees (including our CEO and CFO) and directors. The Code is available on our website at www.kopin.com. We intend to satisfy the disclosure requirement regarding any amendment to or waiver of a provision of the Code applicable to any executive officer or director, by posting such information on our website.
Our corporate governance guidelines, whistleblower policy and the charters of the audit committee, compensation committee and nominating and corporate governance committee of the Board of Directors as well as other corporate governance document materials are available on our website at www.kopin.com under the heading “Investors”, then “Corporate Governance” then “Governance Documents”.
Item 11. | Executive Compensation |
The information required under this item is contained in our Proxy Statement and is incorporated herein by reference from the Proxy Statement.
Item 12. | Security Ownership of Certain Beneficial Owners and Management and Related Stockholder Matters |
The information required by this item is incorporated herein by reference from the Proxy Statement. Refer also to the equity compensation plan information set forth in Part II Item 5 of this Annual Report on Form 10-K.
Item 13. | Certain Relationships and Related Transactions, and Director Independence |
The information required by this item is incorporated herein by reference from the Proxy Statement.
Item 14. | Principal Accounting Fees and Services |
The information required by this item is incorporated herein by reference from the Proxy Statement.
Part IV
Item 15. | Exhibits, Financial Statement Schedules |
(1) Consolidated Financial Statements:
38
Page | |
(2) Financial Statement Schedule:
Schedules other than the one listed above have been omitted because of the absence of conditions under which they are required or because the required information is included in the consolidated financial statements or the notes thereto.
(3) Exhibits
39
3.1 | Amended and Restated Certificate of Incorporation | (2 | ) | ||
3.2 | Amendment to Certificate of Incorporation | (5 | ) | ||
3.3 | Amendment to Certificate of Incorporation | (5 | ) | ||
3.4 | Fourth Amended and Restated By-laws | (8 | ) | ||
4 | Specimen Certificate of Common Stock | (1 | ) | ||
10.1 | Form of Employee Agreement with Respect to Inventions and Proprietary Information | (1 | ) | ||
10.2 | Kopin Corporation 2001 Equity Incentive Plan | (7 | ) | * | |
10.3 | Kopin Corporation 2001 Equity Incentive Plan Amendment | (9 | ) | * | |
10.4 | Kopin Corporation 2001 Equity Incentive Plan Amendment | (10 | ) | * | |
10.5 | Kopin Corporation 2001 Equity Incentive Plan Amendment | (11 | ) | * | |
10.6 | Kopin Corporation 2001 Equity Incentive Plan Amendment | (13 | ) | * | |
10.7 | Kopin Corporation 2001 Supplemental Equity Incentive Plan | (6 | ) | * | |
10.8 | Form of Key Employee Stock Purchase Agreement | (1 | ) | * | |
10.9 | License Agreement by and between the Company and Massachusetts Institute of Technology dated April 22, 1985, as amended | (1 | ) | ||
10.10 | Facility Lease, by and between the Company and Massachusetts Technology Park Corporation, dated October 15, 1993 | (3 | ) | ||
10.11 | Joint Venture Agreement, by and among the Company, Kowon Technology Co., Ltd., and Korean Investors, dated as of March 3, 1998 | (4 | ) | ||
10.12 | Eighth Amended and Restated Employment Agreement between the Company and Dr. John C.C. Fan, dated as of December 31, 2014 | * | |||
10.13 | Kopin Corporation Form of Stock Option Agreement under 2001 and 2010 Equity Incentive Plans | (12 | ) | * | |
10.14 | Kopin Corporation 2001 and 2010 Equity Incentive Plan Form of Restricted Stock Purchase Agreement | (12 | ) | * | |
10.15 | Kopin Corporation Fiscal Year 2012 Incentive Bonus Plan | * | |||
10.16 | Kopin Corporation 2010 Equity Incentive Plan | (14 | ) | ||
10.17 | Purchase Agreement, dated January 10, 2013, by and among Kopin Corporation, IQE KC, LLC and IQE plc | (15 | ) | ||
21.1 | Subsidiaries of Kopin Corporation | ||||
23.1 | Consent of Independent Registered Public Accounting Firm | ||||
31.1 | Chief Executive Officer Certification Pursuant to 18 U.S.C. Section 1350, as Adopted Pursuant to Section 302 of the Sarbanes-Oxley Act of 2002 | ||||
31.2 | Chief Financial Officer Certification Pursuant to 18 U.S.C. Section 1350, as Adopted Pursuant to Section 302 of the Sarbanes-Oxley Act of 2002 | ||||
32.1 | Chief Executive Officer Certification Pursuant to 18 U.S.C. Section 1350, as Adopted Pursuant to Section 906 of the Sarbanes-Oxley Act of 2002 | ** | |||
32.2 | Chief Financial Officer Certification Pursuant to 18 U.S.C. Section 1350, as Adopted Pursuant to Section 906 of the Sarbanes-Oxley Act of 2002 | ** | |||
101 | The following materials from the Company’s Annual Report on Form 10-K for the fiscal year ended December 26, 2015, formatted in XBRL (Extensible Business Reporting Language): (i) Consolidated Balance Sheets, (ii) Consolidated Statements of Operations, (iii) Consolidated Statements of Comprehensive Loss, (iv) Consolidated Statements of Stockholder's Equity, (v) Consolidated Statements of Cash Flows, and (vi) Notes to Consolidated Financial Statements, tagged as blocks of text | ||||
40
* | Management contract or compensatory plan required to be filed as an Exhibit to this Annual Report on Form 10-K. | ||
** | This exhibit shall not be deemed "filed" for purposes of Section 18 of the Securities Exchange Act of 1934 or otherwise subject to the liabilities of that Section, nor shall it be deemed incorporated by reference in any filings under the Securities Act of 1933 or the Securities Exchange Act of 1934, whether made before or after the date hereof and irrespective of any general incorporation language in any filing. | ||
(1 | ) | Filed as an exhibit to Registration Statement on Form S-1, File No. 33-45853, and incorporated herein by reference. | |
(2 | ) | Filed as an exhibit to Registration Statement on Form S-1, File No. 33-57450, and incorporated herein by reference. | |
(3 | ) | Filed as an exhibit to Annual Report on Form 10-K for the fiscal year ended December 31, 1993 and incorporated herein by reference. | |
(4 | ) | Filed as an exhibit to Annual Report on Form 10-Q for the quarterly period ended June 27, 1998 and incorporated herein by reference. | |
(5 | ) | Filed as an exhibit to Quarterly Report on Form 10-Q for the quarterly period ended July 1, 2000 and incorporated herein by reference. | |
(6 | ) | Filed as an exhibit to Registration Statement on Form S-8, filed on November 13, 2011 and incorporated herein by reference. | |
(7 | ) | Filed as an appendix to Proxy Statement filed on April 20, 2001 and incorporated herein by reference. | |
(8 | ) | Filed as an exhibit to Current Report on Form 8-K filed on December 12, 2008 and incorporated herein by reference. | |
(9 | ) | Filed as an exhibit to Registration Statement on Form S-8 filed on August 16, 2002 and incorporated herein by reference | |
(10 | ) | Filed as an exhibit to Registration Statement on Form S-8 filed on March 15, 2004 and incorporated herein by reference. | |
(11 | ) | Filed as an exhibit to Registration Statement on Form S-8 filed on May 10, 2004 and incorporated herein by reference. | |
(12 | ) | Filed as an exhibit to Annual Report on Form 10-K for the fiscal year ended December 25, 2004 and incorporated herein by reference. | |
(13 | ) | Filed as an exhibit to Registration Statement on Form S-8 filed on April 15, 2008 and incorporated herein by reference. | |
(14 | ) | Filed with the Company's Definitive Proxy Statement on Schedule 14 filed as of April 5, 2013 and incorporated by reference herein. | |
(15 | ) | Filed as an exhibit to Current Report on Form 8-K on January 10, 2013 and incorporated by reference herein. | |
41
KOPIN CORPORATION
INDEX TO CONSOLIDATED FINANCIAL STATEMENTS
Page | |
Consolidated Balance Sheets at December 26, 2015 and December 27, 2014 | |
42
REPORT OF INDEPENDENT REGISTERED PUBLIC ACCOUNTING FIRM
To the Board of Directors and Stockholders of
Kopin Corporation
Westborough, Massachusetts
We have audited the accompanying consolidated balance sheets of Kopin Corporation and subsidiaries (the “Company”) as of December 26, 2015 and December 27, 2014, and the related consolidated statements of operations, comprehensive loss, stockholders’ equity, and cash flows for each of the three years in the period ended December 26, 2015. Our audits also included the financial statement schedule listed in the Index at Item 15(2). These financial statements and financial statement schedule are the responsibility of the Company’s management. Our responsibility is to express an opinion on the financial statements and financial statement schedule based on our audits.
We conducted our audits in accordance with the standards of the Public Company Accounting Oversight Board (United States). Those standards require that we plan and perform the audit to obtain reasonable assurance about whether the financial statements are free of material misstatement. An audit includes examining, on a test basis, evidence supporting the amounts and disclosures in the financial statements. An audit also includes assessing the accounting principles used and significant estimates made by management, as well as evaluating the overall financial statement presentation. We believe that our audits provide a reasonable basis for our opinion.
In our opinion, such consolidated financial statements present fairly, in all material respects, the financial position of Kopin Corporation and subsidiaries as of December 26, 2015 and December 27, 2014, and the results of their operations and their cash flows for each of the three years in the period ended December 26, 2015, in conformity with accounting principles generally accepted in the United States of America. Also, in our opinion, such financial statement schedule, when considered in relation to the basic consolidated financial statements taken as a whole, presents fairly, in all material respects, the information set forth therein.
As described in Note 2 to the consolidated financial statements, the Company sold its III-V product line, including its investment in subsidiary, Kopin Taiwan Corporation, on January 16, 2013. The results of the III-V product line are included in income from discontinued operations, net of tax, for all periods presented.
We have also audited, in accordance with the standards of the Public Company Accounting Oversight Board (United States), the Company’s internal control over financial reporting as of December 26, 2015, based on the criteria established in Internal Control-Integrated Framework (2013) issued by the Committee of Sponsoring Organizations of the Treadway Commission and our report dated March 4, 2016 expressed an unqualified opinion on the Company’s internal control over financial reporting.
/s/ Deloitte & Touche LLP
Boston, Massachusetts
March 4, 2016
43
KOPIN CORPORATION
CONSOLIDATED BALANCE SHEETS
December 26, 2015 | December 27, 2014 | ||||||
ASSETS | |||||||
Current assets: | |||||||
Cash and equivalents | $ | 19,767,889 | $ | 14,635,801 | |||
Marketable debt securities, at fair value | 60,942,891 | 76,223,135 | |||||
Accounts receivable, net of allowance of $153,000 and $266,000 in 2015 and 2014, respectively | 1,487,633 | 3,758,832 | |||||
Unbilled receivables | 87,340 | 43,492 | |||||
Inventory | 2,512,473 | 4,081,886 | |||||
Prepaid taxes | 437,586 | 378,637 | |||||
Prepaid expenses and other current assets | 920,410 | 802,837 | |||||
Note receivable | 15,000,000 | — | |||||
Total current assets | 101,156,222 | 99,924,620 | |||||
Property, plant and equipment, net | 2,677,103 | 4,589,421 | |||||
Goodwill | 946,082 | 976,451 | |||||
Intangible assets, net | — | 616,759 | |||||
Other assets | 461,416 | 1,900,828 | |||||
Note receivable | — | 14,933,335 | |||||
Property and plant held for sale | 819,263 | — | |||||
Total assets | $ | 106,060,086 | $ | 122,941,414 | |||
LIABILITIES AND STOCKHOLDERS’ EQUITY | |||||||
Current liabilities: | |||||||
Accounts payable | $ | 3,959,704 | $ | 5,503,734 | |||
Accrued payroll and expenses | 1,631,292 | 1,985,691 | |||||
Accrued warranty | 518,000 | 716,000 | |||||
Billings in excess of revenue earned | 1,407,566 | 586,471 | |||||
Other accrued liabilities | 2,553,282 | 3,169,028 | |||||
Deferred tax liabilities | 1,207,000 | 1,282,000 | |||||
Total current liabilities | 11,276,844 | 13,242,924 | |||||
Asset retirement obligations | 298,463 | 311,187 | |||||
Commitments and contingencies | |||||||
Stockholders’ equity: | |||||||
Preferred stock, par value $.01 per share: authorized, 3,000 shares; none issued | — | — | |||||
Common stock, par value $.01 per share: authorized, 120,000,000 shares; issued 78,271,659 shares in 2015 and 77,731,604 shares in 2014; outstanding 63,977,385 in 2015 and 63,077,715 in 2014, respectively | 760,796 | 751,832 | |||||
Additional paid-in capital | 326,558,527 | 324,625,694 | |||||
Treasury stock (12,102,258 shares in 2015 and 2014, respectively, at cost) | (42,741,551 | ) | (42,741,551 | ) | |||
Accumulated other comprehensive income | 771,774 | 3,126,239 | |||||
Accumulated deficit | (190,608,671 | ) | (175,915,255 | ) | |||
Total Kopin Corporation stockholders’ equity | 94,740,875 | 109,846,959 | |||||
Noncontrolling interest | (256,096 | ) | (459,656 | ) | |||
Total stockholders’ equity | 94,484,779 | 109,387,303 | |||||
Total liabilities and stockholders’ equity | $ | 106,060,086 | $ | 122,941,414 | |||
See Accompanying Notes to Consolidated Financial Statements.
44
KOPIN CORPORATION
CONSOLIDATED STATEMENTS OF OPERATIONS
Fiscal year ended | 2015 | 2014 | 2013 | ||||||||
Revenues: | |||||||||||
Net component revenues | $ | 28,163,118 | $ | 26,956,741 | $ | 20,574,812 | |||||
Research and development revenues | 3,891,301 | 4,850,724 | 2,322,897 | ||||||||
32,054,419 | 31,807,465 | 22,897,709 | |||||||||
Expenses: | |||||||||||
Cost of component revenues | 21,609,826 | 19,638,149 | 20,655,216 | ||||||||
Research and development-funded programs | 3,006,352 | 5,236,791 | 1,550,873 | ||||||||
Research and development-internal | 14,625,061 | 15,499,230 | 15,983,147 | ||||||||
Selling, general and administrative | 18,134,580 | 19,908,020 | 19,124,750 | ||||||||
Impairment of intangible assets and goodwill | — | — | 1,511,414 | ||||||||
57,375,819 | 60,282,190 | 58,825,400 | |||||||||
Loss from operations | (25,321,400 | ) | (28,474,725 | ) | (35,927,691 | ) | |||||
Other income and expense: | |||||||||||
Interest income | 758,153 | 966,403 | 1,118,617 | ||||||||
Other income, net | 127,512 | 271,537 | 235,917 | ||||||||
Foreign currency transaction gains (losses) | 408,192 | 91,725 | (387,351 | ) | |||||||
Gain on sales of investments | 9,206,919 | — | 1,899,291 | ||||||||
Impairment of equity and cost investments | — | (1,319,287 | ) | (5,000,442 | ) | ||||||
10,500,776 | 10,378 | (2,133,968 | ) | ||||||||
Loss from continuing operations before benefit for income taxes, and equity losses in unconsolidated affiliates and net loss of noncontrolling interest | (14,820,624 | ) | (28,464,347 | ) | (38,061,659 | ) | |||||
Tax benefit | 25,000 | 180,000 | 12,933,209 | ||||||||
Loss before equity losses in unconsolidated affiliates and net loss of noncontrolling interest | (14,795,624 | ) | (28,284,347 | ) | (25,128,450 | ) | |||||
Equity losses in unconsolidated affiliates | (47,443 | ) | (386,442 | ) | (625,098 | ) | |||||
Loss from continuing operations | (14,843,067 | ) | (28,670,789 | ) | (25,753,548 | ) | |||||
Income from discontinued operations, net of tax | — | — | 20,147,532 | ||||||||
Net loss | $ | (14,843,067 | ) | $ | (28,670,789 | ) | $ | (5,606,016 | ) | ||
Net loss attributable to the noncontrolling interest | 149,651 | 458,745 | 896,400 | ||||||||
Net loss attributable to the controlling interest | $ | (14,693,416 | ) | $ | (28,212,044 | ) | $ | (4,709,616 | ) | ||
Net (loss) income per share: | |||||||||||
Basic: | |||||||||||
Continuing operations | $ | (0.23 | ) | $ | (0.45 | ) | $ | (0.40 | ) | ||
Discontinued operations | — | — | 0.32 | ||||||||
Net loss per share | $ | (0.23 | ) | $ | (0.45 | ) | $ | (0.08 | ) | ||
Diluted: | |||||||||||
Continuing operations | $ | (0.23 | ) | $ | (0.45 | ) | $ | (0.40 | ) | ||
Discontinued operations | — | — | 0.32 | ||||||||
Net loss per share | $ | (0.23 | ) | $ | (0.45 | ) | $ | (0.08 | ) | ||
Weighted average number of common shares outstanding: | |||||||||||
Basic | 63,465,797 | 62,638,675 | 62,347,852 | ||||||||
Diluted | 63,465,797 | 62,638,675 | 62,347,852 | ||||||||
See Accompanying Notes to Consolidated Financial Statements.
KOPIN CORPORATION
CONSOLIDATED STATEMENTS OF COMPREHENSIVE LOSS
Fiscal years ended | 2015 | 2014 | 2013 | ||||||||
Net loss | $ | (14,843,067 | ) | $ | (28,670,789 | ) | $ | (5,606,016 | ) | ||
Other comprehensive (loss) income: | |||||||||||
Foreign currency translation adjustments | (1,060,186 | ) | (1,102,859 | ) | 231,321 | ||||||
Unrealized holding gain (loss) on marketable securities | 104,362 | 681,346 | (116,134 | ) | |||||||
Reclassifications of gains in net loss | (1,490,776 | ) | (6,477 | ) | (1,936,121 | ) | |||||
Other comprehensive loss | $ | (2,446,600 | ) | $ | (427,990 | ) | $ | (1,820,934 | ) | ||
Comprehensive loss | (17,289,667 | ) | (29,098,779 | ) | (7,426,950 | ) | |||||
Comprehensive (loss) gain attributable to the noncontrolling interest | (91,200 | ) | 570,977 | 871,867 | |||||||
Comprehensive loss attributable to the controlling interest | $ | (17,380,867 | ) | $ | (28,527,802 | ) | $ | (6,555,083 | ) | ||
See Accompanying Notes to Consolidated Financial Statements.
45
KOPIN CORPORATION
CONSOLIDATED STATEMENTS OF STOCKHOLDERS’ EQUITY
Common Stock | Additional Paid-in Capital | Treasury Stock | Accumulated Other Comprehensive Income | Accumulated Deficit | Total Kopin Corporation Stockholders’ Equity | Noncontrolling interest | Total Stockholders’ Equity | |||||||||||||||||||||||||||
Shares | Amount | |||||||||||||||||||||||||||||||||
Balance December 29, 2012 | 73,696,644 | $ | 736,966 | $ | 318,928,495 | $ | (34,450,978 | ) | $ | 6,512,792 | $ | (142,993,596 | ) | $ | 148,733,679 | $ | 6,352,230 | $ | 155,085,910 | |||||||||||||||
Vesting of restricted stock | 1,216,900 | 12,169 | (12,169 | ) | — | — | — | — | — | — | ||||||||||||||||||||||||
Stock-based compensation expense | — | — | 3,804,408 | — | — | — | 3,804,408 | — | 3,804,408 | |||||||||||||||||||||||||
Other comprehensive income | — | — | — | — | (1,845,466 | ) | — | (1,845,466 | ) | 24,532 | (1,820,934 | ) | ||||||||||||||||||||||
Sale of III-V product line | — | — | — | — | (1,580,629 | ) | — | (1,580,629 | ) | (2,673,051 | ) | (4,253,680 | ) | |||||||||||||||||||||
Acquisition of eMDT | — | — | — | — | — | — | 200,198 | 200,198 | ||||||||||||||||||||||||||
Acquisition of noncontrolling interest in Kowon | — | — | (1,020,130 | ) | — | 355,300 | — | (664,830 | ) | (2,997,570 | ) | (3,662,400 | ) | |||||||||||||||||||||
Restricted stock for tax withholding obligations | (320,061 | ) | (3,200 | ) | (1,189,146 | ) | — | — | — | (1,192,346 | ) | — | (1,192,346 | ) | ||||||||||||||||||||
Treasury stock purchase | — | — | — | (7,991,954 | ) | — | — | (7,991,954 | ) | — | (7,991,954 | ) | ||||||||||||||||||||||
Net loss | — | — | — | — | — | (4,709,616 | ) | (4,709,616 | ) | (896,400 | ) | (5,606,016 | ) | |||||||||||||||||||||
Balance December 28, 2013 | 74,593,483 | $ | 745,935 | $ | 320,511,458 | $ | (42,442,932 | ) | $ | 3,441,997 | $ | (147,703,212 | ) | $ | 134,553,246 | $ | 9,939 | $ | 134,563,186 | |||||||||||||||
Exercise of stock options | 36,750 | $ | 368 | $ | 137,445 | — | — | — | 137,812 | — | 137,812 | |||||||||||||||||||||||
Vesting of restricted stock | 843,116 | 8,431 | (8,431 | ) | — | — | — | — | — | — | ||||||||||||||||||||||||
Stock-based compensation expense | — | — | 5,059,572 | — | — | — | 5,059,572 | — | 5,059,572 | |||||||||||||||||||||||||
Other comprehensive loss | — | — | — | — | (315,758 | ) | — | (315,758 | ) | (112,232 | ) | (427,990 | ) | |||||||||||||||||||||
Acquisition of eMDT | — | — | (101,382 | ) | — | — | (101,382 | ) | 101,382 | — | ||||||||||||||||||||||||
Restricted stock for tax withholding obligations | (290,142 | ) | (2,901 | ) | (972,968 | ) | — | — | — | (975,869 | ) | — | (975,869 | ) | ||||||||||||||||||||
Treasury stock purchase | — | — | — | (298,619 | ) | — | — | (298,619 | ) | — | (298,619 | ) | ||||||||||||||||||||||
Net loss | — | — | — | — | — | (28,212,044 | ) | (28,212,044 | ) | (458,745 | ) | (28,670,789 | ) | |||||||||||||||||||||
Balance, December 27, 2014 | 75,183,207 | $ | 751,833 | $ | 324,625,694 | $ | (42,741,551 | ) | $ | 3,126,239 | $ | (175,915,255 | ) | $ | 109,846,959 | $ | (459,656 | ) | $ | 109,387,303 | ||||||||||||||
Exercise of stock options and warrants | 39,798 | 398 | 85,649 | — | — | — | 86,047 | — | 86,047 | |||||||||||||||||||||||||
Vesting of restricted stock | 1,226,992 | 12,270 | (12,270 | ) | — | — | — | — | — | |||||||||||||||||||||||||
Stock-based compensation expense | — | — | 3,373,479 | — | — | — | 3,373,479 | — | 3,373,479 | |||||||||||||||||||||||||
Other comprehensive loss | — | — | — | — | (2,388,148 | ) | — | (2,388,148 | ) | (58,452 | ) | (2,446,600 | ) | |||||||||||||||||||||
Acquisition of Kopin Software Limited | — | — | (445,344 | ) | — | 33,683 | — | (411,661 | ) | 411,663 | 2 | |||||||||||||||||||||||
Restricted stock for tax withholding obligations | (370,354 | ) | (3,704 | ) | (1,068,681 | ) | — | — | — | (1,072,385 | ) | — | (1,072,385 | ) | ||||||||||||||||||||
Net loss | — | — | — | — | — | (14,693,416 | ) | (14,693,416 | ) | (149,651 | ) | (14,843,067 | ) | |||||||||||||||||||||
Balance, December 26, 2015 | 76,079,643 | $ | 760,797 | $ | 326,558,527 | $ | (42,741,551 | ) | $ | 771,774 | $ | (190,608,671 | ) | $ | 94,740,875 | $ | (256,096 | ) | $ | 94,484,779 | ||||||||||||||
See Accompanying Notes to Consolidated Financial Statements.
46
KOPIN CORPORATION
CONSOLIDATED STATEMENTS OF CASH FLOWS
Fiscal year ended | 2015 | 2014 | 2013 | ||||||||
Cash flows from operating activities: | |||||||||||
Net loss | $ | (14,843,067 | ) | $ | (28,670,789 | ) | $ | (5,606,016 | ) | ||
Adjustments to reconcile net loss to net cash used in operating activities: | |||||||||||
Depreciation and amortization | 2,138,982 | 3,002,014 | 3,646,725 | ||||||||
Accretion of premium or discount on marketable debt securities | 168,217 | 53,437 | 360,403 | ||||||||
Stock-based compensation | 3,145,479 | 4,827,772 | 4,203,408 | ||||||||
Net gain on investment transactions | (9,206,919 | ) | — | (1,899,291 | ) | ||||||
Loss on disposal of equipment | 180,715 | — | — | ||||||||
Losses in unconsolidated affiliates | — | 102,305 | 625,098 | ||||||||
Impairment of intangible assets and goodwill | — | — | 1,511,414 | ||||||||
Gain on sale of III-V product line | — | — | (33,452,176 | ) | |||||||
Gain on sale of equipment | — | 283,333 | — | ||||||||
Deferred income taxes | (75,000 | ) | (230,725 | ) | 252,687 | ||||||
Foreign currency (gains) losses | (455,614 | ) | (96,819 | ) | 341,590 | ||||||
Impairment of investments | — | 1,319,287 | 5,000,442 | ||||||||
Change in allowance for bad debt | (112,500 | ) | 63,340 | (107,694 | ) | ||||||
Other non-cash items | 1,560,259 | 489,332 | 733,428 | ||||||||
Change in warranty reserves | (200,000 | ) | — | — | |||||||
Changes in assets and liabilities: | |||||||||||
Accounts receivable | 2,850,942 | (1,286,407 | ) | 4,853,073 | |||||||
Inventory | (8,484 | ) | (1,520,824 | ) | 2,262,547 | ||||||
Prepaid expenses and other current assets | (207,421 | ) | 191,367 | (179,858 | ) | ||||||
Accounts payable and accrued expenses | (2,632,385 | ) | 1,829,591 | (773,471 | ) | ||||||
Billings in excess of revenue earned | 777,247 | 38,790 | (672,714 | ) | |||||||
Net cash used in operating activities | (16,919,549 | ) | (19,604,996 | ) | (18,900,405 | ) | |||||
Cash flows from investing activities: | |||||||||||
Proceeds from sale of marketable debt securities | 38,055,759 | 39,801,276 | 17,130,488 | ||||||||
Purchase of marketable debt securities | (22,835,740 | ) | (19,867,896 | ) | (49,329,891 | ) | |||||
Proceeds from sale of investments | 9,206,919 | — | 2,597,289 | ||||||||
Proceeds from sale of equipment | — | 250,000 | — | ||||||||
Proceeds from sale of III-V product line | — | — | 55,188,020 | ||||||||
Cash paid to acquire eMDT, net of cash acquired | — | — | 211,484 | ||||||||
Purchases of cost based investment | — | — | (3,583,611 | ) | |||||||
Other assets | (1,772 | ) | (38,134 | ) | (10,552 | ) | |||||
Capital expenditures | (1,122,808 | ) | (1,489,986 | ) | (741,543 | ) | |||||
Net cash provided by investing activities | 23,302,358 | 18,655,260 | 21,461,684 | ||||||||
Cash flows from financing activities: | |||||||||||
Treasury stock purchases | — | (298,619 | ) | (7,991,954 | ) | ||||||
Purchase of noncontrolling interest in Kowon | — | — | (3,662,400 | ) | |||||||
Proceeds from exercise of stock options and warrants | 86,047 | 137,813 | — | ||||||||
Settlements of restricted stock for tax withholding obligations | (1,072,385 | ) | (975,869 | ) | (1,192,346 | ) | |||||
Net cash used in financing activities | (986,338 | ) | (1,136,675 | ) | (12,846,700 | ) | |||||
Effect of exchange rate changes on cash | (264,383 | ) | (34,454 | ) | (93,300 | ) | |||||
Net decrease in cash and equivalents | 5,132,088 | (2,120,865 | ) | (10,378,721 | ) | ||||||
Cash and equivalents: | |||||||||||
Beginning of year | 14,635,801 | 16,756,666 | 27,135,387 | ||||||||
End of year | $ | 19,767,889 | $ | 14,635,801 | $ | 16,756,666 | |||||
Supplemental disclosure of cash flow information: | |||||||||||
Income taxes paid | $ | 50,000 | $ | (18,000 | ) | $ | 95,000 | ||||
Supplemental schedule of noncash investing activities: | |||||||||||
Construction in progress included in accrued expenses | $ | — | $ | 373,000 | $ | 105,000 | |||||
Non-cash proceeds from sale of III-V product line | $ | — | $ | — | $ | 14,866,000 | |||||
See Accompanying Notes to Consolidated Financial Statements.
47
KOPIN CORPORATION
NOTES TO CONSOLIDATED FINANCIAL STATEMENTS
1. Summary of Significant Accounting Policies
The preparation of consolidated financial statements in conformity with accounting principles generally accepted in the United States of America requires management to make estimates and assumptions that affect the reported amounts of assets and liabilities and disclosure of contingent assets and liabilities at the date of the financial statements and the reported amounts of revenues and expenses during the reporting period. Actual results could differ from those estimates.
Fiscal Year
The Company’s fiscal year ends on the last Saturday in December. The fiscal years ended December 26, 2015, December 27, 2014 and December 28, 2013 include 52 weeks, and are referred to as fiscal years 2015, 2014 and 2013, respectively, herein.
Principles of Consolidation
The consolidated financial statements include the accounts of the Company, its wholly owned subsidiaries, a majority owned 93% subsidiary, Kowon Technology Co., Ltd. (Kowon), located in Korea, and a majority owned 80% subsidiary, eMDT America Inc (eMDT), located in California (collectively the Company). In the fourth quarter of 2015, the Company increased its investment in Kopin Software Ltd. (KSL) (formerly Intoware Ltd.) from 58% to 100%. Net loss attributable to noncontrolling interest in the Company's consolidated statement of operations represents the portion of the results of operations of Kowon and eMDT for the twelve month period ended December 26, 2015 and for the period of time during 2015 when the Company owned 58% of KSL, which is allocated to the shareholders of the equity interests not owned by the Company. All intercompany transactions and balances have been eliminated. Investments in business entities in which the Company does not have control but has the ability to exercise significant influence over operating and financial policies are accounted for by the equity method.
The Company ceased its production activities at its Kowon facility in 2013 and commenced offering the facility for sale. The Company believes the facility will be sold within the next 12 months and has classified the facility as non-current assets held for sale.
Revenue Recognition
The Company recognizes revenue if four basic criteria have been met: (1) persuasive evidence of an arrangement exists; (2) delivery has occurred and services rendered; (3) the price to the buyer is fixed or determinable; and (4) collectability is reasonably assured. The Company does not recognize revenue for products prior to customer acceptance unless it believes the product meets all customer specifications and the Company has a history of consistently achieving customer acceptance of the product. Provisions for product returns and allowances are recorded in the same period as the related revenues. The Company analyzes historical returns, current economic trends and changes in customer demand and acceptance of product when evaluating the adequacy of sales returns and other allowances. Certain product sales are made to distributors under agreements allowing for a limited right of return on unsold products. Sales to distributors are primarily made for sales to the distributors' customers and not for their stocking of inventory. The Company delays revenue recognition for its estimate of distributor claims of right of return on unsold products based upon its historical experience with the Company’s products and specific analysis of amounts subject to return based upon discussions with the Company’s distributors or their customers.
The Company recognizes revenues from long-term research and development contracts on the percentage-of-completion method of accounting as work is performed, based upon the ratio of costs or hours already incurred to the estimated total cost of completion or hours of work to be performed. Revenue recognized at any point in time is limited to the amount funded by the U.S. government or contracting entity. The Company accounts for product development and research contracts that have established prices for distinct phases as if each phase were a separate contract. In some instances, the Company is contracted to create a deliverable which is anticipated to be qualified and go into full rate production stages. In those cases, the revenue recognition methodology will change from the percentage of completion method to the units-of-delivery method as new contracts are received after formal qualification has been completed. Under certain of its research and development contracts, the Company recognizes revenue on a milestone methodology. This revenue is recognized when the Company achieves specified milestones based on its past performance.
The Company classifies amounts earned on contracts in progress that are in excess of amounts billed as unbilled receivables and classifies amounts received in excess of amounts earned as billings in excess of revenues earned. The Company invoices based on dates specified in the related agreement or in periodic installments based upon its invoicing cycle. The
48
KOPIN CORPORATION
NOTES TO CONSOLIDATED FINANCIAL STATEMENTS—(Continued)
Company recognizes the entire amount of an estimated ultimate loss in its financial statements at the time the loss on a contract becomes known.
Research and Development Costs
Research and development expenses are incurred in support of internal display product development programs or programs funded by agencies or prime contractors of the U.S. government and commercial partners. Research and development costs include staffing, purchases of materials and laboratory supplies, circuit design costs, fabrication and packaging of experimental display products, and overhead, and are expensed immediately.
Cash and equivalents and Marketable securities
The Company considers all highly liquid, short-term debt instruments with original maturities of three months or less to be cash equivalents.
Marketable debt securities consist primarily of commercial paper, medium-term corporate notes, and United States government and agency backed securities. The Company classifies these marketable debt securities as available-for-sale at fair value in “Marketable debt securities, at fair value.” The investments in Vuzix Corporation (Vuzix) and GCS Holdings are included in "Other Assets" as available-for-sale and at fair value. The Company records the amortization of premium and accretion of discounts on marketable debt securities in the results of operations.
The Company uses the specific identification method as a basis for determining cost and calculating realized gains and losses with respect to marketable debt securities. The gross gains and losses realized related to sales of marketable debt securities were not material during fiscal years 2015, 2014 and 2013.
Inventory
Inventory is stated at the lower of cost (determined on the first-in, first-out method) or market and consists of the following at December 26, 2015 and December 27, 2014:
2015 | 2014 | ||||||
Raw materials | $ | 844,475 | $ | 2,057,202 | |||
Work-in-process | 1,281,891 | 1,551,799 | |||||
Finished goods | 386,107 | 472,885 | |||||
$ | 2,512,473 | $ | 4,081,886 | ||||
Property, plant and equipment
Property, plant and equipment are recorded at cost. Depreciation and amortization are provided using the straight-line method over the estimated useful lives of the assets, generally 3 to 10 years. Leasehold improvements and leased equipment are amortized over the shorter of the term of the lease or the useful life of the improvement or equipment. As discussed below, obligations for asset retirement are accrued at the time property, plant and equipment is initially purchased or as such obligations are generated from use.
Intangible assets
At December 26, 2015 and December 27, 2014, intangible assets consisted of patents. Identifiable intangible assets are amortized using the straight-line method over the estimated useful lives of the assets, generally three to seven years.
Assets held for sale
Assets held for sale as of December 26, 2015 consist of land with a cost of $0.8 million and buildings with a cost and net book value of $2.1 million and $0.0 million, respectively, located at the Company’s subsidiary Kowon. Kowon is included in the Kopin segment. The Company did not reclassify its presentation for the December 27, 2014 balance sheet.
Product Warranty
The Company generally sells products with a limited warranty of product quality and a limited indemnification of customers against intellectual property infringement claims related to the Company’s products. The Company accrues for known warranty and indemnification issues if a loss is probable and can be reasonably estimated, and accrues for estimated
49
KOPIN CORPORATION
NOTES TO CONSOLIDATED FINANCIAL STATEMENTS—(Continued)
incurred but unidentified issues based on historical activity. As of December 26, 2015 and December 27, 2014, the Company had warranty reserves of $0.5 million and $0.7 million respectively. For the fiscal years 2015, 2014 and 2013 warranty claims and reversals were approximately $0.8 million, $0.4 million and $0.8 million, respectively.
Asset Retirement Obligations
The Company recorded asset retirement obligations (ARO) liabilities of $0.3 million at December 26, 2015 and December 27, 2014, respectively. This represents the legal obligations associated with retirement of the Company’s assets when the timing and/or method of settling the obligation are conditional on a future event that may or may not be within the control of the Company.
2015 | 2014 | ||||||
Beginning balance | $ | 311,187 | $ | 329,435 | |||
Additions | — | — | |||||
Charges | — | — | |||||
Exchange rate change | (12,724 | ) | (18,248 | ) | |||
Ending balance | $ | 298,463 | $ | 311,187 | |||
Income Taxes
The consolidated financial statements reflect provisions for federal, state, local and foreign income taxes. The Company recognizes deferred tax assets and liabilities for the future tax consequences attributable to differences between the financial statement carrying amounts of existing assets and liabilities and their respective tax basis, as well as operating loss and tax credit carryforwards. The Company measures deferred tax assets and liabilities using enacted tax rates expected to apply to taxable income in the years in which those temporary differences and carryforwards are expected to be recovered or settled. The effect on deferred tax assets and liabilities of a change in tax rates is recognized in income in the period that includes the enactment date. The Company provides valuation allowances if, based on the weight of available evidence, it is more likely than not that some or all of the deferred tax assets will not be realized.
Foreign Currency
Assets and liabilities of non-U.S. operations where the functional currency is other than the U.S. dollar are translated from the functional currency into U.S. dollars at year end exchange rates, and revenues and expenses at average rates prevailing during the year. Resulting translation adjustments are accumulated as part of accumulated other comprehensive income. Transaction gains or losses are recognized in income or loss in the period in which they occur.
Net (Loss) Income Per Share
Basic net (loss) income per share is computed using the weighted-average number of shares of common stock outstanding during the period less any unvested restricted shares. Diluted earnings per common share is calculated using weighted-average shares outstanding and contingently issuable shares, less weighted-average shares reacquired during the period. The net outstanding shares are adjusted for the dilutive effect of shares issuable upon the assumed conversion of the Company’s common stock equivalents, which consist of outstanding stock options and unvested restricted stock.
Weighted-average common shares outstanding used to calculate earnings per share, is as follows:
2015 | 2014 | 2013 | ||||||
Weighted-average common shares outstanding—basic | 63,465,797 | 62,638,675 | 62,347,852 | |||||
Stock options and nonvested restricted common stock | — | — | — | |||||
Weighted-average common shares outstanding—diluted | 63,465,797 | 62,638,675 | 62,347,852 | |||||
The following were not included in weighted-average common shares outstanding-diluted because they are anti-dilutive or performance conditions have not been met at the end of the period.
50
KOPIN CORPORATION
NOTES TO CONSOLIDATED FINANCIAL STATEMENTS—(Continued)
2015 | 2014 | 2013 | ||||||
Nonvested restricted common stock | 2,192,016 | 2,551,631 | 3,024,148 | |||||
Stock options | — | 130,500 | 558,850 | |||||
Total | 2,192,016 | 2,682,131 | 3,582,998 | |||||
Concentration of Credit Risk
Financial instruments that potentially subject the Company to concentration of credit risk other than marketable securities consist principally of trade accounts receivable. Trade receivables are primarily derived from sales to manufacturers of consumer electronic devices and wireless components or military applications.
The Company primarily invests its excess cash in government backed and corporate financial instruments that management believes to be of high credit worthiness, which bear lower levels of relative credit risk. The Company relies on rating agencies to ascertain the credit worthiness of its marketable securities and, where applicable, guarantees by the Federal Deposit Insurance Company. The Company sells its products to customers worldwide and generally does not require collateral. The Company maintains a reserve for potential credit losses.
Fair Value of Financial Instruments
Financial instruments consist of current assets (except inventories, income tax receivables and prepaid assets) and certain current liabilities. Current assets (excluding marketable securities which are recorded at fair value) and current liabilities are carried at cost, which approximates fair value.
Stock-Based Compensation
The fair value of stock option awards is estimated on the date of grant using the Black-Scholes-Merton option-pricing model. There were no stock options granted in fiscal years 2015, 2014 or 2013.
The fair value of nonvested restricted common stock awards is generally the market value of the Company’s equity shares on the date of grant. The nonvested restricted common stock awards require the employee to fulfill certain obligations, including remaining employed by the Company for one, two or four years (the vesting period) and in certain cases also require meeting either performance criteria or the Company’s stock achieving a certain price. The performance criteria primarily consist of the achievement of established milestones. For nonvested restricted common stock awards which solely require the recipient to remain employed with the Company, the stock compensation expense is amortized over the anticipated service period. For nonvested restricted common stock awards which require the achievement of performance criteria, the Company reviews the probability of achieving the performance goals on a periodic basis. If the Company determines that it is probable that the performance criteria will be achieved, the amount of compensation cost derived for the performance goal is amortized over the service period. If the performance criteria are not met, no compensation cost is recognized and any previously recognized compensation cost is reversed. The Company recognizes compensation costs on a straight-line basis over the requisite service period for time vested awards.
On February 13, 2015, the Company modified the termination date of certain restricted stock grants previously made to Dr. Fan, the Company’s President and Chief Executive Officer. In 2011, the Company granted Dr. Fan 260,000 shares of restricted stock which will vest upon the first 10 consecutive trading day period following the grant date during which the Company's common stock trades at a price equal to or greater than $5.25 subject to acceleration upon the occurrence of an acceleration event. This grant was originally set to terminate on September 12, 2016. In 2013, the Company granted compensation awards to Dr. Fan that consisted of two grants of 150,000 shares of restricted stock each. One of the grants will vest at the end of the first 10 consecutive trading day period following the grant date during which the Company’s common stock trades at a price per share equal to or greater than $6.00. The other award will vest at the end of the first 10 consecutive trading day period following the grant date during which the Company’s common stock trades at a price per share equal to or greater than $7.00. Both were due to expire in 2023. On December 31, 2014, Dr. Fan entered into a 3-year employment agreement with the Company which expires on December 31, 2017. The Company has amended the three grants to now terminate on December 31, 2017, to be consistent with Dr. Fan's employment agreement.
In 2013, the Company granted a compensation award to its Chief Executive Officer that consisted of a grant of 300,000 shares of restricted stock that would vest upon the Company shipping 25,000 units of a new display. The Company shipped the displays in 2015 and the award vested.
Comprehensive Loss
51
KOPIN CORPORATION
NOTES TO CONSOLIDATED FINANCIAL STATEMENTS—(Continued)
Comprehensive loss is the total of net (loss) income and all other non-owner changes in equity including such items as unrealized holding (losses) gains on marketable equity and debt securities classified as available-for-sale and foreign currency translation adjustments.
The components of accumulated other comprehensive income are as follows:
Cumulative Translation Adjustment | Unrealized Holding Gain (Loss) on Marketable Securities | Acquisition of Minority Interest in KSL | Accumulated Other Comprehensive Income | ||||||||||||
Balance as of December 29, 2012 | $ | 3,542,104 | $ | 2,970,688 | $ | — | $ | 6,512,792 | |||||||
Changes during year | (1,017,403 | ) | (2,053,392 | ) | — | (3,070,795 | ) | ||||||||
Balance as of December 28, 2013 | 2,524,701 | 917,296 | — | 3,441,997 | |||||||||||
Changes during year | (990,626 | ) | 674,868 | — | (315,758 | ) | |||||||||
Balance as of December 27, 2014 | 1,534,075 | 1,592,164 | — | 3,126,239 | |||||||||||
Changes during year | (1,001,733 | ) | (1,386,415 | ) | 33,683 | (2,354,465 | ) | ||||||||
Balance as of December 26, 2015 | $ | 532,342 | $ | 205,749 | $ | 33,683 | $ | 771,774 | |||||||
Impairment of Long-Lived Assets
The Company periodically reviews the carrying value of its long-lived assets to determine if facts and circumstances suggest that they may be impaired or that the amortization or depreciation period may need to be changed. The carrying value of a long-lived asset is considered impaired when the anticipated identifiable undiscounted cash flows from such asset are less than its carrying value. For assets that are to be held and used, impairment is measured based upon the amount by which the carrying amount of the asset exceeds its fair value. The carrying value of the Company’s long-lived assets was $2.7 million at December 26, 2015.
Recently Issued Accounting Pronouncements
Revenue from Contracts with Customers
In May 2014, the Financial Accounting Standards Board (FASB) issued Accounting Standards Update (ASU) No. 2014-09, Revenue from Contracts with Customers (Topic 606). This new standard outlines a single comprehensive model for entities to use in accounting for revenue arising from contracts with customers and supersedes most current revenue recognition guidance, including industry-specific guidance. In addition, ASU 2014-09 provides guidance on accounting for certain revenue-related costs including, but not limited to, when to capitalize costs associated with obtaining and fulfilling a contract. The standard also requires certain new disclosures. The standard was effective for annual and interim reporting periods beginning after December 15, 2016.
In August 2015, the FASB issued ASU 2015-14, Revenue from Contracts with Customers. The amendments in this ASU defer the effective date of ASU 2014-09. Public companies should apply the guidance in ASU 2014-09 to annual reporting periods beginning after December 15, 2017, including interim periods within that reporting period. Early adoption is permitted only as of annual reporting periods beginning after December 15, 2016, including interim reporting periods within that reporting period. The Company is currently evaluating the expected impact of this new guidance on its consolidated financial statements and available adoption methods.
Balance Sheet Reclassification of Deferred Taxes
In November 2015, the FASB issued ASU 2015-17, Balance Sheet Classification of Deferred Taxes, which will require entities to present all deferred tax assets (“DTAs”) and deferred tax liabilities (“DTLs”) as non-current on the balance sheet. This guidance is effective for public companies for fiscal years, and interim periods within those fiscal years, beginning after December 15, 2016. Early adoption is permitted, and entities may choose whether to adopt this update prospectively or retrospectively. The Company has evaluated ASU 2015-17 and determined that its adoption will not have a material effect on its financial position or earnings.
On December 26, 2015, the Company elected to adopt ASU 2015-17 and change its method of classifying DTAs and DTLs as either current or non-current to classifying all DTAs and DTLs as non-current, and has chosen to apply a prospective method. The prior balance sheet as of December 27, 2014 was not retrospectively adjusted as there was no impact to its historical presentation.
52
KOPIN CORPORATION
NOTES TO CONSOLIDATED FINANCIAL STATEMENTS—(Continued)
Statement of Comprehensive Income
During the twelve months ended December 26, 2015, the change in the Company's accumulated other comprehensive income was the net of $(1.0) million cumulative translation adjustment, $0.1 million unrealized holding gains on marketable securities and $(1.5) million of reclassified holding gains.
2. Discontinued Operations
On January 16, 2013, (the Closing Date), the Company sold its III-V product line, including all of the outstanding equity interest in KTC Wireless, LLC (KTC), a wholly owned subsidiary of the Company, to IQE KC, LLC (IQE) and IQE plc (Parent, and collectively with IQE, the Buyer) pursuant to a Purchase Agreement (the Purchase Agreement) entered into on January 10, 2013 for an aggregate purchase price price, after adjustments for working capital items of $70.2 million of which $55.2 million was paid to the Company in 2013 and the remaining $15 million was paid on January 15, 2016.
The operating results of the III-V product line prior to the Sale are reported within Income from discontinued operations, net of tax, in the consolidated statement of operations and have been excluded from segment results.
The following table summarizes the results from discontinued operations:
December 28, 2013 | |||
Net product and research and development revenues | $ | 2.3 | |
(Loss) gain from discontinued operations before income taxes | (0.2 | ) | |
(Provision) benefit for income taxes on discontinued operations | — | ||
Discontinued operations, net of tax | (0.2 | ) | |
Gain on sale, net of $13.1 million of tax | 20.4 | ||
Income from discontinued operations, net of tax | $ | 20.2 | |
3. Property, Plant and Equipment
Property, plant and equipment consisted of the following at December 26, 2015 and December 27, 2014:
Useful Life | 2015 | 2014 | |||||||
Land | $ | — | $ | 877,485 | |||||
Buildings | 10 years | — | 2,298,367 | ||||||
Equipment | 3-5 years | 18,765,548 | 19,696,919 | ||||||
Leasehold improvements | Life of the lease | 3,659,559 | 3,652,395 | ||||||
Furniture and fixtures | 3 years | 789,067 | 886,985 | ||||||
Equipment under construction | 312,916 | 657,142 | |||||||
23,527,090 | 28,069,293 | ||||||||
Accumulated depreciation and amortization | (20,849,987 | ) | (23,479,872 | ) | |||||
Net property, plant and equipment | $ | 2,677,103 | $ | 4,589,421 | |||||
There were no material gains or losses on disposals of long-lived assets in fiscal years 2015, 2014 and 2013. Depreciation expense for the fiscal years 2015, 2014 and 2013 was approximately $1.5 million, $2.6 million and $2.4 million, respectively.
In February 2016, the Company entered into an agreement to sell land and its Korean facility for an estimated $7.6 million based on the exchange rate on the date of the agreement. The closure of the transaction is based on completion of environment testing and other factors, all of which are expected to be completed by June 2016.
4. Other Assets and Note Receivable
Marketable Equity Securities
As of December 26, 2015 and December 27, 2014, the Company had an investment in GCS Holdings which had a fair market value of $0.2 million and an adjusted cost basis of $0.0 million.
53
KOPIN CORPORATION
NOTES TO CONSOLIDATED FINANCIAL STATEMENTS—(Continued)
On February 25, 2015, the Company acquired approximately 251,000 shares of Vuzix common stock through a cashless exercise of warrants. The Company received the warrants in August 2013 as part of a restructuring of debt owed by Vuzix to the Company. Upon receipt of the warrants, the Company should have recorded the value of the warrant of approximately $352,000 in its consolidated financial statements. Subsequently, the Company should have marked to market the warrants at the end of each reporting period. Had the Company recorded the warrants in its consolidated financial statements and marked to market the warrants as of December 28, 2013 and December 27, 2014, the Company would have recorded gains in its statement of operations of approximately $646,000 and $171,000, respectively. In the first quarter of 2015, the Company recorded the warrants in its consolidated financial statements and as a result recorded a gain of approximately $1.3 million with $817,000 attributed to prior periods. The value of the warrants as of August 2013, December 28, 2013 and December 27, 2014 was determined using the Black-Scholes pricing model. The Company does not believe the unrecorded gains were material to the consolidated financial statements as the loss from operations for the fiscal years ended December 28, 2013 and December 27, 2014 were $35.9 million and $28.5 million, respectively.
Non-Marketable Securities—Equity Method Investments
Equity losses in unconsolidated affiliates recorded in the consolidated statement of operations are as follows:
2015 | 2014 | 2013 | |||||||||
KoBrite | $ | — | $ | (102,305 | ) | $ | (406,811 | ) | |||
Ask Ziggy | $ | (47,443 | ) | $ | (284,137 | ) | $ | (218,287 | ) | ||
Total | $ | (47,443 | ) | $ | (386,442 | ) | $ | (625,098 | ) | ||
In the second quarter of 2014 the Company wrote-off its $1.3 million investment in KoBrite. Prior to the write-off, the Company accounted for its 12% ownership interest in Kobrite using the equity method. One of the Company’s directors is a member of the Board of Directors of Bright LED, principal investor of KoBrite.
In December 2013, the Company wrote down its investment of $2.5 million in Ask Ziggy. The Company continued to fund Ask Ziggy during the first quarter of year ending December 26, 2015. During the twelve months ended December 28, 2013, the Company recorded impairment charges of $2.5 million related to the write-off of a cost based investment.
Summarized financial information for 2013 includes Kobrite for the year ended September 30, 2013 and Ask Ziggy for the five month period August 1, 2013 through December 28, 2013. As of December 26, 2015 and December 27, 2014, the Company no longer has any equity-method investments with value in the financial statements.
2013 | |||
Current assets | $ | 7,769,000 | |
Noncurrent assets | 10,663,000 | ||
Current liabilities | 1,207,000 | ||
Revenues | 5,085,000 | ||
Margin loss | (2,501,000 | ) | |
Loss from operations | (6,114,000 | ) | |
Net loss | (5,526,000 | ) | |
The Company has a $15.0 million note receivable as a result of the sale of its III-V product line and investment in KTC, which was paid on January 15, 2016.
The Company has a loan to a non-officer employee for approximately $140,000 at December 26, 2015 and December 27, 2014, which is currently due.
5. Business Combinations
Kopin Software Ltd.
In the fourth quarter of 2015, the Company increased its ownership in Kopin Software Ltd. from 58% to 100% and acquired 17.5% in a new company by paying GBP 1 to a former employee and transferring the rights of certain software programs to the new company. The former employee is a co-founder of the new company. The Company has ascribed an immaterial amount to its investment in the new company.
54
KOPIN CORPORATION
NOTES TO CONSOLIDATED FINANCIAL STATEMENTS—(Continued)
eMDT
In April 2013, the Company acquired 51% of the outstanding stock of eMDT, a private company, for $400,000. In connection with the acquisition, the Company allocated excess purchase price in the amount of approximately $400,000 to goodwill. The goodwill will not be deductible for tax purposes. During the second quarter of 2014, the Company paid approximately $0.3 million to acquire an additional 29% ownership in its eMDT subsidiary increasing its ownership percentage to 80%. As of December 26, 2015, the Company has an option to acquire the remaining equity of the Company for $200,000.
Kowon
In 2013, the Company paid approximately $3.7 million to acquire an additional 15% ownership in its Kowon subsidiary which raised its ownership from 78% to 93%.
6. Goodwill and Intangibles
The Company’s goodwill balance is as follows:
Fiscal Year Ended | |||||||
December 26, 2015 | December 27, 2014 | ||||||
Beginning Balance | $ | 976,451 | $ | 1,016,132 | |||
Change due to exchange rate fluctuations | (30,369 | ) | (39,681 | ) | |||
Ending Balance | $ | 946,082 | $ | 976,451 | |||
The Company performs impairment tests of goodwill at its reporting unit level. The Company conducts its annual goodwill impairment test on the last day of each fiscal year unless factors indicate that an impairment may have occurred. As of December 26, 2015, the Company performed a qualitative analysis which determined there was no impairment of the Company's goodwill. Goodwill is included in the Kopin reportable segment.
At December 28, 2013, the Company performed a review of the FDD intangibles assets and determined that the customer relationships, technology and trademarks were impaired. The Company performed a remeasurement of the fair value of the intangible assets using the income approach and as a result the Company wrote down the value of the intangible assets by $1.2 million in the year ended December 28, 2013. At December 28, 2013, the Company determined that as a result of a change in the strategic direction of Kopin Software Ltd. the value of its customer relationships were impaired and the Company wrote down the value of the intangible assets by $0.3 million.
The discount rate used was the value-weighted average of the Company’s estimated cost of equity and debt (“cost of capital”) derived using both known and estimated customary market metrics.
The identified intangible assets will be amortized on a straight-line basis over the following lives:
Years | |
Customer relationships | 7 |
Developed technology | 7 |
Trademark portfolio | 7 |
The Company recognized $0.6 million, $1.0 million and $0.3 million in amortization for the fiscal years ended December 26, 2015, December 27, 2014 and December 28, 2013, respectively.
7. Financial Instruments
Fair Value Measurements
Under accounting guidance, financial instruments are categorized as Level 1, Level 2 or Level 3 based upon the method by which their fair value is computed. An investment is categorized as Level 1 when its fair value is based on unadjusted quoted prices in active markets for identical assets that the Company has the ability to access at the measurement date. An investment is categorized as Level 2 if its fair market value is based on quoted market prices for similar assets in active markets, quoted prices for identical or similar assets in markets that are not active, based on observable inputs such as interest rates, yield curves, or derived from or corroborated by observable market data by correlation or other means. An investment is categorized
55
KOPIN CORPORATION
NOTES TO CONSOLIDATED FINANCIAL STATEMENTS—(Continued)
as Level 3 if its fair value is based on assumptions developed by the Company about what a market participant would use in pricing the assets.
The Company’s investments are either held by brokers or in the case of publicly-held corporation, by the Company. The brokers who hold the Company’s investments provide periodic reporting on both the cost and fair value of the securities. The Company performs various procedures to corroborate the fair value provided by the brokers. Debt securities reflected in the table below include investments such as certificates of deposit, commercial paper, corporate bonds, government bonds, and money market fund deposits. When the Company uses observable market prices for identical securities that are traded in less active markets, its debt investments are classified as Level 2. When observable market prices for identical securities are not available, the Company prices the debt investments it owns using non-binding market consensus prices that are corroborated with observable market data; quoted market prices for similar instruments; or pricing models, such as a discounted cash flow model, with all significant inputs derived from or corroborated with observable market data. Non-binding market consensus prices are based on quotes from brokers. The discounted cash flow model uses observable market inputs, such as US treasury-based yield curves.
The following table details the fair value measurements within the fair value hierarchy of the Company’s financial assets:
Fair Value Measurement at December 26, 2015 Using: | |||||||||||||||
Total | Level 1 | Level 2 | Level 3 | ||||||||||||
Money Markets and Cash Equivalents | $ | 19,767,889 | $ | 19,767,889 | $ | — | $ | — | |||||||
U.S. Government Securities | 46,464,663 | 16,381,152 | 30,083,511 | — | |||||||||||
Corporate Debt | 6,886,495 | — | 6,886,495 | — | |||||||||||
Certificates of Deposit | 7,591,733 | — | 7,591,733 | — | |||||||||||
GCS Holdings | 232,037 | 232,037 | — | — | |||||||||||
$ | 80,942,817 | $ | 36,381,078 | $ | 44,561,739 | $ | — | ||||||||
Fair Value Measurement at December 27, 2014 Using: | |||||||||||||||
Total | Level 1 | Level 2 | Level 3 | ||||||||||||
Money Markets and Cash Equivalents | $ | 14,635,802 | $ | 14,635,802 | $ | — | $ | — | |||||||
U.S. Government Securities | 57,697,142 | 21,218,340 | 36,478,802 | — | |||||||||||
Corporate Debt | 5,970,983 | — | 5,970,983 | — | |||||||||||
Certificates of Deposit | 12,555,010 | — | 12,555,010 | — | |||||||||||
Vuzix Corporation | 1,500,777 | 1,500,777 | — | — | |||||||||||
GCS Holdings | 180,347 | 180,347 | — | — | |||||||||||
$ | 92,540,061 | $ | 37,535,266 | $ | 55,004,795 | $ | — | ||||||||
The corporate debt consists of floating rate notes with a maturity that is over multiple years but has interest rates which are reset every three months based on the then current three month London Interbank Offering Rate (3 month Libor). The Company evaluates the fair market values of these corporate debt instruments through the use of a model which incorporates the 3 month Libor, the credit default swap rate of the issuer and the bid and ask price spread of same or similar investments which are traded on several markets.
The carrying amounts of cash equivalents, accounts receivable, accounts payable and accrued liabilities approximate fair value because of their short term nature. The carrying amount of accrued liabilities is classified as Level 2 in the fair value hierarchy.
56
KOPIN CORPORATION
NOTES TO CONSOLIDATED FINANCIAL STATEMENTS—(Continued)
Marketable Debt Securities
Investments in available-for-sale marketable debt securities are as follows at December 26, 2015 and December 27, 2014:
Amortized Cost | Unrealized Gains | Unrealized Losses | Fair Value | ||||||||||||||||||||||||||||
2015 | 2014 | 2015 | 2014 | 2015 | 2014 | 2015 | 2014 | ||||||||||||||||||||||||
U.S. government and agency backed securities | $ | 46,586,224 | $ | 57,897,914 | $ | — | $ | — | $ | (121,561 | ) | $ | (200,772 | ) | $ | 46,464,663 | $ | 57,697,142 | |||||||||||||
Corporate debt and certificates of deposits | 14,534,247 | 18,564,823 | — | — | (56,019 | ) | (38,830 | ) | 14,478,228 | 18,525,993 | |||||||||||||||||||||
Total | $ | 61,120,471 | $ | 76,462,737 | $ | — | $ | — | $ | (177,580 | ) | $ | (239,602 | ) | $ | 60,942,891 | $ | 76,223,135 | |||||||||||||
The contractual maturity of the Company’s marketable debt securities is as follows at December 26, 2015:
Less than One year | One to Five years | Greater than Five years | Total | ||||||||||||
U.S. government and agency backed securities | $ | 17,460,832 | $ | 23,906,600 | $ | 5,097,231 | $ | 46,464,663 | |||||||
Corporate debt and certificates of deposits | 12,086,055 | 2,392,173 | — | 14,478,228 | |||||||||||
Total | $ | 29,546,887 | $ | 26,298,773 | $ | 5,097,231 | $ | 60,942,891 | |||||||
Other-than-Temporary Impairments
The Company reviews its marketable debt securities on a quarterly basis for the presence of other-than-temporary impairment (OTTI).
If the Company determines that an OTTI has occurred it further estimates the amount of OTTI resulting from a decline in the credit worthiness of the issuer (credit-related OTTI) and the amount of non credit-related OTTI. Noncredit-related OTTI can be caused by such factors as market illiquidity. Credit-related OTTI is recognized in earnings while noncredit-related OTTI on securities not expected to be sold is recognized in other comprehensive income (OCI). The Company did not record any OTTI for the fiscal years 2015, 2014 and 2013.
8. Stockholders’ Equity and Stock-Based Compensation
The Company has stock-based awards outstanding under two plans. In 2001, the Company adopted a 2001 Equity Incentive Plan (the Equity Plan). The Equity Plan authorized 7,100,000 shares of common stock, to be issued to employees, non-employees, and members of the Board of Directors (the Board). The Equity Plan had a ten year life and therefore no new equity awards may be issued under this plan. In 2010, the Company adopted a 2010 Equity Incentive Plan (the 2010 Equity Plan) which authorized the issuance of shares of common stock to employees, non-employees, and the Board. The 2010 Equity Plan has been subsequently amended to increase the number of authorized shares. The number of shares authorized under the 2010 Equity Plan is the number of shares approved by the shareholders plus the number of shares of common stock which were available for grant under the Equity Plan, the number of shares of common stock which were the subject of awards outstanding under the Equity Plan and are forfeited, terminated, canceled or expire after the adoption of the 2010 Equity Plan and the number of shares of common stock delivered to the Company either in exercise of an Equity Plan award or in satisfaction of a tax withholding obligation. The option price of statutory incentive stock options shall not be less than 100% of the fair market value of the stock at the date of grant, or in the case of certain statutory incentive stock options, at 110% of the fair market value at the time of the grant. The option price of nonqualified stock options is determined by the Board or Compensation Committee. Options must be exercised within a ten-year period or sooner if so specified within the option agreement. The term and vesting period for restricted stock awards and options granted under the 2010 Equity Plan are determined by the Board’s compensation committee.
The Company has approximately 2.2 million shares of common stock authorized and available for issuance under the Company’s 2010 Equity Plan.
In March 2013, the Company’s Board of Directors authorized the repurchase of the Company’s common stock in open market or negotiated transactions through March 2014. During the period March 2013 through March 2014 the Company purchased 2,241,121 shares of its common stock for $8,290,573.
57
KOPIN CORPORATION
NOTES TO CONSOLIDATED FINANCIAL STATEMENTS—(Continued)
Stock Options
A summary of stock option activity under the stock award plans as of December 26, 2015 and changes during the twelve month period is as follows:
2015 | ||||||
Shares | Weighted Average Exercise Price | |||||
Balance, beginning of year | 130,500 | $ | 3.49 | |||
Options forfeited/canceled | (125,358 | ) | 3.50 | |||
Options exercised | (5,142 | ) | 3.16 | |||
Balance, end of year | — | $ | — | |||
The Company has no stock options outstanding at December 26, 2015 and no stock options were issued in 2015, 2014 or 2013. The intrinsic value of options exercised in 2015, 2014 and 2013 was approximately $0, $26,000 and $0, respectively. The Company issued warrants to purchase 200,000 shares of the Company’s stock at $3.49 which were exercised on a cashless basis in 2015.
Cash received from option and warrant exercises under all share-based payment arrangements was approximately $0.1 million for fiscal year 2015. No tax benefits were realized during the three year period ended 2015 due to the existence of tax net operating loss carryforwards.
NonVested Restricted Common Stock
The Company has issued shares of nonvested restricted common stock to certain employees. Each award requires the employee to fulfill certain obligations, including remaining employed by the Company for one, two or four years (the vesting period) and in certain cases also meeting performance criteria. A summary of the activity for nonvested restricted common stock awards as of December 26, 2015 and changes during the twelve months then ended is presented below:
Shares | Weighted Average Grant Fair Value | |||||
Balance, December 27, 2014 | 2,551,631 | $ | 3.75 | |||
Granted | 1,255,696 | 3.77 | ||||
Forfeited | (388,320 | ) | 3.64 | |||
Vested | (1,226,991 | ) | 3.68 | |||
Balance, December 26, 2015 | 2,192,016 | $ | 3.82 | |||
Subsequent to the year ended December 27, 2014, the Company identified an error in its calculation of the weighted average grant fair value of issued restricted stock outstanding as of December 27, 2014. The Company had disclosed a weighted average grant fair value of $4.41 in its Form 10-K for the year ended December 27, 2014, however the correct weighted average grant fair value was $3.75.
During the three month period ended June 27, 2015, the performance conditions for 50,000 awards granted in 2014 were determined and achieved.
The forfeitures in 2015 were primarily due to fact that the performance criteria were not met related to these awards.
Stock-Based Compensation
The following table summarizes stock-based compensation expense related to employee stock options and nonvested restricted common stock awards for the fiscal years 2015, 2014 and 2013 (no tax benefits were recognized):
58
KOPIN CORPORATION
NOTES TO CONSOLIDATED FINANCIAL STATEMENTS—(Continued)
2015 | 2014 | 2013 | |||||||||
Cost of component revenues | $ | 729,715 | $ | 766,221 | $ | 414,842 | |||||
Research and development | 776,946 | 965,945 | 423,548 | ||||||||
Selling, general and administrative | 1,638,818 | 3,095,606 | 3,365,018 | ||||||||
Total | $ | 3,145,479 | $ | 4,827,772 | $ | 4,203,408 | |||||
Total unrecognized compensation expense for the nonvested restricted common stock as of December 26, 2015 is $4.4 million and is expected to be recognized over a period of two years.
9. Concentrations of Risk
Ongoing credit evaluations of customers’ financial condition are performed and collateral, such as letters of credit, are generally not required. The following table depicts the customer’s trade receivable balance as a percentage of gross trade receivables as of the end of the year indicated. (The symbol “*” indicates that accounts receivables from that customer were less than 10% of the Company’s total accounts receivable.)
Percent of Gross Accounts Receivable | |||
Customer | 2015 | 2014 | |
Company A | * | 32 | |
Company B | 21 | 14 | |
Company C | * | 9 | |
Company D | 15 | * | |
Company E | * | 1 | |
Company F | * | 5 | |
Company G | * | 8 | |
Sales to significant non-affiliated customers for fiscal years 2015, 2014 and 2013, as a percentage of total revenues, is shown in the table below. Note the caption “Military Customers in Total” in the table below excludes research and development contracts. The Company sells its displays to Japanese customers through Ryoden Trading Company. (The symbol “*” indicates that sales to that customer were less than 10% of the Company’s total revenues.)
Sales as a Percent of Total Revenue | |||||
Fiscal Year | |||||
Customer | 2015 | 2014 | 2013 | ||
Military Customers in Total | 32 | 45 | 38 | ||
Company A | 18 | 26 | 13 | ||
Company C | 22 | 11 | * | ||
Company E | * | * | 18 | ||
Funded Research and Development Contracts | 12 | 4 | 7 | ||
59
KOPIN CORPORATION
NOTES TO CONSOLIDATED FINANCIAL STATEMENTS—(Continued)
10. Income Taxes
The (benefit) provision for income taxes from continuing operations consists of the following for the fiscal years indicated:
Fiscal Year | |||||||||||
2015 | 2014 | 2013 | |||||||||
Current | |||||||||||
Federal | $ | — | $ | — | $ | (13,124,000 | ) | ||||
State | 50,000 | 50,000 | 12,000 | ||||||||
Foreign | — | — | (34,000 | ) | |||||||
Total current provision (benefit) | 50,000 | 50,000 | (13,146,000 | ) | |||||||
Deferred | |||||||||||
Federal | (5,356,000 | ) | (9,554,000 | ) | (3,616,000 | ) | |||||
State | (62,000 | ) | (1,709,000 | ) | 644,000 | ||||||
Foreign | 188,000 | 411,000 | (565,000 | ) | |||||||
Change in valuation allowance | 5,155,000 | 10,622,000 | 3,750,000 | ||||||||
Total deferred (benefit) provision | (75,000 | ) | (230,000 | ) | 213,000 | ||||||
Total (benefit) provision for income taxes | $ | (25,000 | ) | $ | (180,000 | ) | $ | (12,933,000 | ) | ||
Net operating losses were not utilized in 2015, 2014 and 2013 to offset federal and state taxes.
The actual income tax (benefit) provision reported from operations are different than those which would have been computed by applying the federal statutory tax rate to loss before income tax (benefit) provision. A reconciliation of income tax (benefit) provision from continuing operations as computed at the U.S. federal statutory income tax rate to the provision for income tax benefit is as follows:
Fiscal Year | |||||||||||
2015 | 2014 | 2013 | |||||||||
Tax provision at federal statutory rates | $ | (5,187,000 | ) | $ | (9,964,000 | ) | $ | (13,322,000 | ) | ||
State tax liability | 33,000 | 33,000 | 8,000 | ||||||||
Foreign deferred | 153,000 | 371,000 | (644,000 | ) | |||||||
Foreign withholding | (75,000 | ) | (196,000 | ) | 308,000 | ||||||
Outside basis in KTC and Kowon, net | (180,000 | ) | (394,000 | ) | (202,000 | ) | |||||
Nondeductible expenses | (402,000 | ) | (21,000 | ) | 306,000 | ||||||
Increase in net state operating loss carryforwards | (158,000 | ) | (177,000 | ) | (2,868,000 | ) | |||||
Utilization of net operating losses for U.K. research and development refund | 719,000 | 1,089,000 | — | ||||||||
Provision to tax return adjustments and state tax rate change | 264,000 | (516,000 | ) | (33,000 | ) | ||||||
Tax credits | (501,000 | ) | (610,000 | ) | (390,000 | ) | |||||
Non-deductible 162M compensation limitations | 40,000 | 196,000 | 558,000 | ||||||||
Non-deductible equity compensation | (34,000 | ) | (687,000 | ) | (418,000 | ) | |||||
Other, net | 148,000 | 74,000 | 14,000 | ||||||||
Change in valuation allowance | 5,155,000 | 10,622,000 | 3,750,000 | ||||||||
$ | (25,000 | ) | $ | (180,000 | ) | $ | (12,933,000 | ) | |||
Pretax foreign losses from continuing operations were approximately $(968,000), $(2,588,000) and $(4,966,000) for fiscal years 2015, 2014 and 2013, respectively. The Company has made the decision to close Kowon and accordingly reflected a liability for unremitted earnings.
The benefit for income taxes for the fiscal year ended 2015 of $25,000 represents the net of state and foreign withholding tax.
60
KOPIN CORPORATION
NOTES TO CONSOLIDATED FINANCIAL STATEMENTS—(Continued)
Deferred income taxes are provided to recognize the effect of temporary differences between tax and financial reporting. Deferred income tax assets and liabilities consist of the following:
Fiscal Year | |||||||
2015 | 2014 | ||||||
Deferred tax liability: | |||||||
Foreign withholding liability | $ | (1,207,000 | ) | $ | (1,282,000 | ) | |
Foreign unremitted earnings | (2,701,000 | ) | (2,882,000 | ) | |||
Deferred tax assets: | |||||||
Federal net operating loss carryforwards | 28,984,000 | 22,758,000 | |||||
State net operating loss carryforwards | 1,913,000 | 1,689,000 | |||||
Foreign net operating loss carryforwards | 2,430,000 | 2,612,000 | |||||
Equity awards | 2,249,000 | 2,508,000 | |||||
Tax credits | 6,768,000 | 6,267,000 | |||||
Equipment | 1,113,000 | 1,024,000 | |||||
Investments | 3,240,000 | 5,279,000 | |||||
Other | 3,667,000 | 3,253,000 | |||||
Net deferred tax assets | 46,456,000 | 41,226,000 | |||||
Valuation allowance | (47,663,000 | ) | (42,508,000 | ) | |||
$ | (1,207,000 | ) | $ | (1,282,000 | ) | ||
As of December 26, 2015, the Company has available for tax purposes federal net operating loss carryforwards (NOLs) of $82.8 million expiring through 2035. The Company has recognized a full valuation allowance on its net deferred tax assets as the Company has concluded that such assets are not more likely than not to be realized. The $5.2 million increase in valuation allowance during fiscal year 2015 was primarily due to an increase in net operating loss carryforwards. The 10.6 million increase in valuation allowance during fiscal year 2014 was primarily due to net operating losses generated of $21.4 million and the sale of III-V assets. The Company has not historically recorded, nor does it intend to record the tax benefits from stock awards until realized. Unrecorded benefits from stock awards approximated $10.3 million at December 26, 2015.
The Company has suspended operations and terminated the majority of employees at its Korean subsidiary, Kowon. The assets, primarily buildings and land, have been put up for sale. It is more likely than not that the Company's share of the net book value of its Korean investment would be repatriated to the U.S. resulting in a Korean withholding tax of $1.2 million. As a result of the Company no longer being permanently reinvested in Korea, a deferred tax liability for the unremitted earnings in the Korean subsidiary has been booked for $2.7 million.
In September 2013, the U.S. Department of the Treasury and the Internal Revenue Service released final regulations relating to guidance on applying tax rules to amounts paid to acquire, produce or improve tangible personal property as well as rules for materials and supplies. The Company is currently assessing these rules and the impacts to the financial statements, if any.
The Company’s income tax returns have not been examined by the Internal Revenue Service and are subject to examination for all years since 2001. State income tax returns are generally subject to examination for a period of three to five years after filing of the respective return. The state impact of any federal changes remains subject to examination by various states for a period of up to one year after formal notification to the states.
International jurisdictions have statutes of limitations generally ranging from three to seven years after filing of the respective return. Years still open to examination by tax authorities in major jurisdictions include Korea (2007 onward), Japan (2007 onward), Hong Kong (2009 onward) and United Kingdom (2012 onward). The Company is not currently under examination in these jurisdictions.
61
KOPIN CORPORATION
NOTES TO CONSOLIDATED FINANCIAL STATEMENTS—(Continued)
11. Accrued Warranty
The Company warrants its products against defect for 12 months. A provision for estimated future costs and estimated returns for credit relating to warranty is recorded in the period when product is shipped and revenue recognized, and is updated as additional information becomes available. The Company’s estimate of future costs to satisfy warranty obligations is based primarily on historical warranty expense experienced and a provision for potential future product failures. Changes in the accrued warranty for fiscal years 2015 and 2014 are as follows:
Fiscal Year Ended | |||||||
December 26, 2015 | December 27, 2014 | ||||||
Beginning Balance | $ | 716,000 | $ | 716,000 | |||
Additions | 598,000 | 798,000 | |||||
Claim and reversals | (796,000 | ) | (798,000 | ) | |||
Ending Balance | $ | 518,000 | $ | 716,000 | |||
12. Employee Benefit Plan
The Company has an employee benefit plan pursuant to Section 401(k) of the Internal Revenue Code of 1986, as amended. In 2015, the plan allowed employees to defer an amount of their annual compensation up to a current maximum of $18,000 if they are under the age of 50 and $24,000 if they are over the age of 50. The Company matches 50% of all deferred compensation on the first 6% of each employee’s deferred compensation. The amount charged to operations in connection with this plan was approximately $324,000, $224,000 and $146,000 in fiscal years 2015, 2014 and 2013, respectively.
13. Commitments and Contingencies
Leases
The Company leases facilities located in Westborough, Massachusetts, Santa Clara, California, Scotts Valley, California, Dalgety Bay, Scotland and Nottingham, United Kingdom, under non-cancelable operating leases. The Westborough lease expires in 2023. The Santa Clara lease expires in 2016. The Scotts Valley lease expires in 2018. The Dalgety Bay lease expires in 2016. The Company also leases two facilities in Nottingham, United Kingdom which expire in 2016 and 2017. Substantially all real estate taxes, insurance and maintenance expenses under these leases are the Company’s obligations and are expensed as incurred and were immaterial. The following is a schedule of minimum rental commitments under non-cancelable operating leases at December 26, 2015:
Fiscal Year ending, | Amount | ||
2016 | $ | 1,097,000 | |
2017 | 800,000 | ||
2018 | 666,000 | ||
2019 | 639,000 | ||
2020 | 637,000 | ||
Thereafter | 1,492,000 | ||
Total minimum lease payments | $ | 5,331,000 | |
Amounts incurred under operating leases are recorded as rent expense on a straight-line basis and aggregated approximately $1.7 million in fiscal year 2015, $1.7 million in fiscal year 2014 and $1.3 million in fiscal year 2013.
Other Agreements
The Company has entered into various license agreements which require payment of royalties based upon a set percentage of product sales, subject in some cases, to certain minimum amounts. Total royalty expense approximated $22,000, $37,000 and $20,000, respectively, in fiscal years 2015, 2014 and 2013.
In 2015, the Company entered into an agreement with the intent to purchase approximately 2% of a company for approximately $2.5 million, subject to certain government approvals and agreement on valuation.
62
KOPIN CORPORATION
NOTES TO CONSOLIDATED FINANCIAL STATEMENTS—(Continued)
14. Litigation
The Company may engage in legal proceedings arising in the ordinary course of business. Claims, suits, investigations and proceedings are inherently uncertain and it is not possible to predict the ultimate outcome of such matters and our business, financial condition, results of operations or cash flows could be affected in any particular period.
15. Segments and Geographical Information
The Company’s chief operating decision maker is its Chief Executive Officer. The Company has determined it has two reportable segments, FDD, the manufacturer of its reflective display products for test and simulation products, and Kopin, which is comprised of Kopin Corporation, Kowon, Kopin Software Ltd. and eMDT.
Kopin | FDD | Total | |||||||||
2015 | |||||||||||
Revenues | $ | 28,538 | $ | 3,516 | $ | 32,054 | |||||
Net loss attributable to the controlling interest | (13,429 | ) | (1,264 | ) | (14,693 | ) | |||||
Total assets from continuing operations | 104,677 | 1,524 | 106,201 | ||||||||
Long-lived assets from continuing operations | 2,639 | 38 | 2,677 | ||||||||
Property and plant held for sale | 819 | — | 819 | ||||||||
2014 | |||||||||||
Revenues | $ | 28,333 | $ | 3,474 | $ | 31,807 | |||||
Net loss attributable to the controlling interest | (26,402 | ) | (1,810 | ) | (28,212 | ) | |||||
Total assets from continuing operations | 121,301 | 1,640 | 122,941 | ||||||||
Long-lived assets from continuing operations | 4,343 | 246 | 4,589 | ||||||||
2013 | |||||||||||
Revenues | $ | 19,883 | $ | 3,014 | $ | 22,898 | |||||
Net loss attributable to the controlling interest | (2,003 | ) | (2,707 | ) | (4,710 | ) | |||||
Total assets from continuing operations | 143,953 | 2,179 | 146,132 | ||||||||
Long-lived assets from continuing operations | 5,488 | 547 | 6,035 | ||||||||
Geographical revenue information for the three years ended December 26, 2015, December 27, 2014 and December 28, 2013 was based on the location of the customers and is as follows:
Fiscal Year | ||||||||||||||||||||
2015 | 2014 | 2013 | ||||||||||||||||||
Revenue | % of Total | Revenue | % of Total | Revenue | % of Total | |||||||||||||||
US | $ | 21,758,000 | 68 | % | $ | 19,695,000 | 62 | % | $ | 11,927,000 | 53 | % | ||||||||
Other Americas | 395,000 | 1 | % | 416,000 | 1 | % | 230,000 | 1 | % | |||||||||||
Total Americas | 22,153,000 | 69 | % | 20,111,000 | 63 | % | 12,157,000 | 54 | % | |||||||||||
Asia-Pacific | 7,160,000 | 22 | % | 8,245,000 | 26 | % | 8,292,000 | 36 | % | |||||||||||
Europe | 2,741,000 | 9 | % | 3,451,000 | 11 | % | 2,449,000 | 10 | % | |||||||||||
Total Revenues | $ | 32,054,000 | 100 | % | $ | 31,807,000 | 100 | % | $ | 22,898,000 | 100 | % | ||||||||
Long-lived assets by geographic area are as follows:
Fiscal Years | |||||||
2015 | 2014 | ||||||
United States of America | $ | 2,613,000 | $ | 2,689,000 | |||
United Kingdom | 64,000 | 377,000 | |||||
Republic of Korea | — | 1,523,000 | |||||
$ | 2,677,000 | $ | 4,589,000 | ||||
63
KOPIN CORPORATION
NOTES TO CONSOLIDATED FINANCIAL STATEMENTS—(Continued)
16. Selected Quarterly Financial Information (Unaudited)
The following tables present Kopin’s quarterly operating results for the fiscal years ended December 26, 2015 and December 27, 2014. The information for each of these quarters is unaudited and has been prepared on the same basis as the audited consolidated financial statements. In the opinion of management, all necessary adjustments, consisting only of normal recurring adjustments, have been included to present fairly the unaudited consolidated quarterly results when read in conjunction with Kopin’s audited consolidated financial statements and related notes. These operating results are not necessarily indicative of the results of any future period.
Quarterly Periods During Fiscal Year Ended December 26, 2015:
Three months ended March 28, 2015 (3) | Three months ended June 27, 2015 (4) | Three months ended September 26, 2015 | Three months ended December 26, 2015 | ||||||||||||
(In thousands, except per share data) | |||||||||||||||
Revenue | $ | 8,585 | $ | 10,857 | $ | 8,001 | $ | 4,612 | |||||||
Gross profit (2) | $ | 1,845 | $ | 3,127 | $ | 1,762 | $ | (170 | ) | ||||||
Loss from operations | $ | (5,945 | ) | $ | (5,495 | ) | $ | (5,923 | ) | $ | (7,958 | ) | |||
Net (loss) gain attributable to the controlling interest | $ | (3,838 | ) | $ | 781 | $ | (4,675 | ) | $ | (6,961 | ) | ||||
Net (loss) gain per share from continuing operations (1): | |||||||||||||||
Basic | $ | (0.06 | ) | $ | 0.01 | $ | (0.07 | ) | $ | (0.11 | ) | ||||
Diluted | $ | (0.06 | ) | $ | 0.01 | $ | (0.07 | ) | $ | (0.11 | ) | ||||
Shares used in computing net loss per share from continuing operations: | |||||||||||||||
Basic | 63,084 | 63,066 | 63,068 | 63,608 | |||||||||||
Diluted | 63,084 | 65,030 | 63,068 | 63,608 | |||||||||||
(1) | Net loss per share is computed independently for each of the quarters presented; accordingly, the sum of the quarterly net income per share may not equal the total computed for the year. |
(2) | Gross profit is defined as net product revenue less cost of product revenues. |
(3) | Includes $2.1 million impact on net gain attributable to the controlling interest relating to the gain on sale of an investment for the three month period ended March 28, 2015. |
(4) | Includes $5.5 million impact on net gain attributable to the controlling interest relating to the gain on sale of an investment for the three month period ended June 27, 2015. |
Quarterly Periods During Fiscal Year Ended December 27, 2014:
Three months ended March 29, 2014 | Three months ended June 28, 2014 | Three months ended September 27, 2014 | Three months ended December 28, 2013 (3) | ||||||||||||
(In thousands, except per share data) | |||||||||||||||
Revenue | $ | 4,695 | $ | 6,943 | $ | 9,532 | $ | 10,637 | |||||||
Gross profit (2) | $ | 2 | $ | 753 | $ | 3,861 | $ | 2,701 | |||||||
(Loss) income from continuing operations | $ | (9,614 | ) | $ | (7,269 | ) | $ | (5,520 | ) | $ | (6,073 | ) | |||
Net loss attributable to the controlling interest | $ | (9,134 | ) | $ | (8,806 | ) | $ | (4,469 | ) | $ | (5,302 | ) | |||
Net loss per share from continuing operations (1): | |||||||||||||||
Basic | $ | (0.15 | ) | $ | (0.14 | ) | $ | (0.08 | ) | $ | (0.08 | ) | |||
Diluted | $ | (0.15 | ) | $ | (0.14 | ) | $ | (0.08 | ) | $ | (0.08 | ) | |||
Shares used in computing net loss per share from continuing operations: | |||||||||||||||
Basic | 62,530 | 62,644 | 62,647 | 62,734 | |||||||||||
Diluted | 62,530 | 62,644 | 62,647 | 62,734 | |||||||||||
64
KOPIN CORPORATION
NOTES TO CONSOLIDATED FINANCIAL STATEMENTS—(Continued)
(1) | Net loss per share is computed independently for each of the quarters presented; accordingly, the sum of the quarterly net income per share may not equal the total computed for the year. |
(2) | Gross profit is defined as net component revenue less cost of component revenues. |
(3) | Includes $1.3 million impact in loss from operations and net loss attributable to the controlling interest attributable to the write off of an investment for the three month period ended June 28, 2014, as described in Note 4. |
65
SIGNATURES
Pursuant to the requirements of Section 13 or 15(d) of the Securities Exchange Act of 1934, the registrant has duly caused this report to be signed on its behalf by the undersigned, thereunto duly authorized.
March 4, 2016
KOPIN CORPORATION | ||
By: | /s/ JOHN C.C. FAN | |
John C.C. Fan Chairman of the Board, Chief Executive Officer, President and Director | ||
Pursuant to the requirements of the Securities Exchange Act of 1934, this report has been signed below by the following persons on behalf of the registrant in the capacities and on the dates indicated.
Signature | Title | Date | ||
/s/ JOHN C.C. FAN | Chairman of the Board, Chief Executive Officer, President and Director (Principal Executive Officer) | March 4, 2016 | ||
John C.C. Fan | ||||
/s/ JAMES BREWINGTON | Director | March 4, 2016 | ||
James Brewington | ||||
/s/ DAVID E. BROOK | Director | March 4, 2016 | ||
David E. Brook | ||||
/s/ MORTON COLLINS | Director | March 4, 2016 | ||
Morton Collins | ||||
/s/ ANDREW H. CHAPMAN | Director | March 4, 2016 | ||
Andrew H. Chapman | ||||
/s/ CHI CHIA HSIEH | Director | March 4, 2016 | ||
Chi Chia Hsieh | ||||
/s/ MICHAEL J. LANDINE | Director | March 4, 2016 | ||
Michael J. Landine | ||||
/s/ RICHARD A. SNEIDER | Treasurer and Chief Financial Officer (Principal Financial and Accounting Officer) | March 4, 2016 | ||
Richard A. Sneider | ||||
66
KOPIN CORPORATION
SCHEDULE II—VALUATION AND QUALIFYING ACCOUNTS
Fiscal Years Ended December 26, 2015, December 27, 2014 and December 28, 2013
Description | Balance at Beginning of Year | Additions Charged to Income | Deductions from Reserve | Balance at End of Year | |||||||||||
Reserve deducted from assets—allowance for doubtful accounts: | |||||||||||||||
2013 | $ | 311,000 | $ | 19,000 | $ | (128,000 | ) | $ | 202,000 | ||||||
2014 | 202,000 | 81,000 | (17,000 | ) | 266,000 | ||||||||||
2015 | 266,000 | — | (113,000 | ) | 153,000 | ||||||||||
67
INDEX TO EXHIBITS
Exhibits | Sequential page number | |||||
3.1 | Amended and Restated Certificate of Incorporation | (2 | ) | |||
3.2 | Amendment to Certificate of Incorporation | (5 | ) | |||
3.3 | Amendment to Certificate of Incorporation | (5 | ) | |||
3.4 | Fourth Amended and Restated By-laws | (8 | ) | |||
4 | Specimen Certificate of Common Stock | (1 | ) | |||
10.1 | Form of Employee Agreement with Respect to Inventions and Proprietary Information | (1 | ) | |||
10.2 | Kopin Corporation 2001 Equity Incentive Plan | (7 | ) | * | ||
10.3 | Kopin Corporation 2001 Equity Incentive Plan Amendment | (9 | ) | * | ||
10.4 | Kopin Corporation 2001 Equity Incentive Plan Amendment | (10 | ) | * | ||
10.5 | Kopin Corporation 2001 Equity Incentive Plan Amendment | (11 | ) | * | ||
10.6 | Kopin Corporation 2001 Equity Incentive Plan Amendment | (13 | ) | * | ||
10.7 | Kopin Corporation 2001 Supplemental Equity Incentive Plan | (6 | ) | * | ||
10.8 | Form of Key Employee Stock Purchase Agreement | (1 | ) | * | ||
10.9 | License Agreement by and between the Company and Massachusetts Institute of Technology dated April 22, 1985, as amended | (1 | ) | |||
10.10 | Facility Lease, by and between the Company and Massachusetts Technology Park Corporation, dated October 15, 1993 | (3 | ) | |||
10.11 | Joint Venture Agreement, by and among the Company, Kowon Technology Co., Ltd., and Korean Investors, dated as of March 3, 1998 | (4 | ) | |||
10.12 | Eighth Amended and Restated Employment Agreement between the Company and Dr. John C.C. Fan, dated as of December 31, 2014 | * | ||||
10.13 | Kopin Corporation Form of Stock Option Agreement under 2001 and 2010 Equity Incentive Plans | (12 | ) | * | ||
10.14 | Kopin Corporation 2001 and 2010 Equity Incentive Plan Form of Restricted Stock Purchase Agreement | (12 | ) | * | ||
10.15 | Kopin Corporation Fiscal Year 2012 Incentive Bonus Plan | * | ||||
10.16 | Kopin Corporation 2010 Equity Incentive Plan | (14 | ) | |||
10.17 | Purchase Agreement, dated January 10, 2013, by and among Kopin Corporation, IQE KC, LLC and IQE plc | (15 | ) | |||
21.1 | Subsidiaries of Kopin Corporation | |||||
23.1 | Consent of Independent Registered Public Accounting Firm | |||||
31.1 | Chief Executive Officer Certification Pursuant to 18 U.S.C. Section 1350, as Adopted Pursuant to Section 302 of the Sarbanes-Oxley Act of 2002 | |||||
31.2 | Chief Financial Officer Certification Pursuant to 18 U.S.C. Section 1350, as Adopted Pursuant to Section 302 of the Sarbanes-Oxley Act of 2002 | |||||
32.1 | Chief Executive Officer Certification Pursuant to 18 U.S.C. Section 1350, as Adopted Pursuant to Section 906 of the Sarbanes-Oxley Act of 2002 | |||||
32.2 | Chief Financial Officer Certification Pursuant to 18 U.S.C. Section 1350, as Adopted Pursuant to Section 906 of the Sarbanes-Oxley Act of 2002 | |||||
101.0 | The following materials from the Company’s Annual Report on Form 10-K for the fiscal year ended December 26, 2015, formatted in XBRL (Extensible Business Reporting Language): (i) Consolidated Balance Sheets, (ii) Consolidated Statements of Operations, (iii) Consolidated Statements of Comprehensive Loss, (iv) Consolidated Statements of Stockholder's Equity, (v) Consolidated Statements of Cash Flows, and (vi) Notes to Consolidated Financial Statements, tagged as blocks of text | |||||
68
* | Management contract or compensatory plan required to be filed as an Exhibit to this Annual Report on Form 10-K. | ||
** | This exhibit shall not be deemed "filed" for purposes of Section 18 of the Securities Exchange Act of 1934 or otherwise subject to the liabilities of that Section, nor shall it be deemed incorporated by reference in any filings under the Securities Act of 1933 or the Securities Exchange Act of 1934, whether made before or after the date hereof and irrespective of any general incorporation language in any filing. | ||
(1 | ) | Filed as an exhibit to Registration Statement on Form S-1, File No. 33-45853, and incorporated herein by reference. | |
(2 | ) | Filed as an exhibit to Registration Statement on Form S-1, File No. 33-57450, and incorporated herein by reference. | |
(3 | ) | Filed as an exhibit to Annual Report on Form 10-K for the fiscal year ended December 31, 1993 and incorporated herein by reference. | |
(4 | ) | Filed as an exhibit to Annual Report on Form 10-Q for the quarterly period ended June 27, 1998 and incorporated herein by reference. | |
(5 | ) | Filed as an exhibit to Quarterly Report on Form 10-Q for the quarterly period ended July 1, 2000 and incorporated herein by reference. | |
(6 | ) | Filed as an exhibit to Quarterly Report on Form 10-Q for the quarterly period ended July 1, 2000 and incorporated herein by reference. | |
(7 | ) | Filed as an appendix to Proxy Statement filed on April 20, 2001 and incorporated herein by reference. | |
(8 | ) | Filed as an exhibit to Current Report on Form 8-K filed on December 12, 2008 and incorporated herein by reference. | |
(9 | ) | Filed as an exhibit to Current Report on Form 8-K filed on December 12, 2008 and incorporated herein by reference. | |
(10 | ) | Filed as an exhibit to Registration Statement on Form S-8 filed on March 15, 2004 and incorporated herein by reference. | |
(11 | ) | Filed as an exhibit to Registration Statement on Form S-8 filed on May 10, 2004 and incorporated herein by reference. | |
(12 | ) | Filed as an exhibit to Annual Report on Form 10-K for the fiscal year ended December 25, 2004 and incorporated herein by reference. | |
(13 | ) | Filed as an exhibit to Registration Statement on Form S-8 filed on April 15, 2008 and incorporated herein by reference. | |
(14 | ) | Filed with the Company's Definitive Proxy Statement on Schedule 14 filed as of April 5, 2013 and incorporated by reference herein. | |
(15 | ) | Filed as an exhibit to Current Report on Form 8-K on January 10, 2013 and incorporated by reference herein. | |
69