Attached files
| file | filename |
|---|---|
| EX-31.2 - EXHIBIT 31.2 - IntraLinks Holdings, Inc. | exhibit312december31201510.htm |
| EX-32.2 - EXHIBIT 32.2 - IntraLinks Holdings, Inc. | exhibit322december31201510.htm |
| EX-21.1 - EXHIBIT 21.1 - IntraLinks Holdings, Inc. | exhibit211december31201510.htm |
| EX-32.1 - EXHIBIT 32.1 - IntraLinks Holdings, Inc. | exhibit321december31201510.htm |
| EX-23.1 - EXHIBIT 23.1 - IntraLinks Holdings, Inc. | exhibit231december31201510.htm |
| EX-10.9 - EXHIBIT 10.9 - IntraLinks Holdings, Inc. | exhibit109directorcompensa.htm |
| EX-31.1 - EXHIBIT 31.1 - IntraLinks Holdings, Inc. | exhibit311december31201510.htm |
UNITED STATES
SECURITIES AND EXCHANGE COMMISSION
Washington, D.C. 20549
Form 10-K
þ | Annual Report Pursuant to Section 13 or 15(d) of the Securities Exchange Act of 1934 | |
For the fiscal year ended December 31, 2015
or
¨ | Transition Report Pursuant to Section 13 or 15(d) of the Securities Exchange Act of 1934 | |
For the transition period from to
Commission File Number 001-34832
INTRALINKS HOLDINGS, INC.
(Exact name of registrant as specified in its charter)
Delaware | 20-8915510 | ||
(State or other jurisdiction of Incorporation or organization) | (I.R.S. Employer Identification Number) | ||
150 East 42nd Street 8th Floor New York, New York | 10017 | ||
(Address of principal executive offices) | (Zip Code) | ||
(212) 543-7700
(Registrant’s telephone number, including area code)
Securities registered under Section 12(b) of the Exchange Act:
Title of each class | Name of Each Exchange on Which registered | |
Common Stock, par value $0.001 per share | New York Stock Exchange | |
Securities registered under Section 12(g) of the Exchange Act: None
Indicate by check mark if the registrant is a well-known seasoned issuer, as defined in Rule 405 of the Securities Act. ¨ Yes þ No
Indicate by check mark if the registrant is not required to file reports pursuant to Section 13 or Section 15(d) of the Act. ¨ Yes þ No
Indicate by check mark whether the registrant (1) has filed all reports required to be filed by Section 13 or 15(d) of the Securities Exchange Act of 1934 during the preceding 12 months (or for such shorter period that the registrant was required to file such reports), and (2) has been subject to such filing requirements for the past 90 days. Yes þ No ¨
Indicate by check mark whether the registrant has submitted electronically and posted on its corporate Web site, if any, every Interactive Data File required to be submitted and posted pursuant to Rule 405 of Regulation S-T (§232.405 of this chapter) during the preceding 12 months (or for such shorter period that the registrant was required to submit and post such files). Yes þ No ¨
Indicate by check mark if disclosure of delinquent filers pursuant to Item 405 of Regulation S-K (§229.405 of this chapter) is not contained herein, and will not be contained, to the best of registrant's knowledge, in definitive proxy or information statements incorporated by reference in Part III of this Form 10-K or any amendments to this Form 10-K. þ
Indicate by check mark whether the registrant is a large accelerated filer, an accelerated filer, a non-accelerated filer or a smaller reporting company. See the definitions of “large accelerated filer,” “accelerated filer,” “non-accelerated filer” and “smaller reporting company” in Rule 12b-2 of the Exchange Act.
Large accelerated filer ¨ | Accelerated filer þ | Non-accelerated filer ¨ | Smaller reporting company ¨ | |||
Indicate by check mark whether the registrant is a shell company (as defined in Rule 12b-2 of the Exchange Act). Yes ¨ No þ
Based on the closing price of the Registrant's common stock on June 30, 2015, the aggregate market value of its shares (based on a closing price of $11.91 per share) held by non-affiliates was $481.2 million.
The number of shares outstanding of the Registrant's common stock as of February 29, 2016 was 58,517,627. The Registrant does not have any non-voting stock outstanding.
DOCUMENTS INCORPORATED BY REFERENCE
Part of Form 10-K | Documents from which portions are incorporated by reference |
Part III | Portions of the registrant’s Proxy Statement relating to the registrant’s 2016 Annual Meeting of Stockholders (the "2016 Proxy Statement") are incorporated by reference into Part III, Items 10, 11, 12, 13 and 14 of this Annual Report on Form 10-K where indicated. We expect to file the 2016 Proxy Statement with the U.S. Securities and Exchange Commission within 120 days after the end of the fiscal year to which this report relates. Except with respect to information specifically incorporated by reference in this Form 10-K, the 2016 Proxy Statement is not deemed to be filed as part of this Form 10-K. |
INTRALINKS HOLDINGS, INC.
ANNUAL REPORT ON FORM 10-K
For the year ended December 31, 2015
Table of Contents
Page Number | |
CORPORATE INFORMATION AND FORWARD-LOOKING STATEMENTS
Our Corporate Information
Our business was incorporated in Delaware as “Intralinks, Inc.” in June 1996. In June 2007, we completed a merger, or the Merger, pursuant to which Intralinks, Inc. became a wholly-owned subsidiary of TA Indigo Holding Corporation, a newly-formed Delaware corporation owned by TA Associates, Inc., which is now part of TA Associates Management, L.P. and certain other stockholders of Intralinks, Inc., including Rho Capital Partners, Inc. and former and current officers and employees of Intralinks, Inc. The Merger was accounted for under the purchase accounting method in accordance with accounting principles generally accepted in the United States of America, or GAAP. In 2010, we changed the name of TA Indigo Holding Corporation to “Intralinks Holdings, Inc.” Unless otherwise stated in this Annual Report on Form 10-K (also referred to as this Annual Report or this Form 10-K) or the context otherwise requires, references to “Intralinks,” “we,” “us,” “our,” the “Company” and similar references refer to Intralinks Holdings, Inc. and its subsidiaries.
Intralinks®, Intralinks Connect®, Intralinks Dealnexus®, Intralinks Dealmanager™, Intralinks Dealspace®, Intralinks Debtspace™, Intralinks Fundspace™, Intralinks Studyspace™, Intralinks VIA® and other trademarks of Intralinks appearing in this Annual Report are the property of Intralinks. Other trademarks or service marks that may appear in this Annual Report are the property of their respective holders. Solely for convenience, the trademarks and trade names in this Annual Report are referred to without the ®, ™ and SM symbols, but such references should not be construed as any indicator that their respective owners will not assert, to the fullest extent under applicable law, their rights thereto.
Forward-Looking Statement Safe Harbor
Some of the statements in this Annual Report constitute “forward-looking statements” within the meaning of Section 27A of the Securities Act of 1933, as amended, and Section 21E of the Securities Exchange Act of 1934, as amended. These statements relate to our operations and are based on our current expectations, estimates and projections. Words such as “may,” “will,” “could,” “would,” “should,” “anticipate,” “predict,” “potential,” “continue,” “expects,” “intends,” “plans,” “projects,” “believes,” “estimates,” “goals,” “in our view” and similar expressions are used to identify these forward-looking statements. The forward-looking statements included in this Annual Report include, but are not limited to, statements about our internal control over financial reporting, our results of operations and financial condition and our plans, strategies and developments. Forward-looking statements are only predictions and, as such, are not guarantees of future performance and involve risks, uncertainties and assumptions that are difficult to predict. Forward-looking statements are based upon assumptions as to future events or our future financial performance that may not prove to be accurate. Actual outcomes and results may differ materially from what is expressed or forecasted in these forward-looking statements. Many of the reasons for these differences include changes that occur in our continually changing business environment and other important factors. These risks, uncertainties and other factors are more fully described in Part I, Item 1A. Risk Factors and Part II, Item 7. Management’s Discussion and Analysis of Financial Condition and Results of Operations of this Annual Report on Form 10-K. You are strongly encouraged to read those sections carefully as the occurrence of the events described therein and elsewhere in this report could materially harm our business. Given these risks, uncertainties and other factors, you should not place undue reliance on these forward-looking statements. Also, these statements speak only as of the date they were made and, except as required by law, we undertake no obligation to publicly update or revise any forward-looking statements, whether as a result of new information, future events or otherwise.
PART I
ITEM 1. BUSINESS
Overview
Intralinks is a leading global technology provider of Software-as-a-Service, or SaaS, solutions for secure enterprise content collaboration within and among organizations. Our cloud-based solutions enable organizations to securely manage, control, track, search, exchange and collaborate on sensitive information inside and outside the firewall, all within an easy-to-use environment. Our customers rely on our cost-effective solutions to manage and control large amounts of electronic information, accelerate information intensive business processes, reduce time to market, optimize critical information workflows, meet regulatory and risk management requirements and collaborate with business counterparties in a secure, auditable and compliant manner. We help our customers eliminate many of the inherent risks and inefficiencies of using email, fax, courier services and other existing solutions to collaborate and exchange information.
At our founding in 1996, we introduced cloud-based collaboration for the debt capital markets industry and, shortly thereafter, extended our solutions to merger and acquisition transactions. Today, we serve enterprises and governmental agencies across a variety of industries, including financial services, pharmaceutical, manufacturing, biotechnology, consumer, energy, telecommunications, industrial, legal, professional services, insurance and technology.
We deliver our solutions through a cloud-based model, making them available on-demand over the internet using a multi-tenant SaaS architecture. We sell our solutions directly through a field sales team with industry-specific expertise and an inside sales team, and indirectly through a customer referral network and channel partners. In 2015, we generated $276.2 million in revenue, 40.7% of which was derived from sales to customers located outside of the United States.
The Intralinks Platform
We have built a highly secure and scalable, cloud-based, multi-tenant, content services platform upon which we develop multiple applications that allow our customers to collaborate, manage and exchange critical information across organizational and geographic boundaries. We integrate content management, enterprise collaboration and social, data analytics, file sync and sharing, and document security software into one platform that supports business collaboration and content exchange. The Intralinks Platform scales from the needs of small groups and individuals within one organization to large teams of people across multiple enterprises, financial institutions and governmental agencies. Our platform helps transform a wide range of slow, expensive and people- and information-intensive tasks into streamlined and efficient business processes. Use cases for the Intralinks Platform and the various Intralinks applications include the following:
• | secure enterprise collaboration and file sharing by business professionals in a wide variety of industry settings; |
• | due diligence for merger and acquisition transactions, initial public offerings, or IPOs, and other strategic transactions; |
• | debt capital markets transactions, including loan syndication, agency and other financing activities; |
• | corporate development and board reporting; |
• | private equity fundraising, hedge fund marketing and investor reporting; |
• | clinical trial management support and safety document distribution; |
• | partner document collaboration; |
• | life sciences drug development support and licensing; |
• | distribution of regulated content; |
• | secure mobile access to content; |
• | contract and vendor management; |
• | externalization of content repositories; |
• | energy exploration and production ventures for the oil and gas industry; and |
• | corporate banking. |
5
Intralinks VIA
Designed for business collaboration in a wide variety of markets and industries, Intralinks VIA is a full-featured content collaboration solution that sits on the Intralinks Platform and is designed for a wide variety of use cases, especially those involving high-value, IP-intensive or regulated content. Intralinks VIA enables users to securely manage collaborative processes and work efficiently on group projects. Intralinks VIA enables all employees in an organization to sync and share content and collaborate beyond the firewall in a way that adheres to management-level control, security, auditability and compliance requirements.
Intralinks VIA allows content collaboration through the creation of workspaces, enabling business professionals to work together on a document or project. Further, Intralinks VIA, which is accessible through a simple web-based user interface that supports access from a wide variety of sources such as web browsers, Windows and Mac desktops and mobile devices, including iPads, iPhones and Android-based products. Intralinks VIA allows users to access and share files at any time, while security and plug-in free IRM capabilities ensure constant control and monitoring of the content. Intralinks VIA integrates with existing applications and systems, providing an extension of familiar tools and experiences, and the means to coordinate work across people, organizations and devices.
The current version of our Intralinks VIA offering includes a completely redesigned user interface, new security functionality and native support for Microsoft Office (through an integration with Microsoft Office Online that is hosted within Intralinks data centers) inside the Intralinks Platform.
Intralinks VIA is available in two editions:
• | Intralinks VIA Pro |
Intralinks VIA Pro is designed for ad-hoc content sharing and collaboration, mobile content access and replacement of file sharing services like file transfer protocol, or FTP.
• | Intralinks VIA Elite |
Intralinks VIA Elite includes additional capabilities such as content management and business process support.
Intralinks Exchanges
Intralinks exchanges are logical nodes that bring people, process and information together and sit on the Intralinks Platform and facilitate collaboration within and among organizations. They integrate the capabilities of content management, file sync and share, collaboration and social networking software into a cohesive work environment that is accessible from a wide variety of platforms like web browsers, Windows and Mac desktops and mobile devices, including iPads, iPhones and Android-based products.
Inherent in each Intralinks exchange is the ability to collaborate and manage content. This includes not only standard content management capabilities, such as the ability to add comments and monitor document use to maintain version control, but also more sophisticated permissioning capabilities such as granular, role-based access controls, document-level reporting and protection capabilities that can watermark content and control a user's ability to view, print, forward and save content stored on an Intralinks exchange. Intralinks exchanges include integrated, plug-in free information rights management, or IRM, capabilities that give document owners lifetime protection and control over their files. These capabilities also support granular access provisions, enable access to files to be rescinded on-demand or at a prescribed time and provide detailed file-level analytics. Content management and IRM capabilities can be configured for users and groups on a bulk or per document basis.
High availability, disaster recovery services, virus scanning and protection and automated backups are included as an ongoing component of our service offering to protect and secure the Intralinks exchange environment and its content. We also provide a comprehensive archiving service that includes a complete electronic copy of all Intralinks exchange content (e.g., files and metadata), access history, historical permissions and electronic communications sent through an Intralinks exchange. Detailed and auditable records also document disclosure should any legal or other compliance challenges arise. These auditable records frequently satisfy additional company and regulatory record-keeping requirements.
Intralinks has a broad range of application solutions that leverage Intralinks exchanges and are built on the Intralinks Platform that deliver collaboration capabilities for different user communities and use cases:
• | Intralinks Dealspace |
Intralinks Dealspace is a virtual deal room, or VDR, solution designed for the mergers and acquisitions, or M&A, industry. Intralinks Dealspace is a rich application that manages the entire due diligence process, providing a secure, customizable environment for deal makers to exchange sensitive documents and information.
• | Intralinks Dealmanager |
Intralinks Dealmanager is a secure content collaboration solution that gives corporate development and M&A professionals the tools to manage their deal pipelines and deal flow and gain efficiencies in how they manage multiple
6
deals at different stages of the deal process. Intralinks Dealmanager improves the ability to evaluate deals properly and efficiently, providing a centralized place from which to manage deal processes, assign tasks and report on deal status and progress.
• | Intralinks Studyspace |
Intralinks Studyspace is used by life sciences companies, including clinical research organizations, biotechnology companies, pharmaceutical and medical device companies, to exchange sensitive information during research programs and drug trials to support bringing new drugs, therapies, medical devices and other medical technologies to market.
• | Intralinks Fundspace |
Intralinks Fundspace is used by the alternative investment community to help raise capital, support investor and fund reporting and manage assets.
• | Intralinks Debtspace |
Intralinks Debtspace is used by syndicated loan professionals to manage the entire syndicated loan process throughout the primary, secondary and agency phases, as well as by debt capital markets professionals to manage the due diligence process related to other financing transactions. Intralinks Debtspace’s features include deal management, marketing support, book building, reporting and amendment voting capabilities.
In addition to solutions built on the Intralinks Platform, we also offer:
Intralinks Dealnexus
Intralinks Dealnexus is an online platform for the deal making community that brings together qualified M&A professionals with matching deal criteria and opportunities. The Intralinks Dealnexus platform offers a low-cost and confidential way for deal makers to market deals broadly and then find and engage the best buyers or capital partners.
Intralinks Technology and Integration Services
The Intralinks Platform provides a technology environment for building business applications that integrates with existing enterprise software applications. Through our technology, integrators and third party developers have the ability to create and deploy new business applications customized to specific customer requirements. Additionally, they can connect and integrate Intralinks exchanges or Intralinks VIA workspaces with existing content management systems and collaboration services, as well as manage business process and information exchange between systems. Key elements include:
• | Intralinks Application Programming Interfaces, or APIs |
Intralinks APIs include a broad set of functionalities and a comprehensive API map to manage and control content, users, sessions and system administration. They are developed on the representational state transfer, or REST, architecture, making them web services ready. Our internal development teams use the Intralinks APIs extensively to create all of the Intralinks applications.
• | Intralinks Adapters |
Intralinks Adapters are applications that enable communications between Intralinks and external systems. Intralinks Adapters include pre-packaged functionality such as contact management, file management and basic system configuration.
• | Intralinks Connectors |
Intralinks Connectors are designed to connect and integrate Intralinks' software with the APIs of specific external systems including content management applications like Microsoft SharePoint and customer relationship management tools like Salesforce.com, among others. Our connectors are "out-of-the-box" offerings for external integration and include packaged services for file transfer, permissioning, reporting and workflow.
Intralinks Professional Services
We offer a series of high quality professional services to enable our customers to fully implement secure and efficient content collaboration solutions utilizing our technology and following industry best practices. Our professional services team offers project implementation and production support services so that our customers can successfully plan, develop, deploy and support enterprise solutions. Our professional services team utilizes a robust service delivery lifecycle methodology to ensure solutions quality, effectiveness and efficiency.
Specific capabilities and competencies of our professional services offerings include:
• | Planning, project and program management; |
7
• | Architecture and design services; |
• | Customized and tailored implementations and roll-outs; |
• | Sophisticated security, enterprise content management and business process mapping, configuration and integration capabilities; |
• | Custom reporting, monitoring and data archiving; |
• | Custom development, including portal, dashboards and product enhancements; and |
• | Customized training curricula, content and delivery. |
Intralinks Customer Service
Our customer-facing teams provide a range of implementation and end-user support services to ensure that our customers remain productive throughout the duration of their use of our services.
Implementation Services:
• | Requirements consultation and solution configuration: We engage with our customers to understand their unique business processes and analyze and identify their service requirements to assist with the optimal configuration of their Intralinks exchange environments. |
• | Project management: We develop an action and training plan to accelerate the integration and roll-out of the Intralinks solution within the customer's organization. |
• | Training: We provide administrator and end-user training, including end-user certifications to meet specific industry requirements in areas such as life sciences. |
• | Document scanning and upload: We provide services, as required, to organize and scan customer documents and to automate the data upload process. |
Our online solutions are critical to enable time-sensitive transactions and communications. We therefore aim to provide excellent customer service to enable our customers to complete their business processes and objectives in a timely and cost-effective manner. Customer service and support are regular components of our value proposition. As a result, our customer service team provides support 24 hours per day, 7 days per week and 365 days per year for all users of our applications and solutions, regardless of whether they are direct customers or end users invited to use our applications and solutions by our direct customers. Our support model is a significant differentiator from alternative application providers, many of whom do not provide support beyond their direct customers' firewalls. Because many of the organizations and business processes supported by our online Intralinks exchanges and Intralinks VIA workspaces are global and involve international communication and collaboration, we support customer and end user enquiries in over 140 languages.
Our Technology
We have built a highly secure and scalable, cloud-based, multi-tenant platform upon which we develop solutions that allow our customers to collaborate, manage and exchange critical information across organizational and geographic boundaries. Our third-generation Intralinks Platform is optimized to service all of our customers from a single software platform. Unlike other enterprise software vendors, we do not need to custom-build software to use our technology in different environments or to address industry-specific needs. Consequently, we do not need to manage and support multiple versions of our software, and we do not need to expend effort to customize support for different hardware, operating systems or databases. Our platform combines our proprietary code with integrated components from third-party vendors.
The Intralinks Platform can be accessed universally from a simple web browser or through a mobile application, yet has a rich customer interface powered by HTML and Adobe Flex that supports familiar desktop tools and access from a variety of desktop and mobile applications. Our technology platform includes an integrated full text search capability that performs real time data categorization and tagging of content, along with dynamic facet generation to help users quickly navigate search results. In addition, we utilize Akamai's Terra Enterprise Solutions services to enable consistently high performance for users around the world. We also employ virtualization and load balancing technologies to enable seamless scalability of our infrastructure across all computing tiers.
We have built a highly sophisticated authentication, authorization and encryption service designed to ensure that the content stored in our system is accessible only by authorized users. We employ a wide range of technical security features, including two factor authentication using RSA Adaptive Authentication and data encryption with encoded session identifiers and passwords. Every file we transmit from an exchange is encrypted in transit via Transport Layer Security, or TLS, up to v1.2. We also use encryption technology in our storage systems and backup processes. We incorporate sophisticated IRM and permissioning controls that enable
8
our customers to control the role of and access of participants to information. Our platform also provides audit trails for compliance and access history tracking for content throughout its lifecycle.
As part of our continuing efforts to build trust and confidence in our technology, we make available, through the completion of a Service Organization Controls (SOC) 2 Report, information and assurance about controls that affect security, availability, and confidentiality of customer data. The SOC 2 report is prepared annually by an independent audit firm acting in accordance with American Institute of Certified Public Accountants' guidance. The SOC 2 Report also serves as an important part of our internal corporate governance, risk management and vendor oversight processes.
The Intralinks Platform is hosted in four secure data centers provided by SunGard Availability Services LP that are run in primary and secondary mode with redundancy and failover capability. Physical security at these facilities includes a continually staffed security station along with biometric and man trap access controls. Systems are protected by firewalls and encryption technology. Each data center features redundant power, on-site backup generators, and environmental controls and monitoring. As part of our disaster recovery arrangements, all customer data is replicated to all sites in near real-time. We and our hosting providers conduct regular security audits of our infrastructure and we, directly or through outside vendors, manage security and monitoring for our platform and applications. The performance of our application suite is continually monitored using a variety of automated tools and customer data is regularly backed up and stored in a primary and secondary secure location to minimize the risk of data loss at any facility.
The Intralinks Platform allows data to be stored at prescribed locations using data centers managed by Intralinks (located in the United States or the United Kingdom, with additional locations planned) or data centers managed by a third party. In addition, Intralinks' Distributed Content Node technology will allow both data storage and data processing to be controlled at a specific data center or other location. These technologies will help organizations meet data residency and data privacy regulations that restrict where and how certain personally identifiable information is managed, processed and stored. Intralinks also allows customers to hold and manage their own data encryption keys. The Intralinks Customer Managed Encryption Key solution provides dedicated encryption keys and a direct, secure connection to the Intralinks data center where the keys are managed. Using Intralinks Customer Managed Encryption Keys, customers have the ability to ensure that only they have the ability to provide unencrypted access to their sensitive files.
Sales and Marketing
We continue to develop a sales and marketing capability aimed at accelerating the adoption of our solutions by expanding penetration of existing industries, capitalizing on new opportunities in underpenetrated or emerging markets and by selectively increasing our geographic coverage.
Sales
We sell our solutions through a mix of field and inside sales, a referral network and a select group of channel partners. Our sales representatives have extensive experience selling technology solutions into a wide variety of industries including financial services, insurance, legal, energy and utilities and life sciences.
In addition to our direct sales force, we have established relationships with channel partners that promote, sell and support our services in specific geographies. Our channel partners include, among others, systems integrators, resellers, referral partners, services partners and consultants that resell our services directly or through referral business. Our key channel partners are located in a variety of countries including India, Japan, Brazil, Mexico, Chile, South Africa, China and a number of European countries.
Marketing
Marketing supports our sales efforts through thought leadership and brand awareness activities, lead generation programs and the unique positioning of our offerings. We have developed a broad mix of marketing tools tailored for the different markets we serve and the different solutions we provide. We have a deep expertise in understanding how organizations in regulated industries such as financial services or life sciences can collaborate and share sensitive documents safely and compliantly. In our core strategic transactions business, we have a leading brand and a strong market share position. Across sales and marketing, we have honed our activities to maintain and develop key relationships within the extended deal making community, where we have relationships that number in the high thousands. In our Enterprise business, where there are millions of potential users across many industries, we have adapted our market approach to focus on use cases and have developed new capabilities to serve the needs of that market.
Research and Development
Under our SaaS model, we maintain and support only one version of our software. As a result, we are able to simultaneously upgrade all of our customers with each new software release. This enables us to focus our research and development expenditures on developing new features and functionality, rather than implementation. Our development process follows our own iterative
9
methodology that includes elements of the Agile software development process with multiple quality control cycles to ensure high quality and on-going update capability.
Our research and development expenses were $20.0 million, $22.4 million and $25.8 million in 2013, 2014 and 2015, respectively, which included stock-based compensation expense of $1.3 million, $1.6 million, and $1.4 million, respectively.
Intellectual Property
We rely on a combination of patent, trademark, copyright and trade secret laws in the U.S. and other jurisdictions, as well as confidentiality procedures and contractual provisions, to protect our proprietary technology and our brand. We have registered our "Intralinks" trademark, as well as other trademarks, with the U.S. Patent and Trademark Office and in several jurisdictions outside the U.S.
We currently hold eleven issued U.S. patents that are scheduled to expire on various dates commencing on February 4, 2019. These patents cover, among other things, processes and systems related to the Intralinks Platform and applications, including many of the technology elements upon which Intralinks was founded as well as our ongoing technology developments. Our patents contemplate broad applications of these processes, including in the context of combining these processes with single-sign-on technology, using these processes with handheld devices, combining these processes with data encryption and customized user interfaces for private labeling, using these processes for managing time-sensitive projects and tasks, automatically updating exchange contents at regular time intervals and incorporating the ability to "UNshare" documents and files. We have filed additional patent applications containing hundreds of inventions with the U.S. Patent and Trademark Office.
We will continue to assess appropriate occasions for seeking patent and other intellectual property protections for those aspects of our technology and service that we believe constitute innovations providing significant competitive advantages.
Competition
The market for our solutions is highly competitive, fragmented and dynamic. We compete with a multitude of service providers, including both virtual data room providers and enterprise software providers. The markets for online collaborative content workspaces and solutions for managing, distributing and protecting enterprise content are also rapidly changing, with relatively low barriers to entry. We expect competition to increase from existing competitors as well as new and emerging market entrants. In addition, as we expand our service offerings, we may face competition from new and existing competitors. We compete primarily on product functionality, service levels, security and compliance characteristics, price and reputation. Our competitors include companies that provide online products that serve as document repositories, virtual data rooms or file sharing and collaboration solutions, together with other products or services that may result in those companies effectively selling these services at lower prices and creating downward pricing pressure for us.
We believe that the principal differentiating factors in our market primarily include the ability to collaborate inside and outside firewalls while maintaining security, control, auditability and compliance standards. We believe we compete effectively based on broad capabilities across all of these factors. In particular, our solutions are specifically designed for inter-enterprise collaboration for content and information sharing beyond the firewall. Our technology platform offers enterprise class scalability and reliability, while enabling secure, auditable and compliant information exchange via a SaaS delivery model that lowers total cost of ownership. Additionally, our industry-specific expertise, global customer support, scalability and reliability to ensure uninterrupted performance, as well as price and functionality, have earned us a reputation of trust with our customers.
Backlog
As of December 31, 2015 and 2014, we had total backlog of approximately $100.5 million and $94.4 million, respectively. Of the $100.5 million in total backlog as of December 31, 2015, 87.6% is expected to be recognized as revenue within 2016.
Employees
As of December 31, 2015, we employed 930 full-time employees, including 388 in sales and marketing, 177 in product development, 178 in services and external operations and 187 in general and administrative. The employees included in services and external operations are included in cost of revenue.
Geographic Information
We generate revenue both within and outside the United States. We operate globally with $163.8 million, or 59.3%, of total revenue derived from sales to customers located in the United States and $112.3 million, or 40.7%, derived from sales to customers located outside the United States, with the largest location being the United Kingdom. The amount of our long-lived assets outside of the United States at December 31, 2015 is immaterial. Information regarding financial data by geographic location is set forth in Note 13 - "Segment and Geographic Information" included in Part II, Item 8. Financial Statements and Supplementary Data of this Annual Report on Form 10-K.
10
Available Information
We maintain an internet website under the name www.intralinks.com. We make available, free of charge, on our website, our annual report on Form 10-K, quarterly reports on Form 10-Q, current reports on Form 8-K, proxy statements, other information and amendments to those reports, as soon as reasonably practicable after providing such reports to the Securities and Exchange Commission, or the SEC. We also make available on our website (i) the charters for the standing committees of our Board of Directors, including the Audit Committee, Compensation Committee and Nominating and Corporate Governance Committee, and (ii) our Code of Business Conduct and Ethics governing our directors, officers and employees.
We file annual reports on Form 10-K, quarterly reports on Form 10-Q, current reports on Form 8-K, proxy statements and other documents with the SEC under the Securities Exchange Act, as amended. The public may read and copy any materials that we file with the SEC at the SEC's Public Reference Room at 100 F Street, N.E., Washington DC 20549. The public may obtain information on the operation of the Public Reference Room by calling the SEC at 1-800-SEC-0330. Also, the SEC maintains an internet website that contains reports, proxy and information statements and other information regarding issuers, including Intralinks Holdings, Inc., that file electronically with the SEC. The public can obtain any document we file with the SEC at www.sec.gov.
The information on our website is not part of this Form 10-K for the year ended December 31, 2015.
ITEM 1A. RISK FACTORS
The following risks and uncertainties, together with all other information in this Annual Report, including our Consolidated Financial Statements and related notes, should be considered carefully. Any of the risk factors we describe below could adversely affect our business, financial condition or results of operations and could cause the market price of our common stock to fluctuate or decline.
Risks Related to Our Business and Our Industry
Our future profitability is uncertain.
We have historically incurred significant net operating losses. As a result of these operating losses, we accumulated a deficit of $169.6 million from June 15, 2007, the date on which, through a series of transactions we refer to as the Merger, all of the outstanding equity of Intralinks, Inc. was acquired by a newly formed entity, TA Indigo Holding Corporation, which was owned by TA Associates, Inc. (now part of TA Associates Management, L.P.), Rho Capital Partners, Inc., a principal stockholder in Intralinks, Inc. since 2001, and other stockholders, including former and current officers and employees of Intralinks, Inc., through December 31, 2015. Our future profitability depends on, among other things, our ability to generate revenue in excess of our expenses. However, since our initial public offering in August 2010, we have incurred and will continue to incur as a public company significant additional legal, accounting and other expenses to which we were not subject to as a private company, including expenses related to our efforts in complying with the requirements of Sarbanes-Oxley Act of 2002, or Sarbanes-Oxley, the Dodd-Frank Wall Street Reform and Consumer Protection Act of 2010 and other public company disclosure and corporate governance requirements, responding to requests of government regulators and defending the class action and stockholder derivative lawsuits filed against us. At the same time, we have significant and continuing fixed costs relating to the maintenance of our assets and business, including our substantial debt service requirements, which we may not be able to reduce adequately to sustain our profitability if our revenue decreases. Our profitability also may be impacted by non-cash charges such as stock-based compensation charges and potential impairment of goodwill, which will negatively affect our reported financial results. Even if we achieve profitability on an annual basis, we may not be able to achieve profitability on a quarterly basis. You should not consider prior revenue growth as indicative of our future performance. In fact, in future quarters we may not have any revenue growth or our revenue could decline. We may continue to incur significant losses in the future for a number of reasons, including the other risks described elsewhere in this Annual Report, and we may encounter unforeseen expenses, difficulties, complications, delays and other unknown events. Our failure to achieve and maintain our profitability could negatively impact the market price of our common stock.
We may be unable to sustain positive cash flow.
Our ability to continue to generate positive cash flow depends on our ability to generate collections from sales in excess of our cash expenditures. Our ability to generate and collect on sales can be negatively affected by many factors, including but not limited to:
• | our inability to convince new customers to use our services or existing customers to renew their contracts or use additional services; |
• | the lengthening of our sales cycle; |
• | changes in our customer mix; |
• | a decision by any of our existing customers to cease or reduce using our services; |
• | failure of customers to pay our invoices on a timely basis or at all; |
11
• | a failure in the performance of our solutions or our internal controls that adversely affects our reputation or results in loss of business; |
• | the loss of market share to existing or new competitors; |
• | the failure to enter or succeed in new markets; |
• | the failure to deliver mobile applications that provide secure, mobile access to content shared through our platform and applications; |
• | regional or global economic conditions or regulations affecting perceived need for or value of our services; or |
• | our inability to develop new offerings, expand our offerings or drive adoption of our new offerings on a timely basis and thus our potentially not meeting evolving market needs. |
We anticipate that we will incur increased sales and marketing and general and administrative expenses as we continue to diversify our business into new industries and geographic markets. Our business will also require significant amounts of working capital to support our growth. In addition, we face significant expenditures in connection with our public company disclosure obligations, Sarbanes-Oxley compliance, and other corporate governance requirements, as well as a pending derivative lawsuit. We may not achieve collections from sales to offset these anticipated expenditures sufficient to maintain positive future cash flow. In addition, we may encounter unforeseen expenses, difficulties, complications, delays and other unknown events that cause our costs to exceed our expectations. An inability to generate positive cash flow may decrease our long-term viability.
Our business may not generate sufficient cash flows from operations or future borrowings under our credit facilities or from other sources may not be available to us in amounts sufficient to enable us to repay our indebtedness or to fund our other liquidity needs, including capital expenditure requirements and share repurchase programs announced from time to time.
We cannot guarantee that we will be able to generate sufficient revenue or obtain enough capital to service our debt, fund our planned capital expenditures, complete stock repurchases in accordance with announced repurchase plans, if any, and execute on our business plan. We may be more vulnerable to adverse economic conditions than less leveraged competitors and thus less able to withstand competitive pressures. Any of these events could reduce our ability to generate cash available for investment or debt repayment or to make improvements or respond to events that would enhance profitability. If we are unable to service or repay our debt when it becomes due, our lenders could seek to accelerate payment of all unpaid principal and foreclose on our assets, and we may have to take actions such as selling assets, seeking additional equity investments or reducing or delaying capital expenditures, strategic acquisitions, investments and alliances. Additionally, we may not be able to take these types of actions, if necessary, on commercially reasonable terms, or at all. The occurrence of any of these events would have a material adverse effect on our business, results of operations and financial condition.
Our operating results are likely to fluctuate from quarter to quarter, which may have an impact on our stock price.
Our operating results have varied significantly from quarter to quarter and may vary significantly from quarter to quarter in the future. As a result, we may not be able to accurately forecast our revenues or operating results. Quarterly fluctuations may result from factors such as:
• | changes in the markets that we serve; |
• | changes in demand for our services; |
• | technical difficulties or interruptions in our service; |
• | rate of penetration within our existing customer base; |
• | loss of customers or business from one or more customers, including from consolidations and acquisitions of customers; |
• | the timing of large contracts or contract terminations; |
• | increased competition; |
• | changes in the mix of customer types; |
• | changes in the mix of our offerings and sales channels through which they are sold; |
• | changes in our standard service contracts that may affect when we recognize revenue; |
• | the timing of our new product releases; |
• | loss of key personnel; |
• | interruption in our service resulting in a loss of revenue; |
12
• | changes in our pricing policies or the pricing policies of our competitors; |
• | fluctuations in currency exchange rates; |
• | costs of developing new solutions and enhancements; |
• | write-offs affecting any of our material assets; |
• | changes in our operating expenses; |
• | customer credits issued in excess of established reserves; |
• | software "bugs" or other service quality problems; |
• | concerns relating to the security of our systems; |
• | extraordinary expenses such as litigation or other dispute related settlement payments; |
• | regulatory changes; |
• | adverse tax consequences; and |
• | general domestic and international political, economic and market conditions or regulations, which may adversely affect either our customers' ability or willingness to purchase additional subscriptions or upgrade their services, or delay a prospective customer's purchasing decision, reduce the value of new subscription contracts or affect attrition rates. |
Many of these factors are outside of our control and the occurrence of one or more of them might cause our operating results to vary widely. We believe that our quarterly operating results may vary significantly in the future, that period-to-period comparisons of results of operations may not necessarily be meaningful and, as a result, such comparisons should not be relied upon as indications of future performance.
Additionally, if we fail to meet or exceed the expectations of securities analysts and investors, or if one or more of the securities analysts who cover us were to adversely change its recommendation regarding our stock, the market price for our common stock could decline. Moreover, our stock price may be based on expectations, estimates and forecasts of our future performance that may be unrealistic or that we may not meet. Further, our stock price may fluctuate based on reporting by the financial media, including television, radio and press reports and blogs.
Fluctuations in foreign currency exchange rates could result in foreign currency transaction losses, which could harm our operating results and financial condition.
We currently have revenue and expenses and related assets and liabilities denominated in foreign currencies and may in the future have transactions denominated in the currencies of additional countries. Foreign currency transaction exposure results primarily from transactions with customers or vendors denominated in currencies other than the functional currency of the entity in which we record the transaction. Any fluctuation in the exchange rate of these foreign currencies may positively or negatively affect our business, financial condition and operating results.
We face exposure to movements in foreign currency exchange rates due to the fact that we have non-U.S. dollar denominated revenue worldwide. Weakening of foreign currencies relative to the U.S. dollar adversely affects the U.S. dollar value of our foreign currency denominated revenue and positively affects the U.S. dollar value of our foreign currency denominated expenses. If foreign currencies were to weaken or strengthen relative to the U.S. dollar, we might elect to raise or lower our international pricing, which could potentially impact demand for our services. Alternatively, we might opt not to adjust our international pricing as a result of fluctuations in foreign currency exchange rates, which could potentially have a positive or negative impact on our results of operations and financial condition.
Similarly, our financial performance may be impacted by fluctuations in currency exchange rates when it comes to our non-U.S. dollar denominated expenses. The third party vendors and suppliers to whom we owe payments for non-U.S. dollar denominated expenses may, or may not, decide to increase or decrease their pricing to reflect fluctuations in foreign currency exchange rates.
If there continues to be volatility in foreign currency exchange rates, we will continue to experience fluctuations in our operating results due to revaluing our assets and liabilities that are not denominated in the functional currency of the entity that recorded the asset or liability. Further, as foreign currency exchange rates change, the translation of our non-U.S. denominated revenue and expenses into U.S. dollars affects the year-over-year comparability of our operating results.
13
Failure to maintain the confidentiality, integrity and availability of our systems, software and solutions could seriously damage our reputation and affect our ability to retain customers and attract new business.
Maintaining the confidentiality, integrity and availability of our systems, software and solutions is an issue of critical importance for us and for our customers and users who rely on our systems to store and exchange large volumes of information, much of which is proprietary and confidential. There appears to be an increasing number of individuals, governments, groups and computer "hackers" developing and deploying a variety of destructive software programs (such as viruses, worms and other malicious software) that could attack our computer systems or solutions or attempt to infiltrate our systems. We make significant efforts to maintain the confidentiality, integrity and availability of our systems, solutions and source code. Despite significant efforts to create security barriers, it is virtually impossible for us to mitigate this risk entirely because techniques used to obtain unauthorized access or sabotage systems change frequently and generally are not recognized until launched against a target. Like all software solutions, our software is vulnerable to these types of attacks. An attack of this type could disrupt the proper functioning of our software solutions, cause errors in the output of our customers' work, allow unauthorized access to sensitive, proprietary or confidential information of ours or our customers and other destructive outcomes. If an actual or perceived breach of our security were to occur, our reputation could suffer, customers could stop buying our solutions and we could face lawsuits and potential liability, any of which could cause our financial performance to be negatively impacted. Though we maintain professional liability insurance that may be available to provide coverage if a cyber-security incident were to occur, there can be no assurance that insurance coverage will be available or that available coverage will be sufficient to cover losses and claims related to any cyber-security incidents we may experience.
There is also a danger of industrial espionage, cyber-attacks, misuse or theft of information or assets (including source code), or damage to assets by people who have gained unauthorized access to our facilities, systems or information, which could lead to the disclosure of portions of our source code or other confidential information, improper usage and distribution of our solutions without compensation, illegal or inappropriate usage of our systems and solutions, jeopardizing of the security of information stored in and transmitted through our computer systems, manipulation and destruction of data, defects in our software and downtime issues. Although we actively employ measures to combat unlicensed copying, access and use of our facilities, systems, software and intellectual property through a variety of techniques, preventing unauthorized use or infringement of our rights is inherently difficult. The occurrence of an event of this nature could adversely affect our financial results or could result in significant claims against us for damages. Further, participating in either a lawsuit to protect against unauthorized access to, usage of or disclosure of any of our solutions or any portion of our source code or the prosecution of an individual in connection with a cybersecurity breach could be costly and time-consuming and could divert management's attention and adversely affect the market's perception of us and our solutions.
A number of core processes, such as software development, sales and marketing, customer service and financial transactions, rely on our information technology, or IT, infrastructure and applications. Defects of malfunctions in our IT infrastructure and applications could cause our service offerings not to perform as our customers expect, which could harm our reputation and business. In addition, malicious software, sabotage and other cybersecurity breaches of the types described above could cause an outage of our infrastructure, which could lead to a substantial denial of service and ultimately downtimes, recovery costs and customer claims, any of which could have a significant negative impact on our business, financial position, profit and cash flows.
We rely upon our customers and users of our solutions to perform important activities relating to the security of the data maintained on our Intralinks Platform, such as assignment of user access rights and administration of document access controls. Because we do not control the access provided by our customers to third parties with respect to the data on our systems, we cannot ensure the complete integrity or security of this data. Errors or wrongdoing by users resulting in security breaches could be attributed to us. Because many of our engagements involve business-critical projects for financial institutions and their customers and for other types of customers where confidentiality is of paramount importance, a failure or inability to meet our customers' expectations with respect to security and confidentiality could seriously damage our reputation and affect our ability to retain customers and attract new business.
The confidentiality, integrity and availability of our systems could also be jeopardized by a breach of our internal controls and policies by our employees, consultants or subcontractors having access to our systems. If our systems fail or are breached as a result of a third-party attack or an error, violation of internal controls or policies or a breach of contract by an employee, consultant or subcontractor that results in the unauthorized use or disclosure of proprietary or confidential information or customer data (including information about the existence and nature of the projects and transactions our customers are engaged in), we could lose business, suffer irreparable damage to our reputation and incur significant costs and expenses relating to the investigation and possible litigation of claims relating to such event. We could be liable for damages, penalties for violation of applicable laws or regulations and costs for remediation and efforts to prevent future occurrences, any of which liabilities could be significant. There can be no assurance that the limitations of liability in our contracts would be enforceable or adequate or would otherwise protect us from liabilities or damages with respect to any particular claim. We also cannot assure that our existing general liability insurance coverage, coverage for errors and omissions and cyberliability insurance will continue to be available on acceptable terms in sufficient amounts to cover one or more large claims, or that the insurer will not deny coverage as to any future claim.
14
The successful assertion of one or more large claims against us that exceeds our available insurance coverage, or the occurrence of changes in our insurance policies, including premium increases or the imposition of large deductible or co-insurance requirements, could have a material adverse effect on our business, financial condition and results of operations. Furthermore, litigation, regardless of its outcome, could result in a substantial cost to us and divert management's attention from our operations. Any significant claim against us or litigation involving us could have a material adverse effect on our business, financial condition and results of operations.
We have implemented a number of measures designed to ensure the security of our information, IT resources and other assets. Nonetheless, unauthorized users could gain access to our systems through cyber-attacks and steal, use without authorization and sabotage our intellectual property and confidential data. Any security breach, misuse of our IT systems or theft of our or our customers' intellectual property or data could lead to customer losses, non-renewal of customer agreements, loss of production, recovery costs or litigation brought by customers or business partners, any of which could adversely impact our cash flows and reputation and could have an adverse impact on our disclosure controls and procedures.
Our ability to provide our services may be adversely impacted by disruptions to our hardware and software systems.
Our services are highly dependent on our computer and telecommunications equipment and software systems. Disruptions in our service and related software systems could be the result of errors or acts by our vendors, customers, users or other third parties, or electronic or physical attacks by persons seeking to disrupt our operations. Any damage to, or failure or capacity limitations of, our systems and our related network could result in interruptions in our service that could cause us to lose revenue, issue credits or refunds or could cause our customers to terminate their subscriptions for our services, in each case adversely affecting our renewal rates. Since our customers use our service for important aspects of their businesses, any errors, defects, disruptions in service or other performance problems could hurt our reputation and may damage our customers' businesses. As a result, we may lose revenue, issue credits or refunds or customers could elect not to renew our services or delay or withhold payments to us. We could also lose future sales or customers may make claims against us, which could result in an increase in our provision for doubtful accounts, an increase in collection cycles for accounts receivable or the expense or risk of litigation.
If we experience interruptions, delays or performance problems with the systems and applications that support our internal operations or difficulties replacing or implementing changes to those systems and applications, our business may be harmed.
We rely on various systems and applications to support our internal operations, including our billing, financial reporting and customer contracting functions. The availability of these systems and applications is essential to us and delays, disruptions or performance problems may adversely impact our ability to accurately bill our customers, report financial information and conduct our business. Additionally, we may choose to replace or implement changes to these systems, including substituting traditional systems with cloud-based solutions, which could be time-consuming and expensive and which could result in delays in the ongoing operational processes these software solutions support. Further, our cloud-based solutions may experience disruptions and outages that are beyond our control as we rely on third party vendors to support these solutions and assure their continued availability.
We may not successfully develop, introduce or integrate new services or enhancements to our Intralinks Platform or our application solutions and this could harm our reputation, revenues and operating income.
Our ability to attract new customers and increase revenue from existing customers will depend in large part on our ability to enhance and improve our existing Intralinks Platform, including our application solutions, and to introduce new functionality either by acquisition or internal development. Our operating results would suffer if our innovations are not responsive to the needs of our customers, are not appropriately timed with market opportunities or are not brought to market effectively. In addition, it is possible that our assumptions about the features that we believe will drive purchasing decisions for our potential customers or renewal decisions for our existing customers could be incorrect. In the past, we have experienced delays in the planned release dates of new features and upgrades and have discovered defects in new services after their introduction. There can be no assurance that new services or upgrades will be released on schedule or that, when released, they will not contain defects as a result of poor planning, execution or other factors during the product development lifecycle. In addition, we could experience challenges, delays or quality issues in our product development efforts due to the demands of the Agile development methodology we rely upon. If any of these situations were to arise, we could suffer adverse publicity, damage to our reputation, loss of revenue, delay in market acceptance or claims by customers brought against us, all of which could have a material adverse effect on our business, results of operations and financial condition. Moreover, upgrades and enhancements to our Intralinks Platform may require substantial investment and there can be no assurance that our investments will prove to help us achieve or sustain a durable competitive advantage in products, services and processes. If customers do not widely adopt our solutions or new innovations to our solutions, we may not be able to justify the investments we have made. If we are unable to develop, license or acquire new solutions or enhancements to existing services on a timely and cost-effective basis, or if our new or enhanced solutions do not achieve market acceptance, our business, results of operations and financial condition will be materially adversely affected.
15
Undetected errors or failures found in our products and services may result in loss of or delay in market acceptance of our products and services that could seriously harm our business.
Our products and services may contain undetected errors or scalability limitations at any point in their lives, but particularly when first introduced or as new versions are released. We frequently release new versions of our products and different aspects of our platform are in various stages of development. Despite testing by us and by current and potential customers, errors may not be found in new products and services until after commencement of commercial availability or use, resulting in a loss of or a delay in market acceptance, damage to our reputation, customer dissatisfaction and reductions in revenues and margins, any of which could seriously harm our business. Additionally, our agreements with customers that attempt to limit our exposure to liability claims may not be enforceable in jurisdictions where we operate, particularly in certain markets outside the United States.
If we fail to develop our brand cost-effectively, our business may suffer.
We believe that developing and maintaining awareness of the Intralinks brand in a cost-effective manner is critical to achieving widespread acceptance of our existing and future services and is an important element in attracting new customers. Furthermore, we believe that the importance of brand recognition will increase as competition in our market develops. Successful promotion of our brand will depend largely on the effectiveness of our marketing efforts and our ability to provide reliable and useful services at competitive prices. In addition, misaligned marketing strategy may hinder our ability to build necessary brand awareness and complete the sales cycle. Brand promotion and protection will also require protection and defense of our trademarks, service marks and trade dress, which may not be adequate to protect our investment in our brand or prevent competitors' use of similar brands. In the past, our efforts to build our brand have involved significant expense. Brand promotion activities may not yield increased revenue, and even if they do, any increased revenue may not offset the expenses we incur in building our brand. If we fail to successfully promote and maintain our brand, or incur substantial expenses in unsuccessful attempts to promote and maintain our brand, we may fail to attract enough new customers or retain our existing customers to the extent necessary to realize a sufficient return on our brand-building efforts, and our business could suffer.
Our business depends substantially on customers renewing and expanding their subscriptions for our services. Any decline in our customer renewals and expansions would harm our future operating results.
We enter into subscription agreements with certain of our customers that are generally one year in length. As a result, maintaining the renewal rate of our subscription agreements is critical to our future success. We cannot assure you that any of our customer agreements will be renewed as our customers have no obligation to renew their subscriptions for our services after the expiration of the initial term of their agreements. The loss of any customers that individually or collectively account for a significant amount of our revenues would have a material adverse effect on our results of operations or financial condition. If our renewal rates are lower than anticipated or decline for any reason, or if customers renew on terms less favorable to us, our revenue may decrease and our profitability and gross margin may be harmed, which would have a material adverse effect on our business, results of operations and financial condition.
We derive a substantial portion of our revenue from contracts that provide for the use of our solutions for a fixed duration. Our inability to enter into new contracts as existing ones expire could negatively impact our overall financial performance.
Many of our contracts with customers are entered into in connection with discrete one-time financial and strategic business transactions and projects such as mergers and acquisitions, or M&A, transactions. During the fiscal years ended December 31, 2013, 2014 and 2015, revenue generated from transactional contracts constituted a substantial portion of our total revenue. These transactional agreements typically have initial terms of six to twelve months depending on the type of transaction and related purpose of the Intralinks exchange. Accordingly, our business depends on our ability to replace these transactional agreements as they expire. Our inability to enter into new contracts with existing customers or find new customers to replace these contracts could have a material adverse effect on our business, results of operations and financial condition.
A significant part of our business is derived from the use of our application solutions in connection with financial and strategic business transactions. Economic trends that affect the volume of these transactions may negatively impact the demand for our services.
A significant portion of our revenue depends on the purchase of our services by parties involved in financial and strategic business transactions such as M&A transactions, loan syndications and other debt capital markets, or DCM, transactions. During the fiscal years ended December 31, 2013, 2014 and 2015, revenue generated from the M&A and DCM principal markets constituted 59.4%, 62.2% and 61.4%, respectively, of our total revenue. The volume of these types of transactions drives demand for our services. Downturns in the global economy or in the economies of the geographies in which we do business, rising unemployment and reduced equity valuations all create risks that could harm our business. We are not able to predict the impact any potential worsening of macroeconomic conditions could also have on our results of operations. The level of activity in the financial services industry, including the financial transactions our services are used to support, is sensitive to many factors beyond our control, including interest rates, regulatory policies, general economic conditions, our customers' competitive environments, business trends, terrorism and political change. Unfavorable conditions or changes in any of these factors could adversely affect our business, operating
16
results and financial condition.
We typically provide service availability commitments under our customer agreements. If we fail to meet these contractual commitments, we could be obligated to provide credits or refunds or face contract terminations, which could adversely affect our revenue and reputation.
In our customer agreements, we typically provide service level commitments. For some of our larger enterprise and government agency customers, we may provide custom service level commitments. If we are unable to meet our stated service level commitments or if we were to suffer extended periods of unavailability of our solutions, we might be contractually obligated to provide affected customers with service credits or refunds, or we could face contract terminations or non-renewals. Our revenue could be significantly affected if we suffer unscheduled downtime that exceeds the allowed downtimes under our customer agreements. Any extended service outages could adversely affect our reputation, revenue and operating results.
The quality of our support and services offerings is important to our customers and, if we fail to offer high quality support and services, customers may not buy our solutions and our revenue may decline.
Our customers generally depend on our service organization to resolve issues relating to the use of our solutions. A high level of support is critical for the successful marketing and sale of our solutions. If we are unable to provide a level of support and service to meet or exceed the expectations of our customers, we could experience:
• | loss of customers and market share; |
• | a failure to attract new customers, including in new geographic regions; and |
• | increased service and support costs and a diversion of resources. |
Any of the above results would likely have a material adverse impact on our business, revenue, results of operations, financial condition and reputation.
The sales cycle for enterprise customers can be long and unpredictable and requires considerable time and expense, which may cause our operating results to fluctuate.
The timing of our revenue from sales to enterprise customers is difficult to predict. Our enterprise sales efforts require us to educate our customers about the use and benefit of our services, including the technical capabilities and potential cost savings to an organization. In this market segment, in order to make sales, we may need to provide greater levels of customer education regarding the uses and benefits of our services, as well as regarding security, privacy, and data protection laws and regulations, especially for those customers in more heavily regulated industries or those with significant international operations. Enterprise customers typically undertake a significant evaluation process that has, in the past, resulted in a lengthy sales cycle, typically several months. We spend substantial time, effort and capital resources on our enterprise sales efforts without any assurance that our efforts will produce any sales.
In addition, larger enterprises may demand more customization, integration and support services and features. As a result, we may need to devote greater sales support and professional services resources to these sales opportunities, which could increase our costs, extend our sales cycle and divert our own sales and professional services resources to a smaller number of larger customers. Where we make sales to enterprise customers on a subscription basis, there is a delay between when we make the sale and when we start to recognize revenue from that customer. Further, where we provide professional services, we are required to delay revenue recognition on some of these transactions until the technical or implementation requirements have been met.
If sales expected from any specific customer for a particular period are not realized in that period or at all or we are required to delay realization of revenue related to a transaction to a later period, our financial results could fall short of public expectations and our business, operating results and financial condition could be adversely affected.
Indemnity provisions in various agreements to which we are a party, including our customer agreements, potentially expose us to substantial liability for losses arising out of intellectual property infringement and other causes.
Certain of our agreements with customers and partners include indemnification provisions under which we have agreed to indemnify the counter-party for losses suffered or incurred as a result of claims of intellectual property infringement related to our Intralinks Platform or application solutions and, in some cases, for financial and other damages caused by us to property or persons. If we were required to make large indemnity payments, our business, operating results and financial condition could be materially and adversely affected.
17
Allegations that we have infringed the proprietary rights of others, whether successful or not, may significantly increase our costs or adversely affect our results of operations and stock price.
A third party may assert that our technology or services violates its intellectual property rights. In particular, as the number of products and services offered in our markets increase, as well as the number of related patents issued in the United States and elsewhere, and the functionality of these products and services further overlap, we believe that infringement claims may arise. Any claims, regardless of their merit, could:
• | be expensive and time-consuming to defend; |
• | force us temporarily to suspend or completely to stop providing services that incorporate the challenged intellectual property; |
• | require us to redesign our technology and services; |
• | divert management's attention and other company resources; and |
• | require us to enter into royalty or licensing agreements in order to obtain the right to use necessary technologies, which may not be available on terms acceptable to us, if at all. |
We face shareholder lawsuits and other potential liabilities that could materially adversely impact our business, financial condition and results of operations.
We have been, are currently and may in the future be the subject of various lawsuits, proceedings and investigations. Specifically, we and certain of our current and former officers and directors were named as defendants in a class action lawsuit and we and certain of our current and former officers and directors were previously named as defendants in a series of stockholder derivative lawsuits, one of which remains ongoing. See Part I, Item 3 - "Legal Proceedings" for more information. Though the class action and one of these derivative lawsuits have been dismissed, given the stage of the remaining derivative lawsuit, we are unable to assess or quantify with any certainty the outcome, timing or potential costs of that matter.
The outcome and amount of resources needed to respond to, defend or resolve lawsuits or regulatory actions or requests is unpredictable and may remain unknown for long periods of time. Our exposure under these matters may also include our indemnification obligations, to the extent we have any, to current and former officers and directors and, in some cases former underwriters, against losses incurred in connection these matters, including reimbursement of legal fees and other expenses. Although we maintain insurance for claims of this nature, our insurance coverage does not apply in all circumstances and may be denied or insufficient to cover the costs related to the class action and stockholder derivative lawsuits. In addition, these matters or future lawsuits or investigations involving us may increase our insurance premiums, deductibles or co-insurance requirements or otherwise make it more difficult for us to maintain or obtain adequate insurance coverage on acceptable terms, if at all. Moreover, adverse publicity associated with regulatory actions and investigations and negative developments in pending legal proceedings could decrease customer demand for our services. As a result, the pending lawsuits and any future lawsuits or investigations involving us or our officers or directors could have a material adverse effect on our business, reputation, financial condition, results of operations, liquidity and the trading price of our common stock.
Compliance with changing European privacy laws could require us to incur significant costs or experience significant business disruption and failure to so comply could result in an adverse impact on our business.
Our application solutions provide our customers with central locations where they can post information and make it accessible to any parties they authorize to access that information. In connection with offering our solutions to our customers and their invited guests, we collect user information related to the individuals who access our software solutions.
Europe Directive 95/46/EC, which covers the protection of individuals with regard to the processing of personal data and on the free movement of such data, or the Directive, has required European Union member states to implement data protection laws to meet the strict privacy requirements of the Directive. Among other requirements, the Directive regulates transfers of personally identifiable data that is subject to the Directive, or Personal Data, to third countries, outside the European Economic Area, or the EEA, such as the United States, that have not been found to provide adequate protection to such Personal Data. We have in the past relied upon adherence to the U.S. Department of Commerce’s Safe Harbor Privacy Principles and compliance with the U.S.-EU Framework as agreed to and set forth by the U.S. Department of Commerce and the European Union, which established a means for legitimating the transfer of Personal Data by data controllers in the EEA to the United States. As a result of the October 6, 2015 European Union Court of Justice, or ECJ, opinion in Case C-362/14 (Schrems v. Data Protection Commissioner) regarding the adequacy of the U.S.-EU Safe Harbor Framework, the U.S.-EU Safe Harbor Framework is no longer deemed to be a valid method of compliance with requirements set forth in the Directive (and member states’ implementations thereof) regarding the transfer of Personal Data outside of the EEA.
Recently, it was announced that negotiators from Europe and the United States reached political agreement on a successor to the Safe Harbor framework that will be referred to as the EU-US Privacy Shield. However, it is likely to be months before all of the
18
details regarding the Privacy Shield program are finalized and a procedure is introduced to allow interested companies to participate in the program. While the details regarding the Privacy Shield program continue to be finalized, we will continue to face uncertainty as to whether our efforts to comply with our obligations under European privacy laws will be sufficient. If we are investigated by a European data protection authority, we may face fines and other penalties. Any such investigation or charges by European data protection authorities could have a negative effect on our existing business and on our ability to attract and retain new customers.
In light of the ECJ opinion in the Schrems case, we have begun to undertake efforts to conform transfers of Personal Data from the EEA based on current regulatory obligations, the guidance of data protection authorities and evolving best practices. Despite these efforts, we may be unsuccessful in establishing conforming means of transferring such data from the EEA, including due to ongoing legislative activity, which may vary the current data protection landscape.
We may also experience hesitancy, reluctance, or refusal by European or multi-national customers to continue to use our services due to the potential risk exposure that these customers might face as a result of the ECJ ruling in the Schrems case and the current data protection obligations imposed on them by certain data protection authorities. These customers may also view any alternative approaches to compliance as being too costly, too burdensome, too legally uncertain or otherwise objectionable and therefore decide not to do business with us.
We and our customers are at risk of enforcement actions taken by certain EU data protection authorities until such time as we may be able to ensure that all transfers of Personal Data to us from the EEA are conducted in compliance with all applicable regulatory obligations, the guidance of data protection authorities and evolving best practices. We may find it necessary to establish systems to maintain Personal Data originating from the EU in the EEA, which may involve substantial expense and may cause us to need to divert resources from other aspects of our business, all of which may adversely affect our business.
The Directive will be replaced in time with the pending European General Data Protection Regulation, which will impose additional obligations and risk upon our business and which may increase substantially the penalties to which we could be subject in the event of any non-compliance. We may incur substantial expense in complying with the new obligations to be imposed by the European General Data Protection Regulation and we may be required to make significant changes in our business operations, all of which may adversely affect our revenues and our business overall.
Government regulation of the internet and e-commerce and of the international exchange of certain information is subject to possible unfavorable changes, and our failure to comply with applicable regulations could harm our business and operating results.
As internet commerce continues to evolve, increasing regulation by federal, state, local and foreign governments becomes more likely. For example, we believe increased regulation is likely in the area of data privacy. Further, laws and regulations applying to the solicitation, collection, processing or use of personal or consumer information could affect our customers' ability to use and share data, potentially reducing demand for our products and services. In addition, taxation of products and services provided over the internet or other charges imposed by government agencies or by private organizations for accessing the internet may also be imposed. Any regulation imposing greater fees for internet use or restricting the exchange of information over the internet could result in reduced growth or a decline in the use of the internet and could diminish the viability of our internet-based services, which could harm our business and operating results.
Changes in laws, regulations or governmental policy applicable to our customers or potential customers may decrease the demand for our solutions or increase our costs.
The level of our customers' and potential customers' activity in the business processes our services are used to support is sensitive to many factors beyond our control, including governmental regulation and regulatory policies. Many of our customers and potential customers in the life sciences, energy, utilities, insurance, financial and other industries are subject to substantial regulation and may be the subject of further regulation in the future. Accordingly, significant new laws or regulations or changes in, or repeals of, existing laws, regulations or governmental policy may change the way these customers do business and could cause the demand for and sales of our solutions to decrease. For example, many products developed by our customers in the life sciences industry require approval of the United States Food and Drug Administration, or FDA, and other similar foreign regulatory agencies before they can market their products. The processes for filing and obtaining FDA approval to market these products are guided by specific protocols that our services help support, such as United States 21 CFR Part 11, which provides the criteria for acceptance by the FDA of electronic records. If new government regulations from future legislation or administrative action or from changes in FDA or foreign regulatory policies occur in the future, the services we currently provide may no longer support these life science processes and protocols, and we may lose customers in the life sciences industry. Any change in the scope of applicable regulations that either decreases the volume of transactions that our customers or potential customers enter into or otherwise negatively impacts their use of our solutions would have a material adverse effect on our revenues or gross margins. Moreover, complying with increased or changed regulations could cause our operating expenses to increase as we may have to reconfigure our existing services or develop new services to adapt to new regulatory rules and policies, either of which will require additional expense and time. Additionally, the information provided by, or residing in, the software or services we provide to our customers could be deemed relevant to a regulatory investigation or other governmental or private legal proceeding involving our customers, which
19
could result in requests for information from us that could be expensive and time consuming for us to address or harm our reputation since our customers rely on us to protect the confidentiality of their information. These types of changes could adversely affect our business, results of operations and financial condition.
If we are unable to increase our penetration in our existing principal markets, develop, market and sell new solutions or expand into additional markets, we will be unable to grow our business and increase our revenue.
We currently market our solutions for a wide range of business processes. These include:
• | due diligence for M&A transactions; |
• | public offerings and other strategic transactions; |
• | loan syndication and other debt capital markets transactions; |
• | board reporting; |
• | partner document collaboration; |
• | distribution of regulated content; |
• | secure mobile access to content; |
• | clinical trial management; |
• | safety information exchange and drug development and licensing for the life sciences industry; |
• | private equity fundraising, hedge fund marketing and investor reporting; |
• | energy exploration and production ventures for the oil and gas industry; |
• | contract and vendor management; |
• | external content repositories; and |
• | collaboration and sharing within and outside of organizations. |
We intend to continue to focus our sales and marketing efforts in these markets to grow our business. In addition, we believe our future growth depends not only on increasing our penetration into the principal markets in which our services are currently used, but also on identifying and expanding the number of industries, communities and markets that use or could use our services and expanding the solutions we offer to customers in those markets. Efforts to expand our service offerings beyond the markets that we currently serve or to develop, market and sell new service offerings, however, may divert management resources from existing operations, expose us to increased competition from new and existing competitors and require us to commit significant financial resources to an unproven business, any of which could significantly impair our operating results. Moreover, efforts to expand beyond our existing markets and solutions may never result in new services that achieve market acceptance, create additional revenue or become profitable, particularly if a new target market turns out to be substantially less attractive than we envision due to overestimates in the number of potential customers, the speed at which the market will evolve or grow, the price potential customers are willing to pay for our solutions or the rate at which they are ready to adopt new products or approaches. Our inability to further penetrate our existing markets, successfully launch new solutions or identify additional markets and achieve acceptance of our services in these additional markets could adversely affect our business, results of operations and financial condition.
If we are unable to attract, engage, retain and integrate our executives and other key employees, we may not be able to implement our business strategy.
Our success depends, in large part, on our ability to attract, engage, retain and integrate qualified executives and other key employees throughout all areas of our business. Identifying, developing internally or hiring externally, training and retaining highly-skilled managerial, technical, sales and services, finance and marketing personnel are critical to our future. Competition for experienced and qualified employees can be intense. In order to attract and retain executives and other key employees in a competitive marketplace, we must provide a competitive compensation package, including cash- and equity-based compensation. If we do not obtain the stockholder approval needed to continue granting equity compensation in a competitive manner, our ability to attract, retain, and motivate executives and key employees could be weakened. In addition, we may be unable to attract and retain key personnel on acceptable terms given the competition among technology companies for experienced management personnel. Failure to successfully hire executives and key employees or the loss of any executives and key employees could have a significant impact on our operations.
Further, we rely on the expertise and experience of our senior management, especially our President and Chief Executive Officer, Ronald W. Hovsepian, as well as the other executive officers and key employees referenced in Item 10 of this Annual Report. Although we have employment agreements with our executive officers, none of them or any of our other management personnel is obligated to remain employed by us. We have no key-man insurance on any members of our management team. The loss of
20
services of any key management personnel could lower productive output, interrupt our strategic vision and make it more difficult to pursue our business goals successfully.
Our employee retention and hiring may be adversely impacted by immigration restrictions and related factors.
Competition for skilled personnel is intense in our industry and any failure on our part to hire and retain appropriately skilled employees could harm our business. Our ability to hire and retain skilled employees is impacted, at least in part, by the fact that a portion of our professional workforce in the United States is comprised of foreign nationals who are not United States citizens. In order to be legally allowed to work for us, these individuals generally hold immigrant visas (which may or may not be tied to their employment with us) or green cards, the latter of which makes them permanent residents in the United States.
The ability of these foreign nationals to remain and work in the United States is impacted by a variety of laws and regulations, as well as the processing procedures of various government agencies. Changes in applicable laws, regulations or procedures could adversely affect our ability to hire or retain these skilled employees and could affect our costs of doing business and our ability to deliver services to our customers. In addition, if the laws, rules or procedures governing the ability of foreign nationals to work in the United States were to change or if the number of visas available for foreign nationals permitted to work in the United States were to be reduced, our business could be adversely affected, if, for example, we were unable to hire or no longer able to retain a skilled worker who is a foreign national.
Employing foreign nationals may require significant time and expense and our foreign national employees may choose to leave after we have made this investment. While a foreign national who is working under an immigrant visa tied to his or her employment by us may be less likely to choose to leave our company than a similarly situated employee who is a United States national or a green card holder (as leaving our employ could mean also having to leave the United States), this may not always be the case. Additionally, many of our foreign national employees hold green cards, which means that they have greater flexibility to leave our company without facing the risk of also having to leave the United States.
If we are unable to maintain or expand our direct sales capabilities, we may not be able to generate anticipated revenues. In addition, if we are unable to maintain or expand our product development capabilities, we may not be able to meet our product development goals.
Our success depends in large part on our ability to attract, motivate and retain highly qualified personnel. We rely primarily on our direct sales force to sell our services. Our services and solutions require a sophisticated sales effort targeted at the senior management of our prospective customers. We may not have the required processes, systems and discipline to execute on our sales and growth strategies. We must expand our sales efforts to generate increased revenue from new customers. Failure to hire or retain qualified sales personnel will preclude us from expanding our business and generating anticipated revenue. Competition for talented sales personnel is intense and there can be no assurance that we will be able to retain our existing sales personnel or attract, assimilate or retain enough highly qualified sales personnel. Many of the companies with which we compete for experienced personnel have greater resources than we have. If any of our sales representatives or sales management personnel were to leave us and join one of our competitors, we may be unable to prevent those sales representatives from helping our competitors solicit business from our existing customers, which could adversely affect our revenue.
In our industry, there is substantial and continuous competition for individuals with high levels of technical experience and expertise in designing and developing innovative solutions. We may not be successful in attracting and retaining qualified personnel. We have from time to time experienced, and we expect to continue to experience, difficulty in hiring and retaining highly skilled employees with appropriate technical qualifications. If we fail to attract new technical personnel or fail to retain and motivate our current technical personnel, we may not be able to meet our product development goals and our business could be materially harmed.
In addition, we believe that, in making employment decisions, particularly in the software industry, job candidates often consider the value of the stock options they are to receive in connection with their employment. We have experienced and may in the future experience a substantial decline in the trading price of our stock. Accordingly, if the price of our stock is subject to a lengthy period of continued decline or significant volatility, our ability to attract or retain key employees could be materially impaired. In the past, our sales force has experienced high turnover rates. New hires require training and take time to achieve full productivity. If we experience high turnover in our sales force or our product development group in the future, we cannot be certain that new hires will become as productive as necessary to maintain or increase our revenue.
Our performance and growth depend on our ability to generate customer referrals and to develop referenceable customer relationships that will enhance our sales and marketing efforts. A failure to accomplish these objectives could materially harm our business.
We depend on end-users of our solutions to generate customer referrals for our services. We depend in part on the financial institutions, legal providers and other third parties who use our services to recommend them to a larger customer base than we can reach through our direct sales and internal marketing efforts. For instance, a significant portion of our revenue from our M&A business is derived from referrals by investment banks, financial advisors and law firms that have utilized our services in connection
21
with prior transactions. These referrals are an important source of new customers for our services and generally are made without expectation of compensation. We intend to continue to focus our marketing efforts on these referral partners in order to expand our reach and improve the efficiency of our sales efforts.
We also recognize that having respected, well known, market-leading customers who have committed to deploy our solutions within their organizations will support our marketing and sales efforts, as these customers can act as references for us and our product offerings. Having these types of “referenceable” or “anchor” customers is an important part of our growth strategy. Our ability to establish and maintain these customer relationships is important to our future profitability. The willingness of these types of customers to provide referrals or serve as anchor or reference customers depends on a number of factors, including the performance, ease of use, reliability, reputation and cost-effectiveness of our services as compared to those offered by our competitors, as well as the internal policies of these customers. We may not be able to cultivate or maintain the strong relationships with customers that are necessary to develop those customer relationships into referenceable accounts.
The loss of any of our significant referral sources, including our anchor customers, or a decline in the number of referrals we receive or anchor customers that we generate could require us to devote substantially more resources to the sales and marketing of our services, which would increase our costs, potentially lead to a decline in our revenue, slow our growth and generally have a material adverse effect on our business, results of operations and financial condition. In addition, the revenue we generate from our referral and anchor relationships may vary from period to period.
We rely in part on strategic relationships with third parties to sell and deliver our solutions. If we are unable to successfully develop and maintain these relationships, our business may be harmed.
In addition to generating customer referrals through third-party users of our solutions, we intend to pursue relationships with other third parties such as technology and content providers and implementation and distribution partners. Our future growth will depend, at least in part, on our ability to enter into and maintain successful strategic relationships with these third parties. Identifying partners and negotiating and documenting relationships with them requires significant time and resources, as does integrating third-party content and technology. Some of the third parties with whom we have strategic relationships have entered and may continue to enter into strategic relationships with our competitors. Further, these third parties may have multiple strategic relationships and may not regard us as significant for their businesses. As a result, they may choose to offer their services on terms that are unfavorable to us, terminate their respective relationships with us, pursue other partnerships or relationships, or attempt to develop or acquire services or solutions that compete with ours. Our relationships with strategic partners could also interfere with our ability to enter into desirable strategic relationships with other potential partners in the future. If we are unsuccessful in establishing or maintaining relationships with strategic partners on favorable economic terms, our ability to compete in the marketplace or to grow our revenue could be impaired, and our business, results of operations and financial condition would suffer. Even if we are successful, we cannot assure you that these relationships will result in increased revenue or customer usage of our solutions or that the economic terms of these relationships will not adversely affect our margins.
Consolidation in the commercial and investment banking industries and other industries we serve could adversely impact our business by eliminating a number of our existing and potential customers.
There has been, and continues to be, merger, acquisition and consolidation activity among our customers. Mergers or consolidations of banks and financial institutions, in particular, have reduced and may continue to reduce the number of our customers and potential customers for our solutions, resulting in a smaller market for our services, which could have a material adverse impact on our business and results of operations. In addition, it is possible that the larger institutions that result from mergers or consolidations could perform themselves some or all of the services that we currently provide or could provide in the future. A merger of two of our existing customers may also result in the merged entity deciding not to use our service or to purchase fewer of our services than the companies did separately or may result in the merged entity seeking pricing advantages or discounts using the leverage of its increased size. If that were to occur, it could adversely impact our revenue, which in turn would adversely affect our business, results of operations and financial condition.
We operate in highly competitive markets, which could make it more difficult for us to acquire and retain customers.
The markets for online collaborative content workspaces and solutions for managing, distributing and protecting enterprise content are intensely competitive and rapidly changing, with relatively low barriers to entry. We expect competition to increase from existing competitors, as well as new and emerging market entrants. In addition, as we expand our service offerings, we may face competition from new and existing competitors. It is also possible that our customers could decide to create, invest in or collaborate in the creation of competitive products that might limit or reduce their need for our products, services and solutions.
We compete primarily on product functionality, service levels, security and compliance characteristics, price and reputation. Our competitors include companies that provide online products that serve as document repositories, virtual data rooms or enterprise content file sharing and collaboration solutions, together with other products or services that may result in those companies effectively selling these services at lower prices and creating downward pricing pressure for us. Some of our competitors may have significantly greater financial resources than we do and they may be able to devote greater resources to the development and
22
improvement of their services than we can. As a result, our competitors may be quicker at implementing technological changes and responding to customers' changing needs including, but not limited to, changes in the area of data privacy. In addition, if our competitors consolidate or our smaller competitors are acquired by other, larger competitors, they may be able to provide services comparable to ours at a lower price due to their size. Our competitors may also develop services or products that are superior to ours and their products or services may gain greater market acceptance than our services. The arrival of new market entrants could reduce the demand for our services or cause us to reduce our pricing, resulting in a loss of revenue and adversely affecting our business, results of operations and financial condition.
The average sales price of our solutions may decrease, which may reduce our profitability.
The average sales price for our solutions may decline for a variety of reasons, including competitive pricing pressures, discounts we offer, new pricing models, a change in the mix of our solutions, anticipation of the introduction of new solutions or promotional programs. Competition continues to increase in the market for online collaborative content workspaces and we expect competition to further increase in the future, thereby leading to increased pricing pressures. We cannot assure you that we will be successful maintaining our prices at levels that will allow us to maintain profitability. Failure to maintain our prices could have an adverse effect on our business, results of operations and financial condition.
If we do not maintain the compatibility of our services with third-party applications that our customers use in their business processes, demand for our services could decline.
Our solutions can be used alongside a wide range of other systems such as email and enterprise software systems used by our customers in their businesses. If we do not support the continued integration of our services with third-party applications, including through the provision of application programming interfaces that enable data to be transferred readily between our services and third-party applications, demand for our services could decline and we could lose sales or experience declining renewal rates. We will also be required to make our services compatible with new or additional third-party applications that are introduced to the markets that we serve and, if we are not successful, we could experience reduced demand for our services. In addition, prospective customers, especially large enterprise customers, may require heavily customized features and functions unique to their business processes. If prospective customers require customized features or functions that we do not offer and that would be difficult for them to develop and integrate within our services, then the market for our services will be adversely affected.
If we fail to adapt our services to changes in technology or the marketplace, we could lose existing customers and fail to attract new business.
We may not currently or in the future appropriately leverage advances in technology to achieve or sustain a competitive advantage in products, services, information and processes. Our customers and users regularly adopt new technologies and industry standards continue to evolve. The introduction of products or services and the emergence of new industry standards can render our existing services obsolete and unmarketable in short periods of time. We expect others to continue to develop, introduce new and enhance existing products and services, which will compete with our services. Our future success will depend, in part, on our ability to enhance our current services and to develop and introduce new services that keep pace with technological developments, emerging industry standards and the needs of our customers. We cannot assure you that we will be successful in cost-effectively developing, marketing and selling new services or service enhancements that meet these changing demands on a timely basis, that we will not experience difficulties that could delay or prevent the successful development, introduction and marketing of these services, or that our new service and service enhancements will adequately meet the demands of the marketplace and achieve market acceptance. We also cannot assure you that the features that we believe will drive purchasing decisions will in fact be the features that our potential customers consider most significant.
Though acceptance of cloud-based enterprise software has advanced in recent years, some businesses may still be hesitant to adopt these types of solutions.
The cloud-based enterprise software market is not as mature as the market for on-premise enterprise software. Some businesses may still be uncertain as to whether a cloud-based service like ours is appropriate for their business needs. Many organizations have invested substantial personnel and financial resources to integrate traditional enterprise software into their organizations and, therefore, may be reluctant or unwilling to migrate to a cloud-based model for storing, accessing, sharing and managing their content. Because we derive, and expect to continue to derive, a substantial portion of our revenue and cash flows from sales of our cloud-based enterprise software solutions, our success will depend to a substantial extent on the widespread adoption of cloud computing for enterprises in general. It is difficult to predict customer adoption rates and demand for our services, the future growth rate and size of the cloud computing market or the entry of competitive services. The expansion of a cloud-based enterprise software market depends on a number of factors, including the cost, performance and perceived value associated with cloud computing, as well as the ability of companies that provide cloud-based services to address security and privacy concerns. If we or other providers of cloud-based services experience security incidents, loss of customer data, disruptions in delivery or other problems, the market for cloud-based services as a whole, including our services, may be negatively affected. If there is a reduction in demand for cloud-based services caused by a lack of customer acceptance, technological challenges, weakening economic
23
conditions, security or privacy concerns, competing technologies and products, decreases in corporate spending or otherwise, we could experience decreased revenue, which could harm our growth rates and adversely affect our business and operating results.
Our customers may adopt technologies that decrease the demand for our services, which could reduce our revenue and adversely affect our business.
We target large institutions such as commercial banks, investment banks and life sciences companies for many of our services and we depend on their continued need for our services. However, over time, our customers or their advisors, such as law firms and investment banking firms, may acquire, adopt or develop their own technologies, such as client extranets, that decrease the need for our solutions. The use of these internal technologies could reduce the demand for our services, result in pricing pressures or cause a reduction in our revenue. If we fail to manage these challenges adequately, our business, results of operations and financial condition could be adversely affected.
Interruptions or delays in our service due to problems with our third-party web hosting facilities or other third-party service providers could adversely affect our business.
We rely on SunGard Availability Services LP and its affiliates, or SunGard, for the maintenance of the equipment running our solutions and software at geographically dispersed hosting facilities. Our agreements with SunGard expire on December 31, 2017. If we are unable to renew, extend or replace these agreements, we may be unable to arrange for replacement services at a similar cost and in a timely manner, which could cause an interruption in our service. We do not control the operation of these SunGard facilities, each of which may be subject to damage or interruption from earthquakes, floods, fires, power loss, telecommunications failures or similar events. These facilities may also be subject to break-ins, sabotage, intentional acts of vandalism or similar misconduct. Despite precautions taken at these facilities, the occurrence of a natural disaster, cessation of operations by our third-party web hosting provider or SunGard's decision to close a facility without adequate notice or other unanticipated problems at any facility could result in lengthy interruptions in our service. In addition, the failure by these facilities to provide our required data communications capacity could result in interruptions in our service.
We have a substantial amount of debt that exposes us to risks that could adversely affect our business, operating results and financial condition.
We had a significant amount of indebtedness outstanding as of December 31, 2015, including $83.3 million outstanding pursuant to a Term Loan Credit Facility, $2.9 million in outstanding letters of credit pursuant to a Revolving Credit Facility and $4.7 million pursuant to an equipment loan financing arrangement. We refer to the Term Loan Credit Facility and the Revolving Credit Facility collectively as the Credit Facilities and the equipment loan financing arrangement as the Equipment Loan Financing. In February 2014, when we entered into the Credit Facilities, we refinanced all the outstanding indebtedness under our first lien credit facility entered into in June 2007, or the Prior Credit Facility. Each of our Credit Facilities is secured by liens on substantially all of our assets. Our Revolving Credit Facility is secured by a first lien on our cash, accounts receivable and certain other liquid collateral and a second lien on our other assets. Our Term Loan Credit Facility is secured by a second lien on our cash, accounts receivable and certain other liquid collateral and a first lien on our other assets. Our Equipment Loan Facility is secured by liens on the equipment financed under that facility. The level and nature of our indebtedness could, among other things:
• | make it difficult for us to obtain any necessary financing in the future; |
• | limit our flexibility in planning for or reacting to changes in our business; |
• | reduce funds available for use in our operations and corporate development initiatives; |
• | impair our ability to incur additional debt because of financial and other restrictive covenants or the liens on our assets that secure our current debt; |
• | hinder our ability to raise equity capital, because in the event of a liquidation of our business, debt holders receive a priority before equity holders; |
• | make us more vulnerable in the event of a downturn in our business; and |
• | place us at a possible competitive disadvantage relative to less leveraged competitors and competitors that have better access to capital resources. |
We have the ability to request the issuance of letters of credit under our Revolving Credit Facility. As of December 31, 2015, the outstanding obligations under the Revolving Credit Facility were primarily related to separate letters of credit provided to landlords under outstanding operating lease agreements for certain of the Company's office locations.
If we increase our indebtedness by borrowing under our Revolving Credit Facility, cash collateralized facility or incur other new indebtedness, each of the risks described above would increase. In addition, we may incur significantly more debt in the future, which will increase each of the risks described above related to our indebtedness.
Our loan agreements contain operating and financial covenants that may restrict our business and financing activities.
24
In February 2014, we refinanced all of the outstanding indebtedness under our Prior Credit Facility with the proceeds of our new Term Loan Credit Facility and our new Revolving Credit Facility. In October 2015, we entered into the Equipment Loan Facility. The borrowings under our Credit Facilities are secured by substantially all of our assets, including our intellectual property. The borrowings under the Equipment Loan Facility are secured by liens on the equipment financed under that facility. Our loan agreements restrict, among other things, our ability to:
• | incur additional indebtedness other than in the normal course of business; |
• | create liens; |
• | make investments and acquisitions; |
• | sell assets; |
• | pay dividends or make distributions on and repurchase our stock; or |
• | consolidate or merge with other entities. |
In addition, certain of our loan agreements have a change in control provision that provides that, upon the occurrence of a change in control, all credit facility commitments shall terminate and all loans shall become due and payable. Furthermore, certain of our loan agreements require us to meet specified minimum financial measurements. The operating and financial restrictions and covenants in our loan agreements, as well as any future financing agreements that we may enter into, may restrict our ability to finance our operations, engage in business activities or expand or fully pursue our business strategies. Our ability to comply with these covenants may be affected by events beyond our control and we may not be able to meet those covenants. A breach of any of the covenants under one of our loan agreements could result in a default under some or all of our loan agreements, which could cause all of the outstanding indebtedness under our loan agreements to become immediately due and payable and terminate all commitments to extend further credit, if any.
We might require additional capital to support the growth of our business and this capital might not be available on reasonable terms or at all.
We intend to continue to make investments to support our business growth and may require additional funds to respond to business challenges, including the need to develop new services or enhance our existing services, enhance our operating infrastructure and acquire complementary businesses and technologies. Accordingly, we may need to engage in equity or debt financings to secure additional funds. If we raise additional funds through further issuances of equity or convertible debt securities, our existing stockholders could suffer significant dilution, and any new equity securities we issue could have rights, preferences and privileges superior to those of holders of our common stock. Any debt financing secured by us in the future could involve restrictive covenants relating to our capital raising activities and other financial and operational matters, which may make it more difficult for us to obtain additional capital and to pursue business opportunities, including potential acquisitions. In addition, we may not be able to obtain additional financing on terms favorable to us, if at all. If we are unable to obtain adequate financing or financing on terms satisfactory to us when we require it, our ability to continue to support our business growth and to respond to business challenges could be significantly limited.
Downgrades in our credit ratings may increase our future borrowing costs, limit our ability to raise capital, cause our stock price to decline or reduce analyst coverage, any of which could have a material adverse impact on our business.
Credit rating agencies review their ratings periodically and, therefore, the credit rating assigned to us by each of the rating agencies may be subject to revision at any time. Factors that can affect our credit ratings include changes in our operating performance, the economic environment, our financial position, conditions in and periods of disruption in any of our principal markets and changes in our business strategy. If weak financial market conditions or competitive dynamics cause any of these factors to deteriorate, we could see a reduction in our corporate credit rating. In the past, we experienced a downgrade in one of our corporate credit ratings. Since investors, analysts and financial institutions often rely on credit ratings to assess a company's creditworthiness and risk profile, make investment decisions and establish threshold requirements for investment guidelines, our ability to raise capital, our access to external financing, our ability to refinance our indebtedness, our stock price and analyst coverage of our stock could be negatively impacted by a further downgrade to our credit rating.
We may choose to pursue business combinations and acquisitions that may be difficult to integrate, disrupt our business, dilute stockholder value or divert management's attention.
We may support our growth through acquisitions of complementary businesses, services or technologies. Future acquisitions involve risks, such as:
• | challenges associated with integrating acquired technologies and operations of acquired companies; |
• | exposure to unforeseen liabilities; |
• | diversion of managerial resources from day-to-day operations; |
25
• | possible loss of key employees, customers and suppliers; |
• | misjudgment with respect to the value, return on investment or strategic fit of any acquired operations or assets; |
• | higher than expected transaction costs; and |
• | additional dilution to our existing stockholders if we use our common stock as consideration for acquisitions. |
As a result of these risks, we may not be able to achieve the expected benefits of any acquisition. If we are unsuccessful in completing or integrating acquisitions, we may be required to reevaluate our growth strategy.
Future business combinations could involve the acquisition of significant intangible assets. We may need to record write-downs from future impairments of identified intangible assets and goodwill. These accounting charges would reduce any future reported earnings or increase a reported loss. In addition, we could use substantial portions of our available cash to pay the purchase price for acquisitions. Subject to the provisions of our existing indebtedness, it is possible that we could incur additional debt or issue additional equity securities as consideration for these acquisitions, which could cause our stockholders to suffer significant dilution.
We make significant investments in new products and services that may not be profitable or align with our established company vision.
We intend to continue to make investments to support our business growth, including expenditures to develop new services or enhance our existing services, enhance our operating infrastructure, market and sell our product offerings and acquire complementary businesses and technologies. These endeavors may involve significant risks and uncertainties, including failures to align new initiatives, planning and execution with our established corporate vision and direction, which could lead to a misapplication of our resources. These new investments are inherently risky and may involve distracting management from current operations, create greater than expected liabilities and expenses, provide us with an inadequate return on capital, include other unidentified risks and, ultimately, may generally not be successful. Further, our ability to effectively integrate new services and investments into our business may affect our profitability. Significant delays in new releases or significant problems in creating new products or services could adversely affect our revenue and financial performance.
Our growth may strain our management, information systems and resources.
Our growth has placed, and may continue to place, a significant strain on our managerial, administrative, operational, financial and other resources. We intend to expand our overall business, customer base, headcount and operations both domestically and internationally. Growing a global organization and managing a geographically dispersed workforce will require substantial management effort and significant additional investment in our infrastructure. We will be required to continue to improve our information technology infrastructure, reporting systems and procedures, and operational and financial controls, as well as manage expanded operations in geographically distributed locations. Our expected additional growth will increase our costs, which will make it more difficult for us to offset any future revenue shortfalls by offsetting expense reductions in the short term. If we fail to manage our growth successfully we will be unable to execute our business plan successfully, which could have a negative impact on our business, financial condition and results of operations. In addition, if we fail to develop and implement appropriate operating practices, our performance may suffer in terms of quality, cost and cycle time.
Expansion of our business internationally will subject us to additional economic, financial and operational risks that could increase our costs and make it difficult for us to operate profitably.
One of our key growth strategies is to pursue international expansion. International revenue accounted for 41.3%, 42.8% and 40.7%, of our revenue in 2013, 2014 and 2015, respectively. In addition, a further portion of our revenue is associated with employees of United States customers using our services outside of the United States. The continued expansion of our international operations may require significant expenditure of financial and management resources and may result in increased administrative and compliance costs. In addition, international expansion will increasingly subject us to the risks inherent in conducting business internationally, including:
• | anti-corruption laws, such as the Foreign Corrupt Practices Act, the U.K. Bribery Act, the Brazil Anti-Corruption Law of 2014 (Law nº. 12,846/2013) and other local laws prohibiting corrupt payments to governmental officials and private actors, and antitrust and competition regulations, among others; |
• | localization of our services, including translation into foreign languages and adaptation for local practices and regulatory requirements; |
• | foreign currency exchange rate fluctuations; |
• | difficulty in enforcing contractual provisions in local jurisdictions; |
• | longer accounts receivable payment cycles and increased difficulty in collecting accounts receivable; |
26
• | the effect of applicable foreign tax structures, including tax rates that may be higher than tax rates in the United States or taxes that may be duplicative of those imposed in the United States; |
• | tariffs and trade barriers; |
• | difficulties in managing and staffing international operations; |
• | general economic and political conditions in each country, particularly in the European Union and Latin America, which continue to face significant economic challenges; |
• | inadequate intellectual property protection in foreign countries; |
• | increased insurance and employee costs associated with operating in foreign jurisdictions; |
• | dependence on certain third parties, including channel partners with whom we may not have extensive experience; |
• | the potential for political unrest, terrorism, hostilities or war; and |
• | the difficulties in and increased expenses resulting from complying with a variety of foreign laws, regulations and trade standards, including employment, labor, tax, data protection and privacy laws that may or may not be in conflict with United States law. |
We may have exposure to additional tax liabilities and any changes in the effective tax rate may materially harm our cash flows, financial condition and results of operation.
As an international business providing secure content collaboration services around the world, we are subject to income taxes and non-income based taxes in both the United States and various non-U.S. jurisdictions. Due to economic and political conditions, tax rates in various jurisdictions may be subject to significant change. Our future effective tax rate could be affected by changes in the mix of earnings in countries with differing statutory tax rates, changes in the valuation of deferred tax assets or changes in tax laws or their interpretation. If our effective tax rate were to increase, our cash flows, financial condition and results of operations would be adversely affected. Although we believe that our tax filing positions are reasonable, the final determination of tax audits or tax disputes may be different from what is reflected in our historical income tax provisions and accruals.
To date, we have been audited in the United States with no significant impact on our financial condition, results of operations or cash flows. If future audits in the United States or other jurisdictions were to result in findings that additional taxes are due, we may be subject to incremental tax liabilities, possibly including interest and penalties, which could have a material adverse effect on our cash flows, financial condition and results of operations. In addition, if we were the subject of a tax audit or other inquiry, we would likely incur professional fees, which could be significant and could have a material adverse effect on our business, results of operations and financial condition.
In general, many governments and tax authorities are increasing their scrutiny of multi-national companies, which has contributed to an increase in audit activity and aggressive stances taken by tax authorities. In our case, in early 2015, French tax authorities commenced an inspection, based on a court order, of our business and operations to determine whether we are in compliance with our French tax obligations. The order was subsequently appealed and a court date has been set for the second quarter of 2016. In the first quarter of 2016, we received notification of the commencement of an audit from the French tax authorities. It is our understanding that several multi-national technology companies have been involved in tax related audits or other inquiries in France. While we believe that we comply with French tax law, French tax authorities may determine that we owe additional taxes and may also assess penalties and interest against us. We intend to contest any assessment of this nature, if material. In general, governments in the United States and Europe are increasingly focused on ways to increase tax revenues, which has contributed to an increase in audit activity and harsher stances taken by tax authorities. Any additional taxes or other assessments that we may be required to pay could be in excess of our current tax provisions or may require us to modify our business practices in order to reduce our exposure to additional taxes going forward, any of which could have a material adverse effect on our business, results of operations and financial condition.
Because we recognize revenue for our services ratably over the term of our customer agreements, downturns or upturns in the value of signed contracts will not be fully and immediately reflected in our operating results.
We offer our services primarily through fixed commitment contracts and recognize revenue ratably over the related service period, which typically ranges from six to twelve months. As a result, some portion of the revenue we report in each quarter is revenue from contracts entered into during prior quarters. Consequently, a decline in signed contracts in any quarter will not be fully and immediately reflected in the revenue for that quarter, but will instead negatively affect our revenue in future quarters. In addition, we may be unable to adjust our cost structure to offset this reduced revenue. Similarly, revenue attributable to an increase in contracts signed in a particular quarter will not be fully and immediately recognized, as revenue from new or renewed contracts is recognized ratably over the applicable service period. Because we incur sales commissions at the time of sale, we may not recognize revenues from some customers despite incurring considerable expense related to our sales processes. Timing differences of this nature could cause our margins and profitability to fluctuate significantly from quarter to quarter.
27
Our offerings of new services or products may be subject to complex revenue recognition standards, which could materially affect our financial results.
As we introduce new services or products, revenue recognition could become increasingly complex and require additional analysis and judgment. Additionally, we may negotiate and revise terms and conditions of our contracts with customers and channel partners, which may also cause us to revise our revenue recognition policies. As our arrangements with customers evolve, we may be required to defer a greater portion of revenue into future periods, which could materially and adversely affect our financial results.
Changes in financial accounting standards or practices may cause adverse, unexpected financial reporting fluctuations and affect our reported financial results.
A change in accounting standards or practices can have a significant effect on our reported results and may even affect our reporting of transactions completed before the change is effective. New accounting pronouncements and varying interpretations of existing accounting pronouncements have occurred and will occur in the future. Changes to existing rules or the questioning of current practices may adversely affect our reported financial results or the way in which we conduct our business.
If we fail to maintain an effective system of disclosure controls and internal control over financial reporting, our ability to produce timely and accurate financial statements or comply with applicable regulations could be impaired.
As a public company, we are subject to the reporting requirements of the Securities Exchange, the Sarbanes-Oxley Act and the listing standards of the New York Stock Exchange, or the NYSE, the exchange on which our common stock is listed (NYSE: IL). We expect that the requirements of these rules and regulations will continue to increase our legal, accounting and financial compliance costs, make some activities more difficult, time consuming and costly and place significant strain on our personnel, systems and resources.
The Sarbanes-Oxley Act requires, among other things, that we maintain effective disclosure controls and procedures and internal control over financial reporting. We are continuing to refine our disclosure controls and other procedures that are designed to ensure that the information that we are required to disclose in the reports that we will file with the SEC is properly recorded, processed, summarized and reported within the time periods specified in SEC rules and forms. We are also continuing to improve our internal control over financial reporting. We have expended, and anticipate that we will continue to expend, significant resources in order to maintain and improve the effectiveness of our disclosure controls and procedures and internal control over financial reporting.
Our current controls and any new controls that we develop in the future may become inadequate because of changes in conditions in our business. Further, weaknesses in our disclosure controls or our internal control over financial reporting may be discovered in the future. Any failure to develop or maintain effective controls, or any difficulties encountered in their implementation or improvement, could harm our operating results or cause us to fail to meet our reporting obligations and may result in a restatement of our financial statements for prior periods. Any failure to implement and maintain effective internal control over financial reporting could also adversely affect the results of management reports and independent registered public accounting firm audits of our internal control over financial reporting that we will be required to include in our periodic reports that will be filed with the SEC. If we were to have ineffective disclosure controls and procedures or internal control over financial reporting, our investors could lose confidence in our reported financial and other information, which would likely have a negative effect on the market price of our common stock.
We rely on third-party software and hardware to support our system and services and our business and reputation could suffer if these third-party services fail to perform properly or are no longer available to us.
We rely on hardware purchased or leased and software licensed from third parties to offer our service. This hardware and software may not continue to be available on commercially reasonable terms or at all. Any loss of the right to use any of this hardware or software could result in delays in the provisioning of our services, which could negatively affect our business until equivalent technology is either developed by us or, if available, is identified, obtained and integrated. In addition, it is possible that our hardware vendors or the licensors of third party software could increase the prices they charge, which could have a material adverse impact on our results of operations. Further, changing hardware vendors or software licensors could detract from management's ability to focus on the ongoing operations of our business or could cause delays in the operations of our business.
Additionally, third-party software underlying our services can contain undetected errors or bugs. We may be forced to delay commercial release of our services until any discovered problems are corrected and, in some cases, may need to implement enhancements or modifications to correct errors that we do not detect until after deployment of our services. In addition, problems with the third party software underlying our services could result in:
• | damage to our reputation; |
• | loss of or delayed revenue; |
• | loss of customers; |
28
• | warranty claims or litigation; |
• | loss of or delayed market acceptance of our services; and |
• | unexpected expenses and diversion of resources to remedy errors. |
Our use of "open source" software could negatively affect our ability to sell our services and subject us to possible litigation.
A portion of the technologies licensed by us incorporates "open source" software, and we may incorporate open source software in the future. Open source software is generally licensed by its authors or other third parties under open source licenses. If we fail to comply with these licenses, we may be subject to certain conditions, including requirements that we offer any of our services that incorporate the open source software at no cost. Additionally, we may be required to make publicly available any source code for modifications or derivative works we create based upon, incorporating or using the open source software and/or license those modifications or alterations on terms that are unfavorable to us. If an author or other third party that distributes open source software were to allege that we had not complied with the conditions of one or more of these licenses, we could be required to incur significant legal expenses defending against such allegations and could be subject to significant damages, enjoined from selling those of our services that contained the open source software and required to comply with the foregoing conditions, which could disrupt the distribution and sale of some of our services.
In addition to risks related to license requirements, usage of open source software can lead to greater risks than use of third-party commercial software, as open source licensors generally do not provide technology support, maintenance, warranties or assurance of title or controls on the origin of the software.
If we are unable to protect our proprietary technology and other rights, the value of our business and our competitive position may be impaired.
If we are unable to protect our intellectual property, our competitors could use our intellectual property to market products and services similar to ours, which could decrease demand for our services. We rely on a combination of copyright, patent, trademark and trade secret laws, as well as third-party nondisclosure agreements and other contractual provisions and technical measures, to protect our intellectual property rights. These protections may not be adequate to prevent our competitors from copying or reverse-engineering our technology and services to create similar offerings. Additionally, any of our pending or future patent applications may not be issued with the scope of protection we seek, if at all. The scope of patent protection, if any, we may obtain from our patent applications is difficult to predict and our patents may be found invalid, unenforceable or of insufficient scope to prevent competitors from offering similar services. Our competitors may independently develop technologies that are substantially equivalent or superior to our technology. To protect our trade secrets and other proprietary information, we require employees, consultants, advisors, subcontractors and collaborators to enter into confidentiality agreements and maintain policies and procedures to limit access to our trade secrets and proprietary information. These agreements and the other actions we take may not provide meaningful protection for our trade secrets, know-how or other proprietary information from unauthorized use, misappropriation or disclosure. Further, existing copyright and patent laws may not provide adequate or meaningful protection in the event competitors independently develop technology, products or services similar to ours. Even if the laws governing intellectual property rights provide protection, we may have insufficient resources to take the legal actions necessary to protect our interests. In addition, our intellectual property rights and interests may not be afforded the same protection under the laws of foreign countries as they are under the laws of the United States.
Our ability to use our net operating loss carryforwards and other tax attributes may be limited or disallowed by the Internal Revenue Service.
As of December 31, 2015, we had net operating loss carryforwards of $38.5 million, including $16.9 million of windfall tax benefits attributable to equity compensation, to offset future taxable income, which expire in various years beginning in 2022 through 2033, if not utilized. If we were not to generate sufficient future taxable income, this would adversely affect our ability to utilize these net operating loss carryforwards. In addition, under the Internal Revenue Code, substantial changes in our ownership could limit the amount of net operating loss carryforwards that can be utilized annually in the future to offset taxable income. Sections 382 and 383 of the Internal Revenue Code impose limitations on a company's ability to use net operating loss carryforwards and other tax attributes if a company experiences a more-than-50-percent ownership change over a three-year period. We believe that, as a result of our initial and follow-on public offerings, or as a result of prior or future issuances of our capital stock, it is possible that such a change in our ownership could occur in the future. If such a change in our ownership occurs, our ability to use our net operating loss carryforwards in any future periods may be limited on an annual basis.
We incur increased costs and demands upon management as a result of complying with the laws and regulations affecting public companies, which could harm our operating results.
Since our initial public offering, we have incurred and will continue to incur as a public company significant additional legal, accounting and other costs to which we were not subject to as a private company, including expenses related to our efforts in complying with Sarbanes-Oxley, and other public company disclosure and corporate governance requirements, responding to
29
requests of government regulators and defending the class action and stockholder derivative lawsuits that were filed against us. Our management and other personnel will continue to need to devote a substantial amount of time to these compliance initiatives. We expect that these rules, regulations and proceedings may make it more difficult and more expensive for us to obtain director and officer liability insurance and we may be required to accept reduced policy limits and coverage or incur substantially higher costs to obtain the same or similar coverage previously available. As a result, it may be more difficult for us to attract and retain qualified individuals to serve on our board of directors or as our executive officers.
If we are required to collect sales and use taxes on the services we sell in additional jurisdictions, we may be subject to liability for past sales and our future sales could decrease.
We currently collect sales or use tax on our services in fourteen states. Historically, with a few exceptions, we have not charged or collected value added tax on our services anywhere in the world. We may lose sales or incur significant expenses should tax authorities in other jurisdictions where we do business be successful in imposing sales and use taxes, value added taxes or similar taxes on the services we provide. A successful assertion by one or more tax authorities that we should collect sales or other taxes on the sale of our services could result in substantial tax liabilities for past sales, including interest and penalty charges, and could discourage customers from purchasing our services and otherwise harm our business. Further, we may conclude based on our own review that our services may be subject to sales and use taxes in other areas where we do business. Under these circumstances, we may voluntarily disclose our estimated liability to the respective tax authorities and initiate activities to collect taxes going forward.
It is not clear that our services are subject to sales and use tax in certain jurisdictions. States and certain municipalities in the United States, as well as countries outside the United States, have different rules and regulations governing sales and use taxes. These rules and regulations are subject to varying interpretations that may change over time and, in the future, our services may be subject to such taxes. Although our customer contracts typically provide that our customers are responsible for the payment of all taxes associated with the provision and use of our services, customers may decline to pay back taxes and may refuse responsibility for interest or penalties associated with those taxes. In certain cases, we may elect not to request customers to pay back taxes. If we are required to collect and pay back taxes and associated interest and penalties, and if our customers fail or refuse to reimburse us for all or a portion of these amounts, or if we elect not to seek payment of these amounts, we will incur unplanned expenses that may be substantial. Moreover, imposition of such taxes on our services going forward will effectively increase the cost of our services to our customers, and may adversely affect our ability to retain existing customers or gain new customers in jurisdictions in which such taxes are imposed. Any of the foregoing could have a material adverse effect on our business, results of operation or financial condition.
Changes in valuation allowance of deferred tax assets may affect our future operating results.
We record a valuation allowance to reduce our net deferred tax assets to the amount that we believe is more-likely-than-not realizable. In assessing the need for a valuation allowance, we consider historical levels of income, expectations and risks associated with estimates of future taxable income and ongoing prudent, feasible and practical tax planning strategies. On a regular basis we evaluate our deferred tax asset balance for realizability. To the extent we believe it is more-likely-than-not that some portion of our deferred tax assets will not be realized, we increase the valuation allowance against the deferred tax assets. If our assumptions and consequently our estimates change in the future, the valuation allowance may be increased or decreased, resulting in a respective increase or decrease in income tax expense. As of December 31, 2015, we assessed that it is more-likely-than-not that we will not realize a portion of our U.S. deferred tax assets based on the absence of sufficient positive objective evidence that we would generate sufficient future taxable income to realize that portion of deferred tax assets being valued. Accordingly and as more fully described in Note 8 - "Income Tax" included in Part II, Item 8. Financial Statements and Supplementary Data of this Annual Report on Form 10-K, as of December 31, 2015, we continued to maintain a valuation allowance on our U.S. deferred tax assets.
Our success depends on our customers' continued high-speed access to the internet and the continued reliability of the internet infrastructure.
Our future sales growth depends on our customers having high-speed access to the internet, as well as the continued maintenance and development of the internet infrastructure. The future delivery of our services will depend on third-party internet service providers to expand high-speed internet access, maintain a reliable network with the necessary speed, data capacity and security, and develop complementary products and services, including high-speed modems, for providing reliable and timely internet access and services. The success of our business depends directly on the continued accessibility, maintenance and improvement of the internet as a convenient means of customer interaction, as well as an efficient medium for the delivery and distribution of information among businesses and by businesses to their employees. All of these factors are out of our control. If for any reason the internet does not remain a widespread communications medium and commercial platform, the demand for our services would be significantly reduced, which would harm our business, results of operations and financial condition.
To the extent that the internet continues to experience increased numbers of users, frequency of use or bandwidth requirements, the internet may become congested and be unable to support the demands placed on it, and its performance or reliability may decline. Any future internet outages or delays could adversely affect our ability to provide services to our customers, which could
30
adversely affect our business.
Catastrophic events may disrupt our business.
A natural disaster, telecommunications failure, power outage, cyber-attack, war, terrorist attack, or other catastrophic event could cause us to suffer system interruptions, reputational harm, delays in product development, breaches of data security and loss of critical data. An event of this nature could also prevent us from fulfilling customer orders or maintaining certain service level requirements, particularly in respect of our SaaS and hosted offerings. While we have developed certain disaster recovery plans and maintain backup systems to reduce the potentially adverse effect of these types of events, a catastrophic event that results in the destruction or disruption of any of our data centers or our critical business or information technology systems could severely affect our ability to conduct normal business operations and, as a result, our business, operating results and financial condition could be adversely affected.
Risks Related to Our Common Stock
Our stock price may fluctuate significantly and could subject us to litigation.
The stock market, particularly in recent years, has experienced significant volatility, particularly with respect to technology stocks. The volatility of technology stocks often does not relate to the operating performance of the companies themselves. Factors that could cause volatility in the market price of our common stock include:
• | variations in our operating results, earnings per share, cash flows from operating activities, deferred revenue and other financial metrics and non-financial metrics, and how those results compare to analyst expectations; |
• | market conditions affecting our customers' businesses, including the level of activity in the M&A and syndicated loan markets; |
• | the loss of any major customers or the acquisition of new customers for our services; |
• | announcements of new services or functions by us or our competitors; |
• | developments concerning intellectual property rights; |
• | comments by securities analysts, including the publication of their estimates of our operating results; |
• | actual and anticipated fluctuations in our quarterly operating results, including fluctuations resulting from changes in foreign exchange rates; |
• | rumors relating to us or our competitors; |
• | disruptions in our service due to computer hardware, software and network or data center problems; |
• | developments relating to lawsuits and investigations involving us; |
• | actions of stockholders, including sales of shares by our directors and executive officers; |
• | trading activity by a limited number of stockholders who together beneficially own a significant portion of our outstanding common stock; |
• | additions or departures of key personnel; and |
• | developments concerning current or future strategic alliances or acquisitions. |
These and other factors may cause the market price and demand for our common stock to fluctuate substantially, which may limit or prevent investors from readily selling their shares of common stock and may otherwise negatively affect the liquidity of our common stock. In addition, if the market for technology stocks or the stock market in general experiences uneven investor confidence, the market price of our common stock could decline for reasons unrelated to our business, operating results or financial condition. These and other factors causing volatility in the market price of our stock could subject us to securities class action litigation. We are currently, and may in the future be, the subject of class action and stockholder derivative lawsuits that could require us to incur substantial costs defending such lawsuits and divert the time and attention of our management.
Our principal stockholders could exercise significant control over our company.
As of February 29, 2016, our two largest stockholders beneficially owned, in the aggregate, shares representing 26.7% of our outstanding capital stock. Although we are not aware of any voting arrangements in place among these stockholders, if these stockholders were to choose to act together, as a result of their stock ownership, they would likely be able to influence our management and affairs. This concentration of ownership may have the effect of delaying or preventing a change in control of our company and might affect the market price of our common stock.
31
Future sales of shares by existing stockholders could cause our stock price to decline.
If our existing stockholders sell, or indicate an intent to sell, substantial amounts of our common stock in the public market, the trading price of our common stock could decline significantly. As of December 31, 2015, we had 58,434,464 shares of common stock outstanding. A relatively small number of our shareholders own large blocks of shares. We cannot predict the effect, if any, that public sales of these shares will have on the market price of our common stock.
In addition, shares subject to outstanding options under our equity incentive plans and shares reserved for future issuance under our equity incentive plans will become eligible for sale in the public market in the future, subject to certain legal and contractual limitations. Moreover, as of February 29, 2016, entities affiliated with TA Associates, L.P. and Rho Capital Partners, Inc. held 15,649,337 shares of our common stock and have the right to require us to register these shares under the Securities Act of 1933, as amended, pursuant to a registration rights agreement. If our existing stockholders sell substantial amounts of our common stock in the public market, or if the public perceives that these types of sales could occur, this could have an adverse impact on the market price of our common stock, even if there is no relationship between these types of sales and the performance of our business.
Provisions of Delaware law, our charter documents and our loan agreements could delay or prevent an acquisition of our company, even if the acquisition would be beneficial to our stockholders, and could make it more difficult for stockholders to change management.
Provisions of Delaware law, our amended and restated certificate of incorporation and amended and restated by-laws and our loan agreements may discourage, delay or prevent a merger, acquisition or other change in control that stockholders may consider favorable, including transactions in which stockholders might otherwise receive a premium for their shares. These provisions may also prevent or delay attempts by stockholders to replace or remove our current management or members of our board of directors. These provisions include:
• | a classified board of directors; |
• | limitations on the removal of directors; |
• | advance notice requirements for stockholder proposals and nominations; |
• | the inability of stockholders to act by written consent or to call special meetings; |
• | the ability of our board of directors to make, alter or repeal our amended and restated by-laws; |
• | the authority of our board of directors to issue preferred stock with such terms as our board of directors may determine; |
• | a forum selection bylaw that establishes the Court of Chancery in the State of Delaware as the sole and exclusive forum for certain legal claims and actions, including (i) derivative actions, (ii) actions asserting a breach of fiduciary duty owed by our directors, officers or other employees, (iii) actions based on the Delaware General Corporation Law, our certificate of incorporation or by-laws, or (iv) actions asserting a claim governed by the internal affairs doctrine, unless we consent in writing to the selection of an alternative forum; and |
• | provisions in our loan agreements that may accelerate payment of our debt in a change in control. |
The affirmative vote of the holders of at least 75% of our shares of capital stock entitled to vote, and not less than 75% of the outstanding shares of each class entitled to vote thereon as a class, is generally necessary to amend or repeal the above provisions that are contained in our amended and restated certificate of incorporation. Also, absent approval of our board of directors, our amended and restated by-laws may only be amended or repealed by the affirmative vote of the holders of at least 75% of our shares of capital stock entitled to vote.
In addition, we are subject to the provisions of Section 203 of the Delaware General Corporation Law, which limits business combination transactions with stockholders of 15% or more of our outstanding voting stock that our board of directors has not approved. These provisions and other similar provisions make it more difficult for stockholders or potential acquirers to acquire us without negotiation. These provisions may apply even if some stockholders may consider the transaction beneficial to them.
As a result, these provisions could limit the price that investors are willing to pay in the future for shares of our common stock. These provisions might also discourage a potential acquisition proposal or tender offer, even if the acquisition proposal or tender offer is at a premium over the then current market price for our common stock.
We have never paid dividends on our capital stock and we do not anticipate paying any dividends in the foreseeable future. Consequently, any gains from an investment in our common stock will likely depend on whether the price of our common stock increases.
We have not paid dividends on any of our classes of capital stock to date and we currently intend to retain our future earnings, if any, to fund the development and growth of our business. In addition, the terms of our outstanding indebtedness restrict our ability
32
to pay dividends, and any future indebtedness that we may incur could preclude us from paying dividends. As a result, capital appreciation, if any, of our common stock will be your sole source of gain for the foreseeable future. Consequently, in the foreseeable future, you will likely only experience a gain from your investment in our common stock if the price of our common stock increases.
If equity research analysts do not publish research or reports about our business or if they issue unfavorable commentary or downgrade our common stock, the price of our common stock could decline.
The trading market for our common stock relies in part on the research and reports that equity research analysts publish about us and our business. We do not control these analysts. We have been, and may in the future be, the subject of unfavorable commentary or termination of coverage by equity analysts. The price of our common stock could decline as a result of any such negative commentary or termination of coverage.
ITEM 1B. UNRESOLVED STAFF COMMENTS
None.
ITEM 2. PROPERTIES
Our principal executive office located at 150 East 42nd Street, New York, New York occupies 43,304 square feet which is subject to a lease agreement that expires in July 2021. In addition, we have a facility in Waltham, Massachusetts that occupies 51,325 square feet under a lease that expires in October 2024. Our New York and Waltham facilities house members of our development, sales, marketing, human resources, services, finance and legal departments.
We also maintain leased space in a number of cities in the United States and around the globe for our sales, services and development activities. We believe that our facilities are adequate for our current needs. However, we may obtain additional office space to house additional services personnel in the near future, and we may require other additional office space as our business grows.
ITEM 3. LEGAL PROCEEDINGS
For a discussion of our material pending legal proceedings, see Note 15 - “Commitments and Contingencies” included in Part II, Item 8. Financial Statements and Supplementary Data of this Annual Report on Form 10-K.
ITEM 4. MINE SAFETY DISCLOSURES
Not applicable.
33
PART II
ITEM 5. MARKET FOR REGISTRANT'S COMMON EQUITY, RELATED STOCKHOLDER MATTERS AND ISSUER PURCHASES OF EQUITY SECURITIES
Our common stock is listed on the New York Stock Exchange, or NYSE, under the symbol "IL". The following table sets forth for the indicated periods the high and low sales prices per share of our common stock as reported on the NYSE.
High | Low | |||||||
Fiscal year ended December 31, 2015: | ||||||||
First quarter | $ | 12.24 | $ | 10.05 | ||||
Second quarter | $ | 12.69 | $ | 9.23 | ||||
Third quarter | $ | 12.00 | $ | 8.26 | ||||
Fourth quarter | $ | 10.25 | $ | 8.27 | ||||
Fiscal year ended December 31, 2014: | ||||||||
First quarter | $ | 12.00 | $ | 9.72 | ||||
Second quarter | $ | 10.63 | $ | 7.91 | ||||
Third quarter | $ | 9.47 | $ | 7.82 | ||||
Fourth quarter | $ | 11.90 | $ | 7.91 | ||||
Holders of Record
On February 29, 2016, the closing price of our common stock on the NYSE was $7.77 and there were approximately 20 holders of record of our common stock. Because the substantial majority of the outstanding shares of our common stock are held by brokers and other institutions on behalf of shareholders, we are not able to estimate the total number of beneficial shareholders represented by these record holders.
Dividend Policy
We have never declared or paid dividends on our capital stock and we do not anticipate paying any dividends on our capital stock in the foreseeable future. We currently intend to retain all available funds and any future earnings to fund the development and growth of our business. Any future determination to declare dividends will be subject to the discretion of our board of directors and will depend on various factors, including applicable laws, our results of operations, financial condition, future prospects and any other factors deemed relevant by our board of directors. In addition, the terms of our outstanding indebtedness restrict our ability to pay dividends, and any future indebtedness that we may incur could preclude us from paying dividends.
Stock Performance Graph
This performance graph shall not be deemed "soliciting material" or to be "filed" with the SEC for purposes of Section 18 of the Securities Exchange Act of 1934, as amended, or the Exchange Act, or otherwise subject to the liabilities under that Section, and shall not be deemed to be incorporated by reference into any of our filings under the Securities Act of 1933, as amended, or the Exchange Act.
The graph below compares the cumulative total stockholder return on our common stock with the cumulative total return on the NASDAQ Composite index and the NASDAQ Computer and Data Processing index for the period beginning December 31, 2010 through December 31, 2015, assuming an initial investment of $100.
34
The comparisons in the graph below are based upon historical data and are not indicative of, nor intended to forecast, future performance of our common stock.
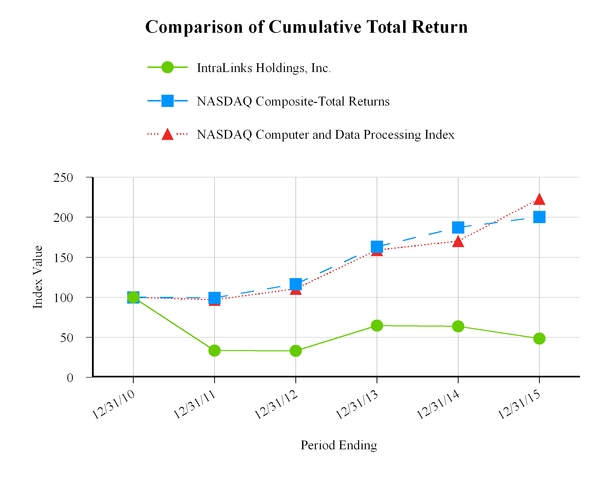
Equity Compensation Plan Information
For information concerning securities authorized for issuance under our equity compensation plans, see Item 12 - "Security Ownership of Certain Beneficial Owners and Management and Related Stockholder Matters" of this Form 10-K.
Unregistered Sales of Equity Securities
None.
Purchases of Equity Securities by the Issuer and Affiliated Purchasers
None.
35
ITEM 6. SELECTED FINANCIAL DATA
The following selected consolidated financial data should be read in conjunction with Item 7. Management's Discussion and Analysis of Financial Condition and Results of Operations and our Consolidated Financial Statements and related notes included in Item 8. Financial Statements and Supplementary Data of this Annual Report on Form 10-K. The consolidated statements of operations data for each of the three years in the period ended December 31, 2015 and the consolidated balance sheet data at December 31, 2015 and 2014 are derived from our audited Consolidated Financial Statements included in Item 8. Financial Statements and Supplementary Data of this Annual Report on Form 10-K. The consolidated statement of operations data for the years ended December 31, 2012 and 2011 and the consolidated balance sheet data at December 31, 2013, 2012, and 2011 have been derived from our audited Consolidated Financial Statements not included in this Form 10-K. Our historical results are not necessarily indicative of the results to be expected for future periods.
Years Ended December 31, | ||||||||||||||||||||
2015 | 2014 | 2013 | 2012 | 2011 | ||||||||||||||||
(In thousands, except share and per share data) | ||||||||||||||||||||
Consolidated Statements of Operations: | ||||||||||||||||||||
Revenue | $ | 276,153 | $ | 255,821 | $ | 234,496 | $ | 216,667 | $ | 213,504 | ||||||||||
Cost of revenue | 75,966 | 69,348 | 64,885 | 62,354 | 56,385 | |||||||||||||||
Gross profit | 200,187 | 186,473 | 169,611 | 154,313 | 157,119 | |||||||||||||||
Operating expenses: | ||||||||||||||||||||
Sales and marketing | 124,006 | 115,867 | 108,428 | 96,198 | 88,872 | |||||||||||||||
General and administrative | 73,589 | 69,911 | 57,063 | 50,608 | 40,808 | |||||||||||||||
Product development | 25,790 | 22,429 | 20,014 | 21,092 | 18,579 | |||||||||||||||
Impairment of capitalized software | — | — | — | 8,715 | — | |||||||||||||||
Total operating expenses | 223,385 | 208,207 | 185,505 | 176,613 | 148,259 | |||||||||||||||
(Loss) income from operations | (23,198 | ) | (21,734 | ) | (15,894 | ) | (22,300 | ) | 8,860 | |||||||||||
Interest expense | 4,435 | 4,202 | 4,136 | 6,435 | 10,645 | |||||||||||||||
Amortization of debt issuance costs | 571 | 579 | 358 | 740 | 1,369 | |||||||||||||||
Other expense (income), net | 1,335 | 1,746 | 239 | (1,870 | ) | (3,123 | ) | |||||||||||||
Net loss before income tax | (29,539 | ) | (28,261 | ) | (20,627 | ) | (27,605 | ) | (31 | ) | ||||||||||
Income tax expense (benefit) | 845 | (1,765 | ) | (5,349 | ) | (10,225 | ) | 1,212 | ||||||||||||
Net loss | $ | (30,384 | ) | $ | (26,496 | ) | $ | (15,278 | ) | $ | (17,380 | ) | $ | (1,243 | ) | |||||
Net loss per common share | ||||||||||||||||||||
Basic | $ | (0.53 | ) | $ | (0.47 | ) | $ | (0.28 | ) | $ | (0.32 | ) | $ | (0.02 | ) | |||||
Diluted | $ | (0.53 | ) | $ | (0.47 | ) | $ | (0.28 | ) | $ | (0.32 | ) | $ | (0.02 | ) | |||||
Weighted average number of shares | ||||||||||||||||||||
Basic | 57,172,659 | 55,932,641 | 55,135,657 | 54,352,536 | 53,381,655 | |||||||||||||||
Diluted | 57,172,659 | 55,932,641 | 55,135,657 | 54,352,536 | 53,381,655 | |||||||||||||||
36
December 31, | ||||||||||||||||||||
2015 | 2014 | 2013 | 2012 | 2011 | ||||||||||||||||
Consolidated Balance Sheet Data: | (In thousands) | |||||||||||||||||||
Cash and cash equivalents | $ | 47,875 | $ | 40,682 | $ | 50,540 | $ | 43,798 | $ | 46,694 | ||||||||||
Investments (1) | $ | 12,425 | $ | 24,455 | $ | 34,886 | $ | 31,549 | $ | 36,120 | ||||||||||
Working capital (2) | $ | 28,870 | $ | 22,376 | $ | 54,223 | $ | 55,486 | $ | 65,425 | ||||||||||
Total assets (2) | $ | 461,713 | $ | 471,860 | $ | 483,814 | $ | 482,285 | $ | 517,630 | ||||||||||
Long-term debt, net of current portion | $ | 80,501 | $ | 77,933 | $ | 75,004 | $ | 75,238 | $ | 91,164 | ||||||||||
Accumulated deficit | $ | (169,594 | ) | $ | (139,210 | ) | $ | (112,714 | ) | $ | (97,436 | ) | $ | (80,056 | ) | |||||
Total stockholders' equity | $ | 282,151 | $ | 300,939 | $ | 316,101 | $ | 322,052 | $ | 331,830 | ||||||||||
(1) At December 31, 2014, $11.8 million is included in current assets and $12.6 million is included in non-current assets.
(2) Includes reclassifications of deferred tax assets and liabilities related to ASU 2015-17, Balance Sheet Classification of Deferred Taxes. See Note 2 - "Summary of Significant Accounting Policies" included in Item 8. Financial Statements and Supplementary Data of this Annual Report on Form 10-K.
ITEM 7. MANAGEMENT’S DISCUSSION AND ANALYSIS OF FINANCIAL CONDITION AND RESULTS OF OPERATIONS
Management’s Discussion and Analysis of Financial Condition and Results of Operations, or MD&A, is intended to provide a reader of our financial statements with a narrative from the perspective of our management on our financial condition, results of operations, liquidity and certain other factors that may affect our future results. The following discussion and analysis should be read in conjunction with our Consolidated Financial Statements and the related notes included in Item 8 - "Financial Statements and Supplementary Data" of this Form 10-K.
Executive Overview
Intralinks is a leading global technology provider of Software-as-a-Service, or SaaS, solutions for secure enterprise content collaboration within and among organizations. Our cloud-based solutions enable organizations to securely manage, control, track, search, exchange and collaborate on sensitive information inside and outside the firewall, all within an easy-to-use environment.
Key Metrics
We monitored the following key metrics to help us measure our performance, identify trends affecting our business, establish budgets, assess operational efficiencies and make strategic decisions.
Year Ended December 31, | ||||||||||||
2015 | 2014 | 2013 | ||||||||||
Key Metrics | (In thousands) | |||||||||||
Revenue | $ | 276,153 | $ | 255,821 | $ | 234,496 | ||||||
Non-GAAP adjusted gross profit | $ | 209,009 | $ | 195,202 | $ | 178,439 | ||||||
Non-GAAP adjusted gross margin | 75.7 | % | 76.3 | % | 76.1 | % | ||||||
Non-GAAP adjusted operating income | $ | 12,311 | $ | 12,441 | $ | 16,036 | ||||||
Non-GAAP adjusted net income | $ | 3,701 | $ | 3,667 | $ | 7,008 | ||||||
Non-GAAP adjusted EBITDA | $ | 39,060 | $ | 38,068 | $ | 36,900 | ||||||
Non-GAAP adjusted EBITDA margin | 14.1 | % | 14.9 | % | 15.7 | % | ||||||
Net cash provided by operating activities | $ | 30,702 | $ | 25,773 | $ | 42,009 | ||||||
Free cash flow | $ | (7,441 | ) | $ | (11,126 | ) | $ | 14,538 | ||||
December 31, | ||||||||||||
2015 | 2014 | 2013 | ||||||||||
Enterprise 12-month backlog growth | 15.6 | % | 11.5 | % | (0.3 | )% | ||||||
37
Enterprise backlog comprises contractual commitments and deferred revenue related to our Enterprise principal market. Enterprise 12-month backlog growth represents the increase in committed future revenue to be derived from our Enterprise principal market over the next twelve months as compared to the amount of that backlog as of the same date in the prior year.
Non-GAAP Financial Measures
This Form 10-K includes information about certain financial measures that are not prepared in accordance with generally accepted accounting principles in the United States, or GAAP or U.S. GAAP. These non-GAAP financial measures are not based on any standardized methodology prescribed by GAAP and are not necessarily comparable to similar measures presented by other companies.
Management defines its non-GAAP financial measures as follows:
• | Non-GAAP adjusted gross profit represents the corresponding GAAP measure adjusted to exclude, if applicable: (1) amortization of intangible assets and (2) stock-based compensation expense. |
• | Non-GAAP adjusted operating income represents the corresponding GAAP measure adjusted to exclude, if applicable: (1) amortization of intangible assets, (2) stock-based compensation expense and (3) impairment charges or asset write-offs. |
• | Non-GAAP adjusted net income represents the corresponding GAAP measure adjusted to exclude, if applicable: (1) amortization of intangible assets, (2) stock-based compensation expense and (3) impairment charges or asset write-offs. The income tax expense included in non-GAAP adjusted net income is calculated using an estimated long-term effective tax rate. |
• | Non-GAAP adjusted EBITDA represents net loss adjusted to exclude, if applicable: (1) depreciation and amortization, (2) amortization of intangible assets, (3) stock-based compensation expense, (4) impairment charges or asset write-offs, (5) interest expense, (6) amortization of debt issuance costs, (7) other expense (income), net, and (8) income tax (benefit) expense. |
• | Free cash flow represents net cash provided by operating activities less capitalized software development costs and capital expenditures. |
Management believes that these non-GAAP financial measures, when viewed with our results under U.S. GAAP and the accompanying reconciliations, provide useful information about our period-over-period growth and provide additional information that is useful for evaluating our operating performance. In addition, free cash flow provides management with useful information for managing the cash needs of our business. Management also believes that these non-GAAP financial measures provide a more meaningful comparison of our operating results against those of other companies in our industry, as well as on a period-over-period basis, because these measures exclude items that are not representative of our operating performance, such as amortization of intangible assets, stock-based compensation expense and interest expense. Management believes that including these costs in our results of operations results in a lack of comparability between our operating results and those of our peers in the industry. However, these non-GAAP measures should be considered in addition to results prepared in accordance with U.S. GAAP and, accordingly, should not be considered as substitutes for or superior to U.S. GAAP results.
38
The table below provides reconciliations of U.S. GAAP financial measures to the non-GAAP financial measures discussed above:
Years Ended December 31, | ||||||||||||
2015 | 2014 | 2013 | ||||||||||
(In thousands) | ||||||||||||
Gross profit | $ | 200,187 | $ | 186,473 | $ | 169,611 | ||||||
Gross margin | 72.5 | % | 72.9 | % | 72.3 | % | ||||||
Cost of revenue – amortization of intangible assets | 8,331 | 8,206 | 8,136 | |||||||||
Cost of revenue – stock-based compensation | 491 | 523 | 692 | |||||||||
Non-GAAP adjusted gross profit | $ | 209,009 | $ | 195,202 | $ | 178,439 | ||||||
Non-GAAP adjusted gross margin | 75.7 | % | 76.3 | % | 76.1 | % | ||||||
Loss from operations | $ | (23,198 | ) | $ | (21,734 | ) | $ | (15,894 | ) | |||
Amortization of intangible assets | 23,949 | 23,791 | 23,644 | |||||||||
Stock-based compensation expense | 11,560 | 10,384 | 8,286 | |||||||||
Non-GAAP adjusted operating income | $ | 12,311 | $ | 12,441 | $ | 16,036 | ||||||
Net (loss) before income tax | $ | (29,539 | ) | $ | (28,261 | ) | $ | (20,627 | ) | |||
Stock-based compensation expense | 23,949 | 23,791 | 23,644 | |||||||||
Amortization of intangible assets | 11,560 | 10,384 | 8,286 | |||||||||
Non-GAAP adjusted net income before tax | 5,970 | 5,914 | 11,303 | |||||||||
Non-GAAP income tax expense | 2,269 | 2,247 | 4,295 | |||||||||
Non-GAAP adjusted Net income | $ | 3,701 | $ | 3,667 | $ | 7,008 | ||||||
Net loss | $ | (30,384 | ) | $ | (26,496 | ) | $ | (15,278 | ) | |||
Depreciation and amortization | 26,749 | 25,627 | 20,864 | |||||||||
Amortization of intangible assets | 23,949 | 23,791 | 23,644 | |||||||||
Stock-based compensation expense | 11,560 | 10,384 | 8,286 | |||||||||
Interest expense | 4,435 | 4,202 | 4,136 | |||||||||
Amortization of debt issuance costs | 571 | 579 | 358 | |||||||||
Other expense, net | 1,335 | 1,746 | 239 | |||||||||
Income tax expense (benefit) | 845 | (1,765 | ) | (5,349 | ) | |||||||
Non-GAAP adjusted EBITDA | $ | 39,060 | $ | 38,068 | $ | 36,900 | ||||||
Non-GAAP adjusted EBITDA margin | 14.1 | % | 14.9 | % | 15.7 | % | ||||||
Cash flow provided by operations | $ | 30,702 | $ | 25,773 | $ | 42,009 | ||||||
Capital expenditures | (12,703 | ) | (9,823 | ) | (6,976 | ) | ||||||
Capitalized software development costs | (25,440 | ) | (27,076 | ) | (20,495 | ) | ||||||
Free cash flow | $ | (7,441 | ) | $ | (11,126 | ) | $ | 14,538 | ||||
Components of Operating Results
Sources of Revenue
We derive revenue principally through fixed commitment contracts under which we provide customers with various services, including access to our cloud-based Intralinks Platform, access to one or more of our Intralinks exchanges and access to Intralinks VIA workspaces, as well as the related customer support and other services. Management operates the business in one reportable segment, assessing performance and making operating decisions based on our single operating segment and reporting unit structure. However, to date we have monitored certain revenue metrics and trends by principal markets, as defined below. We also monitor the mix of "subscription" and "transaction" customers (as defined in "Critical Accounting Policies and Estimates") within these markets, as well as revenue growth in international locations.
39
The following represent our principal markets:
• | Mergers & Acquisitions, or M&A, comprises customers spanning a variety of industries, including financial services, pharmaceutical, manufacturing, biotechnology, consumer, energy, telecommunications, industrial, legal, professional services, insurance and technology who use the Intralinks Platform for project-based transactions, such as mergers, acquisitions and dispositions, primarily under transaction arrangements. These customers are typically referred to us by financial or legal advisors involved in the respective transactions. |
• | Enterprise comprises customers, across the same variety of industries described above, who use the Intralinks Platform for a wide range of corporate purposes, primarily under subscription arrangements. |
• | Debt Capital Markets, or DCM, comprises customers within the financial services industry who use the Intralinks Platform for loan syndication and administration and other debt-related transactions, primarily under subscription arrangements. |
Cost of Revenue
Cost of revenue primarily consists of (i) employee compensation and related expenses, including stock-based compensation expense, (ii) amortization of capitalized software and certain definite-lived intangible assets, (iii) software license and maintenance fees to support the Intralinks Platform, (iv) expenses related to hosting our service, including internet connectivity, co-location management and data storage fees, (v) expenses for third-party contractors providing customer support and project management services, (vi) depreciation of computer equipment and software and (vii) allocated overhead. Our hosting provider charges us a monthly fee based on the number of servers, the amount of storage and the levels of network connectivity required. We allocate overhead, such as facilities and telecommunication charges, to all departments based on headcount, which we consider to be a fair and representative means of allocation. As such, general overhead expenses are reflected in cost of revenue and each of the operating expense categories set forth below.
Operating Expenses
Sales and Marketing - Sales and marketing expense primarily consists of (i) employee compensation and related expenses, including commissions to our sales representatives and stock-based compensation expense, (ii) amortization of certain definite-lived intangible assets, (iii) costs of marketing programs, (iv) travel and entertainment expenses, (v) commissions to our third party partners and (vi) allocated overhead. Our marketing programs include advertising, events and conferences, corporate communications, public relations and other brand building and product marketing expenses.
General and Administrative - General and administrative expense primarily consists of (i) employee compensation and related expenses, including stock-based compensation expense, for our executive management, finance, legal, human resources and internal business systems personnel, (ii) professional fees, (iii) software license and maintenance fees to support our internal business systems, (iv) amortization of certain definite-lived intangible assets and (v) allocated overhead.
Product Development - Product development expense primarily consists of employee compensation and related expenses, including stock-based compensation expense and consulting expenses associated with the design, development and testing of our systems and allocated overhead. We capitalize direct costs of services used in developing internal-use software, including both internal and external direct labor costs. Costs incurred during the preliminary project stage, as well as maintenance and training costs, are expensed as incurred.
Non-Operating Expenses (Income)
Non-operating expenses (income) consist of: (i) interest expense, (ii) amortization of debt issuance costs, (iii) interest income, (iv) foreign currency transaction (gains) and losses and (v) fair value adjustments to our interest rate swap which matured on June 30, 2012.
Income Tax Expense (Benefit)
We are subject to income tax in the United States as well as other countries in which we conduct business. Earnings from our non-U.S. activities are subject to local country income tax and may also be subject to current U.S. income tax based on our corporate structure and operations.
Critical Accounting Policies and Estimates
The preparation of financial statements requires the application of appropriate accounting policies and the use of estimates. Our significant accounting policies are described in Note 2 - "Summary of Significant Accounting Policies" included in Item 8. Financial Statements and Supplementary Data of this Annual Report on Form 10-K. Management considers the following accounting policies and estimates to be critical to an understanding of our financial statements because their application requires significant judgment on the part of management.
40
The preparation of our Consolidated Financial Statements requires us to make certain estimates, judgments and assumptions that affect the reported amounts of assets, liabilities, revenue and expenses, and related disclosure of contingent assets and liabilities. Actual results could differ materially from those estimates. On an ongoing basis, we evaluate our estimates and assumptions including those related to the determination of the fair value of stock-based awards, including estimated forfeitures of such awards, the fair value of our single operating segment and reporting unit, the recoverability of our definite-lived intangible assets, capitalized software and fixed assets (and their related useful lives), certain components of the income tax provision, including the valuation allowance on deferred tax assets, allowances for doubtful accounts and reserves for customer credits and accruals for certain compensation expenses. We base our estimates, judgments and assumptions on historical experience, our forecasts and budgets and on various other factors that we believe to be reasonable under the circumstances.
Revenue Recognition
We derive revenue principally through fixed commitment contracts under which we provide customers various services, including access to our cloud-based Intralinks Platform, which includes Intralinks exchanges and Intralinks VIA, as well as the related customer support and other services.
We currently sell our services under service contracts that we categorize as either "subscription" or "transaction" arrangements, as follows:
• | Subscription arrangements include those customer contracts with an initial term of 12 months or more that automatically renew for successive terms of at least 12 months. Because some long-term customers will not accept automatic renewal terms, we also consider among our subscription customers those whose contracts have been extended upon mutual agreement for at least one renewal term of at least 12 months. We believe subscription arrangements appeal mainly to customers that have integrated our service offerings into their business processes and plan to use our service offerings for a series of expected projects or on an ongoing basis. Subscription arrangements afford customers of our exchange products several benefits, including the ability to manage the creation, opening and closing of any number of exchanges at their convenience during the commitment period, and potentially lower pricing than they would generally be charged under a single-event contract. |
• | Transaction arrangements include those customer contracts with an initial term of less than 12 months. We also consider transaction customers to be those first-time customers whose contracts do not have an automatic renewal clause and who have not yet renewed their contracts by mutual agreement. We believe these types of arrangements appeal mainly to customers who have a single discrete project. Unlike subscription contracts, which generally renew for at least 12 months at a time, transaction contracts continue in effect after their initial term on a month-to-month basis until the customer terminates, often by closing the relevant exchange. |
Revenue from both subscription and transaction contracts is recognized ratably over the contracted service period, provided that there is persuasive evidence of an arrangement, the service has been provided to the customer, collection is reasonably assured, the amount of fees to be paid by the customer is fixed or determinable and we have no significant remaining obligation at the completion of the contracted term. In circumstances where we have a significant remaining obligation after completion of the initial contract term, revenue is recognized ratably over the extended service period.
Under most of our customer arrangements, a fixed commitment fee is generally determined based on (i) the number of users that are expected to access the offering the customer has purchased, (ii) the volume of data expected to be managed by the customer and/or (iii) the expected duration of the project. Fees billed in advance are recorded initially in accounts receivable and deferred revenue, until such time that the relevant revenue recognition criteria have been met, at which time the related amounts are included in revenue.
Under our contractual arrangements with our customers, fees are payable in full and are non-refundable regardless of actual usage of our services. Similarly, while customers may cease using our services, our contracts generally do not allow for cancellation or termination for convenience during the contract term and our contracts do not contain general rights of return. We reserve the right under our contracts to charge customers for loading data or adding users to the offering purchased in excess of their original usage estimates. We bill incremental fees for overages monthly or quarterly in arrears and the related revenue is recognized ratably from the point that the overage is measured through the remaining contract term, or the remaining contract quarter, depending on the usage terms within the customer contract.
Our customers do not have a contractual right, or the ability, to take possession of the Intralinks software at any time during the hosting period, or to contract with an unrelated third party to host the Intralinks software. Therefore, revenue recognition for our services is not accounted for under specific guidance of the Financial Accounting Standards Board, or the FASB, on software revenue recognition. We recognize revenue for our services ratably over the contracted service period, as described above.
We offer our services to customers through single-element and multiple-element arrangements, some of which contain offerings for optional services, including document scanning, data archiving and other professional services. In accordance with the FASB's guidance on multiple-deliverable arrangements, we have evaluated the deliverables in our arrangements to determine whether
41
they represent separate units of accounting and, specifically whether the deliverables have value to our customers on a standalone basis. We have determined that the services delivered to customers under our existing arrangements generally represent a single unit of accounting. Revenue for optional services is recognized as delivered, or as completed, provided that the general revenue recognition criteria described above are met. We will continue to evaluate the nature of the services offered to customers under our fixed commitment contracts, as well as our pricing practices, to determine if a change in policy regarding multiple-element arrangements and related disclosures is warranted in future periods.
Additionally, certain of our customer contracts contain provisions for set-up and implementation services relating to the customer's use of the Intralinks Platform. We believe that these set-up and implementation services provide value to the customer over the entire period that the exchange is active, including renewal periods, and therefore the revenue related to these types of services is recognized over the longer of the contract term or the estimated relationship life, which generally ranges from two to four years. We will continue to evaluate the length of the amortization period of the revenue related to set-up and implementation services to determine if a change is warranted in future periods.
In the normal course of business we may agree to sales concessions with our customers. We maintain an allowance to reserve for potential credits issued to customers based on historical patterns of actual credits issued. Expenses associated with maintaining this reserve are recorded as a reduction to revenue.
Deferred revenue represents the billed but unearned portion of existing contracts for services to be provided. Deferred revenue does not include the unbilled portion of existing contractual commitments of our customers. Accordingly, our deferred revenue balance does not represent the total contract value of outstanding arrangements. However, amounts that have been invoiced but not yet collected are recorded as revenue or deferred revenue, as appropriate, and are included in our accounts receivable balances. Deferred revenue that will be recognized during the subsequent 12-month period is classified as "Deferred revenue," with the remaining non-current portion included in "Other long-term liabilities" on the Consolidated Balance Sheets.
Stock-Based Compensation - Stock-based compensation is measured at the grant date, based on the fair value of the award, and is recognized ratably as an expense, net of estimated forfeitures, over the vesting period of the award. We use the Black-Scholes option pricing model to determine the fair value of options granted under our 2010 Equity Incentive Plan, as well as the rights awarded under our 2010 Employee Stock Purchase Plan, or ESPP. The fair value of restricted shares of common stock, or RSAs, and restricted stock units, or RSUs, is generally determined using the intrinsic value of our common stock at the time of grant, with the exception of certain performance based RSAs and RSUs. The fair value of performance based RSAs and RSUs was determined using a Monte-Carlo simulation.
Determining the appropriate fair value model and calculating the fair value of stock-based payment awards require the use of subjective assumptions, including the expected life of the stock-based payment awards and stock price volatility. Due to our limited trading history, we estimate volatility for option grants by evaluating the average historical volatility of a peer group of similar public companies. The expected term of our option awards represent the period that our stock-based awards are expected to be outstanding. For purposes of determining the expected term, we use the “simplified” method, which uses the midpoint between the vesting date and the end of the contractual term.
In addition to assumptions used in the Black-Scholes option-pricing model, we estimate a forfeiture rate to calculate the stock-based compensation expense for our option awards. We consider several factors when estimating future forfeitures, including types of awards, employee level and historical experience. If this estimated rate changes in future periods due to different actual forfeitures, our stock-based compensation expense may increase or decrease significantly. If there are any modifications or cancellations of the underlying unvested securities or the terms of the awards, we may be required to accelerate, increase or cancel any remaining unamortized stock-based compensation.
Income Taxes - We account for income taxes on the asset and liability method pursuant to Accounting Standards Codification, or ASC, 740, Income Taxes. Under this method, deferred income tax assets and liabilities are recognized for the future tax consequences of net operating losses and tax credit carryforwards and temporary differences between the financial statement carrying amounts of existing assets and liabilities and their respective tax bases. Deferred income taxes are measured using enacted tax rates applicable to taxable income in the years in which the temporary differences are expected to reverse. The effect on deferred income taxes of a change in tax rates is recognized in our results of operations in the period that includes the enactment date.
We assess whether it is necessary to establish a valuation allowance to reduce our deferred income tax assets if we conclude that it is more likely than not that some portion or all of our deferred income tax assets will not be realized. Our evaluation includes assessing both positive (e.g., sources of taxable income) and negative (e.g., recent historical losses) evidence potentially impacting their realizability.
During 2014, we recorded a valuation allowance against our net deferred tax assets. The need for a valuation allowance requires an assessment of both positive and negative evidence when determining whether it is more likely than not that deferred tax assets are recoverable. In making this assessment, significant weight is given to evidence that can be objectively verified. After considering both negative and positive objectively verifiable evidence to assess the recoverability of our net deferred tax assets during 2014,
42
we determined that it was not more likely than not we would realize the full value of our deferred tax assets given the cumulative three-year historical results, as well as current uncertainties regarding the timing of profits as we invest in future growth. We continue to monitor the likelihood that we will be able to realize our deferred tax assets in the future and, as of December 31, 2015, we continue to maintain a valuation allowance on our U.S. net deferred tax assets. Our judgment regarding future profitability may change due to many factors, including future market conditions and the ability to successfully execute on our business plans and/or tax planning strategies. Should there be a change in the ability to recover deferred tax assets, our tax provision would increase or decrease in the period in which the assessment is changed.
We recognize the impact of an uncertain tax position in our financial statements if, based on the technical merits of the position, we believe the position is more-likely-than-not sustainable upon audit. This assessment involves the identification of potential uncertain tax positions, the evaluation of relevant tax law and an analysis of whether a liability for each uncertain tax position is necessary. We operate and are subject to audit in multiple taxing jurisdictions. We record interest expense and penalties on uncertain tax positions as part of income tax expense.
Investments - Our investment portfolio may at any time contain investments in U.S. Treasury obligations, securities guaranteed by the U.S. government, certificates of deposit, corporate notes and bonds, medium-term notes, commercial paper, and money market mutual funds, each with remaining maturities less than two years. Our investments with original maturity dates of less than three months from the purchase date are included in "Cash and cash equivalents" on the Consolidated Balance Sheets included elsewhere in this Form 10-K. Our investments not included in "Cash and cash equivalents" with remaining maturity dates less than one year are classified as current investments and investments with remaining maturity dates greater than one year are classified as non-current investments on the Consolidated Balance Sheets included elsewhere in this Form 10-K. Investments classified as held-to-maturity are recorded at amortized cost. Interest earned on investments is included in "Other expense (income), net" on the Consolidated Statements of Operations, included elsewhere in this Form 10-K.
Non-marketable investments for which we do not have the ability to exert significant influence over operating and financial policies are generally accounted for using the cost method of accounting in accordance with ASC 325-10, Investments-Other. On a quarterly basis, we evaluate whether an event or change in circumstances has occurred in the reporting period that may have a significant adverse effect on the fair value of a cost method investment. If an event or change in circumstances that may cause a significant adverse effect on the fair value of a cost method investment occurs, then the fair value of such cost method investment is estimated to determine if the investment is impaired. No such events or changes in circumstances occurred during the reporting period.
Accounts Receivable - We record accounts receivable at amounts due from customers, net of an allowance for doubtful accounts and reserve for potential credits issued to customers. We evaluate the adequacy of the allowance for doubtful accounts and the credit reserve on a quarterly basis. This evaluation includes historical loss experience, length of time receivables are past due, adverse situations that may affect a customer's ability to pay its obligations to us, prevailing market conditions and historical patterns of actual credits issued. This evaluation is inherently subjective and we may revise our estimates as more information becomes available.
Software Development Costs - We account for the cost of computer software developed or obtained for internal use by capitalizing qualifying costs that are incurred during the application development stage and amortizing them over the expected period of benefit, which is generally three years. Amortization begins when the software is ready for its intended use. Costs incurred in the preliminary and post-implementation stages are expensed as incurred. The amounts capitalized include external direct costs of services used in developing internal-use software, employee compensation and related expenses of personnel directly associated with the development activities and interest. Software development costs are evaluated for recoverability whenever events or changes in circumstances indicate that the carrying value of the asset may not be recoverable.
Goodwill - Goodwill represents the excess of the purchase price allocation over the fair value of tangible and identifiable intangible net assets acquired. ASC 350, Intangibles - Goodwill and Other gives companies the option to perform a qualitative assessment to determine whether it is more likely than not (a likelihood of greater than 50 percent) that the fair value of its reporting unit is less than its carrying value. If it is determined, based on the qualitative assessment, that it is more likely than not that the fair value of its reporting unit is less than its carrying value, or if a company decides to exercise its unconditional option to bypass the qualitative assessment, then the company would proceed to a two-step quantitative impairment test. In the first step, the fair value of each reporting unit is compared with its carrying value, including goodwill and allocated intangible assets. If the fair value is in excess of the carrying value, the goodwill for the reporting unit is considered not to be impaired. If the fair value is less than the carrying value, then a second step is performed in order to measure the amount of the impairment loss, if any, which is based on comparing the implied fair value of the reporting unit's goodwill to the fair value of the net assets of the reporting unit.
At December 31, 2015, we had $224.4 million of goodwill, which includes $8.5 million of goodwill related to the acquisition of docTrackr in April 2014. Goodwill is assessed for impairment annually as of October 1 or more frequently if an event occurs or circumstances change that would more likely than not reduce the fair value of a reporting unit below its carrying value. The goodwill impairment test is based on our determination that we operate as a single operating segment and reporting unit.
Other Intangible Assets - Our definite-lived intangible assets include developed technology, customer relationships, trade names
43
and non-compete agreements. Developed technology is primarily amortized over its estimated useful life at a rate consistent with the expected future cash flows to be generated by the asset. All other definite-lived intangible assets are amortized on a straight-line basis over their estimated useful lives.
Long-Lived Assets - Long-lived assets consist of definite-lived intangible assets, capitalized software and fixed assets that are subject to depreciation or amortization over the useful life of the related asset. The useful lives of our long-lived assets are determined based on our estimate of the period over which the related asset will be utilized. We review these estimated useful lives periodically for reasonableness. We may be required to change these estimates based on changes in our industry or other changing circumstances. If these estimates change in the future, we may be required to recognize increased or decreased depreciation expense for these assets.
Long-lived assets are evaluated for recoverability whenever events or changes in circumstances indicate that the carrying value of an asset may not be recoverable. In evaluating an asset for recoverability, we estimate the future cash flows expected to result from the use and eventual disposition of the asset. If the sum of the undiscounted expected future cash flows is less than the carrying value of the asset, an impairment loss, equal to the excess of the carrying value over the fair value of the asset, is recognized. No impairments were recorded on long-lived assets for the periods presented in the Consolidated Financial Statements included elsewhere in this Form 10-K.
The process of assessing potential impairment of our long-lived assets is highly subjective and requires significant judgment. An estimate of future undiscounted cash flows can be affected by many assumptions, requiring that management make significant judgments in arriving at these estimates, which include sales growth, pricing of our services, market penetration, competition and technological obsolescence. In each of the years presented, we did not identify any indicators of impairment related to our long-lived assets and therefore were not required to assess impairment utilizing an undiscounted cash flow model.
Warranties and Indemnification - Our revenue generating contracts generally provide for indemnification of customers against liabilities arising from third party claims that are attributable to the breach of warranties or infringement of third party intellectual property rights, subject to any contractual limitations of liability. We have also entered into contracts that include service level agreements in which we have warranted that we will provide certain levels of uptime. A subset of those customers have the explicit right, under the terms of their contracts, to receive credits or terminate their agreements with us in the event that we fail to meet those stated service levels. We rely on a risk framework to define our risk tolerances and establish limits to ensure that potential risk-related losses under our customer agreements are within acceptable limits. Factors that we consider in determining our potential exposure under customer contracts include the fact that we typically disclaim liability for consequential and indirect damages, including for loss of data, resulting from any breach of contract and that we, to date, have not had to repair or replace any services or been impacted by any payout in connection with any of these guarantees. To date, we have not incurred any material costs as a result of these indemnification obligations and have not accrued any liabilities related to these obligations in the Consolidated Financial Statements. In addition, to date, we have not provided credits nor had any agreement canceled based on our service level agreements.
Recent Accounting Pronouncements
For a discussion of recent accounting pronouncement, see Item 8 - "Financial Statements and Supplementary Data" in this Form 10-K.
44
Results of Operations
The following table sets forth Consolidated Statements of Operations data as a percentage of revenue.
Years Ended December 31, | |||||||||
2015 | 2014 | 2013 | |||||||
Revenue | 100.0 | % | 100.0 | % | 100.0 | % | |||
Cost of revenue | 27.5 | % | 27.1 | % | 27.7 | % | |||
Gross profit | 72.5 | % | 72.9 | % | 72.3 | % | |||
Operating expenses: | |||||||||
Sales and marketing | 44.9 | % | 45.3 | % | 46.2 | % | |||
General and administrative | 26.6 | % | 27.3 | % | 24.3 | % | |||
Product development | 9.3 | % | 8.8 | % | 8.5 | % | |||
Total operating expenses | 80.9 | % | 81.4 | % | 79.1 | % | |||
Loss from operations | (8.4 | )% | (8.5 | )% | (6.8 | )% | |||
Interest expense | 1.6 | % | 1.6 | % | 1.8 | % | |||
Amortization of debt issuance costs | 0.2 | % | 0.2 | % | 0.2 | % | |||
Other expense, net | 0.5 | % | 0.7 | % | 0.1 | % | |||
Net loss before income tax | (10.7 | )% | (11.0 | )% | (8.8 | )% | |||
Income tax expense (benefit) | 0.3 | % | (0.7 | )% | (2.3 | )% | |||
Net loss | (11.0 | )% | (10.4 | )% | (6.5 | )% | |||
Comparison of the Years ended December 31, 2015, 2014, and 2013
Revenue
Years Ended December 31, | Change from 2014 to 2015 | Change from 2013 to 2014 | ||||||||||||||||||||||||
2015 | 2014 | 2013 | $ | % | $ | % | ||||||||||||||||||||
(Dollars in thousands) | ||||||||||||||||||||||||||
M&A | $ | 139,917 | $ | 130,471 | $ | 110,456 | $ | 9,446 | 7.2 | % | $ | 20,015 | 18.1 | % | ||||||||||||
Enterprise | 106,683 | 96,711 | 95,246 | 9,972 | 10.3 | % | 1,465 | 1.5 | % | |||||||||||||||||
DCM | 29,553 | 28,639 | 28,794 | 914 | 3.2 | % | (155 | ) | (0.5 | )% | ||||||||||||||||
Total revenue | $ | 276,153 | $ | 255,821 | $ | 234,496 | $ | 20,332 | 7.9 | % | $ | 21,325 | 9.1 | % | ||||||||||||
M&A revenue increased $9.4 million, or 7.2%, from 2014 to 2015. The increase in M&A revenue resulted from a higher volume of strategic business transactions in the market.
M&A revenue increased $20.0 million, or 18.1%, from 2013 to 2014. The increase in M&A revenue resulted from a higher volume of strategic business transactions in the market.
Enterprise revenue increased $10.0 million, or 10.3%, from 2014 to 2015. The increase in Enterprise revenue was primarily the result of our continuing focused efforts to grow our Intralinks VIA product offering.
Enterprise revenue increased $1.5 million, or 1.5%, from 2013 to 2014. The increase in Enterprise revenue was primarily due to the growth in revenue generated from our Intralinks VIA product offering.
DCM revenue increased $0.9 million, or 3.2%, from 2014 to 2015. The increase in DCM revenue was due, in part, to the impact of an increase in the subscription renewal commitment level from an existing contract.
DCM revenue in 2014 remained largely unchanged from 2013.
45
Cost of Revenue and Gross Profit
Years Ended December 31, | Change from 2014 to 2015 | Change from 2013 to 2014 | ||||||||||||||||||||||||
2015 | 2014 | 2013 | $ | % | $ | % | ||||||||||||||||||||
(Dollars in thousands) | ||||||||||||||||||||||||||
Cost of revenue | $ | 75,966 | $ | 69,348 | $ | 64,885 | $ | 6,618 | 9.5 | % | $ | 4,463 | 6.9 | % | ||||||||||||
Gross profit | $ | 200,187 | $ | 186,473 | $ | 169,611 | $ | 13,714 | 7.4 | % | $ | 16,862 | 9.9 | % | ||||||||||||
Gross margin | 72.5 | % | 72.9 | % | 72.3 | % | (0.4) points | 0.6 points | ||||||||||||||||||
Cost of revenue increased $6.6 million, or 9.5%, from 2014 to 2015 due to increases in employee compensation and related expenses of $2.8 million, primarily related to an increase in headcount and various cost of revenue related expenses of $3.1 million comprising hosting, depreciation and software license and maintenance fees primarily due to investments in the infrastructure of our Intralinks platform. The increase was also due to an increase in amortization of capitalized software development costs of $0.8 million. Gross margin decreased 0.4 points as a result of the continued investment in our Intralinks platform.
Cost of revenue increased $4.5 million, or 6.9%, from 2013 to 2014 largely due to a $3.0 million increase in amortization of capitalized software related to the enhancement of our service offerings, as well as an increase in employee compensation and related expenses of $1.4 million primarily due to an increase in headcount. Gross margin increased 0.6 points due to the $21.3 million increase in revenue, primarily related to the growth in M&A revenue, partially offset by an increase of $4.5 million in cost of revenue.
Operating Expenses
Years Ended December 31, | Change from 2014 to 2015 | Change from 2013 to 2014 | ||||||||||||||||||||||||
2015 | 2014 | 2013 | $ | % | $ | % | ||||||||||||||||||||
(Dollars in thousands) | ||||||||||||||||||||||||||
Sales and marketing | $ | 124,006 | $ | 115,867 | $ | 108,428 | $ | 8,139 | 7.0 | % | $ | 7,439 | 6.9 | % | ||||||||||||
General and administrative | 73,589 | 69,911 | 57,063 | 3,678 | 5.3 | % | 12,848 | 22.5 | % | |||||||||||||||||
Product development | 25,790 | 22,429 | 20,014 | 3,361 | 15.0 | % | 2,415 | 12.1 | % | |||||||||||||||||
Total operating expenses | $ | 223,385 | $ | 208,207 | $ | 185,505 | $ | 15,178 | 7.3 | % | $ | 22,702 | 12.2 | % | ||||||||||||
Sales and marketing expense increased $8.1 million, or 7.0%, from 2014 to 2015, driven primarily by increases in employee compensation and related expenses, including sales commissions, of $6.9 million and travel and entertainment expenses of $2.1 million, primarily due to increased headcount, as well as increased sales. These increases were partially offset by a decrease in marketing expenses of $0.7 million.
Sales and marketing expense increased $7.4 million, or 6.9%, from 2013 to 2014, driven primarily by increases in (i) employee compensation and related expenses of $5.1 million primarily due to increased headcount, (ii) travel and entertainment expenses of $1.0 million, primarily related to increased headcount, (iii) commission expense to third-party partners of $0.9 million primarily due to new channel partners in 2014, and (iv) allocated rent and telecommunications expense of $0.9 million, which was due, in part, to early termination fees related to all of the premises leased under our Charlestown, Massachusetts lease, as well as higher allocated rent expense from our new Waltham, Massachusetts and London offices.
General and administrative expense increased $3.7 million, or 5.3%, from 2014 to 2015, driven primarily by increases in employee compensation and related expenses of $5.3 million, primarily related to increased headcount, as well as an increase in stock-based compensation expense due to an increase in equity awards granted to key employees, and an increase in bad debt expense of $1.0 million. These increases were partially offset by a decrease of $2.9 million in consulting and contractor expenses.
General and administrative expense increased $12.8 million, or 22.5% from 2013 to 2014, driven primarily by increases in (i) employee compensation and related expenses of $4.3 million primarily due to an increase in headcount, as well as stock-based compensation expense related to an increase in equity awards granted to key employees, (ii) professional fees of $3.4 million primarily due to transaction costs associated with the acquisition of docTrackr and other strategic initiatives, (iii) software maintenance and licensing fees of $1.8 million in support of enhancements to our IT infrastructure, and (iv) bad debt expense of $0.7 million.
Product development expense increased $3.4 million, or 15.0%, from 2014 to 2015, driven primarily by increases in employee compensation and related expenses of $3.2 million primarily due to an increase in headcount, as well as a decrease in the percentage of employee compensation and related expenses that were capitalized during the year.
46
Product development expense increased $2.4 million, or 12.1%, from 2013 to 2014, driven by increases in employee compensation and related expenses of $2.2 million primarily due to an increase in headcount.
Total product development costs comprise product development expense and capitalized software.
Years Ended December 31, | Change from 2014 to 2015 | Change from 2013 to 2014 | ||||||||||||||||||||||||
2015 | 2014 | 2013 | $ | % | $ | % | ||||||||||||||||||||
(Dollars in thousands) | ||||||||||||||||||||||||||
Product Development Expense | $ | 25,790 | $ | 22,429 | $ | 20,014 | $ | 3,361 | 15.0 | % | $ | 2,415 | 12.1 | % | ||||||||||||
Capitalized Software | 25,843 | 25,544 | 21,761 | 299 | 1.2 | % | 3,783 | 17.4 | % | |||||||||||||||||
Total product development costs | $ | 51,633 | $ | 47,973 | $ | 41,775 | $ | 3,660 | 7.6 | % | $ | 6,198 | 14.8 | % | ||||||||||||
The total product development costs increases of $3.7 million, or 7.6%, from 2014 to 2015, and $6.2 million, or 14.8%, from 2013 to 2014, were driven primarily by the factors described above.
Non-Operating Expenses
Years Ended December 31, | Change from 2014 to 2015 | Change from 2013 to 2014 | ||||||||||||||||||||||||
2015 | 2014 | 2013 | $ | % | $ | % | ||||||||||||||||||||
(Dollars in thousands) | ||||||||||||||||||||||||||
Interest expense | $ | 4,435 | $ | 4,202 | $ | 4,136 | $ | 233 | 5.5 | % | $ | 66 | 1.6 | % | ||||||||||||
Amortization of debt issuance costs | $ | 571 | $ | 579 | $ | 358 | $ | (8 | ) | (1.4 | )% | $ | 221 | 61.7 | % | |||||||||||
Other expense, net | $ | 1,335 | $ | 1,746 | $ | 239 | $ | (411 | ) | (23.5 | )% | $ | 1,507 | >100% | ||||||||||||
Interest expense increased $0.2 million, or 5.5%, from 2014 to 2015, primarily due to a higher interest rate and higher average debt outstanding following the refinancing of our prior credit facility in February 2014.
Interest expense increased $0.1 million, or 1.6%, from 2013 to 2014. Excluding capitalized interest, interest expense increased $1.3 million, or 28.3%, due to a higher interest rate and higher average debt balance outstanding following the refinancing of our credit facility in February 2014. This increase in interest expense was primarily offset by an increase in capitalized interest of $1.3 million due in part to a higher interest rate and capitalized software costs in 2014 compared to 2013.
Amortization of debt issuance costs remained largely unchanged from 2014 to 2015.
Amortization of debt issuance costs increased $0.2 million, or 61.7%, from 2013 to 2014, primarily due to additional debt issuance costs related to the refinancing of our credit facility in February 2014.
Other expense, net comprises foreign currency transaction (gains) losses and interest income. Foreign currency transaction (gains) losses largely relate to the remeasurement of Euro denominated accounts receivable held by entities where the Euro is not the functional currency. Net foreign currency transaction losses were $1.4 million, $1.9 million and $0.3 million in 2015, 2014 and 2013, respectively.
Income Tax Expense (Benefit)
Years Ended December 31, | ||||||||||||
2015 | 2014 | 2013 | ||||||||||
(In thousands) | ||||||||||||
Income tax expense (benefit) | $ | 845 | $ | (1,765 | ) | $ | (5,349 | ) | ||||
We recorded an income tax expense of $0.8 million despite a pre-tax loss of $29.5 million for the year ended December 31, 2015 primarily because the income tax benefit related to the U.S. pre-tax loss generated during the period was subject to a valuation allowance. Our effective tax rates for the years ended December 31, 2014 and 2013 of 6.2% and 25.9%, respectively, differ from the U.S. Federal statutory tax rate primarily due to stock-based compensation expense for incentive stock options and our ESPP, which are not tax-deductible, other non-tax-deductible expenses, state income taxes and foreign income taxes, partially offset by research and development credits.
We regularly assess whether a valuation allowance is required on our deferred tax assets by considering both positive and negative evidence related to the likelihood of the realization of our deferred tax assets. In our evaluation, we considered our cumulative loss in recent years and our forecasted losses in the near-term as significant negative evidence. We determined that the negative
47
evidence outweighed the positive evidence and a valuation allowance of $6.4 million on our net U.S. deferred tax assets was established during the fourth quarter of 2014. At December 31, 2015, we continue to maintain a full valuation allowance of $19.6 million on our net U.S. deferred tax assets. We will continue to assess the realizability of our deferred tax assets going forward and will adjust the valuation allowance as needed. See Note 8 - "Income Tax" included in Item 8. Financial Statements and Supplementary Data of this Annual Report on Form 10-K for our reconciliation of income taxes at the statutory federal rate to the provision for income taxes.
Seasonality
Renewal dates for our subscription contracts are typically spread over the course of the year, though we generally experience a greater concentration of renewals in the second and fourth fiscal quarters. Our revenue related to these subscription contracts are primarily recognized ratably over the related service period and contracts are generally invoiced in advance either annually or on a quarterly basis over the contract period. Our revenue related to transaction contracts is typically lowest in the first quarter primarily due to the lower amount of project-based transactions as compared to the remaining quarters of the year.
Financial Position, Liquidity and Capital Resources
Our principal sources of liquidity are our cash, cash equivalents and investments, as well as the cash flows that we generate from operations. At December 31, 2015, we had $47.9 million in cash and cash equivalents, $12.4 million in investments, and $50.4 million in accounts receivable, net of allowance for doubtful accounts and credit reserve. We have a $15.0 million Revolving Credit Facility, which expires on February 24, 2019, and is available as an additional source of financing. At December 31, 2015, we had $2.9 million in outstanding letters of credit under our Revolving Credit Facility.
On February 19, 2016, our Board of Directors authorized the repurchase of up to $20 million of shares of Intralinks Holdings’ common stock. We may purchase shares from time to time on the open market or in privately negotiated transactions, depending on those factors management deems relevant at any particular time, including without limitation, market conditions, share price, future outlook and other corporate liquidity requirements and priorities.
We believe that our sources of funding will be sufficient to satisfy our normal operating requirements, including capital expenditures, share repurchases and principal payments on long-term debt, for at least the next twelve months. Our liquidity could be negatively affected by a decrease in demand for our services. In addition, we may make acquisitions and strategic investments or increase our capital expenditures that could reduce our cash, cash equivalents and investments balances and as a result, we may need to raise additional capital through future debt or equity financing to provide for greater financial flexibility to fund these activities. Additional financing may not be available at all or on terms favorable to us.
The Term Loan Credit Facility requires us to comply with a Consolidated Net Leverage Ratio (as defined in the Term Loan Credit Facility) that must be less than or equal to 3.00 to 1.00. The calculation of our Consolidated Net Leverage Ratio permits us to net from our outstanding total indebtedness up to $20.0 million of our cash and cash equivalents. The Term Loan Credit Facility also requires partial prepayment of a portion of the principal outstanding in the event that we generate Consolidated Excess Cash Flow (as defined under the Term Loan Credit Facility) in excess of a certain threshold. If required, the prepayment is equal to 50% of our excess cash flow as measured on an annual basis, with step-downs to 25% and to 0% of our excess cash flow if our Consolidated Net Leverage Ratio (as defined in the Term Loan Credit Facility), is less than 2.00 to 1.00 and 1.00 to 1.00, respectively. Excess cash flow is generally defined as our adjusted EBITDA (as defined in the Term Loan Credit Facility) less debt service costs, unfinanced capital expenditures, unfinanced acquisition expenditures, and current income taxes paid, as adjusted for changes in our working capital. This determination is to be made 90 days following the end of the preceding fiscal year, with any payment, if required, 105 days following the end of the preceding fiscal year. Additionally, the Term Loan Credit Facility requires mandatory prepayment of the term loans from the net proceeds of certain asset sales outside the ordinary course of business and from proceeds of property insurance and condemnation events, in each case subject to our right to reinvest those proceeds in assets used in our business. The Revolving Credit Facility includes a springing Fixed Charge Coverage Ratio (as defined in the Revolving Credit Facility), which we must comply with any time our cash and cash equivalents held in deposit or securities accounts subject to a lien in favor of our revolving loan lenders falls below $10.0 million or if an Event of Default (as defined in the Revolving Credit Facility) occurs, in either case, a "Fixed Charge Coverage Trigger Event." In the event a Fixed Charge Coverage Trigger Event occurs, the Fixed Charge Coverage Ratio must be greater than or equal to 1.10 to 1.00. We were in compliance with all applicable covenants at December 31, 2015 and there was no required prepayment for the year ended December 31, 2015.
The agreements governing our Credit Facilities include the following customary restrictions on certain activities, which are subject to lender approval, with certain exceptions: (i) incurring additional indebtedness other than in the normal course of business; (ii) creating liens or other encumbrances on our assets; (iii) engaging in merger or acquisition transactions; (iv) making investments; and (v) entering into asset sale agreements or paying dividends, making distributions on or repurchasing our stock.
The agreements governing our Credit Facilities also contain customary events of default, including, but not limited to, uncured cross-defaults among these agreements. In addition, an uncured default under our Equipment Loan Facility would result in a cross-
48
default under our Term Loan Credit Facility and our Revolving Credit Facility. Although we currently expect to remain in compliance with these existing covenants, any breach of these covenants or a change in control could result in a default and subsequent cross-defaults, under our credit agreements, which could cause all of the outstanding indebtedness to become immediately due and payable and terminate all commitments from our lenders to extend further credit.
Each of our Credit Facilities is secured by liens on substantially all our assets, including a pledge of 100% of the equity interests in our domestic subsidiaries and an obligation to pledge 65% of the equity interests in our direct foreign subsidiaries. Our Revolving Credit Facility is secured by a first lien on our cash, accounts receivable and certain other liquid collateral and a second lien on our other assets. Our Term Loan Credit Facility is secured by a second lien on our cash, accounts receivable and certain other liquid collateral and a first lien on our other assets. Our Equipment Loan Facility is secured by liens on the equipment financed under that facility.
All obligations under each of our Credit Facilities are unconditionally guaranteed by our direct and indirect domestic subsidiaries. These guarantees are secured by substantially all the present and future property of the guarantors.
Our corporate credit ratings and rating agency outlooks as of December 31, 2015 are summarized in the table below.
Rating Agency | Rating | Outlook | ||
Moody's | B2 | Stable | ||
Standard & Poor's | B+ | Stable | ||
Cash Flows
December 31, | ||||||||||||
2015 | 2014 | 2013 | ||||||||||
(In thousands) | ||||||||||||
Cash and cash equivalents | $ | 47,875 | $ | 40,682 | $ | 50,540 | ||||||
Years ended December 31, | ||||||||||||
2015 | 2014 | 2013 | ||||||||||
(In thousands) | ||||||||||||
Net cash provided by operating activities | $ | 30,702 | $ | 25,773 | $ | 42,009 | ||||||
Net cash used in investing activities | (27,393 | ) | (36,981 | ) | (34,792 | ) | ||||||
Net cash provided by (used in) financing activities | 5,113 | 1,951 | (168 | ) | ||||||||
Effect of foreign exchange rate changes on cash and cash equivalents | (1,229 | ) | (601 | ) | (307 | ) | ||||||
Net increase (decrease) in cash and cash equivalents | $ | 7,193 | $ | (9,858 | ) | $ | 6,742 | |||||
Operating Activities
Net cash provided by operating activities for the year ended December 31, 2015 was $30.7 million, as a result of $34.7 million in cash generated from results of operations after adjusting for non-cash items, partially offset by a net decrease in our operating assets and liabilities of $4.0 million. The net decrease in operating assets and liabilities consisted primarily of an increase of $6.0 million in accounts receivable related, in part, to increased billings and the timing of cash collections and an increase of $3.7 million in prepaid expenses and other assets, partially offset by increases of $3.7 million in deferred revenue and $2.9 million in accrued expenses and other current liabilities. Additionally, net cash provided by operating activities for the year ended December 31, 2015 consisted of a net loss of $30.4 million plus adjustments for non-cash items of $65.0 million including (a) depreciation and amortization of $26.7 million, (b) amortization of intangible assets of $23.9 million, (c) stock-based compensation expense of $11.6 million and (d) provision for bad debt and customer credits of $2.8 million.
Net cash provided by operating activities for the year ended December 31, 2014 was $25.8 million, as a result of $32.3 million in cash generated from results of operations after adjusting for non-cash items, partially offset by a net decrease in our operating assets and liabilities of $6.5 million. The net decrease in operating assets and liabilities consisted primarily of an increase of $11.4 million in accounts receivable related, in part, to increased billings as well as the timing of cash collections, partially offset by a $4.3 million increase in deferred revenue. Additionally, net cash provided by operating activities for the year ended December 31, 2014 consisted of a net loss of $26.5 million plus adjustments for non-cash items of $58.8 million including (a) depreciation and amortization of $25.6 million, (b) amortization of intangible assets of $23.8 million, (c) stock-based compensation expense of $10.4 million, (d) provision for bad debt and customer credits of $1.8 million and (e) amortization of deferred costs of $1.3 million, partially offset by (f) a deferred tax benefit of $4.7 million.
49
Net cash provided by operating activities for the year ended December 31, 2013 was $42.0 million, as a result of $32.3 million in cash generated from results of operations after adjusting for non-cash items and a net increase in our operating assets and liabilities of $9.7 million. The net increase in operating assets and liabilities consisted primarily of: (i) an increase of $5.1 million in accounts payable due to more effective cash management, (ii) an increase of $4.1 million in accrued expenses and other liabilities primarily related to incentive compensation, and (iii) a $4.0 million increase in deferred revenue, partially offset by (iv) an increase of $2.4 million in accounts receivable related, in part, to higher billings and (v) an increase of $1.2 million in prepaid expenses and other assets due primarily to prepaid licensing costs related to software infrastructure. Additionally, net cash provided by operating activities for the year ended December 31, 2013 consisted of a net loss of $15.3 million plus adjustments for non-cash items of $47.5 million including (a) amortization of intangible assets of $23.6 million, (b) depreciation and amortization of $20.9 million, (c) stock-based compensation expense of $8.3 million, (d) provision for bad debt and customer credits of $1.6 million and (e) amortization of deferred costs of $1.5 million, partially offset by (f) a deferred tax benefit of $8.3 million.
Investing Activities
Net cash used in investing activities for the years ended December 31, 2015, 2014 and 2013 was $27.4 million, $37.0 million and $34.8 million, respectively. During the years ended December 31, 2015 and 2014 maturities net of purchases of investments were $11.8 million and $9.8 million, respectively. During the year ended December 31, 2013 purchases net of maturities of investments were $4.3 million. At December 31, 2015 and 2014, investments consisted of corporate securities. During the year ended December 31, 2014, we used $9.0 million in cash, net of cash acquired of $0.2 million, to acquire all of the outstanding shares of docTrackr. During the years ended December 31, 2015 and 2014 we purchased minority interests in privately held companies for $1.0 million and $3.5 million, respectively, which are accounted for under the cost method.
Cash used in investing activities related to capital expenditures for infrastructure during the years ended December 31, 2015, 2014 and 2013 was $12.7 million, $9.8 million and $7.0 million, respectively. Investments in capitalized software development costs for the years ended December 31, 2015, 2014 and 2013 were $25.4 million, $27.1 million and $20.5 million, respectively.
Additionally, during the year ended December 31, 2014, $2.4 million in cash that was restricted in 2013 was returned to us.
Financing Activities
Net cash provided by financing activities for the year ended December 31, 2015 was $5.1 million, which reflects $4.7 million in proceeds from our Equipment Loan Facility entered into in October 2015 related to the purchase of fixed assets and $3.0 million related to the exercise of stock options and issuance of common stock, net of withholding taxes, partially offset by a $1.5 million payment of a holdback related to the acquisition of docTrackr, recorded in "Other" financing activities.
Net cash provided by financing activities for the year ended December 31, 2014 of $2.0 million includes $79.2 million in proceeds from our Term Loan Credit Facility entered into in February 2014 related to the refinancing of our Prior Credit Facility, of which $74.9 million was used to pay off all of the outstanding indebtedness under our Prior Credit Facility and $2.8 million was used to pay debt issuance costs related to our Term Loan Credit Facility, and a revolving credit facility entered into in February 2014, or our Revolving Credit Facility.
Net cash used in financing activities for the year ended December 31, 2013 of $0.2 million includes $0.8 million of repayments of outstanding principal on long-term debt, $0.7 million of repayments of outstanding financing arrangements and $0.3 million of debt issuance costs, partially offset by proceeds from the exercise of stock options and issuance of common stock, net of withholding taxes of $1.6 million.
Contractual Obligations and Commitments
The following table sets forth, as of December 31, 2015, certain significant cash obligations that will affect our future liquidity:
Total | Less than 1 year | 1 – 3 Years | 3 – 5 Years | More than 5 years | ||||||||||||||||
(In thousands) | ||||||||||||||||||||
Long-term debt, including current portion (1) | $ | 101,831 | $ | 8,424 | $ | 16,290 | $ | 77,117 | $ | — | ||||||||||
Operating leases (2) | 37,604 | 6,124 | 11,285 | 9,563 | 10,632 | |||||||||||||||
Other commitments (3) | 17,177 | 7,948 | 9,229 | — | — | |||||||||||||||
Total | $ | 156,612 | $ | 22,496 | $ | 36,804 | $ | 86,680 | $ | 10,632 | ||||||||||
(1) Represents contractual obligations due, including interest. See Note 9 - “Debt” included in Item 8. Financial Statements and Supplementary Data of this Annual Report on Form 10-K.
(2) Represents contractual commitments under various non-cancelable operating lease agreements for certain of our offices, many of which contain escalation clauses. See Note 15 - “Commitments and Contingencies” included in Item 8. Financial Statements and Supplementary Data of this Annual Report on Form 10-K.
50
(3) Represents contractual commitments under third-party hosting, software license and maintenance agreements.
Uncertain Tax Positions
The unrecognized tax benefits of $5.5 million at December 31, 2015 are excluded from the table above as we are not able to reasonably estimate when we would make any cash payments required to settle these liabilities, but we do not believe that the ultimate settlement of our obligations will materially affect our liquidity. We do not expect that the balance of unrecognized tax benefits will significantly increase or decrease over the next twelve months.
Off-Balance Sheet Arrangements
As of December 31, 2015, we have not entered into any off-balance sheet arrangements or transactions with unconsolidated entities or other persons.
ITEM 7A. QUANTITATIVE AND QUALITATIVE DISCLOSURES ABOUT MARKET RISK
The following discussion should be read together with our Consolidated Financial Statements and related notes to Consolidated Financial Statements included elsewhere in this Form 10-K.
Interest Rate Sensitivity
Term loans under our Term Loan Credit Facility bears interest at a rate of 7.25%, representing a 2.00% floor, plus a margin of 5.25%. Although the interest on our Term Loan Credit Facility was defined as variable, the existence of the LIBOR floor of 2.00% caused us to not be subject to market risks related to fluctuations in interest rates because the LIBOR has been considerably lower than 2.00%. If LIBOR were to have risen above 2.00%, our results of operations, specifically interest expense on our Term Loan Credit Facility, would have been subject to market risk.
The primary objectives of our investment activities are to preserve principal, provide liquidity and maximize income without significantly increasing risk. Some of the securities we invest in are subject to market risk. This means that a change in prevailing interest rates may cause the value of the investment to fluctuate. To minimize this risk, we maintain our portfolio of cash and cash equivalents and short-term investments in a variety of securities, including money market funds, certificates of deposit, U.S. treasuries and corporate debt securities. A 10% decrease in interest rates in the years ended December 31, 2015 and 2014 would not have had a material impact (on a total dollar basis) on our interest income during those periods, respectively, due to the immateriality of the interest income generated by our investments during those periods.
Foreign Currency Exchange Risk
Foreign currency transaction exposure results primarily from transactions with customers or vendors denominated in currencies other than the functional currency of the entity in which the transaction is recorded by us. Assets and liabilities arising from such transactions are translated into the entity’s functional currency using the exchange rate in effect at the balance sheet date. Any gain or loss resulting from currency fluctuations is recorded in “Other expense (income), net” within our Consolidated Statements of Operations. Net foreign currency transaction losses of $1.4 million, $1.9 million and $0.3 million were recorded for the years ended December 31, 2015, 2014 and 2013, respectively.
Foreign currency translation exposure results from the translation of the financial statements of our subsidiaries whose functional currency is not the U.S. dollar into U.S. dollars for consolidated reporting purposes. The balance sheets of these subsidiaries are translated into U.S. dollars using period-end exchange rates and their statements of operations are translated into U.S. dollars using the average exchange rate over the period. Resulting currency translation adjustments are recorded in “Accumulated other comprehensive loss” in our Consolidated Balance Sheets. Net foreign currency translation losses of $3.0 million, $0.7 million and $0.6 million were recorded for the years ended December 31, 2015, 2014 and 2013, respectively.
Currently, our largest foreign currency exposures are those with respect to the Euro and the British pound sterling. Relative to foreign currency exposures existing at December 31, 2015, a 10% unfavorable movement in foreign currency exchange rates would expose us to losses in results of operations. For the year ended December 31, 2015, we estimated that a 10% unfavorable movement in foreign currency exchange rates would have increased our Net loss before income tax by $1.4 million. The estimates used assume that all currencies move in the same direction at the same time. The potential change noted above is based on a sensitivity analysis performed on our financial position as of December 31, 2015. We have experienced and will continue to experience fluctuations in our results of operations as a result of revaluing our assets and liabilities that are not denominated in the functional currency of the entity that recorded the asset or liability. As of December 31, 2015, we do not hedge our foreign currency exchange risk.
51
ITEM 8. Financial Statements and Supplementary Data
INDEX TO FINANCIAL STATEMENTS
Financial Statements of Intralinks Holdings, Inc.
Page | ||
Financial Statement Schedule: | ||
Schedule II - Valuation and Qualifying Accounts | ||
52
REPORT OF INDEPENDENT REGISTERED PUBLIC ACCOUNTING FIRM
To the Board of Directors and Stockholders of Intralinks Holdings, Inc.
In our opinion, the consolidated financial statements listed in the accompanying index present fairly, in all material respects, the financial position of Intralinks Holdings, Inc. and its subsidiaries at December 31, 2015 and December 31, 2014, and the results of their operations and their cash flows for each of the three years in the period ended December 31, 2015 in conformity with accounting principles generally accepted in the United States of America. In addition, in our opinion, the financial statement schedule listed in the accompanying index presents fairly, in all material respects, the information set forth therein when read in conjunction with the related consolidated financial statements. Also in our opinion, the Company maintained, in all material respects, effective internal control over financial reporting as of December 31, 2015, based on criteria established in Internal Control - Integrated Framework (2013) issued by the Committee of Sponsoring Organizations of the Treadway Commission (COSO). The Company's management is responsible for these financial statements and financial statement schedule, for maintaining effective internal control over financial reporting and for its assessment of the effectiveness of internal control over financial reporting, included in the Report of Management on Internal Control over Financial Reporting appearing under Item 9A. Our responsibility is to express opinions on these financial statements, on the financial statement schedule, and on the Company's internal control over financial reporting based on our integrated audits. We conducted our audits in accordance with the standards of the Public Company Accounting Oversight Board (United States). Those standards require that we plan and perform the audits to obtain reasonable assurance about whether the financial statements are free of material misstatement and whether effective internal control over financial reporting was maintained in all material respects. Our audits of the financial statements included examining, on a test basis, evidence supporting the amounts and disclosures in the financial statements, assessing the accounting principles used and significant estimates made by management, and evaluating the overall financial statement presentation. Our audit of internal control over financial reporting included obtaining an understanding of internal control over financial reporting, assessing the risk that a material weakness exists, and testing and evaluating the design and operating effectiveness of internal control based on the assessed risk. Our audits also included performing such other procedures as we considered necessary in the circumstances. We believe that our audits provide a reasonable basis for our opinions.
As discussed in Note 2 to the consolidated financial statements, the Company changed the manner in which it classifies deferred taxes in 2015 and 2014 due to the adoption of Accounting Standards Update 2015-17, Balance Sheet Classification of Deferred Taxes.
A company’s internal control over financial reporting is a process designed to provide reasonable assurance regarding the reliability of financial reporting and the preparation of financial statements for external purposes in accordance with generally accepted accounting principles. A company’s internal control over financial reporting includes those policies and procedures that (i) pertain to the maintenance of records that, in reasonable detail, accurately and fairly reflect the transactions and dispositions of the assets of the company; (ii) provide reasonable assurance that transactions are recorded as necessary to permit preparation of financial statements in accordance with generally accepted accounting principles, and that receipts and expenditures of the company are being made only in accordance with authorizations of management and directors of the company; and (iii) provide reasonable assurance regarding prevention or timely detection of unauthorized acquisition, use, or disposition of the company’s assets that could have a material effect on the financial statements.
Because of its inherent limitations, internal control over financial reporting may not prevent or detect misstatements. Also, projections of any evaluation of effectiveness to future periods are subject to the risk that controls may become inadequate because of changes in conditions, or that the degree of compliance with the policies or procedures may deteriorate.
/s/ PricewaterhouseCoopers LLP
New York, New York
March 4, 2016
53
INTRALINKS HOLDINGS, INC.
CONSOLIDATED BALANCE SHEETS
(In thousands, except share data)
December 31, | ||||||||
2015 | 2014 | |||||||
ASSETS | ||||||||
Current assets: | ||||||||
Cash and cash equivalents | $ | 47,875 | $ | 40,682 | ||||
Investments | 12,425 | 11,825 | ||||||
Accounts receivable, net of allowances of $4,265 and $3,158, respectively | 50,360 | 47,338 | ||||||
Prepaid expenses | 8,595 | 6,602 | ||||||
Other current assets | 3,881 | 3,626 | ||||||
Total current assets | 123,136 | 110,073 | ||||||
Investments | — | 12,630 | ||||||
Fixed assets, net | 20,789 | 16,245 | ||||||
Capitalized software, net | 46,636 | 39,798 | ||||||
Goodwill | 224,383 | 224,383 | ||||||
Other intangibles, net | 38,106 | 62,055 | ||||||
Other non-current assets | 8,663 | 6,676 | ||||||
Total assets | $ | 461,713 | $ | 471,860 | ||||
LIABILITIES AND STOCKHOLDERS' EQUITY | ||||||||
Current liabilities: | ||||||||
Accounts payable | $ | 10,094 | $ | 10,624 | ||||
Current portion of long-term debt | 2,311 | 906 | ||||||
Deferred revenue | 52,005 | 49,193 | ||||||
Accrued expenses and other current liabilities | 29,856 | 26,974 | ||||||
Total current liabilities | 94,266 | 87,697 | ||||||
Long-term debt | 80,501 | 77,933 | ||||||
Other long-term liabilities | 4,795 | 5,291 | ||||||
Commitments and contingencies | ||||||||
Stockholders' equity: | ||||||||
Undesignated Preferred Stock, $0.001 par value; 10,000,000 shares authorized; 0 shares issued and outstanding | — | — | ||||||
Common Stock, $0.001 par value; 300,000,000 shares authorized; 58,434,464 and 57,084,340 shares issued and outstanding, respectively | 58 | 57 | ||||||
Additional paid-in capital | 456,141 | 441,596 | ||||||
Accumulated deficit | (169,594 | ) | (139,210 | ) | ||||
Accumulated other comprehensive loss | (4,454 | ) | (1,504 | ) | ||||
Total stockholders' equity | 282,151 | 300,939 | ||||||
Total liabilities and stockholders' equity | $ | 461,713 | $ | 471,860 | ||||
The accompanying notes are an integral part of these Consolidated Financial Statements.
54
INTRALINKS HOLDINGS, INC.
CONSOLIDATED STATEMENTS OF OPERATIONS
(In thousands, except share and per share data)
Years Ended December 31, | ||||||||||||
2015 | 2014 | 2013 | ||||||||||
Revenue | $ | 276,153 | $ | 255,821 | $ | 234,496 | ||||||
Cost of revenue | 75,966 | 69,348 | 64,885 | |||||||||
Gross profit | 200,187 | 186,473 | 169,611 | |||||||||
Operating expenses: | ||||||||||||
Sales and marketing | 124,006 | 115,867 | 108,428 | |||||||||
General and administrative | 73,589 | 69,911 | 57,063 | |||||||||
Product development | 25,790 | 22,429 | 20,014 | |||||||||
Total operating expenses | 223,385 | 208,207 | 185,505 | |||||||||
Loss from operations | (23,198 | ) | (21,734 | ) | (15,894 | ) | ||||||
Interest expense | 4,435 | 4,202 | 4,136 | |||||||||
Amortization of debt issuance costs | 571 | 579 | 358 | |||||||||
Other expense, net | 1,335 | 1,746 | 239 | |||||||||
Net loss before income tax | (29,539 | ) | (28,261 | ) | (20,627 | ) | ||||||
Income tax expense (benefit) | 845 | (1,765 | ) | (5,349 | ) | |||||||
Net loss | $ | (30,384 | ) | $ | (26,496 | ) | $ | (15,278 | ) | |||
Net loss per common share | ||||||||||||
Basic | $ | (0.53 | ) | $ | (0.47 | ) | $ | (0.28 | ) | |||
Diluted | $ | (0.53 | ) | $ | (0.47 | ) | $ | (0.28 | ) | |||
Weighted average number of shares | ||||||||||||
Basic | 57,172,659 | 55,932,641 | 55,135,657 | |||||||||
Diluted | 57,172,659 | 55,932,641 | 55,135,657 | |||||||||
The accompanying notes are an integral part of these Consolidated Financial Statements.
55
INTRALINKS HOLDINGS, INC.
CONSOLIDATED STATEMENTS OF COMPREHENSIVE LOSS
(In thousands)
Years Ended December 31, | ||||||||||||
2015 | 2014 | 2013 | ||||||||||
Net loss | $ | (30,384 | ) | $ | (26,496 | ) | $ | (15,278 | ) | |||
Change in foreign currency translation adjustment, net of tax | (2,950 | ) | (714 | ) | (605 | ) | ||||||
Total other comprehensive loss, net of tax | (2,950 | ) | (714 | ) | (605 | ) | ||||||
Comprehensive loss | $ | (33,334 | ) | $ | (27,210 | ) | $ | (15,883 | ) | |||
The accompanying notes are an integral part of these Consolidated Financial Statements.
56
INTRALINKS HOLDINGS, INC.
CONSOLIDATED STATEMENTS OF CHANGES IN STOCKHOLDERS' EQUITY
(In thousands, except share data)
Shares | Amount | |||||||||||||||||||||||
Common Stock | Common Stock | Additional Paid-in Capital | Accumulated Deficit | Accumulated Other Comprehensive Income (Loss) | Total Stockholders' Equity | |||||||||||||||||||
Balance at December 31, 2012 | 55,486,651 | $ | 55 | $ | 419,618 | $ | (97,436 | ) | $ | (185 | ) | $ | 322,052 | |||||||||||
Change in foreign currency translation adjustment, net of tax | — | — | — | — | (605 | ) | (605 | ) | ||||||||||||||||
Net loss | — | — | — | (15,278 | ) | — | (15,278 | ) | ||||||||||||||||
Issuance of common stock upon exercise of stock options, vesting of restricted stock units and other, net of withholding taxes | 405,328 | 1 | 1,105 | — | — | 1,106 | ||||||||||||||||||
Issuance of common stock in connection with employee stock purchase plan | 86,338 | — | 540 | — | — | 540 | ||||||||||||||||||
Issuance of restricted common stock | 76,167 | — | — | — | — | — | ||||||||||||||||||
Stock-based compensation expense | — | — | 8,286 | — | — | 8,286 | ||||||||||||||||||
Balance at December 31, 2013 | 56,054,484 | $ | 56 | $ | 429,549 | $ | (112,714 | ) | $ | (790 | ) | $ | 316,101 | |||||||||||
Change in foreign currency translation adjustment, net of tax | — | — | — | — | (714 | ) | (714 | ) | ||||||||||||||||
Net loss | — | — | — | (26,496 | ) | — | (26,496 | ) | ||||||||||||||||
Issuance of common stock upon exercise of stock options, vesting of restricted stock units and other, net of withholding taxes | 817,634 | 1 | 720 | — | — | 721 | ||||||||||||||||||
Issuance of common stock in connection with employee stock purchase plan | 126,017 | — | 943 | — | — | 943 | ||||||||||||||||||
Issuance of restricted common stock | 86,205 | — | — | — | — | — | ||||||||||||||||||
Stock-based compensation expense | — | — | 10,384 | — | — | 10,384 | ||||||||||||||||||
Balance at December 31, 2014 | 57,084,340 | $ | 57 | $ | 441,596 | $ | (139,210 | ) | $ | (1,504 | ) | $ | 300,939 | |||||||||||
Change in foreign currency translation adjustment | — | — | — | — | (2,950 | ) | (2,950 | ) | ||||||||||||||||
Net loss | — | — | — | (30,384 | ) | — | (30,384 | ) | ||||||||||||||||
Issuance of common stock upon exercise of stock options, vesting of restricted stock units and other, net of withholding taxes | 1,152,797 | 1 | 2,019 | — | — | 2,020 | ||||||||||||||||||
Issuance of common stock in connection with employee stock purchase plan | 118,879 | — | 934 | — | — | 934 | ||||||||||||||||||
Issuance of restricted common stock | 78,448 | — | — | — | — | — | ||||||||||||||||||
Excess tax benefits from employee stock plans | — | — | 32 | — | — | 32 | ||||||||||||||||||
Stock-based compensation expense | — | — | 11,560 | — | — | 11,560 | ||||||||||||||||||
Balance at December 31, 2015 | 58,434,464 | $ | 58 | $ | 456,141 | $ | (169,594 | ) | $ | (4,454 | ) | $ | 282,151 | |||||||||||
The accompanying notes are an integral part of these Consolidated Financial Statements. | ||||||||||||||||||||||||
57
INTRALINKS HOLDINGS, INC.
CONSOLIDATED STATEMENTS OF CASH FLOWS
(In thousands)
Years Ended December 31, | ||||||||||||
2015 | 2014 | 2013 | ||||||||||
Net loss | $ | (30,384 | ) | $ | (26,496 | ) | $ | (15,278 | ) | |||
Adjustments to reconcile net loss to net cash provided by operating activities: | ||||||||||||
Depreciation and amortization | 26,749 | 25,627 | 20,864 | |||||||||
Amortization of intangible assets | 23,949 | 23,791 | 23,644 | |||||||||
Stock-based compensation expense | 11,560 | 10,384 | 8,286 | |||||||||
Amortization of deferred costs | 909 | 1,316 | 1,517 | |||||||||
Provision for bad debt and customer credits | 2,837 | 1,802 | 1,594 | |||||||||
Deferred income tax benefit | (957 | ) | (4,708 | ) | (8,338 | ) | ||||||
Other, net | (5 | ) | 572 | (18 | ) | |||||||
Changes in operating assets and liabilities: | ||||||||||||
Accounts receivable | (5,950 | ) | (11,390 | ) | (2,363 | ) | ||||||
Prepaid expenses and other assets | (3,733 | ) | 146 | (1,181 | ) | |||||||
Accounts payable | (846 | ) | 884 | 5,142 | ||||||||
Accrued expenses and other liabilities | 2,895 | (499 | ) | 4,132 | ||||||||
Deferred revenue | 3,678 | 4,344 | 4,008 | |||||||||
Net cash provided by operating activities | 30,702 | 25,773 | 42,009 | |||||||||
Cash flows from investing activities: | ||||||||||||
Capitalized software development costs | (25,440 | ) | (27,076 | ) | (20,495 | ) | ||||||
Capital expenditures | (12,703 | ) | (9,823 | ) | (6,976 | ) | ||||||
Purchases of investments | — | (27,062 | ) | (47,604 | ) | |||||||
Maturities of investments | 11,750 | 36,879 | 43,326 | |||||||||
Purchases of cost method investments | (1,000 | ) | (3,499 | ) | — | |||||||
Acquisitions, net of cash acquired | — | (8,843 | ) | (600 | ) | |||||||
Restricted cash | — | 2,443 | (2,443 | ) | ||||||||
Net cash used in investing activities | (27,393 | ) | (36,981 | ) | (34,792 | ) | ||||||
Cash flows from financing activities: | ||||||||||||
Proceeds from issuance of long-term debt | 4,719 | 79,200 | — | |||||||||
Payments on long-term debt | (800 | ) | (75,498 | ) | (821 | ) | ||||||
Payments of outstanding financing arrangements | (228 | ) | (376 | ) | (708 | ) | ||||||
Debt issuance costs | — | (2,849 | ) | (284 | ) | |||||||
Exercise of stock options and issuance of common stock, net of withholding taxes | 2,953 | 1,662 | 1,645 | |||||||||
Other | (1,531 | ) | (188 | ) | — | |||||||
Net cash provided by (used in) financing activities | 5,113 | 1,951 | (168 | ) | ||||||||
Effect of foreign exchange rate changes on cash and cash equivalents | (1,229 | ) | (601 | ) | (307 | ) | ||||||
Net increase (decrease) in cash and cash equivalents | 7,193 | (9,858 | ) | 6,742 | ||||||||
Cash and cash equivalents at beginning of period | 40,682 | 50,540 | 43,798 | |||||||||
Cash and cash equivalents at end of period | $ | 47,875 | $ | 40,682 | $ | 50,540 | ||||||
Years Ended December 31, | ||||||||||||
2015 | 2014 | 2013 | ||||||||||
Supplemental Schedule of Cash Flow Information: | ||||||||||||
Cash paid during the period for: | ||||||||||||
Interest (net of capitalized interest of $1.7 million, $1.8 million and $0.5, respectively) | $ | 4,245 | $ | 4,033 | $ | 4,136 | ||||||
Income tax | $ | 1,629 | $ | 2,572 | $ | 2,416 | ||||||
The accompanying notes are an integral part of these Consolidated Financial Statements.
58
1. Organization and Description of Business
Intralinks Holdings, Inc. ("Intralinks Holdings") and its subsidiaries (collectively, the "Company") is a leading global provider of Software-as-a-Service ("SaaS") solutions for secure enterprise content collaboration within and among organizations. The Company was incorporated in Delaware in June 1996. The Company's cloud-based solutions enable organizations to manage, control, track, search, exchange and collaborate on sensitive information, inside and outside of the firewall, all within a secure and easy-to-use environment. The Company's customers rely on its cost-effective solutions to manage and control large amounts of electronic information, accelerate information intensive business processes, reduce time to market, optimize critical information workflows, meet regulatory and risk management requirements and collaborate with business counterparties in a secure, auditable and compliant manner. The Company helps its customers eliminate many of the inherent risks and inefficiencies of using email, fax, courier services and other existing solutions to collaborate and exchange information.
2. Summary of Significant Accounting Policies
Principles of Consolidation - The accompanying Consolidated Financial Statements include the accounts of the Company and its wholly-owned subsidiaries, prepared in conformity with accounting principles generally accepted in the United States of America, or U.S. GAAP. All intercompany balances and transactions have been eliminated in consolidation.
Reclassifications - Certain reclassifications have been made to the prior year amounts to conform to the current year presentation.
Use of Estimates - The preparation of the Company's Consolidated Financial Statements in conformity with U.S. GAAP requires management to make certain estimates, judgments and assumptions that affect the reported amounts of assets and liabilities and the disclosure of contingent assets and liabilities at the date of the Consolidated Financial Statements and the reported amounts of revenue and expenses during the reporting period. Actual results could differ materially from those estimates.
On an ongoing basis, the Company evaluates its estimates and assumptions including those related to the determination of the fair value of stock-based awards (including estimated forfeitures of such awards), the fair value of the Company's single operating segment and reporting unit, the recoverability of its definite-lived intangible assets, capitalized software and fixed assets (and their related useful lives), certain components of the income tax provision (including the valuation allowance on deferred tax assets), allowances for doubtful accounts and reserves for customer credits and accruals for certain compensation expenses. The Company bases its estimates, judgments and assumptions on historical experience, its forecasts and budgets and on various other factors that it believes to be reasonable under the circumstances.
Revenue Recognition - The Company derives revenue principally through fixed commitment contracts under which the Company provides customers various services, including access to the cloud-based Intralinks Platform, which includes Intralinks exchanges and Intralinks VIA, as well as the related customer support and other services. The Company's customers do not have a contractual right, or the ability, to take possession of the Intralinks software at any time during the hosting period, or contract with an unrelated third party to host the Intralinks software. Therefore, revenue recognition for the Company's services is not accounted for under specific guidance of the Financial Accounting Standards Board ("FASB") on software revenue recognition. The Company recognizes revenue for its services ratably over the contracted service period, provided that there is persuasive evidence of an arrangement, the service has been provided to the customer, collection is reasonably assured, the amount of fees to be paid by the customer is fixed or determinable and the Company has no significant remaining obligation at the completion of the contracted term. In circumstances where the Company has a significant remaining obligation after completion of the initial contract term, revenue is recognized ratably over the extended service period. The Company's contracts do not contain general rights of return.
In the normal course of business, the Company may agree to sales concessions with its customers. The Company maintains an allowance to reserve for potential credits issued to customers based on historical patterns of actual credits issued. Expenses associated with maintaining this reserve are recorded as a reduction to revenue.
The Company offers services to customers through single-element and multiple-element arrangements, some of which contain offerings for optional services, including document scanning, data archiving and other professional services. In accordance with the FASB's guidance on multiple-deliverable arrangements, the Company has evaluated the deliverables in its arrangements to determine whether they represent separate units of accounting, specifically whether the deliverables have value to the Company's customers on a standalone basis. The Company has determined that the services delivered to customers under its existing arrangements generally represent a single unit of accounting. Revenue for optional services is recognized as delivered, or as completed, provided that the general revenue recognition criteria described above are met. The Company continues to evaluate the nature of the services offered to customers under its fixed commitment contracts, as well as its pricing practices, to determine
59
if a change in policy regarding multiple-element arrangements and related disclosures is warranted in future periods.
Additionally, certain of the Company's customer contracts contain provisions for set-up and implementation services relating to the customer's use of the Intralinks Platform. The Company believes that these set-up and implementation services provide value to the customer over the entire period that the exchange is active, including renewal periods, and therefore the revenue related to these types of services is recognized over the longer of the contract term or the estimated relationship life, which generally ranges from two to four years. The Company will continue to evaluate the length of the amortization period of the revenue related to set up and implementation services to determine if a change in this estimate is warranted in future periods.
Deferred Revenue - Deferred revenue represents the billed but unearned portion of existing contracts for services to be provided. Deferred revenue does not include the unbilled portion of existing contractual commitments of the Company's customers. Accordingly, the deferred revenue balance does not represent the total contract value of outstanding arrangements. However, amounts that have been invoiced but not yet collected are recorded as revenue or deferred revenue, as appropriate, and are included in the Company's accounts receivable balances. Deferred revenue that will be recognized during the subsequent 12-month period is classified as "Deferred revenue," with the remaining non-current portion included in "Other long-term liabilities" on the Consolidated Balance Sheets.
Stock-Based Compensation - Stock-based compensation is measured at the grant date, based on the fair value of the award, and is recognized ratably as an expense, net of estimated forfeitures, over the vesting period of the award. The Company uses the Black-Scholes option pricing model to determine the fair value of options granted under our 2010 Equity Incentive Plan, as well as the rights awarded under our 2010 Employee Stock Purchase Plan, or ESPP. The fair value of restricted shares of common stock, or RSAs, and restricted stock units, or RSUs, is generally determined using the intrinsic value of the Company's common stock at the time of grant, with the exception of certain performance based RSAs and RSUs. The fair value of performance based RSAs and RSUs was determined using a Monte-Carlo simulation.
Determining the appropriate fair value model and calculating the fair value of stock-based payment awards require the use of subjective assumptions, including the expected life of the stock-based payment awards and stock price volatility. Due to the Company's limited trading history, the Company estimates volatility for option grants by evaluating the average historical volatility of a peer group of similar public companies. The expected term of the Company's option awards represent the period that its stock-based awards are expected to be outstanding. For purposes of determining the expected term, the Company used the “simplified” method, which uses the midpoint between the vesting date and the end of the contractual term.
In addition to assumptions used in the Black-Scholes option-pricing model, the Company estimates a forfeiture rate to calculate the stock-based compensation expense for our option awards. The Company considers several factors when estimating future forfeitures, including types of awards, employee level and historical experience. If this estimated rate changes in future periods due to different actual forfeitures, stock-based compensation expense may increase or decrease significantly. If there are any modifications or cancellations of the underlying unvested securities or the terms of the awards, the Company may be required to accelerate, increase or cancel any remaining unamortized stock-based compensation.
Sales Commissions - Commissions payable to the Company's sales staff, third-party channel partners and resellers are expensed in the period earned. Sales commission expense was $22.1 million, $19.2 million and $17.0 million, respectively, for the years ended December 31, 2015, 2014 and 2013 and is included within "Sales and marketing" in the Consolidated Statements of Operations.
Advertising - The Company expenses the cost for producing and communicating advertising and promoting its services in the period incurred.
Income Taxes - The Company accounts for income taxes on the asset and liability method pursuant to ASC 740, Income Taxes. Under this method, deferred income tax assets and liabilities are recognized for the future tax consequences of differences between the financial statement carrying amounts of existing assets and liabilities and their respective tax bases, as well as net operating loss and tax credit carryforwards. Deferred income taxes are measured using enacted tax rates expected to be applied to taxable income in the years in which those temporary differences are expected to be recovered or settled. The effect on deferred income taxes of a change in tax rates is recognized in results of operations in the period that includes the enactment date.
In determining whether it is necessary to record a valuation allowance, the Company assesses whether its deferred income tax assets are more-likely-than-not realizable. This analysis includes evaluating both positive (e.g., sources of taxable income) and negative (e.g., recent historical losses) evidence that could impact the realizability of the Company's deferred income tax assets.
60
The Company recognizes the impact of an uncertain tax position in its financial statements if, in management's judgment, the position is more-likely-than-not sustainable upon audit based on the position's technical merits. This analysis involves the identification of potential uncertain tax positions, the evaluation of applicable income tax laws and measurement of the amount of each uncertain tax position that is more-likely-than-not sustainable. The Company operates within multiple taxing jurisdictions and is subject to audit in each of these jurisdictions. The Company recognizes interest expense and penalties on uncertain tax positions as part of income tax expense.
Net Loss Per Share - Basic loss per share is computed using net loss and the weighted average number of common shares outstanding. Diluted loss per share reflects the weighted average number of shares of common stock outstanding plus any potentially dilutive shares outstanding during the period. Potentially dilutive shares consist of shares issuable upon the exercise of stock options and unvested shares of restricted common stock (using the treasury stock method). Common equivalent shares are excluded from the diluted computation if their effect is anti-dilutive.
Foreign Currency Translation and Transactions - The functional currencies of the Company's foreign operations are the local currencies in each of the foreign subsidiary locations. Assets and liabilities denominated in a foreign currency are translated into U.S. dollars at the exchange rate on the balance sheet date. Revenue and expenses denominated in a foreign currency are translated into U.S. dollars on a monthly basis at the average exchange rate during the period. Adjustments resulting from translating foreign currency financial statements into U.S. dollars are recorded in "Accumulated other comprehensive loss" as a separate component of shareholders' equity within the Consolidated Balance Sheets. Foreign currency transaction gains and losses resulting from monetary assets and liabilities denominated in a currency other than the subsidiary's functional currency are reported in the Consolidated Statements of Operations as a component of "Other expense (income), net." For the years ended December 31, 2015, 2014 and 2013, foreign currency transaction losses were $1.4 million, $1.9 million and $0.3 million, respectively.
Comprehensive Loss - Comprehensive loss consists of net loss and other comprehensive loss. Other comprehensive loss includes certain changes in stockholders' equity that are excluded from net loss, specifically cumulative foreign currency translation adjustments.
Cash and Cash Equivalents - The Company considers all highly liquid investments with an original maturity of three months or less at the date of purchase to be cash equivalents. Cash and cash equivalents consist of cash on deposit with banks, money market funds and certain investments in commercial paper.
Investments - The Company's investment portfolio may at any time contain investments in U.S Treasury obligations, securities guaranteed by the U.S. government, certificates of deposit, corporate notes and bonds, medium-term notes, commercial paper, and money market mutual funds, with remaining maturities less than two years. The Company's investments not included in "Cash and cash equivalents" with remaining maturity dates less than one year are classified as current investments and investments with remaining maturity dates greater than one year are classified as non-current investments on the Consolidated Balance Sheets. Investments classified as held-to-maturity are recorded at amortized cost. Interest earned on investments is included in "Other expense, net" on the Consolidated Statements of Operations.
Non-marketable investments for which the Company does not have the ability to exert significant influence over operating and financial policies are generally accounted for using the cost method of accounting in accordance with ASC 325-10, Investments-Other. On a quarterly basis, the Company evaluates whether an event or change in circumstances has occurred in the reporting period that may have a significant adverse effect on the fair value of a cost method investment. If an event or change in circumstances that may cause a significant adverse effect on the fair value of a cost method investment occurs, then the fair value of such cost method investment is estimated to determine if the investment is impaired. No such events or changes in circumstances occurred during the reporting period.
Concentration of Credit Risk - Financial instruments that potentially subject the Company to concentrations of credit risk consist primarily of cash and cash equivalents, restricted cash, investments and trade accounts receivable. Although the Company deposits its cash with more than one financial institution, its deposits, at times, may exceed federally insured limits. The Company has not experienced any losses on cash and cash equivalent accounts to date and the Company believes it is not exposed to any significant credit risk related to cash.
Accounts Receivable - The Company records accounts receivable at amounts due from customers, net of an allowance for doubtful accounts and reserve for potential credits issued to customers. The Company evaluates the adequacy of the allowance for doubtful accounts and the credit reserve on a quarterly basis. This evaluation includes historical loss experience, length of time receivables are past due, adverse situations that may affect a customer's ability to pay its obligations to the Company, prevailing market conditions and historical patterns of actual credits issued. This evaluation is inherently subjective and the Company may revise
61
its estimates as more information becomes available.
Fixed Assets, net - Fixed assets are stated at cost, less accumulated depreciation. Depreciation is calculated using the straight-line method over the estimated useful lives of those assets, as follows:
Computer equipment and capitalized software | 3 years |
Office equipment | 3 years |
Furniture and fixtures | 5 years |
Leasehold improvements | Shorter of estimated useful life or remaining lease term, ranging from 3 to 11 years |
Repairs and maintenance costs are expensed as incurred. When assets are retired or otherwise disposed of, the cost and accumulated depreciation and amortization are removed from their respective accounts and any gain or loss on such retirement is reflected in operating expenses.
Software Development Costs - The Company accounts for the cost of software developed or obtained for internal use by capitalizing qualifying costs that are incurred during the application development stage and amortizing them over the expected period of benefit, which is generally three years. Amortization begins when the software is ready for its intended use. Costs incurred during the preliminary and post-implementation stages are expensed as incurred. The amounts capitalized include external direct costs of services used in developing internal-use software, employee compensation and related expenses of personnel directly associated with the development activities and interest. Software development costs are evaluated for recoverability whenever events or changes in circumstances indicate that the carrying value of the asset may not be recoverable.
Goodwill - Goodwill represents the excess of the purchase price allocation over the fair value of tangible and identifiable intangible net assets acquired. The Company assesses goodwill for impairment annually as of October 1 or more frequently if an event occurs or circumstances change that would more likely than not reduce the fair value of a reporting unit below its carrying value. The goodwill impairment test is based on the Company's single operating segment and reporting unit structure. ASC 350, Intangibles - Goodwill and Other gives companies the option to perform a qualitative assessment to determine whether it is more likely than not (a likelihood of greater than 50 percent) that the fair value of its reporting unit is less than its carrying value. If it is determined, based on the qualitative assessment, that it is more likely than not that the fair value of its reporting unit is less than its carrying value, or if the company decides to exercise its unconditional option to bypass the qualitative assessment, then the company would proceed to a two-step quantitative impairment test. In the first step, the fair value of each reporting unit is compared with its carrying value, including goodwill and allocated intangible assets. If the fair value is in excess of the carrying value, the goodwill for the reporting unit is considered not to be impaired. If the fair value is less than the carrying value, then a second step is performed in order to measure the amount of the impairment loss, if any, which is based on comparing the implied fair value of the reporting unit's goodwill to the fair value of the net assets of the reporting unit.
Other Intangibles, net - Other intangibles, net represents definite-lived intangible assets, which are being amortized over their estimated useful lives as follows:
Developed technology | 5 to 10 years |
Customer relationships | 10 years |
Trade names | 12 years |
Non-compete agreements | 3 years |
Developed technology is primarily amortized over its estimated useful life at a rate consistent with the expected future cash flows to be generated by the asset. All other definite-lived intangible assets are amortized on a straight-line basis over their estimated useful lives.
62
Long-Lived Assets - The Company's long-lived assets consist of definite-lived intangible assets, capitalized software and fixed assets that are subject to depreciation or amortization over the useful life of the related asset. The useful lives of the Company's long-lived assets are determined based on its estimate of the period over which the related asset will be utilized. The Company periodically reviews these estimated useful lives for reasonableness. Long-lived assets are evaluated for recoverability whenever events or changes in circumstances indicate that the carrying value of an asset may not be recoverable. In evaluating an asset for recoverability, the Company estimates the future cash flows expected to result from the use and eventual disposition of the asset. If the sum of the undiscounted expected future cash flows is less than the carrying value of the asset, an impairment loss, equal to the excess of the carrying value over the fair value of the asset, is recognized. No impairments were recorded on long-lived assets for the periods presented in these Consolidated Financial Statements.
Debt Issuance Costs - Debt issuance costs are deferred and amortized on a straight-line basis over the term of the related loans.
Warranties and Indemnification - The Company's revenue generating contracts generally provide for indemnification of customers against liabilities arising from third party claims that are attributable to the breach of warranties or infringement of third party intellectual property rights, subject to any contractual limitations of liability. The Company has also entered into contracts that include service level agreements in which it has warranted that it will provide certain levels of uptime. A subset of those customers have the explicit right, under the terms of their contracts, to receive credits or terminate their agreements with the Company in the event that it fails to meet those stated service levels. The Company relies on a risk framework to define its risk tolerances and establishes limits to ensure that potential risk-related losses under these customer agreements are within acceptable limits. Factors the Company considers in determining its potential exposure under customer contracts include the fact that it typically disclaims liability for consequential and indirect damages, including for loss of data, resulting from any breach of contract and that the Company, to date, has not had to repair or replace any services or been impacted by any payout in connection with any of these guarantees. To date, the Company has not incurred any material costs as a result of these indemnification obligations and has not accrued any liabilities related to these obligations in the Consolidated Financial Statements. In addition, to date, the Company has not provided credits nor has had any agreement canceled based on its service level agreements.
Recent Accounting Pronouncements
In May 2014, the Financial Accounting Standards Board ("FASB") issued Accounting Standards Update ("ASU") 2014-09, Revenue from Contracts with Customers ("ASU 2014-09"), which outlines a single comprehensive model for entities to use in accounting for revenue. ASU 2014-09 supersedes current revenue recognition guidance and requires an entity to recognize revenue when it transfers promised goods or services to customers in an amount that reflects the consideration to which the entity expects to be entitled in exchange for those goods or services. Entities have the option of using either a full retrospective or a modified retrospective approach to adopt ASU 2014-09. In August 2015, the FASB issued ASU 2015-14, Revenue from Contracts with Customers (Topic 606): Deferral of the Effective Date. The amendment in this update deferred the effective date of implementation of ASU 2014-09 by one year so that it is now effective for annual and interim reporting periods beginning after December 15, 2017. The Company is currently evaluating the impact of the adoption of this standard on its Consolidated Financial Statements.
In June 2014, the FASB issued ASU 2014-12, Stock Compensation ("ASU 2014-12"), which provides guidance on accounting for share-based payment awards when the terms of an award provide that a performance target could be achieved after the requisite service period. ASU 2014-12 clarifies that performance targets that can be achieved after the requisite service period of a share-based payment award be treated as performance conditions that affect vesting. These awards should be accounted for under Accounting Standards Codification Topic 718, Compensation - Stock Compensation, and existing guidance should be applied as it relates to awards with performance conditions that affect vesting. ASU 2014-12 is effective for annual and interim reporting periods beginning after December 15, 2015 and will not have a material impact on the Company's Consolidated Financial Statements.
In April 2015, the FASB issued ASU 2015-03, Interest-Imputation of Interest: Simplifying the Presentation of Debt Issuance Costs ("ASU 2015-03"), which requires an entity to present debt issuance costs on the balance sheet as a direct deduction from the related liability rather than as an asset. ASU 2015-03 is effective for annual and interim reporting periods beginning after December 15, 2015. In August 2015, the FASB issued ASU 2015-15, Interest-Imputation of Interest: Presentation and Subsequent Measurement of Debt Issuance Costs Associated with Line-of-Credit Arrangements, which clarifies that the SEC staff would not object to an entity deferring and presenting debt issuance costs as an asset and subsequently amortizing the deferred debt issuance costs ratably over the term of the line-of-credit arrangement, regardless of whether there are outstanding borrowings on the line-of-credit. ASU 2015-03 will be applied on a retrospective basis and will not have a material impact on the Company's Consolidated Financial Statements.
63
In April 2015, the FASB issued ASU 2015-05, Intangibles-Goodwill and Other-Internal-Use Software: Customer’s Accounting for Fees Paid in a Cloud Computing Arrangement ("ASU 2015-05"), which provides guidance about whether a cloud computing arrangement includes a software license. If a cloud computing arrangement does not include a software license, the Company should account for the arrangement as a service contract. ASU 2015-05 is effective for annual and interim reporting periods beginning after December 15, 2015 and will not have a material impact on the Company's Consolidated Financial Statements.
In November 2015, the FASB issued ASU 2015-17, Balance Sheet Classification of Deferred Taxes ("ASU 2015-17"), which requires that all deferred tax liabilities and assets be classified as noncurrent in the consolidated balance sheet. The standard is effective for financial statements issued for annual and interim reporting periods beginning after December 15, 2016. In order to simplify the presentation of deferred taxes, the Company elected to early adopt ASU 2015-17 in the fourth quarter of 2015 and applied it retrospectively. Accordingly, prior periods have been retrospectively adjusted. As a result of the adoption of ASU 2015-17, the Company made the following adjustments to the 2014 balance sheet: a $9.6 million decrease to current deferred tax assets and a $9.6 million decrease to long-term deferred tax liabilities.
In February 2016, the FASB issued ASU 2016-02, Leases (Topic 842), which supersedes existing guidance on accounting for leases in "Leases (Topic 840)" and generally requires all leases to be recognized in the consolidated balance sheet. ASU 2016-02 is effective for annual and interim reporting periods beginning after December 15, 2018; early adoption is permitted. The provisions of ASU 2016-02 are to be applied using a modified retrospective approach. The Company is currently evaluating the impact of the adoption of this standard, if any, on its Consolidated Financial Statements.
3. Investments and Fair Value Measurements
The Company has classified its investments in corporate securities as held-to-maturity and as such, has recorded them at amortized cost. Interest earned on these debt securities is included in “Other expense, net” within the Consolidated Statements of Operations. The gross unrecognized holding gains and losses for the years ended December 31, 2015, 2014 and 2013 were not material.
The following tables summarize these investments:
December 31, 2015 | ||||||||
Security Type | Remaining Maturity | Consolidated Balance Sheet Classification | Amortized Cost | |||||
(In thousands) | ||||||||
Corporate Securities | 15 to 202 Days | Investments (current) | $ | 12,425 | ||||
December 31, 2014 | ||||||||
Security Type | Remaining Maturity | Consolidated Balance Sheet Classification | Amortized Cost | |||||
(In thousands) | ||||||||
Corporate Securities | 9 to 349 Days | Investments (current) | $ | 11,825 | ||||
Corporate Securities | 380 to 567 Days | Investments (non-current) | 12,630 | |||||
Total | $ | 24,455 | ||||||
The Company categorizes its financial instruments measured at fair value into a three-level fair value hierarchy that prioritizes the inputs used in determining the fair value of the asset or liability. The three levels of the fair value hierarchy are as follows:
• | Level 1: Fair value measurement of the asset or liability using observable inputs such as quoted prices in active markets for identical assets or liabilities; |
• | Level 2: Fair value measurement of the asset or liability using inputs other than quoted prices that are observable for the applicable asset or liability, either directly or indirectly, such as quoted prices for similar (as opposed to identical) assets or liabilities in active markets and quoted prices for identical or similar assets or liabilities in markets that are not active; and |
64
• | Level 3: Fair value measurement of the asset or liability using unobservable inputs that reflect the Company’s own assumptions regarding the applicable asset or liability. |
The following tables present the Company's financial instruments that are measured at fair value on a recurring basis:
December 31, 2015 | ||||||||||||||||
Total | Level 1 | Level 2 | Level 3 | |||||||||||||
(In thousands) | ||||||||||||||||
Asset: | ||||||||||||||||
Money market funds as cash equivalents | $ | 17,143 | $ | 17,143 | $ | — | $ | — | ||||||||
December 31, 2014 | ||||||||||||||||
Total | Level 1 | Level 2 | Level 3 | |||||||||||||
(In thousands) | ||||||||||||||||
Asset: | ||||||||||||||||
Money market funds as cash equivalents | $ | 13,851 | $ | 13,851 | $ | — | $ | — | ||||||||
The Company's non-financial assets, which include goodwill, intangible assets, fixed assets, capitalized software and cost method investments, are adjusted to fair value only when an impairment charge is recognized. These fair value measurements are based predominantly on Level 3 inputs.
At December 31, 2015 and December 31, 2014, the carrying values of the Company's investments accounted for under the cost method totaled $4.5 million and $3.5 million, respectfully, and are included in "Other non-current assets" on the Company's Consolidated Balance Sheets.
4. Goodwill and Other Intangibles
Acquisitions
On April 23, 2014, the Company acquired all of the outstanding shares of docTrackr, Inc., a provider of document security solutions, for a total consideration of $10.5 million in cash, of which, $1.5 million was subject to a holdback to cover any post-closing indemnification claims by the Company. The holdback was released in two installments, the first in the amount of $0.5 million paid in April 2015 and the second in the amount of $1.0 million paid in October 2015. This transaction was accounted for as a business combination under the acquisition method. Assets acquired and liabilities assumed were recorded at fair value and the results of docTrackr, Inc. have been included within the Company’s Consolidated Financial Statements since the date of the acquisition. Pro forma financial information related to this acquisition was not included because the impact on the Company's Consolidated Financial Statements was not considered to be material. The purchase price was allocated among tangible and intangible assets and liabilities as follows: net tangible assets of $0.1 million, developed technology of $1.9 million with an estimated useful life of 5 years, non-compete agreements of $0.3 million with an estimated useful life of 3 years, a net deferred tax liability of $0.3 million and goodwill of $8.5 million. The weighted average useful life for the intangible assets is 4.7 years. The goodwill acquired is not deductible for tax purposes.
Goodwill
At December 31, 2015 and December 31, 2014, the Company had $224.4 million of goodwill. Goodwill is assessed for impairment annually as of October 1 or more frequently if an event occurs or circumstances change that would more likely than not reduce the fair value of a reporting unit below its carrying value. The goodwill impairment test is based on the Company's single operating segment and reporting unit structure.
The Company completed a qualitative impairment assessment as of October 1, 2015. Among the factors included in the Company's qualitative assessment were general economic conditions and the competitive environment, actual and expected financial performance, including consideration of the Company's revenue growth year-over-year, forward-looking business measurements, external market conditions, market capitalization, and other relevant entity-specific events. Based on the results of the qualitative assessment, the Company concluded that it is more likely than not that the fair value of its single operating segment and reporting unit is higher than its carrying value, and therefore performance of the quantitative impairment test was not necessary.
65
At December 31, 2015, other intangibles consisted of the following:
Definite – Lived Intangible Assets | ||||||||||||
Gross Carrying Value | Accumulated Amortization | Net Carrying Value | ||||||||||
(In thousands) | ||||||||||||
Customer relationships | $ | 141,973 | $ | (121,141 | ) | $ | 20,832 | |||||
Developed technology | 134,542 | (121,634 | ) | 12,908 | ||||||||
Trade name | 14,629 | (10,416 | ) | 4,213 | ||||||||
Non-compete agreements | 1,337 | (1,184 | ) | 153 | ||||||||
Total | $ | 292,481 | $ | (254,375 | ) | $ | 38,106 | |||||
At December 31, 2014, other intangibles consisted of the following:
Definite – Lived Intangible Assets | ||||||||||||
Gross Carrying Value | Accumulated Amortization | Net Carrying Value | ||||||||||
(In thousands) | ||||||||||||
Customer relationships | $ | 141,973 | $ | (106,944 | ) | $ | 35,029 | |||||
Developed technology | 134,542 | (113,303 | ) | 21,239 | ||||||||
Trade name | 14,629 | (9,198 | ) | 5,431 | ||||||||
Non-compete agreements | 1,337 | (981 | ) | 356 | ||||||||
Total | $ | 292,481 | $ | (230,426 | ) | $ | 62,055 | |||||
The Company has not identified impairment for any of its definite-lived intangible assets through December 31, 2015.
Intangible amortization expense is classified in each of the operating expense categories as follows:
Years Ended December 31, | ||||||||||||
2015 | 2014 | 2013 | ||||||||||
(In thousands) | ||||||||||||
Cost of revenue | $ | 8,331 | $ | 8,206 | $ | 8,136 | ||||||
Sales and marketing | 14,197 | 14,195 | 14,198 | |||||||||
General and administrative | 1,421 | 1,390 | 1,310 | |||||||||
Total | $ | 23,949 | $ | 23,791 | $ | 23,644 | ||||||
66
At December 31, 2015, amortization expense on an annual basis for the succeeding five years and thereafter is estimated to be as follows:
For the years ending December 31, | Amount | |||
(In thousands) | ||||
2016 | $ | 23,866 | ||
2017 | 11,799 | |||
2018 | 1,629 | |||
2019 | 716 | |||
2020 | 31 | |||
Thereafter | 65 | |||
Total | $ | 38,106 | ||
5. Fixed Assets
Fixed assets consisted of the following:
December 31, | ||||||||
2015 | 2014 | |||||||
(In thousands) | ||||||||
Computer equipment and software | $ | 37,200 | $ | 29,029 | ||||
Furniture, fixtures and office equipment | 3,058 | 3,683 | ||||||
Leasehold improvements | 6,213 | 6,948 | ||||||
Total fixed assets | 46,471 | 39,660 | ||||||
Less: Accumulated depreciation and amortization | (25,682 | ) | (23,415 | ) | ||||
Fixed assets, net | $ | 20,789 | $ | 16,245 | ||||
Depreciation expense is classified in each of the operating expense categories as follows:
Years Ended December 31, | ||||||||||||
2015 | 2014 | 2013 | ||||||||||
(In thousands) | ||||||||||||
Cost of revenue | $ | 4,762 | $ | 3,543 | $ | 2,860 | ||||||
Sales and marketing | 1,246 | 1,206 | 799 | |||||||||
General and administrative | 1,009 | 1,030 | 758 | |||||||||
Product development | 573 | 819 | 731 | |||||||||
Total | $ | 7,590 | $ | 6,598 | $ | 5,148 | ||||||
67
6. Capitalized Software
Capitalized software consisted of the following:
December 31, | ||||||||
2015 | 2014 | |||||||
(In thousands) | ||||||||
Capitalized internal-use software development costs | $ | 146,261 | $ | 120,268 | ||||
Less: Accumulated amortization | (99,625 | ) | (80,470 | ) | ||||
Capitalized software, net | $ | 46,636 | $ | 39,798 | ||||
Amortization expense is classified in each of the operating expense categories as follows:
Years Ended December 31, | ||||||||||||
2015 | 2014 | 2013 | ||||||||||
(In thousands) | ||||||||||||
Cost of revenue | $ | 18,508 | $ | 17,730 | $ | 14,777 | ||||||
Sales and marketing | 162 | 323 | 206 | |||||||||
General and administrative | 489 | 976 | 733 | |||||||||
Total | $ | 19,159 | $ | 19,029 | $ | 15,716 | ||||||
7. Accrued Expenses and Other Current Liabilities
Accrued expenses and other current liabilities consisted of the following:
December 31, | ||||||||
2015 | 2014 | |||||||
(In thousands) | ||||||||
Accrued employee compensation and related expenses | $ | 17,133 | $ | 15,687 | ||||
Other accrued expenses | 12,723 | 11,287 | ||||||
Total accrued expenses and other current liabilities | $ | 29,856 | $ | 26,974 | ||||
8. Income Tax
The following is a summary of the Company's U.S. and non-U.S. net (loss) income before income tax:
Years Ended December 31, | |||||||||||
2015 | 2014 | 2013 | |||||||||
(In thousands) | |||||||||||
U.S. | $ | (34,567 | ) | $ | (33,079 | ) | $ | (25,741 | ) | ||
Non-U.S. | 5,028 | 4,818 | 5,114 | ||||||||
Net loss before income tax | $ | (29,539 | ) | $ | (28,261 | ) | $ | (20,627 | ) | ||
68
The components of the Company's income tax expense (benefit) are as follows:
Years Ended December 31, | |||||||||||
2015 | 2014 | 2013 | |||||||||
(In thousands) | |||||||||||
Current: | |||||||||||
Federal | $ | 63 | $ | 181 | $ | 220 | |||||
State and local | 12 | (42 | ) | 626 | |||||||
Foreign | 1,727 | 2,804 | 2,143 | ||||||||
Total current income tax expense | 1,802 | 2,943 | 2,989 | ||||||||
Deferred: | |||||||||||
Federal | (387 | ) | (4,248 | ) | (6,640 | ) | |||||
State and local | (56 | ) | (487 | ) | (1,483 | ) | |||||
Foreign | (514 | ) | 27 | (215 | ) | ||||||
Total deferred income tax benefit | (957 | ) | (4,708 | ) | (8,338 | ) | |||||
Total income tax expense (benefit) | $ | 845 | $ | (1,765 | ) | $ | (5,349 | ) | |||
A reconciliation of the provision for income taxes at the U.S. Federal statutory income tax rate of 35% to the Company's effective income tax rate is as follows:
Years Ended December 31, | |||||||||||
2015 | 2014 | 2013 | |||||||||
(In thousands) | |||||||||||
Tax at U.S. Federal statutory rate of 35% | $ | (10,339 | ) | $ | (9,891 | ) | $ | (7,219 | ) | ||
State taxes, net of federal income tax effect | (1,987 | ) | (1,186 | ) | (557 | ) | |||||
Stock-based compensation expense | 211 | 622 | 1,886 | ||||||||
Non-deductible expenses | 1,251 | 759 | 438 | ||||||||
Foreign taxes | 795 | 2,043 | 1,348 | ||||||||
Research and development credit | (984 | ) | (647 | ) | (1,008 | ) | |||||
Other | 138 | 88 | (237 | ) | |||||||
Valuation allowance | 11,760 | 6,447 | — | ||||||||
Total income tax expense (benefit) | $ | 845 | $ | (1,765 | ) | $ | (5,349 | ) | |||
Effective tax rate | (2.9 | )% | 6.2 | % | 25.9 | % | |||||
69
Following is a summary of the components of deferred tax assets and deferred tax liabilities at December 31, 2015 and 2014:
Years Ended December 31, | |||||||
2015 | 2014 | ||||||
(In thousands) | |||||||
Deferred tax assets: | |||||||
Net operating loss carryforwards | $ | 7,975 | $ | 10,008 | |||
Research and development tax credit carryforwards | 9,652 | 8,185 | |||||
Stock-based compensation | 6,723 | 5,529 | |||||
Accrued expenses | 4,629 | 4,108 | |||||
AMT tax credit carryforwards | 1,790 | 1,727 | |||||
Allowance for doubtful accounts | 1,660 | 1,264 | |||||
Other | 4,613 | 4,275 | |||||
Total deferred tax assets | 37,042 | 35,096 | |||||
Valuation allowance | (19,576 | ) | (6,447 | ) | |||
Deferred tax assets, net of valuation allowance | 17,466 | 28,649 | |||||
Deferred tax liabilities: | |||||||
Depreciation and amortization | (16,952 | ) | (28,649 | ) | |||
Total deferred tax liabilities | (16,952 | ) | (28,649 | ) | |||
Net deferred tax assets, net of valuation allowance | $ | 514 | $ | — | |||
At December 31, 2015, the Company had net operating loss carryforwards of $38.5 million, including $16.9 million of windfall tax benefits attributable to stock-based compensation. If not utilized, these net operating loss carryforwards will expire beginning in 2022 through 2033. The windfall tax benefits attributable to stock-based compensation will be recorded to additional paid-in capital when such amounts reduce income taxes payable. At December 31, 2015, the Company had U.S. Federal and state research and development tax credit carryforwards of $10.3 million and $5.5 million, respectively, which if not utilized, will expire beginning in 2018 through 2035.
During the fourth quarter of 2014, the Company determined that it was more-likely-than-not that it would not realize its net deferred tax asset position and recorded a valuation allowance on its net deferred tax assets of $6.4 million. The assessment regarding whether a valuation allowance is required considers both positive and negative evidence when determining whether it is more-likely-than-not that deferred tax assets are recoverable. In making this assessment, significant weight is given to evidence that can be objectively verified. In its evaluation, the Company considered its cumulative loss in recent years and its forecasted losses in the near-term as significant negative evidence. The Company determined that the negative evidence outweighed the positive evidence and a valuation allowance on its net deferred tax assets was established. At December 31, 2015, the Company continues to maintain a full valuation allowance on its net U.S. deferred tax assets. Further, in the fourth quarter of 2015, the Company released the valuation allowance of $0.5 million on its foreign net deferred tax assets after determining the positive evidence outweighed the negative evidence, primarily due to the profitability of its foreign operations. The Company will continue to assess the realizability of its deferred tax assets going forward and will adjust the valuation allowance as needed.
Under the provisions of Sections 382 and 383 of the Internal Revenue Code of 1986, as amended (the "IRC"), substantial changes in the Company's or its subsidiaries' ownership may limit the amount of net operating loss and research tax credit carryforwards that can be utilized annually in the future to offset taxable income. Due to ownership changes in 2001, 2007 and 2011, the Company's net operating loss and research and development tax credit carryforwards are subject to limitations pursuant to IRC Sections 382 and 383 and similar state provisions.
70
The following table summarizes changes to the Company's unrecognized tax benefits, excluding interest and penalties:
Years Ended December 31, | |||||||||||
2015 | 2014 | 2013 | |||||||||
(In thousands) | |||||||||||
Balance as of January 1 | $ | 4,688 | $ | 3,945 | $ | 3,335 | |||||
Additions based on tax positions related to the current year | 685 | 540 | 389 | ||||||||
Additions for prior year tax positions | 168 | 289 | 221 | ||||||||
Reductions from expirations of applicable statutes of limitations | (80 | ) | (86 | ) | — | ||||||
Balance as of December 31 | $ | 5,461 | $ | 4,688 | $ | 3,945 | |||||
If recognized, unrecognized tax benefits totaling $4.6 million ($0.6 million net of the impact of the Company's valuation allowance) at December 31, 2015 would impact our effective income tax rate.
At December 31, 2015, total accrued interest and penalties related to the uncertain tax positions was $0.5 million, which includes $0.05 million, $0.3 million, and $0.03 million recorded during the years ended December 31, 2015, 2014 and 2013, respectively. These amounts were recorded as part of income tax expense during the respective periods.
As a result of prior year net operating losses, the Company's U.S. Federal income tax returns for years 1999 through 2014 are open for examination by the U.S. Internal Revenue Service (the "IRS"). In addition, the Company's state and local income tax returns for 2012 through 2015 remain subject to examination by various state and local taxing authorities. The Company's non-U.S. income tax returns are also subject to income tax examination in various foreign jurisdictions.
The Company is routinely under audit by federal, state, local and foreign tax authorities in the area of income tax. These audits include questioning the timing and the amount of income and deductions and the allocation of income and deductions among various tax jurisdictions. The IRS is currently auditing the Company’s federal tax returns for the years ended December 31, 2010 and 2011. Various other jurisdictions are open to examination for various tax years. Management believes it has adequately provided for all uncertain tax positions and any potential audit adjustments would not have a material impact on the Company’s liquidity, results of operations or financial condition.
9. Debt
Long-term debt consisted of the following:
December 31, | ||||||||
2015 | 2014 | |||||||
(In thousands) | ||||||||
Term Loan Credit Facility | $ | 78,600 | $ | 79,400 | ||||
Equipment Loan Facility | 4,719 | — | ||||||
Term Loans original issue discount | (507 | ) | (667 | ) | ||||
Other financing arrangements | — | 106 | ||||||
Total debt | 82,812 | 78,839 | ||||||
Less: current portion (Term Loan Credit Facility) | (800 | ) | (800 | ) | ||||
Less: current portion (Equipment Loan Facility) | (1,511 | ) | — | |||||
Less: current portion (Other financing arrangements) | $ | — | (106 | ) | ||||
Total long-term debt | $ | 80,501 | $ | 77,933 | ||||
Based on available market information, the estimated fair value of the Company’s long-term debt was $81.0 million and $78.7 million as of December 31, 2015 and December 31, 2014, respectively. These fair value measurements were determined using Level 2 observable inputs, as defined in Note 3 - "Investments and Fair Value Measurement."
Term Loan and Revolving Credit Facilities
71
On February 24, 2014, the Company refinanced all of the outstanding indebtedness under its prior credit facility with the proceeds of its Term Loan Credit Facility. The Term Loan Credit Facility provides for an $80.0 million, five-year term loan and bears interest at a base rate (as defined in the Term Loan Credit Facility) plus a margin of 5.25% per annum with a 2.00% floor for an effective interest rate 7.25%. There is a $0.2 million principal payment due on the last day of each quarter, which commenced on June 30, 2014, with the balance due in a final installment on February 24, 2019.
On February 24, 2014, the Company also entered into a Revolving Credit Facility that provides for commitments of up to $15.0 million for general corporate purposes, working capital, certain investments, acquisitions and letters of credit. Loan drawings under the Revolving Credit Facility are subject to a further cap based on the Company’s borrowing base, which is equal to 85% of its eligible accounts receivable, minus customary reserves established by the Company’s lender. In addition, following the June 2014 amendment of this facility, up to 50% of the Company's eligible accounts receivable can be made up of account debtors of the Company based in certain European countries. Loans under the Revolving Credit Facility bear interest at the Eurodollar rate plus 2.50%. Further, following the November 2015 amendment of this facility, the Company may request letters of credit from the lender in certain currencies other than the U.S. Dollar, with all amounts payable under the Revolving Credit Facility, including principal, interest, reimbursement obligations and fees, remaining payable in U.S. Dollars. Under the Revolving Credit Facility, the Company pays a commitment fee in arrears on the first business day of each fiscal quarter of 0.50% on the average daily unused balance for the preceding quarter under this facility. The Revolving Credit Facility matures and the commitments thereunder terminate on the earlier of February 24, 2019 or the date that is six months prior to the maturity date of the Term Loan Credit Facility. Available borrowings under the Revolving Credit Facility are reduced by any outstanding letters of credits issued on behalf of the Company under this facility. As of December 31, 2015, the Company had $2.9 million in outstanding letters of credit issued under its Revolving Credit Facility.
Debt issuance costs of approximately $2.8 million related to the Term Loan Credit Facility and the Revolving Credit Facility (collectively, the "Credit Facilities") were deferred and are being amortized on a straight-line basis over the term of the loans. At December 31, 2015, unamortized debt issuance costs of $0.6 million and $1.2 million were recorded within "Other current assets" and "Other non-current assets," respectively, on the Consolidated Balance Sheet.
Each of the Credit Facilities is secured by liens on substantially all of the Company's assets. The Revolving Credit Facility is secured by a first lien on cash, accounts receivable and certain other liquid collateral and a second lien on other assets. The Term Loan Credit Facility is secured by a second lien on cash, accounts receivable and certain other liquid collateral and a first lien on other assets.
The Credit Facilities include covenants that restrict certain activities by the Company, as well as require the Company to comply with certain financial ratios such as a Consolidated Net Leverage Ratio and a springing Fixed Charge Coverage Ratio, as these terms are defined in the agreements governing the Credit Facilities. The agreements governing the Credit Facilities also contain other affirmative and negative covenants with which the Company is required to comply. The Term Loan Credit Facility requires partial prepayment of a portion of the principal outstanding in the event that the company generates Consolidated Excess Cash Flow (as defined under the Term Loan Credit Facility) in excess of a certain threshold. This determination is to be made 90 days following the end of the preceding fiscal year, with any payment, if required 105 days following the end of the preceding fiscal year. The Company was in compliance with all applicable covenants set forth in the Credit Facilities and there was no required prepayment as of December 31, 2015.
Prior Credit Facility
The Prior Credit Facility provided for term loans in the aggregate principal amount of $135.0 million and included a requirement for mandatory prepayments based on annual excess free cash flow. Term loans under the Prior Credit Facility bore interest at the higher of the Eurodollar Rate (as defined in the credit agreement) or 1.50%, plus 4.50% per annum. At December 31, 2013, the interest rate on the Prior Credit Facility was 6.00%.
In June 2013, obligations previously covered by a revolving line of credit previously available to the Company, which were primarily related to the Company's operating lease agreements for its various office locations, were replaced under a separate cash collateralized facility under which the Company originally provided the bank with $2.5 million and the bank provided the landlords of certain of the Company's leased locations with separate letters of credit. This facility expired on June 3, 2014 and the cash collateral balance related to this facility (which had been classified as "Restricted cash" on the Company's Consolidated Balance Sheet) of $2.4 million was returned to the Company in June 2014.
72
Equipment Loan Facility
In October 2015, the Company entered into a Note and Security Agreement ("Equipment Loan Facility") in the ordinary course of business to purchase certain fixed assets. The Equipment Loan Facility provides for a $4.7 million three-year secured term loan and bears an interest rate of 4.00%, which will be repaid quarterly in arrears in equal installments, commencing January 31, 2016 with the balance due in a final installment on October 31, 2018. The Equipment Loan Facility is secured by liens on the equipment financed under that facility. An uncured default under the Equipment Loan Facility would result in a cross-default under the Term Loan Credit Facility and the Revolving Credit Facility.
Other Financing Arrangements
In June 2011, the Company entered into a financing arrangement in the ordinary course of business to purchase certain software and related services in the amount of $1.2 million, including financing costs of $0.1 million repaid over a 50-month period ended in July 2015. In December 2011, the Company entered into another financing arrangement in the ordinary course of business, to purchase support and maintenance for existing software licenses in the amount of $0.2 million repaid over a 25-month period ended January 2014.
10. Common Stock
As of December 31, 2015, the Company had 300.0 million shares of common stock, par value $0.001 per share ("common stock"), authorized, with 58.4 million shares of common stock issued and outstanding. The number of authorized shares of common stock may be increased or decreased (but not below the number of shares then outstanding) by the affirmative vote of holders representing at least 75% in interest of the issued and outstanding shares of the Company's common stock.
As of December 31, 2015, entities affiliated with TA Associates, L.P. and Rho Capital Partners, Inc. held 15.6 million shares of the Company's common stock and have the right to require the Company to register these shares under the Securities Act of 1933, as amended, pursuant to a registration rights agreement.
11. Employee Stock Plans
2010 Equity Incentive Plan
The Company currently has one active plan under which awards have been granted. The 2010 Equity Incentive Plan was adopted by the Company's board of directors in March 2010 and approved by its stockholders in July 2010. In addition, the 2010 Equity Incentive Plan was amended by the Company’s board of directors and stockholders in 2012 and in 2014 to increase the number of shares of common stock authorized for issuance. The 2010 Equity Incentive Plan permits the Company to make grants of stock options (both incentive stock options and non-qualified stock options), stock appreciation rights, restricted stock, restricted stock units, unrestricted stock, cash-based awards, performance shares and dividend equivalent rights to its executives, employees, non-employee directors and consultants. Generally, shares that are forfeited or canceled from awards under the 2010 Equity Incentive Plan, the 2007 Stock Option and Grant Plan and the 2007 Restricted Preferred Stock Plan also will be available for future awards under the 2010 Equity Incentive Plan. In May 2012, the Company's board of directors adopted a U.K. sub plan to the 2010 Equity Incentive Plan, which was subsequently approved by the HM Revenue and Customs in November 2012. The U.K. sub plan provides for the issuance to U.K. residents of options to acquire shares of the Company's common stock. Further, the U.K. sub plan provides that if recipients exercise their options in an approved manner that meets the requirements of the U.K. sub plan, they will receive favorable tax treatment. At December 31, 2015, the Company had stock options outstanding under the 2007 Stock Option and Grant Plan, and no awards outstanding under the 2007 Restricted Preferred Stock Plan. No additional grants will be made under these plans.
At December 31, 2015, there were 2,605,034 shares of common stock available for future grants under the 2010 Equity Incentive Plan.
Stock options granted under the 2010 Equity Incentive Plan typically have a 10-year contractual term and vest over four years, with 25% of the award vesting after one year and the balance vesting ratably over the subsequent 36 months. Prior to February 2013, stock options that were granted under the 2010 Equity Incentive Plan typically had a 10-year contractual term and vested over four years and 6 months, with 25% of the award vesting after one year and the balance vesting ratably over the subsequent 42 months.
73
Stock-based compensation expense related to all of the Company’s stock awards is included in operating expense categories, as follows:
Years Ended December 31, | ||||||||||||
2015 | 2014 | 2013 | ||||||||||
(In thousands) | ||||||||||||
Cost of revenue | $ | 491 | $ | 523 | $ | 692 | ||||||
Sales and marketing | 1,990 | 1,920 | 1,320 | |||||||||
General and administrative | 7,663 | 6,390 | 4,998 | |||||||||
Product development | 1,416 | 1,551 | 1,276 | |||||||||
Total | $ | 11,560 | $ | 10,384 | $ | 8,286 | ||||||
The total income tax benefit recorded for the years ended December 31, 2015, 2014 and 2013 related to stock-based compensation is $4.3 million, $3.7 million and $2.8 million, respectively. However, for the years ended December 31, 2015 and 2014, the income tax benefit was offset by the valuation allowance and therefore had no impact on the Consolidated Statements of Operations.
Stock Options
The following table summarizes the weighted average values of the assumptions used in the Black-Scholes pricing model to estimate the fair value of the stock options granted during the period presented:
Years Ended December 31, | ||||||
2015 | 2014 | 2013 | ||||
Expected volatility | 45.1% | 51.1% | 52.1% | |||
Expected life of option | 6.25 years | 6.21 years | 6.09 years | |||
Risk free interest rate | 1.8% | 1.9% | 1.3% | |||
Expected dividend yield | 0.0% | 0.0% | 0.0% | |||
The following table summarizes stock option activity for the year ended December 31, 2015:
Shares | Weighted Average Exercise Price | ||||||
Outstanding at December 31, 2014 | 4,688,256 | $ | 6.87 | ||||
Granted | 569,523 | 10.95 | |||||
Exercised | (776,293 | ) | 5.31 | ||||
Forfeited | (402,860 | ) | 9.19 | ||||
Outstanding at December 31, 2015 | 4,078,626 | $ | 7.51 | ||||
74
The following table contains additional information with respect to options outstanding and exercisable at December 31, 2015:
Options Outstanding | Options Exercisable | |||||||||
Number of Options Outstanding | Remaining Weighted Average Life | Number Exercisable | Remaining Weighted Average Life | |||||||
Exercise Prices: | ||||||||||
$1.59 - $4.73 | 632,802 | 5.22 | 527,220 | 4.95 | ||||||
$5.14 - $7.89 | 2,184,342 | 6.23 | 1,987,882 | 6.15 | ||||||
$8.08 - $11.91 | 983,661 | 8.91 | 207,351 | 8.16 | ||||||
$13.00 - $25.89 | 277,821 | 4.81 | 277,821 | 4.81 | ||||||
4,078,626 | 3,000,274 | |||||||||
At December 31, 2015, the aggregate intrinsic value of stock options outstanding and exercisable was $9.8 million and $8.7 million, respectively. At December 31, 2014, the aggregate intrinsic value of stock options outstanding and exercisable was $25.5 million and $16.0 million, respectively. The intrinsic value for stock options is calculated based on the exercise price of the underlying awards and the share price of such awards as of each respective period-end date.
The following table summarizes non-vested stock option activity for the year ended December 31, 2015:
Shares | Weighted Average Grant Date Fair Value | ||||||
Non-vested options outstanding at December 31, 2014 | 1,862,787 | $ | 3.62 | ||||
Granted | 569,523 | 5.03 | |||||
Vested | (1,014,854 | ) | 3.59 | ||||
Forfeited | (339,104 | ) | 3.75 | ||||
Non-vested options outstanding at December 31, 2015 | 1,078,352 | $ | 4.34 | ||||
The following table provides additional information pertaining to the Company's stock options:
Years Ended December 31, | |||||||||||
2015 | 2014 | 2013 | |||||||||
Weighted average grant date fair value for options granted during the period | $ | 5.03 | $ | 4.86 | $ | 3.55 | |||||
Total fair value of options vested (in thousands) | $ | 3,647 | $ | 4,325 | $ | 4,968 | |||||
The intrinsic value of options exercised for the years ended December 31, 2015, 2014 and 2013, was $4.4 million, $2.5 million and $1.0 million, respectively.
At December 31, 2015 and 2014, there was $4.0 million and $6.0 million, respectively, of total unrecognized compensation cost related to non-vested stock options, net of estimated forfeitures, which is expected to be recognized over a weighted average period of 2.70 years and 2.19 years, respectively.
Cash received from stock option exercises and the related tax benefit realized for the years ended December 31, 2015, 2014 and 2013 are: $4.1 million and $0.8 million; $2.4 million and $0.5 million; and $1.6 million and $0.3 million, respectively. However, for the years ended December 31, 2015 and 2014, the income tax benefit was offset by the valuation allowance and therefore had no impact on the Consolidated Statements of Operations.
Restricted Stock Awards
The following table summarizes RSA activity for the year ended December 31, 2015:
75
Shares | Weighted Average Grant Date Fair Value | ||||||
Non-vested RSAs at December 31, 2014 | 564,652 | $ | 4.69 | ||||
Granted | 78,448 | 10.83 | |||||
Vested and exchanged for common stock | (80,164 | ) | 8.73 | ||||
Non-vested RSAs at December 31, 2015 | 562,936 | $ | 4.97 | ||||
For the year ended December 31, 2015, 2014 and 2013, the weighted-average grant date fair value for RSAs was $10.83, $8.12 and $9.19, respectively. The fair value of RSAs vested was $0.8 million, $0.7 million and $0.7 million, respectively, during the same periods.
The aggregate intrinsic value of RSAs outstanding at December 31, 2015 and 2014 was $5.1 million and $6.7 million, respectively. The intrinsic value for RSAs is calculated based on the market price of the Company’s stock as of each period-end date.
At December 31, 2015 and 2014, there was $0.5 million and $0.5 million, respectively, of total unrecognized compensation cost related to non-vested RSAs, net of estimated forfeitures, which is expected to be recognized over a weighted average period of 1.2 years and 0.7 years, respectively.
Certain of the RSAs granted to the Company's Chief Executive Officer in 2012 vest based upon the achievement of specified stock performance and service thresholds. The Company performed a Monte-Carlo simulation to calculate the award’s fair value of $2.1 million and derived service period of 3.80 years. The assumptions used to perform the Monte-Carlo simulation were consistent with those utilized in the Company’s Black-Scholes valuations for stock options.
Restricted Stock Units
The following table summarizes RSU activity for the year ended December 31, 2015:
Shares | Weighted Average Grant Date Fair Value | ||||||
Non-vested RSUs at December 31, 2014 | 1,765,905 | $ | 8.47 | ||||
Granted | 1,332,404 | 9.51 | |||||
Vested | (582,086 | ) | 8.29 | ||||
Forfeited | (484,021 | ) | 9.25 | ||||
Non-vested RSUs at December 31, 2015 | 2,032,202 | $ | 8.97 | ||||
For the years ended December 31, 2015, 2014 and 2013, the weighted-average grant date fair value for RSUs was $9.51, $9.22 and $7.36, respectively. The fair value of RSUs vested was $6.0 million, $4.6 million, and $1.5 million, respectively, during the same periods.
The aggregate intrinsic value of RSUs outstanding at December 31, 2015 and 2014 was $18.4 million and $21.0 million, respectively. The intrinsic value for RSUs is calculated based on the market price of the Company's stock as of each period-end date.
At December 31, 2015 and 2014, there was $12.9 million and $11.3 million, respectively, of total unrecognized compensation cost related to non-vested RSUs, net of estimated forfeitures, which is expected to be recognized over a weighted average period of 2.49 years and 2.71 years, respectively.
During 2015, the Company granted 582,026 restricted stock units with market conditions pursuant to the Company's 2010 Equity Incentive Plan. Vesting of these awards is based upon the achievement of specified stock performance and service thresholds. The Company performed a Monte-Carlo simulation to calculate the awards' grant date fair values of $4.3 million, which will be recognized over the requisite service periods. During 2015, 128,200 of these restricted stock units, which had a grant date fair value of $1.1 million, were forfeited as a result of changes to the Company's executive leadership team.
In 2014, the Company granted RSUs to certain individuals in connection with the acquisition of docTrackr, Inc. The aggregate grant date fair value of these equity awards was $2.1 million. Of the awards granted, 83,914 of these RSUs were to non-employees and, accordingly, these awards were remeasured at fair value as of each reporting period until they became employees during the
76
year ended December 31, 2015. Two awards began vesting in 2015 upon achievement of specified performance conditions. Vesting of the remaining awards is contingent upon continued service over a three-year period.
Modification of Awards
During the year ended December 31, 2015, pursuant to separation agreements for two executives, the Company extended the exercise and vesting terms for certain outstanding equity awards beyond the individuals’ original agreements, resulting in modification of the awards for accounting purposes. As a result of the modified awards, the Company recorded an additional $0.3 million in stock-based compensation expense, which was offset by the reversal of $0.3 million of stock-based compensation expense related to the forfeiture of unvested awards.
During the years ended December 31, 2014 and December 31, 2013, no awards were modified.
2010 Employee Stock Purchase Plan
The ESPP was adopted by the Company's board of directors and approved by its stockholders in July 2010 and subsequently amended by the Company's board of directors and stockholders in 2013. The number of shares available for purchase under the ESPP is 1,000,000. The Company makes one or more offerings each year to its employees to purchase stock under the ESPP, usually beginning on the first business day of the quarter and ending on the last business day of the quarter. For employees eligible to participate on the first date of an offering period, the purchase price of shares of common stock under the ESPP is 85% of the fair market value of the shares, either on the offering date or the exercise date, whichever is less. As of December 31, 2015, there are 1,000,000 shares of common stock reserved, 665,523 shares issued and 334,477 shares available for future issuance under the ESPP.
12. Net Loss per Share
The following table provides a reconciliation of the numerator and denominator used in computing basic and diluted net loss per common share:
Years Ended December 31, | ||||||||||||
2015 | 2014 | 2013 | ||||||||||
Numerator: | ||||||||||||
Net loss (in thousands) | $ | (30,384 | ) | $ | (26,496 | ) | $ | (15,278 | ) | |||
Denominator: | ||||||||||||
Weighted-average shares used to compute basic net loss per share | 57,172,659 | 55,932,641 | 55,135,657 | |||||||||
Effect of dilutive options, unvested shares of restricted stock awards and unvested restricted stock units | — | — | — | |||||||||
Weighted-average shares used to compute diluted net income loss per share | 57,172,659 | 55,932,641 | 55,135,657 | |||||||||
Net loss per share: | ||||||||||||
Basic | $ | (0.53 | ) | $ | (0.47 | ) | $ | (0.28 | ) | |||
Diluted | $ | (0.53 | ) | $ | (0.47 | ) | $ | (0.28 | ) | |||
The following outstanding options to purchase Common Stock, unvested shares under RSAs and unvested shares issuable upon settlement of RSUs were excluded from the computation of diluted net loss per share for the periods presented as their effect would have been anti-dilutive:
Years Ended December 31, | |||||||||
2015 | 2014 | 2013 | |||||||
Options to purchase common stock | 4,078,626 | 4,688,256 | 5,210,384 | ||||||
Unvested shares of restricted stock awards | 562,936 | 564,652 | 557,982 | ||||||
Unvested shares of restricted stock units | 2,032,202 | 1,765,905 | 1,198,290 | ||||||
77
13. Segment and Geographic Information
The Company is a single operating segment and reporting unit. The Company's chief operating decision maker reviews financial information presented on a consolidated basis, accompanied by certain revenue metrics and trends by the following principal markets:
• | Mergers & Acquisitions ("M&A") comprises customers spanning a variety of industries, including financial services, pharmaceutical, manufacturing, biotechnology, consumer, energy, telecommunications, industrial, legal, professional services, insurance and technology who use the Intralinks Platform for project-based transactions, such as mergers, acquisitions and dispositions. These customers are typically referred to the Company by financial or legal advisors involved in the respective transactions. |
• | Enterprise comprises customers, across the same variety of industries described above, who use the Intralinks Platform for a wide range of corporate purposes. |
• | Debt Capital Markets ("DCM") comprises customers within the financial services industry who use the Intralinks Platform for loan syndication and administration and other debt-related transactions. |
The following table sets forth the Company's revenue by principal market:
Years Ended December 31, | ||||||||||||
2015 | 2014 | 2013 | ||||||||||
(In thousands) | ||||||||||||
M&A | $ | 139,917 | $ | 130,471 | $ | 110,456 | ||||||
Enterprise | 106,683 | 96,711 | 95,246 | |||||||||
DCM | 29,553 | 28,639 | 28,794 | |||||||||
Total revenue | $ | 276,153 | $ | 255,821 | $ | 234,496 | ||||||
Revenue by geographic location is based on where the customer is located. Revenue and long-lived assets by geographic location are as follows:
Years Ended December 31, | ||||||||||||
2015 | 2014 | 2013 | ||||||||||
(In thousands) | ||||||||||||
Revenue: | ||||||||||||
U.S. | $ | 163,831 | $ | 146,317 | $ | 137,603 | ||||||
All other countries | 112,322 | 109,504 | 96,893 | |||||||||
Total | $ | 276,153 | $ | 255,821 | $ | 234,496 | ||||||
Years Ended December 31, | ||||||||
2015 | 2014 | |||||||
(In thousands) | ||||||||
Long-lived assets (fixed assets and capitalized software): | ||||||||
U.S. | $ | 65,612 | $ | 54,380 | ||||
All other countries | 1,813 | 1,663 | ||||||
Total | $ | 67,425 | $ | 56,043 | ||||
Concentration of Credit Risk and Significant Customers
The Company operates globally with 59.3% of total revenues derived from customers located in the U.S. and the remaining 40.7%
78
derived from customers located in various international locations. Revenue derived from customers located in the U.K. during the years ended December 31, 2015, 2014 and 2013 was $37.9 million, $34.8 million and $31.1 million, or 13.7%, 13.6% and 13.2% of total revenue, respectively. No other individual foreign country accounted for more than 10% of the Company's revenue during these periods.
No individual customer accounted for more than 10% of the Company's revenue in the years ended December 31, 2015, 2014 and 2013.
14. Related Party Transactions
Affiliates of one of our largest shareholders, TA Associates, L.P. (which is now part of TA Associates Management, L.P.) are also customers of the Company. These affiliates made payments to the Company in connection with their purchase of its services using the Intralinks Platform. Revenue generated from TA Associates, L.P. and its affiliates was nominal for the years ended December 31, 2015, 2014 and 2013. At December 31, 2015 there were no amounts due to TA Associates, L.P and amounts due from these affiliates of TA Associates, L.P. were nominal.
15. Commitments and Contingencies
Operating Leases
The Company has entered into various non-cancelable operating lease agreements for certain of our offices throughout the world with original lease periods expiring between 2015 and 2025. Certain of these arrangements have free or escalating rent payment provisions. We recognized rent expense under such arrangements on a straight-line basis.
At December 31, 2015, future minimum payments under non-cancelable operating leases were as follows over the next five years and thereafter:
Years Ending December 31, | Amount | |||
(In thousands) | ||||
2016 | $ | 6,124 | ||
2017 | 5,851 | |||
2018 | 5,435 | |||
2019 | 4,961 | |||
2020 | 4,602 | |||
Thereafter | 10,632 | |||
Total | $ | 37,605 | ||
Total rent expenses charged to operations for the years ended December 31, 2015, 2014 and 2013 was $6.3 million, $6.6 million and $5.5 million, respectively.
The Company's principal executive office located at 150 East 42nd Street, New York, New York occupies 43,304 square feet which is subject to a lease agreement that expires in July 2021. The lease commenced August 2011, has a ten year term and provided for 12 months of initial free rent and an allowance from the landlord for improvements of $1.9 million.
In addition, the Company leases an office that is located at 404 Wyman Street, Waltham, Massachusetts that occupies 51,325 square feet for a term that expires October 2024. The lease commenced August 2014, has a ten year and three month term and provided for three months of initial free rent and an allowance from the landlord for improvements of $2.3 million.
79
The Company also maintains space in several locations for its sales and services activities.
Contingencies
In the ordinary course of business, the Company and its subsidiaries are subject to various claims, charges, disputes, litigation and regulatory inquiries and investigations. The Company establishes reserves for specific legal matters when it determines that the likelihood of an unfavorable outcome is probable and the loss is reasonably estimable. Management has also identified certain other legal matters where it believes an unfavorable outcome is not probable and, therefore, no reserve is established. Although management currently believes that resolving claims against the Company, including claims where an unfavorable outcome is reasonably possible, will not have a material impact on the Company's liquidity, results of operations or financial condition, these matters are subject to inherent uncertainties and management's view of these matters may change in the future. The Company also evaluates other contingent matters, including income and non-income tax contingencies, to assess the likelihood of an unfavorable outcome and estimated extent of potential loss. These matters, if resolved adversely against the Company, may result in monetary damages, fines and penalties or require changes in business practices. It is possible that an unfavorable outcome of one or more of these lawsuits or other contingencies could have a material impact on the Company's liquidity, results of operations or financial condition.
Legal Proceedings
The Company is not currently aware of any pending or threatened material claims, charges, disputes, litigation and regulatory inquiries and investigations except as follows:
Securities Class Action. On December 5, 2011, the Company became aware of a purported class action lawsuit filed in the U.S. District Court for the Southern District of New York (the "SDNY" or the "Court") against the Company and certain of its current and former executive officers. The initial complaint (the "Wallace Complaint") alleges that the defendants made false and misleading statements or omissions about the Company’s business prospects, financial condition and performance in violation of the Securities Exchange Act of 1934, as amended. The plaintiff seeks unspecified compensatory damages for the purported class of purchasers of the Company's common stock during the period from February 17, 2011 through November 10, 2011 (the "Allegation Period"). On December 27, 2011, a second purported class action complaint, which makes substantially the same claims as, and is related to, the Wallace Complaint, was filed in the SDNY against the Company and certain of its current and former executive officers seeking similar unspecified compensatory damages for the Allegation Period. On April 3, 2012, the Court consolidated the actions and appointed Plumbers and Pipefitters National Pension Fund as lead plaintiff, and also appointed lead counsel in the consolidated action ("Consolidated Class Action"). On June 15, 2012, the lead plaintiff filed an amended complaint (“Consolidated Class Action Complaint”) that, in addition to the original allegations made in the Wallace Complaint, alleges that the Company, certain of its current and former officers and directors, and the underwriters in Intralinks’ April 6, 2011 stock offering issued a registration statement and prospectus in connection with the offering that contained untrue statements of material fact or omitted material information required to be stated therein in violation of the Securities Act of 1933, as amended. The defendants filed motions to dismiss the action on July 31, 2012. On May 8, 2013, the Court issued an opinion dismissing claims based on certain allegations in the complaint, but otherwise denied defendants' motions to dismiss. On June 28, 2013, defendants filed their answers to the Consolidated Class Action Complaint. On February 18, 2014, lead plaintiff filed its motion for class certification. On September 30, 2014, the Court issued an opinion certifying a class of all persons who purchased the Company's stock between February 17, 2011 and November 11, 2011 and a subclass of persons who purchased the Company's stock pursuant or traceable to the Company’s April 6, 2011 offering. On October 14, 2014, the defendants filed a petition in the U.S. Court of Appeals for the Second Circuit for permission to appeal the September 30, 2014 opinion granting plaintiff’s motion for class certification. On December 30, 2014, the Second Circuit denied defendants’ petition. On March 12, 2015, the Court suspended the remaining deadlines in the current scheduling order pending mediation. On July 30, 2015, the Company and the other defendants entered into a stipulation and agreement of settlement ("Settlement"), which was filed with the Court on July 31, 2015. The Settlement provides for the resolution of all of the pending claims in the Consolidated Class Action, without any admission or concession of wrongdoing or liability by the Company or the other defendants. The Company and the other defendants continue to maintain that they have meritorious defenses to all claims alleged in the Consolidated Class Action. The Company and the other defendants agreed to the Settlement to avoid further expense, inconvenience, and the distraction and inherent risks of burdensome and protracted litigation. Pursuant to the Settlement, the defendants agreed to pay $14.0 million (the "Settlement Amount") for a full and complete release of all claims that were or could have been asserted against the Company or the other defendants in the Consolidated Class Action. The full Settlement Amount was paid for and covered by the Company’s insurers pursuant to the applicable insurance policies. On July 31, 2015, the Court issued an order preliminarily approving the Settlement. At a November 12, 2015 hearing, the Court gave
80
final approval of the Settlement and entered an order dismissing the Consolidated Class Action with prejudice. The deadline to appeal entry of the dismissal order expired on December 14, 2015.
Horbal Derivative Action. On April 16, 2012, a second shareholder derivative complaint (the "Horbal Action") was filed in the Supreme Court of the State of New York in New York County ("New York State Court") against the Company and certain of its current and former directors and officers. The complaint alleges that the defendants breached their fiduciary duties by causing the Company to issue materially false and misleading statements about the Company's business operations and financial condition during the same Allegation Period alleged in the Consolidated Class Action Complaint. On April 24, 2012, one of the director defendants removed the Horbal Action to the SDNY, and on May 22, 2012, the plaintiff in the Horbal Action moved to remand the case to New York State Court. On March 11, 2013, the SDNY granted plaintiff's motion to remand, and the case is currently pending in New York State Court. On June 6, 2013, the parties filed a stipulation with the New York State Court agreeing to stay all proceedings in the Horbal Action, including discovery, until ninety days after the SDNY issues a scheduling order in the Consolidated Class Action. On January 13, 2014, the parties filed a stipulation with the New York State Court agreeing to work together on a schedule for defendants’ time to answer, move against or otherwise respond to the complaint or an amended complaint. On June 6, 2014, plaintiff filed an amended complaint that continues to assert the same claims against the same defendants. Defendants filed their motions to dismiss the amended complaint on July 14, 2014. On February 4, 2015, following oral argument, the New York State Court announced from the bench that it would grant defendants’ motions to dismiss. On February 19, 2015, the director defendants served plaintiff with a notice of entry of that dismissal, and on March 20, 2015, plaintiff filed a notice of appeal. On December 2, 2015, plaintiff withdrew his notice of appeal from the Court’s order dismissing the complaint with prejudice.
Levine Shareholder Demand Letter/Complaint. The Company received a shareholder demand letter, dated May 16, 2013, demanding that the Company's Board take action to remedy alleged breaches of fiduciary duty by current and former directors and officers of the Company. These alleged breaches are based on the same alleged misconduct in the complaints in the Horbal and Consolidated Class Actions. The letter specifically demands that the Company's Board undertake an independent internal investigation into the alleged breaches and commence a civil action against each of the allegedly breaching current and former directors and officers. On June 26, 2013, the Company's Board created a Demand Committee to conduct an investigation into the allegations in the Levine demand letter. On December 13, 2013, the shareholder filed a derivative complaint (the "Levine Action") in New York State Court against the Company and certain of its current and former directors and officers. The Levine Action alleges that since the Company’s Board has not responded substantively to the shareholder’s demand letter in over six months, this has resulted in an improper "functional refusal" of the demand. The Levine Action makes substantially the same claims as, and is related to, the Horbal and Consolidated Class Actions. It alleges, among other things, that the defendants breached their fiduciary duties by making materially false and misleading statements related to the strength of the Company’s business and customer satisfaction. On March 27, 2014, counsel for the Demand Committee sent a letter to shareholder’s counsel stating that after thorough investigation of the allegations in the demand letter, the Board concluded that taking any or all of the demanded actions would not serve the best interests of the Company and its shareholders, and voted unanimously to reject the demand. Pursuant to a stipulation filed on June 2, 2014, the defendants filed motions to dismiss the action on July 2, 2014. On February 4, 2015, following oral argument, the New York State Court announced from the bench that it would grant the defendants’ motions to dismiss, without prejudice. On May 20, 2015, Larry Levine filed a new derivative complaint (the "Second Levine Action") under a different docket number in New York State Court against the Company and certain of its current and former directors and officers. The Second Levine Action makes substantially the same claims as in the prior Levine Action, but adds allegations that the prior shareholder demand was wrongfully refused. Pursuant to a stipulation filed on June 2, 2015, the defendants filed motions to dismiss the action on June 26, 2015. Plaintiff filed his opposition on July 20, 2015 and defendants filed their replies on July 31, 2015. Oral argument on the motions to dismiss is scheduled for March 18, 2016. We believe the claims in the Second Levine Action are without merit and intend to defend this lawsuit vigorously. Due to the state of the Second Levine Action and the nature of the potential claims, a range of loss cannot be determined at this time.
81
16. Selected Quarterly Financial Data (Unaudited)
Consolidated Statement of Operations Data: | March 31, 2015 | June 30, 2015 | September 30, 2015 | December 31, 2015 | ||||||||||||
(In thousands) | ||||||||||||||||
Revenue | $ | 66,306 | $ | 68,975 | $ | 69,588 | $ | 71,284 | ||||||||
Gross profit | $ | 47,753 | $ | 49,643 | $ | 50,284 | $ | 52,507 | ||||||||
Loss from operations | $ | (6,401 | ) | $ | (7,375 | ) | $ | (4,723 | ) | $ | (4,699 | ) | ||||
Net loss | $ | (9,352 | ) | $ | (8,491 | ) | $ | (6,561 | ) | $ | (5,980 | ) | ||||
Net loss per common share (1) | ||||||||||||||||
Basic | $ | (0.17 | ) | $ | (0.15 | ) | $ | (0.11 | ) | $ | (0.10 | ) | ||||
Diluted | $ | (0.17 | ) | $ | (0.15 | ) | $ | (0.11 | ) | $ | (0.10 | ) | ||||
Consolidated Statement of Operations Data: | March 31, 2014 | June 30, 2014 | September 30, 2014 | December 31, 2014 | ||||||||||||
(In thousands) | ||||||||||||||||
Revenue | $ | 59,241 | $ | 63,557 | $ | 65,605 | $ | 67,418 | ||||||||
Gross Profit | $ | 42,239 | $ | 46,474 | $ | 48,523 | $ | 49,237 | ||||||||
Loss from operations | $ | (6,193 | ) | $ | (6,963 | ) | $ | (3,923 | ) | $ | (4,655 | ) | ||||
Net loss | $ | (5,379 | ) | $ | (5,673 | ) | $ | (4,351 | ) | $ | (11,093 | ) | ||||
Net loss per common share (1) | ||||||||||||||||
Basic | $ | (0.10 | ) | $ | (0.10 | ) | $ | (0.08 | ) | $ | (0.20 | ) | ||||
Diluted | $ | (0.10 | ) | $ | (0.10 | ) | $ | (0.08 | ) | $ | (0.20 | ) | ||||
(1) Quarterly per share amounts may not add to the related annual per share amount because of differences in the average common shares outstanding during each period.
17. Subsequent Event
On February 19, 2016, the Company's Board of Directors voted to authorize the purchase by the company of up to $20 million of shares of the company’s common stock. Repurchases under this program will be made in open market or privately-negotiated transactions. This authority may be exercised from time to time and in such amounts as market conditions warrant and is subject to regulatory considerations. The timing and actual number of shares repurchased will depend on a variety of factors including price, corporate and regulatory requirements, market conditions and other corporate liquidity requirements and priorities. This stock repurchase program will extend for one year and may be suspended or terminated at any time without prior notice.
82
INTRALINKS HOLDINGS, INC.
SCHEDULE II - VALUATION AND QUALIFYING ACCOUNTS
Balance at Beginning of Period | Charged to Expenses/Against Revenue | Charged to Other Account | Deductions | Balance at End of Period | ||||||||||||||||
(In thousands) | ||||||||||||||||||||
Year ended December 31, 2015 | ||||||||||||||||||||
Allowance for doubtful accounts | $ | 1,258 | $ | 3,725 | $ | — | $ | (2,619 | ) | $ | 2,364 | |||||||||
Credit reserve | 1,900 | 11,578 | — | (11,578 | ) | 1,900 | ||||||||||||||
Deferred tax asset valuation allowance | 6,447 | 12,660 | 989 | (1) | (520 | ) | (2) | 19,576 | ||||||||||||
Total | $ | 9,605 | $ | 27,963 | $ | 989 | $ | (14,717 | ) | $ | 23,840 | |||||||||
Year ended December 31, 2014 | ||||||||||||||||||||
Allowance for doubtful accounts | $ | 1,252 | $ | 2,126 | $ | — | $ | (2,120 | ) | $ | 1,258 | |||||||||
Credit reserve | 1,900 | 8,574 | — | (8,574 | ) | 1,900 | ||||||||||||||
Deferred tax asset valuation allowance | — | 6,447 | — | — | 6,447 | |||||||||||||||
Total | $ | 3,152 | $ | 17,147 | $ | — | $ | (10,694 | ) | $ | 9,605 | |||||||||
Year ended December 31, 2013 | ||||||||||||||||||||
Allowance for doubtful accounts | $ | 1,502 | $ | 1,028 | $ | — | $ | (1,278 | ) | $ | 1,252 | |||||||||
Credit reserve | 1,425 | 6,694 | — | (6,219 | ) | 1,900 | ||||||||||||||
Total | $ | 2,927 | $ | 7,722 | $ | — | $ | (7,497 | ) | $ | 3,152 | |||||||||
(1) Foreign currency translation
(2) Amount is primarily related to the release of the valuation allowance on foreign net deferred tax assets.
83
ITEM 9. CHANGES IN AND DISAGREEMENTS WITH ACCOUNTANTS ON ACCOUNTING AND FINANCIAL DISCLOSURE
None.
ITEM 9A. CONTROLS AND PROCEDURES
Evaluation of Disclosure Controls and Procedures
We maintain disclosure controls and procedures (as defined in Rules 13a-15(e) or 15d-15(e) under the Securities Exchange Act of 1934, as amended, or the Exchange Act), that are designed to ensure that information we are required to disclose in reports that we file or submit under the Exchange Act is recorded, processed, summarized and reported within the time periods specified in the Securities and Exchange Commission rules and forms, and that such information is accumulated and communicated to our management, including our principal executive officer and principal financial officer, as appropriate, to allow timely decisions regarding required disclosure. In designing and evaluating the disclosure controls and procedures, management recognized that any controls and procedures, no matter how well designed and operated, can provide only reasonable assurance of achieving the desired control objectives. Our management, with the participation of our principal executive officer and principal financial officer, evaluated the effectiveness of our disclosure controls and procedures as of the end of the period covered by this report.
Based upon this evaluation, our principal executive officer and principal financial officer have concluded that our disclosure controls and procedures were effective as of the end of the period covered by this report. Management believes that the Consolidated Financial Statements included in this Annual Report on Form 10-K are fairly presented in all material respects in accordance with GAAP, and our principal executive officer and principal financial officer have certified that they fairly present in all material respects our financial condition, results of operations and cash flows for each of the periods presented in this report.
Report of Management on Internal Control over Financial Reporting
Management is responsible for establishing and maintaining adequate internal control over our financial reporting.
Internal control over financial reporting is a process designed to provide reasonable assurance regarding the reliability of financial reporting and the preparation of financial statements for external purposes in accordance with accounting principles generally accepted in the United States of America.
Our internal control over financial reporting includes policies and procedures that (i) pertain to the maintenance of records that, in reasonable detail, accurately and fairly reflect the transactions and dispositions of our assets; (ii) provide reasonable assurance that transactions are recorded as necessary to permit preparation of financial statements in accordance with accounting principles generally accepted in the United States of America, and that our receipts and expenditures are being made only in accordance with authorizations of our management and directors; and (iii) provide reasonable assurance regarding prevention or timely detection of unauthorized acquisition, use, or disposition of our assets that could have a material effect on the financial statements. Due to its inherent limitations, internal control over financial reporting may not prevent or detect misstatements.
Management conducted an evaluation of the effectiveness of internal control over financial reporting based on the framework in Internal Control-Integrated Framework (2013) issued by the Committee of Sponsoring Organizations of the Treadway Commission (COSO). Based on this evaluation, management concluded that our internal control over financial reporting was effective as of December 31, 2015.
The effectiveness of our internal control over financial reporting as of December 31, 2015 has been audited by PricewaterhouseCoopers LLP, an independent registered public accounting firm, as stated in their report which is included in Item 8 of this Annual Report on Form 10-K.
Changes in Internal Control over Financial Reporting
There were no changes in our internal control over financial reporting during the quarter ended December 31, 2015 that have materially affected, or are reasonably likely to materially affect, our internal control over financial reporting.
ITEM 9B. OTHER INFORMATION
None.
84
PART III
ITEM 10. DIRECTORS, EXECUTIVE OFFICERS AND CORPORATE GOVERNANCE
The information required by this Item is set forth under the captions "Board of Directors," "Corporate Governance," "Management" and "Section 16(a) Beneficial Ownership Reporting Compliance" in our definitive proxy statement for our 2016 Annual Meeting of Stockholders, which we expect to file with the SEC within 120 days of December 31, 2015 and is incorporated herein by reference.
We intend to disclose on our website any amendments to, or waivers from, our Code of Business Conduct and Ethics that are required to be disclosed pursuant to the rules of the SEC. Information contained on, or connected to, our website is not incorporated by reference into this Form 10-K and should not be considered part of this report or any other filing that we make with the SEC.
ITEM 11. EXECUTIVE COMPENSATION
The information required by this Item is set forth under the captions “Compensation Discussion and Analysis,” "Director Compensation," "Director Compensation Table - 2015" and "Compensation Practices Risk Assessment" in our definitive proxy statement for our 2016 Annual Meeting of Stockholders, which we expect to file with the SEC within 120 days of December 31, 2015 and is incorporated herein by reference.
ITEM 12. SECURITY OWNERSHIP OF CERTAIN BENEFICIAL OWNERS AND MANAGEMENT AND RELATED STOCKHOLDER MATTERS
The information required by this Item is set forth under the captions “Security Ownership of Certain Beneficial Owners and Management” and “Equity Compensation Plan Information” in our definitive proxy statement for our 2016 Annual Meeting of Stockholders, which we expect to file with the SEC within 120 days of December 31, 2015 and is incorporated herein by reference.
ITEM 13. CERTAIN RELATIONSHIPS AND RELATED TRANSACTIONS, AND DIRECTOR INDEPENDENCE
The information required by this Item is set forth under the captions “Certain Relationships and Related Party Transactions” and “Board of Directors - Composition of our Board of Directors - Director Independence” in our definitive proxy statement for our 2016 Annual Meeting of Stockholders, which we expect to file with the SEC within 120 days of December 31, 2015 and is incorporated herein by reference.
ITEM 14. PRINCIPAL ACCOUNTANT FEES AND SERVICES
The information required by this Item is set forth under the captions “Ratification of Selection of Independent Registered Public Accounting Firm" and "Independent Registered Public Accounting Firm Fees and Services” in our definitive proxy statement for our 2016 Annual Meeting of Stockholders, which we expect to file with the SEC within 120 days of December 31, 2015 and is incorporated herein by reference.
85
PART IV
ITEM 15: EXHIBITS
The following are filed as part of this Annual Report:
1. | Financial Statements |
The financial statements filed as part of this Annual Report are listed on the index to financial statements found in Item 8.
2. | Financial Statement Schedules |
The financial statement schedule entitled "Schedule II-Valuation and Qualifying Accounts" filed as part of this Annual Report is listed on the index to financial statements found in Item 8. All other schedules have been omitted since the required information is not present, or not present in amounts sufficient to require submission of the schedule, or because the information required is included in the Consolidated Financial Statements or the Notes thereto.
3. | Exhibits and Financial Statement Schedules |
The following exhibits are required by Item 601 of Regulation S-K.
Exhibit Number | Description | |
3.1 | Fourth Amended and Restated Certificate of Incorporation of the Company (Incorporated by reference to Exhibit 3.2 to the Company's Registration Statement on Form S-1, as amended (File No. 333-165991)). | |
3.2 | Amended and Restated By-Laws of the Company (Incorporated by reference to Exhibit 3.1 to the Company's Current Report on Form 8-K filed on May 6, 2015). | |
4.1 | Specimen Common Stock Certificate (Incorporated by reference to Exhibit 4.1 to the Company's Registration Statement on Form S-1, as amended (File No. 333-165991)). | |
4.2 | Registration Rights Agreement by and among the investors and shareholders listed therein and the Company, dated as of June 15, 2007 (Incorporated by reference to Exhibit 4.2 to the Company's Registration Statement on Form S-1, as amended (File No. 333-165991)). | |
4.3 | Stockholders Agreement by and among the investors and shareholders listed therein and the Company, dated as of June 15, 2007, as amended (Incorporated by reference to Exhibit 4.3 to the Company's Registration Statement on Form S-1, as amended (File No. 333-165991)). | |
10.1 | Lease Agreement by and between Hiro Real Estate Co. and Intralinks, Inc., dated as of December 31, 2009 (Incorporated by reference to Exhibit 10.3 to the Company's Registration Statement on Form S-1, as amended (File No. 333-165991)). | |
10.2 | Lease Agreement, executed as of March 11, 2014 and dated as of March 3, 2014, by and between 404 Wyman LLC, as landlord, and the Company, as tenant (as amended by the First Amendment, executed as of March 10, 2015 and dated as of February 23, 2015) (Incorporated by reference to Exhibit 10.2 to the Company’s Annual Report on Form 10-K for the year ended December 31, 2014 filed on March 13, 2015). | |
10.3+ | 2007 Stock Option and Grant Plan, First Amendment to 2007 Stock Option and Grant Plan, Form of Incentive Stock Option Agreement, Form of Non-Qualified Stock Option Agreement and Form of Restricted Stock Agreement (Incorporated by reference to Exhibit 10.4 to the Company's Registration Statement on Form S-1, as amended (File No. 333-165991)). | |
10.4+ | 2007 Restricted Preferred Stock Plan and Form of Restricted Stock Agreement (Incorporated by reference to Exhibit 10.5 to the Company's Registration Statement on Form S-1, as amended (File No. 333-165991)). | |
10.5+ | Amended and Restated 2010 Employee Stock Purchase Plan (Incorporated by reference to Exhibit 99.1 to the Company's Registration Statement on Form S-8 filed on September 6, 2013). | |
10.6+ | Amended and Restated 2010 Equity Incentive Plan and forms of award agreements (Incorporated by reference to Exhibit 10.1 to the Company's Current Report on Form 8-K filed on August 1, 2014). | |
10.7+ | Senior Executive Incentive Bonus Plan (Incorporated by reference to Exhibit 10.8 to the Company's Registration Statement on Form S-1, as amended (File No. 333-165991)). | |
10.8+ | Intralinks, Inc. Senior Executive Severance Plan (Incorporated by reference to Exhibit 10.14 to the Company's Registration Statement on Form S-1, as amended (File No. 333-165991)). | |
10.9+* | Non-Employee Director Compensation Policy, dated April 27, 2011 and amended July 28, 2015. | |
10.10 | Credit Agreement, dated as of February 24, 2014, by and among the Company, Intralinks Inc. as Borrower, the financial institutions listed therein as Lenders, JPMorgan Chase Bank, N.A. as Administrative Agent and Collateral Agent and J.P. Morgan Securities LLC as Lead Arranger and Sole Bookrunner (Incorporated by reference to Exhibit 10.1 to the Company's Current Report on Form 8-K filed on February 27, 2014). | |
86
10.11 | Credit Agreement, dated as of February 24, 2014, by and among the Company and Intralinks International Holdings LLC as Guarantors, Intralinks Inc. as Borrower and JPMorgan Chase Bank, N.A. as Lender (Incorporated by reference to Exhibit 10.2 to the Company's Current Report on Form 8-K filed on February 27, 2014). | |
10.12 | First Amendment, dated as of June 20, 2014, to the Credit Agreement, dated as of February 24, 2014, by and among the Company, Intralinks International Holdings LLC and docTrackr, Inc. as Guarantors, Intralinks, Inc. as Borrower and JPMorgan Chase Bank, N.A. as Lender (Incorporated by reference to Exhibit 10.1 to the Company's Current Report on Form 8-K filed on June 23, 2014). | |
10.13 | Second Amendment, dated as of November 2, 2015, to the Credit Agreement, dated as of February 24, 2014 and amended by the First Amendment, dated as of June 20, 2014, by and among the Company, Intralinks International Holdings LLC and docTrackr, Inc. as Guarantors, Intralinks, Inc. as Borrower and JPMorgan Chase Bank, N.A. as Lender (Incorporated by reference to Exhibit 10.1 to the Company's Quarterly Report on Form 10-Q for the quarter ended September 30, 2015 filed on November 4, 2015). | |
10.14+ | Employment Agreement dated as of December 15, 2011 by and between the Company and Ronald W. Hovsepian (Incorporated by reference to Exhibit 10.1 to the Company's Current Report on Form 8-K filed on December 16, 2011). | |
10.15+ | Employment Agreement dated as of September 17, 2012 by and between the Company and Derek Irwin (Incorporated by reference to Exhibit 10.2 to the Company's Current Report on Form 8-K filed on September 4, 2012). | |
10.16+ | Employment Agreement dated as of January 27, 2012 by and between the Company and Scott Semel (Incorporated by reference to Exhibit 10.3 to the Company's Current Report on Form 8-K filed on February 1, 2012). | |
10.17+ | Employment Agreement dated as of April 9, 2012 by and between the Company and Rainer Gawlick (Incorporated by reference to Exhibit 10.2 to the Company's Quarterly Report on Form 10-Q for the quarter ended September 30, 2013 filed on November 8, 2013). | |
10.18+ | Employment Agreement dated as of March 30, 2012 by and between the Company and Jose Almandoz (Incorporated by reference to Exhibit 10.3 to the Company's Quarterly Report on Form 10-Q for the quarter ended June 30, 2014 filed on August 8, 2014). | |
10.19+ | Employment Agreement dated as of June 30, 2015 by and between the Company and Christopher J. Lafond (Incorporated by reference to Exhibit 10.1 to the Company's Current Report on Form 8-K filed on June 30, 2015). | |
10.20+ | Employment Agreement dated as of July 21, 2014 by and between the Company and Aditya Joshi (Incorporated by reference to Exhibit 10.18 to the Company’s Annual Report on Form 10-K for the year ended December 31, 2014 filed on March 13, 2015). | |
10.21+ | Form of Indemnification Agreement (Incorporated by reference to Exhibit 10.15 to the Company's Registration Statement on Form S-1, as amended (File No. 333-165991)). | |
21.1* | List of Subsidiaries of the Company. | |
23.1* | Consent of PricewaterhouseCoopers LLP, Independent Registered Public Accounting Firm. | |
31.1* | Certification of Principal Executive Officer pursuant to Section 302 of the Sarbanes-Oxley Act of 2002. | |
31.2* | Certification of Principal Accounting Officer pursuant to Section 302 of the Sarbanes-Oxley Act of 2002. | |
32.1* | Certification of Principal Executive Officer pursuant to Section 906 of the Sarbanes-Oxley Act of 2002. | |
32.2* | Certification of Principal Accounting Officer pursuant to Section 906 of the Sarbanes-Oxley Act of 2002. | |
101.INS** | XBRL Instance Document | |
101.SCH** | XBRL Taxonomy Extension Schema Document | |
101.CAL** | XBRL Taxonomy Calculation Linkbase Document | |
101.LAB** | XBRL Taxonomy Label Linkbase Document | |
101.PRE** | XBRL Taxonomy Presentation Linkbase Document | |
101.DEF** | XBRL Taxonomy Definitions Linkbase Document | |
* Filed herewith.
+ | Indicates a management contract or compensation plan, contract or arrangement. |
** Attached as Exhibits 101 to this report are the following financial statements from our Annual Report on Form 10-K for the year ended December 31, 2015 formatted in XBRL (eXtensible Business Reporting Language): (i) the Consolidated Balance Sheets, (ii) the Consolidated Statements of Operations, (iii) the Consolidated Statements of Comprehensive Loss, (iv) the Consolidated Statements of Changes in Stockholders' Equity, (v) the Consolidated Statements of Cash Flows and (vi) related notes to these financial statements.
87
SIGNATURES
Pursuant to the requirements of Section 13 or 15(d) of the Securities Exchange Act of 1934, the Registrant has duly caused this report to be signed on its behalf by the undersigned, thereunto duly authorized.
INTRALINKS HOLDINGS, INC. | ||
By: /s/ Ronald W. Hovsepian Ronald W. Hovsepian President and Chief Executive Officer | ||
Date: March 4, 2016 | ||
Pursuant to the requirements of the Securities Exchange Act of 1934, this report has been signed below by the following persons on behalf of the Registrant and in the capacities indicated.
Signature | Title | Date | |
/s/ Ronald W. Hovsepian Ronald W. Hovsepian | Director, President and Chief Executive Officer (principal executive officer) | March 4, 2016 | |
/s/ Christopher J. Lafond Christopher J. Lafond | Chief Financial Officer (principal financial and accounting officer) | March 4, 2016 | |
/s/ Patrick J. Wack, Jr. Patrick J. Wack, Jr. | Chairman of the Board of Directors | March 4, 2016 | |
/s/ Brian J. Conway Brian J. Conway | Director | March 4, 2016 | |
/s/ Peter Gyenes Peter Gyenes | Director | March 4, 2016 | |
/s/ Thomas Hale Thomas Hale | Director | March 4, 2016 | |
/s/ Habib Kairouz Habib Kairouz | Director | March 4, 2016 | |
/s/ Robert C. McBride Robert C. McBride | Director | March 4, 2016 | |
/s/ Harsha Ramalingam Harsha Ramalingam | Director | March 4, 2016 | |
/s/ J. Chris Scalet J. Chris Scalet | Director | March 4, 2016 | |
88