Attached files
| file | filename |
|---|---|
| EX-31.2 - CERTIFICATION OF CFO PURSUANT TO SECTION 302 - BAYLAKE CORP | baylake160851_ex31-2.htm |
| EX-23.1 - CONSENT OF INDEPENDENT REGISTERED PUBLIC ACCOUNTING FIRM - BAYLAKE CORP | baylake160851_ex23-1.htm |
| EX-21.1 - LIST OF SUBSIDIARIES - BAYLAKE CORP | baylake160851_ex21-1.htm |
| EX-32.2 - CERTIFICATION OF CFO PURSUANT TO SECTION 906 - BAYLAKE CORP | baylake160851_ex32-2.htm |
| EX-31.1 - CERTIFICATION OF CEO PURSUANT TO SECTION 302 - BAYLAKE CORP | baylake160851_ex31-1.htm |
| EX-32.1 - CERTIFICATION OF CEO PURSUANT TO SECTION 906 - BAYLAKE CORP | baylake160851_ex32-1.htm |
UNITED
STATES
SECURITIES AND EXCHANGE COMMISSION
WASHINGTON, D.C. 20549
| FORM 10-K |
| (Mark One) | ||
| ☒ ANNUAL REPORT PURSUANT TO SECTION 13 OR 15(d) OF THE | ||
| SECURITIES EXCHANGE ACT OF 1934 | ||
| For the fiscal year ended December 31, 2015 | ||
| or | ||
| ☐ TRANSITION REPORT PURSUANT TO SECTION 13 OR 15(d) OF THE | ||
| SECURITIES EXCHANGE ACT OF 1934 | ||
For the transition period from _________________ to _________________
Commission file number 001-16339
BAYLAKE CORP.
(Exact name of registrant as specified in its charter)
| Wisconsin | 39-1268055 | |
| (State or other jurisdiction of | (I.R.S. Employer | |
| incorporation or organization) | Identification No.) | |
| 217 North Fourth Avenue, Sturgeon Bay, WI | 54235 | |
| (Address of principal executive offices) | (Zip Code) |
| Registrant’s telephone number, including area code: (920) 743-5551 | ||
| Securities registered pursuant to Section 12(b) of the Act: None | ||
Securities registered pursuant to Section 12(g) of the Act: Common Stock $5.00 Par Value Per Share
Indicate by check mark if the registrant is a well-known seasoned issuer, as defined in Rule 405 of the Securities Act. Yes ☐ No ☒
Indicate by check mark if the registrant is not required to file reports pursuant to Section 13 or Section 15(d) of the Act. Yes ☐ No ☒
Indicate by check mark whether the registrant (1) has filed all reports required to be filed by Section 13 or 15(d) of the Securities Exchange Act of 1934 during the preceding 12 months (or for such shorter period that the registrant was required to file such reports), and (2) has been subject to such filing requirements for the past 90 days.
Yes ☒ No ☐
Indicate by check mark whether the registrant has submitted electronically and posted on its corporate Web site, if any, every Interactive Data File required to be submitted and posted pursuant to Rule 405 of Regulation S-T (§232.405 of this chapter) during the preceding 12 months (or for such shorter period that the registrant was required to submit and post such files). Yes ☒ No ☐
Indicate by check mark if disclosure of delinquent filers pursuant to Item 405 of Regulation S-K (§229.405 of this chapter) is not contained herein, and will not be contained, to the best of registrant’s knowledge, in definitive proxy or information statements incorporated by reference in Part III of this Form 10-K or any amendment to this Form 10-K ☒.
Indicate by check mark whether the registrant is a large accelerated filer, an accelerated filer, a non-accelerated filer, or a smaller reporting company. See definitions of “large accelerated filer,” “accelerated filer” and “smaller reporting company” in Rule 12b-2 of the Exchange Act. (Check one):
Large accelerated filer ☐ |
Accelerated filer ☒ | Non-accelerated filer ☐ | Smaller reporting company ☐ |
(Do not check if a smaller reporting company)
Indicate by check mark whether the registrant is a shell company (as defined in Rule 12b-2 of the Exchange Act.) Yes ☐ No ☒
As of June 30, 2015, (the last business day of the Registrant’s most recently completed second fiscal quarter), the aggregate market value of the Common Stock (based upon the $12.80 per share average reported bid and asked price on that date) held by non-affiliates was approximately $105.26 million. This market value calculation excludes a total of 1,096,902 shares of common stock reported as beneficially owned by directors and executive officers. For purposes of this market value calculation, the Registrant assumed that all executive officers and directors (and no other person) qualified as “affiliates”; provided, however, nothing herein shall constitute an admission or any evidence whatsoever, as to affiliate status. As of March 4, 2016, 9,620,348 shares of Common Stock were outstanding.
DOCUMENTS INCORPORATED BY REFERENCE
| Document | Part of Form 10-K Into Which Portions of Documents are Incorporated | |
| Definitive Proxy Statement for 2016 Annual | Part III | |
| Meeting of Shareholders to be filed within 120 | ||
| days of the fiscal year ended December 31, 2015 |
| 2 |
2015 FORM 10-K
TABLE OF CONTENTS
| 3 |
General
Baylake Corp. (“we,” “us,” “our” or the “Company”) is a Wisconsin corporation organized in 1976 and is registered as a bank holding company under the Bank Holding Company Act of 1956, as amended (the “BHCA”). Our primary activities consist of holding the stock of our wholly-owned subsidiary bank, Baylake Bank (the “Bank”), and providing a wide range of banking and related business activities through the Bank and our other subsidiaries. At December 31, 2015, we had total assets of approximately $1.1 billion. For additional financial information, see our Consolidated Financial Statements at Part II, Item 8 of this Form 10-K. On September 8, 2015, we entered into an Agreement and Plan of Merger (the “Merger Agreement”) with Nicolet Bankshares, Inc., a Wisconsin corporation (“Nicolet”), pursuant to which we will merge with and into Nicolet (the “Merger”). The transaction is expected to close in the second quarter of 2016. Following the Merger, the Bank will merge with and into Nicolet National Bank (“NNB”), Nicolet’s wholly-owned bank subsidiary, with NNB continuing as the surviving bank (the “Bank Merger”).
Baylake Bank
The Bank is a Wisconsin state bank originally chartered in 1876. The Bank is an independent community bank offering a full range of financial services primarily to small businesses and individuals located in our market area. We conduct our community banking business through 23 full-service financial centers located throughout Northeast Wisconsin, in Brown, Door, Kewaunee, Manitowoc, and Outagamie Counties. During the second quarter of 2013, we closed one branch, consolidating the related loans and deposits into our remaining branches. In the second half of 2013, we sold the deposits of two additional branches and moved these facilities to the Bank’s other real estate owned. We have eight financial centers in Door County, which is known for its tourism-related services. We currently have seven financial centers in Brown County, which includes the City of Green Bay and two financial centers in Outagamie County, one of which we purchased in February of 2014. In January of 2015, we announced our intentions to close one of our branches in Brown County, which became effective in the second quarter of 2015. At the present time, we intend to continue to utilize the facility in future bank operations. We acquired four additional branches in Brown, Kewaunee, and Manitowoc Counties in December of 2015 through our acquisition of NEW Bancshares, Inc. (“NEWBI”). One branch in Kewaunee County was immediately closed.
We serve a broader range of service, manufacturing and retail job segments in the Brown County market. The rest of our financial centers are located in smaller cities and smaller communities. Other principal industries in our market area include tourism/recreation, manufacturing, agriculture and food related products. Services are provided in person at our financial centers discussed above or at other locations, as well as through the mail, over the telephone, electronically by using the Bank’s internet banking services, and mobile banking through customer mobile phones.
Non-Bank Subsidiaries
In addition to our banking operations, the Bank owns one non-bank subsidiary: Bay Lake Investments, Inc., located in Las Vegas, Nevada, which holds and manages a portion of the Bank’s investment portfolio. The Bank also owns 99.2% of the outstanding common stock in United Financial Services, Incorporated (“UFS Inc.”) which in turn, owns 49.8% of the outstanding common stock in UFS, LLC, a data processing services company located in Grafton, Wisconsin. Collectively, UFS Inc. and UFS, LLC are referred to as United Financial Services (“UFS”). UFS, LLC provides data processing services to other banks. During 2013, we capitalized a wholly-owned registered investment advisor subsidiary, Admiral Asset Management, LLC (“Admiral”), to provide brokerage services beyond those provided by the Bank and investment advisory services to customers.
Corporate Governance Matters
We maintain a website at www.baylake.com. We make available through that website, free of charge, copies of our Annual Reports on Form 10-K, Quarterly Reports on Form 10-Q, Current Reports on Form 8-K, and amendments to those reports, as soon as reasonably practicable after we electronically file those materials with, or furnish them to, the Securities and Exchange Commission (“SEC”). Our SEC reports can be accessed through the Investor Relations link on our website. The SEC also maintains a website at www.sec.gov that contains reports, proxy statements and other information regarding SEC registrants.
| 4 |
Lending
We offer short-term and long-term loans on a secured and unsecured basis for business and personal purposes. We make real estate, commercial/industrial, agricultural, consumer and municipal loans in accordance with the basic lending policies established by our Board of Directors. We focus lending activities on individuals and small businesses in our market area. Our lending activity has been historically concentrated primarily within the State of Wisconsin. We do not conduct any substantial business with foreign obligors. We serve a wide variety of industries including, on a limited basis, a concentration on businesses directly and indirectly related to the tourism/recreation industries. Loans to customers in the tourism/recreation industry, including restaurants and lodging businesses, totaled approximately $85.2 million at December 31, 2015, or 11.5% of our aggregate loans outstanding at that date. Although competitive and economic pressures exist in this market segment, business remains relatively steady in the markets we serve. However, any deterioration in the economy of Northeastern Wisconsin (as a result, for example, of a decline in its manufacturing or tourism/recreation industries or otherwise) could have a material adverse effect on our business and operations. In particular, a decline in the Door County tourism business would not only affect our customers in the restaurant and lodging business, and therefore loans to such entities as described above, but could also affect loans and other business relationships with persons employed in that industry, as well as real estate values (including collateral values) in the area. Our expansion into other market areas has reduced our concentration level in tourism/recreation related businesses, but these types of businesses still remain an important element of the customer base that we serve.
In addition to originating loans, we buy and sell loan participations with other banks located in markets we serve. These loans are underwritten to the same lending standards as the loans we originate. Additionally, we purchase syndicated loans in the national market, which represent small portions of large national credits. These credits are also subject to our normal underwriting guidelines and totaled $64.6 million, or 8.7% of total outstanding loans at December 31, 2015.
Our total outstanding loans as of December 31, 2015 were approximately $743.4 million, consisting of 42.8% commercial real estate loans, 24.1% residential real estate loans, 14.3% other commercial and industrial loans, 8.7% syndicated commercial and industrial loans, 5.9% construction and land development real estate loans, 3.0% tax exempt loans and 1.2% consumer loans.
Investments
We maintain a portfolio of investments, primarily consisting of U.S. government agency securities, U.S. government-sponsored agency securities, mortgage-backed securities, obligations of states and their political subdivisions, and private placement and corporate bonds. We attempt to balance our portfolio to manage interest rate risks, maximize tax advantages, and meet liquidity needs while endeavoring to optimize investment income.
Deposits
We offer a broad range of depository products, including noninterest-bearing demand deposits, interest-bearing demand deposits, various savings and money market accounts and certificates of deposit (“CDs”). Deposits are insured by the Deposit Insurance Fund of the Federal Deposit Insurance Corporation (“FDIC”) up to statutory limits. At December 31, 2015, our total deposits were approximately $866.2 million, including interest-bearing deposits of $668.2 million and noninterest bearing deposits of $198.0 million. In the first quarter of 2014, we acquired $13.7 million of deposits in conjunction with the purchase of a branch in Outagamie County, Wisconsin. In December 2015, deposits of $68.5 million were acquired in the merger with NEWBI.
Other Customer Services and Products
Other services and products we offer include safe deposit box services, personal and business trust services, brokerage services, treasury management, private banking, financial planning and electronic banking services, including mobile banking, and eBanc, an internet banking product for our customers. Additionally, we offer investment advisory services through Admiral.
| 5 |
Seasonality
The tourism/recreation industry, particularly in the Door County market, substantially affects our business with our customers, particularly those customers in the restaurant and lodging businesses. The tourist business of Door County is largely seasonal, with the vast majority of tourist vacationing beginning in early spring and continuing until late fall. Although businesses and customers involved in the delivery of tourism-related services have financial needs throughout the entire year, the seasonal nature of the tourism business tends to result in increased demands for loans shortly before and during the tourist season and causes reduced deposits shortly before and during the early part of the tourist season. Although more pronounced in the past, this seasonality has become lessened by the continued growth of other industries throughout our markets in the past few years.
Competition
The financial services industry is highly competitive. We compete with other financial institutions and businesses in both attracting and retaining deposits and making loans in all of our principal markets. The primary factors in competing for deposits are interest rates, personalized services, the quality and range of financial services including electronic and mobile banking options, and convenience of office locations and office hours. Competition for deposit products comes primarily from other commercial banks, savings banks, credit unions and non-bank competitors, including insurance companies, money market and mutual funds, and other investment alternatives. The primary factors in competing for loans are interest rates, loan origination fees, terms and conditions, the quality and range of lending services and personalized services. Competition for loans comes primarily from other commercial banks, savings banks, mortgage banking firms, credit unions, finance companies, leasing companies, marketplace lenders and other financial intermediaries. Some of our competitors are not subject to the same degree of regulation as that imposed on bank holding companies or federally insured banks, and may be able to price loans and deposits more aggressively. We also face direct competition from other banks and bank holding companies that have greater assets and resources than us.
Supervision and Regulation
We must comply with state and federal banking laws and regulations that control virtually all aspects of our operations. These laws and regulations generally aim to protect our depositors, not necessarily our shareholders or our creditors. Any changes in applicable laws or regulations may materially affect our business and prospects. Proposed legislative or regulatory changes may also affect our operations. The following description summarizes some of the laws and regulations to which we are subject. References to applicable statutes and regulations are brief summaries, do not purport to be complete and are qualified in their entirety by reference to such statutes and regulations.
Dodd-Frank Wall Street Reform and Consumer Protection Act of 2010
The Dodd-Frank Wall Street Reform and Consumer Protection Act of 2010 (the “Dodd-Frank Act”), enacted in July 2010, resulted in sweeping changes in the regulation of financial institutions aimed at strengthening safety and soundness for the financial services sector.
Among other things, the Dodd-Frank Act required the federal banking agencies to establish minimum leverage and risk-based capital requirements for banks and bank holding companies, increased regulatory oversight, supervision and examination of banks, bank holding companies and their respective subsidiaries by the appropriate regulatory agency, and contained a wide variety of provisions affecting the regulation of depository institutions, including restrictions related to mortgage originations, risk retention requirement as to securitized loans, the establishment of the Consumer Financial Protection Bureau (“CFPB”), and restrictions on proprietary trading (the “Volcker Rule”). The Dodd-Frank Act may have a material impact on our and the Bank’s operations, particularly through increased compliance costs resulting from possible future consumer and fair lending regulations. See Part I, Item 1A, “Risk Factors” for a more extensive discussion of this topic.
| 6 |
Capital Requirements and Basel III
We and the Bank are subject to various regulatory capital requirements administered by the Federal Reserve Bank of Chicago (“Reserve Bank”). Failure to meet minimum capital requirements could result in certain mandatory and possible additional discretionary actions by regulators that, if undertaken, could have a material adverse effect on our financial statements. Under capital adequacy guidelines and the regulatory framework for prompt corrective action (described below), we must meet specific capital guidelines that involve quantitative measures of our assets, liabilities and certain off-balance sheet items as calculated under regulatory accounting policies. Our capital amounts and classification are also subject to judgments by the regulators regarding qualitative components, risk weightings and other factors.
In July 2013, our and the Bank’s primary federal regulator, the Board of Governors of the Federal Reserve (“FRB”), published the Basel III Capital Rules establishing a new comprehensive capital framework for U.S. banking organizations. The rules implement the December 2010 framework of the Basel Committee on Banking Supervision (the “Basel Committee”), known as “Basel III,” for strengthening international capital standards as well as certain provisions of the Dodd-Frank Act. The Basel III Capital Rules substantially revise the risk-based capital requirements applicable to bank holding companies and depository institutions, including us and the Bank, compared to the prior U.S. risk-based capital rules.
The Basel III Capital Rules define the components of capital and address other issues affecting the numerator in banking institutions’ regulatory capital ratios. The Basel III Capital Rules also address risk weights and other issues affecting the denominator in banking institutions’ regulatory capital ratios and replace the existing risk-weighting approach, which was derived from the Basel I capital accords of the Basel Committee, with a more risk-sensitive approach based, in part, on the standardized approach in the Basel Committee’s 2004 Basel II capital accords. The Basel III Capital Rules also implement the requirements of Section 939A of the Dodd-Frank Act to remove references to credit ratings from the federal banking rules. The Basel III Capital Rules were effective for us and the Bank on January 1, 2015, subject to a phase-in period.
The Basel III Capital Rules, among other things: (i) revise minimum capital requirements and adjust prompt corrective action thresholds; (ii) revise the components of regulatory capital and create a new capital measure called Common Equity Tier 1 (“Common Equity”), which must constitute at least 4.5% of risk-weighted assets; (iii) specify that Tier 1 capital consist only of Common Equity and certain “Additional Tier 1 Capital” instruments meeting specified requirements; (iv) increase the minimum Tier 1 capital ratio requirement from 4% to 6%; (v) retain the existing risk-based capital treatment for 1-4 family residential mortgage exposures; (vi) permit most banking organizations, including us, to retain, through a one-time permanent election, the existing capital treatment for accumulated other comprehensive income; (vii) implement a new capital conservation buffer of common equity Tier 1 capital equal to 2.5% of risk-weighted assets, which will be in addition to the 4.5% Common Equity ratio and be phased in over a three-year period beginning January 1, 2016, which buffer is generally required in order for an institution to make capital distributions and pay executive bonuses; (viii) increase capital requirements for past-due loans, high volatility commercial real estate exposures and certain short-term loan commitments; (ix) require the deduction of mortgage servicing assets and deferred tax assets that exceed 10% of Common Equity in each category and 15% of Common Equity in the aggregate; and (x) remove references to credit ratings consistent with the Dodd-Frank Act and establish due diligence requirements for securitization exposures.
Compliance with the Basel III Capital Rules was required for most banking organizations beginning January 1, 2015, including us and the Bank, subject to a transition period for several aspects of the final rules, including the new minimum capital ratio requirements, the capital conservation buffer and the regulatory capital adjustments and deductions. Requirements to maintain higher levels of capital could adversely impact our return on equity. We believe that we will continue to exceed all estimated well-capitalized regulatory requirements under these new rules on a fully phased-in basis. For further detail on capital and capital ratios, see the discussion under the “Liquidity” and “Capital” sections of Part II, Item 7, “Management’s Discussion and Analysis of Financial Condition and Results of Operations,” and Note 15 to our consolidated financial statements under Part II, Item 8.
Baylake Corp.
As a bank holding company, we are subject to regulation by the FRB and examination by the Reserve Bank under the BHCA and are required to file reports of our operations and such additional information as the FRB may require under FRB policy.
| 7 |
Permitted Activities
In 1999, Congress enacted the Gramm-Leach-Bliley Act (the “GLB Act”), which modernized the U.S. banking system by: (i) allowing bank holding companies that qualify as “financial holding companies” to engage in a broad range of financial and related activities; (ii) allowing insurers and other financial services companies to acquire banks; (iii) removing restrictions that applied to bank holding company ownership of securities firms and mutual fund advisory companies; and (iv) establishing the overall regulatory scheme applicable to bank holding companies that also engage in insurance and securities operations. The general effect of the law was to establish a comprehensive framework to permit affiliations among commercial banks, insurance companies, securities firms and other financial service providers. Activities that are financial in nature are broadly defined to include not only banking, insurance and securities activities, but also merchant banking and additional activities that the FRB, in consultation with the Secretary of the Treasury, determines to be financial in nature, incidental to such financial activities or “complementary” activities that do not pose a substantial risk to the safety and soundness of depository institutions or the financial system generally.
In contrast to financial holding companies, bank holding companies are limited to managing or controlling banks, furnishing services to or performing services for its subsidiaries and engaging in other activities that the FRB determines by regulation or order to be so closely related to banking or managing or controlling banks as to be a proper incident thereto. We have not elected to be certified as a financial holding company, so these limitations apply to us.
Changes in Control
Subject to certain exceptions, the BHCA and the Change in Bank Control Act, together with the applicable regulations, require FRB approval (or, depending upon the circumstances, no notice of disapproval) prior to any person or company acquiring a “controlling interest” in a bank or bank holding company, which is presumed to exist where an individual or company acquires the power, directly or indirectly to direct the management or policies of an insured depository institution or to vote 25% or more of any class of voting securities of any insured depository institution. A rebuttable presumption of control exists if a person or company acquires 10% or more but less than 25% of any class of voting securities of an insured depository institution and either the institution has registered securities under Section 12 of the Securities Exchange Act of 1934, or no other person will own a greater percentage of that class of voting securities immediately after the acquisition.
As a bank holding company, we are required to obtain prior approval from the FRB before (i) acquiring all or substantially all of the assets of a bank or bank holding company, (ii) acquiring direct or indirect ownership or control of more than 5% of the outstanding voting stock of any bank or bank holding company (unless we own a majority of such bank’s voting shares), or (iii) merging or consolidating with any other bank or bank holding company.
Dividends; Source of Strength
The FRB has issued a policy statement on the payment of cash dividends by bank holding companies, which expresses the FRB’s view that a bank holding company should pay cash dividends only to the extent that its net income for the past year is sufficient to cover both the cash dividend and a rate of retention consistent with its needs. The FRB policy statement also indicates that it would be inappropriate for a bank holding company experiencing serious financial problems to borrow money to pay dividends. In addition, compliance with capital adequacy guidelines at both a bank subsidiary and a bank holding company could affect such entity’s ability to pay dividends, if its capital levels were to decrease.
Under FRB policy, we are expected to act as a source of financial strength to the Bank and to commit resources to support the Bank in circumstances where we might not deem it appropriate to do so, absent such policy.
Baylake Bank
The Bank is a banking institution that is chartered by and headquartered in the State of Wisconsin, and it is subject to supervision and regulation by the Wisconsin Department of Financial Institutions, Division of Banking (“WDFI”). The WDFI supervises and regulates all areas of the Bank’s operations including, without limitation, the making of loans, the issuance of securities, the conduct of the Bank’s corporate affairs, the satisfaction of capital adequacy requirements, the payment of dividends and the establishment or closing of banking centers. The Bank is also a member of the Federal Reserve System, which makes the Bank’s operations subject to broad federal regulation and oversight by the FRB. In addition, the Bank’s deposit accounts are insured by the FDIC to the maximum extent permitted by law, and the FDIC has certain enforcement powers over the Bank.
| 8 |
Reserves
The FRB requires all depository institutions to maintain reserves against specified transaction accounts. Reserves are required to be maintained against aggregate transaction accounts as follows: a 3% reserve ratio is assessed on net transaction accounts over $15.2 million up to and including $110.2 million; a 10% reserve ratio is applied above $110.2 million. The first $15.2 million of otherwise reservable balances (subject to adjustments by the FRB) are exempted from reserve requirements. The Bank complies with the foregoing requirements. In October 2008, the FRB began paying interest on certain reserve balances. In addition, the reserve balances imposed by the FRB may be used by the Bank to satisfy liquidity requirements. An institution may borrow from the Reserve Bank “discount window” as a secondary source of funds, provided that the institution meets the Reserve Bank’s credit standards. The 2015 limits as stated above are reviewed annually and any changes are applicable to the following calendar year.
Dividends
The Bank is subject to legal limitations on the frequency and amount of dividends that can be paid to us. The FRB may restrict the ability of the Bank to pay dividends if such payments would constitute an unsafe or unsound banking practice. These regulations and restrictions may limit our ability to obtain funds from the Bank for our cash needs, including funds for acquisitions, payment of interest on our subordinated debentures and other debt obligations, payment of dividends and operating expenses. In addition, Wisconsin law requires that dividends of Wisconsin banks be paid out of current earnings or, no more than once within the immediate preceding two years, out of undivided profits. Any other dividends require the prior written consent of the WDFI.
Deposit Insurance
The Bank is a member of the Deposit Insurance Fund (“DIF”), which is administered by the FDIC. The Bank’s deposit accounts are insured by the FDIC, generally up to a maximum of $250,000. The FDIC imposes an assessment against all depository institutions. An institution’s assessment rate depends upon the category to which it is assigned and certain adjustments specified by the FDIC regulations, with less risky institutions paying lower rates. Assessment rates (inclusive of possible adjustments) currently range from 2.5 to 45 basis points of each institution’s total assets less tangible capital. The FDIC may increase or decrease the range of assessments uniformly, except that no adjustment can deviate more than two basis points from the base assessment rate without notice and comment rulemaking. The FDIC’s current assessment system represents a change, required by the Dodd-Frank Act, from its prior practice of basing the assessment on an institution’s aggregate deposits.
The FDIC has the authority to increase insurance assessments. A significant increase in insurance assessments would likely have an adverse effect on the operating expenses and results of operations of the Bank. We cannot predict what insurance assessment rates will be in the future.
Insurance of deposits may be terminated by the FDIC upon a finding that an institution has engaged in unsafe or unsound practices, is in an unsafe or unsound condition to continue operations or has violated any applicable law, regulation, rule, order or condition imposed by the FDIC. We do not know of any practice, condition or violation that might lead to termination of our deposit insurance.
In addition to the FDIC assessments, the Financing Corporation (“FICO”) is authorized to impose and collect, with the approval of the FDIC, assessments for anticipated payments, issuance costs and custodial fees on bonds issued by the FICO in the 1980s to recapitalize the former Federal Savings and Loan Insurance Corporation. The bonds issued by the FICO are due to mature in 2017 through 2019. For the quarter ended December 31, 2015, the annualized FICO assessment was equal to 0.60 basis points of total assets less tangible capital.
Transactions with Affiliates
Federal law limits the Bank’s authority to engage in transactions with “affiliates” (e.g., any entity that controls or is under common control with the Bank, including us and our other subsidiaries). The aggregate amount of covered transactions with any individual affiliate is limited to 10% of the capital and surplus of the Bank. The aggregate amount of covered transactions with all affiliates is limited to 20% of the Bank’s capital and surplus. Certain transactions with affiliates are required to be secured by collateral in an amount and of a type specified by federal law. The purchase of low quality assets from affiliates is generally prohibited. Transactions with affiliates must generally be on terms and under circumstances that are at least as favorable to the institution as those prevailing at the time for comparable transactions with non-affiliated companies.
| 9 |
The Sarbanes-Oxley Act of 2002 generally prohibits us from lending money to our executive officers and directors. However, the law contains a specific exception for loans by a depository institution to its executive officers and directors in compliance with federal banking laws. Under such laws, the Bank’s authority to extend credit to executive officers, directors and 10% shareholders (“insiders”), as well as entities such persons control, is limited. The laws limit both the individual and aggregate amount of loans that the Bank may make to insiders based, in part, on the Bank’s capital level and requires that certain board approval procedures be followed. Such loans are required to be made on terms substantially the same as those offered to non-insiders and not involve more than the normal risk of repayment. There is an exception for loans made pursuant to a benefit or compensation program that is widely available to all employees of the institution and does not give preference to insiders over other employees. Loans to executive officers are subject to additional limitations based on the type of loan involved.
Community Reinvestment Act
Under the Community Reinvestment Act (“CRA”) and the implementing regulations, the Bank has a continuing and affirmative obligation to help meet the credit needs of its local community, including low and moderate-income neighborhoods, consistent with the safe and sound operation of the Bank. The CRA requires the boards of directors of financial institutions, such as the Bank, to adopt a CRA statement for each assessment area that, among other things, describes its efforts to help meet community credit needs and the specific types of credit that the institution is willing to extend. The Bank’s service area is designated and comprises the four counties within the geographic area of Northeast Wisconsin. The Bank’s board of directors is required to review the appropriateness of this delineation at least annually.
The Bank underwent a CRA Performance Evaluation by the Federal Reserve on October 19, 2015, for which it received a Satisfactory rating.
Prompt Corrective Action
The FRB has adopted risk-based capital adequacy guidelines for bank holding companies and their subsidiary state-chartered banks that are members of the FRB. The risk-based capital guidelines are designed to make regulatory capital requirements more sensitive to differences in risk profiles among banks and bank holding companies, to account for off-balance sheet exposure, to minimize disincentives for holding liquid assets, and to achieve greater consistency in evaluating the capital adequacy of major banks throughout the world. Under these guidelines, assets and off-balance sheet items are assigned to broad risk categories each with designated weights. The resulting capital ratios represent capital as a percentage of total risk-weighted assets and off-balance sheet items.
The current guidelines require all bank holding companies and federally regulated banks to maintain a minimum risk-based total capital ratio equal to 8%, of which at least 6.0% must be Tier 1 Capital. Tier 1 Capital, which includes common shareholders’ equity, noncumulative perpetual preferred stock, and a limited amount of cumulative perpetual preferred stock and trust preferred securities, less certain goodwill items and other intangible assets, is required to equal at least 4% of risk-weighted assets. The remainder (“Tier 2 Capital”) may consist of (i) an allowance for loan losses of up to 1.25% of risk-weighted assets, (ii) excess of qualifying perpetual preferred stock, (iii) hybrid capital instruments, (iv) perpetual debt, (v) mandatory convertible securities, and (vi) subordinated debt and intermediate-term preferred stock up to 50% of Tier 1 Capital. Total capital is the sum of Tier 1 Capital and Tier 2 Capital, less reciprocal holdings of other banking organizations’ capital instruments, investments in unconsolidated subsidiaries and any other deductions as determined by the appropriate regulator. Effective January 1, 2015, the new Common Equity ratio requirement was implemented with a 4.5% minimum threshold. Common Equity mirrors Tier 1 Capital, excluding trust preferred securities and cumulative preferred securities and may be adjusted for deferred tax benefits.
The federal bank regulatory authorities have also adopted regulations that supplement the risk-based guidelines. These regulations generally require banks and bank holding companies to maintain a minimum level of Tier 1 Capital to total assets less goodwill of 4% (the “Leverage Ratio”). The FRB permits a bank to maintain a minimum 3% Leverage Ratio if the bank achieved a 1 rating under the CAMELS rating system in its most recent examination, as long as the bank is not experiencing or anticipating significant growth. The CAMELS rating is a non-public system used by bank regulators to rate the strengths and weaknesses of financial institutions. The CAMELS rating comprises six categories: capital adequacy, asset quality, management, earnings, liquidity and sensitivity to market risk. Banking organizations experiencing or anticipating significant growth, as well as those organizations that do not satisfy the criteria described above, will be required to maintain a minimum leverage ratio ranging generally from 4% to 5%.
| 10 |
The Federal Deposit Insurance Act (“FDIA”) requires, among other things, the federal banking agencies to take “prompt corrective action” with respect to depository institutions that do not meet minimum capital requirements. The capital-based regulatory framework consists of five categories of compliance with regulatory capital guidelines, including “well-capitalized,” “adequately capitalized,” “undercapitalized,” “significantly undercapitalized” and “critically undercapitalized.” To qualify as a “well-capitalized” institution, a bank must have a Leverage Ratio of no less than 5%, a Common Equity ratio of no less than 6.5%, a Tier 1 Capital ratio of no less than 8.0% and a total risk-based capital ratio of no less than 10%, and the bank must not be under any order or directive from the appropriate regulatory agency to meet and maintain a specific capital level. Generally, a bank must be “well-capitalized” before the FRB will approve an application by a bank holding company to acquire or merge with another bank or bank holding company. A bank’s capital category is determined solely for the purpose of applying prompt corrective action regulations, and the capital category may not constitute an accurate representation of the bank’s overall financial condition or prospects for other purposes.
Under the regulations, the applicable agency can treat an institution as if it were in the next lower category if the agency determines that the institution is in an unsafe or unsound condition or is engaging in an unsafe or unsound practice. The degree of regulatory scrutiny of a financial institution will increase, and the permissible activities of the institution will decrease, as it moves downward through the capital categories. Institutions that fall into one of the three undercapitalized categories may be required to (i) submit a capital restoration plan; (ii) raise additional capital; (iii) restrict their growth, deposit interest rates, and other activities; (iv) improve their management; (v) eliminate management fees; or (vi) divest themselves of all or a part of their operations. Bank holding companies can be called upon to boost the institutions’ capital and to partially guarantee the institutions’ performance under their capital restoration plans.
Immediately upon becoming undercapitalized, a depository institution becomes subject to the provisions of Section 38 of the FDIA, which (a) restricts payment of capital distributions and management fees; (b) requires that the appropriate federal banking agency monitor the condition of the institution and its efforts to restore its capital; (c) requires submission of a capital restoration plan; (d) restricts the growth of the institution’s assets; and (e) requires prior approval of certain expansion proposals. The appropriate federal banking agency for an undercapitalized institution also may take any number of discretionary supervisory actions if the agency determines that any of these actions is necessary to resolve the problems of the institution at the least possible long-term cost to the DIF. These discretionary supervisory actions include: (i) requiring the institution to raise additional capital; (ii) restricting transactions with affiliates; (iii) requiring divestiture of the institution or sale of the institution to a willing purchaser; and (iv) any other supervisory action that the agency deems appropriate. These and additional mandatory and permissive supervisory actions may be taken with respect to significantly undercapitalized and critically undercapitalized institutions.
As of December 31, 2015, we and the Bank exceeded the guidelines contained in the applicable regulations, policies and directives pertaining to capital adequacy to be classified as “well-capitalized.”
The Basel III Capital Rules revised the current prompt corrective action requirements effective January 1, 2015 by: (i) introducing a Common Equity ratio requirement at each level (other than critically undercapitalized), with the required Common Equity ratio being 6.5% for “well-capitalized” status; (ii) increasing the minimum Tier 1 capital ratio requirement for each category (other than critically undercapitalized), with the minimum Tier 1 capital ratio for well-capitalized status being 8% (compared to the current 6%); and (iii) eliminating the current provision that provides that a bank with a composite supervisory rating of 1 may have a 3% leverage ratio and still be adequately capitalized. The Basel III Capital Rules do not change the total risk-based capital requirement for any prompt corrective action category.
Interstate Banking and Branching
The BHCA was amended by the Interstate Banking Act. The Interstate Banking Act provides that adequately capitalized and managed bank holding companies are permitted to acquire banks in any state.
State laws prohibiting interstate banking or discriminating against out-of-state banks are preempted. States are not permitted to enact laws opting out of this provision; however, states are allowed to adopt minimum age restrictions requiring that target banks located within the state be in existence for a period of years, up to a maximum of five years, before a bank may be subject to the Interstate Banking Act. The Interstate Banking Act, as amended by the Dodd-Frank Act, establishes deposit caps which prohibit acquisitions that result in the acquiring company controlling 30% or more of the deposits of insured banks and thrift institutions held in the state in which the target maintains a branch or 10% or more of the deposits nationwide. States have the authority to waive the 30% deposit cap. State-level deposit caps are preempted as long as they do not discriminate against out-of-state companies, and the federal deposit caps apply only to initial entry acquisitions.
Under the Dodd-Frank Act, national banks and state banks are able to establish branches in any state if that state would permit the establishment of the branch by a state bank chartered in that state. Applications to establish such branches must still be filed with the appropriate primary federal regulator.
| 11 |
Bank Secrecy Act/Anti-money Laundering
The Uniting and Strengthening America by Providing Appropriate Tools Required to Intercept and Obstruct Terrorism Act of 2001 (“USA PATRIOT Act”) provides the federal government with additional powers to address terrorist threats through enhanced domestic security measures, expanded surveillance powers, increased information sharing and broad anti-money laundering requirements. By way of amendments to the Bank Secrecy Act (“BSA”), the USA PATRIOT Act puts in place measures intended to encourage information sharing among bank regulatory and law enforcement agencies. In addition, certain provisions of the USA PATRIOT Act impose affirmative obligations on a broad range of financial institutions.
Among other requirements, the USA PATRIOT Act and related regulations require banks to establish anti-money laundering programs. Those programs must, at a minimum: (1) provide for a system of internal controls to assure ongoing compliance; (2) provide for independent testing for compliance; (3) designate an individual responsible for coordinating and monitoring day-to-day compliance; and (4) provide for training for appropriate personnel. Additionally, the USA PATRIOT Act requires each financial institution to develop a customer identification program (“CIP”) as part of its anti-money laundering program. The key components of the CIP are identification, verification, government list comparison, notice and record retention. The purpose of the CIP is to enable the financial institution to determine the true identity and anticipated account activity of each customer. We and our affiliates have adopted policies, procedures and controls to comply with the BSA and the USA PATRIOT Act.
Office of Foreign Assets Control Regulations
The United States has imposed economic sanctions that affect transactions with designated foreign countries, nationals and others. These are typically known as the “OFAC” rules based on their administration by the U.S. Treasury Department Office of Foreign Assets Control (“OFAC”). The OFAC-administered sanctions targeting countries take many different forms. Generally, however, they contain one or more of the following elements: (i) restrictions on trade with or investment in a sanctioned country, including prohibitions against direct or indirect imports from and exports to a sanctioned country and prohibitions on “U.S. persons” engaging in financial transactions relating to making investments in, or providing investment-related advice or assistance to, a sanctioned country; and (ii) a blocking of assets in which the government or specially designated nationals of the sanctioned country have an interest, by prohibiting transfers of property subject to U.S. jurisdiction (including property in the possession or control of U.S. persons). Blocked assets (e.g. property and bank deposits) cannot be paid out, withdrawn, set off or transferred in any manner without a license from OFAC. Failure to comply with these sanctions could have serious legal, monetary and reputational consequences.
Regulatory Enforcement Authority
Federal and state banking laws grant substantial regulatory enforcement powers to federal and state banking regulators. This enforcement authority includes, among other things, the ability to assess civil money penalties, to issue cease and desist or removal orders and to initiate injunctive actions against banking organizations and institution-affiliated parties. In general, these enforcement actions may be initiated for violations of laws and regulations and unsafe or unsound practices. Other actions or inactions may provide the basis for enforcement action, including misleading or untimely reports filed with regulatory agencies.
Privacy
Under the GLB Act, federal banking regulators adopted rules limiting the ability of banks and other financial institutions to disclose nonpublic information about consumers to nonaffiliated third parties. The rules require disclosure of privacy policies to consumers and, in some circumstances, allow consumers to prevent disclosure of certain personal information to nonaffiliated third parties.
Incentive Compensation Policies and Restrictions
In July 2010, the federal banking agencies issued guidance that applies to all banking organizations supervised by the agencies (thereby including both us and the Bank). Pursuant to the guidance, to be consistent with safety and soundness principles, a banking organization’s incentive compensation arrangements should (i) provide employees with incentives that appropriately balance risk and reward; (ii) be compatible with effective controls and risk management; and (iii) be supported by strong corporate governance, including active and effective oversight by the banking organization’s board of directors. Monitoring methods and processes used by a banking organization should be commensurate with the size and complexity of the organization and its use of incentive compensation.
| 12 |
In addition, the Dodd-Frank Act requires the federal bank regulatory agencies and the SEC to establish joint regulations or guidelines prohibiting incentive-based payment arrangements at specified regulated entities having at least $1 billion in total assets that encourage inappropriate risks by providing an executive officer, employee, director or principal shareholder with excessive compensation, fees or benefits or that could lead to material financial loss to the entity. In addition, these regulators must establish regulations or guidelines requiring enhanced disclosure to regulators of incentive-based compensation arrangements. The agencies proposed such regulations in April 2011, but final rules have not yet been published, however, we believe that we are in compliance with the rules as currently proposed.
The FRB will review, as part of the regular risk-focused examination process, the incentive compensation arrangements of banking organizations, such as us and the Bank, that are not “large, complex banking organizations.” These reviews will be tailored to each organization based on the scope and complexity of the organization’s activities and the prevalence of incentive compensation arrangements. The findings of the supervisory initiatives will be included in reports of examination. Deficiencies will be incorporated into the organization’s supervisory ratings, which can affect the organization’s ability to make acquisitions and take other actions. Enforcement actions may be taken against a banking organization if its incentive compensation arrangements, or related risk management control or governance processes, pose a risk to the organization’s safety and soundness and the organization is not taking prompt and effective measures to correct the deficiencies.
Volcker Rule
The Dodd-Frank Act prohibits insured depository institutions and their holding companies from engaging in proprietary trading except in limited circumstances, and prohibits them from owning equity interest in excess of three percent (3%) of Tier 1 Capital in private equity and hedge funds (known as the “Volcker Rule”). On December 10, 2013, five U.S. financial regulators, including the Federal Reserve, adopted final rules (the “Final Rules”) implementing the Volcker Rule. The Final Rules prohibit banking entities from (1) engaging in short-term proprietary trading for their own accounts, and (2) having certain ownership interest in and relationships with hedge funds or private equity funds, which are referred to as “covered funds.” The Final Rules are intended to provide greater clarity with respect to both the extent of those primary prohibitions and of the related exemptions and exclusions. The Final Rules also require each regulated entity to establish an internal compliance program that is consistent with the extent to which it engages in activities covered by the Volcker Rule, which must include (for the largest entities) making regular reports about those activities to regulators. Although the Final Rules provide some tiering of compliance and reporting obligations based on size, the fundamental prohibitions of the Volcker Rule apply to banking entities of any size, including us and the Bank. The Final Rules were effective April 1, 2014, but the conformance period was extended from its statutory end of date of July 21, 2014 until July 21, 2015. In addition, the Federal Reserve granted an extension until July 21, 2016 of the conformance period for banking entities to conform investments and relationships with covered funds that were in place prior to December 31, 2013, and announced its intention to further extend this aspect of the conformance period until July 21, 2017. We have evaluated the implications of the Final Rules on our investments and do not expect any material financial implications.
Ability-to-Repay and Qualified Mortgage Rule
Pursuant to the Dodd-Frank Act, the CFPB issued a final rule on January 10, 2013 (effective on January 10, 2014) amending Regulation Z as implemented by the Truth in Lending Act, requiring mortgage lenders to make a reasonable and good faith determination based on verified and documented information that a consumer applying for a mortgage loan has a reasonable ability to repay the loan according to its terms. Mortgage lenders are required to determine consumers’ ability to repay in one of two ways. The first alternative requires the mortgage lender to consider the following eight underwriting factors when making the credit decision: (i) current or reasonably expected income or assets; (ii) current employment status; (iii) the monthly payment on the covered transaction; (iv) the monthly payment on any simultaneous loan; (v) the monthly payment for mortgage-related obligations; (vi) current debt obligations, alimony and child support; (vii) the monthly debt-to-income ratio or residual income; and (viii) credit history. Alternatively, the mortgage lender can originate “qualified mortgages,” which are entitled to a presumption that the creditor making the loan satisfied the ability-to-repay requirements. In general, a qualified mortgage is a mortgage loan without negative amortization, interest-only payments, balloon payments, or terms exceeding 30 years. In addition, to be a qualified mortgage the points and fees paid by a consumer cannot exceed 3% of the total loan amount. Qualified mortgages that are “higher priced” (e.g. subprime loans) are given a safe harbor of compliance. The Bank is predominantly an originator of compliant qualified mortgages.
| 13 |
Consumer Laws and Regulations
The Bank is also subject to other federal and state consumer laws and regulations that are designed to protect consumers in transactions with banks. While the list set forth below is not exhaustive, these laws and regulations include the Truth in Lending Act, the Truth in Savings Act, the Electronic Funds Transfer Act, the Expedited Funds Availability Act, the Check Clearing for the 21st Century Act, the Fair Credit Reporting Act, the Equal Credit Opportunity Act, the Fair Housing Act, the Home Mortgage Disclosure Act, the Fair and Accurate Transactions Act, the Mortgage Disclosure Improvement Act and the Real Estate Settlement Procedures Act, among others. These laws and regulations mandate certain disclosure requirements and regulate the manner in which financial institutions must deal with customers when taking deposits or making loans to customers. The Bank must comply with the applicable provisions of these consumer protection laws and regulations as part of its ongoing customer relations.
Legislative and Regulatory Initiatives
From time to time, various legislative and regulatory initiatives are introduced in Congress and state legislatures, as well as by regulatory agencies. Such initiatives may include proposals to expand or contract the powers of bank holding companies and depository institutions or proposals to substantially change the financial institution regulatory system. Such legislation could change banking statutes and our operating environment in substantial and unpredictable ways. If enacted, such legislation could increase or decrease the cost of doing business, limit or expand permissible activities or affect the competitive balance among banks, savings associations, credit unions and other financial institutions. We cannot predict whether any such legislation will be enacted and, if enacted, the effect that it or any implementing regulations would have on our financial condition or results of operations. A change in statutes, regulations or regulatory policies applicable to us or any of our subsidiaries could have a material effect on our business, financial condition and results of operations.
Employees
At December 31, 2015,
we had 261 total employees company-wide, 244 of which were full-time. We consider our relationship with our employees to be good.
At December 31, 2014, we had 261 total employees, 243 of which were full-time.
| 14 |
Forward-Looking Statements
This report contains statements that may constitute forward-looking statements within the meaning of the safe-harbor provisions for forward-looking statements contained in the Private Securities Litigation Reform Act of 1995, such as statements other than historical facts contained or incorporated by reference in this report. These forward-looking statements include statements with respect to our financial condition, results of operations, plans, objectives, future performance and business, including statements preceded by, followed by or that include the words “believes,” “expects,” or “anticipates,” references to estimates or similar expressions. Future filings by us with the SEC, and future statements other than historical facts contained in written material, press releases and oral statements issued by us, or on our behalf, may also constitute forward-looking statements.
Forward-looking statements are subject to significant risks and uncertainties, and our actual results may differ materially from the results discussed in such forward-looking statements. Factors that might cause actual results to differ from the results discussed above include, but are not limited to, the Risk Factors set forth below and any other risks identified in this report or in other filings we may make with the SEC. All forward-looking statements contained in this report or which may be contained in future statements made for or on our behalf are based upon information available at the time the statement is made and we assume no obligation to update any forward-looking statements.
Risk Factors
An investment in our common stock contains a high degree of risk. In addition to the other information contained in, or incorporated by reference into, this Form 10-K, including the matters addressed under the caption “Forward Looking Statements” above, you should carefully consider the risks described below before deciding whether to invest in our common stock. If any of the events highlighted in the following risks actually occur, or if additional risks and uncertainties not presently known to us or that we do not currently believe to be important to you, materialize, our business, results of operations or financial condition would likely suffer. In such an event, the trading price of our common stock could decline and you could lose all or part of your investment. In assessing these risks, you should also refer to the other information contained in our filings with the SEC, including our financial statements and related notes.
Risks Relating to the Merger
We will be subject to business uncertainties while the Merger is pending, which could adversely affect our business.
Uncertainty about the effect of the Merger on employees and customers may have an adverse effect on us and, consequently, the combined company. Although we have undertaken steps to reduce any adverse effects, these uncertainties may impair our ability to attract, retain and motivate key personnel until the Merger is consummated and for a period of time thereafter, and could cause customers and others that deal with us to seek to change their existing business relationship with us. Our employee retention may be particularly challenging during the pendency of the Merger, as employees may experience uncertainty about their roles with the combined company following the Merger.
The Merger Agreement contains provisions that restrict our ability to pursue alternatives to the Merger and, in specified circumstances, could require us to pay a termination fee to Nicolet.
Under the Merger Agreement, we and Nicolet have agreed that, subject to certain exceptions, neither us nor any of our subsidiaries, affiliates or representatives will initiate, solicit, encourage or knowingly facilitate any inquiries or proposals with respect to, or engaging in any negotiations concerning, or provide any confidential or nonpublic information or data to, or have any discussions with, any person relating to, any acquisition proposal.
| 15 |
Prior to receipt of the requisite shareholder proposals, we and Nicolet may, if our respective board determines, in good faith, after consultation with outside counsel, that a failure to do so would be inconsistent with their directors’ duties under Wisconsin law, and subject to our compliance with the restrictions set forth above, in response to a bona fide acquisition proposal received after the date of the Merger Agreement that the board determines, in good faith, after consultation with outside counsel and its financial advisors, constitutes or is reasonably capable of resulting in a superior acquisition proposal, and so long as such acquisition proposal was not solicited by us and did not otherwise result from breach or a deemed breach of the restrictions set forth above, (i) furnish information with respect to us to the person making such acquisition proposal and its representative pursuant to a customary confidentiality agreement, (ii) participate in discussions and negotiations with such person and its representatives regarding such acquisition proposal, and (iii) terminate the Merger Agreement in order to concurrently enter into an agreement with respect to such acquisition proposal; provided, however, that we or Nicolet may not terminate the Merger Agreement unless and until five business days have elapsed following the delivery to the other party of a written notice of such determination by our board or the Nicolet board, and during such five business day period the parties cooperate with one another with the intent of enabling the parties to engage in good faith negotiations so that the Merger may be effected and, at the end of such five business day period, we or Nicolet continues in good faith and after consultation with outside legal counsel and financial advisors, to believe that a superior acquisition proposal continues to exist.
If we or Nicolet receive a superior acquisition proposal and as a result thereof our respective boards determine in good faith and after consultation with outside counsel and its financial advisors that a failure to so act would be inconsistent with the directors’ duties under Wisconsin law, then before receipt of shareholder approval (and in no event after receipt of such approvals) our or Nicolet’s board may make a recommendation change and/or, subject to its compliance with the terms of the Merger Agreement, including as set forth above, terminate the Merger Agreement in order to enter concurrently into a definitive agreement providing for the implementation of such superior acquisition proposal. Under such circumstances, we or Nicolet may be required to pay a termination fee equal to $7,000,000 to the other party. These provisions could discourage a third party that may have an interest in acquiring all or a significant part of us or Nicolet from considering or proposing such acquisition, even if such third party were prepared to enter into a transaction that would be more favorable to us or Nicolet and our respective shareholders than the Merger and other transactions contemplated by the Merger Agreement.
Completion of the Merger is subject to certain conditions, and if these conditions are not satisfied or waived, the Merger will not be completed.
The obligations of Nicolet and us to complete the Merger are subject to satisfaction or waiver (if permitted) of a number of conditions. The satisfaction of all of the required conditions could delay the completion of the Merger for a significant period of time or prevent it from occurring. Any delay in completing the Merger could cause the combined company not to realize some or all of the benefits that the combined company expects to achieve if the Merger is successfully completed within its expected timeframe. Further, there can be no assurance that the conditions to closing of the Merger will be satisfied or waived or that the Merger will be completed.
Failure to complete the Merger could negatively impact our stock price and our future business and financial results.
If the Merger is not completed for any reason, including as a result of our shareholders failing to approve the Merger or other transactions contemplated by the Merger Agreement, our ongoing business may be adversely affected and, without realizing any of the benefits of having completed the Merger, we would be subject to a number of risks including the following:
| • | We may be required, under certain circumstances, to pay a termination fee to Nicolet; |
| • | We are subject to certain restrictions on the conduct of our business prior to completing the Merger, which may adversely affect our abilities to execute certain aspects of our business strategies; |
| • | We may experience negative reactions from the financial markets, including negative impacts on our stock prices from our customers, regulatory and employees; |
| • | We have incurred and will continue to incur certain costs and fees associated with the Merger and other transactions contemplated by the Merger Agreement; |
| • | Matters relating to the Merger (including integration planning) may require substantial commitments of time and resources by our management, which would otherwise have been devoted to day-to-day operations and other opportunities that may have been beneficial to us as an independent company. |
| 16 |
In addition, we could be subject to litigation related to any failure to complete the Merger or related to any enforcement proceeding commenced against us to perform our obligations under the Merger Agreement. If the Merger is not completed, these risks may materialize and may adversely affect our business, financial condition, financial results and stock price.
Risks Related to Our Lending and Credit Activities
We are subject to lending concentration risks.
As of December 31, 2015, approximately 71.8% of our loan portfolio consisted of commercial and industrial, real estate construction and commercial real estate loans (collectively, “commercial loans”). Commercial loans are generally viewed as having more inherent risk of default than residential mortgage loans or retail loans. Also, the commercial loan balance per borrower is typically larger than that for residential mortgage loans and retail loans, inferring higher potential losses on an individual loan basis. Because the Bank’s loan portfolio contains a number of larger commercial loans, the deterioration of one or a few of these loans could cause a significant increase in nonaccrual loans, which could result in a loss of interest income from these loans, an increase in the provision for loan losses, and an increase in loan charge offs, all of which could have a material adverse effect on our financial condition and results of operations.
Our business may be adversely affected by conditions in the financial markets and economic conditions generally, as our borrowers’ ability to repay loans and the value of the collateral securing our loans decline.
Our success depends, to a certain extent, upon local and national economic and political conditions, as well as governmental monetary policies. Conditions such as an economic recession, rising unemployment, changes in interest rates, money supply and other factors beyond our control may adversely affect our asset quality, deposit levels and loan demand and, therefore our earnings. Because we have a significant amount of real estate loans, decreases in real estate values could adversely affect the value of property used as collateral. Adverse changes in the economy may also have a negative effect on the ability of our borrowers to make timely repayments of their loans, which could have an adverse impact on our earnings. Consequently, any decline in the economy in our market area could have a material adverse effect on our financial condition and results of operations.
Weakness in the markets for residential or commercial real estate, including the secondary residential mortgage loan markets, could reduce our net income and profitability.
There can be no assurance that the economy will not enter into another recession, whether in the near term or long term. Significant declines in real estate values in Northeastern Wisconsin coupled with the impact of any future possible economic downturns and high unemployment levels, could drive losses beyond the levels provided for in our allowance for loan losses, in which case our future earnings would be adversely affected.
Additional declines in real estate values and home sales within Northeastern Wisconsin, and financial stress on borrowers as a result of job losses, or other factors, could have further adverse effects on borrowers that might result in higher delinquencies and greater charge-offs in future periods, which would adversely affect our financial condition and results of operations.
Our allowance for loan losses may be insufficient.
To address risks inherent in our loan portfolio, we maintain an allowance for loan losses that represents management’s best estimate of probable losses that may occur within our existing loan portfolio. The level of the allowance reflects management’s continuing evaluation of various factors, including industry concentrations, specific credit risks, loan loss experience, current loan portfolio quality, present economic, political and regulatory conditions, and unidentified losses inherent in the current loan portfolio. Determining the appropriate level of the allowance for loan losses involves a high degree of subjectivity and requires us to make estimates of significant credit risks and future trends, all of which may undergo material changes. In evaluating our impaired loans, we assess repayment expectations and determine collateral values based on all information that is available to us. However, we must often make subjective decisions based on our assumptions about the creditworthiness of the borrowers and the value of the collateral.
| 17 |
Continuing deterioration in economic conditions affecting borrowers, new information regarding existing loans, identification of additional problem loans, and other factors, both within and outside of our control, may require an increase in our allowance for loan losses. In addition, bank regulatory agencies periodically examine our allowance for loan losses and may require an increase in the allowance or the recognition of further loan charge-offs, based on judgments different from those of management.
If charge-offs in future periods exceed our allowance for loan losses, we will need to take additional loan loss provisions to increase our allowance for loan losses. Any additional loan loss provisions will reduce our net income or increase our net loss, which would have a material adverse effect on our financial condition and results of operations.
We are subject to environmental liability risk associated with collateral securing our real estate lending.
Because a significant portion of our loan portfolio is secured by real property, from time to time we may find it necessary to foreclose on and take title to properties securing such loans. In doing so, there is a risk that hazardous or toxic substances could be found on those properties. If such substances are found, we may be liable for remediation costs, as well as for personal injury and property damage. We may also be required to incur substantial expenses that could materially reduce the affected property’s value or limit our ability to use or sell the affected property. In addition, future environmental laws or more stringent interpretations or enforcement policies with respect to existing laws may increase our exposure to environmental liability. Although we are careful to perform environmental reviews on properties prior to foreclosure, our reviews may not detect all environmental hazards.
We rely on the accuracy and completeness of information about customers or counterparties, and inaccurate or incomplete information could negatively impact our financial condition and results of operations.
In deciding whether to extend credit or enter into other transactions with customers and counterparties, we may rely on information provided to us by such customers and counterparties, including financial statements and other financial information. We may also rely on representations of customers and counterparties as to the accuracy and completeness of that information and, with respect to financial statements, on reports of independent auditors. Our financial condition and results of operations could be negatively impacted to the extent we rely on financial statements that do not comply with generally accepted accounting principles or that are inaccurate or misleading.
Risks Related to Our Operations
We are subject to interest rate risk.
Our earnings and cash flows are largely dependent upon our net interest income, which is the difference between interest income on interest-earning assets such as loans and securities and interest expense paid on interest-bearing liabilities such as deposits and borrowed funds. There are many factors that influence interest rates that are beyond our control including, but not limited to, general economic conditions and governmental policy, in particular, the policies of the FRB. Any changes in such policies, including changes in interest rates, could influence the amount of interest we receive on loans and securities and the amount of interest we pay on deposits and borrowings.
Such changes could also affect (i) our ability to originate loans and obtain deposits, (ii) the value of our financial assets and liabilities, and (iii) the average maturity of our securities portfolio. In addition, an increase in the general level of interest rates may also adversely affect the ability of certain of our borrowers to repay their obligations. If the interest rates paid on deposits and other borrowings increase at a faster rate than the interest rates received on loans and other investments, our net interest income, and therefore our earnings, would be adversely affected. Earnings would also be adversely affected if the interest rates received on loans and other investments fall more quickly than the interest rates paid on deposits and other borrowings.
Management uses various methods to monitor interest rate risk and believes it has implemented effective asset and liability strategies to reduce the potential effects of changes in interest rates on our results of operations. Management also periodically adjusts our mix of assets and liabilities to manage interest rate risk. However, any substantial, unexpected, prolonged change in market interest rates could have a material adverse effect on our financial condition and results of operations.
| 18 |
The mortgage-backed securities in which we invest are subject to several types of risk.
We invest in mortgage-backed securities that evidence interests in, or are secured by, a single mortgage loan or a pool of mortgage loans. Accordingly, these securities are subject to all of the risks of the underlying mortgage loans. In a rising interest rate environment, the value of mortgage-backed securities may be adversely affected when prepayments on underlying mortgages do not occur as anticipated, resulting in the extension of the security’s effective maturity and the related increase in interest rate sensitivity of a longer-term instrument. The value of mortgage-backed securities may also change due to shifts in the market’s perception of issuers and regulatory or tax changes adversely affecting the mortgage-backed securities market as a whole. In addition, mortgage-backed securities are subject to the credit risk associated with performance of the underlying mortgage properties. Private label mortgage-backed securities are issued by investment banks, not financial institutions, and while the loans that are pooled to create the security carry government agency guarantees, the securities themselves are not insured or guaranteed by the United States government. Finally, mortgage-backed securities are also subject to geographic risk when the mortgages underlying the securities are concentrated in one or more geographic areas. This risk is managed by monitoring the geographic dispersion of the underlying loans in each security. As of December 31, 2015, the highest concentration of loans secured by 1-4 family homes issued in any state was issued in California and those loans represented approximately 15.3% of the total amount we had invested in mortgage-backed securities as of that date.
Although we generally invest in mortgage-backed securities collateralized by residential loans, the value of such securities can be negatively impacted by any dislocation in the mortgage-backed securities market in general. During the recent economic downturn, the mortgage-backed securities market suffered from a severe dislocation created by mortgage pools that included sub-prime mortgages secured by residential real estate.
Changes in our accounting policies or in accounting standards could materially affect how we report our financial results and condition.
Our accounting policies are fundamental to understanding our financial results and condition. Some of these policies require use of estimates and assumptions that may affect the value of our assets or liabilities and financial results. Some of our accounting policies are critical because they require management to make difficult, subjective and complex judgments about matters that are inherently uncertain and because it is likely that materially different amounts would be reported under different conditions or using different assumptions. If such estimates or assumptions underlying our financial statements are incorrect, we may experience material losses.
From time to time, the Financial Accounting Standards Board (“FASB”) changes the financial accounting and reporting standards or the interpretation of those standards that govern the preparation of our external financial statements. These changes are beyond our control, can be hard to predict and could materially impact how we report our results of operations and financial condition. We could be required to apply a new or revised standard retroactively, resulting in our restating prior period financial statements in material amounts.
Our controls and procedures may fail or be circumvented.
Management regularly reviews and updates our internal controls, disclosure controls and procedures, and corporate governance policies and procedures. Any system of controls, however well-designed and operated, is based in part on certain assumptions and can provide only reasonable assurances that the objectives of the system are met. Any failure or circumvention of our controls and procedures or failure to comply with regulations related to controls and procedures could have a material adverse effect on our business, financial condition and results of operations.
Uncertainty in the financial markets could result in lower fair values for our investment securities, which fair values may not be realizable if we were to sell those securities today.
In assessing whether any impairment of investment securities we hold is other-than-temporary, management considers the length of time and extent to which the fair value has been less than cost, the financial condition and near-term prospects of the issuer, and the intent and ability to retain our investment in the security for a period of time sufficient to allow for any anticipated recovery in fair value in the near term. Any such determination of other-than-temporary impairment could have a material adverse effect on our business, results of operations and financial condition.
| 19 |
Impairment of deferred income tax assets could require charges to earnings, which could result in an adverse impact on our results of operations.
In assessing the realizability of deferred income tax assets, management considers whether it is more likely than not that some portion or all of the benefits of deferred income tax assets will not be realized. Assessing the need for, or the sufficiency of, a valuation allowance requires management to evaluate all available evidence, both negative and positive. Positive evidence necessary to overcome the negative evidence includes whether future taxable income in sufficient amounts and character within the carry back and carry forward periods is available under the tax law, including the use of tax planning strategies. When negative evidence (e.g. cumulative losses in recent years, history of operating loss or tax credit carry forwards expiring unused) exists, more positive evidence than negative evidence will be necessary. At December 31, 2015, net deferred tax assets are approximately $4.8 million. If a valuation allowance becomes necessary with respect to such balance, it could have a material adverse effect on our business, results of operations and financial condition.
Impairment of goodwill could require charges to earnings, which could result in an adverse impact on our results of operations.
Under current accounting standards, goodwill is not amortized but, instead, is subject to impairment tests on at least an annual basis or more frequently if an event occurs or circumstances change that reduce the fair value of a reporting unit below its carrying amount. A decline in our stock price or occurrence of a triggering event following any of our quarterly earnings releases and prior to the filing of the periodic report for that period could, under certain circumstances, cause us to perform a goodwill impairment test and result in an impairment charge being recorded for that period that was not reflected in such earnings release. In the event that we conclude that all or a portion of our goodwill may be impaired, a non-cash charge for the amount of such impairment would be recorded to earnings. Such a charge would have no impact on tangible capital. At December 31, 2015, we had goodwill of $8.4 million, representing about 7.3% of stockholders’ equity.
We may not be able to attract and retain skilled personnel.
Our success depends, in large part, on our ability to attract and retain key personnel. Competition for the best people in most activities engaged in by us can be intense and we may not be able to hire people or retain them. The unexpected loss of services of one or more of our key personnel could have a material adverse impact on our business because of their skills, knowledge of our local markets, years of industry experience and the difficulty of promptly finding qualified replacement personnel.
Our operations are geographically limited and are more at risk for downturns in those areas.
Our financial performance generally is highly dependent upon the business environment in Northeastern Wisconsin, particularly in Door and Brown Counties. As a result of this geographical concentration, we are more vulnerable to downturns or other factors that affect the local economy or decrease demand for our services than if our operations were conducted over a wider area. Other local factors, such as natural disasters and the local regulatory climate, could also significantly affect our results because of our lack of geographical diversity.
The overall economic environment evident during 2015 remained challenging for many households and businesses in Northeast Wisconsin and the business environment of the markets in which we operate have been adversely affected, which if this condition continues, could require us to make additional provisions to our allowance for loan losses and thus have a material adverse effect on our financial condition and results of operations. In our market area, especially in Door County, a significant percentage of our customer base is in the tourism industry, particularly lodging and restaurants and many other of our customers depend indirectly on the tourism industry. With this concentration in a single industry, any downturn, deterioration of the economy or other issues affecting local tourism could reduce the demand for our services, increase problem loans and thus disproportionately have a materially adverse effect on our financial condition and results of operations.
| 20 |
We continually encounter technological change.
The financial services industry is continually undergoing rapid technological change with frequent introductions of new technology driven by products and services. The effective use of technology increases efficiency and enables financial institutions to better serve customers and to reduce costs. Our future success depends, in part, upon our ability to address the needs of our customers by using technology to provide products and services that will satisfy customer demands, as well as to create additional efficiencies in our operations. Many of our competitors have substantially greater resources to invest in technological improvements. We may not be able to effectively implement new technology driven products and services or be successful in marketing these products and services to our customers. Failure to successfully keep pace with technological change affecting the financial services industry could have a material adverse effect on our business and, in turn, our financial condition and results of operations.
We are dependent upon third parties for certain information systems, data management and processing services and to provide key components of our business infrastructure.
We outsource certain information system and data management and processing functions to third party service providers. These third party service providers are also sources of operational and information system interruptions or breaches, and unauthorized disclosures of sensitive or confidential client or customer information. If third party service providers encounter any of these issues, or if we have difficulty communicating with them, we could be exposed to disruption of operations, loss of service or connectivity to customers, reputational damage, and litigation risk that could have a material adverse effect on our results of operations or our business.
Third party vendors provide key components of our business infrastructure such as internet connections, network access and core application processing. Any problems caused by these third parties, including as a result of their not providing us their services for any reason or their performing their services poorly, could adversely affect our ability to deliver products and services to our customers and otherwise to conduct our business. Replacing these third party vendors could also entail significant delay and expense. We monitor vendor risks, including the financial stability of critical vendors, as the failure of a critical vendor could disrupt our business and cause us to incur significant expense.
Our information systems may experience an interruption or breach in security.
We rely heavily on communications and information systems to conduct our business. Any failure, interruption or breach in security or operational integrity of these systems could result in failures or disruptions in our customer relationship management, general ledger, deposit, loan and other systems. While we have policies and procedures designed to prevent or limit the effect of a failure, interruption or security breach of our information systems, we cannot be assured that any such failures, interruptions or security breaches will not occur or, if they do, that they will be addressed adequately. The occurrence of any failures, interruptions or security breaches of our information systems could damage our reputation, result in a loss of customer business, subject us to additional regulatory scrutiny, or expose us to civil litigation and possible financial liability, any of which could have a material adverse effect on our financial condition.
Risks Related to Legal and Regulatory Compliance
We operate in a highly regulated environment, which could increase our cost structure or have other negative impacts on our operations.
We are highly regulated by both federal and state regulatory authorities. Regulation includes, among other things, capital and reserve requirements, permissible investments and lines of business, dividend limitations, limitations on products and services offered, loan limits, geographical limits, consumer credit regulations, community reinvestment requirements and restrictions on transactions with affiliated parties. The system of supervision and regulation applicable to us establishes a comprehensive framework for our operations and is intended primarily for the protection of the DIF, our depositors and the public, rather than our shareholders. We are also subject to regulation by the SEC. Failure to comply with applicable laws, regulations or policies could result in sanction by regulatory agencies, civil monetary penalties, and/or damage to our reputation, which could have a material adverse effect on our business, consolidated financial condition and results of operations. In addition, any change in government regulation could have a material adverse effect on our business.
The CFPB may reshape the consumer financial laws through rulemaking and enforcement of the prohibitions against unfair, deceptive and abusive business practices. Compliance with any such change may impact the business operations of depository institutions offering consumer financial products or services, such as the Bank.
| 21 |
The CFPB has broad rulemaking authority to administer and carry out the provisions of the Dodd-Frank Act with respect to financial institutions that offer covered financial products and services to consumers. The CFPB has also been directed to write rules identifying practices or acts that are unfair, deceptive or abusive in connection with any transaction with a consumer for a consumer financial product or service, or the offering of a consumer financial product or service. The concept of what may be considered to be an “abusive” practice is relatively new under the law. Moreover, while the Bank will not be directly supervised and examined by the CFPB for compliance with the CFPB’s regulations and policies, the Bank’s primary federal regulator, the FRB, will be responsible for oversight and examination of such regulations and policies. The costs and limitations related to this additional regulatory reporting regimen have yet to be fully determined, although they may be material and the limitations and restrictions that will be placed upon the Bank with respect to its consumer product offering and services may produce significant, material effects on the Bank’s and our profitability.
We are subject to examinations and challenges by taxing authorities.
In the normal course of business, we are routinely subjected to examinations and challenges from federal and state taxing authorities regarding the amount of taxes due in connection with our investments and the businesses in which we engage. Federal and state taxing authorities have recently become increasingly aggressive in challenging tax positions taken by financial institutions. These tax positions may relate to tax compliance, sales and use, franchise, gross receipts, payroll, property or income tax issues, including tax base, apportionment and tax planning. The challenges made by taxing authorities may result in adjustments to the timing or amount of taxable income or deductions or the allocations of income among tax jurisdictions. If any such challenges are not resolved in our favor, they could have a material adverse impact on our consolidated financial condition and results of operations.
We may experience unanticipated losses as a result of residential mortgage loan repurchase or reimbursement obligations under agreements with secondary market purchasers.
We may be required to repurchase residential mortgage loans, or to reimburse the purchaser for losses with respect to residential mortgage loans, which have been sold to secondary market purchases in the event there are breaches of certain representations and warranties contained within the sales agreements, such as representations and warranties related to credit information, loan documentation, collateral and insurability. Consequently, we are exposed to credit risk, and potentially funding risk, associated with sold loans. There can be no assurance that we will not be required to repurchase from or reimburse secondary market purchasers for any loans sold or that the total losses incurred, if any, on such repurchases or reimbursements will not have a material adverse effect on our financial condition or results of operations.
External Risks
We may be adversely affected by the soundness of other financial institutions.
Financial institutions are interrelated as a result of trading, clearing, counterparty or other relationships. We routinely execute transactions with counterparties in the financial services industry, including commercial banks, brokers and dealers, investment banks, and other institutional clients. Many of these transactions expose us to credit risk in the event of default by a counterparty. In addition, our credit risk may be heightened when the collateral we hold cannot be realized upon liquidation or is liquidated at prices not sufficient to recover the full amount of the credit or derivative exposure due to us. Any such losses could have a material adverse effect on our consolidated financial condition and results of operations.
Competition may affect our results.
We face strong competition in originating loans, in seeking deposits and in offering our other services. We must compete with commercial banks, savings associations, trust companies, mortgage banking firms, credit unions, finance companies, marketplace lenders, mutual funds, insurance companies, brokerage and investment banking firms. Our market area is also served by several commercial banks and savings associations that are substantially larger than us in terms of deposits and loans and have greater human and financial resources.
| 22 |
Our ability to compete successfully depends on a number of factors, including but not limited to: (i) our ability to develop, maintain and build upon long-term customer relationships; (ii) our ability to expand our market positions; (iii) the scope, relevance and pricing of our products and services offered to meet customer needs; (iv) the rate at which we introduce new products and services relative to our competitors; (v) customer satisfaction with our level of service; and (vi) industry and general economic trends.
Failure to perform in any of these areas could significantly weaken our competitive position, which could adversely affect our growth and profitability, which, in turn, could have a material adverse impact on our financial position and results of operation.
Customers may decide not to use banks to complete their financial transactions, which could result in a loss of income to us.
Technology and other changes are allowing customers to complete financial transactions using non-banks that historically have involved banks at one or both ends of the transaction. For example, customers can now pay bills and transfer funds directly without going through a bank. Customers can now also obtain loans using marketplace lending portals rather than obtaining loans through banks. The process of eliminating banks as intermediaries, known as disintermediation, could result in the loss of fee and interest income, as well as the loss of customer deposits.
Acts or threats of terrorism and political or military actions by the United States or other governments could adversely affect general economic industry conditions.
Geopolitical conditions may affect our earnings. Acts or threats of terrorism and political actions taken by the United States or other governments in response to terrorism, or similar activity, could adversely affect general economic or industry conditions and, as a result, our consolidated financial condition and results of operations.
Strategic Risks
Maintaining or increasing our market share may depend on lowering prices and market acceptance of new products and services.
Our success depends, in part, on our ability to adapt our products and services to evolving industry standards. There is increasing pressure to provide products and services at lower prices. Lower prices can reduce our net interest margin and revenues from our fee-based products and services. In addition, the widespread adoption of new technologies, including internet services, could require us to make substantial expenditures to modify or adapt our existing products and services. Also, these and other capital investments in our business may not produce expected growth in earnings anticipated at the time of the expenditure. We may not be successful in introducing new products and services, achieving market acceptance of our products and services, or developing and maintaining loyal customers.
Future growth or operating results may require us to raise additional capital but that capital may not be available.
We are required by federal and state regulatory authorities to maintain adequate levels of capital to support our operations. To the extent our future operating results erode capital or we elect to expand through loan growth or acquisition, we may be required to raise capital.
Our ability to raise capital will depend on conditions in the capital markets, which are outside of our control, and on our financial performance. Accordingly, we cannot be assured of our ability to raise capital when needed or on favorable terms. If we cannot raise additional capital when needed, we will be subject to increased regulatory supervision and the imposition of restrictions on our growth and business. These could negatively impact our ability to operate or further expand our operations and may result in increases in operating expenses and reductions in revenues that could have a material effect on our consolidated financial condition and results of operations.
| 23 |
Reputation Risks
Unauthorized disclosure of sensitive or confidential client or customer information, whether through a breach of our computer system or otherwise, could severely harm our business.
As part of our financial and data processing products and services, we collect, process and retain sensitive and confidential client and customer information. Despite the security measures we have in place, our facilities and systems, and those of third party service providers, may be vulnerable to security breaches, acts of vandalism, computer viruses, misplaced or lost data, programming and/or human error, or other similar events. Any security breach involving the misappropriation, loss or other unauthorized disclosure of confidential information, whether by us or our vendors, could severely damage our reputation, expose us to the risks of litigation and liability, disrupt our operations and/or harm our business.
Ethics or conflict of interest issues could damage our reputation.
We have established a Code of Conduct and related policies and procedures to address the ethical conduct of business and to avoid potential conflicts of interest. Any system of controls, however well designed and operated, is based, in part, on certain assumptions and can provide only reasonable, not absolute, assurances that the objectives of the system are met. Any failure or circumvention of our related controls and procedures or failure to comply with the established Code of Conduct could have a material adverse effect on our reputation, business, results of operations and/or financial condition.
Liquidity Risks
We could experience an unexpected inability to obtain needed liquidity.
Liquidity measures the ability to meet current and future cash flow needs as they become due. The liquidity of a financial institution reflects its ability to meet loan requests, to accommodate possible outflows in deposits, and to take advantage of interest rate market opportunities. The ability of a financial institution to meet its current financial obligations is a function of its balance sheet structure, its ability to liquidate assets and its access to alternative sources of funds. We seek to ensure our funding needs are met by maintaining an appropriate level of liquidity through asset/liability management. If we become unable to obtain funds when needed, it could have a material adverse effect on our business and, in turn, our consolidated financial condition and results of operations.
We rely on dividends from the Bank for most of our revenues.
We are a separate and distinct legal entity from our subsidiaries. Historically, we have received substantially all of our revenue in the form of dividends from the Bank. Federal and/or state laws and regulations limit the amount of dividends that the Bank may pay to us. Also, a holding company’s right to participate in a distribution of assets upon a subsidiary’s liquidation or reorganization is subject to the prior claims of the subsidiary’s creditors. In the event the Bank is unable to pay dividends to us when needed, we may not be able to service our debt or pay our obligations, including dividends on the Trust Preferred Stock. Any inability to receive dividends from the Bank could have a material adverse effect on our business, financial condition and/or results of operations.
Risks Related to an Investment in Our Common Stock
The price of our securities can be volatile.
Price volatility may make it more difficult for you to sell your securities when you want and at prices you find attractive. Our securities prices can fluctuate widely in response to a variety of factors including, among other things:
| • | actual or anticipated variations in quarterly results of operations or financial conditions; |
| • | operating results and stock price performance of other companies that investors deem comparable to us; |
| • | news reports relating to trends, concerns and other issues in the financial services industry; |
| • | perceptions in the marketplace regarding us and/or our competitors; |
| 24 |
| • | significant acquisitions or business combinations, strategic partnerships, joint ventures or capital commitment by or involving us or our competitors; |
| • | changes in government regulations; and |
| • | geopolitical conditions such as acts or threats of terrorism or military conflicts. |
General market fluctuations, industry factors and general economic and political conditions and events, such as economic slowdowns or recessions, interest rate changes, or credit loss trends could also cause our securities prices to decrease regardless of our operating results. In addition, while our common stock is listed on the NASDAQ Stock Market LLC (“NASDAQ”), there is limited trading activity in the stock. As such, relatively small trades may have a significant impact on the price of our stock.
Our securities are not an insured deposit.
Securities issued by us are not a bank deposit and are not insured or guaranteed by the FDIC or any other government agency. Securities are subject to investment risk, and investors must be able to afford the loss of their entire investment.
You may not receive dividends on your investment in our common stock.
Our ability to pay dividends is dependent upon our receipt of dividends from the Bank, which is subject to regulatory restrictions. Such restrictions, which govern state-chartered banks, generally limit the payment of dividends on bank stock to the bank’s undivided profits after all payments of all necessary expenses, provided that the bank’s surplus equals or exceeds its capital. In addition, under the terms of our junior subordinated debentures, we would be precluded from paying dividends on our common stock if we were in default under the debentures, if we exercised our right to defer payments of interest on the debentures, or if certain related defaults occurred. While we have made all contractual payments currently due under the subordinated debentures and are not otherwise in default, there can be no assurance that we will be able to continue paying dividends to our shareholders and if we do, in what amounts. Total dividends declared and paid in 2014 were $0.30 per share. During 2015, total dividends of $0.34 per share were declared and paid.
The holders of our junior subordinated debentures have rights that are senior to those of our shareholders.
On March 31, 2006, we issued $16.1 million of floating rate junior subordinated debentures in connection with a $16.1 million trust preferred securities issuance by our subsidiary, Baylake Capital Trust II. The 2006 junior subordinated debentures mature in June of 2036. The purpose of the transaction was to raise additional capital in order for us to redeem our trust preferred securities issued by our subsidiary Baylake Capital Trust I. Payments of the principal and interest on the trust preferred securities are conditionally guaranteed by us. The junior subordinated debentures are senior to our shares of common stock. As a result, we must make payments on the junior subordinated debentures (and the related trust preferred securities) before any dividends can be paid on our common stock and, in the event of our bankruptcy, dissolution or liquidation, the holders of the debentures must be satisfied before any distributions can be made to the holders of our common stock. We have the right to defer distributions on the junior subordinated debentures (and the related trust preferred securities) for up to five years, during which time no dividends may be paid to holders of our common stock. We are currently paying dividends on the junior subordinated debentures in accordance with their terms.
There may be future sales or other dilution of our equity, which may adversely affect the market price of our securities.
We are not restricted from issuing additional securities, including common stock and securities that are convertible or exchangeable for, or that represent the right to receive common stock. The issuance of additional shares of common stock or the issuance of convertible securities would dilute the ownership interest of our existing common shareholders. The market price of our common stock could decline as a result of an equity offering, as well as other sales of a large block of shares of our common stock or similar securities in the market after an equity offering, or the perception that such sales could occur.
During 2009 and 2010, we issued $9.5 million of our 10% Convertible Notes due June 30, 2017 (the “Convertible Notes”). During 2014 and 2015, all the Convertible Notes were converted to shares of our common stock. As such, as of December 31, 2015, we had no Convertible Notes outstanding.
| 25 |
ITEM 1B. UNRESOLVED STAFF COMMENTS
None.
The Bank owns its headquarters and twenty-two other branches. The main office is located in Sturgeon Bay, Wisconsin and the branches are distributed by county as follows: seven in Brown County, seven in Door County, five in Kewaunee County, one in Manitowoc County, and two in Outagamie County. In 2013, we closed three branches, two of which were in central Wisconsin and were in conjunction with a sale of the deposits of such branches. The three facilities related to the 2013 closures were transferred to other real estate owned. In 2014, the Bank consummated the purchase of a branch in Outagamie County, Wisconsin and $13.7 million related deposits. The Bank leases office space adjacent to the facility purchased in Outagamie County for use by Admiral. In December 2015, three additional properties were acquired in conjunction with the acquisition of NEW Bancshares, Inc.
The main office building located in Sturgeon Bay serves as our corporate headquarters and main banking office. The twenty-three offices owned by the Bank are in good condition and considered adequate for present and near term requirements. In addition, the Bank owns other real property that we do not consider in the aggregate to be material to our consolidated financial position. All of such other real property is reserved for future expansion and is located in the following Wisconsin municipalities: Neenah, and Oshkosh.
During the second quarter of 2015, the Bank announced the closure of one of its branches in Brown County, Wisconsin. We intend to utilize this location in future bank operations and therefore, this facility will not be transferred to other real estate at this time. In the fourth quarter of 2015, in conjunction with the pending merger, the Bank entered into a lease agreement with Nicolet related to this facility.
We may be involved from time to time in various routine legal proceedings incidental to our business. Neither we nor any of our subsidiaries are currently engaged in any legal proceedings that are expected to have a material adverse effect on our consolidated financial statements.
ITEM 4. MINE SAFETY DISCLOSURES
Not applicable.
| 26 |
ITEM 5. MARKET FOR REGISTRANT’S COMMON EQUITY, RELATED STOCKHOLDER MATTERS AND ISSUER PURCHASES OF EQUITY SECURITIES
Historically, trading in shares of our common stock has been limited. Between mid-1993 and November 3, 2013, our common stock had been quoted on the Over-The-Counter Bulletin Board (“OTCBB”), an electronic interdealer quotation system providing real-time quotations on eligible securities. Beginning in November 2013, our stock began being quoted on the NASDAQ (Trading symbol: BYLK).
The following table summarizes high and low bid prices and cash dividends declared for our common stock for the periods indicated. Bid prices are as reported from the NASDAQ. The reported high and low prices represent interdealer bid prices, without retail mark-ups, mark-downs or commissions, and may not necessarily represent actual transactions.
| Calendar Period | High | Low | Cash Dividends per share |
||||||||||
| 2015 | 4th Quarter | $ | 14.89 | $ | 13.81 | $ | 0.09 | ||||||
| 3rd Quarter | $ | 15.00 | $ | 12.13 | $ | 0.09 | |||||||
| 2nd Quarter | $ | 13.26 | $ | 12.03 | $ | 0.08 | |||||||
| 1st Quarter | $ | 12.75 | $ | 11.90 | $ | 0.08 | |||||||
| 2014 | 4th Quarter | $ | 12.75 | $ | 11.41 | $ | 0.08 | ||||||
| 3rd Quarter | $ | 12.67 | $ | 10.92 | $ | 0.08 | |||||||
| 2nd Quarter | $ | 13.06 | $ | 11.54 | $ | 0.07 | |||||||
| 1st Quarter | $ | 14.00 | $ | 11.27 | $ | 0.07 | |||||||
We had approximately 2,000 shareholders of record at March 4, 2016. The number of shareholders does not separately reflect persons or entities that hold their stock in nominee or “street” name through various brokerage firms.
The holders of our common stock are entitled to receive such dividends when and as declared by our Board of Directors and if required, approved by our regulators. In determining the payment of cash dividends, our Board of Directors considers the earnings, capital and debt servicing requirements, financial ratio guidelines and restrictions issued by the FRB and other banking regulators, our financial condition, and other relevant factors.
Our ability to pay dividends is dependent upon our receipt of dividends from the Bank, which is subject to regulatory restrictions. Such restrictions, which govern state-chartered banks, generally limit the payment of dividends on bank stock to the bank’s undivided profits after payment of all necessary expenses, provided that the bank’s surplus equals or exceeds its capital, as discussed further in Item 7, Management’s Discussion and Analysis of Financial Condition and Results of Operation-Capital Resources. In addition, under the terms of our junior subordinated debentures due 2036, we would be precluded from paying dividends on our common stock if we were in default under the debentures, if we exercised our right to defer payments of interest on the debentures, or if certain related defaults occurred.
Quarterly dividends of $0.07, $0.07, $0.08, and $0.08 were declared in each successive quarter in 2014 and $0.08, $0.08, $0.09 and $0.09 were declared in each successive quarter in 2015. Nonetheless, there is no assurance that we will be able to continue to declare quarterly dividends going forward and, even if we do, in what amounts. We maintain a dividend reinvestment plan enabling participating shareholders to elect to purchase shares of our common stock in lieu of receiving cash dividends. Such shares may be newly issued or acquired by us in the open market. New shares issued under this plan are limited to one million over the life of the plan.
In 2009 and 2010, we completed closings for a private placement of Convertible Notes. The Convertible Notes were offered and sold primarily to “accredited investors” as defined in the Securities Act of 1933 and up to 35 non-accredited investors in reliance on the exemption from registration under Section 4(2) of the Securities Act of 1933, as amended and Rule 506 thereunder. At the closings, we issued in aggregate $9.45 million of Convertible Notes. The proceeds of this financing were contributed, in part, as additional capital to the Bank and otherwise used for general corporate purposes.
| 27 |
The Convertible Notes were convertible into shares of our common stock at a ratio of one share of common stock for each $5.00 in aggregate principal amount held on the record date of the conversion subject to certain adjustments as described in the Convertible Notes (the “Conversion Ratio”). Prior to the quarterly interest date preceding the fifth anniversary of issuance of the Convertible Notes, each holder of the Convertible Notes could have converted up to 100% (at the discretion of the holder) of the original principal amount into shares of our common stock at the Conversion Ratio. Beginning on the quarterly interest date prior to the fifth anniversary of the Convertible Notes, we were entitled to redeem the notes in whole or in part. A notice of redemption supersedes and takes priority over any notice of conversion. On October 1, 2014, one-half of the original principal amounts of the Convertible Notes were mandatorily convertible at the Conversion Ratio if voluntary conversion had not yet occurred. The principal amount of any Convertible Note that had not been converted would have been payable at maturity on June 30, 2017.
Beginning January 1, 2014, we began redeeming the notes at the investors’ option under the terms described in the preceding paragraph. In 2014, $6.1 million was converted into 1.2 million shares of our common stock under this option. On October 1, 2014, an additional $1.6 million of Convertible Notes were converted into 330,000 shares of our common stock under the mandatory conversion provision of the Convertible Notes, resulting in an aggregate $1.7 million of Convertible Notes remaining outstanding after such conversions. During 2015, all of the remaining debentures were converted to 330,000 shares of our common stock at the investors’ option. As of December 31, 2015, none of the Convertible Notes remain outstanding.
We did not sell any securities without registration during the fourth quarter of 2015.
A stock repurchase program was approved by our board of directors on May 23, 2013 (the “Repurchase Program”). This program authorized us to repurchase up to 400,000 shares of our stock through May 30, 2014. In April of 2014, this program was extended through May 30, 2015 and the maximum number of common shares subject to repurchase was increased to 800,000. In May of 2015, this program was extended again through May 30, 2016, and the maximum number of common shares subject to repurchase was increased to 1.2 million. In 2013, we repurchased 163,000 shares of our common stock under the Repurchase Program. During 2014, an additional 339,000 shares of our common stock were repurchased. In 2015, an additional 115,500 shares of our common stock were repurchased. In the aggregate, a total of 617,500 shares of common stock have been repurchased under the Repurchase Program since its adoption at an average price of $11.98 per share.
Total
Number | Average
| Total Number of Shares Purchased as Part of Publically Announced Plans or Programs | Maximum Number of Shares that May Yet Be Purchased Under the Plans or Programs | |||||||||||||
| October 1 – October 31, 2015 | — | $ | — | — | 582,500 | |||||||||||
| November 1 – November 30, 2015 | — | — | — | 582,500 | ||||||||||||
| December 1 - December 31, 2015 | — | $ | — | — | 582,500 | |||||||||||
| 28 |
Performance Graph
The following graph shows the cumulative stockholder return on our common stock for the period of December 31, 2010 to December 31, 2015 compared with the NASDAQ Bank and the S&P 500 Index. The graph assumes a $100 investment on December 31, 2010, together with the reinvestment of all dividends. The graph is sourced from SNL Financial LC.
Baylake Corp.
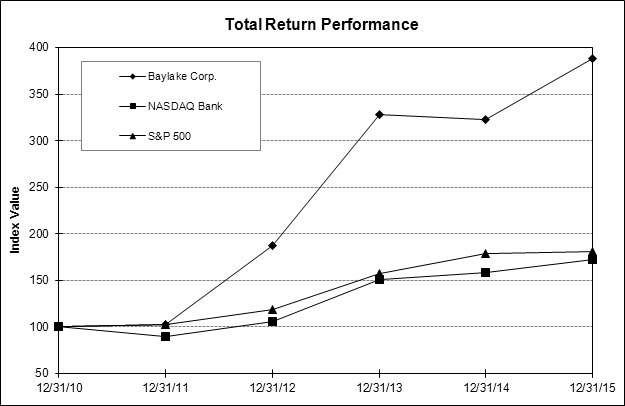
| Period Ending | |||||||||||||||||||
| Index | 12/31/10 | 12/31/11 | 12/31/12 | 12/31/13 | 12/31/14 | 12/31/15 | |||||||||||||
| Baylake Corp. | 100.00 | 102.44 | 187.51 | 328.46 | 322.91 | 387.77 | |||||||||||||
| NASDAQ Bank | 100.00 | 89.50 | 106.23 | 150.55 | 157.95 | 171.92 | |||||||||||||
| S&P 500 | 100.00 | 102.11 | 118.45 | 156.82 | 178.28 | 180.75 | |||||||||||||
| 29 |
ITEM 6. SELECTED FINANCIAL DATA
BAYLAKE
CORP.
FIVE YEAR SELECTED CONSOLIDATED FINANCIAL DATA
Year Ended December 31, (dollars in thousands, except per share data) | ||||||||||||||||||||
| 2015 | 2014 | 2013 | 2012 | 2011 | ||||||||||||||||
| Results of operations: | ||||||||||||||||||||
| Interest and dividend income | $ | 35,275 | $ | 34,743 | $ | 34,740 | $ | 39,186 | $ | 42,122 | ||||||||||
| Interest expense | 2,635 | 3,313 | 4,540 | 6,755 | 9,582 | |||||||||||||||
| Net interest income before loan losses | 32,640 | 31,430 | 30,200 | 32,431 | 32,540 | |||||||||||||||
| Provision for loan losses | 200 | — | 1,400 | 5,425 | 5,050 | |||||||||||||||
| Net interest income after provision for loan losses | 32,440 | 31,430 | 28,800 | 27,006 | 27,490 | |||||||||||||||
| Noninterest income | 9,696 | 9,067 | 9,830 | 13,823 | 10,020 | |||||||||||||||
| Noninterest expense | 30,410 | 28,322 | 27,302 | 31,704 | 31,627 | |||||||||||||||
| Income before provision (benefit) for income taxes | 11,726 | 12,175 | 11,328 | 9,125 | 5,883 | |||||||||||||||
| Income tax provision | 3,709 | 3,252 | 3,319 | 1,483 | 1,407 | |||||||||||||||
| Net income | $ | 8,017 | $ | 8,923 | $ | 8,009 | $ | 7,642 | $ | 4,476 | ||||||||||
| Per Share Data: (1) | ||||||||||||||||||||
| Net income per share (basic)(1) | $ | 0.86 | $ | 1.07 | $ | 1.01 | $ | 0.96 | $ | 0.57 | ||||||||||
| Net income per share (diluted)(1) | 0.85 | 0.97 | 0.87 | 0.84 | 0.57 | |||||||||||||||
| Cash dividends per common share | 0.34 | 0.30 | 0.22 | 0.08 | — | |||||||||||||||
| Book value per share at end of year | 11.89 | 11.65 | 12.02 | 11.73 | 10.67 | |||||||||||||||
| Selected Financial Condition Data (at December 31): | ||||||||||||||||||||
| Total assets | $ | 1,093,917 | $ | 1,021,623 | $ | 996,776 | $ | 1,023,971 | $ | 1,086,929 | ||||||||||
| Securities | 198,095 | 208,524 | 230,883 | 242,019 | 284,331 | |||||||||||||||
| Gross loans | 743,381 | 679,357 | 617,960 | 595,533 | 631,015 | |||||||||||||||
| Total deposits | 866,195 | 765,542 | 744,212 | 806,015 | 865,187 | |||||||||||||||
| Short-term borrowings (2) | 48,127 | 64,869 | 58,448 | 51,568 | 47,566 | |||||||||||||||
| Other borrowings (3) | 41,595 | 60,455 | 66,700 | 40,000 | 55,000 | |||||||||||||||
| Subordinated debentures | 16,100 | 16,100 | 16,100 | 16,100 | 16,100 | |||||||||||||||
| Convertible promissory notes | — | 1,650 | 9,400 | 9,400 | 9,450 | |||||||||||||||
| Total stockholders’ equity | 114,349 | 105,504 | 93,881 | 93,144 | 84,401 | |||||||||||||||
| Performance Ratios: | ||||||||||||||||||||
| Return on average assets | 0.80 | % | 0.91 | % | 0.83 | % | 0.74 | % | 0.43 | % | ||||||||||
| Return on average total stockholders’ equity | 7.34 | 8.99 | 8.55 | 8.60 | 5.53 | |||||||||||||||
| Dividend payout ratio | 39.39 | 28.23 | 21.78 | 8.31 | — | |||||||||||||||
| Equity to assets | 10.45 | 10.33 | 9.42 | 9.10 | 7.77 | |||||||||||||||
| Net interest margin (4) | 3.66 | 3.63 | 3.58 | 3.53 | 3.55 | |||||||||||||||
| Net interest spread (4) | 3.58 | 3.55 | 3.48 | 3.43 | 3.44 | |||||||||||||||
| Noninterest income to average assets | 0.97 | 0.93 | 1.02 | 1.33 | 0.96 | |||||||||||||||
| Noninterest expense to average assets | 3.03 | 2.89 | 2.84 | 3.05 | 3.04 | |||||||||||||||
| Net overhead ratio (5) | 2.06 | 1.96 | 1.82 | 1.72 | 2.08 | |||||||||||||||
| Average loan-to-average deposit ratio | 88.51 | 86.29 | 79.28 | 74.29 | 74.87 | |||||||||||||||
| Average interest-earning assets to average interest-bearing liabilities | 127.52 | 121.98 | 119.10 | 114.58 | 110.70 | |||||||||||||||
| Efficiency ratio (6) | 70.57 | 67.30 | 67.57 | 72.52 | 73.60 | |||||||||||||||
| Asset Quality Ratios: (7) | ||||||||||||||||||||
| Nonperforming loans to total loans | 0.30 | % | 0.76 | % | 1.08 | % | 2.42 | % | 3.09 | % | ||||||||||
| Allowance for loan losses to: | ||||||||||||||||||||
| Gross loans | 0.79 | 1.04 | 1.24 | 1.54 | 1.68 | |||||||||||||||
| Nonperforming loans | 267.27 | 136.78 | 115.02 | 63.43 | 54.32 | |||||||||||||||
| Net charge-offs to average loans | 0.19 | 0.10 | 0.48 | 1.11 | 0.94 | |||||||||||||||
| Nonperforming assets to total assets | 0.54 | 0.92 | 1.30 | 2.43 | 2.92 | |||||||||||||||
| 30 |
Year Ended December 31, (dollars in thousands, except per share data) | ||||||||||||||||||||
| 2015 | 2014 | 2013 | 2012 | 2011 | ||||||||||||||||
| Capital Ratios: (8) | ||||||||||||||||||||
| Stockholders’ equity to assets | 10.45 | % | 10.33 | % | 9.42 | % | 9.10 | % | 7.77 | % | ||||||||||
| Tier 1 risk-based capital | 14.39 | % | 14.96 | % | 14.26 | % | 13.34 | % | 11.03 | % | ||||||||||
| Tier 1 common equity risk-based capital (9) | 12.59 | % | N/A | N/A | N/A | N/A | ||||||||||||||
| Total risk-based capital | 15.11 | % | 16.14 | % | 16.71 | % | 15.96 | % | 13.54 | % | ||||||||||
| Leverage ratio | 11.56 | % | 11.27 | % | 10.48 | % | 9.41 | % | 7.93 | % | ||||||||||
| Efficiency Ratio GAAP to Non-GAAP reconciliation: (6) | 2015 | 2014 | 2013 | 2012 | 2011 | |||||||||||||||
| Noninterest expense | $ | 30,410 | $ | 28,322 | $ | 27,302 | $ | 31,704 | $ | 31,627 | ||||||||||
| Less: payment under UFS tax strategy reorganization | 163 | 661 | — | — | — | |||||||||||||||
| Noninterest expense (non-GAAP) | 30,247 | 27,661 | 27,302 | 31,704 | 31,627 | |||||||||||||||
| Net interest income | 32,640 | 31,430 | 30,200 | 32,431 | 32,540 | |||||||||||||||
| Plus: tax equivalent adjustment relating to tax exempt loans and securities | 1,001 | 1,052 | 1,070 | 1,057 | 1,058 | |||||||||||||||
| Net interest income (non-GAAP) – tax equivalent | 33,641 | 32,482 | 31,270 | 33,488 | 33,598 | |||||||||||||||
| Noninterest income | 9,696 | 9,067 | 9,830 | 13,823 | 10,020 | |||||||||||||||
| Less: net securities gains (losses) | 465 | 446 | 574 | 2,188 | 651 | |||||||||||||||
| Less: gains on sales of deposits or branches | — | — | 122 | 826 | — | |||||||||||||||
| Less: net gains (losses) on disposal of fixed assets | 11 | 1 | (3 | ) | 582 | (4 | ) | |||||||||||||
| Noninterest income – (non-GAAP) | $ | 9,220 | $ | 8,620 | $ | 9,137 | $ | 10,227 | $ | 9,373 |
| Efficiency Ratio | 71.83 | % | 69.94 | % | 68.20 | % | 68.54 | % | 74.31 | % | ||||||||||
| Efficiency Ratio (non-GAAP) – tax equivalent | 70.57 | % | 67.30 | % | 67.57 | % | 72.52 | % | 73.60 | % |
| (1) | Basic earnings per share are based on the weighted average number of shares outstanding for the period. Diluted earnings per share are based on the weighted average number of shares outstanding during the period as well as shares that would be issued if outstanding stock options were exercised, stock awards were fully vested and promissory notes were converted. |
| (2) | Consists of federal funds purchased and repurchase agreements. |
| (3) | Consists of Federal Home Loan Bank term notes and other term notes. |
| (4) | Net interest margin represents net interest income as a percentage of average interest-earning assets, and net interest spread represents the difference between the weighted average yield on interest-earning assets and the weighted average cost of interest-bearing liabilities. |
| (5) | Net overhead ratio represents the difference between noninterest expense and noninterest income, divided by average assets. |
| 31 |
| (6) | Efficiency ratio is calculated as follows: non-interest expense less significant, non-recurring expenses divided by the sum of taxable equivalent net interest income plus non-interest income, excluding net investment security gains, net gains on sale of fixed assets and land held for sale and significant, non-recurring income. This efficiency ratio is presented on a tax equivalent basis, which adjusts net interest income for the tax-favored status of certain loans and investment securities. Management believes this measure to be the preferred industry measurement of net interest income as it enhances the comparability of such income arising from both taxable and non-taxable sources. However, as calculated, this ratio is not considered to be in accordance with Generally Accepted Accounting Principles (“GAAP”) and as such, a reconciliation of GAAP to non-GAAP is presented as well. |
| (7) | Nonperforming loans consist of nonaccrual loans, loans 90 days or more past due, but still accruing interest and restructured loans on nonaccrual. Nonperforming assets include nonperforming loans and other real estate owned. |
| (8) | The capital ratios are presented on a consolidated basis. For information on our regulatory capital requirements, see Item 7. “Management’s Discussion and Analysis of Financial Condition and Results of Operations-Capital Resources” and Item 1. “Business-Supervision and Regulation”. |
| (9) | 2015 ratios were calculated under Basel III rules which became effective January 1, 2015. |
| 32 |
ITEM 7. MANAGEMENT’S DISCUSSION AND ANALYSIS OF FINANCIAL CONDITION AND RESULTS OF OPERATION
General
The following sets forth management’s discussion and analysis of our consolidated financial condition and results of operations that should be read in conjunction with our consolidated financial statements, related notes, the selected financial data and the statistical information presented elsewhere in this report for a more complete understanding of the following discussion and analysis.
Critical Accounting Policies
In the course of our normal business activity, management must select and apply many accounting policies and methodologies that are the basis for the financial results presented in our consolidated financial statements. Some of these policies are more critical than others.
Allowance for Loan Losses (“ALL”) – Originated Loans: The ALL represents management’s estimate of probable and inherent credit losses in the loan portfolio. Estimating the amount of the ALL requires the exercise of significant judgment and the use of estimates related to the amount and timing of expected future cash flows on impaired loans, estimated losses on pools of homogeneous loans based on historical loss experience, and consideration of other qualitative factors such as current economic trends and conditions, all of which may be susceptible to significant change. The loan portfolio also represents the largest asset on the consolidated balance sheet. Loan losses are charged off against the ALL while recoveries of amounts previously charged off are credited to the ALL. A provision for loan losses (“PFLL”) is charged to operations based on management’s periodic evaluation of the factors previously mentioned, as well as other pertinent factors.
The ALL consists of specific reserves on certain impaired loans and general reserves for non-impaired loans. Specific reserves reflect estimated losses based on regular analyses of all impaired non-homogenous loans. These analyses involve a high degree of judgment in estimating the amount of loss associated with specific loans, including estimating the amount and timing of future cash flows and collateral values. The general reserve is based on our historical loss experience which is updated quarterly. The general reserve portion of the ALL also includes consideration of certain qualitative factors such as 1) changes in the nature, volume and terms of loans, 2) changes in lending personnel, 3) changes in the quality of the loan review function, 4) changes in nature and volume of past-due, nonaccrual and/or classified loans, 5) changes in concentration of credit risk, 6) changes in economic and industry conditions, 7) changes in legal and regulatory requirements, 8) unemployment and inflation statistics, and 9) changes in underlying collateral values.
There are many factors affecting the ALL, some are quantitative while others require qualitative judgment. The process for determining the ALL (which management believes adequately considers potential factors which may possibly result in credit losses) includes subjective elements and, therefore, may be susceptible to significant change. To the extent actual outcomes differ from management estimates, additional PFLLs may be required that could adversely affect our earnings or financial position in future periods. Allocations of the ALL may be made for specific loans but the entire ALL is available for any loan that, in management’s judgment, should be charged-off or for which an actual loss is realized. As an integral part of their examination process, various regulatory agencies review the ALL as well. Such agencies may require that changes in the ALL be recognized when such regulatory credit evaluations differ from those of management based on information available to the regulators at the time of their examinations.
Allowance for Loan Losses – Acquired Loans: Performing, acquired loans are periodically evaluated, and, if necessary, a provision may be required. At the time of acquisition, loans on which it was determined that all payments contractually required to be paid by the borrower under the loan agreement were not collectible were identified as Purchase Credit Impaired (“PCI”). For PCI loans, the present value of cash flows are determined and if that value is less than the carrying value, additional impairment may be required.
Core
Deposit Intangible: Core deposit intangible represents a premium paid to acquire the core deposits of an institution. The
premium is the amount paid in excess of the dollar amount of the deposits acquired and is amortized over the expected life of
the deposits. This is subject to impairment valuation on a periodic basis.
| 33 |
Goodwill: Goodwill results from business acquisitions and represents the excess of the purchase price over the fair value of acquired tangible assets. The goodwill recorded represents the excess of market value over book value. Our operations are managed and financial performance is evaluated on a company-wide basis.
Business Combinations: We account for business combinations under the acquisition method of accounting in accordance with Accounting Standards Codification (“ASC”) 805, Business Combinations (“ASC 805”). Under ASC 805, all identifiable assets acquired and all liabilities assumed must be measured at fair value at the acquisition date. The “carrying over” of the allowance for loan and lease losses to the acquiring entity is prohibited. Acquisition-related costs such as legal, accounting, consulting, and investment broker fees must be expensed as incurred. We may change provisional amounts initially recorded as of the acquisition date for a period of up to one year after the acquisition date of the business combination.
Other Real Estate Owned: Other real estate owned acquired through or in lieu of loan foreclosure and bank facilities no longer in use are initially recorded at fair value, less estimated costs to sell, establishing a new cost basis. Fair value is determined using a variety of market information including but not limited to appraisals, professional market assessments and real estate tax assessment information. If fair value declines subsequent to foreclosure, a valuation allowance is recorded through expense. Costs incurred after acquisition are expensed.
Income Tax Accounting: The assessment of income tax assets and liabilities involves the use of estimates, assumptions, interpretations, and judgments concerning certain accounting pronouncements and federal and state tax codes. There can be no assurance that future events, such as court decisions or positions of federal and state taxing authorities, will not differ from management’s current assessment, the impact of which could be significant to the consolidated results of our operations and reported earnings. We believe that the net deferred income tax asset on our December 31, 2015 consolidated balance sheet is recoverable, and the income tax liabilities are adequate and fairly stated in the consolidated financial statements. See Note 18-”Income Taxes” to our consolidated financial statements for further information.
Overview
We are a full-service financial services company, providing a wide variety of loan, deposit and other banking products and services to our business, individual or retail, and municipal customers, as well as a full range of trust, investment and cash management services. We are the bank holding company of the Bank, a Wisconsin state-chartered bank and a member of the Reserve Bank and Federal Home Loan Bank of Chicago.
On May 5, 2015 we announced an Agreement and Plan of Merger with NEWBI of Kewaunee, Wisconsin pursuant to which NEWBI would be merged with and into Baylake, with Baylake continuing as the surviving corporation. In addition, NEWBI’s wholly-owned bank subsidiary, Union State Bank (“Union”) would be merged with and into the Bank. This transaction was completed on December 4, 2015 in a cash-and-stock transaction. This increased our branch locations to 23 and added approximately $77.4 million in assets, $46.6 million in loans, $23.4 million in investment securities, $1.0 million in fed funds sold, and $68.5 million in deposits. Since the acquisition occurred late in the year, it had minimal impact to our 2015 operating results.
On September 8, 2015 we announced a Merger Agreement with Nicolet pursuant to which we will merge with and into Nicolet in a stock-for-stock transaction. Following the merger, the Bank will merge with and into NNB, Nicolet’s wholly-owned bank subsidiary, with NNB continuing as the surviving bank, with all bank branches operating under the NNB brand. This transaction is expected to close in the second quarter of 2016. As of December 31, 2015, the combined company would have total assets of approximately $2.3 billion, deposits of approximately $1.9 billion and loans of approximately $1.6 billion.
Our
profitability, like most financial institutions, is dependent to a large extent upon net interest income. Results of operations
are also affected by the PFLL, operating expenses, income taxes and noninterest income. Economic conditions, competition and the
monetary and fiscal policies of the federal government in general significantly affect financial institutions, including us. Lending
activities are also influenced by regional and local economic factors, including specifically the demand for and supply of housing,
competition among lenders, interest rate conditions and prevailing market rates on competing investments, customer preferences
and levels of personal income and savings in our market area.
| 34 |
Our regulatory capital ratios and those of the Bank are in excess of the levels established by regulatory agencies for “well-capitalized” financial institutions.
Performance Summary
The following is a brief summary of some of the factors that affected our operating results in 2015. See the remainder of this section for a more thorough discussion.
We reported net income of $8.0 million for the year ended December 31, 2015, a decrease of $0.9 million compared to net income of $8.9 million in 2014. Basic and diluted earnings per share were $0.86 and $0.85, respectively, for 2015. Basic and diluted earnings per share were $1.07 and $0.97, respectively, for 2014. Return on average assets for the year ended December 31, 2015 was 0.80% compared to 0.91% for the year ended December 31, 2014. The return on average equity was 7.34% for 2015 compared to 8.99% for 2014. Cash dividends of $0.34 and $0.30 per share were declared in 2015 and 2014, respectively.
Key factors behind these results were:
| • | In December 2015, we consummated the acquisition of NEWBI. NEWBI was the parent company of Union State Bank (“Union”), which we concurrently merged into the Bank. This transaction included the acquisition of $46.6 million of loans, $68.5 million of deposits, $23.4 million of investments securities and $1.0 million of fed funds sold. |
| • | Net interest income before provision for loan losses was $32.6 million in 2015 compared to $31.4 million in 2014. |
| • | Tax-equivalent net interest income was $33.6 million for 2015, an increase of $1.1 million or 3.6% from $32.5 million for 2014. Tax-equivalent interest income increased $0.5 million or 1.3% to $36.3 million from $35.8 million, while interest expense decreased $0.7 million. |
| • | Net interest margin improved for 2015 to 3.66% compared to 3.63% for 2014. |
| • | Net loan charge-offs increased from a year ago. Net loan charge-offs were $1.3 million in 2015, an increase of $0.7 million compared to $0.6 million for 2014. Net loan charge-offs for commercial real estate loans represented $0.5 million and commercial other loans represented $0.6 million of the $1.3 million total in 2015. Net loan charge-offs represent 0.19% of average loans in 2015 compared to 0.10% in 2014. A $0.2 million PFLL was recorded for 2015 compared to no PFLL recorded for 2014. |
| • | Noninterest income was $9.7 million for 2015, an increase of $0.6 million or 6.9% from 2014 resulting primarily from an increase in net gains from sales of loans and increase in fees from financial, fiduciary and other services to customers. |
| • | Noninterest income was $9.7 million for 2015, an increase of $0.6 million or 6.9% from 2014 resulting primarily from an increase in net gains from sales of loans and increase in fees from financial, fiduciary and other services to customers. |
| • | Noninterest expense was $30.4 million for 2015, an increase of $2.1 million or 7.4% over 2014. This was primarily the result of $1.6 million of costs related to the merger with NEWBI completed in the fourth quarter of 2015 and the pending merger with Nicolet expected to occur in the second quarter of 2016. |
| • | Provision for income taxes resulted in tax expense of $3.7 million for 2015 increased $0.5 million or 14.1% from 2014 due to the non-deductibility of some of the aforementioned merger costs. |
| 35 |
STATEMENT OF OPERATIONS ANALYSIS
Table 1: Average Balances and Interest Rates (interest and rates on a tax-equivalent basis)
| 2015 | Year ended December 31, (dollars in thousands) | 2013 | ||||||||||||||||||||||||||||||||||
| Average Balance | Interest | Average Rate | Average Balance | Interest | Average Rate | Average Balance | Interest | Average Rate | ||||||||||||||||||||||||||||
| ASSETS: | ||||||||||||||||||||||||||||||||||||
| Interest-Earning Assets | ||||||||||||||||||||||||||||||||||||
| Loans, net (1)(2) | $ | 686,933 | $ | 29,663 | 4.32 | % | $ | 636,085 | $ | 28,416 | 4.47 | % | $ | 601,228 | $ | 28,539 | 4.75 | % | ||||||||||||||||||
| U.S. Treasuries | — | — | — | — | — | — | — | — | — | |||||||||||||||||||||||||||
| U.S. government sponsored agencies | 121,650 | 3,221 | 2.65 | 157,907 | 3,987 | 2.53 | 166,792 | 3,744 | 2.24 | |||||||||||||||||||||||||||
| State and municipal obligations(1) | 59,342 | 2,633 | 4.44 | 59,107 | 2,827 | 4.78 | 59,205 | 2,817 | 4.76 | |||||||||||||||||||||||||||
| Other securities | 14,468 | 659 | 4.55 | 12,476 | 489 | 3.92 | 15,243 | 619 | 4.06 | |||||||||||||||||||||||||||
| Federal funds sold | 2,289 | 4 | 0.19 | 2,426 | 6 | 0.26 | 2,254 | 6 | 0.27 | |||||||||||||||||||||||||||
| Other money market instruments | 35,073 | 96 | 0.27 | 27,398 | 69 | 0.25 | 28,900 | 82 | 0.28 | |||||||||||||||||||||||||||
| Total earning assets | 919,755 | 36,276 | 3.94 | % | 895,399 | 35,794 | 4.00 | % | 873,622 | 35,807 | 4.10 | % | ||||||||||||||||||||||||
| Noninterest-earning assets | 83,126 | 83,199 | 87,055 | |||||||||||||||||||||||||||||||||
| Total assets | $ | 1,002,881 | $ | 978,598 | $ | 960,677 | ||||||||||||||||||||||||||||||
| LIABILITIES AND STOCKHOLDERS’ EQUITY | ||||||||||||||||||||||||||||||||||||
| Interest-Bearing Liabilities | ||||||||||||||||||||||||||||||||||||
| NOW accounts | $ | 135,982 | $ | 116 | 0.08 | % | $ | 129,989 | $ | 98 | 0.08 | % | $ | 133,452 | $ | 138 | 0.10 | % | ||||||||||||||||||
| Savings accounts | 342,605 | 482 | 0.14 | 311,570 | 437 | 0.14 | 298,933 | 418 | 0.14 | |||||||||||||||||||||||||||
| Time deposits>$100M | 45,623 | 352 | 0.77 | 46,662 | 386 | 0.83 | 51,039 | 533 | 1.04 | |||||||||||||||||||||||||||
| Time deposits<$100M | 83,045 | 383 | 0.46 | 100,480 | 619 | 0.62 | 127,850 | 1,079 | 0.84 | |||||||||||||||||||||||||||
| Brokered deposits | 3,732 | 9 | 0.23 | 10,805 | 49 | 0.45 | 21,544 | 324 | 1.50 | |||||||||||||||||||||||||||
| Total interest-bearing deposits | 610,987 | 1,342 | 0.22 | 599,506 | 1,589 | 0.26 | 632,818 | 2,492 | 0.39 | |||||||||||||||||||||||||||
| Federal funds purchased | 27 | — | 1.10 | 111 | — | 0.72 | — | — | — | |||||||||||||||||||||||||||
| Repurchase agreements | 46,965 | 61 | 0.13 | 41,110 | 98 | 0.24 | 34,728 | 79 | 0.23 | |||||||||||||||||||||||||||
| FHLB advances and other borrowings | 46,930 | 939 | 2.00 | 71,432 | 755 | 1.06 | 40,461 | 729 | 1.80 | |||||||||||||||||||||||||||
| Subordinated debentures | 16,100 | 267 | 1.66 | 16,100 | 259 | 1.61 | 16,100 | 266 | 1.65 | |||||||||||||||||||||||||||
| Convertible promissory notes | 267 | 27 | 10.08 | 5,825 | 612 | 10.51 | 9,400 | 975 | 10.37 | |||||||||||||||||||||||||||
| Total interest-bearing liabilities | 721,276 | 2,636 | 0.36 | % | 734,084 | 3,313 | 0.45 | % | 733,507 | 4,541 | 0.62 | % | ||||||||||||||||||||||||
| Demand deposits | 165,088 | 137,627 | 125,498 | |||||||||||||||||||||||||||||||||
| Accrued expenses and other liabilities | 7,285 | 7,606 | 7,958 | |||||||||||||||||||||||||||||||||
| Stockholders’ equity | 109,232 | 99,281 | 93,714 | |||||||||||||||||||||||||||||||||
| Total liabilities and stockholders’ equity | $ | 1,002,881 | $ | 978,598 | $ | 960,677 | ||||||||||||||||||||||||||||||
| Net interest income and rate spread(3) | $ | 33,640 | 3.58 | % | $ | 32,481 | 3.55 | % | $ | 31,266 | 3.48 | % | ||||||||||||||||||||||||
| Net interest margin(4) | 3.66 | % | 3.63 | % | 3.58 | % | ||||||||||||||||||||||||||||||
| (1) | The interest income on tax exempt securities and loans is computed on a tax-equivalent basis using a tax rate of 34% for all periods presented. |
| (2) | The average loan balances and rates include nonaccrual loans. |
| (3) | Interest rate spread is the difference between the annualized average yield earned on average interest-earning assets for the period and the annualized average rate of interest accrued on average interest-bearing liabilities for the period. |
| (4) | Net interest margin is the annualized effect of net interest income for a period divided by average interest-earning assets for the period. |
| 36 |
Table 2: Rate/Volume Analysis (1)
| 2015 compared to 2014 | 2014 compared to 2013 | |||||||||||||||||||||||
| Increase (Decrease) due to | Increase (Decrease) due to | |||||||||||||||||||||||
| Volume | Rate* | Net | Volume | Rate* | Net | |||||||||||||||||||
| (dollars in thousands) | ||||||||||||||||||||||||
| Interest income: | ||||||||||||||||||||||||
| Loans (2) | $ | 2,202 | $ | (955 | ) | $ | 1,247 | $ | 1,512 | $ | (1,635 | ) | $ | (123 | ) | |||||||||
| U.S. government-sponsored agencies | (952 | ) | 186 | (766 | ) | (207 | ) | 450 | 243 | |||||||||||||||
| State and municipal obligations (2) | 13 | (207 | ) | (194 | ) | (1 | ) | 11 | 10 | |||||||||||||||
| Other securities | 85 | 85 | 170 | (109 | ) | (21 | ) | (130 | ) | |||||||||||||||
| Federal funds sold | (1 | ) | (1 | ) | (2 | ) | — | — | — | |||||||||||||||
| Other money market instruments | 21 | 6 | 27 | (4 | ) | (9 | ) | (13 | ) | |||||||||||||||
| Total interest-earning assets | 1,368 | (886 | ) | 482 | 1,191 | (1,204 | ) | (13 | ) | |||||||||||||||
| Interest expense: | ||||||||||||||||||||||||
| NOW accounts | 5 | 13 | 18 | (4 | ) | (36 | ) | (40 | ) | |||||||||||||||
| Savings accounts | 44 | 1 | 45 | 18 | 1 | 19 | ||||||||||||||||||
| Time deposits | (104 | ) | (166 | ) | (270 | ) | (246 | ) | (361 | ) | (607 | ) | ||||||||||||
| Brokered deposits | (24 | ) | (16 | ) | (40 | ) | (136 | ) | (139 | ) | (275 | ) | ||||||||||||
| Repurchase agreements | 13 | (50 | ) | (37 | ) | 15 | 4 | 19 | ||||||||||||||||
| FHLB advances and other borrowings | (324 | ) | 508 | 184 | 408 | (382 | ) | 26 | ||||||||||||||||
| Subordinated debentures | — | 8 | 8 | — | (7 | ) | (7 | ) | ||||||||||||||||
| Convertible promissory notes | (561 | ) | (24 | ) | (585 | ) | (375 | ) | 12 | (363 | ) | |||||||||||||
| Total interest-bearing liabilities | (951 | ) | 274 | (677 | ) | (320 | ) | (908 | ) | (1,228 | ) | |||||||||||||
| Net interest income | $ | 2,319 | $ | (1,160 | ) | $ | 1,159 | $ | 1,511 | $ | (296 | ) | $ | 1,215 | ||||||||||
| * | Nonaccrual loans are included in the daily average loan balances outstanding. |
| (1) | The change in interest due to both rate and volume has been allocated proportionally to the relationship to the dollar amounts of the change in each. |
| (2) | The yield on tax-exempt loans and securities is computed on a tax-equivalent basis using a tax rate of 34% for all periods presented. |
2015 compared to 2014
Net Interest Income
Net interest income represents the difference between the dollar amount of interest earned on interest-earning assets and the dollar amount of interest paid on interest-bearing liabilities. The interest income and interest expense of financial institutions are significantly affected by general economic conditions, competition, policies of regulatory authorities and other factors.
Interest rate spread and net interest margin are used to measure and explain changes in net interest income. Interest rate spread is the difference between the yield on interest-earning assets and the rate paid for interest-bearing liabilities that fund those assets. Net interest margin is expressed as the percentage of net interest income to average interest-earning assets. Net interest margin exceeds interest rate spread because noninterest-bearing sources of funds (“net free funds”), principally demand deposits and stockholders’ equity, also support interest-earning assets. To compare tax-exempt asset yields to taxable yields, the yield on tax-exempt loans and securities is computed on a tax-equivalent basis. The narrative below discusses net interest income, interest rate spread and net interest margin on a tax-equivalent basis.
Table 1 above provides average balances of interest-earning assets and interest-bearing liabilities, tax-equivalent interest income and expense, and the corresponding interest rates earned, as well as net interest income, interest spread, and net interest margin on a tax-equivalent basis for the years ended December 31, 2015, 2014 and 2013. Results for 2015 were impacted somewhat by the acquisition of NEWBI in December 2015, in which $46.6 million of loans, $23.4 million of securities, $1.0 million of fed funds sold, and $68.5 million of deposits were acquired. Results for 2014 were impacted by the purchase of $13.7 million of deposits associated with the acquisition of one branch in February 2014.
| 37 |
Net interest income in the consolidated statements of operations (which excludes the tax-equivalent adjustment) was $32.6 million for 2015, compared to $31.4 million for 2014. The tax equivalent adjustments (adjustments needed to bring tax-exempt interest to a level that would yield the same after-tax income had that income been subject to taxation using a 34% tax rate) of $1.0 million for 2015 and $1.1 million for 2014 resulted in a tax-equivalent net interest income of $33.6 million and $32.5 million, respectively. The net interest margin for 2015 was 3.66% compared to 3.63% in 2014 and the interest rate spread for 2015 was 3.58% compared to 3.55% in 2014. The return on interest-earning assets declined 6 bp while the cost of interest-bearing liabilities declined 8 bp in 2015.
During 2015, we were relatively interest rate neutral (which means both assets and liabilities reprice at the same rate) but continued to re-position the balance sheet to be more asset sensitive (which means that assets will re-price faster than liabilities); meaning that future rate increases would impact net interest income positively. We expect that in a gradually increasing rate environment, our statement of operations would benefit from asset sensitivity over the long term, although changes in the portfolio or the pace of interest rate increases could affect that trend.
As shown in the rate/volume analysis in Table 2 on the preceding page, volume changes resulted in a $2.3 million increase to tax-equivalent net interest income in 2015. The changes in the composition of earning assets resulted in a $1.4 million increase to tax equivalent interest income in 2015 enhanced by a $0.9 million decrease in interest expense due to the composition change in interest-bearing liabilities. Rate changes on earning assets decreased interest income by $0.9 million and rate changes on interest-bearing liabilities, increased interest expense by $0.3 million, for an aggregate decrease in net interest income of $1.2 million due to changes in interest rates.
For 2015, the yield on earning assets declined to 3.94% from 4.00% in 2014, which was the combined effect of a decrease of 15 bps in the loan yield, a 34 bp decline in the yield on state and municipal obligations, and a 7 bp reduction in yields on federal funds sold offset by a 12 bp increase in yields on U.S. government sponsored agencies, a 63 bp increase in yields on other securities, and a 2 bp increase in yields on money market instruments. The average loan yield was 4.32% in 2015 and 4.47% in 2014. The decline in loan yields reflected lower yields received on new loan originations.
For 2015, the cost of interest-bearing liabilities decreased by 8 bps from 0.45% in 2014, to 0.37% in 2015. The combined average cost of interest-bearing deposits was 0.22%, down 4 bps from 2014, primarily resulting from the continued low short-term interest rate environment during 2015. Also contributing to the decrease was the cost of repurchase agreements (down 11 bps to 0.13%), offset by a 94 bp increase to 2.00% in the cost of FHLB advances and other borrowings. The cost of Convertible Notes decreased to 10.08% for 2015 from 10.51% for 2014. During 2015, $32.9 million of FHLB borrowings matured and $14.0 million of FHLB advances and other borrowings were advanced, resulting in an increase in cost for the year as the new borrowings carried higher rates.
Average earning assets were $919.8 million in 2015, compared to $895.4 million in 2014. Average loans outstanding increased 8.0% to $686.9 million in 2015 from $636.1 million in 2014. The merger with NEWBI in December 2015 in which $46.6 million of loans were acquired contributed $3.4 million to the increase in average loans. Average loans to average total assets increased to 68.5% in 2015 from 65.0% in 2014. For 2015, tax-equivalent interest income on loans increased $1.2 million, of which a $2.2 million increase was due to higher average loan balances, offset in part by a decrease of $1.0 million due to lower loan yields. Average balances of securities and short-term investments decreased $0.8 million in 2015 versus 2014. Tax-equivalent interest income on securities and short-term investments decreased $0.8 million, primarily from volume changes, with nominal impact from the rate environment. The merger with NEWBI in December 2015 in which $24.3 million of securities and short term investments were acquired, helped to offset the decrease in average securities and short term investments by $1.8 million.
Average interest-bearing liabilities decreased $12.8 million in 2015 from 2014 levels, while net free funds (the total of demand deposits, accrued expenses, other liabilities and stockholders’ equity less noninterest earning assets) increased $37.2 million during the same period. The increase in net free funds is primarily attributable to an increase in demand deposits. Average demand deposits increased by $27.5 million. Average interest-bearing deposits increased $11.5 million, or 1.9% during 2015 to $611.0 million. This increase resulted from a $31.0 million increase in savings balances and a $6.0 million increase in NOW balances, offset by a $18.5 million, or 12.6% decrease in time deposits and a $7.1 million decrease in brokered deposits. Interest expense on interest-bearing deposits decreased $0.1 million each from volume and mix changes and from impact of lower rates during 2015, resulting in an aggregate decrease of $0.2 million in interest expense on interest-bearing deposits for the year. Average wholesale-funding sources decreased by $24.3 million during 2015 primarily due to decreases in FHLB advances and other borrowings and the conversion of the remaining Convertible Notes in April 2015, offset by increases in repurchase agreements. For 2015, interest expense on wholesale funding sources decreased by $0.49 million from 2014 due to changes in volume and mix, offset by increases in interest expense of $0.5 million related to rates.
| 38 |
Provision for Loan Losses
The PFLL is the periodic cost of providing an allowance for probable and inherent losses in our loan portfolio. The ALL consists of specific and general components. Our internal risk system is used to identify loans that meet the criteria for being “impaired” as defined in the accounting guidance. The specific component relates to loans that are individually classified as impaired and where expected cash flows are less than carrying value. The general component covers non-impaired loans and is based on historical loss experience adjusted for qualitative factors. These qualitative factors include: 1) changes in the nature, volume and terms of loans, 2) changes in lending personnel, 3) changes in the quality of the loan review function, 4) changes in nature and volume of past-due, nonaccrual and/or classified loans, 5) changes in concentration of credit risk, 6) changes in economic and industry conditions, 7) changes in legal and regulatory requirements, 8) unemployment and inflation statistics, and 9) changes in underlying collateral values.
Net loan charge-offs for the year ended December 31, 2015 were $1.3 million compared to net charge-offs of $0.6 million for 2014. Net charge-offs to average loans were 0.19% for 2015 compared to 0.10% in 2014. Nonperforming loans decreased by $3.0 million (57.0%), to $2.2 million at December 31, 2015, from $5.2 million at December 31, 2014, an indication of improvement in the quality of the loan portfolio. Refer to the “Financial Condition - Risk Management and the Allowance for Loan Losses” and “Balance Sheet Analysis - Nonperforming Loans and Other Real Estate Owned” sections below for more information related to nonperforming loans.
PFLL of $0.2 million was recorded for the year ended December 31, 2015 compared to none for the same period in 2014. Our management believes that the ALL as of December 31, 2015 is appropriate in view of the present condition of the loan portfolio and the amount and quality of the collateral supporting nonperforming loans. The loans acquired in the merger with NEWBI were evaluated for credit impairment and recorded at the time of acquisition at fair value. There was no subsequent credit deterioration related to these loans and therefore no allowance was allocated to the loans at December 31, 2015. We are continually monitoring nonperforming loan relationships and will make provisions, as necessary, if the facts and circumstances change. In addition, a decline in the quality of our loan portfolio as a result of general economic conditions, factors affecting particular borrowers or our market area, could affect the adequacy of the ALL. If there are significant charge-offs against the ALL or we otherwise determine that the ALL is inadequate, we will need to make additional PFLLs in the future. See the “Balance Sheet Analysis - Risk Management and the Allowance for Loan Losses” following for more information related to nonperforming loans.
| 39 |
Noninterest Income
Table 3: Noninterest Income
| Noninterest Income | ||||||||||||
| Years Ended December 31, | ||||||||||||
| 2015 | 2014 | % Change | ||||||||||
| Fees from fiduciary services | $ | 1,159 | $ | 1,044 | 11.0 | % | ||||||
| Fees from loan servicing | 633 | 584 | 8.4 | % | ||||||||
| Service charges on deposit accounts | 3,144 | 2,974 | 5.7 | % | ||||||||
| Other fee income | 630 | 646 | (2.5 | )% | ||||||||
| Financial services income | 1,194 | 1,153 | 3.6 | % | ||||||||
| Gains from sales of loans | 922 | 648 | 42.3 | % | ||||||||
| Net change in valuation of MSRs | (79 | ) | (205 | ) | 61.5 | % | ||||||
| Net gains from sale of securities | 465 | 446 | 4.3 | % | ||||||||
| Net gain from sale of premise and equipment | 11 | 1 | 1,000.0 | % | ||||||||
| Increase in CSV | 355 | 382 | (7.1 | )% | ||||||||
| Income in equity of UFS | 1,216 | 1,208 | 0.7 | % | ||||||||
| Other income | 46 | 186 | (75.3 | )% | ||||||||
| Total Noninterest Income | $ | 9,696 | $ | 9,067 | 6.9 | % | ||||||
Fees from fiduciary services, service charges on deposit accounts, financial services income, and income from our UFS subsidiary were the primary components of noninterest income in 2015. Total noninterest income for 2015 was $9.7 million, a $0.6 million or 6.9% increase from $9.1 million in 2014. This increase was due primarily to a $0.3 million increase in gains from the sale of loans, a $0.1 million increase in net fees from fiduciary services, a $0.2 million increase in service charges on deposit accounts, and a $0.1 million increase in the valuation of mortgage servicing rights, offset in part by a $0.1 million reduction in other income. The noninterest income to average assets ratio was 0.97% for the year ended December 31, 2015 compared to 0.93% for the same period in 2014.
Gains of $0.5 million from the sale of securities in our investment portfolio were realized in 2015 comparable to such gains in 2014. These gains were available due to the low interest rate environment and the sales allowed us to reposition our investment portfolio to take advantage of increased credit-related spreads and to provide additional cash for funding of increased loan demand. Our securities portfolio at December 31, 2015 has net unrealized gains of $2.6 million.
Gains on loans sold in the secondary market increased from $0.6 million in 2014 to $0.9 million in 2015, an increase of $0.3 million, or 42.3%. These gains were primarily from residential mortgage loans sold in the secondary market and are included in gains from sales of loans in noninterest income. The continued low interest rate environment and improving economy made home purchases attractive to consumers.
| 40 |
Noninterest Expense
Table 4: Noninterest Expense
| Noninterest
Expense Years Ended December 31, |
||||||||||||
| 2015 | 2014 | % Change | ||||||||||
| Salaries and employee benefits | $ | 17,834 | $ | 16,557 | 7.7 | % | ||||||
| Occupancy | 2,145 | 2,137 | 0.4 | % | ||||||||
| Equipment | 1,382 | 1,351 | 2.3 | % | ||||||||
| Data processing and courier | 948 | 861 | 10.1 | % | ||||||||
| Operation of other real estate owned | 769 | 1,009 | (23.8 | )% | ||||||||
| Business development and advertising | 665 | 604 | 10.1 | % | ||||||||
| Charitable contributions | 81 | 79 | 2.5 | % | ||||||||
| Stationary and supplies | 391 | 457 | (14.4 | )% | ||||||||
| Director fees | 394 | 386 | 2.1 | % | ||||||||
| FDIC | 613 | 604 | 1.5 | % | ||||||||
| Audit and legal expense | 1,146 | 808 | 41.8 | % | ||||||||
| Loan and collection | 74 | 37 | 100.0 | % | ||||||||
| Other outside services | 1,746 | 1,148 | 52.1 | % | ||||||||
| Other operating | 2,222 | 2,284 | (2.7 | )% | ||||||||
| Total Noninterest expense | $ | 30,410 | $ | 28,322 | 7.4 | % | ||||||
Noninterest expense increased from $28.3 million in 2014 to $30.4 million in 2015, for an increase of $2.1 million or 7.4%, primarily due to merger related expenses.
Salaries and employee benefits expense is the largest component of noninterest expense, totaling $17.8 million in 2015, increased from $16.6 million in 2014. Salary and employee benefit expenses were impacted by $0.5 million related to the departure of two senior executives of the Bank; one of whose departure was in anticipation of our pending merger with Nicolet. Additionally, $0.1 million of cost relating to transitioning of Union employees to the Bank in conjunction of our acquisition of NEWBI were incurred. The number of full-time equivalent employees increased from 243 in 2014 to 244 in 2015. In 2015 our financial results met our targeted performance levels and cash incentive bonuses of $0.7 million were earned, increased from $0.6 million in 2014.
There were no costs associated with the Bank’s Supplemental Executive Retirement Plan (“SERP Plan”) in 2015, versus costs of $0.1 million in 2014. In addition, no contributions were made to the SERP Plan in either 2015 or 2014. The SERP Plan is intended to provide deferred compensation in excess of that available under our other retirement programs to certain management and highly-compensated employees who have contributed and are expected to continue to contribute to our success.
Accrued benefit costs, principally for health insurance, and pension costs, represent the remaining portion of personnel-related costs. Health insurance costs are expected to increase in 2016 due to increases in associated premiums. Benefit expense was consistent with 2014 and included incentive compensation costs for 2015 of $1.2 million, of which $0.5 million related to the Equity Incentive Plan. In March 2015 and 2014, grants of restricted stock units and stock options were made under the plan. Total 401K safe harbor contributions of $0.4 million were made in 2015 compared to $0.3 million in 2014. In addition, a 1% 401K matching contribution totaling $0.1 million was made in 2015 and 2014.
Net occupancy expense was $2.1 million in 2015, consistent with 2014.
Income generated from other real estate owned is netted against related expenses in the determination of operation of other real estate owned. These properties reflected a net expense from the operation of such real estate of $0.8 million in 2015, down from $1.0 million in 2014 due to a reduction in the number of other real estate owned properties held. Provision for valuation reductions of other real estate owned obtained by us in collection efforts were charged to 2015 operations in the amount of $0.6 million, reflecting a decline in estimated market values of such properties based on appraisals and other evaluation means. This compared to a $0.7 million provision for such valuations in 2014. Significant efforts were made to further reduce the balances of our other real estate owned. A net gain of $0.1 million was recognized on the sale of such properties in 2015 compared to a nominal gain in 2014.
| 41 |
FDIC insurance premiums were $0.6 million for 2015 consistent with the same period a year ago.
Audit and legal costs, as well as costs of other outside services both increased compared to 2014 due primarily to costs associated with both the NEWBI and pending Nicolet mergers.
While 2015 other operating expenses of $2.2 million were consistent with those of the prior year, costs incurred in 2015 included $0.3 million related to write downs to fair market value of Premises Held for Sale as well as $0.2 million related to make-whole costs associated with the UFS reorganization. Other operating expenses in 2014 included $0.7 million of such make-whole costs.
Provision for Income Taxes
Income tax expense totaled $3.7 million in 2015 on pre-tax income of $11.7 million (for an effective tax rate of 31.6%), compared to income tax expense of $3.3 million in 2014 on pre-tax income of $12.2 million (for an effective tax rate of 26.7%). The higher effective tax rate in 2015 compared to 2014 primarily reflected the impact of non-deductible or partially deductible expenses associated with both the NEWBI and pending Nicolet mergers.
See Note 1, “Nature of Business and Summary of Significant Accounting Policies” and Note 18, “Income Taxes” of the Notes to Consolidated Financial Statements for a further discussion of income tax accounting. Income tax expense recorded in the consolidated statements of operations involves interpretation and application of certain accounting pronouncements and federal and state tax codes and is, therefore, considered a critical accounting policy. We undergo examination by various taxing authorities. Such taxing authorities may require that changes in the amount of tax expense or valuation allowance be recognized when their interpretations differ from those of management, based on their judgments about information available to them at the time of their examinations.
2014 compared to 2013
Net Interest Income
Net interest income in the consolidated statements of operations (which excludes the tax-equivalent adjustment) was $31.4 million for 2014, compared to $30.2 million for 2013. The tax equivalent adjustments (adjustments needed to bring tax-exempt interest to a level that would yield the same after-tax income had that income been subject to taxation using a 34% tax rate) of $1.1 million for 2014 and 2013 resulted in a tax-equivalent net interest income of $32.5 million and $31.3 million, respectively. The net interest margin for 2014 was 3.63% compared to 3.58% in 2013 and the interest rate spread for 2014 was 3.55% compared to 3.48% in 2013. The return on interest-earning assets declined 10 bp while the cost of interest-bearing liabilities declined 17 bp in 2014. Net interest income for 2014 was impacted by the purchase of $13.7 million of deposits associated with the acquisition of one branch in February 2014. Results for 2013 were impacted by the sale of $15.6 million of deposits associated with the closure of two branches in November, as well as by the closure of one other branch in the second quarter of 2013.
During 2014, we were liability sensitive (which means that liabilities will re-price faster than assets) but continued to re-position the balance sheet to be more asset sensitive; which would mean that future rate increases would impact net interest income positively. We expect that in a gradually increasing rate environment, our statement of operations would benefit from asset sensitivity over the long term, although changes in the portfolio or the pace of interest rate increases could affect that trend.
As shown in the rate/volume analysis in Table 2 above, volume changes resulted in a $1.5 million increase to tax-equivalent net interest income in 2014. The changes in the composition of earning assets resulted in a $1.2 million increase to tax equivalent interest income in 2014 enhanced by a $0.3 million decrease in interest expense due to the composition change in interest-bearing liabilities. Rate changes on earning assets decreased interest income by $1.2 million but were partially offset by rate changes on interest-bearing liabilities, which decreased interest expense by $0.9 million, for a net decrease in net interest income of $0.3 million due to changes in interest rates.
| 42 |
For 2014, the yield on earning assets declined to 4.00% from 4.10% in 2013, which was the combined effect of a decrease of 28 bps in the loan yield, a 14 bp decline in the yield on other securities, a 3 bp decrease in the yield on money market instruments and a 1 bp reduction in the yield on federal funds sold offset by a 29 bp increase in the yield on U.S. government sponsored agencies and a 2 bp increase in the yield on state and municipal obligations. The average loan yield was 4.47% in 2014 and 4.75% in 2013. The decline in loan yields reflected lower yields received on new loan originations.
For 2014, the cost of interest-bearing liabilities decreased by 17 bps from 0.62% in 2013, to 0.45%. The combined average cost of interest-bearing deposits was 0.26%, down 13 bps from 2013, primarily resulting from the continued low short-term interest rate environment during 2014. Also contributing to the decrease was the cost of funding, comprising FHLB advances (down 74 bps to 1.06%) and subordinated debentures (down 4 bp to 1.61%) offset by a 1 bp increase to 0.24% in the cost of repurchase agreements. During 2014, $76.3 million of FHLB borrowings matured and $82.5 million of FHLB borrowings were advanced, resulting in a reduction in cost for the year as the new borrowings carried lower rates. The cost of Convertible Notes increased to 10.51% for 2014 from 10.37% for 2013.
Average earning assets were $895.4 million in 2014, compared to $873.6 million in 2013. Average loans outstanding increased 5.8% to $636.1 million in 2014 from $601.2 million in 2013. Average loans to average total assets increased to 65.0% in 2014 from 62.6% in 2013. Tax-equivalent interest income on loans decreased $0.1 million, of which $1.6 million related to the lower loan yields offset by an increase of $1.5 million related to higher average loan balances. Average balances of securities and short-term investments decreased $13.1 million in 2014 versus 2013. Tax-equivalent interest income on securities and short-term investments decreased $0.3 million from volume changes, and increased $0.4 million from the impact of the rate environment, for a net increase of $0.1 million in tax-equivalent interest income on securities in our investment portfolio.
Average interest-bearing liabilities increased $0.6 million in 2014 from 2013 levels, while net free funds (the total of demand deposits, accrued expenses, other liabilities and stockholders’ equity less noninterest earning assets) increased $17.3 million during the same period. The increase in net free funds is primarily attributable to an increase in demand deposits. Average demand deposits increased by $12.1 million, or 9.7%. Average interest-bearing deposits declined $33.3 million, or 5.3% during 2014 to $599.5 million. This decline resulted from a decrease in time deposits of $31.4 million, or 17.7% and a $3.5 million decrease in NOW balances offset by a $12.6 million, or 4.2% increase in savings average balances. Interest expense on interest-bearing deposits decreased $0.4 million from the volume and mix changes and $0.5 million from impact of lower rates during 2014, resulting in an aggregate decrease of $0.9 million in interest expense on interest-bearing deposits for the year. Average wholesale-funding sources increased by $33.9 million during 2014 primarily due to increases in FHLB borrowings and repurchase agreements. For 2014, interest expense on wholesale funding sources decreased by $0.3 million from 2013 due to declining interest rates.
Provision for Loan Losses
The PFLL is the periodic cost of providing an allowance for probable and inherent losses in our loan portfolio. The ALL consists of specific and general components. Our internal risk system is used to identify loans that meet the criteria for being “impaired” as defined in the accounting guidance. The specific component relates to loans that are individually classified as impaired and where expected cash flows are less than carrying value. The general component covers non-impaired loans and is based on historical loss experience adjusted for qualitative factors. These qualitative factors include: 1) changes in the nature, volume and terms of loans, 2) changes in lending personnel, 3) changes in the quality of the loan review function, 4) changes in nature and volume of past-due, nonaccrual and/or classified loans, 5) changes in concentration of credit risk, 6) changes in economic and industry conditions, 7) changes in legal and regulatory requirements, 8) unemployment and inflation statistics, and 9) changes in underlying collateral values.
Net loan charge-offs for the year ended December 31, 2014 were $0.6 million compared to net charge-offs of $2.9 million for 2013. Net charge-offs to average loans were 0.10% for 2014 compared to 0.48% in 2013. Nonperforming loans decreased by $1.5 million (22.6%), to $5.2 million at December 31, 2014, from $6.7 million at December 31, 2013, an indication of improvement in the quality of the loan portfolio. Refer to the “Financial Condition - Risk Management and the Allowance for Loan Losses” and “Balance Sheet Analysis - Nonperforming Loans and Other Real Estate Owned” sections below for more information related to nonperforming loans.
| 43 |
No PFLL was recorded for the year ended December 31, 2014 compared to $1.4 million for the same period in 2013. See the “Balance Sheet Analysis - Risk Management and the Allowance for Loan Losses” following for more information related to nonperforming loans.
Fees from fiduciary services, service charges on deposit accounts, financial services income, and income from our UFS subsidiary were the primary components of noninterest income in 2014. Total noninterest income for 2014 was $9.1 million, a $0.7 million or 7.8% decrease from $9.8 million in 2013. This decrease was due primarily to a $0.8 million decrease in gains from the sale of loans, a $0.1 million decrease in net gains from the sale of securities, a $0.1 million decrease in net gain on the sale of branches, and a $0.1 million decline in the valuation of mortgage servicing rights. These declines were offset by a $0.3 million increase in income in equity of the Bank’s UFS subsidiary. The noninterest income to average assets ratio was 0.93% for the year ended December 31, 2014 compared to 1.02% for the same period in 2013.
Gains of $0.4 million from the sale of securities in our investment portfolio were realized in 2014 compared to $0.6 million of such gains in 2013. These gains were available due to the low interest rate environment and the sales allowed us to reposition our investment portfolio to take advantage of increased credit-related spreads and to provide additional cash for funding of increased loan demand. Our securities portfolio at December 31, 2014 had net unrealized gains of $3.8 million.
Gains on loans sold in the secondary market declined from $1.4 million in 2013 to $0.6 million in 2014, a decrease of $0.8 million, or 54.2% due to a larger volume of loans being sold into the secondary market during 2015 compared to 2014. These gains were primarily from residential mortgage loans sold in the secondary market and are included in gains from sales of loans in noninterest income. Although very low interest rates continued throughout 2014, the refinance activity declined due to the large volume of consumers who had refinanced in 2013 and 2012. Additionally, we chose to hold more mortgage loans on our balance sheet rather than sell them into the secondary market in 2014, thus not recording a gain on sale.
Noninterest Expense
Noninterest expense in 2014 increased to $28.3 million from $27.3 million in 2013, for an increase of $1.0 million or 3.7%, primarily as a result of an increase in occupancy and equipment expenses related to the acquisition of an additional branch in the first quarter of 2014 and the $0.7 million make-whole costs associated with the UFS reorganization. These increases were offset by a decrease in loan and collection expenses and FDIC insurance expense.
Salaries and employee benefits expense is the largest component of noninterest expense, totaling $16.6 million in 2014, unchanged from 2013. Commissioned salespersons, including financial advisors and mortgage originators, are paid a base salary plus commissions. Mortgage commission expense decreased $0.2 million in 2014 due to decreased mortgage origination and refinancing activity and the related decreased mortgage volumes. The number of full-time equivalent employees decreased from 258 in 2013 to 243 in 2014. In 2014 our financial results met our targeted performance levels and cash incentive bonuses of $0.6 million were earned. This is unchanged compared to cash incentive bonuses earned in 2013.
Costs associated with the SERP Plan were $0.1 million for 2014, a decline from $0.2 million in 2013. No Bank contributions were made to the SERP Plan in 2014 or 2013.
Accrued benefit costs, principally for health insurance, pension costs and bonus expense, represent the remaining portion of personnel-related costs. Benefit expense in 2014 was consistent with 2013 and included incentive compensation costs for 2014 of $0.9 million, of which $0.4 million related to the Equity Incentive Plan. In March 2013 and April 2014, grants of restricted stock units and stock options were made under the plan. Total 401K safe harbor contributions of $0.3 million were made in 2014 consistent with 2013. In addition, a 1% 401K matching contribution totaling $0.1 million was made in 2014 and 2013.
Net occupancy expense increased to $2.1 million in 2014 compared to $1.9 million in 2013. Impacting net occupancy expense in 2014 was the purchase of one branch in February 2014.
| 44 |
Other real estate owned reflected a net expense from the operation of such properties of $1.0 million in 2014 consistent with 2013. Provision for valuation reductions of other real estate owned obtained by us in collection efforts were charged to 2014 operations in the amount of $0.7 million, reflecting a decline in estimated market values of such properties based on appraisals and other evaluation means. This compared to a $0.9 million provision for such valuations in 2013. Significant efforts were made to further reduce the balances of our other real estate owned. A net gain of $0.1 million was recognized on the sale of other real estate owned in 2014 compared to a net gain of $0.2 million in 2013.
FDIC insurance premiums decreased to $0.6 million for 2014 from $0.7 million for the same period a year ago, a decrease of $0.1 million, or 13.6%. The decrease in FDIC insurance premiums in 2014 compared to 2013 was primarily related to a decrease in the assessment rate.
Loan and collection expenses were less than $0.1 million in 2014 compared to $0.2 million in 2013. This is primarily related to costs on loans that are in the collection process that have not been transferred to other real estate owned and includes costs incurred for property management fees, real estate taxes, insurance and operating expenses. There were no external legal costs incurred related to these loans in 2014.
Provision for Income Taxes
Income tax expense totaled $3.3 million in 2014 on pre-tax income of $12.2 million (for an effective tax rate of 26.7%), compared to income tax expense of $3.3 million in 2013 on pre-tax income of $11.3 million (for an effective tax rate of 29.3%). The lower effective tax rate in 2014 compared to 2013 reflected reversal of a previously recorded deferred tax liability offset in part by the non-deductibility of the make-whole costs, both of which resulted from the UFS tax strategy reorganization.
See Note 1, “Nature of Business and Summary of Significant Accounting Policies” and Note 16, “Income Taxes” of the Notes to Consolidated Financial Statements for a further discussion of income tax accounting. Income tax expense recorded in the consolidated statements of operations involves interpretation and application of certain accounting pronouncements and federal and state tax codes and is, therefore, considered a critical accounting policy. We undergo examination by various taxing authorities. Such taxing authorities may require that changes in the amount of tax expense or valuation allowance be recognized when their interpretations differ from those of management, based on their judgments about information available to them at the time of their examinations.
| 45 |
BALANCE SHEET ANALYSIS
Loans
Gross loans outstanding increased $64.0 million, from $679.4 million at December 31, 2014 to $743.4 million at December 31, 2015, a 9.4% increase year over year. This follows a 9.9% increase between December 31, 2013 and December 31, 2014. Without the acquisition of $46.6 million of loans in the NEWBI acquisition, gross loans would have increased $17.4 million or 2.6%.
Table 5 summarizes the composition (mix) of the loan portfolio at December 31 for the most recent five fiscal years:
Table 5: Loan Composition
As of December 31, (dollars in thousands) | ||||||||||||||||||||||||||||||||||||||||
| 2015 | 2014 | 2013 | 2012 | 2011 | ||||||||||||||||||||||||||||||||||||
| Amount | % of Total | Amount | % of Total | Amount | % of Total | Amount | % of Total | Amount | % of Total | |||||||||||||||||||||||||||||||
| Amount of loans by type | ||||||||||||||||||||||||||||||||||||||||
| Real estate-mortgage | ||||||||||||||||||||||||||||||||||||||||
| Commercial | $ | 318,324 | 42.8 | % | $ | 304,446 | 44.8 | % | $ | 287,815 | 46.6 | % | $ | 291,992 | 49.0 | % | $ | 317,198 | 50.3 | % | ||||||||||||||||||||
| 1-4 Family residential | 178,784 | 24.1 | 152,091 | 22.4 | 142,398 | 23.0 | 127,315 | 21.4 | 143,456 | 22.7 | ||||||||||||||||||||||||||||||
| Construction | 43,760 | 5.9 | 40,808 | 6.0 | 36,948 | 6.0 | 40,901 | 6.9 | 53,606 | 8.5 | ||||||||||||||||||||||||||||||
| Commercial and agricultural | ||||||||||||||||||||||||||||||||||||||||
| Syndicated | 64,585 | 8.7 | 65,429 | 9.6 | 43,105 | 7.0 | 33,626 | 5.6 | 6,252 | 1.0 | ||||||||||||||||||||||||||||||
| Other | 107,447 | 14.4 | 88,045 | 13.0 | 82,185 | 13.3 | 75,264 | 12.7 | 85,498 | 13.6 | ||||||||||||||||||||||||||||||
| Consumer installment | 8,622 | 1.2 | 6,075 | 0.9 | 6,495 | 1.1 | 7,882 | 1.3 | 8,809 | 1.4 | ||||||||||||||||||||||||||||||
| Tax exempt loans | 22,355 | 3.0 | 22,964 | 3.4 | 19,435 | 3.1 | 18,970 | 3.2 | 16,577 | 2.6 | ||||||||||||||||||||||||||||||
| Less: deferred fees, net of costs | (496 | ) | (0.1 | ) | (501 | ) | (0.1 | ) | (421 | ) | (0.1 | ) | (417 | ) | (0.1 | ) | (381 | ) | (0.1 | ) | ||||||||||||||||||||
| Total loans (net of unearned income) | $ | 743,381 | 100.0 | % | $ | 679,357 | 100.0 | % | $ | 617,960 | 100.0 | % | $ | 595,533 | 100.0 | % | $ | 631,015 | 100.0 | % | ||||||||||||||||||||
Commercial real estate loans secured by farmland, multifamily property, and nonfarm/non-residential real estate property totaled $318.3 million at year-end 2015 comprising 42.8% of the loan portfolio. Loans of this type are mainly for business property, multifamily property and community purpose property. The credit risk related to these types of loans is greatly influenced by general economic conditions, especially those applicable to the Northeast Wisconsin market area, and the resulting impact on our borrowers’ operations. Many times, we will secure these loans with additional real estate collateral to enhance the overall lending relationship. A decline in the tourism industry, or other economic effects, such as increased interest rates affecting demand for real estate, could affect both our lending opportunities in this area and the value of our collateral for these loans. We acquired $12.3 million of loans in this category in the merger with NEWBI.
Commercial and agricultural loans not secured by real estate totaled $172.0 million at year-end 2015, an increase of $18.6 million or 12.1% since year-end 2014 due to $4.4 million of such loans acquired in the NEWBI transaction, as well as increased loan originations, primarily resulting from the purchase of loan participations with other financial institutions. Syndicated loans decreased $0.1 million or 1.3% to $64.6 million at December 31, 2015 from $65.4 million at year-end of 2014. Syndicated commercial loans are loans purchased in the national market place, which represent small portions of national credits and allows us to attempt to sustain or grow loan balances while reducing our exposure in commercial real estate loans. The other commercial and agricultural loan classification primarily consists of commercial loans to small businesses. Loans of this type are in a broad range of industries and include service, retail, wholesale and manufacturing concerns. Agricultural loans are made principally to farmers engaged in dairy, cherry and apple production. Borrowers are primarily concentrated in Door, Brown, Outagamie, Kewaunee, and Manitowoc Counties of Wisconsin. The origination of new other commercial and commercial real estate loans was primarily from our Brown County market area. The credit risk related to these loans is largely influenced by general economic conditions, especially those specifically applicable to that market area, and the resulting impact on borrowers’ operations. Management uses an active credit risk management process for commercial loans to ensure that sound and consistent credit decisions are made. Management attempts to control credit risk by adhering to detailed underwriting procedures, performing comprehensive loan administration, and undertaking periodic review of borrowers’ outstanding loans and commitments. Borrower relationships are formally reviewed periodically during the life of the loan. Further analyses by customer, industry, and location are performed to monitor trends, financial performance and concentrations.
| 46 |
Real estate construction loans increased $3.0 million or 7.2% to $43.8 million at December 31, 2015 from $40.8 million at December 31, 2014. Loans in this classification are primarily short-term interim loans that provide financing for the acquisition or development of commercial real estate, such as multifamily or other commercial development projects. The credit risk related to real estate construction loans is generally limited to specific geographic areas, but it is also influenced by general economic conditions. We attempt to control the credit risk on these types of loans by making loans to developers in familiar markets, reviewing the merits of the individual project, controlling loan structure and monitoring project progress and advances of construction proceeds. We acquired $2.4 million of loans in this category in the merger with NEWBI.
Our loan portfolio is diversified by types of borrowers and industry groups within the market areas that we serve. Significant loan concentrations are considered to exist for a financial entity when such amounts are loans to multiple borrowers engaged in similar activities that cause them to be similarly impacted by economic or other conditions. We have identified certain industry groups within our market area, including lodging, restaurants, retail shops, small manufacturing, real estate rental properties and real estate development. At December 31, 2015, two industry group concentrations existed in our loans that exceeded 10% of total loans; loans on non-residential real estate rental properties located throughout our market area totaled $86.8 million or 11.7% of total loans at December 31, 2015, compared to $94.3 million or 13.9% at December 31, 2014. In addition, the recreation industry totaled $85.2 million or 11.5% of total loans at December 31, 2015, compared to $85.9 million or 12.6% of total loans at December 31, 2014.
At the end of 2015, residential real estate mortgage loans totaled $178.8 million and comprised 24.1% of the loan portfolio. These loans increased $26.7 million or 17.6% during 2015 due to $24.3 million of this type loan acquired in the merger with NEWBI and a focus on maintaining a larger portion of these loans on our balance sheet than in prior years. Home equity loans accounted for approximately $0.6 million of the increase. Our product offerings include mortgages that will be recorded on our balance sheet rather than sold in the secondary market. Residential real estate loans consist of conventional fixed-rate home mortgages, adjustable indexed variable rate mortgage loans, home equity loans, and secondary home mortgages. Loans are primarily for properties within the market areas we serve. Residential real estate loans generally contain a limit for the maximum loan to collateral value of 75% to 80% of fair market value. Private mortgage insurance may be required when the loan-to-value ratio exceeds these limits.
We offer indexed adjustable-rate mortgage loans based upon market demands. At year-end 2015, those loans totaled $69.8 million, an increase of $20.4 million over 2014. Included in the year-over-year increase are $13.4 million of adjustable-rate mortgage loans acquired in the acquisition of NEWBI. Adjustable rate mortgage loans contain an interest rate adjustment provision tied to the weekly average yield on U.S. Treasury securities adjusted to a constant maturity of one year (the “index”), plus an additional spread of up to 2.75%. Interest rates on indexed mortgage loans are adjusted up or down on predetermined dates fixed by contract in relation to and based on the index or market interest rates as of a predetermined time prior to the adjustment date. Adjustable rate mortgage loans have an initial rate-lock period, ranging from one to five years, during which time the interest rate is fixed, with adjustments permitted thereafter, subject to annual and lifetime interest rate caps that vary by product type. Annual limits on interest rate changes are 2% while aggregate lifetime interest rate increases over the term of the loan are currently capped at 6% above the original mortgage loan interest rate. We do not originate sub-prime loans.
We also offer loans that are not retained on our balance sheet. We participate in a fixed rate mortgage program under the Federal Home Loan Mortgage Corporation (“FHLMC”) guidelines. These loans are sold in the secondary market without recourse and we retain servicing rights. During 2015, sales of these loans totaled $14.3 million compared to $10.4 million during 2014. In the merger with NEWBI, $37.5 million of these loans with servicing rights retained of $0.3 million were acquired. In addition, we also offer fixed rate mortgages through participation in fixed rate mortgage programs with private investors. These loans also are sold in the secondary market without recourse and with servicing rights released to the buyer. In 2015, we sold $46.1 million in mortgage loans through the secondary market programs, including the FHLMC, compared to $30.3 million in 2014. When we sell mortgage loans in the secondary market, we make representations and warranties to the purchasers about various characteristics of each loan, including the underwriting standards applied and the documentation being provided. Failure to comply with the requirements established by the purchaser of the loan may result in us having to repurchase the loan. There have not been any material instances where we were required to repurchase loans.
| 47 |
Installment loans to individuals totaled $8.6 million, or 1.2% of the total loan portfolio at December 31, 2015, compared to $6.1 million, or 0.9%, at December 31, 2014. We acquired $3.2 million of such loans in the merger with NEWBI. Installment loans include short-term installment loans, direct and indirect automobile loans, recreational vehicle loans, credit card loans, and other personal loans. Individual borrowers may be required to provide collateral or a satisfactory endorsement or guaranty from another party, depending upon the specific type of loan and the creditworthiness of the borrower. Loans are made to individual borrowers located in the market areas we serve. Credit risks for loans of this type are generally influenced by general economic conditions (especially in the market areas served), the characteristics of individual borrowers and the nature of the loan collateral. Reviewing the creditworthiness of the borrowers, as well as taking the appropriate collateral and guaranty positions on such loans, primarily controls credit risk.
Tax exempt loans totaled $22.4 million, or 3.0% of the total loan portfolio at December 31, 2015 compared to $23.0 million, or 3.4% at year-end 2014. Tax exempt loans are short- or long-term loans to municipalities and other tax exempt entities. The proceeds of these loans are collateralized by the backing of the corresponding taxing authority and can be used for general municipal purposes or revenue producing projects. We acquired $0.1 million of loans in this classification type in the merger of NEWBI.
Table 6 details expected maturities by loan purpose as of December 31, 2015. Those loans with expected maturities over one year are further scheduled by fixed rate or variable rate interest sensitivity.
Table 6: Loan Maturity and Interest Rate Sensitivity
| Maturity | ||||||||||||||||
| December 31, 2015 | Within 1 Year | 1-5 Years | After 5 Years | Total | ||||||||||||
| (dollars in thousands) | ||||||||||||||||
| Loans secured primarily by real estate: | ||||||||||||||||
| Residential | $ | 36,100 | $ | 32,028 | $ | 110,656 | $ | 178,784 | ||||||||
| Construction | 25,725 | 17,288 | 747 | 43,760 | ||||||||||||
| Commercial (1) | 77,913 | 188,609 | 51,306 | 317,828 | ||||||||||||
| Commercial, syndicated | — | 30,057 | 34,528 | 64,585 | ||||||||||||
| Commercial, other | 46,497 | 52,725 | 8,225 | 107,447 | ||||||||||||
| Tax-exempt | 813 | 6,136 | 15,406 | 22,355 | ||||||||||||
| Consumer | 3,035 | 4,726 | 861 | 8,622 | ||||||||||||
| Total | $ | 190,083 | $ | 331,569 | $ | 221,729 | $ | 743,381 | ||||||||
| Interest sensitivity | |||||||||||
| Fixed rate | Variable rate | ||||||||||
| Due after one year | $ | 319,899 | $ | 233,399 | |||||||
| (1) | Commercial loans have been adjusted for deferred fees, net of costs. |
Critical factors in the overall management of credit quality are sound loan underwriting and administration, systematic monitoring of existing loans and commitments, effective loan review on an ongoing basis, allowance to provide for anticipated loan losses, and nonaccrual and charge-off policies.
Risk Management and the Allowance for Loan Losses
The loan portfolio is our primary asset subject to credit risk. To address this credit risk, we set aside an allowance for probable and inherent credit losses through periodic charges to our earnings. These charges are shown in our consolidated statements of operations as PFLL. See “Statement of Operations Analysis - Provision For Loan Losses” above. We attempt to control, monitor and minimize credit risk through the use of prudent lending standards, a thorough review of potential borrowers prior to lending, and ongoing and timely review of payment performance. Asset quality administration, including early identification of loans performing in a substandard manner as well as timely and active resolution of problems, further enhances management of credit risk and minimization of loan losses. Any losses that occur and are charged off against the ALL are periodically reviewed with specific efforts focused on achieving maximum recovery of both principal and interest.
| 48 |
In general, our loan policy establishes underwriting guidelines for each of our major loan categories. In addition to requiring financial statements, applications, credit histories and credit analyses for underwriting our loans, some of the more significant guidelines for specific types of loans are:
| • | For
commercial real estate loans, maximum loan-to-value ratios range from 50% to 80% upon origination, depending on the collateral
securing the loan. Loan terms have a maximum amortization period of 20 years. Hazard insurance is required on collateral securitizing
the loan and appropriate legal work is performed to verify our lien position. |
| • | For
first mortgage 1-4 family residential real estate loans, maximum loan-to-value ratios do not generally exceed 80% upon origination,
unless private mortgage insurance is purchased by the borrower. Loan terms have a maximum amortization period of 30 years. Hazard
insurance is required on collateral securing the loan and appropriate title work is performed to verify our lien position. |
| • | For commercial and industrial loans, loan-to-value ratios and loan terms will vary, reflecting varied collateral securitizing the loan. Documentation required for the loan transaction may include income tax returns, financial statements, profit and loss budgets and cash flow projections. Loans included in this type are short-term loans, lines of credit, term loans and floor plans. |
| • | For home equity loans and second mortgages, maximum loan-to-value ratios do not generally exceed 85%. Hazard insurance is required on collateral securing the loan and appropriate title work is performed to verify our lien position. |
On a quarterly basis, management reviews the adequacy of the ALL. The analysis of the ALL consists of three components: (i) specific credit reserve established for expected losses relating to specific individual loans for which the recorded investment in the loans exceeds its fair value; (ii) general portfolio reserve based on historical loan loss experience for significant loan categories; and (iii) general portfolio reserve based on economic conditions as well as specific factors in the markets in which we operate.
The specific credit reserve for the ALL is based on a regular analysis by the loan officers of all commercial credits. The loan officers grade commercial credits and the loan review function validates the grades assigned. In the event that the loan review function downgrades the loan, it is included in the ALL analysis process at the lower grade. This grading system is in compliance with regulatory classifications. At least quarterly, all commercial loans that have been deemed impaired are evaluated. The fair value of the loan is determined based on either the present value of expected future cash flows discounted at the loan’s effective interest rate, the market price of the loan or, if the loan is collateral dependent, the fair value of the underlying collateral less the cost of sale. This evaluation may include obtaining supplemental market data and/or routine site visits to offer support to the evaluation process. If the carrying value of the loan exceeds the fair value less estimated costs to sell, a specific reserve is established. Such reserves are reviewed by the Delinquent Account Review Team.
We have two other major components of the ALL that do not pertain to specific loans: “General Reserves – Historical” and “General Reserves – Other.” We determine General Reserves – Historical based on our historical recorded charge-offs of loans in particular categories, analyzed as a group. As it relates to the historical loss component, we use the historical loss look-back period of the average eight and twelve quarters. We believe using the average of the eight and twelve quarters for historical charge-off factors enables the model to provide a better reflection of the recent economic times. We determine General Reserves – Other by taking into account other factors, such as 1) changes in the nature, volume and terms of loans, 2) changes in lending personnel, 3) changes in the quality of the loan review function, 4) changes in nature and volume of past-due, nonaccrual and/or classified loans, 5) changes in concentration of credit risk, 6) changes in economic and industry conditions, 7) changes in legal and regulatory requirements, 8) unemployment and inflation statistics, and 9) changes in underlying collateral values. By nature, our general reserve changes with our fluid lending environment and the overall economic environment in which we lend. As such, we are continually attempting to enhance this portion of the allocation process to reflect anticipated losses in our portfolio driven by these changing factors. Economic statistics, specifically unemployment and inflation rates for national, state and local markets are monitored and factored into the allocation to address repayment risk. Further identification and management of portfolio concentration risks, both by loan category and by specific markets, is reflected in the general allocation component.
| 49 |
All of the factors we take into account in determining the ALL in the general categories are subject to change; thus, the reserves are not necessarily indicative of the loan categories in which future loan losses will occur. As loan balances and estimated losses in a particular loan type decrease or increase and as the factors and resulting allocations are monitored by management, changes in the risk profile of the various parts of the loan portfolio may be reflected in the allowance.
Table 7: Quarterly Allowance for Loan Loss Components
| 12/31/15 | 09/30/15 | 6/30/15 | 3/31/15 | 12/31/14 | ||||||||||||||||
| (dollars in thousands) | ||||||||||||||||||||
| Component 1 – Specific credit reserve | $ | 83 | $ | 642 | $ | 1,051 | $ | 1,563 | $ | 1,361 | ||||||||||
| Component 2 – General reserves | 4,009 | 6,261 | 4,640 | 4,667 | 5,135 | |||||||||||||||
| Unallocated | 1,836 | 755 | 1,265 | 773 | 555 | |||||||||||||||
| Allowance for Loan Losses | $ | 5,928 | $ | 7,658 | $ | 6,956 | $ | 7,003 | $ | 7,051 | ||||||||||
Management believes the ALL is at an appropriate level to absorb probable and inherent losses in the loan portfolio at December 31, 2015 and while the model determines the ALL in components, the entire ALL is available to cover any loss within the loan portfolio. The unallocated portion of the ALL of $1.8 million at December 31, 2015 is due to the subjective nature of the model. Additionally, there are possible changes which may be mandated in the next several years by FASB regarding the methodology used in evaluating and quantifying the amount of the ALL. Management believes the total ALL at December 31, 2015 is appropriate based on the risk profile of the related loan portfolio. Management continues to monitor our model results and will make appropriate changes in the future when deemed necessary.
Proactive efforts to collect on all nonperforming loans, including use of the legal process when deemed appropriate to minimize the risk of further deterioration of such loans, will be ongoing. In the event that the facts and circumstances relating to these nonperforming loans change, additions to the ALL may become necessary. With respect to the remainder of the loan portfolio, while management uses available information to recognize losses on loans, future adjustments to the ALL may become necessary based on changes in economic conditions and the impact of such changes on our borrowers. Management remains watchful of credit quality issues and believes that issues within the portfolio are reflective of the challenging economic environment experienced over the past few years. Should the economic climate deteriorate further, the level of nonperforming loans, charge-offs and delinquencies could rise, warranting an increase in the provision.
As an integral part of their examination process, various regulatory agencies review the ALL as well. Such agencies may require that changes in the ALL be recognized when their credit evaluations differ from those of management, based on their judgments regarding information available to them at the time of their examinations.
During the fourth quarter of 2014, Commercial and industrial loans were separated into two groups: Commercial-syndicated and Commercial-other. This was primarily done to identify the loans balances within each group, identify and prudently monitor the risk characteristics of the two portfolio types, and reflect both portfolios in the ALL model in order to establish appropriate reserve levels to cover any losses in each portfolio. Commercial-syndicated loans are typically national credits with borrowers located outside our market area while Commercial-other loans are originated to commercial borrowers located within our market area. Both loan types are underwritten to meet similar credit underwriting standards. As the Commercial-syndicated portfolio grew in 2014, we recognized that there might be potential risks unique to this group and deemed it appropriate to monitor these loans independently of Commercial-other loans. This change was not a change in the ALL estimation process as a whole, but a refinement to more effectively align the process with the changing characteristics of the Bank’s lending activities. Due to the unavailability of historical loss data relative to the Commercial-Syndicated loan portfolio, we have allocated a greater loss percentage to this portfolio at December 31, 2015 and 2014, than we have to the Commercial-Other loan portfolio. If and when actual losses related to the Commercial-Syndicated loans become known, we may make changes to the historical loss allocation percentages. While the separation did not occur until the fourth quarter of 2014, the information in Table 8 below is presented as if the separation of the two groups had been applied in prior quarters.
| 50 |
Table 8: Loan Loss Experience
Years Ended December 31, (Dollars in thousands) | ||||||||||||||||||||
| 2015 | 2014 | 2013 | 2012 | 2011 | ||||||||||||||||
| Daily average amount of loans | $ | 686,933 | $ | 636,085 | $ | 601,228 | $ | 623,685 | $ | 629,759 | ||||||||||
| Loans, end of period | $ | 743,381 | $ | 679,357 | $ | 617,960 | $ | 595,533 | $ | 631,015 | ||||||||||
| ALL, at beginning of year | $ | 7,051 | $ | 7,658 | $ | 9,165 | $ | 10,638 | $ | 11,502 | ||||||||||
| Loans charged off: | ||||||||||||||||||||
| Real estate, residential | 152 | 88 | 552 | 1,216 | 1,903 | |||||||||||||||
| Real estate, construction | — | 162 | 93 | 781 | 373 | |||||||||||||||
| Real estate, commercial | 798 | 656 | 2,132 | 5,075 | 3,499 | |||||||||||||||
| Commercial, syndicated | — | 178 | — | — | — | |||||||||||||||
| Commercial, other | 825 | 116 | 758 | 492 | 625 | |||||||||||||||
| Consumer installment | 42 | 83 | 55 | 108 | 223 | |||||||||||||||
| Total loans charged off | 1,817 | 1,283 | 3,590 | 7,672 | 6,623 | |||||||||||||||
| Recoveries of loans previously charged off: | ||||||||||||||||||||
| Real estate, residential | 70 | 126 | 100 | 74 | 12 | |||||||||||||||
| Real estate, construction | 20 | 56 | 15 | 25 | 59 | |||||||||||||||
| Real estate, commercial | 250 | 439 | 269 | 557 | 103 | |||||||||||||||
| Commercial, syndicated | — | — | — | — | — | |||||||||||||||
| Commercial, other | 145 | 37 | 272 | 87 | 482 | |||||||||||||||
| Consumer installment | 9 | 18 | 27 | 31 | 53 | |||||||||||||||
| Total loans recovered | 494 | 676 | 683 | 774 | 709 | |||||||||||||||
| Net loans charged off (“NCOs”) | 1,323 | 607 | 2,907 | 6,898 | 5,914 | |||||||||||||||
| Additions to ALL charged to operations | 200 | — | 1,400 | 5,425 | 5,050 | |||||||||||||||
| ALL, at end of year | $ | 5,928 | $ | 7,051 | $ | 7,658 | $ | 9,165 | $ | 10,638 | ||||||||||
| Ratio of NCOs during period to average loans outstanding | 0.19 | % | 0.10 | % | 0.48 | % | 1.11 | % | 0.94 | % | ||||||||||
| Ratio of ALL to NCOs | 4.48 | X | 11.62 | X | 2.63 | X | 1.33 | X | 1.80 | X | ||||||||||
| Ratio of ALL to total loans end of period | 0.79 | % | 1.04 | % | 1.24 | % | 1.54 | % | 1.69 | % | ||||||||||
As Table 8 indicates, the ALL at December 31, 2015 was $5.9 million compared to $7.1 million at December 31, 2014. Loans increased 9.4% in 2015, in part due to $46.6 million of loans acquired in the merger with NEWBI. Since these acquired loans were recorded at fair value on acquisition date and no subsequent deterioration in their credit has occurred, no allowance was allocated to the acquired loans. The allowance as a percent of gross loans decreased to 0.79% at year-end 2015 from 1.04% at year-end 2014. Net loan charge-offs increased in 2015 to $1.3 million from $0.6 million in 2014. Net commercial real estate loan charge-offs represented 41.4% of the total net charge-offs for 2015 versus 35.8% for 2014, while commercial-other loan net charge-offs represented 51.4% of the total net charge-offs for 2015 versus 13.0% for 2014. Net residential real estate charge-offs represented 6.2% of total net charge-offs for 2015, versus a net recovery in 2014. There were no commercial syndicated loan net charge-offs for 2015 versus charge-offs of such loans representing 29.3% of total net charge-offs in 2014. Loans charged-off are subject to periodic review and specific efforts are taken to achieve maximum recovery of principal, accrued interest and related expenses.
Table 9 shows the amount of the ALL by loan class on the dates indicated. It also shows allowance for loan loss as a percentage of total loans by each type. In general, it would be expected that those types of loans which have historically more risk of loss associated with them will have a proportionally larger amount of the ALL allocated to them than do loans that have historically less risk of loss.
| 51 |
Table 9: Allowance for Loan Losses by Loan Class
| As of December
31, (dollars in thousands) |
||||||||||||||||||||||||||||||||||||||||
| 2015 | 2014 | 2013 | 2012 | 2011 | ||||||||||||||||||||||||||||||||||||
| % of | % of | % of | % of | % of | ||||||||||||||||||||||||||||||||||||
| Amount | loans in each category to total loans | Amount | loans in each category to total loans | Amount | loans in each category to total loans | Amount | loans in each category to total loans | Amount | loans in each category to total loans | |||||||||||||||||||||||||||||||
| Commercial, syndicated | $ | 1,066 | 8.7 | % | $ | 1,047 | 9.6 | % | $ | 218 | 7.0 | % | $ | 207 | 5.6 | % | $ | 49 | 1.0 | % | ||||||||||||||||||||
| Commercial, other | 636 | 14.4 | 1,082 | 13.0 | 445 | 13.3 | 471 | 12.7 | 721 | 13.6 | ||||||||||||||||||||||||||||||
| Commercial real estate | 1,867 | 42.8 | 3,282 | 44.8 | 4,431 | 46.6 | 5,787 | 49.0 | 5,467 | 50.3 | ||||||||||||||||||||||||||||||
| Real estate | ||||||||||||||||||||||||||||||||||||||||
| Construction | 116 | 5.9 | 252 | 6.0 | 372 | 6.0 | 628 | 6.9 | 1,231 | 8.5 | ||||||||||||||||||||||||||||||
| Residential | 360 | 24.1 | 779 | 22.4 | 1,373 | 23.0 | 1,682 | 21.4 | 1,995 | 22.7 | ||||||||||||||||||||||||||||||
| Consumer installment | 47 | 1.2 | 54 | 0.9 | 64 | 1.1 | 102 | 1.3 | 161 | 1.4 | ||||||||||||||||||||||||||||||
| Tax exempt | — | 3.0 | — | 3.4 | — | 3.1 | — | 3.2 | — | 2.6 | ||||||||||||||||||||||||||||||
| Not specifically allocated | 1,836 | (0.1 | ) | 555 | (0.1 | ) | 755 | (0.1 | ) | 288 | (0.1 | ) | 1,014 | (0.1 | ) | |||||||||||||||||||||||||
| Total allowance | $ | 5,928 | 100.0 | % | $ | 7,051 | 100.0 | % | $ | 7,658 | 100.0 | % | $ | 9,165 | 100.0 | % | $ | 10,638 | 100.0 | % | ||||||||||||||||||||
Nonperforming Loans and Other Real Estate Owned
Management encourages early identification of nonaccrual and problem loans in order to minimize the risk of loss.
Nonperforming loans are defined as nonaccrual loans, loans 90 days or more past due but still accruing, and restructured loans non-accruing. Additionally, whenever management becomes aware of facts or circumstances that may adversely impact the collection of principal or interest on loans, it is the practice of management to place such loans on nonaccrual status immediately rather than waiting until the loans become 90 days past due. The accrual of interest income is discontinued when a loan becomes 90 days past due as to principal or interest, or earlier if the loan is moved to nonaccrual status before 90 days. When interest accruals are discontinued, unpaid interest credited to income is reversed. If collection is in doubt, cash receipts on nonaccrual loans are used to reduce principal rather than recorded as interest income.
Restructuring loans involves the granting of some concession to the borrower involving a loan modification, such as payment schedule changes, interest rate reductions, or principal charge-offs. A troubled debt restructuring (“TDR”) includes a loan modification where a borrower is experiencing financial difficulty and we grant a concession to that borrower that we would not otherwise consider except for the borrower’s financial difficulties. A TDR may be either accrual or nonaccrual status based upon the performance of the borrower and management’s assessment of collectability. A loan that is modified at a market rate of interest may no longer be classified as a TDR in the calendar year subsequent to the restructuring if it is in compliance with the modified terms. If a TDR is placed on nonaccrual status, it remains there until a sufficient period of performance under the restructured terms has occurred at which time it is returned to accrual status, generally six months.
Also included in our restructured notes are modifications where a note is separated into two notes (A/B notes). The A note is considered an impaired loan, either accruing or nonaccruing while the B note is charged-off. The A note will be considered a TDR through the current calendar year in which it was restructured, but may no longer be classified as a TDR in the calendar year subsequent to the restructuring if it is in compliance with the modified terms.
| 52 |
Table 10: Nonperforming Loans and Other Real Estate Owned
| December
31, (dollars in thousands) | ||||||||||||||||||||
| 2015 | 2014 | 2013 | 2012 | 2011 | ||||||||||||||||
| Nonaccrual loans | $ | 2,218 | $ | 5,155 | $ | 6,403 | $ | 10,724 | $ | 15,242 | ||||||||||
| Accruing loans past due 90 days or more | — | — | — | — | — | |||||||||||||||
| Restructured loans, non-accruing | — | — | 255 | 3,724 | 4,341 | |||||||||||||||
| Total nonperforming loans (“NPLs”) | 2,218 | 5,155 | 6,658 | 14,448 | 19,583 | |||||||||||||||
| Other real estate owned, net | 3,710 | 4,266 | 6,298 | 10,476 | 12,119 | |||||||||||||||
| Total nonperforming assets (“NPAs”) | $ | 5,928 | $ | 9,421 | $ | 12,956 | $ | 24,924 | $ | 31,702 | ||||||||||
| Ratios: | ||||||||||||||||||||
| NPLs to total loans | 0.30 | % | 0.76 | % | 1.08 | % | 2.42 | % | 3.10 | % | ||||||||||
| NPAs to total assets | 0.54 | % | 0.92 | % | 1.30 | % | 2.44 | % | 2.92 | % | ||||||||||
| ALL to NPLs | 267.27 | % | 136.78 | % | 115.02 | % | 63.44 | % | 54.32 | % | ||||||||||
Nonperforming loans at December 31, 2015 were $2.2 million compared to $5.2 million at December 31, 2014. Nonperforming loans decreased $3.0 million, or 57.0% from December 31, 2014. Management believes collateral is currently sufficient to recover the net carrying value of those loans in the event of foreclosure or repossession, and has aggressively charged off collateral deficiencies. Our assessment is based on recent appraisals, professional market valuations and/or sales agreements with respect to each of the properties. Management is continually monitoring these relationships and in the event facts and circumstances change, additional PFLLs may be necessary.
Table 11: Quarterly Nonaccrual and Restructured Loans
| Quarters Ended (dollars in thousands) | ||||||||||||||||||||
| 12/31/15 | 09/30/15 | 06/30/15 | 03/31/15 | 12/31/14 | ||||||||||||||||
| Nonaccrual loans | $ | 2,218 | $ | 3,352 | $ | 4,708 | $ | 5,731 | $ | 5,155 | ||||||||||
| Restructured loans, non-accruing | — | 271 | 62 | — | — | |||||||||||||||
| Total nonperforming loans | $ | 2,218 | $ | 3,623 | $ | 4,770 | $ | 5,731 | $ | 5,155 | ||||||||||
| Restructured loans, accruing interest | $ | 8,357 | $ | 6,578 | $ | 6,816 | $ | 6,907 | $ | 8,656 | ||||||||||
As of December 31, 2015, loans in TDR accruing category were $8.4 million, a decrease of $0.3 million, or 3.5%, from December 31, 2014. During 2015, $2.0 million in loans were transferred to TDR status and $1.8 million in loans were transferred out of TDR accruing status due to compliance with restructured terms. During 2015, $0.2 million of payments were received and $0.3 million of TDRs in accruing status were placed on non-accrual status.
There were no loans in the restructured non-accrual category at December 31, 2015, consistent with December 31, 2014.
| 53 |
Table 12: 30-89 Days Past Due Loans
The following table presents an analysis of our past due loans excluding nonaccrual loans:
PAST DUE LOANS (EXCLUDING NONACCRUALS)
30-89 DAYS PAST DUE
(Dollar amounts in thousands)
| 12/31/15 | 09/30/15 | 06/30/15 | 03/31/15 | 12/31/14 | ||||||||||||||||
| Total secured by real estate | $ | 778 | $ | 1,572 | $ | 2,454 | $ | 2,303 | $ | 1,309 | ||||||||||
| Commercial, syndicated | — | — | — | — | — | |||||||||||||||
| Commercial, other | 38 | 1 | 1 | 6 | 11 | |||||||||||||||
| Loans to individuals | 26 | 28 | 5 | 12 | 35 | |||||||||||||||
| All other loans | — | — | — | — | — | |||||||||||||||
| Total | $ | 842 | 1,601 | $ | 2,460 | $ | 2,321 | $ | 1,355 | |||||||||||
| Percent of total loans | 0.11 | % | 0.23 | % | 0.36 | % | 0.35 | % | 0.19 | % | ||||||||||
As indicated above, loan balances 30 to 89 days past due have decreased by $0.5 million or 37.9% since December 31, 2014.
Table 13: Foregone Loan Interest
The following table shows, for those loans accounted for on a nonaccrual basis for the years ended as indicated, the gross interest that would have been recorded if the loans had been current in accordance with their original terms and the amount of interest income that was included in interest income for the period.
| Years
ended December 31, (dollars in thousands) | ||||||||||||
| 2015 | 2014 | 2013 | ||||||||||
| Interest income in accordance with original terms | $ | 60 | $ | 249 | $ | 276 | ||||||
| Interest income recognized | (1 | ) | (20 | ) | — | |||||||
| Reduction in interest income | $ | 59 | $ | 229 | $ | 276 | ||||||
Table 14: Other Real Estate Owned Summary
Other real estate owned, which represent properties that we acquired through foreclosure or in satisfaction of debt or bank facilities no longer in use, totaled $3.7 million at December 31, 2015. This compared to $4.3 million at year-end 2014. Management actively seeks to ensure that properties held are administered to minimize any risk of loss.
Activity for other real estate owned for 2015, 2014 and 2013, including costs of operation are shown below:
| Years
ended December 31, (dollars in thousands) | ||||||||||||
| 2015 | 2014 | 2013 | ||||||||||
| Income from operation of other real estate owned | $ | 65 | $ | 79 | $ | — | ||||||
| Expense from operation of other real estate owned | (884 | ) | (1,107 | ) | (1,395 | ) | ||||||
| Net gains from sale of other real estate owned | 50 | 19 | 426 | |||||||||
| Cost of operation and sale of other real estate owned | $ | (769 | ) | $ | (1,009 | ) | $ | (969 | ) | |||
| 54 |
Investment Portfolio
Our investment portfolio is intended to provide us with adequate liquidity, flexibility in asset/liability management and earning potential.
Table 15: Investment Portfolio
| December
31, (dollars in thousands) | ||||||||||||
| 2015 | 2014 | 2013 | ||||||||||
| Securities Available for Sale (“AFS”): | ||||||||||||
| U.S. Treasury and U.S. government sponsored agency securities | $ | 5,693 | $ | 2,751 | $ | 3,014 | ||||||
| Obligations of states and political subdivisions | 67,980 | 57,032 | 56,630 | |||||||||
| Mortgage-backed securities | 89,775 | 113,862 | 149,985 | |||||||||
| Asset-backed securities | — | — | 3,782 | |||||||||
| Private placement and corporate bonds | 3,519 | 3,520 | 3,520 | |||||||||
| Other equity securities | 3,644 | 1,905 | 1,905 | |||||||||
| Total AFS amortized cost | $ | 170,611 | $ | 179,070 | $ | 218,836 | ||||||
| Total AFS fair value and carrying value | $ | 172,608 | $ | 182,912 | $ | 220,608 | ||||||
| Securities Held to Maturity (“HTM”): | ||||||||||||
| Mortgage-backed securities | $ | 20,487 | $ | 20,612 | $ | 10,275 | ||||||
| Private placement and corporate bonds | 5,000 | 5,000 | — | |||||||||
| Total HTM amortized cost and carrying value | $ | 25,487 | $ | 25,612 | $ | 10,275 | ||||||
| Total HTM fair value | $ | 26,119 | $ | 26,181 | $ | 10,275 | ||||||
Securities classified as AFS are those securities which we have determined might be sold to manage interest rates, reposition holdings to increase returns or modify durations, or in response to changes in interest rates or other economic factors. They may or may not be held until maturity. Securities AFS are carried at fair value. We evaluate securities for other-than-temporary impairment at least on a quarterly basis, and more frequently when economic or market concerns warrant such evaluation. As part of such monitoring, the credit quality of individual securities and their issuers is assessed. Adjustments to market value that are considered temporary are recorded as a separate component of other comprehensive income, net of tax. If an impairment of a security is identified as other-than-temporary based on information available, such as the decline in the creditworthiness of the issuer, external market ratings or the anticipated or realized elimination of associated dividends, such impairments are further analyzed to determine if a credit loss exists. If there is a credit loss, it will be recorded in the consolidated statement of operations. Unrealized losses other than credit losses will continue to be recognized in other comprehensive income, net of tax. Unrealized losses have not been included in the results of operations because the unrealized losses were not deemed other-than-temporary. We do not have the intent to sell the securities and have determined that it is not more likely than not that we will be required to sell the debt securities before their anticipated recovery and therefore, there is no other-than-temporary impairment. The losses on these securities are expected to dissipate as they approach their maturity dates and/or if interest rates decline.
During 2015, securities with a fair value of $13.9 million were sold, $12.7 million of securities matured or were called, and $23.6 million of payments were received, partially offset by $19.2 million of other securities purchased. Gains of $0.5 million were realized on the sale of securities in 2015. Additionally, $23.4 million of securities were acquired in the merger with NEWBI.
| 55 |
Table 16: Securities Portfolio Maturity Distribution (dollars in thousands, rates on a tax-equivalent basis)
| Securities AFS – maturity distribution and weighted average yield at December 31, 2015 | ||||||||||||||||||||||||||||||||||||||||
| Within one year | After one year but Within five years | After five years but Within ten years | After ten years | Total | ||||||||||||||||||||||||||||||||||||
| Amount | Yield | Amount | Yield | Amount | Yield | Amount | Yield | Amount | Yield | |||||||||||||||||||||||||||||||
| U.S. government-sponsored agency securities | $ | — | — | % | $ | 5,721 | 1.59 | % | $ | — | — | % | $ | — | — | % | $ | 5,721 | 1.59 | % | ||||||||||||||||||||
| Mortgage-backed securities | 1,369 | 3.83 | 59,807 | 2.31 | 29,084 | 2.47 | — | — | 90,260 | 2.38 | ||||||||||||||||||||||||||||||
| Obligations of states and political subdivisions | 9,459 | 3.31 | 22,107 | 3.08 | 34,691 | 2.83 | 3,200 | 2.45 | 69,457 | 2.96 | ||||||||||||||||||||||||||||||
| Private placement and corporate bonds | — | — | — | — | — | — | 3,535 | 5.90 | 3,535 | 5.90 | ||||||||||||||||||||||||||||||
| Other securities | 2,402 | 5.22 | 1,233 | 2.92 | — | — | — | — | 3,635 | 4.44 | ||||||||||||||||||||||||||||||
| Total carrying value | $ | 13,230 | 3.49 | % | $ | 88,868 | 1.99 | % | $ | 63,775 | 2.67 | % | $ | 6,735 | 4.26 | % | $ | 172,608 | 2.44 | % | ||||||||||||||||||||
| Securities HTM – maturity distribution and weighted average yield at December 31, 2015 | ||||||||||||||||||||||||||||||||||||||||
| Mortgage-backed securities | $ | — | — | % | $ | 20,944 | 2.57 | % | $ | — | — | % | $ | — | — | % | $ | 20,944 | 2.57 | % | ||||||||||||||||||||
| Private placement and corporate bonds | — | — | — | — | 5,175 | 6.50 | — | — | 5,175 | 6.50 | ||||||||||||||||||||||||||||||
| Total carrying value | $ | — | — | % | $ | 20,944 | 2.57 | % | $ | 5,175 | 6.50 | % | $ | — | — | % | $ | 26,119 | 3.35 | % | ||||||||||||||||||||
Average securities balances totaled $195.5 million in 2015 compared with $229.5 million in 2014. In 2015, average taxable securities comprised approximately 76.5% of the total average investments compared to 80.2% in 2014.
Goodwill
Goodwill is not amortized but is subject to impairment tests on an annual basis or more frequently if deemed appropriate. For goodwill valuation purposes, the goodwill of our organization is collectively evaluated as one segment. The operations are managed and financial performance is evaluated on a company-wide basis. All of the financial service operations are considered by management to be aggregated in one reportable operating segment.
During the fourth quarter of 2015, goodwill increased $1.1 million due to the merger with NEWBI and the related acquisition of its branch operations and facilities in Kewaunee County, Wisconsin. Following consummation of the merger, Union State Bank merged with and into the Bank.
U.S. GAAP provides that prior to performing the traditional two-step goodwill impairment test, the Company is permitted to first perform a qualitative assessment about the likelihood of the carrying value of a reporting unit exceeding its fair value, referred to as the “Step 0” assessment. The Step 0 assessment requires the evaluation of certain events and circumstances such as macroeconomic conditions, industry and market considerations, cost factors and overall financial performance, as well as Company items. After performing the Step 0 assessment, should the Company determine that it is more likely than not that the fair value of goodwill is less than its carrying amount, it is required to perform the prescribed two-step goodwill impairment test to identify the potential goodwill impairment and measure the amount of the goodwill impairment loss, if any, to be recognized. However, if the Company concludes otherwise based on the Step 0 assessment, the two-step goodwill impairment test is not required.
During 2015, management valued the Company by utilizing the Step 0 qualitative assessment approach in determining whether it is more likely than not that the fair value of the Company is less than its carrying amount, including goodwill. As part of the qualitative assessment approach, the Company assessed the following relevant events and circumstances: macroeconomic conditions, industry and market considerations, overall financial performance, changes in management and management strategy, and changes in the composition or carrying amount of the net assets. In addition, consideration was given to the pending merger with Nicolet as well as the significant difference in fair value compared to the book value of goodwill in 2014. The conclusion of the Step 0 assessment was that it was more likely than not that the fair value of goodwill continued to exceed its carrying value at December 31, 2015. Therefore, a two-step quantitative analysis was not considered necessary.
| 56 |
Deposits
Deposits are our largest source of funds. Average total deposits for 2015 were $776.1 million, an increase of 5.3% from 2014. At December 31, 2015, deposits totaled $866.2 million, an increase of $100.7 million or 13.1%, from $765.5 million at December 31, 2014. During 2015, $1.0 million of maturing deposits obtained in previous years by utilizing a national deposit listing service were not renewed, at which time we carried no such remaining deposits. We also saw a customer preference towards money market deposits as customers moved balances out of term deposits. Average brokered CDs decreased $0.4 million or 19.3%, and money market brokered deposits decreased $6.7 million or 77.0%, between 2014 and 2015. The reliance on brokered CDs as a noncore source of funding decreased despite the fact that loan demand increased during 2015. From a liquidity standpoint, those funds were not necessary as our cash position was sufficient to pay time deposits as they matured and otherwise provided us with liquidity for our operations. Management views brokered certificates of deposits as a stable source of funds. If liquidity concerns arise, we believe (but cannot be assured) that we have alternative sources of funds, such as lines with correspondent banks and borrowing arrangements with the FHLB. Typically, overall deposit balances for the first six months of the year tend to decline slightly as a result of the seasonality of our customer base, as customers draw down deposits during the first half of the year in anticipation of the summer tourist season.
Table 17: Average Deposits Distribution
| For
the year ended December 31, (dollars in thousands) | ||||||||||||||||||||||||||||||||||||
| 2015 | 2014 | 2013 | ||||||||||||||||||||||||||||||||||
| Amount | %
of Total | Average Rate | Amount | %
of Total | Average Rate | Amount | %
of Total | Average Rate | ||||||||||||||||||||||||||||
| Noninterest-bearing demand deposits | $ | 165,088 | 21.3 | % | 0.0 | % | $ | 137,627 | 18.7 | % | 0.0 | % | $ | 125,498 | 16.6 | % | 0.0 | % | ||||||||||||||||||
| Interest-bearing demand deposits | 135,982 | 17.5 | 0.1 | 129,989 | 17.6 | 0.1 | 133,452 | 17.6 | 0.1 | |||||||||||||||||||||||||||
| Savings deposits (excluding brokered deposits) | 342,605 | 44.1 | 0.1 | 311,570 | 42.3 | 0.1 | 298,933 | 39.4 | 0.1 | |||||||||||||||||||||||||||
| Other time deposits (excluding brokered deposits) | 83,045 | 10.7 | 0.5 | 100,480 | 13.6 | 0.6 | 127,850 | 16.9 | 0.8 | |||||||||||||||||||||||||||
| Time deposits $100,000 and over (excluding brokered deposits) | 45,623 | 5.9 | 0.8 | 46,662 | 6.3 | 0.8 | 51,039 | 6.7 | 1.0 | |||||||||||||||||||||||||||
| Brokered deposits | 3,732 | 0.5 | 0.2 | 10,805 | 1.5 | 0.5 | 21,544 | 2.8 | 1.8 | |||||||||||||||||||||||||||
| Total deposits | $ | 776,075 | 100.0 | % | $ | 737,133 | 100.0 | % | $ | 758,316 | 100.0 | % | ||||||||||||||||||||||||
Table 18: Maturity Distribution-Certificates of Deposit and Other Time Deposits of $100,000 or More
| December
31, 2015 (dollars in thousands) | ||||||||||||||||||||
| Certificates of Deposit | Other Time Deposits | Total | ||||||||||||||||||
| $100,000 to less than $250,000 | $250,000 or more | $100,000 to less than $250,000 | $250,000 or more | |||||||||||||||||
| Three months or less | $ | 4,615 | $ | 2,178 | $ | 2,995 | $ | — | $ | 9,788 | ||||||||||
| Over three months through six months | 3,270 | 253 | 683 | — | 4,206 | |||||||||||||||
| Over six months through twelve months | 13,752 | 1,938 | 1,063 | — | 16,753 | |||||||||||||||
| Over twelve months | 8,052 | 5,878 | 2,968 | 953 | 17,851 | |||||||||||||||
| Total | $ | 29,689 | $ | 10,247 | $ | 7,709 | $ | 953 | $ | 48,598 | ||||||||||
As shown in Table 17, noninterest bearing demand deposits in 2015 averaged $165.1 million, up 20.0% from $137.6 million in 2014. This $27.5 million increase reflects the shift from time deposits to transactional accounts due to the continued low interest rate environment, as well as the acquisition of $15.9 million of noninterest-bearing demand deposit balances in the merger with NEWBI. As of December 31, 2015, noninterest-bearing demand deposits totaled $198.0 million compared to $153.1 million at year-end 2014.
| 57 |
Interest-bearing deposits generally consist of interest-bearing checking accounts, savings accounts, money market accounts, individual retirement accounts (“IRAs”) and certificates of deposit (“CDs”). In 2015, interest-bearing deposits averaged $611.0 million, an increase of 1.9% from 2014. Average balances of NOW accounts, savings deposits and money market accounts increased $37.0 million or 8.4%, as a result of customer preference in a low interest rate environment. During the same period, average time deposits, including CDs and IRAs (other than brokered time deposits and time deposits over $100,000) decreased by $17.4 million or 17.4%, primarily in response to customer anticipation of possible rate increases in a continued low rate environment. Average time deposits over $100,000, other than brokered time deposits, decreased by $1.0 million or 2.2%. These deposits were priced within the framework of our rate structure and did not materially affect the average rates on deposit liabilities. Increased competition for consumer deposits and customer awareness of interest rates continue to limit our core deposit growth in these types of deposits. By utilizing other more attractively priced wholesale borrowings and growth in demand deposit balances, we were able to reduce our average brokered deposits by $7.1 million, or 65.5% in 2015 compared to 2014.
In 2016, we will continue to focus on attracting and retaining core deposit accounts and expanding customer deposit relationships by emphasizing customer service, convenience, new product offerings, and competitive pricing. In the event that core deposit growth goals are not accomplished, we will continue to look at other wholesale sources of funds.
Other funding sources
Total other funding sources, including short-term borrowings, Federal Home Loan Bank (“FHLB”) advances, term notes, convertible promissory notes and subordinated debentures, were $105.8 million at December 31, 2015, a decrease of $37.2 million, (26.0%), from $143.1 million at December 31, 2014. Borrowings from the FHLB are secured by our portfolio of one-to-four family residential mortgages, home equity lines of credit and specifically pledged investment securities allowing us to use FHLB borrowings for additional funding purposes.
Table 19: Short-term Borrowings
| December
31, (dollars in thousands) | ||||||||||||
| 2015 | 2014 | 2013 | ||||||||||
| Securities sold under agreements to repurchase: | ||||||||||||
| Balance end of year | $ | 48,127 | $ | 64,869 | $ | 58,448 | ||||||
| Average amounts outstanding during year | 46,965 | 41,110 | 34,728 | |||||||||
| Maximum month-end amounts outstanding | 54,909 | 64,869 | 69,902 | |||||||||
| Average interest rates on amounts outstanding at end of year | 0.10 | % | 0.27 | % | 0.11 | % | ||||||
| Average interest rates on amounts outstanding during year | 0.13 | % | 0.24 | % | 0.23 | % | ||||||
Securities are sold to Bank customers under repurchase agreements at competitive market rates.
Long-term Debt
On March 31, 2006, we issued $16.1 million of trust preferred securities and $0.5 million of trust common securities issued under the name Baylake Capital Trust II (“the Trust”) that adjust quarterly at a rate equal to 1.35% over the three month LIBOR (1.95% at December 31, 2015). The Trust’s ability to pay amounts due on the trust preferred securities is solely dependent upon our making payment on the related subordinated debentures to the Trust. Our obligations under the subordinated debentures include a conditional guarantee by us of the Trust’s obligations under the trust securities issued by the Trust. In addition, under the terms of the Debentures, we would be precluded from paying dividends on our common stock if we were in default under the Debentures, if we exercised our right to defer payments of interest on the Debentures or if certain related defaults occurred. At December 31, 2015 we are current on our interest payments.
During 2009 and 2010, we completed closings of a private placement of our 10% Convertible Notes due June 30, 2017. The Convertible Notes were offered and sold in reliance on the exemption from registration under Section 4(2) of the Securities Act of 1933 and Rule 506 thereunder. Through December 31, 2010 we issued $9.45 million principal amount of the Convertible Notes, at par, and received gross proceeds in the same amount.
| 58 |
The Convertible Notes accrued interest at a fixed rate of 10% per annum upon issuance and until maturity or earlier conversion or redemption. Interest was payable quarterly, in arrears, on January 1, April 1, July 1, and October 1, of each year.
The Convertible Notes were convertible into shares of our common stock at a conversion ratio of one share of common stock for each $5.00 in aggregate principal amount held on the record date of the conversion subject to certain adjustments as described in the Convertible Notes (“the Conversion Ratio”). Prior to the quarterly interest date preceding the fifth anniversary of issuance of the Convertible Notes, each holder of the Convertible Notes was permitted to convert up to 100% (at the discretion of the holder) of the original principal amount into shares of our common stock at the Conversion Ratio. Beginning on the quarterly interest date prior to the fifth anniversary of the Convertible Notes, we were permitted to redeem the notes in whole or in part. A notice of redemption superseded and took priority over any notice of conversion. On October 1, 2014, one-half of the original principal amounts were mandatorily convertible at the Conversion Ratio if voluntary conversion had not yet occurred. The principal amount of any Convertible Note that had not been converted would have been payable at maturity on June 30, 2017.
Beginning January 1, 2014, we began redeeming Convertible Notes at the investors’ option under the terms described in the preceding paragraph. In 2014, $6.1 million was converted into 1.2 million shares under this option. Additionally, on October 1, 2014, an additional $1.6 million of Convertible Notes were converted to 0.3 million shares of our common stock under the mandatory conversion provision of the Convertible Notes. Finally, in early 2015 the remaining Convertible Notes were converted to 0.3 million shares of our common stock at the investors’ option. At December 31, 2015 there are no Convertible Notes outstanding.
We incurred debt offering issuance costs of $0.2 million in conjunction with the issuance of the Convertible Notes. Those costs were capitalized and amortized to interest expense using the effective interest method over the initial conversion term, which ran through October 1, 2014.
Off-Balance Sheet Arrangements
We do not currently use interest rate contracts (e.g. swaps), forward loan sales or other derivatives to manage interest rate risk and do not have any of these instruments outstanding. The Bank does have, through its normal operations, loan commitments and standby letters of credit outstanding as of December 31, 2015 and 2014 in the amount of $252.5 million and $228.5 million, respectively. These are further explained in Note 16 of the Notes to Consolidated Financial Statements in Item 8 below.
Contractual Obligations
As of December 31, 2015, we were contractually obligated under long-term agreements as follows:
Table 20: Contractual Obligations
| Payments due by period (dollars in thousands) | ||||||||||||||||||||
| Total | Less than 1 year | 1 to 3 years | 3 to 5 years | More than 5 years | ||||||||||||||||
| Certificates of deposit and other time deposit obligations | $ | 138,730 | $ | 86,015 | $ | 39,915 | $ | 12,800 | $ | — | ||||||||||
| Repurchase agreements | 48,127 | 48,127 | — | — | — | |||||||||||||||
| Subordinated debentures | 16,100 | — | — | — | 16,100 | |||||||||||||||
| FHLB advances and other borrowings | 41,595 | 1,750 | 16,550 | 23,295 | — | |||||||||||||||
| Operating leases | 224 | 48 | 67 | 31 | 78 | |||||||||||||||
| Totals | $ | 244,776 | $ | 135,940 | $ | 56,532 | $ | 36,126 | $ | 16,178 | ||||||||||
The operating lease referenced in the table above relates to space adjacent to our facility in Outagamie County, leased for use by Admiral. For a further discussion of the contractual obligations in Table 20, see Note 13, “Subordinated Debentures,” and Note 14, “Convertible Promissory Notes,” to the Consolidated Financial Statements included in Item 8 below.
| 59 |
Liquidity
Liquidity management refers to our ability to ensure that cash is available in a timely manner to meet loan demand and depositors’ needs, and to service other liabilities as they become due, without undue cost or risk, or causing a disruption to normal operating activities. We believe we have sufficient cash on hand to meet our current obligations. We and the Bank have different liquidity considerations.
Our primary sources of funds are dividends from the Bank and net proceeds from borrowings and the offerings of subordinated debentures and convertible promissory notes. We may also undertake offerings of debt and issue our common stock if and when we deem it prudent to do so, subject to regulatory approval if required. We generally manage our liquidity position in order to provide funds necessary to meet interest obligations of our trust preferred securities and Convertible Notes, pay dividends to our shareholders, and repurchase shares. The Bank meets its cash flow needs by having funding sources available to it to satisfy the credit needs of customers as well as having available funds to satisfy deposit withdrawal requests. Liquidity at the Bank is derived from deposit growth, payments on and maturities of loans, payments on and maturities of the investment portfolio, access to other funding sources, marketability of certain assets, the ability to use its loan and investment portfolios as collateral for secured borrowings and a strong capital position.
Maturing investments and investment sales have been a primary source of liquidity at the Bank. Principal payments on investments totaling $36.3 million were received in 2015 and $13.9 million of proceeds were received from investment sales. Offsetting these amounts, $19.2 million in investments were purchased in 2015. At December 31, 2015, the carrying value of available for sale securities maturing within one year was $13.2 million, or 6.7% of the total investment securities portfolio. This compares to 8.6% of our investment securities with one year or less maturities as of December 31, 2014. At December 31, 2015 and 2014 the mortgage-backed securities portfolio was $111.2 million and $136.8 million, respectively, representing 56.0% and 65.4% of the investment portfolio, respectively. Approximately 2.6%, or $2.8 million, of the mortgage-backed securities outstanding at December 31, 2015 were issued and guaranteed by the Government National Mortgage Associate (“GNMA”), an agency of the United States government. An additional 94.6%, or $105.2 million, of the mortgage-backed securities outstanding at December 31, 2015 were issued by either the Federal National Mortgage Association (“FNMA”), the Federal Home Loan Mortgage Corporation (“FHLMC”), or FHLB; United States government-sponsored agencies. Non-agency mortgage-backed securities present a level of credit risk that does not exist with agency-backed securities, but only comprised approximately 2.8%, or $3.1 million, of the outstanding mortgage-backed securities at December 31, 2015. We evaluate these non-agency mortgage-backed securities at least on a quarterly basis, and more frequently when economic or market concerns warrant such evaluation.
During 2015 and 2014, we maintained large balances at the Reserve Bank for liquidity purposes. On average, those balances were $34.4 million in 2015 and $26.9 million in 2014. At year-end 2015, the balance was $45.6 million. We anticipate reducing those balances in 2016.
Deposit growth is another potential source of liquidity for the Bank. As a financing activity reflected in the 2015 Consolidated Statements of Cash Flows, deposit increases were $32.2 million in 2015, not including $68.5 million of deposits which were acquired in the merger with NEWBI. The Bank’s overall deposit base increased $100.7 million or 13.1% during 2015. Deposit growth is potentially the most stable source of liquidity for the Bank, although brokered deposits are inherently less stable than locally generated core deposits. Affecting liquidity are core deposit growth levels, CD maturity structure and retention, and characteristics and diversification of wholesale funding sources affecting the channels by which brokered deposits are acquired. Conversely, deposit outflow would require the Bank to develop alternative sources of funds which may not be as liquid and may be potentially a more costly alternative.
Federal funds sold averaged $2.3 million in 2015 compared to $2.4 million in 2014 and $0.8 million of fed funds sold were acquired in the merger with NEWBI. Funds provided from the maturity of these assets typically are used as funding sources for seasonal loan growth, which typically has higher yields. Short-term and liquid by nature, federal funds sold generally provide a yield lower than other earning assets. The Bank has a strategy of maintaining a sufficient level of liquidity to accommodate fluctuations in funding sources and will at times take advantage of specific opportunities to temporarily invest excess funds at narrower than normal rate spreads while still generating additional interest revenue. At December 31, 2015, the Bank had $1.3 million federal funds sold.
| 60 |
The scheduled maturity of loans can provide a source of additional liquidity. At December 31, 2015, the Bank had $190.1 million, or 25.6% of total loans maturing within one year. Factors affecting liquidity relative to loans are loan origination volumes, loan prepayment rates and the maturity structure of existing loans. The Bank’s liquidity position is influenced by changes in interest rates, economic conditions and competition. Conversely, the need for liquidity resulting from loan demand will cause us to acquire other sources of funding which could be harder to find and, therefore, more costly to acquire.
Within the classification of short-term borrowings at year-end 2015, securities sold under agreements to repurchase totaled $48.1 million. At December 31, 2015, the Bank had no federal funds purchased. Generally, federal funds are purchased from various upstream correspondent banks while securities sold under agreements to repurchase are obtained from a base of business customers. At December 31, 2015, the Bank had $80.0 million available in the form of federal funds lines. Short-term and long-term FHLB advances are another source of funds, with $37.6 million outstanding at year-end 2015. At December 31, 2015, the Bank had an additional $67.8 million of available FHLB credit. In December, 2015, the Company entered into two borrowing agreements with another financial institution to provide liquidity to the Company. The fixed-term, fixed rate note of $4.0 million was outstanding at December 31, 2015 and matures in 2018. The variable rate line of credit in the amount of $2.0 million, matures in December 2016. No funds were outstanding on the line of credit at December 31, 2015.
We continue to focus on expanding customer deposit relationships and attracting core deposit accounts by emphasizing customer service while maintaining competitive pricing. In the event that core deposit growth goals are not accomplished, we will continue to look at other wholesale sources of funds. In addition, we may acquire additional brokered deposits as funding for short-term liquidity needs. Short-term liquidity needs will also be addressed by growth in short-term borrowings, maturing federal funds sold and portfolio investments, and loan maturities and prepayments.
In assessing liquidity, historical information such as seasonality (the effect on liquidity of loan demand starts before and during the tourist season and deposit draw down that affects liquidity shortly before and during the early part of the tourist season), local economic cycles and the economy in general are considered along with our current financial position and projections. Management believes that, in the current economic environment, our liquidity position is adequate. To our knowledge, there are no known trends nor any known demands, commitments, events or uncertainties that will result or are reasonably likely to result in material increases or decreases in our liquidity.
Capital Resources
Stockholders’ equity at December 31, 2015 increased $8.8 million or 8.4% to $114.3 million, compared to $105.5 million at the end of 2014. Accumulated other comprehensive income decreased to $1.2 million at year-end 2015 versus accumulated other comprehensive income of $2.3 million at year-end 2014. The ratio of stockholders’ equity to assets at December 31, 2015 was 10.45%, compared to 10.33% at year-end 2014.
Under applicable regulatory guidelines, the trust preferred securities qualify as Tier 1 capital up to a maximum of 25% of Tier 1 capital. Any additional portion of trust preferred securities qualify as Tier 2 capital. As of December 31, 2015, all $16.1 million of the trust preferred securities qualify as Tier 1 capital.
Cash dividends of $0.34 and $0.30 per share were declared and paid in 2015 and 2014, respectively. In January 2016, we declared a $0.09 per share dividend payable in March 2016.
On May 23, 2013, after review of our capital position, our board of directors approved the Repurchase Program, authorizing us to repurchase up to 400,000 shares of our stock through May 30, 2014. On April 15, 2014, the Board of Directors approved an extension of the Repurchase Program to May 30, 2015 and increased the maximum shares allowed to be acquired to 800,000 shares. In total, 502,000 shares were acquired in 2013 and 2014. On May 16, 2015 the Board of Directors again approved an extension of program to May 30, 2016 and increased the maximum number of shares allowed to be acquired to $1.2 million shares. In the first quarter of 2015, 66,000 shares were purchased under the program. An additional 49,500 shares were repurchased in the second quarter of 2015. No shares were purchased in the third and fourth quarter of 2015, with an aggregate of 617,500 shares repurchased since inception of the Repurchase Program. An additional 582,500 shares may yet be repurchased under the Repurchase Program.
| 61 |
The adequacy of our capital is regularly reviewed to ensure that sufficient capital is available for current and future needs and is in compliance with regulatory guidelines. The assessment of overall capital adequacy depends upon a variety of factors, including asset quality, liquidity, stability of earnings, changing competitive forces, economic conditions in markets served and strength of management.
The FRB has established capital adequacy rules which take into account risks attributable to balance sheet assets and off-balance sheet activities. All banks and bank holding companies must meet a minimum total risk-based capital ratio of 8%. Of the 8% required, at least half must consist of core capital elements defined as Tier 1 capital. The federal banking agencies also have adopted leverage capital guidelines that banking organizations must meet. Under these guidelines, the most highly rated banking organizations must meet a leverage ratio of at least 3% Tier 1 capital to assets, while lower rated banking organizations must maintain a ratio of at least 4% to 5%. Failure to meet minimum capital requirements can trigger certain mandatory and possible additional discretionary actions by regulators that, if undertaken, could have a material adverse effect on our consolidated financial statements.
To be “well capitalized” under the regulatory framework, the Tier 1 capital ratio must meet or exceed 6%, the total capital ratio must meet or exceed 10%,the leverage ratio must meet or exceed 5%, and the common equity Tier 1 capital ratio must meet or exceed 6.5%. As of December 31, 2015, our Tier 1 capital ratio was 14.39%, our total capital ratio was 15.11%, our leverage ratio was 11.56%, and our common equity Tier 1 capital ratio was 12.59%.
Management believes that a strong capital position is necessary to take advantage of opportunities for profitable expansion of product and market share and to provide depositor and investor confidence. Our capital level must be maintained at an appropriate level to provide the opportunity for an adequate return on the capital employed. Management actively reviews our capital strategies to ensure that capital levels are appropriate based on the perceived business risks, further growth opportunities, industry standards, and regulatory requirements.
Recent Accounting Pronouncements
See Note 1 to the Notes to Consolidated Financial Statements titled “Recent Accounting Pronouncements.”
| 62 |
ITEM 7A. QUANTITATIVE AND QUALITATIVE DISCLOSURES ABOUT MARKET RISK.
Interest Rate Sensitivity Management
Our business and the composition of our consolidated balance sheet consist of investments in interest-earning assets (including loans and securities) which are primarily funded by interest-bearing liabilities (deposits and borrowings). We maintain all of our financial instruments for non-trading purposes. Such financial instruments have varying levels of sensitivity to changes in market rates of interest. Our operating income and net income depends, to a substantial extent, on “rate spread” (i.e., the differences between the income we receive from loans, securities, and other earning assets and the interest expense we pay to obtain deposits and other liabilities). These rates are highly sensitive to many factors that are beyond our control, including general economic conditions and the policies of various governmental and regulatory authorities.
We measure our overall interest rate sensitivity through a net interest income analysis. The net interest income analysis measures the changes in net interest income in the event of hypothetical changes in interest rates. This analysis assesses the risk of changes in net interest income in the event of an immediate and sustained 100 bp and 200 bp increase in market interest rates or a 100 bp and 200 bp decrease in market rates. The interest rate scenarios are used for analytical purposes and do not necessarily represent management’s view of future market interest rate movements. The table below presents our projected changes in net interest income for 2016 based on financial data at December 31, 2015, for the various rate shock levels indicated.
Table 21: Net Interest Income Sensitivity Analysis
| Potential impact on 2016 consolidated net interest income | Net Interest Income (Dollars in thousands) | |||||||
| Potential Change in Net Interest Income ($) | Potential Change in Net Interest Income (%) | |||||||
| + 200 bps | $ | 785 | 2.3 | % | ||||
| + 100 bps | $ | 369 | 1.1 | % | ||||
| Base | ||||||||
| - 100 bps | $ | (1,292 | ) | (3.8 | )% | |||
| - 200 bps | $ | (2,552 | ) | (7.5 | )% | |||
Note: The table above may not be indicative of future results.
In order to limit exposure to interest rate risk, we have developed strategies to increase our liquidity in order to take advantage of an expected rise in rates and to shorten the effective maturities of certain interest-earning assets, and increase the effective maturities of certain interest-bearing liabilities including the FHLB borrowings. The origination of floating rate loans such as business, construction and other prime or London Interbank Offered Rate (“LIBOR”)-based loans is a key focus. The majority of fixed rate loans have re-pricing periods less than five years. The mix of floating and fixed rate assets is designed to mitigate the impact of rate changes on our net interest income.
There can be no assurance that the results of operations would be impacted as indicated in the above table if interest rates did move by the amounts discussed above. Management continually reviews its interest risk position through its Asset/Liability Management Committee. Management’s general philosophy is to maintain relatively matched rate sensitive asset and liability positions within the range described above in order to provide earnings stability in the event of significant interest rate changes. In the present historically low interest rate environment, liability rates are modeled to be unable to be reduced further, resulting in the potential net interest income fluctuation in a scenario of a further decline in interest rates to be potentially significant as indicated in Table 21. However, Management has evaluated this scenario to be highly unlikely to occur.
| 63 |
ITEM 8. FINANCIAL STATEMENTS AND SUPPLEMENTARY DATA
Our Consolidated Financial Statements are included on the pages that follow.
REPORT BY BAYLAKE CORP.’S MANAGEMENT
ON INTERNAL CONTROL OVER FINANCIAL REPORTING
Our management is responsible for establishing and maintaining an effective system of internal control over financial reporting, as such term is defined in Section 13a-15(f) of the Securities Exchange Act of 1934. The Company’s system of internal control over financial reporting is designed to provide reasonable assurance regarding the reliability of financial reporting and the preparation of financial statements for external purposes in accordance with generally accepted accounting principles. There are inherent limitations in the effectiveness of any system of internal control over financial reporting, including the possibility of human error and circumvention or overriding of controls. Accordingly, even an effective system of internal control over financial reporting can provide only reasonable assurance with respect to financial statement preparation. Projections of any evaluation of effectiveness to future periods are subject to the risks that controls may become inadequate because of changes in conditions or that the degree of compliance with the policies or procedures may deteriorate.
Management maintains a comprehensive system of internal controls intended to ensure that transactions are executed in accordance with management’s authorization, assets are safeguarded and financial records are reliable. Management also takes steps to see that information and communication flows are effective and to monitor performance, including performance of internal control procedures.
Management assessed the Company’s systems of internal control over financial reporting as of December 31, 2015. This assessment was based on criteria for effective internal control over financial reporting described in Internal Control – Integrated Framework (2013) issued by the Committee of Sponsoring Organizations of the Treadway Commission (COSO). Based on this assessment, management believes that as of December 31, 2015, the Company maintained effective internal control over financial reporting based on those criteria.
The Company’s independent registered public accountants have issued an audit report on the effectiveness of the Company’s internal control over financial reporting.
| /s/ Robert J. Cera | /s/ Kevin L. LaLuzerne | |
|
Robert J. Cera President and Chief Executive Officer |
Kevin L. LaLuzerne Senior Vice President and Chief Financial Officer |
| 64 |
Report of Independent Registered Public Accounting Firm
To the Shareholders, Audit Committee and Board of Directors
Baylake Corp.
Sturgeon Bay, WI
We have audited the accompanying consolidated balance sheets of Baylake Corp. and subsidiaries (the “Company”) as of December 31, 2015 and 2014, and the related consolidated statements of operations, comprehensive income, changes in stockholders’ equity and cash flows for the years ended December 31, 2015, 2014, and 2013. We also have audited Baylake Corp.’s internal control over financial reporting as of December 31, 2015, based on criteria established in Internal Control – Integrated Framework (2013) issued by the Committee of Sponsoring Organizations of the Treadway Commission (COSO). These consolidated financial statements are the responsibility of the Company’s management. Our responsibility is to express an opinion on these consolidated financial statements based on our audits.
We conducted our audits in accordance with the standards of the Public Company Accounting Oversight Board (United States). Those standards require that we plan and perform the audit to obtain reasonable assurance about whether the consolidated financial statements are free of material misstatement and whether effective internal control over financial reporting was maintained in all material respects. An audit includes examining, on a test basis, evidence supporting the amounts and disclosures in the consolidated financial statements. An audit also includes assessing the accounting principles used and significant estimates made by management as well as evaluating the overall consolidated financial statement presentation. Our audit of internal control over financial reporting included obtaining an understanding of internal control over financial reporting, assessing the risk that a material weakness exists, and testing and evaluating the design and operating effectiveness of internal control based on the assessed risk. Our audits also included performing such other procedures as we considered necessary in the circumstances. We believe that our audits provide a reasonable basis for our opinion.
A company’s internal control over financial reporting is a process designed to provide reasonable assurance regarding the reliability of financial reporting and the preparation of consolidated financial statements for external purposes in accordance with accounting principles generally accepted in the United States of America. A company’s internal control over financial reporting includes those policies and procedures that (1) pertain to the maintenance of records that, in reasonable detail, accurately and fairly reflect the transactions and dispositions of the assets of the company; (2) provide reasonable assurance that transactions are recorded as necessary to permit preparation of consolidated financial statements in accordance with accounting principles generally accepted in the United States of America, and that receipts and expenditures of the company are being made only in accordance with authorizations of management and directors of the company; and (3) provide reasonable assurance regarding prevention or timely detection of unauthorized acquisition, use, or disposition of the company’s assets that could have a material effect on the consolidated financial statements.
Because of its inherent limitations, internal control over financial reporting may not prevent or detect misstatements. Also, projections of any evaluation of effectiveness to future periods are subject to the risk that controls may become inadequate because of changes in conditions, or that the degree of compliance with the policies or procedures may deteriorate.
In our opinion, the consolidated financial statements referred to above present fairly, in all material respects, the financial position of Baylake Corp. and subsidiaries as of December 31, 2015 and 2014, and the results of its operations and cash flows for the years ended December 31, 2015, 2014 and 2013, in conformity with accounting principles generally accepted in the United States of America. Also in our opinion, Baylake Corp. and subsidiaries maintained, in all material respects, effective internal control over financial reporting as of December 31, 2015, based on criteria established in Internal Control – Integrated Framework (2013) issued by the Committee of Sponsoring Organizations of the Treadway Commissions (COSO).
| /s/ Baker Tilly Virchow Krause, LLP | ||
| Milwaukee, Wisconsin |
March 4, 2016
| 65 |
BAYLAKE CORP.
CONSOLIDATED BALANCE SHEETS
December 31, 2015 and 2014
(Dollar amounts in thousands)
| 2015 | 2014 | |||||||
| ASSETS | ||||||||
| Cash and due from financial institutions | $ | 70,458 | $ | 60,189 | ||||
| Federal funds sold and certificates of deposit | 1,333 | 1,176 | ||||||
| Securities held to maturity, at amortized cost | 25,487 | 25,612 | ||||||
| Securities available for sale, at fair value | 172,608 | 182,912 | ||||||
| Loans held for sale | 2,804 | 1,290 | ||||||
| Loans, net of allowance of $5,928 and $7,051 at December 31, 2015 and 2014, respectively | 737,453 | 672,306 | ||||||
| Cash surrender value of life insurance | 25,195 | 23,587 | ||||||
| Premises and equipment, net | 20,102 | 20,206 | ||||||
| Premises held for sale | 2,104 | 844 | ||||||
| Federal Home Loan Bank stock, at cost | 4,462 | 4,238 | ||||||
| Other real estate owned, net | 3,710 | 4,266 | ||||||
| Goodwill | 8,359 | 7,222 | ||||||
| Deferred income taxes, net | 4,753 | 4,707 | ||||||
| Accrued interest receivable | 2,869 | 2,559 | ||||||
| Other assets | 12,220 | 10,509 | ||||||
| Total Assets | $ | 1,093,917 | $ | 1,021,623 | ||||
| LIABILITIES AND STOCKHOLDERS’ EQUITY | ||||||||
| Deposits | ||||||||
| Noninterest-bearing | $ | 198,003 | $ | 153,113 | ||||
| Interest-bearing | 668,192 | 612,429 | ||||||
| Total Deposits | 866,195 | 765,542 | ||||||
| Federal Home Loan Bank advances and other borrowings | 41,595 | 60,455 | ||||||
| Repurchase agreements | 48,127 | 64,869 | ||||||
| Subordinated debentures | 16,100 | 16,100 | ||||||
| Convertible promissory notes | — | 1,650 | ||||||
| Accrued expenses and other liabilities | 7,551 | 7,503 | ||||||
| Total Liabilities | 979,568 | 916,119 | ||||||
| Commitments and Contingencies - Note 16 | ||||||||
| Common stock, $5 par value, authorized 50,000,000 shares; | ||||||||
| Issued - 10,458,861 shares at December 31, 2015 and 9,777,834 shares at December 31, 2014; Outstanding - 9,620,348 shares at December 31, 2015 and 9,054,821 shares at December 31, 2014 | 52,294 | 48,889 | ||||||
| Additional paid-in capital | 15,803 | 12,654 | ||||||
| Retained earnings | 55,982 | 51,123 | ||||||
| Treasury stock 838,513 shares at December 31, 2015 and 723,013 shares at December 31, 2014 | (10,944 | ) | (9,497 | ) | ||||
| Accumulated other comprehensive income | 1,214 | 2,335 | ||||||
| Total Stockholders’ Equity | 114,349 | 105,504 | ||||||
| Total Liabilities and Stockholders’ Equity | $ | 1,093,917 | $ | 1,021,623 | ||||
See accompanying Notes to Consolidated Financial Statements
| 66 |
BAYLAKE CORP.
CONSOLIDATED STATEMENTS OF COMPREHENSIVE INCOME
Years ended December 31, 2015, 2014 and 2013
(Dollar amounts in thousands)
| 2015 | 2014 | 2013 | ||||||||||
| INTEREST AND DIVIDEND INCOME | ||||||||||||
| Loans, including fees | $ | 29,373 | $ | 28,135 | $ | 28,236 | ||||||
| Taxable securities | 4,421 | 5,035 | 4,928 | |||||||||
| Tax exempt securities | 1,381 | 1,497 | 1,488 | |||||||||
| Federal funds sold and certificates of deposit | 100 | 76 | 88 | |||||||||
| Total Interest and Dividend Income | 35,275 | 34,743 | 34,740 | |||||||||
| INTEREST EXPENSE | ||||||||||||
| Deposits | 1,341 | 1,589 | 2,492 | |||||||||
| Repurchase agreements | 61 | 98 | 78 | |||||||||
| Federal Home Loan Bank advances and other borrowings | 939 | 755 | 728 | |||||||||
| Subordinated debentures | 267 | 259 | 266 | |||||||||
| Convertible promissory notes | 27 | 612 | 976 | |||||||||
| Total Interest Expense | 2,635 | 3,313 | 4,540 | |||||||||
| Net interest income before provision for loan losses | 32,640 | 31,430 | 30,200 | |||||||||
| Provision for loan losses | 200 | — | 1,400 | |||||||||
| Net interest income after provision for loan losses | 32,440 | 31,430 | 28,800 | |||||||||
| NONINTEREST INCOME | ||||||||||||
| Fees from fiduciary activities | 1,159 | 1,044 | 1,062 | |||||||||
| Fees from loan servicing | 633 | 584 | 591 | |||||||||
| Fees from financial services to customers | 1,194 | 1,153 | 1,220 | |||||||||
| Fees for other services to customers | 3,774 | 3,620 | 3,404 | |||||||||
| Net gain on sale of loans | 922 | 648 | 1,414 | |||||||||
| Net change in valuation of mortgage servicing rights, net of payments and payoffs | (79 | ) | (205 | ) | (96 | ) | ||||||
| Net realized gain on sale of securities | 465 | 446 | 574 | |||||||||
| Net gains (losses) on sale of premises and equipment | 11 | 1 | (3 | ) | ||||||||
| Net gain on sale of branches and deposits | — | — | 122 | |||||||||
| Increase in cash surrender value of life insurance | 355 | 382 | 340 | |||||||||
| Income in equity of UFS subsidiary | 1,216 | 1,208 | 936 | |||||||||
| Other noninterest income | 46 | 186 | 266 | |||||||||
| Total Noninterest Income | 9,696 | 9,067 | 9,830 | |||||||||
| NONINTEREST EXPENSE | ||||||||||||
| Salaries and employee benefits | 17,834 | 16,557 | 16,551 | |||||||||
| Occupancy expense | 2,145 | 2,137 | 1,938 | |||||||||
| Equipment expense | 1,382 | 1,351 | 1,190 | |||||||||
| Data processing and courier expense | 948 | 861 | 854 | |||||||||
| FDIC insurance expense | 613 | 604 | 699 | |||||||||
| Operation of other real estate owned | 769 | 1,009 | 969 | |||||||||
| Loan and collection expense | 74 | 37 | 224 | |||||||||
| Other outside services | 1,746 | 1,148 | 878 | |||||||||
| Audit and legal expense | 1,146 | 808 | 708 | |||||||||
| Costs relating to UFS tax strategy implementation | 163 | 661 | — | |||||||||
| Other noninterest expenses | 3,590 | 3,149 | 3,291 | |||||||||
| Total Noninterest Expense | 30,410 | 28,322 | 27,302 | |||||||||
| Income before provision for income taxes | 11,726 | 12,175 | 11,328 | |||||||||
| Provision for income taxes | 3,709 | 3,252 | 3,319 | |||||||||
| Net Income | $ | 8,017 | $ | 8,923 | $ | 8,009 | ||||||
| Basic earnings per share | $ | 0.86 | $ | 1.07 | $ | 1.01 | ||||||
| Diluted earnings per share | $ | 0.85 | $ | 0.97 | $ | 0.87 | ||||||
| Cash dividends paid per share | $ | 0.34 | $ | 0.30 | $ | 0.22 | ||||||
See accompanying Notes to Consolidated Financial Statements
| 67 |
BAYLAKE CORP.
CONSOLIDATED STATEMENTS OF COMPREHENSIVE INCOME
Years ended December 31, 2015, 2014 and 2013
(Dollar amounts in thousands)
| 2015 | 2014 | 2013 | ||||||||||
| Net Income | $ | 8,017 | $ | 8,923 | $ | 8,009 | ||||||
| Other comprehensive income (loss), net of tax | ||||||||||||
| Unrealized gains on securities available for sale | ||||||||||||
| Net unrealized holding gains (losses) arising during the period | (1,380 | ) | 2,516 | (6,351 | ) | |||||||
| Less: reclassification adjustment for gains realized in net income | (465 | ) | (446 | ) | (574 | ) | ||||||
| Tax effect | 724 | (812 | ) | 2,741 | ||||||||
| Other comprehensive income (loss) | (1,121 | ) | 1,258 | (4,184 | ) | |||||||
| Comprehensive income | $ | 6,896 | $ | 10,181 | $ | 3,825 | ||||||
See accompanying Notes to Consolidated Financial Statements
| 68 |
BAYLAKE CORP.
CONSOLIDATED STATEMENTS OF CHANGES IN STOCKHOLDERS’ EQUITY
Years ended December 31, 2015, 2014 and 2013
(Dollar amounts in thousands, except share data)
| Common Stock | Additional Paid-In | Retained | Treasury | Accumulated Other Comprehensive | Stockholders’ | |||||||||||||||||||||||
| Shares | Amount | Capital | Earnings | Stock | Income | Equity | ||||||||||||||||||||||
| Balance, January 1, 2013 | 7,937,347 | 40,792 | 12,192 | 38,448 | (3,549 | ) | 5,261 | 93,144 | ||||||||||||||||||||
| Net income | — | — | — | 8,009 | — | — | 8,009 | |||||||||||||||||||||
| Net changes in unrealized losses on securities available for sale | — | — | — | — | — | (6,351 | ) | (6,351 | ) | |||||||||||||||||||
| Reclassification adjustment for net gains realized in income | — | — | — | — | — | (574 | ) | (574 | ) | |||||||||||||||||||
| Tax effect | — | — | — | — | — | 2,741 | 2,741 | |||||||||||||||||||||
| Total comprehensive income | 3,825 | |||||||||||||||||||||||||||
| Purchase of treasury stock | (163,000 | ) | — | — | — | (1,707 | ) | — | (1,707 | ) | ||||||||||||||||||
| Stock-based compensation expense recognized, net | — | — | 292 | — | — | — | 292 | |||||||||||||||||||||
| Vesting of RSUs | 28,679 | 143 | (143 | ) | — | — | — | — | ||||||||||||||||||||
| Tax benefit from vesting of RSUs | — | — | 47 | — | — | — | 47 | |||||||||||||||||||||
| Exercise of stock options | 6,971 | 35 | (4 | ) | — | — | — | 31 | ||||||||||||||||||||
| Tax benefit from exercise of stock options/RSUs | — | — | 8 | — | — | — | 8 | |||||||||||||||||||||
| Forfeiture of stock options not exercised or RSUs not vested | — | — | (13 | ) | — | — | — | (13 | ) | |||||||||||||||||||
| Tax expense from forfeiture of unexercised stock options/RSUs | — | — | (8 | ) | — | — | — | (8 | ) | |||||||||||||||||||
| Cash dividends - ($0.22 per share) | — | — | — | (1,738 | ) | — | — | (1,738 | ) | |||||||||||||||||||
| Balance, December 31, 2013 | 7,809,997 | $ | 40,970 | 12,371 | 44,719 | (5,256 | ) | 1,077 | 93,881 | |||||||||||||||||||
| Net income | — | — | — | 8,923 | — | — | 8,923 | |||||||||||||||||||||
| Net changes in unrealized gains on securities available for sale | — | — | — | — | — | 2,516 | 2,516 | |||||||||||||||||||||
| Reclassification adjustment for net gains realized in income | — | — | — | — | — | (446 | ) | (446 | ) | |||||||||||||||||||
| Tax effect | — | — | — | — | — | (812 | ) | (812 | ) | |||||||||||||||||||
| Total comprehensive income | 10,181 | |||||||||||||||||||||||||||
| Purchase of treasury stock | (339,000 | ) | — | — | — | (4,241 | ) | — | (4,241 | ) | ||||||||||||||||||
| Stock-based compensation expense recognized, net | — | — | 355 | — | — | — | 355 | |||||||||||||||||||||
| Vesting of RSUs | 32,267 | 161 | (161 | ) | — | — | — | — | ||||||||||||||||||||
| Tax benefit from vesting of RSUs | — | — | 92 | — | — | — | 92 | |||||||||||||||||||||
| Exercise of stock options | 1,557 | 8 | (1 | ) | — | — | — | 7 | ||||||||||||||||||||
| Tax benefit from exercise of stock options/RSUs | — | — | 3 | — | — | — | 3 | |||||||||||||||||||||
| Forfeiture of stock options not exercised or RSUs not vested | — | — | (7 | ) | — | — | — | (7 | ) | |||||||||||||||||||
| Tax expense from forfeiture of unexercised stock options/RSUs | — | — | 2 | — | — | — | 2 | |||||||||||||||||||||
| Conversion of debentures | 1,550,000 | 7,750 | 7,750 | |||||||||||||||||||||||||
| Cash dividends - ($0.30 per share) | — | — | — | (2,519 | ) | — | — | (2,519 | ) | |||||||||||||||||||
| Balance, December 31, 2014 | 9,054,821 | $ | 48,889 | $ | 12,654 | $ | 51,123 | $ | (9,497 | ) | $ | 2,335 | $ | 105,504 | ||||||||||||||
| Net income | — | — | — | 8,017 | — | — | 8,017 | |||||||||||||||||||||
| Net changes in unrealized losses on securities available for sale | — | — | — | — | — | (1,380 | ) | (1,380 | ) | |||||||||||||||||||
| Reclassification adjustment for net gains realized in income | — | — | — | — | — | (465 | ) | (465 | ) | |||||||||||||||||||
| Tax effect | — | — | — | — | — | 724 | 724 | |||||||||||||||||||||
| Total comprehensive income | 6,896 | |||||||||||||||||||||||||||
| Purchase of treasury stock | (115,500 | ) | — | — | — | (1,447 | ) | — | (1,447 | ) | ||||||||||||||||||
| Stock-based compensation expense recognized, net | — | — | 514 | — | — | — | 514 | |||||||||||||||||||||
| Vesting of RSUs | 35,556 | 178 | (178 | ) | — | — | — | — | ||||||||||||||||||||
| Tax benefit from vesting of RSUs | — | — | 81 | — | — | — | 81 | |||||||||||||||||||||
| Exercise of stock options | 29,566 | 147 | 5 | — | — | — | 152 | |||||||||||||||||||||
| Tax benefit from exercise of stock options/RSUs | — | — | 63 | — | — | — | 63 | |||||||||||||||||||||
| Tax expense from forfeiture of unexercised stock options/RSUs | — | — | (4 | ) | — | — | — | (4 | ) | |||||||||||||||||||
| Issuance of common stock in acquisition | 285,905 | 1,430 | 2,668 | 4,098 | ||||||||||||||||||||||||
| Conversion of debentures | 330,000 | 1,650 | — | — | — | — | 1,650 | |||||||||||||||||||||
| Cash dividends - ($0.34 per share) | — | — | — | (3,158 | ) | — | — | (3,158 | ) | |||||||||||||||||||
| Balance, December 31, 2015 | 9,620,348 | $ | 52,294 | $ | 15,803 | $ | 55,982 | $ | (10,944 | ) | $ | 1,214 | $ | 114,349 | ||||||||||||||
See accompanying Notes to Consolidated Financial Statements
| 69 |
BAYLAKE CORP.
CONSOLIDATED STATEMENTS OF CASH FLOWS Years ended December 31, 2015, 2014 and 2013
(Dollar amounts in thousands)
| 2015 | 2014 | 2013 | ||||||||||
| CASH FLOWS FROM OPERATING ACTIVITIES | ||||||||||||
| Reconciliation of net income to net cash provided by operating activities: | ||||||||||||
| Net Income | $ | 8,017 | $ | 8,923 | $ | 8,009 | ||||||
| Adjustments to reconcile net income to net cash provided by operating activities: | ||||||||||||
| Depreciation and amortization | 1,283 | 1,318 | 1,297 | |||||||||
| Amortization of debt issuance costs | — | 26 | 36 | |||||||||
| Amortization of core deposit intangible | 38 | 21 | — | |||||||||
| Provision for loan losses | 200 | — | 1,400 | |||||||||
| Loss on transfer of bank facilities to other real estate owned | — | — | 268 | |||||||||
| Net amortization of premium/discount on securities | 1,458 | 1,531 | 2,402 | |||||||||
| Increase in cash surrender value of life insurance | (355 | ) | (382 | ) | (340 | ) | ||||||
| Net realized gain on sale of securities | (465 | ) | (446 | ) | (574 | ) | ||||||
| Net gain on sale of loans | (922 | ) | (648 | ) | (1,414 | ) | ||||||
| Net gain on sale of branches | — | — | (122 | ) | ||||||||
| Proceeds from sale of loans held for sale | 45,400 | 31,442 | 69,364 | |||||||||
| Origination of loans held for sale | (46,094 | ) | (30,804 | ) | (68,641 | ) | ||||||
| Change in valuation of mortgage servicing rights, net of payments and payoffs | 79 | 205 | 96 | |||||||||
| Provision for valuation allowance on other real estate owned | 573 | 730 | 946 | |||||||||
| Provision for valuation allowance on land held for sale | 344 | — | — | |||||||||
| Net gains (losses) on sale of premises and equipment | (11 | ) | (1 | ) | 3 | |||||||
| Net gains on disposals of other real estate owned | (50 | ) | (19 | ) | (202 | ) | ||||||
| Provision for deferred income tax expense | 887 | 1,117 | 2,463 | |||||||||
| Stock-based compensation expense | 514 | 355 | 292 | |||||||||
| Forfeiture of options not exercised and RSUs not vested | — | (7 | ) | (13 | ) | |||||||
| Tax benefit from exercise/forfeiture of options | 59 | 5 | — | |||||||||
| Income in equity of UFS subsidiary | (1,216 | ) | (1,208 | ) | (936 | ) | ||||||
| Changes in assets and liabilities: | ||||||||||||
| Return of prepaid FDIC assessment | — | — | 358 | |||||||||
| Accrued income taxes | (1,063 | ) | (3,911 | ) | 1,441 | |||||||
| Accrued interest receivable and other assets | 285 | (542 | ) | 287 | ||||||||
| Income tax payments (refunds) | 2,220 | 2,977 | (316 | ) | ||||||||
| Accrued expenses and other liabilities | (262 | ) | (587 | ) | 291 | |||||||
| Net cash provided by operating activities | 10,919 | 10,095 | 16,395 | |||||||||
| CASH FLOWS FROM INVESTING ACTIVITIES | ||||||||||||
| Proceeds from sale of securities available for sale | 13,911 | 15,879 | 6,406 | |||||||||
| Principal payments on securities available for sale | 36,279 | 27,984 | 48,034 | |||||||||
| Purchase of securities held to maturity | — | (15,456 | ) | (10,275 | ) | |||||||
| Purchase of securities available for sale | (19,202 | ) | (5,063 | ) | (41,782 | ) | ||||||
| Purchase of FHLB stock | — | (640 | ) | — | ||||||||
| Proceeds from sale of other real estate owned | 950 | 2,525 | 5,040 | |||||||||
| Proceeds from sale of premises and equipment | 40 | 82 | 7 | |||||||||
| Proceeds from life insurance death benefit | 203 | 196 | — | |||||||||
| Loan originations and payments, net | (19,359 | ) | (63,205 | ) | (26,371 | ) | ||||||
| Additions to premises and equipment | (2,104 | ) | (941 | ) | (816 | ) | ||||||
| Net change in federal funds sold | 598 | (1,113 | ) | 955 | ||||||||
| Dividend from UFS subsidiary | 503 | 417 | 433 | |||||||||
| Capital contribution to UFS subsidiary | (732 | ) | — | — | ||||||||
| Net cash provided by (used in) purchase or acquisition of institutions | (3,960 | ) | 12,086 | — | ||||||||
| Net cash provided by (used in) investing activities | 7,127 | (27,249 | ) | (18,369 | ) | |||||||
See accompanying Notes to Consolidated Financial Statements
| 70 |
BAYLAKE CORP.
CONSOLIDATED STATEMENTS OF CASH FLOWS Years ended December 31, 2015, 2014 and 2013
(Dollar amounts in thousands)
| 2015 | 2014 | 2013 | ||||||||||
| CASH FLOWS FROM FINANCING ACTIVITIES | ||||||||||||
| Net change in deposits | $ | 32,197 | $ | 7,649 | $ | (61,681 | ) | |||||
| Net change in repurchase agreements | (16,742 | ) | 6,421 | 6,880 | ||||||||
| Repayments on Federal Home Loan Bank advances and other borrowings | (32,860 | ) | (82,545 | ) | (15,000 | ) | ||||||
| Proceeds from Federal Home Loan Bank advances and other borrowings | 14,000 | 76,300 | 41,700 | |||||||||
| Tax benefit from vesting of restricted stock units | 81 | 92 | 47 | |||||||||
| Proceeds from exercise of stock options | 152 | 7 | 31 | |||||||||
| Purchase of treasury stock | (1,447 | ) | (4,241 | ) | (1,707 | ) | ||||||
| Cash dividends paid | (3,158 | ) | (2,519 | ) | (1,738 | ) | ||||||
| Net cash provided by (used in) financing activities | (7,777 | ) | 1,164 | (31,468 | ) | |||||||
| Net change in cash | 10,269 | (15,990 | ) | (33,442 | ) | |||||||
| Beginning cash | 60,189 | 76,179 | 109,621 | |||||||||
| Ending cash | $ | 70,458 | $ | 60,189 | $ | 76,179 | ||||||
| Supplemental cash flow information: | ||||||||||||
| Interest paid | $ | 2,629 | $ | 3,578 | $ | 4,758 | ||||||
| Income taxes paid (refunded), net | 2,220 | 2,977 | (316 | ) | ||||||||
| Supplemental noncash disclosure: | ||||||||||||
| Transfers from loans to other real estate owned | $ | 623 | $ | 1,204 | $ | 1,037 | ||||||
| Transfers from premises and equipment to other real estate owned | 147 | — | 509 | |||||||||
| Transfers from real estate held for sale to other real estate owned | — | — | 60 | |||||||||
| Transfers from premises and equipment to premises held for sale | 1,320 | — | — | |||||||||
| Mortgage servicing rights resulting from sale of loans | 102 | 79 | 224 | |||||||||
| Conversion of debentures to equity | 1,650 | 7,750 | — | |||||||||
See accompanying Notes to Consolidated Financial Statements
| 71 |
BAYLAKE CORP.
NOTES TO CONSOLIDATED FINANCIAL STATEMENTS
December 31, 2015, 2014 and 2013
(Dollar amounts in thousands except share and per share data)
NOTE 1 - NATURE OF BUSINESS AND SUMMARY OF SIGNIFICANT ACCOUNTING POLICIES
The consolidated financial statements of Baylake Corp. (the “Company”) include the accounts of the Company, its wholly owned subsidiaries Baylake Bank (the “Bank”) and Admiral Asset Management, Inc. (“Admiral”), and the Bank’s wholly owned subsidiary: Bay Lake Investments, Inc. In the fourth quarter of 2013, the Company capitalized Admiral, a wholly-owned registered investment advisor subsidiary to provide brokerage services in addition to those offered by the Bank and investment advisory services to customers. All significant intercompany items and transactions have been eliminated. Management has evaluated the impact of all subsequent events and determined that all subsequent events have been appropriately recognized and disclosed in the accompanying consolidated financial statements through the date of this report.
Through the third quarter of 2014, the Bank owned a 49.8% interest (500 shares) in United Financial Services, Incorporated (“UFS Inc.”), a data processing service and e-banking entity. During the third quarter of 2014, a tax strategy reorganization of UFS Inc. was launched with the intent of providing a more favorable tax structure to UFS Inc. and its shareholders. This transaction was completed in the fourth quarter of 2014. As part of the reorganization, UFS, LLC was formed. Collectively, UFS Inc. and UFS, LLC are referred to as United Financial Services (“UFS”). UFS Inc. owns a 50.2% interest in UFS, LLC. Under the new structure, the Bank owns a 49.8% indirect interest in UFS, LLC, through its 99.2% ownership (500 shares) of UFS Inc. As part of the transaction, the Bank paid $661 to UFS, LLC’s other 49.8% shareholder as reimbursement for the disproportionate share of tax obligations borne by that shareholder resulting from the overall restructuring transaction. The Bank’s payment was non-deductible for tax purposes. Partially offsetting this expense was a $584 reversal of a previously recorded deferred tax liability related to UFS Inc. Other costs incurred in the transaction included $146 of professional fees. In the second quarter of 2015, the Bank paid an additional $163 to the shareholder as a final settlement related to the transaction.
In addition to the ownership interest, UFS LLC, UFS Inc. and the Bank have a common member on each of their respective Boards of Directors. The investment in UFS Inc. is carried under the equity method of accounting and the Bank’s pro rata share of UFS Inc.’s income is included in noninterest income. Income in equity of UFS recognized by the Bank was $1,216, $1,208, and $936 for the years ended 2015, 2014, and 2013, respectively. Amounts paid to UFS for data processing services by the Bank were $911, $883, and $937 in 2015, 2014, and 2013, respectively. Loans to UFS were $964 and $2,978 at December 31, 2015 and December 31, 2014, respectively. The carrying value of the Bank’s investment in UFS was $5,838 and $4,640 at December 31, 2015 and December 31, 2014, respectively. The current book value of UFS is approximately $11,676 per share as of December 31, 2015.
The Bank makes commercial, mortgage, and installment loans to customers substantially all of whom are located in Door, Brown, Kewaunee, Manitowoc, and Outagamie Counties of Wisconsin as well as participates in national lending credits. Although the Bank has a diversified portfolio, a substantial portion of its debtors’ ability to honor their contracts is dependent upon the economic condition of the local tourism/recreation businesses, as well as the industrial, commercial and agricultural industries.
On February 7, 2014, the Bank purchased a branch location in Appleton, Wisconsin. The transaction included deposits of $13,681 and related overdraft loans of $3 as well as $950 of fixed assets. The transaction resulted in $112 of core deposit intangible.
On April 10, 2015, the Bank closed one of its branch locations in Brown County, Wisconsin. Customer deposits and loans were transferred to other Bank locations and staff was relocated to other branches. The Bank anticipates using the facility in future operations and therefore the property has not been transferred to other real estate. In October 2015, in conjunction with the pending merger with Nicolet Bankshares, Inc. (“Nicolet), the Bank entered into a lease agreement with Nicolet’s wholly-owned bank subsidiary, Nicolet National Bank, related to this facility.
On May 8, 2015 the Company announced the signing of a definitive agreement to acquire NEW Bancshares, Inc. (“NEWBI”) in a cash and stock transaction. NEWBI, headquartered in Kewaunee, Wisconsin, was the parent company of Union State Bank (“Union”), which operated four locations in northeast Wisconsin. That transaction closed on December 4, 2015.
| 72 |
BAYLAKE CORP.
NOTES TO CONSOLIDATED FINANCIAL STATEMENTS
December 31, 2015, 2014 and 2013
(Dollar amounts in thousands)
NOTE 1 – NATURE OF BUSINESS AND SUMMARY OF SIGNIFICANT ACCOUNTING POLICIES (Continued)
On September 8, 2015, the Company announced jointly with Nicolet the signing of an Agreement and Plan of Merger whereby the Company will merge with and into Nicolet. Following the merger, the Bank will merge with and into Nicolet National Bank with Nicolet National Bank continuing as the surviving bank and with all Bank branches operating under the Nicolet National Bank brand. This transaction is expected to close in the second quarter of 2016.
Use of Estimates: To prepare financial statements in conformity with accounting principles generally accepted in the United States of America (“U.S. GAAP”), management makes estimates and assumptions based on available information. These estimates and assumptions affect the amounts reported in the consolidated financial statements and the disclosures provided, and actual results could differ. The allowance for loan losses, value of foreclosed properties, other than temporary impairment of securities, income tax expense, and fair values of financial instruments are particularly subject to change.
Business Combinations: The Company accounts for business combinations under the acquisition method of accounting in accordance with Accounting Standards Codification (“ASC”) 805, Business Combinations (“ASC 805”). Under ASC 805, all identifiable assets acquired and all liabilities assumed must be measured at fair value at the acquisition date. The “carrying over” of the allowance for loan and lease losses to the acquiring entity is prohibited. Acquisition-related costs such as legal, accounting, consulting, and investment broker fees must be expensed as incurred. The excess cost of the acquisition over the fair value of the net tangible and intangible assets acquired is recorded as goodwill. The Company may change provisional amounts initially recorded as of the acquisition date for a period of up to one year after the acquisition date of the business combination.
Cash and Cash Equivalents: Cash and cash equivalents include cash and deposits with other financial institutions. Balances over $250 in those institutions are not insured by the Federal Deposit Insurance Corporation (“FDIC”) and therefore pose a potential risk in the event the institution were to fail. As of December 31, 2015, uninsured deposits totaled $1,489.
Securities: Securities are classified as held to maturity or available for sale at the time of purchase. Investment securities classified as held to maturity, which management has the intent and ability to hold to maturity, are reported at amortized cost, adjusted for amortization of premiums and accretion of discounts, using a method that approximates level yield. Investment securities classified as available for sale, which management has the intent and ability to hold for an indefinite period of time, but not necessarily to maturity, are carried at fair value, with unrealized gains and losses, net of related deferred income taxes, included in stockholders’ equity as a separate component of other comprehensive income. Premiums and discounts are amortized or accreted into interest income over the estimated life (earlier of call date, maturity, or estimated life) of the related security, using a prospective method that approximates level yield. Any decision to sell investment securities available for sale would be based on various factors, including, but not limited to, asset/liability management strategies, changes in interest rates or prepayment risks, liquidity needs, or regulatory capital considerations. Gains and losses on sales are recorded on the trade date and determined using the specific identification method.
Declines in the fair value of securities below their cost that are other-than-temporary due to credit issues are reflected as “Other than temporary impairment of securities” in the statement of operations. In estimating other-than-temporary losses, management considers: (1) the length of time and extent that fair value has been less than cost, (2) the financial condition and near-term prospects of the issuer, and (3) the Company’s ability and intent to hold the security for a period sufficient to allow for any anticipated recovery in fair value. The difference between the present values of the cash flows expected to be collected and the amortized cost basis is the credit loss. The credit loss is the portion of the other-than-temporary impairment that is recognized in earnings and is a reduction to the cost basis of the security. The portion of other-than-temporary impairment related to all other factors is included in other comprehensive income (loss).
Federal Home Loan Bank (“FHLB”) stock: The Bank is a member of the FHLB system. Members are required to own a certain amount of stock based on the level of borrowings and other factors, and may invest in additional amounts. FHLB stock is carried at cost, classified as a restricted security, and periodically evaluated for impairment based on expected ultimate recovery of par value. The determination of whether a decline affects the ultimate recovery is influenced by criteria such as: (1) the significance of the decline in net assets of the FHLB as compared to the capital stock amount and length of time a decline has persisted; (2) impact of legislative and regulatory changes on the FHLB and (3) the liquidity position of the FHLB. Both cash and stock dividends are reported as income.
| 73 |
BAYLAKE CORP.
NOTES TO CONSOLIDATED FINANCIAL STATEMENTS
December 31, 2015, 2014 and 2013
(Dollar amounts in thousands)
NOTE 1 – NATURE OF BUSINESS AND SUMMARY OF SIGNIFICANT ACCOUNTING POLICIES (Continued)
Loans Held for Sale: Mortgage loans originated and intended for sale in the secondary market are carried at the lower of aggregate cost or market, as determined by outstanding commitments from investors. Net unrealized losses, if any, are recorded as a valuation allowance and charged to earnings.
Mortgage loans held for sale may be sold with servicing rights retained. The carrying value of mortgage loans sold with servicing rights retained is reduced by the amount allocated to the servicing right at the time of sale. Gains and losses on sales of mortgage loans are based on the difference between the selling price and the carrying value of the related loan sold.
Loans – Originated: Loans that management has the intent and ability to hold for the foreseeable future or until maturity or payoff are reported at the principal balance outstanding, net of deferred loan fees and costs, and an allowance for loan losses. Interest income is accrued on the unpaid principal balance. Loan origination fees, net of certain direct origination costs, are deferred and recognized in interest income using the level-yield method without anticipating prepayments.
Interest income on loans is discontinued at the time the loan is 90 days delinquent. Past due status is based on the contractual terms of the loan. In all cases, loans are placed on nonaccrual or charged off at an earlier date if collection of principal or interest is considered doubtful. All interest accrued but not received for loans placed on nonaccrual is reversed against interest income. Interest received on such loans is accounted for on the cash-basis or cost-recovery method until qualifying for return to accrual status. Loans are returned to accrual status when all the principal and interest amounts contractually due are brought current and future payments are reasonably assured.
Loans – Acquired: Loans acquired in a business combination are recorded at their estimated fair value at the acquisition date under ASC Topic 310-20, Receivables – Nonrefundable Fees and Other Costs or ASC Topic 310-30, Receivables – Loans and Debt Securities Acquired with Deteriorated Credit Quality. ASC 310-30 is used when the determination is made at acquisition that the acquirer will be unable to collect all contractually required payments from the borrower. These loans are identified as Purchase Credit Impaired (“PCI”) loans and the amount of the credit discount is a nonaccretable mark that is not recorded within the Allowance for Loan Losses (“ALL”). Credit deterioration subsequent to the acquisition will be charged to the ALL.
All other loans that are not PCI loans will be measured at fair value based on the expected cash flows of the loans. The difference between the fair value and expected cash flows will be accreted into interest income using a method that approximates a level yield. These loans are recorded at fair value, thus, there is no allowance established at the acquisition date. Subsequent to acquisition, these loans are evaluated and a loan loss provision may be recorded if a decline in value occurs.
Restructured Loans: Restructured loans involve the granting of some concession to the borrower involving a loan modification, such as payment schedule changes, interest rate reductions, or principal charge-offs. A troubled debt restructuring (“TDR”) includes a loan modification where a borrower is experiencing financial difficulty and a concession is granted to that borrower that would not otherwise be considered but for the borrower’s financial difficulties. A TDR may be accrual or nonaccrual status based upon the performance of the borrower and management’s assessment of collectability. A TDR on nonaccrual is returned to accrual after performing in accordance with the modified terms for a sufficient period, generally six months. A loan that is modified at a market rate of interest may no longer be classified as a TDR in the calendar year subsequent to the restructuring if it is in compliance with the modified terms.
| 74 |
BAYLAKE CORP.
NOTES TO CONSOLIDATED FINANCIAL STATEMENTS
December 31, 2015, 2014 and 2013
(Dollar amounts in thousands)
NOTE 1 – NATURE OF BUSINESS AND SUMMARY OF SIGNIFICANT ACCOUNTING POLICIES (Continued)
Allowance for Loan Losses – Originated Loans: The ALL represents management’s estimate of probable and inherent credit losses in the loan portfolio. Estimating the amount of the ALL requires the exercise of significant judgment and the use of estimates related to the amount and timing of expected future cash flows on impaired loans, estimated losses on pools of homogeneous loans based on historical loss experience, and consideration of other qualitative factors such as current economic trends and conditions, all of which may be susceptible to significant change. The loan portfolio also represents the largest asset on the consolidated balance sheets. Loan losses are charged off against the ALL when realized, while recoveries of amounts previously charged off are credited to the ALL. A provision for loan losses (“PFLL”) is charged to operations based on management’s periodic evaluation of the factors previously mentioned, as well as other pertinent factors.
The ALL consists of specific reserves on certain impaired loans and general reserves for non-impaired loans. Specific reserves reflect estimated losses based on regular analyses of all impaired non-homogenous loans. These analyses involve a high degree of judgment in estimating the amount of loss associated with specific loans, including estimating the amount and timing of future cash flows and collateral values. The general reserve is based on the Bank’s historical loss experience which is updated quarterly. The general reserve portion of the ALL also includes consideration of certain qualitative factors such as (1) changes in the nature, volume and terms of loans, (2) changes in lending personnel,(3) changes in the quality of the loan review function, (4) changes in nature and volume of past-due, nonaccrual and/or classified loans, (5) changes in concentration of credit risk, (6) changes in economic and industry conditions, (7) changes in legal and regulatory requirements, (8) unemployment and inflation statistics, and (9) changes in underlying collateral values.
There are many factors affecting the ALL; some are quantitative while others require qualitative judgment. The process for determining the ALL (which management believes adequately considers potential factors which might possibly result in credit losses) includes subjective elements and, therefore, may be susceptible to significant change. To the extent actual outcomes differ from management estimates, additional PFLL could be required that could adversely affect the earnings or financial position in future periods. Allocations of the ALL may be made for specific loans but the entire ALL is available for any loan that, in management’s judgment, should be charged-off or for which an actual loss is realized. As an integral part of their examination process, various regulatory agencies review the ALL as well. Such agencies may require that changes in the ALL be recognized when such regulators’ credit evaluations differ from those of management based on information available to the regulators at the time of their examinations.
Allowance for Loan Losses – Acquired Loans: Performing, acquired loans are periodically evaluated, and, if necessary, a PFLL may be required. For PCI loans, the present value of cash flows are determined and if that value is less than the carrying value, additional PFLL may be required.
Mortgage Servicing Rights: Mortgage servicing rights are recognized separately when they arise through sales of loans with servicing retained. Mortgage servicing rights are initially recorded at fair value with the offsetting effect recorded as a reduction to gain/loss on sale of loans. Changes in fair value are included in “net change in valuation of mortgage servicing rights, net of payments and payoffs,” in the consolidated statements of operations. Subsequent to origination, under the fair value measurement method, the Company measures fair value based on market prices for comparable servicing contracts, when available, or alternatively, based on a valuation model that calculates the present value of estimated future net servicing income. The valuation model incorporates assumptions that market participants would use in estimating future net servicing income, such as the cost to service, the discount rate, prepayment speeds and default rates and losses. The Company compares the valuation model inputs and results to published industry data in order to validate the model results and assumptions. The fair values of mortgage servicing rights are subject to significant fluctuations as a result of changes in estimated and actual prepayment speeds and default rates and losses. Mortgage servicing rights are included in other assets on the consolidated balance sheets.
Loan servicing fee income earned for servicing loans is based on a contractual percentage of the outstanding principal or a fixed amount per loan and is recorded as income when earned. Loan servicing fees totaled $633, $584, and $591 for the years ended December 31, 2015, 2014, and 2013 respectively. Late fees and ancillary fees related to loan servicing are not material.
| 75 |
BAYLAKE CORP.
NOTES TO CONSOLIDATED FINANCIAL STATEMENTS
December 31, 2015, 2014 and 2013
(Dollar amounts in thousands)
NOTE 1 – NATURE OF BUSINESS AND SUMMARY OF SIGNIFICANT ACCOUNTING POLICIES (Continued)
Bank Owned Life Insurance: The Company has purchased life insurance policies on certain key executives. Bank owned life insurance is recorded at the amount that can be realized under the insurance contract at the balance sheet date, which is the net cash surrender value.
Transfers of Financial Assets: Transfers of financial assets are accounted for as sales when control over the assets has been surrendered. Control over transferred assets is deemed to be surrendered when (1) the assets have been isolated from the Company, (2) the transferee obtains the right (free of conditions that constrain it from taking advantage of that right) to pledge or exchange the transferred assets, and (3) the Company does not maintain effective control over the transferred assets through an agreement to repurchase them before their maturity.
Other Real Estate Owned Properties: Assets acquired through or instead of loan foreclosure or bank facilities no longer in use are initially recorded at fair value, less estimated costs to sell, establishing a new cost basis. If the fair value declines subsequent to foreclosure, a valuation allowance is recorded through expense. Costs incurred after acquisition are expensed. These costs include management fees, operating expenses, and valuation write-downs.
Premises and Equipment: Land is carried at cost. Premises and equipment are stated at cost less accumulated depreciation. Buildings and related components are depreciated using the straight-line method with useful lives ranging from 5 to 40 years. Furniture, fixtures, and equipment are depreciated using the straight-line (or accelerated) method with useful lives ranging from 3 to 12 years.
Rabbi Trust: During 2011, the Company established a Rabbi Trust to hold proceeds from the surrender of life insurance policies. The assets of the Rabbi Trust are invested in investment choices identical to the investments selected by eligible participants in the Company’s Supplemental Executive Retirement Plan (“SERP”). This provides an economic hedge to the Company’s liability under the SERP. The Rabbi Trust remains in effect at December 31, 2015 and is included in other assets in the consolidated balance sheets.
Core Deposit Intangible: Core deposit intangible assets represent a premium paid to acquire the core deposits of an institution. The premium is the amount paid in excess of the dollar amount of the deposits acquired and is amortized over the expected life of the deposits. Core deposit intangible assets are subject to impairment valuation at least annually, or whenever events or changes in circumstances indicate that the carrying amount may not be fully recovered.
Goodwill: Goodwill results from business acquisitions and represents the excess of the purchase price over the fair value of acquired tangible and intangible assets. The goodwill recorded represents the excess of market value over book value. The Company’s operations are managed and financial performance is evaluated on a company-wide basis. All of the financial services operations are considered by management to be aggregated as one reportable segment.
During the fourth quarter of 2015, goodwill increased $1.1 million due to the merger with NEWBI and the related acquisition of its branch operations.
U.S. GAAP provides that prior to performing the traditional two-step goodwill impairment test, the Company is permitted to first perform a qualitative assessment about the likelihood of the carrying value of a reporting unit exceeding its fair value, referred to as the “Step 0” assessment. The Step 0 assessment requires the evaluation of certain events and circumstances such as macroeconomic conditions, industry and market considerations, cost factors and overall financial performance, as well as Company items. After performing the Step 0 assessment, should the Company determine that it is more likely than not that the fair value of goodwill is less than its carrying amount, it is required to perform the prescribed two-step goodwill impairment test to identify the potential goodwill impairment and measure the amount of the goodwill impairment loss, if any, to be recognized. However, if the Company concludes otherwise based on the Step 0 assessment, the two-step goodwill impairment test is not required.
| 76 |
BAYLAKE CORP.
NOTES TO CONSOLIDATED FINANCIAL STATEMENTS
December 31, 2015, 2014 and 2013
(Dollar amounts in thousands)
NOTE 1 – NATURE OF BUSINESS AND SUMMARY OF SIGNIFICANT ACCOUNTING POLICIES (Continued)
During 2015, management valued the Company by utilizing the Step 0 qualitative assessment approach in determining whether it is more likely than not that the fair value of the Company is less than its carrying amount, including goodwill. As part of the qualitative assessment approach, the Company assessed the following relevant events and circumstances: macroeconomic conditions, industry and market considerations, overall financial performance, changes in management and management strategy, and changes in the composition or carrying amount of the net assets. In addition, consideration was given to the pending merger with Nicolet as well as the significant difference in fair value compared to the book value of goodwill in 2014. The conclusion of the Step 0 assessment was that it was more likely than not that the fair value of goodwill continued to exceed its carrying value at December 31, 2015. Therefore, a two-step quantitative analysis was not considered necessary.
During 2014, the Company, with the assistance of a third party valuation firm, determined an estimated cash fair value of the Company’s common stock. Consideration was given to the nature and history of the Company, the competitive and economic outlook for the trade area and for the banking industry in general, the book value and financial condition of the Company, the future earnings and dividend paying capacity, the size of the block valued, and the prevailing market prices of bank stocks. The following valuation methodologies were considered: (1) net asset value – defined as the net worth of the Company, (2) market value – defined as the price at which knowledgeable buyers and sellers would agree to buy and sell the Company’s common stock, and (3) investment value – defined as an estimate of the present value of the future benefits, usually earnings, cash flow, or dividends, that will accrue to the Company’s common stock. When consideration was given to the three valuation methodologies, as well as all other relevant valuation variables and factors, the fully-diluted cash fair value range of the Company’s common shares was considered to be in excess of the book value. Because the valuation ranges obtained from that firm exceeded the carrying value including goodwill, step one of the impairment test established under U.S. GAAP was met and, therefore, no goodwill impairment was recognized. If the carrying amount would have exceeded fair value, the Company would have performed the second step to measure the amount of impairment loss.
Long-Term Assets: Premises and equipment, and other long-term assets are reviewed for impairment when events indicate that their carrying amount may not be recoverable from future undiscounted cash flows. If impaired, the assets are recorded at fair value. Management has determined that such assets have not been impaired as of December 31, 2015 and 2014.
Loan Commitments and Related Financial Instruments: Financial instruments include off-balance-sheet credit instruments, such as commitments to make loans and commercial letters of credit, issued to meet customer financing needs. The face amount for these items represents the exposure to loss, before considering customer collateral or ability to repay. Such financial instruments are recorded when they are funded. Instruments, such as standby letters of credit, that are considered financial guarantees in accordance with accounting guidance are recorded at fair value.
Trust Fee Income: The Company provides trust services to customers and in return charges fees using terms customary in its industry, including charging fees based on the agreed-upon percentages of assets managed or as otherwise specified in the underlying agreements. Income from trust services is recognized when the services are provided and included as “fees from fiduciary activities” in the consolidated statements of operations.
Advertising Expense: The Company expenses all advertising costs as they are incurred. Total advertising costs for the years ended December 31, 2015, 2014 and 2013 were $144, $204 and $246, respectively.
Earnings Per Common Share: Basic earnings per common share is net income or loss divided by the weighted average number of common shares outstanding during the period. Diluted earnings per common share include the dilutive effect of additional potential common shares issuable under stock options, stock awards, and convertible promissory notes.
Loss Contingencies: Loss contingencies, including claims and legal actions arising in the ordinary course of business, are recorded as liabilities when the likelihood of loss is probable and an amount or range of loss can be reasonably estimated.
| 77 |
BAYLAKE CORP.
NOTES TO CONSOLIDATED FINANCIAL STATEMENTS
December 31, 2015, 2014 and 2013
(Dollar amounts in thousands, except share and per share data)
NOTE 1 – NATURE OF BUSINESS AND SUMMARY OF SIGNIFICANT ACCOUNTING POLICIES (Continued)
Restrictions on Cash: Cash on hand or on deposit with the Federal Reserve Bank of Chicago (“Reserve Bank”) of $2,314 and $1,652 was required to meet regulatory reserve requirements as of December 31, 2015 and 2014, respectively. These balances earn interest at a rate periodically determined by the Reserve Bank.
Dividend Reinvestment Plan: The Company administers a dividend reinvestment plan (“DRIP”), whereby the Company allocates applicable dividends to acquire, on the participant’s behalf, shares of the Company’s common stock. During 2015, total cash dividends of $3,158 were declared and paid by the Company. Of this amount, $404 was allocated to the DRIP and was used to purchase 30,600 shares in the open market at a weighted average price of $13.15 per share, to fulfill the DRIP plan requirements. No shares were issued by the Company during 2015 in administration of the DRIP.
During 2014, 27,337 shares were purchased in the open market at a weighted average price of $12.90 per share to fulfill the DRIP plan requirements for a total of $351 in dividends.
Operating Segments: While the chief decision makers monitor the revenue streams of the various products and services, the identifiable segments are not material and operations are managed and financial performance is evaluated on a Company-wide basis. Accordingly, all of the financial service operations are considered by management to be aggregated in one reportable operating segment.
Premises Held for Sale: Assets which the Company wishes to dispose of or liquidate through the sale to others. These assets are carried at the lower of cost or fair value and are not depreciated.
Stock-based Compensation: The Company accounts for equity awards by recognizing compensation expense related to the stock-based equity awards over the vesting period. See Note 20 for information on stock-based compensation.
Income Taxes: Deferred income taxes are recognized for the future tax consequences attributable to differences between the financial statement carrying amounts of existing assets and liabilities and their respective tax bases. Deferred tax assets and liabilities are measured using enacted tax rates that will apply to taxable income in the years in which those temporary differences are expected to be recovered or settled. The effect on deferred income tax assets and liabilities of a change in tax rates is recognized as income or expense in the period that includes the enactment date. See Note 18 for details on the Company’s income taxes.
A tax position is recognized as a benefit only if it is “more likely than not” that the tax position would be sustained in a tax examination, with a tax estimation presumed to occur. The amount recognized is the largest amount of tax benefit that is greater than 50% likely to be realized on examination. For tax positions not meeting the “more likely than not” test, no tax benefit is recorded.
The Company regularly reviews the carrying amount of its deferred income tax assets to determine if the establishment of a valuation allowance is necessary. If based on the available evidence it is more likely than not that all or a portion of the Company’s deferred income tax assets will not be realized in future periods, a deferred income tax valuation allowance would be established. Consideration is given to various positive and negative factors that could affect the realization of the deferred income tax assets. In evaluating this available evidence, management considers, among other things, historical financial performance, expectation of future earnings, the ability to carry back losses to recoup taxes previously paid, length of statutory carry forward periods, experience with operating loss and tax credit carry forwards not expiring unused, tax planning strategies and timing of reversals of temporary differences. Significant judgment is required in assessing future earning trends and the timing of reversals of temporary differences. The Company’s evaluation is based on current tax laws as well as management’s expectations of future performance.
| 78 |
BAYLAKE CORP.
NOTES TO CONSOLIDATED FINANCIAL STATEMENTS
December 31, 2015, 2014 and 2013
(Dollar amounts in thousands, except share and per share data)
NOTE 1 – NATURE OF BUSINESS AND SUMMARY OF SIGNIFICANT ACCOUNTING POLICIES (Continued)
The Company is subject to the income tax laws of the U.S., its states and municipalities. These tax laws are complex and subject to different interpretations by the taxpayer and the relevant governmental taxing authorities. The accounting guidance for income taxes prescribes a comprehensive model for how companies should recognize, measure, present, and disclose in their financial statements uncertain tax positions taken or expected to be taken on a tax return. Under the guidance, tax positions shall initially be recognized in the financial statements when it is more likely than not the position will be sustained upon the examination by the tax authorities. Such tax positions shall initially and subsequently be measured as the largest amount of tax benefit that is greater than 50% likely to be realized upon ultimate settlement with the tax authority assuming full knowledge of the position and all relevant facts. Interest and penalties related to income tax expense are recorded as income tax expense, net of federal and state tax benefit, when the amounts can reasonably be determined.
Reclassifications: Certain items previously reported were reclassified to conform to the current presentation.
Recent Accounting Pronouncements:
In January 2016, the Financial Accounting Standards Board (“FASB”) issued Accounting Standard Update (“ASU”) no. 2016-01 Financial Instruments – Overall (Subtopic 825-10): Recognition and Measurement of Financial Assets and Financial Liabilities. The update intends to enhance the reporting model for financial instruments to provide users of financial statements with more decision-useful information and addresses certain aspects of the recognition, measurement, presentation, and disclosure of financial instruments. The new standard affects all entities that hold financial assets or owe financial liabilities. For public business entities, the amendments in this Update are effective for fiscal years beginning after December 15, 2017, including interim periods within those fiscal years. The adoption of this guidance is not expected to have a material impact on the consolidated financial condition, results of operations or liquidity of the Company.
In November 2015, FASB issued ASU no. 2016-01 Income Taxes (Topic 740): Balance Sheet Classification of Deferred Taxes. The update eliminates the requirement to classify deferred tax assets and liabilities as noncurrent or current within a classified statement of financial position. For public business entities, the amendments in this Update are effective for fiscal years beginning after December 15, 2017, including interim periods within those fiscal years. The adoption of this guidance is not expected to have a material impact on the consolidated financial condition, results of operations or liquidity of the Company.
In September 2015, FASB issued ASU no. 2015-16 Business Combinations (Topic 805): Simplifying the Accounting for Measurement-Period Adjustments. The amendments in this update require that an acquirer recognize adjustments to estimated amounts that are identified during the measurement period in the reporting period in which the adjustment amounts are determined. The amendments require that the acquirer record, in the same period’s financial statements, the effect on earnings of changes in depreciation, amortization or other income effects, if any, as a result of the change to the estimated amounts, calculated as if the account had been completed at the acquisition date. The amendments also require an entity to present separately on the face of the income statement or disclose in the notes the portion of the amount recorded in current-period earnings by line item that would have been recorded in previous reporting periods if the adjustment to the estimated amounts had been recognized as of the acquisition date. This guidance is effective for fiscal years, and interim periods within those fiscal years, beginning after December 15, 2015. The adoption of this guidance is not expected to have a material impact on the consolidated financial condition, results of operations or liquidity of the Company.
In August 2015, the FASB issued ASU 2015-03, Interest - Imputation of Interest (Subtopic 835-30): Presentation and Subsequent Measurement of Debt Issuance Costs Associated with Line-of-Credit Arrangements-Amendments to SEC Paragraphs Pursuant to Staff Announcement at June 8, 2015 EITF Meeting (SEC Update). The original ASU (2015-03) issued in April 2015 required that debt issuance costs related to a recognized debt liability be presented in the balance sheet as a direct deduction from the carrying amount of that debt liability, consistent with debt discounts. Given the absence of authoritative guidance within ASU 2015-03 for debt issuance costs related to line-of-credit arrangements, the SEC staff stated that they would not object to an entity deferring and presenting debt issuance costs as an asset and subsequently amortizing those deferred debt issuance costs ratably over the term of the line-of-credit arrangement, regardless of whether there are any outstanding borrowings on the line-of-credit arrangement. This guidance is effective for fiscal years beginning after December 15, 2015 and interim periods with fiscal years beginning after December 15, 2016. A reporting entity may apply the amendments prospectively or retrospectively to all prior periods presented in the financial statements. Early adoption is permitted provided that the guidance is applied from the beginning of the fiscal year of adoption. The adoption of this guidance is not expected to have a material impact on the consolidated financial condition, results of operations or liquidity of the Company.
| 79 |
BAYLAKE CORP.
NOTES TO CONSOLIDATED FINANCIAL STATEMENTS
December 31, 2015, 2014 and 2013
(Dollar amounts in thousands)
NOTE 1 – NATURE OF BUSINESS AND SUMMARY OF SIGNIFICANT ACCOUNTING POLICIES (Continued)
In May 2015, FASB issued ASU No. 2015-08 Business Combinations (Topic 805): Pushdown Accounting – Amendments to SEC Paragraphs Pursuant to Staff Accounting Bulletin No. 115. Amendments in this update amend SEC paragraphs pursuant to Staff Accounting Bulletin (“SAB”) No. 115, which supersedes several paragraphs in ASC 805-50 in response to the SEC’s November 2014 publication of SAB 115.The SEC issued SAB 115 in connection with the release of FASB ASU No. 2014-17, “Pushdown Accounting.” This guidance is effective immediately. The adoption of this guidance did not have a material impact on the consolidated financial condition, results of operations or liquidity of the Company.
In April 2015, FASB issued ASU No. 2015-05 Intangibles - Goodwill and Other Internal-Use Software (Subtopic 350-40). The amendments in this update provide guidance to customers about whether a cloud computing arrangement includes a software license. If a cloud computing arrangement includes a software license, then the customer should account for the software license element of the arrangement consistent with the acquisition of other software licenses. If a cloud computing arrangement does not include a software license, the customer should account for the arrangement as a service contract. The guidance will not change U.S. GAAP for a customer’s accounting for service contracts. In addition, the guidance in this Update supersedes paragraph 350-40-25-16. Consequently, all software licenses within the scope of Subtopic 350-40 will be accounted for consistent with other licenses of intangible assets. This guidance is effective for fiscal years, and interim periods within those fiscal years, beginning after December 15, 2015. The adoption of this guidance is not expected to have a material impact on the consolidated financial condition, results of operations or liquidity of the Company.
In April 2015, the FASB issued ASU No. 2015-04 Compensation - Retirement Benefits (Topic 715). The amendments in this update provide a practical expedient that permits the entity to measure defined benefit plan assets and obligations using the month-end that is closest to the entity’s fiscal year-end and apply that practical expedient consistently from year to year. The amendments in this update also provide a practical expedient that permits the entity to remeasure defined benefit plan assets and obligations using the month-end that is closest to the date of the significant event. This guidance is effective for fiscal years, and interim periods within those fiscal years, beginning after December 15, 2015. The adoption of this guidance is not expected to have a material impact on the consolidated financial condition, results of operations or liquidity of the Company.
In February 2015, the FASB issued ASU No. 2015-02 Consolidation (Topic 810): Amendments to the Consolidation Analysis. The amendments in this update rescind the indefinite deferral of FASB Statement No. 167, Amendments to FASB Interpretation No. 46(R), included in FASB Accounting Standards Update No. 2010-10, Consolidation (Topic 810): Amendments for Certain Investment Funds. However, the amendments in this update provide a scope exception from Topic 810 for reporting entities with interests in legal entities that are required to comply with or operate in accordance with requirements similar to those in Rule 2a-7 of the Investment Company Act of 1940 for registered money market funds. This guidance is effective for fiscal years, and interim periods within those fiscal years, beginning after December 15, 2015. The adoption of this guidance is not expected to have a material impact on the consolidated financial condition, results of operations or liquidity of the Company.
In January 2015, FASB issued ASU No. 2015-01 Income Statement - Extraordinary and Unusual Items (Subtopic 225-20): Simplifying Income Statement Presentation by Eliminating the Concept of Extraordinary Items. The amendment eliminates from U.S. GAAP the concept of extraordinary items. Subtopic 225-20, Income Statement – Extraordinary and Unusual Items, required that an entity separately classify, present, and disclose extraordinary events and transactions. Presently, an event or transaction is presumed to be an ordinary and usual activity of the reporting entity unless evidence clearly supports its classification as an extraordinary item. If an event or transaction meets the criteria for extraordinary classification, an entity is required to segregate the extraordinary item from the results of ordinary operations and show the item separately in the income statement, net of tax, after income from continuing operations. The entity also is required to disclose applicable income taxes and either present or disclose earnings-per-share data applicable to the extraordinary item. This guidance is effective for fiscal years, and interim periods within those fiscal years, beginning after December 15, 2015. A reporting entity may apply the amendments prospectively or retrospectively to all prior periods presented in the financial statements. Early adoption is permitted provided that the guidance is applied from the beginning of the fiscal year of adoption. The adoption of this guidance is not expected to have a material impact on the consolidated financial condition, results of operations or liquidity of the Company.
| 80 |
BAYLAKE CORP.
NOTES TO CONSOLIDATED FINANCIAL STATEMENTS
December 31, 2015, 2014 and 2013
(Dollar amounts in thousands)
NOTE 2 – ACQUISITION
Effective December 4, 2015, the Company completed its acquisition of NEWBI pursuant to the Agreement and Plan of Merger dated May 4, 2015 (the “NEWBI Merger Agreement”), whereby NEWBI was merged with and into the Company, and Union was merged with and into the Bank. The system integration was completed in December 2015. Three of Union’s branches located in Kewaunee, Manitowoc and Brown Counties opened on December 7, 2015 as the Bank and the remaining branch which previously served as the main office for Union was closed. Deposits and loans relating to this branch were consolidated with the Bank’s existing branch in Kewaunee County. The branch facility was transferred to other real estate owned subsequent to the acquisition.
The cash-and-stock transaction was valued at approximately $9.9 million, with 41.3% of the consideration paid through the issuance of 285,905 shares of the Company’s common stock. The number of shares of Company common stock issued in connection with the transaction was based on the Company’s average trading price of $14.33 per share. As provided for in the NEWBI Merger Agreement, the average trading price was determined by taking the average daily high and low sale price of Company common stock on the NASDAQ Stock Market LLC for 10 trading days ending on and including December 2, 2015. Cash consideration of $5.8 million was also paid in connection with the transaction.
The transaction was accounted for under the acquisition method of accounting requiring assets and liabilities to be recorded at their respective fair values at the date of acquisition. Since the value of liabilities exceeded the value of assets, goodwill was recorded. The Company has one year from the date of the acquisition to make adjustments related to the transaction based on new or updated information. As part of the valuation process, the Company used an unrelated third party valuation expert to determine a value of the core deposit intangible.
The fair value of the assets acquired and liabilities assumed on December 4, 2015 was as follows:
| As
recorded by NEWBI |
Fair
Value Adjustments |
As
recorded by Baylake |
|||||||
| Cash and cash equivalents | $ | 1,812 | $ | 244 | $ | 2,056 | |||
| Fed funds sold(1) | 755 | — | 755 | ||||||
| Investment securities(1) | 23,824 | 11 | 23,835 | ||||||
| Loans, net of participations | 47,267 | (656) | 46,611 | ||||||
| Allowance for loan losses | (687) | 687 | — | ||||||
| Other Real Estate Owned | 265 | (118) | 147 | ||||||
| Premises and equipment | 964 | (109) | 855 | ||||||
| Core deposit intangible | — | 1,365 | 1,365 | ||||||
| Other assets | 1,899 | 142 | 2,041 | ||||||
| Total assets acquired | $ | 76,099 | $ | 1,566 | $ | 77,665 | |||
| Deposits | $ | 68,242 | $ | 214 | $ | 68,456 | |||
| Other liabilities | 171 | 266 | 437 | ||||||
| Total liabilities assumed | $ | 68,413 | $ | 480 | $ | 68,893 | |||
| Excess of assets acquired over liabilities assumed | 8,772 | ||||||||
| Less: purchase price | 9,910 | ||||||||
| Goodwill | $ | (1,138) | |||||||
(1) These assets were merged with the Bank’s wholly-owned Nevada subsidiary, Bay Lake Investments, Inc.
Loans acquired in this transaction were recorded at their estimated fair value at the acquisition date. When a determination was made at acquisition that the Company will be unable to collect all contractually required payments from the borrower under a loan agreement, the loan was identified as a PCI loan. Based on an evaluation of collateral and source of repayment, a credit discount was determined. The amount of the credit discount is a nonaccretable mark that is not recorded to the ALL. Credit deterioration subsequent to the acquisition will be charged to the ALL.
| 81 |
BAYLAKE CORP.
NOTES TO CONSOLIDATED FINANCIAL STATEMENTS
December 31, 2015, 2014 and 2013
(Dollar amounts in thousands)
NOTE 2 – ACQUISITION (Continued)
At acquisition, $1,707 of loans were identified as PCI loans and credit discounts of $828 were recorded. The remaining balance of $879 of such loans was recorded as an asset in which full repayment is expected over the remaining term of the loan.
All other loans that are not PCI loans (“Non-PCI loans”) are measured at fair value based on the expected cash flows of the loans. The difference between the fair value and expected cash flows will be accreted into interest income using a method that approximates a level yield. Since these loans are recorded at fair value, there is no allowance established at the acquisition date. Subsequent to acquisition, these loans are evaluated and a loan loss provision may be recorded if a decline in value occurs.
At acquisition, $46,227 of loans were identified as Non-PCI loans and a fair value of $45,713 was recorded. The difference of $514 will be accreted into interest income under the level yield method over the next several years.
NOTE 3 – FAIR VALUE INFORMATION
Accounting guidance establishes a fair value hierarchy which requires an entity to maximize the use of observable inputs and minimize the use of unobservable inputs when measuring fair value. The guidance describes three levels of inputs that may be used to measure fair value:
| Level 1: | Quoted prices (unadjusted) for identical assets or liabilities in active markets that the entity has the ability to access as of the measurement date. |
| Level 2: | Significant other observable inputs other than Level 1 prices such as quoted prices for similar assets or liabilities; quoted prices in markets that are not active; or other inputs that are observable or can be corroborated by observable market data. |
| Level 3: | Significant unobservable inputs that reflect a reporting entity’s own assumptions about the assumptions that market participants would use in pricing an asset or liability. |
A financial instrument’s categorization within the valuation hierarchy is based upon the lowest level of input within the valuation hierarchy that is significant to the fair value measurement.
The methods and assumptions used to estimate fair value are described below.
Securities available for sale - the fair value of securities available for sale is determined by obtaining quoted prices on nationally recognized securities exchanges (Level 1 inputs) or matrix pricing, which is a mathematical technique widely used in the industry to value debt securities without relying exclusively on quoted prices for the specific securities but rather by relying on the securities’ relationship to other benchmark quoted securities (Level 2 inputs). For other securities not able to be priced on matrix pricing, outside third parties are relied upon (Level 3 inputs). Only one of the Company’s securities available for sale at each of December 31, 2015 and 2014 was measured using Level 3 inputs.
Non-impaired loans and deposits - the fair value of fixed rate non-impaired loans and deposits and non-impaired variable rate loans and deposits with infrequent repricing or repricing limits is based on discounted cash flows using current market rates applied to the estimated life and credit risk (Level 3 inputs). Fair value of loans held for sale is based on market quotes for individual, specific loans (Level 1 inputs).
Impaired loans - the fair value of impaired loans is based on a review of comparable collateral in similar marketplaces (Level 3 inputs) or an analysis of expected cash flows of the loan in relationship to the contractual terms of the loan (Level 3 inputs). Impaired loans are carried at the lower of amortized cost or fair value less estimated costs to sell. Impaired loans are not carried at fair value if there is sufficient collateral or if expected repayments exceed the recorded investments of such loans.
| 82 |
BAYLAKE CORP.
NOTES TO CONSOLIDATED FINANCIAL STATEMENTS
December 31, 2015, 2014 and 2013
(Dollar amounts in thousands)
NOTE 3 – FAIR VALUE INFORMATION (Continued)
Mortgage servicing rights - the fair value of mortgage servicing rights is based on a valuation model that calculates the present value of estimated net servicing income. The valuation model incorporates assumptions that market participants would use in estimating future net servicing income. These assumptions include servicing costs, expected loan lives, discount rates, and the determination of whether the loan is likely to be refinanced. The Company compares the valuation model inputs and results to published industry data for reasonableness (Level 2 inputs).
Other real estate owned - the fair value of other real estate owned is determined using a variety of market information including, but not limited to, appraisals, professional market assessments, and real estate tax assessment information. Properties obtained by the Bank in foreclosure are adjusted to fair value less estimated costs to sell upon their transfer to other real estate owned, establishing a new cost basis. Subsequently, other real estate owned is carried at the lower of cost or fair value less estimated costs to sell (Level 3 inputs).
Premises held for sale – premises held for sale are carried at the lower of cost or fair value less estimated costs to sell. The fair value is determined using a variety of market information including but not limited to, appraisals, professional market assessments, and accepted offers to sell.
Convertible promissory notes – the fair value of convertible promissory notes is based on current rates for similar financing arrangements (Level 3 inputs).
ASSETS MEASURED ON A RECURRING BASIS
| December 31, 2015 | Quoted
Prices in Active Markets For Identical Assets (Level 1) | Significant
Other Observable Inputs (Level 2) | Significant
Unobservable Inputs (Level 3) | |||||||||||||
| Assets: | ||||||||||||||||
| Securities available for sale: | ||||||||||||||||
| U.S. government sponsored agency securities | $ | 5,721 | $ | — | $ | 5,721 | $ | — | ||||||||
| Mortgage-backed securities | 90,260 | — | 90,164 | 96 | ||||||||||||
| Obligations of states and political subdivisions | 69,457 | — | 69,457 | — | ||||||||||||
| Private placement and corporate bonds | 3,535 | — | 3,535 | — | ||||||||||||
| Other securities | 3,635 | — | 3,635 | — | ||||||||||||
| Total securities available for sale | 172,608 | — | 172,512 | 96 | ||||||||||||
| Mortgage servicing rights | 1,115 | — | 1,115 | — | ||||||||||||
| Total | $ | 173,723 | $ | — | $ | 173,627 | $ | 96 | ||||||||
| December 31, 2014 | Quoted
Prices in Active Markets For Identical Assets (Level 1) | Significant
Other Observable Inputs (Level 2) | Significant
Unobservable Inputs (Level 3) | |||||||||||||
| Assets: | ||||||||||||||||
| Securities available for sale: | ||||||||||||||||
| U.S. government sponsored agency securities | $ | 2,747 | $ | — | $ | 2,747 | $ | — | ||||||||
| Mortgage backed securities | 115,714 | — | 115,460 | 254 | ||||||||||||
| Obligations of states and political subdivisions | 59,002 | — | 59,002 | — | ||||||||||||
| Private placement and corporate bonds | 3,544 | — | 3,544 | — | ||||||||||||
| Other securities | 1,905 | — | 1,905 | — | ||||||||||||
| Total securities available for sale | 182,912 | — | 182,658 | 254 | ||||||||||||
| Mortgage servicing rights | 841 | — | 841 | — | ||||||||||||
| Total | $ | 183,753 | $ | — | $ | 183,499 | $ | 254 | ||||||||
| 83 |
BAYLAKE CORP.
NOTES TO CONSOLIDATED FINANCIAL STATEMENTS
December 31, 2015, 2014 and 2013
(Dollar amounts in thousands)
NOTE 3 – FAIR VALUE INFORMATION (Continued)
The following table presents additional information about Level 3 assets measured at fair value on a recurring basis:
| December
31, 2015 | December
31, 2014 | |||||||
| Balance, beginning of period | $ | 254 | $ | 482 | ||||
| Other comprehensive gain (loss) | 5 | (28 | ) | |||||
| Principal payments | (163 | ) | (200 | ) | ||||
| Balance, end of period | $ | 96 | $ | 254 | ||||
Fair value of Level 3 assets measured on a recurring basis is determined by obtaining multiple price estimates on each Level 3 asset from organizations experienced in the securities industry with specific knowledge of the assets.
Assets measured at fair value on a non-recurring basis are summarized below:
ASSETS MEASURED ON A NON-RECURRING BASIS
| December 31, 2015 | Quoted
Prices in Active Markets For Identical Assets (Level 1) | Significant
Other Observable Inputs (Level 2) | Significant
Unobservable Inputs (Level 3) | |||||||||||||
| Assets: | ||||||||||||||||
| Impaired loans with allocated allowance | $ | 241 | $ | — | $ | — | $ | 241 | ||||||||
| Premises held for sale | 2,104 | — | — | 2,104 | ||||||||||||
| Other real estate owned, net | 3,710 | — | — | 3,710 | ||||||||||||
| Total | $ | 6,055 | $ | — | $ | — | $ | 6,055 | ||||||||
| December 31, 2014 | Quoted
Prices in Active Markets For Identical Assets (Level 1) | Significant
Other Observable Inputs (Level 2) | Significant
Unobservable Inputs (Level 3) | |||||||||||||
| Assets: | ||||||||||||||||
| Impaired loans with allocated allowance | $ | 1,451 | $ | — | $ | — | $ | 1,451 | ||||||||
| Premises held for sale | 844 | — | — | 844 | ||||||||||||
| Other real estate owned, net | 4,266 | — | — | 4,266 | ||||||||||||
| Total | $ | 6,561 | $ | — | $ | — | $ | 6,561 | ||||||||
Fair value of other real estate owned is determined on a non-recurring basis based on evaluation of the underlying collateral, net of estimated costs of disposal.
Required Financial Disclosures about Fair Value of Financial Instruments
The accounting guidance for financial instruments requires disclosures of estimated fair value of certain financial instruments and the methods and significant assumptions used to estimate their fair values. Certain financial instruments and all nonfinancial instruments are excluded from the scope of this guidance. Accordingly, the fair value disclosures required by this guidance are only indicative of the value of individual financial instruments as of the dates indicated and should not be considered an indication of the Company’s fair value.
| 84 |
BAYLAKE CORP.
NOTES TO CONSOLIDATED FINANCIAL STATEMENTS
December 31, 2015, 2014 and 2013
(Dollar amounts in thousands)
NOTE 3 – FAIR VALUE INFORMATION (Continued)
The following table presents the carrying amount and estimated fair value of certain financial instruments:
| December 31, | ||||||||||||||||||||||||
| 2015 | 2014 | |||||||||||||||||||||||
| Carrying
Amount | Fair Value | Fair
Value Level | Carrying
Amount | Fair Value | Fair
Value Level | |||||||||||||||||||
| Financial assets | ||||||||||||||||||||||||
| Cash and due from financial institutions | $ | 70,458 | $ | 70,458 | 1 | $ | 60,189 | $ | 60,189 | 1 | ||||||||||||||
| Federal funds sold | 1,333 | 1,333 | 2 | 1,176 | 1,176 | 2 | ||||||||||||||||||
| Securities held to maturity | 25,487 | 26,119 | 2 | 25,612 | 26,181 | 2 | ||||||||||||||||||
| Securities available for sale | 172,608 | 172,608 | 2,3 | 182,912 | 182,912 | 2,3 | ||||||||||||||||||
| Loans held for sale | 2,804 | 2,849 | 1 | 1,290 | 1,314 | 1 | ||||||||||||||||||
| Loans, net | 737,453 | 736,064 | 2,3 | 672,306 | 675,481 | 2,3 | ||||||||||||||||||
| Federal Home Loan Bank stock | 4,462 | 4,462 | 2 | 4,238 | 4,238 | 2 | ||||||||||||||||||
| Mortgage servicing rights | 1,115 | 1,115 | 2 | 841 | 841 | 2 | ||||||||||||||||||
| Premises held for sale | 2,104 | 2,104 | 3 | 844 | 844 | 3 | ||||||||||||||||||
| Other real estate owned, net | 3,710 | 3,710 | 3 | 4,266 | 4,266 | 3 | ||||||||||||||||||
| Accrued interest receivable | 2,869 | 2,869 | 2 | 2,559 | 2,559 | 2 | ||||||||||||||||||
| Financial liabilities | ||||||||||||||||||||||||
| Deposits | $ | 866,195 | $ | 865,601 | 2 | $ | 765,542 | $ | 765,370 | 2 | ||||||||||||||
| Repurchase agreements | 48,127 | 48,127 | 2 | 64,869 | 64,869 | 2 | ||||||||||||||||||
| Federal Home Loan Bank advances and other borrowings | 41,595 | 42,002 | 2 | 60,455 | 60,475 | 2 | ||||||||||||||||||
| Subordinated debentures | 16,100 | 16,100 | 2 | 16,100 | 16,100 | 2 | ||||||||||||||||||
| Convertible promissory notes | — | — | — | 1,650 | 1,642 | 3 | ||||||||||||||||||
| Accrued interest payable | 289 | 289 | 2 | 283 | 283 | 2 | ||||||||||||||||||
The methods and assumptions that were used to estimate the fair value of financial assets and financial liabilities that are measured at fair value on a recurring and non-recurring basis have been previously disclosed. The following methods and assumptions were used to estimate the fair value of other financial instruments for which it is practicable to estimate that value:
(a) Cash and due from financial institutions
The carrying amount of cash approximates fair value.
(b) Federal Funds Sold
The carrying amount of federal funds sold approximates fair value.
(c) Securities Held to Maturity and Available for Sale
The fair value of securities held to maturity and securities available for sale is based on quoted prices in active markets, or if quoted prices are not available for a specific security, then fair values are estimated by using pricing models, quoted prices of securities with similar characteristics or discounted cash flows.
(d) Loans Held for Sale
Loans held for sale, which generally consist
of the current production of first-lien residential mortgage loans, are carried at the lower of cost or estimated fair value. Fair
value is estimated based on actual market quotes from investors in the secondary market.
| 85 |
BAYLAKE
CORP.
NOTES TO CONSOLIDATED FINANCIAL STATEMENTS
December 31, 2015, 2014 and 2013
(Dollar amounts in thousands)
NOTE 3 – FAIR VALUE INFORMATION (Continued)
| (e) | Loans, net |
The fair value of fixed and variable rate, non-impaired loans are based on discounted cash flows using current market interest rates applied to the estimated life of the loan. The fair value of impaired loans is based on an individual review of comparable collateral in similar marketplaces or analysis of expected cash flows of the loan in relationship.
| (f) | Federal Home Loan Bank Stock |
It is not practical to determine the fair value of Federal Home Loan Bank (“FHLB”) stock due to restrictions placed on its transferability. No secondary market exists for FHLB stock. The stock is bought and sold at par by the FHLB. Management believes that the recorded value is representative of fair value.
| (g) | Mortgage Servicing Rights |
Mortgage servicing rights are carried at fair value based on valuation model that calculates the present value of estimated net servicing income based on assumptions that market participants would use in valuing future estimated servicing income.
| (h) | Premises Held for Sale |
Premises held for sale are carried at the lower of cost or fair value less estimated costs to sell. Fair value is determined using a variety of market information including, but not limited to, appraisals, professional market assessments, and real estate tax assessments.
| (i) | Other Real Estate Owned |
Other real estate owned is carried at the lower of cost or fair value less estimated costs to sell. Fair value is determined using a variety of market information including, but not limited to, appraisals, professional market assessments, and real estate tax assessments.
| (j) | Accrued Interest Receivable |
The carrying amount of accrued interest receivable approximates fair value.
| (k) | Deposits |
The carrying amount of demand deposits (interest-bearing and noninterest-bearing), savings deposits, and money market deposits approximates fair value. The carrying amount of variable rate time deposits, including certificates of deposit (“CDs”), approximates fair value. For fixed rate time deposits, fair value is based on discounted cash flows using current market interest rates. Time deposits include both CDs and individual retirement accounts.
| (l) | Repurchase Agreements |
The carrying amount of repurchase agreements approximates fair value.
| (m) | Federal Home Loan Bank Advances |
The carrying amount of variable rate FHLB advances approximates fair value. For fixed rate advances, fair value is based on discounted cash flows using current market interest rates.
| (n) | Subordinated Debentures |
The carrying amount of variable rate subordinated debentures approximates fair value.
| 86 |
BAYLAKE
CORP.
NOTES TO CONSOLIDATED FINANCIAL STATEMENTS
December 31, 2015, 2014 and 2013
(Dollar amounts in thousands)
NOTE 3 – FAIR VALUE INFORMATION (Continued)
| (o) | Convertible Promissory Notes |
Fair value of convertible promissory notes is based on current market rates for financing arrangements with similar terms.
| (p) | Accrued Interest Payable |
The carrying amount of accrued interest payable approximates fair value.
NOTE 4 - SECURITIES
The fair value of securities available for sale, the fair value of securities held to maturity and the related unrealized gains and losses as of December 31, 2015 and 2014 are as follows:
| 2015 | ||||||||||||
| Fair Value | Gross
Unrealized Gains | Gross
Unrealized Losses | ||||||||||
| Securities Available for Sale (“AFS”): | ||||||||||||
| U.S. government sponsored agency securities | $ | 5,721 | $ | 34 | $ | (6 | ) | |||||
| Obligations of states and political subdivisions | 69,457 | 1,512 | (35 | ) | ||||||||
| Mortgage-backed securities | 90,260 | 1,153 | (668 | ) | ||||||||
| Private placement and corporate bonds | 3,535 | 16 | — | |||||||||
| Other securities | 3,635 | — | (9 | ) | ||||||||
| Total AFS Securities | $ | 172,608 | $ | 2,715 | $ | (718 | ) | |||||
| Securities Held to Maturity (“HTM”): | ||||||||||||
| Mortgage-backed securities | $ | 20,944 | $ | 457 | $ | — | ||||||
| Private placement and corporate bonds | 5,175 | 175 | — | |||||||||
| Total HTM Securities | $ | 26,119 | $ | 632 | $ | — | ||||||
| Total Securities | $ | 198,727 | $ | 3,347 | $ | (718 | ) | |||||
| 2014 | ||||||||||||
| Fair Value | Gross
Unrealized Gains | Gross
Unrealized Losses | ||||||||||
| Securities Available for Sale (“AFS”): | ||||||||||||
| U.S. government sponsored agency securities | $ | 2,747 | $ | — | $ | (4 | ) | |||||
| Obligations of states and political subdivisions | 59,002 | 2,027 | (57 | ) | ||||||||
| Mortgage-backed securities | 115,714 | 2,492 | (640 | ) | ||||||||
| Private placement and corporate bonds | 3,544 | 24 | — | |||||||||
| Other securities | 1,905 | — | — | |||||||||
| Total AFS Securities | $ | 182,912 | $ | 4,543 | $ | (701 | ) | |||||
| Securities Held to Maturity (“HTM”): | ||||||||||||
| Mortgage-backed securities | $ | 21,131 | $ | 519 | $ | — | ||||||
| Private placement and corporate bonds | 5,050 | 50 | — | |||||||||
| Total HTM Securities | $ | 26,181 | $ | 569 | $ | — | ||||||
| Total Securities | $ | 209,093 | $ | 5,112 | $ | (701 | ) | |||||
Other securities consist of short-term money market mutual funds, certificates of deposit in other financial institutions, equity securities in the Federal Reserve Bank and other nonmarketable equity securities, which are carried at cost and believed to be an approximate fair value.
| 87 |
BAYLAKE
CORP.
NOTES TO CONSOLIDATED FINANCIAL STATEMENTS
December 31, 2015, 2014 and 2013
(Dollar amounts in thousands)
NOTE 4 - SECURITIES (Continued)
A summary of sales of securities available for sale during the year ended December 31 is as follows:
| 2015 | 2014 | 2013 | ||||||||||
| Proceeds | $ | 13,911 | $ | 15,879 | $ | 6,406 | ||||||
| Gross realized gains | 472 | 488 | 574 | |||||||||
| Gross realized losses | 7 | 42 | — | |||||||||
The estimated fair value of securities at December 31, 2015, by contractual maturity, is shown below. Expected maturities will differ from contractual maturities on other equity securities, mortgage-backed securities and asset-backed securities because borrowers may have the right to call or prepay obligations with or without call or prepayment penalties.
| AFS
Estimated Fair Value | HTM
Estimated Fair Value | |||||||
| Due in one year or less | $ | 9,459 | $ | — | ||||
| Due after one year through five years | 27,828 | 5,175 | ||||||
| Due after five years through ten years | 34,691 | — | ||||||
| Due after ten years | 6,735 | — | ||||||
| 78,713 | 5,175 | |||||||
| Other securities | 3,635 | — | ||||||
| Mortgage-backed securities | 90,260 | 20,944 | ||||||
| $ | 172,608 | $ | 26,119 | |||||
Securities pledged to secure public deposits, customer repurchase balances and borrowed funds had a carrying value of $85,468 and $138,262 at December 31, 2015 and 2014, respectively.
Securities with unrealized losses at December 31, 2015, aggregated by investment category and length of time that individual securities have been in a continuous unrealized loss position, are as follows:
| Less than 12 Months | 12 Months or More | Total | ||||||||||||||||||||||
| Description of Securities |
Fair Value | Unrealized
Loss | Fair Value | Unrealized
Loss | Fair Value | Unrealized
Loss | ||||||||||||||||||
| 2015 | ||||||||||||||||||||||||
| U.S. government sponsored agency securities | $ | 3,465 | $ | (6 | ) | $ | — | $ | — | $ | 3,465 | $ | (6 | ) | ||||||||||
| Obligations of states and political subdivisions | 5,168 | (20 | ) | 1,057 | (15 | ) | 6,225 | (35 | ) | |||||||||||||||
| Mortgage-backed securities | 32,631 | (203 | ) | 14,774 | (465 | ) | 47,405 | (668 | ) | |||||||||||||||
| Other securities | 1,727 | (9 | ) | — | — | 1,727 | (9 | ) | ||||||||||||||||
| Total temporarily impaired | $ | 42,991 | $ | (238 | ) | $ | 15,831 | $ | (480 | ) | $ | 58,822 | $ | (718 | ) | |||||||||
| 88 |
BAYLAKE
CORP.
NOTES TO CONSOLIDATED FINANCIAL STATEMENTS
December 31, 2015, 2014 and 2013
(Dollar amounts in thousands)
NOTE 4 - SECURITIES (Continued)
Securities with unrealized losses at December 31, 2014, aggregated by investment category and length of time that individual securities have been in a continuous unrealized loss position, are as follows:
| Less than 12 Months | 12 Months or More | Total | ||||||||||||||||||||||
| Description of Securities | Fair Value | Unrealized Loss | Fair Value | Unrealized
Loss | Fair Value | Unrealized
Loss | ||||||||||||||||||
| 2014 | ||||||||||||||||||||||||
| U.S. government sponsored agency securities | $ | — | $ | — | $ | 2,747 | $ | (4 | ) | $ | 2,747 | $ | (4 | ) | ||||||||||
| Obligations of states and political subdivisions | 857 | (4 | ) | 2,935 | (53 | ) | 3,792 | (57 | ) | |||||||||||||||
| Mortgage-backed securities | 2,689 | (6 | ) | 30,216 | (634 | ) | 32,905 | (640 | ) | |||||||||||||||
| Total temporarily impaired | $ | 3,546 | $ | (10 | ) | $ | 35,898 | $ | (691 | ) | $ | 39,444 | $ | (701 | ) | |||||||||
At December 31, 2015, the obligations of states and political subdivisions category with continuous unrealized losses for twelve months or more compromised three securities. The mortgage-backed securities category with continuous unrealized losses for twelve months or more compromised nine securities.
At December 31, 2014, the U.S. government sponsored agency securities category with continuous unrealized losses for twelve months or more comprised one security. The obligations of states and political subdivisions category with continuous unrealized losses for twelve months or more comprised ten securities. The mortgage-backed securities category with continuous unrealized losses for twelve months or more comprised thirteen securities.
Management evaluates securities for other-than-temporary impairment at least on a quarterly basis, and more frequently when economic or market concerns warrant such evaluation to determine the Company’s exposure to other–than-temporary impairment. This evaluation takes into consideration numerous factors and the relative significance of any single factor can vary by security. Factors that may be considered include the length of time and extent to which a security has been in a loss position, changes in security ratings, financial condition of the security issuer, payment structure of the security, value of collateral underlying the security and general economic conditions that might have potential impact on the value of the security. Based on this evaluation, management does not believe that any unrealized loss at December 31, 2015 or 2014 represents an other-than-temporary impairment and the unrealized losses indicated are attributable to changes in the interest rate environment and market conditions at those dates rather than credit deterioration. Further, the Company does not intend to sell, nor does it believe that it will be required to sell the securities before recovery of the amortized cost basis.
At December 31, 2015 and 2014 the fair value of the mortgage-backed securities portfolio was $111,204 (56.0%) and $136,845 (65.4%), respectively, of the investment portfolio. Approximately 2.6% or $2,840, of the mortgage-backed securities outstanding at December 31, 2015 were issued and guaranteed by the Government National Mortgage Association (“GNMA”), an agency of the United States government. An additional 94.6%, or $105,234, of the mortgage-backed securities outstanding were issued by the Federal National Mortgage Association (“FNMA”), the Federal Home Loan Mortgage Corporation (“FHLMC”), or the Federal Home Loan Bank (“FHLB”); United States government-sponsored agencies. Non-agency mortgage-backed securities present a level of credit risk that does not exist currently with United States government agency-backed securities, but only comprise approximately 2.8%, or $3,130, of the outstanding mortgage-backed securities at December 31, 2015. Management evaluates these non-agency mortgage-backed securities at least quarterly and more frequently when economic or market concerns warrant such evaluation.
| 89 |
BAYLAKE
CORP.
NOTES TO CONSOLIDATED FINANCIAL STATEMENTS
December 31, 2015, 2014 and 2013
(Dollar amounts in thousands)
NOTE 5 - LOANS
Major classifications of loans as of December 31, 2015 and 2014 are as follows:
| 2015 | 2014 | |||||||
| Commercial-syndicated | $ | 64,585 | $ | 65,429 | ||||
| Commercial-other | 107,447 | 88,045 | ||||||
| Real estate: | ||||||||
| Residential | 178,784 | 152,091 | ||||||
| Commercial | 318,324 | 304,446 | ||||||
| Construction | 43,760 | 40,808 | ||||||
| Consumer | 8,622 | 6,075 | ||||||
| Tax exempt | 22,355 | 22,964 | ||||||
| Total | 743,877 | 679,858 | ||||||
| Less: | ||||||||
| Deferred loan origination fees, net of costs | (496 | ) | (501 | ) | ||||
| Allowance for loan losses | (5,928 | ) | (7,051 | ) | ||||
| Loans, net | $ | 737,453 | $ | 672,306 | ||||
Loans having a carrying value of $168,920 and $142,049 are pledged as collateral for borrowings from the FHLB at December 31, 2015 and 2014, respectively.
Major classification of loans as of December 31, 2015 are summarized as originated and acquired as follows:
| Originated | Acquired | Total | ||||||||||
| Commercial-syndicated | $ | 64,585 | $ | — | $ | 64,585 | ||||||
| Commercial-other | 103,012 | 4,435 | 107,447 | |||||||||
| Real estate: | ||||||||||||
| Residential | 154,490 | 24,294 | 178,784 | |||||||||
| Commercial | 306,021 | 12,303 | 318,324 | |||||||||
| Construction | 41,339 | 2,421 | 43,760 | |||||||||
| Consumer | 5,431 | 3,191 | 8,622 | |||||||||
| Tax exempt | 22,248 | 107 | 22,355 | |||||||||
| Total | 697,126 | 46,751 | 743,877 | |||||||||
| Less: | ||||||||||||
| Deferred loan origination fees, net of costs | (496 | ) | — | (496 | ) | |||||||
| Allowance for loan losses | (5,928 | ) | — | (5,928 | ) | |||||||
| Loans, net | $ | 690,702 | $ | 46,751 | $ | 737,453 | ||||||
Certain directors and officers of the Company and the Bank, including their immediate families, companies in which they are principal owners, and trusts in which they are involved, are considered related parties and were loan customers of the Bank during 2015 and 2014.
| 90 |
BAYLAKE
CORP.
NOTES TO CONSOLIDATED FINANCIAL STATEMENTS
December 31, 2015, 2014 and 2013
(Dollar amounts in thousands)
NOTE 5 - LOANS (Continued)
A summary of the changes in related party loans is as follows:
| For
the year ended December 31, | ||||||||
| 2015 | 2014 | |||||||
| Balance at beginning of year | $ | 7,097 | $ | 6,186 | ||||
| New loans made | 3,225 | 3,852 | ||||||
| Repayments received | (3,630 | ) | (2,676 | ) | ||||
| Reclassification for loans related to new/former officers and directors | (2,575 | ) | (265 | ) | ||||
| Balance at end of year | $ | 4,117 | $ | 7,097 | ||||
Changes in the allowance for loan losses were as follows:
| For the year ended December 31, | ||||||||||||
| 2015 | 2014 | 2013 | ||||||||||
| Balance at beginning of year | $ | 7,051 | $ | 7,658 | $ | 9,165 | ||||||
| Provision charge to operations | 200 | — | 1,400 | |||||||||
| Recoveries | 494 | 676 | 683 | |||||||||
| Loans charged off | (1,817 | ) | (1,283 | ) | (3,590 | ) | ||||||
| Balance at end of year | $ | 5,928 | $ | 7,051 | $ | 7,658 | ||||||
Information regarding impaired loans is as follows:
| December 31, | ||||||||
| 2015 | 2014 | |||||||
| Impaired loans with no allocated allowance for loan loss | $ | 9,373 | $ | 10,999 | ||||
| Impaired loans with allocated allowance for loan loss | 324 | 2,812 | ||||||
| Allowance allocated to impaired loans | 83 | 1,361 | ||||||
| For the year ended December 31, | ||||||||||||
| 2015 | 2014 | 2013 | ||||||||||
| Average impaired loans during the period | $ | 10,142 | $ | 14,202 | $ | 14,914 | ||||||
| Interest income recognized during impairment | 309 | 356 | 329 | |||||||||
| Cash-basis interest income recognized | 1 | 20 | — | |||||||||
Nonperforming and restructured loans were as follows:
| December 31, | ||||||||
| 2015 | 2014 | |||||||
| Loans past due over 90 days still on accrual | $ | — | $ | — | ||||
| Loans restructured in a troubled debt restructuring non-accruing | — | — | ||||||
| Nonaccrual loans, originated | 1,339 | 5,155 | ||||||
| Nonaccrual loans, acquired | 879 | — | ||||||
| Total nonperforming loans | $ | 2,218 | $ | 5,155 | ||||
| Restructured, originated loans, accruing interest | $ | 8,357 | $ | 8,656 | ||||
| Restructured, acquired loans, accruing interest | — | — | ||||||
| Total restructured loans | $ | 8,357 | $ | 8,656 | ||||
If these loans had been current throughout their terms, interest income for the nonaccrual period would have approximated $60 and $249 for the years ended December 31, 2015 and 2014 respectively.
| 91 |
BAYLAKE CORP.
NOTES TO CONSOLIDATED FINANCIAL STATEMENTS
December 31, 2015, 2014 and 2013
(Dollar amounts in thousands)
NOTE 5 – LOANS (Continued)
A breakdown of the ALL and recorded investments in originated loans at December 31, 2015 is as follows:
| Construction | Real
Estate- Residential | Real
Estate- Commercial | Commercial- Syndicated | Commercial- Other | Consumer | Tax Exempt | Not
Specifically Allocated | Total | ||||||||||||||||||||||||||||
| Allowance for Loan Losses: | ||||||||||||||||||||||||||||||||||||
| Beginning balance | $ | 252 | $ | 779 | $ | 3,282 | $ | 1,047 | $ | 1,082 | $ | 54 | $ | — | $ | 555 | $ | 7,051 | ||||||||||||||||||
| Charge-offs | — | (152 | ) | (798 | ) | — | (825 | ) | (42 | ) | — | — | (1,817 | ) | ||||||||||||||||||||||
| Recoveries | 20 | 70 | 250 | — | 145 | 9 | — | — | 494 | |||||||||||||||||||||||||||
| Provision | (156 | ) | (337 | ) | (867 | ) | 19 | 234 | 26 | — | 1,281 | 200 | ||||||||||||||||||||||||
| Ending Balance | $ | 116 | $ | 360 | $ | 1,867 | $ | 1,066 | $ | 636 | $ | 47 | $ | — | $ | 1,836 | $ | 5,928 | ||||||||||||||||||
| Loans: | ||||||||||||||||||||||||||||||||||||
| Ending balance | $ | 41,339 | $ | 154,490 | $ | 305,525 | $ | 64,585 | $ | 103,012 | $ | 5,431 | $ | 22,248 | $ | — | $ | 696,630 | ||||||||||||||||||
| ALL | (116 | ) | (360 | ) | (1,867 | ) | (1,066 | ) | (636 | ) | (47 | ) | — | (1,836 | ) | (5,928 | ) | |||||||||||||||||||
| Recorded investment | $ | 41,223 | $ | 154,130 | $ | 303,658 | $ | 63,519 | $ | 102,376 | $ | 5,384 | $ | 22,248 | $ | (1,836 | ) | $ | 690,702 | |||||||||||||||||
| Ending balance: | ||||||||||||||||||||||||||||||||||||
| Individually evaluated | $ | — | $ | 715 | $ | 8,975 | $ | — | $ | — | $ | 7 | $ | — | $ | — | $ | 9,697 | ||||||||||||||||||
| Collectively evaluated | 41,339 | 153,775 | 296,550 | 64,585 | 103,012 | 5,424 | 22,248 | — | 686,933 | |||||||||||||||||||||||||||
| Total | $ | 41,339 | $ | 154,490 | $ | 305,525 | $ | 64,585 | $ | 103,012 | $ | 5,431 | $ | 22,248 | $ | — | $ | 696,630 | ||||||||||||||||||
A breakdown of the ALL and recorded investments in acquired loans at December 31, 2015 is as follows:
| Construction | Real
Estate- Residential | Real
Estate- Commercial | Commercial- Syndicated | Commercial- Other | Consumer | Tax Exempt | Not
Specifically Allocated | Total | ||||||||||||||||||||||||||||
| Allowance for Loan Losses: | ||||||||||||||||||||||||||||||||||||
| Beginning balance | $ | — | $ | — | $ | — | $ | — | $ | — | $ | — | $ | — | $ | — | $ | — | ||||||||||||||||||
| Charge-offs | — | — | — | — | — | — | — | — | — | |||||||||||||||||||||||||||
| Recoveries | — | — | — | — | — | — | — | — | — | |||||||||||||||||||||||||||
| Provision | — | — | — | — | — | — | — | — | — | |||||||||||||||||||||||||||
| Ending Balance | $ | — | $ | — | $ | — | $ | — | $ | — | $ | — | $ | — | $ | — | $ | — | ||||||||||||||||||
| Loans: | ||||||||||||||||||||||||||||||||||||
| Ending balance | $ | 2,421 | $ | 24,294 | $ | 12,303 | $ | — | $ | 4,435 | $ | 3,191 | $ | 107 | $ | — | $ | 46,751 | ||||||||||||||||||
| ALL | — | — | — | — | — | — | — | — | — | |||||||||||||||||||||||||||
| Recorded investment | $ | 2,421 | $ | 24,294 | $ | 12,303 | $ | — | $ | 4,435 | $ | 3,191 | $ | 107 | $ | — | $ | 46,751 | ||||||||||||||||||
| Ending balance: | ||||||||||||||||||||||||||||||||||||
| Individually evaluated | $ | — | $ | — | $ | — | $ | — | $ | — | $ | — | $ | — | $ | — | $ | — | ||||||||||||||||||
| Collectively evaluated | 2,421 | 24,294 | 12,303 | — | 4,435 | 3,191 | 107 | — | 46,751 | |||||||||||||||||||||||||||
| Total | $ | 2,421 | $ | 24,294 | $ | 12,303 | $ | — | $ | 4,435 | $ | 3,191 | $ | 107 | $ | — | $ | 46,751 | ||||||||||||||||||
| 92 |
BAYLAKE CORP.
NOTES TO CONSOLIDATED FINANCIAL STATEMENTS
December 31, 2015, 2014 and 2013
(Dollar amounts in thousands)
NOTE 5 – LOANS (Continued)
A breakdown of the ALL and recorded investments in total loans at December 31, 2015 is as follows:
| Construction | Real
Estate- Residential | Real
Estate- Commercial | Commercial- Syndicated | Commercial- Other | Consumer | Tax Exempt | Not
Specifically Allocated | Total | ||||||||||||||||||||||||||||
| Allowance for Loan Losses: | ||||||||||||||||||||||||||||||||||||
| Beginning balance | $ | 252 | $ | 779 | $ | 3,282 | $ | 1,047 | $ | 1,082 | $ | 54 | $ | — | $ | 555 | $ | 7,051 | ||||||||||||||||||
| Charge-offs | — | (152 | ) | (798 | ) | — | (825 | ) | (42 | ) | — | — | (1,817 | ) | ||||||||||||||||||||||
| Recoveries | 20 | 70 | 250 | — | 145 | 9 | — | — | 494 | |||||||||||||||||||||||||||
| Provision | (156 | ) | (337 | ) | (867 | ) | 19 | 234 | 26 | — | 1,281 | 200 | ||||||||||||||||||||||||
| Ending Balance | $ | 116 | $ | 360 | $ | 1,867 | $ | 1,066 | $ | 636 | $ | 47 | $ | — | $ | 1,836 | $ | 5,928 | ||||||||||||||||||
| Loans: | ||||||||||||||||||||||||||||||||||||
| Ending balance | $ | 43,760 | $ | 178,784 | $ | 317,828 | $ | 64,585 | $ | 107,447 | $ | 8,622 | $ | 22,355 | $ | — | $ | 743,381 | ||||||||||||||||||
| ALL | (116 | ) | (360 | ) | (1,867 | ) | (1,066 | ) | (636 | ) | (47 | ) | — | (1,836 | ) | (5,928 | ) | |||||||||||||||||||
| Recorded investment | $ | 43,644 | $ | 178,424 | $ | 315,961 | $ | 63,519 | $ | 106,811 | $ | 8,575 | $ | 22,355 | $ | (1,836 | ) | $ | 737,453 | |||||||||||||||||
| Ending balance: | ||||||||||||||||||||||||||||||||||||
| Individually evaluated | $ | — | $ | 715 | $ | 8,975 | $ | — | $ | — | $ | 7 | $ | — | $ | — | $ | 9,697 | ||||||||||||||||||
| Collectively evaluated | 43,760 | 178,069 | 308,853 | 64,585 | 107,447 | 8,615 | 22,355 | — | 733,684 | |||||||||||||||||||||||||||
| Total | $ | 43,760 | $ | 178,784 | $ | 317,828 | $ | 64,585 | $ | 107,447 | $ | 8,622 | $ | 22,355 | $ | — | $ | 743,381 | ||||||||||||||||||
At the time of acquisition, loans acquired were evaluated for possible credit impairment and appropriately recorded at fair market value. As there was no subsequent deterioration related to these loans, no allowance was allocated to these loans at December 31, 2015.
| 93 |
BAYLAKE CORP.
NOTES TO CONSOLIDATED FINANCIAL STATEMENTS
December 31, 2015, 2014 and 2013
(Dollar amounts in thousands)
NOTE 5 – LOANS (Continued)
A breakdown of the ALL and recorded investments in loans at December 31, 2014 is as follows:
| Construction | Real
Estate- Residential | Real
Estate- Commercial | Commercial-
Syndicated | Commercial- Other | Consumer | Tax Exempt | Not
Specifically Allocated | Total | ||||||||||||||||||||||||||||
| Allowance for Loan Losses: | ||||||||||||||||||||||||||||||||||||
| Beginning balance | $ | 372 | $ | 1,373 | $ | 4,431 | $ | 218 | $ | 445 | $ | 64 | $ | — | $ | 755 | $ | 7,658 | ||||||||||||||||||
| Charge-offs | (162 | ) | (88 | ) | (656 | ) | (178 | ) | (116 | ) | (83 | ) | — | — | (1,283 | ) | ||||||||||||||||||||
| Recoveries | 56 | 126 | 439 | — | 37 | 18 | — | — | 676 | |||||||||||||||||||||||||||
| Provision | (14 | ) | (632 | ) | (932 | ) | 1,007 | 716 | 55 | — | (200 | ) | — | |||||||||||||||||||||||
| Ending Balance | $ | 252 | $ | 779 | $ | 3,282 | $ | 1,047 | $ | 1,082 | $ | 54 | $ | — | $ | 555 | $ | 7,051 | ||||||||||||||||||
| Loans: | ||||||||||||||||||||||||||||||||||||
| Ending balance | $ | 40,808 | $ | 152,091 | $ | 303,945 | 65,429 | $ | 88,045 | $ | 6,075 | $ | 22,964 | $ | — | $ | 679,357 | |||||||||||||||||||
| ALL | (252 | ) | (779 | ) | (3,282 | ) | (1,047 | ) | (1,082 | ) | (54 | ) | — | (555 | ) | (7,051 | ) | |||||||||||||||||||
| Recorded investment | $ | 40,556 | $ | 151,312 | $ | 300,663 | $ | 64,382 | $ | 86,963 | $ | 6,021 | $ | 22,964 | $ | (555 | ) | $ | 672,306 | |||||||||||||||||
| Ending balance: | ||||||||||||||||||||||||||||||||||||
| Individually evaluated | $ | — | $ | 849 | $ | 12,101 | $ | — | $ | 848 | $ | 13 | $ | — | $ | — | $ | 13,811 | ||||||||||||||||||
| Collectively evaluated | 40,808 | 151,242 | 291,844 | 65,429 | 87,197 | 6,062 | 22,964 | — | 665,546 | |||||||||||||||||||||||||||
| Total | $ | 40,808 | $ | 152,091 | $ | 303,945 | $ | 65,429 | $ | 88,045 | $ | 6,075 | $ | 22,964 | $ | — | $ | 679,357 | ||||||||||||||||||
Loans are individually evaluated for impairment once a weakness or adverse trend is identified that may jeopardize the repayment of the loan.
The Company’s recorded investment in loans as of December 31, 2015 and 2014 shown above is broken down by portfolio segment and impairment methodology.
Credit Quality: Management utilizes a risk grading matrix on each of the Company’s commercial loans. Loans are graded on a scale of 0001 to 0007. A description of the loan grades is as follows:
0001-Excellent Risk. Borrowers of highest quality and character. Almost no risk possibility. Balance sheets are very strong with superior liquidity, excellent debt capacity and low leverage. Cash flow trends are positive and stable. Excellent ratios.
0002-Very Good Risk. Good ratios in all areas. High quality borrower. Normally quite liquid. Differs slightly from a 0001 rated customer.
0003-Strong in most categories. Possible higher levels of debt or shorter track record. Minimal attention required. Good management.
0004-Better than Average Risk. Adequate ratios, fair liquidity, desirable customer. Proactive management. Performance trends
| 94 |
BAYLAKE CORP.
NOTES TO CONSOLIDATED FINANCIAL STATEMENTS
December 31, 2015, 2014 and 2013
(Dollar amounts in thousands)
NOTE 5 – LOANS (Continued)
0005-Satisfactory Risk. Some ratios slightly weak. Overall ability to repay is adequate. Capable and generally proactive management in all critical positions. Margins and cash flow may lack stability but trends are stable to positive. Company normally profitable year to year but may experience an occasional loss.
0006A-Weakness detected in either management, capacity to repay or balance sheet. Erratic profitability and financial performance. Loan demands more attention. Includes loans deemed to have weaknesses and less than 90 days past due.
0006B-Have weaknesses that deserve management’s close attention. If left uncorrected, these potential weaknesses may result in deterioration of the repayment prospects for the loan or in the Bank’s collateral position at some future date. Loans rated 0006B are not adversely classified and do not expose the Bank to sufficient risk to warrant adverse classification. Includes loans deemed to have weaknesses and less than 90 days past due.
0007-Well defined weaknesses and trends that jeopardize the repayment of loans. Ranging from workout to legal. Includes loans that are nonaccrual and/or 90 days or more past due.
In addition to the risk grading on commercial loans, real estate mortgage, consumer, and municipal loans are included in the 0001-0005 category until such time as the loan becomes past due 90 days or more or is moved to nonaccrual status, at which point the loan is rated 0007.
Below is a breakdown of originated loans by risk grading as of December 31, 2015:
| 0001-0005 | 0006A | 0006B | 0007 | Total | ||||||||||||||||
| Commercial- syndicated | $ | 57,950 | $ | — | $ | 3,830 | $ | 2,805 | $ | 64,585 | ||||||||||
| Commercial- other | 98,205 | 3,703 | 870 | 234 | 103,012 | |||||||||||||||
| Real estate - commercial | 267,119 | 26,035 | 2,719 | 10,148 | 306,021 | |||||||||||||||
| Construction | 37,970 | 3,186 | — | 183 | 41,339 | |||||||||||||||
| 461,244 | 32,924 | 7,419 | 13,370 | 514,957 | ||||||||||||||||
| Real estate-residential | 152,031 | 934 | 126 | 1,399 | 154,490 | |||||||||||||||
| Consumer | 5,473 | (49 | ) | — | 7 | 5,431 | ||||||||||||||
| Tax exempt | 22,248 | — | — | — | 22,248 | |||||||||||||||
| Total | $ | 640,996 | $ | 33,809 | $ | 7,545 | $ | 14,776 | $ | 697,126 | ||||||||||
| Deferred loan origination fees | (496 | ) | ||||||||||||||||||
| Total originated loans | $ | 696,630 | ||||||||||||||||||
| Percent of originated loans | 92.0 | % | 4.8 | % | 1.1 | % | 2.1 | % | 100.0 | % | ||||||||||
| Percent of total loans | 86.2 | % | 4.5 | % | 1.0 | % | 2.0 | % | 93.7 | % | ||||||||||
| 95 |
BAYLAKE CORP.
NOTES TO CONSOLIDATED FINANCIAL STATEMENTS
December 31, 2015, 2014 and 2013
(Dollar amounts in thousands)
NOTE 5 – LOANS (Continued)
Below is a breakdown of acquired loans by risk grading as of December 31, 2015:
| 0001-0005 | 0006A | 0006B | 0007 | Total | ||||||||||||||||
| Commercial- syndicated | $ | — | $ | — | $ | — | $ | — | $ | — | ||||||||||
| Commercial- other | 4,348 | 28 | 59 | — | 4,435 | |||||||||||||||
| Real estate - commercial | 8,584 | 2,711 | — | 1,008 | 12,303 | |||||||||||||||
| Construction | 1,875 | 41 | 505 | — | 2,421 | |||||||||||||||
| 14,807 | 2,780 | 564 | 1,008 | 19,159 | ||||||||||||||||
| Real estate-residential | 22,436 | 920 | — | 938 | 24,294 | |||||||||||||||
| Consumer | 3,142 | 49 | — | — | 3,191 | |||||||||||||||
| Tax exempt | 107 | — | — | — | 107 | |||||||||||||||
| Total | $ | 40,492 | $ | 3,749 | $ | 564 | $ | 1,946 | $ | 46,751 | ||||||||||
| Deferred loan origination fees | — | |||||||||||||||||||
| Total acquired loans | $ | 46,751 | ||||||||||||||||||
| Percent of total acquired loans | 86.6 | % | 8.0 | % | 1.2 | % | 4.2 | % | 100.0 | % | ||||||||||
| Percent of total loans | 5.4 | % | 0.5 | % | 0.1 | % | 0.3 | % | 6.3 | % |
Loans acquired were evaluated and recorded at fair value at the time of acquisition. At December 31, 2015, there has been no subsequent credit deterioration related to these loans, no allowance has been allocated to these loans, and they are not considered impaired.
Below is a breakdown of total loans by risk grading as of December 31, 2015:
| 0001-0005 | 0006A | 0006B | 0007 (1) | Total | ||||||||||||||||
| Commercial- syndicated | $ | 57,950 | $ | — | $ | 3,830 | $ | 2,805 | $ | 64,585 | ||||||||||
| Commercial- other | 102,553 | 3,731 | 929 | 234 | 107,447 | |||||||||||||||
| Real estate - commercial | 275,703 | 28,746 | 2,719 | 11,156 | 318,324 | |||||||||||||||
| Construction | 39,845 | 3,227 | 505 | 183 | 43,760 | |||||||||||||||
| 476,051 | 35,704 | 7,983 | 14,378 | 534,116 | ||||||||||||||||
| Real estate-residential | 174,467 | 1,854 | 126 | 2,337 | 178,784 | |||||||||||||||
| Consumer | 8,615 | — | — | 7 | 8,622 | |||||||||||||||
| Tax exempt | 22,355 | — | — | — | 22,355 | |||||||||||||||
| Total | $ | 681,488 | $ | 37,558 | $ | 8,109 | $ | 16,722 | $ | 743,877 | ||||||||||
| Deferred loan origination fees | (496 | ) | ||||||||||||||||||
| Total loans | $ | 743,381 | ||||||||||||||||||
| Percent of total loans | 91.6 | % | 5.0 | % | 1.1 | % | 2.3 | % | 100.0 | % | ||||||||||
| (1) | Included in the 0007 rated loans are $7,025 of loans that are collectively evaluated and not considered impaired because, in the event of default, no loss is expected. |
| 96 |
BAYLAKE CORP.
NOTES TO CONSOLIDATED FINANCIAL STATEMENTS
December 31, 2015, 2014 and 2013
(Dollar amounts in thousands)
NOTE 5 – LOANS (Continued)
Below is a breakdown of total loans by risk grading as of December 31, 2014:
| 0001-0005 | 0006A | 0006B | 0007 (2) | Total | ||||||||||||||||
| Commercial- syndicated | $ | 60,694 | $ | 4,735 | $ | — | $ | — | $ | 65,429 | ||||||||||
| Commercial- other | 81,530 | $ | 4,224 | $ | 1,240 | $ | 1,051 | $ | 88,045 | |||||||||||
| Real estate-commercial | 255,711 | 26,124 | 5,632 | 16,979 | 304,446 | |||||||||||||||
| Construction | 38,679 | 1,153 | 783 | 193 | 40,808 | |||||||||||||||
| 436,614 | 36,236 | 7,655 | 18,223 | 498,728 | ||||||||||||||||
| Real estate-residential | 148,835 | 1,299 | 414 | 1,543 | 152,091 | |||||||||||||||
| Consumer | 6,062 | — | — | 13 | 6,075 | |||||||||||||||
| Tax exempt | 21,994 | 970 | — | — | 22,964 | |||||||||||||||
| Total | $ | 613,505 | $ | 38,505 | $ | 8,069 | $ | 19,779 | $ | 679,858 | ||||||||||
| Deferred loan origination fees | (501 | ) | ||||||||||||||||||
| Total loans | $ | 679,357 | ||||||||||||||||||
| Percent of total loans | 90.2 | % | 5.7 | % | 1.2 | % | 2.9 | % | 100.0 | % | ||||||||||
| (2) | Included in the 0007 rated loans are $5,968 of loans that are collectively evaluated and not considered impaired because, in the event of default, no loss is expected. |
A summary of past due loans at December 31 are as follows:
| 2015 | ||||||||||||
| 30-89 Days Past
Due (accruing) | 90 Days or more
Past Due or on Nonaccrual | Total | ||||||||||
| Construction | $ | — | $ | — | $ | — | ||||||
| Real estate-residential | 778 | 876 | 1,654 | |||||||||
| Real estate-commercial | — | 1,335 | 1,335 | |||||||||
| Commercial-syndicated | — | — | — | |||||||||
| Commercial-other | 38 | — | 38 | |||||||||
| Consumer | 26 | 7 | 33 | |||||||||
| Tax exempt | — | — | — | |||||||||
| Total | $ | 842 | $ | 2,218 | $ | 3,060 | ||||||
| 2014 | ||||||||||||
| 30-89 Days Past Due (accruing) | 90 Days or more Past Due or on Nonaccrual | Total | ||||||||||
| Construction | $ | — | $ | — | $ | — | ||||||
| Real estate-residential | 313 | 849 | 1,162 | |||||||||
| Real estate-commercial | 996 | 3,461 | 4,457 | |||||||||
| Commercial-syndicated | — | — | — | |||||||||
| Commercial-other | 11 | 832 | 843 | |||||||||
| Consumer | 35 | 13 | 48 | |||||||||
| Tax exempt | — | — | — | |||||||||
| Total | $ | 1,355 | $ | 5,155 | $ | 6,510 | ||||||
| 97 |
BAYLAKE CORP.
NOTES TO CONSOLIDATED FINANCIAL STATEMENTS
December 31, 2015, 2014 and 2013
(Dollar amounts in thousands)
NOTE 5 – LOANS (Continued)
Further analysis of past due loans at December 31, 2015 follows:
| 2015 | ||||||||||||
| Originated Loans | 30-89 Days Past Due (accruing) |
90 Days or more Past Due or on Nonaccrual |
Total | |||||||||
| Construction | $ | — | $ | — | $ | — | ||||||
| Real estate-residential | 778 | 439 | 1,217 | |||||||||
| Real estate-commercial | — | 893 | 893 | |||||||||
| Commercial-syndicated | — | — | — | |||||||||
| Commercial-other | — | — | — | |||||||||
| Consumer | 25 | 7 | 32 | |||||||||
| Tax exempt | — | — | — | |||||||||
| Total | $ | 803 | $ | 1,339 | $ | 2,142 | ||||||
| 2015 | ||||||||||||
| Acquired Loans | 30-89 Days Past Due (accruing) | 90 Days or more Past Due or on Nonaccrual | Total | |||||||||
| Construction | $ | — | $ | — | $ | — | ||||||
| Real estate-residential | — | 437 | 437 | |||||||||
| Real estate-commercial | — | 442 | 442 | |||||||||
| Commercial-syndicated | — | — | — | |||||||||
| Commercial-other | 38 | — | 38 | |||||||||
| Consumer | 1 | — | 1 | |||||||||
| Tax exempt | — | — | — | |||||||||
| Total | $ | 39 | $ | 879 | $ | 918 | ||||||
A summary of trouble debt restructurings as of December 31, 2015 and 2014 is as follows (dollar amounts in thousands):
| 2015 | 2014 | |||||||||||||||
| Number
of Modifications | Recorded
Investment | Number
of Modifications | Recorded Investment | |||||||||||||
| Construction | — | $ | — | — | $ | — | ||||||||||
| Real estate-residential | 2 | 276 | — | — | ||||||||||||
| Real estate-commercial | 7 | 8,081 | 9 | 8,640 | ||||||||||||
| Commercial-syndicated | — | — | — | — | ||||||||||||
| Commercial-other | — | — | 1 | 16 | ||||||||||||
| Consumer | — | — | — | — | ||||||||||||
| Tax exempt | — | — | — | — | ||||||||||||
| Total | 9 | $ | 8,357 | 10 | $ | 8,656 | ||||||||||
| 98 |
BAYLAKE CORP.
NOTES TO CONSOLIDATED FINANCIAL STATEMENTS
December 31, 2015, 2014 and 2013
(Dollar amounts in thousands)
NOTE 5 – LOANS (Continued)
A roll forward of troubled debt restructuring during the year ended December 31, 2015 is as follows:
| Construction | Real
Estate- Residential | Real
Estate- Commercial | Commercial
- | Commercial- Other | Consumer | Tax
Exempt | Total | |||||||||||||||||||||||||
| Accruing | ||||||||||||||||||||||||||||||||
| Beginning balance | $ | — | $ | — | $ | 8,640 | $ | — | $ | 16 | $ | — | $ | — | $ | 8,656 | ||||||||||||||||
| Principal payments | — | (2 | ) | (188 | ) | — | — | — | — | (190 | ) | |||||||||||||||||||||
| Charge-offs | — | — | — | — | — | — | — | — | ||||||||||||||||||||||||
| Advances | — | 2 | 5 | — | — | — | — | 7 | ||||||||||||||||||||||||
| New restructureds | — | 276 | 1,635 | — | — | 62 | — | 1,973 | ||||||||||||||||||||||||
| Transfers to other real estate owned | — | — | — | — | — | — | — | — | ||||||||||||||||||||||||
| Transfers to nonaccrual | — | — | (219 | ) | — | — | (62 | ) | — | (281 | ) | |||||||||||||||||||||
| Transfers out of TDRs | — | — | (1,792 | ) | — | (16 | ) | — | — | (1,808 | ) | |||||||||||||||||||||
| Ending Balance | $ | — | $ | 276 | $ | 8,081 | $ | — | $ | — | $ | — | $ | — | $ | 8,357 | ||||||||||||||||
| Nonaccrual | ||||||||||||||||||||||||||||||||
| Beginning balance | $ | — | $ | — | $ | — | $ | — | $ | — | $ | — | $ | — | $ | — | ||||||||||||||||
| Principal payments | — | — | — | — | — | (62 | ) | — | (62 | ) | ||||||||||||||||||||||
| Charge-offs | — | — | (95 | ) | — | — | — | — | (95 | ) | ||||||||||||||||||||||
| Advances | — | — | 43 | — | — | — | — | 43 | ||||||||||||||||||||||||
| New restructureds | — | — | — | — | — | — | — | — | ||||||||||||||||||||||||
| Transfers to other real estate owned | — | — | (167 | ) | — | — | — | — | (167 | ) | ||||||||||||||||||||||
| Transfers from accruing | — | — | 219 | — | — | 62 | — | 281 | ||||||||||||||||||||||||
| Transfers out of TDRs | — | — | — | — | — | — | — | — | ||||||||||||||||||||||||
| Ending Balance | $ | — | $ | — | $ | — | $ | — | $ | — | $ | — | $ | — | $ | — | ||||||||||||||||
| Totals | ||||||||||||||||||||||||||||||||
| Beginning balance | $ | — | $ | — | $ | 8,640 | $ | — | $ | 16 | $ | — | $ | — | $ | 8,656 | ||||||||||||||||
| Principal payments | — | (2 | ) | (188 | ) | — | — | (62 | ) | — | (252 | ) | ||||||||||||||||||||
| Charge-offs | — | — | (95 | ) | — | — | — | — | (95 | ) | ||||||||||||||||||||||
| Advances | — | 2 | 48 | — | — | — | — | 50 | ||||||||||||||||||||||||
| New restructureds | — | 276 | 1,635 | — | — | 62 | — | 1,973 | ||||||||||||||||||||||||
| Transfers to other real estate owned | — | — | (167 | ) | — | — | — | — | (167 | ) | ||||||||||||||||||||||
| Transfers out of TDRs | — | — | (1,792 | ) | — | (16 | ) | — | — | (1,808 | ) | |||||||||||||||||||||
| Ending Balance | $ | — | $ | 276 | $ | 8,081 | $ | — | $ | — | $ | — | $ | — | $ | 8,357 | ||||||||||||||||
| 99 |
BAYLAKE CORP.
NOTES TO CONSOLIDATED FINANCIAL STATEMENTS
December 31, 2015, 2014 and 2013
(Dollar amounts in thousands)
NOTE 5 – LOANS (Continued)
A roll forward of troubled debt restructuring during the year ended December 31, 2014 is as follows:
| Construction | Real Estate- Residential | Real Estate- Commercial | Commercial - Syndicated | Commercial- Other | Consumer | Tax Exempt | Total | |||||||||||||||||||||||||
| Accruing | ||||||||||||||||||||||||||||||||
| Beginning balance | $ | — | $ | — | $ | 9,009 | $ | — | $ | — | $ | — | $ | — | $ | 9,009 | ||||||||||||||||
| Principal payments | — | — | (19 | ) | — | (11 | ) | — | — | (30 | ) | |||||||||||||||||||||
| Charge-offs | — | — | — | — | — | — | — | — | ||||||||||||||||||||||||
| Advances | — | — | 6 | — | — | — | — | 6 | ||||||||||||||||||||||||
| New restructureds | — | — | 302 | — | 27 | — | — | 329 | ||||||||||||||||||||||||
| Transfers to other real estate owned | — | — | — | — | — | — | — | — | ||||||||||||||||||||||||
| Transfers to nonaccrual | — | — | — | — | — | — | — | — | ||||||||||||||||||||||||
| Transfers out of TDRs | — | — | (658 | ) | — | — | — | — | (658 | ) | ||||||||||||||||||||||
| Ending Balance | $ | — | $ | — | $ | 8,640 | $ | — | $ | 16 | $ | — | $ | — | $ | 8,656 | ||||||||||||||||
| Nonaccrual | ||||||||||||||||||||||||||||||||
| Beginning balance | $ | — | $ | — | $ | 255 | $ | — | $ | — | $ | — | $ | — | $ | 255 | ||||||||||||||||
| Principal payments | — | — | (290 | ) | — | — | — | — | (290 | ) | ||||||||||||||||||||||
| Charge-offs | — | — | (12 | ) | — | — | — | — | (12 | ) | ||||||||||||||||||||||
| Advances | — | — | 47 | — | — | — | — | 47 | ||||||||||||||||||||||||
| New restructureds | — | — | — | — | — | — | — | — | ||||||||||||||||||||||||
| Transfers to other real estate owned | — | — | — | — | — | — | — | — | ||||||||||||||||||||||||
| Transfers from accruing | — | — | — | — | — | — | — | — | ||||||||||||||||||||||||
| Transfers out of TDRs | — | — | — | — | — | — | — | — | ||||||||||||||||||||||||
| Ending Balance | $ | — | $ | — | $ | — | $ | — | $ | — | $ | — | $ | — | $ | — | ||||||||||||||||
| Totals | ||||||||||||||||||||||||||||||||
| Beginning balance | $ | — | $ | — | $ | 9,264 | $ | — | $ | — | $ | — | $ | — | $ | 9,264 | ||||||||||||||||
| Principal payments | — | — | (309 | ) | — | (11 | ) | — | — | (320 | ) | |||||||||||||||||||||
| Charge-offs | — | — | (12 | ) | — | — | — | — | (12 | ) | ||||||||||||||||||||||
| Advances | — | — | 53 | — | — | — | — | 53 | ||||||||||||||||||||||||
| New restructureds | — | — | 302 | — | 27 | — | — | 329 | ||||||||||||||||||||||||
| Transfers to other real estate owned | — | — | — | — | — | — | — | — | ||||||||||||||||||||||||
| Transfers out of TDRs | — | — | (658 | ) | — | — | — | — | (658 | ) | ||||||||||||||||||||||
| Ending Balance | $ | — | $ | — | $ | 8,640 | $ | — | $ | 16 | $ | — | $ | — | $ | 8,656 | ||||||||||||||||
| 100 |
BAYLAKE CORP.
NOTES TO CONSOLIDATED FINANCIAL STATEMENTS
December 31, 2015, 2014 and 2013
(Dollar amounts in thousands)
NOTE 5 – LOANS (Continued)
At December 31, 2015, there were no outstanding unfunded commitments to customers whose terms have been modified in a troubled debt restructuring.
Restructured loans involves the granting of some concession to the borrower involving a loan modification, such as payment schedule changes, interest rate reductions, or principal charge-offs (“A/B Note Structure”). During the year ended December 31, 2015, restructured loan modifications primarily consisted of loans in the real estate-commercial category. Reasons for restructuring were principal charge-offs, interest rate concessions, and term extensions.
A summary of troubled debt restructurings as of December 31, 2015 by restructure type is as follows:
| Accruing | Nonaccruing | Total | ||||||||||
| A/B Note Structure | $ | 1,808 | $ | — | $ | 1,808 | ||||||
| Payment schedule changes | 6,404 | — | 6,404 | |||||||||
| Interest rate reduction | 145 | — | 145 | |||||||||
| Total | $ | 8,357 | $ | — | $ | 8,357 | ||||||
A loan that is modified at a market rate of interest may no longer be classified as a TDR in the calendar year subsequent to restructuring if it is in compliance with its modified terms for a meaningful period of time, usually at least six months.
All loans transferred out of TDRs in 2015 and 2014 have continued to perform under their restructured terms.
| 101 |
BAYLAKE CORP.
NOTES TO CONSOLIDATED FINANCIAL STATEMENTS
December 31, 2015, 2014 and 2013
(Dollar amounts in thousands)
NOTE 5 – LOANS (Continued)
Information regarding impaired loans is as follows:
IMPAIRED LOANS AND ALLOCATED ALLOWANCE
| December 31, 2015 | Construction | Real Estate- Residential | Real Estate- Commercial | Commercial- Syndicated | Commercial- Other | Consumer | Tax Exempt | Not Specifically Allocated | Total | |||||||||||||||||||||||||||
| With an allowance recorded: | ||||||||||||||||||||||||||||||||||||
| Recorded investment | $ | — | $ | 85 | $ | 156 | $ | — | $ | — | $ | — | $ | — | $ | — | $ | 241 | ||||||||||||||||||
| Unpaid principal balance | — | 113 | 211 | — | — | — | — | — | 324 | |||||||||||||||||||||||||||
| Related allowance | — | 28 | 55 | — | — | — | — | — | 83 | |||||||||||||||||||||||||||
| With no related allowance recorded: | ||||||||||||||||||||||||||||||||||||
| Recorded investment | $ | — | $ | 602 | $ | 8,764 | $ | — | $ | — | $ | 7 | $ | — | $ | — | $ | 9,373 | ||||||||||||||||||
| Unpaid principal balance | — | 602 | 8,764 | — | — | 7 | — | — | 9,373 | |||||||||||||||||||||||||||
| Related allowance | — | — | — | — | — | — | — | — | — | |||||||||||||||||||||||||||
| Total: | ||||||||||||||||||||||||||||||||||||
| Recorded investment | $ | — | $ | 687 | $ | 8,920 | $ | — | $ | — | $ | 7 | $ | — | $ | — | $ | 9,614 | ||||||||||||||||||
| Unpaid principal balance | — | 715 | 8,975 | — | — | 7 | — | — | 9,697 | |||||||||||||||||||||||||||
| Related allowance | — | 28 | 55 | — | — | — | — | — | 83 | |||||||||||||||||||||||||||
| Average recorded investment during year | $ | — | $ | 710 | $ | 9,174 | $ | — | $ | 209 | $ | 49 | $ | — | $ | — | $ | 10,142 | ||||||||||||||||||
| Interest income recognized while impaired | $ | — | $ | 9 | $ | 293 | $ | — | $ | 4 | $ | 3 | $ | — | $ | — | $ | 309 | ||||||||||||||||||
Management regularly monitors impaired loan relationships. In the event facts and circumstances change, an additional PFLL may be necessary.
| 102 |
BAYLAKE CORP.
NOTES TO CONSOLIDATED FINANCIAL STATEMENTS
December 31, 2015, 2014 and 2013
(Dollar amounts in thousands)
NOTE 5 – LOANS (Continued)
Information regarding impaired loans is as follows:
IMPAIRED LOANS AND ALLOCATED ALLOWANCE
| December 31, 2014 | Construction | Real
Estate- Residential | Real
Estate- Commercial | Commercial- Syndicated | Commercial- Other | Consumer | Tax Exempt | Not Specifically Allocated | Total | |||||||||||||||||||||||||||
| With an allowance recorded: | ||||||||||||||||||||||||||||||||||||
| Recorded investment | $ | — | $ | 83 | $ | 1,367 | $ | — | $ | — | $ | 1 | $ | — | $ | — | $ | 1,451 | ||||||||||||||||||
| Unpaid principal balance | — | 168 | 2,008 | — | 634 | 2 | — | — | 2,812 | |||||||||||||||||||||||||||
| Related allowance | — | 85 | 641 | — | 634 | 1 | — | — | 1,361 | |||||||||||||||||||||||||||
| With no related allowance recorded: | ||||||||||||||||||||||||||||||||||||
| Recorded investment | $ | — | $ | 681 | $ | 10,093 | $ | — | $ | 214 | $ | 11 | $ | — | $ | — | $ | 10,999 | ||||||||||||||||||
| Unpaid principal balance | — | 681 | 10,093 | — | 214 | 11 | — | — | 10,999 | |||||||||||||||||||||||||||
| Related allowance | — | — | — | — | — | — | — | — | — | |||||||||||||||||||||||||||
| Total: | ||||||||||||||||||||||||||||||||||||
| Recorded investment | $ | — | $ | 764 | $ | 11,460 | $ | — | $ | 214 | $ | 12 | $ | — | $ | — | $ | 12,450 | ||||||||||||||||||
| Unpaid principal balance | — | 849 | 12,101 | — | 848 | 13 | — | — | 13,811 | |||||||||||||||||||||||||||
| Related allowance | — | 85 | 641 | — | 634 | 1 | — | — | 1,361 | |||||||||||||||||||||||||||
| Average recorded investment during year | $ | 408 | $ | 532 | $ | 13,031 | $ | — | $ | 228 | $ | 3 | $ | — | $ | $ | 14,202 | |||||||||||||||||||
| Interest income recognized while impaired | $ | — | $ | 5 | $ | 351 | $ | — | $ | — | $ | — | $ | — | $ | — | $ | 356 | ||||||||||||||||||
| 103 |
BAYLAKE CORP.
NOTES TO CONSOLIDATED FINANCIAL STATEMENTS
December 31, 2015, 2014 and 2013
(Dollar amounts in thousands)
NOTE 6 - PREMISES AND EQUIPMENT
| December 31, | ||||||||
| 2015 | 2014 | |||||||
| Land | $ | 3,533 | $ | 5,026 | ||||
| Buildings and improvements | 25,840 | 23,916 | ||||||
| Equipment | 13,094 | 12,431 | ||||||
| 42,467 | 41,373 | |||||||
| Less accumulated depreciation | 22,365 | 21,167 | ||||||
| Premises and equipment, net | $ | 20,102 | $ | 20,206 | ||||
The fair market value of premises and equipment acquired in the NEWBI merger was $855, of which $147 related to a branch facility transferred to other real estate owned. Additionally, another property acquired in the NEWBI merger of $70 was sold in January 2016. During 2015, premises considered no longer necessary for use in bank operation of $1,320 was transferred to premises held for sale subsequent to a write-down of $284 recorded to adjust the property to fair market value.
Included in buildings and improvements at December 31, 2015 and 2014 was $396 and $142, respectively, of costs related to facilities remodeling projects in process at that time.
Depreciation expense was $1,283, $1,318 and $1,297 for the years ended December 31, 2015, 2014 and 2013, respectively.
NOTE 7 - PREMISES HELD FOR SALE
| December 31, | ||||||||
| 2015 | 2014 | |||||||
Premises held for sale |
$ | 2,104 | $ | 844 | ||||
Premises originally purchased for future branch expansion on which offers to sell have been accepted by the Bank are included in premises held for sale. At December 31, 2015, premises held for sale comprised two properties. During the fourth quarter of 2015, a property totaling $1,320 was transferred from premises and equipment to premises held for sale. During 2015, one property held for sale of $784 was written down by $60, then sold subsequent to December 31, 2015.
The sale of the remaining property is expected to close in the second quarter of 2016.
| 104 |
BAYLAKE CORP.
NOTES TO CONSOLIDATED FINANCIAL STATEMENTS
December 31, 2015, 2014 and 2013
(Dollar amounts in thousands)
NOTE 8 – OTHER REAL ESTATE OWNED, NET
Other real estate owned is summarized as follows:
| For the year ended December 31, | ||||||||||||
| 2015 | 2014 | 2013 | ||||||||||
| Beginning balance | $ | 5,093 | $ | 8,566 | $ | 14,334 | ||||||
| Transfer of loan collateral to other real estate owned | 623 | 1,204 | 1,037 | |||||||||
| Transfer of bank facilities to other real estate owned | 147 | — | 569 | |||||||||
| Other real estate owned properties acquired in branch acquisition | 147 | — | — | |||||||||
| Sales proceeds, net | (950 | ) | (2,525 | ) | (5,040 | ) | ||||||
| Net gain from disposal of other real estate owned | 50 | 19 | 202 | |||||||||
| Valuation allowance related to properties disposed | (290 | ) | (2,171 | ) | (2,536 | ) | ||||||
| Total other real estate owned | 4,820 | 5,093 | 8,566 | |||||||||
| Valuation allowance for losses | (1,110 | ) | (827 | ) | (2,268 | ) | ||||||
| Total other real estate owned, net | $ | 3,710 | $ | 4,266 | $ | 6,298 | ||||||
Included in other real estate owned is $414, $569 and $569 of bank facilities in 2015, 2014 and 2013, respectively, no longer in use by the Bank. Of the bank facilities held in other real estate owned at December 31, 2015, $147 was acquired in the acquisition of NEWBI.
Changes in the valuation allowance for losses on other real estate owned were as follows:
| For the year ended December 31, | ||||||||||||
| 2015 | 2014 | 2013 | ||||||||||
| Beginning balance | $ | 827 | $ | 2,268 | $ | 3,858 | ||||||
| Provision charged to operations | 573 | 730 | 946 | |||||||||
| Amounts related to properties disposed | (290 | ) | (2,171 | ) | (2,536 | ) | ||||||
| Balance at end of year | $ | 1,110 | $ | 827 | $ | 2,268 | ||||||
The foreclosure process commences on real estate - residential loans when a borrower becomes 120 or greater days delinquent in accordance with Consumer Finance Protection Bureau guidelines. Foreclosure procedures and timelines may vary depending on a variety of factors, including where the property is located. At both December 31, 2015 and 2014, the recorded investment in real estate - residential loans that were in the process of foreclosure was $350. Additionally, $244 at December 31, 2015 and $391 at December 31, 2014 of loans serviced for and guaranteed by FHLMC were in the process of foreclosure. Although these loans continue to be serviced by the Bank, these loans are sold to FHLMC once originated and therefore, no balances are included in the Company’s balance sheet. At December 31, 2015 $171 of real estate - residential properties comprised of three properties, were held as other real estate owned.
Real estate - residential properties are derecognized as mortgage loans and classified as Other Real Estate Owned when the Bank has control of the property, regardless of whether legal title has been transferred in the completed foreclosure process. At both December 31, 2015 and December 31, 2014, titles relating to all of the real estate - residential loan properties classified as Other Real Estate Owned had been transferred to the Company.
| 105 |
BAYLAKE CORP.
NOTES TO CONSOLIDATED FINANCIAL STATEMENTS
December 31, 2015, 2014 and 2013
(Dollar amounts in thousands)
NOTE 9 – MORTGAGE SERVICING RIGHTS
The Bank has contractual obligations to service residential first mortgage loans and commercial loans that have been sold in the secondary market with servicing retained. Mortgage servicing rights (“MSRs”) are recorded when loans are sold in the secondary market with servicing retained. On a monthly basis MSRs are valued based on available market information. The Bank does not hedge against the risk of changes in fair value.
Changes in the carrying value of MSRs are as follows:
| For the year ended December 31, | ||||||||
| 2015 | 2014 | |||||||
| Balance at beginning of period | $ | 841 | $ | 967 | ||||
| Addition from loans acquired with servicing retained | 251 | — | ||||||
| Addition from loans sold with servicing retained | 102 | 79 | ||||||
| Loan payments and payoffs | (109 | ) | (124 | ) | ||||
| Changes in valuation | 30 | (81 | ) | |||||
| Fair value of MSRs at the end of period | $ | 1,115 | $ | 841 | ||||
| Unpaid principal balance of loans serviced at December 31 | $ | 159,211 | $ | 123,943 | ||||
NOTE 10 - DEPOSITS
The following is a summary of deposits by type at December 31:
| 2015 | 2014 | |||||||
| Noninterest-bearing demand deposits | $ | 198,003 | $ | 153,113 | ||||
| Interest-bearing demand deposits | 159,326 | 140,159 | ||||||
| Savings deposits | 62,019 | 44,868 | ||||||
| Money market deposits | 308,117 | 288,744 | ||||||
| Time deposits $100,000 - $250,000 | 37,398 | 38,697 | ||||||
| Time deposits $250,000 and greater | 11,200 | 10,051 | ||||||
| Other time deposits less than $100,000 | 90,132 | 89,910 | ||||||
| Total deposits | $ | 866,195 | $ | 765,542 | ||||
| Brokered deposits included above | $ | 555 | $ | 8,532 | ||||
Deposits of $68,456 were acquired in the merger with NEWBI.
Time deposits include both CDs and individual retirement accounts. At December 31, 2015, the scheduled maturities of time deposits were as follows:
| 2016 | $ | 86,015 | ||||
| 2017 | 30,404 | |||||
| 2018 | 9,512 | |||||
| 2019 | 7,058 | |||||
| 2020 | 5,741 | |||||
| $ | 138,730 | |||||
Deposits from the Company’s directors and officers held by the Bank at December 31, 2015 and 2014 amounted to $5,206 and $5,554, respectively.
| 106 |
BAYLAKE CORP.
NOTES TO CONSOLIDATED FINANCIAL STATEMENTS
December 31, 2015, 2014 and 2013
(Dollar amounts in thousands)
NOTE 11 - FEDERAL HOME LOAN BANK ADVANCES AND OTHER BORROWINGS
A summary of FHLB advances and other borrowings at December 31 is as follows:
Year of Maturity | 2015 | Weighted Average Rate | 2014 | Weighted Average Rate | ||||||||||||||
| 2015 | $ | — | — | % | $ | 22,800 | 1.38 | % | ||||||||||
| 2016 | 1,750 | 0.75 | 1,750 | 0.75 | ||||||||||||||
| 2017 | 1,950 | 1.10 | 1,950 | 1.10 | ||||||||||||||
| 2018 | 14,600 | 2.73 | 10,600 | 2.44 | ||||||||||||||
| 2019 | 13,295 | 1.86 | 13,355 | 1.86 | ||||||||||||||
| 2020 | 10,000 | 2.81 | — | — | ||||||||||||||
| 2021 | — | — | 10,000 | 0.28 | ||||||||||||||
| 2022 | — | — | — | — | ||||||||||||||
| $ | 41,595 | 2.31 | % | $ | 60,455 | 2.02 | % | |||||||||||
Maximum month-end amounts outstanding were $60,450 and $98,985 during the years ended December 31, 2015 and 2014, respectively.
There were no variable rate FHLB advances outstanding at December 31, 2015. At December 31, 2014, $16,000 of the FHLB advances outstanding were variable rate. Each advance is payable at its maturity date, with a prepayment penalty for fixed rate advances. FHLB advances were secured by $122,595 of real estate first mortgages, $46,325 of home equity loans and lines, and $408 of obligations of state and political subdivisions securities.
NOTE 12 - REPURCHASE AGREEMENTS
Short-term borrowings consisted of the following at December 31:
| 2015 | 2014 | |||||||
| Securities sold under agreements to repurchase | $ | 48,127 | $ | 64,869 | ||||
| Average amounts outstanding during year | $ | 46,965 | $ | 41,110 | ||||
| Maximum month-end amounts outstanding | 54,909 | 64,869 | ||||||
| Average interest rates on amounts outstanding at end of year | 0.10 | % | 0.27 | % | ||||
| Average interest rates on amounts outstanding during year | 0.13 | % | 0.24 | % | ||||
NOTE 13 - SUBORDINATED DEBENTURES
On March 31, 2006, the Company issued $16,100 of trust preferred securities (“TruPS”) and $598 of trust common securities through its wholly-owned subsidiary, Baylake Capital Trust II (the “Trust”) that adjust quarterly at a rate equal to 1.35% over the three month LIBOR (1.95% at December 31, 2015). The Trust’s ability to pay amounts due on the TruPS is solely dependent upon the Company making payment on the related subordinated debentures to the Trust. The Company’s obligations under the subordinated debentures include a conditional guarantee by the Company of the Trust’s obligations under the TruPS issued by the Trust. In addition, under the terms of the subordinated debentures, the Company would be precluded from paying dividends on the Company’s common stock if it was in default under the subordinated debentures, if the Company exercised its right to defer payments of interest on the subordinated debentures or if certain related defaults occurred. At December 31, 2015 and 2014, the Company had made all contractual payments on the subordinated debentures in accordance with their terms.
| 107 |
BAYLAKE CORP.
NOTES TO CONSOLIDATED FINANCIAL STATEMENTS
December 31, 2015, 2014 and 2013
(Dollar amounts in thousands, except shares and per share data)
NOTE 14 – CONVERTIBLE PROMISSORY NOTES
During 2009 and 2010, the Company issued 10% Convertible Notes due June 30, 2017 (the “Convertible Notes”) totaling $9,450. The Convertible Notes offering was exempt from registration under Section 4(2) of the Securities Act of 1933 and Rule 506 promulgated thereunder.
The Convertible Notes accrued interest at a fixed rate of 10% payable quarterly, in arrears, on January 1, April 1, July 1, and October 1, of each year. The Convertible Notes were convertible into shares of the Company’s common stock at a conversion ratio of one share of common stock for each $5.00 in aggregate principal amount held on the record date of the conversion subject to certain adjustments as described in the Convertible Notes (“the Conversion Ratio”). Prior to the quarterly interest date preceding the fifth anniversary of issuance of the Convertible Notes, each holder of the Convertible Notes was permitted to convert up to 100% (at the discretion of the holder) of the original principal amount into shares of the Company’s common stock at the Conversion Ratio. Beginning on the quarterly interest date prior to the fifth anniversary of the Convertible Notes, the Company was permitted to redeem the notes in whole or in part. A notice of redemption supersedes and takes priority over any notice of conversion. On October 1, 2014, one-half of the original principal amounts were mandatorily convertible at the Conversion Ratio if voluntary conversion had not yet occurred. The principal amount of any Convertible Note that has not been converted would have been payable at maturity on June 30, 2017.
Beginning January 1, 2014, the Company began redeeming the notes at the investors’ option under the terms described in the preceding paragraph. In 2014, $6,100 was converted into 1.2 million shares under this option. On October 1, 2014, an additional $1,650 of Convertible Notes were converted to 0.3 million shares of the Company’s common stock under the mandatory conversion provision of the Convertible Notes. During the first quarter of 2015, $575 of Convertible Notes were converted into 0.1 million shares of the Company’s common stock at the option of the holder. Finally, on April 1, 2015, the remaining $1,075 of Convertible Notes were converted in full under the voluntary conversion provisions into 0.2 million shares of the Company’s common stock, resulting in no remaining outstanding Convertible Notes at December 31, 2015.
The Company incurred debt issuance costs of $179 in conjunction with the sale of the Convertible Notes. These costs were capitalized and were amortized to interest expense using the effective interest method over the initial conversion term, which was through September 30, 2014.
NOTE 15 - CAPITAL MATTERS
Banks and bank holding companies are subject to regulatory capital requirements administered by federal banking agencies. Capital adequacy guidelines and, additionally for banks, prompt corrective action regulations involve quantitative measures of assets, liabilities, and certain off-balance-sheet items calculated under regulatory accounting practices. Capital amounts and classifications are also subject to qualitative judgments by regulators. Failure to meet capital requirements can trigger regulatory action.
Prompt corrective action regulations provide five capital classifications: well capitalized, adequately capitalized, undercapitalized, significantly undercapitalized, and critically undercapitalized, although these terms are not used to represent overall financial condition. If adequately capitalized, regulatory approval is required to accept brokered deposits. If undercapitalized, capital distributions are limited, as is asset growth and expansion, and capital restoration plans are required. At December 31, 2015, regulatory notifications categorized the Bank and the Company as well capitalized, under the regulatory framework for prompt corrective action. There are no conditions or events since that notification that management believes have changed the Bank’s or the Company’s category.
| 108 |
BAYLAKE CORP.
NOTES TO CONSOLIDATED FINANCIAL STATEMENTS
December 31, 2015, 2014 and 2013
(Dollar amounts in thousands, except per share data)
NOTE 15 – CAPITAL MATTERS (Continued)
During 2015, the Company declared and paid dividends of $0.34 per share or $3,158. On January 28, 2016, the Company declared a dividend of $0.09 per share to shareholders of record on February 12, 2016.
The Company’s and the Bank’s risk-based capital and leverage ratios at December 31, 2015 and 2014 are presented below.
| Actual | For
Capital Adequacy Purposes | To
Be Well Capitalized Under Prompt Corrective Action Provisions | ||||||||||||||||||||||
| Amount | Ratio | Amount | Ratio | Amount | Ratio | |||||||||||||||||||
| 2015 | ||||||||||||||||||||||||
| Total Capital to Risk-Weighted Assets | ||||||||||||||||||||||||
| Company | $ | 124,058 | 15.11 | % | $ | 65,685 | 8.00 | % | N/A | N/A | ||||||||||||||
| Bank | 124,206 | 15.14 | % | 65,632 | 8.00 | % | $ | 82,041 | 10.00 | % | ||||||||||||||
| Tier 1 Capital to Risk-Weighted Assets | ||||||||||||||||||||||||
| Company | 118,130 | 14.39 | % | 49,264 | 6.00 | % | N/A | N/A | ||||||||||||||||
| Bank | 118,278 | 14.42 | % | 49,224 | 6.00 | % | 65,632 | 8.00 | % | |||||||||||||||
| Tier 1 Common Equity to Risk-Weighted Assets | ||||||||||||||||||||||||
| Company | 103,337 | 12.59 | % | 36,948 | 4.50 | % | N/A | N/A | ||||||||||||||||
| Bank | 118,278 | 14.42 | % | 36,918 | 4.50 | % | 53,326 | 6.50 | % | |||||||||||||||
| Tier 1 Capital to Average Assets | ||||||||||||||||||||||||
| Company | 118,130 | 11.56 | % | 40,865 | 4.00 | % | N/A | N/A | ||||||||||||||||
| Bank | 118,278 | 11.60 | % | 40,786 | 4.00 | % | 50,982 | 5.00 | % | |||||||||||||||
December 31, 2015 ratios are calculated under Basel III rules, which became effective January 1, 2015.
| 2014 | ||||||||||||||||||||||||
| Total Capital to Risk-Weighted Assets | ||||||||||||||||||||||||
| Consolidated | $ | 118,605 | 16.14 | % | $ | 58,791 | 8.00 | % | N/A | N/A | ||||||||||||||
| Bank | 116,935 | 15.92 | % | 58,753 | 8.00 | % | $ | 73,441 | 10.00 | % | ||||||||||||||
| Tier 1 (Core) Capital to Risk-Weighted Assets | ||||||||||||||||||||||||
| Consolidated | 109,904 | 14.96 | % | 29,395 | 4.00 | % | N/A | N/A | ||||||||||||||||
| Bank | 109,884 | 14.96 | % | 29,376 | 4.00 | % | 44,064 | 6.00 | % | |||||||||||||||
| Tier 1 (Core) Capital to Average Assets | ||||||||||||||||||||||||
| Consolidated | 109,904 | 11.26 | % | 39,032 | 4.00 | % | N/A | N/A | ||||||||||||||||
| Bank | 109,884 | 11.27 | % | 39,016 | 4.00 | % | 48,770 | 5.00 | % |
| 109 |
BAYLAKE CORP.
NOTES TO CONSOLIDATED FINANCIAL STATEMENTS
December 31, 2015, 2014 and 2013
(Dollar amounts in thousands)
NOTE 15 – CAPITAL MATTERS (Continued)
Regulatory Initiative Affecting the Banking Industry
Basel III
The Federal Reserve and the FDIC approved the final rules implementing Basel III. Under the final rules, minimum requirements will increase for both the quantity and quality of capital the Company and the Bank hold. The rules include a new common equity Tier 1 capital to risk-weighted assets minimum ratio of 4.5%, raise the minimum ratio of Tier 1 capital to risk-weighted assets from 4.0% to 6.0%, require a minimum ratio of total capital to risk-weighted assets of 8.0%, and require a minimum Tier 1 leverage ratio of 4.0%. A new capital conservation buffer, comprised of common equity Tier 1 capital, is also established above the regulatory minimum capital requirements. This capital conservation buffer will be phased-in beginning January 1, 2016 at 0.625% of risk-weighted assets and increase each subsequent year by an additional 0.625% until reaching its final level of 2.5% on January 1, 2019. Strict eligibility for regulatory capital instruments was also implemented under the final rules. The final rules also revise the definition and calculation of Tier 1 capital, total capital and risk-weighted assets.
The phase-in period for the final rules became effective for the Company and the Bank on January 1, 2015 with full compliance with all of the final rules’ requirements phased in incrementally, to be fully phased-in by January 1, 2019. Although as of December 31, 2015, the Company and the Bank were categorized as “well-capitalized” under the new rules, the ratios have declined on a comparative basis to our regulatory capital ratios at December 31, 2014 due to compliance with the new rules under Basel III.
NOTE 16 – COMMITMENTS AND CONTINGENCIES
The Company is party to financial instruments with off-balance-sheet risk in the normal course of business to meet the financing needs of customers. These financial instruments include off balance-sheet credit instruments, such as commitments to make loans and commercial letters of credit, issued to meet customer financing needs. The face amount for these items represents the exposure to loss, before considering customer collateral or ability to repay. Such financial instruments are recorded when they are funded. Instruments, such as standby letters of credit, that are considered financial guarantees are recorded at fair value. The Company does not use forward loan sale commitments.
The Company’s exposure to credit loss in the event of nonperformance by the other party to the financial instrument for commitments to extend credit and standby letters of credit is represented by the contract or notional amount of those instruments. The Company uses the same credit policies in making commitments and conditional obligations as it does for on-balance-sheet instruments.
| December 31, | ||||||||
| 2015 | 2014 | |||||||
| Financial instruments whose contract amounts represent credit risk: | ||||||||
| Commitments to extend credit | $ | 252,507 | $ | 228,521 | ||||
| Standby letters of credit | 9,857 | 9,757 | ||||||
| 110 |
BAYLAKE CORP.
NOTES TO CONSOLIDATED FINANCIAL STATEMENTS
December 31, 2015, 2014 and 2013
(Dollar amounts in thousands)
NOTE 16 – COMMITMENTS AND CONTINGENCIES (Continued)
Commitments to extend credit are agreements to lend to a customer as long as there is no violation of any condition established in the contract. Commitments generally have fixed expiration dates or other termination clauses and may require payment of a fee. Since many of the commitments are expected to expire without being drawn upon, the total commitment amounts do not necessarily represent future cash requirements. The Company evaluates each customer’s creditworthiness on a case-by-case basis. The amount of collateral obtained, if deemed necessary by the Company upon extension of credit, is based on management’s credit evaluation of the counter-party. Collateral held varies but may include accounts receivable; inventory; property, plant, and equipment; and income-producing commercial properties. Fixed rate commercial commitments totaled $31,549 and $35,500 at December 31, 2015 and 2014, respectively, with rates ranging from 1.40% to 8.25% in 2015 and 0.50% to 7.25% in 2014.
Standby letters of credit are conditional commitments issued by the Company to guarantee the performance of customers to a third party. These are primarily issued to support private borrowing arrangements. Approximately 63% of these commitments expire prior to December 31, 2017. Another 36% expire in 2018 and the remainder expire in 2019. The credit risk involved in issuing letters of credit is essentially the same as that involved in extending loan facilities to customers. The Company does not require collateral as support for the commitments. Collateral is secured as commitments are funded.
In 2015, 2014 and 2013, no impairment charges were taken on standby letters of credit, which were issued by the Company on behalf of customers to accommodate their borrowings with third parties.
Loss contingencies, including claims and legal actions arising in the ordinary course of business, are recorded as liabilities when the likelihood of loss is probable and an amount or range of loss can be reasonably estimated.
The Company does not use interest rate contracts (e.g. swaps) or other derivatives to manage interest rate risk and does not have any of these instruments outstanding as of and for the years ended December 31, 2015, 2014 or 2013.
NOTE 17 - RETIREMENT PLANS
The Bank has a 401(k) profit sharing plan covering all employees who qualify as to age and length of service. The discretionary employer contributions paid and expensed under all plans totaled $461, $438 and $449 in 2015, 2014 and 2013, respectively. Certain officers and directors of the Company and its subsidiaries are covered by nonqualified deferred compensation plans. Payments to be made under these plans are accrued over the anticipated years of service of the individuals covered. Amounts charged to expense were $34, $175, and $323 in 2015, 2014, and 2013, respectively. The aggregate amount of deferred compensation included in other liabilities in the consolidated balance sheets is $2,580 and $3,145 in 2015 and 2014, respectively. The Company established the SERP Plan, which is intended to provide certain management and highly compensated employees of the Company who have contributed and are expected to continue to contribute to the Company’s success, deferred compensation in addition to that available under the Company’s other retirement programs. No costs related to the SERP Plan were charged to expense in 2015, but costs amounting $104 and $225 were included in the amounts charged to expense for 2014 and 2013, respectively. The Company has ceased making contributions to the SERP Plan at the present time and does not expect to resume making contributions to the SERP Plan in the foreseeable future.
| 111 |
BAYLAKE CORP.
NOTES TO CONSOLIDATED FINANCIAL STATEMENTS
December 31, 2015, 2014 and 2013
(Dollar amounts in thousands)
NOTE 18- INCOME TAXES
Income tax expense (benefit) consists of the following:
| For the year ended December 31, | ||||||||||||
| 2015 | 2014 | 2013 | ||||||||||
| Current income taxes | ||||||||||||
| Federal | $ | 2,005 | $ | 1,639 | $ | 922 | ||||||
| State | 817 | 496 | (66 | ) | ||||||||
| 2,822 | 2,135 | 856 | ||||||||||
| Deferred income taxes | ||||||||||||
| Federal | 815 | 1,023 | 1,535 | |||||||||
| State | 72 | 94 | 928 | |||||||||
| 887 | 1,117 | 2,463 | ||||||||||
| Income tax expense | $ | 3,709 | $ | 3,252 | $ | 3,319 | ||||||
The provision for income taxes differs from the amount of income tax determined by applying the statutory federal income tax rate to pretax income as a result of the following differences:
| For the year ended December 31, | ||||||||||||
| 2015 | 2014 | 2013 | ||||||||||
| Income tax expense based on statutory rate (34%) | $ | 3,987 | $ | 4,140 | $ | 3,851 | ||||||
| State income tax expense net of federal tax expense | 587 | 643 | 569 | |||||||||
| Effect of tax-exempt interest income | (653 | ) | (687 | ) | (698 | ) | ||||||
| Life insurance death benefit and earnings | (121 | ) | (130 | ) | (119 | ) | ||||||
| Equity in income of UFS subsidiary | (413 | ) | (320 | ) | (254 | ) | ||||||
| Deferred tax reversal related to UFS subsidiary restructure | — | (332 | ) | — | ||||||||
| Non-deductible/partially deductible merger expenses | 266 | — | — | |||||||||
| Other | 56 | (62 | ) | (30 | ) | |||||||
| Expense based on effective tax rates | $ | 3,709 | $ | 3,252 | $ | 3,319 | ||||||
Deferred income taxes reflect the net tax effects of temporary differences between the carrying amounts of assets and liabilities for financial reporting purposes and the amounts used for income tax purposes.
| 112 |
BAYLAKE CORP.
NOTES TO CONSOLIDATED FINANCIAL STATEMENTS
December 31, 2015, 2014 and 2013
(Dollar amounts in thousands)
NOTE 18- INCOME TAXES (Continued)
The following is a summary of the significant components of the Company’s deferred income tax assets and liabilities as of December 31, 2015 and 2014:
| 2015 | 2014 | |||||||||
| Deferred income tax assets | ||||||||||
| Allowance for loan losses | $ | 2,245 | $ | 2,765 | ||||||
| Deferred loan fees | 194 | 196 | ||||||||
| Deferred compensation | 1,206 | 1,464 | ||||||||
| Nonaccrual loans | 98 | 189 | ||||||||
| Accrued vacation pay | 676 | 603 | ||||||||
| Fixed asset write-downs | 135 | — | ||||||||
| OREO property valuation/expenses | 712 | 465 | ||||||||
| Deferred tax credits-AMT | 1,600 | 2,241 | ||||||||
| Deferred tax assets related to merger | 680 | — | ||||||||
| State net operating loss carry forwards (“NOLs”) | 526 | 559 | ||||||||
| Other | 379 | 274 | ||||||||
| Total deferred tax assets | 8,451 | 8,756 | ||||||||
| Deferred income tax liabilities | ||||||||||
| Depreciation | 1,237 | 1,701 | ||||||||
| FHLB stock dividends | 424 | 413 | ||||||||
| Mortgage loan servicing | 317 | 185 | ||||||||
| Net unrealized gain on securities available for sale | 783 | 1,508 | ||||||||
| Net unrealized gain on SERP | 120 | — | ||||||||
| Equity in UFS subsidiary | — | — | ||||||||
| Prepaid expenditures | 240 | 153 | ||||||||
| Core deposit intangibles related to merger | 415 | — | ||||||||
| Deferred tax liabilities related to merger | 147 | — | ||||||||
| Other | 15 | 89 | ||||||||
| Total deferred income tax liabilities | 3,698 | 4,049 | ||||||||
| Net deferred income tax assets | $ | 4,753 | $ | 4,707 |
The Company has state net operating loss carry forwards of $10,094 and $10,725 at December 31, 2015 and December 31, 2014, respectively. These net operating losses expire in 2031.
Income tax expense recorded in the consolidated statement of operations involves the interpretation and application of certain accounting pronouncements and federal and state tax codes. The Company undergoes examination by various regulatory taxing agencies. Such agencies may require that changes in the amount of tax expense be recognized when their interpretations differ from those of management, based on their judgment about information available to them at the time of their examination.
The Company and its subsidiaries are subject to U.S. federal and Wisconsin state income tax. The Company and its subsidiaries file a consolidated federal income tax return and a combined Wisconsin tax return. The Company is no longer subject to examination by U.S. Federal taxing authorities for years before 2012 and for Wisconsin state income taxes for years before 2011. During the third quarter of 2014, the IRS began an audit of the Company’s 2012 federal income tax return. The audit was concluded in the first quarter of 2015. There were no adjustments related to the audit. The Company does not expect the total amount of unrecognized tax benefits to significantly increase or decrease in the next twelve months.
The Company recognizes interest and/or penalties related to income tax matters in income tax expense.
| 113 |
BAYLAKE CORP.
NOTES TO CONSOLIDATED FINANCIAL STATEMENTS
December 31, 2015, 2014 and 2013
(Dollar amounts in thousands, except shares and per share data)
NOTE 19 - EARNINGS PER SHARE
Earnings per share is based on the weighted average number of shares outstanding for the year. A reconciliation of the basic and diluted earnings per share amounts is as follows:
| For the year ended December 31, | ||||||||||||
| 2015 | 2014 | 2013 | ||||||||||
| Basic | ||||||||||||
| Net income | $ | 8,017 | $ | 8,923 | $ | 8,009 | ||||||
| Weighted average common shares outstanding | 9,302,699 | 8,354,034 | 7,902,732 | |||||||||
| Basic earnings per common share | $ | 0.86 | $ | 1.07 | $ | 1.01 | ||||||
| Diluted | ||||||||||||
| Net income | 8,017 | 8,923 | 8,009 | |||||||||
| Earnings from assumed conversion of convertible debentures | 16 | (1) | 372 | 593 | ||||||||
| Net income | $ | 8,033 | $ | 9,295 | $ | 8,602 | ||||||
| Weighted average common shares outstanding for basic earnings per share | 9,302,699 | 8,354,034 | 7,902,732 | |||||||||
| Add: Dilutive effects of assumed exercises of stock options and vesting of restricted stock units | 79,483 | 81,019 | 68,910 | |||||||||
| Add: Dilutive effects of convertible promissory notes | 53,014 | (1) | 1,165,055 | 1,880,000 | ||||||||
| Average shares and dilutive potential common shares | 9,435,196 | 9,600,108 | 9,851,642 | |||||||||
| Diluted earnings per common share | $ | 0.85 | $ | 0.97 | $ | 0.87 | ||||||
| Additional common stock option shares that have not been included due to their antidilutive effect | 109,301 | 61,469 | 49,949 | |||||||||
| Additional common stock convertible debenture shares that have not been included due to their antidilutive effect | — | — | — | |||||||||
| (1) | Although the convertible debentures were fully converted and not outstanding at December 31, 2015, they are considered as a factor in the calculation of diluted earnings per common share due to being outstanding during part of 2015 |
NOTE 20 – EQUITY INCENTIVE PLAN
The Company has a non-qualified stock option plan (the “Option Plan”) under which certain officers and key salaried employees may purchase shares of the Company’s stock at an established exercise price. Unless earlier terminated, these options expire ten years from the date of grant. The options vest over a five-year period becoming exercisable 20% per year, commencing one year from date of grant. The Option Plan expired in 2003 and no options remain outstanding under the Option Plan. There was no compensation expense recognized for the Option Plan in 2015, 2014 and 2013. At December 31, 2015, 2014 and 2013, there was no unrecognized compensation cost related to the Option Plan. There were no unexercised vested options outstanding at December 31, 2015 or 2014. At December 31, 2013, there were 10,000 options vested but unexercised.
| 114 |
BAYLAKE CORP.
NOTES TO CONSOLIDATED FINANCIAL STATEMENTS
December 31, 2015, 2014 and 2013
(Dollar amounts in thousands, except shares and per share data)
NOTE 20 - EQUITY INCENTIVE PLAN (Continued)
In June 2010, the Company’s shareholders approved the Baylake Corp 2010 Equity Incentive Plan (the “2010 Plan”), under which current and prospective employees, non-employee directors and consultants may be awarded incentive stock options, non-statutory stock options, shares of restricted stock or restricted stock units (“RSUs”), or stock appreciation rights. The aggregate number of shares of the Company’s common stock issuable under the 2010 Plan is 750,000.
Stock Options
On March 17, 2015, the Company granted 58,434 stock options to certain members of management at the market value of the stock on the grant date, which was $12.52 per share. The options granted expire 10 years from date of grant and vest ratably over a five-year period. The fair value of the stock options granted was $1.81 per option, determined under the Black-Scholes option pricing model. Compensation cost to be recognized over the five-year vesting period, net of income tax, is $64. As of December 31, 2015, none of the options were vested and 14,357 options had been forfeited. Unrecognized compensation expense, net of income tax, is $50.
Restricted Stock Units
On January 20, 2015, the Company granted 1,281 RSUs to a certain member of management at the market value of the stock, which was $12.10 per share. The RSUs were awarded at no cost to the employee and vest ratably over a five-year period. The compensation cost to be recognized over the five-year period was $9. As of December 31, 2015, these RSUs had been forfeited. There is no unrecognized compensation expense related to this grant.
On March 17, 2015, the Company granted 25,342 RSUs to certain members of management at the market value of the stock, which was $12.52 per share. The RSUs were awarded at no cost to the employee and vest ratably over a five-year period. Compensation cost to be recognized over the five-year vesting period, net of income tax, is $193. As of December 31, 2015, none of the RSUs were vested. During 2015, 10,600 RSUs were forfeited. Unrecognized compensation expense related to this grant, net of income tax, is $149.
Accounting for Stock Options
The fair value of each option grant was estimated as of the date of the grant using the Black-Scholes option pricing model. The risk-free interest rate is based on the U.S. Treasury rate for the expected option term. The expected volatility is based on the volatility of the Company’s stock over the 36-month period preceding the grant date. The expected term represents the period of time the options are expected to be outstanding. The grant date fair values and assumptions used to determine such values are as follows:
| 2015 | 2014 | |||||||
| Weighted average grant date fair value | $ | 1.81 | $ | 3.26 | ||||
| Assumptions: | ||||||||
| Risk-free interest rate | 1.87 | % | 2.26 | % | ||||
| Expected volatility | 18.35 | % | 25.45 | % | ||||
| Expected term (in years) | 7 | years | 7 | years | ||||
| Expected dividend yield | 2.56 | % | 2.01 | % |
| 115 |
BAYLAKE CORP.
NOTES TO CONSOLIDATED FINANCIAL STATEMENTS
December 31, 2015, 2014 and 2013
(Dollar amounts in thousands, except shares and per share data)
NOTE 20 - EQUITY INCENTIVE PLAN (Continued)
Activity in the stock option plans during 2015 follows:
| Shares | Weighted
Average Exercise Price | Weighted Average Remaining Contractual Term | Aggregate Intrinsic Value | |||||||||||||
| Outstanding at beginning of year | 225,736 | $ | 8.34 | 7.68 | ||||||||||||
| Granted | 58,434 | 12.52 | — | |||||||||||||
| Exercised | (29,566 | ) | 5.16 | — | ||||||||||||
| Forfeited or expired | (14,537 | ) | 9.67 | — | ||||||||||||
| Outstanding at end of year | 240,067 | $ | 9.66 | 7.39 | ||||||||||||
| Exercisable at end of year | 83,268 | $ | 7.07 | 6.32 | $ | 627 | ||||||||||
| Fully vested and expected to vest | 240,067 | $ | 9.66 | 7.39 | $ | 1,187 | ||||||||||
Activity in the stock option plans during 2014 follows:
| Shares | Weighted
Average Exercise Price | Weighted
Average Remaining Contractual Term | Aggregate Intrinsic Value | |||||||||||||
| Outstanding at beginning of year | 175,824 | $ | 6.69 | 7.63 | ||||||||||||
| Granted | 64,130 | 13.90 | — | |||||||||||||
| Exercised | (1,557 | ) | 4.15 | — | ||||||||||||
| Forfeited or expired | (12,661 | ) | 14.10 | — | ||||||||||||
| Outstanding at end of year | 225,736 | $ | 8.34 | 7.68 | ||||||||||||
| Exercisable at end of year | 67,930 | $ | 5.56 | 6.83 | $ | 471 | ||||||||||
| Fully vested and expected to vest | 225,736 | $ | 8.34 | 7.68 | $ | 1,024 | ||||||||||
Activity in the stock option plan during 2013 follows:
| Shares | Weighted
Average Exercise Price | Weighted Average Remaining Contractual Term | Aggregate Intrinsic Value | |||||||||||||
| Outstanding at beginning of year | 163,281 | $ | 6.44 | 7.48 | ||||||||||||
| Granted | 43,176 | 9.50 | — | |||||||||||||
| Exercised | (6,971 | ) | 4.40 | — | ||||||||||||
| Forfeited or expired | (23,662 | ) | 10.81 | — | ||||||||||||
| Outstanding at end of year | 175,824 | $ | 6.69 | 7.63 | ||||||||||||
| Exercisable at end of year | 45,738 | $ | 6.91 | 5.92 | $ | 202 | ||||||||||
| Fully vested and expected to vest | 175,824 | $ | 6.69 | 7.63 | $ | 1,125 | ||||||||||
| 116 |
BAYLAKE CORP.
NOTES TO CONSOLIDATED FINANCIAL STATEMENTS
December 31, 2015, 2014 and 2013
(Dollar amounts in thousands, except shares and per share data)
NOTE 20 - EQUITY INCENTIVE PLAN (Continued)
The following options were outstanding at December 31, 2015:
| Number of Shares | Weighted-Average Exercise | Weighted-Average Remaining Life (in Years) |
||||||||||||||||||||||||
| Price | Outstanding | Exercisable | Outstanding | Exercisable | ||||||||||||||||||||||
| $ | 4.15 | 38,966 | 27,989 | $ | 4.15 | $ | 4.15 | 5.20 | ||||||||||||||||||
| $ | 6.20 | 52,388 | 30,430 | $ | 6.20 | $ | 6.20 | 6.25 | ||||||||||||||||||
| $ | 9.50 | 34,716 | 13,891 | $ | 9.50 | $ | 9.50 | 7.21 | ||||||||||||||||||
| $ | 12.52 | 58,434 | — | $ | 12.52 | $ | — | 9.21 | ||||||||||||||||||
| $ | 13.90 | 55,563 | 10,958 | $ | 13.90 | $ | 13.90 | 8.21 | ||||||||||||||||||
| 240,067 | 83,268 | $ | 9.66 | $ | 7.07 | 7.39 | ||||||||||||||||||||
Information related to the stock option plans during each year follows:
| 2015 | 2014 | 2013 | ||||||||||
| Intrinsic value of options exercised | $ | 245 | $ | 13 | $ | 42 | ||||||
| Cash received from option exercises | 152 | 7 | 31 | |||||||||
| Tax benefit realized from option exercises | 63 | 5 | 8 | |||||||||
The following table summarizes information about the Company’s RSU activity for 2015, 2014, and 2013:
Restricted Stock Units
Activity in the RSUs during 2015 were as follows:
| RSUs | Weighted Average Grant Price |
|||||||
| Outstanding at beginning of year | 106,834 | $ | 7.53 | |||||
| Granted | 26,623 | 12.50 | ||||||
| Vested | (35,556 | ) | 6.76 | |||||
| Forfeited or expired | (10,600 | ) | 8.15 | |||||
| Outstanding at end of year | 87,301 | $ | 9.45 |
Activity in the RSUs during 2014 were as follows
| RSUs | Weighted Average Grant Price | |||||||
| Outstanding at beginning of year | 122,685 | $ | 6.43 | |||||
| Granted | 17,040 | 13.72 | ||||||
| Vested | (32,267 | ) | 6.05 | |||||
| Forfeited or expired | (624 | ) | 13.90 | |||||
| Outstanding at end of year | 106,834 | $ | 7.53 | |||||
| 117 |
BAYLAKE CORP.
NOTES TO CONSOLIDATED FINANCIAL STATEMENTS
December 31, 2015, 2014 and 2013
(Dollar amounts in thousands, except shares and per share data)
NOTE 20 - EQUITY INCENTIVE PLAN (Continued)
Activity in the RSUs during 2013 were as follows:
| RSUs | Weighted
Average Grant Price |
|||||||
| Outstanding at beginning of year | 124,671 | $ | 5.28 | |||||
| Granted | 35,177 | 9.50 | ||||||
| Vested | (28,679 | ) | 5.13 | |||||
| Forfeited or expired | (8,484 | ) | 6.62 | |||||
| Outstanding at end of year | 122,685 | $ | 6.43 | |||||
It is expected that all equity positions outstanding at the date of merger with Nicolet, excepting those that have been granted to the Chief Executive Officer, will immediately vest.
NOTE 21 - CONDENSED FINANCIAL INFORMATION - PARENT COMPANY ONLY
CONDENSED BALANCE SHEETS
December 31,
| 2015 | 2014 | |||||||
| ASSETS | ||||||||
| Cash and due from financial institutions | $ | 3,022 | $ | 2,015 | ||||
| Deferred income taxes | 260 | 188 | ||||||
| Unamortized debt offering costs | — | — | ||||||
| Income tax receivable | 159 | 20 | ||||||
| Investment in subsidiaries | 130,650 | 121,061 | ||||||
| Other assets | 379 | 13 | ||||||
| Total assets | $ | 134,470 | $ | 123,297 | ||||
| LIABILITIES AND STOCKHOLDERS’ EQUITY | ||||||||
| Liabilities | ||||||||
| Interest payable | $ | 21 | $ | 43 | ||||
| Other borrowings | 4,000 | — | ||||||
| Debentures | 16,100 | 16,100 | ||||||
| Convertible promissory notes | — | 1,650 | ||||||
| Total liabilities | 20,121 | 17,793 | ||||||
| Stockholders’ equity | 114,349 | 105,504 | ||||||
| Total liabilities and stockholders’ equity | $ | 134,470 | $ | 123,297 | ||||
| 118 |
BAYLAKE CORP.
NOTES TO CONSOLIDATED FINANCIAL STATEMENTS
December 31, 2015, 2014 and 2013
(Dollar amounts in thousands)
NOTE 21 - CONDENSED FINANCIAL INFORMATION - PARENT COMPANY ONLY (Continued)
CONDENSED STATEMENTS OF OPERATIONS
Years ended December 31,
| 2015 | 2014 | 2013 | ||||||||||
| Income | ||||||||||||
| Dividends from subsidiaries | $ | 8,000 | $ | 6,000 | $ | 5,724 | ||||||
| Interest income | 5 | 3 | 5 | |||||||||
| Other | — | — | 1 | |||||||||
| Total income | 8,005 | 6,003 | 5,730 | |||||||||
| Expenses | ||||||||||||
| Interest | 305 | 871 | 1,242 | |||||||||
| Other | 784 | 667 | 552 | |||||||||
| Total expenses | 1,089 | 1,538 | 1,794 | |||||||||
| Income before equity in undistributed net income of subsidiaries | 6,916 | 4,465 | 3,936 | |||||||||
| Equity in undistributed net income of subsidiaries (earnings in excess of dividends) | 676 | 3,761 | 3,316 | |||||||||
| Income before income taxes | 7,592 | 8,226 | 7,252 | |||||||||
| Income tax benefit | (425 | ) | (697 | ) | (757 | ) | ||||||
| Net income | $ | 8,017 | $ | 8,923 | $ | 8,009 | ||||||
| 119 |
BAYLAKE CORP.
NOTES TO CONSOLIDATED FINANCIAL STATEMENTS
December 31, 2015, 2014 and 2013
(Dollar amounts in thousands)
NOTE 21 - CONDENSED FINANCIAL INFORMATION - PARENT COMPANY ONLY (Continued)
CONDENSED STATEMENT OF CASH FLOWS
Years ended December 31,
| 2015 | 2014 | 2013 | ||||||||||
| Cash flows from operating activities: | ||||||||||||
| Net income | $ | 8,017 | $ | 8,923 | $ | 8,009 | ||||||
| Adjustments to reconcile net income to net cash provided by operating activities: | ||||||||||||
| Undistributed earnings of subsidiary (earnings in excess of dividends) | (676 | ) | (3,761 | ) | (3,316 | ) | ||||||
| Amortization of debt issuance costs | — | 27 | 36 | |||||||||
| Net change in income tax receivable | (139 | ) | 95 | 600 | ||||||||
| Other changes, net | 343 | 212 | 301 | |||||||||
| Net cash flows provided by operating activities | 7,545 | 5,496 | 5,630 | |||||||||
| Cash flows from investing activities: | ||||||||||||
| Capitalization of non-bank subsidiary | (150 | ) | — | (100 | ) | |||||||
| Net cash used in acquisition | (5,783 | ) | — | — | ||||||||
| Net cash used in investing activities | (5,933 | ) | — | (100 | ) | |||||||
| Cash flows from financing activities: | ||||||||||||
| Proceeds from other borrowings | 4,000 | — | — | |||||||||
| Purchase of treasury stock | (1,447 | ) | (4,241 | ) | (1,707 | ) | ||||||
| Dividends paid | (3,158 | ) | (2,519 | ) | (1,738 | ) | ||||||
| Net cash used in financing activities | (605 | ) | (6,760 | ) | (3,445 | ) | ||||||
| Net change in cash and cash equivalents | 1,007 | (1,264 | ) | 2,085 | ||||||||
| Beginning cash and cash equivalents | 2,015 | 3,279 | 1,194 | |||||||||
| Ending cash and cash equivalents | $ | 3,022 | $ | 2,015 | $ | 3,279 | ||||||
| 120 |
BAYLAKE CORP.
NOTES TO CONSOLIDATED FINANCIAL STATEMENTS
December 31, 2015, 2014 and 2013
(Dollar amounts in thousands except per share data)
NOTE 22 – SELECTED QUARTERLY FINANCIAL DATA
The following is selected unaudited financial data summarizing the results of operations for each quarter in the years ended December 31, 2015 and 2014:
| 2015 Quarter Ended | ||||||||||||||||
| March 31 | June 30 | September 30 | December 31 | |||||||||||||
| Interest income | $ | 8,643 | $ | 8,841 | $ | 8,620 | $ | 9,171 | ||||||||
| Interest expense | 681 | 686 | 627 | 641 | ||||||||||||
| Net interest income | 7,962 | 8,155 | 7,993 | 8,530 | ||||||||||||
| Provision for loan losses | 200 | — | — | — | ||||||||||||
| Net interest income after provision for loan losses | 7,762 | 8,155 | 7,993 | 8,530 | ||||||||||||
| Noninterest income | 2,391 | 2,567 | 2,273 | 2,465 | ||||||||||||
| Noninterest expense | 7,078 | 7,247 | 6,944 | 9,141 | ||||||||||||
| Income before income tax expense | 3,075 | 3,475 | 3,322 | 1,854 | ||||||||||||
| Provision for income tax | 868 | 1,093 | 1,031 | 717 | ||||||||||||
| Net income | $ | 2,207 | $ | 2,382 | $ | 2,291 | $ | 1,137 | ||||||||
| Basic earnings per share | $ | 0.24 | $ | 0.26 | $ | 0.25 | $ | 0.12 | ||||||||
| Diluted earnings per share | $ | 0.24 | $ | 0.25 | $ | 0.24 | $ | 0.12 | ||||||||
| 2014 Quarter Ended | ||||||||||||||||
| March 31 | June 30 | September 30 | December 31 | |||||||||||||
| Interest income | $ | 8,512 | $ | 8,795 | $ | 8,541 | $ | 8,895 | ||||||||
| Interest expense | 922 | 949 | 783 | 659 | ||||||||||||
| Net interest income | 7,590 | 7,846 | 7,758 | 8,236 | ||||||||||||
| Provision for loan losses | — | — | — | — | ||||||||||||
| Net interest income after provision for loan losses | 7,590 | 7,846 | 7,758 | 8,236 | ||||||||||||
| Noninterest income | 2,016 | 2,166 | 2,329 | 2,556 | ||||||||||||
| Noninterest expense | 6,768 | 6,994 | 6,508 | 8,052 | ||||||||||||
| Income before income tax expense | 2,838 | 3,018 | 3,579 | 2,740 | ||||||||||||
| Provision for income tax | 773 | 859 | 1,122 | 498 | ||||||||||||
| Net income | $ | 2,065 | $ | 2,159 | $ | 2,457 | $ | 2,242 | ||||||||
| Basic earnings per share | $ | 0.27 | $ | 0.27 | $ | 0.29 | $ | 0.25 | ||||||||
| Diluted earnings per share | $ | 0.23 | $ | 0.24 | $ | 0.26 | $ | 0.24 | ||||||||
| 121 |
ITEM 9. CHANGES IN AND DISAGREEMENTS WITH ACCOUNTANTS ON ACCOUNTING AND FINANCIAL DISCLOSURE
None.
ITEM 9A. CONTROLS AND PROCEDURES
Disclosures Controls and Procedures: Our management, with the participation of our Chief Executive Officer and Chief Financial Officer, has evaluated the effectiveness of our disclosure controls and procedures (as such term is defined in Rules 13a-15(e) and 15d-15(e) under the Securities Exchange Act of 1934, as amended (the “Exchange Act”)) as of December 31, 2015. Based on such evaluation, our Chief Executive Officer and Chief Financial Officer have concluded that, as of the end of such period, our disclosure controls and procedures are effective in recording, processing, summarizing and reporting, on a timely basis, information required to be disclosed by us in the reports that we file or submit under the Exchange Act.
There are inherent limitations in the effectiveness of any system of internal control over financial reporting, including the possibility of human error and circumvention or overriding of controls. Accordingly, even an effective system of internal control over financial reporting can provide only reasonable assurance with respect to financial statement preparation. Projections of any evaluation of effectiveness to future periods are subject to the risks that controls may become inadequate because of changes in conditions or that the degree of compliance with the policies or procedures may deteriorate.
Management’s Report on Internal Control over Financial Reporting: The report of our management on our internal control over financial reporting appears on page 65 of this Annual Report on Form 10-K.
Baker Tilly Virchow Krause, LLP, the independent registered public accounting firm that audited our consolidated financial reports included in this Annual Report on Form 10-K, has issued an attestation report on the effectiveness of our internal control over financial reporting as of December 31, 2015. The report, which expresses an unqualified opinion on the effectiveness of our internal controls over financial reporting as of December 31, 2015, is included under Item 8 of this Annual Report on Form 10-K.
Changes in Internal Control Over Financial Reporting: There have not been any changes in our internal control over financial reporting (as such term is defined in Rules 13a-15(f) and 15d-15(f) under the Exchange Act) that have occurred during the quarter ended December 31, 2015, that have materially affected or are reasonably likely to materially affect our internal control over financial reporting.
None.
| 122 |
ITEM 10. DIRECTORS, EXECUTIVE OFFICERS AND CORPORATE GOVERNANCE
The information set forth under the sections titled “Proposal No. 1, Election of Directors,” “Information on Executive Officers” and “Compliance with Section 16(a) of the Exchange Act” contained in the definitive proxy statement for our 2016 Annual Meeting of Shareholders is incorporated herein by reference.
ITEM 11. EXECUTIVE COMPENSATION
The information set forth under the sections titled “Director Fees and Benefits”, “Compensation Discussion and Analysis”, “Board of Directors Compensation Committee Report on Management Compensation”, and “Compensation Committee Interlocks and Insider Participation” contained in the definitive proxy statement for our 2016 Annual Meeting of Shareholders is incorporated herein by reference.
ITEM 12. SECURITY OWNERSHIP OF CERTAIN BENEFICIAL OWNERS AND MANAGEMENT AND RELATED STOCKHOLDER MATTERS
The information set forth under the section titled “Ownership of Baylake Common” contained in the definitive proxy statement for our 2016 Annual Meeting of Shareholders is incorporated herein by reference.
Equity compensation plan information:
The following table sets forth information regarding options and shares reserved for future issuance under the equity compensation plans as of December 31, 2015.
| Number of securities to be issued upon exercise of outstanding options, warrants and rights | Weighted-average exercise price of outstanding options, warrants and rights | Number of securities remaining available for future issuance under equity compensation plans (excluding securities reflected in column (a)) | ||||||||||
| Plan Category | (a) | (b) | (c) | |||||||||
| Equity compensation plans approved by security holders | 240,067 | $ | 9.66 | 272,228 | ||||||||
| Total | 240,067 | $ | 9.66 | 272,228 | ||||||||
ITEM 13. CERTAIN RELATIONSHIPS AND RELATED TRANSACTIONS, AND DIRECTOR INDEPENDENCE
Information set forth in the section titled “Certain Transactions with Management” in the definitive proxy statement for our 2016 Annual Meeting of Shareholders is incorporated herein by reference.
ITEM 14. PRINCIPAL ACCOUNTANT FEES AND SERVICES
Information set forth in the section titled “Principal Accountant Fees and Services” in the definitive proxy statement for our 2016 Annual Meeting of Shareholders is incorporated herein by reference.
| 123 |
ITEM 15. EXHIBITS AND FINANCIAL STATEMENT SCHEDULES
(a) 1 and 2
The consolidated financial statements and supplementary data contained in Item 8 of this report are filed as part of this Form 10-K.
All schedules have been omitted as the required information is either inapplicable or included in the Notes to Consolidated Financial Statements contained in Part II, Item 8 of this Form 10-K.
Reference is made to the Exhibit Index following the signatures for exhibits filed as part of this Form 10-K.
| 124 |
Pursuant to the requirements of Section 13 or 15 (d) of the Securities Exchange Act of 1934, the registrant has duly caused this report to be signed on its behalf by the undersigned, thereunto duly authorized.
| BAYLAKE CORP. | |||
| By: | /s/Robert J. Cera | ||
| Robert J. Cera | |||
| President and Chief Executive Officer and | |||
| Director (Principal Executive Officer) | |||
| By: | /s/Kevin L. LaLuzerne | ||
| Kevin L. LaLuzerne | |||
| Chief Financial Officer and Treasurer | |||
| (Principal Financial and Accounting Officer) | |||
| Date: March 4, 2016 | |||
POWER OF ATTORNEY
KNOW ALL MEN BY THESE PRESENTS, that each individual whose signature appears below hereby designates and appoints Robert J. Cera and Kevin L. LaLuzerne, and each of them, any one of whom may act without the joinder of the other, as such person’s true and lawful attorney-in-fact and agents (the “Attorneys-in-Fact”) with full power of substitution and resubstitution, for such person and in such person’s name, place and stead, in any and all capacities, to sign any and all amendments to this report, and to file the same, with all exhibits thereto, and other documents in connection therewith, the Securities and Exchange Commission and any state securities commission, granting unto said Attorneys-in-Fact and agents, and each of them, full power and authority to do and perform each and every act and thing requisite and necessary to be done in and about the premises, as fully to all intents and purposes as he might or could do in person, hereby ratifying and conforming all that said Attorneys-in-Fact and agents or any of them, or their or his substitutes, may lawfully do or cause to be done by virtue hereof.
| 125 |
Pursuant to the requirements of the Securities Exchange Act of 1934 this report has been signed below by the following persons on behalf of the registrant and in the capacities and on the dates indicated.
| /s/ Robert W. Agnew | /s/ Louis J. “Rick” Jeanquart | ||
| Robert W. Agnew, Director | Louis J. “Rick” Jeanquart, Director | ||
| Chairman of the Board | Vice Chairman of the Board | ||
| /s/ Robert J. Cera | /s/ Kevin L. LaLuzerne | ||
| Robert J. Cera, President and Chief Executive | Kevin L. LaLuzerne, Chief Financial Officer | ||
| Officer and Director (Principal Executive | and Treasurer ( Principal Financial and | ||
| Officer) | Accounting Officer) | ||
| /s/ Roger G. Ferris | /s/ Elyse Mollner Stackhouse | ||
| Roger G. Ferris, Director | Elyse Mollner Stackhouse, Director | ||
| /s/ Terrence R. Fulwiler | /s/ Joseph J. Morgan | ||
| Terrence R. Fulwiler, Director | Joseph J. Morgan, Director | ||
| /s/ Dee Geurts-Bengston | /s/ Dean J. Nolden | ||
| Dee Geurts-Bengston, Director | Dean J. Nolden, Director | ||
| /s/ Thomas L. Herlache | /s/ William D. Murphy | ||
| Thomas L. Herlache, Director | William D. Murphy, Director |
||
| /s/ Paul Jay Sturm | |||
| Paul Jay Sturm, Director |
* Each of the above signatures is affixed as of March 4, 2016.
| 126 |
| Exhibit No. | Description |
| 2.1 | Agreement and Plan of Merger dated as of May 5, 2015 by and between Baylake Corp. and NEW Bancshares, Inc., incorporated by reference to the Company’s Current Report on Form 8-K filed on May 8, 2015 |
| 2.2 | Agreement and Plan of Merger dated as of September 8, 2015 by and between Nicolet Bankshares, Inc., and Baylake Corp., incorporated by reference to the Company’s Current Report on Form 8-K filed on September 11, 2015 |
| 2.3 | First Amendment to Agreement and Plan of Merger dated as of October 14, 2015 by and between Baylake Corp., and NEW Bancshares, Inc., incorporated by reference to the Company’s Current Report on Form 8-K filed on October 16, 2015 |
| 3.1 | Articles of Incorporation, as amended through July 3, 2001, incorporated by reference to Exhibit 4.1 from the Company’s Registration Statement on Form S-3 (File No. 333-118857) filed on September 8, 2004 |
| 3.2 | Articles of Amendment to Articles of Incorporation, incorporated by reference to Exhibit 3.1 from the Company’s Quarterly Report on Form 10-Q for the quarter ended June 30, 2007 |
| 3.3 | Composite Articles of Incorporation, incorporated by reference to Exhibit 3.2 from the Company’s Quarterly Report on Form 10-Q for the quarter ended June 30, 2007 |
| 3.4 | Bylaws, as amended through February 21, 1996, incorporated by reference to Exhibit 4.2 from the Company’s Registration Statement on Form S-3 (File No. 333-118857) filed on September 8, 2004 |
| 4.1 | Advances, Collateral Pledge, and Security Agreement dated as of August 8, 1997 between Baylake Bank and Federal Home Loan Bank of Chicago, incorporated by reference to Exhibit 4.1 from the Company’s Annual Report on Form 10-K for the fiscal year ended December 31, 2006 |
| 10.1 | Baylake Bank’s Deferred Compensation Program with Thomas L. Herlache*, incorporated by reference to Exhibit 10.3 from the Company’s Annual Report on Form 10-K for the fiscal year ended December 31, 1993 |
| 10.2 | Baylake Bank’s Deferred Compensation and Salary Continuation Agreement with Richard A. Braun*, incorporated by reference to Exhibit 10.5 from the Company’s Annual Report on Form 10-K for the fiscal year ended December 31, 1993 |
| 10.3 | Deferred Compensation Plan for Selected Directors of Baylake Bank (Money Purchase Compensation Plan) dated December 19, 1995*, incorporated by reference to Exhibit 10.3 from the Company’s Annual Report on Form 10-K for the fiscal year ended December 31, 2006 |
| 10.4 | Baylake Corp. Stock Purchase Plan*, incorporated by reference to Exhibit 4 from the Company’s Form S-8 filed on February 10, 1998 |
| 10.5 | Baylake Corp. 1993 Stock Option Plan, as amended in 1998*, incorporated by reference to Exhibit 99.1 from the Company’s Form S-8 filed on September 21, 1998 |
| 10.6 | Baylake Bank Supplemental Executive Retirement Plan*, incorporated by reference to Exhibit 10.8 from the Company’s Annual Report on Form 10-K for the fiscal year ended December 31, 2004 |
| 10.7 | Employment Agreement dated as of June 30, 2006 between Baylake Bank and Robert J. Cera*, incorporated by reference to Exhibit 10.7 from the Company’s Annual Report on Form 10-K for the fiscal year ended December 31, 2006 |
| 10.8 | Executive Employee Salary Continuation Agreement for Thomas L. Herlache dated October 1, 1999*, incorporated by reference to Exhibit 10.9 from the Company’s Annual Report on Form 10-K for the Fiscal year ended December 31, 2006 |
| 127 |
| 10.9 | Preferred Compensation Agreement, incorporated by reference to Exhibit 10.1 from the Company’s Quarterly Report on Form 10-Q for the quarter ended March 31, 2007* |
| 10.10 | Non-Qualified Retirement Trust incorporated by reference from the Company’s Quarterly Report on Form 10-Q for the quarter ended March 31, 2007* |
| 10.11 | Amendments to Deferred Compensation Agreements with Thomas L. Herlache and Summary of Benefits for serving as Chairman, incorporated by reference from the Company’s Quarterly Report on Form 10-Q for the quarter ended June 30, 2007* |
| 10.12 | Baylake Corp. 2010 Equity Incentive Plan, incorporated by reference to Exhibit A to the Proxy Statement on Schedule 14A filed on April 28, 2010 in connection with the Company’s 2010 Annual Meeting* |
| 10.13 | Full and Final Separation Agreement and Release dated as of December 29, 2015 by and between Baylake Bank and Kenneth Lammersfeld, incorporated by reference to the Company’s Current Report on Form 8-K filed on December 31, 2015* |
| 21.1 | List of Subsidiaries |
| 23.1 | Consent of Baker Tilly Virchow Krause, LLP |
| 24.1 | Power of Attorney (contained on the Signature Page) |
| 31.1 | Certification of the Chief Executive Officer pursuant to Rule 13a-14(a) under the Securities Exchange Act of 1934, as amended |
| 31.2 | Certification of the Chief Financial Officer pursuant to Rule 13a-14(a) under the Securities Exchange Act of 1934, as amended |
| 32.1 | Certification of the Chief Executive Officer pursuant to Rule 13a-14(b) under the Securities Exchange Act of 1934, as amended and 18 U.S.C. Section 1350 |
| 32.2 | Certification of the Chief Financial Officer pursuant to Rule 13a-14(b) under the Securities Exchange Act of 1934, as amended and 18 U.S.C. Section 1350 |
| 101.1 | The following materials for year ended December 31, 2015, formatted in XBRL (Extensible Business Reporting Language); (i)the Consolidated Balance Sheets, (ii) the Consolidated Statements of Operations, (iii) the Consolidated Statements of Comprehensive Income, (iv) the Consolidated Statements of Changes in Stockholders’ Equity, (v) the Consolidated Statements of Cash Flows, and (vi) the Notes to the Consolidated Financial Statements (filed herewith) |
*Designates compensation plans or agreements
| 128 |