Attached files
| file | filename |
|---|---|
| EX-31.2 - EX-31.2 - TopBuild Corp | bld-20151231ex312769f75.htm |
| EX-10.10 - EX-10.10 - TopBuild Corp | bld-20151231ex10102fb61.htm |
| EX-31.1 - EX-31.1 - TopBuild Corp | bld-20151231ex3113f4a31.htm |
| EX-10.11 - EX-10.11 - TopBuild Corp | bld-20151231ex10110fc1d.htm |
| EX-10.9 - EX-10.9 - TopBuild Corp | bld-20151231ex10983c784.htm |
| EX-32.1 - EX-32.1 - TopBuild Corp | bld-20151231ex32195401d.htm |
| EX-32.2 - EX-32.2 - TopBuild Corp | bld-20151231ex322d540d8.htm |
UNITED STATES SECURITIES AND EXCHANGE COMMISSION
WASHINGTON, D.C. 20549
FORM 10-K
|
(Mark One) |
|
|
☒ |
ANNUAL REPORT PURSUANT TO SECTION 13 OR 15(d) OF THE SECURITIES EXCHANGE ACT OF 1934 |
For the fiscal year ended December 31, 2015
|
☐ |
TRANSITION REPORT PURSUANT TO SECTION 13 OR 15(d) OF THE SECURITIES EXCHANGE ACT OF 1934 |
For the transition period from to
Commission file number: 1-36870
TopBuild Corp.
(Exact Name of Registrant as Specified in its Charter)
|
Delaware
(State or Other Jurisdiction of Incorporation or |
47-3096382
(I.R.S. Employer |
|
260 Jimmy Ann Drive Daytona Beach, Florida (Address of Principal Executive Offices) |
32114 (Zip Code) |
(386) 304-2200
(Registrant's telephone number, including area code)
Securities registered pursuant to Section 12(b) of the Act:
|
Title of each class |
Name of each exchange on which registered |
|
|
Common stock, par value $0.01 per share |
New York Stock Exchange |
Securities registered pursuant to section 12(g) of the Act:
None
Indicate by check mark if the registrant is a well-known seasoned issuer, as defined in Rule 405 of the Securities Act.
☐ Yes ☒ No
Indicate by check mark if the registrant is not required to file reports pursuant to Section 13 or Section 15(d) of the Act.
☐ Yes ☒ No
Indicate by check mark whether the registrant (1) has filed all reports required to be filed by Section 13 or 15(d) of the Securities Exchange Act of 1934 during the preceding 12 months (or for such shorter period that the registrant was required to file such reports), and (2) has been subject to such filing requirements for the past 90 days.
☒ Yes ☐ No
Indicate by check mark whether the registrant has submitted electronically and posted on its corporate Web site, if any, every Interactive Data File required to be submitted and posted pursuant to Rule 405 of Regulation S-T (§232.405 of this chapter) during the preceding 12 months (or for such shorter period that the registrant was required to submit and post such files.
☒ Yes ☐ No
Indicate by check mark if disclosure of delinquent filers pursuant to Item 405 of Regulation S-K (§229.405 of this chapter) is not contained herein, and will not be contained, to the best of registrant’s knowledge, in definitive proxy or information statements incorporate by reference in Part III of this Form 10-K or any amendment to this Form 10-K.☒
Indicate by check mark whether the registrant is a large accelerated filer, an accelerated filer, a non-accelerated filer, or a smaller reporting company. See the definitions of “large accelerated filer,” “accelerated filer” and “smaller reporting company” in Rule 12b-2 of the Exchange Act.
Large accelerated filer ☐ Accelerated filer ☐ Smaller reporting company ☐ Non-accelerated filer ☒ (Do not check if a smaller reporting company)
Indicate by check mark whether the registrant is a shell company (as defined in Rule 12b-2 of the Exchange Act).
☐ Yes ☒ No
The aggregate market value of the voting and non-voting common stock held by non-affiliates of the registrant based on the closing price of $29.00 per share as reported on the New York Stock Exchange on June 30, 2015, was approximately $1.1 billion.
Number of shares of common stock outstanding as of February 26, 2016: 37,833,855
DOCUMENTS INCORPORATED BY REFERENCE
Portions of the Registrant’s Proxy Statement for its 2016 Annual Meeting of Shareholders, to be filed with the Securities and Exchange Commission no later than 120 days after December 31, 2015, are incorporated by reference into Part III of this Form 10-K.
TOPBUILD CORP.
2
Overview
TopBuild Corp., headquartered in Daytona Beach, Florida, is the leading installer and distributor of insulation products to the United States construction industry, based on revenue. Prior to June 30, 2015, we operated as a subsidiary of Masco Corporation, which trades on the New York Stock Exchange (“NYSE”) under the symbol “MAS.” We were incorporated in Delaware in February 2015 as Masco SpinCo Corp. and we changed our name to TopBuild Corp. on March 20, 2015. On June 30, 2015, the separation from Masco (“Separation”) was completed and on July 1, 2015, we began trading on the NYSE under the symbol “BLD.”
Segment Overview
Installation (TruTeam)
We provide insulation installation services nationwide through our TruTeam contractor services business which has over 180 installation branches located in 44 states.
Various insulation applications we install include:
|
· |
Fiberglass batts and rolls |
|
· |
Blown-in loose fill fiberglass |
|
· |
Blown-in loose fill cellulose |
|
· |
Polyurethane spray foam |
In addition to insulation products, which represented 73% of our installation segment’s sales, we also install other building products including rain gutters, garage doors, fireplaces, shower enclosures, and closet shelving.
We handle every stage of the installation process including material procurement supplied by leading manufacturers, project scheduling and logistics, multi-phase professional installation, and installation quality assurance. The amount of insulation in a new home is regulated by various building and energy codes.
Our TruTeam customer base includes the largest single-family homebuilders in the United States (“U.S.”) as well as local/single-family custom builders, multi-family builders, commercial general contractors, remodelers, and individual homeowners.
Through our Home Services subsidiary and our Environments For Living® program, we offer a number of services and tools designed to assist builders with applying the principles of building science to new home construction. This includes pre-construction plan reviews that use industry-standard home-energy analysis software, various inspection services, and diagnostic testing. We believe our Home Services subsidiary is one of the largest Home Energy Rating System Index (HERS) raters in the U.S.
Distribution (Service Partners)
We distribute insulation and other building products including rain gutters, fireplaces, closet shelving, and roofing materials through our Service Partners business, which has over 70 distribution centers in 35 states.
Our Service Partners customer base consists of thousands of insulation contractors of all sizes, gutter contractors, weatherization contractors, other contractors, dealers, metal building erectors, and modular home builders.
3
For further information on our segments, see Item 8, Financial Statements and Supplementary Data, Note 7 - Segment Information.
Background
Demand for our insulation products and services is driven by new single-family residential and multi-family construction, remodeling and repair activity, commercial construction, building codes, and the growing need for energy efficiency. Being a leader in both installation and distribution allows us to more effectively reach a broader set of customers, regardless of their size or geographic location within the U.S. We recognize that competition for the installation and sale of insulation and other building products occurs in localized geographic markets throughout the country, and as such our operating model is based on branches building and maintaining local customer relationships. At the same time, our local operations benefit from centralized functions such as information technology, credit, and purchasing.
Competitive Advantages
The market for the distribution and installation of building products is highly fragmented and competitive. Barriers to entry for local competitors are relatively low, increasing the risk that additional competitors will emerge. Our ability to maintain our competitive position in our industry depends on a number of factors including our national scale, sales channels, diversified product lines, a strong local presence, and strong cash flows.
National scale. With our national footprint, we provide products and services to each major construction line of business in the U.S. Our national scale, together with our centralized TopBuild executive management team, allows us to compete locally by:
•Providing national and regional builders with broad geographic reach, while maintaining consistent policies and practices that enable reliable, high‑quality products and services across many geographies and building sites
•Establishing strong ties to major manufacturers of insulation and other building products that help ensure we are buying competitively, have availability of supply to our local branches and distribution centers and are driving efficiencies throughout our supply chain
•Providing consistent, customized support and geographic coverage to our customers
•Maintaining an operating capacity that allows us to ramp‑up rapidly, without major incremental investment, to target forecasted growth in housing starts and construction activity in each of our lines of business anywhere in the U.S.
•Leveraging investments in systems and processes and sharing best practices across both our installation and distribution businesses
Two avenues to reach the builder. We believe having both an installation and distribution business provides a number of advantages to reaching our customers and driving share gains. Our installation business customer base includes builders of all sizes. Our branches go to market with the local brands that small builders recognize and value, and our national footprint is appealing to large builders who value consistency across a broad geography. Our distribution business focuses on selling to small contractors who are particularly adept at cultivating the local relationships with small custom builders. Being a leader in both installation and distribution allows us to more effectively reach a broader set of builder customers, regardless of their size or geographic location within the U.S., and leverage housing growth wherever it occurs.
Diversified lines of business. In response to the housing downturn in prior years, we enhanced our ability to serve the residential repair/remodel and commercial construction markets. Although the residential repair/remodel and commercial construction markets are affected by many of the same macroeconomic and local economic factors that drive residential new construction, residential repair/remodel and commercial construction have historically followed different cycles than
4
residential new construction. We have thus positioned our business to benefit from a greater mix of residential repair/remodel activity and commercial construction activity than we have historically, which helps reduce volatility because we are less dependent on residential new construction, and also enables us to better respond to changes in customer demand.
Strong local presence. Competition for the installation and sale of insulation and other building products to builders occurs in localized geographic markets throughout the country. Builders in each local market have different options in terms of choosing among insulation installers and distributors for their projects, and value local relationships, quality and timeliness. Our installation branches are locally branded businesses that are recognized within the communities in which they operate. Our distribution centers service primarily local contractors, lumberyards, retail stores and others who, in turn, service local homebuilders and other customers. Our branch‑ and distribution center‑based operating model, in which individual branches and distribution centers maintain local customer relationships, enables us to develop local, long‑tenured relationships with these customers, build local reputations for quality, service and timeliness and provide specialized products and personalized services tailored to a geographic region. At the same time, our local operations benefit from centralized functions such as information technology, credit and purchasing, and the resources and scale efficiencies of an installation and distribution business that has a presence across the U.S.
Reduced exposure to residential housing cyclicality. During industry downturns many insulation contractors, who buy directly from manufacturers during industry peaks, return to purchasing through distributors for small, “Less Than Truckload” shipments, reduced warehousing needs, and access to purchases on credit. This drives incremental customers to Service Partners during these points in the business cycle. As a result, our leadership position in both installation and distribution helps to reduce exposure to cyclical swings in our lines of business.
Strong cash flow, low capital investment, and favorable working capital fund organic growth. Over the last several years, we have reduced fixed costs. As a result, we can achieve profitability at lower levels of demand as compared to historical periods. For further discussion on our cash flows and liquidity, see Item 7, Management’s Discussion and Analysis of Financial Condition and Results of Operations – Liquidity and Capital Resources.
Major Customers
We have a diversified portfolio of customers and no single customer accounted for 3% or more of our total revenues. Our top ten customers accounted for approximately 10% of our total sales in 2015.
Backlog
Due to our customers’ need for timely installation of our products, our installation jobs are scheduled and completed within a short timeframe. We do not consider backlog material to our business.
Suppliers
Our businesses depend on our ability to obtain an adequate supply of high quality products and components from manufacturers and other suppliers. We rely heavily on third party suppliers for our products and key components. We source the majority of our building products from four primary U.S. based residential fiberglass insulation manufacturers: Owens Corning, Knauf, CertainTeed, and Johns Manville. Failure by our suppliers to provide us with an adequate supply of high quality products on commercially reasonable terms, or to comply with applicable legal requirements, could have a material, adverse effect on our financial condition or operating results. We believe we have good relationships with our suppliers.
Employees
At December 31, 2015, we had approximately 8,000 employees. Approximately 490 of our employees are currently covered by collective bargaining or other similar labor agreements.
5
Executive Management
See Item 10, Directors, Executive Officers, and Corporate Governance.
Legislation and Regulation
We are subject to U.S., state and local regulations, particularly those pertaining to health and safety (including protection of employees and consumers), labor standards/regulations, contractor licensing, and environmental issues. In addition to complying with current effective requirements and requirements that will become effective at a future date, even more stringent requirements could eventually be imposed on our industries. Additionally, some of our products and services may require certification by industry or other organizations. Compliance with these regulations and industry standards may require us to alter our distribution and installation processes and our sourcing, which could adversely impact our competitive position. Further, if we do not effectively and timely comply with such regulations and industry standards, our operating results could be negatively affected.
Additional Information
We make available free of charge on our website, www.topbuild.com, our Annual Report on Form 10-K, our Quarterly Reports on Form 10-Q, and our Current Reports on Form 8-K as soon as reasonably practicable after these reports are filed with or furnished to the Securities and Exchange Commission (the “SEC”).
There are a number of business risks and uncertainties that could affect our business. These risks and uncertainties could cause our actual results to differ from past performance or expected results. We consider the following risks and uncertainties to be most relevant to our business activities. Additional risks and uncertainties not presently known to us, or that we currently believe to be immaterial, also may impact our business, financial condition, and results of operations. We urge investors to consider carefully the risk factors described below in evaluating the information contained in this Report.
Our historical financial information is not necessarily indicative of our future financial condition or future results of operations, nor does it reflect what our financial condition or results of operations would have been as an independent public company during the periods presented prior to the Separation.
Our historical financial information included in this Report is not necessarily indicative of our future financial condition, future results of operations or future cash flows, nor does it reflect what our financial condition, results of operations, or cash flows would have been as an independent public company during the periods presented prior to the Separation. In particular, the historical financial information included in this Report is not necessarily indicative of our future financial condition, results of operations, or cash flows primarily because of the following factors:
|
· |
Our historical financial results for the periods prior to the Separation reflect allocations of expenses for services historically provided by Masco, and this allocation of Masco corporate expenses may be significantly lower than the comparable expenses we would have incurred as an independent company. |
|
· |
Our working capital requirements and capital expenditures historically have been satisfied as part of Masco’s corporate‑wide cash management and capital expenditure programs, and our cost of debt and other capital may have significantly differed from that reflected in our historical financial statements. |
|
· |
The historical financial information prior to the Separation may not fully reflect the costs associated with being an independent public company. |
6
We have limited history operating as an independent public company. We have incurred significant costs to create the corporate infrastructure necessary to operate as an independent public company, and may continue to do so.
We currently pay Masco for certain support services on a transitional basis and Masco will continue to provide some of these services to us, generally through June 30, 2016, with a possible extension of 12 months, pursuant to the Transition Services Agreement. Any interruption in these services could have a material adverse effect on our business, financial condition, results of operations, and cash flows. In addition, at the end of this transition period, we will need to perform these functions ourselves or hire third parties to perform these functions on our behalf. The costs associated with performing or outsourcing these functions may exceed the amounts reflected in our historical financial statements or that we have agreed to pay Masco during the transition period. A significant increase in the costs of performing or outsourcing these functions could materially and adversely affect our business, financial condition, results of operations, and cash flows.
Our business relies on residential new construction activity, and to a lesser extent on residential repair/remodel and commercial construction activity, all of which are cyclical and not fully recovered from the housing crisis.
Our business relies on residential new construction activity and, to a lesser but significant extent on residential repair/remodel and commercial construction activity in the U.S., which is cyclical. Macroeconomic and local economic conditions, including consumer confidence levels, fluctuations in home prices, unemployment and underemployment levels, student loan debt, household formation rates, the age and volume of the housing stock, the availability of home equity loans and mortgages and the interest rates for such loans, and other factors, affect consumers’ discretionary spending on both residential new construction projects and residential repair/remodel activity. The commercial construction market is affected by macroeconomic and local economic factors such as interest rates, credit availability for commercial construction projects, material costs, employment rates, office vacancy rates, and office absorption rates. Adverse changes or uncertainty regarding these and other factors could result in a decline in spending on residential new construction, residential repair/remodel, and commercial construction projects, which could adversely affect our results of operations and our financial position.
While improving, residential new construction, residential repair/remodel, and commercial construction activity (including consumer spending for big ticket remodeling projects) continue to be below historical average levels, which has affected our operating results. While markets have stabilized from the downturn in recent years, there remains significant uncertainty regarding the timing and extent of a full recovery in residential new construction and residential repair/remodel activity and the resulting demand levels for building products we install and/or distribute. In addition to the influence of cyclical macroeconomic and local conditions discussed above, other factors that pose challenges for the markets to return to historical levels of activity include:
|
· |
A significant number of homeowners have outstanding principal balances on their mortgage loans which exceed the market value of their homes, impeding their ability to purchase another home or begin a remodeling project they may desire and otherwise be able to afford. |
|
· |
While decreasing, there are relatively high levels of mortgage loan delinquencies, defaults, and foreclosures that could add to an inventory of lender‑owned homes that may be sold in competition with new and resale homes at low, distressed prices or that generate short sales activity at such price levels. |
|
· |
The size and nature of new homes decreased during the downturn and shifted to a greater mix of multi‑family housing units such as apartments and condominiums, which are often smaller than single‑family housing units and require less insulation and other building products. |
|
· |
Tighter lending standards and practices for mortgage loans limit consumers’ ability to qualify for mortgage financing to purchase a home. |
|
· |
Tighter lending standards for commercial credit for smaller builders, as well as for the development of new lots, limit builders’ ability to qualify for financing for new development. |
7
|
· |
Relatively high levels of student debt and consumer debt, and relatively low consumer confidence, inhibit consumers’ willingness to accept available financing for new construction. |
|
· |
Certain unfavorable demographic trends, such as historically low household formation rates, tend to result in lower home ownership rates than historical averages. |
Given these challenges, the present recovery may not continue or gain further momentum and activity in our lines of business may not return to historic levels, which would have a significant adverse effect on the growth potential of our business, and on our financial condition, operating results, and cash flows.
We may not be successful in integrating acquisitions.
Part of our strategy to grow our business is dependent on our ability to make acquisitions that result in an increase in revenues and operating profit.
Our acquisition strategy requires that we successfully integrate acquired companies into our business practices as well as our procurement, management, and our enterprise-wide information technology systems. We may not be successful in implementing our business practices or systems. Any such difficulties, or increased costs associated with such integration, could affect our financial performance and operations.
If we are unable to integrate acquisitions, it could have a material adverse effect on our growth strategy, business, financial condition, and results of operations.
We are dependent on third‑party suppliers and manufacturers providing us with an adequate supply of high quality products, and the loss of a key supplier or manufacturer could negatively affect our operating results.
Our installation and distribution businesses depend on our ability to obtain an adequate supply of high quality products and components from manufacturers and other suppliers. We rely heavily on third‑party suppliers for our products and key components. Failure by our suppliers to provide us with an adequate supply of high quality products on commercially reasonable terms, or to comply with applicable legal requirements, could have a material adverse effect on our financial condition or operating results. We procure our materials, primarily fiberglass insulation, from leading manufacturers in the industry. While we believe that we have strong relationships with our suppliers, the fiberglass insulation industry has encountered both shortages and periods of significant oversupply during past housing market cycles, leading to volatility in prices and allocations of supply. This volatility of selling prices and materials availability has in the past had, and may in the future have, a significant impact on our results of operation. While we do not believe we depend on any sole or limited source of supply, we do source the majority of our building products, primarily insulation, from a limited number of large suppliers. Any re-sourcing of building products to one or more new supplier could, therefore, take time and involve significant costs. Accordingly, the loss of a key supplier, or a substantial decrease in the availability of products or components from our suppliers, could disrupt our business and adversely impact our operating results.
The long‑term performance of our businesses relies on our ability to attract, develop, and retain talented personnel, including sales representatives, branch managers, installers, and truck drivers, while controlling our labor costs.
To be successful, we must attract, develop, and retain highly qualified and talented personnel who have the experience, knowledge, and expertise to successfully implement our key business strategies. We also must attract, develop, and retain our sales and labor force while maintaining labor costs. We compete for employees, including branch managers, sales people, regional management, and executive officers, with a broad range of employers in many different industries, and we invest significant resources in recruiting, developing, motivating, and retaining them. The failure to attract and retain key employees, or to develop effective succession planning to assure smooth transitions of those employees and their knowledge, customer relationships, and expertise could negatively affect our competitive position and operating results. Further, as the economy continues to recover, if we are unable to cost‑effectively recruit, train, and retain sufficient skilled sales and labor personnel, including sales representatives, branch managers, installers, and truck drivers, we may not be able to adequately satisfy increased demand for our products and services, which could impact our operating results. In
8
the past, we have also experienced challenges securing personnel for certain of our labor force due to lack of proper immigration status.
Our ability to control labor costs and attract qualified labor is subject to numerous external factors including prevailing wage rates, labor shortages, the impact of legislation or regulations governing wages and hours, labor relations, immigration, healthcare benefits, and other insurance costs. In addition, we compete with other companies to recruit and retain qualified installers and truck drivers in a tight labor market, and we invest significant resources in training and motivating them to maintain a high level of job satisfaction. These positions generally have high turnover rates, which can lead to increased training and retention costs. If we are unable to attract or retain qualified employees, it could adversely impact our operating results.
Because we operate our business through highly dispersed locations across the U.S., our operations may be materially adversely affected by inconsistent practices and the operating results of individual branches and distribution centers may vary.
We operate our business through a network of dispersed branch locations and distribution facilities throughout the U.S., supported by corporate executives and services in our headquarters, with branch and regional management retaining responsibility for day‑to‑day operations and adherence to applicable local laws. Our operating structure can make it difficult for us to coordinate procedures across our operations. In addition, our branches and distribution facilities may require significant oversight and coordination from headquarters to support their growth. Inconsistent implementation of corporate strategy and policies at the local or regional level could materially and adversely affect our overall profitability, business, results of operations, financial condition, and prospects.
In addition, the operating results of a specific individual branch or distribution facility may differ from that of another branch or distribution facility for a variety of reasons including business apportionment, management practices, competitive landscape, regulatory requirements, and local economic conditions. As a result, certain of our branches or distribution facilities may experience higher or lower levels of growth than other branches or distribution facilities. Therefore, our overall financial performance and results of operations may not be indicative of the performance and results of operations of any individual branch or distribution facility.
Our profit margins could decrease due to changes in the costs of the products we install and/or distribute.
The principal building products that we install and distribute have been subject to price changes in the past, some of which have been significant. Our results of operations for individual quarters can be, and have been, hurt by a delay between the time building product cost increases are implemented and the time we are able to increase prices for our installation or distribution services, if at all. Our supplier purchase prices may depend on our purchasing volume or other arrangements with any given supplier. While we have been able to achieve cost savings through volume purchasing or other arrangements with suppliers in the past, we may not be able to continue to receive advantageous pricing for the products we distribute and install. If we are unable to maintain pricing consistent with prior periods, our costs could increase and our margins may be adversely affected, which could have a material adverse effect on our financial condition, results of operations, and cash flows.
Increases in fuel costs could adversely affect our results of operations.
The price of oil has fluctuated over the last few years, creating volatility in our fuel costs. We do not currently hedge our fuel costs. Increases in fuel costs can negatively impact our costs to deliver our products to our customers and thus increase our cost of sales. If we are unable to increase the selling price of our products to our customers to cover any increases in fuel costs, results of operations may be adversely affected.
We face significant competition.
The market for the distribution and installation of building products is highly fragmented and competitive. Barriers to entry for local competitors are relatively low, increasing the risk that additional competitors will emerge. We face significant pricing pressure from competitors in both our installation and distribution businesses. In addition to price, we
9
believe that competition in our industry is based largely on customer service and the quality and timeliness of installation services and distribution product deliveries in each local market. Our installation competitors include national contractors, regional contractors, and local contractors, and we face many or all of these competitors for each project on which we bid. Our insulation distribution competitors include specialty insulation distributors (one multi‑regional, several regional, and numerous local). In some instances, our insulation distribution business sells products to companies that may compete directly with our installation service business. We also compete with broad line building products distributors, big box retailers, and insulation manufacturers.
Our ability to maintain our competitive position in our industry and grow our businesses depends upon successfully maintaining our relationships with major suppliers and customers; cost‑effectively recruiting and retaining our sales and labor force including key sales representatives, branch managers, installers, and truck drivers in a tight labor market; delivering superior customer service and quality installations; implementing growth strategies; leveraging our scale; and managing our cost structure, none of which is assured. If we are unable to compete effectively, our business, financial condition, results of operations, and cash flows would be materially and adversely affected.
Our business is seasonal and is susceptible to adverse weather conditions and natural disasters.
Our industry is seasonal. We normally experience stronger sales during the third and fourth calendar quarters, corresponding with the peak season for residential new construction and residential repair/remodel activity. Sales during the winter weather months are seasonally slower due to the lower construction activity. Historically, the installation of insulation lags housing starts by several months.
In addition, to the extent that hurricanes, severe storms, earthquakes, droughts, floods, fires, other natural disasters, or similar events occur in the geographic areas in which we operate, our business may be adversely affected.
Severe weather and natural disasters can cause delays or halts and increased costs in the construction of new homes, residential repair/remodeling projects, and commercial construction projects. We may underestimate the impact of seasonality in any given period. Severe weather is often unpredictable, which contributes to earnings volatility and makes forecasting our results of operation more difficult. Severe weather and seasonality may have an adverse impact on our business, including our financial position, cash flows from operations, and results of operations.
In addition, we may experience business interruptions and property or other damage due to severe weather or natural disasters. If insurance is unavailable to us or is unavailable on acceptable terms, or if our insurance is not adequate to cover business interruption or losses resulting from adverse weather or natural disasters, our business and results of operations will be adversely affected. In addition, damage to homes or commercial sites caused by adverse weather or a natural disaster can cause our insurance costs to increase.
Claims and litigation could be costly.
We are, from time to time, involved in various claims, litigation matters, and regulatory proceedings that arise in the ordinary course of our business and which could have a material adverse effect on us. These matters may include contract disputes, automobile liability and other personal injury claims, warranty disputes, environmental claims or proceedings, other tort claims, employment and tax matters, and other proceedings and litigation, including class actions.
We rely on our suppliers to provide us with the building products that we install and/or distribute. Due to the difficulty of controlling the quality of products sourced from our suppliers, we are exposed to risks relating to the quality of such products and to limitations on our recourse against such suppliers.
In addition, we are exposed to potential claims by our employees or others based on job related hazards. For example, certain types of insulation, particularly spray foam applications, require our employees to handle potentially hazardous or toxic substances. While we place significant focus on employee safety and our employees who handle potentially hazardous or toxic materials, including but not limited to lead‑based paint, receive specialized training and wear protective clothing, there is still a risk that they, or others, may be exposed to these substances. Exposure to these substances could
10
result in significant injury to our employees and others, including site occupants, and damage to our property or the property of others, including natural resource damage, for which we may be liable.
We have also experienced class action lawsuits in recent years predicated upon claims for antitrust, product liability, construction defects, competition, and wage and hour issues. We have generally denied liability and have vigorously defended these cases. Due to their scope and complexity, however, these lawsuits can be particularly costly to defend and resolve, and we have and may continue to incur significant costs as a result of these types of lawsuits.
Our builder and contractor customers are subject to construction defect and warranty claims in the ordinary course of their business. Our contractual arrangements with these customers may include our agreement to defend and indemnify them against various liabilities. These claims, often asserted several years after completion of construction, can result in complex lawsuits or claims against the builders, contractors, and many of their subcontractors, including us, and may require us to incur defense and indemnity costs even when our services or distributed products are not the principal basis for the claims.
Although we intend to defend all claims and litigation matters vigorously, given the inherently unpredictable nature of claims and litigation, we cannot predict with certainty the outcome or effect of any claim or litigation matter.
We expect to maintain insurance against some, but not all, of these risks of loss resulting from claims and litigation. We may elect not to obtain insurance if we believe the cost of available insurance is excessive relative to the risks presented. The levels of insurance we maintain may not be adequate to fully cover any and all losses or liabilities. If any significant accident, judgment, claim, or other event is not fully insured or indemnified against, it could have a material adverse impact on our business, financial condition, and results of operations.
We may not be able to identify new products and new product lines and integrate them into our distribution network, which may impact our ability to compete. Our expansion into new markets may present competitive, distribution, and regulatory challenges that differ from current ones.
Our business depends in part on our ability to identify future products and product lines that complement existing products and product lines and that respond to our customers’ needs. We may not be able to compete effectively unless our product selection keeps up with trends in the markets in which we compete or trends in new products. In addition, our ability to integrate new products and product lines into our distribution network could affect our ability to compete. The success of new products and new product lines will depend on market demand and there is a risk that new products and new product lines will not deliver expected results, which could negatively impact our future sales and results of operations. Our expansion into new markets may present competitive, distribution, and regulatory challenges that differ from current ones. We may be less familiar with new product categories and may face different or additional risks, as well as increased or unexpected costs, compared to existing operations. Growth into new markets may also bring us into direct competition with companies with whom we have little or no past experience as competitors and may not be supported by our historical product suppliers. To the extent we are reliant upon expansion into new geographic, industry, and product markets for growth and do not meet the new challenges posed by such expansion, our future sales growth could be negatively impacted, our operating costs could increase, and our business operations and financial results could be negatively affected.
We may be adversely affected by any natural or man‑made disruptions to our facilities.
We currently maintain a broad network of distribution facilities and installation branches throughout the U.S. Any widespread disruption to our facilities resulting from fire, earthquake, weather‑related events, an act of terrorism, or any other cause could damage a significant portion of our inventory and supply stock, and could materially impair our ability to provide installation and/or distribution services for our customers. Moreover, we could incur significantly higher costs and longer lead times associated with our installation and distribution services to our customers during the time that it takes for us to reopen or replace a damaged facility. If any of these events were to occur, our financial condition, operating results, and cash flows could be materially and adversely affected.
11
We are subject to competitive pricing pressure from our customers.
Residential homebuilders historically have exerted significant pressure on their outside suppliers to keep prices low because of their market share, and ability to leverage such market share, in the highly fragmented building products supply and services industry. The housing industry downturn resulted in significantly increased pricing pressures from homebuilders and other customers. These pricing pressures have adversely affected our operating results and cash flows. In addition, consolidation among homebuilders, and changes in homebuilders’ purchasing policies or payment practices could result in additional pricing pressure. Moreover, during the housing downturn, several of our homebuilder customers defaulted on amounts owed to us or extended their payable days as a result of their financial condition. If such payment failures or delays were to recur, it could significantly adversely affect our financial condition, operating results, and cash flows.
The development of alternatives to distributors in the supply chain could cause a decrease in our sales and operating results and limit our ability to grow our business.
Our distribution customers could begin purchasing more of their product needs directly from manufacturers, which would result in decreases in our net sales and earnings. Our suppliers could invest in infrastructure to expand their own local sales force and sell more products directly to our distribution customers, which also would negatively impact our business. In addition, our distribution customers may elect to establish their own building products manufacturing and distribution facilities, or give advantages to manufacturing or distribution intermediaries in which they have an economic stake. These changes in the supply chain could adversely affect our financial condition, operating results, and cash flows.
Union organizing activity and work stoppages could delay or reduce availability of products that we install and increase our costs.
Approximately 490 of our employees are currently covered by collective bargaining or other similar labor agreements that expire on various dates from May 2016 through June 2019. Any inability by us to negotiate collective bargaining arrangements could cause strikes or other work stoppages, and new contracts could result in increased operating costs. If any such strikes or other work stoppages occur, or if other employees become represented by a union, we could experience a disruption of our operations and higher labor costs. Further, if a significant number of additional employees were to unionize, including in the wake of any future legislation that makes it easier for employees to unionize, these risks would increase. In addition, certain of our suppliers have unionized work forces, and certain of the products we install and/or distribute are transported by unionized truckers. Strikes, work stoppages, or slowdowns could result in slowdowns or closures of facilities where the products that we install and/or distribute are manufactured, or could affect the ability of our suppliers to deliver such products to us. Any interruption in the production or delivery of these products could delay or reduce availability of these products and increase our costs.
If we are required to take significant non‑cash charges, our financial resources could be reduced and our financial flexibility may be negatively affected.
We have recorded significant goodwill and other intangible assets related to prior business combinations on our balance sheet. The valuation of these assets is largely dependent upon the expectations for future performance of our businesses. Expectations about the growth of residential new construction, residential repair/remodel, and commercial construction activity may impact whether we are required to recognize non‑cash, pre‑tax impairment charges for goodwill and other indefinite‑lived intangible assets or other long‑lived assets. If the value of our goodwill, other intangible assets, or long‑lived assets is further impaired, our earnings and stockholders’ equity would be adversely affected.
Compliance with government regulation and industry standards could impact our operating results.
We are subject to federal, state, and local government regulations, particularly those pertaining to health and safety, including protection of employees and consumers; employment laws, including immigration and wage and hour regulations; contractor licensing; and environmental issues. In addition to complying with current requirements, even more stringent requirements could be imposed in the future. Compliance with these regulations and industry standards is costly and may require us to alter our installation and distribution processes, product sourcing, or business practices, and
12
makes recruiting and retaining labor in a tight labor market more challenging. Compliance with these regulations and industry standards could also divert our attention and resources to compliance activities, and could cause us to incur higher costs. Further, if we do not effectively and timely comply with such regulations and industry standards, our results of operations could be negatively affected and we could become subject to substantial penalties or other legal liability.
If we encounter difficulties with our information technology systems, we could experience problems with customer service, inventory, collections, and cost control.
Our operations are dependent upon our information technology systems, which encompass all of our major business functions. We rely upon such information technology systems to manage customer orders on a timely basis, to coordinate our installation and distribution activities across locations, and to manage invoicing. If we experience problems with our information technology systems we could experience, among other things, delays in receiving customer orders, placing orders with suppliers, and scheduling production, installation services, or shipments. Any failure by us to properly maintain and protect our information systems could thus adversely impact our ability to attract and serve customers, and could cause us to incur higher operating costs and experience delays in the execution of our business strategies.
Since we rely heavily on information technology, both in serving our customers and in our enterprise infrastructure, in order to achieve our objectives, we may be vulnerable to damage or intrusion from a variety of cyber‑attacks including computer viruses, worms, or other malicious software programs that gain access to our systems. Despite the precautions we take to mitigate the risks of such events, an attack on our enterprise information technology system could result in theft or disclosure of our proprietary or confidential information, or a breach of confidential customer or employee information. Such events could have an adverse impact on revenue, harm our reputation, and cause us to incur legal liability and costs, which could be significant, to address and remediate such events and related security concerns.
Our business relies significantly on the expertise of our employees, and we generally do not have an intellectual property position that is protected by patents.
Our business is significantly dependent upon our expertise in installation and distribution logistics, including significant expertise in the application of building science to our installation services. We rely on a combination of trade secrets and contractual confidentiality provisions and, to a much lesser extent, copyrights and trademarks, to protect our proprietary rights. Accordingly, our intellectual property position is more vulnerable than it would be if it were protected primarily by patents. If we fail to protect our proprietary rights successfully, our competitive position could suffer, which could harm our operating results. We may be required to spend significant resources to monitor and protect our proprietary rights, and in the event a misappropriation or breach of our proprietary rights occurs our competitive position in the market may be harmed. In addition, competitors may develop competing technologies and expertise that renders our expertise obsolete or less valuable.
Changes in building codes and consumer preferences could affect our ability to market our service offerings and our profitability. Moreover, if we do not respond to evolving customer preferences or changes in building standards, or if we do not maintain or expand our leadership in building science, our business, results of operation, financial condition, and cash flow would be adversely affected.
Each of our lines of business is impacted by local and state building codes and consumer preferences, including a growing focus on energy efficiency. Recently, building codes and consumer preferences have begun to shift towards environmentally friendly and energy‑efficient building products. In addition, state and local governments may change building codes periodically for perceived safety or other reasons. Our competitive advantage is due, in part, to our ability to respond to changes in consumer preferences and building codes. In particular, our Environments For Living® program is designed to make homes more energy‑efficient, comfortable, and durable. However, if our installation and distribution services do not adequately or quickly adapt to changing preferences and building standards, we may lose market share to competitors, which would adversely affect our business, results of operation, financial condition, and cash flows. Further, our growth prospects could be harmed if consumer preferences and building standards evolve more slowly than we anticipate towards energy‑efficient service offerings, which are more profitable than minimum code service offerings.
13
The volatile and challenging economic environment of recent years has caused shifts in consumer preferences and purchasing practices, and changes in the business models and strategies of our customers. This has led to a shift in the quantity, type, and prices of products demanded by our customers. For example, demand has increased for multi‑family housing units such as apartments and condominiums, which are typically smaller, with correspondingly less insulation, than single‑family houses. These shifts have negatively impacted our sales and profitability, and it is uncertain whether these shifts represent long‑term changes in preferences.
We may have future capital needs and may not be able to obtain additional financing on acceptable terms.
Economic and credit market conditions, the performance of the construction industry, and our financial performance, as well as other factors including restrictions under the Tax Matters Agreement related to the Separation, may constrain our financing abilities. Our ability to secure additional financing and to satisfy our financial obligations will depend upon our future operating performance; the availability of credit; economic conditions; and financial, business, and other factors, many of which are beyond our control. Any worsening of current housing market or other construction industry conditions, and the macroeconomic and local economic factors that affect our industry, could require us to seek additional capital and may have a material adverse effect on our ability to secure such capital on favorable terms, if at all. In addition, from and until the second anniversary of the Separation, the Tax Matters Agreement generally will prohibit us and our affiliates from taking certain actions that could cause the Separation and certain related transactions to fail to qualify as tax‑free transactions, which includes certain issuances of our common stock.
Restrictions in our existing credit facility, or any other indebtedness we may incur in the future, could adversely affect our business, financial condition, results of operations, ability to make distributions to shareholders, and the value of our common stock.
Our existing term loan and revolving credit facility, or any future credit facility or other indebtedness we enter into, may limit our ability to, among other things:
|
· |
Incur or guarantee additional debt |
|
· |
Make distributions or dividends on, or redeem or repurchase shares of, common stock |
|
· |
Make certain investments, acquisitions, or other restricted payments |
|
· |
Incur certain liens or permit them to exist |
|
· |
Acquire, merge, or consolidate with another company |
|
· |
Transfer, sell, or otherwise dispose of substantially all of our assets |
Our revolving credit facility contains, and any future credit facility or other debt instrument we may enter into will also likely contain, covenants requiring us to maintain certain financial ratios and meet certain tests, such as a fixed charge coverage ratio, a leverage ratio, and a minimum test. (See Item 7, Management’s Discussion and Analysis of Financial Condition and Results of Operations.) Our ability to comply with those financial ratios and tests can be affected by events beyond our control, and we may not be able to comply with those ratios and tests when required to do so under the applicable debt instruments.
The provisions of our credit facility or other debt instruments may affect our ability to obtain future financing and pursue attractive business opportunities and our flexibility in planning for, and reacting to, changes in business conditions. In addition, a failure to comply with the provisions of our existing credit facility, any future credit facility, or other debt instruments could result in a default or an event of default that could enable our lenders or other debt holders to declare the outstanding principal of that debt, together with accrued and unpaid interest, to be immediately due and payable. If the payment of our debt is accelerated, our assets may be insufficient to repay such debt in full, and our stockholders could experience a partial or total loss of their investment.
14
Any adverse credit rating could increase our costs of borrowing money and limit our access to capital markets and commercial credit.
We do not currently intend to seek credit ratings from Moody’s Investor Service, Standard & Poor’s, or another rating service. However, if Moody’s, Standard & Poor’s, or another rating service rates our credit, such rating could be below investment grade. Further, an initial credit rating could be lowered or withdrawn entirely by a ratings agency if, in its judgment, the circumstances warrant. If any such ratings are lowered, or are otherwise below investment grade, our borrowing costs could increase and our funding sources could decrease. Actual or anticipated changes or downgrades in future ratings, including any announcement that our ratings are under review for a downgrade, could adversely affect our business, cash flows, financial condition, and operating results.
We may be affected by significant restrictions due to the Separation in order to avoid triggering significant tax‑related liabilities.
The Tax Matters Agreement generally will prohibit us from taking certain actions that could cause the Separation and certain related transactions to fail to continue to qualify as tax‑free transactions, including the following:
|
· |
From and until the second anniversary of the Separation, neither we nor any of our subsidiaries may sell, exchange, distribute, or otherwise dispose of any assets held by us or our subsidiaries, except for assets that, in the aggregate, do not constitute more than 15% of our total assets. |
|
· |
From and until the second anniversary of the Separation (or otherwise pursuant to a “plan” within the meaning of Section 355(e) of the Internal Revenue Code of 1986, as amended (the “Code”)), we may not cause or permit any business combination or transaction which, individually or in the aggregate, could result in one or more persons acquiring directly or indirectly a forty percent (40%) or greater interest in us for purposes of Section 355(e) of the Code. |
|
· |
From and until the second anniversary of the Separation, we may not discontinue the active conduct of our business (within the meaning of Section 355(b)(2) of the Code). |
|
· |
From and until the second anniversary of the Separation, we may not sell or otherwise issue our common stock, other than pursuant to issuances that satisfy certain regulatory safe harbors set forth in Treasury Regulations related to stock issued to employees and retirement plans. |
|
· |
From and until the second anniversary of the Separation, we may not redeem or otherwise acquire any of our common stock, other than pursuant to open‑market repurchases of less than 20% of our common stock (in the aggregate). |
|
· |
From and until the second anniversary of the Separation, we may not amend our certificate of incorporation or other organizational documents, or take any other action, whether through a stockholder vote or otherwise, affecting the voting rights of our common stock. |
|
· |
More generally, we may not take any action that could reasonably be expected to cause the Separation and certain related transactions to fail to qualify as tax‑free transactions under Section 368(a)(1)(D) and Section 355 of the Code. |
If we take any of the actions above and such actions result in tax‑related losses to Masco, then we generally will be required to indemnify Masco for such tax‑related losses. Due to these restrictions and indemnification obligations under the Tax Matters Agreement, we may be limited in our ability to pursue strategic transactions, equity or convertible debt financings, or other transactions that may otherwise be in our best interests. Our potential indemnity obligation to Masco might discourage, delay, or prevent a change of control that our stockholders may consider favorable to our ability to pursue strategic transactions, equity or convertible debt financings, or other transactions that may otherwise be in our best interests.
15
In connection with the Separation, Masco indemnified us for certain liabilities and we indemnify Masco for certain liabilities. If we are required to act under these indemnities to Masco, we may need to divert cash to meet those obligations, which could adversely affect our financial results. Moreover, the Masco indemnity may not be sufficient to insure us against the full amount of liabilities for which it will be allocated responsibility, and Masco may not be able to satisfy its indemnification obligations to us in the future.
Pursuant to the Separation and Distribution Agreement and other agreements with Masco, Masco agreed to indemnify us for certain liabilities, and we agreed to indemnify Masco for certain liabilities. Indemnities that we may be required to provide Masco are not subject to any cap, may be significant, and could negatively affect our business, particularly indemnities relating to our actions that could affect the tax‑free nature of the Separation. Third parties could also seek to hold us responsible for any of the liabilities that Masco has agreed to retain, and under certain circumstances, we may be subject to continuing contingent liabilities of Masco following the Separation, such as certain shareholder litigation claims. Further, Masco may not be able to fully satisfy its indemnification obligations or such indemnity obligations may not be sufficient to cover our liabilities. Moreover, even if we ultimately succeed in recovering from Masco any amounts for which we are held liable, we may be temporarily required to bear these losses ourselves. Each of these risks could negatively affect our business, results of operations, liquidity, and financial condition.
Some of our directors and officers may have actual or potential conflicts of interest because of their equity ownership in Masco, and some of our directors may have actual or potential conflicts of interest because they also serve on the Masco board of directors.
Because of their current or former positions with Masco, some of our directors and executive officers may own shares of Masco common stock or have options to acquire shares of Masco common stock, and such holdings may be significant for some of these individuals compared to their total assets. In addition, one of our directors, Mr. Dennis Archer, serves on the Masco board of directors. This ownership or service on both boards of directors may create, or may create the appearance of, conflicts of interest when these directors and officers are faced with decisions that could have different implications for Masco and us. For example, potential conflicts of interest could arise in connection with the resolution of any dispute that may arise between Masco and us regarding the terms of the agreements governing the Separation and the relationship between the companies.
Compliance with and changes in tax laws could adversely affect our performance.
We are subject to extensive tax liabilities imposed by multiple jurisdictions including income taxes; indirect taxes which include excise and duty, sales and use, and gross receipts taxes; payroll taxes; franchise taxes; withholding taxes; and ad valorem taxes. New tax laws and regulations, and changes in existing tax laws and regulations, are continuously being enacted or proposed which could result in increased expenditures for tax liabilities in the future. Many of these liabilities are subject to periodic audits by the respective taxing authority. Subsequent changes to our tax liabilities as a result of these audits may subject us to interest and penalties.
Risks Relating to Our Common Stock
The price of our common stock may fluctuate substantially, and your investment may decline in value.
The market price of our common stock could fluctuate significantly due to a number of factors, many of which are beyond our control, including:
|
· |
Fluctuations in our quarterly or annual earnings results, or those of other companies in our industry |
|
· |
Failures of our operating results to meet the estimates of securities analysts or the expectations of our stockholders, or changes by securities analysts in their estimates of our future earnings |
|
· |
Announcements by us or our customers, suppliers, or competitors |
|
· |
Changes in laws or regulations which adversely affect our industry or us |
16
|
· |
Changes in accounting standards, policies, guidance, interpretations, or principles |
|
· |
General economic, industry, and stock market conditions |
|
· |
Future sales of our common stock by our stockholders |
|
· |
Future issuances of our common stock by us |
|
· |
Other factors described in these “Risk Factors” and elsewhere in this Report |
Future sales of our common stock, or the perception in the public markets that these sales may occur, may depress our stock price.
The market price of our common stock could decline significantly as a result of sales of a large number of shares of our common stock. These sales, or the perception that these sales might occur, could depress the market price of our common stock.
All of our shares of common stock, other than those held by our “affiliates”, are freely tradable without restriction or registration under the Securities Act. Shares held by our affiliates, which include our directors and executive officers, can be sold subject to volume, manner of sale, and notice provisions under Rule 144. We estimate that our directors and executive officers, who may be considered “affiliates” for purposes of Rule 144, beneficially own less than 1% of our common stock.
In the future, we may issue shares of our common stock in connection with investments or acquisitions. The amount of shares of our common stock issued in connections with an investment or acquisition could constitute a material portion of our then-outstanding shares of our common stock.
Provisions in our certificate of incorporation and bylaws, and certain provisions of Delaware law, could delay or prevent a change in control.
The existence of some provisions of our certificate of incorporation and bylaws and Delaware law could discourage, delay, or prevent a change in control that a stockholder may consider favorable. These include provisions:
|
· |
Providing for a classified board of directors |
|
· |
Providing that our directors may be removed by our stockholders only for cause |
|
· |
Establishing supermajority vote requirements for our stockholders to amend certain provisions of our certificate of incorporation and our bylaws |
|
· |
Authorizing a large number of shares of stock that are not yet issued, which could have the effect of preventing or delaying a change in control if our board of directors issued shares to persons that did not support such change in control, or which could be used to dilute the stock ownership of persons seeking to obtain control |
|
· |
Prohibiting stockholders from calling special meetings of stockholders or taking action by written consent |
|
· |
Establishing advance notice requirements for nominations of candidates for election to our board of directors or for proposing matters that can be acted on by stockholders at the annual stockholder meetings |
In addition, we are subject to Section 203 of the Delaware General Corporation Law, which may have an anti‑takeover effect with respect to transactions not approved in advance by our board of directors, including discouraging takeover attempts that could have resulted in a premium over the market price for shares of our common stock.
17
These provisions apply even if a takeover offer may be considered beneficial by some stockholders and could delay or prevent an acquisition that our board of directors determines is not in our and our stockholders’ best interests.
Our bylaws designate a state or federal court located within the State of Delaware as the sole and exclusive forum for certain types of actions and proceedings that may be initiated by our stockholders, which could limit our stockholders’ ability to obtain a preferred judicial forum for disputes with us or our directors, officers, or other employees.
Our bylaws provide that, unless we consent in writing to the selection of an alternative forum, the sole and exclusive forum for (i) any derivative action or proceeding brought on our behalf, (ii) any action asserting a claim of breach of a fiduciary duty owed by any director, officer, or other employee to us or our stockholders, (iii) any action asserting a claim arising pursuant to any provision of Delaware General Corporation Law, our certificate of incorporation (including any certificate of designations for any class or series of our preferred stock), or our bylaws, in each case, as amended from time to time, or (iv) any action asserting a claim governed by the internal affairs doctrine, shall be a state or federal court located within the State of Delaware, in all cases subject to the court’s having personal jurisdiction over the indispensable parties named as defendants. Any person or entity purchasing or otherwise acquiring any interest in shares of our capital stock is deemed to have received notice of, and consented to, the foregoing provision. This forum selection provision may limit a stockholder’s ability to bring a claim in a judicial forum that it finds favorable or cost‑effective for disputes with us or our directors, officers, or other employees, which may discourage such lawsuits against us and our directors, officers, and employees.
Item 1B. UNRESOLVED STAFF COMMENTS
None.
We operate over 180 installation branch locations and over 70 distribution centers in the United States, most of which are leased. We currently lease a 63,404 square foot facility for our corporate and TruTeam (Installation segment) headquarters located at 260 Jimmy Ann Drive, Daytona Beach, Florida, 32114. Our existing headquarters lease will be terminated when we move into our new, 65,700 square foot corporate office, currently under construction at 75 N. Williamson Boulevard in Daytona Beach, FL 32114. The new office is expected to be completed during the fourth quarter of 2016. The lease on our new corporate office will expire approximately 12 years after substantial completion of the landlord’s work, assuming no exercise of any options set forth in the lease. Additionally, we also lease a 17,510 square foot facility for our Service Partners (Distribution Segment) corporate headquarters located at 1029 Technology Park Drive, Glen Allen, Virginia, 23059. Our Service Partners headquarters lease expires on May 31, 2020, assuming no exercise of any options set forth in the lease. We believe that our facilities have sufficient capacity and are adequate for our installation and distribution requirements.
None.
Item 4. MINE SAFETY DISCLOSURES
Not applicable.
18
Item 5. MARKET FOR REGISTRANT’S COMMON EQUITY, RELATED STOCKHOLDER MATTERS, AND ISSUER PURCHASES OF EQUITY SECURITIES
Market Information. Our common stock is traded on the NYSE under the symbol “BLD”. The following table presents the high and low sales prices of our common stock for each quarter starting July 1, 2015, the date on which our stock began trading “regular way” on the NYSE:
|
2015 |
|
|
High |
|
|
Low |
|
Third quarter |
|
$ |
36.36 |
|
$ |
26.67 |
|
Fourth quarter |
|
$ |
33.33 |
|
$ |
27.58 |
As of February 26, 2016, there were approximately 3,500 holders of our issued and outstanding common stock.
Dividends. No dividends were paid during the years ended December 31, 2015 and 2014. Our credit agreement, in certain circumstances, limits the amount of dividends we may distribute. We do not anticipate declaring any such cash dividends to holders of our common stock in the foreseeable future.
Issuer Purchases of Equity Securities. During the fourth quarter ended December 31, 2015, we did not repurchase any of our equity securities.
Securities Authorized for Issuance under Equity Compensation Plans. The information required by this item will be set forth under the heading “Compensation of Executive Officers” in our 2016 Proxy Statement and is incorporated herein by reference.
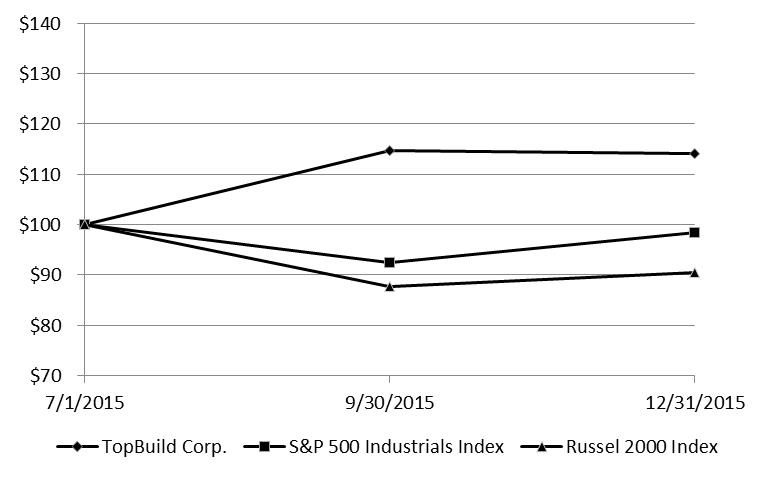
Performance Graph and Table. The following graph and table compares the cumulative total return of our common stock from July 1, 2015, the date on which our stock began trading “regular way” on the NYSE, through December 31, 2015, with the total cumulative return of the Russel 2000 Index and the Standard and Poor’s Industrials Index (“S&P 500 Industrials Index). The graph and table assumes an initial investment of $100 in our common stock and each of the two indices at the close of business on July 1, 2015, and reinvestment of dividends.
|
|
|
Period ended: |
|||||||
|
Index |
|
7/1/2015 |
|
9/30/2015 |
|
12/31/2015 |
|||
|
TopBuild Corp. |
|
$ |
100 |
|
$ |
115 |
|
$ |
114 |
|
S&P 500 Industrials Index |
|
|
100 |
|
|
92 |
|
|
98 |
|
Russel 2000 Index |
|
|
100 |
|
|
88 |
|
|
90 |
19
Item 6. SELECTED HISTORICAL FINANCIAL DATA
The following table sets forth selected historical financial data that should be read in conjunction with “Management’s Discussion and Analysis of Financial Condition and Results of Operations” and our financial statements and notes thereto, included in this Report. The Consolidated Statements of Operations data for the years ended December 31, 2015, 2014, and 2013, and the Consolidated Balance Sheet data as of December 31, 2015, and 2014, are derived from our audited financial statements included in this Report. The Consolidated Statements of Operations data for the year ended December 31, 2012, and the Consolidated Balance Sheet data as of December 31, 2013, were derived from our audited financial statements not included in this report. The Consolidated Statements of Operations data for the year ended December 31, 2011, and the Consolidated Balance Sheet data as of December 31, 2012, and 2011, are derived from our unaudited financial statements not included in this Report. The selected historical financial data in this section is not intended to replace our historical financial statements and the related notes thereto. Prior to the Separation, our historical financial results included allocations of general and corporate expense from Masco and as such our historical results are not necessarily indicative of future results. For more information, see Item 8. Financial Statements and Supplementary Data, Note 1 – Summary of Significant Accounting Policies: Basis of Presentation.
|
|
|
Year ended December 31, |
|||||||||||||
|
(in thousands) |
|
2015 |
|
2014 |
|
2013 |
|
2012 (b) |
|
2011 |
|||||
|
Net sales |
|
$ |
1,616,580 |
|
$ |
1,512,077 |
|
$ |
1,411,524 |
|
$ |
1,207,889 |
|
$ |
1,076,557 |
|
Operating profit (loss) |
|
|
83,531 |
|
|
40,717 |
|
|
24,103 |
|
|
(115,928) |
|
|
(98,158) |
|
Income (loss) from continuing operations |
|
$ |
79,123 |
|
$ |
10,496 |
|
$ |
(11,551) |
|
$ |
(154,375) |
|
$ |
(137,893) |
|
|
|
|
|
|
|
|
|
|
|
|
|
|
|
|
|
|
Income (loss) per common share on income (loss) from continuing operations (a): |
|
|
|
|
|
|
|
|
|
|
|
|
|
|
|
|
Basic |
|
$ |
2.10 |
|
$ |
0.28 |
|
$ |
(0.31) |
|
$ |
(4.10) |
|
$ |
(3.66) |
|
Diluted |
|
$ |
2.09 |
|
$ |
0.28 |
|
$ |
(0.31) |
|
$ |
(4.10) |
|
$ |
(3.66) |
|
|
|
|
|
|
|
|
|
|
|
|
|
|
|
|
|
|
At period end: |
|
|
|
|
|
|
|
|
|
|
|
|
|
|
|
|
Total assets |
|
$ |
1,642,249 |
|
$ |
1,476,424 |
|
$ |
1,466,946 |
|
$ |
1,450,663 |
|
$ |
1,451,294 |
|
Long-term debt |
|
|
193,457 |
|
|
— |
|
|
— |
|
|
— |
|
|
— |
|
Equity |
|
$ |
915,729 |
|
$ |
952,291 |
|
$ |
1,002,685 |
|
$ |
1,026,749 |
|
$ |
1,103,657 |
|
(a) |
For comparative purposes, the computation of basic and diluted earnings per common share for prior year periods presented was calculated using the shares distributed at Separation. |
|
(b) |
In July 2012 Masco reached a settlement agreement to the Columbus Drywall litigation. Masco and its insulation installation companies named in the suit agreed to pay $76 million in return for dismissal with prejudice and full release of all claims. Masco and its insulation installation companies denied that the challenged conduct was unlawful and admitted no wrongdoing as part of the settlement. A settlement was reached to eliminate the considerable expense and uncertainty of this lawsuit. |
20
Item 7. MANAGEMENT’S DISCUSSION AND ANALYSIS OF FINANCIAL CONDITION AND RESULTS OF OPERATIONS
The financial and business analysis below provides information which we believe is relevant to an assessment and understanding of our financial position, results of operations, and cash flows. This financial and business analysis should be read in conjunction with the financial statements and related notes.
The following discussion and certain other sections of this Report contain statements reflecting our views about our future performance. Forward‑looking statements can be identified by words such as “anticipate,” “intend,” “plan,” “believe,” “estimate,” “expect,” “assume,” “seek,” “appear,” “may,” “should,” “will,” “forecast,” and similar references to future periods. These views involve risks and uncertainties that are difficult to predict and, accordingly, our actual results may differ materially from the results discussed in such forward‑looking statements. We caution you against relying on any of these forward‑looking statements. In addition to the various factors included in the “Executive Summary,” “Competitive Advantages,” “Strategy,” “Critical Accounting Policies and Estimates,” and “Material Trends in Our Business” sections, our future performance may be affected by our reliance on residential new construction, residential repair/remodel, and commercial construction; our reliance on third‑party suppliers and manufacturers; our ability to attract, develop and retain talented personnel; our ability to maintain consistent practices across our locations; our ability to maintain our competitive position; and our ability to realize the expected benefits of the Separation. These and other factors are discussed in detail under the caption “Risk Factors” in Item 1A of this Report. Any forward‑looking statement made by us speaks only as of the date on which it was made. Factors or events that could cause our actual results to differ may emerge from time to time, and it is not possible for us to predict all of them. Unless required by law, we undertake no obligation to update publicly any forward‑looking statements as a result of new information, future events, or otherwise.
Executive Summary
We are the leading installer and distributor of insulation products to the United States (“U.S.”) construction industry, based on revenue. Demand for our products and services is driven primarily by residential new construction, residential repair/remodel, and commercial construction activity throughout the U.S. A number of local and national factors influence activity in each of our lines of business, including demographic trends, interest rates, employment levels, business investment, supply and demand for housing stock, availability of credit, foreclosure rates, consumer confidence, and general economic conditions.
Activity in the construction industry is seasonal, typically peaking in the summer months. Because installation of insulation historically lags housing starts by several months, we generally see a corresponding benefit in our operating results during the third and fourth quarters.
Competitive Advantages
We believe we are well positioned to organically grow our business as a result of a number of competitive advantages including:
National Scale. Our national scale enables us to drive supply chain efficiencies and provide the tools necessary for our branches and distribution centers to effectively compete locally. Given the highly fragmented homebuilding industry, our leadership positions in installation, distribution, and building science services allow us to tailor our approach to each local market, which differs in characteristics such as customer mix, competitive activity, building codes, and labor availability. Moreover, serving multiple lines of business provides additional revenue growth potential with which to leverage our fixed costs, and reduces our exposure to the cyclical swings in residential new construction.
Strong Local Presence. Competition for the installation and sale of insulation and other building products to builders occurs in localized geographic markets across the country. Builders in each local market have different options in terms of choosing among insulation installers and distributors for their projects and value local relationships, quality, and timeliness. Our national footprint includes over 180 installation services branches which are locally branded businesses that are recognized within the communities in which they operate. We have over 70 distribution centers primarily serving local contractors, lumberyards, retails stores, and others who, in turn, service local homebuilders and other customers.
21
Through both businesses we have developed local, long-tenured relationships with a reputation for quality, service, and timeliness.
Two Avenues to Reach the Builder. Being a leader in both installation and distribution allows us to more effectively reach a broader set of builder customers, regardless of their size or geographic location with the United States, and leverage housing growth wherever it occurs.
Strategy
Our long-term strategy is to grow net sales, income, and operating cash flows and remain the leading insulation installer and distributor by revenue. In order to achieve these goals we plan to:
|
· |
Capitalize on the U.S. housing market recovery through focused organic growth and accretive aligned acquisitions |
|
· |
Gain share in commercial construction |
|
· |
Continue to leverage our expertise in building science to benefit from the increasing focus on energy efficiency and trends in building codes |
Our operating results depend heavily on residential new construction activity and, to a lesser extent, on residential repair/remodel and commercial construction activity, all of which are cyclical. We are also dependent on third-party suppliers and manufacturers providing us with an adequate supply of high-quality products.
We are optimistic on housing and expect the current moderate pace of improvement to continue for several years. The U.S. housing market has grown from approximately 587,000 housing starts in 2010 to approximately 1,111,400 housing starts in 2015, well below the 50-year historical average of approximately 1.5 million starts per year. We believe that while the current headwinds of credit availability, student debt, and labor shortages within the construction industry are moderating the rate of recovery, they are also extending the recovery cycle. We believe there is pent-up demand for housing, and this demand will eventually be satisfied with higher levels of new construction.
2015 Results
In 2015 our results were positively affected by increased sales volume of residential new construction and commercial construction activity and increased selling prices. Our sales volume increased across our businesses. Compared to 2014, our Installation segment contributed sales volume increases of 4.5 percent and our Distribution segment contributed sales volume increases of 0.6 percent to our total sales increase, prior to intercompany eliminations. Selling price increases, primarily in our Installation segment, increased our sales by 1.9 percent compared to 2014. Our operating results were positively affected by increased sales volume and a more favorable relationship between selling prices and commodity costs. We also benefitted from our past business rationalizations and other cost savings initiatives, including headcount reductions.
Liquidity and Capital Resources
Prior to the Separation, we largely funded our growth through cash provided by our operations combined with support from Masco through its operating cash flows, its long‑term bank debt, and its issuance of securities in the financial markets, including issuances for certain mergers and acquisitions.
Subsequent to the Separation, we have had access to liquidity through our cash from operations and available borrowing capacity under our revolving credit facility. Cash flows are seasonally stronger in the third and fourth quarters as a result of increased new construction activity.
22
On June 9, 2015, we entered into a Credit Agreement with a bank group. The credit agreement consists of a senior secured term loan facility of $200 million, which was used to finance a $200 million cash distribution to Masco in connection with the Separation, and a senior secured revolving facility, which provides for borrowing and/or standby letter of credit issuances of up to $125 million. Together, the term loan facility and revolving facility are referred to as the “credit facility.” Additional borrowing capacity under the credit facility may be accessed by the Company in an aggregate amount not to exceed $100 million without the consent of the lenders, subject to certain conditions (including existing or new lenders providing commitments in respect of such additional borrowing capacity). For additional information, see Item 8, Financial Statements and Supplementary Data, Note 5 - Long-term Debt.
Undrawn capacity under our credit facility provides additional borrowing capacity for working capital and other general corporate purposes. As of December 31, 2015, we had standby letters of credit outstanding of approximately $55.1 million. The standby letters of credit were issued to secure financial obligations related to our workers compensation, general insurance, and auto liability programs. Our historical financial statements for periods prior to the Separation include letter of credit costs, as Masco allocated these costs to us in related party interest expense.
We had cash and cash equivalents of approximately $112.8 million and $3.0 million at December 31, 2015 and 2014, respectively. Our cash and cash equivalents consist of AAA-rated money market funds as well as cash held in our demand deposit accounts.
The following table summarizes our total liquidity, in thousands:
|
|
December 31, |
|||||||
|
|
2015 |
|
2014 |
|
2013 |
|||
|
Cash and cash equivalents |
$ |
112,848 |
|
$ |
2,965 |
|
$ |
3,021 |
|
Revolving credit facility |
|
125,000 |
|
|
― |
|
|
― |
|
Less: standby letters of credit |
|
(55,096) |
|
|
― |
|
|
― |
|
Available borrowings |
|
69,904 |
|
|
― |
|
|
― |
|
Total liquidity |
$ |
182,752 |
|
$ |
2,965 |
|
$ |
3,021 |
We believe that our cash flows from operations, combined with our current cash levels and available borrowing capacity, will be adequate to support our ongoing operations and to fund our debt service requirements, capital expenditures, and working capital for at least the next 12 months.
Cash Flows
Significant sources and (uses) of cash and cash equivalents for the years ending December 31 are as follows, in thousands:
|
|
|
2015 |
|
2014 |
|
2013 |
|
|||
|
Net cash from operating activities |
|
$ |
56,011 |
|
$ |
71,861 |
|
$ |
24,672 |
|
|
Purchases of property and equipment |
|
|
(13,644) |
|
|
(13,141) |
|
|
(14,008) |
|
|
Proceeds from sale of property and equipment |
|
|
805 |
|
|
999 |
|
|
281 |
|
|
Other investing, net |
|
|
632 |
|
|
880 |
|
|
(541) |
|
|
Net transfer from (to) Former Parent |
|
|
72,965 |
|
|
(60,655) |
|
|
(18,124) |
|
|
Cash distribution paid to Former Parent |
|
|
(200,000) |
|
|
— |
|
|
— |
|
|
Proceeds from issuance of long-term debt |
|
|
200,000 |
|
|
— |
|
|
— |
|
|
Repayment of long-term debt |
|
|
(5,000) |
|
|
— |
|
|
— |
|
|
Payment of debt issuance costs |
|
|
(1,715) |
|
|
— |
|
|
— |
|
|
Other financing, net |
|
|
(171) |
|
|
— |
|
|
— |
|
|
Cash and cash equivalents increase (decrease) |
|
$ |
109,883 |
|
$ |
(56) |
|
$ |
(7,720) |
|
|
|
|
|
|
|
|
|
|
|
|
|
|
Working capital (receivables, net plus inventories, less accounts payable) as a % of net sales |
|
|
6.2 |
% |
|
6.5 |
% |
|
8.4 |
% |
23
As of December 31, 2015 and 2014, our working capital was 6.2 percent and 6.5 percent of net sales, respectively. One of our objectives in managing working capital is to reduce working capital as a percentage of net sales. This can be accomplished by a number of factors including timelier collections of accounts receivables or improving payment terms with our suppliers. The reduction in working capital as a percentage of net sales in 2015, compared with 2014, was primarily the result of increased sales and improved supplier terms. The reduction in working capital as a percentage of net sales in 2014, compared with 2013, was the result of increased sales, improved management of accounts receivable and inventory, and improved terms with suppliers.
Cash provided by operating activities for the year ended December 31, 2015, decreased $15.9 million from the comparable period ended December 31, 2014, primarily due to changes in deferred income taxes, the recognition of a non-cash employee benefit policy change, reduced depreciation, the non-recurring impact of improved supplier terms received in 2014, and amortization expense related to a software system which was fully depreciated in 2014, partially offset by an increase in net income driven by increased sales volume of residential new construction and commercial construction activity. Cash provided by operating activities for the year ended December 31, 2014, increased $47.2 million from the comparable period ended December 31, 2013, primarily due to an increase in net income of $22.1 million driven by increased sales volume of residential new construction and commercial construction activity. In addition, cash from operations in 2014 benefited from improved working capital of $20.3 million.
Net cash used for investing activities was $12.2 million for the year ended December 31, 2015, which was primarily comprised of $13.6 million in purchases of property and equipment, partially offset by $0.8 million of proceeds from the sale of property and equipment. Net cash used for investing activities was $11.3 million for the year ended December 31, 2014, which was primarily comprised of $13.1 million in purchases of property and equipment partially offset by $1.0 million of proceeds from the sale of property and equipment. Net cash used for investing activities was $14.3 million for the year ended December 31, 2013, which was primarily comprised of $14.0 million in purchases of property and equipment, partially offset by $0.3 million of proceeds from the sale of property and equipment.
Net cash from (for) financing activities was $66.1 million, $(60.7) million, and $(18.1) million for the years ended December 31, 2015, 2014, and 2013, respectively. During the year ended December 31, 2015, we received $200.0 million in proceeds from the issuance of long-term debt which was remitted to our Former Parent in connection with the Separation. Additionally, we received a transfer from our Former Parent of $73.0 million, partially offset by repayments of our long-term debt and payment of debt issuance costs. During the years ended December 31, 2014 and 2013, we made transfers of $60.7 million and $18.1 million, respectively, to our Former Parent.
Costs of environmental responsibilities and compliance with existing environmental laws and regulations have not had, nor do we expect them to have, a material effect on our capital expenditures, financial position, or results of operations.
Results of Operations
We report our financial results in conformity with accounting principles generally accepted in the United States of America (“U.S. GAAP”). However, we believe that certain non‑GAAP performance measures and ratios, used in managing the business, may provide users of this financial information with additional meaningful comparisons between current results and results in prior periods. Non‑GAAP performance measures and ratios should be viewed in addition to, and not as an alternative for, our reported results.
24
The following table sets forth our net sales, and our gross and operating profit and margins, as reported in our Consolidated Statements of Operations for, in thousands:
|
|
|
Year Ended December 31, |
|
|||||||
|
|
|
2015 |
|
2014 |
|
2013 |
|
|||
|
Net sales |
|
$ |
1,616,580 |
|
$ |
1,512,077 |
|
$ |
1,411,524 |
|
|
Cost of sales |
|
|
1,258,551 |
|
|
1,180,409 |
|
|
1,108,846 |
|
|
Cost of sales ratio |
|
|
77.9 |
% |
|
78.1 |
% |
|
78.6 |
% |
|
|
|
|
|
|
|
|
|
|
|
|
|
Gross profit |
|
|
358,029 |
|
|
331,668 |
|
|
302,678 |
|
|
Gross profit margin |
|
|
22.1 |
% |
|
21.9 |
% |
|
21.4 |
% |
|
|
|
|
|
|
|
|
|
|
|
|
|
Selling, general, and administrative expense |
|
|
274,498 |
|
|
290,951 |
|
|
278,575 |
|
|
Selling, general, and administrative expense to sales ratio |
|
|
17.0 |
% |
|
19.2 |
% |
|
19.7 |
% |
|
|
|
|
|
|
|
|
|
|
|
|
|
Operating profit |
|
|
83,531 |
|
|
40,717 |
|
|
24,103 |
|
|
Operating profit margin |
|
|
5.2 |
% |
|
2.7 |
% |
|
1.7 |
% |
|
|
|
|
|
|
|
|
|
|
|
|
|
Other expense, net |
|
|
(9,416) |
|
|
(12,379) |
|
|
(13,329) |
|
|
Income tax benefit (expense) from continuing operations |
|
|
5,008 |
|
|
(17,842) |
|
|
(22,325) |
|
|
Income (loss) from continuing operations |
|
$ |
79,123 |
|
$ |
10,496 |
|
$ |
(11,551) |
|
|
Net margin on continuing operations |
|
|
4.9 |
% |
|
0.7 |
% |
|
(0.8) |
% |
2015, 2014, and 2013 Comparison
Sales and Operations
Net sales for 2015 increased 6.9 percent, or $104.5 million, to $1,616.6 million. The increase was driven by sales volume growth in both Installation and Distribution segments. Our sales benefited from increased volume in residential new construction and commercial construction activity, increased insulation sales driven by changing building code requirements, and increased selling prices.
Net sales for 2014 increased 7.1 percent, or $100.6 million. The increase was driven by sales volume growth in the Installation and Distribution segments, primarily due to increased residential new construction and commercial construction activity and, to a lesser extent, residential repair/remodel activity. In addition, 2014 benefited from increased insulation sales volume driven by changing building code requirements and increased selling prices.
Our gross profit margins were 22.1 percent, 21.9 percent, and 21.4 percent for 2015, 2014, and 2013, respectively. Our increases in gross profit margins reflect increased sales volume and the related absorption of fixed costs, a more favorable relationship between selling prices and material costs, and benefits associated with business rationalization and cost savings initiatives.
Selling, general, and administrative expense as a percent of sales was 17.0 percent, 19.2 percent, and 19.7 percent for 2015, 2014, and 2013, respectively. Reduced selling, general, and administrative expense as a percent of sales is a result of increasing sales volume and price, benefits associated with business rationalizations, and other cost savings initiatives.
Our selling, general, and administrative expense includes allocations of Masco general corporate expense for the periods prior to the Separation of $13.6 million, $21.9 million, and $22.1 million in 2015, 2014, and 2013, respectively. Such expense may not be indicative of our general corporate expense in the future.
During the fourth quarter of 2015, we modified our vacation policy from being granted based on prior year service to being earned on a per pay period approach. This employee benefit policy change resulted in a $9.9 million expense reduction, which is reflected as a $6.1 million reduction of cost of sales and a $3.8 million reduction of selling, general, and administrative expenses in our Consolidated Statements of Operations. This item is reflected as a non-cash employee benefit policy change in our Consolidated Statements of Cash Flows.
25
Operating margins, as reported for 2015, 2014, and 2013 were 5.2 percent, 2.7 percent, and 1.7 percent, respectively. Operating margins, before general corporate expense, for 2015, 2014, and 2013 were 6.6 percent, 4.1 percent and 3.3 percent, respectively. Improvements in operating margins in 2015, 2014, and 2013 were positively affected by increased sales volume, a more favorable relationship between selling prices and commodity costs, and benefits associated with business rationalizations and other cost savings initiatives.
Other Income (Expense), Net
Interest expense was $9.5 million in 2015 of which $3.2 million was incurred under the TopBuild credit facility while $6.3 million was allocated by Masco prior to the Separation. Interest expenses was $12.4 million and $13.4 million in 2014 and 2013, respectively, and was exclusively related to a Masco allocation. Such expense may not be indicative of our interest expense in the future.
Income (Loss) from Continuing Operations
Income (loss) from continuing operations was $79.1 million, $10.5 million, and $(11.6) million in 2015, 2014, and 2013, respectively.
Income Tax Benefit (Expense) from Continuing Operations
Our effective tax rates for income (loss) from continuing operations were (7) percent, 63 percent, and 207 percent in 2015, 2014, and 2013, respectively. Compared to our normalized tax rate of 38 percent, the variance in the effective tax rates in 2015, 2014, and 2013 was primarily due to changes in the U.S. Federal and certain state valuation allowances.
Material Trends in Our Business
We believe there are several meaningful trends that indicate U.S. housing demand will recover to levels consistent with the historical average of the past 50 years. These trends include low interest rates relative to historical averages, the aging of housing stock, population growth, and household formation. We expect these trends to also drive long‑term growth in repair/remodel expenditures and commercial construction activity.
We normally experience stronger sales during the third and fourth calendar quarters, corresponding with the peak season for residential new construction and residential repair/remodel activity. Sales during the winter weather months are seasonally slower due to lower construction activity. Historically, the installation of insulation lags housing starts by several months.
26
2015, 2014, and 2013 Business Segment Results
The following table sets forth our net sales and operating profit information by business segment, in thousands:
|
|
|
Year ended December 31, |
|
Percent |
|
|
Percent |
|
|||||||
|
|
|
2015 |
|
2014 |
|
2013 |
|
2015 |
|
2014 |
|||||
|
Net sales by business segment: |
|
|
|
|
|
|
|
|
|
|
|
|
|
|
|
|
Installation |
|
$ |
1,057,553 |
|
$ |
963,351 |
|
$ |
904,570 |
|
9.8 |
% |
|
6.5 |
% |
|
Distribution |
|
|
646,441 |
|
|
628,810 |
|
|
578,141 |
|
2.8 |
% |
|
8.8 |
% |
|
Intercompany eliminations and other adjustments |
|
|
(87,414) |
|
|
(80,084) |
|
|
(71,187) |
|
|
|
|
|
|
|
Net sales |
|
$ |
1,616,580 |
|
$ |
1,512,077 |
|
$ |
1,411,524 |
|
6.9 |
% |
|
7.1 |
% |
|
|
|
2015 |
|
2014 |
|
2013 |
|
|||
|
Operating profit by business segment: |
|
|
|
|
|
|
|
|
|
|
|
Installation |
|
$ |
55,232 |
|
$ |
23,970 |
|
$ |
6,160 |
|
|
Distribution |
|
|
55,700 |
|
|
52,334 |
|
|
46,405 |
|
|
Intercompany eliminations and other adjustments (a) |
|
|
(4,796) |
|
|
(13,639) |
|
|
(6,389) |
|
|
Operating profit before general corporate expense |
|
|
106,136 |
|
|
62,665 |
|
|
46,176 |
|
|
General corporate expense, net |
|
|
(22,605) |
|
|
(21,948) |
|
|
(22,073) |
|
|
Operating profit, as reported |
|
$ |
83,531 |
|
$ |
40,717 |
|
$ |
24,103 |
|
|
|
|
2015 |
|
2014 |
|
2013 |
|||
|
Operating Profit Margins: |
|
|
|
|
|
|
|
|
|
|
Installation |
|
5.2 |
% |
|
2.5 |
% |
|
0.7 |
% |
|
Distribution |
|
8.6 |
% |
|
8.3 |
% |
|
8.0 |
% |
|
Operating profit margin before general corporate expense |
|
6.6 |
% |
|
4.1 |
% |
|
3.3 |
% |
|
Operating profit margin, as reported |
|
5.2 |
% |
|
2.7 |
% |
|
1.7 |
% |
|
(a) |
Intercompany eliminations include the elimination of intercompany profit of $15.6 million, $14.1 million, and $11.2 million for the years ending December 31, 2015, 2014, and 2013, respectively. Other adjustments primarily include differences between estimated and actual corporate costs allocated to the segments. During the years ended December 31, 2015, 2014, and 2013, other adjustments were $10.8 million, $0.5 million, and $4.8 million, respectively. |
2015, 2014, and 2013 Business Segment Results Discussion
Changes in operating profit margins in the following business segment results discussion exclude general corporate expense, net in 2015, 2014, and 2013, as applicable.
The construction industry is expanding both in residential new home and commercial construction, and is subject to inflationary pressures on costs. We are seeing the impact of this growth with increases in the cost of building materials. We realized higher material costs, principally for insulation, in each of the three years ended December 31, 2015, 2014, and 2013. Insulation is the largest commodity we purchase in our business segments. We have been successful to date in achieving price increases to more than offset the increased commodity costs.
Installation
Sales
Sales increased $94.2 million or 9.8 percent in 2015 compared to 2014. Such increases were primarily due to increased sales volume, which increased sales by 7.4 percent. Increased sales volume is primarily related to a higher level of activity in residential new construction and commercial construction and changing building code requirements. Sales also increased by 2.3 percent due to increased selling prices. Such increases were partially offset by a greater number of multi-family housing starts versus single-family housing starts, the former of which uses less insulation per unit.
27
Sales increased $58.8 million or 6.5 percent in 2014 compared to 2013. Such increases were primarily due to increased sales volume, which increased sales 3.8 percent. Increased sales volume was primarily driven by a higher level of activity in residential new construction and commercial construction and changing building code requirements. Sales also increased by 3.4 percent due to increased selling prices. Such increases were partially offset by a greater number of multi-family housing starts versus single-family housing starts, the former of which uses less insulation per unit.
Operating Results
Operating profit increased $31.3 million in 2015 compared to 2014, primarily due to increased sales volume and a more favorable relationship between selling prices and commodity costs. Operating profit was also positively affected by cost savings initiatives including process improvements, sourcing savings, and an employee benefit policy change. These changes were partially offset by a less favorable product mix due to higher multi-family housing starts (which use less insulation per unit) than in the prior years, as well as higher insurance costs.
Operating profit increased $17.8 million in 2014 compared to 2013, primarily due to increased sales volume and a more favorable relationship between selling prices and commodity costs. Such increases were partially offset by a greater number of multi-family housing starts versus single-family housing starts, the former of which uses less insulation per unit.
Distribution
Sales
Net sales increased $17.6 million or 2.8 percent in 2015 compared to 2014. Such increases were primarily due to increased sales volume, which increased sales by 1.6 percent. Increased sales volume was driven by a higher level of activity in residential new construction and commercial construction, including metal building insulation. Sales volume increases were partially offset in the first quarter of 2015 by an acceleration of sales in the fourth quarter of 2014, following the announcement of a price increase for fiberglass insulation. We also saw lower roofing sales due to consolidation in the industry. Sales increased by 1.3% due to increased selling prices.
Net sales increased $50.7 million or 8.8 percent in 2014 compared to 2013. Such increases were primarily due to increased sales volume, which increased sales by 7.6 percent driven by a higher level of activity in residential new construction and commercial construction, including metal building insulation. Sales also increased by 1.7% due to increased selling prices.
Operating Results
Operating profit increased $3.4 million in 2015 compared to 2014 due to increased sales volume and a more favorable product mix, including increased sales of higher margin insulation products compared to lower margin roofing products. This segment also benefited from a more favorable relationship between selling prices and commodity costs.
Operating profit increased by $5.9 million in 2014 compared to 2013, primarily due to increased sales volume, partially offset by a less favorable relationship between selling prices and material costs.
Commitments and Contingencies
Litigation
We are subject to claims, charges, litigation, and other proceedings in the ordinary course of our business, including those arising from or related to contractual matters, intellectual property, personal injury, environmental matters, product liability, product recalls, construction defect, insurance coverage, personnel and employment disputes, antitrust issues and other matters, including class actions. We believe we have adequate defenses in these matters, and that the likelihood that the outcome of these matters would have a material adverse effect on us is remote. However, there is no assurance that we will prevail in these matters, and we could in the future incur judgments, enter into settlements of claims, or revise our expectations regarding the outcome of these matters, which could materially impact our results of operations.
28
Other Commitments
We enter into contracts, which include customary indemnifications that are standard for the industries in which we operate. Such indemnifications include customer claims against builders for issues relating to our products and workmanship. In conjunction with divestitures and other transactions, we occasionally provide customary indemnifications relating to various items including the enforceability of trademarks, legal and environmental issues, and asset valuations. We evaluate the probability that amounts may be incurred, and appropriately record an estimated liability when probable.
Critical Accounting Policies and Estimates
We prepare our Consolidated Financial Statements in conformity with U.S. GAAP. The preparation of these financial statements requires us to make estimates and assumptions that affect the reported amounts of assets and liabilities, and disclosure of contingent assets and liabilities, at the date of the financial statements, and the reported amounts of sales and expenses during the reporting period. Actual results could differ from those estimates.
Our significant accounting policies are more fully described in Item 8, Financial Statements and Supplementary Data, Note 1 - Summary of Significant Accounting Policies. However, certain of our accounting policies considered critical are those we believe are both most important to the portrayal of our financial condition and operating results and require our most difficult, subjective, or complex judgments, often as a result of the need to make estimates about the effect of matters that are inherently uncertain. Judgments and uncertainties affecting the application of those policies may result in materially different amounts being reported under different conditions or using different assumptions. We consider the following policies to be most critical in understanding the judgments that are involved in preparing our Consolidated Financial Statements.
Revenue Recognition and Receivables
We recognize revenue for our Installation segment using the percentage of completion method of accounting based on the amount of material installed and associated labor costs at our customers’ locations compared to the total expected cost for the contract. The amount of revenue recognized for our Installation segment which had not been billed as of December 31, 2015 and 2014, was $23.7 million and $23.6 million, respectively. Revenue from our distribution segment is recognized when title to products and risk of loss transfers to our customers. We record estimated reductions to revenue for customer programs and incentive offerings, including special pricing and other volume‑based incentives. We maintain allowances for doubtful accounts receivable for estimated losses resulting from the inability of customers to make required payments. In addition, we monitor our customer receivable balances and the credit worthiness of our customers on an on‑going basis. During downturns in our markets, declines in the financial condition and creditworthiness of customers impact the credit risk of the receivables involved and we have incurred additional bad debt expense related to customer defaults.
Goodwill and Other Intangible Assets
We record the excess of purchase cost over the fair value of net tangible assets of acquired companies as goodwill or other identifiable intangible assets. We perform our annual impairment testing of goodwill in the fourth quarter of each year, or as events occur or circumstances change that would more likely than not reduce the fair value of a reporting unit below its carrying amount. We complete the impairment testing of goodwill utilizing a discounted cash flow method. We selected this methodology because we believe that it is comparable to what would be used by other market participants. Our operating segments are reporting units that engage in business activities for which discrete financial information, including long range forecasts, are available. We have identified our segments as our reporting units and complete the impairment testing of goodwill at the operating segment level, as defined by accounting guidance. Fair value for our reporting units is determined using a discounted cash flow method which includes significant unobservable inputs (Level 3 inputs).
Determining market values using a discounted cash flow method requires us to make significant estimates and assumptions, including long‑term projections of cash flows, market conditions, and appropriate discount rates. Our judgments are based on historical experience, current market trends, consultations with external valuation specialists, and other information. While we believe that the estimates and assumptions underlying the valuation methodology are
29
reasonable, changes to estimates and assumptions could result in different outcomes. In estimating future cash flows, we rely on internally generated long range forecasts for sales and operating profits, including capital expenditures, and generally a one to three percent long‑term assumed annual growth rate of cash flows for periods after the long range forecast. We generally develop these forecasts based upon, among other things, recent sales data for existing products, and estimated U.S. housing starts.
When necessary, an impairment loss is recognized to the extent that a reporting unit’s recorded goodwill exceeds its implied fair value.
In 2015 and 2014 we did not recognize any impairment charges for goodwill. As of December 31, 2015, net goodwill reflected $762.0 million of accumulated impairment losses, relating primarily to impairment charges taken in 2008‑2010 following the substantial decrease in U.S. housing starts after the financial crisis of 2007‑2008.
A ten percent decrease in the estimated fair value of our reporting units at October 31, 2015, our measurement date, would not have resulted in any additional analysis of goodwill impairment for any reporting unit.
Intangible assets with finite useful lives are amortized using the straight‑line method over their estimated useful lives. We evaluate the remaining useful lives of amortizable identifiable intangible assets at each reporting period to determine whether events and circumstances warrant a revision to the remaining periods of amortization.
Income Taxes
Accounting guidance for income taxes requires that the future realization of deferred tax assets depends on the existence of sufficient taxable income in future periods. Possible sources of taxable income include taxable income in carryback periods, the future reversal of existing taxable temporary differences recorded as a deferred tax liability, tax planning strategies that generate future income or gains in excess of anticipated losses in the carryforward period, and projected future taxable income.
If, based upon all available evidence, both positive and negative, it is more likely than not (more than 50 percent likely) such deferred tax assets will not be realized, a valuation allowance is recorded. Significant weight is given to positive and negative evidence that is objectively verifiable. A company’s three year cumulative loss position is significant negative evidence in considering whether deferred tax assets are realizable and the accounting guidance restricts the amount of reliance we can place on projected taxable income to support the recovery of deferred tax assets.
In a prior period, we had recorded a valuation allowance against our U.S. Federal and certain state deferred tax assets as a non‑cash charge to income tax expense. In reaching this conclusion, we considered the significant decline in residential new construction, high level of foreclosure activity, and the slower than anticipated recovery in the U.S. housing market which led to U.S. operating losses, causing us to be in a three‑year cumulative U.S. loss position.
During the years ended December, 31, 2010, 2011, and 2012, objective and verifiable negative evidence, such as continued U.S. operating losses and significant impairment charges for U.S. goodwill in 2010, continued to outweigh positive evidence necessary to reduce the valuation allowance. As a result, we recorded increases in the valuation allowance against our U.S. Federal and certain state deferred tax assets as a non-cash charge to income tax expense during the years ended December 31, 2010, 2011, and 2012.
A return to sustainable profitability in the U.S. is required before we would change our judgment regarding the need for a valuation allowance against our deferred tax assets.
Although the strengthening in residential new construction activity resulted in profitability for our operations in 2013 and 2014, we continued to record a full valuation allowance against the U.S. Federal and certain state deferred tax assets. We arrived at this conclusion due to the Company’s (i) low amount of profit in 2013 and 2014, (ii) continued the three year cumulative loss position throughout the year ended December 31, 2014, and (iii) lack of taxable income after evaluating the four sources of taxable income generally allowed under ASC 740 in determining whether or not a deferred asset may be realized.
30
In the fourth quarter of 2015 we recorded a $35.5 million tax benefit ($13.5 million of Federal and $22.0 million of State & local net of federal benefit) from the release of the valuation allowance against its U.S. Federal and certain state deferred tax assets due primarily to a return to sustainable profitability in our U.S. operations. In reaching this conclusion, we considered the Company’s strong results in the third and fourth quarters reflecting (i) continued improvement in both new home construction and repair/remodel activity in the U.S. and (ii) the Company’s ability to function as a standalone business. We also considered our progress on strategic initiatives to reduce costs and expand the breadth of our market positions, which contributed to the continued improvement in our operations over the past few years.
The reduction in the valuation allowance in 2015 resulted in a net positive income tax benefit of $5.0 million and a negative effective tax rate of 7% for the year. Excluding the valuation allowance release of $35.5 million, our effective tax rate would have been 41% for the year ended December 31, 2015, comprised of a 35% U.S. Federal statutory rate and 6% of State and local taxes, net of U.S. Federal tax benefit and Other, net. This rate is higher than would normally be expected due to various nondeductible expenses related to the Separation transaction and other adjustments primarily related to the Separation.
For the activity through the first six months of 2015, we will file tax returns as a member of the Masco consolidated group for federal and certain state jurisdictions. As a result, certain tax attributes, primarily the net operating loss carryforwards, are treated as an asset of the Masco group and may be utilized by the Masco group through the end of December 31, 2015, Masco’s tax year-end. It is anticipated that all of our U.S. Federal net operating loss carryforward and certain state net operating loss carryforwards will be utilized by the Masco consolidated group. In accordance, the deferred tax assets relating to the net operating loss carryforwards for federal and certain state jurisdictions were transferred to Masco, in the amount of $401 million, with a similar transfer of the related valuation allowance.
Due to the fact that TopBuild’s current income tax expense is based on a full year, notwithstanding that it was a member of Masco’s consolidated group through June 30, 2015, an adjustment of $2.6 million was required to made to equity to record the appropriate current income tax payable on a standalone basis.
Current accounting guidance allows the recognition of only those income tax positions that have a greater than 50 percent likelihood of being sustained upon examination by taxing authorities. We believe that there is an increased potential for volatility in our effective tax rate because this threshold allows changes in the income tax environment and the inherent complexities of income tax law in a substantial number of jurisdictions to affect the computation of the liability for uncertain tax positions to a greater extent.
While we believe we have adequately assessed for our uncertain tax positions, amounts asserted by taxing authorities could vary from our assessment of uncertain tax positions. Accordingly, provisions for tax-related matters, including interest and penalties, could be recorded in income tax expense in the period revised assessments are made.
Recently Issued Accounting Pronouncements
Recently issued accounting pronouncements and their expected or actual effect on our reported results of operations are addressed in Item 8, Financial Statements and Supplementary Data, Note 1 - Summary of Significant Accounting Policies.
Off-Balance Sheet Arrangements
As of December 31, 2015 and 2014, other than operating leases, letters of credit issued under our revolving credit facility, and performance and license bonds, we had no material off-balance sheet arrangements.
31
Contractual Obligations
The following table provides payment obligations related to current contracts at December 31, 2015, in thousands:
|
|
|
Payments Due by Period |
|
|||||||||||||||||||
|
|
|
|
|
|
|
|
|
|
|
|
|
|
|
|
|
|
|
|
|
|||
|
|
|
2016 |
|
2017 |
|
2018 |
|
2019 |
|
2020 |
|
Thereafter |
|
Total |
|
|||||||
|
Operating leases |
|
$ |
37,033 |
|
$ |
27,224 |
|
$ |
17,406 |
|
$ |
8,909 |
|
$ |
3,847 |
|
$ |
6,639 |
|
$ |
101,058 |
|
|
Principal repayments of long-term debt |
|
|
15,000 |
|
|
20,000 |
|
|
20,000 |
|
|
25,000 |
|
|
115,000 |
|
|
— |
|
|
195,000 |
|
|
Interest payments on long-term debt (a) |
|
|
4,613 |
|
|
4,175 |
|
|
3,691 |
|
|
3,191 |
|
|
1,346 |
|
|
— |
|
|
17,016 |
|
|
Standby Letters of Credit and Commitment Fees (b) |
|
|
1,363 |
|
|
1,363 |
|
|
1,363 |
|
|
1,363 |
|
|
682 |
|
|
— |
|
|
6,134 |
|
|
Total |
|
$ |
58,009 |
|
$ |
52,762 |
|
$ |
42,460 |
|
$ |
38,463 |
|
$ |
120,875 |
|
$ |
6,639 |
|
$ |
319,208 |
|
|
(a) |
Interest has been calculated using the interest rate on our long-term debt as of December 31, 2015, of 2.42% |
|
(b) |
Assumes our standby letters of credit remain constant during the term of our credit facility. |
Item 7A. QUANTITATIVE AND QUALITATIVE DISCLOSURES ABOUT MARKET RISK
Interest Rate Risk
Prior to the Separation, we participated in Masco’s centralized cash management program and were funded through an intercompany loan arrangement whereby Masco provided daily liquidity, as needed, to fund our operations. As a result of this intercompany funding arrangement, prior to the Separation, we had no external indebtedness that exposed us to interest rate risk. Our historical financial statements include standby letter of credit costs, as Masco allocated these costs to TopBuild in related party interest expense allocations.
On June 9, 2015, we entered into a credit agreement. The credit agreement consists of a senior secured term loan facility in the amount of $200 million and a senior secured revolving facility in the amount of $125 million.
Interest payable on both the term loan facility and revolving facility are based on a variable interest rate. As of December 31, 2015, we had $195.0 million outstanding under our term loan facility. As a result, we are exposed to market risks related to fluctuations in interest rates on our outstanding indebtedness. For additional information on our credit agreement and how our interest rate is determined, see Item 8, Financial Statements and Supplementary Data, Note 5 - Long-Term Debt. Based on the current interest rate of 2.42 percent under the senior secured term loan facility, a 100 basis point increase in the interest rate would result in a $1.9 million increase in our annual interest expense for the year ending December 31, 2016. There was no outstanding balance under the revolving facility as of December 31, 2015.
32
Item 8. FINANCIAL STATEMENTS AND SUPPLEMENTARY DATA
Report of Independent Registered Certified Public Accounting Firm
To the Board of Directors and Shareholders of TopBuild Corp.:
In our opinion, the consolidated financial statements listed in the index appearing under Item 15(a)(i) present fairly, in all material respects, the financial position of TopBuild Corp. and its subsidiaries at December 31, 2015 and 2014, and the results of their operations and their cash flows for each of the three years in the period ended December 31, 2015 in conformity with accounting principles generally accepted in the United States of America. In addition, in our opinion, the financial statement schedule listed in the accompanying index appearing under Item 15(a)(ii) presents fairly, in all material respects, the information set forth therein when read in conjunction with the related consolidated financial statements. These financial statements and financial statement schedule are the responsibility of the Company's management. Our responsibility is to express an opinion on these financial statements and financial statement schedule based on our audits. We conducted our audits of these statements in accordance with the standards of the Public Company Accounting Oversight Board (United States). Those standards require that we plan and perform the audit to obtain reasonable assurance about whether the financial statements are free of material misstatement. An audit includes examining, on a test basis, evidence supporting the amounts and disclosures in the financial statements, assessing the accounting principles used and significant estimates made by management, and evaluating the overall financial statement presentation. We believe that our audits provide a reasonable basis for our opinion.
/s/PricewaterhouseCoopers LLP
Orlando, Florida
March 3, 2016
33
TOPBUILD CORP.
(In thousands except share amounts)
|
|
|
As of December 31, |
|
||||
|
|
|
2015 |
|
2014 |
|
||
|
ASSETS |
|
|
|
|
|
|
|
|
Current assets: |
|
|
|
|
|
|
|
|
Cash and cash equivalents |
|
$ |
112,848 |
|
$ |
2,965 |
|
|
Receivables, net of an allowance for doubtful accounts of $3,399 and $3,961 at December 31, 2015 and 2014, respectively |
|
|
235,549 |
|
|
220,176 |
|
|
Inventories, net |
|
|
118,701 |
|
|
106,972 |
|
|
Prepaid expenses and other current assets |
|
|
13,263 |
|
|
5,117 |
|
|
Total current assets |
|
|
480,361 |
|
|
335,230 |
|
|
|
|
|
|
|
|
|
|
|
|
|
|
|
|
|
|
|
|
Property and equipment, net |
|
|
93,066 |
|
|
93,157 |
|
|
Goodwill |
|
|
1,044,041 |
|
|
1,044,041 |
|
|
Other intangible assets, net |
|
|
1,987 |
|
|
2,962 |
|
|
Deferred tax assets, net |
|
|
20,549 |
|
|
— |
|
|
Other assets |
|
|
2,245 |
|
|
1,034 |
|
|
Total assets |
|
$ |
1,642,249 |
|
$ |
1,476,424 |
|
|
|
|
|
|
|
|
|
|
|
LIABILITIES AND EQUITY |
|
|
|
|
|
|
|
|
Current liabilities: |
|
|
|
|
|
|
|
|
Accounts payable |
|
$ |
253,311 |
|
$ |
228,720 |
|
|
Current portion of long-term debt |
|
|
15,000 |
|
|
— |
|
|
Accrued liabilities |
|
|
58,369 |
|
|
72,747 |
|
|
Total current liabilities |
|
|
326,680 |
|
|
301,467 |
|
|
|
|
|
|
|
|
|
|
|
Long-term debt |
|
|
178,457 |
|
|
— |
|
|
Deferred tax liabilities, net |
|
|
181,254 |
|
|
182,281 |
|
|
Other liabilities |
|
|
40,129 |
|
|
40,385 |
|
|
Total liabilities |
|
|
726,520 |
|
|
524,133 |
|
|
|
|
|
|
|
|
|
|
|
Commitments and contingencies |
|
|
|
|
|
|
|
|
|
|
|
|
|
|
|
|
|
Equity: |
|
|
|
|
|
|
|
|
Preferred stock, $0.01 par value: 10,000,000 shares authorized; 0 shares issued and outstanding at December 31, 2015 |
|
|
— |
|
|
— |
|
|
Common stock, $0.01 par value: 250,000,000 shares authorized; 37,681,765 shares issued and outstanding at December 31, 2015 |
|
|
377 |
|
|
— |
|
|
Additional paid-in capital |
|
|
838,976 |
|
|
— |
|
|
Retained earnings |
|
|
76,376 |
|
|
— |
|
|
Former Parent investment |
|
|
— |
|
|
952,291 |
|
|
Total equity |
|
|
915,729 |
|
|
952,291 |
|
|
Total liabilities and equity |
|
$ |
1,642,249 |
|
$ |
1,476,424 |
|
See notes to our consolidated financial statements.
34
TOPBUILD CORP.
CONSOLIDATED STATEMENTS OF OPERATIONS
(In thousands except per common share amounts)
|
|
|
Years Ended December 31, |
|||||||
|
|
|
2015 |
|
2014 |
|
2013 |
|||
|
Net sales |
|
$ |
1,616,580 |
|
$ |
1,512,077 |
|
$ |
1,411,524 |
|
Cost of sales |
|
|
1,258,551 |
|
|
1,180,409 |
|
|
1,108,846 |
|
Gross profit |
|
|
358,029 |
|
|
331,668 |
|
|
302,678 |
|
|
|
|
|
|
|
|
|
|
|
|
Selling, general, and administrative expense |
|
|
274,498 |
|
|
290,951 |
|
|
278,575 |
|
Operating profit |
|
|
83,531 |
|
|
40,717 |
|
|
24,103 |
|
|
|
|
|
|
|
|
|
|
|
|
Other income (expense), net: |
|
|
|
|
|
|
|
|
|
|
Interest expense |
|
|
(9,465) |
|
|
(12,404) |
|
|
(13,366) |
|
Other, net |
|
|
49 |
|
|
25 |
|
|
37 |
|
Other expense, net: |
|
|
(9,416) |
|
|
(12,379) |
|
|
(13,329) |
|
Income from continuing operations before income taxes |
|
|
74,115 |
|
|
28,338 |
|
|
10,774 |
|
|
|
|
|
|
|
|
|
|
|
|
Income tax benefit (expense) from continuing operations |
|
|
5,008 |
|
|
(17,842) |
|
|
(22,325) |
|
Income (loss) from continuing operations |
|
|
79,123 |
|
|
10,496 |
|
|
(11,551) |
|
|
|
|
|
|
|
|
|
|
|
|
Loss from discontinued operations, net |
|
|
(152) |
|
|
(1,093) |
|
|
(1,187) |
|
Net income (loss) |
|
$ |
78,971 |
|
$ |
9,403 |
|
$ |
(12,738) |
|
|
|
|
|
|
|
|
|
|
|
|
Income (loss) per common share: |
|
|
|
|
|
|
|
|
|
|
Basic: |
|
|
|
|
|
|
|
|
|
|
Income (loss) from continuing operations |
|
$ |
2.10 |
|
$ |
0.28 |
|
$ |
(0.31) |
|
Loss from discontinued operations, net |
|
|
— |
|
|
(0.03) |
|
|
(0.03) |
|
Net income (loss) |
|
$ |
2.10 |
|
$ |
0.25 |
|
$ |
(0.34) |
|
|
|
|
|
|
|
|
|
|
|
|
Diluted: |
|
|
|
|
|
|
|
|
|
|
Income (loss) from continuing operations |
|
$ |
2.09 |
|
$ |
0.28 |
|
$ |
(0.31) |
|
Loss from discontinued operations, net |
|
|
— |
|
|
(0.03) |
|
|
(0.03) |
|
Net income (loss) |
|
$ |
2.09 |
|
$ |
0.25 |
|
$ |
(0.34) |
See notes to our consolidated financial statements.
35
TOPBUILD CORP.
CONSOLIDATED STATEMENTS OF CASH FLOWS
(In thousands)
|
|
|
Years Ended December 31, |
|||||||
|
|
|
2015 |
|
2014 |
|
2013 |
|||
|
Net Cash From (For) Operating Activities: |
|
|
|
|
|
|
|
|
|
|
Net income (loss) |
|
$ |
78,971 |
|
$ |
9,403 |
|
$ |
(12,738) |
|
Adjustments to reconcile net income to net cash from (for) operating activities: |
|
|
|
|
|
|
|
|
|
|
Depreciation and amortization |
|
|
12,108 |
|
|
26,079 |
|
|
27,488 |
|
Share-based compensation |
|
|
4,651 |
|
|
3,762 |
|
|
3,903 |
|
Loss on sale of property and equipment |
|
|
2,334 |
|
|
364 |
|
|
591 |
|
Provision for bad debt expense |
|
|
4,219 |
|
|
3,563 |
|
|
3,379 |
|
Loss from inventory obsolescence |
|
|
1,879 |
|
|
1,302 |
|
|
743 |
|
Non-cash employee benefit policy change |
|
|
(9,861) |
|
|
— |
|
|
— |
|
Deferred income taxes, net |
|
|
(16,556) |
|
|
16,711 |
|
|
21,609 |
|
Changes in certain assets and liabilities: |
|
|
|
|
|
|
|
|
|
|
Receivables, net |
|
|
(19,591) |
|
|
(19,225) |
|
|
(25,620) |
|
Inventories, net |
|
|
(13,608) |
|
|
(10,287) |
|
|
(13,376) |
|
Prepaids and other current assets |
|
|
(9,054) |
|
|
100 |
|
|
(1,186) |
|
Accounts payable |
|
|
24,008 |
|
|
44,941 |
|
|
27,676 |
|
Accrued liabilities |
|
|
(3,746) |
|
|
(4,768) |
|
|
(7,733) |
|
Other, net |
|
|
257 |
|
|
(84) |
|
|
(64) |
|
Net cash from operating activities |
|
|
56,011 |
|
|
71,861 |
|
|
24,672 |
|
|
|
|
|
|
|
|
|
|
|
|
Cash Flows From (For) Investing Activities: |
|
|
|
|
|
|
|
|
|
|
Purchases of property and equipment |
|
|
(13,644) |
|
|
(13,141) |
|
|
(14,008) |
|
Proceeds from sale of property and equipment |
|
|
805 |
|
|
999 |
|
|
281 |
|
Other, net |
|
|
632 |
|
|
880 |
|
|
(541) |
|
Net cash for investing activities |
|
|
(12,207) |
|
|
(11,262) |
|
|
(14,268) |
|
|
|
|
|
|
|
|
|
|
|
|
Cash Flows From (For) Financing Activities: |
|
|
|
|
|
|
|
|
|
|
Net transfer from (to) Former Parent |
|
|
72,965 |
|
|
(60,655) |
|
|
(18,124) |
|
Cash distribution paid to Former Parent |
|
|
(200,000) |
|
|
— |
|
|
— |
|
Proceeds from issuance of long-term debt |
|
|
200,000 |
|
|
— |
|
|
— |
|
Repayment of long-term debt |
|
|
(5,000) |
|
|
— |
|
|
— |
|
Payment of debt issuance costs |
|
|
(1,715) |
|
|
— |
|
|
— |
|
Other, net |
|
|
(171) |
|
|
— |
|
|
— |
|
Net cash from (for) financing activities |
|
|
66,079 |
|
|
(60,655) |
|
|
(18,124) |
|
|
|
|
|
|
|
|
|
|
|
|
Cash and Cash Equivalents |
|
|
|
|
|
|
|
|
|
|
Increase (decrease) for the year |
|
|
109,883 |
|
|
(56) |
|
|
(7,720) |
|
Beginning of year |
|
|
2,965 |
|
|
3,021 |
|
|
10,741 |
|
End of year |
|
$ |
112,848 |
|
$ |
2,965 |
|
$ |
3,021 |
|
|
|
|
|
|
|
|
|
|
|
|
Supplemental disclosure of cash paid for: |
|
|
|
|
|
|
|
|
|
|
Cash interest on long-term debt |
|
$ |
2,233 |
|
$ |
— |
|
$ |
— |
|
Income taxes |
|
|
20,992 |
|
|
1,134 |
|
|
717 |
|
|
|
|
|
|
|
|
|
|
|
|
Supplemental disclosure of noncash investing activities: |
|
|
|
|
|
|
|
|
|
|
Accruals for property and equipment |
|
$ |
583 |
|
$ |
— |
|
$ |
— |
See notes to our consolidated financial statements.
36
TOPBUILD CORP.
CONSOLIDATED STATEMENTS OF CHANGES IN EQUITY
(In thousands)
|
|
|
Common |
|
Additional |
|
|
|
|
Former |
|
|
|
|
|||
|
|
|
Stock |
|
Paid-in |
|
Retained |
|
Parent |
|
|
|
|||||
|
|
|
($0.01 par value) |
|
Capital |
|
Earnings |
|
Investment |
|
Equity |
|
|||||
|
Balance at December 31, 2012 |
|
$ |
— |
|
$ |
— |
|
$ |
— |
|
$ |
1,026,770 |
|
$ |
1,026,770 |
|
|
Net income |
|
|
— |
|
|
— |
|
|
— |
|
|
(12,738) |
|
|
(12,738) |
|
|
Net transfers to Former Parent |
|
|
— |
|
|
— |
|
|
— |
|
|
(11,350) |
|
|
(11,350) |
|
|
Balance at December 31, 2013 |
|
$ |
— |
|
$ |
— |
|
$ |
— |
|
$ |
1,002,682 |
|
$ |
1,002,682 |
|
|
Net income |
|
|
— |
|
|
— |
|
|
— |
|
|
9,403 |
|
|
9,403 |
|
|
Net transfers to Former Parent |
|
|
— |
|
|
— |
|
|
— |
|
|
(59,794) |
|
|
(59,794) |
|
|
Balance at December 31, 2014 |
|
$ |
— |
|
$ |
— |
|
$ |
— |
|
$ |
952,291 |
|
$ |
952,291 |
|
|
Net income |
|
|
— |
|
|
— |
|
|
76,376 |
|
|
2,595 |
|
|
78,971 |
|
|
Separation-related adjustments |
|
|
— |
|
|
— |
|
|
— |
|
|
(118,356) |
|
|
(118,356) |
|
|
Reclassification of Former Parent investment in connection with the Separation |
|
|
— |
|
|
836,530 |
|
|
— |
|
|
(836,530) |
|
|
— |
|
|
Issuance of common stock at Separation |
|
|
377 |
|
|
(377) |
|
|
— |
|
|
— |
|
|
— |
|
|
Share-based compensation |
|
|
— |
|
|
2,823 |
|
|
— |
|
|
— |
|
|
2,823 |
|
|
Balance at December 31, 2015 |
|
$ |
377 |
|
$ |
838,976 |
|
$ |
76,376 |
|
$ |
— |
|
$ |
915,729 |
|
See notes to our consolidated financial statements.
37
1. SUMMARY OF SIGNIFICANT ACCOUNTING POLICIES
Basis of Presentation. On June 30, 2015 (the “Effective Date”), Masco Corporation (“Masco” or the “Former Parent”) completed the separation (the “Separation”) of its Installation and Other Services businesses (the “Services Business”) from its other businesses. On the Effective Date, TopBuild Corp. (“TopBuild” or the “Company”), a Delaware corporation formed in anticipation of the Separation, became an independent public company which holds, through its subsidiaries, the assets and liabilities associated with the Services Business. The Separation was achieved through the distribution of 100 percent of the outstanding capital stock of TopBuild to holders of Masco Corporation common stock. Immediately following the Separation, Masco Corporation stockholders owned 100 percent of the outstanding shares of common stock of TopBuild. References to “TopBuild,” the “Company,” “we,” “our,” and “us” refer to TopBuild Corp. and its consolidated subsidiaries.
Prior to the Separation, the consolidated financial statements of TopBuild were prepared on a stand-alone basis and reflect the historical results of operations, financial position, and cash flows of Masco’s Services Business, including an allocable portion of corporate costs.
We report our business in two segments, Installation and Distribution. Our Installation segment principally includes the sales and installation of insulation and other building products. Our Distribution segment principally includes the distribution of insulation and other building products. Our segments are based on our operating units, for which financial information is regularly evaluated by our corporate operating executives.
Financial Statement Presentation. The consolidated financial statements have been developed in conformity with accounting principles generally accepted in the United States of America (“U.S. GAAP”). Historically, stand-alone financial statements were not prepared for the Services Business. Separation related adjustments recorded in the Consolidated Statements of Changes in Equity primarily relate to a cash distribution of $200 million made by TopBuild to Masco immediately prior to the Separation, offset by net transfers from the Former Parent.
All intercompany transactions between the TopBuild entities have been eliminated. Transactions between TopBuild and Masco prior to the Separation, with the exception of purchase transactions, are reflected in equity in the Consolidated Balance Sheets as “Former Parent investment” and in the Consolidated Statements of Cash Flows as a financing activity in “Net transfer from (to) Former Parent.”
The accompanying consolidated financial statements for the periods prior to the Separation include allocations of general corporate expenses that were incurred by Masco for functions such as corporate human resources, finance, and legal, including salaries, benefits, and other related costs. These general corporate expenses were allocated to TopBuild on the basis of sales. Total allocated general corporate costs were $13.6 million, $21.9 million, and $22.1 million for the years ended December 31, 2015, 2014, and 2013, respectively and are included in selling, general, and administrative expense.
Prior to the Separation, Masco incurred certain operating expenses on behalf of the Services Business which were allocated to TopBuild based on direct benefit or usage. These allocated operating expenses were $5.6 million, $17.8 million, and $16.0 million for the years ended December 31, 2015, 2014, and 2013, respectively and are included in selling, general, and administrative expense. An estimate of these operating expenses were allocated to each of TopBuild’s reporting segment, based on a percentage of sales.
For the periods prior to the Separation, these consolidated financial statements may not reflect the actual expenses that would have been incurred had we operated as a stand-alone company and may not reflect the consolidated results of operations, financial position, and cash flows had we operated as a stand-alone company. Actual costs that would have been incurred had we operated as a stand-alone company prior to the Separation would depend on multiple factors including organizational structure and strategic decisions made in various areas, including information technology and infrastructure.
38
During the first quarter ended March 31, 2015, we identified an error related primarily to the misallocation of a favorable legal settlement to general corporate expenses of TopBuild in the fourth quarter of 2014. The impact of the error was to understate the allocation of corporate expense reported as selling, general, and administrative expense and overstate operating profit by $1.9 million. The error was not considered material to the previously reported 2014 financial statements. We recorded the correction of the error by an out-of-period adjustment in the first quarter of 2015 which is therefore reflected in the twelve months ended December 31, 2015 Consolidated Statements of Operations and Consolidated Statements of Cash Flows.
Use of Estimates and Assumptions in the Preparation of Financial Statements. The preparation of our consolidated financial statements in conformity with U.S. GAAP requires us to make certain estimates and assumptions that affect the reported amounts of assets and liabilities, and disclosure of any contingent assets and liabilities, at the date of the financial statements, and the reported amounts of sales and expenses during the reporting period. Actual results may differ from these estimates and assumptions.
Revenue Recognition. We recognize revenue for our Installation segment using the percentage of completion method of accounting based on the amount of material installed and associated labor costs at our customers’ locations compared to the total expected cost for the contract. The amount of revenue recognized for our Installation segment, which had not been billed as of December 31, 2015 and 2014, was $23.7 million and $23.6 million, respectively. Revenue from our distribution segment is recognized when title to products and risk of loss transfers to our customers. At time of sale we record estimated reductions to revenue for customer programs and incentive offerings, including special pricing and other volume‑based incentives.
Income Taxes. We account for income taxes using the asset and liability method, which requires recognition of deferred tax assets and liabilities for expected future tax consequences of temporary differences that currently exist between tax basis and financial reporting basis of our assets and liabilities. Deferred tax assets and liabilities are measured using enacted tax rates in the respective jurisdictions in which we operate.
Valuation allowances are established against deferred tax assets when it is more likely than not that the realization of those deferred tax assets will not occur. In evaluating our ability to recover our deferred tax assets within the jurisdiction from which they arise, we consider all available positive and negative evidence. If, based upon all available evidence, both positive and negative, it is more likely than not (more than 50 percent likely) such deferred tax assets will not be realized, a valuation allowance is recorded. Significant weight is given to positive and negative evidence that is objectively verifiable. A company’s three year cumulative loss position is significant negative evidence in considering whether deferred tax assets are realizable and the accounting guidance restricts the amount of reliance we can place on projected taxable income to support the recovery of the deferred tax assets.
Interest and penalties on our uncertain tax positions, if recorded, are reported in income tax expense.
Cash and Cash Equivalents. We consider our highly liquid investments with a maturity of three months or less at the time of purchase to be cash and cash equivalents.
Receivables, net. We do business with a significant number of customers, principally homebuilders. We monitor our exposure for credit losses on our customer receivable balances and the credit worthiness of our customers on an on‑going basis and record related allowances for doubtful accounts. Allowances are estimated based upon specific customer balances where a risk of default has been identified, and also include a provision for non‑customer specific defaults based upon historical collection, return, and write‑off activity. During downturns in our markets, declines in the financial condition and creditworthiness of customers impact the credit risk of the receivables involved and we have incurred additional bad debt expense related to customer defaults. Receivables, net are presented net of certain allowances, including allowances for doubtful accounts.
Inventories, net. Inventories, net consist primarily of insulation, rain gutters, garage doors, fireplaces, fireproofing and firestopping products, roofing and shingles, shower enclosures, closet shelving, accessories, and other products. We value inventory at the lower of cost or market, where cost is determined by the first in‑first out cost method.
39
Inventory value is evaluated at each balance sheet date to ensure that it is carried at the lower of cost or market. Inventory provisions are recorded to reduce inventory to the lower of cost or market value for obsolete or slow moving inventory based on assumptions about future demand and marketability of products, the impact of new product introductions, inventory levels and turns, product spoilage, and specific identification of items such as product discontinuance, engineering/material changes, or regulatory-related changes. As of December 31, 2015 and 2014, all inventory consisted of finished goods.
Property and Equipment, net. Property and equipment, net, including significant betterments to existing facilities, are recorded at cost. Upon retirement or disposal, the cost and accumulated depreciation are removed from the accounts and any gain or loss is included in the Consolidated Statements of Operations. Maintenance and repair costs are charged against earnings as incurred. Gains and losses on the disposal of equipment are included in selling, general, and administrative expense.
We review our property and equipment as an event occurs or circumstances change that would more likely than not reduce the fair value of the property and equipment below the carrying amount. If the carrying amount is not recoverable from its undiscounted cash flows, we would recognize an impairment loss for the difference between the carrying amount and the current fair value. Further, we evaluate the remaining useful lives of property and equipment at each reporting period to determine whether events and circumstances warrant a revision to the remaining depreciation periods.
Depreciation. Depreciation expense is computed principally using the straight‑line method over the estimated useful lives of the assets. Estimated useful lives are as follows:
|
Asset Class |
Estimated Useful Life |
|
Buildings and land improvements |
20 – 40 years |
|
Software and company vehicles |
3 – 6 years |
|
Equipment |
3 – 15 years |
Fair Value. The fair value measurement standard defines fair value as the price that would be received to sell an asset, or paid to transfer a liability, in an orderly transaction between market participants at the measurement date (referred to as an “exit price”). A fair value hierarchy is established that prioritizes the inputs to valuation techniques used to measure fair value. The hierarchy gives the highest priority to unadjusted quoted market prices in active markets for identical assets and liabilities (Level 1 measurements) and the lowest priority to unobservable inputs (Level 3 measurements). The three levels of the fair value hierarchy are:
Level 1: Quoted prices in active markets for identical assets or liabilities.
Level 2: Observable inputs other than Level 1 prices, such as quoted market prices for similar assets or liabilities or other inputs that are observable or can be corroborated by market data.
Level 3: Unobservable inputs in which there is little or no market data, which require the reporting entity to develop its own assumptions.
Goodwill and Other Intangible Assets. We perform our annual impairment testing of goodwill in the fourth quarter of each year, or as events occur or circumstances change that would more likely than not reduce the fair value of a reporting unit below its carrying amount. We have defined our reporting units and completed the impairment testing of goodwill at the operating segment level. Our operating segments are reporting units that engage in business activities for which discrete financial information, including long-range forecasts, are available. We compare the fair value of the reporting units to the carrying value of the reporting units for goodwill impairment testing. Fair value for our reporting units is determined using a discounted cash flow method, which includes significant unobservable inputs (Level 3 inputs).
40
Determining market values using a discounted cash flow method requires us to make significant estimates and assumptions, including long‑term projections of cash flows, market conditions, and appropriate discount rates. Our judgments are based upon historical experience, current market trends, consultations with external valuation specialists and other information. In estimating future cash flows, we rely on internally generated long-range forecasts for sales and operating profits, including capital expenditures, and generally utilize a one to three percent long‑term assumed annual growth rate of cash flows for periods after the long-range forecast. An impairment loss is recognized to the extent that a reporting unit’s recorded goodwill exceeds the implied fair value of goodwill.
Intangible assets with finite useful lives are amortized using the straight‑line method over their estimated useful lives. We evaluate the remaining useful lives of amortizable intangible assets at each reporting period to determine whether events and circumstances warrant a revision to the remaining periods of amortization. For additional information, see Note 4 - Goodwill and Other Intangible Assets.
Insurance Reserves. We use a combination of high deductible insurance and matching deductible insurance for a number of risks including, but not limited to, workers’ compensation, general, vehicle, and property liabilities. Our workers’ compensation insurance is primarily a high‑deductible insurance program and our primary general liability insurance is a matching deductible program. We are insured for covered claims above the deductibles and retentions. The liabilities represent our best estimate of our costs, using generally accepted actuarial reserving methods, of the ultimate obligations for reported claims plus those incurred but not reported claims through December 31, 2015 and 2014. The accruals are adjusted as new information develops or circumstances change that would affect the estimated liability. We also have an insurance receivable for claims that exceeded the stop loss limit included in other assets on our Consolidated Balance Sheets which offsets an equal liability included within the reserve amount recorded in other liabilities on our Consolidated Balance Sheet. At December 31, 2015 and 2014, the amount of this receivable and liability was $1.8 million and $1.4 million, respectively
Advertising. Advertising costs are expensed as incurred. Advertising expense, net of manufacturers support, was approximately $1.5 million, $2.5 million, and $3.1 million for the years ended December 31, 2015, 2014, and 2013, respectively, and is included in selling, general, and administrative expense.
Share‑based Compensation. Our share-based compensation program consists of restricted stock and stock option awards. We grant restricted stock awards with a fair value based on our closing stock price on the date of grant. Restricted stock awards generally vest ratably over five years. We also grant stock options for a fixed number of shares to certain employees with an exercise price equal to the market price of our common stock on the date of grant. Stock options generally become exercisable (vest ratably) over five years beginning on the first anniversary from the date of grant and expire no later than 10 years after the grant date. The fair value of stock option awards is determined using the Black-Scholes Options Pricing Model. We have elected to use the straight-line method to recognize compensation expense evenly over the respective service period for restricted stock awards and stock option grants. Share-based compensation expense is reported in selling, general, and administrative expense.
Debt Issuance Costs. Debt issuance costs are amortized as interest expense over the life of the respective debt, which approximates the effective interest rate method.
Leases. Leases where the lessor retains substantially all the risks and benefits of ownership of the asset are classified as operating leases. Operating lease payments are recognized as an expense in the Consolidated Statements of Operations on a straight-line basis over the lease term, including future option periods the Company reasonably expects to exercise, whereby an equal amount of rent expense is attributed to each period during the term of the lease, regardless of when actual payments are made. This generally results in rent expense in excess of cash payments during the early years of a lease and rent expense less than cash payments in later years. The difference between rent expense recognized and actual rental payments is recorded as deferred rent and included in other liabilities. Lease termination costs are accrued over the life of the lease based on historical experience. Leasehold improvements are amortized over the lesser of the expected lease term, including cancelable option periods, or the estimated useful lives of the related assets using the straight-line method.
41
Recently Issued Accounting Pronouncements: In May 2014, the Financial Accounting Standards Board (“FASB”) issued a new standard for revenue recognition, Accounting Standards Codification 606 (“ASC 606”). The purpose of ASC 606 is to provide a single, comprehensive revenue recognition model for all contracts with customers to improve comparability across industries. ASC 606 is effective for us for annual periods beginning January 1, 2018. We are currently evaluating the impact the adoption of this new standard will have on our results of operations.
In April 2014, the FASB issued Accounting Standards Update 2014-8 (“ASU 2014-8”), “Reporting of Discontinued Operations and Disclosure of Disposals of Components of an Entity,” which changes the criteria for determining which disposals can be presented as discontinued operations and modifies the related disclosure requirements. On January 1, 2015, we adopted ASU 2014-8. Adoption of the new standard did not have an impact on our financial position or results of operations.
In April 2015, the FASB issued Accounting Standards Update 2015-03 (“ASU 2015-03”), “Interest – Imputation of Interest (Subtopic 835-30) – Simplifying the Presentation of Debt Issuance Costs,” which requires that all costs incurred to issue debt be presented in the balance sheet as a direct deduction from the carrying value of the debt. ASU 2015-3 is effective for us in the first quarter of 2016, however, we elected to early adopt this standard retrospectively during the fourth quarter of 2015. The adoption of this standard did not affect our Consolidated Statements of Operations. As we did not incur any debt issuance costs prior to the Separation there is no change to our Consolidated Balance Sheet as of December 31, 2014.
In July 2015, the FASB issued Accounting Standards Update 2015-11 (“ASU 2015-11”), “Simplifying the Measurement of Inventory.” Under the amendment, ASU 2015-11, inventory should be measured at the lower of cost and net realizable value. Net realizable value is the estimated selling price in the ordinary course of business, less reasonably predictable costs of completion, disposal, and transportation. This guidance is effective for fiscal years beginning after December 15, 2016. Early adoption is permitted. We do not expect the adoption of this amendment to have a material impact on our financial position or results of operations.
In November 2015, the FASB issued Accounting Standards Update 2015-17 (“ASU 2015-17”), “Balance Sheet Classification of Deferred Taxes.” This guidance requires that all deferred tax assets and liabilities, along with any related valuation allowance, be classified as noncurrent on the balance sheet. ASU 2015-17 is effective for us in the first quarter of 2017, however, we early adopted this new standard prospectively during the fourth quarter of 2015. As we adopted this guidance prospectively, prior periods were not retrospectively adjusted. The adoption of this standard did not affect our Consolidated Statements of Operations.
2. RELATED PARTY TRANSACTIONS
Prior to the Separation, interest was charged each month as an adjustment to Former Parent investment in TopBuild. Our Consolidated Statements of Operations reflect an interest expense charge of $6.3 million, $12.4 million, and $13.4 million for the years ended December 31, 2015, 2014, and 2013, respectively. The charge was based on the monthly average intercompany balance payable to Masco based on a 12-month LIBOR plus two percent.
Prior to the Separation, transactions between us and Masco, with the exception of purchase transactions, are reflected in equity in the Consolidated Balance Sheets as “Former Parent investment” and in the Consolidated Statements of Cash Flows as a financing activity in “Net transfer from (to) Former Parent.” TopBuild related party purchases from Masco businesses aggregated $2.6 million, $6.7 million, and $6.4 million for the years ended December 31, 2015, 2014, and 2013, respectively, and have been included in cost of sales. The amounts owed to Masco subsidiaries was $0.6 million at December 31, 2014. Subsequent to the Separation, any transactions with Masco are no longer considered related party and are reflected in our Consolidated Statements of Operations and included in the operating cash flow section of our Consolidated Statements of Cash Flows.
In conjunction with the Separation, we executed several agreements with Masco. These agreements include a Tax Matters Agreement, a Transition Services Agreement, and an Employee Matters Agreement. The Tax Matters Agreement governs the parties’ respective rights, responsibilities, and obligations with respect to taxes. The Transition
42
Services Agreement sets forth the terms on which Masco will provide to us and we will provide to Masco, on a transition basis, certain services or functions that the companies have historically shared. The Employee Matters Agreement governs our, and Masco’s, compensation and employee benefit obligations with respect to current and former employees and non-employee directors of each company. Masco will continue to provide some of thse services to us, generally through June 30, 2016, with a possible extension of 12 months.
One of our directors, Mr. Carl Camden, is the Chief Executive and President of Kelly Services, Inc. We purchased approximately $0.2 million, $0.1 million, and $0.2 million of Kelly Services’ services in the years ended December 31, 2015, 2014, and 2013, respectively.
Subsequent to the Separation, one of our Directors, Mr. Dennis Archer, continues to serve on the Masco board of directors.
3. PROPERTY & EQUIPMENT
The following table sets forth our property and equipment by class as of December 31, 2015 and 2014, in thousands:
|
|
|
As of December 31, |
||||
|
|
|
2015 |
|
2014 |
||
|
Land and improvements |
|
$ |
7,950 |
|
$ |
8,055 |
|
Buildings |
|
|
39,424 |
|
|
39,521 |
|
Equipment |
|
|
85,217 |
|
|
80,818 |
|
Computer hardware and software |
|
|
123,550 |
|
|
124,835 |
|
Company vehicles |
|
|
36,988 |
|
|
38,965 |
|
|
|
|
293,129 |
|
|
292,194 |
|
Less: Accumulated depreciation |
|
|
(200,063) |
|
|
(199,037) |
|
Total property and equipment, net |
|
$ |
93,066 |
|
$ |
93,157 |
Depreciation expense was $11.1 million, $24.9 million, and $26.2 million for the years ended December 31, 2015, 2014, and 2013, respectively
4. GOODWILL AND OTHER INTANGIBLES
There were no changes in the carrying amount of goodwill for the years ended December 31, 2015 and 2014. The goodwill balances by segment, were as follows, in thousands:
|
|
|
Gross Goodwill |
|
Gross Goodwill |
|
Accumulated |
|
Net Goodwill |
|
||||
|
|
|
at |
|
at |
|
Impairment |
|
at |
|
||||
|
|
|
December 31, 2014 |
|
December 31, 2015 |
|
Losses |
|
December 31, 2015 |
|
||||
|
Installation |
|
$ |
1,389,775 |
|
$ |
1,389,775 |
|
$ |
(762,021) |
|
$ |
627,754 |
|
|
Distribution |
|
|
416,287 |
|
|
416,287 |
|
|
— |
|
|
416,287 |
|
|
Total |
|
$ |
1,806,062 |
|
$ |
1,806,062 |
|
$ |
(762,021) |
|
$ |
1,044,041 |
|
|
|
|
Gross Goodwill |
|
Gross Goodwill |
|
Accumulated |
|
Net Goodwill |
|
||||
|
|
|
at |
|
at |
|
Impairment |
|
at |
|
||||
|
|
|
December 31, 2013 |
|
December 31, 2014 |
|
Losses |
|
December 31, 2014 |
|
||||
|
Installation |
|
$ |
1,389,775 |
|
$ |
1,389,775 |
|
$ |
(762,021) |
|
$ |
627,754 |
|
|
Distribution |
|
|
416,287 |
|
|
416,287 |
|
|
— |
|
|
416,287 |
|
|
Total |
|
$ |
1,806,062 |
|
$ |
1,806,062 |
|
$ |
(762,021) |
|
$ |
1,044,041 |
|
In the fourth quarters of 2015 and 2014, we completed our annual impairment testing of goodwill and other indefinite-lived intangible assets. The impairment tests in both 2015 and 2014 indicated there was no impairment of goodwill or other indefinite-lived intangible assets.
43
Other intangible assets, net includes customer relationships, non-compete agreements, and trademarks. The following table sets forth our other intangible assets and associated amortization expense, in thousands:
|
|
For the years ended December 31, |
|
|||||||
|
|
2015 |
|
2014 |
|
2013 |
|
|||
|
Gross definite-lived intangible assets |
$ |
19,472 |
|
$ |
19,727 |
|
|
|
|
|
Accumulated amortization |
|
(17,892) |
|
|
(17,172) |
|
|
|
|
|
Net definite-lived intangible assets |
|
1,580 |
|
|
2,555 |
|
|
|
|
|
Indefinite-lived intangible assets not subject to amortization |
|
407 |
|
|
407 |
|
|
|
|
|
Other intangible assets, net |
$ |
1,987 |
|
$ |
2,962 |
|
|
|
|
|
|
|
|
|
|
|
|
|
|
|
|
Amortization expense recognized |
$ |
1,026 |
|
$ |
1,166 |
|
$ |
1,267 |
|
The following table sets forth the amortization expense related to the definite-lived intangible assets during each of the next five years, in thousands:
|
|
|
Amortization |
|
|
2016 |
|
$ |
722 |
|
2017 |
|
|
327 |
|
2018 |
|
|
106 |
|
2019 |
|
|
106 |
|
2020 |
|
|
106 |
|
Thereafter |
|
|
213 |
|
|
|
|
|
5. LONG-TERM DEBT
In connection with the Separation, the Company and wholly-owned domestic subsidiaries (collectively, the “Guarantors”) entered into a credit agreement and related collateral and guarantee documentation (collectively, the “Credit Agreement”) with PNC Bank, National Association, as administrative agent, and the other lenders and agents party thereto. The Credit Agreement was executed by the parties thereto on June 9, 2015, with an effective date of June 30, 2015.
The Credit Agreement consists of a senior secured term loan facility (“term loan facility”) of $200 million and a senior secured revolving credit facility (“revolving facility”) which provides borrowing availability of up to $125 million. Together, the term loan facility and revolving facility are referred to as the credit facility. Additional borrowing capacity under the credit facility may be accessed by the Company in an aggregate amount not to exceed $100 million without the consent of the lenders, subject to certain conditions (including existing or new lenders providing commitments in respect of such additional borrowing capacity). The credit facility is scheduled to mature on June 30, 2020.
The revolving facility includes a $100 million sublimit for the issuance of letters of credit and a $15 million sublimit for swingline loans. Swingline loans and letters of credit issued under the revolving facility reduce availability under the revolving facility.
The proceeds of the $200 million term loan facility were used to finance a cash distribution to Masco in connection with the Separation. We expect to use the borrowing capacity under the revolving facility from time to time for working capital and funds for general corporate purposes.
Interest payable on the credit facility is based on either:
|
· |
the London interbank offered rate (“LIBOR”), adjusted for statutory reserve requirements (the “Adjusted LIBOR Rate”); or |
44
|
· |
the Base Rate, which is defined as the highest of (a) the prime rate, (b) the federal funds open rate plus 0.50 percent, and (c) the daily LIBOR rate for a one-month interest period plus 1.0 percent, |
plus, (A) in the case of Adjusted LIBOR Rate borrowings, applicable margins ranging from 1.00 percent to 2.00 percent per annum, and (B) in the case of Base Rate borrowings, spreads ranging from 0.00 percent to 1.00 percent per annum, depending on, in each of (A) and (B), the Company’s Total Leverage Ratio, defined as the ratio of debt to EBITDA, ranging from less than or equal to 1.00:1.00 to greater than 2.50:1.00. The interest rate period with respect to the Adjusted LIBOR Rate interest rate option can be set at one-, two-, three-, or six-months, and in certain circumstances one-week or 12-months, as selected by the Company in accordance with the terms of the Credit Agreement. The interest rate as of December 31, 2015, was 2.42 percent. The effective interest rate on the term loan facility for the year ending December 31, 2015, was 2.23 percent.
The Company shall make payments on the outstanding principal amount of the term loan in quarterly principal installments based on annual amortization of (a) for the first year, 5 percent, (b) for the second, third, and fourth years, 10 percent per year, and (c) for the fifth year, 15 percent, with the remaining balance payable on the scheduled maturity date of the term loan.
The following table sets forth our principal payments for the following five years, in thousands:
|
|
|
Total Principal |
|
|
|
|
Payments |
|
|
Schedule of Debt Maturity by Years: |
|
|
|
|
2016 |
|
$ |
15,000 |
|
2017 |
|
|
20,000 |
|
2018 |
|
|
20,000 |
|
2019 |
|
|
25,000 |
|
2020 |
|
|
115,000 |
|
Total principal maturities |
|
$ |
195,000 |
The following table reconciles the principal balance of our long-term debt to our Consolidated Balance Sheets as of December 31, 2015 and 2014, in thousands:
|
|
|
2015 |
|
2014 |
||
|
Current portion of long-term debt |
|
$ |
15,000 |
|
$ |
— |
|
Long term portion of long-term debt |
|
|
180,000 |
|
|
— |
|
Unamortized debt issuance costs |
|
|
(1,543) |
|
|
— |
|
Long-term debt |
|
$ |
193,457 |
|
$ |
— |
Borrowings under the credit facility are prepayable at the Company’s option without premium or penalty. The Company is required to prepay the term loan with the net cash proceeds of certain asset sales, debt issuances, or casualty events, subject to certain exceptions.
The Credit Agreement contains certain covenants that limit, among other things, the ability of the Company and its subsidiaries to incur additional indebtedness or liens; to make certain investments or loans; to make certain restricted payments; to enter into consolidations, mergers, sales of material assets, and other fundamental changes; to transact with affiliates; to enter into agreements restricting the ability of subsidiaries to incur liens or pay dividends; or to make certain accounting changes. In addition, the Credit Agreement requires us to maintain a net leverage ratio, defined as the ratio of debt (less certain cash) to EBITDA, that is less than (i) from the date the Credit Agreement is entered into through December 31, 2015, 3.50:1.00; (ii) from March 31, 2016, through September 30, 2016, 3.25:1.00; and (iii) from and after December 31, 2016, 3.00:1.00. The Credit Agreement also requires us to maintain a minimum fixed charge coverage ratio of 1.10:1.00. The Credit Agreement contains customary events of default. We were compliant with all covenants as of December 31, 2015.
45
All obligations under the Credit Agreement are guaranteed by the Guarantors, and all obligations under the Credit Agreement, including the guarantees of those obligations, are secured by substantially all of the assets of the Company and the Guarantors.
We have standby letters of credit outstanding of approximately $55.1 million as of December 31, 2015. The standby letters of credit were issued to secure financial obligations related to our workers compensation, general insurance, and auto liability programs.
6. FAIR VALUE MEASUREMENTS
The fair value measurement standard defines fair value as the price that would be received to sell an asset, or paid to transfer a liability, in an orderly transaction between market participants at the measurement date (referred to as an “exit price”). Authoritative guidance on fair value measurements and disclosures clarifies that a fair value measurement for a liability should reflect the entity’s non-performance risk. In addition, a fair value hierarchy is established that prioritizes the inputs to valuation techniques used to measure fair value. The hierarchy gives the highest priority to unadjusted quoted market prices in active markets for identical assets and liabilities (Level 1 measurements) and the lowest priority to unobservable inputs (Level 3 measurements).
Fair Value on Recurring Basis
The carrying values of cash and cash equivalents, receivables, net, and accounts payables are considered to be representative of their respective fair values due to the short-term nature of these instruments.
Fair Value on Non-Recurring Basis
Fair value measurements were applied to our long-term debt. The carrying value of our long-term debt approximates the fair market value, primarily due to the fact that the non-performance risk of servicing our debt obligations, as reflected in our business and credit risk profile, has not materially changed since the debt obligations were assumed on June 30, 2015. In addition, due to the floating-rate nature of our long-term debt, the market value is not subject to variability solely due to changes in the general level of interest rates as is the case with a fixed-rate debt obligation.
During the periods presented, there were no transfers between fair value hierarchical levels.
46
7. SEGMENT INFORMATION
Our reportable segments are as follows:
Installation principally includes the sale and installation of insulation and other building products. We sell primarily to the residential new construction market, but have seen increasing activity in both the commercial construction industry and repair/remodel of residential housing. In addition to insulation, our installed product lines include rain gutters, garage doors, fireplaces, fireproofing and firestopping products, shower enclosures, closet shelving, and other building products.
Distribution principally includes the distribution of insulation and other building products. Our distributed products include insulation, insulation accessories, rain gutters, and roofing, among others. Distributed products are sold primarily to contractors and dealers (including lumber yards) from distribution centers in various parts of the United States.
Our segments are based on our operating units, for which financial information is regularly evaluated by our corporate operating executives in determining resource allocation and assessing performance. Accounting policies for the segments are generally the same as those for the Company. The key performance metric we use to evaluate our businesses is segment operating profit. Operating profit for the individual segments includes estimated corporate costs which are allocated to the segments based on various metrics including sales and headcount. To arrive at total segment operating profit, the aforementioned allocated estimated corporate costs are removed and replaced with actual corporate costs, which are allocated to the segments based on direct benefit or usage (such as salaries of corporate employees who directly support the segment). Differences between estimated and actual corporate costs are included in ‘‘Intercompany eliminations and other adjustments.’’
Intercompany sales from the Distribution segment to the Installation segment are recorded by the Distribution segment with a profit margin and by our Installation segment at cost.
The following table is a summary of the annual percentage of net sales by product category:
|
|
|
2015 |
|
2014 |
|
2013 |
|||
|
Insulation |
|
72 |
% |
|
71 |
% |
|
70 |
% |
|
Rain gutters |
|
7 |
|
|
7 |
|
|
7 |
|
|
Accessories |
|
4 |
|
|
4 |
|
|
4 |
|
|
Afterpaint (shower enclosures, closet shelving, mirrors/glass, bath accessories, etc.) |
|
4 |
|
|
4 |
|
|
3 |
|
|
Garage doors |
|
3 |
|
|
3 |
|
|
3 |
|
|
Fireplaces |
|
2 |
|
|
2 |
|
|
3 |
|
|
Roofing materials |
|
2 |
|
|
2 |
|
|
3 |
|
|
Fireproofing and firestopping |
|
2 |
|
|
1 |
|
|
1 |
|
|
Other |
|
4 |
|
|
6 |
|
|
6 |
|
|
|
|
100 |
% |
|
100 |
% |
|
100 |
% |
47
Information about us by segment is as follows, in thousands:
|
|
|
Net Sales |
|
|
Operating Profit |
|||||||||||||
|
|
|
2015 |
|
2014 |
|
2013 |
|
2015 |
|
2014 |
|
2013 |
||||||
|
Our operations by segment were (1): |
|
|
|
|
|
|
|
|
|
|
|
|
|
|
|
|
|
|
|
Installation |
|
$ |
1,057,553 |
|
$ |
963,351 |
|
$ |
904,570 |
|
$ |
55,232 |
|
$ |
23,970 |
|
$ |
6,160 |
|
Distribution |
|
|
646,441 |
|
|
628,810 |
|
|
578,141 |
|
|
55,700 |
|
|
52,334 |
|
|
46,405 |
|
Intercompany eliminations and other adjustments (2) |
|
|
(87,414) |
|
|
(80,084) |
|
|
(71,187) |
|
|
(4,796) |
|
|
(13,639) |
|
|
(6,389) |
|
Total |
|
$ |
1,616,580 |
|
$ |
1,512,077 |
|
$ |
1,411,524 |
|
|
106,136 |
|
|
62,665 |
|
|
46,176 |
|
General corporate expense, net (3) |
|
|
|
|
|
|
|
|
|
|
|
(22,605) |
|
|
(21,948) |
|
|
(22,073) |
|
Operating profit, as reported |
|
|
|
|
|
|
|
|
|
|
|
83,531 |
|
|
40,717 |
|
|
24,103 |
|
Other expense, net |
|
|
|
|
|
|
|
|
|
|
|
(9,416) |
|
|
(12,379) |
|
|
(13,329) |
|
Income from continuing operations before income taxes |
|
|
|
|
|
|
|
|
|
|
$ |
74,115 |
|
$ |
28,338 |
|
$ |
10,774 |
|
Property Additions |
Depreciation and |
Total Assets |
|||||||||||||||||||||||||||||||||
|
2015 |
2014 |
2013 |
2015 |
2014 |
2013 |
2015 |
2014 |
||||||||||||||||||||||||||||
|
Our operations by segment were (1): |
|
|
|
|
|
|
|
|
|
|
|
|
|
|
|
|
|
|
|
|
|
|
|
|
|||||||||||
|
Installation |
|
$ |
9,802 |
|
$ |
9,270 |
|
$ |
10,505 |
|
$ |
8,371 |
|
$ |
22,564 |
|
$ |
23,924 |
|
$ |
927,303 |
|
$ |
904,118 | |||||||||||
|
Distribution |
|
|
3,123 |
|
|
3,871 |
|
|
3,503 |
|
|
3,699 |
|
|
3,515 |
|
|
3,564 |
|
|
574,601 |
|
|
572,306 | |||||||||||
|
Corporate |
|
|
1,302 |
|
|
— |
|
|
— |
|
|
38 |
|
|
— |
|
|
— |
|
|
140,345 |
|
|
— |
|||||||||||
|
Total, as reported |
|
$ |
14,227 |
|
$ |
13,141 |
|
$ |
14,008 |
|
$ |
12,108 |
|
$ |
26,079 |
|
$ |
27,488 |
|
$ |
1,642,249 |
|
$ |
1,476,424 | |||||||||||
|
(1) |
All of our operations are located in the United States. |
|
|
|
|
(2) |
Intercompany eliminations include the elimination of intercompany profit of $15.6 million, $14.1 million, and $11.2 million for the years ending December 31, 2015, 2014, and 2013, respectively. Other adjustments primarily include differences between estimated and actual corporate costs allocated to the segments. During the years ended December 31, 2015, 2014, and 2013, other adjustments were $10.8 million, $0.5 million, and $4.8 million, respectively. |
|
|
|
|
(3) |
General corporate expense, net included those expenses not specifically attributable to our segments. |
8. DISCONTINUED OPERATIONS
The presentation of discontinued operations includes components which were sold, for which operations and cash flows can be clearly distinguished from the rest of the Company. We have no continuing involvement in these product lines or businesses. Expenses incurred subsequent to disposition are primarily related to the settlement of our self-insurance reserves.
Selected financial information for discontinued operations is presented in the following table, in thousands:
|
|
|
Years Ended December 31, |
|||||||
|
|
|
2015 |
|
2014 |
|
2013 |
|||
|
Loss before income tax |
|
$ |
(234) |
|
$ |
(702) |
|
$ |
(1,444) |
|
Income tax benefit (expense) |
|
|
82 |
|
|
(391) |
|
|
257 |
|
Loss from discontinued operations, net |
|
$ |
(152) |
|
$ |
(1,093) |
|
$ |
(1,187) |
48
9. ACCRUED LIABILITIES
The following table sets forth the components of accrued liabilities at December 31, 2015 and 2014, in thousands:
|
|
|
2015 |
|
2014 |
||
|
Salaries, wages, and commissions |
|
$ |
16,037 |
|
$ |
24,704 |
|
Insurance reserves |
|
|
20,274 |
|
|
24,892 |
|
Other |
|
|
22,058 |
|
|
23,151 |
|
Total Accrued Liabilities |
|
$ |
58,369 |
|
$ |
72,747 |
10. OTHER LIABILITIES
The following table sets forth the components of other liabilities at December 31, 2015 and 2014, in thousands:
|
|
|
2015 |
|
2014 |
||
|
Long-term portion of insurance reserves |
|
$ |
39,655 |
|
$ |
39,972 |
|
Other |
|
|
474 |
|
|
413 |
|
Total other liabilities |
|
$ |
40,129 |
|
$ |
40,385 |
11. EMPLOYEE RETIREMENT PLANS
We provide a defined-contribution retirement plan for substantially all employees. In addition, we participate in 21 regional multi‑employer pension plans, principally related to building trades; none of the plans are considered significant.
Prior to the Separation, Masco provided defined-benefit pension plans to certain TopBuild employees. The TopBuild liability associated with these plans is not reflected in our balance sheet as this obligation will be maintained and serviced by Masco; all future benefit accruals were frozen effective January 1, 2010.
Pre‑tax expense related to our participation in the retirement plans was as follows, in thousands:
|
|
|
Years Ended December 31, |
|||||||
|
|
|
2015 |
|
2014 |
|
2013 |
|||
|
Defined contribution plans |
|
$ |
3,451 |
|
$ |
2,983 |
|
$ |
3,095 |
|
Defined benefit plans |
|
|
— |
|
|
— |
|
|
26 |
|
Multi-employer plans |
|
|
5,829 |
|
|
4,514 |
|
|
3,567 |
|
|
|
$ |
9,280 |
|
$ |
7,497 |
|
$ |
6,688 |
The Pension Protection Act (“PPA”) defines a zone status for multi-employer pension plans. Plans in the green zone are at least 80 percent funded, plans in the yellow zone are at least 65 percent funded and plans in the red zone are generally less than 65 percent funded.
We participate in the Carpenters Pension Trust Fund for Northern California (“NCT”), which is our largest multi‑employer plan expense and is in the red zone. The NCT has implemented a funding or rehabilitation plan in accordance with government requirements. Our contributions to NCT have not exceeded 1 percent of the total contributions to the plan.
|
|
|
Employer |
|
|
|
|
|
|
|
|
|
|
|
|
||
|
|
|
Identification |
|
PPA Zone Status |
|
Funding Plan |
|
Contributions (in thousands) |
|
Surcharge |
||||||
|
Pension Fund |
|
Number/Plan Number |
|
2015 |
|
2014 |
|
Pending / Implemented |
|
2015 |
|
2014 |
|
2013 |
|
Imposed |
|
NCT |
|
94-6050970/001 |
|
Red |
|
Red |
|
Yes |
|
$ 1,730
|
|
$ 1,479
|
|
$ 1,292
|
|
No |
49
12. OTHER COMMITMENTS AND CONTINGENCIES
Litigation. We are subject to claims, charges, litigation, and other proceedings in the ordinary course of our business, including those arising from or related to contractual matters, intellectual property, personal injury, environmental matters, product liability, product recalls, construction defects, insurance coverage, personnel and employment disputes, antitrust, and other matters, including class actions. We believe we have adequate defenses in these matters and that the likelihood the outcome of these matters would have a material adverse effect on us is remote. However, there is no assurance that we will prevail in these matters, and we could in the future incur judgments, enter into settlements of claims, or revise our expectations regarding the outcome of these matters, which could materially impact our results of operations.
Other Matters. We enter into contracts, which include customary indemnifications that are standard for the industries in which we operate. Such indemnifications include customer claims against builders for issues relating to our products and workmanship. In conjunction with divestitures and other transactions, we occasionally provide customary indemnifications relating to various items including: the enforceability of trademarks; legal and environmental issues; and asset valuations. We evaluate the probability that amounts may be incurred and appropriately record an estimated liability when deemed probable.
We occasionally use performance bonds to ensure completion of our work on certain larger customer contracts that can span multiple accounting periods. As of December 31, 2015 and 2014, we had performance bonds outstanding, totaling $19.5 million and $14.1 million, respectively. Performance bonds generally do not have stated expiration dates; rather, we are released from the bonds as the contractual performance is completed. In addition, at December 31, 2015 and 2014, respectively, we had $10.0 million and $5.4 million of other types of bonds outstanding, principally license and insurance related.
We lease company vehicles and warehouse facilities, some under non-cancellable operating leases. We lease certain operating facilities from certain related parties, primarily former owners (and in certain cases, current management personnel) of companies acquired. Such leases approximate market value and are comprised of less than 40 of our leases. Rental expense is recorded in our Consolidated Statements of Operations and includes expense to such related parties. Our rental expense was as follows, in thousands:
|
|
|
Rent Expense |
|
Rent Expense |
||
|
2015 |
|
$ |
46,431 |
|
$ |
2,223 |
|
2014 |
|
|
39,387 |
|
|
2,660 |
|
2013 |
|
|
34,017 |
|
|
2,650 |
Future minimum lease payments at December 31, 2015 were as follows, in thousands:
|
|
|
Minimum Lease Payments |
|
Minimum Lease Payments |
||
|
2016 |
|
$ |
37,033 |
|
$ |
1,902 |
|
2017 |
|
|
27,224 |
|
|
1,577 |
|
2018 |
|
|
17,406 |
|
|
961 |
|
2019 |
|
|
8,909 |
|
|
8 |
|
2020 |
|
|
3,847 |
|
|
− |
|
2021 & Thereafter |
|
|
6,639 |
|
|
− |
A corporate leased asset used by Masco was terminated and an accrual was established in 2014 for the difference between estimated proceeds and the contractual value. The corporate leased asset was disposed of on April 1, 2015, for the expected proceeds, and we received reimbursement from Masco.
50
13. INCOME TAXES
|
(In thousands) |
|
2015 |
|
2014 |
|
2013 |
|||
|
Income from continuing operations before income taxes: |
|
|
|
|
|
|
|
|
|
|
U.S. |
|
$ |
74,115 |
|
$ |
28,338 |
|
$ |
10,774 |
|
Income tax expense (benefit) on income from continuing operations: |
|
|
|
|
|
|
|
|
|
|
Currently payable: |
|
|
|
|
|
|
|
|
|
|
U.S. Federal |
|
$ |
9,656 |
|
$ |
(28) |
|
$ |
(21) |
|
State and local |
|
|
1,811 |
|
|
1,162 |
|
|
738 |
|
Deferred: |
|
|
|
|
|
|
|
|
|
|
U.S. Federal |
|
|
12,633 |
|
|
14,943 |
|
|
19,115 |
|
State and local |
|
|
(29,108) |
|
|
1,765 |
|
|
2,493 |
|
|
|
$ |
(5,008) |
|
$ |
17,842 |
|
$ |
22,325 |
|
Deferred tax assets at December 31: |
|
|
|
|
|
|
|
|
|
|
Receivables, net |
|
$ |
1,888 |
|
$ |
2,567 |
|
|
|
|
Inventories, net |
|
|
1,484 |
|
|
2,094 |
|
|
|
|
Other assets, principally share-based compensation |
|
|
1,883 |
|
|
5,427 |
|
|
|
|
Accrued liabilities |
|
|
11,095 |
|
|
11,594 |
|
|
|
|
Long-term liabilities |
|
|
15,957 |
|
|
26,156 |
|
|
|
|
Net operating loss carryforward |
|
|
31,197 |
|
|
434,090 |
|
|
|
|
|
|
|
63,504 |
|
|
481,928 |
|
|
|
|
Valuation allowance |
|
|
(815) |
|
|
(454,610) |
|
|
|
|
|
|
|
62,689 |
|
|
27,318 |
|
|
|
|
Deferred tax liabilities at December 31: |
|
|
|
|
|
|
|
|
|
|
Property and equipment, net |
|
|
13,899 |
|
|
15,318 |
|
|
|
|
Intangibles, net |
|
|
207,589 |
|
|
191,736 |
|
|
|
|
Other |
|
|
1,906 |
|
|
1,637 |
|
|
|
|
|
|
|
223,394 |
|
|
208,691 |
|
|
|
|
Net deferred tax liability at December 31 |
|
$ |
160,705 |
|
$ |
181,373 |
|
|
|
The FASB issued Accounting Standards Update 2015-17 (“ASU 2015-17”) “Balance Sheet Classification of Deferred Taxes”, in November of 2015. This guidance requires all deferred tax assets and liabilities, along with any related valuation allowance, be classified as noncurrent on the balance sheet. ASU 2015-17 is effective for us in the first quarter of 2017; however, we early adopted this new standard prospectively during the fourth quarter of 2015. See “Summary of Significant Accounting Policies” for more discussion on this subject.
At December 31, 2015 the net deferred tax liability of $160.7 million consisted of net long-term deferred tax assets of $20.6 million and net long-term deferred tax liabilities of $181.3 million. At December 31, 2014 the net deferred tax liability of $181.4 million consisted of net short-term deferred tax assets included in prepaid expenses and other current assets of $0.9 million and net long-term deferred tax liabilities of $182.3 million.
The deferred portion of state and local taxes includes a $(33.7) million, $(2.0) million, and $0.8 million tax (benefit) expense resulting from a change in the valuation allowance against state and local deferred tax assets in the years ending December 31, 2015, 2014, and 2013, respectively.
Accounting guidance for income taxes requires that future realization of deferred tax assets depends on the existence of sufficient taxable income in future periods. Possible sources of taxable income include taxable income in carryback periods, future reversals of existing taxable temporary differences recorded as a deferred tax liability, tax‑planning strategies that generate future income or gains in excess of anticipated losses in the carryforward period, and projected future taxable income.
If, based upon all available evidence, both positive and negative, it is more likely than not (more than 50 percent likely) such deferred tax assets will not be realized, a valuation allowance is recorded. Significant weight is given to positive and negative evidence that is objectively verifiable. A company’s three‑year cumulative loss position is
51
significant negative evidence in considering whether deferred tax assets are realizable. Accounting guidance restricts the amount of reliance we can place on projected taxable income to support the recovery of deferred tax assets.
In a prior period, we had recorded a valuation allowance against our U.S. Federal and certain state deferred tax assets as a non‑cash charge to income tax expense. In reaching this conclusion, we considered the significant decline in residential new construction, high level of foreclosure activity, and the slower than anticipated recovery in the U.S. housing market which led to U.S. operating losses, causing us to be in a three‑year cumulative U.S. loss position.
During the years ended December, 31, 2010, 2011, and 2012, objective and verifiable negative evidence, such as continued U.S. operating losses and significant impairment charges for U.S. goodwill in 2010, continued to outweigh positive evidence necessary to reduce the valuation allowance. As a result, we recorded increases in the valuation allowance against our U.S. Federal and certain state deferred tax assets as a non‑cash charge to income tax expense during the years ended December 31, 2010, 2011, and 2012.
A return to sustainable profitability in the U.S. is required before we would change our judgment regarding the need for a valuation allowance against our deferred tax assets.
Although strengthening residential new construction activity resulted in profitability for our operations in 2013 and 2014, we continued to record a full valuation allowance against the U.S. Federal and certain state deferred tax assets. We arrived at this conclusion due to the Company’s (i) low amount of profit in 2013 and 2014, (ii) continued three‑year cumulative loss position through the year ended December 31, 2014, and (iii) lack of taxable income after evaluating the sources of income generally allowed under ASC 740 in determining whether or not a deferred asset may be realized.
In the fourth quarter of 2015 we recorded a $35.5 million tax benefit ($13.5 million of Federal and $22.0 million of state and local net of federal benefit) from the release of the valuation allowance against its U.S. Federal and certain state deferred tax assets due primarily to a return to sustainable profitability in our U.S. operations. In reaching this conclusion, we considered the Company’s strong results in the third and fourth quarters reflecting (i) continued improvement in both new home construction and repair/remodel activity in the U.S. and (ii) the Company’s ability to function as a standalone business. We also considered our progress on strategic initiatives to reduce costs and expand the breadth of our market positions, which contributed to the continued improvement in our operations over the past few years
For activity through the first six months of 2015 we will file tax returns as a member of the Masco consolidated group for federal and certain state jurisdictions. As a result, certain tax attributes, primarily the net operating loss carryforward, are treated as an asset of the Masco group and may be utilized by the Masco group through the end of December 31, 2015, Masco’s tax year-end. It is anticipated that all of our U.S. Federal net operating loss carryforward and certain state net operating loss carryforwards will be utilized by the Masco consolidated group. In accordance, the deferred tax assets relating to the net operating loss carryforwards for federal and certain state jurisdictions were transferred to Masco in the amount of $401 million, with a similar transfer of the related valuation allowance.
Due to the fact that TopBuild’s current income tax expense is based on a full year, notwithstanding that it was a member of Masco’s consolidated group through June 30, 2015, an adjustment of $2.6 million was required to be made to equity to record the appropriate current income tax payable on a standalone basis.
Of the deferred tax asset related to the net operating loss at December 31, 2015, $31.2 million will expire between 2020 and 2035. Of the deferred tax asset related to the net operating loss at December 31, 2014, $434.1 million will expire between 2020 and 2034.
52
A reconciliation of the U.S. Federal statutory tax rate to the income tax expense (benefit) on income from continuing operations was as follows:
|
|
|
2015 |
|
2014 |
|
2013 |
|
|||
|
U.S. Federal statutory tax rate |
|
35 |
% |
|
35 |
% |
|
35 |
% |
|
|
State and local taxes, net of U.S. Federal tax benefit |
|
(24) |
|
|
7 |
|
|
19 |
|
|
|
U.S. Federal valuation allowance |
|
(18) |
|
|
20 |
|
|
150 |
|
|
|
Other, net |
|
— |
|
|
1 |
|
|
3 |
|
|
|
Effective tax rate |
|
(7) |
% |
|
63 |
% |
|
207 |
% |
|
The reduction in the valuation allowance in 2015 resulted in a negative effective tax rate for the year.
Income taxes paid were $21.0 million, $1.1 million, and $0.7 million during the years ended December 31, 2015, 2014, and 2013, respectively.
We file income tax returns in the U.S. Federal jurisdiction and various state and local jurisdictions. For periods prior to the Separation we, as a member of the Masco consolidated group, participated in the Compliance Assurance Program (“CAP”). CAP is a real‑time audit of the U.S. Federal income tax return that allows the Internal Revenue Service (“IRS”), working in conjunction with Masco, to determine tax return compliance with the U.S. Federal tax law prior to filing the return. This program provided us with greater certainty about our tax liability for a given year within months, rather than years, of filing the annual tax return and greatly reduced the need for recording a liability for U.S. Federal uncertain tax positions. The IRS has completed their examination of the Masco consolidated U.S. Federal tax return in which we were included through the year ended December 31, 2014. With few exceptions, we are no longer subject to state income tax examinations on filed returns for years before 2010.
At December 31, 2015, there are no liabilities related to uncertain tax positions. We have not incurred any interest related to the underpayment of income taxes or penalties related to tax positions not meeting the minimum statutory threshold to avoid payment of penalties in the year ended December 31, 2015.
14. INCOME (LOSS) PER SHARE
Basic net income per share is calculated by dividing net income by the weighted average shares outstanding during the period, without consideration for common stock equivalents.
Diluted net income per share is calculated by adjusting weighted average shares outstanding for the dilutive effect of common stock equivalents outstanding for the period, determined using the treasury stock method.
For comparative purposes, the computation of basic and diluted earnings per common share for prior year periods presented was calculated using the shares distributed at Separation.
53
Basic and diluted income (loss) per share were computed as follows, in thousands (except share and per share amounts):
|
|
|
Years Ended December 31, |
|||||||
|
|
|
2015 |
|
2014 |
|
2013 |
|||
|
Income (loss) from continuing operations |
|
$ |
79,123 |
|
$ |
10,496 |
|
$ |
(11,551) |
|
Loss from discontinued operations, net |
|
|
(152) |
|
|
(1,093) |
|
|
(1,187) |
|
Net income (loss) - basic and diluted |
|
$ |
78,971 |
|
$ |
9,403 |
|
$ |
(12,738) |
|
|
|
|
|
|
|
|
|
|
|
|
Weighted average number of common shares outstanding - basic |
|
|
37,674,913 |
|
|
37,667,947 |
|
|
37,667,947 |
|
|
|
|
|
|
|
|
|
|
|
|
Dilutive effect of common stock equivalents: |
|
|
|
|
|
|
|
|
|
|
Restricted stock awards |
|
|
93,688 |
|
|
— |
|
|
— |
|
Stock options |
|
|
12,274 |
|
|
— |
|
|
— |
|
|
|
|
|
|
|
|
|
|
|
|
Weighted average number of common shares outstanding - diluted |
|
|
37,780,875 |
|
|
37,667,947 |
|
|
37,667,947 |
|
|
|
|
|
|
|
|
|
|
|
|
Basic earnings (loss) per common share: |
|
|
|
|
|
|
|
|
|
|
Income (loss) from continuing operations |
|
$ |
2.10 |
|
$ |
0.28 |
|
$ |
(0.31) |
|
Loss from discontinued operations, net |
|
|
— |
|
|
(0.03) |
|
|
(0.03) |
|
Net income (loss) |
|
$ |
2.10 |
|
$ |
0.25 |
|
$ |
(0.34) |
|
|
|
|
|
|
|
|
|
|
|
|
Diluted earnings (loss) per common share: |
|
|
|
|
|
|
|
|
|
|
Income (loss) from continuing operations |
|
$ |
2.09 |
|
$ |
0.28 |
|
$ |
(0.31) |
|
Loss from discontinued operations, net |
|
|
— |
|
|
(0.03) |
|
|
(0.03) |
|
Net income (loss) |
|
$ |
2.09 |
|
$ |
0.25 |
|
$ |
(0.34) |
Certain restricted stock awards and stock options were excluded from the calculation of diluted earnings per share because their effect would have been anti-dilutive.
On June 30, 2015, we distributed 37.7 million shares of our common stock to Masco shareholders in conjunction with the Separation.
15. SHARE-BASED COMPENSATION
Prior to the Separation, our employees participated in the Masco share-based compensation program and received restricted stock awards and stock options. Effective July 1, 2015, our employees participate in the 2015 TopBuild Long-Term Incentive Plan (the “2015 Plan”). The 2015 Plan authorizes the Board of Directors to grant stock options, stock appreciation rights, restricted stock, restricted stock units, performance awards, and dividend equivalents. No more than 4.0 million shares of common stock may be issued under the 2015 Plan.
Prior to the Separation, share-based compensation expense was allocated to TopBuild based on the awards and options previously granted by Masco to TopBuild employees. Outstanding, unvested Masco stock options and restricted stock awards held by employees of TopBuild as of June 30, 2015, were forfeited upon Separation and replaced with TopBuild long-term incentive awards immediately subsequent to the Separation. The replacement awards are subject to the same terms and conditions in effect prior to the Separation and are of generally equivalent value.
54
For the year ended December 31, 2015 and 2014, share-based compensation was $4.7 million and $3.8 million, respectively. The following table presents a summary of our share-based compensation activity for the six months ended December 31, 2015, in thousands (except per share amounts):
|
|
|
Restricted Stock Awards |
|
Stock Options |
|
||||||||||||
|
|
|
Number of |
|
Weighted |
|
Number of |
|
Weighted |
|
Weighted |
|
Aggregate |
|
||||
|
Balance, June 30, 2015 |
|
— |
|
$ |
— |
|
— |
|
$ |
— |
|
$ |
— |
|
$ |
— |
|
|
Replacement awards |
|
468.7 |
|
|
20.32 |
|
162.5 |
|
|
7.84 |
|
|
19.78 |
|
|
|
|
|
Granted |
|
143.0 |
|
|
27.63 |
|
225.1 |
|
|
10.44 |
|
|
27.10 |
|
|
|
|
|
Converted/Exercised |
|
(21.0) |
|
|
23.81 |
|
— |
|
|
— |
|
|
— |
|
|
|
|
|
Forfeited |
|
(4.1) |
|
|
21.49 |
|
— |
|
|
— |
|
|
— |
|
|
|
|
|
Balance, December 31, 2015 |
|
586.6 |
|
$ |
21.97 |
|
387.6 |
|
$ |
9.35 |
|
$ |
24.03 |
|
$ |
2,611.7 |
|
|
|
|
|
|
|
|
|
|
|
|
|
|
|
|
|
|
|
|
|
Exercisable, December 31, 2015 |
|
|
|
|
|
|
1.9 |
|
$ |
3.88 |
|
$ |
11.08 |
|
$ |
37.9 |
|
As of December 31, 2015, there was $9.1 million of unrecognized compensation expense related to unvested restricted stock awards. Such awards had a weighted average remaining vesting period of 1.5 years. The total fair value of restricted stock awards that vested during the year ended December 31, 2015, was $0.5 million.
As of December 31, 2015, there was $3.0 million of unrecognized compensation expense related to unvested stock options. Such options had a weighted average remaining vesting period of 2.0 years and a weighted average remaining contractual life of 8.6 years. The total fair value of stock options that vested during the year ended December 31, 2015, was $0.0 million. The weighted average remaining contractual term for vested but unexercised stock options is 4.8 years.
The fair value of stock options granted under the 2015 Plan was calculated using the Black-Scholes Options Pricing Model. The following table presents the assumptions used to estimate the fair values of the options granted:
|
Risk free interest rate |
|
|
1.82 |
% |
|
Expected volatility |
|
|
37.00 |
% |
|
Expected life (in years) |
|
|
6.00 |
|
|
Dividend yield |
|
|
0.00 |
% |
|
Weighted average estimated fair value of options granted during the year |
|
$ |
10.44 |
|
55
16. QUARTERLY FINANCIAL DATA (UNAUDITED)
The following tables set forth our quarterly results for each quarter of the years ending December 31, 2015 and 2014, in thousands (except per share amounts):
|
|
|
2015 |
|||||||||||||
|
|
|
Q1 (a) |
|
Q2 |
|
Q3 |
|
Q4 |
|
Total Year |
|||||
|
Net sales |
|
$ |
358,460 |
|
$ |
403,761 |
|
$ |
427,888 |
|
$ |
426,471 |
|
$ |
1,616,580 |
|
Gross profit |
|
|
73,816 |
|
|
85,690 |
|
|
94,002 |
|
|
104,521 |
|
|
358,029 |
|
Operating profit (loss) |
|
|
(1,147) |
|
|
11,490 |
|
|
30,191 |
|
|
42,997 |
|
|
83,531 |
|
Income (loss) from continuing operations |
|
|
(3,800) |
|
|
6,630 |
|
|
16,624 |
|
|
59,669 |
|
|
79,123 |
|
Income (loss) from discontinued operations, net |
|
|
1 |
|
|
(235) |
|
|
— |
|
|
82 |
|
|
(152) |
|
Net income (loss) |
|
$ |
(3,799) |
|
$ |
6,395 |
|
$ |
16,624 |
|
$ |
59,751 |
|
$ |
78,971 |
|
|
|
|
|
|
|
|
|
|
|
|
|
|
|
|
|
|
Basic income (loss) per common share: |
|
|
|
|
|
|
|
|
|
|
|
|
|
|
|
|
Income (loss) from continuing operations |
|
$ |
(0.10) |
|
$ |
0.18 |
|
$ |
0.44 |
|
$ |
1.58 |
|
$ |
2.10 |
|
Loss from discontinued operations, net |
|
|
— |
|
|
(0.01) |
|
|
— |
|
|
— |
|
|
— |
|
Net income (loss) |
|
$ |
(0.10) |
|
$ |
0.17 |
|
$ |
0.44 |
|
$ |
1.58 |
|
$ |
2.10 |
|
|
|
|
|
|
|
|
|
|
|
|
|
|
|
|
|
|
Diluted income (loss) per common share: |
|
|
|
|
|
|
|
|
|
|
|
|
|
|
|
|
Income (loss) from continuing operations |
|
$ |
(0.10) |
|
$ |
0.18 |
|
$ |
0.44 |
|
$ |
1.57 |
|
$ |
2.09 |
|
Loss from discontinued operations, net |
|
|
— |
|
|
(0.01) |
|
|
— |
|
|
— |
|
|
— |
|
Net income (loss) |
|
$ |
(0.10) |
|
$ |
0.17 |
|
$ |
0.44 |
|
$ |
1.57 |
|
$ |
2.09 |
|
|
|
|
|
|
|
|
|
|
|
|
|
|
|
|
|
|
|
|
2014 |
|||||||||||||
|
|
|
Q1 (a) |
|
Q2 (a) |
|
Q3 (a) |
|
Q4 (a) |
|
Total Year (a) |
|||||
|
Net sales |
|
$ |
333,579 |
|
$ |
382,794 |
|
$ |
397,647 |
|
$ |
398,057 |
|
$ |
1,512,077 |
|
Gross profit |
|
|
65,578 |
|
|
84,941 |
|
|
88,384 |
|
|
92,765 |
|
|
331,668 |
|
Operating profit (loss) |
|
|
(7,868) |
|
|
10,220 |
|
|
13,783 |
|
|
24,582 |
|
|
40,717 |
|
Income (loss) from continuing operations |
|
|
(8,085) |
|
|
6,182 |
|
|
6,458 |
|
|
5,941 |
|
|
10,496 |
|
Loss from discontinued operations, net |
|
|
(496) |
|
|
(348) |
|
|
(79) |
|
|
(170) |
|
|
(1,093) |
|
Net income (loss) |
|
$ |
(8,581) |
|
$ |
5,834 |
|
$ |
6,379 |
|
$ |
5,771 |
|
$ |
9,403 |
|
|
|
|
|
|
|
|
|
|
|
|
|
|
|
|
|
|
Basic income (loss) per common share: |
|
|
|
|
|
|
|
|
|
|
|
|
|
|
|
|
Income (loss) from continuing operations |
|
$ |
(0.21) |
|
$ |
0.16 |
|
$ |
0.17 |
|
$ |
0.16 |
|
$ |
0.28 |
|
Loss from discontinued operations, net |
|
|
(0.01) |
|
|
(0.01) |
|
|
— |
|
|
— |
|
|
(0.03) |
|
Net income (loss) |
|
$ |
(0.22) |
|
$ |
0.15 |
|
$ |
0.17 |
|
$ |
0.16 |
|
$ |
0.25 |
|
|
|
|
|
|
|
|
|
|
|
|
|
|
|
|
|
|
Diluted income (loss) per common share: |
|
|
|
|
|
|
|
|
|
|
|
|
|
|
|
|
Income (loss) from continuing operations |
|
$ |
(0.21) |
|
$ |
0.16 |
|
$ |
0.17 |
|
$ |
0.16 |
|
$ |
0.28 |
|
Loss from discontinued operations, net |
|
|
(0.01) |
|
|
(0.01) |
|
|
— |
|
|
— |
|
|
(0.03) |
|
Net income (loss) |
|
$ |
(0.22) |
|
$ |
0.15 |
|
$ |
0.17 |
|
$ |
0.16 |
|
$ |
0.25 |
|
(a) |
For comparative purposes, the computation of basic and diluted earnings per common share for prior year periods presented was calculated using the shares distributed at Separation. |
56
17. SUBSEQUENT EVENTS
In connection with the preparation of our financial statements, and in accordance with U.S. GAAP, the Company evaluated subsequent events after the balance sheet date of December 31, 2015.
We continuously evaluate our national footprint to ensure we are strategically located throughout the U.S. to serve our customers and position ourselves for continued growth. As a result of this evaluation, management has approved a plan to close certain locations within our Installation and Distribution segments during the first and second quarters of 2016. We continue to assess the financial effect of these closures as the selection of locations has not been finalized. We believe these efforts are necessary to preserve our competitiveness and will provide lasting benefit over the long-term.
On March 1, 2016, the Company’s Board of Directors authorized a share repurchase program (the “Share Repurchase Program”), pursuant to which the Company may purchase up to $50 million of the Company’s common stock. Share repurchases may be executed through various means including, without limitation, open market purchases, privately negotiated transactions, or otherwise. The Share Repurchase Program does not obligate the Company to purchase any shares and expires in one year. Authorization for the Share Repurchase Program may be terminated, increased, or decreased by the Company’s Board of Directors at its discretion at any time.
57
|
|
|
For the years ended December 31, 2015, 2014, and 2013 |
|
||||||||||||||||
|
Column A |
|
Column B |
|
Column C |
|
Column D |
|
Column E |
|
||||||||||
|
|
|
|
|
|
|
|
|
|
|
|
|
|
|
|
|
|
|||
|
|
|
|
|
|
Additions |
|
|
|
|
|
|
|
|||||||
|
|
|
Balance at |
|
Charged to |
|
Charged to |
|
|
|
Balance at |
|
||||||||
|
|
|
Beginning of |
|
Costs and |
|
Other |
|
|
|
End of |
|
||||||||
|
Description |
|
Period |
|
Expenses |
|
Accounts |
|
Deductions |
|
Period |
|
||||||||
|
Allowances for doubtful accounts, deducted from |
|
|
|
|
|
|
|
|
|
|
|
|
|
|
|
|
|||
|
accounts receivable in the balance sheet: |
|
|
|
|
|
|
|
|
|
|
|
|
|
|
|
|
|||
|
2015 |
|
$ |
3,961 |
|
$ |
4,219 |
|
$ |
― |
|
$ |
(4,781) |
(a) |
$ |
3,399 |
|
|||
|
2014 |
|
$ |
4,578 |
|
$ |
3,563 |
|
$ |
― |
|
$ |
(4,180) |
(a) |
$ |
3,961 |
|
|||
|
2013 |
|
$ |
4,877 |
|
$ |
3,379 |
|
$ |
― |
|
$ |
(3,678) |
(a) |
$ |
4,578 |
|
|||
|
|
|
|
|
|
|
|
|
|
|
|
|
|
|
|
|
|
|||
|
Valuation allowance on deferred tax assets: |
|
|
|
|
|
|
|
|
|
|
|
|
|
|
|
|
|||
|
2015 |
|
$ |
454,610 |
|
$ |
― |
|
$ |
― |
|
$ |
(453,795) |
(b) |
$ |
815 |
|
|||
|
2014 |
|
$ |
452,600 |
|
$ |
3,950 |
|
$ |
(1,940) |
(c) |
$ |
― |
|
$ |
454,610 |
|
|||
|
2013 |
|
$ |
436,380 |
|
$ |
16,990 |
|
$ |
(770) |
(c) |
$ |
― |
|
$ |
452,600 |
|
|||
|
(a) |
Deductions representing uncollectible accounts written off, less recoveries of accounts written off in prior years. |
|
(b) |
Of the $453.8 million, $47.2 million (of which $13.5 million was related to federal deferred tax assets and $33.7 million was related to state and local deferred tax assets, before federal tax benefit) is reflected in our Consolidated Statements of Operations in income tax benefit (expense) from continuing operations. The remaining $406.6 million was related to federal and state net operating losses that were utilized by Masco in their separate consolidated return and written off at the time of Separation with the related deferred assets. |
|
(c) |
Valuation allowance on deferred tax assets recorded primarily in equity. |
58
ITEM 9. CHANGES IN AND DISAGREEMENTS WITH ACCOUNTANTS ON ACCOUNTING AND FINANCIAL DISCLOSURE
None.
Item 9A. CONTROLS AND PROCEDURES
Evaluation of Disclosure Controls and Procedures
Our principal executive officer and principal financial officer have concluded, based on an evaluation of the Company’s disclosure controls and procedures (as defined in Rules 13a-15(e) and 15d-15(e) under the Securities Exchange Act of 1934, as amended), that as of December 31, 2015, the Company’s disclosure controls and procedures were effective.
Changes in Internal Control over Financial Reporting
During the three months ended December 31, 2015, we did not make any changes in our internal control over financial reporting that have materially affected, or are reasonably likely to materially affect, our internal control over financial reporting.
Management's Report on Internal Control Over Financial Reporting
This annual report does not include a report of management’s assessment regarding internal control over financial reporting or an attestation report of the company’s registered public accounting firm due to a transition period established by rules of the Securities and Exchange Commission for newly public companies.
Executive Severance Plan and Change in Control and Severance Agreement
On March 1, 2016, our board of directors adopted an Executive Severance Plan (the “Severance Plan”), which became effective on March 1, 2016. The Compensation Committee is responsible for designating which officers of the Company are eligible to participate in the Severance Plan (the “Severance Plan Participants”). On March 1, 2016, the Compensation Committee identified the following named executive officers as Severance Plan Participants: Robert Buck, John Peterson, Michelle Friel, Robin Reininger, Mark Moore, David Cushen, and Steve Raia.
In addition, on March 1, 2016, we entered into a Change in Control and Severance Agreement (the “Severance Agreement”) with Gerald Volas, our Chief Executive Officer and a member of our board of directors (collectively with the Severance Plan Participants, the “Participants”).
The Severance Plan and the Severance Agreement provide for the payment of severance and other benefits to the Participants in the event of a termination of employment with the Company, including in the following circumstances:
|
· |
A termination of a Participant’s employment with the Company without Cause (as defined in the Severance Plan and the Severance Agreement), or a resignation of a Participant from such employment for Good Reason (as defined in the Severance Plan and the Severance Agreement), where, in each case, such termination occurs outside of a Change in Control Period (as defined in the Severance Plan and the Severance Agreement) (a “Non-Change in Control Termination”); |
|
· |
A termination of a Participant’s employment with the Company without Cause, or a resignation of a Participant for Good Reason, where, in each case, such termination occurs during a Change in Control Period (a “Change in Control Termination”); |
|
· |
A termination of a Participant’s employment (i) voluntarily by the Participant (other than for Good Reason and prior to the Participant’s attainment of age 65), or (ii) for Cause by the Company; and |
59
|
· |
A termination of a Participant’s employment as a result of the Participant’s Disability (as defined in the Severance Plan and the Severance Agreement), the Participant’s death, or the Participant’s resignation on or after the Participant’s attainment of age 65 under circumstances other than a Non-Change in Control Termination or a Change in Control Termination (a “Normal Retirement”). |
The Severance Plan and the Severance Agreement provide for the payment of the following severance and other benefits (subject to certain conditions described in the Severance Plan and the Severance Agreement) in connection with the termination of a Participant:
|
· |
Accrued Compensation – In any termination, the Participant would receive all of the Participant’s accrued but unpaid vacation, expense reimbursements, wages, and other benefits due to the Participant under any Company-provided plans, policies or arrangements as of the Participant’s termination date. |
|
· |
Severance Payments – |
|
o |
In a Non-Change in Control Termination, a Severance Plan Participant would receive a lump-sum payment equal to one year of the Severance Plan Participant’s base salary, and Mr. Volas would receive a lump-sum payment equal to two years of his base salary. |
|
o |
In a Change in Control Termination, a Severance Plan Participant would receive a lump-sum payment equal to two years of the Participant’s base salary, and Mr. Volas would receive a lump-sum payment equal to three years of his base salary. |
|
· |
Target Bonus Payments – |
|
o |
In a Non-Change in Control Termination, a Severance Plan Participant would receive a lump-sum payment equal to 100% of the Participant’s target bonus, and Mr. Volas would receive a lump-sum payment equal to 200% of his target bonus. |
|
o |
In a Change in Control Termination, a Severance Plan Participant would receive a lump-sum payment equal to 200% of the Participant’s target bonus, and Mr. Volas would receive a lump-sum payment equal to 300% of his target bonus. |
|
· |
Continuation Coverage – In a Non-Change in Control Termination or a Change in Control Termination, a Participant would receive health care continuation benefits. |
|
· |
Accelerated Vesting of Equity Awards – In a Change in Control Termination and, in most instances, a Normal Retirement, the Participant’s then-outstanding equity compensation awards would be subject to accelerated vesting. |
Copies of the Severance Plan and Severance Agreement are attached as Exhibits 10.10 and 10.11, respectively, and are incorporated herein by reference. The foregoing summary of the Severance Plan and the Severance Agreement does not purport to be complete and is qualified in its entirety by reference to the Severance Plan and the Severance Agreement
.
Termination of Severance Agreement
The Severance Agreement replaces and supersedes the letter severance agreement, dated June 11, 2015, by and between the Company and Mr. Volas (the “Preexisting Severance Agreement”). As a result, the Preexisting Severance Agreement was terminated on March 1, 2016.
TruTeam Management Structure
The Company split the management of TruTeam (Installation) into Eastern and Western divisions. On March 1, 2016, David Cushen became the Senior Vice President of Operations, TruTeam Contractor Services of the Western Division. Previously, Mr. Cushen was Senior Vice President of Operations, TruTeam Contractor Services.
60
Item 10. DIRECTORS, EXECUTIVE OFFICERS, AND CORPORATE GOVERNANCE
Information required by this item will be set forth under the headings “Corporate Governance,” “Proposal 1: Election of Directors,” “Board of Directors and Committees,” and “Section 16(a) Beneficial Ownership Reporting Compliance” in our definitive proxy statement for the 2016 Annual Meeting of Stockholders (“2016 Proxy Statement”) to be filed with the SEC within 120 days of the year ended December 31, 2015, and is incorporated herein by reference.
Our Board of Directors has also adopted a Code of Business Ethics that applies to all of our employees, officers, and directors, including our Chief Executive Officer, Chief Financial Officer, and other senior officers, in accordance with applicable rules and regulations of the SEC and the NYSE. Our Code of Business Ethics is available on our website at http://www.topbuild.com/Investors/Corporate-Governance/Governance-Documents/. We will disclose any amendments to or waivers of this Code for directors, executive officers, or senior officers on our website.
Item 11. EXECUTIVE COMPENSATION
Information required by this item will be set forth under the headings “Director Compensation,” “Director Compensation Table,” “Compensation Committee Report,” “Compensation of Executive Officers,” and “Corporate Governance” in our 2016 Proxy Statement, and is incorporated herein by reference.
Item 12. SECURITY OWNERSHIP OF CERTAIN BENEFICIAL OWNERS AND MANAGEMENT, AND RELATED STOCKHOLDER MATTERS
Information required by this item will be set forth under the heading “Common Stock Ownership of Officers, Directors, and Significant Stockholders” and “Equity Compensation Plan Information” in our 2016 Proxy Statement, and is incorporated herein by reference.
Item 13. CERTAIN RELATIONSHIPS AND RELATED TRANSACTIONS, AND DIRECTOR INDEPENDENCE
Information required by this item will be set forth under the heading “Corporate Governance” and related subsections within our 2016 Proxy Statement, and is incorporated herein by reference.
Item 14. PRINCIPAL ACCOUNTANT FEES AND SERVICES
Information required by this item will be set forth under the heading “Proposal 2 - Ratification of the Appointment of Independent Registered Public Accounting Firm” in our 2016 Proxy Statement, and is incorporated herein by reference.
61
Item 15. EXHIBITS AND FINANCIAL STATEMENT SCHEDULES
|
a. |
Listing of Documents: |
|
i. |
Financial Statements. Our Consolidated Financial Statements included in Item 8 hereof, as required at December 31, 2015 and 2014, and for the years ended December 31, 2015, 2014, and 2013, consist of the following: |
Consolidated Balance Sheets
Consolidated Statements of Operations
Consolidated Statements of Cash Flows
Consolidated Statements of Changes in Equity
Notes to Consolidated Financial Statements
|
ii. |
Financial Statement Schedule. Our Financial Statement Schedule appended hereto, as required for the years ended December 31, 2015, 2014, and 2013 consists of the following: |
II. Valuation and Qualifying Accounts
|
iii. |
Exhibits. See separate Index to Exhibits hereafter. |
62
INDEX TO EXHIBITS
|
|
|
|
|
Incorporated By Reference |
|
Filed |
||||
|
Exhibit No. |
|
Exhibit Title |
|
Form |
|
Exhibit |
|
Filing Date |
|
Herewith |
|
|
|
|
|
|
|
|
|
|
|
|
|
2.1† |
|
Separation and Distribution Agreement, dated as of June 29, 2015, by and between Masco Corporation and TopBuild Corp. (incorporated by reference to Exhibit 2.1 to the Company’s Current Report on Form 8-K filed with the SEC on July 6, 2015). |
|
10-Q |
|
2.1 |
|
11/3/2015 |
|
|
|
|
|
|
|
|
|
|
|
|
|
|
|
|
|
†The schedules to this agreement are omitted pursuant to Item 601(b)(2) of Regulation S-K. The Company agrees to |
|
|
|
|
|
|
|
|
|
|
|
|
|
|
|
|
|
|
|
|
|
3.1 |
|
Amended and Restated Certificate of Incorporation of TopBuild Corp. (incorporated by reference to Exhibit 3.1 to the Company’s Current Report on Form 8-K filed with the SEC on July 6, 2015). |
|
10-Q |
|
3.1 |
|
11/3/2015 |
|
|
|
|
|
|
|
|
|
|
|
|
|
|
|
3.2 |
|
Amended and Restated Bylaws of TopBuild Corp. (incorporated by reference to Exhibit 3.2 to the Company’s Current Report on Form 8-K filed with the SEC on July 6, 2015). |
|
10-Q |
|
3.2 |
|
11/3/2015 |
|
|
|
|
|
|
|
|
|
|
|
|
|
|
|
10.1 |
|
Credit Agreement, dated as of June 9, 2015, among TopBuild Corp. and PNC Bank, National Association, as administrative agent, and the other lenders and agents party thereto. |
|
10-Q |
|
10.1 |
|
11/3/2015 |
|
|
|
|
|
|
|
|
|
|
|
|
|
|
|
10.2 |
|
Tax Matters Agreement, dated as of June 29, 2015, between Masco Corporation and TopBuild Corp. (incorporated by reference to Exhibit 10.1 to the Company's Current Report on Form 8-K filed with the SEC on July 6, 2015). |
|
10-Q |
|
10.2 |
|
11/3/2015 |
|
|
|
|
|
|
|
|
|
|
|
|
|
|
|
10.3 |
|
Transition Services Agreement, dated as of June 29, 2015, by and between Masco Corporation and TopBuild Corp. (incorporated by reference to Exhibit 10.2 to the Company’s Current Report on Form 8-K filed with the SEC on July 6, 2015). |
|
10-Q |
|
10.3 |
|
11/3/2015 |
|
|
|
|
|
|
|
|
|
|
|
|
|
|
|
10.4 |
|
Employee Matters Agreement, dated as of June 29, 2015, by and between Masco Corporation and TopBuild Corp. (incorporated by reference to Exhibit 10.3 to the Company’s Current Report on Form 8-K filed with the SEC on July 6, 2015. |
|
10-Q |
|
10.4 |
|
11/3/2015 |
|
|
|
|
|
|
|
|
|
|
|
|
|
|
|
10.5 |
|
TopBuild Corp. 2015 Long Term Stock Incentive Plan. |
|
10-Q |
|
10.5 |
|
11/3/2015 |
|
|
|
|
|
|
|
|
|
|
|
|
|
|
|
10.6 |
|
Form of Restricted Stock Award under the TopBuild Corp. 2015 Long-Term Stock Incentive Plan. |
|
10-Q |
|
10.6 |
|
11/3/2015 |
|
|
|
|
|
|
|
|
|
|
|
|
|
|
|
10.7 |
|
Form of Non-Qualified Stock Option Award under the TopBuild Corp. 2015 Long-Term Stock. Incentive Plan. |
|
10-Q |
|
10.7 |
|
11/3/2015 |
|
|
|
|
|
|
|
|
|
|
|
|
|
|
|
10.8 |
|
Form of Restricted Stock Award for Non-Employee Directors under the TopBuild Corp. 2015 Long Term Stock Incentive Plan. |
|
10-Q |
|
10.8 |
|
11/3/2015 |
|
|
63
|
|
|
|
|
Incorporated By Reference |
|
Filed |
||||
|
Exhibit No. |
|
Exhibit Title |
|
Form |
|
Exhibit |
|
Filing Date |
|
Herewith |
|
|
|
|
|
|
|
|
|
|
|
|
|
10.9 |
|
Form of Performance Restricted Stock Award under the TopBuild Corp. 2015 Long-Term Incentive Plan |
|
|
|
|
|
|
|
X |
|
|
|
|
|
|
|
|
|
|
|
|
|
10.10 |
|
TopBuild Corp. Executive Severance Plan |
|
|
|
|
|
|
|
X |
|
|
|
|
|
|
|
|
|
|
|
|
|
10.11 |
|
Change in Control and Severance Agreement between Gerald Volas and TopBuild Corp. |
|
|
|
|
|
|
|
X |
|
|
|
|
|
|
|
|
|
|
|
|
|
31.1 |
|
Principal Executive Officer Certification required by Rules 13a-14 and 15d-14 as adopted pursuant to Section 302 of the Sarbanes-Oxley Act of 2002. |
|
|
|
|
|
|
|
X |
|
|
|
|
|
|
|
|
|
|
|
|
|
31.2 |
|
Principal Financial Officer Certification required by Rules 13a-14 and 15d-14 as adopted pursuant to Section 302 of the Sarbanes-Oxley Act of 2002. |
|
|
|
|
|
|
|
X |
|
|
|
|
|
|
|
|
|
|
|
|
|
32.1‡ |
|
Certification of Principal Executive Officer pursuant to 18 U.S.C. Section 1350, as adopted pursuant to Section 906 of Sarbanes Oxley Act of 2002. |
|
|
|
|
|
|
|
|
|
|
|
|
|
|
|
|
|
|
|
|
|
|
|
‡Furnished herewith |
|
|
|
|
|
|
|
|
|
|
|
|
|
|
|
|
|
|
|
|
|
32.2‡ |
|
Certification of Principal Financial Officer pursuant to 18 U.S.C. Section 1350, as adopted pursuant to Section 906 of Sarbanes Oxley Act of 2002. |
|
|
|
|
|
|
|
|
|
|
|
|
|
|
|
|
|
|
|
|
|
|
|
‡Furnished herewith |
|
|
|
|
|
|
|
|
|
|
|
|
|
|
|
|
|
|
|
|
|
101.INS |
|
XBRL Instance Document. |
|
|
|
|
|
|
|
X |
|
|
|
|
|
|
|
|
|
|
|
|
|
101.SCH |
|
XBRL Taxonomy Extension Schema Document. |
|
|
|
|
|
|
|
X |
|
|
|
|
|
|
|
|
|
|
|
|
|
101.CAL |
|
XBRL Taxonomy Extension Calculation Linkbase Document. |
|
|
|
|
|
|
|
X |
|
|
|
|
|
|
|
|
|
|
|
|
|
101.DEF |
|
XBRL Taxonomy Extension Definition Linkbase. |
|
|
|
|
|
|
|
X |
|
|
|
|
|
|
|
|
|
|
|
|
|
101.LAB |
|
XBRL Taxonomy Extension Label Linkbase Document. |
|
|
|
|
|
|
|
X |
|
|
|
|
|
|
|
|
|
|
|
|
|
101.PRE |
|
XBRL Taxonomy Extension Presentation Linkbase Document. |
|
|
|
|
|
|
|
X |
64
Pursuant to the requirements of Section 13 or 15(d) of the Securities Exchange Act of 1934, the registrant has duly caused this report to be signed on its behalf by the undersigned, thereunto duly authorized.
|
|
TOPBUILD CORP. |
|
|
|
|
|
|
|
|
|
|
|
By: |
/s/ John S. Peterson |
|
|
Name: |
John S. Peterson |
|
|
Title: |
Vice President and Chief Financial Officer |
March 3, 2016
Pursuant to the requirements of the Securities Exchange Act of 1934, this report has been signed below by the following persons on behalf of the registrant and in the capacities and on the dates indicated.
|
Signature |
Title |
Date |
||
|
|
|
|
||
|
/s/ Gerald Volas |
Director, Chief Executive Officer |
March 3, 2016 |
||
|
Gerald Volas |
(Principal Executive Officer) |
|
||
|
|
|
|
||
|
/s/ John S. Peterson |
Vice President, Chief Financial Officer |
March 3, 2016 |
||
|
John S. Peterson |
(Principal Financial Officer) |
|
||
|
|
|
|
||
|
/s/ Nicholas R. Thompson |
Controller |
March 3, 2016 |
||
|
Nicholas R. Thompson |
(Principal Accounting Officer) |
|
||
|
|
|
|
||
|
/s/ Alec C. Covington* |
Chairman of the Board |
March 3, 2016 |
||
|
Alec C. Covington |
|
|
||
|
|
|
|
||
|
/s/ Dennis W. Archer* |
Director |
March 3, 2016 |
||
|
Dennis W. Archer |
|
|
||
|
|
|
|
||
|
/s/ Carl T. Camden* |
Director |
March 3, 2016 |
||
|
Carl T. Camden |
|
|
||
|
|
|
|
||
|
/s/ Joseph S. Cantie* |
Director |
March 3, 2016 |
||
|
Joseph S. Cantie |
|
|
||
|
|
|
|
||
|
/s/ Mark A. Petrarca* |
Director |
March 3, 2016 |
||
|
Mark A. Petrarca |
|
|
||
|
|
|
|
||
|
/s/ Margaret M. Whelan* |
Director |
March 3, 2016 |
||
|
Margaret M. Whelan |
|
|
||
|
*By: |
/s/ Michelle A. Friel |
|
|
Michelle A. Friel |
|
|
Attorney-in-Fact |
|
|
pursuant to a power of attorney |
65