Attached files
| file | filename |
|---|---|
| 8-K - 8-K - Nimble Storage Inc | d138257d8k.htm |
| EX-99.2 - EX-99.2 - Nimble Storage Inc | d138257dex992.htm |
Exhibit 99.1
Nimble Storage Inc. Q4FY16 Shareholder Letter
Executive Summary
The storage industry is going through a period of unprecedented change with modern architectures upending legacy storage architectures. Large incumbent vendors have experienced consistent revenue declines and market-share losses over the last two years because their legacy architectures are no longer competitive.
We were founded on the belief that we could emerge as a long-term leader in storage by leveraging the very same technology catalysts that are disrupting the large incumbents. Organizations rely on applications to drive core business processes and business applications in turn rely on rapid, uninterrupted access to data. When something disrupts the delivery of data to applications, this app-data gap impacts business outcomes negatively. Our founding thesis was to leverage flash and cloud-based predictive analytics to eliminate the app-data gap. We built our Predictive Flash Platform to deliver data velocity.
The Nimble Storage Predictive Flash Platform is comprised of three key components:
| • | Unified Flash Fabric. The Unified Flash Fabric combines industry-leading All-Flash arrays and Adaptive Flash arrays into a single storage architecture that dramatically enhances the performance of every enterprise application while simultaneously lowering the total cost of ownership (TCO) of storage. |
| • | InfoSight cloud-based predictive analytics. InfoSight monitors our customers’ infrastructure on a real-time basis from the cloud and leverages predictive analytics to predict and prevent the vast majority of infrastructure disruptions that can negatively impact application performance. |
| • | Timeless Storage. Timeless Storage is our approach to ensuring investment protection to customers that deploy our products. It includes an unwavering commitment to customer success, guarantees that protect against product obsolescence or forklift upgrades that are frequently required 3-4 years after deploying legacy architectures, and the ability for our customers to procure storage as capex or leverage our Storage on Demand solution to only pay for storage performance and capacity based on actual usage. |
Our long-term goal is to leverage the Predictive Flash Platform to emerge as the leader in storage. We executed well against our vision in Q4FY16.
| • | A significant and exciting highlight during Q4FY16 was the strong, positive feedback from dozens of beta customers to our next generation All Flash arrays, which we believe deliver industry leading performance and scalability at a TCO that is up to 33 to 66 percent lower than existing leading all flash arrays. Further, our Unified Flash Fabric combines All Flash and Adaptive Flash arrays into a single storage consolidation architecture, bringing the power of flash to every application across the enterprise. |
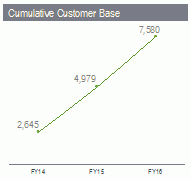
| • | We added a record 752 new customers during Q4FY16 to end FY16 with 7,580 customers across our installed base – a pace of customer acquisition that remains unmatched by any emerging vendor in our industry. |
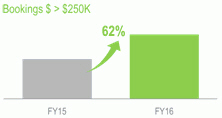
| • | We are driving larger deals across our customer base, with deals over $100K accounting for 41% and deals over $250K accounting for 17% of total bookings during Q4FY16. Fibre Channel is a key driver of larger deployments, accounting for 26% of the mix of Fibre Channel + iSCSI bookings during Q4FY16, up from 24% in Q3FY16. |
| • | Even as our customer base continues to expand rapidly, we are making steady progress in diversifying our customer base to include international customers, large global enterprises and Cloud Service Providers (CSPs). |
| • | International revenue during Q4FY16 grew at 66% compared to Q4FY15, and accounted for 25% of total revenue during Q4FY16. On a constant currency basis international revenues would have grown at 80%. |
| • | Global enterprises contributed 17% of total Q4FY16 bookings, up from 14% during Q3FY16. |
| • | CSPs contributed 20% of Q4FY16 bookings, up from 17% during Q3FY16. |
| • | We have always maintained an unwavering commitment to customer success, as reflected in our inaugural Net Promoter Score of 85 – a score that is ahead of even the strongest brand names in technology. This customer satisfaction continues to drive strong repeat purchases, repeat bookings accounted for 48% of bookings during Q4FY16 as well as for all of FY16. |
Unified Flash Fabric: A Single Architecture Across All Flash and Adaptive Flash Arrays
We are proud of the pace at which we have delivered innovation over the last several years. In just the last two years, we have delivered a broad range of innovations that include: Scale-out Clustering, Adaptive Flash functionality, Triple Parity RAID, Fibre Channel support, application granular encryption, and Flash Service Levels among many others.
We took another major step forward in February 2016 as we introduced our next generation All Flash arrays that we believe leapfrog the current all flash arrays in the market. Further, our Unified Flash Fabric combines All Flash and Adaptive Flash arrays into a single consolidation architecture that democratizes the use of flash to accelerate every application across the enterprise in a manner that we believe is unmatched in our industry. During Q4FY16, we recruited dozens of customers and prospects as part of the All Flash array beta program, and the feedback has been very positive.
CASL, our flash optimized file system, has been the architectural foundation of our market leading Adaptive Flash arrays. The ground-up design of CASL was motivated by the ability to leverage flash efficiently, and that same design objective has allowed us to build an All Flash array that we believe delivers a substantially better value proposition than other all flash arrays in the market:
| • | Up to 33-66% Lower TCO. Our assessment is that we can lower the TCO of deploying All Flash arrays by 33 to 66% compared to industry leading competitive all flash arrays driven by some key architectural advantages. |
| • | Unconstrained by memory. CASL is very efficient in its use of memory, requiring one-tenth (1/10th) or less memory per TB of flash than competitive all flash arrays, thereby lowering the number of controllers required and reducing costs. |
| • | Designed for cost-optimized 3D-NAND. Our ability to manage endurance through intelligent software allows us to use low-cost 3D-NAND thereby lowering the media cost of our All Flash arrays. Further, even compared to other arrays that use low-cost 3D-NAND, we have a lower overhead associated with endurance management and lower system overheads, which results in 20% greater usable capacity per TB of raw flash. |
| • | Best-in-class data reduction. The CASL design also allows us to leverage the entire spectrum of data reduction techniques including variable block compression, variable block deduplication, zero-block elimination, zero-copy cloning and thin provisioning. Therefore, the effective capacity of a system is substantially higher than the raw capacity – on par with the best all flash arrays on the market. |
| • | Backup, Data Recovery (DR) and Archives at 1/3rd the cost. For most applications, primary storage accounts for a smaller fraction of the data compared to secondary data copies, including backup, DR and test & development copies. Because CASL leverages common underlying data management services, low-cost Adaptive Flash arrays can be used for backup, DR, test & dev and archives even when production instances reside on All Flash arrays. |
| • | Performance and Capacity Scalability. CASL scale-up functionality facilitates non-disruptive scaling of a single array to deliver up to 350,000 IOPS and over 500TB of raw capacity (2PB+ of effective capacity). At the same time, CASL scale-out functionality facilitates non-disruptive scaling of a single system to deliver over 1.2M IOPS and over 2 PB of raw capacity (8PB+ of effective capacity). The combination of scale-up and scale-out delivers a system that scales substantially beyond even the leading next-generation all flash arrays on the market. |
| • | Non-stop availability. Our core software and system architecture was designed for six-nines of availability, and we have already achieved a measured availability of 99.9997% across over 7,500 customers. Our All Flash arrays go further by incorporating Triple+ Parity RAID, a unique innovation that enables the system to continue operating without data loss even upon the failure of three SSDs within a RAID group as well as to recover from errors within SSDs. |
| • | Transparent application mobility. The Unified Flash Fabric facilitates application transparent mobility such that customers can deploy applications on our All Flash or Adaptive Flash arrays and seamlessly migrate applications back and forth as needed. Even when a customer deploys All Flash arrays for a production instance, secondary copy instances can live on cost-optimized Adaptive Flash arrays. |
|
Forca delivers data 3X faster to customers increasing satisfaction levels
Turning data into knowledge is a fundamental strategy for Forca. Forca helps three of Denmark’s largest pension funds contain costs and deliver improved member services. It selected the Nimble Adaptive Flash Platform as the storage foundation for its Microsoft applications including its Microsoft Business Intelligence solution. Forca customers have very high expectations for immediate access to data and with the addition of the Nimble All Flash array, Forca customers can find, understand and act on critical data in minutes vs. hours or days.
Further, InfoSight predictive analytics enables Forca to manage both the performance and capacity required to run its business today and accurately forecast and plan for the future. Understanding how and when to add performance or capacity is critical to maintaining customer service level agreements. The Nimble Predictive Flash platform delivers a consistent, predictable user experience that ultimately leads to increased customer satisfaction and a more competitive business.
|
LenderLive selects All Flash array to accelerate SQL performance
LenderLive is an end-to-end, single source mortgage services provider that serves more than 300 financial institutions including three of the world’s largest banks and top-tier mortgage lenders. The LenderLive IT organization selected and deployed the Nimble All Flash array to maximize performance for its SQL databases. SQL database performance has increased by an order of magnitude with the Nimble All Flash array - database queries increased from 800 per second to 12,000 a second, and reports that took about an hour, now run in minutes.
Due to the critical nature of application responsiveness and predictability, LenderLive storage platform needs high performance and a deterministic latency so they can deliver on service level agreements for end users. The Nimble Predictive Flash platform delivers the speed LenderLive needs to keep customers happy. |
Driving Growth by Building a Large, Diversified and Global Community of Satisfied Customers
Our strategy for growth focuses on four main themes. The first is new customer acquisition. The second is to drive larger deals within our customers. The third is to diversify our customer base and increase the mix of revenue from international customers, large global enterprises and CSPs. The fourth theme is to drive repeat business from existing customers through an unwavering commitment to customer success.
| • New customer acquisition. We added a record 752 new customers during Q4FY16 to end the fiscal year with 7,580 customers – a growth of over 50% in our installed base of customers. Our channel partners continue to play a key role in generating new opportunities, with ~49% of the new opportunities in FY16 originated by our channel partners.
• Driving larger transactions. As we grow our product portfolio, we are steadily achieving larger deployments within our customer base. During Q4FY16, we had record bookings from deals over $100K and from deals over $250K. Fibre Channel has been a key driver of larger deployments thus far and has grown to 26% of the mix (of iSCSI + Fibre Channel bookings) from 24% during Q3FY16 and 12% during Q4FY15. We anticipate our All Flash arrays will further drive larger transactions across our customer base
• Faster growth in key segments: international customers, large global enterprises and CSPs. To drive sustainable growth over many years, we are focused on increasing our penetration of these strategic segments that represent a substantial share of our total addressable market. During Q4FY16 we achieved the following:
• Our international revenue grew rapidly at 66% compared to Q4FY15 and accounted for 25% of our total revenue. Growth was strong across EMEA and APJ as investments made during FY15 resulted in strong growth during FY16. On a constant currency basis, international revenue growth would have been even higher at 80% |
|
| • | Our global enterprise customer bookings grew from 14% in Q3FY16 to 17% during Q4FY16. We ended FY16 with 443 global enterprise customers that drove 15% of total bookings during FY16. |
| • | CSPs contributed 20% to Q4FY16 bookings, up from 17% during Q3FY16 – a record level of bookings compared to any prior quarter. For all of FY16, CSPs drove 16% of our total bookings. |
|
• Land and expand model. From the outset, we have maintained an unwavering commitment to customer success. InfoSight has proven key to ensuring an industry-leading proactive approach to managing customers’ data centers and preventing issues that cause application disruptions. This has in turn caused our customers to be strong advocates for Nimble Storage – recommending us to other prospects as well as driving repeat bookings. One of the best proof points of this customer advocacy is our inaugural Net Promoter Score of 85 – a very high score compared even to the marquee brands in technology. Consequently, repeat bookings accounted for 48% of our bookings during Q4FY16, driven by a consistent and strong repeat purchase propensity by our customers. |
Siemens PLM adds features and delights customers
Siemens PLM Software’s product lifecycle management solutions are utilized by companies worldwide to design, simulate and manufacture everything from golf clubs and smart phones, to automobiles and airplanes. One of the biggest challenges of its Technical Operations organization was keeping pace with increasing workload demands across its legacy software development and customer support infrastructure. With the Nimble Adaptive Flash platform, Siemens’ PLM software development teams are now able to conduct deeper integrations and achieve faster iterations across their testing and design automation environments than they’ve ever been able to before. Siemens PLM Software product support engineers can now quickly spin up VM’s to match customer environments, enabling them to close more calls on first contact.
In addition, Siemens uses Nimble InfoSight VMVision to gain a server-centric view of its entire private cloud infrastructure. InfoSight provides a solid view of Siemans’ environment today, as well as helping with performance and capacity recommendations for the future. Overall, Nimble helps Siemens PLM Software deliver the performance it needs today, with room to grow in the future, and the ability to predict and prevent downtime, which are all critical to its customers’ success.
|
Driving Growth In The Converged Infrastructure Market With SmartStack
| During FY16, SmartStack associated bookings grew by 150% compared to FY15. Customers want to simplify and accelerate infrastructure deployment, and as a result, our SmartStack integrated infrastructure solution has seen strong customer momentum. Our portfolio of solutions spans a broad spectrum of alliance partners including Oracle, Microsoft, VMware, Citrix, SAP, and CommVault among others. During Q4FY16, SmartStack became a “Cisco Validated Design” which further increases the joint engineering and marketing investment by Cisco and Nimble Storage, and significantly strengthens the appeal of SmartStack to joint Cisco and Nimble channel partners. |
Virtacore Systems delivers sustained customer satisfaction
Virtacore is a leading cloud services provider specializing in virtual infrastructure solutions utilizing VMware, Cisco UCS, and the Nimble Adaptive Flash platform. Demand for Virtacore cloud services, has grown and expanded rapidly over the past few years with the addition of new performance based offerings where customers require absolute performance at scale. The Nimble Adaptive Flash platform enables Virtacore to support customers in all industries with IaaS or DRaaS requirements, with products that deliver on a single common theme, performance. The Nimble All Flash array provides the speed new applications require with the data velocity customers demand.
InfoSight Predictive Analytics gives Virtacore a complete understanding of all parts of its infrastructure. With VM-level granularity, InfoSight delivers the information Virtacore needs to maintain service levels, and scale performance and capacity in line with customer requirements.
|
Building a Healthy Business Model While Capitalizing on Industry Consolidation
Change is accelerating across the $40B storage market with incumbent vendors consistently losing share because we believe their legacy architectures are no longer competitive. We believe the impending merger of EMC and Dell may lead to additional industry consolidation, including consolidation of product lines. At the same time, of the dozens of startups that had been funded over the last five years, fewer than a handful of storage startups have reached critical mass in terms of customer base or revenues as we believe they lack the breadth of functionality to displace the large incumbent vendors. If popular sentiment about easy access to private capital becoming scarce in calendar 2016 proves true, these startups’ ability to fund future growth may rapidly diminish.
Given these forces, we believe the storage industry will consolidate to a few large systems vendors and a handful of next generation storage specialists. This consolidation creates an opportunity for Nimble to solidify its position as a long-term leader in the redefined storage market. This conviction guides our investments.
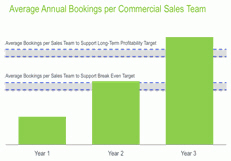
During Q3FY16, we recognized the need to increase investments in our commercial business, which has a quicker payback since our commercial sales teams typically achieve breakeven levels of productivity during their second year. We plan to increase investments in demand generation, channel programs and commercial sales capacity during 1HFY17 to drive growth in 2HFY17.
| A second area of investment is in entering the All Flash array market. We started R&D investments about two years ago, and accelerated our investments during the last several months of FY16 culminating in a very successful beta program in Q4FY16 and a planned market entry in Q1FY17. We believe that All Flash arrays will increase productivity of our commercial and enterprise sales teams, given the rapid growth in the all flash array market and the differentiation of our All Flash arrays.
As we look ahead at FY17, we believe that the investments we are making in accelerating our commercial business, and in entering the all flash array |
|
market will lead to higher operating losses in the 1HFY17, but will reaccelerate growth and improve operating leverage in 2HFY17. More significantly, we are well positioned to leverage the current disruption in the storage industry as we aspire to emerge as a next generation storage leader.
Financial Performance
Q4FY16 and FY16 Financial Results
As a reminder, all results presented in this letter are on a non-GAAP basis except for revenue and the balance sheet. Non-GAAP results exclude the impact of stock-based compensation.
Q4FY16 Highlights
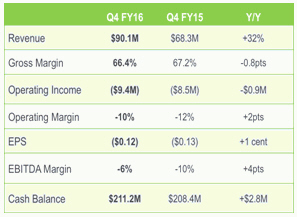
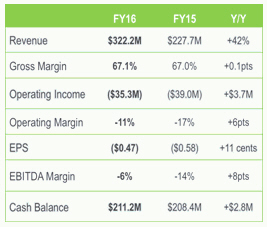
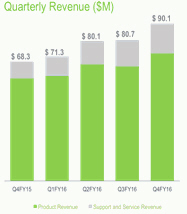
| • | Revenue of $90.1 million increased 32% from $68.3 million in Q4FY15. Excluding fluctuations in foreign currency over the past fiscal year, revenue would have been $2.5 million higher or $92.6 million representing an increase of 36% over Q4FY15. |
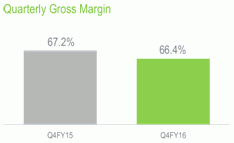
| • Non-GAAP Gross Margin was 66.4%, a decrease of 80 bps vs. Q4FY15. Excluding fluctuations in foreign currency, gross margin would have been flat to Q4FY15 at 67.2%.
• Non-GAAP Operating Loss increased to $9.4 million compared to $8.5 million in Q4FY15. Excluding fluctuations in foreign currency, operating loss would have been $8.0 million, or $1.4 million better than our Q4FY16 reported operating loss.
• Non-GAAP Operating Margin improved by 200 bps to negative 10% of revenue from negative 12% of revenue in Q4FY15. Excluding fluctuations in foreign currency, operating margin would have been negative 9% of revenue. |
|
| • | Adjusted EBITDA improved to negative $5.1 million compared to negative $6.8 million in Q4FY15. Adjusted EBITDA Margin improved by 400 bps to negative 6% of revenue from negative 10% of revenue in Q4FY15. |
| • | Non-GAAP EPS was a loss of $0.12 per share compared to a loss of $0.13 per share in Q4FY15. |
| • | Total Cash ended Q4FY16 at $211.2 million, an increase of $1.5 million during the quarter. |
| FY2016 Highlights
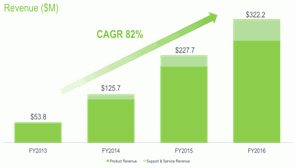
• Revenue of $322.2 million, up 42% from $227.7 million in FY15
• Non-GAAP Gross Margin of 67.1%, an improvement of 10 bps from 67.0% in FY15
• Non-GAAP Operating Loss of $35.3 million compared to a loss of $39.0 million in FY15
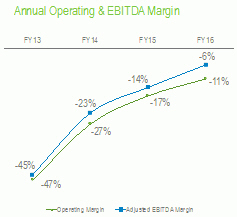
• Non-GAAP Operating Margin of negative 11% compared to negative 17% in FY15
• Adjusted EBITDA of negative $20.4 million or negative 6% of revenue compared to negative $32.3 million or negative 14% of revenue in FY15.
• Non-GAAP EPS was a loss of $0.47 per share compared to a loss of $0.58 per share in FY15. |
|
| • | Total Cash ended FY16 at $211.2 million, an increase of $2.8 million during the year. |
Q4FY16 Financial Results
| During Q4, we achieved revenue of $90.1 million, at the top end of our guidance range of $87 million to $90 million. We had an operating loss of $9.4 million, and our non-GAAP EPS was a loss of $0.12 per share, in line with our projected operating loss of $8.0 million to $10.0 million, and non-GAAP EPS loss of $0.11 to $0.13 per share.
Product revenue for Q4 was $73.1 million, representing 81% of total revenue and an increase of 25% from Q4FY15. Q4 support and service revenue, which includes our maintenance and InfoSight cloud-based predictive analytics service, was $17.0 million, representing 19% of total revenue and an increase of 77% from Q4FY15.
Our international business contributed 25% of total revenue during Q4 and grew by 66% from Q4FY15. Revenue from our EMEA operations increased by 68% and revenue from APJ increased by 61% from a year ago. Excluding fluctuations in foreign currency, international revenues would have been 26% of total revenue, with growth of 80% compared to Q4FY15. |
| |||
|
At the end of Q4, our total deferred revenue was $114.8 million, an increase of $40.4 million or 54% from Q4FY15. Our deferred revenue consists primarily of payments received for support and service agreements including InfoSight, which have an average life of approximately three years. | ||||
|
Non-GAAP gross margin was 66.4% in Q4, a decrease of 50 bps from Q3FY16 and a decrease of 80 bps from Q4FY15. Our reported gross margin would have been 80 bps higher or flat to Q4FY15 at constant exchange rates. Product gross margin in Q4 was 66.7%, 110 bps lower than Q3FY16. Support and service gross margin in Q4 was 65.2%, 240 bps higher than Q3FY16. Our industry leading overall gross margin remains above our long-term target model of 63% to 65%. |
| |||
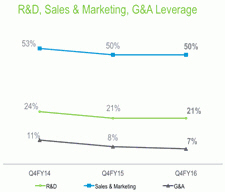
Q4FY16 total operating expenses were $69.2 million or 77% of revenue compared to Q4 last year operating expenses of $54.4 million or 80% of revenue. We ended FY16 with 1,104 employees, an increase of 55 employees in Q4.
| Our Q4 non-GAAP operating loss was $9.4 million, in line with our expectations for the quarter. Q4 non-GAAP operating margin improved to negative 10% compared to negative 12% in Q4 last year. Our adjusted EBITDA was negative $5.1 million or negative 6% of revenue in Q4FY16 compared to negative $6.8 million or negative 10% of revenue in Q4FY15, an improvement of 400 bps.
Q4FY16 non-GAAP EPS was a loss of $0.12 per share on approximately 81.2 million weighted average basic and diluted shares outstanding compared to a loss of $0.13 per share in Q4FY15. This was in line with our expectations for a loss of $0.11 to $0.13 per share.
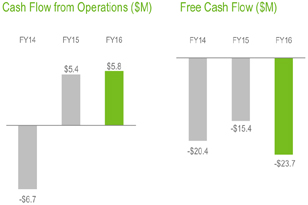
We ended Q4FY16 with cash and cash equivalents of $211.2 million, an increase of $1.5 million during the quarter. Cash Flow from Operations (CFFO) during Q4FY16 was positive at $2.3 million. Non-GAAP Free Cash Flow (FCF) during Q4FY16 was negative $4.1 million due to capex spending of $6.4 million during the quarter.
In Q4FY16, we achieved a cash conversion cycle of 16 days, ahead of our target of 20 days. We ended Q4 with accounts receivables of $50.4 million, an increase of $5.9 million from Q3FY16. Days sales outstanding (DSO) were 44 days, an improvement of 2 days from Q3FY16 due to better linearity of billings during the quarter. We ended Q4 with inventory of $16.0 million, an increase of $1.3 million from Q3FY16. Days sales in inventory (DSI) were 47 days, also an improvement of 2 days from Q3FY16. |
|
FY16 Financial Results
During FY16, we achieved revenue of $322.2 million, an increase of 42% from FY15. Product revenue was $265.6 million, representing 82% of total revenue and an increase of 34% from the prior year. Support and service revenue was $56.6 million, representing 18% of total revenue and an increase of 92% from prior year. Our international business contributed 21% of total revenue during FY16, up from 18% in FY15, and grew by 66% from the prior year. During FY16, our EMEA revenue grew by 63% and APJ revenue grew by 72% over FY15.
In FY16, our gross margin increased by 10 bps to 67.1%. Our product margin was 68.2%, a decrease of 90 bps from FY15. Our support and service margin increased by 890 bps to 62.2% from 53.3%. Total operating expenses were 78% of revenue compared to 84% in FY15, an improvement of 600 bps. Our operating margin in FY16 was negative 11% compared to negative 17% in FY15, an improvement of 600 bps. Adjusted EBITDA margin in FY16 was negative 6% compared to negative 14% in FY15, an improvement of 800 bps.
Our total cash balance increased by $2.8 million during the year to end at $211.2 million. This was the second consecutive year that our overall cash balance has been flat to slightly up. CFFO was positive $5.8 million in FY16, up from positive $5.4 million in FY15. Our FCF decreased to negative $23.7 million compared to negative $15.4 million in FY15 as capex spending increased to $29.4 million in FY16 from $20.8 million in FY15.
|
|
Q1FY17 Financial Outlook and FY17 Perspectives
As we enter FY17, we are very excited about the prospects and traction of our Predictive Flash Platform and its key components: our Unified Flash Fabric, Infosight cloud-based Predictive Analytics and Timeless Storage. As we discussed during our last earnings call, we expect the first half of FY17 to be a rebuilding period. During this period we will increase our investments to expand our market share, which we believe will lead to re-accelerating revenue growth and improving operating leverage in the second half of FY17.
We remain committed to achieving our long-term target operating model as we continually assess the appropriate balance of revenue growth, market share expansion, and profitability.
The guidance for Q1 takes into account the following factors:
| • | Q1 is our seasonally slowest quarter and one in which the large companies in our industry typically see double digit sequential declines in revenue from the fourth quarter. In addition, we believe we have taken into account the potential impact of the All Flash array product introduction during the quarter on existing sales cycles. At the mid-point of our guidance, we expect a 6% decline in revenue from Q4. |
| • | We estimate that the incremental costs associated with the launch and go-to-market costs of the Predictive Flash Platform and in particular the All Flash array during Q1 will be approximately $4 million. |
| • | We plan to increase our investment in sales and marketing resources as we outlined during our last earnings call, in particular to re-accelerate growth in our commercial business and leverage our new All Flash array product line. |
Given that context, our guidance for Q1 is as follows:
| • | Total revenue of $83.0 million to $86.0 million |
| • | Non-GAAP operating loss of $20.0 million to $22.0 million |
| • | Non-GAAP net loss of $0.25 to $0.27 per share, based on weighted average basic shares outstanding of approximately 83 million |
While our practice is not to provide full year guidance, it is helpful to share some perspectives on FY17 as a whole:
| • | Over the last several years, we have demonstrated significant improvement in operating leverage in our financial model. Our operating margin has improved from negative 27% in FY14 (the year we went public), to negative 17% in FY15 to negative 11% in FY16. Our expectation is that in FY17, we will see a pause in this operating leverage improvement as we invest for growth. We believe our operating margin will likely decline compared to FY16 but stay above FY15 levels. |
| • | We expect our operating losses in FY17 to be somewhat front-end loaded with approximately 60% of our annual loss being incurred in the first half of the year. By the second half of FY17, we expect that operating margins will be comparable to the second half of FY16. |
| • | Capex spending will be in the range of $25 million to $30 million. |
| • | We expect our cash balance at the end of FY17 to be in the range of $185 million to $190 million. |
We thank our partners and customers once again for embracing us, our investors for their confidence in us, and our employees for their dedication and flawless execution.

|

| |
| Suresh Vasudevan, CEO | Anup Singh, CFO |
Conference Call Information:
As previously announced, Nimble Storage will host a live question & answer conference call and webcast today at 5:00 p.m. ET (2:00 p.m. PT) to discuss its financial results for the fiscal fourth quarter 2016. Interested parties may access the call by dialing 877-604-9673 in the U.S. or 719-325-4773 from international locations. In addition, a live audio webcast of the conference call will be available on the Nimble Storage Investor Relations website at http://investors.nimblestorage.com. The live webcast will be archived and available on this site for 45 days. A replay of the conference call will be available for 45 days. To access the replay, dial 888-203-1112 and enter pass code 757294. Callers outside the U.S. and Canada should dial 719-457-0820 and enter pass code 757294.
Non-GAAP Financial Measures
To provide investors with additional information regarding our financial results, Nimble Storage has disclosed in this release non-GAAP financial measures that are not calculated in accordance with generally accepted accounting principles in the United States, or GAAP. The Company provides non-GAAP gross margin, non-GAAP product margin, non-GAAP service and support margin, non-GAAP operating margin, non-GAAP net loss, non-GAAP net loss per basic and diluted share, free cash flow and adjusted EBITDA. In computing many of these non-GAAP financial measures, the Company excludes the effects of stock-based compensation, which is a recurring expense for the Company. The Company has provided reconciliation below of non-GAAP financial measures to the most directly comparable GAAP financial measures.
The Company discloses these non-GAAP financial measures because they are key measures used by the Company’s management and board of directors to understand and evaluate operating performance and trends, to prepare and approve the annual budget and to develop short-term and long-term operational and compensation plans. In particular, the exclusion of certain expenses in calculating non-GAAP financial measures can provide a useful measure for period-to-period comparisons of the Company’s business. Accordingly, the Company believes that these non-GAAP financial measures provide useful information to investors and others in understanding and evaluating the Company’s operating results in the same manner as the Company’s management and board of directors.
Non-GAAP financial measures have limitations as analytical tools and, as such, should not be considered in isolation or as substitutes for analysis of the Company’s results as reported under GAAP. Some of these limitations are:
| • | Non-GAAP financial measures do not consider the potentially dilutive impact of equity-based compensation, which is an ongoing expense for the Company; and |
| • | Other companies, including companies in our industry, may calculate non-GAAP financial measures differently, which reduces their usefulness as comparative measures. |
Nimble Storage, Inc.
Reconciliation of GAAP to Non-GAAP Financial Measures
(In thousands, except per share amounts)
(Unaudited)
| Three Months Ended | Year Ended | |||||||||||||||
| January 31, | January 31, | |||||||||||||||
| 2016 | 2015 | 2016 | 2015 | |||||||||||||
| GAAP gross margin |
$ | 58,050 | $ | 44,831 | $ | 209,580 | $ | 148,720 | ||||||||
| Stock-based compensation |
1,758 | 1,062 | 6,715 | 3,888 | ||||||||||||
|
|
|
|
|
|
|
|
|
|||||||||
| Non-GAAP gross margin |
$ | 59,808 | $ | 45,893 | $ | 216,295 | $ | 152,608 | ||||||||
|
|
|
|
|
|
|
|
|
|||||||||
| GAAP operating margin |
$ | (31,867 | ) | $ | (23,393 | ) | $ | (118,636 | ) | $ | (96,077 | ) | ||||
| Stock-based compensation |
22,468 | 14,935 | 83,304 | 57,067 | ||||||||||||
|
|
|
|
|
|
|
|
|
|||||||||
| Non-GAAP operating margin |
$ | (9,399 | ) | $ | (8,458 | ) | $ | (35,332 | ) | $ | (39,010 | ) | ||||
|
|
|
|
|
|
|
|
|
|||||||||
| GAAP net loss |
$ | (32,400 | ) | $ | (24,745 | ) | $ | (120,069 | ) | $ | (98,846 | ) | ||||
| Stock-based compensation |
22,468 | 14,935 | 83,304 | 57,067 | ||||||||||||
|
|
|
|
|
|
|
|
|
|||||||||
| Non-GAAP net loss |
$ | (9,932 | ) | $ | (9,810 | ) | $ | (36,765 | ) | $ | (41,779 | ) | ||||
|
|
|
|
|
|
|
|
|
|||||||||
| Interest income, net |
(45 | ) | (50 | ) | (240 | ) | (139 | ) | ||||||||
| Provision for income taxes |
266 | 300 | 1,017 | 837 | ||||||||||||
| Depreciation |
4,613 | 2,712 | 15,598 | 8,753 | ||||||||||||
|
|
|
|
|
|
|
|
|
|||||||||
| Adjusted EBITDA |
$ | (5,098 | ) | $ | (6,848 | ) | $ | (20,390 | ) | $ | (32,328 | ) | ||||
|
|
|
|
|
|
|
|
|
|||||||||
| GAAP net loss per share, basic and diluted |
$ | (0.40 | ) | $ | (0.33 | ) | $ | (1.52 | ) | $ | (1.37 | ) | ||||
| Stock-based compensation |
0.28 | 0.20 | 1.05 | 0.79 | ||||||||||||
|
|
|
|
|
|
|
|
|
|||||||||
| Non-GAAP net loss per share |
$ | (0.12 | ) | $ | (0.13 | ) | $ | (0.47 | ) | $ | (0.58 | ) | ||||
|
|
|
|
|
|
|
|
|
|||||||||
| Shares used to compute GAAP net loss per share, basic and diluted |
81,175 | 74,517 | 78,932 | 72,304 | ||||||||||||
|
|
|
|
|
|
|
|
|
|||||||||
| Shares used to compute Non-GAAP net loss per share |
81,175 | 74,517 | 78,932 | 72,304 | ||||||||||||
|
|
|
|
|
|
|
|
|
|||||||||
| GAAP net cash provided by operating activities |
$ | 2,290 | $ | 8,609 | $ | 5,755 | $ | 5,376 | ||||||||
| Purchase of property and equipment |
(6,392 | ) | (7,980 | ) | (29,423 | ) | (20,820 | ) | ||||||||
|
|
|
|
|
|
|
|
|
|||||||||
| Non-GAAP Free cash flow |
$ | (4,102 | ) | $ | 629 | $ | (23,668 | ) | $ | (15,444 | ) | |||||
|
|
|
|
|
|
|
|
|
|||||||||
Forward-Looking Statements
This press release contains “forward-looking” statements that are based on our management’s beliefs and assumptions and on information currently available to management. We intend for such forward-looking statements to be covered by the safe harbor provisions for forward-looking statements contained in the U.S. Private Securities Litigation Reform Act of 1995. Forward-looking statements include all statements other than statements of historical fact contained in this letter, including our current beliefs and expectations concerning our future financial results, product releases, product performance and benefits, business plans, strategy and objectives, potential growth drivers and opportunities, competitive position, industry trends and environment and potential market opportunities.
Forward-looking statements are subject to known and unknown risks, uncertainties, assumptions and other factors including, but not limited to, those related to our future financial performance, which is inherently uncertain, unforeseen delays in product development or introduction, uncertainty around market acceptance of our solutions, our ability to increase sales of our solutions, our ability to attract and retain customers and to selling additional solutions to our existing customers, our ability to develop new solutions and bring them to market in a timely manner, pricing pressure (as a result of competition or otherwise), introduction of new technologies and products by other companies, changes in the storage industry, our ability to maintain, protect and enhance our brand and intellectual property, the effectiveness of our channel partners and sales team, our ability to recruit new or keep our existing key talent, global economic conditions, fluctuations in foreign currency rates, and our ability to continue to expand our business and manage our growth. Moreover, we operate in very competitive and rapidly changing environments, and new risks may emerge from time to time. It is not possible for our management to predict all risks, nor can we assess the impact of all factors on our business or the extent to which any factor, or combination of factors, may cause actual results to differ materially from those contained in any forward-looking statements we may make. Further information on these and other factors that could affect our financial results are included in our filings with the Securities and Exchange Commission, and may cause our actual results, performance or achievements to differ materially and adversely from those anticipated or implied by our forward-looking statements.
You should not rely upon forward-looking statements as predictions of future events. Although our management believes that the expectations reflected in our forward-looking statements are reasonable, we cannot guarantee that the future results, levels of activity, performance or events and circumstances described in the forward-looking statements will be achieved or occur. Moreover, neither the Company, nor any other person, assumes responsibility for the accuracy and completeness of the forward-looking statements. We undertake no obligation to publicly update any forward-looking statements for any reason after the date of this presentation to conform these statements to actual results or to changes in our expectations, except as required by law.
Any unreleased services, features or functions whether referenced in this document, Nimble Storage’s website or other press releases or public statements that are not currently available are subject to change at Nimble Storage’s discretion and may not be delivered as planned or at all. Customers who purchase Nimble Storage’s products and services should make their purchase decisions based upon services, features and functions that are currently available.
“Customer” or “Customers” referenced above are Nimble Storage’s end-customers. It is Nimble Storage’s practice to identify an end-customer from our channel partners prior to shipment and before any support and services are provided. Products are typically shipped directly to the end-customers of our channel partners. Assuming all other revenue recognition criteria have been met, Nimble Storage generally recognizes product revenue on sales upon shipment, as title and risk of loss are transferred at that time. Nimble Storage recognizes revenue from support and service contracts over the contractual service period.
Nimble Storage, the Nimble Storage logo, CASL, InfoSight, SmartStack, Timeless Storage, Data Velocity Delivered, Unified Flash Fabric and NimbleConnect are trademarks or registered trademarks of Nimble Storage, Inc. Other trade names or words used in this document are the properties of their respective owners.
Press Contact:
Kristalle Cooks
408-514-3313
kristalle@nimblestorage.com
Investor Relations Contact:
Edelita Tichepco
408-514-3379
IR@nimblestorage.com