Attached files
| file | filename |
|---|---|
| EX-21.1 - EX-21.1 - FIDUS INVESTMENT Corp | d141680dex211.htm |
| EX-31.1 - EX-31.1 - FIDUS INVESTMENT Corp | d141680dex311.htm |
| EX-32.1 - EX-32.1 - FIDUS INVESTMENT Corp | d141680dex321.htm |
| EX-31.2 - EX-31.2 - FIDUS INVESTMENT Corp | d141680dex312.htm |
Table of Contents
UNITED STATES
SECURITIES AND EXCHANGE COMMISSION
Washington, D.C. 20549
Form 10-K
(Mark One)
| x | ANNUAL REPORT PURSUANT TO SECTION 13 OR 15(d) OF THE SECURITIES EXCHANGE ACT OF 1934 |
For the fiscal year ended December 31, 2015
OR
| ¨ | TRANSITION REPORT PURSUANT TO SECTION 13 OR 15(d) OF THE SECURITIES EXCHANGE ACT OF 1934 |
For the transition period from to
Commission file number: 814-00861
FIDUS INVESTMENT CORPORATION
(Exact Name of Registrant as Specified in Its Charter)
| Maryland | 27-5017321 | |
| (State or Other Jurisdiction of Incorporation or Organization) |
(I.R.S. Employer Identification No.) | |
| 1603 Orrington Avenue, Suite 1005 Evanston, Illinois |
60201 | |
| (Address of Principal Executive Offices) | (Zip Code) |
(847) 859-3940
(Registrant’s Telephone Number, including Area Code)
Securities registered pursuant to Section 12(b) of the Act:
| Title of each class |
Name of each exchange on which registered | |
| Common Stock, par value $0.001 per share | The NASDAQ Global Select Market |
Securities registered pursuant to Section 12(g) of the Act: None
Indicate by check mark if the registrant is a well-known seasoned issuer, as defined in Rule 405 of the Securities Act. Yes ¨ No x
Indicate by check mark if the registrant is not required to file reports pursuant to Section 13 or 15(d) of the Act. Yes ¨ No x
Indicate by check mark whether the registrant (1) has filed all reports required to be filed by Section 13 or 15(d) of the Securities Exchange Act of 1934 during the preceding 12 months (or for such shorter period that the registrant was required to file such reports), and (2) has been subject to such filing requirements for the past 90 days. Yes x No ¨
Indicate by check mark whether the registrant has submitted electronically and posted on its corporate Web site, if any, every Interactive Data File required to be submitted and posted pursuant to Rule 405 of Regulation S-T (§232.405 of this chapter) during the preceding 12 months (or for such shorter period that the registrant was required to submit and post such files). Yes ¨ No ¨
Indicate by check mark if disclosure of delinquent filers pursuant to Item 405 of Regulation S-K (§229.406) is not contained herein, and will not be contained, to the best of registrant’s knowledge, in definitive proxy or information statements incorporated by reference in Part III of this Form 10-K or any amendment to this Form 10-K. x
Indicate by check mark whether the registrant is a large accelerated filer, an accelerated filer, a non-accelerated filer, or a smaller reporting company. See definitions of “large accelerated filer”, “accelerated filer” and “smaller reporting company” in Rule 12b-2 of the Exchange Act. (Check one):
| Large accelerated filer | ¨ | Accelerated filer | x | |||
| Non-accelerated filer | ¨ (Do not check if a smaller reporting company) | Smaller reporting company | ¨ |
Indicate by check mark whether the registrant is a shell company (as defined in Rule 12b-2 of the Securities Exchange Act of 1934). Yes ¨ No x
The aggregate market value of common stock held by non-affiliates of the registrant on June 30, 2015 based on the closing price on that date of $14.90 on the NASDAQ Global Select Market was $238,083,543. For the purposes of calculating this amount only, all directors and executive officers of the registrant have been treated as affiliates. There were 16,300,732 shares of the registrant’s common stock outstanding as of March 3, 2016.
DOCUMENTS INCORPORATED BY REFERENCE
Portions of the registrant’s proxy statement to be filed with the Securities and Exchange Commission pursuant to Regulation 14A in connection with the registrant’s 2016 Annual Meeting of Stockholders, which will be filed subsequent to the date hereof, are incorporated by reference into Part III of this Form 10-K. Such proxy statement will be filed with the Securities and Exchange Commission not later than 120 days following the end of the registrant’s fiscal year ended December 31, 2015.
Table of Contents
| Page | ||||||
| PART I | ||||||
| Item 1. |
4 | |||||
| Item 1A. |
32 | |||||
| Item 1B. |
56 | |||||
| Item 2. |
56 | |||||
| Item 3. |
56 | |||||
| Item 4. |
56 | |||||
| PART II | ||||||
| Item 5. |
57 | |||||
| Item 6. |
60 | |||||
| Item 7. |
Management’s Discussion and Analysis of Financial Condition and Results of Operations |
61 | ||||
| Item 7A. |
78 | |||||
| Item 8. |
79 | |||||
| Item 9. |
Changes in and Disagreements with Accountants on Accounting and Financial Disclosure |
123 | ||||
| Item 9A. |
123 | |||||
| Item 9B. |
124 | |||||
| PART III | ||||||
| Item 10. |
125 | |||||
| Item 11. |
125 | |||||
| Item 12. |
Security Ownership of Certain Beneficial Owners and Management and Related Stockholder Matters |
125 | ||||
| Item 13. |
Certain Relationships and Related Transactions, and Director Independence |
125 | ||||
| Item 14. |
125 | |||||
| PART IV | ||||||
| Item 15. |
126 | |||||
| 128 | ||||||
- 1 -
Table of Contents
SPECIAL NOTE REGARDING FORWARD LOOKING STATEMENTS
This Annual Report on Form 10-K (“Annual Report”) contains forward-looking statements that involve substantial risks and uncertainties. These forward-looking statements are not historical facts, but rather are based on current expectations, estimates and projections about us, our current and prospective portfolio investments, our industry, our beliefs, and our assumptions. Words such as “anticipates,” “expects,” “intends,” “plans,” “will,” “may,” “continue,” “believes,” “seeks,” “estimates,” “would,” “should,” “targets,” “projects” and variations of these words and similar expressions are intended to identify forward-looking statements. The forward-looking statements contained in this Annual Report on Form 10-K involve risks and uncertainties, including statements as to:
| • | our future operating results; |
| • | our business prospects and the prospects of our portfolio companies; |
| • | the impact of investments that we expect to make; |
| • | our contractual arrangements and relationships with third parties; |
| • | the dependence of our future success on the general economy and its impact on the industries in which we invest; |
| • | the ability of our portfolio companies to achieve their objectives; |
| • | our expected financing and investments; |
| • | the adequacy of our cash resources and working capital; |
| • | the timing of cash flows, if any, from the operations of our portfolio companies; |
| • | the impact of increased competition; |
| • | the ability of our investment advisor to identify suitable investments for us and to monitor and administer our investments; |
| • | the ability of our investment advisor to attract and retain highly talented professionals; |
| • | our regulatory structure and tax status; |
| • | our ability to operate as a BDC, a SBIC and a RIC; |
| • | the timing, form and amount of any dividend distributions; |
| • | the impact of fluctuations in interest rates on our business; |
| • | the valuation of any investments in portfolio companies, particularly those having no liquid trading market; and |
| • | our ability to recover unrealized losses. |
These statements are not guarantees of future performance and are subject to risks, uncertainties and other factors, some of which are beyond our control and difficult to predict and could cause actual results to differ materially from those expressed or forecasted in the forward-looking statements, including without limitation:
| • | an economic downturn could impair our portfolio companies’ ability to continue to operate, which could lead to the loss of value in some or all of our investments in such portfolio companies; |
| • | a contraction of available credit and/or an inability to access the equity markets could impair our lending and investment activities; |
| • | interest rate volatility could adversely affect our results, particularly because we use leverage as part of our investment strategy; |
| • | currency fluctuations could adversely affect the results of our investments in portfolio companies with foreign operations; and, |
- 2 -
Table of Contents
| • | the risks, uncertainties and other factors we identify in Item 1A. — Risk Factors contained in this Annual Report on Form 10-K for the year ended December 31, 2015 and in our other filings with the SEC. |
Although we believe that the assumptions on which these forward-looking statements are based are reasonable, any of those assumptions could prove to be inaccurate, and as a result, the forward-looking statements based on those assumptions also could later prove to be inaccurate. Important assumptions include our ability to originate new loans and investments, certain margins and levels of profitability and the availability of additional capital. In light of these and other uncertainties, the inclusion of a projection or forward-looking statement in this Annual Report should not be regarded as a representation by us that our plans and objectives will be achieved. These risks and uncertainties include those described or identified in Item 1A entitled “Risk Factors” in Part 1 and elsewhere in this Annual Report. You should not place undue reliance on these forward-looking statements as a prediction of actual results, which apply only as of the date of this Annual Report. We expressly disclaim any responsibility to update forward-looking statements, whether as a result of new information, future events or otherwise, except as required by law. The forward-looking statements and projections contained in this Annual Report are excluded from the safe harbor protection provided by Section 27A of the Securities Act of 1933, as amended, or the Securities Act.
- 3 -
Table of Contents
Except as otherwise specified, references to “we,” “us,” “our,” “Fidus” and “FIC” refer to Fidus Investment Corporation and its consolidated subsidiaries, and for the periods prior to consummation of the Formation Transactions (as defined below), Fidus Mezzanine Capital, L.P. and its consolidated subsidiaries. Some of the statements in this Annual Report constitute forward-looking statements, which apply to us and relate to future events, future performance or financial condition. The forward-looking statements involve risks and uncertainties for us and actual results could differ materially from those projected in the forward-looking statements for any reason, including those factors discussed in “Risk Factors” and elsewhere in this report.
GENERAL
Fidus Investment Corporation was formed on February 14, 2011 as a Maryland Corporation, for the purpose of acquiring 100.0% of the equity interests in Fidus Mezzanine Capital, L.P. (“Fund I”) and Fidus Mezzanine Capital GP, LLC (“FMCGP”), the former general partner of Fund I, raising capital in an initial public offering (“IPO”), which was completed in June 2011, and thereafter operating as an externally managed business development company (“BDC”) under the Investment Company Act of 1940 (“1940 Act”). We were formed to continue and to expand the business of Fund I, which was formed in February 2007 and is licensed by the U.S. Small Business Administration (the “SBA”) as a small business investment company (an “SBIC”).
On June 20, 2011, FIC acquired 100.0% of the limited partnership interests in Fund I and 100.0% of the equity interests in FMCGP, in exchange for 4,056,521 shares of common stock in FIC (the “Formation Transactions”). Fund I became FIC’s wholly-owned subsidiary, retained its license by the SBA to operate as a SBIC, and continues to hold its existing investments and make new investments. The IPO consisted of the sale of 5,370,500 shares of FIC’s common stock at a price of $15.00 per share resulting in net proceeds of $73.6 million, after deducting underwriting fees and commissions and offering costs totaling $6.9 million. The offering costs were primarily for legal and other professional services and were recorded as a reduction to additional paid-in capital.
On March 29, 2013, we commenced operations of a second wholly-owned investment fund, Fidus Mezzanine Capital II, L.P. (“Fund II”) and on May 28, 2013, were granted a second license by the SBA to operate Fund II as an SBIC. Collectively, Fund I and Fund II are referred to as the “Funds.” The Funds are licensed by the SBA as SBICs and we plan to continue to operate the Funds as SBICs, subject to SBA approval, and to utilize the proceeds of the sale of SBA-guaranteed debentures to enhance returns to our stockholders. We have also made, and continue to make, investments directly through FIC. We believe that utilizing both FIC and the Funds as investment vehicles provides us with access to a broader array of investment opportunities. Given our access to lower cost capital through the SBA’s SBIC debenture program, we expect that the majority of our investments will continue to be made through the Funds until the Funds reach their borrowing limit under the program. For three or more SBICs under common control, the maximum amount of outstanding SBA debentures cannot exceed $350.0 million.
As a result of the IPO and the Formation Transactions described above, we and Fund I are externally managed, closed-end, non-diversified investment companies that have elected to be treated as BDCs under the 1940 Act. Fund II is not a BDC or investment company under the 1940 Act based on the exclusion from the definition of investment company contained in Section 3(c)(7) of the 1940 Act. In addition, FIC has elected to be treated as a regulated investment company (“RIC”) under Subchapter M of the Internal Revenue Code of 1986, as amended (the “Code”). As of December 31, 2015, our shares were listed on the NASDAQ Global Select Market under the symbol “FDUS.”
- 4 -
Table of Contents
Overview of our Business
We provide customized debt and equity financing solutions to lower middle-market companies, which we define as U.S. based companies having revenues between $10.0 million and $150.0 million. Our investment objective is to provide attractive risk-adjusted returns by generating both current income from our debt investments and capital appreciation from our equity related investments. Our investment strategy includes partnering with business owners, management teams and financial sponsors by providing customized financing for ownership transactions, recapitalizations, strategic acquisitions, business expansion and other growth initiatives. We seek to maintain a diversified portfolio of investments in order to help mitigate the potential effects of adverse economic events related to particular companies, regions or industries.
We invest in companies that possess some or all of the following attributes: predictable revenues; positive cash flows; defensible and/or leading market positions; diversified customer and supplier bases; and proven management teams with strong operating discipline. We target companies in the lower middle-market with annual earnings, before interest, taxes, depreciation and amortization, or EBITDA, between $3.0 million and $20.0 million; however, we may from time to time opportunistically make investments in larger or smaller companies. Our investments typically range between $5.0 million and $25.0 million per portfolio company.
As of December 31, 2015, we had debt and equity investments in 53 portfolio companies with an aggregate fair value of $443.3 million. The weighted average yield on our debt investments as of December 31, 2015 was 13.3%. The weighted average yield was computed using the effective interest rates as of December 31, 2015, including accretion of original issue discount and loan origination fees, but excluding investments on non-accrual status, if any. There can be no assurance that the weighted average yield will remain at its current level.
Available Information
Our headquarters are in Evanston, Illinois, and our internet address is www.fdus.com. We are not including the information contained on our website as a part of, or incorporating it by reference into, this Annual Report. We make available free of charge through our website our proxy statement, annual reports on Form 10-K, quarterly reports on Form 10-Q, current reports on Form 8-K and amendments to those reports, as soon as reasonably practicable after we electronically file such material with, or furnish such material to, the U.S. Securities and Exchange Commission (the “SEC”). You may read and copy all materials we file with the SEC at the SEC’s Public Reference Room at 100 F Street, N.E., Washington, D.C. 20549. You may obtain information regarding the Public Reference Room by calling the SEC at 1-800- SEC-0330. The SEC maintains an internet site at http://www.sec.gov that contains reports, proxy and information statements, and other information regarding issuers, like us, that file electronically with the SEC. Copies of this Annual Report and other reports are also available without charge by contacting us in writing at 1603 Orrington Avenue, Suite 1005, Evanston, Illinois 60201, Attention: Investor Relations.
Our Advisor
Our investment activities are managed by Fidus Investment Advisors, LLC, our investment advisor, and supervised by our board of directors, a majority of whom are not “interested persons” of FIC as defined in section 2(a)(19) of the 1940 Act, and who we refer to hereafter as the Independent Directors. Pursuant to the terms of the investment advisory and management agreement, which we refer to as the Investment Advisory Agreement, between us and our investment advisor, our investment advisor is responsible for determining the composition of our portfolio, including sourcing potential investments, conducting research and diligence on potential investments and equity sponsors, analyzing investment opportunities, structuring our investments and monitoring our investments and portfolio companies on an ongoing basis. Our investment advisor’s investment professionals seek to capitalize on their significant deal origination and sourcing, underwriting, due diligence, investment structuring, execution, portfolio management and monitoring experience. These professionals have developed a broad network of contacts within the investment community, have gained extensive experience investing in assets that constitute our primary focus and have expertise in investing across all levels of the capital structure of lower middle-market companies.
- 5 -
Table of Contents
Our relationship with our investment advisor is governed by and dependent on the Investment Advisory Agreement and may be subject to conflicts of interest. We pay our investment advisor a fee for its services under the Investment Advisory Agreement consisting of two components—a base management fee and an incentive fee. The base management fee is calculated at an annual rate of 1.75% of the average value of our total assets (other than cash or cash equivalents but including assets purchased with borrowed amounts). The incentive fee consists of two parts. The first part is calculated and payable quarterly in arrears and equals 20.0% of our “pre-incentive fee net investment income” for the immediately preceding quarter, subject to a 2.0% preferred return, or “hurdle,” and a “catch up” feature. The second part is determined and payable in arrears as of the end of each fiscal year in an amount equal to 20.0% of our realized capital gains, if any, on a cumulative basis from inception through the end of each fiscal year, computed net of all realized capital losses and unrealized capital depreciation on a cumulative basis, less the aggregate amount of any capital gain incentive fees paid in prior years. We accrue, but do not pay, a capital gains incentive fee in connection with any unrealized capital appreciation, as appropriate. For more information about how we compensate our investment advisor, see “Management and Other Agreements—Investment Advisory Agreement.”
Among other things, our board of directors is charged with protecting our interests by monitoring how our investment advisor addresses conflicts of interest associated with its management services and compensation. Our board of directors is not expected to review or approve each borrowing or incurrence of leverage. However, our board of directors periodically reviews our investment advisor’s portfolio management decisions and portfolio performance. In addition, our board of directors at least annually reviews the services provided by and fees paid to our investment advisor. In connection with these reviews, our board of directors, including a majority of our Independent Directors, considers whether the fees and expenses (including those related to leverage) that we pay to our investment advisor are fair and reasonable in relation to the services provided. Renewal of our Investment Advisory Agreement must be approved each year by our board of directors, including a majority of our Independent Directors.
Fidus Investment Advisors, LLC is a Delaware limited liability company that is registered as an investment advisor under the Investment Advisers Act of 1940, as amended, or the Advisers Act. In addition, Fidus Investment Advisors, LLC serves as our administrator and provides us with office space, equipment and clerical, book-keeping and record-keeping services pursuant to an administration agreement, which we refer to as the Administration Agreement.
Business Strategy
We intend to accomplish our goal of becoming the premier provider of capital to and value-added partner of lower middle-market companies by:
Leveraging the Experience of Our Investment Advisor. Our investment advisor’s investment professionals have significant experience investing in, lending to and advising companies across multiple industries and changing market cycles. These professionals have diverse backgrounds with prior experience in senior management positions at investment banks, specialty finance companies, commercial banks and privately and publicly held companies and have extensive experience investing across all levels of the capital structure of lower middle-market companies. We believe these professionals possess an in-depth understanding of the strategic, financial and operational challenges and opportunities of lower middle-market companies, enabling our investment advisor to effectively identify, assess, structure and monitor our investments.
Capitalizing on Our Strong Transaction Sourcing Network. Our investment advisor’s investment professionals possess an extensive network of long-standing relationships with private equity firms, middle-market senior lenders, junior capital partners, financial intermediaries and management teams of privately owned businesses. We believe that the combination of our investment advisor’s relationships and our reputation as a reliable, responsive and value-added financing partner helps generate a steady stream of new investment opportunities and proprietary deal flow.
- 6 -
Table of Contents
Serving as a Value-Added Partner with Customized Financing Solutions. We follow a partnership-oriented investment approach and focus on opportunities where we believe we can add value to a portfolio company. We primarily concentrate on industries or market niches in which the investment professionals of our investment advisor have prior experience. These professionals also have expertise in structuring securities at all levels of the capital structure, which we believe positions us well to meet the unique financing needs of our portfolio companies. We invest primarily in mezzanine debt securities, typically coupled with an equity interest; however, on a selective basis we may invest in senior secured or unitranche loans. Further, as a publicly-traded BDC, we have a longer investment horizon without the capital return requirements of traditional private investment vehicles. We believe this flexibility enables us to generate attractive risk-adjusted returns on invested capital and enables us to be a better long-term partner for our portfolio companies. We believe that by leveraging the industry and structuring expertise of our investment advisor coupled with our long-term investment horizon, we are well positioned to be a value-added partner for our portfolio companies.
Employing Rigorous Due Diligence and Underwriting Processes Focused on Capital Preservation. Our investment advisor follows a disciplined and credit-oriented approach to evaluating and investing in companies. We focus on companies with proven business models, significant free cash flow, defensible market positions and significant enterprise value cushion for our debt investments. In making investment decisions, we seek to minimize the risk of capital loss without foregoing the opportunity for capital appreciation. Our investment advisor’s investment professionals have developed extensive due diligence and underwriting processes designed to better assess a portfolio company’s prospects and to determine the appropriate investment structure. Our investment advisor thoroughly analyzes each potential portfolio company’s competitive position, financial performance, management team, growth potential and industry attractiveness. As part of this process, our investment advisor also participates in meetings with management, tours of facilities, discussions with industry professionals and third-party reviews. We believe this approach enables us to build and maintain an attractive investment portfolio that meets our return and value criteria over the long term.
Actively Managing our Portfolio. We believe that our investment advisor’s initial and ongoing portfolio review process allows us to effectively monitor the performance and prospects of our portfolio companies. We seek to obtain board observation rights or board seats with respect to our portfolio companies and we conduct monthly financial reviews and regular discussions with portfolio company management. We structure our investments with a comprehensive set of financial maintenance, affirmative and negative covenants. We believe that active monitoring of our portfolio companies’ compliance with covenants provides us with an early warning of any financial difficulty and enhances our ability to protect our invested capital.
Maintaining Portfolio Diversification. We seek to maintain a portfolio of investments that is appropriately diversified among companies, industries, geographic regions and end markets. We have made investments in portfolio companies in the following industries: business services, industrial products and services, value-added distribution, healthcare products and services, consumer products and services (including retail, food and beverage), energy services, defense and aerospace, transportation and logistics, information technology services and niche manufacturing. We believe that investing across various industries helps mitigate the potential effects of negative economic events for particular companies, regions and industries.
Benefiting from Lower Cost of Capital. The Funds’ SBIC licenses allow us to issue SBA-guaranteed debentures. These SBA debentures carry long-term fixed rates that are generally lower than rates on comparable bank and public debt. Because lower-cost SBA leverage is, and will continue to be, a significant part of our funding strategy, our relative cost of debt capital should be lower than many of our competitors. For three or more SBICs under common control, the maximum amount of outstanding SBA debentures cannot exceed $350.0 million.
Investments
We seek to create a diversified investment portfolio that primarily includes mezzanine loans and equity securities. Our investments typically range between $5.0 million to $25.0 million per portfolio company,
- 7 -
Table of Contents
although this investment size may vary proportionately with the size of our capital base. Our investment objective is to provide attractive risk-adjusted returns by generating both current income from our debt investments and capital appreciation from our equity related investments. We may invest in the equity securities of our portfolio companies, such as preferred stock, common stock, warrants and other equity interests, either directly or in conjunction with our debt investments.
Mezzanine Debt Investments. We typically invest in mezzanine debt, which includes senior subordinated notes and junior secured loans. These loans typically have higher fixed interest rates (often representing a combination of cash pay and payment-in-kind interest), prepayment penalties and amortization of principal deferred to maturity, as well as origination and other fees. Subordinated loans generally allow the borrower to make a large lump sum payment of principal at the end of the loan term, and there is a risk of loss if the borrower is unable to pay the lump sum or refinance the amount owed at maturity. Subordinated investments are generally more volatile than secured loans and may involve a greater risk of loss of principal. In certain situations where we are able to structure an investment as a junior secured loan, we will obtain a junior security interest in the assets of these portfolio companies that will serve as collateral in support of the repayment of such loan. This collateral may take the form of second-priority liens on the assets of a portfolio company.
Senior Secured Loans. We also structure some of our debt investments as senior secured or unitranche loans. Senior secured loans typically provide for a fixed interest rate and may contain some minimum principal amortization, excess cash flow sweep features and prepayment penalties. Senior secured loans are secured by a first or second priority lien on all existing and future assets of the borrower and may take the form of term loans or revolving lines of credit. Unitranche debt financing involves issuing one debt security that blends the risk and return profiles of both secured and subordinated debt and typically involves a first priority lien on all existing and future assets of the borrower. We believe that unitranche debt can be attractive for many lower middle-market companies given their size in order to reduce structural complexity and potential conflicts among creditors.
Equity Securities. Our equity securities typically consist of either a direct minority equity investment in common or preferred stock or membership/partnership interests of a portfolio company, or we may receive warrants to buy a minority equity interest in a portfolio company in connection with a debt investment. Warrants we receive with our debt investments typically require only a nominal cost to exercise, and thus, as a portfolio company appreciates in value, we may achieve additional investment return from this equity interest. Our equity investments are typically not control-oriented investments, and in many cases, we acquire equity securities as part of a group of private equity investors in which we are not the lead investor. We may structure such equity investments to include provisions protecting our rights as a minority-interest holder, as well as a “put,” or right to sell such securities back to the issuer, upon the occurrence of specified events. In many cases, we may also seek to obtain registration rights in connection with these equity interests, which may include demand and “piggyback” registration rights. Our equity investments typically are made in connection with debt investments to the same portfolio companies.
Our Consolidated Portfolio
We generally seek to invest in companies from the broad range of industries in which our investment advisor has direct experience. The following is a representative list of the broad industry segments in which we have invested; however, we may invest in other industries if we are presented with attractive opportunities.
| • | business services; | • | niche manufacturing; | |||
| • | industrial products and services; | • | defense and aerospace; | |||
| • | value-added distribution; | • | transportation and logistics; | |||
| • | healthcare products and services; | • | information technology services; and | |||
| • | consumer products and services (including retail, food and beverage); | • | energy services. | |||
- 8 -
Table of Contents
As of December 31, 2015, we had investments in 53 portfolio companies with an aggregate fair value of $443.3 million. As of December 31, 2014, we had investments in 42 portfolio companies with an aggregate fair value of $396.4 million.
The following table shows the portfolio composition by geographic region at fair value and cost and as a percentage of total investments. The geographic composition is determined by the location of the corporate headquarters of the portfolio company.
| Fair Value | Cost | |||||||||||||||||||||||||||||||
| December 31, 2015 | December 31, 2014 | December 31, 2015 | December 31, 2014 | |||||||||||||||||||||||||||||
| (dollars in thousands) | ||||||||||||||||||||||||||||||||
| Midwest |
$ | 119,291 | 26.8 | % | $ | 94,572 | 23.9 | % | $ | 116,015 | 25.9 | % | $ | 92,721 | 23.7 | % | ||||||||||||||||
| Southeast |
107,975 | 24.4 | 113,516 | 28.6 | 113,430 | 25.3 | 113,725 | 29.0 | ||||||||||||||||||||||||
| Northeast |
93,430 | 21.1 | 66,900 | 16.9 | 92,492 | 20.6 | 65,248 | 16.7 | ||||||||||||||||||||||||
| West |
84,648 | 19.1 | 78,904 | 19.9 | 77,028 | 17.2 | 71,975 | 18.4 | ||||||||||||||||||||||||
| Southwest |
37,925 | 8.6 | 42,463 | 10.7 | 49,373 | 11.0 | 47,669 | 12.2 | ||||||||||||||||||||||||
|
|
|
|
|
|
|
|
|
|
|
|
|
|
|
|
|
|||||||||||||||||
| Total |
$ | 443,269 | 100.0 | % | $ | 396,355 | 100.0 | % | $ | 448,338 | 100.0 | % | $ | 391,338 | 100.0 | % | ||||||||||||||||
|
|
|
|
|
|
|
|
|
|
|
|
|
|
|
|
|
|||||||||||||||||
The following table shows the detailed industry segment composition of our portfolio at fair value and cost as a percentage of total investments.
| Fair Value | Cost | |||||||||||||||
| December 31, 2015 |
December 31, 2014 |
December 31, 2015 |
December 31, 2014 |
|||||||||||||
| Healthcare products |
11.4 | % | 11.2 | % | 10.4 | % | 10.6 | % | ||||||||
| Healthcare services |
11.1 | 10.3 | 11.2 | 10.8 | ||||||||||||
| Aerospace & defense manufacturing |
10.5 | 9.4 | 8.7 | 8.6 | ||||||||||||
| Transportation services |
8.1 | 4.0 | 7.6 | 3.9 | ||||||||||||
| Specialty distribution |
8.0 | 10.3 | 7.7 | 9.3 | ||||||||||||
| Business services |
5.4 | 3.1 | 5.7 | 3.2 | ||||||||||||
| Consumer products |
5.1 | 5.6 | 5.0 | 5.6 | ||||||||||||
| Utility equipment manufacturing |
4.6 | 2.6 | 4.6 | 2.6 | ||||||||||||
| Building products manufacturing |
4.0 | 3.6 | 3.6 | 3.7 | ||||||||||||
| Industrial cleaning & coatings |
3.9 | 4.1 | 4.1 | 4.2 | ||||||||||||
| Component manufacturing |
3.8 | 4.3 | 4.0 | 4.6 | ||||||||||||
| Oil & gas services |
3.7 | 8.6 | 4.5 | 8.8 | ||||||||||||
| Financial services |
3.1 | 3.7 | 2.8 | 3.4 | ||||||||||||
| Information technology services |
3.0 | 2.3 | 3.2 | 2.5 | ||||||||||||
| Safety products manufacturing |
2.4 | 2.7 | 2.4 | 2.7 | ||||||||||||
| Printing services |
2.2 | 2.4 | 2.3 | 2.6 | ||||||||||||
| Restaurants |
2.0 | 1.7 | 2.0 | 1.6 | ||||||||||||
| Specialty chemicals |
1.7 | 2.2 | 1.9 | 2.2 | ||||||||||||
| Laundry services |
1.5 | 1.5 | 1.4 | 1.4 | ||||||||||||
| Telecommunication services |
1.4 | — | 1.3 | — | ||||||||||||
| Apparel distribution |
1.3 | 1.5 | 1.3 | 1.5 | ||||||||||||
| Vending equipment manufacturing |
0.8 | — | 0.9 | — | ||||||||||||
| Electronic components supplier |
0.4 | 0.4 | 0.3 | 0.4 | ||||||||||||
| Retail |
0.3 | 2.7 | 0.2 | 2.6 | ||||||||||||
| Commercial cleaning |
0.2 | 0.2 | 0.2 | 0.2 | ||||||||||||
| Retail cleaning |
0.1 | 1.1 | 2.7 | 2.7 | ||||||||||||
| Specialty cracker manufacturing |
0.0 | 0.5 | 0.0 | 0.3 | ||||||||||||
|
|
|
|
|
|
|
|
|
|||||||||
| Total |
100.0 | % | 100.0 | % | 100.0 | % | 100.0 | % | ||||||||
|
|
|
|
|
|
|
|
|
|||||||||
- 9 -
Table of Contents
Investment Criteria/Guidelines
We use the following criteria and guidelines in evaluating investment opportunities and constructing our portfolio. However, not all of these criteria and guidelines have been, or will be, met in connection with each of our investments.
Value Orientation / Positive Cash Flow. Our investment advisor places a premium on analysis of business fundamentals from an investor’s perspective and has a distinct value orientation. We focus on companies with proven business models in which we can invest at relatively low multiples of operating cash flow. We also typically invest in portfolio companies with a history of profitability and minimum trailing twelve month EBITDA of $3.0 million. We do not invest in start-up companies, “turn-around” situations or companies that we believe have unproven business plans.
Experienced Management Teams with Meaningful Equity Ownership. We target portfolio companies that have management teams with significant experience and/or relevant industry experience coupled with meaningful equity ownership. We believe management teams with these attributes are more likely to manage the companies in a manner that protects our debt investment and enhances the value of our equity investment.
Niche Market Leaders with Defensible Market Positions. We seek to invest in portfolio companies that have developed defensible and/or leading positions within their respective markets or market niches and are well positioned to capitalize on growth opportunities. We favor companies that demonstrate significant competitive advantages, which we believe helps to protect their market position and profitability.
Diversified Customer and Supplier Base. We prefer to invest in portfolio companies that have a diversified customer and supplier base. Companies with a diversified customer and supplier base are generally better able to endure economic downturns, industry consolidation and shifting customer preferences.
Significant Equity Value. We believe the existence of significant underlying equity value provides important support to our debt investments. With respect to our debt investments, we look for portfolio companies where management/sponsors have provided significant equity funding and where we believe aggregate enterprise value significantly exceeds aggregate indebtedness, after consideration of our investment.
Viable Exit Strategy. We invest in portfolio companies that we believe will provide steady cash flows to service our debt, ultimately repay our loans and provide working capital for their respective businesses. In addition, we seek to invest in portfolio companies whose business models and expected future cash flows offer attractive exit possibilities for our portfolio equity investments. We expect to exit our investments typically through one of three scenarios: (a) the sale of the portfolio company resulting in repayment of all outstanding debt and monetization of equity; (b) the recapitalization of the portfolio company through which our investments are replaced with debt or equity from a third party or parties; or (c) the repayment of the initial or remaining principal amount of our debt investment from cash flow generated by the portfolio company. In some investments, there may be scheduled amortization of some portion of our debt investment that would result in a partial exit of our investment prior to the maturity of the debt investment.
Investment Committee
Our investment advisor has formed an investment committee to evaluate and approve all of our investments. The investment committee process is intended to bring the diverse experience and perspectives of the committee’s members to the analysis and consideration of each investment. The investment committee also serves to provide investment consistency and adherence to our investment advisor’s core investment philosophy and policies. The investment committee also determines appropriate investment sizing and suggest ongoing monitoring requirements.
- 10 -
Table of Contents
The members of the investment committee that evaluate and approve all of our investments are Edward H. Ross, Thomas C. Lauer, John H. Grigg, Robert G. Lesley, Jr., John J. Ross, II, and W. Andrew Worth.
Investment Process Overview
Our investment advisor has developed the following investment process based on the experience of its investment professionals to identify investment opportunities and to structure investments quickly and effectively. Furthermore, our investment advisor seeks to identify those companies exhibiting superior fundamental risk-reward profiles and strong defensible business franchises while focusing on the relative value of the security in the portfolio company’s capital structure. The investment process consists of five distinct phases:
| • | Investment Generation/Origination; |
| • | Initial Evaluation; |
| • | Due Diligence and Underwriting; |
| • | Documentation and Closing; and |
| • | Active Portfolio Management. |
Each of the phases is described in more detail below.
Investment Generation/Origination. Our investment origination efforts are focused on leveraging our investment advisor’s extensive network of long-standing relationships with private equity firms, middle-market senior lenders, junior-capital partners, financial intermediaries, service providers and management teams of privately owned businesses. We believe that our investment advisor’s investment professionals have reputations as reliable, responsive and value-added partners for lower middle-market companies. Our investment advisor’s focus and reputation as a valued-added partner generates a balanced mix of proprietary deal flow and a steady stream of new deal opportunities.
Initial Evaluation. After a potential transaction is received by our investment advisor, it will conduct an initial review of the transaction materials to determine whether it meets our investment criteria and complies with SBA and other regulatory compliance requirements.
If the potential transaction initially meets our investment criteria, at least two members of the investment committee, referred to as the deal team, will conduct a preliminary due diligence review, taking into consideration some or all of the following factors:
| • | A comprehensive financial model based on quantitative analysis of historical financial performance, projections and pro forma adjustments to determine a range of estimated internal rates of return. |
| • | An initial call or meeting with the management team, owner, private equity sponsor or other deal partner. |
| • | A brief industry and market analysis, leveraging direct industry expertise from other investment professionals of our investment advisor. |
| • | Preliminary qualitative analysis of the management team’s competencies and backgrounds. |
| • | Potential investment structures and pricing terms. |
Upon successful completion of the screening process, the deal team prepares a screening memorandum and makes a recommendation to the investment committee. At this time, the investment committee will also consider whether the investment would be made by us or through the Funds. If the investment committee supports the deal team’s recommendation, the deal team issues a non-binding term sheet to the potential portfolio company. Such a
- 11 -
Table of Contents
term sheet will typically include the key economic terms based on our analysis conducted during the screening process. Upon agreement on a term sheet with the potential portfolio company, our investment advisor will begin a formal diligence and underwriting process.
Due Diligence and Underwriting. Our investment advisor has developed a rigorous and disciplined due diligence process that includes a comprehensive understanding of a borrower’s industry, market, operational, financial, organizational and legal positions and prospects. The due diligence review will take into account information that the deal team deems necessary to make an informed decision about the creditworthiness of the borrower and the risks of the investment, which includes some or all of the following:
| • | Initial or additional site visits and facility tours with management and key personnel. |
| • | Review of the business history, operations and strategy. |
| • | In depth review of industry and competition. |
| • | Analysis of key customers and suppliers, including review of any concentrations and key contracts. |
| • | Detailed review of historical and projected financial statements, including a review of at least three years of performance (annual and monthly), key financial ratios, revenue, expense and profitability drivers and sensitivities to management’s financial projections. |
| • | Detailed evaluation of company management, including background checks. |
| • | Third party reviews of accounting, environmental, legal, insurance, interviews with customers and suppliers, material contracts, competition, industry and market studies (each as appropriate). |
| • | Financial sponsor diligence, if applicable, including portfolio company and other reference checks. |
During the due diligence process, significant attention is given to sensitivity analyses and how the portfolio company might be expected to perform given various scenarios, including downside, “base case” and upside. Upon satisfactory completion of the due diligence review process, the deal team will present their findings and a recommendation to the investment committee. If the investment committee supports the deal team’s recommendation, the deal team will proceed with negotiating and documenting the investment.
Documentation and Closing. Our investment advisor works with the management of a potential portfolio company and its other capital providers, including as applicable, senior, junior and equity capital providers to structure an investment. Our investment advisor structures each investment with an acute focus on capital preservation and will tailor the terms of each investment to the facts and circumstances of the transaction and the prospective portfolio company. We seek to limit the downside of our investments by:
| • | Targeting an optimal total return on our investments (including a combination of current and deferred interest, prepayment penalties and equity participation) that compensates us for credit risk. |
| • | Negotiating covenants in connection with our investments that afford our portfolio companies as much flexibility in managing their businesses as possible, yet consistent with preservation of our capital. Such restrictions may include affirmative and negative covenants, default penalties, lien protection, change of control provisions and board rights, including either board observation or rights to a seat on the board under some circumstances. |
| • | Structuring financial covenants and terms in our debt investments that require a portfolio company to reduce leverage over time, thereby mitigating the risk of loss and increasing the likelihood of achieving targeted returns on investment. These methods may include, among others: leverage covenants requiring a decreasing ratio of debt to cash flow; cash flow covenants requiring an increasing ratio of cash flow to interest expense and possibly other cash expenses such as capital expenditures, cash taxes and mandatory principal payments; and debt incurrence prohibitions, or limiting a company’s ability to relever its balance sheet. In addition, limitations on asset sales and capital expenditures prevent a company from changing the nature of its business or capitalization without our consent. |
- 12 -
Table of Contents
We expect to hold most of our investments to maturity or repayment, but may exit our investments earlier if a liquidity event takes place, such as a sale or recapitalization of a portfolio company or if we determine that a sale of one or more of our investments is in our best interest.
Active Portfolio Management. Active portfolio monitoring is a vital part of our investment process and we continuously monitor the status and progress of the portfolio companies. The same deal team that was involved in the investment process will continue its involvement in the portfolio company post-investment. This provides for continuity of knowledge and allows the deal team to maintain a strong business relationship with key management of its portfolio companies for post-investment assistance and monitoring purposes.
As part of the monitoring process, the deal team conducts a comprehensive review of the financial and operating results of each portfolio company that includes a review of the monthly/quarterly financials relative to prior year and budget, a review of the financial projections including cash flow and liquidity needs, meeting with management, attending board meetings and reviewing compliance certificates and covenants. We will maintain an ongoing dialogue with the management and any controlling equity holders of a portfolio company that will include discussions about the company’s business plans and growth opportunities and any changes in industry and competitive dynamics. While we maintain limited involvement in the ordinary course operations of our portfolio companies, we may maintain a higher level of involvement in non-ordinary course financing or strategic activities and any non-performing scenarios. Our investment advisor’s portfolio management will also include quarterly portfolio reviews with all investment professionals and investment committee members.
Investment Rating System
In addition to various risk management and monitoring tools, our investment advisor uses an internally developed investment rating system to characterize and monitor the credit profile and our expected level of returns on each investment in our portfolio. We use a five-level numeric rating scale. The following is a description of the conditions associated with each investment rating:
| • | Investment Rating 1 is used for investments that involve the least amount of risk in our portfolio. The portfolio company is performing above expectations and the trends and risk factors are favorable, and may include an expected capital gain. |
| • | Investment Rating 2 is used for investments that involve a level of risk similar to the risk at the time of origination. The portfolio company is performing substantially within our expectations and the risks factors are neutral or favorable. Each new portfolio investment enters our portfolio with Investment Rating 2. |
| • | Investment Rating 3 is used for investments performing below expectations and indicates the investment’s risk has increased somewhat since origination. The portfolio company requires closer monitoring, but we expect a full return of principal and collection of all interest and/or dividends. |
| • | Investment Rating 4 is used for investments performing materially below our expectations and the risk has increased materially since origination. The portfolio company has the potential for some loss of investment return, but we expect no loss of principal. |
| • | Investment Rating 5 is used for investments performing substantially below our expectations and the risks have increased substantially since origination. We expect some loss of principal. |
- 13 -
Table of Contents
The following table shows the distribution of our investments on the 1 to 5 investment rating scale at fair value as of December 31, 2015 and 2014.
| As of December 31, 2015 | As of December 31, 2014 | |||||||||||||||
| Investment Rating |
Investments at Fair Value |
Percent of Total Portfolio |
Investments at Fair Value |
Percent of Total Portfolio |
||||||||||||
| (dollars in thousands) | ||||||||||||||||
| 1 |
$ | 77,875 | 17.6 | % | $ | 49,499 | 12.5 | % | ||||||||
| 2 |
268,285 | 60.4 | 297,024 | 74.9 | ||||||||||||
| 3 |
95,981 | 21.7 | 48,814 | 12.3 | ||||||||||||
| 4 |
1,128 | 0.3 | 1,018 | 0.3 | ||||||||||||
| 5 |
— | — | — | — | ||||||||||||
|
|
|
|
|
|
|
|
|
|||||||||
| Totals |
$ | 443,269 | 100.0 | % | $ | 396,355 | 100.0 | % | ||||||||
|
|
|
|
|
|
|
|
|
|||||||||
Based on our investment rating system, the weighted average rating of our portfolio as of both December 31, 2015 and 2014 was 2.0 on a fair value basis.
Determination of Net Asset Value and Valuation Process
We determine the net asset value per share of our common stock on at least a quarterly basis, and more frequently if we are required to do so in connection with the issuance of shares of our common stock or pursuant to applicable federal laws and regulations. The net asset value per share of common stock is equal to the carrying value of our total assets minus liabilities and any preferred stock outstanding divided by the total number of shares of common stock outstanding. Our business plan calls for us to invest primarily in illiquid securities issued by private companies. These portfolio investments may be subject to restrictions on resale and will generally have no established trading market. Because there is not a readily available market for substantially all of the investments in our portfolio, we value substantially all of our portfolio investments at fair value as determined in good faith by our board of directors using a documented valuation policy and consistently applied valuation process in accordance with authoritative accounting guidelines. See “Management’s Discussion and Analysis of Financial Condition and Results of Operations — Critical Accounting Policies and Use of Estimates — Valuation of Portfolio Investments.”
Competition
Our primary competitors in providing financing to lower middle-market companies include public and private funds, other BDCs, SBICs, commercial and investment banks, commercial financing companies and, to the extent they provide an alternative form of financing, private equity and hedge funds. Many of our competitors are substantially larger and have considerably greater financial, technical and marketing resources than we do. For example, we believe some competitors may have access to funding sources that are not available to us. In addition, some of our competitors may have higher risk tolerances or different risk assessments, which could allow them to consider a wider variety of investments and establish more relationships than us. Furthermore, many of our competitors are not subject to the regulatory restrictions that the 1940 Act imposes on us as a BDC or to the distribution and other requirements we must satisfy to maintain our RIC status.
We use the expertise of the investment professionals of our investment advisor to assess investment risks and determine appropriate pricing for our investments in portfolio companies. In addition, the relationships of the investment professionals of our investment advisor enable us to learn about, and compete effectively for, financing opportunities with attractive lower middle-market companies in the industries in which we seek to invest. For additional information concerning the competitive risks we face, see “Risk Factors — Risks Relating to Our Business and Structure — We operate in a highly competitive market for investment opportunities, which could reduce returns and result in losses.”
- 14 -
Table of Contents
Employees
We do not have any direct employees, and our day-to-day investment operations are managed by our investment advisor, which is also acting as our administrator. We have a chief executive officer, chief financial officer and chief compliance officer and, to the extent necessary, our board of directors may elect to hire additional personnel going forward. Our officers are employees of, and are compensated by, our investment advisor, and our allocable portion of the cost of our chief financial officer and chief compliance officer and their respective staffs are paid by us pursuant to the Administration Agreement. Some of our executive officers are also officers of our investment advisor. See “Management and Other Agreements — Administration Agreement.”
MANAGEMENT AND OTHER AGREEMENTS
Our investment advisor is located at 1603 Orrington Avenue, Suite 1005, Evanston, Illinois 60201. Our investment advisor is registered as an investment adviser under the Advisers Act. Subject to the overall supervision of our board of directors and in accordance with the 1940 Act, our investment advisor manages our day-to-day operations and provides investment advisory services to us. Under the terms of the Investment Advisory Agreement, our investment advisor:
| • | determines the composition of our portfolio, the nature and timing of the changes to our portfolio and the manner of implementing such changes; |
| • | assists us in determining what securities we purchase, retain or sell; |
| • | identifies, evaluates and negotiates the structure of the investments we make (including performing due diligence on our prospective portfolio companies); and |
| • | executes, closes, services and monitors the investments we make. |
Investment Advisory Agreement
Management Fee
Pursuant to the Investment Advisory Agreement, we pay our investment advisor a fee for investment advisory and management services consisting of two components — a base management fee and an incentive fee.
Base Management Fee
The base management fee is calculated at an annual rate of 1.75% based on the average value of our total assets (other than cash or cash equivalents but including assets purchased with borrowed amounts) at the end of the two most recently completed calendar quarters, and appropriately adjusted for any share issuances or repurchases during the current calendar quarter. Base management fees for any partial quarter are appropriately prorated. The base management fee is payable quarterly in arrears.
Incentive Fee
The incentive fee consists of two parts. The first part is calculated and payable quarterly in arrears based on our pre-incentive fee net investment income for the immediately preceding calendar quarter. Pre-incentive fee net investment income means interest income, dividend income and any other income (including any other fees such as commitment, origination, structuring, diligence and consulting fees or other fees that we receive from portfolio companies but excluding fees for providing managerial assistance) accrued during the calendar quarter, minus operating expenses for the quarter (including the base management fee, any expenses payable under the Administration Agreement and any interest expense and dividends paid on any outstanding preferred stock, but excluding the incentive fee, excise taxes on realized gains and any deferred organizing and offering costs). Pre-incentive fee net investment income includes, in the case of investments with a deferred interest feature (such as market discount, debt instruments with payment-in-kind interest, preferred stock with payment-in-kind dividends
- 15 -
Table of Contents
and zero-coupon securities), accrued income that we have not yet received in cash. Our investment advisor is not under any obligation to reimburse us for any part of the incentive fee it receives that was based on accrued interest that we never actually receive.
Pre-incentive fee net investment income does not include any realized capital gains, realized capital losses or unrealized capital appreciation or depreciation. Because of the structure of the incentive fee, it is possible that we may pay an incentive fee for a quarter where we incur a loss. For example, if we receive pre-incentive fee net investment income in excess of the hurdle rate (as defined below) for a quarter, we will pay the applicable incentive fee even if we have incurred a loss in that quarter due to realized and unrealized capital losses.
Pre-incentive fee net investment income, expressed as a rate of return on the value of our weighted average net assets (defined as total assets less indebtedness and before taking into account any incentive fees payable during the period) at the end of the immediately preceding calendar quarter, is compared to a fixed “hurdle rate” of 2.0% per quarter. If market interest rates rise, we may be able to invest our funds in debt instruments that provide for a higher return, which would increase our pre-incentive fee net investment income and make it easier for our investment advisor to surpass the fixed hurdle rate and receive an incentive fee based on such net investment income. Our pre-incentive fee net investment income used to calculate this part of the incentive fee is also included in the amount of our total assets (other than cash and cash equivalents but including assets purchased with borrowed amounts) used to calculate the 1.75% base management fee.
We pay our investment advisor an incentive fee with respect to our pre-incentive fee net investment income earned in each calendar quarter as follows:
| • | no incentive fee in any calendar quarter in which the pre-incentive fee net investment income does not exceed the hurdle rate of 2.0%; |
| • | 100.0% of our pre-incentive fee net investment income with respect to that portion of such pre-incentive fee net investment income, if any, that exceeds the hurdle rate but is less than 2.5% in any calendar quarter. We refer to this portion of our pre-incentive fee net investment income (that exceeds the hurdle rate but is less than 2.5%) as the “catch-up” provision. The catch-up is meant to provide our investment advisor with 20.0% of the pre-incentive fee net investment income as if a hurdle rate did not apply if net investment income exceeds 2.5% in any calendar quarter; and |
| • | 20.0% of the amount of our pre-incentive fee net investment income, if any, that exceeds 2.5% in any calendar quarter. |
These calculations are appropriately prorated for any period of less than three months and adjusted for any share issuances or repurchases during the current quarter.
The following is a graphical representation of the calculation of the quarterly income-related portion of the incentive fee:
Quarterly Incentive Fee Based on Net Investment Income
Pre-incentive fee net investment income
(expressed as a percentage of the value of net assets)
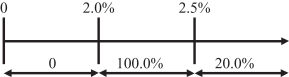
Percentage of pre-incentive fee net investment income
allocated to income-related portion of incentive fee
- 16 -
Table of Contents
The second part of the incentive fee is a capital gains incentive fee that is determined and paid in arrears as of the end of each fiscal year (or, upon termination of the Investment Advisory Agreement, as of the termination date), and equals 20.0% of our net capital gains as of the end of the fiscal year. In determining the capital gains incentive fee to be paid to our investment advisor, we calculate the cumulative aggregate realized capital gains and cumulative aggregate realized capital losses since the Formation Transactions, and the aggregate unrealized capital depreciation as of the date of the calculation, as applicable, with respect to each of the investments in our portfolio. At the end of the applicable year, the amount of capital gains that serves as the basis for our calculation of the capital gains incentive fee equals the cumulative aggregate realized capital gains less cumulative aggregate realized capital losses, less aggregate unrealized capital depreciation, with respect to our portfolio of investments. If this number is positive at the end of such year, then the capital gains incentive fee for such year equals 20.0% of such amount, less the aggregate amount of any capital gains incentive fees paid in respect of our portfolio in all prior years. We accrue, but do not pay, a capital gains incentive fee in connection with any unrealized capital appreciation, as appropriate.
Examples of Quarterly Incentive Fee Calculation
Example 1: Income Related Portion of Incentive Fee
Alternative 1
Assumptions
Investment income (including interest, dividends, fees, etc.) = 1.25%
Hurdle rate (1) = 2.0%
Management fee (2) = 0.4375%
Other expenses (legal, accounting, custodian, transfer agent, etc.) (3) = 0.2%
Pre-incentive fee net investment income
(investment income – (management fee + other expenses)) = 0.6125%
Pre-incentive fee net investment income does not exceed hurdle rate, therefore there is no income-related incentive fee.
Alternative 2
Assumptions
Investment income (including interest, dividends, fees, etc.) = 2.9%
Hurdle rate (1) = 2.0%
Management fee (2) = 0.4375%
Other expenses (legal, accounting, custodian, transfer agent, etc.) (3) = 0.2%
Pre-incentive fee net investment income
(investment income – (management fee + other expenses)) = 2.2625%
| Incentive fee | = 100.0% × pre-incentive fee net investment income (subject to “catch-up”) (4) | |
| = 100.0% × (2.2625% – 2.0%) | ||
| = 0.2625% |
Pre-incentive fee net investment income exceeds the hurdle rate, but does not fully satisfy the “catch-up” provision, therefore the income related portion of the incentive fee is 0.2625%.
- 17 -
Table of Contents
Alternative 3
Assumptions
Investment income (including interest, dividends, fees, etc.) = 3.5%
Hurdle rate (1) = 2.0%
Management fee (2) = 0.4375%
Other expenses (legal, accounting, custodian, transfer agent, etc.) (3) = 0.2%
Pre-incentive fee net investment income
(investment income – (management fee + other expenses)) = 2.8625%
Incentive fee = 100.0% × pre-incentive fee net investment income (subject to “catch-up”) (4)
Incentive fee = 100.0% × “catch-up” + (20.0% × (pre-incentive fee net investment income – 2.5%))
| “Catch-up” | = 2.5% – 2.0% | |||
| = 0.5% | ||||
| Incentive fee | = (100.0% × 0.5%) + (20.0% × (2.8625% – 2.5%)) | |||
| = 0.5% + (20.0% × 0.3625%) | ||||
| = 0.5% + 0.0725% | ||||
| = 0.575% | ||||
Pre-incentive fee net investment income exceeds the hurdle rate and fully satisfies the “catch-up” provision, therefore the income related portion of the incentive fee is 0.575%.
| (1) | Represents 8.0% annualized hurdle rate. |
| (2) | Represents 1.75% annualized base management fee. |
| (3) | Excludes organizational and offering expenses. |
| (4) | The “catch-up” provision is intended to provide our investment advisor with an incentive fee of 20.0% on all pre-incentive fee net investment income as if a hurdle rate did not apply when our net investment income exceeds 2.5% in any fiscal quarter. |
Example 2: Capital Gains Portion of Incentive Fee(*):
Alternative 1
Assumptions
Year 1 : $5.0 million investment made in Company A (“Investment A”), and $7.5 million investment made in Company B (“Investment B”)
Year 2 : Investment A sold for $12.5 million and fair market value (“FMV”) of Investment B determined to be $8.0 million
Year 3 : FMV of Investment B determined to be $6.25 million
Year 4 : Investment B sold for $7.75 million
The capital gains portion of the incentive fee would be:
Year 1 : None
Year 2 : Capital gains incentive fee of $1.5 million — ($7.5 million realized capital gains on sale of Investment A multiplied by 20.0%)
Year 3 : None — $1.25 million (20.0% multiplied by ($7.5 million cumulative capital gains less $1.25 million cumulative capital depreciation)) less $1.5 million (previous capital gains fee paid in Year 2)
- 18 -
Table of Contents
Year 4 : Capital gains incentive fee of $50,000 — $1.55 million ($7.75 million cumulative realized capital gains multiplied by 20.0%) less $1.5 million (capital gains incentive fee taken in Year 2)
Alternative 2
Assumptions
Year 1 : $4.0 million investment made in Company A (“Investment A”), $7.5 million investment made in Company B (“Investment B”) and $6.25 million investment made in Company C (“Investment C”)
Year 2 : Investment A sold for $12.5 million, FMV of Investment B determined to be $6.25 million and FMV of Investment C determined to be $6.25 million
Year 3 : FMV of Investment B determined to be $6.75 million and Investment C sold for $7.5 million
Year 4 : FMV of Investment B determined to be $8.75 million
Year 5 : Investment B sold for $5.0 million
The capital gains incentive fee, if any, would be:
Year 1 : None
Year 2 : $1.45 million capital gains incentive fee — 20.0% multiplied by $7.25 million ($8.5 million realized capital gains on Investment A less $1.25 million unrealized capital depreciation on Investment B)
Year 3 : $0.35 million capital gains incentive fee (1) — $1.8 million (20.0% multiplied by $9.0 million ($9.75 million cumulative realized capital gains less $0.75 million unrealized capital depreciation)) less $1.45 million capital gains incentive fee received in Year 2
Year 4 : None
Year 5 : None — $1.45 million (20.0% multiplied by $7.25 million (cumulative realized capital gains of $9.75 million less realized capital losses of $2.5 million)) is less than $1.8 million cumulative capital gains incentive fee paid in Year 2 and Year 3 (2)
| * | The hypothetical amounts of returns shown are based on a percentage of our total net assets and assume no leverage. There is no guarantee that positive returns will be realized and actual returns may vary from those shown in this example. |
| (1) | As illustrated in Year 3 of Alternative 2 above, if we were to be wound up on a date other than our fiscal year end of any year, we may have paid aggregate capital gains incentive fees that are more than the amount of such fees that would be payable if we had been wound up on our fiscal year end of such year. |
| (2) | As noted above, it is possible that the cumulative aggregate capital gains fee received by our investment advisor ($1.8 million) is effectively greater than $1.45 million (20.0% of cumulative aggregate realized capital gains less net realized capital losses or net unrealized depreciation ($7.25 million)). |
Payment of Our Expenses
All investment professionals of our investment advisor and/or its affiliates, when and to the extent engaged in providing investment advisory and management services to us, and the compensation and routine overhead expenses of personnel allocable to these services to us, are provided and paid for by our investment advisor and not by us. We bear all other out-of-pocket costs and expenses of our operations and transactions. See “Management’s Discussion and Analysis of Financial Condition and Results of Operations – Overview – Expenses.”
Duration and Termination
At an in-person meeting of our board of directors on June 3, 2015, our board of directors, including a majority of the Independent Directors, unanimously voted to approve the continuation of the Investment
- 19 -
Table of Contents
Advisory Agreement to June 20, 2016. Unless terminated earlier, the Investment Advisory Agreement will automatically renew for successive annual periods if approved annually by our board of directors or by the affirmative vote of the holders of a majority of our outstanding voting securities (as that term is defined in the 1940 Act), including, in either case, approval by a majority of the Independent Directors.
In reaching a decision to approve the current Investment Advisory Agreement, our board of directors reviewed information comparing our investment performance to other externally managed BDCs with similar investment objectives and to appropriate market indices. The board also reviewed other information and considered, among other things:
| • | the nature, extent and quality of the advisory and other services (including administrative services provided under the Administrative Agreement as discussed below) provided to us by our investment advisor; |
| • | the fee structure of comparative externally managed BDCs with similar investment objectives; |
| • | our projected operating expenses and expense ratio compared to BDCs with similar investment objectives; |
| • | our investment advisor’s pro forma profitability with respect to managing us and providing administrative services under the Administrative Agreement; |
| • | the limited potential for our investment advisor and its affiliates to derive additional “fall-out” benefits as a result of our relationship with our investment advisor; and |
| • | various other matters. |
Our board of directors did not rank or otherwise assign relative weights to the specific factors it considered in connection with its evaluation of the Investment Advisory Agreement, nor did it undertake to make any specific determination as to whether any particular factor, or any aspect of any particular factor, was favorable or unfavorable to the ultimate decision made by our board of directors. Rather, our board of directors based its approval of the Investment Advisory Agreement on the totality of information presented to it. In considering the factors discussed above, individual directors may have given different weights to different factors.
Based on the information reviewed and the factors discussed above, our board of directors (including the Independent Directors) concluded that the terms of the Investment Advisory Agreement, including the fee rates thereunder, are fair and reasonable in relation to the services provided and approved the continuation of the Investment Advisory Agreement as being in the best interests of FIC and our stockholders.
Conflicts of interest may arise if our investment advisor seeks to change the terms of the Investment Advisory Agreement, including, for example, the amount of the base management fee, the incentive fee or other compensation terms. In general, material amendments to the Investment Advisory Agreement must be approved by the affirmative vote of the holders of a majority of our outstanding voting securities (as that term is defined in the 1940 Act) and by a majority of our Independent Directors.
See “Item 1A. Risk Factors — Risks Relating to our Business and Structure — We are dependent upon our investment advisor’s managing members and our executive officers for our future success. If our investment advisor was to lose any of its managing members or we lose any of our executive officers, our ability to achieve our investment objective could be significantly harmed.”
Indemnification
The Investment Advisory Agreement provides that, absent willful misconduct, bad faith or gross negligence in the performance of its duties under the Investment Advisory Agreement or by reason of the reckless disregard of its duties and obligations under the Investment Advisory Agreement, our investment advisor and its affiliates, and their respective officers, directors, members, managers, partners, stockholders and employees, are entitled to
- 20 -
Table of Contents
indemnification from us from and against any claims or liabilities, including reasonable legal fees and other expenses reasonably incurred, arising out of or in connection with our investment advisor’s performance of its duties and obligations under the Investment Advisory Agreement or otherwise as our investment advisor.
Administration Agreement
Pursuant to the Administration Agreement, Fidus Investment Advisors, LLC acts as our administrator and furnishes us with office facilities and equipment and clerical, book-keeping and record-keeping services at such facilities. Under the Administration Agreement, our investment advisor performs, or oversees the performance of, our required administrative services, which include being responsible for the financial records that we are required to maintain and preparing reports to our stockholders and reports filed with the SEC. In addition, our investment advisor assists us in determining and publishing our net asset value, overseeing the preparation and filing of our tax returns and the printing and dissemination of reports to our stockholders, and generally overseeing the payment of our expenses and the performance of administrative and professional services rendered to us by others. Under the Administration Agreement, our investment advisor also provides managerial assistance on our behalf to those portfolio companies that have accepted our offer to provide such assistance and we reimburse our Investment Advisor for fees and expenses incurred with providing such services. In addition, we reimburse our Investment Advisor for fees and expenses incurred while performing due diligence on our prospective portfolio companies. Payments under the Administration Agreement are equal to an amount based upon our allocable portion of our investment advisor’s overhead in performing its obligations under the Administration Agreement, including rent and our allocable portion of the cost of our officers, including our chief financial officer and chief compliance officer and their respective staffs. To the extent that our investment advisor outsources any of its functions, we will pay the fees associated with such functions on a direct basis without profit to our investment advisor.
At an in-person meeting of our board of directors on June 3, 2015, our board of directors, including a majority of the Independent Directors, unanimously voted to approve the continuation of the Administration Agreement to June 20, 2016. Unless terminated earlier, the Administration Agreement will automatically renew for successive annual periods if approved annually by our board of directors or by the affirmative vote of the holders of a majority of our outstanding voting securities (as that term is defined in the 1940 Act), including, in either case, approval by a majority of our Independent Directors. In making the decision to approve the continuation of the Administration Agreement, our board of directors took into account, to the extent relevant, certain information set forth above under “Investment Advisory Agreement – Duration and Termination” with respect to its consideration of the Investment Advisory Agreement.
The Administration Agreement may be terminated by either party without penalty upon 60 days’ written notice to the other party. The holders of a majority of our outstanding voting securities (as that term is defined in the 1940 Act) may also terminate the Administration Agreement without penalty.
Indemnification
The Administration Agreement provides that, absent willful misconduct, bad faith or gross negligence in the performance of its duties under the Administration Agreement or by reason of the reckless disregard of its duties and obligations under the Administration Agreement, our investment advisor and its affiliates, and their respective officers, directors, members, managers, stockholders and employees, are entitled to indemnification from us from and against any claims or liabilities, including reasonable legal fees and other expenses reasonably incurred, arising out of or in connection with our investment advisor’s performance of its duties or obligations under the Administration Agreement or otherwise as our administrator.
License Agreement
We have entered into a license agreement with Fidus Partners, LLC under which Fidus Partners, LLC has agreed to grant us a non-exclusive (provided that there is not a change in control of Fidus Partners, LLC),
- 21 -
Table of Contents
royalty-free license to use the name “Fidus.” Under this agreement, we have a right to use the “Fidus” name for so long as our investment advisor remains our investment advisor. Other than with respect to this limited license, we have no legal right to the “Fidus” name. This license agreement will remain in effect for so long as the Investment Advisory Agreement with our investment advisor remains in effect.
REGULATION
General
We and Fund I have elected to be treated as BDCs under the 1940 Act and we have elected to be treated as a RIC under Subchapter M of the Code. The 1940 Act contains prohibitions and restrictions relating to transactions between BDCs and their affiliates (including any investment advisors), principal underwriters and affiliates of those affiliates or principal underwriters and requires that a majority of the directors be persons other than “interested persons,” as that term is defined in the 1940 Act. In addition, the 1940 Act provides that we may not change the nature of our business so as to cease to be, or to withdraw our election as, a BDC unless approved by a majority of our outstanding voting securities, as that term is defined in the 1940 Act.
We may invest up to 100.0% of our assets in securities acquired directly from issuers in privately negotiated transactions. With respect to such securities, we may, for the purpose of public resale, be deemed an “underwriter” as that term is defined in the Securities Act. Our intention is to not write (sell) or buy put or call options to manage risks associated with any publicly-traded securities that may from time-to-time be held by our portfolio companies, except that we may enter into hedging transactions to manage the risks associated with interest rate fluctuations. However, we may purchase or otherwise receive warrants to purchase the common stock of our portfolio companies in connection with acquisition financing or other investments. Similarly, in connection with an acquisition, we may acquire rights to require the issuers of acquired securities or their affiliates to repurchase them under certain circumstances. We also do not intend to acquire securities issued by any investment company that exceed the limits imposed by the 1940 Act. Under these limits, we generally cannot acquire more than 3.0% of the total outstanding voting stock of any investment company, invest more than 5.0% of the value of our total assets in securities issued by one investment company or invest more than 10.0% of the value of our total assets in securities issued by more than one investment company. With regard to that portion of our portfolio invested in securities issued by investment companies, it should be noted that such investments might subject our stockholders to additional expenses. These policies are not fundamental and, as a result, each may be changed by the vote of a majority of our board of directors without stockholder approval.
Qualifying Assets
Under the 1940 Act, a BDC may not acquire any asset other than assets of the type listed in section 55(a) of the 1940 Act, which are referred to as “qualifying assets,” unless, at the time the acquisition is made, qualifying assets represent at least 70.0% of the company’s total assets. The principal categories of qualifying assets relevant to our business are the following:
(a) Securities purchased in transactions not involving any public offering from the issuer of such securities, which issuer (subject to certain limited exceptions) is an eligible portfolio company, or from any person who is, or has been during the preceding 13 months, an affiliated person of an eligible portfolio company, or from any other person, subject to such rules as may be prescribed by the SEC. An eligible portfolio company is defined in the 1940 Act as any issuer that:
| • | is organized under the laws of, and has its principal place of business in, the U.S.; |
| • | is not an investment company (other than a small business investment company wholly-owned by the BDC) or a company that would be an investment company but for certain exclusions under the 1940 Act; and |
- 22 -
Table of Contents
| • | satisfies either of the following: |
| • | does not have any class of securities listed on a national securities exchange or has any class of securities listed on a national securities exchange subject to a $250.0 million market capitalization maximum; or |
| • | is controlled by a BDC or a group of companies including a BDC, the BDC actually exercises a controlling influence over the management or policies of the eligible portfolio company, and, as a result, the BDC has an affiliated person who is a director of the eligible portfolio company. |
(b) Securities of any eligible portfolio company which we control.
(c) Securities purchased in a private transaction from a U.S. issuer that is not an investment company or from an affiliated person of the issuer, or in transactions incident to such a private transaction, if the issuer is in bankruptcy and subject to reorganization or if the issuer, immediately prior to the purchase of its securities, was unable to meet its obligations as they came due without material assistance other than conventional lending or financing arrangements.
(d) Securities of an eligible portfolio company purchased from any person in a private transaction if there is no ready market for such securities and we already own 60.0% of the outstanding equity of the eligible portfolio company.
(e) Securities received in exchange for or distributed on or with respect to securities described above, or pursuant to the exercise of warrants or rights relating to such securities.
(f) Cash, cash equivalents, U.S. government securities or high-quality debt securities that mature in one year or less from the date of investment.
The regulations defining qualifying assets may change over time. We may adjust our investment focus as needed to comply with and/or take advantage of any regulatory, legislative, administrative or judicial actions in this area.
Managerial Assistance to Portfolio Companies
A BDC must be organized and have its principal place of business in the U.S. and must be operated for the purpose of making investments in the types of securities described in (a), (b) or (c) above. However, in order to count portfolio securities as qualifying assets for the purpose of the 70.0% test, the BDC must either control the issuer of the securities or must offer to make available to the issuer of the securities significant managerial assistance; except that, when the BDC purchases such securities in conjunction with one or more other persons acting together, one of the other persons in the group may make available such managerial assistance. Making available managerial assistance means, among other things, any arrangement whereby the BDC, through its directors, officers or employees, offers to provide, and, if accepted, does so provide, significant guidance and counsel concerning the management, operations or business objectives and policies of a portfolio company. Our investment advisor, acting as our administrator, has agreed to provide such managerial assistance on our behalf to portfolio companies that request this assistance. We may receive fees for these services and will reimburse our investment advisor, acting as our administrator, for its allocated costs in providing such assistance.
Temporary Investments
Pending investment in other types of qualifying assets, as described above, our investments may consist of cash, cash equivalents, U.S. government securities, repurchase agreements and high-quality debt investments that mature in one year or less from the date of investment, which we refer to, collectively, as temporary investments, so that 70.0% of our assets are invested in qualifying assets or temporary investments. We may from time to time invest in U.S. Treasury bills or in repurchase agreements, so long as the agreements are fully collateralized by cash or securities issued by the U.S. government, including securities issued by certain U.S. government agencies. A repurchase agreement involves the purchase by an investor, such as us, of a specified security and the
- 23 -
Table of Contents
simultaneous agreement by the seller to repurchase it at an agreed-upon future date and at a price that is greater than the purchase price by an amount that reflects an agreed-upon interest rate. There is no percentage restriction on the proportion of our assets that may be invested in such repurchase agreements. However, if more than 25.0% of our total assets constitute repurchase agreements from a single counterparty (other than repurchase agreements fully collateralized by U.S. government securities), we would not satisfy the asset diversification requirements for qualification as a RIC for U.S. federal income tax purposes. Accordingly, we do not intend to enter into any such repurchase agreements that would cause us to fail such asset diversification requirements. Our investment advisor monitors the creditworthiness of the counterparties with which we enter into repurchase agreement transactions.
Senior Securities
We are permitted, under specified conditions, to issue multiple classes of indebtedness and one class of stock senior to our common stock if our asset coverage, as defined in the 1940 Act, is at least equal to 200.0% immediately after each such issuance (exclusive of the SBA debentures pursuant to our SEC exemptive relief). In addition, while any senior securities remain outstanding, we must make provisions to prohibit any distribution to our stockholders or the repurchase of such securities or shares unless we meet the applicable asset coverage ratios at the time of the distribution or repurchase. We may also borrow amounts up to 5.0% of the value of our total assets for temporary or emergency purposes without regard to asset coverage. For a discussion of the risks associated with leverage, see “Risk Factors — Risks Relating to Our Business and Structure — Regulations governing our operation as a BDC affect our ability to raise, and the way in which we raise, additional capital which may have a negative effect on our growth.”
Codes of Ethics
We, Fund I and our investment advisor have adopted a joint code of ethics pursuant to Rule 17j-1 under the 1940 Act that establishes procedures for personal investments and restricts certain personal securities transactions. Additionally, our investment advisor has adopted a code of ethics pursuant to rule 204A-1 under the Advisers Act and in accordance with Rule 17j-1(c). Personnel subject to the code of ethics may invest in securities for their personal investment accounts, including securities that may be purchased or held by us, so long as such investments are made in accordance with the code’s requirements. You may read and copy these codes at the SEC’s Public Reference Room in Washington, D.C. You may obtain information on the operation of the Public Reference Room by calling the SEC at (800) SEC-0300. You may also obtain copies of the joint code of ethics, after paying a duplicating fee, by electronic request at the following e-mail address: publicinfo@sec.gov, or by writing the SEC’s Public Reference Section, 100 F Street, N.E., Washington, D.C. 20549. The joint code of ethics is also available on our website at www.fdus.com. We have also adopted a code of business conduct that is applicable to all officers, directors and employees of Fidus and our investment advisor that is available on our website.
Proxy Voting Policies and Procedures
In light of the types of investments held in our portfolio, it is unlikely that we will be called upon to vote our shares very often. In the event that we receive a proxy statement related to one of our portfolio companies, however, we have delegated our proxy voting responsibility to our investment advisor. The proxy voting policies and procedures of our investment advisor are set out below. The guidelines are reviewed periodically by our investment advisor and our Independent Directors, and, accordingly, are subject to change. For purposes of these proxy voting policies and procedures described below, “we,” “our” and “us” refer to our investment advisor.
Introduction
As an investment adviser registered under the Advisers Act, our investment advisor has a fiduciary duty to act solely in our best interests. As part of this duty, our investment advisor recognizes that it must vote our securities in a timely manner free of conflicts of interest and in our best interests.
- 24 -
Table of Contents
Our investment advisor’s policies and procedures for voting proxies for its investment advisory clients are intended to comply with Section 206 of, and Rule 206(4)-6 under, the Advisers Act.
Proxy Policies
Our investment advisor will vote proxies relating to our portfolio securities in what it perceives to be the best interest of our stockholders. Our investment advisor reviews on a case-by-case basis each proposal submitted to a stockholder vote to determine its effect on the portfolio securities we hold. In most cases our investment advisor will vote in favor of proposals that it believes are likely to increase the value of the portfolio securities we hold. Although our investment advisor will generally vote against proposals that may have a negative effect on our portfolio securities, our investment advisor may vote for such a proposal if there exist compelling long-term reasons to do so.
Proxy voting decisions are made by our investment advisor’s senior investment professionals who are responsible for monitoring each of our portfolio investments. To ensure that our investment advisor’s vote is not the product of a conflict of interest, our investment advisor requires that (a) anyone involved in the decision-making process disclose to our chief compliance officer any potential conflict that he or she is aware of and any contact that he or she has had with any interested party regarding a proxy vote; and (b) employees involved in the decision-making process or vote administration are prohibited from revealing how our investment advisor intends to vote on a proposal in order to reduce any attempted influence from interested parties. Where conflicts of interest may be present, our investment advisor will disclose such conflicts to us, including our Independent Directors, and may request guidance from us on how to vote such proxies.
Proxy Voting Records
You may obtain information about how our investment advisor voted proxies for us by making a written request for proxy voting information to: Fidus Investment Corporation, 1603 Orrington Avenue, Suite 1005, Evanston, Illinois 60201, Attention: Investor Relations, or by calling Fidus Investment Corporation collect at (847) 859-3940.
Compliance Policies and Procedures
We, Fund I and our investment advisor have each adopted and implemented written policies and procedures reasonably designed to prevent violation of federal securities laws and are required to review these compliance policies and procedures annually for their adequacy and the effectiveness of their implementation. Our chief compliance officer is responsible for administering these policies and procedures.
Privacy Principles
We are committed to maintaining the privacy of our stockholders and to safeguarding their nonpublic personal information. The following information is provided to help you understand what personal information we collect, how we protect that information and why, in certain cases, we may share information with select other parties.
From time to time, we may receive nonpublic personal information relating to our stockholders. We do not disclose nonpublic personal information about our stockholders or former stockholders to anyone, except as required by law or as is necessary in order to service stockholder accounts (for example, to a transfer agent or third-party administrator).
We restrict access to nonpublic personal information about our stockholders to employees of our investment advisor, its affiliates or authorized service providers that have a legitimate business need for the information. We maintain physical, electronic and procedural safeguards designed to protect the nonpublic personal information of our stockholders.
- 25 -
Table of Contents
Other
Under the 1940 Act, we are required to provide and maintain a bond issued by a reputable fidelity insurance company to protect us against larceny and embezzlement. Furthermore, as a BDC, we are prohibited from protecting any director or officer against any liability to us or our stockholders arising from willful misfeasance, bad faith, gross negligence or reckless disregard of the duties involved in the conduct of such person’s office.
We may also be prohibited under the 1940 Act from knowingly participating in certain transactions with our affiliates without the prior approval of our Independent Directors and, in some cases, prior approval by the SEC. On March 27, 2012, the SEC granted us and Fund I exemptive relief allowing us to operate effectively as one company and to take certain actions, including engaging in certain transactions with our affiliates, and to be subject to modified consolidated asset coverage requirements for senior securities issued by a BDC, that would otherwise be prohibited by the 1940 Act. Effective September 30, 2014, our exemptive relief was amended to include Fund II. Therefore, any SBA debentures issued by Fund II are not subject to the 200.0% asset coverage requirement.
Small Business Administration Regulations
The Funds are licensed by the SBA to operate as SBICs under Section 301(c) of the Small Business Investment Act of 1958. Fund I received its SBIC license on October 22, 2007 and Fund II received its SBIC license on May 28, 2013. We may issue SBA debentures to fund additional investments through the Funds.
SBICs are designed to stimulate the flow of private equity capital to eligible small businesses. Under SBA regulations, SBICs can provide financing in the form of debt and/or equity securities and provide consulting and advisory services to “eligible” small businesses. The Funds have typically invested in senior subordinated debt, acquired warrants and/or made other equity investments in qualifying small businesses.
Under current SBA regulations, eligible small businesses generally include businesses that (together with their affiliates) have a tangible net worth not exceeding $19.5 million and have average annual net income after U.S. federal income taxes not exceeding $6.5 million (average net income to be computed without benefit of any carryover loss) for the two most recent fiscal years. In addition, an SBIC must devote between 20.0% and 25.0% (depending upon when it was licensed, when it obtained leverage commitments, the amount of leverage drawn and when financings occur) of its investment activity to “smaller” concerns as defined by the SBA. A smaller concern generally includes businesses (including their affiliates) that have a tangible net worth not exceeding $6.0 million and have average annual net income after U.S. federal income taxes not exceeding $2.0 million (average net income to be computed without benefit of any net carryover loss) for the two most recent fiscal years. SBA regulations also provide alternative size standard criteria to determine eligibility for designation as an eligible small business or smaller concern, which criteria depend on the industry in which the business (including its affiliates) is engaged and are based on the number of employees and gross revenue. However, once an SBIC has invested in a portfolio company, it may continue to make follow-on investments in the portfolio company, regardless of the size of the portfolio company at the time of the follow-on investment, up to the time of the portfolio company’s initial public offering.
The SBA prohibits an SBIC from providing funds to small businesses for certain purposes, such as relending and investment outside the U.S., to businesses engaged in a few prohibited industries, and to certain “passive” (non-operating) companies. In addition, under SBA regulations, without prior SBA approval, an SBIC may not invest more than 30.0% of its regulatory capital in any one portfolio company (assuming the SBIC intends to draw leverage equal to twice its regulatory capital).
The SBA places certain limitations on the financing terms of investments by SBICs in portfolio companies (such as limiting the permissible interest rate on debt securities held by an SBIC in a portfolio company). SBA regulations allow an SBIC to exercise control over a small business for a period of seven years from the date on which the SBIC initially acquires its control position. This control period may be extended for an additional period of time with the SBA’s prior written approval.
- 26 -
Table of Contents
The SBA restricts the ability of an SBIC to lend money to any of its officers, directors and employees or to invest in affiliates thereof. The SBA also prohibits, without prior SBA approval, a “change of control” of an SBIC or transfers that would result in any person (or a group of persons acting in concert) owning 10.0% or more of a class of capital stock of a licensed SBIC. A “change of control” is any event that would result in the transfer of the power, direct or indirect, to direct the management and policies of an SBIC, whether through ownership, contractual arrangements or otherwise.
An SBIC (or group of SBICs under common control) may generally have outstanding debentures guaranteed by the SBA in amounts up to two times the amount of the regulatory capital of the SBIC(s). Debentures guaranteed by the SBA have a maturity of ten years, require semi-annual payments of interest, and do not require any principal payments prior to maturity. In December 2015, the 2016 omnibus spending bill approved by Congress and signed into law by the President increased the amount of SBA-guaranteed debentures that affiliated SBIC funds can have outstanding from $225.0 million to $350.0 million, subject to SBA approval.
SBICs must invest idle funds that are not being used to make loans in investments permitted under SBA regulations in the following limited types of securities: (i) direct obligations of, or obligations guaranteed as to principal and interest by, the U.S. government, which mature within 15 months from the date of the investment; (ii) repurchase agreements with federally insured institutions with a maturity of seven days or less (and the securities underlying the repurchase obligations must be direct obligations of or guaranteed by the federal government); (iii) certificates of deposit with a maturity of one year or less, issued by a federally insured institution; (iv) a deposit account in a federally insured institution that is subject to a withdrawal restriction of one year or less; (v) a checking account in a federally insured institution; or (vi) a reasonable petty cash fund.
SBICs are periodically examined and audited by the SBA’s staff to determine their compliance with SBA regulations and are periodically required to file certain forms with the SBA.
Neither the SBA nor the U.S. government or any of its agencies or officers has approved any ownership interest to be issued by us or any obligation that we or any of our subsidiaries may incur.
Sarbanes-Oxley Act of 2002
The Sarbanes-Oxley Act of 2002, or the Sarbanes-Oxley Act, imposes a wide variety of regulatory requirements on publicly held companies and their insiders. Many of these requirements affect us. For example:
| • | pursuant to Rule 13a-14 under the Securities Exchange Act of 1934, as amended, or the Exchange Act, our principal executive officer and principal financial officer must certify the accuracy of the financial statements contained in our periodic reports; |
| • | pursuant to Item 307 under Regulation S-K, our periodic reports must disclose our conclusions about the effectiveness of our disclosure controls and procedures; |
| • | pursuant to Rule 13a-15 under the Exchange Act, our management must prepare an annual report regarding its assessment of our internal control over financial reporting, which must be audited by our independent registered public accounting firm; and |
| • | pursuant to Item 308 of Regulation S-K and Rule 13a-15 under the Exchange Act, our periodic reports must disclose whether there were significant changes in our internal controls over financial reporting or in other factors that could significantly affect these controls subsequent to the date of their evaluation, including any corrective actions with regard to significant deficiencies and material weaknesses. |
The Sarbanes-Oxley Act requires us to review our current policies and procedures to determine whether we comply with the Sarbanes-Oxley Act and the regulations promulgated under such act. We will continue to monitor our compliance with all regulations that are adopted under the Sarbanes-Oxley Act and will take actions necessary to ensure that we comply with that act.
- 27 -
Table of Contents
The NASDAQ Global Select Market Corporate Governance Regulations
The NASDAQ Global Select Market has adopted corporate governance regulations with which listed companies must comply. We are in compliance with such corporate governance listing standards applicable to BDCs.
Election to Be Taxed as a RIC
We have elected to be treated as a RIC under Subchapter M of the Code. As a RIC, we generally will not be subject to corporate-level U.S. federal income taxes on any income that we distribute to our stockholders. To maintain our status as a RIC, we must, among other things, meet certain source-of-income and asset diversification requirements (as described below). In addition, in order to maintain our status as a RIC, we must distribute to our stockholders, for each taxable year, at least 90.0% of our “investment company taxable income,” which is generally our net ordinary income plus the excess, if any, of realized net short-term capital gain over realized net long-term capital loss, or the Annual Distribution Requirement. Depending on the level of taxable income earned in a tax year, we may choose to carry forward taxable income in excess of current year distributions into the next tax year and pay a 4.0% excise tax on such income. In such case, we must distribute any such carryover taxable income through a distribution declared prior to filing the final tax return for the year in which we generated such taxable income. Even if we maintain our status as a RIC, we generally will be subject to corporate-level U.S. federal income tax on our undistributed taxable income and could be subject to U.S. federal excise, state, local and foreign taxes.
Taxation as a RIC
Provided that we maintain our status as a RIC and satisfy the Annual Distribution Requirement, we will not be subject to U.S. federal income tax on the portion of our investment company taxable income and net capital gain (which is defined as net long-term capital gain in excess of net short-term capital loss) that we timely distribute to stockholders. We will be subject to U.S. federal income tax at the regular corporate rates on any income or capital gain not distributed (or deemed distributed) to our stockholders.
We will be subject to a 4.0% nondeductible U.S. federal excise tax on certain undistributed income unless we distribute in a timely manner an amount at least equal to the sum of (1) 98.0% of our investment company taxable income for each calendar year, (2) 98.2% of our capital gain net income for the one-year period ending October 31 in that calendar year (or, if we so elect, for that calendar year) and (3) any income recognized, but not distributed, in the preceding calendar year and on which we paid no U.S. federal income tax.
In order to maintain our status as a RIC for U.S. federal income tax purposes, we must, among other things:
| • | meet the Annual Distribution Requirement; |
| • | qualify to be treated as a BDC or be registered as a management investment company under the 1940 Act at all times during each taxable year; |
| • | derive in each taxable year at least 90.0% of our gross income from dividends, interest, payments with respect to certain securities loans, gains from the sale or other disposition of stock or other securities or foreign currencies, other income derived with respect to our business of investing in such stock, securities or currencies and net income derived from an interest in a “qualified publicly traded partnership” (as defined in Subchapter M of the Code), or the 90% Income Test; and |
| • | diversify our holdings so that at the end of each quarter of the taxable year: |
| • | at least 50.0% of the value of our assets consists of cash, cash equivalents, U.S. Government securities, securities of other RICs, and other securities if such other securities of any one issuer do not represent more than 5.0% of the value of our assets or more than 10.0% of the outstanding voting securities of the issuer (which for these purposes includes the equity securities of a “qualified publicly traded partnership”); and |
- 28 -
Table of Contents
| • | no more than 25.0% of the value of our assets is invested in the securities, other than U.S. Government securities or securities of other RICs, (i) of one issuer (ii) of two or more issuers that are controlled, as determined under applicable tax rules, by us and that are engaged in the same or similar or related trades or businesses or (iii) of one or more “qualified publicly traded partnerships,” or the Diversification Tests. |
To the extent that we invest in entities treated as partnerships for U.S. federal income tax purposes (other than a “qualified publicly traded partnership”), we generally must include our allocable share of the items of gross income derived by the partnerships for purposes of the 90% Income Test, and the income that is derived from a partnership (other than, a “qualified publicly traded partnership”) will be treated as qualifying income for purposes of the 90% Income Test only to the extent that such income is attributable to items of income of the partnership which would be qualifying income if realized by us directly. In addition, we generally must take into account our proportionate share of the assets held by partnerships (other than a “qualified publicly traded partnership”) in which we are a partner for purposes of the Diversification Tests.
In order to meet the 90% Income Test, we have established several special purpose corporations, and in the future may establish additional such corporations, to hold assets from which we do not anticipate earning dividends, interest or other qualifying income under the 90% Income Test (the “Taxable Subsidiaries”). Any investments held through the Taxable Subsidiaries are generally subject to U.S. federal income and other taxes, and therefore we can expect to achieve a reduced after-tax yield on such investments.
We may be required to recognize taxable income in circumstances in which we do not receive a corresponding payment in cash. For example, if we hold debt obligations that are treated under applicable tax rules as having original issue discount or debt instruments with payment-in-kind interest, we must include in income each year a portion of the original issue discount that accrues over the life of the obligation and payment-in-kind interest, regardless of whether cash representing such income is received by us in the same taxable year. We may also have to include in income other amounts that we have not yet received in cash, such as deferred loan origination fees that are paid after origination of the loan or are paid in non-cash compensation such as warrants or stock. We anticipate that a portion of our income may constitute original issue discount or other income required to be included in taxable income prior to our receipt of cash.
Because any original issue discount or other amounts accrued will be included in our investment company taxable income for the year of the accrual, we may be required to make a distribution to our stockholders in order to satisfy the Annual Distribution Requirement, even though we will not have received any corresponding cash amount. As a result, we may have difficulty meeting the Annual Distribution Requirement. We may have to sell some of our investments at times and/or at prices we would not consider advantageous, raise additional debt or equity capital or forgo new investment opportunities for this purpose. If we are not able to obtain cash from other sources, we may fail to qualify for RIC tax treatment and thus become subject to corporate-level income tax.
Furthermore, a portfolio company in which we invest may face financial difficulty that requires us to work-out, modify or otherwise restructure our investment in the portfolio company. Any such restructuring may result in unusable capital losses and future non-cash income. Any restructuring may also result in our recognition of a substantial amount of non-qualifying income for purposes of the 90% Income Test, such as cancellation of indebtedness income in connection with the work-out of a leveraged investment (which, while not free from doubt, may be treated as non-qualifying income) or the receipt of other non-qualifying income.
Gain or loss realized by us from warrants acquired by us, as well as any loss attributable to the lapse of such warrants, generally will be treated as capital gain or loss. Such gain or loss generally will be long-term or short-term, depending on how long we held a particular warrant.
Investments by us in non-U.S. securities may be subject to non-U.S. income, withholding and other taxes, and therefore, our yield on any such securities may be reduced by such non-U.S. taxes. Stockholders will generally not be entitled to claim a credit or deduction with respect to non-U.S. taxes paid by us.
- 29 -
Table of Contents
Although we do not presently expect to do so, we are authorized to borrow funds and to sell assets in order to satisfy the Annual Distribution Requirement and to avoid corporate-level U.S. federal income tax and the 4.0% U.S. federal excise tax. However, under the 1940 Act, we are not permitted to make distributions to our stockholders while our debt obligations and other senior securities are outstanding unless certain “asset coverage” tests are met. See “Regulation — Qualifying Assets” and “Regulation — Senior Securities.” Moreover, our ability to dispose of assets to satisfy the Annual Distribution Requirement and to avoid corporate-level U.S. federal income tax and the 4.0% U.S. federal excise tax may be limited by (1) the illiquid nature of our portfolio and (2) other requirements relating to our status as a RIC, including the Diversification Tests. If we dispose of assets in order to meet the Annual Distribution Requirement or to avoid corporate-level U.S. federal income tax or the 4.0% U.S. federal excise tax, we may make such dispositions at times that, from an investment standpoint, are not advantageous.
If we fail to satisfy the Annual Distribution Requirement or otherwise fail to qualify as a RIC in any taxable year, unless certain cure provisions apply, we will be subject to tax in that year on all of our taxable income, regardless of whether we make any distributions to our stockholders. In that case, all of such income will be subject to corporate-level U.S. federal income tax, reducing the amount available to be distributed to our stockholders. See “Failure To Qualify as a RIC” below.
As a RIC, we are not allowed to carry forward or carry back a net operating loss for purposes of computing our investment company taxable income in other taxable years. U.S. federal income tax law generally permits a RIC to carry forward (i) the excess of its net short-term capital loss over its net long-term capital gain for a given year as a short-term capital loss arising on the first day of the following year and (ii) the excess of its net long-term capital loss over its net short-term capital gain for a given year as a long- term capital loss arising on the first day of the following year. However, future transactions in which we may engage could cause our ability to use any capital loss carryforwards, and unrealized losses once realized, to be limited under Section 382 of the Code.
Certain of our investment practices may be subject to special and complex U.S. federal income tax provisions that may, among other things, (i) disallow, suspend or otherwise limit the allowance of certain losses or deductions, (ii) convert lower taxed long-term capital gain and qualified dividend income into higher taxed short-term capital gain or ordinary income, (iii) convert an ordinary loss or a deduction into a capital loss (the deductibility of which is more limited), (iv) cause us to recognize income or gain without a corresponding receipt of cash, (v) adversely affect the time as to when a purchase or sale of stock or securities is deemed to occur, (vi) adversely alter the characterization of certain complex financial transactions, and (vii) produce income that will not be qualifying income for purposes of the 90% Income Test. We will monitor our transactions and may make certain tax elections in order to mitigate the effect of these provisions.
As described above, to the extent that we invest in equity securities of entities that are treated as partnerships for U.S. federal income tax purposes, the effect of such investments for purposes of the 90% Income Test and the Diversification Tests will depend on whether or not the partnership is a “qualified publicly traded partnership” (as defined in Subchapter M of the Code). If the partnership is a “qualified publicly traded partnership,” the net income derived from such investments will be qualifying income for purposes of the 90% Income Test and will be “securities” for purposes of the Diversification Tests. If the partnership, however, is not treated as a “qualified publicly traded partnership,” then the consequences of an investment in the partnership will depend upon the amount and type of income and assets of the partnership allocable to us. The income derived from such investments may not be qualifying income for purposes of the 90% Income Test and, therefore, could adversely affect our qualification as a RIC. We intend to monitor our investments in equity securities of entities that are treated as partnerships for U.S. federal income tax purposes to prevent our disqualification as a RIC.
We may invest in preferred securities or other securities the U.S. federal income tax treatment of which may not be clear or may be subject to recharacterization by the IRS. To the extent the tax treatment of such securities
- 30 -
Table of Contents
or the income from such securities differs from the expected tax treatment, it could affect the timing or character of income recognized, requiring us to purchase or sell securities, or otherwise change our portfolio, in order to comply with the tax rules applicable to RICs under Subchapter M of the Code.
We may make distributions that are payable in cash or shares of our stock at the election of each stockholder. Under certain applicable provisions of Subchapter M of the Code and the Treasury regulations, distributions payable in cash or in shares of stock at the election of stockholders may be treated as taxable dividends to the extent of the distributing corporation’s current and accumulated earnings and profits. The Internal Revenue Service has issued private letter rulings indicating that such treatment will apply under circumstances in which the total amount of cash distributed is limited to as little as 20.0% of the total distribution. If we decide to make any distributions that are payable in part in shares of our stock, U.S. stockholders receiving such distributions will be required to include the full amount of the distribution (whether received in cash, shares of our stock, or a combination thereof) as ordinary income (or as long-term capital gain to the extent such distribution is properly reported as a capital gain dividend) to the extent of our current and accumulated earnings and profits. As a result, a U.S. stockholder may be required to pay tax with respect to such distributions in excess of any cash received. If a U.S. stockholder sells the stock it receives in order to pay this tax, the sales proceeds may be less than the amount included in income with respect to the distribution, depending on the market price of our stock at the time of the sale. Furthermore, with respect to non-U.S. stockholders, we may be required to withhold U.S. federal tax with respect to such distributions, including in respect of all or a portion of such distributions that are payable in stock. In addition, if a significant number of our stockholders determine to sell shares of our stock in order to pay taxes owed on such distributions, it may put downward pressure on the trading price of shares of our stock.
We may decide to retain some or all of our long-term capital gains in excess of the amount required to satisfy the Annual Distribution Requirement, but designate the retained amount as a “deemed distribution.” In that case, among other consequences, we will pay tax on the retained amount on behalf of the stockholders. Each U.S. stockholder will be required to include his, her or its share of the deemed distribution in income as if it had been actually distributed to the U.S. stockholder, and the stockholder will be entitled to claim a credit equal to his, her or its allocable share of the tax paid thereon by us. Since non-U.S. stockholders generally would not have U.S. tax liability with respect to the deemed capital gain distribution, they would not be entitled to credit the tax paid by us for U.S. tax purposes. Whether non-U.S. stockholders could claim a credit with respect to their non-U.S. tax liability will depend on the foreign tax credit rules of the country in which they are a resident.
Failure to Qualify as a RIC
If we fail to satisfy the 90% Income Test or the Diversification Tests for any taxable year, we may nevertheless continue to qualify as a RIC for such year if certain cure provisions are applicable (which may, among other things, require us to pay certain corporate-level U.S. federal taxes or to dispose of certain assets).
If we were unable to maintain our status as a RIC, we would be subject to tax on all of our taxable income at regular corporate rates. We would not be able to deduct distributions to stockholders, nor would distributions be compulsory. Distributions would generally be taxable to our stockholders as dividend income to the extent of our current and accumulated earnings and profits (in the case of noncorporate U.S. stockholders, at a maximum federal income tax rate applicable to qualified dividend income of 20.0%). Subject to certain limitations under Subchapter M of the Code, corporate distributees would be eligible for the dividends-received deduction. Distributions in excess of our current and accumulated earnings and profits would be treated first as a return of capital to the extent of the stockholder’s tax basis, and any remaining distributions would be treated as a capital gain.
If we fail to meet the RIC requirements for more than two consecutive years and then seek to re-qualify as a RIC, we would be subject to corporate-level taxation on any built-in gain recognized during the succeeding 10-year period unless we made a special election to recognize all such built-in gain upon our re-qualification as a RIC and pay the corporate-level tax on such built-in gain.
- 31 -
Table of Contents
Investing in our common stock involves a number of significant risks. You should carefully consider these risk factors, together with all of the other information included in this Annual Report and other reports and documents filed by us with the SEC. The risks set out below are not the only risks we face. Additional risks and uncertainties not presently known to us or not presently deemed material by us may also impair our operations and performance. If any of the following events occur, our business, financial condition and results of operations could be materially and adversely affected. In such case, our net asset value and the trading price of our common stock could decline, and you may lose all or part of your investment.
Risks Relating to Our Business and Structure
We are dependent upon our investment advisor’s managing members and our executive officers for our future success. If our investment advisor was to lose any of its managing members or we lose any of our executive officers, our ability to achieve our investment objective could be significantly harmed.
We depend on the investment expertise, skill and network of business contacts of the managing members of our investment advisor, who evaluate, negotiate, structure, execute and monitor our investments. Our future success will depend to a significant extent on the continued service and coordination of the investment professionals of our investment advisor and executive officers. Certain investment professionals and executives may not devote all of their business time to our operations and may have other demands on their time as a result of other activities. The departure of any of these individuals could have a material adverse effect on our ability to achieve our investment objective.
Our business model depends, to a significant extent, upon strong referral relationships with financial institutions, sponsors and investment professionals. Any inability of our investment advisor to maintain or develop these relationships, or the failure of these relationships to generate investment opportunities, could adversely affect our business.
We depend upon the investment professionals of our investment advisor to maintain their relationships with financial institutions, sponsors and investment professionals, and we intend to rely to a significant extent upon these relationships to provide us with potential investment opportunities. If the investment professionals of our investment advisor fail to maintain such relationships, or to develop new relationships with other sources of investment opportunities, we will not be able to grow our investment portfolio. In addition, individuals with whom the investment professionals of our investment advisor have relationships are not obligated to provide us with investment opportunities, and, therefore, we can offer no assurance that these relationships will generate investment opportunities for us in the future.
Our financial condition and results of operation depends on our ability to manage our business effectively.
Our ability to achieve our investment objective and grow depends on our ability to manage our business and deploy our capital effectively. This depends, in turn, on our investment advisor’s ability to identify, evaluate and monitor companies that meet our investment criteria. The achievement of our investment objectives on a cost-effective basis depends upon our investment advisor’s execution of our investment process, its ability to provide competent, attentive and efficient services to us and, to a lesser extent, our access to financing on acceptable terms. Our investment advisor has substantial responsibilities under the Investment Advisory Agreement. In addition, our investment advisor’s investment professionals may be called upon to provide managerial assistance to our portfolio companies. These activities may distract them or slow our rate of investment. Any failure to manage our business and our future growth effectively could have a material adverse effect on our business, financial condition and results of operations.
- 32 -
Table of Contents
We may suffer credit losses and our investments could be rated below investment grade.
Private debt in the form of mezzanine, senior secured or unitranche loans to corporate and asset-based borrowers is highly speculative and involves a high degree of risk of credit loss, and therefore an investment in our shares of common stock may not be suitable for someone with a low tolerance for risk. These risks are likely to increase during an economic recession.
In addition, investments in our portfolio are typically not rated by any rating agency. We believe that if such investments were rated, the vast majority would be rated below investment grade (which is sometimes referred to as “junk”) due to speculative characteristics of the issuer’s capacity to pay interest and repay principal. Our investments may result in an amount of risk, volatility or potential loss of principal that is greater than that of alternative investments.
Because we borrow money and may in the future issue additional senior securities, including preferred stock and debt securities, the potential for gain or loss on amounts invested in us is magnified and may increase the risk of investing in us.
Borrowings, also known as leverage, magnify the potential for gain or loss on amounts invested and, therefore, increase the risks associated with investing in us. The Funds borrow from and issue debt securities to the SBA, and we may borrow from banks and other lenders in the future. The SBA has fixed dollar claims on the Funds’ assets that are superior to the claims of our stockholders. We may also borrow from banks and other lenders or issue additional senior securities including preferred stock and debt securities in the future. If the value of our assets increases, then leveraging would cause the net asset value attributable to our common stock to increase more sharply than it would have had we not used leverage. Conversely, if the value of our assets decreases, leveraging would cause net asset value to decline more sharply than it otherwise would have had we not leveraged. Similarly, any increase in our income in excess of interest payable on the borrowed funds would cause our net income to increase more than it would without the leverage, while any decrease in our income would cause net income to decline more sharply than it would have had we not borrowed. Such a decline could negatively affect our ability to make distributions to our stockholders. Leverage is generally considered a speculative investment technique.
Our ability to achieve our investment objectives may depend in part on our ability to achieve additional leverage on favorable terms by borrowing from the SBA, banks or other lenders, and there can be no assurance that such additional leverage can in fact be achieved.
As a BDC, we are generally required to meet a coverage ratio at least equal to 200.0% of total assets to total borrowings and other senior securities, which include all of our borrowings (other than the Funds’ SBA leverage under the terms of SEC exemptive relief) and any preferred stock we may issue in the future. If this ratio declines below 200.0%, we may not be able to incur additional debt and may need to sell a portion of our investments to repay some debt when it is disadvantageous to do so, and we may not be able to make distributions to our stockholders.
The following table illustrates the effect of leverage on returns from an investment in our common stock assuming various annual returns, net of expenses. The calculations in the table below are hypothetical and actual returns may be higher or lower than those appearing in the table below.
Assumed Return on Our Portfolio
(Net of Expenses)
| (10.0)% | (5.0)% | 0.0% | 5.0% | 10.0% | ||||||||||||||||
| Corresponding return to common stockholder(1) |
(23.3 | )% | (13.5 | )% | (3.7 | )% | 6.1 | % | 16.0 | % | ||||||||||
| (1) | Assumes $485.5 million in total assets, $213.5 million in outstanding SBA debentures, $15.5 million in borrowings under the Credit Facility, and $247.4 million in net assets as of December 31, 2015 and an average cost of funds of 4.0%. |
- 33 -
Table of Contents
Pending legislation may allow us to incur additional leverage.
As a BDC, under the 1940 Act generally we are not permitted to incur indebtedness unless immediately after such borrowing we have an asset coverage for total borrowings of at least 200.0% (i.e., the amount of debt may not exceed 50.0% of the value of our assets). Legislation introduced to the U.S. House of Representatives, if passed, would modify this section of the 1940 Act and increase the amount of debt that BDCs may incur by modifying the minimum asset coverage ratio from 200.0% to 150.0%. If such legislation were to pass, we would be able to incur additional indebtedness in the future and therefore your risk of an investment in us may increase.
In addition, in December 2015, the 2016 omnibus spending bill approved by Congress and signed into law by the President increased the amount of SBA-guaranteed debentures that affiliated SBIC funds can have outstanding from $225.0 million to $350.0 million, subject to SBA approval. This new legislation may allow us to issue additional SBIC debentures above the $213.5 million of SBA-guaranteed debentures we had outstanding as of December 31, 2015. If we incur this additional indebtedness in the future, your risk of an investment in our securities may increase.
Many of our portfolio investments are recorded at fair value as determined in good faith by our board of directors, and, as a result, there is uncertainty as to the value of our portfolio investments and the valuation process for certain of our portfolio holdings creates a conflict of interest.
Many of our portfolio investments take the form of debt and equity securities that are not publicly-traded. The debt and equity securities in which we invest for which market quotations are not readily available are valued at fair value as determined in good faith by our board of directors. As part of the valuation process, we may take into account the following types of factors, if relevant, in determining the fair value of our investments:
| • | a comparison of the portfolio company’s securities to comparable publicly-traded securities; |
| • | the enterprise value of a portfolio company; |
| • | the nature and realizable value of any collateral; |
| • | the portfolio company’s ability to make payments and its earnings and discounted cash flow; |
| • | the markets in which the portfolio company does business; and |
| • | changes in the interest rate environment and the credit markets generally that may affect the price at which similar investments may be made in the future and other relevant factors. |
The fair value of each investment in our portfolio is determined quarterly by our board of directors. Any changes in fair value of portfolio securities from the prior period are recorded in our consolidated statement of operations as net change in unrealized appreciation or depreciation.
In connection with that determination, investment professionals from our investment advisor prepare portfolio company valuations based upon the most recent portfolio company financial statements available and projected financial results of each portfolio company. In addition, certain members of our board of directors have a pecuniary interest in our investment advisor. The participation of our investment advisor’s investment professionals in our valuation process, and the pecuniary interest in our investment advisor by certain members of our board of directors, may result in a conflict of interest as the management fees that we pay our investment advisor are based on our gross assets less cash.
Due to the inherent uncertainty of determining the fair value of investments that do not have a readily available market value, the fair value of our investments may differ significantly from the values that would have been used had a readily available market value existed for such investments, and the differences could be material. Declines in prices and liquidity in the corporate debt markets may also result in significant net unrealized depreciation in our debt portfolio. Our net asset value could be adversely affected if our determinations regarding the fair value of our investments were materially higher than the values that we ultimately realize upon the disposal of such investments.
- 34 -
Table of Contents
We operate in a highly competitive market for investment opportunities, which could reduce returns and result in losses.
A number of entities compete with us to make the types of investments that we plan to make. We compete with public and private funds, commercial and investment banks, commercial financing companies and, to the extent they provide an alternative form of financing, private equity and hedge funds. Many of our competitors are substantially larger and have considerably greater financial, technical and marketing resources than we do. For example, we believe some of our competitors may have access to funding sources that are not available to us. In addition, some of our competitors may have higher risk tolerances or different risk assessments. These characteristics could allow our competitors to consider a wider variety of investments, establish more relationships and offer better pricing and more flexible structuring than we offer. We may lose investment opportunities if we do not match our competitors’ pricing, terms and structure. If we match our competitors’ pricing, terms and structure, we may experience a decrease in net investment income or an increase in risk of capital loss. A significant part of our competitive advantage stems from the fact that the lower middle-market is underserved by traditional commercial and investment banks, and generally has less access to capital. A significant increase in the number and/or the size of our competitors in this target market could force us to accept less attractive investment terms.
Furthermore, many of our competitors are not subject to the regulatory restrictions that the 1940 Act imposes on us as a BDC or the source of income, asset diversification and distribution requirements we must satisfy to maintain our RIC status. The competitive pressures we face may have a material adverse effect on our business, financial condition and results of operations. As a result of this existing and potentially increasing competition, we may not be able to take advantage of attractive investment opportunities from time to time, and we may not be able to identify and make investments that are consistent with our investment objective.
Our management and incentive fee structure may create incentives for our investment advisor that are not fully aligned with the interests of our stockholders and may encourage our investment advisor to make speculative investments.
The management and incentive fees paid to our investment advisor are based on our total assets (other than cash or cash equivalents but including assets purchased with borrowed amounts), and our investor advisor may therefore benefit when we incur debt or use leverage. This fee structure may encourage our investment advisor to cause us to borrow money to finance additional investments. Under certain circumstances, the use of borrowed money may increase the likelihood of default, which would disfavor our stockholders. Our board of directors is charged with protecting our interests by monitoring how our investment advisor addresses these and other conflicts of interests. Our board of directors is not expected to review or approve each borrowing or incurrence of leverage. However, our board of directors, periodically reviews our investment advisor’s portfolio management decisions and portfolio performance. In addition, our board of directors at least annually reviews the services provided by and fees paid to our investment advisor. In connection with these reviews, our board of directors, including a majority of our Independent Directors, considers whether the fees and expenses (including those related to leverage) that we pay to our investment advisor are fair and reasonable in relation to the services provided and must approve renewal of our Advisory Agreement.
The part of the incentive fee payable to our investment advisor that relates to our net investment income is computed and paid on income that includes interest income that has been accrued but not yet received in cash. This fee structure may encourage our investment advisor to favor debt financings that provide for deferred interest, rather than current cash payments of interest. Our investment advisor may have an incentive to invest in deferred interest securities in circumstances where it would not have done so but for the opportunity to continue to earn the incentive fee even when the issuers of the deferred interest securities would not be able to make actual cash payments to us on such securities. This risk could be increased because our investment advisor is not obligated to reimburse us for any incentive fees received even if we subsequently incur losses or never receive in cash the deferred interest that was previously accrued.
- 35 -
Table of Contents
The incentive fee is based, in part, upon net capital gains realized on our investments. Unlike the portion of the incentive fee based on income, there is no hurdle rate applicable to the portion of the incentive fee based on net capital gains. As a result, our investment advisor may have a tendency to invest more capital in investments that are likely to result in capital gains as compared to income producing securities. Such a practice could result in our investing in more speculative securities than would otherwise be the case, which could result in higher investment losses, particularly during economic downturns.
We may be obligated to pay our investment advisor incentive compensation even if we incur a loss and may pay more than 20.0% of our net capital gains because we cannot recover payments made in previous years.
Our investment advisor will be entitled to incentive compensation for each fiscal quarter in an amount equal to a percentage of the excess of our pre-incentive fee net investment income for that quarter above a threshold return for that quarter. Our pre-incentive fee net investment income for incentive compensation purposes excludes realized and unrealized capital losses that we may incur in the fiscal quarter, even if such capital losses result in a net loss on our consolidated statement of operations for that quarter. Thus, we may be required to pay our investment advisor incentive compensation for a fiscal quarter even if there is a decline in the value of our portfolio or we incur a net loss for that quarter. Further, if we pay an incentive fee of 20.0% of our realized capital gains (net of all realized capital losses and unrealized capital depreciation on a cumulative basis) and thereafter experience additional realized capital losses or unrealized capital depreciation, we will not be able to recover any portion of the incentive fee previously paid.
We may have potential conflicts of interest related to obligations that our investment advisor may have to other clients.
Currently, the Company, the Funds and Fidus Credit Opportunities, LLC are the only investment vehicles managed by our investment advisor. The Investment Advisory Agreement does not limit our investment advisor’s ability to act as an investment advisor to other funds, including other BDCs, or other investment advisory clients. To the extent our investment advisor acts as an investment advisor to other funds or clients, including Fidus Credit Opportunities, LLC, we may have conflicts of interest with our investment advisor or its other clients that elect to invest in similar types of securities as those in which we invest. Members of our investment advisor’s investment committee serves or may serve as officers, directors or principals of entities that operate in the same or a related line of business as we do, or of investment funds or other investment vehicles managed by our investment advisor. In serving in these multiple capacities, they may have obligations to other clients or investors in those entities, the fulfillment of which may not be in the best interests of us or our stockholders. Our investment advisor will seek to allocate investment opportunities among eligible accounts in a manner that is fair and equitable over time and consistent with an allocation policy approved by our board of directors.
To the extent our investment adviser forms affiliates, including Fidus Credit Opportunities, LLC, we may co-invest on a concurrent basis with such affiliates, subject to compliance with applicable regulations and regulatory guidance and our allocation procedures. While we may co-invest with investment entities managed by our investment advisor or its affiliates, to the extent permitted by the 1940 Act and the rules and regulations thereunder, the 1940 Act imposes significant limits on co-investment. As a result, we, Fidus Investment Advisors, LLC, the Funds, and Fidus Credit Opportunities, LLC have applied for exemptive relief from the SEC under the 1940 Act, which, if granted, would allow additional latitude to co-invest. However, there is no assurance when, or even if, we will obtain such relief. In the event the SEC does not grant us relief, we will be limited in our ability to invest in certain portfolio companies in which Fidus Investment Advisors, LLC or any of its respective affiliates are investing or are invested. Even if we are able to obtain exemptive relief, we will be unable to participate in certain transactions originated by Fidus Investment Advisors, LLC or its respective affiliates prior to receipt of such relief.
- 36 -
Table of Contents
Our investment advisor or its investment committee may, from time to time, possess material non-public information, limiting our investment discretion.
The investment professionals of our investment advisor may serve as directors of, or in a similar capacity with, companies in which we invest, the securities of which are purchased or sold on our behalf. In the event that material non-public information is obtained with respect to such companies, or we become subject to trading restrictions under the internal trading policies of those companies or as a result of applicable law or regulations, we could be prohibited for a period of time from purchasing or selling the securities of such companies, and this prohibition may have an adverse effect on us.
We may have conflicts related to other arrangements with our investment advisor.
We entered into a license agreement with Fidus Partners, LLC under which Fidus Partners, LLC granted us a non-exclusive (provided that there is not a change in control of Fidus Partners, LLC), royalty-free license to use the name “Fidus.” Some of the members of our investment advisor’s investment committee and the senior origination professionals of our investment advisor are members of Fidus Partners, LLC. See “Management and Other Agreements — License Agreement.” In addition, we rent office space from our investment advisor and pay to our investment advisor our allocable portion of overhead and other expenses incurred in performing its obligations under the Administration Agreement, such as our allocable portion of the cost of our chief financial officer and chief compliance officer. This creates conflicts of interest that our board of directors must monitor.
The Funds are licensed by the SBA, and, therefore, are subject to SBA regulations.
The Funds are licensed to operate as SBICs and are regulated by the SBA. Under current SBA regulations, a licensed SBIC can provide capital to those entities that have a tangible net worth not exceeding $19.5 million and an average annual net income after U.S. federal income taxes not exceeding $6.5 million for the two most recent fiscal years. In addition, a licensed SBIC must devote 25.0% of its investment activity to those entities that have a tangible net worth not exceeding $6.0 million and an average annual net income after U.S. federal income taxes not exceeding $2.0 million for the two most recent fiscal years. The SBA regulations also provide alternative size standard criteria to determine eligibility, which depend on the industry in which the business is engaged and are based on either the number of employees or the gross sales of the business. The SBA regulations permit licensed SBICs to make long term loans to small businesses, invest in the equity securities of such businesses and provide them with consulting and advisory services. The SBA also places certain limitations on the financing terms of investments by SBICs in portfolio companies and prohibits SBICs from providing funds for certain purposes or to businesses in certain prohibited industries. Further, the SBA regulations require that a licensed SBIC be periodically examined and audited by the SBA staff to determine its compliance with the relevant SBA regulations. Compliance with these SBA requirements may cause the Funds to forego attractive investment opportunities that are not permitted under the SBA regulations, and may cause the Funds to make investments they otherwise would not make in order to remain in compliance with these regulations.
Failure to comply with the SBA regulations could result in the loss of the SBIC licenses and the resulting inability to participate in the SBA debenture program. The SBA prohibits, without prior SBA approval, a “change of control” of an SBIC or transfers that would result in any person (or a group of persons acting in concert) owning 10.0% or more of a class of capital stock of a licensed SBIC. Current SBA regulations provide the SBA with certain rights and remedies if an SBIC violates their terms. A key regulatory metric for SBA is the extent of “Capital Impairment,” which is the extent of realized (and, in certain circumstances, net unrealized) losses compared with the SBIC’s private capital commitments. Interest payments, management fees, organization and other expenses are included in determining “realized losses.” SBA regulations preclude the full amount of “unrealized appreciation” from portfolio companies from being considered when calculating Capital Impairment in certain circumstances. Remedies for regulatory violations are graduated in severity depending on the seriousness of Capital Impairment or other regulatory violations. For minor regulatory infractions, the SBA issues a warning. For more serious infractions, the use of SBA debentures may be limited or prohibited, outstanding debentures can be declared to be immediately due and payable, restrictions on distributions and
- 37 -
Table of Contents
making new investments may be imposed and management fees may be required to be reduced. In severe cases, the SBA may require the removal of a general partner of an SBIC or its officers, directors, managers or partners, or the SBA may obtain appointment of a receiver for the SBIC.
SBA regulations limit the amount of SBA-guaranteed debt that may be borrowed by an SBIC.
The SBA regulations currently limit the amount that is available to be borrowed by any SBIC and guaranteed by the SBA to 300.0% of an SBIC’s regulatory capital or $150.0 million, whichever is less. For three or more SBICs under common control, the maximum amount of outstanding SBA debentures cannot exceed $350.0 million. If the Funds borrow the maximum amount from the SBA and thereafter require additional capital, our cost of capital may increase, and there is no assurance that we will be able to obtain additional financing on acceptable terms.
Moreover, the Funds’ current status as SBICs does not automatically assure that they will continue to receive funding through the SBA debenture program. Receipt of SBA debenture funding is dependent upon the Funds’ continuing compliance with SBA regulations and policies and there being funding available. The amount of SBA debenture funding available to SBICs is dependent upon annual Congressional authorizations and in the future may be subject to annual Congressional appropriations. There can be no assurance that there will be sufficient SBA debenture funding available at the times desired by the Funds.
The debentures issued by the Funds and guaranteed by the SBA have a maturity of ten years and bear interest semi-annually at fixed rates. The Funds will need to generate sufficient cash flow to make required debt payments on such debentures. If the Funds are unable to generate such cash flow, the SBA, as guarantor of the debentures, will have a superior claim to our assets over our stockholders in the event the Funds liquidate or the SBA exercises its remedies under such debentures as the result of a default by the Funds.
The Funds, as SBICs, are limited in their ability to make distributions to us, which could result in us being unable to meet the minimum distribution requirements to maintain our status as a RIC.
In order to maintain our status as a RIC, we are required to distribute to our stockholders on an annual basis 90.0% of our net ordinary income and net short-term capital gains in excess of net long-term capital losses. For this purpose, our taxable income will include the income of the Funds (and any other entities that are disregarded as separate from us for U.S. federal income tax purposes). The Funds’ ability to make distributions to us may be limited by the Small Business Investment Act of 1958. As a result, in order to maintain our status as a RIC, we may be required to make distributions attributable to the Funds’ income without receiving any corresponding cash distributions with respect to such income. We can make no assurances that the Funds will be able to make, or not be limited in making, distributions to us. If we are unable to satisfy the annual distribution requirements, we may fail to maintain our status as a RIC, which would result in the imposition of corporate-level U.S. federal income tax on our entire taxable income without regard to any distributions made by us. See “We will be subject to corporate-level U.S. federal income tax if we are unable to maintain our qualification as a RIC under Subchapter M of the Code.”
Changes in interest rates will affect our cost of capital and net investment income.
Most of our debt investments bear interest at fixed rates and the value of these investments could be negatively affected by increases in market interest rates. In addition, to the extent that we borrow additional funds to make investments, an increase in interest rates would make it more expensive for us to use debt to finance our investments. As a result, a significant increase in market interest rates could both reduce the value of our portfolio investments and increase our cost of capital, which would reduce our net investment income. Conversely, a decrease in interest rates may have an adverse impact on our returns by requiring us to seek lower yields on our debt investments and by increasing the risk that our portfolio companies will prepay the debt investments, resulting in the need to redeploy capital at potentially lower rates.
- 38 -
Table of Contents
You should also be aware that a rise in market interest rates typically leads to higher interest rates applicable to our debt investments. Accordingly, an increase in interest rates may result in an increase of the amount of incentive fees payable to our investment advisor.
Capital markets may experience periods of disruption and instability and we cannot predict when these conditions will occur. Such market conditions could materially and adversely affect debt and equity capital markets in the United States and abroad, which could have a negative impact on our business, financial condition and results of operations.
The U.S. and global capital markets experienced extreme volatility and disruption during the economic downturn that began in mid-2007, and the U.S. economy was in a recession for several consecutive calendar quarters during the same period. In 2010, a financial crisis emerged in Europe, triggered by high budget deficits and rising direct and contingent sovereign debt, which created concerns about the ability of certain nations to continue to service their sovereign debt obligations. Risks resulting from such debt crisis and any future debt crisis in Europe or any similar crisis elsewhere could have a detrimental impact on the global economic recovery, sovereign and non-sovereign debt in certain countries and the financial condition of financial institutions generally. In July and August 2015, Greece reached agreements with its creditors for bailouts that provide aid in exchange for certain austerity measures. These and similar austerity measures may adversely affect world economic conditions and have an adverse impact on our business and that of our portfolio companies. In the second quarter of 2015, stock prices in China experienced a significant drop, resulting primarily from continued sell-off of shares trading in Chinese markets. In August 2015, Chinese authorities sharply devalued China’s currency. These market and economic disruptions adversely affected, and these and other similar market and economic disruptions may in the future affect, the U.S. capital markets, which could adversely affect our business and that of our portfolio companies. These market disruptions materially and adversely affected, and may in the future affect, the broader financial and credit markets and has reduced the availability of debt and equity capital for the market as a whole and to financial firms, in particular. At various times, these disruptions resulted in, and may in the future result, a lack of liquidity in parts of the debt capital markets, significant write-offs in the financial services sector and the repricing of credit risk. These conditions may reoccur for a prolonged period of time again or materially worsen in the future, including as a result of further downgrades to the U.S. government’s sovereign credit rating or the perceived credit worthiness of the United States or other large global economies. Unfavorable economic conditions, including future recessions, also could increase our funding costs, limit our access to the capital markets or result in a decision by lenders not to extend credit to us. We may in the future have difficulty accessing debt and equity capital on attractive terms, or at all, and a severe disruption and instability in the global financial markets or deteriorations in credit and financing conditions may cause us to reduce the volume of loans we originate and/or fund, adversely affect the value of our portfolio investments or otherwise have a material adverse effect on our business, financial condition, results of operations and cash flows.
We may experience fluctuations in our quarterly operating results.
We could experience fluctuations in our quarterly operating results due to a number of factors, including our ability or inability to make investments in companies that meet our investment criteria, the interest rate payable on the debt securities we acquire, the default rate on such securities, the level of our expenses, variations in and the timing of the recognition of realized and unrealized gains or losses, the degree to which we encounter competition in our markets and general economic conditions. As a result of these factors, results for any period should not be relied upon as being indicative of performance in future periods.
We will be subject to corporate-level U.S. federal income tax if we are unable to maintain qualification as a RIC under Subchapter M of the Code.
We have elected to be treated as a RIC under Subchapter M of the Code; however, no assurance can be given that we will be able to maintain our RIC status. To maintain our status as a RIC under Subchapter M of the Code and to avoid the imposition of U.S. federal income taxes on income and gains distributed to our
- 39 -
Table of Contents
stockholders, we must meet certain requirements, including source-of-income, asset diversification and annual distribution requirements. The source-of-income requirement will be satisfied if we derive at least 90.0% of our gross income for each year from dividends, interest, gains from sale of securities or similar sources. To maintain our status as a RIC, we must also meet certain asset diversification requirements at the end of each calendar quarter. Failure to meet these requirements may result in our losing our RIC status or our having to dispose of certain investments quickly in order to prevent the loss of RIC status. Because most of our investments will be in private or thinly traded public companies, any such dispositions could be made at disadvantageous prices and may result in substantial losses. The annual distribution requirement applicable to RICs will be satisfied if we distribute at least 90.0% of our net ordinary income and net short-term capital gains in excess of net long-term capital losses, if any, to our stockholders on an annual basis. In addition, we will be subject to a 4.0% nondeductible federal excise tax to the extent that we do not satisfy certain additional minimum distribution requirements on a calendar-year basis. We will be subject, to the extent we use debt financing, to certain asset coverage ratio requirements under the 1940 Act and financial covenants under loan and credit agreements that could, under certain circumstances, restrict us from making annual distributions necessary to maintain our status as a RIC. If we are unable to obtain cash from other sources, we may fail to maintain our status as a RIC and, thus, may be subject to U.S. federal corporate income tax on our entire taxable income without regard to any distributions made by us. If we fail to maintain our status as a RIC for any reason and become subject to U.S. corporate income tax, the resulting tax liability could substantially reduce our net assets, the amount of income available for distributions to stockholders and the amount of our distributions and the amount of funds available for new investments. Such a failure would have a material adverse effect on us and our stockholders.
We may not be able to pay you distributions, our distributions may not grow over time, a portion of distributions paid to you may be a return of capital, and investors in our debt securities may not receive all of the interest income to which they are entitled.
We intend to pay quarterly distributions to our stockholders out of assets legally available for distribution. We cannot assure you that we will achieve investment results that will allow us to make a specified level of cash distributions or year-to-year increases in cash distributions. Our ability to pay distributions might be harmed by, among other things, the risk factors described in this annual report on Form 10-K. In addition, the inability to satisfy the asset coverage test applicable to us as a BDC could, in the future, limit our ability to pay distributions. All distributions will be paid at the discretion of our board of directors and will depend on our earnings, our financial condition, maintenance of our RIC status, compliance with applicable BDC regulations, SBA regulations, state corporate laws affecting the distribution of corporate assets and such other factors as our board of directors may deem relevant from time to time. We cannot assure you that we will pay distributions to our stockholders in the future.
If we issue debt securities in the future, the above-referenced restrictions on distributions may also inhibit our ability to make required interest payments to holders of any such debt securities, which may cause a default under the terms of our then-existing debt agreements. Such a default could materially increase our cost of raising capital, as well as cause us to incur penalties under the terms of our then-existing debt agreements.
When we make quarterly distributions, we will be required to determine the extent to which such distributions are paid out of current and accumulated earnings and profits, recognized capital gain or capital. To the extent there is a return of capital, investors will be required to reduce their basis in our stock for U.S. federal income tax purposes.
We may have difficulty paying our required distributions if we recognize income before, or without, receiving cash representing such income.
For U.S. federal income tax purposes, we are required to include in our income certain amounts that we have not yet received in cash, such as original issue discount, which may arise if we receive warrants in connection with the making of a loan or in other circumstances, and contracted payment-in-kind interest, which
- 40 -
Table of Contents
represents contractual interest added to the loan balance and due at the end of the loan term. Such original issue discount, or increases in loan balances as a result of contracted payment-in-kind arrangements, will be included in our income before we receive any corresponding cash payments. We also may be required to include in our income certain other amounts that we will not receive in cash.
Since in certain cases we may be required to recognize income before or without receiving cash representing such income, we may have difficulty meeting the requirement to distribute on an annual basis at least 90.0% of our net ordinary income and net short-term capital gains in excess of net long-term capital losses, if any, to maintain our status as a RIC. In such a case, we may have to sell some of our investments at times and/or at prices we would not consider advantageous, raise additional debt or equity capital or forgo new investment opportunities to satisfy the annual distribution requirements. In such circumstances, if we are unable to obtain such cash from other sources, we may fail to maintain our status as a RIC and thus be subject to corporate-level U.S. federal income tax. See “We will be subject to corporate-level U.S. federal income tax if we are unable to maintain our qualification as a RIC under Subchapter M of the Code.”
If a portfolio company defaults on a loan that is structured to provide accrued interest, it is possible that accrued interest previously used in the calculation of the incentive fee will become uncollectible. Our investment advisor will not be under any obligation to reimburse us for any part of the incentive fee it received that was based on accrued income that we never receive as a result of a default by an entity on the obligation that resulted in the accrual of such income. That part of the incentive fee payable by us that relates to our net investment income will be computed and paid on income that may include interest that has been accrued but not yet received in cash, such as market discount, debt instruments with payment-in-kind interest, preferred stock with payment-in-kind dividends and zero coupon securities.
You may have a current tax liability on distributions you elect to reinvest in our common stock but would not receive cash to pay such tax liability.
If you participate in our dividend reinvestment plan, you will be deemed to have received, and for U.S. federal income tax purposes will be taxed on, the amount reinvested in our common stock to the extent the amount reinvested was not a tax-free return of capital. As a result, unless you are a tax-exempt entity, you may have to use funds from other sources to pay your tax liability on the value of our common stock received as a result of the distribution.
Because we expect to distribute substantially all of our net investment income and net realized capital gains to our stockholders, we will need additional capital to finance our growth, and such capital may not be available on favorable terms or at all.
We have elected to be taxed for U.S. federal income tax purposes as a RIC under Subchapter M of the Code. If we continue to meet certain requirements, including source-of-income, asset diversification and distribution requirements, and if we continue to be regulated as a BDC, we will continue to qualify to be taxed as a RIC and therefore will not have to pay U.S. federal corporate income tax on income that we timely distribute to our stockholders, allowing us to substantially reduce or eliminate our corporate-level income tax liability. As a BDC, we are generally required to meet a coverage ratio of total assets to total senior securities, which includes all of our borrowings (other than SBA leverage) and any preferred stock we may issue in the future, of at least 200.0% at the time we issue any debt or preferred stock. This requirement limits the amount of our leverage. Because we will continue to need capital to grow our investment portfolio, this limitation may prevent us from incurring debt or issuing preferred stock and require us to raise additional equity at a time when it may be disadvantageous to do so.
While we expect to be able to borrow and to issue additional debt and equity securities, we cannot assure you that debt and equity financing will be available to us on favorable terms, or at all. If additional funds are not available to us, we could be forced to curtail or cease new investment activities, and our net asset value could
- 41 -
Table of Contents
decline. In addition, as a BDC, we generally are not permitted to issue equity securities priced below net asset value without stockholder approval. At our Annual Stockholders Meeting on June 3, 2015, our stockholders voted to allow us to issue common stock at a price below net asset value per share for a period of one year ending on the earlier of June 3, 2016 or the date of our 2016 Annual Meeting of Stockholders. We expect to present to our stockholders a similar proposal at our 2016 Annual Meeting of Stockholders. The maximum number of shares issuable below net asset value pursuant to the authority granted by our stockholders that could result in such dilution is limited to 25.0% of FIC’s then outstanding common stock immediately prior to each such sale. We do not intend to issue shares of our common stock below net asset value unless our board of directors determines that it would be in our stockholders’ best interests to do so.
Our board of directors may change our investment objective, operating policies and strategies without prior notice or stockholder approval, the effects of which may be adverse.
Our board of directors has the authority, except as otherwise provided by the 1940 Act, to modify or waive certain of our operating policies and strategies without prior notice and without stockholder approval. Under Maryland law, we also cannot be dissolved without prior stockholder approval except by judicial action. In addition, upon approval of a majority of our stockholders, we may elect to withdraw our status as a BDC. If we, or Fund I, decide to withdraw our election, or if we otherwise fail to maintain our qualification, as a BDC, we may be subject to the substantially greater regulation under the 1940 Act as a closed-end investment company. Compliance with such regulations would significantly decrease our operating flexibility, and could significantly increase our costs of doing business. We cannot predict the effect any changes to our current operating policies and strategies would have on our business, operating results or the value of our common stock. Nevertheless, any such changes could adversely affect our business and impair our ability to make distributions.
Any failure on our part to maintain our status as a BDC would reduce our operating flexibility.
If we, or Fund I, fail to maintain our status as a BDC, we might be regulated as a closed-end investment company under the 1940 Act, which would subject us to substantially more onerous regulatory restrictions under the 1940 Act and correspondingly decrease our operating flexibility.
Regulations governing our operation as a BDC affect our ability to raise, and the way in which we raise, additional capital which may have a negative effect on our growth.
Our business will require capital to operate and grow. We may acquire such additional capital from the following sources:
Senior Securities. Currently we, through the Funds, issue debt securities guaranteed by the SBA and have access to funds under a revolving credit facility. In the future, we may issue debt securities or preferred stock and/or borrow money from banks or other financial institutions, which we refer to collectively as senior securities. As a result of issuing senior securities, we will be exposed to additional risks, including, but not limited to, the following:
| • | Under the provisions of the 1940 Act, we are permitted, as a BDC, to issue senior securities only in amounts such that our asset coverage, as defined in the 1940 Act, equals at least 200.0% after each issuance of senior securities. If the value of our assets declines, we may be unable to satisfy this test. If that happens, we may be required to sell a portion of our investments and, depending on the nature of our leverage, repay a portion of our debt at a time when such sales and/or repayments may be disadvantageous. Further, we may not be permitted to declare or make any distribution to stockholders or repurchase shares until such time as we satisfy this test. |
| • | Any amounts that we use to service our debt or make payments on preferred stock will not be available for distributions to our common stockholders. |
- 42 -
Table of Contents
| • | It is likely that any senior securities or other indebtedness we issue will be governed by an indenture or other instrument containing covenants restricting our operating flexibility. Additionally, some of these securities or other indebtedness may be rated by rating agencies, and in obtaining a rating for such securities and other indebtedness, we may be required to abide by operating and investment guidelines that further restrict operating and financial flexibility. |
| • | We and, indirectly, our stockholders will bear the cost of issuing and servicing such securities and other indebtedness. |
| • | Preferred stock or any convertible or exchangeable securities that we issue in the future may have rights, preferences and privileges more favorable than those of our common stock, including separate voting rights and could delay or prevent a transaction or a change in control to the detriment of the holders of our common stock. |
Additional Common Stock. Under the provisions of the 1940 Act, we are not generally able to issue and sell our common stock at a price below net asset value per share. We may, however, sell our common stock, warrants, options or rights to acquire our common stock, at a price below the current net asset value of the common stock if our board of directors determines that such sale is in the best interests of our stockholders, and our stockholders approve such sale. At our Annual Stockholders Meeting on June 3, 2015, our stockholders voted to allow us to issue common stock at a price below net asset value per share for a period of one year ending on the earlier of June 3, 2016 or the date of our 2016 Annual Meeting of Stockholders. We expect to present to our stockholders a similar proposal at our 2016 Annual Meeting of Stockholders. The maximum number of shares issuable below net asset value pursuant to the authority granted by our stockholders that could result in such dilution is limited to 25.0% of FIC’s then outstanding common stock immediately prior to each such sale. We do not intend to sell or otherwise issue shares of our common stock below net asset value unless our board of directors determines that it would be in our stockholders’ best interests to do so. In any such case, however, the price at which our common stock is to be issued and sold may not be less than a price which, in the determination of our board of directors, closely approximates the market value of such securities (less any distributing commission or discount). We may also make rights offerings to our stockholders at prices per share less than the net asset value per share, subject to applicable requirements of the 1940 Act. If we raise additional funds by issuing more common stock or senior securities convertible into, or exchangeable for, our common stock, the percentage ownership of our stockholders at that time would decrease, and they may experience dilution. Moreover, we can offer no assurance that we will be able to issue and sell additional equity securities in the future, on favorable terms or at all.
Changes in laws or regulations governing our operations may adversely affect our business or cause us to alter our business strategy.
We are subject to regulation at the local, state and federal level. New legislation may be enacted or new interpretations, rulings or regulations could be adopted, including those governing the types of investments we are permitted to make, any of which could harm us and our stockholders, potentially with retroactive effect. In addition, any change to the SBA’s current debenture program could have a significant impact on our ability to obtain low-cost leverage and, therefore, our competitive advantage over other funds.
Additionally, any changes to the laws and regulations governing our operations related to permitted investments may cause us to alter our investment strategy in order to meet our investment objectives. Such changes could result in material differences to the strategies and plans set forth in this Annual Report and may shift our investment focus from the areas of expertise of our investment advisor to other types of investments in which our investment advisor may have little or no expertise or experience. Any such changes, if they occur, could have a material adverse effect on our results of operations and the value of your investment.
- 43 -
Table of Contents
The impact of financial reform legislation on us remains uncertain.
In light of the global financial crisis and resulting conditions in the U.S. and global financial markets and the U.S. and global economy, legislators, the presidential administration and regulators increased their focus on the regulation of the financial services industry. In July 2010, the Dodd-Frank Wall Street Reform and Consumer Protection Act (the “Dodd-Frank Act”) was enacted, instituting a wide range of reforms that impact all financial institutions. Many of the requirements called for in the Dodd-Frank Act are subject to implementation regulations, some of which will continue to be implemented over the course of the next several years. Given the continuing uncertainty associated with the manner in which the provisions of the Dodd-Frank Act will be implemented by the various regulatory agencies, the full impact new regulatory requirements will have on our business, results of operations or financial condition remains unclear. The changes resulting from the Dodd-Frank Act have, and may continue to, require us to invest significant management attention and resources to evaluate and make necessary changes in order to comply with new statutory and regulatory requirements. Failure to comply with any such laws, regulations or principles, or changes thereto, may negatively impact our business, results of operations and financial condition. While we cannot predict what effect the on-going changes in the laws or regulations implemented as a result of the Dodd-Frank Act, or the interpretations of such changes may have on us, these changes could be materially adverse to us and our stockholders.
Our ability to enter into and exit investment transactions with our affiliates will be restricted.
Except in those instances where we have received prior exemptive relief from the SEC, we will be prohibited under the 1940 Act from knowingly participating in certain transactions with our affiliates without the prior approval of our Independent Directors. We, our investment advisor, the Funds, and Fidus Credit Opportunities, LLC have applied for exemptive relief from the SEC under the 1940 Act, which, if granted, will permit us to co-invest with other funds managed by our investment advisor or its affiliates in a manner consistent with our investment objective, positions, policies, strategies and restrictions as well as regulatory requirements and other pertinent factors. There can be no assurance that any such exemptive order will be obtained. In addition, any person that owns, directly or indirectly, 5.0% or more of our outstanding voting securities is deemed our affiliate for purposes of the 1940 Act and we are generally prohibited from buying or selling any security from or to such affiliate, absent the prior approval of our Independent Directors. The 1940 Act also prohibits “joint” transactions with an affiliate, which could include investments in the same portfolio company (whether at the same or different times), without prior approval of our Independent Directors. If a person acquires more than 25.0% of our voting securities, we will be prohibited from buying or selling any security from or to such person, or entering into joint transactions with such person, absent the prior approval of the SEC. These restrictions could limit or prohibit us from making certain attractive investments that we might otherwise make absent such restrictions.
Our investment advisor can resign on 60 days’ notice, and we may not be able to find a suitable replacement within that time, resulting in a disruption in our operations that could adversely affect our financial condition, business and results of operations.
Our investment advisor has the right, under the Investment Advisory Agreement, to resign at any time upon not less than 60 days’ written notice, whether we have found a replacement or not. If our investment advisor resigns, we may not be able to find a new investment advisor or hire internal management with similar expertise and ability to provide the same or equivalent services on acceptable terms within 60 days, or at all. If we are unable to do so quickly, our operations are likely to experience a disruption, our financial condition, business and results of operations as well as our ability to pay distributions are likely to be adversely affected and the market price of our shares may decline. In addition, investment activities are likely to suffer if we are unable to identify and reach an agreement with a single institution or group of executives having the expertise possessed by our investment advisor and its affiliates. Even if we are able to retain comparable management, whether internal or external, the integration of such management and their lack of familiarity with our investment objective may result in additional costs and time delays that may adversely affect our financial condition, business and results of operations.
- 44 -
Table of Contents
Our investment advisor can resign from its role as our administrator under the Administration Agreement, and we may not be able to find a suitable replacement, resulting in a disruption in our operations that could adversely affect our financial condition, business and results of operations.
Our investment advisor also has the right to resign under the Administration Agreement, whether we have found a replacement or not. If our investment advisor resigns as our administrator, we may not be able to find a new administrator or hire internal management with similar expertise and ability to provide the same or equivalent services on acceptable terms, or at all. If we are unable to do so quickly, our operations are likely to experience a disruption, our financial condition, business and results of operations as well as our ability to pay distributions are likely to be adversely affected and the market price of our shares may decline. In addition, administrative activities are likely to suffer if we are unable to identify and reach an agreement with a service provider or individuals with the expertise possessed by our investment advisor. Even if we are able to retain a comparable service provider or individuals to perform such services, whether internal or external, their integration into our business and lack of familiarity with our investment objective may result in additional costs and time delays that may adversely affect our financial condition, business and results of operations.
Efforts to comply with the Sarbanes-Oxley Act will involve significant expenditures, and non-compliance with the Sarbanes-Oxley Act may adversely affect us and the market price of our common stock.
As a publicly-traded company, we incur legal, accounting and other expenses, including costs associated with the periodic reporting requirements applicable to a company whose securities are registered under the Exchange Act, as well as additional corporate governance requirements, including requirements under the Sarbanes-Oxley Act and other rules implemented by the SEC.
Section 404 of the Sarbanes-Oxley Act requires that public companies evaluate and report on their systems of internal control over financial reporting. In addition, our independent registered public accounting firm must report on management’s evaluation of those controls. In future periods, we may identify deficiencies in our system of internal controls over financial reporting that may require remediation. There can be no assurances that any such future deficiencies identified may not be material weaknesses that would be required to be reported in future periods.
We are dependent on information systems and systems failures could significantly disrupt our business, which may, in turn, negatively affect the market price of our common stock and our ability to pay dividends.
Our business is dependent on our and third parties’ communications and information systems. Any failure or interruption of those systems, including as a result of the termination of an agreement with any third-party service providers, could cause delays or other problems in our activities. Our financial, accounting, data processing, backup or other operating systems and facilities may fail to operate properly or become disabled or damaged as a result of a number of factors including events that are wholly or partially beyond our control and adversely affect our business. There could be:
| • | sudden electrical or telecommunications outages; |
| • | natural disasters such as earthquakes, tornadoes and hurricanes; |
| • | disease pandemics; |
| • | events arising from local or larger scale political or social matters, including terrorist acts; and |
| • | cyber-attacks. |
These events, in turn, could have a material adverse effect on our operating results and negatively affect the market price of our common stock and our ability to pay dividends to our stockholders.
- 45 -
Table of Contents
The failure in cyber security systems, as well as the occurrence of events unanticipated in our disaster recovery systems and management continuity planning could impair our ability to conduct business effectively.
The occurrence of a disaster such as a cyber-attack, a natural catastrophe, an industrial accident, a terrorist attack or war, events unanticipated in our disaster recovery systems, or a support failure from external providers, could have an adverse effect on our ability to conduct business and on our results of operations and financial condition, particularly if those events affect our computer-based data processing, transmission, storage, and retrieval systems or destroy data. If a significant number of our managers were unavailable in the event of a disaster, our ability to effectively conduct our business could be severely compromised.
We depend heavily upon computer systems to perform necessary business functions. Despite our implementation of a variety of security measures, our computer systems could be subject to cyber-attacks and unauthorized access, such as physical and electronic break-ins or unauthorized tampering. Like other companies, we may experience threats to our data and systems, including malware and computer virus attacks, unauthorized access, system failures and disruptions. If one or more of these events occurs, it could potentially jeopardize the confidential, proprietary and other information processed and stored in, and transmitted through, our computer systems and networks, or otherwise cause interruptions or malfunctions in our operations, which could result in damage to our reputation, financial losses, litigation, increased costs, regulatory penalties and/or customer dissatisfaction or loss.
Risks Relating to Our Investments
Economic recessions or downturns could impair our portfolio companies and harm our operating results.
Many of our portfolio companies are susceptible to economic slowdowns or recessions (including industry specific downturns, such as that currently being experienced by the oil and gas industry) and may be unable to repay our loans during these periods. Therefore, our non-performing assets are likely to increase and the value of our portfolio is likely to decrease during these periods. Adverse economic conditions may decrease the value of collateral securing some of our loans and the value of our equity investments. Economic slowdowns or recessions could lead to financial losses in our portfolio and a decrease in revenues, net income and assets. Unfavorable economic conditions also could increase our funding costs, limit our access to the capital markets or result in a decision by lenders not to extend credit to us. These events could prevent us from increasing our investments and harm our operating results.
Our investments in certain industry sectors, such as the energy sector, may be subject to significant political, economic and capacity risks that may increase the possibility that we lose all or a part of our investment.
The revenues and profitability of certain portfolio companies may be significantly affected by the future prices of and the demand for oil, natural gas liquids and natural gas, which are inherently uncertain. Investments in energy companies may have significant shortfalls in projected cash flow if prices decline from levels projected at the time the investment is made. Various factors beyond our control could affect energy prices, including worldwide supplies, political instability or armed conflicts in oil, natural gas liquids and natural gas producing regions, the price of foreign imports, the level of consumer demand, the price and availability of alternative fuels, capacity constraints and changes in existing government regulation, taxation and price controls. Energy prices have fluctuated greatly during the past, and energy markets continue to be volatile.
Changes in healthcare laws and other regulations applicable to some of our portfolio companies’ businesses may constrain their ability to offer their products and services.
Changes in healthcare or other laws and regulations applicable to the businesses of some of our portfolio companies may occur that could increase their compliance and other costs of doing business, require significant systems enhancements, or render their products or services less profitable or obsolete, any of which could have a
- 46 -
Table of Contents
material adverse effect on their results of operations. There has also been an increased political and regulatory focus on healthcare laws in recent years, and new legislation could have a material effect on the business and operations of some of our portfolio companies.
Our investments in portfolio companies may be risky, and we could lose all or part of our investment.
Investing in lower middle-market companies involves a number of significant risks. Among other things, these companies:
| • | may have limited financial resources and may be unable to meet their obligations under their debt instruments that we hold, which may be accompanied by a deterioration in the value of any collateral and a reduction in the likelihood of us realizing any guarantees from subsidiaries or affiliates of portfolio companies that we may have obtained in connection with our investment; |
| • | may have shorter operating histories, narrower product lines and smaller market shares, which tend to render them more vulnerable to competitors’ actions and market conditions, as well as general economic downturns, than larger businesses; |
| • | are more likely to depend on the management talents and efforts of a small group of persons; therefore, the death, disability, resignation or termination of one or more of these persons could have a material adverse impact on our portfolio company and, in turn, on us; |
| • | generally have less predictable operating results, may from time to time be parties to litigation, may be engaged in rapidly changing businesses with products subject to a substantial risk of obsolescence, and may require substantial additional capital to support their operations, finance expansion or maintain their competitive position; and |
| • | generally have less publicly available information about their businesses, operations and financial condition. If we are unable to uncover all material information about these companies, we may not make a fully informed investment decision, and may lose all or part of our investment. |
In addition, in the course of providing significant managerial assistance to certain portfolio companies, certain of our management and directors may serve as directors on the boards of such companies. To the extent that litigation arises out of investments in these portfolio companies, our management and directors may be named as defendants in such litigation, which could result in an expenditure of funds (through our indemnification of such officers and directors) and the diversion of management time and resources.
The lack of liquidity in our investments may adversely affect our business.
All of our assets may be invested in illiquid securities, and a substantial portion of our investments in leveraged companies will be subject to legal and other restrictions on resale or will otherwise be less liquid than more broadly traded public securities. The illiquidity of these investments may make it difficult for us to sell such investments when desired. In addition, if we are required to liquidate all or a portion of our portfolio quickly, we may realize significantly less than the value at which we have previously recorded these investments. As a result, we do not expect to achieve liquidity in our investments in the near-term. However, to maintain the elections to be regulated as a BDC and as a RIC, we may have to dispose of investments if they do not satisfy one or more of the applicable criteria under the respective regulatory frameworks. We may also face other restrictions on our ability to liquidate an investment in a portfolio company to the extent that we or our investment advisor have material nonpublic information regarding such portfolio company.
We may not have the funds to make additional investments in our portfolio companies which could impair the value of our portfolio.
After our initial investment in a portfolio company, we may be called upon from time to time to provide additional funds to such company or have the opportunity to increase our investment through the exercise of a
- 47 -
Table of Contents
warrant to purchase common stock. There is no assurance that we will make, or will have sufficient funds to make, follow-on investments. Any decisions not to make a follow-on investment or any inability on our part to make such an investment may have a negative impact on a portfolio company in need of such an investment, may result in a missed opportunity for us to increase our participation in a successful operation or may reduce the expected yield on the investment. Even if we have sufficient capital to make a desired follow-on investment, we may elect not to make a follow-on investment because we may not want to increase our level of risk, because we prefer other opportunities or because we are inhibited by compliance with BDC requirements or the desire to maintain our RIC status. Our ability to make follow-on investments may also be limited by our investment advisor’s allocation policy.
Portfolio companies may incur debt that ranks equally with, or senior to, our investments in such companies.
We will invest primarily in mezzanine debt as well as equity issued by lower middle-market companies. The portfolio companies may have, or may be permitted to incur, other debt that ranks equally with, or senior to, the debt in which we invest. By their terms, such senior debt instruments may entitle the holders to receive payment of interest or principal on or before the dates on which we are entitled to receive payments with respect to the mezzanine debt instruments in which we invest. Also, in the event of insolvency, liquidation, dissolution, reorganization or bankruptcy of a portfolio company, holders of debt instruments ranking senior to our investment in that portfolio company would typically be entitled to receive payment in full before we receive any distribution. After repaying such senior creditors, such portfolio company may not have any remaining assets to use for repaying its obligation to us. In the case of debt ranking equally with debt instruments in which we invest, we would have to share on an equal basis any distributions with other creditors holding such debt in the event of an insolvency, liquidation, dissolution, reorganization or bankruptcy of the relevant portfolio company.
There may be circumstances where our debt investments could be subordinated to claims of other creditors or could be subject to lender liability claims.
Even though we may have structured certain of our investments as senior loans, if one of our portfolio companies were to go bankrupt, depending on the facts and circumstances, including the extent to which we actually provided managerial assistance to that portfolio company, a bankruptcy court might recharacterize our debt investment and subordinate all or a portion of our claim to that of other creditors. We may also be subject to lender liability claims for actions taken by us with respect to a borrower’s business or instances where we exercise control over the borrower. It is possible that we could become subject to a lender’s liability claim, including as a result of actions taken in rendering significant managerial assistance.
Second priority liens on collateral securing loans that we make to our portfolio companies may be subject to control by senior creditors with first priority liens. If there is a default, the value of the collateral may not be sufficient to repay in full both the first priority creditors and us.
Certain loans we make to portfolio companies are and will be secured on a second priority basis by the same collateral securing senior secured debt of such companies. The first priority liens on the collateral secure the portfolio company’s obligations under any outstanding senior debt and may secure certain other future debt that may be permitted to be incurred by the company under the agreements governing the loans. The holders of obligations secured by the first priority liens on the collateral will generally control the liquidation of and be entitled to receive proceeds from any realization of the collateral to repay their obligations in full before us. In addition, the value of the collateral in the event of liquidation will depend on market and economic conditions, the availability of buyers and other factors. There can be no assurance that the proceeds, if any, from the sale or sales of all of the collateral would be sufficient to satisfy the loan obligations secured by the second priority liens after payment in full of all obligations secured by the first priority liens on the collateral. If such proceeds are not sufficient to repay amounts outstanding under the loan obligations secured by the second priority liens, then we, to the extent not repaid from the proceeds of the sale of the collateral, will only have an unsecured claim against the company’s remaining assets, if any.
- 48 -
Table of Contents
The rights we may have with respect to the collateral securing the loans we make to portfolio companies with senior debt outstanding may also be limited pursuant to the terms of one or more intercreditor agreements entered into with the holders of senior debt. Under an intercreditor agreement, at any time that obligations having the benefit of the first priority liens are outstanding, any of the following actions that may be taken in respect to the collateral will be at the direction of the holders of the obligations secured by the first priority liens:
| • | the ability to cause the commencement of enforcement proceedings against the collateral; |
| • | the ability to control the conduct of such proceedings; |
| • | the approval of amendments to collateral documents; |
| • | releases of liens on the collateral; and |
| • | waivers of past defaults under collateral documents. |
We may not have the ability to control or direct such actions, even if our rights are adversely affected.
We may hold the debt securities of leveraged companies that may, due to the significant volatility of such companies, enter into bankruptcy proceedings.
Leveraged companies may experience bankruptcy or similar financial distress. The bankruptcy process has a number of significant inherent risks. Many events in a bankruptcy proceeding are the product of contested matters and adversary proceedings and are beyond the control of the creditors. A bankruptcy filing by an issuer may adversely and permanently affect the issuer. If the proceeding is converted to a liquidation, the value of the issuer may not equal the liquidation value that was believed to exist at the time of the investment. The duration of a bankruptcy proceeding is also difficult to predict, and a creditor’s return on investment can be adversely affected by delays until the plan of reorganization or liquidation ultimately becomes effective. The administrative costs in connection with a bankruptcy proceeding are frequently high and would be paid out of the debtor’s estate prior to any return to creditors. Because the standards for classification of claims under bankruptcy law are vague, our influence with respect to the class of securities or other obligations we own may be lost by increases in the number and amount of claims in the same class or by different classification and treatment. In the early stages of the bankruptcy process, it is often difficult to estimate the extent of, or even to identify, any contingent claims that might be made. In addition, certain claims that have priority by law (for example, claims for taxes) may be substantial.
Any unrealized depreciation we experience on our investment portfolio may be an indication of future realized losses, which could reduce our income available for distribution.
As a BDC, we are required to carry our investments at market value or, if no market value is ascertainable, at the fair value as determined in good faith by our board of directors. Decreases in the market values or fair values of our investments will be recorded as unrealized depreciation. Any unrealized depreciation in our investment portfolio could be an indication of a portfolio company’s inability to meet its repayment obligations to us with respect to the affected investments. This could result in realized losses in the future and ultimately in reductions of our income available for distribution in future periods.
Defaults by our portfolio companies will harm our operating results.
A portfolio company’s failure to satisfy financial or operating covenants imposed by us or other lenders could lead to defaults and, potentially, termination of its loans and foreclosure on its assets. This could trigger cross-defaults under other agreements and jeopardize the portfolio company’s ability to meet its obligations under the debt or equity securities that we hold. We may incur expenses to the extent necessary to seek recovery upon default or to negotiate new terms, which may include the waiver of certain financial covenants, with a defaulting portfolio company.
- 49 -
Table of Contents
We do not expect to control many of our portfolio companies.
We do not expect to control many of our portfolio companies, even though we may have board representation or board observation rights, and the debt agreements may contain certain restrictive covenants. As a result, we are subject to the risk that a portfolio company in which we invest may make business decisions with which we disagree and the management of such company, as representatives of the holders of the company’s common equity, may take risks or otherwise act in ways that do not serve our interests as debt investors. Due to the lack of liquidity for our investments in private companies in the lower middle-market, we may not be able to dispose of our interests in our portfolio companies as readily as we would like or at an appropriate valuation. As a result, a portfolio company may make decisions that could decrease the value of our portfolio holdings.
We are a non-diversified investment company within the meaning of the 1940 Act; therefore we are not limited with respect to the proportion of our assets that may be invested in securities of a single issuer.
We are classified as a non-diversified investment company within the meaning of the 1940 Act, which means that we are not limited by the 1940 Act with respect to the proportion of our assets that we may invest in securities of a single issuer. To the extent that we assume large positions in the securities of a small number of issuers, our net asset value may fluctuate to a greater extent than that of a diversified investment company as a result of changes in the financial condition or the market’s assessment of the issuer and the aggregate returns we realize may be significantly adversely affected if a small number of investments perform poorly or if we need to write down the value of any one investment. Additionally, while we are not targeting any specific industries, our investments may be concentrated in relatively few industries. As a result, a downturn in any particular industry in which we are invested could also significantly impact the aggregate returns we realize. We may also be more susceptible to any single economic or regulatory occurrence than a diversified investment company. Beyond the asset diversification requirements applicable to RICs, we do not have fixed guidelines for diversification, and our investments could be concentrated in relatively few portfolio companies.
Prepayments of our debt investments by our portfolio companies could adversely impact our results of operations and reduce our return on equity.
We are subject to the risk that the investments we make in our portfolio companies may be repaid prior to maturity. When this occurs, we will generally reinvest these proceeds in temporary investments, pending future investments in new portfolio companies. These temporary investments will typically have substantially lower yields than the debt being repaid, and we could experience significant delays in reinvesting these amounts. In addition, any future investment of such amounts in a new portfolio company may also be at lower yields than the investment that was repaid. As a result, our results of operations could be materially adversely affected if one or more of our portfolio companies elects to prepay amounts owed to us. Additionally, prepayments could negatively impact our return on equity, which could result in a decline in the market price of our common stock.
We may not realize gains from our equity investments.
Certain investments that we have made in the past and may make in the future include warrants or other equity or equity-related securities. In addition, we may from time to time make non-control, equity co-investments in portfolio companies. Our goal is to realize gains upon our disposition of such equity interests. However, the equity interests we receive may not appreciate in value and, in fact, may decline in value. We also may be unable to realize any value if a portfolio company does not have a liquidity event, such as a sale of the business, recapitalization or public offering, which would allow us to sell the underlying equity interests. We often seek puts or similar rights to give us the right to sell our equity securities back to the portfolio company issuer. We may be unable to exercise these put rights for the consideration provided in our investment documents if the issuer is in financial distress. Accordingly, we may not be able to realize gains from our equity interests, and any gains that we do realize on the disposition of any equity interests may not be sufficient to offset any other losses we experience.
- 50 -
Table of Contents
If our primary investments are deemed not to be qualifying assets, we could be precluded from investing in our desired manner or deemed to be in violation of the 1940 Act.
In order to maintain our status as a BDC, we may not acquire any assets other than “qualifying assets” unless, at the time of and after giving effect to such acquisition, at least 70.0% of our total assets are qualifying assets. We believe that most of the investments that we may acquire in the future will constitute qualifying assets. However, we may be precluded from investing in what we believe are attractive investments if such investments are not qualifying assets for purposes of the 1940 Act. If we do not invest a sufficient portion of our assets in qualifying assets, we could violate the 1940 Act provisions applicable to BDCs and be precluded from making follow-on investments in existing portfolio companies (which could result in the dilution of our position) or required to dispose of investments at inappropriate times in order to come into compliance with the 1940 Act. If we need to dispose of such investments quickly, it could be difficult to dispose of such investments on favorable terms. We may not be able to find a buyer for such investments and, even if we do find a buyer, we may have to sell the investments at a substantial loss. Any such outcomes would have a material adverse effect on our business, financial condition and results of operations.
The disposition of our investments may result in contingent liabilities.
A significant portion of our investments involve private securities and we expect that a significant portion of our investments will continue to involve private securities. In connection with the disposition of an investment in private securities, we may be required to make representations about the business and financial affairs of the portfolio company typical of those made in connection with the sale of a business. We may also be required to indemnify the purchasers of such investment to the extent that any such representations turn out to be inaccurate or with respect to potential liabilities. These arrangements may result in contingent liabilities that ultimately result in funding obligations that we must satisfy through its return of distributions previously made to it.
We may be unable to invest a significant portion of any net proceeds from an offering or from exiting an investment or other capital on acceptable terms, which could harm our financial condition and operating results.
We may be unable to invest the net proceeds of any offering or from exiting an investment or other sources of capital on acceptable terms within the time period that we anticipate or at all. Delays in investing such capital may cause our performance to be worse than that of fully invested BDCs or other lenders or investors pursuing comparable investment strategies.
Depending on market conditions and the amount of the capital involved, it may take us a substantial period of time to invest substantially all the capital in securities meeting our investment objective. During this period, we will invest such capital primarily in short-term securities consistent with our BDC election and our election to be taxed as a RIC, which may produce returns that are significantly lower than the returns which we expect to achieve when our portfolio is fully invested in longer-term investments in pursuit of our investment objective. Any distributions that we pay during such period may be substantially lower than the distributions that we may be able to pay when our portfolio is fully invested. In addition, until such time as the net proceeds of any offering or from exiting an investment or other sources capital are invested in new investments meeting our investment objective, the market price for our common stock may decline.
Our investment advisor’s liability is limited under the Investment Advisory Agreement, and we have agreed to indemnify our investment advisor against certain liabilities, which may lead our investment advisor to act in a riskier manner on our behalf than it would when acting for its own account.
Under the Investment Advisory Agreement, our investment advisor does not assume any responsibility to us other than to render the services called for under that agreement, and it is not responsible for any action of our board of directors in following or declining to follow our investment advisor’s advice or recommendations. Under the terms of the Investment Advisory Agreement, our investment advisor and its officers, directors,
- 51 -
Table of Contents
members, managers, partners, stockholders and employees are not liable to us, any subsidiary of ours, our directors, our stockholders or any subsidiary’s stockholders or partners for acts or omissions performed in accordance with and pursuant to the Investment Advisory Agreement, except those resulting from acts constituting gross negligence, willful misconduct, bad faith or reckless disregard of our investment advisor’s duties under the Investment Advisory Agreement. In addition, we have agreed to indemnify our investment advisor and its officers, directors, members, managers, partners, stockholders and employees from and against any claims or liabilities, including reasonable legal fees and other expenses reasonably incurred, arising out of or in connection with our business and operations or any action taken or omitted on our behalf pursuant to authority granted by the Investment Advisory Agreement, except where attributable to gross negligence, willful misconduct, bad faith or reckless disregard of such person’s duties under the Investment Advisory Agreement. These protections may lead our investment advisor to act in a riskier manner when acting on our behalf than it would when acting for its own account.
Risks Relating to Our Common Stock
Shares of closed-end investment companies, including business development companies, frequently trade at a discount to their net asset value.
Shares of closed-end investment companies, including BDCs, frequently trade at a discount from net asset value. This characteristic of closed-end investment companies and BDCs is separate and distinct from the risk that our net asset value per share may decline. We cannot predict whether our common stock will trade at, above or below net asset value. In addition, if our common stock trades below net asset value, we will generally not be able to issue additional common stock at the market price without first obtaining the approval of our stockholders and our Independent Directors. On June 3, 2015 our stockholders voted to allow us to sell or otherwise issue common stock at a price below net asset value per share for a period of one year ending on the earlier of June 3, 2016 or the date of our 2016 Annual Meeting of Stockholders. We expect to present to our stockholders a similar proposal at our 2016 Annual Meeting of Stockholders. Selling or otherwise issuing shares of FIC’s common stock below its then current net asset value per share would result in a dilution of FIC’s existing common stockholders. The maximum number of shares issuable below net asset value pursuant to the authority granted by our stockholders that could result in such dilution is limited to 25.0% of FIC’s then outstanding common stock immediately prior to each such sale. We do not intend to sell or otherwise issue shares of our common stock below net asset value unless our board of directors determines that it would be in our stockholders’ best interests to do so.
Stockholders may experience dilution in their ownership percentage if they do not participate in our dividend reinvestment plan.
All distributions declared in cash payable to stockholders that are participants in our dividend reinvestment plan are generally automatically reinvested in shares of our common stock. As a result, stockholders that do not participate in the dividend reinvestment plan may experience dilution over time. Stockholders who receive distributions in shares of common stock may experience accretion to the net asset value of their shares if our shares are trading at a premium and dilution if our shares are trading at a discount. The level of accretion or discount would depend on various factors, including the proportion of our stockholders who participate in the plan, the level of premium or discount at which our shares are trading and the amount of the distribution payable to a stockholder.
Market conditions may increase the risks associated with our business and an investment in us.
The current worldwide financial market situation may contribute to increased market volatility, may have long-term effects on the U.S. and worldwide financial markets and may cause economic uncertainties or deterioration in the U.S. and worldwide. These conditions raised the level of many of the risks described herein and, if repeated or continued, could have an adverse effect on our portfolio companies and on their results of operations, financial conditions, access to credit and capital. The stress in the credit market and upon banks has
- 52 -
Table of Contents
led other creditors to tighten credit and the terms of credit. In certain cases, senior lenders to our portfolio companies can block payments by our portfolio companies in respect of our loans to such portfolio companies. In turn, these could have adverse effects on our business, financial condition, results of operations, distributions to our stockholders, access to capital, valuation of our assets and our stock price. Notwithstanding recent gains across both the equity and debt markets, these conditions may continue for a prolonged period of time or worsen in the future.
If, in the future, we sell common stock at a discount to our net asset value per share, stockholders who do not participate in such sale will experience immediate dilution in an amount that may be material.
On June 3, 2015, our stockholders approved our ability to sell or otherwise issue shares of our common stock at a discount from net asset value per share, as long as the cumulative number of shares sold pursuant to such authority does not exceed 25.0% of our then outstanding common stock immediately prior to each such sale, for a period of one year ending on the earlier of June 3, 2016 or the date of our 2016 Annual Meeting of Stockholders. Our stockholders will be asked to vote on a similar proposal at our 2016 Annual Meeting of Stockholders. If we sell or otherwise issue shares of our common stock at a discount to net asset value, it will pose a risk of dilution to our stockholders. In particular, stockholders who do not purchase additional shares at or below the discounted price in proportion to their current ownership will experience an immediate decrease in net asset value per share (as well as in the aggregate net asset value of their shares if they do not participate at all). These stockholders will also experience a disproportionately greater decrease in their participation in our earnings and assets and their voting power than the increase we experience in our assets, potential earning power and voting interests from such issuances or sale. In addition, such issuances or sales may adversely affect the price at which our common stock trades. For additional information and hypothetical examples of these risks, see “Sales of Common Stock Below Net Asset Value,” and for actual dilution illustrations specific to an offering, see the prospectus supplement pursuant to which such sale is made.
Our net asset value may have changed significantly since our last valuation.
Our board of directors determines the fair value of our portfolio investments on a quarterly basis based on input from our investment advisor, our audit committee and, as to certain of our investments, a third party independent valuation firm. While the board of directors will review our net asset value per share in connection with any offering, it will not always have the benefit of input from the independent valuation firm when it does so. The fair value of various individual investments in our portfolio and/or the aggregate fair value of our investments may change significantly over time. If the fair value of our investment portfolio at December 31, 2016 is less than the fair value at the time of an offering during 2016, then we may record an unrealized loss on our investment portfolio and may report a lower net asset value per share than will be reflected in the Selected Consolidated Financial Data and the financial statements included in the prospectus supplement of that offering. If the fair value of our investment portfolio at December 31, 2016 is greater than the fair value at the time of an offering during 2016, we may record an unrealized gain on our investment portfolio and may report a greater net asset value per share than so reflected in the prospectus supplement of that offering. Upon publication of this information in connection with our announcement of operating results for our fiscal year ended December 31, 2016, the market price of our common stock may fluctuate materially, and may be substantially less than the price per share you pay for our common stock in an offering.
The market price of our securities may fluctuate significantly.
The market price and liquidity of the market for shares of our common stock may be significantly affected by numerous factors, some of which are beyond our control and may not be directly related to our operating performance. These factors include:
| • | significant volatility in the market price and trading volume of securities of BDCs or other companies in our sector, which is not necessarily related to the operating performance of these companies; |
- 53 -
Table of Contents
| • | exclusion of our common stock from certain market indices, such as the Russell 2000 Financial Services Index, could reduce the ability of certain institutional investors to own our common stock and could put short term pressure on our common stock; |
| • | changes in regulatory policies or tax guidelines, particularly with respect to RICs, BDCs or SBICs; |
| • | loss of RIC or BDC status; |
| • | loss of status as an SBIC for the Funds, or any other SBIC subsidiary we may form; |
| • | changes or perceived changes in earnings or variations in operating results; |
| • | changes or perceived changes in the value of our portfolio of investments; |
| • | changes in accounting guidelines governing valuation of our investments; |
| • | any shortfall in revenue or net income or any increase in losses from levels expected by investors or securities analysts; |
| • | departure of our investment advisor’s key personnel; |
| • | operating performance of companies comparable to us; |
| • | general economic trends and other external factors; and |
| • | loss of a major funding source. |
Investing in our securities may involve an above average degree of risk.
The investments we make in accordance with our investment objective may result in a higher amount of risk than alternative investment options and a higher risk of volatility or loss of principal. Our investments in portfolio companies may be highly speculative; therefore, an investment in our securities may not be suitable for someone with lower risk tolerance.
Sales of substantial amounts of our common stock may have an adverse effect on the market price of our common stock.
As of February 29, 2016, we had 16,300,732 shares of common stock outstanding. In August 2014, we entered into an equity distribution agreement with Raymond James & Associates, Inc. and Robert W. Baird & Co. Incorporated through which we could sell, by means of at-the-market offerings from time to time, shares of our common stock having an aggregate offering price of up to $50.0 million (the “ATM Program”). Sales of substantial amounts of our common stock, or the availability of shares for sale, could adversely affect the prevailing market price of our common stock. If this occurs and continues, it could impair our ability to raise additional capital through the sale of equity securities should we desire to do so.
If we issue preferred stock and/or debt securities, the net asset value and market value of our common stock may become more volatile.
We cannot assure you that the issuance of preferred stock and/or debt securities would result in a higher yield or return to the holders of our common stock. The issuance of preferred stock and/or debt securities would likely cause the net asset value and market value of our common stock to become more volatile. If the distribution rate on the preferred stock, or the interest rate on the debt securities, were to approach the net rate of return on our investment portfolio, the benefit of leverage to the holders of our common stock would be reduced. If the distribution rate on the preferred stock, or the interest rate on the debt securities, were to exceed the net rate of return on our portfolio, the use of leverage would result in a lower rate of return to the holders of common stock than if we had not issued the preferred stock and/or debt securities. Any decline in the net asset value of our investment would be borne entirely by the holders of our common stock. Therefore, if the market value of our portfolio were to decline, the leverage would result in a greater decrease in net asset value to the holders of our
- 54 -
Table of Contents
common stock than if we were not leveraged through the issuance of preferred stock and/or debt securities. This decline in net asset value would also tend to cause a greater decline in the market price for our common stock.
There is also a risk that, in the event of a sharp decline in the value of our net assets, we would be in danger of failing to maintain required asset coverage ratios which may be required by the preferred stock and/or debt securities or of a downgrade in the ratings of the preferred stock and/or debt securities or our current investment income might not be sufficient to meet the distribution requirements on the preferred stock or the interest payments on the debt securities. In order to counteract such an event, we might need to liquidate investments in order to fund redemption of some or all of the preferred stock and/or debt securities. In addition, we would pay (and the holders of our common stock would bear) all costs and expenses relating to the issuance and ongoing maintenance of the preferred stock and/or debt securities. Holders of preferred stock and/or debt securities may have different interests than holders of common stock and may at times have disproportionate influence over our affairs.
Provisions of the Maryland General Corporation Law and our charter and bylaws could deter takeover attempts and have an adverse effect on the price of our common stock.
The Maryland General Corporation Law contains provisions that may discourage, delay or make more difficult a change in control of us or the removal of our directors. In addition, our board of directors may, without stockholder action, authorize the issuance of shares of stock in one or more classes or series, including preferred stock. Our charter and bylaws contain provisions that limit liability and provide for indemnification of our directors and officers. These provisions and others also may have the effect of deterring hostile takeovers or delaying changes in control or management. We are generally prohibited from engaging in mergers and other business combinations with stockholders that beneficially own 10.0% or more of the voting power of our outstanding voting stock, or with their affiliates, for five years after the most recent date on which such stockholders became the beneficial owners of 10.0% or more of the voting power of our outstanding voting stock and thereafter unless our directors and stockholders approve the business combination in the prescribed manner. See “Description of Our Capital Stock—Business Combinations.” Maryland law may discourage third parties from trying to acquire control of us and increase the difficulty of consummating such an offer.
We have also adopted measures that may make it difficult for a third party to obtain control of us, including provisions of our charter authorizing our board of directors to classify or reclassify shares of our stock in one or more classes or series and to cause the issuance of additional shares of our stock, including preferred stock. In addition, we have adopted a classified board of directors. A classified board may render a change in control of us or removal of our incumbent management more difficult. These provisions, as well as other provisions of our charter and bylaws, may delay, defer or prevent a transaction or a change in control that might otherwise be in the best interests of our stockholders.
Our business and operation could be negatively affected if we become subject to any securities litigation or shareholder activism, which could cause us to incur significant expense, hinder execution of investment strategy and impact our stock price.
In the past, following periods of volatility in the market price of a company’s securities, securities class action litigation has often been brought against that company. Shareholder activism, which could take many forms or arise in a variety of situations, has been increasing in the BDC space recently. While we are currently not subject to any securities litigation or shareholder activism, due to the potential volatility of our stock price and for a variety of other reasons, we may in the future become the target of securities litigation or shareholder activism. Securities litigation and shareholder activism, including potential proxy contests, could result in substantial costs and divert management’s and our board of directors’ attention and resources from our business. Additionally, such securities litigation and shareholder activism could give rise to perceived uncertainties as to our future, adversely affect our relationships with service providers and make it more difficult to attract and retain qualified personnel. Also, we may be required to incur significant legal fees and other expenses related to
- 55 -
Table of Contents
any securities litigation and activist shareholder matters. Further, our stock price could be subject to significant fluctuation or otherwise be adversely affected by the events, risks and uncertainties of any securities litigation and shareholder activism.
Terrorist attacks, acts of war or national disasters may affect any market for our securities, impact the businesses in which we invest and harm our business, operating results and financial condition.
Terrorist acts, acts of war or national disasters may disrupt our operations, as well as the operations of the businesses in which we invest. Such acts have created, and continue to create, economic and political uncertainties and have contributed to global economic instability. Future terrorist activities, military or security operations, or natural disasters could further weaken the domestic/global economies and create additional uncertainties, which may negatively impact the businesses in which we invest directly or indirectly and, in turn, could have a material adverse impact on our business, operating results and financial condition. Losses from terrorist attacks and natural disasters are generally uninsurable.
Item 1B. Unresolved Staff Comments.
Not applicable.
We do not own any real estate or other physical properties materially important to our operation. Our headquarters are located at 1603 Orrington Avenue, Suite 1005, Evanston, Illinois 60201, and are provided by our investment advisor pursuant to the Administration Agreement. We believe that our office facilities are suitable and adequate to our business as we contemplate conducting it.
We are not, and our investment advisor is not, currently subject to any material legal proceedings.
Item 4. Mine Safety Disclosures.
Not applicable.
- 56 -
Table of Contents
Item 5. Market for Registrant’s Common Equity, Related Stockholder Matters and Issuer Purchases of Equity Securities
Price Range of Common Stock, Holders and Distributions.
Our common stock began trading on June 21, 2011 on The NASDAQ Global Market under the symbol “FDUS.” Effective January 3, 2012, our common stock was included in the NASDAQ Global Select Market. The following table lists the high and low closing sale price for our common stock, the closing sale price as a percentage of net asset value, or NAV, and the cash distributions per share that we have declared on our common stock for each fiscal quarter during the last two most recently completed fiscal years.
| Period |
NAV (1) | High Closing Sales Price |
Low Closing Sales Price |
Premium/ (Discount) of High Sales Price to NAV (2) |
Premium/ (Discount) of Low Sales Price to NAV (2) |
Distributions Per Share (3) |
||||||||||||||||||
| Year ended December 31, 2015 |
||||||||||||||||||||||||
| First Quarter |
$ | 15.18 | $ | 17.02 | $ | 14.40 | 12.1 | % | (5.1 | )% | $ | 0.38 | ||||||||||||
| Second Quarter |
15.18 | 16.90 | 14.90 | 11.3 | (1.8 | ) | 0.40 | |||||||||||||||||
| Third Quarter |
15.12 | 15.51 | 13.65 | 2.6 | (9.7 | ) | 0.39 | |||||||||||||||||
| Fourth Quarter |
15.17 | 14.80 | 13.11 | (2.4 | ) | (13.6 | ) | 0.43 | ||||||||||||||||
| Year ended December 31, 2014 |
||||||||||||||||||||||||
| First Quarter |
15.22 | 21.99 | 17.86 | 44.5 | 17.3 | 0.38 | ||||||||||||||||||
| Second Quarter |
15.09 | 20.54 | 16.63 | 36.1 | 10.2 | 0.48 | ||||||||||||||||||
| Third Quarter |
15.18 | 20.04 | 16.51 | 32.0 | 8.8 | 0.38 | ||||||||||||||||||
| Fourth Quarter |
15.16 | 17.10 | 13.71 | 12.8 | (9.6 | ) | 0.48 | |||||||||||||||||
| (1) | Net asset value per share is determined as of the last day in the relevant quarter and therefore may not reflect the net asset value per share on the date of the high and low sales prices. The net asset values shown are based on outstanding shares at the end of each period. |
| (2) | Calculated as the difference between the respective high or low closing sales price and the quarter end net asset value divided by the quarter end net asset value. |
| (3) | Represents the regular and special, if applicable, distribution declared in the specified quarter. We have adopted an “opt out” dividend reinvestment plan for our common stockholders. As a result, if we declare a distribution, stockholders’ cash distributions will be automatically reinvested in additional shares of our common stock, unless they specifically “opt out” of the dividend reinvestment plan so as to receive cash distributions. See “Dividend Reinvestment Plan.” |
The last reported price for our common stock on February 29, 2016 was $14.26 per share. As of February 29, 2016, we had 20 stockholders of record.
We intend to continue to pay quarterly distributions to our stockholders. Our quarterly distributions, if any, are determined by our board of directors. We have elected to be taxed as a RIC under Subchapter M of the Code. As long as we qualify as a RIC, we will not be taxed on our investment company taxable income or net capital gain, to the extent that such income or gain is distributed, or deemed to be distributed, to stockholders on a timely basis.
On February 16, 2016, our board of directors declared a regular quarterly dividend of $0.39 per share payable on March 25, 2016 to holders of record as of March 11, 2016.
In addition, during 2013 we designated approximately $8.3 million, or $0.60 per share, of our net long-term capital gains as a “deemed distribution” to stockholders of record as of December 31, 2013. We incurred
- 57 -
Table of Contents
approximately $2.9 million, or $0.21 per share, of U.S. federal income taxes on behalf of stockholders related to this deemed distribution. Such taxes were paid in January of 2014. There were no deemed distributions during the years 2011, 2012, 2014 or 2015.
We may not be able to achieve operating results that will allow us to make distributions at a specific level or to increase the amount of these distributions from time to time. If we do not distribute a certain percentage of our income annually, we will suffer adverse tax consequences, including possible loss of our status as a RIC. We cannot assure stockholders that they will receive any distributions at a particular level.
We have adopted a dividend reinvestment plan that provides for reinvestment of our distributions on behalf of our stockholders, unless a stockholder elects to receive cash. As a result, if our board of directors authorizes, and we declare, a cash distribution, then our stockholders who have not “opted out” of our dividend reinvestment plan will have their cash distribution automatically reinvested in additional shares of our common stock, rather than receiving the cash distribution. Under the terms of our dividend reinvestment plan, dividends will primarily be paid in newly issued shares of common stock. However, we reserve the right to purchase shares in the open market in connection with the implementation of the plan. This feature of the plan means that, under certain circumstances, we may issue shares of our common stock at a price below net asset value per share, which could cause our stockholders to experience dilution.
Distributions in excess of our current and accumulated profits and earnings would be treated first as a return of capital to the extent of the stockholder’s tax basis, and any remaining distributions would be treated as a capital gain. The determination of the tax attributes of our distributions will be made annually as of the end of our fiscal year based upon our taxable income for the full year and distributions paid for the full year. Therefore, a determination made on a quarterly basis may not be representative of the actual tax attributes of our distributions for a full year. Each year, a statement on Form 1099-DIV identifying the source of the distribution will be sent to our U.S. stockholders of record. Our board of directors presently intends to declare and pay quarterly dividends. Our ability to pay dividends could be affected by future business performance, liquidity, capital needs, alternative investment opportunities and loan covenants.
The tax character of distributions declared and paid in 2015 is described in Note 12 to our consolidated financial statements.
- 58 -
Table of Contents
Stock Performance Graph
This graph compares the stockholder return on our common stock from June 21, 2011 (commencement of trading) to December 31, 2015 with that of the Russell 2000 Financial Services Index and the Standard & Poor’s 500 Stock Index. This graph assumes that on June 21, 2011, $100 was invested in our common stock, the Russell 2000 Financial Services Index, and the Standard & Poor’s 500 Stock Index. The graph also assumes the reinvestment of all cash dividends prior to any tax effect. The graph and other information furnished under this Part II Item 5 of this Annual Report shall not be deemed to be “soliciting material” or to be “filed” with the SEC or subject to Regulation 14A or 14C under, or to the liabilities of Section 18 of, the Exchange Act. The stock price performance included in the below graph is not necessarily indicative of future stock performance.
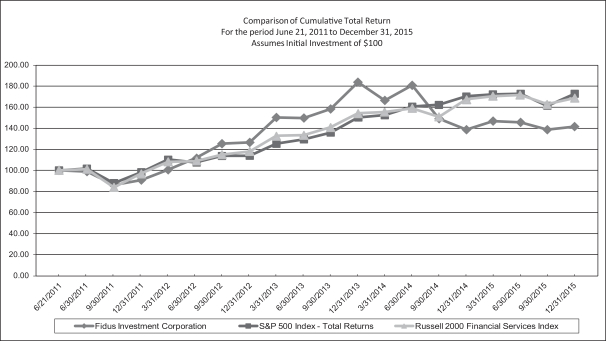
- 59 -
Table of Contents
Item 6. Selected Consolidated Financial Data
The following selected consolidated financial data of FIC and its subsidiaries, including the Funds, as of and for the years ended December 31, 2015, 2014, 2013, 2012 and 2011, is derived from the consolidated financial statements that have been audited by RSM US LLP, independent registered public accounting firm. Financial information prior to our IPO in June 2011 is that of Fund I. This financial data should be read in conjunction with our consolidated financial statements and the notes thereto included elsewhere in this Annual Report and with Management’s Discussion and Analysis of Financial Condition and Results of Operations which follows.
| Year Ended December 31, | ||||||||||||||||||||
| 2015 | 2014 | 2013 | 2012 | 2011 | ||||||||||||||||
| (Dollars in Thousands) | ||||||||||||||||||||
| Statement of operations data: |
||||||||||||||||||||
| Total investment income |
$ | 54,269 | $ | 46,116 | $ | 41,792 | $ | 33,849 | $ | 23,387 | ||||||||||
| Interest and financing expenses |
9,428 | 7,507 | 7,076 | 6,422 | 5,488 | |||||||||||||||
| Management fees, net |
7,545 | 5,899 | 5,261 | 4,237 | 3,182 | |||||||||||||||
| Incentive fees |
6,481 | 4,857 | 6,792 | 4,839 | 1,609 | |||||||||||||||
| All other expenses |
3,932 | 4,189 | 3,121 | 2,660 | 1,551 | |||||||||||||||
|
|
|
|
|
|
|
|
|
|
|
|||||||||||
| Net investment income before income taxes |
27,386 | 23,664 | 19,542 | 15,691 | 11,557 | |||||||||||||||
| Income tax provision |
390 | 383 | 246 | 4 | 24 | |||||||||||||||
|
|
|
|
|
|
|
|
|
|
|
|||||||||||
| Net investment income |
26,493 | 23,281 | 19,296 | 15,687 | 11,533 | |||||||||||||||
| Net realized gains (losses) on investments |
9,531 | (17,029 | ) | 30,588 | 1,975 | (12,318 | ) | |||||||||||||
| Net change in unrealized appreciation (depreciation) on investments |
(10,086 | ) | 13,250 | (22,188 | ) | 1,749 | 16,171 | |||||||||||||
| Income tax (provision) on realized gains on investments |
39 | (17 | ) | (493 | ) | — | — | |||||||||||||
|
|
|
|
|
|
|
|
|
|
|
|||||||||||
| Net increase (decrease) in net assets resulting from operations |
$ | 25,977 | $ | 19,485 | $ | 27,203 | $ | 19,411 | $ | 15,386 | ||||||||||
|
|
|
|
|
|
|
|
|
|
|
|||||||||||
| Per share data(1): |
||||||||||||||||||||
| Net asset value (at end of period) |
$ | 15.17 | $ | 15.16 | $ | 15.35 | $ | 15.32 | $ | 14.90 | ||||||||||
| Net investment income |
$ | 1.64 | $ | 1.62 | $ | 1.43 | $ | 1.54 | $ | 1.22 | ||||||||||
| Net gain (loss) on investments |
$ | (0.04 | ) | $ | (0.26 | ) | $ | 0.58 | $ | 0.37 | $ | 0.40 | ||||||||
| Net increase in net assets resulting from operations |
$ | 1.60 | $ | 1.36 | $ | 2.01 | $ | 1.91 | $ | 1.63 | ||||||||||
| Dividends (post initial public offering) |
$ | 1.60 | $ | 1.72 | $ | 1.94 | $ | 1.46 | $ | 0.64 | ||||||||||
| Other data: |
||||||||||||||||||||
| Weighted average annual yield on debt investments (2) |
13.3 | % | 13.4 | % | 14.5 | % | 15.3 | % | 15.3 | % | ||||||||||
| Number of portfolio companies at year end |
53 | 42 | 37 | 30 | 23 | |||||||||||||||
| Expense ratios (as percentage of average net assets): |
||||||||||||||||||||
| Operating expenses |
7.3 | % | 6.7 | % | 7.2 | % | 7.4 | % | 4.7 | % | ||||||||||
| Interest expense |
3.8 | % | 3.4 | % | 3.4 | % | 4.1 | % | 4.0 | % | ||||||||||
| (1) | Per share data and average net assets are presented as if the Formation Transaction and IPO had occurred on January 1, 2011. |
| (2) | Weighted average yields are computed using the effective interest rates for debt investments at cost as of the period end date, including accretion of original issue discount and loan origination fees, but excluding debt investments on non-accrual status, if any. |
- 60 -
Table of Contents
| As of December 31, | ||||||||||||||||||||
| 2015 | 2014 | 2013 | 2012 | 2011 | ||||||||||||||||
| (Dollars in Thousands) | ||||||||||||||||||||
| Statement of assets and liabilities data: |
||||||||||||||||||||
| Total investments at fair value |
$ | 443,269 | $ | 396,355 | $ | 306,981 | $ | 274,249 | $ | 204,745 | ||||||||||
| Total assets |
485,540 | 435,587 | 367,262 | 333,849 | 248,643 | |||||||||||||||
| Borrowings |
229,000 | 183,500 | 144,500 | 144,500 | 104,000 | |||||||||||||||
| Total net assets |
247,362 | 243,263 | 211,125 | 183,091 | 140,482 | |||||||||||||||
Item 7. Management’s Discussion and Analysis of Financial Condition and Results of Operations.
The following discussion and analysis of our financial condition and results of operations should be read in conjunction with “Selected Consolidated Financial Data,” FIC’s consolidated financial statements and related notes appearing elsewhere in this annual report on Form 10-K (“Annual Report”). The information contained in this section contains forward-looking statements that involve risk and uncertainties. Please see “Risk Factors” and “Special Note Regarding Forward-Looking Statements” for a discussion of the uncertainties, risks and assumptions associated with these statements.
Overview
We provide customized debt and equity financing solutions to lower middle-market companies, which we define as U.S. based companies having revenues between $10.0 million and $150.0 million. Our investment objective is to provide attractive risk-adjusted returns by generating both current income from our debt investments and capital appreciation from our equity related investments. Our investment strategy includes partnering with business owners, management teams and financial sponsors by providing customized financing for ownership transactions, recapitalizations, strategic acquisitions, business expansion and other growth initiatives. We seek to maintain a diversified portfolio of investments in order to help mitigate the potential effects of adverse economic events related to particular companies, regions or industries.
FIC was formed as a Maryland corporation on February 14, 2011. We completed our initial public offering, or IPO, in June 2011, and completed additional underwritten public offerings of our common stock in September 2012, February 2013 and September 2014 providing approximately $174.1 million in net proceeds after deducting underwriting fees and offering costs.
On June 20, 2011, FIC acquired all of the limited partnership interests of Fund I and membership interests of FMCGP through the Formation Transactions, resulting in Fund I becoming our wholly-owned SBIC subsidiary. Immediately following the Formation Transactions, we and Fund I elected to be treated as BDCs under the 1940 Act and our investment activities have been managed by Fidus Investment Advisors, LLC, our investment advisor, and supervised by our board of directors, a majority of whom are independent of us. On March 29, 2013, we commenced operations of a second wholly-owned subsidiary, Fund II. Fund I and Fund II are collectively referred to as the “Funds.”
Fund I received its SBIC license on October 22, 2007 and Fund II received its SBIC license on May 28, 2013. We plan to continue to operate the Funds as SBICs, subject to SBA approval, and to utilize the proceeds of the sale of SBA-guaranteed debentures to enhance returns to our stockholders. We have also made, and continue to make, investments directly through FIC. We believe that utilizing FIC and the Funds as investment vehicles provides us with access to a broader array of investment opportunities. Based on the current capitalization of the Funds, we have approximately $11.5 million of remaining borrowing capacity under the SBIC Debenture Program and intend to fully utilize such capacity over the ensuing 3-6 months.
Revenues: We generate revenue in the form of interest income on debt investments and capital gains and distributions, if any, on equity investments. Our debt investments, whether in the form of mezzanine, senior
- 61 -
Table of Contents
secured or unitranche loans, typically have terms of five to seven years and bear interest at a fixed rate but may bear interest at a floating rate. In some instances, we receive payments on our debt investments based on scheduled amortization of the outstanding balances. In addition, we receive repayments of some of our debt investments prior to their scheduled maturity dates. The frequency or volume of these repayments fluctuates significantly from period to period. Our portfolio activity may reflect the proceeds of sales of securities. In some cases, our investments provide for deferred interest payments or PIK interest. The principal amount of loans and any accrued but unpaid interest generally become due at the maturity date. In addition, we may generate revenue in the form of commitment, origination, amendment, or structuring fees and fees for providing managerial assistance. Loan origination fees, original issue discount and market discount or premium, if any, are capitalized, and we accrete or amortize such amounts into interest income. We record prepayment premiums on loans as fee income. Interest and dividend income is recorded on the accrual basis to the extent that we expect to collect such amounts. Loans or preferred equity securities are placed on non-accrual status when principal, interest or dividend payments become materially past due, or when there is reasonable doubt that principal, interest or dividends will be collected. See “Critical Accounting Policies and Use of Estimates – Revenue Recognition.” Interest and dividend income is accrued based upon the outstanding principal amount and contractual terms of debt and preferred equity investments. Interest is accrued on a daily basis. Dividend income is recorded as dividends are declared or at the point an obligation exists for the portfolio company to make a distribution. Distributions of earnings from portfolio companies are evaluated to determine if the distribution is a distribution of earnings or a return of capital.
We recognize realized gains or losses on investments based on the difference between the net proceeds from the disposition and the cost basis of the investment, without regard to unrealized gains or losses previously recognized. We record current period changes in fair value of investments that are measured at fair value as a component of the net change in unrealized appreciation (depreciation) on investments in the consolidated statements of operations.
Expenses: All investment professionals of our investment advisor and/or its affiliates, when and to the extent engaged in providing investment advisory and management services to us, and the compensation and routine overhead expenses allocable to personnel who provide these services to us, are provided and paid for by our investment advisor and not by us. We bear all other out-of-pocket costs and expenses of our operations and transactions, including, without limitation, those relating to:
| • | organization; |
| • | calculating our net asset value (including the cost and expenses of any independent valuation firm); |
| • | fees and expenses incurred by our investment advisor under the Investment Advisory Agreement or payable to third parties, including agents, consultants or other advisors, in monitoring financial and legal affairs for us and in monitoring our investments and performing due diligence on our prospective portfolio companies or otherwise relating to, or associated with, evaluating and making investments; |
| • | interest payable on debt, if any, incurred to finance our investments; |
| • | offerings of our common stock and other securities; |
| • | investment advisory fees and management fees; |
| • | administration fees and expenses, if any, payable under the Administration Agreement (including payments under the Administration Agreement between us and our investment advisor based upon our allocable portion of our investment advisor’s overhead in performing its obligations under the Administration Agreement, including rent and the allocable portion of the cost of our officers, including our chief compliance officer, our chief financial officer, and their respective staffs); |
| • | transfer agent, dividend agent and custodial fees and expenses; |
| • | federal and state registration fees; |
- 62 -
Table of Contents
| • | all costs of registration and listing our shares on any securities exchange; |
| • | U.S. federal, state and local taxes; |
| • | Independent Directors’ fees and expenses; |
| • | costs of preparing and filing reports or other documents required by the SEC or other regulators including printing costs; |
| • | costs of any reports, proxy statements or other notices to stockholders, including printing and mailing costs; |
| • | our allocable portion of any fidelity bond, directors and officers/errors and omissions liability insurance, and any other insurance premiums; |
| • | direct costs and expenses of administration, including printing, mailing, long distance telephone, copying, secretarial and other staff, independent auditors and outside legal costs; |
| • | proxy voting expenses; and |
| • | all other expenses reasonably incurred by us or our investment advisor in connection with administering our business. |
Portfolio Composition, Investment Activity and Yield
During the year ended December 31, 2015, we invested $136.4 million in debt and equity investments, including 13 new portfolio companies. These investments consisted of subordinated notes ($98.1 million, or 72.0%), senior secured loans ($28.3 million, or 20.7%), equity securities ($9.5 million, or 7.0%), warrants ($0.2 million, or 0.1%) and royalty rights ($0.3 million, or 0.2%). During the year ended December 31, 2015 we received proceeds from sales or repayments, including principal, return of capital dividends and net realized gains (losses), of $94.7 million. During the year ended December 31, 2014, we invested $149.8 million in debt and equity investments, including 12 new portfolio companies. These investments consisted of subordinated notes ($103.7 million, or 69.2%), senior secured loans ($33.1 million, or 22.1%), equity securities ($12.2 million, or 8.1%) and warrants ($0.8 million, or 0.6%). During the year ended December 31, 2014, we received proceeds from sales or repayments, including principal, return of capital dividends and realized gains, of $62.6 million.
As of December 31, 2015, the fair value of our investment portfolio totaled $443.3 million and consisted of 53 portfolio companies. As of December 31, 2015, one debt investment bore interest at a variable rate, which represented $8.9 million of our portfolio on a fair value basis, and the remainder of our debt portfolio was comprised of fixed rate investments. Overall, the portfolio had net unrealized depreciation of $5.1 million as of December 31, 2015. As of December 31, 2015, our average portfolio company investment at amortized cost was $9.0 million (which excludes three investments in portfolio companies that sold their operations and are in the process of winding down).
As of December 31, 2014, the fair value of our investment portfolio totaled $396.4 million and consisted of 42 portfolio companies. As of December 31, 2014, our debt portfolio was entirely comprised of fixed rate investments. Overall, the portfolio had net unrealized appreciation of $5.0 million as of December 31, 2014. Our average portfolio company investment at amortized cost was $9.3 million as of December 31, 2014.
The weighted average yield on debt investments as of December 31, 2015 and December 31, 2014 was 13.3% and 13.4%, respectively. The weighted average yields were computed using the effective interest rates for debt investments at cost as of both December 31, 2015 and 2014, including the accretion of original issue discount and loan origination fees, but excluding investments on non-accrual status, if any.
- 63 -
Table of Contents
The following table shows the portfolio composition by investment type at fair value and cost and as a percentage of total investments:
| Fair Value | Cost | |||||||||||||||||||||||||||||||
| December 31, 2015 |
December 31, 2014 |
December 31, 2015 |
December 31, 2014 |
|||||||||||||||||||||||||||||
| (dollars in thousands) | ||||||||||||||||||||||||||||||||
| Subordinated notes |
$ | 300,467 | 67.8 | % | $ | 273,711 | 69.1 | % | $ | 309,899 | 69.2 | % | $ | 273,347 | 69.8 | % | ||||||||||||||||
| Senior secured loans |
88,485 | 20.0 | 74,286 | 18.7 | 88,505 | 19.7 | 74,486 | 19.0 | ||||||||||||||||||||||||
| Equity |
44,899 | 10.1 | 42,886 | 10.8 | 42,651 | 9.5 | 36,623 | 9.4 | ||||||||||||||||||||||||
| Warrants |
9,233 | 2.1 | 5,472 | 1.4 | 7,098 | 1.6 | 6,882 | 1.8 | ||||||||||||||||||||||||
| Royalty rights |
185 | — | — | — | 185 | — | — | — | ||||||||||||||||||||||||
|
|
|
|
|
|
|
|
|
|
|
|
|
|
|
|
|
|||||||||||||||||
| Total |
$ | 443,269 | 100.0 | % | $ | 396,355 | 100.0 | % | $ | 448,338 | 100.0 | % | $ | 391,338 | 100.0 | % | ||||||||||||||||
|
|
|
|
|
|
|
|
|
|
|
|
|
|
|
|
|
|||||||||||||||||
The following table shows portfolio composition by geographic region at fair value and cost and as a percentage of total investments. The geographic composition is determined by the location of the corporate headquarters of the portfolio company, which may not be indicative of the primary source of the portfolio company’s business.
| Fair Value | Cost | |||||||||||||||||||||||||||||||
| December 31, 2015 |
December 31, 2014 |
December 31, 2015 |
December 31, 2014 |
|||||||||||||||||||||||||||||
| (dollars in thousands) | ||||||||||||||||||||||||||||||||
| Midwest |
$ | 119,291 | 26.8 | % | $ | 94,572 | 23.9 | % | $ | 116,015 | 25.9 | % | $ | 92,721 | 23.7 | % | ||||||||||||||||
| Southeast |
107,975 | 24.4 | 113,516 | 28.6 | 113,430 | 25.3 | 113,725 | 29.0 | ||||||||||||||||||||||||
| Northeast |
93,430 | 21.1 | 66,900 | 16.9 | 92,492 | 20.6 | 65,248 | 16.7 | ||||||||||||||||||||||||
| West |
84,648 | 19.1 | 78,904 | 19.9 | 77,028 | 17.2 | 71,975 | 18.4 | ||||||||||||||||||||||||
| Southwest |
37,925 | 8.6 | 42,463 | 10.7 | 49,373 | 11.0 | 47,669 | 12.2 | ||||||||||||||||||||||||
|
|
|
|
|
|
|
|
|
|
|
|
|
|
|
|
|
|||||||||||||||||
| Total |
$ | 443,269 | 100.0 | % | $ | 396,355 | 100.0 | % | $ | 448,338 | 100.0 | % | $ | 391,338 | 100.0 | % | ||||||||||||||||
|
|
|
|
|
|
|
|
|
|
|
|
|
|
|
|
|
|||||||||||||||||
The following table shows the detailed industry composition of our portfolio at fair value and cost as a percentage of total investments:
| Fair Value | Cost | |||||||||||||||
| December 31, 2015 |
December 31, 2014 |
December 31, 2015 |
December 31, 2014 |
|||||||||||||
| Healthcare products |
11.4 | % | 11.2 | % | 10.4 | % | 10.6 | % | ||||||||
| Healthcare services |
11.1 | 10.3 | 11.2 | 10.8 | ||||||||||||
| Aerospace & defense manufacturing |
10.5 | 9.4 | 8.7 | 8.6 | ||||||||||||
| Transportation services |
8.1 | 4.0 | 7.6 | 3.9 | ||||||||||||
| Specialty distribution |
8.0 | 10.3 | 7.7 | 9.3 | ||||||||||||
| Business services |
5.4 | 3.1 | 5.7 | 3.2 | ||||||||||||
| Consumer products |
5.1 | 5.6 | 5.0 | 5.6 | ||||||||||||
| Utility equipment manufacturing |
4.6 | 2.6 | 4.6 | 2.6 | ||||||||||||
| Building products manufacturing |
4.0 | 3.6 | 3.6 | 3.7 | ||||||||||||
| Industrial cleaning & coatings |
3.9 | 4.1 | 4.1 | 4.2 | ||||||||||||
| Component manufacturing |
3.8 | 4.3 | 4.0 | 4.6 | ||||||||||||
| Oil & gas services |
3.7 | 8.6 | 4.5 | 8.8 | ||||||||||||
- 64 -
Table of Contents
| Fair Value | Cost | |||||||||||||||
| December 31, 2015 |
December 31, 2014 |
December 31, 2015 |
December 31, 2014 |
|||||||||||||
| Financial services |
3.1 | 3.7 | 2.8 | 3.4 | ||||||||||||
| Information technology services |
3.0 | 2.3 | 3.2 | 2.5 | ||||||||||||
| Safety products manufacturing |
2.4 | 2.7 | 2.4 | 2.7 | ||||||||||||
| Printing services |
2.2 | 2.4 | 2.3 | 2.6 | ||||||||||||
| Restaurants |
2.0 | 1.7 | 2.0 | 1.6 | ||||||||||||
| Specialty chemicals |
1.7 | 2.2 | 1.9 | 2.2 | ||||||||||||
| Laundry services |
1.5 | 1.5 | 1.4 | 1.4 | ||||||||||||
| Telecommunication services |
1.4 | — | 1.3 | — | ||||||||||||
| Apparel distribution |
1.3 | 1.5 | 1.3 | 1.5 | ||||||||||||
| Vending equipment manufacturing |
0.8 | — | 0.9 | — | ||||||||||||
| Electronic components supplier |
0.4 | 0.4 | 0.3 | 0.4 | ||||||||||||
| Retail |
0.3 | 2.7 | 0.2 | 2.6 | ||||||||||||
| Commercial cleaning |
0.2 | 0.2 | 0.2 | 0.2 | ||||||||||||
| Retail cleaning |
0.1 | 1.1 | 2.7 | 2.7 | ||||||||||||
| Specialty cracker manufacturing |
— | 0.5 | — | 0.3 | ||||||||||||
|
|
|
|
|
|
|
|
|
|||||||||
| Total |
100.0 | % | 100.0 | % | 100.0 | % | 100.0 | % | ||||||||
|
|
|
|
|
|
|
|
|
|||||||||
Portfolio Asset Quality
In addition to various risk management and monitoring tools, our investment advisor uses an internally developed investment rating system to characterize and monitor the credit profile and our expected level of returns on each investment in our portfolio. We use a five-level numeric rating scale. The following is a description of the conditions associated with each investment rating:
| • | Investment Rating 1 is used for investments that involve the least amount of risk in our portfolio. The portfolio company is performing above expectations and the trends and risk factors are favorable, and may include an expected capital gain. |
| • | Investment Rating 2 is used for investments that involve a level of risk similar to the risk at the time of origination. The portfolio company is performing substantially within our expectations and the risk factors are neutral or favorable. Each new portfolio investment enters our portfolio with Investment Rating 2. |
| • | Investment Rating 3 is used for investments performing below expectations and indicates the investment’s risk has increased somewhat since origination. The portfolio company requires closer monitoring, but we expect a full return of principal and collection of all interest and/or dividends. |
| • | Investment Rating 4 is used for investments performing materially below expectations and the risk has increased materially since origination. The portfolio company has the potential for some loss of investment return, but we expect no loss of principal. |
| • | Investment Rating 5 is used for investments performing substantially below our expectations and the risks have increased substantially since origination. We expect some loss of principal. |
- 65 -
Table of Contents
The following table shows the distribution of our investments on the 1 to 5 investment rating scale at fair value as of December 31, 2015 and December 31, 2014:
| As of December 31, 2015 | As of December 31, 2014 | |||||||||||||||
| Investment Rating |
Investments at Fair Value |
Percent of Total Portfolio |
Investments at Fair Value |
Percent of Total Portfolio |
||||||||||||
| (dollars in thousands) | ||||||||||||||||
| 1 |
$ | 77,875 | 17.6 | % | $ | 49,499 | 12.5 | % | ||||||||
| 2 |
268,285 | 60.4 | 297,024 | 74.9 | ||||||||||||
| 3 |
95,981 | 21.7 | 48,814 | 12.3 | ||||||||||||
| 4 |
1,128 | 0.3 | 1,018 | 0.3 | ||||||||||||
| 5 |
— | — | — | — | ||||||||||||
|
|
|
|
|
|
|
|
|
|||||||||
| Totals |
$ | 443,269 | 100.0 | % | $ | 396,355 | 100.0 | % | ||||||||
|
|
|
|
|
|
|
|
|
|||||||||
Based on our investment rating system, the weighted average rating of our portfolio as of both December 31, 2015 and 2014 was 2.0 on a fair value basis.
Non-Accrual
As of December 31, 2015, we had debt investments in one portfolio company on non-accrual status, which had an aggregate cost and fair value of $5.2 million and $0.6 million, respectively. For the year ended December 31, 2015, we recognized unrealized depreciation on non-accrual investments of $4.4 million, respectively. As of December 31, 2014, we had no investments on non-accrual status.
Discussion and Analysis of Results of Operations
Comparison of fiscal years ended December 31, 2015 and December 31, 2014
Investment Income
For the year ended December 31, 2015, total investment income was $54.3 million, an increase of $8.2 million, or 17.7%, over the $46.1 million of total investment income for the year ended December 31, 2014. The increase was primarily attributable to a $10.3 million increase in interest income resulting largely from higher average levels of debt investments outstanding, which was partially offset by a $1.1 million decrease in dividend income due to lower average levels of income producing equity investments outstanding and a $1.1 million decrease in fee income resulting from lower levels of investment activity for the year ended December 31, 2015, as compared to the year ended December 31, 2014.
Expenses
For the year ended December 31, 2015, total expenses, including income tax provision, were $27.8 million, an increase of $4.9 million or 21.6%, over the $22.8 million of total expenses, including income tax provision, for the year ended December 31, 2014. Interest and financing expenses for the year ended December 31, 2015 were $9.4 million, an increase of $1.9 million or 25.6%, compared to $7.5 million for the year ended December 31, 2014 as a result of higher average balances of SBA debentures outstanding during 2015 and interest and commitment fees related to the Credit Facility. The base management fee increased $1.6 million, or 27.9%, to $7.5 million for the year ended December 31, 2015 due to higher average total assets less cash and cash equivalents for the year ended December 31, 2015 than the fiscal year 2014. The incentive fee for the year ended December 31, 2015 was $6.5 million, a $1.6 million, or 33.4%, increase from the $4.9 million incentive fee for the year ended December 31, 2014 which was the result of a $1.0 million increase in the income incentive fee to $6.6 million and the reversal of previously accrued capital gains incentive fees totaling $0.1 million during the year ended December 31, 2015 compared to a capital gains incentive fee reversal of $0.7 million during the
- 66 -
Table of Contents
fiscal year 2014. The administrative service fee, professional fees and other general and administrative expenses totaled $3.9 million for the year December 31, 2015 compared to a total of $4.2 million for the year ended December 31, 2014.
Net Investment Income
Net investment income for the year ended December 31, 2015 was $26.5 million, which was an increase of $3.2 million, or 13.8%, compared to net investment income of $23.3 million during the year ended December 31, 2014 as a result of the $8.2 million increase in total investment income and the $4.9 million increase in total expenses, including income tax provision.
Net Increase in Net Assets Resulting From Operations
For the year ended December 31, 2015, the total net realized gain on investments was $9.5 million. Significant realized gains for the year ended December 31, 2015 are summarized below:
| Portfolio Company |
Realization Event |
Realized Gains (Losses) (in millions) |
||||
| Connect-Air International, Inc. |
Exit of portfolio company | $ | 5.5 | |||
| ACFP Acquisition Company, Inc. |
Distribution related to sale of operations | 2.3 | ||||
| Westminster Cracker Company, Inc. |
Distribution related to sale of operations | 1.5 | ||||
| Acentia, LLC |
Exit of portfolio company | <(0.1 | ) | |||
| Other |
0.2 | |||||
|
|
|
|||||
| Total |
$ | 9.5 | ||||
|
|
|
|||||
For the year ended December 31, 2014, the total net realized loss on investments was $17.0 million and was comprised of $3.3 million in gross realized gains and $20.3 million in gross realized losses. Significant realized gains and (losses) are summarized below:
| Portfolio Company |
Realization Event |
Net Realized Gains (Losses) (in millions) |
||||
| Nobles Manufacturing, Inc. |
Exit of portfolio company | $ | 1.7 | |||
| Brook Furniture Rental, Inc. |
Exit of portfolio company | 0.9 | ||||
| Apex Microtechnology, Inc. |
Repayment of debt in full | 0.2 | ||||
| S.B. Restaurant Co. (dba Elephant Bar) |
Exit of portfolio company | (8.0 | ) | |||
| Avrio Technology Group, LLC |
Exit of portfolio company | (12.3 | ) | |||
| Other |
0.5 | |||||
|
|
|
|||||
| Total |
$ | (17.0 | ) | |||
|
|
|
|||||
During the year ended December 31, 2015, we recorded a net change in unrealized depreciation on investments of $10.1 million attributable to (i) the reversal of net unrealized appreciation on investments of $4.7 million related to the exit or sale of investments, resulting in unrealized depreciation, (ii) net unrealized depreciation of $9.3 million on debt investments and (iii) net unrealized appreciation of $3.9 million on equity investments. During the year ended December 31, 2014, we recorded a net change in unrealized appreciation on investments of $13.3 million attributable to (i) the reversal of net unrealized depreciation on investments of $11.0 million related to the exit or sale of investments, resulting in unrealized appreciation, (ii) net unrealized depreciation of $0.8 million on debt investments and (iii) net unrealized appreciation of $3.1 million on equity investments.
- 67 -
Table of Contents
As a result of these events, our net increase in net assets resulting from operations during the year ended December 31, 2015 was $26.0 million, or an increase of $6.5 million, or 33.3%, compared to a net increase in net assets resulting from operations of $19.5 million during the prior year period.
Comparison of years ended December 31, 2014 and December 31, 2013
Investment Income
For the year ended December 31, 2014, total investment income was $46.1 million, an increase of $4.3 million, or 10.3%, over the $41.8 million of total investment income for the year ended December 31, 2013. The increase was primarily attributable to a $2.6 million increase in interest income resulting largely from higher average levels of debt investments outstanding and a $1.5 million increase in fee income from investments during the year ended December 31, 2014, as compared to the year ended December 31, 2013.
Expenses
For the year ended December 31, 2014, total expenses, including income tax provision, were $22.8 million, an increase of $0.3 million or 1.5%, over the $22.5 million of total expenses, including income tax provision, for the year ended December 31, 2013. Interest and financing expenses for the year ended December 31, 2014 were $7.5 million, an increase of $0.4 million or 6.1%, compared to $7.1 million for the year ended December 31, 2013 as a result of higher average balances of SBA debentures outstanding during 2014 and interest and commitment fees related to the Credit Facility. The base management fee increased $0.6 million, or 12.1%, to $5.9 million for the year ended December 31, 2014 due to higher average total assets less cash and cash equivalents for the year ended December 31, 2014 than the comparable period in 2013. The incentive fee for the year ended December 31, 2014 was $4.9 million, a $1.9 million, or 28.5%, decrease from the $6.8 million incentive fee for the year ended December 31, 2013 which was primarily the result of a capital gains incentive fee reversal of $0.7 million during the 2014 period compared to a capital gains incentive fee accrual of $1.6 million during the same period in 2013, which was partially offset by a $0.4 million increase in the income incentive fee. The administrative service fee, professional fees and other general and administrative expenses increased $1.1 million, or 34.2%, to $4.2 million primarily due to increased personnel costs and professional fees.
Net Investment Income
Net investment income for the year ended December 31, 2014 was $23.3 million, which was an increase of $4.0 million, or 20.7%, compared to net investment income of $19.3 million during the year ended December 31, 2013 as a result of the $4.3 million increase in total investment income and the $0.3 million increase in total expenses, including income tax provision.
Net Increase in Net Assets Resulting From Operations
For the year ended December 31, 2014, the total net realized loss on investments was $17.0 million and was comprised of $3.3 million in gross realized gains and $20.3 million in gross realized losses. Significant realized gains and (losses) are summarized below:
| Portfolio Company |
Realization Event |
Net Realized Gains (Losses) (in millions) |
||||
| Nobles Manufacturing, Inc. |
Exit of portfolio company | $ | 1.7 | |||
| Brook Furniture Rental, Inc. |
Exit of portfolio company | 0.9 | ||||
| Apex Microtechnology, Inc. |
Repayment of debt in full | 0.2 | ||||
| S.B. Restaurant Co. (dba Elephant Bar) |
Exit of portfolio company | (8.0 | ) | |||
| Avrio Technology Group, LLC |
Exit of portfolio company | (12.3 | ) | |||
| Other |
0.5 | |||||
|
|
|
|||||
| Total |
$ | (17.0 | ) | |||
|
|
|
|||||
- 68 -
Table of Contents
For the year ended December 31, 2013, the total realized gain on investments was $30.6 million. Significant realized gains and (losses) for the year ended December 31, 2013 are summarized below:
| Portfolio Company |
Realization Event |
Net Realized Gains (Losses) (in millions) |
||||
| Worldwide Express Operations, LLC |
Restructuring | $ | 22.2 | |||
| Tulsa Inspection Resources, Inc. |
Exit of portfolio company | 3.9 | ||||
| Goodrich Quality Theaters, Inc. |
Exit of portfolio company | 2.6 | ||||
| Caldwell & Gregory, LLC |
Restructuring | 1.4 | ||||
| Other |
0.5 | |||||
|
|
|
|||||
| Total |
$ | 30.6 | ||||
|
|
|
|||||
During the year ended December 31, 2014, we recorded a net change in unrealized appreciation on investments of $13.3 million attributable to (i) the reversal of net unrealized depreciation on investments of $11.0 million related to the exit or sale of investments, resulting in unrealized appreciation, (ii) net unrealized depreciation of $0.8 million on debt investments and (iii) net unrealized appreciation of $3.1 million on equity investments. During the year ended December 31, 2013, we recorded net unrealized depreciation of $22.2 million attributable to (i) the reversal of net unrealized appreciation on investments of $14.6 million related to the exit or sale of investments, resulting in unrealized depreciation, (ii) net unrealized depreciation of $6.8 million on debt investments and (iii) net unrealized depreciation of $0.8 million on equity investments.
As a result of these events, our net increase in net assets resulting from operations during the year ended December 31, 2014 was $19.5 million, or a decrease of $7.7 million, or 28.4%, compared to a net increase in net assets resulting from operations of $27.2 million during the prior year period.
Liquidity and Capital Resources
As of December 31, 2015, we had $31.7 million in cash and cash equivalents and our net assets totaled $247.4 million. We believe that our current cash and cash equivalents on hand, our continued access to SBA-guaranteed debentures, our Credit Facility and our anticipated cash flows from operations will provide adequate capital resources with which to operate and finance our investment business and make distributions to our stockholders for at least the next 12 months. We intend to generate additional cash primarily from the future offerings of securities (including the ATM Program) and future borrowings, as well as cash flows from operations, including income earned from investments in our portfolio companies. On both a short-term and long-term basis, our primary use of funds will be investments in portfolio companies and cash distributions to our stockholders.
Cash Flows
For the year ended December 31, 2015, we experienced a net increase in cash and cash equivalents in the amount of $2.3 million. During that period, we used $19.5 million of cash for operating activities, primarily for the funding of $136.4 million of investments, which was partially offset by the proceeds from sales and repayments of investments of $94.7 million. During the same period, we received $21.8 million for financing activities resulting from proceeds received from stock offerings, net of expenses, of $3.2 million, proceeds from the issuance of SBA debentures of $40.0 million and net borrowings under the Credit Facility of $5.5 million, which were partially offset by cash dividends paid to stockholders of $25.0 million and the payment of deferred financing costs totaling $1.8 million.
For the year ended December 31, 2014, we experienced a net decrease in cash and cash equivalents in the amount of $24.1 million. During that period, we used $71.3 million of cash for operating activities, primarily for
- 69 -
Table of Contents
the funding of $149.8 million of investments, which was partially offset by the proceeds from sales and repayments of investments of $62.6 million. During the same period, we generated $47.2 million from financing activities resulting from proceeds received from stock offerings, net of expenses, of $36.5 million, proceeds from the issuance of SBA debentures of $29.0 million and borrowings under the Credit Facility of $10.0 million, which were partially offset by cash dividends paid to stockholders of $23.9 million, a $2.9 million payment for taxes paid on behalf of the stockholders related to the 2013 deemed distribution and payments of financing costs totaling $1.6 million.
Capital Resources
We anticipate that we will continue to fund our investment activities on a long-term basis through a combination of additional debt and equity capital.
The Funds are licensed SBICs, and have the ability to issue debentures guaranteed by the SBA at favorable interest rates. Under the Small Business Investment Act and the SBA rules applicable to SBICs, an SBIC can have outstanding at any time debentures guaranteed by the SBA in an amount up to twice its regulatory capital. The SBA regulations currently limit the amount that is available to be borrowed by any SBIC and guaranteed by the SBA to 200.0% of an SBIC’s regulatory capital or $150.0 million, whichever is less. For three or more SBICs under common control, the maximum amount of outstanding SBA debentures cannot exceed $350.0 million. SBA debentures have fixed interest rates that approximate prevailing 10-year Treasury Note rates plus a spread and have a maturity of ten years with interest payable semi-annually. The principal amount of the SBA debentures is not required to be paid before maturity but may be pre-paid at any time. As of December 31, 2015, Fund I had $150.0 million of outstanding SBA debentures and cannot issue additional SBA debentures. As of December 31, 2015, Fund II had $63.5 million of outstanding SBA debentures. Based on its $37.5 million of regulatory capital as of December 31, 2015, Fund II has the current capacity to issue up to an additional $11.5 million of SBA debentures. Subject to SBA regulatory requirements and approval, we may access up to $125.0 million of additional SBA debentures under the SBIC Debenture Program. For more information on the SBA debentures, please see Note 6 to our consolidated financial statements.
In June 2014, we entered into the Credit Facility to provide additional funding for our investment and operational activities. The Credit Facility, which matures on June 16, 2018, had an initial commitment of $30.0 million and an accordion feature that allows for an increase in the total commitments up to $75.0 million, subject to certain customary conditions. The Credit Facility is secured primarily by our assets, excluding the assets of the Funds.
On December 19, 2014, we amended the Credit Facility to (i) increase the commitment from $30.0 million to $50.0 million (ii) allow FIC to buy-back up to $10.0 million of our common stock subject to the satisfaction of specified financial covenants and conditions. The Credit Facility continues to have an accordion feature which allows for an increase in the total commitment up to $75.0 million.
Amounts available to borrow under the Credit Facility are subject to a minimum borrowing/collateral base that applies an advance rate to certain portfolio investments. We are subject to limitations with respect to the investments securing the Credit Facility, including, but not limited to, restrictions on sector concentrations, loan size, payment frequency and status and collateral interests, as well as restrictions on portfolio company leverage, which may also affect the borrowing base and therefore amounts available to borrow.
Borrowings under the Credit Facility bear interest, subject to our election, on a per annum basis equal to (i) the alternate base rate plus 2.5% or (ii) the applicable LIBOR rate plus 3.5%. The alternate base rate is equal to the greater of (i) prime rate, (ii) the federal funds rate plus 0.5% or (iii) the three-month LIBOR rate plus 1.0%. We pay a commitment fee ranging from 0.5% to 1.0% per annum based on the size of the unused portion of the Credit Facility.
- 70 -
Table of Contents
We have made customary representations and warranties and are required to comply with various covenants, reporting requirements and other customary requirements for similar credit facilities. These covenants are subject to important limitations and exceptions that are described in the documents governing the Credit Facility. As of December 31, 2015, we were in compliance with all covenants of the Credit Facility and there was $15.5 million outstanding under the Credit Facility.
As of December 31, 2015, the weighted average interest rate for all SBA debentures and borrowings outstanding under the Credit Facility was 4.0%.
As a BDC, we are generally required to meet a coverage ratio of total assets to total senior securities, which include borrowings and any preferred stock we may issue in the future, of at least 200.0%. This requirement limits the amount that we may borrow. We have received exemptive relief from the Securities and Exchange Commission, or the SEC, to allow us to exclude any indebtedness guaranteed by the SBA and issued by the Funds from the 200.0% asset coverage requirements, which, in turn, will enable us to fund more investments with debt capital.
As a BDC, we are generally not permitted to issue and sell our common stock at a price below net asset value per share. We may, however, sell our common stock, or warrants, options or rights to acquire our common stock, at a price below the then-current net asset value per share of our common stock if our board of directors, including Independent Directors, determines that such sale is in the best interests of us and our stockholders, and if our stockholders approve such sale. On June 3, 2015, our stockholders voted to allow us to sell or otherwise issue common stock at a price below net asset value per share for a period of one year ending on the earlier of June 3, 2016 or the date of our 2016 Annual Meeting of Stockholders. We expect to present to our stockholders a similar proposal at our 2016 Annual Meeting of Stockholders. Our stockholders specified that the cumulative number of shares sold in each offering during the one-year period ending on the earlier of June 3, 2016 or the date of our 2016 Annual Meeting of Stockholders may not exceed 25.0% of our outstanding common stock immediately prior to each such sale.
Critical Accounting Policies and Use of Estimates
The preparation of financial statements in accordance with GAAP requires management to make certain estimates and assumptions affecting amounts reported in the financial statements. We have identified investment valuation and revenue recognition as our most critical accounting estimates. We continuously evaluate our estimates, including those related to the matters described below. These estimates are based on the information that is currently available to us and on various other assumptions that we believe to be reasonable under the circumstances. Actual results could differ materially from those estimates under different assumptions or conditions. A discussion of our critical accounting policies follows.
Valuation of Portfolio Investments
As a BDC, we report our assets and liabilities at fair value at all times consistent with GAAP and the 1940 Act. Accordingly, we are required to periodically determine the fair value of all of our portfolio investments.
Our investments generally consist of illiquid securities including debt and equity investments in lower middle-market companies. Investments for which market quotations are readily available are valued at such market quotations. Because we expect that there will not be a readily available market for substantially all of the investments in our portfolio, we value substantially all of our portfolio investments at fair value as determined in good faith by our board of directors using a documented valuation policy and consistently applied valuation process. Due to the inherent uncertainty of determining the fair value of investments that do not have a readily available market value, the fair value of our investments may differ significantly from the values that would have been used had a readily available market value existed for such investments, and the difference could be material.
- 71 -
Table of Contents
With respect to investments for which market quotations are not readily available, our board of directors undertakes a multi-step valuation process each quarter, as described below:
| • | our quarterly valuation process begins with each portfolio company or investment being initially evaluated and rated by the investment professionals of our investment advisor responsible for the portfolio investment; |
| • | preliminary valuation conclusions are then documented and discussed with the investment committee of our investment advisor; |
| • | our board of directors engages one or more independent valuation firm(s) to conduct independent appraisals of a selection of our portfolio investments for which market quotations are not readily available. Each portfolio company investment is generally appraised by the valuation firm(s) at least once every calendar year and each new portfolio company investment is appraised at least once in the twelve-month period following the initial investment. In certain instances, we may determine that it is not cost-effective, and as a result it is not in our stockholders’ best interest, to request the independent appraisal of certain portfolio company investments. Such instances include, but are not limited to, situations where we determine that the fair value of the portfolio company investment is relatively insignificant to the fair value of the total portfolio. Our board of directors consulted with the independent valuation firm(s) in arriving at our determination of fair value for 16 and 9 of our portfolio company investments representing 43.0% and 20.7% of the total portfolio investments at fair value (exclusive of new portfolio company investments made during the three months ended December 31, 2015 and 2014, respectively) as of December 31, 2015 and 2014, respectively; |
| • | the audit committee of our board of directors reviews the preliminary valuations of our investment advisor and of the independent valuation firm(s) and responds and supplements the valuation recommendations to reflect any comments; and |
| • | our board of directors discusses the valuations and determines the fair value of each investment in our portfolio in good faith, based on the input of our investment advisor, the independent valuation firm(s) and the audit committee. |
In making the good faith determination of the value of portfolio investments, we start with the cost basis of the security. The transaction price is typically the best estimate of fair value at inception. When evidence supports a subsequent change to the carrying value from the original transaction price, adjustments are made to reflect the expected exit values.
Consistent with the policies and methodologies adopted by our board of directors, we perform detailed valuations of our debt and equity investments, including an analysis on the Company’s unfunded loan commitments, using both the market and income approaches as appropriate. Under the market approach, we typically use the enterprise value methodology to determine the fair value of an investment. There is no one methodology to estimate enterprise value and, in fact, for any one portfolio company, enterprise value is generally best expressed as a range of values, from which we derive a single estimate of enterprise value. Under the income approach, we typically prepare and analyze discounted cash flow models to estimate the present value of future cash flows of either an individual debt investment or of the underlying portfolio company itself.
We evaluate investments in portfolio companies using the most recent portfolio company financial statements and forecasts. We also consult with the portfolio company’s senior management to obtain further updates on the portfolio company’s performance, including information such as industry trends, new product development and other operational issues.
For our debt investments, including senior secured loans and subordinated notes, the primary valuation technique used to estimate the fair value is the discounted cash flow method. However, if there is deterioration in credit quality or a debt investment is in workout status, we may consider other methods in determining the fair
- 72 -
Table of Contents
value, including the value attributable to the debt investment from the enterprise value of the portfolio company or the proceeds that would be received in a liquidation analysis. Our discounted cash flow models estimate a range of fair values by applying an appropriate discount rate to the future cash flow streams of our debt investments, based on future interest and principal payments as set forth in the associated loan agreements. We prepare a weighted average cost of capital for use in the discounted cash flow model for each investment, based on factors including, but not limited to: current pricing and credit metrics for similar proposed or executed investment transactions of private companies; the portfolio company’s historical financial results and outlook; and the portfolio company’s current leverage and credit quality as compared to leverage and credit quality as of the date the investment was made. We may also consider the following factors when determining the fair value of debt investments: the portfolio company’s ability to make future scheduled payments; prepayment penalties and other fees; estimated remaining life; the nature and realizable value of any collateral securing such debt investment; and changes in the interest rate environment and the credit markets that generally may affect the price at which similar investments may be made. We estimate the remaining life of our debt investments to generally be the legal maturity date of the instrument, as we generally intend to hold loans to maturity. However, if we have information available to us that the loan is expected to be repaid in the near term, we would use an estimated remaining life based on the expected repayment date.
For our equity investments, including equity securities and warrants, we generally use a market approach, including valuation methodologies consistent with industry practice, to estimate the enterprise value of portfolio companies. Typically, the enterprise value of a private company is based on multiples of EBITDA, net income, revenues, or in limited cases, book value. In estimating the enterprise value of a portfolio company, we analyze various factors consistent with industry practice, including but not limited to original transaction multiples, the portfolio company’s historical and projected financial results, applicable market trading and transaction comparables, applicable market yields and leverage levels, the nature and realizable value of any collateral, the markets in which the portfolio company does business, and comparisons of financial ratios of peer companies that are public. Where applicable, we consider our ability to influence the capital structure of the portfolio company, as well as the timing of a potential exit.
We may also utilize an income approach when estimating the fair value of our equity securities, either as a primary methodology if consistent with industry practice or if the market approach is otherwise not applicable, or as a supporting methodology to corroborate the fair value ranges determined by the market approach. We typically prepare and analyze discounted cash flow models based on projections of the future free cash flows (or earnings) of the portfolio company. We consider various factors, including but not limited to the portfolio company’s projected financial results, applicable market trading and transaction comparables, applicable market yields and leverage levels, the markets in which the portfolio company does business, and comparisons of financial ratios of peer companies that are public.
The fair value of our royalty rights are calculated based on projected future cash flows and the specific provisions contained in the pertinent royalty agreement. The determination of the fair value of such royalty rights is not a significant component of our valuation process.
Determination of fair value involves subjective judgments and estimates. Accordingly, the notes to our consolidated financial statements express the uncertainties with respect to the possible effect of such valuations, and any changes in such valuations, on the consolidated financial statements.
Revenue Recognition
Investments and related investment income. Realized gains or losses on investments are recorded upon the sale or disposition of a portfolio investment and are calculated as the difference between the net proceeds from the sale or disposition and the cost basis of the investment, without regard to unrealized appreciation or depreciation previously recognized. Net change in unrealized appreciation or depreciation on the consolidated statements of operations includes changes in the fair value of investments from the prior period, as determined by
- 73 -
Table of Contents
our board of directors through the application of our valuation policy, as well as reclassifications of any prior period unrealized appreciation or depreciation on exited investments to realized gains or losses on investments.
Interest and dividend income. Interest and dividend income are recorded on the accrual basis to the extent that we expect to collect such amounts. Interest and dividend income is accrued daily based on the outstanding principal amount and the contractual terms of the debt or preferred equity investment. Dividend income is recorded at the point an obligation exists for the portfolio company to make a distribution. Distributions from portfolio companies are evaluated to determine if the distribution is a distribution of earnings or a return of capital.
Payment-in-kind interest. Certain of our investments contain a PIK income provision. The PIK income, computed at the contractual rate specified in the applicable investment agreement, is added to the principal balance of the investment, rather than being paid in cash, and recorded as interest or dividend income, as applicable, on the consolidated statements of operations. Generally, PIK can be paid-in-kind or all in cash. We stop accruing PIK income when there is reasonable doubt that PIK income will be collected. PIK income is included in our taxable income and, therefore, affects the amount we are required to pay to our stockholders in the form of dividends in order to maintain our status as a RIC and to avoid paying corporate federal income tax, even though we have not yet collected the cash.
Non-accrual. When there is reasonable doubt that principal, interest or dividends will be collected, loans or preferred equity investments are placed on non-accrual status and we will generally cease recognizing interest or dividend income. Interest and dividend payments received on non-accrual investments may be recognized as interest or dividend income or applied to the investment principal balance based on management’s judgment. Non-accrual investments are restored to accrual status when past due principal, interest or dividends are paid and, in management’s judgment, are likely to remain current.
Warrants. In connection with our debt investments, we will sometimes receive warrants or other equity-related securities, or Warrants. We determine the cost basis of Warrants based upon their respective fair values on the date of receipt in proportion to the total fair value of the debt and Warrants received. Any resulting difference between the face amount of the debt and its recorded fair value resulting from the assignment of value to the Warrants are treated as original issue discount, or OID, and accreted into interest income using the effective interest method over the term of the debt investment.
Fee income. All transaction fees earned in connection with our investments are recognized as fee income. Such fees typically include fees for services, including structuring and advisory services, provided to portfolio companies. We recognize income from fees for providing such structuring and advisory services when the services are rendered or the transactions are completed. Upon the prepayment of a loan or debt security, any prepayment penalties are recorded as fee income when earned. Prior to the Formation Transactions, and in accordance with the prior limited partnership agreement, we historically recorded transaction fees provided in connection with our investments as a direct offset to management fee expense.
We also typically receive loan origination or closing fees in connection with investments. Such loan origination and closing fees are capitalized as unearned income and offset against investment cost basis on our consolidated statements of assets and liabilities and accreted into income over the life of the investment.
Recently Issued Accounting Standards
In February 2015, the FASB issued ASU 2015-02, Consolidation: Amendments to the Consolidation Analysis, which amends the criteria for determining which entities are considered variable interest entities (“VIEs”), amends the criteria for determining if a service provider possesses a variable interest in a VIE and ends the deferral granted to investment companies for application of the VIE consolidation model. This guidance is effective for annual and interim reporting periods of public entities beginning after December 15, 2015 and early adoption is permitted. We are currently evaluating the impact this ASU will have on our consolidated financial position or disclosures.
- 74 -
Table of Contents
In April 2015, FASB issued ASU 2015-03, Interest – Imputation of interest (Subtopic 835-30): Simplifying the Presentation of Debt Issuance Costs, which requires that debt issuance costs related to a recognized debt liability be presented in the balance sheet as a direct deduction from the carrying amount of that debt liability rather than as an asset. Amortization of the costs will continue to be reported as interest expense. This guidance is effective for annual and interim periods beginning after December 15, 2015 and early adoption is permitted. The new guidance will be applied retrospectively to each prior period presented. We are currently evaluating the impact this ASU will have on our consolidated financial position or disclosures.
In August 2015, the Financial Accounting Standards Board (“FASB”) issued Accounting Standards Update (“ASU”) 2015-14, Revenue from Contracts with Customers (Topic 606), which supersedes the revenue recognition requirements in Revenue Recognition (Topic 605). Under the new guidance, an entity should recognize revenue to depict the transfer of promised goods or services to customers in an amount that reflects the consideration to which the entity expects to be entitled in exchange for those goods or services. This guidance is effective for annual and interim reporting periods beginning after December 15, 2017 and early application is permitted only for annual reporting periods beginning after December 15, 2016, including interim reporting periods within that reporting period. We are currently evaluating the impact this ASU will have on our consolidated financial position or disclosures.
Off-Balance Sheet Arrangements
We may be a party to financial instruments with off-balance sheet risk in the normal course of business to meet the financial needs of our portfolio companies. As of December 31, 2015, we had off-balance sheet arrangements consisting of six unfunded revolving loan commitments totaling $4.7 million to portfolio companies and three unfunded loan commitments totaling $5.4 million to portfolio companies. As of December 31, 2014, we had off-balance sheet arrangements consisting of consisting of five unfunded revolving loan commitments totaling $4.1 million to portfolio companies and two unfunded loan commitment totaling $5.4 million to a portfolio company.
Contractual Obligations
As of December 31, 2015 our future fixed commitments for cash payments are as follows:
| Total | Less Than 1 Year |
1 – 3 Years |
3 – 5 Years |
More than 5 Years |
||||||||||||||||
| (Dollars in thousands) | ||||||||||||||||||||
| SBA debentures |
$ | 213,500 | $ | — | $ | 36,700 | $ | 55,250 | $ | 121,550 | ||||||||||
| Interest due on SBA debentures |
42,472 | 8,254 | 15,490 | 9,274 | 9,454 | |||||||||||||||
| Credit Facility borrowings |
15,500 | — | 15,500 | — | — | |||||||||||||||
| Interest and fees due on Credit Facility(1) |
1,451 | 667 | 784 | — | — | |||||||||||||||
|
|
|
|
|
|
|
|
|
|
|
|||||||||||
| Total |
$ | 272,923 | $ | 8,921 | $ | 68,474 | $ | 64,524 | $ | 131,004 | ||||||||||
|
|
|
|
|
|
|
|
|
|
|
|||||||||||
| (1) | Amounts represent (i) commitment fees on the unused portion of Credit Facility calculated at a rate of 1.0% of the unused amount as of December 31, 2015, which was $34.5 million, (ii) interest expense calculated at a weighted average interest rate of 3.9% of outstanding borrowings under the Credit Facility as of December 31, 2015, which were $15.5 million and (iii) annual agency fees due to the Credit Facility administrative agent. |
We have certain contracts under which we have material future commitments. We entered into the Investment Advisory Agreement with our investment advisor in accordance with the 1940 Act. Under the Investment Advisory Agreement, our investment advisor provides us with investment advisory and management services. We pay the following amounts for these services (a) a management fee equal to a percentage of the
- 75 -
Table of Contents
average of our total assets (excluding cash and cash equivalents) and (b) an incentive fee based on our performance. See “Business — Management and Other Agreements — Investment Advisory Agreement — Management Fee.”
Under the Administration Agreement, our investment advisor furnishes us with office facilities and equipment, provides us clerical, bookkeeping and record keeping services at such facilities and provides us with other administrative services necessary to conduct our day-to-day operations. See “Business — Management and Other Agreements — Administration Agreement.”
If any of our contractual obligations discussed above are terminated, our costs under any new agreements that we enter into may increase. In addition, we would likely incur significant time and expense in locating alternative parties to provide the services we expect to receive under our Investment Advisory Agreement and our Administration Agreement. Any new investment advisory agreement would also be subject to approval by our Independent Directors and our stockholders.
Related Party Transactions
We have entered into a number of business relationships with affiliated or related parties, including the following:
| • | In connection with the Formation Transactions, Fund I terminated its management services agreement with Fidus Capital, LLC and we entered into the Investment Advisory Agreement with Fidus Investment Advisors, LLC, as our investment advisor. The investment professionals of Fidus Investment Advisors, LLC were also the investment professionals of Fidus Capital, LLC. We entered into the Investment Advisory Agreement with Fidus Investment Advisors, LLC to manage our day-to-day operating and investing activities. We pay our investment advisor a fee for its services under the Investment Advisory Agreement consisting of two components — a base management fee and an incentive fee. See Note 5 to our consolidated financial statements. |
| Edward H. Ross, our Chairman and Chief Executive Officer and Thomas C. Lauer, one of our directors, are managers of Fidus Investment Advisors, LLC. In May 2015, Fidus Investment Advisors, LLC entered into a combination with Fidus Partners, LLC (the “Combination”), by which members of Fidus Investment Advisors LLC and Fidus Partners, LLC (“Partners”) contributed all of their respective membership interest in Fidus Investment Advisors LLC and Partners to a newly formed limited liability company, Fidus Group Holdings, LLC (“Holdings”). As a result, Fidus Investment Advisors LLC is a wholly-owned subsidiary of Holdings, which is a newly formed limited liability company organized under the laws of Delaware. |
| • | We entered into the Administration Agreement with Fidus Investment Advisors, LLC to provide us with the office facilities and administrative services necessary to conduct day-to-day operations. See Note 5 to our consolidated financial statements. |
| • | We entered into a license agreement with Fidus Partners, LLC, pursuant to which Fidus Partners, LLC has granted us a non-exclusive, royalty-free license to use the name “Fidus.” |
In connection with the IPO and our election to be regulated as a BDC, we applied for and received exemptive relief from the SEC on March 27, 2012 to allow us to take certain actions that would otherwise be prohibited by the 1940 Act, as applicable to BDCs. The relief permits FIC and Fund I, each of which has elected to be treated as a BDC, to operate effectively as one company, specifically allowing them to: (1) engage in certain transactions with each other; (2) invest in securities in which the other is or proposes to be an investor; (3) file consolidated reports with the Commission; and (4) be subject to modified consolidated asset coverage requirements for senior securities issued by a BDC and its SBIC subsidiary. Fund II has not elected to be treated as a BDC and is not party to this exemptive relief. The fourth exemption described above allows us to exclude any indebtedness guaranteed by the SBA and issued by Fund I from the 200.0% asset coverage requirements
- 76 -
Table of Contents
applicable to us. Effective September 30, 2014, any SBA debentures issued by Fund II are not considered senior securities for purposes of the 200.0% asset coverage requirements.
In addition, we, Fund I and our investment advisor have each adopted a joint code of ethics pursuant to Rule 17j-1 under the 1940 Act that governs the conduct of our and our investment advisor’s officers, directors and employees. Additionally, our investment advisor has adopted a code of ethics pursuant to rule 240A-1 under the 1940 Act and in accordance with Rule 17j-1(c). We, and Fund I, have also adopted a code of business conduct that is applicable to all officers, directors and employees of Fidus and our investment advisor. Our officers and directors also remain subject to the duties imposed by both the 1940 Act and the Maryland General Corporation Law.
Recent Developments
On January 15, 2016, we invested $10.5 million in the subordinated notes and common equity of OMC Investors, LLC, doing business as Ohio Medical Corporation, a manufacturer and distributer of medical suction and oxygen therapy products and source equipment.
On January 27, 2016, we filed an exemptive application with the SEC to permit us to co-invest with funds or entities managed by our investment adviser in certain negotiated transactions where co-investing would otherwise be prohibited under the 1940 Act. Any such order, if granted by the SEC, will be subject to certain terms and conditions. Furthermore, there is no assurance when, or if, this application for exemptive relief will be granted by the SEC.
On January 28, 2016, we announced that our board of directors authorized an open market stock repurchase program (the “Program”) under which we may acquire up to $5.0 million of our outstanding common stock. Under the Program, we may, but are not obligated to, repurchase our outstanding common stock in the open market from time to time provided that we comply with the prohibitions under our insider trading policies and the requirements of Rule 10b-18 of the Exchange Act, including certain price, market volume and timing constraints. The timing, manner, price and amount of any share repurchases will be determined by the Company’s management, in its discretion, based upon the evaluation of economic and market conditions, stock price, capital availability, applicable legal and regulatory requirements and other corporate considerations. Unless extended by our board of directors, we expect that the Program will be in effect until January 22, 2017, or until the approved dollar amount has been used to repurchase shares. The program does not require us to repurchase any specific number of shares and Fidus cannot assure that any shares will be repurchased under the program. The program may be suspended, extended, modified or discontinued at any time.
On January 29, 2016, we exited our debt and warrant investments in Continental Anesthesia Management, LLC in connection with the sale of the portfolio company. We received payment in full on our subordinated notes and recognized a loss of approximately $0.3 million on our warrant investment.
On February 1, 2016, we exited our debt and equity investments in X5 Opco LLC. We received payment in full on our senior secured loan, including a prepayment penalty, and sold our equity at a price approximating cost.
On February 16, 2016, we exited our debt investment in Stagnito Partners, LLC. We received payment in full on our senior secured loan, including a prepayment penalty.
On February 16, 2016, the board of directors declared a regular quarterly dividend of $0.39 per share, which is payable on March 25, 2016 to stockholders of record as of March 11, 2016.
- 77 -
Table of Contents
Item 7A. Quantitative and Qualitative Disclosures About Market Risk.
We are subject to financial market risks, including changes in interest rates. Changes in interest rates affect both our cost of funding and the valuation of our investment portfolio. Our risk management systems and procedures are designed to identify and analyze our risk, to set appropriate policies and limits and to continually monitor these risks and limits by means of reliable administrative and information systems and other policies and programs. In the future, our investment income may also be affected by changes in various interest rates, including LIBOR and prime rates, to the extent of any debt investments that include floating interest rates. As of December 31, 2015, one debt investment bore interest at a variable rate, which represented $8.9 million of our portfolio on a fair value basis, and the remainder of our debt portfolio was comprised entirely of fixed rate investments. As of December 31, 2014, our debt portfolio was comprised entirely of fixed rate investments. Assuming that the consolidated statements of assets and liabilities as of December 31, 2015 and 2014 were to remain constant, a hypothetical 100 basis point change in interest rates would not have a material effect on our level of interest income from debt investments. Our pooled SBA debentures bear interest at fixed rates. Our Credit Facility bears interest, subject to our election, on a per annum basis equal to (i) the alternate base rate plus 2.5% or (ii) the applicable LIBOR rate plus 3.5%. The alternate base rate is equal to the greater of (i) prime rate, (ii) the federal funds rate plus 0.5% or (iii) the three-month LIBOR rate plus 1.0%.
Because we currently borrow, and plan to borrow in the future, money to make investments, our net investment income is dependent upon the difference between the rate at which we borrow funds and the rate at which we invest the funds borrowed. Accordingly, there can be no assurance that a significant change in market interest rates will not have a material adverse effect on our net investment income. In periods of rising interest rates, our cost of funds would increase, which could reduce our net investment income if there is not a corresponding increase in interest income generated by our investment portfolio.
- 78 -
Table of Contents
Item 8. Consolidated Financial Statements and Supplementary Data.
Index to Consolidated Financial Statements
- 79 -
Table of Contents
Report of Independent Registered Public Accounting Firm
To the Board of Directors and Stockholders
Fidus Investment Corporation and Subsidiaries
We have audited Fidus Investment Corporation and Subsidiaries’ (collectively, the “Company”) internal control over financial reporting as of December 31, 2015, based on criteria established in Internal Control — Integrated Framework issued by the Committee of Sponsoring Organizations of the Treadway Commission in 2013. The Company’s management is responsible for maintaining effective internal control over financial reporting, and for its assessment of the effectiveness of internal control over financial reporting included in the accompanying Management’s Report on Internal Control over Financial Reporting. Our responsibility is to express an opinion on the Company’s internal control over financial reporting based on our audit.
We conducted our audit in accordance with the standards of the Public Company Accounting Oversight Board (United States). Those standards require that we plan and perform the audit to obtain reasonable assurance about whether effective internal control over financial reporting was maintained in all material respects. Our audit included obtaining an understanding of internal control over financial reporting, assessing the risk that a material weakness exists, and testing and evaluating the design and operating effectiveness of internal control based on the assessed risk. Our audit also included performing such other procedures as we considered necessary in the circumstances. We believe that our audit provides a reasonable basis for our opinion.
A company’s internal control over financial reporting is a process designed to provide reasonable assurance regarding the reliability of financial reporting and the preparation of financial statements for external purposes in accordance with generally accepted accounting principles. A company’s internal control over financial reporting includes those policies and procedures that (a) pertain to the maintenance of records that, in reasonable detail, accurately and fairly reflect the transactions and dispositions of the assets of the company; (b) provide reasonable assurance that transactions are recorded as necessary to permit preparation of financial statements in accordance with generally accepted accounting principles, and that receipts and expenditures of the company are being made only in accordance with authorizations of management and directors of the company; and (c) provide reasonable assurance regarding prevention or timely detection of unauthorized acquisition, use, or disposition of the company’s assets that could have a material effect on the financial statements.
Because of its inherent limitations, internal control over financial reporting may not prevent or detect misstatements. Also, projections of any evaluation of effectiveness to future periods are subject to the risk that controls may become inadequate because of changes in conditions, or that the degree of compliance with the policies or procedures may deteriorate.
In our opinion, Fidus Investment Corporation and Subsidiaries maintained, in all material respects, effective internal control over financial reporting as of December 31, 2015, based on criteria established in Internal Control — Integrated Framework issued by the Committee of Sponsoring Organizations of the Treadway Commission in 2013.
We have also audited, in accordance with the standards of the Public Company Accounting Oversight Board (United States), the consolidated statements of assets and liabilities, including the consolidated schedules of investments, of Fidus Investment Corporation and Subsidiaries as of December 31, 2015 and 2014, and the related consolidated statements of operations, changes in net assets and cash flows for each of the three years in the period ended December 31, 2015, and our report dated March 3, 2016 expressed an unqualified opinion.
/s/ RSM US LLP
Chicago, Illinois
March 3, 2016
- 80 -
Table of Contents
Report of Independent Registered Public Accounting Firm
To the Board of Directors and Stockholders
Fidus Investment Corporation and Subsidiaries
We have audited the accompanying consolidated statements of statement of assets and liabilities, including the consolidated schedules of investments, of Fidus Investment Corporation and Subsidiaries (collectively, the “Company”) as of December 31, 2015 and 2014, and the related consolidated statements of operations, changes in net assets and cash flows for each of the three years in the period ended December 31, 2015. These financial statements are the responsibility of the Company’s management. Our responsibility is to express an opinion on these financial statements based on our audits.
We conducted our audits in accordance with the standards of the Public Company Accounting Oversight Board (United States). Those standards require that we plan and perform the audit to obtain reasonable assurance about whether the financial statements are free of material misstatement. An audit includes examining, on a test basis, evidence supporting the amounts and disclosures in the financial statements. An audit also includes assessing the accounting principles used and significant estimates made by management, as well as evaluating the overall financial statement presentation. Our procedures included confirmation of investments owned as of December 31, 2015 and 2014, by correspondence with the custodian, loan agent, or borrower or by other appropriate procedures where replies from the custodian, loan agent or borrower were not received. We believe that our audits provide a reasonable basis for our opinion.
In our opinion, the consolidated financial statements referred to above present fairly, in all material respects, the financial position of Fidus Investment Corporation and Subsidiaries as of December 31, 2015 and 2014, and the results of their operations and their cash flows for each of the three years in the period ended December 31, 2015 in conformity with U.S. generally accepted accounting principles.
We have also audited, in accordance with the standards of the Public Company Accounting Oversight Board (United States), Fidus Investment Corporation and Subsidiaries’ internal control over financial reporting as of December 31, 2015, based on criteria established in Internal Control — Integrated Framework issued by the Committee of Sponsoring Organizations of the Treadway Commission in 2013, and our report dated March 3, 2016, expressed an unqualified opinion on the effectiveness of the Company’s internal control over financial reporting.
/s/ RSM US LLP
Chicago, Illinois
March 3, 2016
- 81 -
Table of Contents
FIDUS INVESTMENT CORPORATION
Consolidated Statements of Assets and Liabilities
(In thousands, except shares and per share data)
| December 31, 2015 |
December 31, 2014 |
|||||||
| ASSETS | ||||||||
| Investments, at fair value |
||||||||
| Control investments (cost: $12,042 and $10,460, respectively) |
$ | 618 | $ | 4,244 | ||||
| Affiliate investments (cost: $105,930 and $81,979, respectively) |
111,846 | 86,200 | ||||||
| Non-control/non-affiliate investments (cost: $330,366 and $298,899, respectively) |
330,805 | 305,911 | ||||||
|
|
|
|
|
|||||
| Total investments, at fair value (cost: $448,338 and $391,338, respectively) |
443,269 | 396,355 | ||||||
| Cash and cash equivalents |
31,657 | 29,318 | ||||||
| Interest receivable |
4,520 | 4,460 | ||||||
| Deferred financing costs (net of accumulated amortization of $3,794 and $2,784, respectively) |
4,872 | 4,567 | ||||||
| Prepaid expenses and other assets |
1,222 | 887 | ||||||
|
|
|
|
|
|||||
| Total assets |
$ | 485,540 | $ | 435,587 | ||||
|
|
|
|
|
|||||
| LIABILITIES | ||||||||
| SBA debentures |
$ | 213,500 | $ | 173,500 | ||||
| Borrowings under credit facility |
15,500 | 10,000 | ||||||
| Accrued interest and fees payable |
2,840 | 2,853 | ||||||
| Due to affiliates |
5,762 | 5,395 | ||||||
| Taxes payable |
400 | 328 | ||||||
| Accounts payable and other liabilities |
176 | 248 | ||||||
|
|
|
|
|
|||||
| Total liabilities |
238,178 | 192,324 | ||||||
|
|
|
|
|
|||||
| Commitments and contingencies (Note 7) |
||||||||
| NET ASSETS | ||||||||
| Common stock, $0.001 par value (100,000,000 shares authorized, 16,300,732 and 16,051,037 shares issued and outstanding at December 31, 2015 and December 31, 2014, respectively) |
16 | 16 | ||||||
| Additional paid-in capital |
246,307 | 243,008 | ||||||
| Undistributed net investment income |
13,887 | 12,433 | ||||||
| Accumulated net realized (loss) gain on investments, net of taxes and distributions |
(6,145 | ) | (15,999 | ) | ||||
| Accumulated net unrealized (depreciation) appreciation on investments |
(6,703 | ) | 3,805 | |||||
|
|
|
|
|
|||||
| Total net assets |
247,362 | 243,263 | ||||||
|
|
|
|
|
|||||
| Total liabilities and net assets |
$ | 485,540 | $ | 435,587 | ||||
|
|
|
|
|
|||||
| Net asset value per common share |
$ | 15.17 | $ | 15.16 | ||||
|
|
|
|
|
|||||
See Notes to Consolidated Financial Statements.
- 82 -
Table of Contents
FIDUS INVESTMENT CORPORATION
Consolidated Statements of Operations
(In thousands, except shares and per share data)
| Years Ended December 31, | ||||||||||||
| 2015 | 2014 | 2013 | ||||||||||
| Investment income: |
||||||||||||
| Interest income |
||||||||||||
| Control investments |
$ | 220 | $ | 86 | $ | 1,648 | ||||||
| Affiliate investments |
10,400 | 9,738 | 8,969 | |||||||||
| Non-control/non-affiliate investments |
39,973 | 30,473 | 27,033 | |||||||||
|
|
|
|
|
|
|
|||||||
| Total interest income |
50,593 | 40,297 | 37,650 | |||||||||
| Dividend income |
||||||||||||
| Affiliate investments |
412 | 150 | 139 | |||||||||
| Non-control/non-affiliate investments |
548 | 1,865 | 1,539 | |||||||||
|
|
|
|
|
|
|
|||||||
| Total dividend income |
960 | 2,015 | 1,678 | |||||||||
| Fee income |
||||||||||||
| Control investments |
— | — | 176 | |||||||||
| Affiliate investments |
591 | 584 | 337 | |||||||||
| Non-control/non-affiliate investments |
2,072 | 3,193 | 1,801 | |||||||||
|
|
|
|
|
|
|
|||||||
| Total fee income |
2,663 | 3,777 | 2,314 | |||||||||
| Interest on idle funds and other income |
53 | 27 | 150 | |||||||||
|
|
|
|
|
|
|
|||||||
| Total investment income |
54,269 | 46,116 | 41,792 | |||||||||
|
|
|
|
|
|
|
|||||||
| Expenses: |
||||||||||||
| Interest and financing expenses |
9,428 | 7,507 | 7,076 | |||||||||
| Base management fee |
7,545 | 5,899 | 5,261 | |||||||||
| Incentive fee |
6,481 | 4,857 | 6,792 | |||||||||
| Administrative service expenses |
1,465 | 1,772 | 1,155 | |||||||||
| Professional fees |
1,255 | 1,182 | 851 | |||||||||
| Other general and administrative expenses |
1,212 | 1,235 | 1,115 | |||||||||
|
|
|
|
|
|
|
|||||||
| Total expenses |
27,386 | 22,452 | 22,250 | |||||||||
|
|
|
|
|
|
|
|||||||
| Net investment income before income taxes |
26,883 | 23,664 | 19,542 | |||||||||
| Income tax provision |
390 | 383 | 246 | |||||||||
|
|
|
|
|
|
|
|||||||
| Net investment income |
26,493 | 23,281 | 19,296 | |||||||||
|
|
|
|
|
|
|
|||||||
| Net realized and unrealized gains (losses) on investments: |
||||||||||||
| Realized gains on control investments |
— | — | 22,231 | |||||||||
| Net realized gains (losses) on affiliate investments |
1,686 | (12,121 | ) | — | ||||||||
| Net realized gains (losses) on non-control/non-affiliate investments |
7,845 | (4,908 | ) | 8,357 | ||||||||
| Net change in unrealized (depreciation) appreciation on investments |
(10,086 | ) | 13,250 | (22,188 | ) | |||||||
| Income tax benefit (provision) from realized gains on investments |
39 | (17 | ) | (493 | ) | |||||||
|
|
|
|
|
|
|
|||||||
| Net (loss) gain on investments |
(516 | ) | (3,796 | ) | 7,907 | |||||||
|
|
|
|
|
|
|
|||||||
| Net increase in net assets resulting from operations |
$ | 25,977 | $ | 19,485 | $ | 27,203 | ||||||
|
|
|
|
|
|
|
|||||||
| Per common share data: |
||||||||||||
| Net investment income per share-basic and diluted |
$ | 1.64 | $ | 1.62 | $ | 1.43 | ||||||
|
|
|
|
|
|
|
|||||||
| Net increase in net assets resulting from operations per share-basic and diluted |
$ | 1.60 | $ | 1.36 | $ | 2.01 | ||||||
|
|
|
|
|
|
|
|||||||
| Dividends paid per share |
$ | 1.60 | $ | 1.72 | $ | 1.94 | ||||||
|
|
|
|
|
|
|
|||||||
| Weighted average number of shares outstanding - basic and diluted |
16,201,449 | 14,346,438 | 13,524,368 | |||||||||
|
|
|
|
|
|
|
|||||||
See Notes to Consolidated Financial Statements.
- 83 -
Table of Contents
FIDUS INVESTMENT CORPORATION
Consolidated Statements of Changes in Net Assets
(In thousands, except shares)
| Common Stock | Additional Paid in Capital |
Undistributed Net Investment Income |
Accumulated Net Realized (Loss) Gain on Investments, net of taxes and distributions |
Accumulated Net Unrealized (Depreciation) Appreciation on Investments |
Total Net Assets |
|||||||||||||||||||||||
| Number of Shares |
Par Value |
|||||||||||||||||||||||||||
| Balances at December 31, 2012 |
11,953,847 | $ | 12 | $ | 177,498 | $ | 455 | $ | 1,493 | $ | 3,633 | $ | 183,091 | |||||||||||||||
| Public offerings of common stock, net of expenses |
1,725,000 | 2 | 28,855 | — | — | — | 28,857 | |||||||||||||||||||||
| Shares issued under dividend reinvestment plan |
76,385 | — | 1,464 | — | — | — | 1,464 | |||||||||||||||||||||
| Net increase in net assets resulting from operations |
— | — | — | 19,296 | 20,985 | (13,078 | ) | 27,203 | ||||||||||||||||||||
| Dividends declared |
— | — | — | (16,603 | ) | (10,000 | ) | — | (26,603 | ) | ||||||||||||||||||
| Deemed distribution |
— | — | 5,363 | — | (8,250 | ) | — | (2,887 | ) | |||||||||||||||||||
| Tax reclassificaiton of stockholders’ equity in accordance with generally accepted accounting principles |
— | — | (7,057 | ) | 73 | 6,984 | — | — | ||||||||||||||||||||
|
|
|
|
|
|
|
|
|
|
|
|
|
|
|
|||||||||||||||
| Balances at December 31, 2013 |
13,755,232 | 14 | 206,123 | 3,221 | 11,212 | (9,445 | ) | 211,125 | ||||||||||||||||||||
| Public offerings of common stock, net of expenses |
2,241,767 | 2 | 36,540 | — | — | — | 36,542 | |||||||||||||||||||||
| Shares issued under dividend reinvestment plan |
54,038 | — | 935 | — | — | — | 935 | |||||||||||||||||||||
| Net increase in net assets resulting from operations |
— | — | — | 23,281 | (17,046 | ) | 13,250 | 19,485 | ||||||||||||||||||||
| Dividends declared |
— | — | — | (14,435 | ) | (10,389 | ) | — | (24,824 | ) | ||||||||||||||||||
| Tax reclassificaiton of stockholders’ equity in accordance with generally accepted accounting principles |
— | — | (590 | ) | 366 | 224 | — | — | ||||||||||||||||||||
|
|
|
|
|
|
|
|
|
|
|
|
|
|
|
|||||||||||||||
| Balances at December 31, 2014 |
16,051,037 | 16 | 243,008 | 12,433 | (15,999 | ) | 3,805 | 243,263 | ||||||||||||||||||||
| Public offerings of common stock, net of expenses |
190,623 | — | 3,170 | — | — | — | 3,170 | |||||||||||||||||||||
| Shares issued under dividend reinvestment plan, net of expenses |
59,072 | — | 899 | — | — | — | 899 | |||||||||||||||||||||
| Net increase in net assets resulting from operations |
— | — | — | 26,493 | 9,992 | (10,508 | ) | 25,977 | ||||||||||||||||||||
| Dividends declared |
— | — | — | (25,947 | ) | — | — | (25,947 | ) | |||||||||||||||||||
| Tax reclassificaiton of stockholders’ equity in accordance with generally accepted accounting principles |
— | — | (770 | ) | 908 | (138 | ) | — | — | |||||||||||||||||||
|
|
|
|
|
|
|
|
|
|
|
|
|
|
|
|||||||||||||||
| Balances at December 31, 2015 |
16,300,732 | $ | 16 | $ | 246,307 | $ | 13,887 | $ | (6,145 | ) | $ | (6,703 | ) | $ | 247,362 | |||||||||||||
|
|
|
|
|
|
|
|
|
|
|
|
|
|
|
|||||||||||||||
See Notes to Consolidated Financial Statements.
- 84 -
Table of Contents
FIDUS INVESTMENT CORPORATION
Consolidated Statements of Cash Flows
(In thousands)
| Years Ended December 31, | ||||||||||||
| 2015 | 2014 | 2013 | ||||||||||
| Cash Flows from Operating Activities: |
||||||||||||
| Net increase in net assets resulting from operations |
$ | 25,977 | $ | 19,485 | $ | 27,203 | ||||||
| Adjustments to reconcile net increase in net assets resulting from operations to net cash (used for) operating activities: |
||||||||||||
| Net change in unrealized depreciation on investments |
10,086 | (13,250 | ) | 22,188 | ||||||||
| Net realized (gain) loss on investments |
(9,531 | ) | 17,029 | (30,588 | ) | |||||||
| Interest and dividend income paid-in-kind |
(5,170 | ) | (5,617 | ) | (5,811 | ) | ||||||
| Accretion of original issue discount |
(578 | ) | (643 | ) | (1,081 | ) | ||||||
| Accretion of loan origination fees |
(797 | ) | (529 | ) | (407 | ) | ||||||
| Purchase of investments |
(136,380 | ) | (149,814 | ) | (149,095 | ) | ||||||
| Proceeds from sales and repayments of investments |
94,686 | 62,643 | 131,199 | |||||||||
| Proceeds from loan origination fees |
770 | 807 | 863 | |||||||||
| Amortization of deferred financing costs |
1,010 | 681 | 512 | |||||||||
| Changes in operating assets and liabilities: |
||||||||||||
| Interest receivable |
(60 | ) | (1,973 | ) | 820 | |||||||
| Prepaid expenses and other assets |
(335 | ) | 337 | (387 | ) | |||||||
| Accrued interest and fees payable |
487 | 155 | 61 | |||||||||
| Due to affiliates |
367 | (187 | ) | 1,936 | ||||||||
| Taxes payable |
72 | (356 | ) | 684 | ||||||||
| Accounts payable and other liabilities |
(72 | ) | (38 | ) | (189 | ) | ||||||
|
|
|
|
|
|
|
|||||||
| Net cash (used for) operating activities |
(19,468 | ) | (71,270 | ) | (2,092 | ) | ||||||
|
|
|
|
|
|
|
|||||||
| Cash Flows from Financing Activities: |
||||||||||||
| Proceeds from stock offerings, net of expenses |
3,170 | 36,542 | 28,857 | |||||||||
| Proceeds received from SBA debentures |
40,000 | 29,000 | — | |||||||||
| Net proceeds received from borrowings under credit facility |
5,500 | 10,000 | — | |||||||||
| Payment of deferred financing costs |
(1,815 | ) | (1,596 | ) | (250 | ) | ||||||
| Dividends paid to stockholders, including expenses |
(25,048 | ) | (23,889 | ) | (25,139 | ) | ||||||
| Taxes paid on deemed distribution |
— | (2,887 | ) | — | ||||||||
|
|
|
|
|
|
|
|||||||
| Net cash provided by financing activities |
21,807 | 47,170 | 3,468 | |||||||||
|
|
|
|
|
|
|
|||||||
| Net increase (decrease) in cash and cash equivalents |
2,339 | (24,100 | ) | 1,376 | ||||||||
| Cash and cash equivalents: |
||||||||||||
| Beginning of period |
29,318 | 53,418 | 52,042 | |||||||||
|
|
|
|
|
|
|
|||||||
| End of period |
$ | 31,657 | $ | 29,318 | $ | 53,418 | ||||||
|
|
|
|
|
|
|
|||||||
| Supplemental disclosure of cash flow information: |
||||||||||||
| Cash payments for interest |
$ | 7,931 | $ | 6,670 | $ | 6,503 | ||||||
| Cash payments for taxes, net of tax refunds received |
$ | 279 | $ | 3,471 | $ | 55 | ||||||
| Non-cash financing activities: |
||||||||||||
| Shares issued under dividend reinvestment plan |
$ | 901 | $ | 935 | $ | 1,464 | ||||||
See Notes to Consolidated Financial Statements.
- 85 -
Table of Contents
FIDUS INVESTMENT CORPORATION
Consolidated Schedule of Investments
December 31, 2015
(In thousands, except shares)
| Industry Portfolio Company (a)(b) Investment Type (c) |
Rate (d) Cash/PIK |
Maturity | Principal Amount |
Cost | Fair Value |
Percent of Net Assets |
||||||||||||||||||
|
|
||||||||||||||||||||||||
| Aerospace & Defense Manufacturing |
||||||||||||||||||||||||
| FDS Avionics Corp. |
||||||||||||||||||||||||
| (dba Flight Display Systems) |
||||||||||||||||||||||||
| Subordinated Note |
12.3%/0.0% | 4/1/2020 | $ | 5,200 | $ | 5,180 | $ | 5,200 | ||||||||||||||||
| Common Equity (200 units) (i) |
2,000 | 1,468 | ||||||||||||||||||||||
|
|
|
|
|
|||||||||||||||||||||
| 7,180 | 6,668 | 3 | % | |||||||||||||||||||||
| Lightning Diversion Systems, LLC |
||||||||||||||||||||||||
| Senior Secured Loan |
9.5%/0.0% | 12/20/2018 | 9,198 | 9,165 | 9,198 | |||||||||||||||||||
| Revolving Loan ($1,000 commitment) (h) |
9.5%/0.0% | 12/20/2018 | — | (1 | ) | (1 | ) | |||||||||||||||||
| Common Equity (600,000 units) |
— | 2,429 | ||||||||||||||||||||||
|
|
|
|
|
|||||||||||||||||||||
| 9,164 | 11,626 | 5 | % | |||||||||||||||||||||
| Malabar International (k) |
||||||||||||||||||||||||
| Subordinated Note (j) |
12.5%/2.5% | 5/21/2017 | 7,450 | 7,436 | 7,450 | |||||||||||||||||||
| Preferred Equity (1,494 shares) (f) |
6.0%/0.0% | 11/21/2017 | 1,994 | 4,808 | ||||||||||||||||||||
|
|
|
|
|
|||||||||||||||||||||
| 9,430 | 12,258 | 5 | % | |||||||||||||||||||||
| Simplex Manufacturing Co. |
||||||||||||||||||||||||
| Subordinated Note |
14.0%/0.0% | 5/1/2016 | 4,550 | 4,550 | 4,550 | |||||||||||||||||||
| Warrant (24 shares) |
710 | 3,359 | ||||||||||||||||||||||
|
|
|
|
|
|||||||||||||||||||||
| 5,260 | 7,909 | 3 | % | |||||||||||||||||||||
| Steward Holding LLC (k) |
||||||||||||||||||||||||
| (dba Steward Advanced Materials) |
||||||||||||||||||||||||
| Subordinated Note |
12.0%/2.3% | 5/12/2021 | 7,022 | 6,987 | 6,987 | |||||||||||||||||||
| Common Equity (1,000,000 units) |
1,000 | 1,000 | ||||||||||||||||||||||
|
|
|
|
|
|||||||||||||||||||||
| 7,987 | 7,987 | 3 | % | |||||||||||||||||||||
| Apparel Distribution |
||||||||||||||||||||||||
| Jacob Ash Holdings, Inc. |
||||||||||||||||||||||||
| Subordinated Note (j) |
13.0%/4.0% | 6/30/2018 | 4,000 | 3,994 | 4,000 | |||||||||||||||||||
| Subordinated Note |
13.0%/0.0% | 6/30/2018 | 963 | 956 | 963 | |||||||||||||||||||
| Preferred Equity (66,138 shares) (f) |
0.0%/15.0% | 6/30/2018 | 924 | 926 | ||||||||||||||||||||
| Warrant (63,492 shares) |
67 | — | ||||||||||||||||||||||
|
|
|
|
|
|||||||||||||||||||||
| 5,941 | 5,889 | 2 | % | |||||||||||||||||||||
| Building Products Manufacturing |
||||||||||||||||||||||||
| The Wolf Organization, LLC |
||||||||||||||||||||||||
| Common Equity (175 shares) |
1,750 | 2,514 | 1 | % | ||||||||||||||||||||
| US GreenFiber, LLC |
||||||||||||||||||||||||
| Subordinated Note (j) |
12.5%/0.0% | 1/2/2019 | 14,000 | 13,952 | 14,000 | |||||||||||||||||||
| Common Equity (1,667 units) (g)(i) |
500 | 1,170 | ||||||||||||||||||||||
|
|
|
|
|
|||||||||||||||||||||
| 14,452 | 15,170 | 6 | % | |||||||||||||||||||||
| Business Services |
||||||||||||||||||||||||
| Inflexxion, Inc. (k) |
||||||||||||||||||||||||
| Senior Secured Loan |
12.5%/0.0% | 12/16/2019 | 3,950 | 3,931 | 3,470 | |||||||||||||||||||
| Revolving Loan ($1,000 commitment) (i) |
12.5%/0.0% | 12/16/2019 | 150 | 146 | 132 | |||||||||||||||||||
| Preferred Equity (1,400 units) |
1,400 | — | ||||||||||||||||||||||
|
|
|
|
|
|||||||||||||||||||||
| 5,477 | 3,602 | 1 | % | |||||||||||||||||||||
| Plymouth Rock Energy, LLC |
||||||||||||||||||||||||
| Senior Secured Loan |
11.8%/0.0% | 5/14/2017 | 6,000 | 5,984 | 6,000 | 2 | % | |||||||||||||||||
| Stagnito Partners, LLC (dba Stagnito Business Information) |
||||||||||||||||||||||||
| Senior Secured Loan (i) |
12.0%/0.0% | 6/30/2018 | 6,361 | 6,290 | 6,361 | 3 | % | |||||||||||||||||
| Vanguard Dealer Services, L.L.C. |
||||||||||||||||||||||||
| Subordinated Note ($9,850 commitment) (j) |
12.3%/0.0% | 1/30/2021 | 7,350 | 7,310 | 7,310 | |||||||||||||||||||
| Common Equity (6,000 shares) |
600 | 600 | ||||||||||||||||||||||
|
|
|
|
|
|||||||||||||||||||||
| 7,910 | 7,910 | 3 | % | |||||||||||||||||||||
- 86 -
Table of Contents
FIDUS INVESTMENT CORPORATION
Consolidated Schedule of Investments—(Continued)
December 31, 2015
(In thousands, except shares)
| Industry Portfolio Company (a)(b) Investment Type (c) |
Rate (d) Cash/PIK |
Maturity | Principal Amount |
Cost | Fair Value |
Percent of Net Assets |
||||||||||||||||||
|
|
||||||||||||||||||||||||
| Commercial Cleaning |
||||||||||||||||||||||||
| Premium Franchise Brands, LLC |
||||||||||||||||||||||||
| Preferred Equity (1,054,619 shares) |
$ | 832 | $ | 717 | 0 | % | ||||||||||||||||||
| Component Manufacturing |
||||||||||||||||||||||||
| Channel Technologies Group, LLC |
||||||||||||||||||||||||
| Subordinated Note |
11.0%/1.8% | 4/10/2019 | 7,000 | 6,963 | 6,253 | |||||||||||||||||||
| Preferred Equity (612 units) (g)(i) |
1,139 | 548 | ||||||||||||||||||||||
| Common Equity (612,432 units) (g)(i) |
— | — | ||||||||||||||||||||||
|
|
|
|
|
|||||||||||||||||||||
| 8,102 | 6,801 | 3 | % | |||||||||||||||||||||
| Toledo Molding & Die, Inc. |
||||||||||||||||||||||||
| Subordinated Note (i) |
10.5%/0.0% | 12/18/2018 | 10,000 | 9,889 | 10,000 | 4 | % | |||||||||||||||||
| Consumer Products |
||||||||||||||||||||||||
| Grindmaster Corporation |
||||||||||||||||||||||||
| Subordinated Note |
11.5%/0.0% | 10/31/2019 | 10,500 | 10,465 | 10,500 | 4 | % | |||||||||||||||||
| World Wide Packaging, LLC (k) |
||||||||||||||||||||||||
| Subordinated Note (i) |
12.0%/1.0% | 10/26/2018 | 10,265 | 10,239 | 10,277 | |||||||||||||||||||
| Common Equity (1,517,573 units) (g)(i) |
1,518 | 2,043 | ||||||||||||||||||||||
|
|
|
|
|
|||||||||||||||||||||
| 11,757 | 12,320 | 5 | % | |||||||||||||||||||||
| Electronic Components Supplier |
||||||||||||||||||||||||
| Apex Microtechnology, Inc. (k) |
||||||||||||||||||||||||
| Warrant (2,293 shares) |
220 | 274 | ||||||||||||||||||||||
| Common Equity (11,690 shares) |
1,169 | 1,425 | ||||||||||||||||||||||
|
|
|
|
|
|||||||||||||||||||||
| 1,389 | 1,699 | 1 | % | |||||||||||||||||||||
| Financial Services |
||||||||||||||||||||||||
| National Truck Protection Co., Inc. |
||||||||||||||||||||||||
| Senior Secured Loan |
13.5%/2.0% | 9/13/2018 | 11,989 | 11,944 | 11,989 | |||||||||||||||||||
| Common Equity (1,109 shares) |
758 | 1,705 | ||||||||||||||||||||||
|
|
|
|
|
|||||||||||||||||||||
| 12,702 | 13,694 | 6 | % | |||||||||||||||||||||
| Healthcare Products |
||||||||||||||||||||||||
| Allied 100 Group, Inc. |
||||||||||||||||||||||||
| Subordinated Note (j) |
11.5%/0.0% | 5/26/2020 | 13,000 | 12,948 | 13,000 | |||||||||||||||||||
| Common Equity (1,250,000 units) (i) |
1,250 | 1,223 | ||||||||||||||||||||||
|
|
|
|
|
|||||||||||||||||||||
| 14,198 | 14,223 | 6 | % | |||||||||||||||||||||
| Anatrace Products, LLC |
||||||||||||||||||||||||
| Subordinated Note |
13.0%/1.3% | 6/23/2021 | 6,500 | 6,480 | 6,480 | |||||||||||||||||||
| Common Equity (360,000 shares) (i) |
— | 148 | ||||||||||||||||||||||
|
|
|
|
|
|||||||||||||||||||||
| 6,480 | 6,628 | 3 | % | |||||||||||||||||||||
| MedPlast, LLC |
||||||||||||||||||||||||
| Subordinated Note (i) |
11.0%/1.5% | 3/31/2019 | 10,338 | 10,294 | 10,338 | |||||||||||||||||||
| Preferred Equity (188 shares) (f)(i) |
0.0%/8.0% | 3/31/2019 | 223 | 223 | ||||||||||||||||||||
| Common Equity (3,728 shares) (i) |
62 | 103 | ||||||||||||||||||||||
|
|
|
|
|
|||||||||||||||||||||
| 10,579 | 10,664 | 4 | % | |||||||||||||||||||||
| Pfanstiehl, Inc. (k) |
||||||||||||||||||||||||
| Subordinated Note |
12.0%/2.0% | 9/29/2018 | 6,208 | 6,178 | 6,208 | |||||||||||||||||||
| Common Equity (8,500 units) (i) |
850 | 4,280 | ||||||||||||||||||||||
|
|
|
|
|
|||||||||||||||||||||
| 7,028 | 10,488 | 4 | % | |||||||||||||||||||||
| Six Month Smiles Holdings, Inc. |
||||||||||||||||||||||||
| Subordinated Note (i) |
12.0%/1.8% | 7/31/2020 | 8,106 | 8,077 | 8,106 | 3 | % | |||||||||||||||||
- 87 -
Table of Contents
FIDUS INVESTMENT CORPORATION
Consolidated Schedule of Investments—(Continued)
December 31, 2015
(In thousands, except shares)
| Industry Portfolio Company (a)(b) Investment Type (c) |
Rate (d) Cash/PIK |
Maturity | Principal Amount |
Cost | Fair Value |
Percent of Net Assets |
||||||||||||||||||
|
|
||||||||||||||||||||||||
| Healthcare Services |
||||||||||||||||||||||||
| Continental Anesthesia Management, LLC |
||||||||||||||||||||||||
| Senior Secured Loan |
10.0%/4.0% | 4/15/2016 | $ | 10,676 | $ | 10,676 | $ | 10,676 | ||||||||||||||||
| Warrant (263 shares) |
276 | — | ||||||||||||||||||||||
|
|
|
|
|
|||||||||||||||||||||
| 10,952 | 10,676 | 4 | % | |||||||||||||||||||||
| Medsurant Holdings, LLC (k) |
||||||||||||||||||||||||
| Subordinated Note |
12.3%/0.0% | 6/18/2021 | 6,267 | 6,211 | 6,211 | |||||||||||||||||||
| Preferred Equity (126,662 units) (g) |
1,346 | 1,515 | ||||||||||||||||||||||
| Warrant (505,176 units) (g) |
4,516 | 5,237 | ||||||||||||||||||||||
|
|
|
|
|
|||||||||||||||||||||
| 12,073 | 12,963 | 5 | % | |||||||||||||||||||||
| Microbiology Research Associates, Inc. (k) |
||||||||||||||||||||||||
| Senior Secured Loan |
6.0%/0.0% | 5/13/2020 | 3,750 | 3,734 | 3,750 | |||||||||||||||||||
| Revolving Loan ($500 commitment) (h)(i) |
6.0%/0.0% | 5/13/2020 | — | (2 | ) | — | ||||||||||||||||||
| Subordinated Note |
12.5%/0.0% | 11/13/2020 | 6,250 | 6,222 | 6,250 | |||||||||||||||||||
| Common Equity (1,000,000 units) (i) |
1,000 | 1,444 | ||||||||||||||||||||||
|
|
|
|
|
|||||||||||||||||||||
| 10,954 | 11,444 | 5 | % | |||||||||||||||||||||
| Oaktree Medical Centre, P.C. |
||||||||||||||||||||||||
| (dba Pain Management Associates) |
||||||||||||||||||||||||
| Senior Secured Loan (i) |
8.5%/0.0% | 1/1/2018 | 560 | 570 | 589 | |||||||||||||||||||
| Senior Secured Loan (i) |
16.0%/0.0% | 1/1/2018 | 5,379 | 5,458 | 5,454 | |||||||||||||||||||
| Revolving Loan ($500 commitment) (i) |
8.5%/0.0% | 1/1/2018 | 250 | 257 | 263 | |||||||||||||||||||
|
|
|
|
|
|||||||||||||||||||||
| 6,285 | 6,306 | 3 | % | |||||||||||||||||||||
| United Biologics, LLC |
||||||||||||||||||||||||
| Subordinated Note |
12.0%/2.0% | 3/5/2017 | 8,523 | 8,360 | 7,932 | |||||||||||||||||||
| Preferred Equity (98,377 units) (g)(i) |
1,069 | — | ||||||||||||||||||||||
| Warrant (57,469 units) |
566 | — | ||||||||||||||||||||||
|
|
|
|
|
|||||||||||||||||||||
| 9,995 | 7,932 | 3 | % | |||||||||||||||||||||
| Industrial Cleaning & Coatings |
||||||||||||||||||||||||
| K2 Industrial Services, Inc. |
||||||||||||||||||||||||
| Subordinated Note |
8.8%/6.4% | 5/23/2017 | 17,118 | 17,086 | 16,718 | |||||||||||||||||||
| Preferred Equity - Series A (1,200 shares) |
1,200 | 271 | ||||||||||||||||||||||
| Preferred Equity - Series B (74 shares) |
68 | 78 | ||||||||||||||||||||||
|
|
|
|
|
|||||||||||||||||||||
| 18,354 | 17,067 | 7 | % | |||||||||||||||||||||
| Information Technology Services |
||||||||||||||||||||||||
| FTH Acquisition Corp. VII |
||||||||||||||||||||||||
| Subordinated Note |
13.0%/0.0% | 2/28/2017 | 8,352 | 8,352 | 8,236 | |||||||||||||||||||
| Preferred Equity (887,122 shares) |
887 | — | ||||||||||||||||||||||
|
|
|
|
|
|||||||||||||||||||||
| 9,239 | 8,236 | 3 | % | |||||||||||||||||||||
| inthinc Technology Solutions, Inc. |
||||||||||||||||||||||||
| Subordinated Note ($5,000 commitment) |
12.5%/0.0% | 4/24/2020 | 4,000 | 3,979 | 3,979 | |||||||||||||||||||
| Subordinated Note |
0.0%/12.5% | 4/24/2020 | 1,039 | 861 | 861 | |||||||||||||||||||
| Royalty Rights |
4/24/2020 | 185 | 185 | |||||||||||||||||||||
|
|
|
|
|
|||||||||||||||||||||
| 5,025 | 5,025 | 2 | % | |||||||||||||||||||||
| Laundry Services |
||||||||||||||||||||||||
| Caldwell & Gregory, LLC |
||||||||||||||||||||||||
| Subordinated Note |
11.5%/1.0% | 11/30/2018 | 1,539 | 1,523 | 1,539 | |||||||||||||||||||
| Subordinated Note |
0.0%/12.0% | 5/31/2019 | 4,072 | 3,897 | 4,072 | |||||||||||||||||||
| Common Equity (500,000 units) (g) |
500 | 651 | ||||||||||||||||||||||
| Warrant (242,121 units) (g) |
242 | 316 | ||||||||||||||||||||||
|
|
|
|
|
|||||||||||||||||||||
| 6,162 | 6,578 | 3 | % | |||||||||||||||||||||
| Oil & Gas Services |
||||||||||||||||||||||||
| IOS Acquisitions, Inc. (n) |
||||||||||||||||||||||||
| Common Equity (2,152 units) (i) |
109 | 21 | 0 | % | ||||||||||||||||||||
| Pinnergy, Ltd. |
||||||||||||||||||||||||
| Subordinated Note (j) |
10.5%/1.8% | 1/24/2020 | 20,000 | 19,945 | 16,440 | 7 | % | |||||||||||||||||
- 88 -
Table of Contents
FIDUS INVESTMENT CORPORATION
Consolidated Schedule of Investments—(Continued)
December 31, 2015
(In thousands, except shares)
| Industry Portfolio Company (a)(b) Investment Type (c) |
Rate (d) Cash/PIK |
Maturity | Principal Amount |
Cost | Fair Value |
Percent of Net Assets |
||||||||||||||||||
|
|
||||||||||||||||||||||||
| Printing Services |
||||||||||||||||||||||||
| Brook & Whittle Limited |
||||||||||||||||||||||||
| Subordinated Note |
12.0%/4.8% | 12/31/2016 | $ | 7,655 | $ | 7,655 | $ | 7,361 | ||||||||||||||||
| Subordinated Note |
12.0%/2.0% | 12/31/2016 | 2,296 | 2,296 | 2,151 | |||||||||||||||||||
| Warrant (1,051 shares) |
285 | — | ||||||||||||||||||||||
| Common Equity - Series A (148 shares) |
110 | — | ||||||||||||||||||||||
| Common Equity - Series D (527 shares) |
53 | 77 | ||||||||||||||||||||||
|
|
|
|
|
|||||||||||||||||||||
| 10,399 | 9,589 | 4 | % | |||||||||||||||||||||
| Restaurants |
||||||||||||||||||||||||
| ACFP Management, Inc. (n) |
||||||||||||||||||||||||
| Common Equity (1,000,000 units) (i) |
— | — | 0 | % | ||||||||||||||||||||
| Cardboard Box LLC |
||||||||||||||||||||||||
| (dba Anthony’s Coal Fired Pizza) |
||||||||||||||||||||||||
| Common Equity (521,021 units) (i) |
521 | 521 | 0 | % | ||||||||||||||||||||
| Restaurant Finance Co, LLC |
||||||||||||||||||||||||
| Senior Secured Loan ($10,500 commitment) (j) |
12.0%/4.0% | 7/31/2020 | 8,443 | 8,410 | 8,443 | 3 | % | |||||||||||||||||
| Retail |
||||||||||||||||||||||||
| EBL, LLC (EbLens) |
||||||||||||||||||||||||
| Common Equity (750,000 units) (g)(i) |
750 | 1,389 | 1 | % | ||||||||||||||||||||
| Retail Cleaning |
||||||||||||||||||||||||
| Paramount Building Solutions, LLC (l) |
||||||||||||||||||||||||
| Subordinated Note (m) |
0.0%/18.0% | 12/31/2017 | 625 | 625 | 618 | |||||||||||||||||||
| Subordinated Note (m) |
0.0%/15.0% | 12/31/2017 | 275 | 275 | — | |||||||||||||||||||
| Subordinated Note (m) |
0.0%/10.0% | 12/31/2017 | 1,376 | 1,376 | — | |||||||||||||||||||
| Subordinated Note (m) |
0.0%/14.0% | 12/31/2017 | 2,927 | 2,927 | — | |||||||||||||||||||
| Warrant (1,086,035 units) (g) |
— | — | ||||||||||||||||||||||
| Preferred Equity (5,000,000 units) (g) |
5,339 | — | ||||||||||||||||||||||
| Common Equity (107,143 units) (g) |
1,500 | — | ||||||||||||||||||||||
|
|
|
|
|
|||||||||||||||||||||
| 12,042 | 618 | 0 | % | |||||||||||||||||||||
| Safety Products Manufacturing |
||||||||||||||||||||||||
| Safety Products Group, LLC (k) |
||||||||||||||||||||||||
| Subordinated Note |
12.0%/1.5% | 12/30/2018 | 10,000 | 9,974 | 10,000 | |||||||||||||||||||
| Preferred Equity (749 units) (g)(i) |
749 | 834 | ||||||||||||||||||||||
| Common Equity (676 units) (g)(i) |
1 | — | ||||||||||||||||||||||
|
|
|
|
|
|||||||||||||||||||||
| 10,724 | 10,834 | 4 | % | |||||||||||||||||||||
| Specialty Chemicals |
||||||||||||||||||||||||
| FAR Research Inc. (k) |
||||||||||||||||||||||||
| Senior Secured Loan (j) |
11.8%/1.0% | 3/31/2019 | 7,448 | 7,423 | 7,448 | |||||||||||||||||||
| Revolving Loan ($1,750 commitment) (i) |
11.8%/1.0% | 3/31/2019 | 137 | 131 | 136 | |||||||||||||||||||
| Common Equity (10 units) |
1,000 | 161 | ||||||||||||||||||||||
|
|
|
|
|
|||||||||||||||||||||
| 8,554 | 7,745 | 3 | % | |||||||||||||||||||||
| Specialty Cracker Manufacturing |
||||||||||||||||||||||||
| Westminster Cracker Company, Inc. (k)(n) |
||||||||||||||||||||||||
| Common Equity (1,307,262 units) |
— | 191 | 0 | % | ||||||||||||||||||||
| Specialty Distribution |
||||||||||||||||||||||||
| Carlson Systems Holdings, Inc. |
||||||||||||||||||||||||
| Subordinated Note (j) |
12.0%/0.0% | 5/20/2020 | 21,000 | 20,912 | 21,000 | |||||||||||||||||||
| Common Equity (15,000 units) (i) |
1,500 | 2,079 | ||||||||||||||||||||||
|
|
|
|
|
|||||||||||||||||||||
| 22,412 | 23,079 | 9 | % | |||||||||||||||||||||
| Virginia Tile Company, LLC |
||||||||||||||||||||||||
| Subordinated Note (j) |
12.3%/0.0% | 5/19/2020 | 12,000 | 11,952 | 12,000 | |||||||||||||||||||
| Common Equity (20 shares) |
250 | 559 | ||||||||||||||||||||||
|
|
|
|
|
|||||||||||||||||||||
| 12,202 | 12,559 | 5 | % | |||||||||||||||||||||
- 89 -
Table of Contents
FIDUS INVESTMENT CORPORATION
Consolidated Schedule of Investments—(Continued)
December 31, 2015
(In thousands, except shares)
| Industry Portfolio Company (a)(b) Investment Type (c) |
Rate (d) Cash/PIK |
Maturity | Principal Amount |
Cost | Fair Value |
Percent of Net Assets |
||||||||||||||||||
|
|
||||||||||||||||||||||||
| Telecommunication Services |
||||||||||||||||||||||||
| X5 Opco LLC |
||||||||||||||||||||||||
| Senior Secured Loan |
12.0%/0.0% | 3/24/2020 | $ | 5,500 | $ | 5,477 | $ | 5,665 | ||||||||||||||||
| Revolving Loan ($500 commitment) (h) |
12.0%/0.0% | 3/24/2020 | — | — | — | |||||||||||||||||||
| Preferred Equity (5,000 units) (f)(g)(i) |
0.0%/8.0% | 531 | 350 | |||||||||||||||||||||
|
|
|
|
|
|||||||||||||||||||||
| 6,008 | 6,015 | 2 | % | |||||||||||||||||||||
| Transportation Services |
||||||||||||||||||||||||
| Cavallo Bus Lines Holdings, LLC |
||||||||||||||||||||||||
| Subordinated Note |
12.0%/3.0% | 4/26/2021 | 8,250 | 8,210 | 8,210 | 3 | % | |||||||||||||||||
| US Pack Logistics LLC |
||||||||||||||||||||||||
| Subordinated Note |
12.0%/1.8% | 9/27/2020 | 10,299 | 10,255 | 10,299 | |||||||||||||||||||
| Common Equity (5,357 units) (g)(i) |
536 | 483 | ||||||||||||||||||||||
|
|
|
|
|
|||||||||||||||||||||
| 10,791 | 10,782 | 4 | % | |||||||||||||||||||||
| Worldwide Express Operations, LLC |
||||||||||||||||||||||||
| Subordinated Note |
11.5%/1.0% | 8/1/2020 | 12,805 | 12,723 | 12,806 | |||||||||||||||||||
| Common Equity (2,500,000 units) (g)(i) |
2,500 | 4,036 | ||||||||||||||||||||||
|
|
|
|
|
|||||||||||||||||||||
| 15,223 | 16,842 | 7 | % | |||||||||||||||||||||
| Utility Equipment Manufacturing |
||||||||||||||||||||||||
| Mirage Trailers LLC (k) |
||||||||||||||||||||||||
| Senior Secured Loan (j)(e) |
12.5%/0.0% | 11/25/2020 | 9,000 | 8,912 | 8,912 | |||||||||||||||||||
| Common Equity (2,500,000 shares) |
2,475 | 2,475 | ||||||||||||||||||||||
|
|
|
|
|
|||||||||||||||||||||
| 11,387 | 11,387 | 5 | % | |||||||||||||||||||||
| Trantech Radiator Products, Inc. (k) |
||||||||||||||||||||||||
| Subordinated Note (i) |
12.0%/1.8% | 5/4/2017 | 8,494 | 8,482 | 8,494 | |||||||||||||||||||
| Common Equity (6,875 shares) (i) |
688 | 434 | ||||||||||||||||||||||
|
|
|
|
|
|||||||||||||||||||||
| 9,170 | 8,928 | 4 | % | |||||||||||||||||||||
| Vending Equipment Manufacturing |
||||||||||||||||||||||||
| Ice House America, LLC |
||||||||||||||||||||||||
| Subordinated Note (i) |
12.0%/3.5% | 1/1/2020 | 4,098 | 3,903 | 3,668 | |||||||||||||||||||
| Warrant (1,957,895 units) (g)(i) |
216 | 47 | ||||||||||||||||||||||
|
|
|
|
|
|||||||||||||||||||||
| 4,119 | 3,715 | 2 | % | |||||||||||||||||||||
| Total Investments |
$ | 448,338 | $ | 443,269 | 179 | % | ||||||||||||||||||
|
|
|
|
|
|
|
|||||||||||||||||||
| (a) | See Note 3 to the consolidated financial statements for portfolio composition by geographic location. |
| (b) | Equity ownership may be held in shares or units of companies related to the portfolio companies. |
| (c) | All debt investments are income producing, unless otherwise indicated. Equity investments are non-income producing unless otherwise noted. |
| (d) | Rate includes the cash interest or dividend rate and paid-in-kind interest or dividend rate, if any, as of December 31, 2015. Generally, payment-in-kind interest can be paid-in-kind or all in cash. |
| (e) | The investment bears interest at a variable rate that is determined by reference to LIBOR, which is reset monthly. The interest rate is set as LIBOR + 11.5% and is subject to a 12.5% interest rate floor. The Company has provided the interest rate in effect as of December 31, 2015. |
| (f) | Income producing. Maturity date, if any, represents mandatory redemption date. |
| (g) | Investment is held by a wholly-owned subsidiary of the Company. |
| (h) | The entire commitment was unfunded at December 31, 2015. As such, no interest is being earned on this investment. |
| (i) | Investment pledged as collateral for the Credit Facility and, as a result, is not directly available to the creditors of the Company to satisfy any obligations of the Company other than the Company’s obligations under the Credit Facility (see Note 6 to the consolidated financial statements). |
| (j) | The portion of the investment not held by the Funds is pledged as collateral for the Credit Facility and, as a result, is not directly available to the creditors of the Company to satisfy any obligations of the Company other than the Company’s obligations under the Credit Facility (see Note 6 to the consolidated financial statements). |
| (k) | As defined in the 1940 Act, the Company is deemed to be an “Affiliated Person” of this portfolio company because it owns 5% or more of the portfolio company’s outstanding voting securities or it has the power to exercise control over the management or policies of such portfolio company. Transactions in which the issuer was an Affiliated Person are detailed in Note 3 to the consolidated financial statements. |
| (l) | As defined in the 1940 Act, the Company is deemed to be both an “Affiliated Person” of and “Control” this portfolio company because it owns 25% or more of the portfolio company’s outstanding voting securities or it has the power to exercise control over the management or policies of such portfolio company. Transactions in which the issuer was both an Affiliated Person and a portfolio company that the Company is deemed to Control are detailed in Note 3 to the consolidated financial statements. |
| (m) | Investment was on non-accrual status as of December 31, 2015, meaning the Company has ceased recognizing interest income on the investment. |
| (n) | Investment in portfolio company that has sold its operations and is in the process of winding down. |
See Notes to Consolidated Financial Statements.
- 90 -
Table of Contents
FIDUS INVESTMENT CORPORATION
Consolidated Schedule of Investments
December 31, 2014
(In thousands, except shares)
| Industry Portfolio Company (a) (b) Investment Type (c) |
Rate (d) Cash/PIK |
Maturity | Principal Amount |
Cost | Fair Value | Percent of Net Assets |
||||||||||||||||||
|
|
||||||||||||||||||||||||
| Aerospace & Defense Manufacturing |
||||||||||||||||||||||||
| FDS Avionics Corp. |
||||||||||||||||||||||||
| (dba Flight Display Systems) |
||||||||||||||||||||||||
| Subordinated Note |
12.3%/0.0% | 4/1/2020 | $ | 5,200 | $ | 5,175 | $ | 5,175 | ||||||||||||||||
| Common Equity (200 units) (h) |
2,000 | 2,000 | ||||||||||||||||||||||
|
|
|
|
|
|||||||||||||||||||||
| 7,175 | 7,175 | 3 | % | |||||||||||||||||||||
| Lightning Diversion Systems, LLC |
||||||||||||||||||||||||
| Senior Secured Loan |
10.5%/0.0% | 12/20/2018 | 12,198 | 12,154 | 12,198 | |||||||||||||||||||
| Revolving Loan ($1,000 commitment) (g) |
N/A | 12/20/2018 | — | (2 | ) | (2 | ) | |||||||||||||||||
| Common Equity (600,000 units) |
— | 2,204 | ||||||||||||||||||||||
|
|
|
|
|
|||||||||||||||||||||
| 12,152 | 14,400 | 6 | % | |||||||||||||||||||||
| Malabar International (j) |
||||||||||||||||||||||||
| Subordinated Note (i) |
12.5%/2.5% | 5/21/2017 | 7,264 | 7,239 | 7,264 | |||||||||||||||||||
| Preferred Equity (1,494 shares) (e) |
6.0%/0.0% | 1,992 | 3,258 | |||||||||||||||||||||
|
|
|
|
|
|||||||||||||||||||||
| 9,231 | 10,522 | 4 | % | |||||||||||||||||||||
| Simplex Manufacturing Co. |
||||||||||||||||||||||||
| Subordinated Note |
14.0%/0.0% | 11/1/2015 | 4,550 | 4,537 | 4,537 | |||||||||||||||||||
| Warrant (24 shares) |
710 | 813 | ||||||||||||||||||||||
|
|
|
|
|
|||||||||||||||||||||
| 5,247 | 5,350 | 2 | % | |||||||||||||||||||||
| Apparel Distribution |
||||||||||||||||||||||||
| Jacob Ash Holdings, Inc. |
||||||||||||||||||||||||
| Subordinated Note (i) |
13.0%/4.0% | 6/30/2018 | 4,000 | 3,992 | 4,000 | |||||||||||||||||||
| Subordinated Note |
13.0%/0.0% | 6/30/2018 | 963 | 953 | 963 | |||||||||||||||||||
| Preferred Equity (66,138 shares) (e) |
0.0%/15.0% | 6/30/2018 | 798 | 810 | ||||||||||||||||||||
| Warrant (63,492 shares) |
67 | — | ||||||||||||||||||||||
|
|
|
|
|
|||||||||||||||||||||
| 5,810 | 5,773 | 2 | % | |||||||||||||||||||||
| Building Products Manufacturing |
||||||||||||||||||||||||
| US GreenFiber, LLC |
||||||||||||||||||||||||
| Subordinated Note (i) |
12.5%/0.0% | 1/2/2019 | 14,000 | 13,936 | 13,936 | |||||||||||||||||||
| Common Equity (1,667 units) (f)(h) |
500 | 500 | ||||||||||||||||||||||
|
|
|
|
|
|||||||||||||||||||||
| 14,436 | 14,436 | 6 | % | |||||||||||||||||||||
| Business Services |
||||||||||||||||||||||||
| Inflexxion, Inc. (j) |
||||||||||||||||||||||||
| Senior Secured Loan |
12.5%/0.0% | 12/16/2019 | 4,750 | 4,726 | 4,726 | |||||||||||||||||||
| Revolving Loan ($1,000 commitment) (h) |
12.5%/0.0% | 12/16/2019 | 300 | 295 | 295 | |||||||||||||||||||
| Preferred Equity (1,400 units) |
1,400 | 1,400 | ||||||||||||||||||||||
|
|
|
|
|
|||||||||||||||||||||
| 6,421 | 6,421 | 3 | % | |||||||||||||||||||||
| Plymouth Rock Energy, LLC |
||||||||||||||||||||||||
| Senior Secured Loan |
11.8%/0.0% | 5/14/2017 | 6,000 | 5,973 | 5,973 | 2 | % | |||||||||||||||||
| Commercial Cleaning |
||||||||||||||||||||||||
| Premium Franchise Brands, LLC |
||||||||||||||||||||||||
| Preferred Equity (1,054,619 shares) |
832 | 718 | 0 | % | ||||||||||||||||||||
| Component Manufacturing |
||||||||||||||||||||||||
| Channel Technologies Group, LLC |
||||||||||||||||||||||||
| Subordinated Note |
11.0%/1.3% | 4/10/2019 | 7,000 | 6,952 | 6,619 | |||||||||||||||||||
| Preferred Equity (612 units) (f)(h) |
1,139 | 686 | ||||||||||||||||||||||
| Common Equity (612,432 units) (f)(h) |
— | — | ||||||||||||||||||||||
|
|
|
|
|
|||||||||||||||||||||
| 8,091 | 7,305 | 3 | % | |||||||||||||||||||||
| Toledo Molding & Die, Inc. |
||||||||||||||||||||||||
| Subordinated Note (h) |
10.5%/0.0% | 12/18/2018 | 10,000 | 9,851 | 9,851 | 4 | % | |||||||||||||||||
- 91 -
Table of Contents
FIDUS INVESTMENT CORPORATION
Consolidated Schedule of Investments—(Continued)
December 31, 2014
(In thousands, except shares)
| Industry Portfolio Company (a) (b) Investment Type (c) |
Rate (d) Cash/PIK |
Maturity | Principal Amount |
Cost | Fair Value | Percent of Net Assets |
||||||||||||||||||
|
|
||||||||||||||||||||||||
| Consumer Products |
||||||||||||||||||||||||
| Grindmaster Corporation |
||||||||||||||||||||||||
| Subordinated Note |
11.5%/0.0% | 10/31/2019 | $ | 10,500 | $ | 10,456 | $ | 10,456 | 4 | % | ||||||||||||||
| World Wide Packaging, LLC (j) |
||||||||||||||||||||||||
| Subordinated Note (h) |
12.0%/1.8% | 10/26/2018 | 10,097 | 10,063 | 10,097 | |||||||||||||||||||
| Common Equity (1,517,573 units) (f)(h) |
1,518 | 1,515 | ||||||||||||||||||||||
|
|
|
|
|
|||||||||||||||||||||
| 11,581 | 11,612 | 5 | % | |||||||||||||||||||||
| Electronic Components Supplier |
||||||||||||||||||||||||
| Apex Microtechnology, Inc. (j) |
||||||||||||||||||||||||
| Warrant (2,293 units) |
220 | 254 | ||||||||||||||||||||||
| Common Equity (11,690 shares) |
1,169 | 1,302 | ||||||||||||||||||||||
|
|
|
|
|
|||||||||||||||||||||
| 1,389 | 1,556 | 1 | % | |||||||||||||||||||||
| Financial Services |
||||||||||||||||||||||||
| National Truck Protection Co., Inc. |
||||||||||||||||||||||||
| Senior Secured Loan |
13.5%/2.0% | 9/13/2018 | 12,662 | 12,598 | 12,662 | |||||||||||||||||||
| Common Units (1,109 shares) |
758 | 1,923 | ||||||||||||||||||||||
|
|
|
|
|
|||||||||||||||||||||
| 13,356 | 14,585 | 6 | % | |||||||||||||||||||||
| Healthcare Products |
||||||||||||||||||||||||
| Allied 100 Group, Inc. |
||||||||||||||||||||||||
| Subordinated Note (i) |
11.5%/0.0% | 5/26/2020 | 13,000 | 12,936 | 12,936 | |||||||||||||||||||
| Common Equity (1,250,000 units) (h) |
1,250 | 1,250 | ||||||||||||||||||||||
|
|
|
|
|
|||||||||||||||||||||
| 14,186 | 14,186 | 6 | % | |||||||||||||||||||||
| Anatrace Products, LLC |
||||||||||||||||||||||||
| Senior Secured Loan |
11.5%/1.5% | 10/11/2018 | 9,500 | 9,469 | 9,500 | |||||||||||||||||||
| Revolving Loan ($500 commitment) (g) |
N/A | 10/11/2018 | — | (2 | ) | (2 | ) | |||||||||||||||||
| Common Equity (360,000 shares) (h) |
360 | 520 | ||||||||||||||||||||||
|
|
|
|
|
|||||||||||||||||||||
| 9,827 | 10,018 | 4 | % | |||||||||||||||||||||
| MedPlast, LLC |
||||||||||||||||||||||||
| Subordinated Note (h) |
11.0%/1.5% | 3/31/2019 | 10,185 | 10,126 | 10,185 | |||||||||||||||||||
| Preferred Equity (188 shares) (e)(h) |
0.0%/8.0% | 206 | 206 | |||||||||||||||||||||
| Common Equity (3,728 shares) (h) |
62 | 65 | ||||||||||||||||||||||
|
|
|
|
|
|||||||||||||||||||||
| 10,394 | 10,456 | 4 | % | |||||||||||||||||||||
| Pfanstiehl, Inc. (j) |
||||||||||||||||||||||||
| Subordinated Note |
12.0%/1.5% | 9/29/2018 | 6,208 | 6,168 | 6,208 | |||||||||||||||||||
| Common Equity (8,500 units) (h) |
850 | 3,088 | ||||||||||||||||||||||
|
|
|
|
|
|||||||||||||||||||||
| 7,018 | 9,296 | 4 | % | |||||||||||||||||||||
| Healthcare Services |
||||||||||||||||||||||||
| Continental Anesthesia Management, LLC |
||||||||||||||||||||||||
| Senior Secured Loan |
8.0%/6.0% | 4/15/2015 | 10,259 | 10,252 | 10,130 | |||||||||||||||||||
| Warrant (263 shares) |
276 | — | ||||||||||||||||||||||
|
|
|
|
|
|||||||||||||||||||||
| 10,528 | 10,130 | 4 | % | |||||||||||||||||||||
| Medsurant Holdings, LLC (j) |
||||||||||||||||||||||||
| Subordinated Note |
9.5%/4.5% | 7/12/2016 | 10,129 | 9,603 | 10,129 | |||||||||||||||||||
| Preferred Equity (126,662 units) (f) |
1,345 | 1,027 | ||||||||||||||||||||||
| Warrant (505,176 units) (f) |
4,516 | 3,715 | ||||||||||||||||||||||
|
|
|
|
|
|||||||||||||||||||||
| 15,464 | 14,871 | 6 | % | |||||||||||||||||||||
- 92 -
Table of Contents
FIDUS INVESTMENT CORPORATION
Consolidated Schedule of Investments—(Continued)
December 31, 2014
(In thousands, except shares)
| Industry Portfolio Company (a) (b) Investment Type (c) |
Rate (d) Cash/PIK |
Maturity | Principal Amount |
Cost | Fair Value | Percent of Net Assets |
||||||||||||||||||
|
|
||||||||||||||||||||||||
| Oaktree Medical Centre, P.C. |
||||||||||||||||||||||||
| (dba Pain Management Associates) |
||||||||||||||||||||||||
| Senior Secured Loan (h) |
6.5%/0.0% | 5/6/2019 | $ | 700 | $ | 694 | $ | 675 | ||||||||||||||||
| Senior Secured Loan (h) |
14.0%/0.0% | 5/6/2019 | 5,300 | 5,254 | 5,000 | |||||||||||||||||||
| Revolving Loan ($500 commitment) (h) |
6.5%/0.0% | 5/6/2019 | 250 | 246 | 250 | |||||||||||||||||||
|
|
|
|
|
|||||||||||||||||||||
| 6,194 | 5,925 | 2 | % | |||||||||||||||||||||
| United Biologics, LLC |
||||||||||||||||||||||||
| Subordinated Note |
12.0%/2.0% | 3/5/2017 | 8,688 | 8,393 | 8,688 | |||||||||||||||||||
| Preferred Equity (98,377 units) (f)(h) |
1,069 | 1,069 | ||||||||||||||||||||||
| Warrant (57,469 units) |
566 | 281 | ||||||||||||||||||||||
|
|
|
|
|
|||||||||||||||||||||
| 10,028 | 10,038 | 4 | % | |||||||||||||||||||||
| Industrial Cleaning & Coatings |
||||||||||||||||||||||||
| K2 Industrial Services, Inc. |
||||||||||||||||||||||||
| Subordinated Note |
11.8%/2.8% | 5/23/2017 | 15,213 | 15,162 | 15,213 | |||||||||||||||||||
| Preferred Equity - Series A (1,200 shares) |
1,200 | 914 | ||||||||||||||||||||||
| Preferred Equity - Series B (74 shares) |
68 | 83 | ||||||||||||||||||||||
|
|
|
|
|
|||||||||||||||||||||
| 16,430 | 16,210 | 7 | % | |||||||||||||||||||||
| Information Technology Services |
||||||||||||||||||||||||
| Acentia, LLC |
||||||||||||||||||||||||
| Common Units (499 units) |
500 | 243 | 0 | % | ||||||||||||||||||||
| FTH Acquisition Corp. VII |
||||||||||||||||||||||||
| Subordinated Note |
13.0%/0.0% | 2/27/2015 | 8,395 | 8,395 | 8,350 | |||||||||||||||||||
| Preferred Equity (887,122 shares) |
887 | 621 | ||||||||||||||||||||||
|
|
|
|
|
|||||||||||||||||||||
| 9,282 | 8,971 | 4 | % | |||||||||||||||||||||
| Laundry Services |
||||||||||||||||||||||||
| Caldwell & Gregory, LLC |
||||||||||||||||||||||||
| Subordinated Note |
11.5%/1.0% | 11/30/2018 | 1,524 | 1,502 | 1,524 | |||||||||||||||||||
| Subordinated Note |
0.0%/12.0% | 5/31/2019 | 3,618 | 3,394 | 3,618 | |||||||||||||||||||
| Common Equity (500,000 units) (f) |
500 | 568 | ||||||||||||||||||||||
| Warrant (242,121 units) (f) |
242 | 275 | ||||||||||||||||||||||
|
|
|
|
|
|||||||||||||||||||||
| 5,638 | 5,985 | 2 | % | |||||||||||||||||||||
| Oil & Gas Services |
||||||||||||||||||||||||
| IOS Acquisitions, Inc. |
||||||||||||||||||||||||
| Subordinated Note |
12.0%/3.3% | 6/26/2018 | 14,263 | 14,175 | 13,788 | |||||||||||||||||||
| Common Equity (2,152 shares) (h) |
500 | 364 | ||||||||||||||||||||||
|
|
|
|
|
|||||||||||||||||||||
| 14,675 | 14,152 | 6 | % | |||||||||||||||||||||
| Pinnergy, Ltd. |
||||||||||||||||||||||||
| Subordinated Note (i) |
10.5%/0.8% | 1/24/2020 | 20,000 | 19,931 | 19,812 | 8 | % | |||||||||||||||||
| Printing Services |
||||||||||||||||||||||||
| Brook & Whittle Limited |
||||||||||||||||||||||||
| Subordinated Note |
12.0%/4.8% | 12/31/2016 | 7,297 | 7,297 | 7,272 | |||||||||||||||||||
| Subordinated Note |
12.0%/2.0% | 12/31/2016 | 2,250 | 2,250 | 2,153 | |||||||||||||||||||
| Warrant (1,051 shares) |
285 | 134 | ||||||||||||||||||||||
| Common Equity - Series A (148 shares) |
110 | 20 | ||||||||||||||||||||||
| Common Equity - Series D (527 shares) |
53 | 71 | ||||||||||||||||||||||
|
|
|
|
|
|||||||||||||||||||||
| 9,995 | 9,650 | 4 | % | |||||||||||||||||||||
| Restaurants |
||||||||||||||||||||||||
| ACFP Management, Inc. |
||||||||||||||||||||||||
| Common Units (1,000,000 units) (h) |
1,091 | 1,587 | 1 | % | ||||||||||||||||||||
| Restaurant Finance Co, LLC |
||||||||||||||||||||||||
| Senior Secured Loan ($10,500 commitment) (i) |
12.0%/4.0% | 7/31/2020 | 5,145 | 5,133 | 5,145 | 2 | % | |||||||||||||||||
- 93 -
Table of Contents
FIDUS INVESTMENT CORPORATION
Consolidated Schedule of Investments—(Continued)
December 31, 2014
(In thousands, except shares)
| Industry Portfolio Company (a) (b) Investment Type (c) |
Rate (d) Cash/PIK |
Maturity | Principal Amount |
Cost | Fair Value | Percent of Net Assets |
||||||||||||||||||
|
|
||||||||||||||||||||||||
| Retail |
||||||||||||||||||||||||
| EBL, LLC (EbLens) |
||||||||||||||||||||||||
| Subordinated Note (h) |
12.0%/3.0% | 2/2/2018 | $ | 9,610 | $ | 9,584 | $ | 9,706 | ||||||||||||||||
| Common Equity (750,000 units) (f)(h) |
750 | 981 | ||||||||||||||||||||||
|
|
|
|
|
|||||||||||||||||||||
| 10,334 | 10,687 | 4 | % | |||||||||||||||||||||
| Retail Cleaning |
||||||||||||||||||||||||
| Paramount Building Solutions, LLC (k) |
||||||||||||||||||||||||
| Subordinated Note |
7.0%/3.0% | 12/31/2017 | 1,118 | 1,118 | 1,067 | |||||||||||||||||||
| Subordinated Note |
7.0%/7.0% | 12/31/2017 | 2,842 | 2,842 | 2,687 | |||||||||||||||||||
| Warrant (1,086,035 units) (f) |
— | — | ||||||||||||||||||||||
| Preferred Equity (5,000,000 units) (f) |
5,000 | 490 | ||||||||||||||||||||||
| Common Equity (107,143 units) (f) |
1,500 | — | ||||||||||||||||||||||
|
|
|
|
|
|||||||||||||||||||||
| 10,460 | 4,244 | 2 | % | |||||||||||||||||||||
| Safety Products Manufacturing |
||||||||||||||||||||||||
| Safety Products Group, LLC (j) |
||||||||||||||||||||||||
| Subordinated Note |
12.0%/1.5% | 12/30/2018 | 10,000 | 9,965 | 10,000 | |||||||||||||||||||
| Preferred Equity (749 units) (f)(h) |
749 | 812 | ||||||||||||||||||||||
| Common Equity (676 units) (f)(h) |
1 | — | ||||||||||||||||||||||
|
|
|
|
|
|||||||||||||||||||||
| 10,715 | 10,812 | 4 | % | |||||||||||||||||||||
| Specialty Chemicals |
||||||||||||||||||||||||
| FAR Research Inc. (j) |
||||||||||||||||||||||||
| Senior Secured Loan (i) |
11.8%/0.0% | 3/31/2019 | 7,600 | 7,567 | 7,600 | |||||||||||||||||||
| Revolving Loan ($1,750 commitment) (h) |
11.8%/0.0% | 3/31/2019 | 136 | 129 | 136 | |||||||||||||||||||
| Common Equity (10 units) |
1,000 | 938 | ||||||||||||||||||||||
|
|
|
|
|
|||||||||||||||||||||
| 8,696 | 8,674 | 4 | % | |||||||||||||||||||||
| Specialty Cracker Manufacturing |
||||||||||||||||||||||||
| Westminster Cracker Company, Inc. (j) |
||||||||||||||||||||||||
| Preferred Equity (95,798 units) |
70 | 152 | ||||||||||||||||||||||
| Common Equity (1,208,197 units) |
1,208 | 1,804 | ||||||||||||||||||||||
|
|
|
|
|
|||||||||||||||||||||
| 1,278 | 1,956 | 1 | % | |||||||||||||||||||||
| Specialty Distribution |
||||||||||||||||||||||||
| Carlson Systems Holdings, Inc. |
||||||||||||||||||||||||
| Subordinated Note (i) |
11.5%/0.0% | 5/20/2020 | 12,000 | 11,941 | 11,941 | |||||||||||||||||||
| Common Equity (7,500 units) (h) |
750 | 750 | ||||||||||||||||||||||
|
|
|
|
|
|||||||||||||||||||||
| 12,691 | 12,691 | 5 | % | |||||||||||||||||||||
| Connect-Air International, Inc. |
||||||||||||||||||||||||
| Subordinated Note |
12.8%/0.0% | 11/5/2018 | 11,400 | 11,395 | 11,400 | |||||||||||||||||||
| Common Equity |
— | 4,600 | ||||||||||||||||||||||
|
|
|
|
|
|||||||||||||||||||||
| 11,395 | 16,000 | 7 | % | |||||||||||||||||||||
| Virginia Tile Company, LLC |
||||||||||||||||||||||||
| Subordinated Note (i) |
12.3%/0.0% | 5/19/2020 | 12,000 | 11,940 | 11,940 | |||||||||||||||||||
| Common Equity (19.5 shares) |
250 | 250 | ||||||||||||||||||||||
|
|
|
|
|
|||||||||||||||||||||
| 12,190 | 12,190 | 5 | % | |||||||||||||||||||||
| Utility Equipment Manufacturing |
||||||||||||||||||||||||
| Trantech Radiator Products, Inc. (j) |
||||||||||||||||||||||||
| Subordinated Note (h) |
12.0%/1.8% | 5/4/2017 | 9,518 | 9,498 | 9,518 | |||||||||||||||||||
| Common Equity (6,875 shares) (h) |
688 | 962 | ||||||||||||||||||||||
|
|
|
|
|
|||||||||||||||||||||
| 10,186 | 10,480 | 4 | % | |||||||||||||||||||||
- 94 -
Table of Contents
FIDUS INVESTMENT CORPORATION
Consolidated Schedule of Investments—(Continued)
December 31, 2014
(In thousands, except shares)
| Industry Portfolio Company (a) (b) Investment Type (c) |
Rate (d) Cash/PIK |
Maturity | Principal Amount |
Cost | Fair Value | Percent of Net Assets |
||||||||||||||||||
|
|
||||||||||||||||||||||||
| Transportation Services |
||||||||||||||||||||||||
| Worldwide Express Operations, LLC |
||||||||||||||||||||||||
| Subordinated Note |
11.5%/1.0% | 8/1/2020 | $ | 12,678 | $ | 12,578 | $ | 12,678 | ||||||||||||||||
| Common Equity (2,500,000 units) (f)(h) |
2,500 | 3,135 | ||||||||||||||||||||||
|
|
|
|
|
|||||||||||||||||||||
| 15,078 | 15,813 | 7 | % | |||||||||||||||||||||
|
|
|
|
|
|
|
|||||||||||||||||||
| Total Investments |
$ | 391,338 | $ | 396,355 | 163 | % | ||||||||||||||||||
|
|
|
|
|
|
|
|||||||||||||||||||
| (a) | See Note 3 to the consolidated financial statements for portfolio composition by geographic location. |
| (b) | Equity ownership may be held in shares or units of companies related to the portfolio companies. |
| (c) | All debt investments are income producing. Equity investments are non-income producing unless otherwise noted. |
| (d) | Rate includes the cash interest or dividend rate and paid-in-kind interest or dividend rate, if any, as of December 31, 2014. Generally, payment-in-kind interest can be paid-in-kind or all in cash. |
| (e) | Income producing. Maturity date, if any, represents mandatory redemption date. |
| (f) | Investment is held by a wholly-owned subsidiary of the Company. |
| (g) | The entire commitment was unfunded at December 31, 2014. As such, no interest is being earned on this investment. |
| (h) | Investment pledged as collateral for the Credit Facility and, as a result, is not directly available to the creditors of the Company to satisfy any obligations of the Company other than the Company’s obligations under the Credit Facility (see Note 6 to the consolidated financial statements). |
| (i) | The portion of the investment not held by the Funds is pledged as collateral for the Credit Facility and, as a result, is not directly available to the creditors of the Company to satisfy any obligations of the Company other than the Company’s obligations under the Credit Facility (see Note 6 to the consolidated financial statements). |
| (j) | As defined in the 1940 Act, the Company is deemed to be an “Affiliated Person” of this portfolio company because it owns 5% or more of the portfolio company’s outstanding voting securities or it has the power to exercise control over the management or policies of such portfolio company. Transactions in which the issuer was an Affiliated Person are detailed in Note 3 to the consolidated financial statements. |
| (k) | As defined in the 1940 Act, the Company is deemed to be both an “Affiliated Person” of and “Control” this portfolio company because it owns 25% or more of the portfolio company’s outstanding voting securities or it has the power to exercise control over the management or policies of such portfolio company. Transactions in which the issuer was both an Affiliated Person of and a portfolio company that the Company is deemed to Control are detailed in Note 3 to the consolidated financial statements. |
See Notes to Consolidated Financial Statements.
- 95 -
Table of Contents
FIDUS INVESTMENT CORPORATION
Notes to Consolidated Financial Statements
(In thousands, except shares and per share data)
Note 1. Organization and Nature of Business
Fidus Investment Corporation, a Maryland corporation (“FIC,” and together with its subsidiaries, the “Company”), was formed on February 14, 2011 for the purposes of (i) acquiring 100% of the limited partnership interests of Fidus Mezzanine Capital, L.P. and its consolidated subsidiaries (collectively, “Fund I”) and 100% of the membership interests of Fund I’s general partner, Fidus Mezzanine Capital GP, LLC (“FMCGP”), (ii) raising capital in an initial public offering that was completed in June 2011 (the “IPO”) and (iii) thereafter operating as an externally managed, closed-end, non-diversified management investment company that has elected to be regulated as a business development company (“BDC”) under the Investment Company Act of 1940, as amended (the “1940 Act”).
On June 20, 2011, FIC acquired 100% of the limited partnership interests in Fund I and 100% of the equity interests in FMCGP, in exchange for 4,056,521 shares of common stock in FIC (the “Formation Transactions”). Fund I became FIC’s wholly-owned subsidiary, retained its license to operate as a Small Business Investment Company (“SBIC”), and continues to hold investments and make new investments. The IPO consisted of the sale of 5,370,500 shares of the Company’s common stock, including shares purchased by the underwriters pursuant to their exercise of the over-allotment option, at a price of $15.00 per share resulting in net proceeds of $73,626, after deducting underwriting fees and commissions and offering costs totaling $6,932.
The Company provides customized debt and equity financing solutions to lower middle-market companies. Fund I commenced operations on May 1, 2007, and on October 22, 2007, was granted a license to operate as a SBIC under the authority of the U.S. Small Business Administration (“SBA”). On March 29, 2013, the Company commenced operations of a second wholly-owned subsidiary, Fidus Mezzanine Capital II, L.P. (“Fund II”) and on May 28, 2013, was granted a second license to operate Fund II as an SBIC. Collectively, Fund I and Fund II are referred to as the “Funds.” The SBIC licenses allow the Funds to obtain leverage by issuing SBA-guaranteed debentures (“SBA debentures”), subject to the issuance of leverage commitments by the SBA and other customary procedures. As SBICs, the Funds are subject to a variety of regulations and oversight by the SBA under the Small Business Investment Act of 1958, as amended (the “SBIC Act”), concerning, among other things, the size and nature of the companies in which they may invest and the structure of those investments.
Fund I has also elected to be regulated as a BDC under the 1940 Act. Fund II will not be registered under the 1940 Act and will rely on the exclusion from the definition of investment company contained in Section 3(c)(7) of the 1940 Act. In addition, for federal income tax purposes, the Company elected to be treated as a regulated investment company (“RIC”) under Subchapter M of the Internal Revenue Code of 1986, as amended (the “Code”), commencing with its taxable year ended December 31, 2011.
For all periods subsequent to the consummation of the Formation Transactions and the IPO, the Company pays a quarterly base management fee and an incentive fee to Fidus Investment Advisors, LLC (the “Investment Advisor”) under an investment advisory agreement (the “Investment Advisory Agreement”). The initial investment professionals of the Investment Advisor were previously employed by Fidus Capital, LLC, who was the investment advisor to Fund I prior to consummation of the Formation Transactions.
Note 2. Significant Accounting Policies
Basis of presentation: The accompanying consolidated financial statements of the Company have been prepared in accordance with generally accepted accounting principles in the United States of America (“GAAP”) pursuant to the requirements for reporting on Form 10-K, Accounting Standards Codification (“ASC”) 946, Financial Services – Investment Companies (“ASC 946), and Articles 6 or 10 of Regulation S-X. In the opinion
- 96 -
Table of Contents
FIDUS INVESTMENT CORPORATION
Notes to Consolidated Financial Statements—(Continued)
(In thousands, except shares and per share data)
of management, the consolidated financial statements reflect all adjustments and reclassifications that are necessary for the fair presentation of financial results as of and for the periods presented. Certain prior period amounts have been reclassified to conform to the current period presentation.
Use of estimates: The preparation of the consolidated financial statements in conformity with GAAP requires management to make estimates and assumptions that affect the reported amounts of assets and liabilities and disclosure of contingent assets and liabilities at the date of the consolidated financial statements and the reported amounts of revenues and expenses during the reporting period. Actual results could differ from those estimates.
Consolidation: Pursuant to Article 6 of Regulation S-X and ASC 946, the Company will generally not consolidate its investments in a company other than an investment company subsidiary or a controlled operating company whose business consists of providing services to the Company. As a result, the consolidated financial statements of the Company include only the accounts of the Company and its wholly-owned subsidiaries, including the Funds. All significant intercompany balances and transactions have been eliminated.
Fair value of financial instruments: The Company measures and discloses fair value with respect to substantially all of its financial instruments in accordance with ASC Topic 820 — Fair Value Measurements and Disclosures (“ASC Topic 820”). ASC Topic 820 defines fair value, establishes a framework used to measure fair value, and requires disclosures for fair value measurements, including the categorization of financial instruments into a three-level hierarchy based on the transparency of valuation inputs. See Note 4 to the consolidated financial statements for further discussion regarding the fair value measurements and hierarchy.
Investment classification: The Company classifies its investments in accordance with the requirements of the 1940 Act. Under the 1940 Act, “Control Investments” are defined as investments in those companies where the Company owns more than 25% of the voting securities of such company or has rights to maintain greater than 50% of the board representation. Under the 1940 Act, “Affiliate Investments” are defined as investments in those companies where the Company owns between 5% and 25% of the voting securities of such company. “Non-Control/Non-Affiliate Investments” are those that neither qualify as Control Investments nor Affiliate Investments.
Segments: In accordance with ASC Topic 280 — Segment Reporting, the Company has determined that it has a single reporting segment and operating unit structure.
Cash and cash equivalents: Cash and cash equivalents are highly liquid investments with an original maturity of three months or less at the date of acquisition. The Company places its cash in financial institutions and, at times, such balances may be in excess of the Federal Deposit Insurance Corporation insurance limits. The Company does not believe its cash balances are exposed to any significant credit risk.
Deferred financing costs: Deferred financing costs consist of fees and expenses paid in connection with the Credit Facility (as defined in Note 6) and SBA debentures. Deferred financing costs are capitalized and amortized over the term of the debt agreement using the effective interest method.
Deferred equity financing costs: Deferred equity financing costs include registration expenses related to shelf filings, including expenses related to the launch of the ATM Program. These expenses primarily consist of Securities and Exchange Commission (“SEC”) registration fees, legal fees and accounting fees incurred. These expenses are included in prepaid assets and are charged to additional paid in capital upon the receipt of proceeds from an equity offering or charged to expense if no offering is completed.
- 97 -
Table of Contents
FIDUS INVESTMENT CORPORATION
Notes to Consolidated Financial Statements—(Continued)
(In thousands, except shares and per share data)
Realized gains or losses and unrealized appreciation or depreciation on investments: Realized gains or losses on investments are recorded upon the sale or disposition of a portfolio investment and are calculated as the difference between the net proceeds from the sale or disposition and the cost basis of the investment, without regard to unrealized appreciation or depreciation previously recognized. Net change in unrealized appreciation or depreciation on the consolidated statements of operations includes changes in the fair value of investments from the prior period, as determined in good faith by the Company’s board of directors (the “Board”) through the application of the Company’s valuation policy, as well as reclassifications of any prior period unrealized appreciation or depreciation on exited investments to realized gains or losses on investments.
Interest, fee and dividend income: Interest and dividend income is recorded on the accrual basis to the extent that the Company expects to collect such amounts. Interest and dividend income is accrued daily based on the outstanding principal amount and the contractual terms of the debt or preferred equity investment. Dividend income is recorded at the point an obligation exists for the portfolio company to make a distribution. Distributions from portfolio companies are evaluated to determine if the distribution is a distribution of earnings or a return of capital.
Certain of the Company’s investments contain a payment-in-kind (“PIK”) income provision. The PIK income, computed at the contractual rate specified in the applicable investment agreement, is added to the principal balance of the investment, rather than being paid in cash, and recorded as interest or dividend income, as applicable, on the consolidated statements of operations. Generally, PIK can be paid-in-kind or all in cash. The Company stops accruing PIK income when there is reasonable doubt that PIK income will be collected. PIK income is included in the Company’s taxable income and, therefore, affects the amount the Company is required to pay to shareholders in the form of dividends in order to maintain the Company’s status as a RIC and to avoid corporate federal income tax, even though the Company has not yet collected the cash.
When there is reasonable doubt that principal, interest or dividends will be collected, loans or preferred equity investments are placed on non-accrual status and the Company will generally cease recognizing interest or dividend income. Interest and dividend payments received on non-accrual investments may be recognized as interest or dividend income or may be applied to the investment principal balance based on management’s judgment. Non-accrual investments are restored to accrual status when past due principal, interest or dividends are paid and, in management’s judgment, payments are likely to remain current.
In connection with the Company’s debt investments, the Company will sometimes receive warrants or other equity-related securities from the borrower (“Warrants”). The Company determines the cost basis of Warrants based upon their respective fair values on the date of receipt in proportion to the total fair value of the debt and Warrants received. Any resulting difference between the face amount of the debt and its recorded fair value resulting from the assignment of value to the Warrants is treated as original issue discount (“OID”), and accreted into interest income using the effective interest method over the term of the debt investment.
Transaction fees earned in connection with the Company’s investments are recognized as fee income. Such fees typically include fees for services, including structuring and advisory services, provided to portfolio companies. The Company recognizes income from fees for providing such structuring and advisory services when the services are rendered or the transactions are completed. Upon the prepayment of a loan or debt security, any prepayment penalties are recorded as fee income when earned.
The Company also typically receives loan origination or closing fees in connection with investments. Such loan origination and closing fees are capitalized as unearned income and offset against investment cost basis on the consolidated statements of assets and liabilities and accreted into income over the life of the investment.
- 98 -
Table of Contents
FIDUS INVESTMENT CORPORATION
Notes to Consolidated Financial Statements—(Continued)
(In thousands, except shares and per share data)
Partial loan sales: The Company follows the guidance in ASC 860, Transfers and Servicing, when accounting for loan participations and other partial loan sales. Such guidance requires a participation or other partial loan sale to meet the definition of a “participating interest,” as defined in the guidance, in order for sale treatment to be allowed. Participations or other partial loan sales which do not meet the definition of a participating interest should remain on the Company’s consolidated statement of assets and liabilities and the proceeds recorded as a secured borrowing until the definition is met. Management has determined that all participations and other partial loan sale transactions entered into by the Company have met the definition of a participating interest. Accordingly, the Company uses sale treatment in accounting for such transactions.
Income taxes: The Company has elected to be treated as a RIC under Subchapter M of the Code, which will generally relieve the Company from U.S. federal income taxes with respect to all income distributed to stockholders. In order to qualify as a RIC, the Company is required to timely distribute to its stockholders at least 90.0% of “investment company taxable income,” as defined by Subchapter M of the Code, each year. Depending on the level of taxable income earned in a tax year, the Company may choose to carry forward taxable income in excess of current year distributions into the next tax year; however, the Company will pay a 4.0% excise tax if it does not distribute at least 98.0% of the current year’s ordinary taxable income. Any such carryover taxable income must be distributed through a dividend declared prior to the later of the date on which the final tax return related to the year in which the Company generated such taxable income is filed or the 15th day of the 9th month following the close of such taxable year. In addition, the Company will be subject to federal excise tax if it does not distribute at least 98.2% of its net capital gains realized, computed for any one year period ending October 31.
In the future, the Funds may be limited by provisions of the SBIC Act and SBA regulations governing SBICs from making certain distributions to FIC that may be necessary to enable FIC to make the minimum distributions required to qualify as a RIC.
The Company has certain wholly-owned taxable subsidiaries (the “Taxable Subsidiaries”), each of which generally holds one or more of the Company’s portfolio investments listed on the consolidated schedules of investments. The Taxable Subsidiaries are consolidated for financial reporting purposes, such that the Company’s consolidated financial statements reflect the Company’s investment in the portfolio companies owned by the Taxable Subsidiaries. The purpose of the Taxable Subsidiaries is to permit the Company to hold equity investments in portfolio companies that are taxed as partnerships for U.S. federal income tax purposes (such as entities organized as limited liability companies (“LLCs”) or other forms of pass through entities) while complying with the “source-of-income” requirements contained in the RIC tax provisions. The Taxable Subsidiaries are not consolidated with the Company for U.S. federal corporate income tax purposes, and each Taxable Subsidiary will be subject to U.S. federal corporate income tax on its taxable income. Any such income or expense is reflected in the consolidated statements of operations.
U.S. federal income tax regulations differ from GAAP, and as a result, distributions in accordance with tax regulations may differ from net investment income and realized gains recognized under GAAP. Differences may be permanent or temporary. Permanent differences may arise as a result of, among other items, a difference in the book and tax basis of certain assets and nondeductible federal income taxes. Temporary differences arise when certain items of income, expense, gain or loss are recognized at some time in the future.
ASC Topic 740 — Accounting for Uncertainty in Income Taxes (“ASC Topic 740”) provides guidance for how uncertain tax positions should be recognized, measured, presented and disclosed in the consolidated financial statements. ASC Topic 740 requires the evaluation of tax positions taken in the course of preparing the Company’s tax returns to determine whether the tax positions are “more-likely-than-not” to be respected by the
- 99 -
Table of Contents
FIDUS INVESTMENT CORPORATION
Notes to Consolidated Financial Statements—(Continued)
(In thousands, except shares and per share data)
applicable tax authorities. Tax benefits of positions not deemed to meet the more-likely-than-not threshold would be recorded as a tax expense in the current year. It is the Company’s policy to recognize accrued interest and penalties related to uncertain tax benefits in income tax provision, if any. There were no material uncertain income tax positions at December 31, 2015 and 2014. The 2012 through 2014 tax years remain subject to examination by U.S. federal and most state tax authorities.
Distributions to stockholders: Distributions to stockholders are recorded on the record date with respect to such distributions. The amount, if any, to be distributed to stockholders, is determined by the Board each quarter and is generally based upon the earnings estimated by management. Net realized capital gains, if any, may be distributed at least annually, although the Company may decide to retain such capital gains for investment.
The determination of the tax attributes for the Company’s distributions is made annually, and is based upon the Company’s taxable income and distributions paid to its stockholders for the full year. Ordinary dividend distributions from a RIC do not qualify for the preferential tax rate on qualified dividend income from domestic corporations and qualified foreign corporations, except to the extent that the RIC received the income in the form of qualifying dividends from domestic corporations and qualified foreign corporations. The tax characterization of the Company’s distributions generally includes both ordinary income and capital gains but may also include qualified dividends or return of capital.
The Company has adopted a dividend reinvestment plan (“DRIP”) that provides for the reinvestment of dividends on behalf of its stockholders, unless a stockholder has elected to receive dividends in cash. As a result, if the Company declares a cash dividend, the Company’s stockholders who have not “opted out” of the DRIP at least three days prior to the dividend payment date will have their cash dividend automatically reinvested into additional shares of the Company’s common stock. The Company has the option to satisfy the share requirements of the DRIP through the issuance of new shares of common stock or through open market purchases of common stock by the DRIP plan administrator. Newly issued shares are valued based upon the final closing price of the Company’s common stock on a date determined by the Board. Shares purchased in the open market to satisfy the DRIP requirements will be valued based upon the average price of the applicable shares purchased by the DRIP plan administrator before any associated brokerage or other costs. See Note 9 to the consolidated financial statements regarding dividend declarations and distributions.
Earnings and net asset value per share: The earnings per share calculations for the years ended December 31, 2015, 2014 and 2013, are computed utilizing the weighted average shares outstanding for the period. Net asset value per share is calculated using the number of shares outstanding as of the end of the period.
Recent accounting pronouncements: In February 2015, the FASB issued ASU 2015-02, Consolidation: Amendments to the Consolidation Analysis, which amends the criteria for determining which entities are considered variable interest entities (“VIEs”), amends the criteria for determining if a service provider possesses a variable interest in a VIE and ends the deferral granted to investment companies for application of the VIE consolidation model. This guidance is effective for annual and interim reporting periods of public entities beginning after December 15, 2015 and early adoption is permitted. The Company is currently evaluating the impact this ASU will have on the Company’s consolidated financial position or disclosures.
In April 2015, FASB issued ASU 2015-03, Interest — Imputation of interest (Subtopic 835-30): Simplifying the Presentation of Debt Issuance Costs, which requires that debt issuance costs related to a recognized debt liability be presented in the balance sheet as a direct deduction from the carrying amount of that debt liability rather than as an asset. Amortization of the costs will continue to be reported as interest expense. This guidance is effective for annual and interim periods beginning after December 15, 2015. The new guidance will be applied
- 100 -
Table of Contents
FIDUS INVESTMENT CORPORATION
Notes to Consolidated Financial Statements—(Continued)
(In thousands, except shares and per share data)
retrospectively to each prior period presented. The Company is currently evaluating the impact this ASU will have on the Company’s consolidated financial position or disclosures.
In August 2015, the Financial Accounting Standards Board (“FASB”) issued Accounting Standards Update (“ASU”) 2015-14, Revenue from Contracts with Customers (Topic 606), which supersedes the revenue recognition requirements in Revenue Recognition (Topic 605). Under the new guidance, an entity should recognize revenue to depict the transfer of promised goods or services to customers in an amount that reflects the consideration to which the entity expects to be entitled in exchange for those goods or services. This guidance is effective for annual and interim reporting periods beginning after December 15, 2017 and early application is permitted only for annual reporting periods beginning after December 15, 2016, including interim reporting periods within that reporting period. The Company is currently evaluating the impact this ASU will have on the Company’s consolidated financial position or disclosures.
Note 3. Portfolio Company Investments
The Company’s portfolio investments principally consist of secured and unsecured debt, equity warrants and direct equity investments in privately held companies. The debt investments may or may not be secured by either a first or second lien on the assets of the portfolio company. The debt investments generally bear interest at fixed rates, and generally mature between five and seven years from the original investment. In connection with a debt investment, the Company also may receive nominally priced equity warrants and/or make a direct equity investment in the portfolio company. The Company’s warrants or equity investments may be investments in a holding company related to the portfolio company. In addition, the Company periodically makes equity investments in its portfolio companies through Taxable Subsidiaries. In both situations, the investment is generally reported under the name of the operating company on the consolidated schedules of investments.
As of December 31, 2015, the Company had investments in 53 portfolio companies with an aggregate fair value of $443,269 and a weighted average effective yield on its debt investments of 13.3%. As of December 31, 2015, the Company held equity investments in 83.0% of its portfolio companies and the average fully diluted equity ownership in those portfolio companies was 8.3%. As of December 31, 2014, the Company had investments in 42 portfolio companies with an aggregate fair value of $396,355 and a weighted average effective yield on its debt investments of 13.4%. As of December 31, 2014, the Company held equity investments in 85.7% of its portfolio companies and the average fully diluted equity ownership in those portfolio companies was 8.7%. The weighted average yields were computed using the effective interest rates for debt investments at cost as of December 31, 2015 and 2014, including accretion of original issue discount and loan origination fees, but excluding investments on non-accrual status, if any.
Purchases of debt and equity investments for the years ended December 31, 2015, 2014 and 2013 totaled $136,380, $149,814 and $149,095, respectively. Proceeds from sales and repayments, including principal, return of capital distributions and realized gains, of portfolio investments for the years ended December 31, 2015, 2014 and 2013 totaled $94,686 and $62,643 and $131,199, respectively.
- 101 -
Table of Contents
FIDUS INVESTMENT CORPORATION
Notes to Consolidated Financial Statements—(Continued)
(In thousands, except shares and per share data)
Investments by type with corresponding percentage of total portfolio investments consisted of the following:
| Fair Value | Cost | |||||||||||||||||||||||||||||||
| December 31, 2015 | December 31, 2014 | December 31, 2015 | December 31, 2014 | |||||||||||||||||||||||||||||
| Subordinated notes |
$ | 300,467 | 67.8 | % | $ | 273,711 | 69.1 | % | $ | 309,899 | 69.2 | % | $ | 273,347 | 69.8 | % | ||||||||||||||||
| Senior secured loans |
88,485 | 20.0 | 74,286 | 18.7 | 88,505 | 19.7 | 74,486 | 19.0 | ||||||||||||||||||||||||
| Equity |
44,899 | 10.1 | 42,886 | 10.8 | 42,651 | 9.5 | 36,623 | 9.4 | ||||||||||||||||||||||||
| Warrants |
9,233 | 2.1 | 5,472 | 1.4 | 7,098 | 1.6 | 6,882 | 1.8 | ||||||||||||||||||||||||
| Royalty rights |
185 | — | — | — | 185 | — | — | — | ||||||||||||||||||||||||
|
|
|
|
|
|
|
|
|
|
|
|
|
|
|
|
|
|||||||||||||||||
| Total |
$ | 443,269 | 100.0 | % | $ | 396,355 | 100.0 | % | $ | 448,338 | 100.0 | % | $ | 391,338 | 100.0 | % | ||||||||||||||||
|
|
|
|
|
|
|
|
|
|
|
|
|
|
|
|
|
|||||||||||||||||
All investments made by the Company as of December 31, 2015 and 2014 were made in portfolio companies headquartered in the U.S. The following table shows portfolio composition by geographic region at fair value and cost and as a percentage of total investments. The geographic composition is determined by the location of the corporate headquarters of the portfolio company, which may not be indicative of the primary source of the portfolio company’s business.
| Fair Value | Cost | |||||||||||||||||||||||||||||||
| December 31, 2015 | December 31, 2014 | December 31, 2015 | December 31, 2014 | |||||||||||||||||||||||||||||
| Midwest |
$ | 119,291 | 26.8 | % | $ | 94,572 | 23.9 | % | $ | 116,015 | 25.9 | % | $ | 92,721 | 23.7 | % | ||||||||||||||||
| Southeast |
107,975 | 24.4 | 113,516 | 28.6 | 113,430 | 25.3 | 113,725 | 29.0 | ||||||||||||||||||||||||
| Northeast |
93,430 | 21.1 | 66,900 | 16.9 | 92,492 | 20.6 | 65,248 | 16.7 | ||||||||||||||||||||||||
| West |
84,648 | 19.1 | 78,904 | 19.9 | 77,028 | 17.2 | 71,975 | 18.4 | ||||||||||||||||||||||||
| Southwest |
37,925 | 8.6 | 42,463 | 10.7 | 49,373 | 11.0 | 47,669 | 12.2 | ||||||||||||||||||||||||
|
|
|
|
|
|
|
|
|
|
|
|
|
|
|
|
|
|||||||||||||||||
| Total |
$ | 443,269 | 100.0 | % | $ | 396,355 | 100.0 | % | $ | 448,338 | 100.0 | % | $ | 391,338 | 100.0 | % | ||||||||||||||||
|
|
|
|
|
|
|
|
|
|
|
|
|
|
|
|
|
|||||||||||||||||
As of December 31, 2015 and 2014, the Company had no portfolio company investments that represented more than 10% of the total investment portfolio. As of December 31, 2015, the Company had debt investments in one portfolio company on non-accrual status, which had an aggregate cost and fair value of $5,203 and $618, respectively. As of December 31, 2014, there were no investments on non-accrual status.
Schedule 12-14. Consolidated Schedule of Investments In and Advances To Affiliates
The table below represents the fair value of control and affiliate investments as of December 31, 2014 and any gross additions and reductions made to such investments, as well as the ending fair value as of December 31, 2015.
| Portfolio Company (1) |
Credited
to Income(2) |
December 31, 2014 Fair Value |
Gross Additions(3) |
Gross Reductions(4) |
December 31, 2015 Fair Value |
|||||||||||||||
| Control Investments |
||||||||||||||||||||
| Paramount Building Solutions, LLC |
||||||||||||||||||||
| Subordinated Note |
$ | — | $ | — | $ | 625 | $ | 7 | $ | 618 | ||||||||||
| Subordinated Note |
— | — | 275 | 275 | — | |||||||||||||||
| Subordinated Note |
51 | 1,067 | 597 | 1,664 | — | |||||||||||||||
| Subordinated Note |
169 | 2,687 | 84 | 2,771 | — | |||||||||||||||
| Warrant |
— | — | — | — | — | |||||||||||||||
- 102 -
Table of Contents
FIDUS INVESTMENT CORPORATION
Notes to Consolidated Financial Statements—(Continued)
(In thousands, except shares and per share data)
| Portfolio Company (1) |
Credited
to Income(2) |
December 31, 2014 Fair Value |
Gross Additions(3) |
Gross Reductions(4) |
December 31, 2015 Fair Value |
|||||||||||||||
| Preferred Equity |
$ | — | $ | 490 | $ | 339 | $ | 829 | $ | — | ||||||||||
| Common Equity |
— | — | — | — | — | |||||||||||||||
|
|
|
|
|
|
|
|
|
|
|
|||||||||||
| 220 | 4,244 | 1,920 | 5,546 | 618 | ||||||||||||||||
|
|
|
|
|
|
|
|
|
|
|
|||||||||||
| Total Control Investments |
220 | 4,244 | 1,920 | 5,546 | 618 | |||||||||||||||
|
|
|
|
|
|
|
|
|
|
|
|||||||||||
| Affiliate Investments |
||||||||||||||||||||
| Apex Microtechnology, Inc. |
||||||||||||||||||||
| Warrant |
— | 254 | 20 | — | 274 | |||||||||||||||
| Common Equity |
40 | 1,302 | 123 | — | 1,425 | |||||||||||||||
|
|
|
|
|
|
|
|
|
|
|
|||||||||||
| 40 | 1,556 | 143 | — | 1,699 | ||||||||||||||||
| FAR Research Inc. |
||||||||||||||||||||
| Senior Secured Loan |
963 | 7,600 | 40 | 192 | 7,448 | |||||||||||||||
| Revolving Loan |
27 | 136 | 2 | 2 | 136 | |||||||||||||||
| Common Equity |
— | 938 | — | 777 | 161 | |||||||||||||||
|
|
|
|
|
|
|
|
|
|
|
|||||||||||
| 990 | 8,674 | 42 | 971 | 7,745 | ||||||||||||||||
| Inflexxion, Inc. |
||||||||||||||||||||
| Senior Secured Loan |
543 | 4,726 | 5 | 1,261 | 3,470 | |||||||||||||||
| Revolving Loan |
30 | 295 | 241 | 404 | 132 | |||||||||||||||
| Preferred Equity |
— | 1,400 | — | 1,400 | — | |||||||||||||||
|
|
|
|
|
|
|
|
|
|
|
|||||||||||
| 573 | 6,421 | 246 | 3,065 | 3,602 | ||||||||||||||||
| Malabar International |
||||||||||||||||||||
| Subordinated Note |
1,125 | 7,264 | 197 | 11 | 7,450 | |||||||||||||||
| Preferred Equity |
123 | 3,258 | 1,550 | — | 4,808 | |||||||||||||||
|
|
|
|
|
|
|
|
|
|
|
|||||||||||
| 1,248 | 10,522 | 1,747 | 11 | 12,258 | ||||||||||||||||
| Medsurant Holdings, LLC |
||||||||||||||||||||
| Subordinated Note |
1,781 | 10,129 | 775 | 10,904 | — | |||||||||||||||
| Subordinated Note |
125 | — | 1,765 | 1,765 | — | |||||||||||||||
| Subordinated Note |
97 | — | 6,211 | — | 6,211 | |||||||||||||||
| Preferred Equity |
— | 1,027 | 488 | — | 1,515 | |||||||||||||||
| Warrant |
— | 3,715 | 1,522 | — | 5,237 | |||||||||||||||
|
|
|
|
|
|
|
|
|
|
|
|||||||||||
| 2,003 | 14,871 | 10,761 | 12,669 | 12,963 | ||||||||||||||||
| Microbiology Research Associates, Inc. |
||||||||||||||||||||
| Senior Secured Loan |
202 | — | 3,750 | — | 3,750 | |||||||||||||||
| Revolving Loan |
9 | — | — | — | — | |||||||||||||||
| Subordinated Note |
594 | — | 6,250 | — | 6,250 | |||||||||||||||
| Common Equity |
— | — | 1,444 | — | 1,444 | |||||||||||||||
|
|
|
|
|
|
|
|
|
|
|
|||||||||||
| 805 | — | 11,444 | — | 11,444 | ||||||||||||||||
| Mirage Trailers LLC |
||||||||||||||||||||
| Senior Secured Loan |
204 | — | 8,912 | — | 8,912 | |||||||||||||||
| Common Equity |
25 | — | 2,475 | — | 2,475 | |||||||||||||||
|
|
|
|
|
|
|
|
|
|
|
|||||||||||
| 229 | — | 11,387 | — | 11,387 | ||||||||||||||||
- 103 -
Table of Contents
FIDUS INVESTMENT CORPORATION
Notes to Consolidated Financial Statements—(Continued)
(In thousands, except shares and per share data)
| Portfolio Company (1) |
Credited
to Income(2) |
December 31, 2014 Fair Value |
Gross Additions(3) |
Gross Reductions(4) |
December 31, 2015 Fair Value |
|||||||||||||||
| Pfanstiehl, Inc. |
||||||||||||||||||||
| Subordinated Note |
$ | 855 | $ | 6,208 | $ | 11 | $ | 11 | $ | 6,208 | ||||||||||
| Common Equity |
180 | 3,088 | 1,192 | — | 4,280 | |||||||||||||||
|
|
|
|
|
|
|
|
|
|
|
|||||||||||
| 1,035 | 9,296 | 1,203 | 11 | 10,488 | ||||||||||||||||
| Safety Products Group, LLC |
||||||||||||||||||||
| Subordinated Note |
1,377 | 10,000 | 9 | 9 | 10,000 | |||||||||||||||
| Preferred Equity |
— | 812 | 22 | — | 834 | |||||||||||||||
| Common Equity |
— | — | — | — | — | |||||||||||||||
|
|
|
|
|
|
|
|
|
|
|
|||||||||||
| 1,377 | 10,812 | 31 | 9 | 10,834 | ||||||||||||||||
| Steward Holding LLC |
||||||||||||||||||||
| (dba Steward Advanced Materials) |
||||||||||||||||||||
| Subordinated Note |
243 | — | 6,987 | — | 6,987 | |||||||||||||||
| Common Equity |
— | — | 1,000 | — | 1,000 | |||||||||||||||
|
|
|
|
|
|
|
|
|
|
|
|||||||||||
| 243 | — | 7,987 | — | 7,987 | ||||||||||||||||
| Trantech Radiator Products, Inc. |
||||||||||||||||||||
| Subordinated Note |
1,312 | 9,518 | 135 | 1,159 | 8,494 | |||||||||||||||
| Common Equity |
— | 962 | — | 528 | 434 | |||||||||||||||
|
|
|
|
|
|
|
|
|
|
|
|||||||||||
| 1,312 | 10,480 | 135 | 1,687 | 8,928 | ||||||||||||||||
| Westminster Cracker Company, Inc. |
||||||||||||||||||||
| Preferred Equity |
16 | 152 | 16 | 168 | — | |||||||||||||||
| Common Equity |
65 | 1,804 | — | 1,613 | 191 | |||||||||||||||
|
|
|
|
|
|
|
|
|
|
|
|||||||||||
| 81 | 1,956 | 16 | 1,781 | 191 | ||||||||||||||||
| World Wide Packaging, LLC |
||||||||||||||||||||
| Subordinated Note |
1,413 | 10,097 | 180 | — | 10,277 | |||||||||||||||
| Common Equity |
54 | 1,515 | 528 | — | 2,043 | |||||||||||||||
|
|
|
|
|
|
|
|
|
|
|
|||||||||||
| 1,467 | 11,612 | 708 | — | 12,320 | ||||||||||||||||
|
|
|
|
|
|
|
|
|
|
|
|||||||||||
| Total Affiliate Investments |
$ | 11,403 | $ | 86,200 | $ | 45,850 | $ | 20,204 | $ | 111,846 | ||||||||||
|
|
|
|
|
|
|
|
|
|
|
|||||||||||
| (1) | The principal amount, the ownership detail for equity investments, and if the investment is income producing is shown in the consolidated schedule of investments. |
| (2) | Represents the total amount of interest, fees or dividends included in 2015 income for the portion of the year ended December 31, 2015 that an investment was included in Control or Affiliate categories. |
| (3) | Gross additions include increases in the cost basis of investments resulting from a new portfolio investment, follow on investments, accrued PIK interest or dividends, and accretion of OID and loan origination fees. Gross additions also include net increases in unrealized appreciation or net decreases in unrealized depreciation, as well as the movement of an existing portfolio company into this category and out of a different category. |
| (4) | Gross reductions include decreases in the cost basis of investments resulting from principal repayments, if any. Gross reductions also include net increases in unrealized depreciation or net decreases in unrealized appreciation as well as the movement of an existing portfolio company out of this category and into a different category. |
- 104 -
Table of Contents
FIDUS INVESTMENT CORPORATION
Notes to Consolidated Financial Statements—(Continued)
(In thousands, except shares and per share data)
Note 4. Fair Value Measurements
Investments
The Board has established and documented processes and methodologies for determining the fair values of portfolio company investments on a recurring basis in accordance with ASC Topic 820 and consistent with the requirements of the 1940 Act. Fair value is the price, determined at the measurement date, that would be received in the sale of an asset or paid to transfer a liability in an orderly transaction between market participants. Where available, fair value is based on observable market prices or parameters, or derived from such prices or parameters. Where observable prices or inputs are not available or reliable, valuation techniques described below are applied. Under ASC Topic 820, portfolio investments recorded at fair value in the consolidated financial statements are classified within the fair value hierarchy based upon the level of judgment associated with the inputs used to measure their value, as defined below:
Level 1 — Inputs are unadjusted, quoted prices in active markets for identical assets as of the measurement date.
Level 2 — Inputs include quoted prices for similar assets in active markets, or that are quoted prices for identical or similar assets in markets that are not active and inputs that are observable, either directly or indirectly, for substantially the full term, if applicable, of the investment.
Level 3 — Inputs include those that are both unobservable and significant to the overall fair value measurement.
An investment’s categorization within the valuation hierarchy is based upon the lowest level of input that is significant to the fair value measurement. The Company’s investment portfolio is comprised entirely of debt and equity securities of privately held companies for which quoted prices falling within the categories of Level 1 and Level 2 inputs are not available. Therefore, the Company values all of its portfolio investments at fair value, as determined in good faith by the Board, using Level 3 inputs. The degree of judgment exercised by the Board in determining fair value is greatest for investments classified as Level 3 inputs. Due to the inherent uncertainty of determining the fair values of investments that do not have readily available market values, the Board’s estimate of fair values may differ significantly from the values that would have been used had a ready market for the securities existed, and those differences may be material. In addition, changes in the market environment, portfolio company performance and other events that may occur over the lives of the investments may cause the amounts ultimately realized on these investments to be materially different than the valuations currently assigned.
With respect to investments for which market quotations are not readily available, the Board undertakes a multi-step valuation process each quarter, as described below:
| • | the quarterly valuation process begins with each portfolio company or investment being initially evaluated and rated by the investment professionals of the Investment Advisor responsible for the portfolio investment; |
| • | preliminary valuation conclusions are then documented and discussed with the investment committee of the Investment Advisor; |
| • | the Board engages one or more independent valuation firm(s) to conduct independent appraisals of a selection of our portfolio investments for which market quotations are not readily available. Each portfolio company investment is generally appraised by the valuation firm(s) at least once every calendar year and each new portfolio company investment is appraised at least once in the twelve- |
- 105 -
Table of Contents
FIDUS INVESTMENT CORPORATION
Notes to Consolidated Financial Statements—(Continued)
(In thousands, except shares and per share data)
| month period following the initial investment. In certain instances, the Company may determine that it is not cost-effective, and as a result it is not in the Company’s stockholders’ best interest, to request the independent appraisal of certain portfolio company investments. Such instances include, but are not limited to, situations where the Company determines that the fair value of the portfolio company investment is relatively insignificant to the fair value of the total portfolio. The Board consulted with the independent valuation firm(s) in arriving at the Company’s determination of fair value for 16 and 9 of its portfolio company investments representing 43.0% and 20.7% of the total portfolio investments at fair value (exclusive of new portfolio company investments made during the three months ended December 31, 2015 and 2014, respectively) as of December 31, 2015 and 2014, respectively. |
| • | the audit committee of the Board reviews the preliminary valuations of the Investment Advisor and of the independent valuation firm(s) and responds and supplements the valuation recommendations to reflect any comments; and |
| • | the Board discusses these valuations and determines the fair value of each investment in our portfolio in good faith, based on the input of the Investment Advisor, the independent valuation firm(s) and the audit committee. |
In making the good faith determination of the value of portfolio investments, the Board starts with the cost basis of the security. The transaction price is typically the best estimate of fair value at inception. When evidence supports a subsequent change to the carrying value from the original transaction price, adjustments are made to reflect the expected exit values.
Consistent with the policies and methodologies adopted by the Board, the Company performs detailed valuations of its debt and equity investments, including an analysis on the Company’s unfunded loan commitments, using both the market and income approaches as appropriate. Under the market approach, the Company typically uses the enterprise value methodology to determine the fair value of an investment. There is no one methodology to estimate enterprise value and, in fact, for any one portfolio company, enterprise value is generally best expressed as a range of values, from which the Company derives a single estimate of enterprise value. Under the income approach, the Company typically prepares and analyzes discounted cash flow models to estimate the present value of future cash flows of either an individual debt investment or of the underlying portfolio company itself.
The Company evaluates investments in portfolio companies using the most recent portfolio company financial statements and forecasts. The Company also consults with the portfolio company’s senior management to obtain further updates on the portfolio company’s performance, including information such as industry trends, new product development and other operational issues.
For the Company’s debt investments, including senior secured loans and subordinated notes, the primary valuation technique used to estimate the fair value is the discounted cash flow method. However, if there is deterioration in credit quality or a debt investment is in workout status, the Company may consider other methods in determining the fair value, including the value attributable to the debt investment from the enterprise value of the portfolio company or the proceeds that would be received in a liquidation analysis. The Company’s discounted cash flow models estimate a range of fair values by applying an appropriate discount rate to the future cash flow streams of its debt investments, based on future interest and principal payments as set forth in the associated loan agreements. The Company prepares a weighted average cost of capital for use in the discounted cash flow model for each investment, based on factors including, but not limited to: current pricing and credit metrics for similar proposed or executed investment transactions of private companies; the portfolio company’s historical financial results and outlook; and the portfolio company’s current leverage and credit quality as
- 106 -
Table of Contents
FIDUS INVESTMENT CORPORATION
Notes to Consolidated Financial Statements—(Continued)
(In thousands, except shares and per share data)
compared to leverage and credit quality as of the date the investment was made. The Company may also consider the following factors when determining the fair value of debt investments: the portfolio company’s ability to make future scheduled payments; prepayment penalties and other fees; estimated remaining life; the nature and realizable value of any collateral securing such debt investment; and changes in the interest rate environment and the credit markets that generally may affect the price at which similar investments may be made. The Company estimates the remaining life of its debt investments to generally be the legal maturity date of the instrument, as the Company generally intends to hold its loans to maturity. However, if the Company has information available to it that the loan is expected to be repaid in the near term, it would use an estimated remaining life based on the expected repayment date.
For the Company’s equity investments, including equity and warrants, the Company generally uses a market approach, including valuation methodologies consistent with industry practice, to estimate the enterprise value of portfolio companies. Typically, the enterprise value of a private company is based on multiples of EBITDA, net income, revenues, or in limited cases, book value. In estimating the enterprise value of a portfolio company, the Company analyzes various factors consistent with industry practice, including but not limited to original transaction multiples, the portfolio company’s historical and projected financial results, applicable market trading and transaction comparables, applicable market yields and leverage levels, the nature and realizable value of any collateral, the markets in which the portfolio company does business, and comparisons of financial ratios of peer companies that are public. Where applicable, the Company considers the Company’s ability to influence the capital structure of the portfolio company, as well as the timing of a potential exit.
The Company may also utilize an income approach when estimating the fair value of its equity securities, either as a primary methodology if consistent with industry practice or if the market approach is otherwise not applicable, or as a supporting methodology to corroborate the fair value ranges determined by the market approach. The Company typically prepares and analyzes discounted cash flow models based on projections of the future free cash flows (or earnings) of the portfolio company. The Company considers various factors, including but not limited to the portfolio company’s projected financial results, applicable market trading and transaction comparables, applicable market yields and leverage levels, the markets in which the portfolio company does business, and comparisons of financial ratios of peer companies that are public.
The fair value of the Company’s royalty rights are calculated based on projected future cash flows and the specific provisions contained in the pertinent agreements. The determination of the fair value of such royalty rights is not a significant component of the Company’s valuation process.
The Company reviews the fair value hierarchy classifications on a quarterly basis. Reclassifications impacting Level 3 of the fair value hierarchy are reported as transfers in or out of the Level 3 category as of the beginning of the quarter in which the reclassifications occur. There were no transfers among Levels 1, 2, and 3 during the years ended December 31, 2015 and 2014.
- 107 -
Table of Contents
FIDUS INVESTMENT CORPORATION
Notes to Consolidated Financial Statements—(Continued)
(In thousands, except shares and per share data)
The following tables present a reconciliation of the beginning and ending balances for fair valued investments measured using significant unobservable inputs (Level 3) for the years ended December 31, 2015 and 2014:
| Subordinated Notes |
Senior Secured Loans |
Equity | Warrants | Royalty Rights |
Total | |||||||||||||||||||
| Balance, December 31, 2013 |
$ | 214,400 | $ | 53,387 | $ | 32,560 | $ | 6,634 | $ | — | $ | 306,981 | ||||||||||||
| Net realized (losses) gains on investments |
(13,742 | ) | — | (3,973 | ) | 686 | — | (17,029 | ) | |||||||||||||||
| Net change in unrealized (depreciation) appreciation on investments |
5,928 | (276 | ) | 8,685 | (1,087 | ) | — | 13,250 | ||||||||||||||||
| Non-cash conversion of security types |
1,833 | (6,833 | ) | 5,000 | — | — | — | |||||||||||||||||
| Purchase of investments |
103,663 | 33,086 | 12,238 | 827 | — | 149,814 | ||||||||||||||||||
| Proceeds from sales and repayments of investments |
(43,356 | ) | (5,592 | ) | (12,107 | ) | (1,588 | ) | — | (62,643 | ) | |||||||||||||
| Interest and dividend income paid-in-kind |
4,577 | 586 | 454 | — | — | 5,617 | ||||||||||||||||||
| Proceeds from loan origination fees |
(589 | ) | (195 | ) | (23 | ) | — | — | (807 | ) | ||||||||||||||
| Accretion of loan origination fees |
402 | 82 | 45 | — | — | 529 | ||||||||||||||||||
| Accretion of original issue discount |
595 | 41 | 7 | — | — | 643 | ||||||||||||||||||
|
|
|
|
|
|
|
|
|
|
|
|
|
|||||||||||||
| Balance, December 31, 2014 |
273,711 | 74,286 | 42,886 | 5,472 | — | 396,355 | ||||||||||||||||||
| Net realized gains on investments |
155 | — | 9,376 | — | — | 9,531 | ||||||||||||||||||
| Net change in unrealized (depreciation) appreciation on investments |
(9,796 | ) | 180 | (4,015 | ) | 3,545 | — | (10,086 | ) | |||||||||||||||
| Purchase of investments |
98,050 | 28,341 | 9,496 | 216 | 277 | 136,380 | ||||||||||||||||||
| Proceeds from sales and repayments of investments |
(66,420 | ) | (15,162 | ) | (13,012 | ) | — | (92 | ) | (94,686 | ) | |||||||||||||
| Interest and dividend income paid-in-kind |
4,170 | 813 | 187 | — | — | 5,170 | ||||||||||||||||||
| Proceeds from loan origination fees |
(485 | ) | (260 | ) | (25 | ) | — | — | (770 | ) | ||||||||||||||
| Accretion of loan origination fees |
514 | 280 | 3 | — | — | 797 | ||||||||||||||||||
| Accretion of original issue discount |
568 | 7 | 3 | — | — | 578 | ||||||||||||||||||
|
|
|
|
|
|
|
|
|
|
|
|
|
|||||||||||||
| Balance, December 31, 2015 |
$ | 300,467 | $ | 88,485 | $ | 44,899 | $ | 9,233 | $ | 185 | $ | 443,269 | ||||||||||||
|
|
|
|
|
|
|
|
|
|
|
|
|
|||||||||||||
Net change in unrealized (depreciation) appreciation of $(5,363) and $2,294 for the years ended December 31, 2015 and 2014, respectively, was attributable to Level 3 investments held at December 31, 2015 and 2014, respectively.
- 108 -
Table of Contents
FIDUS INVESTMENT CORPORATION
Notes to Consolidated Financial Statements—(Continued)
(In thousands, except shares and per share data)
The following tables summarize the significant unobservable inputs by valuation technique used to determine the fair value of the Company’s Level 3 debt and equity investments as of December 31, 2015 and 2014. The tables are not intended to be all-inclusive, but instead capture the significant unobservable inputs relevant to the Company’s determination of fair values.
| Fair Value at December 31, 2015 |
Valuation Techniques |
Unobservable Inputs |
Range (weighted average) | |||||||
| Debt investments: |
||||||||||
| Subordinated notes |
$ | 299,849 | Discounted cash flow | Weighted average cost of capital | 10.9% - 22.8% (14.8%) | |||||
| 618 | Enterprise value | EBITDA multiples | 5.5x - 5.5x (5.5x) | |||||||
| Senior secured loans |
88,485 | Discounted cash flow | Weighted average cost of capital | 6.1% - 23.2% (14.1%) | ||||||
| Equity investments: | ||||||||||
| Equity |
44,899 | Enterprise value | EBITDA multiples | 3.8x - 13.1x (7.3x) | ||||||
| Warrants |
9,233 | Enterprise value | EBITDA multiples | 5.0x - 9.5x (6.7x) | ||||||
| Royalty rights |
185 | Discounted cash flow | Weighted average cost of capital | 22.0% - 27.0% (27.0%) | ||||||
| Fair Value at December 31, 2014 |
Valuation Techniques |
Unobservable Inputs |
Range (weighted average) | |||||||
| Debt investments: | ||||||||||
| Subordinated notes |
$ | 273,711 | Discounted cash flow | Weighted average cost of capital | 11.4% - 18.1% (13.6 %) | |||||
| Senior secured loans |
74,286 | Discounted cash flow | Weighted average cost of capital | 6.7% - 17.0% (14.0%) | ||||||
| Equity investments: |
||||||||||
| Equity |
42,886 | Enterprise value | EBITDA multiples | 4.5x - 10.4x (6.8x) | ||||||
| Warrants |
5,472 | Enterprise value | EBITDA multiples | 5.0x - 9.5x (7.0x) | ||||||
The significant unobservable input used in determining the fair value under the discounted cash flow technique is the weighted average cost of capital of each security. Significant increases (or decreases) in this input would likely result in a significantly lower (or higher) fair value estimate.
The significant unobservable inputs used in determining fair value under the enterprise value technique are revenue and EBITDA multiples. Significant increases (or decreases) in this input could result in a significantly higher (or lower) fair value estimate.
Other Financial Assets and Liabilities
ASC Topic 820 requires disclosure of the fair value of financial instruments for which it is practical to estimate such value. The Company believes that the carrying amounts of its other financial instruments such as cash and cash equivalents, receivables and payables approximate the fair value of such items due to the short maturity of such instruments. The fair value of borrowings under the Credit Facility (as defined in Note 6) are based on a market yield approach and current interest rates, which are level 3 inputs to the market yield model, and is estimated to be $15,500 and $10,000 as of December 31, 2015 and 2014, respectively, which is the same as the Company’s carrying value of the borrowings. SBA debentures are carried at cost and with their longer maturity dates, fair value is estimated by discounting remaining payments using current market rates for similar instruments and considering such factors as the legal maturity date and the ability of market participants to prepay the debentures. As of December 31, 2015 and 2014, the fair value of the Company’s SBA debentures using Level 3 inputs is estimated at $213,500 and $173,500, respectively, which is the same as the Company’s carrying value of the debentures.
- 109 -
Table of Contents
FIDUS INVESTMENT CORPORATION
Notes to Consolidated Financial Statements—(Continued)
(In thousands, except shares and per share data)
Note 5. Related Party Transactions
Investment Advisory Agreement: Concurrent with the Formation Transactions, the Company entered into the Investment Advisory Agreement with the Investment Advisor. On June 3, 2015, the Board approved the renewal of the Investment Advisory Agreement through June 20, 2016. Pursuant to the Investment Advisory Agreement and subject to the overall supervision of the Board, the Investment Advisor provides investment advisory services to the Company. For providing these services, the Investment Advisor receives a fee, consisting of two components — a base management fee and an incentive fee.
The base management fee is calculated at an annual rate of 1.75% based on the average value of total assets (other than cash or cash equivalents but including assets purchased with borrowed amounts) at the end of the two most recently completed calendar quarters. The base management fee is payable quarterly in arrears. During the year ended December 31, 2014, the Investment Advisor waived $13 of the base management fee attributable to a portfolio investment that funded into escrow on September 30, 2014 but did not close until after the end of the quarter. The base management fee under the Investment Advisory Agreement for the years ended December 31, 2015, 2014 and 2013 totaled $7,545, $5,899 and $5,261, respectively.
The incentive fee consists of two parts. The first part is calculated and payable quarterly in arrears based on the Company’s pre-incentive fee net investment income for the quarter. Pre-incentive fee net investment income means interest income, dividend income and any other income (including any other fees such as commitment, origination, structuring, diligence and consulting fees or other fees that the Company receives from portfolio companies but excluding fees for providing managerial assistance) accrued during the calendar quarter, minus operating expenses for the quarter (including the base management fee, any expenses payable under the Administration Agreement (defined below) and any interest expense and dividends paid on any outstanding preferred stock, but excluding the incentive fee, excise taxes on realized gains and any deferred organizing and offering costs). Pre-incentive fee net investment income includes, in the case of investments with a deferred interest feature (such as market discount, debt instruments with payment-in-kind income, preferred stock with PIK dividends and zero-coupon securities), accrued income the Company has not yet received in cash. The Investment Advisor is not under any obligation to reimburse the Company for any part of the incentive fee it receives that was based on accrued interest that the Company never collects.
Pre-incentive fee net investment income does not include any realized capital gains, taxes associated with such realized capital gains, realized capital losses or unrealized capital appreciation or depreciation. Because of the structure of the incentive fee, it is possible that the Company may pay an incentive fee in a quarter where the Company incurs a loss. For example, if the Company generates pre-incentive fee net investment income in excess of the hurdle rate (as defined below) for a quarter, the Company will pay the applicable incentive fee even if the Company has incurred a loss in that quarter due to a net loss on investments.
Pre-incentive fee net investment income, expressed as a rate of return on the value of the Company’s weighted average net assets (defined as total assets less indebtedness and before taking into account any incentive fees payable during the period) at the end of the immediately preceding calendar quarter, is compared to a fixed “hurdle rate” of 2.0% per quarter. If market interest rates rise, the Company may be able to invest funds in debt instruments that provide for a higher return, which would increase the Company’s pre-incentive fee net investment income and make it easier for the Investment Advisor to surpass the fixed hurdle rate and receive an incentive fee based on such net investment income. The Company’s pre-incentive fee net investment income used to calculate this part of the incentive fee is also included in the total assets (other than cash and cash equivalents but including assets purchased with borrowed amounts) used to calculate the 1.75% base management fee.
- 110 -
Table of Contents
FIDUS INVESTMENT CORPORATION
Notes to Consolidated Financial Statements—(Continued)
(In thousands, except shares and per share data)
The Company pays the Investment Advisor an incentive fee with respect to pre-incentive fee net investment income in each calendar quarter as follows:
| • | no incentive fee in any calendar quarter in which the pre-incentive fee net investment income does not exceed the hurdle rate of 2.0%; |
| • | 100.0% of the Company’s pre-incentive fee net investment income with respect to that portion of such pre-incentive fee net investment income, if any, that exceeds the hurdle rate but is less than 2.5% in any calendar quarter. This portion of the pre-incentive fee net investment income (which exceeds the hurdle rate but is less than 2.5%) is referred to as the “catch-up” provision. The catch-up is meant to provide the Investment Advisor with 20.0% of the pre-incentive fee net investment income as if a hurdle rate did not apply if this net investment income exceeds 2.5% in any calendar quarter; and |
| • | 20.0% of the amount of the Company’s pre-incentive fee net investment income, if any, that exceeds 2.5% in any calendar quarter. |
The sum of the calculations above equals the income incentive fee. The income incentive fee is appropriately prorated for any period of less than three months and adjusted for any share issuances or repurchases during the calendar quarter. The income incentive fee for the years ended December 31, 2015, 2014 and 2013 totaled $6,582, $5,588 and $5,211, respectively.
The second part of the incentive fee is a capital gains incentive fee that is determined and paid in arrears as of the end of each fiscal year (or upon termination of the Investment Advisory Agreement, as of the termination date), and equals 20.0% of the net capital gains as of the end of the fiscal year. In determining the capital gains incentive fee to be paid to the Investment Advisor, the Company calculates the cumulative aggregate realized capital gains and cumulative aggregate realized capital losses since the Formation Transactions, and the aggregate unrealized capital depreciation as of the date of the calculation, as applicable, with respect to each of the investments in the Company’s portfolio. At the end of the applicable year, the amount of capital gains that serves as the basis for the calculation of the capital gains incentive fee to be paid equals the cumulative aggregate realized capital gains less cumulative aggregate realized capital losses, less aggregate unrealized capital depreciation, with respect to the Company’s portfolio of investments. If this number is positive at the end of such year, then the capital gains incentive fee to be paid for such year equals 20.0% of such amount, less the aggregate amount of any capital gains incentive fees paid in all prior years. As of both December 31, 2015 and 2014, the capital gains incentive fee payable was $0. The aggregate amount of capital gains incentive fees paid from the IPO through December 31, 2015 is $348.
In addition, the Company accrues, but does not pay, a capital gains incentive fee in connection with any unrealized capital appreciation, as appropriate. If, on a cumulative basis, the sum of net realized gains/(losses) plus net unrealized appreciation/(depreciation) decreases during a period, the Company will reverse any excess capital gains incentive fee previously accrued such that the amount of capital gains incentive fee accrued is no more than 20.0% of the sum of net realized gains/(losses) plus net unrealized appreciation/(depreciation). During the years ended December 31, 2015 and 2014, the Company reversed previously accrued capital gains incentive fees of $101 and $731, respectively. During the year ended December 31, 2013, the Company accrued capital gains incentive fees of $1,581.
The sum of the income incentive fee and the capital gains incentive fee is the incentive fee and is reported in the consolidated statements of operations. Accrued management fees, income incentive fees and capital gains incentive fees are reported in the due to affiliates line in the consolidated statements of assets and liabilities.
- 111 -
Table of Contents
FIDUS INVESTMENT CORPORATION
Notes to Consolidated Financial Statements—(Continued)
(In thousands, except shares and per share data)
Unless terminated earlier as described below, the Investment Advisory Agreement will continue in effect from year to year if approved annually by the Board or by the affirmative vote of the holders of a majority of the Company’s outstanding voting securities, and, in either case, if also approved by a majority of the Independent Directors. The Investment Advisory Agreement automatically terminates in the event of its assignment, as defined in the 1940 Act, by the Investment Advisor and may be terminated by either party without penalty upon not less than 60 days’ written notice to the other. The holders of a majority of the Company’s outstanding voting securities may also terminate the Investment Advisory Agreement without penalty.
Administration Agreement: Concurrent with the Formation Transactions, the Company also entered into an administration agreement (the “Administration Agreement”) with the Investment Advisor. On June 3, 2015, the Board approved the renewal of the Administrative Agreement through June 20, 2016. Under the Administration Agreement, the Investment Advisor furnishes the Company with office facilities and equipment, provides it clerical, bookkeeping and record keeping services at such facilities and provides the Company with other administrative services necessary to conduct its day-to-day operations. The Company reimburses the Investment Advisor for the allocable portion of overhead expenses incurred in performing its obligations under the Administration Agreement, including rent and the Company’s allocable portion of the cost of its chief financial officer and chief compliance officer and their respective staffs. Under the Administration Agreement, the Investment Advisor also provides managerial assistance to those portfolio companies to which the Company is required to provide such assistance and the Company reimburses the Investment Advisor for fees and expenses incurred with providing such services. In addition, the Company reimburses the Investment Advisor for fees and expenses incurred while performing due diligence on the Company’s prospective portfolio companies. Under the Administration Agreement, administrative expenses for services provided for the years ended December 31, 2015, 2014 and 2013 totaled $1,465, $1,772 and $1,155, respectively. Accrued administrative expenses are reported in the due to affiliates line in the consolidated statements of assets and liabilities.
Note 6. Debt
Revolving Credit Facility: On June 16, 2014, FIC entered into a senior secured revolving credit agreement (the “Credit Facility”) with ING Capital LLC (“ING”), as the administrative agent, collateral agent, and lender. The Credit Facility had an initial commitment of $30,000 with an accordion feature that allows for an increase in the total commitments up to $75,000, subject to certain conditions and the satisfaction of specified financial covenants. The Credit Facility is secured by certain portfolio investments held by the Company, but portfolio investments held by the Funds are not collateral for the Credit Facility. The stated maturity date for the Credit Facility is June 16, 2018, which may be extended by mutual agreement.
On December 19, 2014, FIC amended the Credit Facility to (i) increase the commitment from $30,000 to $50,000 (ii) allow FIC to buy-back up to $10,000 of the Company’s common stock subject to the satisfaction of specified financial covenants and conditions. The Credit Facility continues to have an accordion feature which allows for an increase in the total commitment up to $75,000.
Amounts available to borrow under the Credit Facility are subject to a minimum borrowing/collateral base that applies an advance rate to certain investments held by the Company. The Company is subject to limitations with respect to the investments securing the Credit Facility, including, but not limited to, restrictions on sector concentrations, loan size, payment frequency and status and collateral interests, as well as restrictions on portfolio company leverage, which may also affect the borrowing base and therefore amounts available to borrow.
- 112 -
Table of Contents
FIDUS INVESTMENT CORPORATION
Notes to Consolidated Financial Statements—(Continued)
(In thousands, except shares and per share data)
Borrowings under the Credit Facility bear interest, subject to the Company’s election, on a per annum basis equal to (i) the alternate base rate plus 2.5% or (ii) the applicable LIBOR rate plus 3.5%. The alternate base rate is equal to the greater of (i) prime rate, (ii) the federal funds rate plus 0.5% or (iii) the three-month LIBOR rate plus 1.0%. The Company pays a commitment fee between 0.5% and 1.0% per annum based on the size of the unused portion of the Credit Facility.
The Company has made customary representations and warranties and is required to comply with various covenants, reporting requirements and other customary requirements for similar credit facilities. These covenants are subject to important limitations and exceptions that are described in the documents governing the Credit Facility. As of December 31, 2015 and 2014, the Company was in compliance in all material respect with the terms of the Credit Facility.
As of December 31, 2015 and 2014, the Company had outstanding borrowings under the Credit Facility of $15,500 and $10,000, respectively. For the years ended December 31, 2015, 2014 and 2013, interest and financing expenses related to the Credit Facility amounted to $1,069, $325 and $0, respectively. As of December 31, 2015 and 2014, accrued interest and fees payable related to the Credit Facility totaled $101 and $97, respectively.
SBA debentures: The Company uses debenture leverage provided through the SBA to fund a portion of its investment purchases.
Under the SBA debenture program, the SBA commits to purchase debentures issued by SBICs and such debentures are guaranteed by the SBA. The SBA has made commitments to purchase $225,000 of SBA debentures from the Company on or before September 30, 2019. Unused commitments as of December 31, 2015 and 2014 were $11,500 and $51,500, respectively. The SBA may limit the amount that may be drawn each year under these commitments, and each issuance of leverage is conditioned on the Company’s full compliance, as determined by the SBA, with the terms and conditions set forth in the SBIC Act.
As of December 31, 2015 and 2014, the Company’s issued and outstanding SBA debentures mature as follows:
| Pooling Date(1) |
Maturity Date |
Fixed Interest Rate |
December 31, 2015 |
December 31, 2014 |
||||||||||||
| 3/26/2008 |
3/1/2018 | 6.188 | % | $ | 24,750 | $ | 24,750 | |||||||||
| 9/24/2008 |
9/1/2018 | 6.442 | 11,950 | 11,950 | ||||||||||||
| 3/25/2009 |
3/1/2019 | 5.337 | 19,750 | 19,750 | ||||||||||||
| 9/23/2009 |
9/1/2019 | 4.950 | 10,000 | 10,000 | ||||||||||||
| 3/24/2010 |
3/1/2020 | 4.825 | 13,000 | 13,000 | ||||||||||||
| 9/22/2010 |
9/1/2020 | 3.932 | 12,500 | 12,500 | ||||||||||||
| 3/29/2011 |
3/1/2021 | 4.801 | 1,550 | 1,550 | ||||||||||||
| 9/21/2011 |
9/1/2021 | 3.594 | 3,250 | 3,250 | ||||||||||||
| 3/21/2012 |
3/1/2022 | 3.483 | 3,250 | 3,250 | ||||||||||||
| 3/21/2012 |
3/1/2022 | 3.051 | 19,000 | 19,000 | ||||||||||||
| 9/19/2012 |
9/1/2022 | 2.530 | 11,000 | 11,000 | ||||||||||||
| 9/19/2012 |
9/1/2022 | 3.049 | 11,500 | 11,500 | ||||||||||||
| 3/27/2013 |
3/1/2023 | 3.155 | 3,000 | 3,000 | ||||||||||||
| 9/24/2014 |
9/1/2024 | 3.775 | 1,000 | 1,000 | ||||||||||||
| 3/25/2015 |
3/1/2025 | 3.321 | 1,000 | 1,000 | ||||||||||||
- 113 -
Table of Contents
FIDUS INVESTMENT CORPORATION
Notes to Consolidated Financial Statements—(Continued)
(In thousands, except shares and per share data)
| Pooling Date(1) |
Maturity Date |
Fixed Interest Rate |
December 31, 2015 |
December 31, 2014 |
||||||||||||
| 3/25/2015 |
3/1/2025 | 3.321 | $ | 1,000 | $ | 1,000 | ||||||||||
| 3/25/2015 |
3/1/2025 | 3.321 | 1,000 | 1,000 | ||||||||||||
| 3/25/2015 |
3/1/2025 | 3.321 | 1,500 | 1,500 | ||||||||||||
| 3/25/2015 |
3/1/2025 | 3.321 | 1,000 | 1,000 | ||||||||||||
| 3/25/2015 |
3/1/2025 | 3.277 | 6,000 | 6,000 | ||||||||||||
| 3/25/2015 |
3/1/2025 | 3.277 | 7,500 | 7,500 | ||||||||||||
| 3/25/2015 |
3/1/2025 | 3.277 | 2,500 | 2,500 | ||||||||||||
| 3/25/2015 |
3/1/2025 | 3.277 | 1,500 | 1,500 | ||||||||||||
| 3/25/2015 |
3/1/2025 | 3.277 | 5,000 | 5,000 | ||||||||||||
| 9/23/2015 |
9/1/2025 | 3.571 | 5,000 | — | ||||||||||||
| 9/23/2015 |
9/1/2025 | 3.571 | 1,000 | — | ||||||||||||
| 9/23/2015 |
9/1/2025 | 3.571 | 200 | — | ||||||||||||
| 9/23/2015 |
9/1/2025 | 3.571 | 500 | — | ||||||||||||
| 9/23/2015 |
9/1/2025 | 3.571 | 10,000 | — | ||||||||||||
| (2) |
(2 | ) | (2 | ) | 7,000 | — | ||||||||||
| (2) |
(2 | ) | (2 | ) | 500 | — | ||||||||||
| (2) |
(2 | ) | (2 | ) | 5,000 | — | ||||||||||
| (2) |
(2 | ) | (2 | ) | 2,500 | — | ||||||||||
| (2) |
(2 | ) | (2 | ) | 1,000 | — | ||||||||||
| (2) |
(2 | ) | (2 | ) | 800 | — | ||||||||||
| (2) |
(2 | ) | (2 | ) | 2,500 | — | ||||||||||
| (2) |
(2 | ) | (2 | ) | 4,000 | — | ||||||||||
|
|
|
|
|
|||||||||||||
| $ | 213,500 | $ | 173,500 | |||||||||||||
|
|
|
|
|
|||||||||||||
| (1) | The SBA has two scheduled pooling dates for debentures (in March and in September). Certain debentures funded during the reporting periods may not be pooled until the subsequent pooling date. |
| (2) | The Company issued $23,300 in SBA debentures which pool in March 2016, at which time the Company expects the current short-term interest rate will reset to a higher long-term fixed rate. |
Interest on SBA debentures is payable semi-annually on March 1 and September 1. For the years ended December 31, 2015, 2014 and 2013, interest and financing expenses on outstanding SBA debentures amounted to $8,359, $7,182 and $7,076, respectively. As of December 31, 2015 and 2014, accrued interest and fees payable related to the SBA debentures totaled $2,739 and $2,756, respectively.
Deferred Financing Costs
Deferred financing costs are amortized into interest and financing expenses on the consolidated statement of operations using the straight-line method, which approximates the effective interest method, over the term of the respective financing instrument. Deferred financing cost amortization for the years ended December 31, 2015,
- 114 -
Table of Contents
FIDUS INVESTMENT CORPORATION
Notes to Consolidated Financial Statements—(Continued)
(In thousands, except shares and per share data)
2014 and 2013 was $1,010, $682 and $512, respectively. Deferred financing costs related to the Credit Facility and SBA debentures as of December 31, 2015 and 2014, were as follows:
| December 31, 2015 |
December 31, 2014 |
|||||||
| SBA debenture commitment fees |
$ | 2,250 | $ | 2,250 | ||||
| SBA debenture leverage fees |
5,177 | 4,207 | ||||||
| Credit Facility upfront fees |
1,239 | 894 | ||||||
|
|
|
|
|
|||||
| Subtotal |
8,666 | 7,351 | ||||||
| Accumulated amortization |
(3,794 | ) | (2,784 | ) | ||||
|
|
|
|
|
|||||
| Net deferred financing costs |
$ | 4,872 | $ | 4,567 | ||||
|
|
|
|
|
|||||
The weighted average interest rate for all SBA debentures and borrowings outstanding under the Credit Facility as of December 31, 2015 and 2014 was 4.0%, respectively.
Note 7. Commitments and Contingencies
Commitments: As of December 31, 2015, the Company had six unfunded revolving loan commitments totaling $4,714 to portfolio companies and three unfunded loan commitments totaling $5,436 to portfolio companies. As of December 31, 2014, the Company had five unfunded revolving loan commitments totaling $4,064 to portfolio companies and two unfunded loan commitments totaling $5,426 to portfolio companies. The commitments are generally subject to the borrowers meeting certain criteria such as compliance with financial and nonfinancial covenants. Since commitments may expire without being drawn upon, the total commitment amount does not necessarily represent future cash requirements.
Indemnifications: In the normal course of business, the Company enters into contracts and agreements that contain a variety of representations and warranties that provide indemnifications under certain circumstances. The Company’s maximum exposure under these arrangements is unknown, as this would involve future claims that may be made against the Company that have not yet occurred. The Company expects the risk of future obligation under these indemnifications to be remote.
Legal proceedings: In the normal course of business, the Company may be subject to legal and regulatory proceedings that are generally incidental to its ongoing operations. While the outcome of these legal proceedings cannot be predicted with certainty, the Company does not believe these proceedings will have a material adverse effect on the Company’s consolidated financial statements.
Note 8. Common Stock
The following table summarizes the total shares issued, offering price and net proceeds received in public offerings of the Company’s common stock since the IPO:
| Offering Date |
Number of Shares |
Gross Proceeds |
Underwriting Fees and Commissions and Offering Costs |
Offering Price |
||||||||||||
| September 11, 2012 |
2,472,500 | $ | 39,807 | $ | 1,855 | $ | 16.10 | |||||||||
| February 8, 2013 |
1,725,000 | 30,361 | 1,504 | 17.60 | ||||||||||||
| September 30, 2014 |
2,083,414 | (1) | 35,418 | 1,747 | 17.00 | |||||||||||
| (1) | Includes 83,414 shares purchased by underwriters pursuant to the over-allotment option on October 21, 2014. |
- 115 -
Table of Contents
FIDUS INVESTMENT CORPORATION
Notes to Consolidated Financial Statements—(Continued)
(In thousands, except shares and per share data)
On August 21, 2014, the Company entered into an equity distribution agreement with Raymond James & Associates, Inc. and Robert W. Baird & Co. Incorporated through which the Company could sell, by means of at-the-market offerings from time to time, shares of the Company’s common stock having an aggregate offering price of up to $50,000 (the “ATM Program”). The gross proceeds raised, the related sales agent commission, the offering expenses and the average price at which shares were issued under the ATM Program from August 21, 2014 through December 31, 2015 are as follow:
| Year Ended December 31, 2014 |
Number of Shares |
Gross Proceeds |
Underwriting Fees and Commissions and Offering Costs |
Average Offering Price |
||||||||||||
| Third Quarter ended September 30, 2014 |
153,541 | $ | 2,850 | $ | 56 | $ | 18.56 | |||||||||
| Fourth Quarter ended December 31, 2014 |
4,812 | 80 | 3 | 17.00 | ||||||||||||
|
|
|
|
|
|
|
|
|
|||||||||
| Total |
158,353 | $ | 2,930 | $ | 59 | $ | 18.51 | |||||||||
|
|
|
|
|
|
|
|
|
|||||||||
| Year Ended December 31, 2015 |
||||||||||||||||
| First Quarter ended March 31, 2015 |
49,193 | $ | 819 | $ | 16 | $ | 16.65 | |||||||||
| Second Quarter ended June 30, 2015 |
141,430 | 2,347 | 50 | 16.60 | ||||||||||||
| Third Quarter ended September 30, 2015 |
— | — | — | — | ||||||||||||
| Fourth Quarter ended December 31, 2015 |
— | — | — | — | ||||||||||||
|
|
|
|
|
|
|
|
|
|||||||||
| Total |
190,623 | $ | 3,166 | $ | 66 | $ | 16.61 | |||||||||
|
|
|
|
|
|
|
|
|
|||||||||
The Company issued 59,072, 54,038 and 76,385 shares of common stock under the DRIP during the years ended December 31, 2015, 2014 and 2013, respectively. See Note 9 for additional information regarding the issuance of shares under the DRIP.
As of December 31, 2015 and December 31, 2014, the Company had 16,300,732 and 16,051,037 shares of common stock outstanding, respectively.
Note 9. Dividends and Distributions
The Company’s dividends and distributions are recorded on the record date. The following table summarizes the dividends paid since the Company’s IPO.
| Date |
Record Date |
Payment Date |
Amount Per Share |
Total Distribution |
Cash Distribution |
DRIP Shares Value |
DRIP Shares |
DRIP Share Issue Price |
||||||||||||||||||||||||
| Fiscal Year Ended December 31, 2011: |
|
|||||||||||||||||||||||||||||||
| 7/28/2011 |
9/12/2011 | 9/26/2011 | $ | 0.32 | $ | 3,016 | $ | 3,016 | $ | — | — | $ | — | |||||||||||||||||||
| 11/2/2011 |
12/6/2011 | 12/20/2011 | 0.32 | 3,017 | 3,017 | — | — | — | ||||||||||||||||||||||||
|
|
|
|
|
|
|
|
|
|
|
|||||||||||||||||||||||
| $ | 0.64 | $ | 6,033 | $ | 6,033 | $ | — | — | ||||||||||||||||||||||||
|
|
|
|
|
|
|
|
|
|
|
|||||||||||||||||||||||
| Fiscal Year Ended December 31, 2012: |
|
|||||||||||||||||||||||||||||||
| 2/10/2012 |
3/14/2012 | 3/28/2012 | $ | 0.34 | $ | 3,205 | $ | 3,205 | $ | — | (1) | — | (1) | — | (1) | |||||||||||||||||
| 4/30/2012 |
6/13/2012 | 6/27/2012 | 0.36 | 3,394 | 3,394 | — | (2) | — | (2) | — | (2) | |||||||||||||||||||||
| 7/31/2012 |
9/11/2012 | 9/25/2012 | 0.38 | 4,522 | 4,010 | 512 | 30,563 | 16.75 | ||||||||||||||||||||||||
| 10/29/2012 |
12/7/2012 | 12/21/2012 | 0.38 | 4,533 | 4,145 | 388 | 23,763 | 16.35 | ||||||||||||||||||||||||
|
|
|
|
|
|
|
|
|
|
|
|||||||||||||||||||||||
| $ | 1.46 | $ | 15,654 | $ | 14,754 | $ | 900 | 54,326 | ||||||||||||||||||||||||
|
|
|
|
|
|
|
|
|
|
|
|||||||||||||||||||||||
- 116 -
Table of Contents
FIDUS INVESTMENT CORPORATION
Notes to Consolidated Financial Statements—(Continued)
(In thousands, except shares and per share data)
| Date |
Record Date |
Payment Date |
Amount Per Share |
Total Distribution |
Cash Distribution |
DRIP Shares Value |
DRIP Shares |
DRIP Share Issue Price |
||||||||||||||||||||||||
| Fiscal Year Ended December 31, 2013: |
|
|||||||||||||||||||||||||||||||
| 2/22/2013 |
3/14/2013 | 3/28/2013 | $ | 0.38 | $ | 5,198 | $ | 4,822 | $ | 376 | 20,501 | 18.36 | ||||||||||||||||||||
| 5/1/2013 |
6/12/2013 | 6/26/2013 | 0.38 | 5,206 | 4,893 | 313 | 17,415 | 17.97 | ||||||||||||||||||||||||
| 7/31/2013 |
9/12/2013 | 9/26/2013 | 0.38 | 5,212 | 4,902 | 310 | 15,899 | 19.51 | ||||||||||||||||||||||||
| 7/31/2013(3) |
9/12/2013 | 9/26/2013 | 0.04 | 549 | 516 | 33 | 1,674 | 19.51 | ||||||||||||||||||||||||
| 11/4/2013 |
12/6/2013 | 12/20/2013 | 0.38 | 5,219 | 5,003 | 216 | 10,448 | 20.72 | ||||||||||||||||||||||||
| 11/4/2013(3) |
12/6/2013 | 12/20/2013 | 0.38 | 5,219 | 5,003 | 216 | 10,448 | 20.72 | ||||||||||||||||||||||||
|
|
|
|
|
|
|
|
|
|
|
|||||||||||||||||||||||
| $ | 1.94 | $ | 26,603 | $ | 25,139 | $ | 1,464 | 76,385 | ||||||||||||||||||||||||
|
|
|
|
|
|
|
|
|
|
|
|||||||||||||||||||||||
| Fiscal Year Ended December 31, 2014: |
|
|||||||||||||||||||||||||||||||
| 2/18/2014 |
3/21/2014 | 3/31/2014 | $ | 0.38 | $ | 5,277 | $ | 5,028 | $ | 199 | 10,410 | 19.14 | ||||||||||||||||||||
| 5/5/2014 |
6/13/2014 | 6/27/2014 | 0.38 | 5,231 | 5,037 | 194 | 9,459 | 20.44 | ||||||||||||||||||||||||
| 5/5/2014(3) |
7/25/2014 | 7/31/2014 | 0.05 | 689 | 664 | 25 | 1,368 | 18.66 | ||||||||||||||||||||||||
| 5/5/2014(3) |
8/25/2014 | 8/29/2014 | 0.05 | 689 | 660 | 29 | 1,567 | 18.48 | ||||||||||||||||||||||||
| 8/5/2014 |
9/12/2014 | 9/26/2014 | 0.38 | 5,293 | 5,095 | 198 | 11,562 | 17.16 | ||||||||||||||||||||||||
| 11/4/2014 |
12/5/2014 | 12/19/2014 | 0.38 | 6,092 | 5,862 | 230 | 15,574 | 14.71 | ||||||||||||||||||||||||
| 11/4/2014(3) |
12/5/2014 | 12/19/2014 | 0.10 | 1,603 | 1,543 | 60 | 4,098 | 14.71 | ||||||||||||||||||||||||
|
|
|
|
|
|
|
|
|
|
|
|||||||||||||||||||||||
| $ | 1.72 | $ | 24,824 | $ | 23,889 | $ | 935 | 54,038 | ||||||||||||||||||||||||
|
|
|
|
|
|
|
|
|
|
|
|||||||||||||||||||||||
| Fiscal Year Ended December 31, 2015: |
|
|||||||||||||||||||||||||||||||
| 2/17/2015 |
3/12/2015 | 3/26/2015 | $ | 0.38 | $ | 6,099 | $ | 5,886 | $ | 213 | 12,922 | 16.46 | ||||||||||||||||||||
| 5/5/2015 |
6/11/2015 | 6/25/2015 | 0.38 | 6,176 | 5,968 | 208 | 12,883 | 16.18 | ||||||||||||||||||||||||
| 5/5/2015(3) |
6/11/2015 | 6/25/2015 | 0.02 | 325 | 314 | 11 | 678 | 16.18 | ||||||||||||||||||||||||
| 8/3/2015 |
9/17/2015 | 9/25/2015 | 0.39 | 6,345 | 6,097 | 248 | 16,985 | 14.61 | ||||||||||||||||||||||||
| 11/2/2015(3) |
11/27/2015 | 12/11/2015 | 0.04 | 651 | 624 | 27 | 2,034 | 13.43 | ||||||||||||||||||||||||
| 11/2/2015 |
12/4/2015 | 12/18/2015 | 0.39 | 6,351 | 6,157 | 194 | 13,570 | 14.29 | ||||||||||||||||||||||||
|
|
|
|
|
|
|
|
|
|
|
|||||||||||||||||||||||
| $ | 1.60 | $ | 25,947 | $ | 25,046 | $ | 901 | 59,072 | ||||||||||||||||||||||||
|
|
|
|
|
|
|
|
|
|
|
|||||||||||||||||||||||
| (1) | Satisfied $591 of DRIP participation with the purchase of 43,029 shares of common stock in the open market at an average price of $13.73. |
| (2) | Satisfied $600 of DRIP participation with the purchase of 40,196 shares of common stock in the open market at an average price of $14.94. |
| (3) | Special dividend. |
Since the Company’s IPO, dividends and distributions to stockholders total $99,061 or $7.36 per share.
In addition, during 2013 the Company designated $8,250, or approximately $0.60 per share, of the net long-term capital gains as a “deemed distribution” to stockholders of record as of December 31, 2013. The Company incurred $2,887, or $0.21 per share, of U.S. federal income taxes on behalf of stockholders related to this deemed distribution. See Note 12 for further discussion regarding deemed distributions. There were no deemed distributions during the years 2011, 2012, 2014 or 2015.
- 117 -
Table of Contents
FIDUS INVESTMENT CORPORATION
Notes to Consolidated Financial Statements—(Continued)
(In thousands, except shares and per share data)
Note 10. Financial Highlights
The following is a schedule of financial highlights for the years ended December 31, 2015, 2014, 2013, 2012 and 2011:
| Year Ended December 31, | ||||||||||||||||||||
| 2015 | 2014 | 2013 | 2012 | 2011 | ||||||||||||||||
| Per share data: |
||||||||||||||||||||
| Net asset value at beginning of period(1) |
$ | 15.16 | $ | 15.35 | $ | 15.32 | $ | 14.90 | $ | 13.33 | ||||||||||
| Net investment income(2) |
1.64 | 1.62 | 1.43 | 1.54 | 1.22 | |||||||||||||||
| Net realized gain (loss) on investments, net of tax benefit (refund)(2) |
0.58 | (1.18 | ) | 2.22 | 0.19 | (1.31 | ) | |||||||||||||
| Net unrealized (depreciation) appreciation on investments(2) |
(0.62 | ) | 0.92 | (1.64 | ) | 0.18 | 1.72 | |||||||||||||
|
|
|
|
|
|
|
|
|
|
|
|||||||||||
| Total increase from investment operations(2) |
1.60 | 1.36 | 2.01 | 1.91 | 1.63 | |||||||||||||||
| Capital contributions from partners |
— | — | — | — | 0.74 | |||||||||||||||
| Capital distributions to partners |
— | — | — | — | (0.16 | ) | ||||||||||||||
| Accretive effect of share issuance above NAV |
0.02 | 0.19 | 0.18 | 0.03 | — | |||||||||||||||
| Dividends to stockholders |
(1.60 | ) | (1.72 | ) | (1.94 | ) | (1.46 | ) | (0.64 | ) | ||||||||||
| Taxes paid on deemed distribution |
— | — | (0.21 | ) | — | — | ||||||||||||||
|
Other(3) |
(0.01 | ) | (0.02 | ) | (0.01 | ) | (0.06 | ) | — | |||||||||||
|
|
|
|
|
|
|
|
|
|
|
|||||||||||
| Net asset value at end of period |
$ | 15.17 | $ | 15.16 | $ | 15.35 | $ | 15.32 | $ | 14.90 | ||||||||||
|
|
|
|
|
|
|
|
|
|
|
|||||||||||
| Market value at end of period |
$ | 13.69 | $ | 14.85 | $ | 21.74 | $ | 16.45 | $ | 12.97 | ||||||||||
|
|
|
|
|
|
|
|
|
|
|
|||||||||||
| Shares outstanding at end of period |
16,300,732 | 16,051,037 | 13,755,232 | 11,953,847 | 9,427,021 | |||||||||||||||
| Weighted average shares outstanding during the period(1) |
16,201,449 | 14,346,438 | 13,524,368 | 10,185,627 | 9,427,021 | |||||||||||||||
| Ratios to average net assets: |
||||||||||||||||||||
| Expenses other than incentive fee |
8.5 | % | 7.9 | % | 7.4 | % | 8.4 | % | 7.5 | % | ||||||||||
| Incentive fee(4) |
2.6 | % | 2.2 | % | 3.2 | % | 3.1 | % | 1.2 | % | ||||||||||
|
|
|
|
|
|
|
|
|
|
|
|||||||||||
| Total expenses |
11.1 | % | 10.1 | % | 10.6 | % | 11.5 | % | 8.7 | % | ||||||||||
| Net investment income |
10.8 | % | 10.5 | % | 9.2 | % | 10.0 | % | 8.5 | % | ||||||||||
| Total return(5) |
3.0 | % | (23.8 | )% | 44.0 | % | 38.1 | % | (9.3 | )% | ||||||||||
| Net assets at end of period |
$ | 247,362 | $ | 243,263 | $ | 211,125 | $ | 183,091 | $ | 140,482 | ||||||||||
| Average debt outstanding |
$ | 199,340 | $ | 152,700 | $ | 144,500 | $ | 126,050 | $ | 97,050 | ||||||||||
| Average debt per share(1) (2) |
$ | 12.30 | $ | 10.64 | $ | 10.68 | $ | 12.38 | $ | 10.29 | ||||||||||
| Portfolio turnover ratio |
22.5 | % | 18.9 | % | 44.9 | % | 10.7 | % | 14.0 | % | ||||||||||
| (1) | Net asset value per share as of January 1, 2011, weighted average shares outstanding and average debt per share for the year ended December 31, 2011 are presented as if the IPO (including the over-allotment) and Formation Transactions had occurred on January 1, 2011. See Note 2 for a further description of the basis of presentation of the Company’s consolidated financial statements. |
- 118 -
Table of Contents
FIDUS INVESTMENT CORPORATION
Notes to Consolidated Financial Statements—(Continued)
(In thousands, except shares and per share data)
| (2) | Weighted average per share data. |
| (3) | Represents the impact of different share amounts used in calculating per share data as a result of calculating certain per share data based on weighted average shares outstanding during the period and certain per share data based on the shares outstanding as of a period end or transaction date. |
| (4) | The Investment Advisor voluntarily waived $83 of incentive fees for the period June 21, 2011 through June 30, 2011. Incentive fee for the period July 1, 2011 through December 31, 2011 is not annualized. |
| (5) | The total return for the years ended December 31, 2015, 2014, 2013 and 2012 equals the change in the market value of the Company’s common stock per share during the period plus dividends paid per share during the period, divided by the market value per share at the beginning of the period. The total return for the year ended December 31, 2011 equals the change in the market value at the end of the period of the Company’s common stock from the IPO price of $15.00 per share plus dividends paid per share during the period, divided by the IPO price and is not annualized. |
Note 11. Selected Quarterly Financial Data (unaudited)
| March 31, 2015 |
June 30, 2015 |
September 30, 2015 |
December 31, 2015 |
|||||||||||||
| Total investment income |
$ | 12,838 | $ | 12,799 | $ | 13,557 | $ | 15,075 | ||||||||
| Net investment income |
6,229 | 6,039 | 7,050 | 7,175 | ||||||||||||
| Net increase in net assets from operations |
6,409 | 6,246 | 5,487 | 7,835 | ||||||||||||
| Net investment income per share |
0.39 | 0.37 | 0.43 | 0.44 | ||||||||||||
| Net increase in net assets from operations per share |
0.40 | 0.39 | 0.34 | 0.48 | ||||||||||||
| Net asset value per share at end of period |
15.18 | 15.18 | 15.12 | 15.17 | ||||||||||||
| March 31, 2014 |
June 30, 2014 |
September 30, 2014 |
December 31, 2014 |
|||||||||||||
| Total investment income |
$ | 10,559 | $ | 10,581 | $ | 11,324 | $ | 13,652 | ||||||||
| Net investment income |
5,444 | 5,509 | 5,627 | 6,701 | ||||||||||||
| Net increase in net assets from operations |
3,378 | 3,428 | 5,301 | 7,378 | ||||||||||||
| Net investment income per share |
0.40 | 0.40 | 0.41 | 0.42 | ||||||||||||
| Net increase in net assets from operations per share |
0.25 | 0.25 | 0.38 | 0.46 | ||||||||||||
| Net asset value per share at end of period |
15.22 | 15.09 | 15.18 | 15.16 | ||||||||||||
- 119 -
Table of Contents
FIDUS INVESTMENT CORPORATION
Notes to Consolidated Financial Statements—(Continued)
(In thousands, except shares and per share data)
Note 12. Income Taxes
The Company has elected to be treated for federal income tax purposes as a RIC, whereby the Company generally will not pay corporate-level federal income taxes on any net ordinary income or capital gains that the Company distributes to its stockholders as dividends. The Company must generally distribute at least 90% of its investment company taxable income to maintain its RIC status. As part of maintaining RIC status, undistributed taxable income pertaining to a given fiscal year may be distributed up to 12 months subsequent to the end of that fiscal year, provided such dividends are declared prior to the later of the filing of the federal income tax return for the prior year or the 15th day of the 9th month following the prior tax year. Such taxable income carried forward to the next tax year will be subject to excise tax equal to 4% of the amount by which (i) 98% of the Company’s ordinary income recognized during a calendar year and (ii) 98.2% of the Company’s long term capital gains, as defined by Subchapter M of the Code, recognized for the one year period ending October 31st of a calendar year exceeds the respective distributions for the year. For the years ended December 31, 2015, 2014 and 2013, the excise tax provision (benefit) was $395, $340 and $348, respectively. Excise tax is included as a component of income tax provision and income tax (provision) on realized gains on investments, depending on the character of the underlying taxable income, on the consolidated statements of operations.
The Taxable Subsidiaries hold certain portfolio investments for the Company. The Taxable Subsidiaries are consolidated for financial reporting purposes, and the portfolio investments held by the Taxable Subsidiaries are included in the Company’s consolidated financial statements. The principal purpose of the Taxable Subsidiaries are to permit the Company to hold equity investments in portfolio companies which are “pass through” entities for federal income tax purposes in order to comply with the “source-of-income” requirements contained in the RIC tax provisions of Subchapter M of the Code. The Taxable Subsidiaries are not consolidated for federal income tax purposes and may generate income tax expense or income tax benefit as a result of their ownership of various portfolio investments. The Company classifies interest and penalties, if any, as a component of income tax provision on the consolidated statements of operations. For the years ended December 31, 2015, 2014 and 2013, income tax expense at the taxable subsidiaries was $34, $28, and $391, respectively. Income tax expense is included as a component of the income tax provisions on the consolidated statements of operations.
Listed below is a reconciliation of net increase in net assets resulting from operations on the consolidated statements of operations to taxable income and to total distributions declared to common stockholders for the years ended December 31, 2015, 2014 and 2013.
| 2015 (1) | 2014 | 2013 | ||||||||||
| Net increase in net assets resulting from operations |
$ | 25,977 | $ | 19,485 | $ | 27,203 | ||||||
| Net change in unrealized depreciation (appreciation) on investments |
10,086 | (13,250 | ) | 22,188 | ||||||||
| Permanent book income and tax income differences |
1,190 | 367 | 2,062 | |||||||||
| Temporary book income and tax income differences |
(6,545 | ) | 5,391 | 636 | ||||||||
| Capital loss carry forward (utilization) |
(3,713 | ) | 11,288 | (2,408 | ) | |||||||
|
|
|
|
|
|
|
|||||||
| Taxable income |
26,995 | 23,281 | 49,681 | |||||||||
| Taxable income earned in prior year and carried forward for distribution in current year |
13,843 | 15,386 | 558 | |||||||||
| Taxable income earned in current period and carried forward for distribution in following year |
(14,891 | ) | (13,843 | ) | (15,386 | ) | ||||||
| Deemed distribution |
— | — | (8,250 | ) | ||||||||
|
|
|
|
|
|
|
|||||||
| Total distributions to common stockholders |
$ | 25,947 | $ | 24,824 | $ | 26,603 | ||||||
|
|
|
|
|
|
|
|||||||
- 120 -
Table of Contents
FIDUS INVESTMENT CORPORATION
Notes to Consolidated Financial Statements—(Continued)
(In thousands, except shares and per share data)
| (1) | The Company’s taxable income for 2015 is an estimate and will not be finalized until the Company files its 2015 federal income tax return in 2016. Therefore, the Company’s actual taxable income, and the Company’s actual taxable income that was earned in 2015 and carried forward for distribution in 2016, may be different than this estimate. |
For tax purposes, distributions paid to stockholders are reported as ordinary income, long term capital gains, qualified dividends, return of capital or a combination thereof. The tax character of distributions paid for the years ended December 31, 2015, 2014 and 2013 was as follows:
| 2015 | 2014 | 2013 | ||||||||||
| Ordinary income |
$ | 25,639 | $ | 14,242 | $ | 15,282 | ||||||
| Long term capital gains |
— | 10,389 | 10,000 | |||||||||
| Qualified dividends |
308 | 193 | 1,321 | |||||||||
|
|
|
|
|
|
|
|||||||
| Total distributions |
$ | 25,947 | $ | 24,824 | $ | 26,603 | ||||||
|
|
|
|
|
|
|
|||||||
The Company estimates that it generated undistributed ordinary taxable income of approximately $14,891, or $0.91 per share during 2015 that will be carried forward and distributed in 2016. Ordinary dividend distributions from a RIC do not qualify for the preferential federal income tax rate on dividend income from certain domestic corporations and qualified foreign corporations, except to the extent that the RIC received the income in the form of qualifying dividends from domestic corporations and qualified foreign corporations.
The Company may distribute a portion of its realized net long term capital gains in excess of realized net short term capital losses to its stockholders, but may also decide to retain a portion, or all, of its net capital gains and elect to make a “deemed distribution” to its stockholders For the year ended December 31, 2013, the Company elected to designate retained net capital gains of $8,250, or approximately $0.60 per share, as a deemed distribution, which was allocated to stockholders of record as of December 31, 2013. The Company incurred U.S. federal income taxes of $2,887, or approximately $0.21 per share, on behalf of stockholders related to this deemed distribution. Such U.S. federal income taxes were paid in January 2014. For the years ended December 31, 2015 and 2014, the Company did not elect to designate retained net capital gains as a deemed distribution.
As of December 31, 2015, 2014 and 2013, the tax basis components of distributable earnings were as follows:
| 2015 (1) | 2014 | 2013 | ||||||||||
| Undistributed ordinary income |
$ | 14,891 | $ | 13,733 | $ | 4,865 | ||||||
| Undistributed qualified income |
— | 110 | 132 | |||||||||
| Undistributed long term capital gains |
— | — | 10,389 | |||||||||
| Unrealized appreciation (depreciation) (2) |
6,703 | 3,805 | (9,445 | ) | ||||||||
| Temporary book/tax differences |
425 | (6,121 | ) | (1,073 | ) | |||||||
| Capital loss carry forward |
(7,574 | ) | (11,288 | ) | — | |||||||
|
|
|
|
|
|
|
|||||||
| Total distributable earnings |
$ | 1,039 | $ | 239 | $ | 4,868 | ||||||
|
|
|
|
|
|
|
|||||||
| (1) | The Company’s undistributed earnings for 2015 is an estimate and will not be finally determined until the Company files its 2015 federal income tax return in 2016. Therefore, the Company’s actual distributable earnings may be different than this estimate. |
- 121 -
Table of Contents
FIDUS INVESTMENT CORPORATION
Notes to Consolidated Financial Statements—(Continued)
(In thousands, except shares and per share data)
| (2) | In addition, there is net unrealized appreciation of $1,633, $1,211 and $1,211 included in additional paid in capital as of December 31, 2015, 2014 and 2013, respectively, that was recognized prior to the Formation Transactions. |
For federal income tax purposes, the cost of investments owned at December 31, 2015 and 2014 was approximately $448,889 and $397,698, respectively.
Distributions from net investment income and net realized capital gains are determined in accordance with U.S. federal tax regulations, which may differ from amounts determined in accordance with GAAP and those differences could be material. These permanent book-to-tax differences are reclassified on the consolidated statements of changes in net assets to reflect their tax character but have no impact on total net assets. The following permanent book-to-tax differences were reclassified on the consolidated statements of changes in net assets for the years ended December 31, 2015, 2014 and 2013.
| 2015 | 2014 | 2013 | ||||||||||
| Additional paid in capital |
$ | (770 | ) | $ | (590 | ) | $ | (7,057 | ) | |||
| Undistributed net investment income |
908 | 366 | 73 | |||||||||
| Accumulated net realized (loss) gain on investments, net of taxes |
(138 | ) | 224 | 6,984 | ||||||||
Note 13. Subsequent Events
On January 15, 2016, the Company invested $10,500 in the subordinated notes and common equity of OMC Investors, LLC, doing business as Ohio Medical Corporation, a manufacturer and distributer of medical suction and oxygen therapy products and source equipment.
On January 29, 2016, the Company exited its debt and warrant investments in Continental Anesthesia Management, LLC in connection with the sale of the portfolio company. The Company received payment in full on its subordinated notes and recognized a loss of approximately $275 on its warrant investment.
On February 1, 2016, the Company exited its debt and equity investments in X5 Opco LLC. The Company received payment in full on its senior secured loan, including a prepayment penalty, and sold its equity at a price approximating cost.
On February 16, 2016, the Company exited its debt investment in Stagnito Partners, LLC. The Company received payment in full on its senior secured loan, including a prepayment penalty.
On February 16, 2016, the Board declared a regular quarterly dividend of $0.39 per share payable on March 25, 2016 to stockholders of record as of March 11, 2016.
- 122 -
Table of Contents
Item 9. Changes in and Disagreements with Accountants on Accounting and Financial Disclosure.
None.
Item 9A. Controls and Procedures.
Evaluation of Disclosure Controls and Procedures
We maintain disclosure controls and procedures that are designed to ensure that information required to be disclosed in the reports that we file or submit under the Exchange Act, is recorded, processed, summarized and reported within the time periods specified in the SEC’s rules and forms and that such information is accumulated and communicated to our management, including our Chief Executive Officer and Chief Financial Officer, as appropriate, to allow timely decisions regarding required disclosure. Our Chief Executive Officer and Chief Financial Officer carried out an evaluation of the effectiveness of the design and operation of our disclosure controls and procedures (as defined in Rule 13a-15(e) of the 1934 Act) as of the end of the period covered by this report. Based on the evaluation of these disclosure controls and procedures, the Chief Executive Officer and Chief Financial Officer concluded that our disclosure controls and procedures were effective. It should be noted that any system of controls, however well designed and operated, can provide only reasonable, and not absolute, assurance that the objectives of the system are met. In addition, the design of any control system is based in part upon certain assumptions about the likelihood of future events. Because of these and other inherent limitations of control systems, there can be no assurance that any design will succeed in achieving its stated goals under all potential future conditions, regardless of how remote.
Management’s Annual Report on Internal Control over Financial Reporting and Attestation Report of the Registered Public Accounting Firm
Our management, including our Chief Executive Officer and Chief Financial Officer, is responsible for establishing and maintaining adequate internal control over financial reporting, as such term is defined in Rules 13a-15(f) and 15d-15(f) under the Exchange Act. Our internal control over financial reporting is a process designed to provide reasonable assurance regarding the reliability of financial reporting and the preparation of our financial statements for external reporting purposes in accordance with GAAP. Internal control over financial reporting includes those policies and procedures that: (i) pertain to the maintenance of records that in reasonable detail accurately and fairly reflect the transactions and dispositions of the assets of the company; (ii) provide reasonable assurance that transactions are recorded as necessary to permit preparation of financial statements in accordance with GAAP, and that receipts and expenditures of the company are being made only in accordance with authorizations of management and directors of the company; and (iii) provide reasonable assurance regarding prevention or timely detection of unauthorized acquisition, use, or disposition of the company’s assets that could have a material effect on the financial statements. Because of its inherent limitations, internal control over financial reporting may not prevent or detect misstatements. Also, projections of any evaluation of effectiveness to future periods are subject to the risk that controls may become inadequate because of changes in conditions, or that the degree of compliance with policies or procedures may deteriorate.
Management (with the participation of our Chief Executive Officer and Chief Financial Officer) conducted an evaluation of the effectiveness of our internal control over financial reporting based on the framework in Internal Control — Integrated Framework issued by the Committee of Sponsoring Organizations of the Treadway Commission in 2013. Based on this evaluation, management concluded that our internal control over financial reporting was effective as of December 31, 2015.
Attestation Report of the Registered Public Accounting Firm
Our internal control over financial reporting as of December 31, 2015 has been audited by RSM US LLP, an independent registered public accounting firm, as stated in their report, which is included in Item 8 of Part II of this Annual Report under the heading Report of Independent Registered Public Accounting Firm.
- 123 -
Table of Contents
Changes in Internal Control over Financial Reporting
There were no changes in our internal control over financial reporting during the fourth quarter of 2015 that have materially affected, or are reasonably likely to materially affect, our internal control over financial reporting.
None.
- 124 -
Table of Contents
Item 10. Directors, Executive Officers and Corporate Governance.
The information required by Item 10 is hereby incorporated by reference from our definitive Proxy Statement relating to our 2016 Annual Meeting of Stockholders, to be filed with the Securities and Exchange Commission within 120 days following the end of our fiscal year.
Item 11. Executive Compensation.
The information required by Item 11 is hereby incorporated by reference from our definitive Proxy Statement relating to our 2016 Annual Meeting of Stockholders, to be filed with the Securities and Exchange Commission within 120 days following the end of our fiscal year.
| Item 12. Security | Ownership of Certain Beneficial Owners and Management and Related Stockholder Matters. |
The information required by Item 12 is hereby incorporated by reference from our definitive Proxy Statement relating to our 2016 Annual Meeting of Stockholders, to be filed with the Securities and Exchange Commission within 120 days following the end of our fiscal year.
Item 13. Certain Relationships and Related Transactions, and Director Independence.
The information required by Item 13 is hereby incorporated by reference from our definitive Proxy Statement relating to our 2016 Annual Meeting of Stockholders, to be filed with the Securities and Exchange Commission within 120 days following the end of our fiscal year.
Item 14. Principal Accountant Fees and Services.
The information required by Item 14 is hereby incorporated by reference from our definitive Proxy Statement relating to our 2016 Annual Meeting of Stockholders, to be filed with the Securities and Exchange Commission within 120 days following the end of our fiscal year.
- 125 -
Table of Contents
Item 15. Exhibits and Financial Statement Schedules.
The following documents are filed or incorporated by reference as part of this Annual Report:
(1) Consolidated Financial Statements
(2) Financial Statement Schedules
None.
(3) Exhibits
Unless otherwise noted, the following exhibits are filed as part of this report or hereby incorporated by reference to exhibits previously filed with the SEC:
| Exhibit Number |
Description | |
| 3.1 | Articles of Amendment and Restatement of the Registrant (Filed as Exhibit (a)(1) to Pre-Effective Amendment No. 2 to the Registrant’s Registration Statement on Form N-2 (File No. 333-172550) filed with the Securities and Exchange Commission on April 29, 2011 and incorporated herein by reference). | |
| 3.2 | Bylaws of the Registrant (Filed as Exhibit (b)(1) to Pre-Effective Amendment No. 2 to the Registrant’s Registration Statement on Form N-2 (File No. 333-172550) filed with the Securities and Exchange Commission on April 29, 2011 and incorporated herein by reference). | |
| 4.1 | Form of Stock Certificate of the Registrant (Filed as Exhibit (d) to Pre-Effective Amendment No. 2 to the Registrant’s Registration Statement on Form N-2 (File No. 333-172550) filed with the Securities and Exchange Commission on April 29, 2011 and incorporated herein by reference). | |
| 4.2 | Agreement to Furnish Certain Instruments (Filed as Exhibit (f)(2) to Pre-Effective Amendment No. 3 to the Registrant’s Registration Statement on Form N-2 (File No. 333-172550) filed with the Securities and Exchange Commission on May 26, 2011 and incorporated herein by reference). | |
| 10.1 | Investment Advisory and Management Agreement between Registrant and Fidus Investment Advisors, LLC (Filed as Exhibit (g) to Pre-Effective Amendment No. 2 to the Registrant’s Registration Statement on Form N-2 (File No. 333-172550) filed with the Securities and Exchange Commission on April 29, 2011 and incorporated herein by reference). | |
| 10.2 | Custody Agreement (Filed as Exhibit (j) to Pre-Effective Amendment No. 3 to the Registrant’s Registration Statement on Form N-2 (File No. 333-172550) filed with the Securities and Exchange Commission on May 26, 2011 and incorporated herein by reference). | |
- 126 -
Table of Contents
| Exhibit Number |
Description | |
| 10.3 | Administration Agreement between Registrant and Fidus Investment Advisors, LLC (Filed as Exhibit (k)(1) to Pre-Effective Amendment No. 2 to the Registrant’s Registration Statement on Form N-2 (File No. 333-172550) filed with the Securities and Exchange Commission on April 29, 2011 and incorporated herein by reference). | |
| 10.4 | Trademark License Agreement between Registrant and Fidus Partners, LLC (Filed as Exhibit (k)(2) to Pre-Effective Amendment No. 3 to the Registrant’s Registration Statement on Form N-2 (File No. 333-172550) filed with the Securities and Exchange Commission on May 26, 2011 and incorporated herein by reference). | |
| 10.5† | Form of Indemnification Agreement by and between Registrant and each of its directors (Filed as Exhibit (k)(3) to Pre-Effective Amendment No. 4 to the Registrant’s Registration Statement on Form N-2 (File No. 333-172550) filed with the Securities and Exchange Commission on June 10, 2011 and incorporated herein by reference). | |
| 10.6 | Dividend Reinvestment Plan (Filed as Exhibit (e) to Pre-Effective Amendment No. 1 to the Registrant’s Registration Statement on Form N-2 (File No. 333-182785) filed with the Securities and Exchange Commission on August 27, 2012 and incorporated herein by reference). | |
| 10.7 | First Amendment to Investment Advisory and Management Agreement between Registrant and Fidus Investment Advisors, LLC filed as exhibit 10.7 to the Registrant’s annual report on Form 10-K, filed with the Securities and Exchange Commission on March 6, 2014 and incorporated herein by reference. | |
| 10.8 | Senior Secured Revolving Credit Agreement, dated June 16, 2014, by and among the Registrant, the lenders party thereto and ING Capital LLC, as Administrative Agent, filed as exhibit 10.1 to the Registrant’s current report on Form 8-K filed with the Securities and Exchange Commission on June 20, 2014 and incorporated herein by reference. | |
| 10.9 | Amendment No. 1, dated December 19, 2014, to the Senior Secured Revolving Credit Agreement dated June 16, 2014, by and among the Registrant, the lenders party thereto and ING Capital LLC as Administrative Agent filed as exhibit 10.1 to the Registrant’s current report on Form 8-K filed with the Securities and Exchange Commission on December 22, 2014 and incorporated herein by reference. | |
| 14.1 | Code of Business Conduct of the Registrant (Filed as Exhibit 14.1 to the Registrant’s Annual Report on Form 10-K (File No. 814-00861) filed with the Securities and Exchange Commission on March 8, 2012 and incorporated herein by reference). | |
| 21.1 | List of Subsidiaries (filed herewith). | |
| 31.1 | Certification of Chief Executive Officer pursuant to Rule 13a-14 of the Securities Exchange Act of 1934, as amended (filed herewith). | |
| 31.2 | Certification of Chief Financial Officer pursuant to Rule 13a-14 of the Securities Exchange Act of 1934, as amended (filed herewith). | |
| 32.1 | Certification of Chief Executive Officer and Chief Financial Officer pursuant to section 906 of The Sarbanes-Oxley Act of 2002 (furnished herewith). | |
| † | Denotes a management contract or compensatory plan, contract or arrangement. |
- 127 -
Table of Contents
Pursuant to the requirements of Section 13 or 15(d) of the Securities Exchange Act of 1934, the registrant has duly caused this report to be signed on its behalf by the undersigned, thereunto duly authorized.
| FIDUS INVESTMENT CORPORATION A Maryland Corporation |
Date: March 3, 2016
| /s/ EDWARD H. ROSS | ||
| Name: | Edward H. Ross | |
| Title: | Chairman and Chief Executive Officer | |
Pursuant to the requirements of the Securities Exchange Act of 1934, this report has been signed below by the following persons on behalf of the registrant and in the capacities and on the dates indicated.
| Signature |
Title |
Date | ||
| /s/ EDWARD H. ROSS Edward H. Ross |
Chairman and Chief Executive Officer (Principal Executive Officer) |
March 3, 2016 | ||
| /s/ SHELBY E. SHERARD Shelby E. Sherard |
Chief Financial Officer (Principal Financial and Accounting Officer) |
March 3, 2016 | ||
| /s/ THOMAS C. LAUER Thomas C. Lauer |
Director | March 3, 2016 | ||
| /s/ RAYMOND L. ANSTISS, JR. Raymond L. Anstiss |
Director | March 3, 2016 | ||
| /s/ CHARLES D. HYMAN Charles D. Hyman |
Director | March 3, 2016 | ||
| /s/ JOHN A. MAZZARINO John A. Mazzarino |
Director | March 3, 2016 | ||
- 128 -
Table of Contents
EXHIBIT INDEX
| Exhibit Number |
Description | |
| 3.1 | Articles of Amendment and Restatement of the Registrant (Filed as Exhibit (a)(1) to Pre-Effective Amendment No. 2 to the Registrant’s Registration Statement on Form N-2 (File No. 333-172550) filed with the Securities and Exchange Commission on April 29, 2011 and incorporated herein by reference). | |
| 3.2 | Bylaws of the Registrant (Filed as Exhibit (b)(1) to Pre-Effective Amendment No. 2 to the Registrant’s Registration Statement on Form N-2 (File No. 333-172550) filed with the Securities and Exchange Commission on April 29, 2011 and incorporated herein by reference). | |
| 4.1 | Form of Stock Certificate of the Registrant (Filed as Exhibit (d) to Pre-Effective Amendment No. 2 to the Registrant’s Registration Statement on Form N-2 (File No. 333-172550) filed with the Securities and Exchange Commission on April 29, 2011 and incorporated herein by reference). | |
| 4.2 | Agreement to Furnish Certain Instruments (Filed as Exhibit (f)(2) to Pre-Effective Amendment No. 3 to the Registrant’s Registration Statement on Form N-2 (File No. 333-172550) filed with the Securities and Exchange Commission on May 26, 2011 and incorporated herein by reference). | |
| 10.1 | Investment Advisory and Management Agreement between Registrant and Fidus Investment Advisors, LLC (Filed as Exhibit (g) to Pre-Effective Amendment No. 2 to the Registrant’s Registration Statement on Form N-2 (File No. 333-172550) filed with the Securities and Exchange Commission on April 29, 2011 and incorporated herein by reference). | |
| 10.2 | Custody Agreement (Filed as Exhibit (j) to Pre-Effective Amendment No. 3 to the Registrant’s Registration Statement on Form N-2 (File No. 333-172550) filed with the Securities and Exchange Commission on May 26, 2011 and incorporated herein by reference). | |
| 10.3 | Administration Agreement between Registrant and Fidus Investment Advisors, LLC (Filed as Exhibit (k)(1) to Pre-Effective Amendment No. 2 to the Registrant’s Registration Statement on Form N-2 (File No. 333-172550) filed with the Securities and Exchange Commission on April 29, 2011 and incorporated herein by reference). | |
| 10.4 | Trademark License Agreement between Registrant and Fidus Partners, LLC (Filed as Exhibit (k)(2) to Pre-Effective Amendment No. 3 to the Registrant’s Registration Statement on Form N-2 (File No. 333-172550) filed with the Securities and Exchange Commission on May 26, 2011 and incorporated herein by reference). | |
| 10.5† | Form of Indemnification Agreement by and between Registrant and each of its directors (Filed as Exhibit (k)(3) to Pre-Effective Amendment No. 4 to the Registrant’s Registration Statement on Form N-2 (File No. 333-172550) filed with the Securities and Exchange Commission on June 10, 2011 and incorporated herein by reference). | |
| 10.6 | Dividend Reinvestment Plan (Filed as Exhibit (e) to Pre-Effective Amendment No. 1 to the Registrant’s Registration Statement on Form N-2 (File No. 333-182785) filed with the Securities and Exchange Commission on August 27, 2012 and incorporated herein by reference). | |
| 10.7 | First Amendment to Investment Advisory and Management Agreement between Registrant and Fidus Investment Advisors, LLC filed as exhibit 10.7 to the Registrant’s annual report on Form 10-K, filed with the Securities and Exchange Commission on March 6, 2014 and incorporated herein by reference. | |
| 10.8 | Senior Secured Revolving Credit Agreement, dated June 16, 2014, by and among the Registrant, the lenders party thereto and ING Capital LLC, as Administrative Agent, filed as exhibit 10.1 to the Registrant’s current report on Form 8-K filed with the Securities and Exchange Commission on June 20, 2014 and incorporated herein by reference. | |
Table of Contents
| Exhibit Number |
Description | |
| 10.9 | Amendment No. 1, dated December 19, 2014, to the Senior Secured Revolving Credit Agreement dated June 16, 2014, by and among the Registrant, the lenders party thereto and ING Capital LLC as Administrative Agent filed as exhibit 10.1 to the Registrant’s current report on Form 8-K filed with the Securities and Exchange Commission on December 22, 2014 and incorporated herein by reference. | |
| 14.1 | Code of Business Conduct of the Registrant (Filed as Exhibit 14.1 to the Registrant’s Annual Report on Form 10-K (File No. 814-00861) filed with the Securities and Exchange Commission on March 8, 2012 and incorporated herein by reference). | |
| 21.1 | List of Subsidiaries (filed herewith). | |
| 31.1 | Certification of Chief Executive Officer pursuant to Rule 13a-14 of the Securities Exchange Act of 1934, as amended (filed herewith). | |
| 31.2 | Certification of Chief Financial Officer pursuant to Rule 13a-14 of the Securities Exchange Act of 1934, as amended (filed herewith). | |
| 32.1 | Certification of Chief Executive Officer and Chief Financial Officer pursuant to section 906 of The Sarbanes-Oxley Act of 2002 (furnished herewith). | |
| † | Denotes a management contract or compensatory plan, contract or arrangement. |