Attached files
| file | filename |
|---|---|
| 8-K - 8-K - BBVA USA Bancshares, Inc. | bbvacompass8-k2016303.htm |
| EX-99.2 - EXHIBIT 99.2 - BBVA USA Bancshares, Inc. | bbvacompassfixedincomeca.htm |

Fixed Income Investor Call Ed Bilek, Director Shareholder Relations Chris Marshall, Treasurer March 3, 2016

“Safe Harbor” Forward Looking Statements The following should be read in conjunction with the financial statements, notes and other information contained in BBVA Compass Bancshares, Inc.’s (BBVA Compass) Annual Report on Form 10-K, Quarterly Reports on Form 10-Q and Current Reports on Form 8-K. This presentation includes non-GAAP financial measures to describe BBVA Compass’ performance. Reconciliation of those non- GAAP measures are provided within or in the appendix of this presentation. Additionally, certain ratios are presented on an annualized basis for comparison, which is the preferred industry standard. Certain statements in this presentation may contain forward-looking statements about BBVA Compass and its industry that involve substantial risks and uncertainties. Statements other than statements of current or historical fact, including statements regarding our future financial condition, results of operations, business plans, liquidity, cash flows, projected costs, and the impact of any laws or regulations applicable to BBVA Compass, constitute forward-looking statements as defined by the Private Securities Litigation Reform Act of 1995. Words such as “anticipates,” “believes,” “estimates,” “expects,” “forecasts,” “intends,” “plans,” “projects,” “may,” “will,” “should,” and other similar expressions are intended to identify these forward-looking statements. These forward-looking statements reflect BBVA Compass’ views regarding future events and financial performance. Such statements are subject to risks, uncertainties, assumptions and other important factors, many of which may be beyond BBVA Compass’ control, that could cause actual results to differ materially from anticipated results. If BBVA Compass’ assumptions and estimates are incorrect, or if BBVA Compass becomes subject to significant limitations as the result of litigation or regulatory action, then BBVA Compass’ actual results could vary materially from those expressed or implied in these forward-looking statements. The forward-looking statements are and will be based on BBVA Compass’ then current views and assumptions regarding future events and speak only as of their dates made. BBVA Compass assumes no obligation to update any forward-looking statement, whether as a result of new information, future events or otherwise, except as required by securities law. For further information regarding risks and uncertainties associated with BBVA Compass’ business, please refer to the “Risk Factors” section of BBVA Compass’ Annual Report on Form 10-K filed with the U.S. Securities and Exchange Commission on March 2, 2016, as updated by BBVA Compass’ subsequent SEC filings. 2

Sections 1 2 Financial Performance 3 Loan Portfolio Overview4 5 Credit Quality Overview BBVA Compass Strategic Overview Liquidity and Funding 3 Capital and Capital Planning6
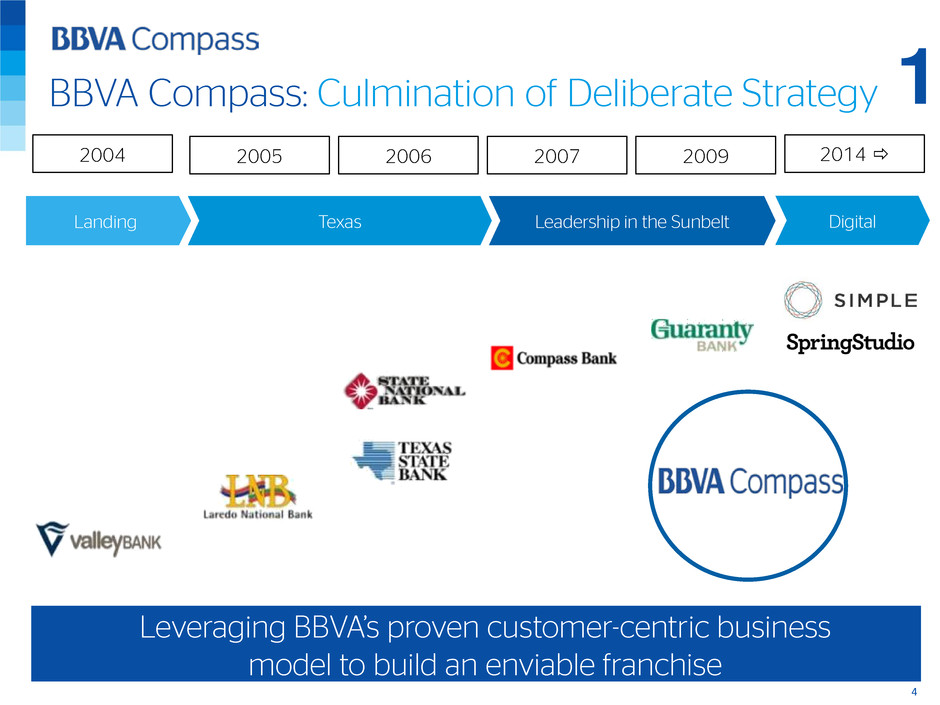
Landing 2006 2007 20092005 DigitalTexas Leadership in the Sunbelt BBVA Compass: Culmination of Deliberate Strategy Leveraging BBVA’s proven customer-centric business model to build an enviable franchise 2004 2014 1 4

A Strong U.S. Banking Franchise 666 Branches $66.0 Billion In Deposits $61.4 Billion In Loans 10,553 Employees $90.0 Billion In Assets Balances as of 12/31/15 5 1

A Sweeping Transformation CRE concentration Product-oriented Legacy risk practices Outdated systems Limited brand awareness Inefficient retail network A regional commercial bank From Today Diversified portfolio Relationship Banking Reinforced risk infrastructure Real time proprietary platform Rising recognition Productive and integrated network Global capabilities up-tiered 1 6

One of the Largest Mobile Platforms 1 7 “We want to give our clients access to banking services anywhere, any time, and on the device of their choice…” The most reputable brand in the US1 (1) American Banker/ Reputation Institute Survey of Bank Reputations, 2014. Ranking based on customer scores

Financial Summary 8 2 Solid loan and deposit growth, led by a 12% increase in noninterest bearing deposits Stable Net Interest Income despite covered loan run-off and challenging rate environment Expense growth well- contained but as expected, increase in 4th quarter provision driven by Energy Covered loan runoff refers to Guaranty Bank (GB) Loans acquired from the FDIC subject to loss sharing agreements; GB commercial loan portfolio removed from covered loans in 4Q14 FTE – Fully Taxable Equivalent $ in millions 4Q14 3Q15 4Q15 % Change QoQ % Change YoY 2014 FY 2015 FY % Change YoY Net interest income (Non-FTE) 509.5 507.9 504.1 -1 -1 1,985.5 2,013.0 1 Noninterest income 236.2 233.4 235.3 1 0 917.4 976.5 6 Revenues 745.7 741.2 739.3 0 -1 2,902.9 2,989.4 3 Noninterest expense 583.5 536.3 557.9 4 -4 2,180.8 2,136.5 -2 Operating income 162.2 205.0 181.5 -11 12 722.2 852.9 18 Provision 19.9 29.2 76.3 161 283 106.3 193.6 82 Pre-Tax Income 142.3 175.8 105.2 -40 -26 615.9 659.3 7 Tax expense 39.9 50.1 17.5 -65 -56 147.3 167.5 14 Noncontrolling interest 0.2 0.5 0.5 0 150 2.0 2.2 10 Net Income 102.2 125.2 87.2 -30 -15 466.6 489.6 5 Total Assets ($B) 83.2 89.4 90.0 1 8 83.2 90.0 8 Total Loans ($B) 57.5 60.9 61.4 1 7 57.5 61.4 7 Total Deposits ($B) 61.2 64.5 66.0 2 8 61.2 66.0 8

$478 $510 $508 $50 $17 $15 3.02% 2.70% 2.66% 0.10% 0.60% 1.10% 1.60% 2.10% 2.60% $400 $420 $440 $460 $480 $500 $520 $540 $560 4Q14 3Q15 4Q15 D ol la r in M ill io ns All Other Interest Income Guaranty Loans Interest Income Net Interest Margin - GAAP Margin Decline Driven by Covered Loan Portfolio Covered loan portfolio less than $500 million, smaller and shorter duration book causing volatility with NIM Key Points 1 2 Growth in core margin, exclusive of Guaranty Bank loan runoff 9 Interest Income Trends Dollars in Millions GB commercial loan portfolio removed from covered loans in 4Q14 Guaranty Loan Interest Income and All Other Net Interest Income are non-GAAP measures, see appendix page 30 for reconciliation Yield on covered loans for 2015 was 10.9% versus 22.7% for 2014 3 2 Percent margin change driven by Guaranty and matched U.S. Treasury Repo book at Section 20 securities sub.

Noninterest Income 10 2 Healthy growth in Client- centric businesses like Mortgage Banking and Investment Banking Retail investment sales impacted by lower customer demand for products in low rate environment Asset management fees negatively impacted by sale of wealth management firm CIC $ in millions 4Q14 3Q15 4Q15 % Change QoQ % Change YoY 2014 FY 2015 FY % Change YoY Service Charges On Deposits 56.8 54.9 54.4 -1 -4 222.7 216.2 -3 Card/Merchant Processing Fees 26.4 29.0 28.9 0 9 107.9 112.8 5 Retail Investment Sales 25.4 26.1 24.0 -8 -6 108.5 101.6 -6 Investment banking & advisory fees 24.2 17.8 20.3 14 -16 87.5 105.2 20 Asset management fees 10.8 7.9 8.7 10 -19 42.8 33.2 -22 Corporate and correspondent investment sales 7.6 6.0 9.7 62 28 29.6 30.0 1 Mortgage banking income 5.6 0.5 6.0 1100 7 24.6 27.3 11 Bank owned life insurance 5.8 4.3 5.1 19 -12 18.6 18.7 1 Other income 68.0 80.0 65.3 -18 -4 222.6 257.8 16 230.8 226.7 222.5 -2 -4 864.7 902.8 4 Securities & Other Gains 5.4 6.7 12.8 91 137 52.7 73.6 40 Total Noninterest Income 236.2 233.4 235.3 1 0 917.4 976.5 6

Noninterest Expense 11 2 Ex. FDIC indem. & amort. of intangibles, improved efficiencies and disciplined management helped contain expenses up 1% versus 2014 Expense growth impacted by Simple & Spring Studio, including $17mm Simple impairment in 2015 Growth in marketing primarily reflects launch of the NBA Sponsorship and Digital expansion $ in millions 4Q14 3Q15 4Q15 % Change QoQ % Change YoY 2014 FY 2015 FY % Change YoY Salaries, benefits, and commissions 281.1 268.4 274.9 2 -2 1,072.3 1,071.2 0 Professional services 59.0 54.8 63.9 17 8 207.7 216.3 4 Equipment 58.4 58.2 57.5 -1 -2 224.0 231.0 3 Net occupancy 39.9 39.5 41.1 4 3 158.4 160.3 1 Marketing 5.9 10.6 9.4 -11 59 36.0 41.8 16 Communications 6.0 5.7 5.3 -7 -12 24.6 22.0 -11 Other expense 74.4 81.2 91.2 12 23 292.0 299.6 3 524.6 518.3 543.3 5 4 2,014.8 2,042.2 1 FDIC Indemnification 34.3 8.5 5.5 -35 -84 115.0 55.1 -52 Amortization of intangibles 24.6 9.5 9.1 -4 -63 50.9 39.2 -22 Total NIE 583.5 536.3 557.9 4 -4 2,180.8 2,136.5 -2

Asset Quality Summary NPLs NPAs Continued low levels in non-performers with NPL and NPA at 0.78% and 0.82%, respectively. Coverage Ratio ALLL as a percent of NPLs at 160% as of 4Q15. Charge Offs Net Charge Offs remain at low levels, 0.23% in 4Q15 versus 0.22% in 4Q14. Asset quality trends remain stable with NPL and NCO ratios at very low-levels Notes: Troubled Debt Restructuring (TDR) totals include accruing loans 90 days past due classified as TDR. Nonperforming loans include nonaccrual loans and loans held for sale (including nonaccrual loans classified as TDR), accruing loans 90 days past due and accruing TDRs 90 days past due. Nonperforming assets include nonperforming loans, other real estate and other repossessed assets. 12 3

$1,549.0 $869.5 $525.8 $395.8 $476.5 $395.8 $429.1 $466.3 $455.2 $476.5 2011 2012 2013 2014 2015 4Q14 1Q15 2Q15 3Q15 4Q15 TDRs 90 Days Past Due & Accruing Loans 90 Days Past Due & Accruing Non-Accrual Loans Annual Quarterly $1,771.1 $941.9 $552.4 $420.4 $506.2 $420.4 $450.7 $490.7 $482.3 $506.2 2011 2012 2013 2014 2015 4Q14 1Q15 2Q15 3Q15 4Q15 Other Repossed Assets ORE Total Non Performing Loans Annual Quarterly 3.68% 1.92% 1.03% 0.69% 0.78% 0.69% 0.73% 0.77% 0.75% 0.78% 2011 2012 2013 2014 2015 4Q14 1Q15 2Q15 3Q15 4Q15 4.18% 2.07% 1.09% 0.73% 0.82% 0.73% 0.77% 0.81% 0.79% 0.82% 2011 2012 2013 2014 2015 4Q14 1Q15 2Q15 3Q15 4Q15 Nonperforming Loans Remain at Low Levels 13 Nonperforming Loans Nonaccrual loans + Past dues 90d Nonperforming Assets NPL + ORE + Other Repossessed Assets Nonperforming Assets NPL + ORE + Other Repossessed Assets Nonperforming Loans Nonaccrual loans + Past dues 90d Annual Quarterly Annual Quarterly 3

68.7% 93.2% 135.2% 173.1% 160.0% 173.1% 163.6% 154.7% 158.6% 160.0% 2011 2012 2013 2014 2015 4Q14 1Q15 2Q15 3Q15 4Q15 $485.9 $278.4 $209.7 $122.0 $116.0 $30.8 $25.2 $26.5 $28.5 $35.8 2011 2012 2013 2014 2015 4Q14 1Q15 2Q15 3Q15 4Q15 $428.6 $29.4 $107.5 $106.3 $193.6 $19.9 $42.0 $46.1 $29.2 $76.3 2011 2012 2013 2014 2015 4Q14 1Q15 2Q15 3Q15 4Q15 1.19% 0.63% 0.44% 0.22% 0.19% 0.22% 0.17% 0.18% 0.19% 0.23% $1,051.8 $802.9 $700.7$685.0 $762.7 $685.0 $701.9 $721.5 $722.1 $762.7 2011 2012 2013 2014 2015 4Q14 1Q15 2Q15 3Q15 4Q15 Coverage Ratios Remain Very Healthy Net Charge Offs Quarters Percentage Annualized as a % of average loans Provision Expense ($ in millions) 14 ALLL to NPLsALLL and ALLL / Total Loans ($ in millions) Annual Quarterly Annual Quarterly Annual Quarterly Annual Quarterly 3 Provision was negatively impacted by recent downgrades in the energy lending portfolio 2.51% 1.78% 1.38% 1.19% 1.24% 1.19% 1.20% 1.20% 1.20% 1.24%

$17.0 $20.2 $23.8 $24.4 $25.0 $25.6 $26.0 $9.6 $10.8 $12.0 $12.2 $12.8 $12.9 $12.8$11.4 $12.7 $13.9 $14.0 $14.2 $13.9 $14.0 $5.8 $6.2 $7.1 $7.4 $7.6 $7.4 $8.1 $0.7 $0.5 $0.2 $0.5 $0.6 $0.4 2012 2013 2014 1Q15 2Q15 3Q15 4Q15 CF&A CRE Resi Mortgage Other Consumer Loans Covered Loans Loans Held for Sale $45.3 $61.0$60.3 $58.4$57.5 $50.7 $61.4 Loan Portfolio Historical $ in Billions. Period-end balances “CRE” reflects summation of Commercial Real Estate Mortgage and Commercial Real Estate Construction per the 10-K filing YoY Loan Growth (12/31/15 EoP vs. 12/31/14EoP) Consolidated Loan Portfolio $ in Millions. Period-end balances; Other includes net growth of all other loan categories per the 10-K filing 15 4 Demonstrated ability to transform and grow the loan portfolio while maintaining a strong risk profile $3,868 274 625 776 776 2,194 $0 $1,000 $2,000 $3,000 $4,000 Total Loans CF&A CRE Consumer Indirect Other CF&A stands for Commercial, Financial & Agricultural
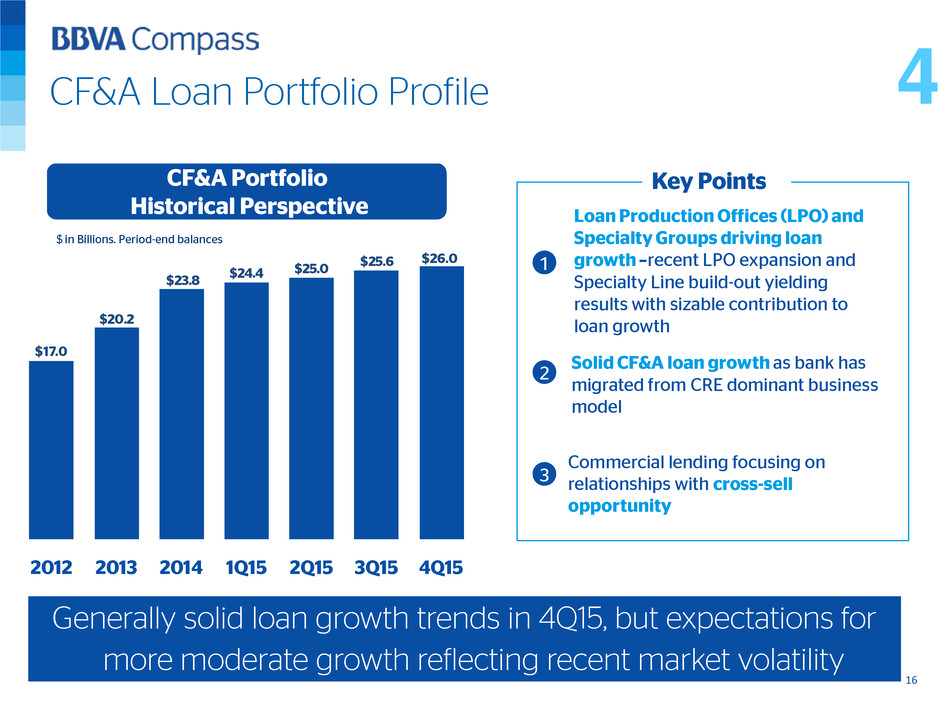
$17.0 $20.2 $23.8 $24.4 $25.0 $25.6 $26.0 2012 2013 2014 1Q15 2Q15 3Q15 4Q15 CF&A Loan Portfolio Profile CF&A Portfolio Historical Perspective $ in Billions. Period-end balances Commercial lending focusing on relationships with cross-sell opportunity • Loan Production Offices (LPO) and Specialty Groups driving loan growth –recent LPO expansion and Specialty Line build-out yielding results with sizable contribution to loan growth Key Points Generally solid loan growth trends in 4Q15, but expectations for more moderate growth reflecting recent market volatility 1 2 3 16 4 Solid CF&A loan growth as bank has migrated from CRE dominant business model
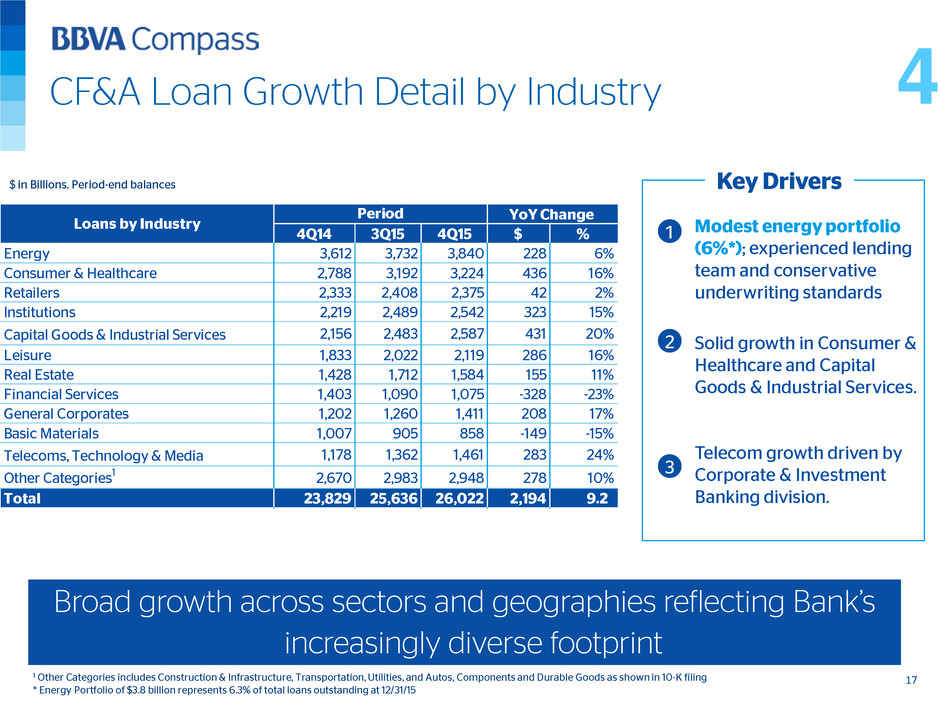
CF&A Loan Growth Detail by Industry $ in Billions. Period-end balances Key Drivers Broad growth across sectors and geographies reflecting Bank’s increasingly diverse footprint 1 2 3 17 Solid growth in Consumer & Healthcare and Capital Goods & Industrial Services. Telecom growth driven by Corporate & Investment Banking division. 1 Other Categories includes Construction & Infrastructure, Transportation, Utilities, and Autos, Components and Durable Goods as shown in 10-K filing * Energy Portfolio of $3.8 billion represents 6.3% of total loans outstanding at 12/31/15 Modest energy portfolio (6%*); experienced lending team and conservative underwriting standards 4 4Q14 3Q15 4Q15 $ % Energy 3,612 3,732 3,840 228 6% Consumer & Healthcare 2,788 3,192 3,224 436 16% Retailers 2,333 2,408 2,375 42 2% Institutions 2,219 2,489 2,542 323 15% Capital Goods & Industrial Services 2,156 2,483 2,587 431 20% Leisure 1,833 2,022 2,119 286 16% Real Estate 1,428 1,712 1,584 155 11% Financial Services 1,403 1,090 1,075 -328 -23% General Corporates 1,202 1,260 1,411 208 17% Basic Materials 1,007 905 858 -149 -15% Telecoms, Technology & Media 1,178 1,362 1,461 283 24% Other Categories1 2,670 2,983 2,948 278 10% Total 23,829 25,636 26,022 2,194 9.2 Loans by Industry Period YoY Change

Exploration and Production 53% Drilling Oil & Support Services 7% Midstream 35% Refineries and Terminals 4% Other 1% Oil&Gas:Conservative Portfolio Composition Prudent underwriting guidelines has resulted in conservative Energy portfolio 18 • Balanced portfolio representing ~50% Crude Oil and ~50% Natural and Liquid Natural Gas* Key Points • Over 87% of Exploration and Production balances are secured by engineered reserves 1 2 3 4 *based on clients that have provided detailed engineering information and when applying the bank's current pricing policies. Period-end percentages as of 12/31/15 Additional Oil & Gas Breakout In-house engineering staff with average 20 years experience. Currently, employ four engineers and three engineer techs Experienced energy lending team in place since 1994 4

Oil&Gas:Growth in Energy Driven by Midstream $ in Billions. Period-end balances In-line with broader market, anticipate moderating Midstream growth as scheduled LNG project loans near completion 19 Scheduled draws from project finance loans related to Natural Gas Liquefaction facilities drove Midstream growth. 4 Oil & Gas Sector Loan Growth Key Point LNG: Liquefied Natural Gas Loans Non- accrual Loans Non- accrual $ % Exploration and Production 2,257 0 2,041 92 -216 -10% Drilling Oil & Support Services 242 5 267 0 25 10% Midstream 950 0 1,356 0 406 43% Refineries and Terminals 124 1 138 1 14 11% Other 38 0 39 0 1 3% Total 3,612 6 3,840 93 228 6% 4Q14 Sector 4Q15 YoY Change Loans

Oil&Gas:Favorable Risk Profile Small Exposure to Drilling Oil and Support Services 20 • Minimal exposure to Oilfield Services companies with no nonaccrual loans from that sector at year-end. Key Points • ALLL Coverage ratio for Energy book 2.3%1 1 2 3 Loans rated special mention or lower in this portfolio were only 16.3%, comprised of 4.3% rated special mention and 12.0% rated substandard or lower. Energy Exposure Among Regional Banks Regional Banks that have publicly disclosed energy Criticized Loans 1 Does not include any portion of the allowance that has not been identified by the Company as related to a specific loan category Data as of 4Q15; Numbers may not round to 100% due to rounding Source: Company Filings, J.P. Morgan Research; Regional Banks for Peer purposes include BOK, CFR, HBHC, LTXB, TCBI, ZION, CMA, IBKC, ASB, RF 4 Publicly Traded Banks with Energy Exposure Greater than 3% Exploration & Production Mid- stream Down- stream Drilling & Support Services Other Peer 1 19.1% 82% 6% - 9% 3% 10.5% 2.9% Peer 2 15.3% 71% 10% - 16% 4% 9.1% 3.1% Peer 3 10.0% 52% 7% 21% 21% 28.6% 5.0% Peer 4 8.6% 87% 13% - - - 22.7% 2.3% Peer 5 7.1% 70% - - 14% 14% 16.9% 2.7% Peer 6 6.4% 31% 23% 5% 39% 2% 23.0% 5.0% Peer 7 6.3% 70% 16% - 14% - 40.0% 4.0% BBVA Compass 6.3% 53% 35% 4% 7% 1% 16.3% 2.3% Peer 8 4.8% 47% 18% 36% 22.0% 3.9% Peer 9 4.0% 100% - - - - 27.9% 5.6% Peer 10 3.1% 35% 16% 3% 39% 6% 32.5% 6.0% Firm Energy Loans as % of Total Exposure (% of Funded Energy Loans) % Criticized Loans % ALLL Coverage
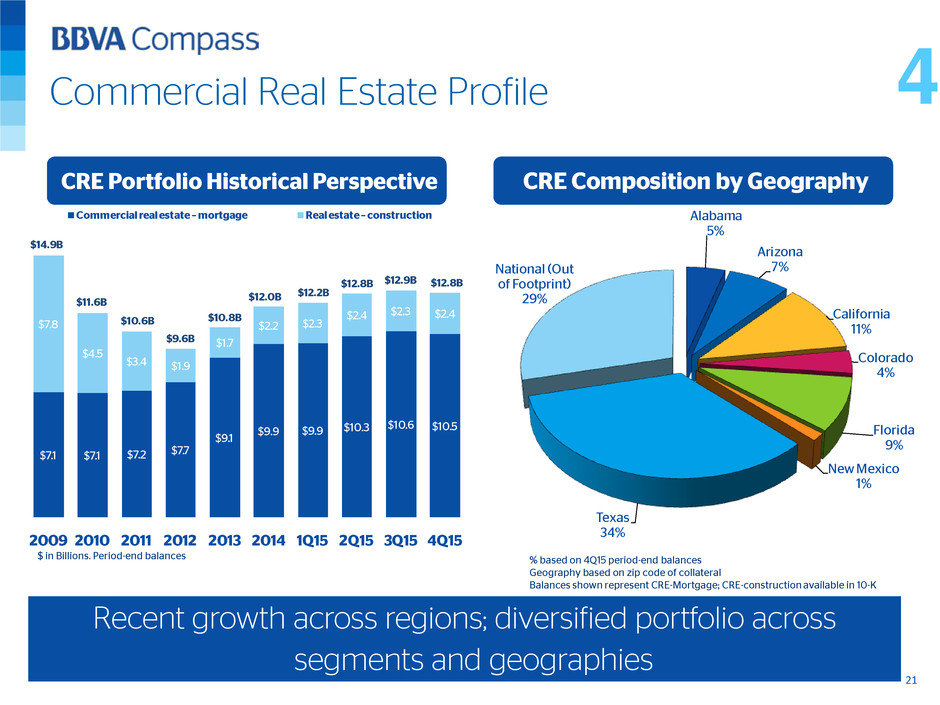
$7.1 $7.1 $7.2 $7.7 $9.1 $9.9 $9.9 $10.3 $10.6 $10.5 $7.8 $4.5 $3.4 $1.9 $1.7 $2.2 $2.3 $2.4 $2.3 $2.4 2009 2010 2011 2012 2013 2014 1Q15 2Q15 3Q15 4Q15 Commercial real estate – mortgage Real estate – construction $9.6B $10.8B $12.0B $12.2B $12.8B $12.9B $12.8B $10.6B $11.6B $14.9B Alabama 5% Arizona 7% California 11% Colorado 4% Florida 9% New Mexico 1% Texas 34% National (Out of Footprint) 29% CRE Composition by Geography Commercial Real Estate Profile CRE Portfolio Historical Perspective $ in Billions. Period-end balances % based on 4Q15 period-end balances Geography based on zip code of collateral Balances shown represent CRE-Mortgage; CRE-construction available in 10-K Recent growth across regions; diversified portfolio across segments and geographies 21 4
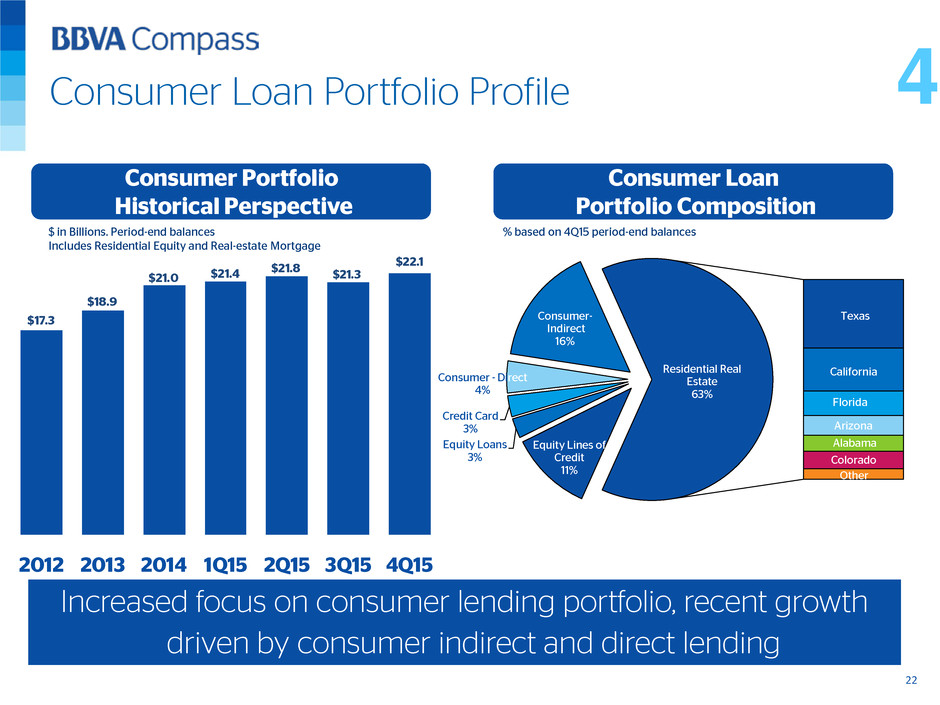
$17.3 $18.9 $21.0 $21.4 $21.8 $21.3 $22.1 2012 2013 2014 1Q15 2Q15 3Q15 4Q15 Equity Lines of Credit 11% Equity Loans 3% Credit Card 3% Consumer - Direct 4% Consumer- Indirect 16% Texas California Florida Arizona Alabama Colorado Other Residential Real Estate 63% Consumer Loan Portfolio Composition Consumer Portfolio Historical Perspective $ in Billions. Period-end balances Includes Residential Equity and Real-estate Mortgage % based on 4Q15 period-end balances Consumer Loan Portfolio Profile Increased focus on consumer lending portfolio, recent growth driven by consumer indirect and direct lending 22 4
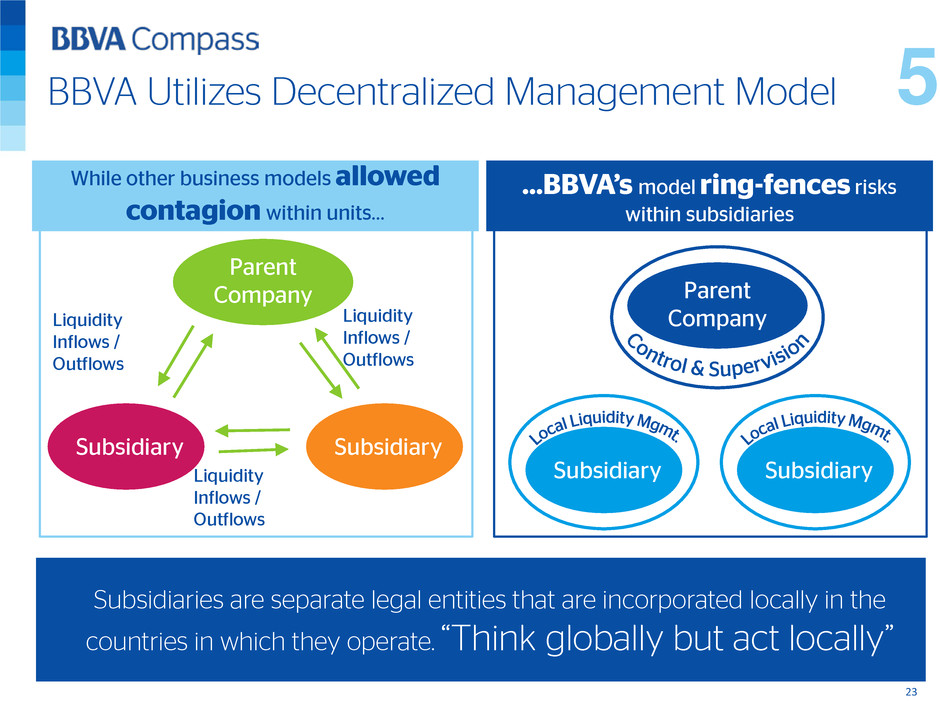
Subsidiaries are separate legal entities that are incorporated locally in the countries in which they operate. “Think globally but act locally” While other business models allowed contagion within units… …BBVA’s model ring-fences risks within subsidiaries Parent Company SubsidiarySubsidiary Liquidity Inflows / Outflows Liquidity Inflows / Outflows Liquidity Inflows / Outflows Parent Company SubsidiarySubsidiary BBVA Utilizes Decentralized Management Model 23 5

$14.4 $15.4 $17.2 $18.6 $19.0 $19.1 $19.3 $18.3 $19.3 $23.4 $24.1 $23.4 $24.9 $25.2 $12.1 $12.0 $12.7 $12.5 $12.8 $13.5 $14.0 $6.7 $7.7 $7.7 $7.5 $7.1 $6.9 $7.4 2012 2013 2014 1Q15 2Q15 3Q15 4Q15 Non-interest DDA Savings & Money Market Time Deposits Interest Bearing DDA Foreign Office Deposits $64.5$62.5 $51.6 $54.4 $61.2 $62.9 $66.0 Balanced Deposit Mix Historical Deposit Mix $ in Billions. Period-end balances as of 12/31/15 • Attractive deposit mix • 29% are noninterest bearing • Focus on retail & transactional relationships for favorable Liquidity Coverage Ratio (LCR) posture Key Points • Sustained growth in non-consumer DDA across lines of business Focus on building account base with multiple relationships 2 1 3 24 5 • Deposit growth of 8% versus last year above peer average1 of 5% 4 (1) Peer comparison as of 4Q15. Peer group includes: CMA, HBAN, FITB, RF, STI, SNV, USB, PNC, KEY MTB excluded from calculation reflecting acquisition of Hudson City DDA: Demand Deposit Account

$3.3 $3.5 $3.4 $3.1 $2.7 $3.0 $3.1 $4.3 $3.7 $2.9 $2.9 $3.3 $4.2 $4.2 $3.8 $3.7 $3.7 $3.9 $5.4 $7.0 $1.0 $1.0 $1.0 $1.0 $1.0 $1.0 $1.1 $0.9 $1.0 $0.9 $0.6 $0.7 $0.9 $0.6 $0.5 $0.7 $0.9 $0.7 $0.7 $0.7 $0.7 $0.7 $0.7 $1.4 $1.4 $1.4 $0.2 $0.1 $0.1 $0.1 $0.2 $0.2 $0.2 $0.2 $0.2 $0.1 14.8% 14.2% 15.2% 14.4% 13.6% 13.7% 13.2% 15.0% 15.8% 16.9% $0.00 $0.02 $0.04 $0.06 $0.08 $0.10 $0.12 $0.14 $0.16 $0.18 $0.0 $2.0 $4.0 $6.0 $8.0 $10.0 $12.0 $14.0 $16.0 2012 2013 1Q14 2Q14 3Q14 4Q14 1Q15 2Q15 3Q15 4Q15 FHLB Borrowings Brokered Deposits Senior Unsecured Debt Fed Funds Purchased (Customer) Subordinated Notes & Debentures Deposits in Foreign Offices % of Total Liabilities $8.4B $8.5B $9.4B $9.0B$9.0B $9.4B $9.6B $11.4B $12.2B $13.1B Increased Funding of HQLA for LCR Purposes Period end balances in billions * $0.8B of Equity Linked CDs and other deposit accounts re-classified as Brokered Deposits, prior quarters not restated. Exclusive of BBVA Securities Inc (BSI) matched Treasury repo book FHLB: Federal Home Loan Bank Successful placement of senior and subordinated debt has built credit curve comparable to other large U.S. regionals 25 5 *

$3.1 $6.1 $3.6 $2.8 $3.7 $3.4 $3.9 $4.1 $8.0 $8.0 $8.3 $10.2 $10.1 $10.4 $10.8 $11.1 $0.00 $2.00 $4.00 $6.00 $8.00 $10.00 $12.00 $14.00 $16.00 2011 2012 2013 2014 1Q15 2Q15 3Q15 4Q15 Cash & Due From Available for Sale Securities 91% 88% 92% 94% 93% 96% 94% 93% Loans to Deposits Strong Liquidity Profile with Large Pool of HQLA Liquidity Overview Solid customer deposit franchise and diversified funding base. Building significant stock of High Quality Liquid Assets (HQLA) and cash for LCR ratio in the U.S. and for BBVA Group. For liquidity purposes, the holding company and Compass Bank are self-funded subs of BBVA Group. 1Period end balances in billions 26 5
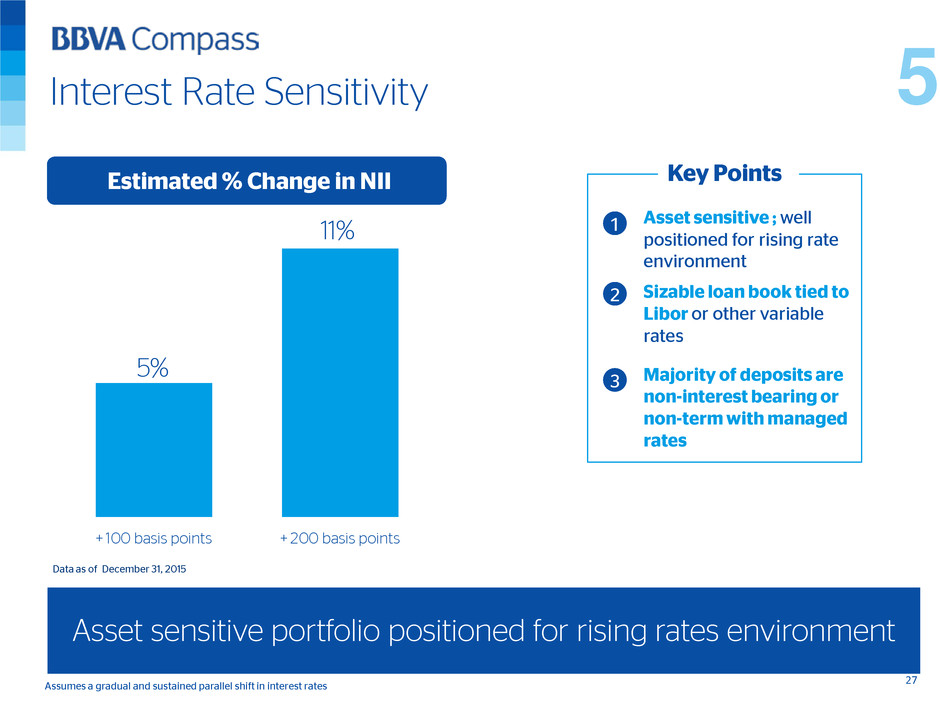
5% 11% + 100 basis points + 200 basis points Interest Rate Sensitivity Estimated % Change in NII Data as of December 31, 2015 • Assumes a gradual and sustained parallel shift in interest rates Key Points • Asset sensitive ; well positioned for rising rate environment Asset sensitive portfolio positioned for rising rates environment 2 1 27 Sizable loan book tied to Libor or other variable rates 3 Majority of deposits are non-interest bearing or non-term with managed rates 5

13.74 12.81 12.50 13.29 13.38 13.68 2013 2014 1Q15 2Q15 3Q15 4Q15 10.58 10.57 10.68 10.70 2013 2014 1Q15 2Q15 3Q15 4Q15 31% 55% 25% 11.62 10.94 10.65 10.63 10.74 11.08 2013 2014 1Q15 2Q15 3Q15 4Q15 Solid Capital Reflecting Improved Planning Process 28 Total Capital Ratio (%) Tier 1 Common Equity Ratio (%) Period End - Holding Company 2015 shown is Transitional Common Equity Tier 1 Period End - Holding Company Tier 1 Capital Ratio (%) 2 Healthy Capital Ratios Distributions Limited to Dividends 4Q15 Common Equity Tier 1 (Transitional) Capital Distributions1 Dividends Share Buybacks Peers Tier 1 qualifying $230mm perpetual preferred stock issued late 4Q15 Solid Capital Ratios 1 Dividend payout is from BBVA Compass Bancshares, Inc. 2015 CCAR submission request; peer ratios are based on LTM distributions as % of LTM net income. 2 Peer comparison includes: ASBC, BBT, HBAN, MTB, FITB, RF, STI, SNV, USB, PNC, KEY, WFC 6 10.26% 10.70% Period End - Holding Company

Ratings recently affirmed by Moody’s and Standard & Poor’s 29 Appendix: Ratings
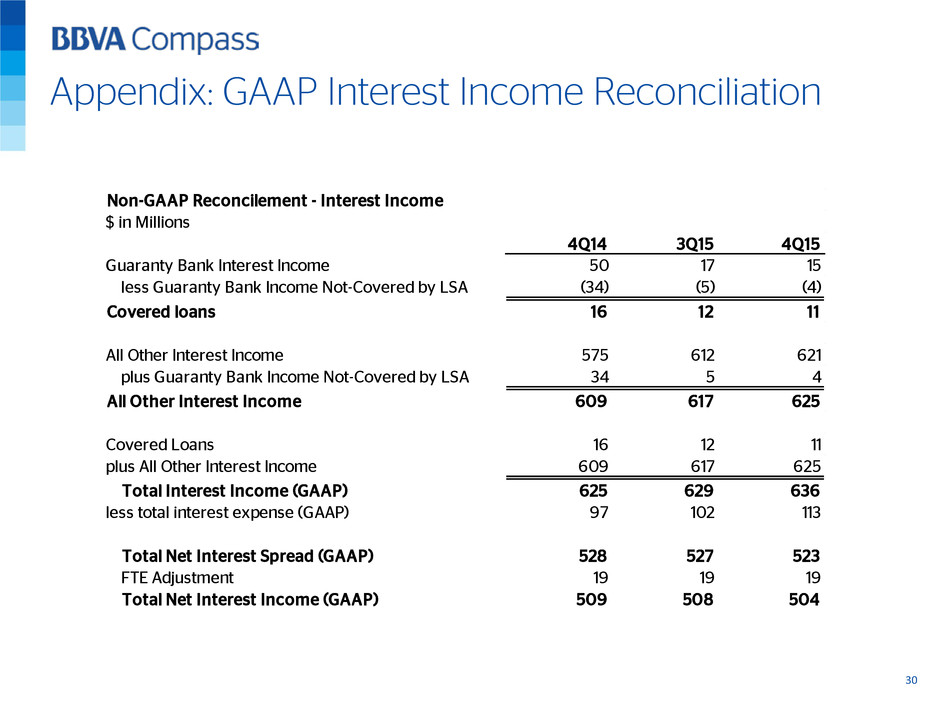
Appendix: GAAP Interest Income Reconciliation 30 Non-GAAP Reconcilement - Interest Income $ in Millions 4Q14 3Q15 4Q15 Guaranty Bank Interest Income 50 17 15 less Guaranty Bank Income Not-Covered by LSA (34) (5) (4) Covered loans 16 12 11 All Other Interest Income 575 612 621 plus Guaranty Bank Income Not-Covered by LSA 34 5 4 All Other Interest Income 609 617 625 Covered Loans 16 12 11 plus All Other Interest Income 609 617 625 Total Interest Income (GAAP) 625 629 636 less total interest expense (GAAP) 97 102 113 Total Net Interest Spread (GAAP) 528 527 523 FTE Adjustment 19 19 19 Total Net Interest Income (GAAP) 509 508 504

Fixed Income Investor Call Ed Bilek, Director Shareholder Relations Chris Marshall, Treasurer March 3, 2016
