Attached files
| file | filename |
|---|---|
| EX-31.2 - EX-31.2 - WW INTERNATIONAL, INC. | d40414dex312.htm |
| EX-31.1 - EX-31.1 - WW INTERNATIONAL, INC. | d40414dex311.htm |
| EX-21.1 - EX-21.1 - WW INTERNATIONAL, INC. | d40414dex211.htm |
| EX-32.1 - EX-32.1 - WW INTERNATIONAL, INC. | d40414dex321.htm |
| EX-10.34 - EX-10.34 - WW INTERNATIONAL, INC. | d40414dex1034.htm |
| EX-10.35 - EX-10.35 - WW INTERNATIONAL, INC. | d40414dex1035.htm |
| EX-23.1 - EX-23.1 - WW INTERNATIONAL, INC. | d40414dex231.htm |
| EX-10.36 - EX-10.36 - WW INTERNATIONAL, INC. | d40414dex1036.htm |
| EX-10.39 - EX-10.39 - WW INTERNATIONAL, INC. | d40414dex1039.htm |
Table of Contents
UNITED STATES
SECURITIES AND EXCHANGE COMMISSION
WASHINGTON, D.C. 20549
FORM 10-K
| x | ANNUAL REPORT PURSUANT TO SECTION 13 OR 15(d) OF THE SECURITIES EXCHANGE ACT OF 1934 |
For the fiscal year ended January 2, 2016.
or
| ¨ | TRANSITION REPORT PURSUANT TO SECTION 13 OR 15(d) OF THE SECURITIES EXCHANGE ACT OF 1934 |
For the transition period from to .
Commission file number 001-16769
WEIGHT WATCHERS INTERNATIONAL, INC.
(Exact name of registrant as specified in its charter)
| Virginia | 11-6040273 | |
| (State or other jurisdiction of incorporation or organization) | (I.R.S. Employer Identification No.) |
675 Avenue of the Americas, 6th Floor, New York, New York 10010
(Address of principal executive offices) (Zip code)
Registrant’s telephone number, including area code:
(212) 589-2700
Securities registered pursuant to Section 12(b) of the Act:
| Title of each class |
Name of each exchange on which registered | |
| Common Stock, no par value | New York Stock Exchange |
Securities registered pursuant to Section 12(g) of the Act:
None
(Title of class)
Indicate by check mark if the registrant is a well-known seasoned issuer, as defined in Rule 405 of the Securities Act.
Yes ¨ No x
Indicate by check mark if the registrant is not required to file reports pursuant to Section 13 or Section 15(d) of the Act.
Yes ¨ No x
Indicate by check mark whether the registrant (1) has filed all reports required to be filed by Section 13 or 15(d) of the Securities Exchange Act of 1934 during the preceding 12 months (or for such shorter period that the registrant was required to file such reports), and (2) has been subject to such filing requirements for the past 90 days.
Yes x No ¨
Indicate by check mark whether the registrant has submitted electronically and posted on its corporate Web site, if any, every Interactive Data File required to be submitted and posted pursuant to Rule 405 of Regulation S-T (§232.405 of this chapter) during the preceding 12 months (or for such shorter period that the registrant was required to submit and post such files).
Yes x No ¨
Indicate by check mark if disclosure of delinquent filers pursuant to Item 405 of Regulation S-K (§229.405 of this chapter) is not contained herein, and will not be contained, to the best of registrant’s knowledge, in definitive proxy or information statements incorporated by reference in Part III of this Form 10-K or any amendment to this Form 10-K. ¨
Indicate by check mark whether the registrant is a large accelerated filer, an accelerated filer, a non-accelerated filer, or a smaller reporting company. See the definitions of “large accelerated filer,” “accelerated filer” and “smaller reporting company” in Rule 12b-2 of the Exchange Act.
Large accelerated filer ¨ Accelerated filer x
Non-accelerated filer ¨ (Do not check if a smaller reporting company) Smaller reporting company ¨
Indicate by check mark whether the registrant is a shell company (as defined in Rule 12b-2 of the Act).
Yes ¨ No x
The aggregate market value of the registrant’s common stock held by non-affiliates as of July 2, 2015 (based upon the closing price of $4.09 per share of common stock as of July 2, 2015, the last business day of the registrant’s second fiscal quarter of 2015, as quoted on the New York Stock Exchange) was $112,751,513. For purposes of this computation, it is assumed that shares of common stock held by our directors, executive officers and our controlling shareholders as of July 2, 2015 would be deemed stock held by affiliates.
The number of shares outstanding of common stock as of February 1, 2016 was 63,648,349.
DOCUMENTS INCORPORATED BY REFERENCE
Portions of the registrant’s definitive Proxy Statement for its 2016 annual meeting of shareholders are incorporated herein by reference in Part III, Items 10-14. Such Proxy Statement will be filed with the SEC no later than 120 days after the registrant’s fiscal year ended January 2, 2016.
Table of Contents
Weight Watchers International, Inc.
Annual Report on Form 10-K
| Page | ||||||
| Part I | ||||||
| Item 1. | 1 | |||||
| Item 1A. | 12 | |||||
| Item 1B. | 21 | |||||
| Item 2. | 22 | |||||
| Item 3. | 22 | |||||
| Item 4. | 23 | |||||
| 24 | ||||||
| Part II | ||||||
| Item 5. | 28 | |||||
| Item 6. | 30 | |||||
| Item 7. | Management’s Discussion and Analysis of Financial Condition and Results of Operations |
35 | ||||
| Item 7A. | 67 | |||||
| Item 8. | 69 | |||||
| Item 9. | Changes in and Disagreements With Accountants on Accounting and Financial Disclosure |
69 | ||||
| Item 9A. | 69 | |||||
| Item 9B. | 69 | |||||
| Part III | ||||||
| Item 10. | 70 | |||||
| Item 11. | 70 | |||||
| Item 12. | Security Ownership of Certain Beneficial Owners and Management and Related Shareholder Matters |
70 | ||||
| Item 13. | Certain Relationships and Related Transactions, and Director Independence |
70 | ||||
| Item 14. | 70 | |||||
| Part IV | ||||||
| Item 15. | 72 | |||||
i
Table of Contents
BASIS OF PRESENTATION
Weight Watchers International, Inc. is a Virginia corporation with its principal executive offices in New York, New York. In this Annual Report on Form 10-K unless the context indicates otherwise: “we,” “us,” “our,” the “Company” and “WWI” refer to Weight Watchers International, Inc. and all of its operations consolidated for purposes of its financial statements; “North America” refers to our North American Company-owned operations; “United Kingdom” refers to our United Kingdom Company-owned operations; “Continental Europe” refers to our Continental Europe Company-owned operations; and “Other” refers to Asia Pacific and emerging markets operations and franchise revenues and related costs. Each of North America, United Kingdom, Continental Europe and Other is also a reportable segment.
Our fiscal year ends on the Saturday closest to December 31st and consists of either 52- or 53-week periods. In this Annual Report on Form 10-K:
| • | “fiscal 2009” refers to our fiscal year ended January 2, 2010; |
| • | “fiscal 2010” refers to our fiscal year ended January 1, 2011; |
| • | “fiscal 2011” refers to our fiscal year ended December 31, 2011; |
| • | “fiscal 2012” refers to our fiscal year ended December 29, 2012; |
| • | “fiscal 2013” refers to our fiscal year ended December 28, 2013; |
| • | “fiscal 2014” refers to our fiscal year ended January 3, 2015 (included a 53rd week); |
| • | “fiscal 2015” refers to our fiscal year ended January 2, 2016; and |
| • | “fiscal 2016” refers to our fiscal year ended December 31, 2016. |
The following terms used in this Annual Report on Form 10-K are our trademarks: Weight Watchers®, PointsPlus®, ProPoints® and SmartPoints™.
ii
Table of Contents
| Item 1. | Business |
Overview
We are a leading, global-branded consumer company and the world’s leading commercial provider of weight management services, operating globally through a network of Company-owned and franchise operations. With over five decades of weight management experience, expertise and know-how, we have established Weight Watchers as one of the most recognized and trusted brand names among weight-conscious consumers. Weight Watchers-branded products and services include meetings conducted by us and our franchisees, digital weight management products provided through our websites, mobile sites and apps, products sold at meetings, licensed products sold in retail channels and magazine subscriptions and other publications. Our primary sources of revenue are subscriptions for our monthly commitment plans for Weight Watchers meetings and Online subscriptions. Our “meetings” business refers to providing access to meetings to our monthly commitment plan subscribers, “pay-as-you-go” members, Total Access subscribers and other meeting members. “Online” refers to Weight Watchers Online, Weight Watchers OnlinePlus, Personal Coaching and other digital subscription products.
Our brand enjoys high awareness and credibility among all types of weight-conscious consumers—women and men, consumers online and offline, the support-inclined and the self-help-inclined. We are one of only a few commercial weight management programs whose efficacy has been clinically proven repeatedly. As the number of overweight and obese people worldwide grows, the demand for an effective, scalable and consumer-friendly weight management program increases. We believe our global presence and brand awareness uniquely position us in the global weight management market. We continue to explore different channels to access this market, including through our at-work meetings and healthcare strategic initiatives.
We believe the unique value provided by our offerings is inspiration, accountability and support. In the more than 50 years since our founding, we have built our meetings business by helping millions of people around the world lose weight through sensible and sustainable food plans, activity, behavior modification and group support. As of the end of fiscal 2015, we had approximately 1.0 million active meeting subscribers, who could attend over 32,000 Weight Watchers meetings around the world, which were run by more than 9,000 leaders—each of whom lost weight on our program. We also believe we are the leading global provider of paid digital subscription weight management products. As of the end of fiscal 2015, we had approximately 1.4 million active Online subscribers. Our Online business, together with its products, including apps for mobile and tablet devices, has evolved over time. Our strong brand, together with the effectiveness of our plans, loyal customer base and unparalleled network of service providers, are unique in the marketplace.
Business Organization and Global Operations
We have four reportable segments based on an integrated geographical structure as follows: North America, United Kingdom, Continental Europe (CE) and Other. Each reportable segment provides similar products and services. Further information regarding our reportable segments and our geographic areas can be found in Part II, Item 7 of this Annual Report on Form 10-K under “Management’s Discussion and Analysis of Financial Condition and Results of Operations” and in Part IV, Item 15 of this Annual Report on Form 10-K under Note 15 “Segment and Geographic Data” in the Notes to the Consolidated Financial Statements. Information concerning some of the risks to which we are exposed resulting from our international operations and foreign currency exchange rates is set forth in “Item 1A. Risk Factors” of this Annual Report on Form 10-K.
We operate in numerous countries around the world. Our “North America” reportable segment consists of our United States and Canada Company-owned operations; our “United Kingdom” reportable segment consists of our United Kingdom Company-owned operations; our “Continental Europe” reportable segment consists of our Germany, Switzerland, France, Spain, Belgium, Netherlands and Sweden Company-owned operations; and
1
Table of Contents
our “Other” reportable segment consists of our Australia, New Zealand, Mexico and Brazil Company-owned operations, as well as revenues and costs from our franchises in the United States and certain other countries. Revenues from our North America, United Kingdom, Continental Europe, and Other reportable segments contributed 64.9%, 10.7%, 19.7% and 4.7%, respectively, of our total revenues in fiscal 2015. Revenues from our North America, United Kingdom, Continental Europe, and Other reportable segments contributed 64.0%, 10.6%, 20.2% and 5.2%, respectively, of our total revenues in fiscal 2014. Finally, revenues from our North America, United Kingdom, Continental Europe, and Other reportable segments contributed 67.4%, 10.0%, 17.4% and 5.2%, respectively, of our total revenues in fiscal 2013.
The Global Weight Management Market
We participate in the global weight management market. According to Marketdata Enterprises, the weight management market had revenue of approximately $59.8 billion in 2014 in the United States alone. The number of overweight and obese adults around the world rose 27.5% between 1980 and 2013, and is estimated to reach over 3 billion by 2030. Between 2011 and 2012, 69% of Americans at or over the age of 20 were considered overweight and over a third of these were obese. Numerous diseases, including heart disease, high blood pressure and Type II diabetes, are associated with being overweight or obese.
Our Services and Products
Our Weight Management Program and Plan
In each of our markets, we offer services and products that are built upon our new weight management program, known as Beyond the Scale in North America. The program goes beyond a singular focus on weight loss, encompassing a holistic approach to a healthier, more active, happier life. It is comprised of a range of nutritional, activity, behavioral and lifestyle tools and approaches that can be personalized. Our new food plan, known as SmartPoints, was developed from a combination of advancements in scientific research and consumer insights, including from customers who experienced prior Weight Watchers plans. With the SmartPoints system, each food has a SmartPoints value determined by the food’s calories, saturated fat, sugar and protein content. Customers following the SmartPoints system can eat any food as long as the SmartPoints value of their total food consumption stays within their personalized SmartPoints “budget”. Since nutritious foods generally have lower SmartPoints values, this approach guides customers toward healthier eating patterns. Based on a personalized assessment included in the Beyond the Scale program, members and subscribers get daily and weekly SmartPoints targets, personalized activity goals and relevant content tailored to their needs. Prior to the launch of SmartPoints in December 2015, we offered a weight management plan known as PointsPlus in North America, or ProPoints in certain of our other geographies.
Our customers can participate in our program in two main ways: in-person group meetings and digitally. Within these two channels, we offer a variety of products to meet each customer’s preferences. Our leaders, when leading meetings and providing personal coaching, educate members and subscribers on our program and range of tools. In addition to providing support, our leaders also inspire members and subscribers, as each leader was successful in her or his weight loss journey using our methods.
Our Meetings Business
In our meetings business, we present our program in regular weekly meetings of 30 to 45 minutes in duration, conveniently scheduled throughout the day. Our group support system remains the cornerstone of our meetings. Members provide each other support by sharing their experiences with, and by providing encouragement and empathy to, other people experiencing similar weight management challenges. Leaders facilitate this support through interactive meetings that encourage learning through member-driven discussions and individual goal-setting.
2
Table of Contents
The primary payment structure for our meetings business globally is through monthly commitment plans. Under these plans, members generally receive unlimited access to meetings at a discounted monthly price plus free access to certain Online and mobile tools and 24/7 Expert Chat, where available. Pursuant to these plans, a fee is typically charged automatically to the member’s credit card or debit card on a monthly basis until the member elects to cancel. As of the end of fiscal 2015, we had approximately 1.0 million active subscribers to our monthly commitment plans. We also have a “pay-as-you-go” arrangement for the meetings business and, in some countries, offer prepayment plans for meetings consisting of pre-paid meeting vouchers and coupons.
In fiscal 2015, we had total meeting attendance of approximately 31.8 million, which does not include management’s estimate that franchised operations had total meeting attendance of over 3.8 million. Franchisees typically pay us a fee equal to 10% of their meeting fee revenues. We have enjoyed a mutually beneficial relationship with our franchisees over many years. In our early years, we used an aggressive franchising strategy to quickly establish a meeting infrastructure to pre-empt competition. Since then, we have acquired a large number of franchises. Our franchisees are responsible for operating classes in their franchise class territory using the program and marketing guidelines we have developed. We provide a central support system for the program and our brand. In many of our markets, franchisees purchase products from us at wholesale prices for resale directly to members. Franchisees are obligated to adhere strictly to our program content guidelines, with the freedom to control pricing, class locations, operational structure and local promotions. Franchisees provide local operational expertise, advertising and public relations. Most franchise agreements are perpetual and can be terminated only upon a material breach or bankruptcy of the franchisee.
Our Online Business
In our Online business, we offer various digital subscription products, including Weight Watchers OnlinePlus and a weight management companion for Weight Watchers meetings members who want to digitally manage the day-to-day aspects of their weight management plan. These products provide interactive and personalized resources that allow users to follow our weight management plan via the Internet or on their mobile device. In December 2014, we launched an Online subscription product, Personal Coaching, in certain of our markets, including the United States. Personal Coaching offers one-on-one telephonic, e-mail and text support and personalized planning from a Weight Watchers-certified Coach as well as access to other Online tools.
Our Online subscription products are based on the Weight Watchers approach to weight management and provide additional tools to our meetings members, as applicable. They help subscribers adopt a healthier and more active lifestyle, with a view toward long-term behavior modification—a key aspect of the Weight Watchers approach toward sustainable weight loss. These products provide subscribers with online and mobile content, functionality, resources and interactive mobile and web-based weight management plans. We believe our personalized and interactive Online subscription products give subscribers an engaging weight management experience. Our online community, which can be accessed via the web and the new Connect feature in our mobile app, gives our subscribers a way to stay virtually connected, and support and motivate each other.
We believe that mobile weight management tools and resources are an important market opportunity for us. Our mobile phone (iPhone® and Android™) and iPad® apps provide monthly commitment plan purchasers and Online subscribers with access to a suite of weight-loss tools, such as recipe and tracking tools, as well as other helpful content and the ability to scan the barcodes of food products for their SmartPoints values. We are continuing to improve the capabilities of our products, including integrating with popular activity-tracking devices and wireless weight scales.
Our Product Sales
We sell a range of products, including bars, snacks, cookbooks, food and restaurant guides with SmartPoints values, Weight Watchers magazines, SmartPoints calculators and fitness kits, and certain third-party products, such as activity-tracking monitors. These products complement our weight management program and help our
3
Table of Contents
customers in their weight management efforts. We have focused on selling products that drive recurring purchases. Our products are designed to be high quality, offer benefits related to the Weight Watchers program and be easy to merchandise.
We sell our products through our meetings business, online and to our franchisees. Excluding sales to or by our franchisees, in fiscal 2015, sales of proprietary products in our meetings business and online represented approximately 11.3% of our revenues. We seek to grow our product sales per attendee in our meetings business by continuing to optimize our product offerings by updating existing products, selectively introducing new products and sharing best practices across geographies. In fiscal 2015, we launched our ecommerce platform at shop.weightwatchers.com, making the site available to all consumers, including non-members and non-subscribers.
Licensing and Endorsements
We license the Weight Watchers brand and our other intellectual property in certain categories of food, including frozen foods and baked goods, among others, and other relevant consumer products, including scales. We also endorse carefully selected branded consumer products. By partnering with carefully selected companies in categories relevant and helpful to weight-conscious consumers, we have created a highly profitable licensing business as well as a powerful vehicle to reinforce the Weight Watchers brand in the minds of our target consumers.
We typically partner in our licensing and endorsement arrangements with third parties that excel at new product development and have strong marketing and sales expertise, manufacturing and distribution capabilities, financial strength, prior performance in previous licensing and endorsement deals and senior management committed to building the Weight Watchers brand. In connection with our acquisition from the H.J. Heinz Company, or Heinz, in September 1999, Heinz received a perpetual royalty-free license to continue using our brand in its core food categories. We plan to continue to choose our licensing and endorsement partners carefully after identifying and prioritizing product categories that enhance the Weight Watchers brand and have long-term growth potential.
Our licensing and endorsement arrangements give us access to weight-conscious consumers through products sold at retail and increase the awareness of our brand. We continue to believe there are significant opportunities both in the United States and internationally to take advantage of the strength of the Weight Watchers brand and our other intellectual property through additional licensing and endorsement arrangements.
Publishing
Weight Watchers magazines are published in most of our major markets. In the United States, Weight Watchers Magazine is an important branded marketing platform that continues to show strong circulation and advertiser acceptance. As of fall 2015, our US magazine had a readership of over seven million, according to GfK Mediamark Research and Intelligence, LLC, an industry tracking service. We also issue other publications, such as cookbooks and food and restaurant guides with SmartPoints values, which complement our program.
At-Work Meetings and Healthcare
As healthcare costs continue to be a significant concern on the minds of employers and their employees, we believe that our broad range of services and products uniquely positions us to serve the corporate market and help companies reduce their healthcare costs and improve the overall well-being of their employees. Our strategy is focused on leveraging our organizational capability to serve companies of every size and type by offering convenient and flexible weight-loss solutions that include meetings at the workplace, local community meetings and access to Weight Watchers Online.
4
Table of Contents
We believe the healthcare market represents an important channel to reach new consumers. At the end of fiscal 2014, we announced a strategic initiative with Humana, Inc. to offer our weight management services as a part of coverage under certain employer-sponsored health plans. We continue to explore different approaches to this market.
Our Clinical Efficacy and Reputation in the Marketplace
Weight Watchers is one of the most clinically-studied commercial weight management programs, with dozens of peer-reviewed publications in the last 20 years. For example, in 2013, a randomized controlled trial conducted by the Baylor College of Medicine researchers and funded by us was published in The American Journal of Medicine and found that overweight and obese adults following Weight Watchers lost significantly more weight at six months than those who tried to lose weight on their own. Our efficacy and the value of our offerings are also well-acknowledged in the marketplace. For instance, in 2016, we again were recognized by U.S. News & World Report in the “2016 Best Diets” rankings. We ranked #1 for “Best Weight-Loss Diet” and tied for #1 for “Best Commercial Diet Plan” and “Easiest Diet to Follow.”
Marketing and Promotion
Our communications with consumers and other promotional efforts enhance our brand image and awareness, and motivate both former and potential new customers to join Weight Watchers meetings or purchase our Online products. We also recently entered into a Strategic Collaboration Agreement with Oprah Winfrey, pursuant to which, among other things, Ms. Winfrey provides us with services in her discretion to promote the Company and our programs, products and services, including in advertisements and promotions, and making personal appearances on our behalf. The announcement of our partnership with Ms. Winfrey led to more than one billion earned media impressions. Further information on this agreement and our partnership with Ms. Winfrey can be found below under “—History—Winfrey Transaction.”
We advertise primarily in national media vehicles (television, digital, print, radio, etc.), which are selected based on their efficiency and effectiveness in reaching our target audience. We develop and maintain a high level of engagement with new and potential customers on various social platforms including Facebook and Twitter. While our traditional advertising schedule generally supports the three key marketing campaigns of the year, winter, spring and fall, we communicate with consumers in the Online space in real time throughout the year. Also, we utilize brand ambassadors, including from time to time celebrity spokespersons, as part of our advertising.
In addition to the above advertising channels, we take advantage of other channels for which we are uniquely positioned given our long history and network of leaders, members and subscribers. The word of mouth generated by our current and former customers is an important source of new customers. These referrals, combined with our strong brand and known effectiveness, enable us to attract new and returning customers. We also carry out many of our key public relations initiatives through the efforts of current and former Weight Watchers leaders, members and subscribers, including from time to time celebrities.
Additionally, Weight Watchers Magazine reinforces the value of our brand and serves as an important marketing tool to both existing and potential customers. We also utilize mailing campaigns and the WeightWatchers.com website to attract new and returning customers and to engage current customers.
Seasonality
Our business is seasonal due to the importance of the winter season to our overall recruitment environment. Our advertising schedule generally supports the three key recruitment-generating seasons of the year: winter, spring and fall, with winter having the highest concentration of advertising spending.
5
Table of Contents
Competition
The weight management industry includes commercial weight management programs; Internet, free mobile and other weight management apps and other electronic weight management approaches; surgical procedures; the pharmaceutical industry; self-help weight management regimens and other self-help weight management products, services and publications, such as books, magazines, websites and social media groups; dietary supplements and meal replacement products; healthy lifestyle services, products and publications; weight management services administered by doctors, nutritionists and dieticians; government agencies and non-profit groups that offer weight management services; fitness centers and national drug store chains.
Competition among commercial weight management programs is largely based on program recognition and reputation and the effectiveness, safety and price of the program. In the United States, we compete with several other companies in the commercial weight management industry, although we believe that their businesses are not comparable to ours. For example, many of these competitors’ businesses are based on the sale of pre-packaged meals and meal replacements. Our meetings use group support, interactive, member-driven discussions to encourage learning and behavior modification to help our members move towards a healthier, more active, happier life with healthier eating patterns, in conjunction with a flexible food plan that allows members the freedom to choose what they eat. There are no significant group education-based competitors in any of our major markets, except in the United Kingdom.
We believe that food manufacturers that produce meal replacement products are not comparable competition because these businesses’ meal replacement products do not engender behavior modification through education in conjunction with a flexible, healthy food plan.
We also compete with various self-help diets, products, services and publications, such as free mobile and other weight management apps. Further information regarding our competition can be found in Part II, Item 7 of this Annual Report on Form 10-K under “Management’s Discussion and Analysis of Financial Condition and Results of Operations.”
Trademarks, Patents and Other Proprietary Rights
We own numerous domestic and international trademarks, patents and other proprietary rights that are valuable assets and are important to our business. Depending upon the jurisdiction, trademarks are valid as long as they are used in the regular course of trade and/or their registrations are properly maintained. Patent protection extends for varying periods according to the date of patent filing or grant and the legal term of patents in the jurisdiction in which the patent is granted. The actual protection afforded by a patent may vary from country to country depending upon the type of patent, the scope of its coverage and the availability of legal remedies in the country. We believe the protection of our trademarks, copyrights, patents, domain names, trade dress and trade secrets is important to our success. We aggressively protect our intellectual property rights by relying on a combination of trademark, copyright, patent, trade dress, trade secret and other intellectual property laws, and through domain name dispute resolution systems.
History
Early Development
In 1961, Jean Nidetch, our founder, attended a New York City obesity clinic and took what she learned from her personal experience at the obesity clinic and began weight-loss meetings with a group of her overweight friends in the basement of a New York apartment building. Under Ms. Nidetch’s leadership, the group members supported each other in their weight-loss efforts, and word of the group’s success quickly spread. Ms. Nidetch and Al and Felice Lippert, who all successfully lost weight through these efforts, formally launched our business in 1963. Weight Watchers International, Inc. was incorporated as a Virginia corporation in 1974 and succeeded to the business started in New York in 1963. Heinz acquired us in 1978.
6
Table of Contents
Artal Ownership
In September 1999, Artal Luxembourg S.A., or Artal Luxembourg, acquired us from Heinz. Artal Luxembourg is an indirect subsidiary of Artal Group S.A., or Artal Group, which together with its parents and its subsidiaries is referred to in this Annual Report on Form 10-K as Artal. Currently, Artal Luxembourg is the record holder of all our shares owned by Artal.
WeightWatchers.com Acquisition
In July 2005, we acquired control of our licensee and affiliate, WeightWatchers.com, Inc., by increasing our ownership interest from approximately 20% to approximately 53%. Subsequently, in December 2005, WeightWatchers.com, Inc. redeemed all shares owned by Artal in it, resulting in our current ownership of 100% of WeightWatchers.com, Inc.
Winfrey Transaction
On October 18, 2015, we entered into a Strategic Collaboration Agreement with Ms. Winfrey, or the Strategic Collaboration Agreement, pursuant to which Ms. Winfrey granted us the right to use, subject to her approval, her name, image, likeness and endorsement for and in connection with the Company and its programs, products and services (including in advertising, promotion, materials and content), and we granted Ms. Winfrey the right to use our WEIGHT WATCHERS marks to collaborate with and promote the Company and its programs, products and services. The Strategic Collaboration Agreement has an initial term of five years, with additional successive one year renewal terms. During this period, Ms. Winfrey will consult with us and participate in developing, planning, executing and enhancing the Weight Watchers program and related initiatives, and provide us with services in her discretion to promote the Company and its programs, products and services, including in advertisements and promotions, and making personal appearances on our behalf. Ms. Winfrey will not grant anyone but the Company the right to use her name, image, likeness or endorsement for or in connection with any other weight loss or weight management programs during the term of the Strategic Collaboration Agreement, and she will not engage in any other weight loss or weight management business, program, products, or services during the term of the Strategic Collaboration Agreement and for one year thereafter.
On that same date, we entered into a Share Purchase Agreement with Ms. Winfrey, or the Winfrey Purchase Agreement, pursuant to which we issued and sold to Ms. Winfrey an aggregate of 6,362,103 shares of our common stock for an aggregate cash purchase price of $43,198,679. The purchased shares are subject to certain transfer restrictions and a right of first offer and right of first refusal held by the Company. Under the Winfrey Purchase Agreement, Ms. Winfrey has certain demand registration rights and piggyback rights with respect to these purchased shares. The Winfrey Purchase Agreement also provides Ms. Winfrey with the right to be nominated as director of the Company for so long as she and certain permitted transferees own at least 3% of our issued and outstanding common stock.
In consideration of Ms. Winfrey entering into the Strategic Collaboration Agreement and the performance of her obligations thereunder, on October 18, 2015, we granted Ms. Winfrey a fully vested option to purchase 3,513,468 shares of our common stock, or the Winfrey Option. The term sheet for the Winfrey Option, which includes the terms and conditions appended thereto, relating to the grant of the Winfrey Option is referred to herein as the Winfrey Option Agreement. The Winfrey Option is exercisable at a price of $6.97 per share, in whole or in part, at any time prior to October 18, 2025, subject to earlier termination under certain circumstances, including if (i) the Strategic Collaboration Agreement expires as a result of Ms. Winfrey’s decision not to renew the term of such agreement and (ii) a change in control (as defined the Winfrey Option Agreement) of the Company occurs. The shares issuable upon exercise of the Winfrey Option are subject to certain transfer restrictions and a right of first offer and right of first refusal held by the Company.
7
Table of Contents
In connection with Ms. Winfrey’s purchase of our common stock and the grant of the Winfrey Option described above, Artal Luxembourg entered into a Voting Agreement with Ms. Winfrey on October 18, 2015, or the Voting Agreement, pursuant to which Ms. Winfrey agreed to vote all of her common stock or preferred stock of the Company and other securities convertible into or exercisable or exchangeable for any common stock or preferred stock of the Company so as to elect such individuals designated by Artal. The Voting Agreement terminates on the date that any of the following occurs: (i) Artal (and certain permitted transferees) and Ms. Winfrey (and certain permitted transferees) collectively own less than 50% of our issued and outstanding common stock, (ii) Ms. Winfrey then has the right to be nominated as a director and has met certain eligibility requirements under the Winfrey Purchase Agreement, but is not elected as a director of the Company, (iii) Ms. Winfrey (and certain permitted transferees) collectively own less than 1% of our issued and outstanding common stock, (iv) the voting and related arrangements in the Voting Agreement, in our reasonable determination, constitutes a “change of control” in any of our debt agreements or (v) the parties to the Voting Agreement terminate such agreement by written consent.
As a result of entering into the Voting Agreement, Artal and Ms. Winfrey are acting as a “group” within the meaning of Section 13(d)(3) or Section 14(d)(2) of the Securities Exchange Act of 1934, as amended, or the Exchange Act. As a result, we continue to qualify as a “controlled company” under the applicable rules of The New York Stock Exchange, or the NYSE.
The transactions contemplated by the Strategic Collaboration Agreement, Winfrey Purchase Agreement and Winfrey Option Agreement are collectively referred to herein as the Winfrey Transaction.
Regulation
A number of laws and regulations govern our advertising, services, products, operations and relations with consumers, licensees, franchisees, employees and other service providers and government authorities in the countries in which we operate. Certain federal, state and foreign agencies, such as the Federal Trade Commission, or FTC, and the Food and Drug Administration, or FDA, regulate and enforce such laws and regulations relating to advertising, promotions, packaging, privacy, consumer pricing and billing arrangements and other consumer protection matters. We are subject to many distinct employment, labor, commercial, benefits and tax laws and regulations in each country in which we operate, including regulations affecting our employment and wage and hour practices and our relations with our employees and service providers. Laws and regulations directly applicable to communications, operations or commerce over the Internet such as those governing intellectual property, privacy and taxation, are more prevalent and continue to evolve. Our operations are subject to these laws and regulations and we continue to monitor their development and our compliance. In addition, we are subject to other laws and regulations in the United States and internationally.
During the mid-1990s, the FTC filed complaints against a number of commercial weight management providers alleging violations of federal law in connection with the use of advertisements that featured testimonials, claims for program success and program costs. In 1997, we entered into a consent order with the FTC settling all contested issues raised in the complaint filed against us. The consent order requires us to comply with certain procedures and disclosures in connection with our advertisements of services and products. From time to time, we have been in discussions with the FTC regarding such consent order.
Employees and Service Providers
As of January 2, 2016, we had approximately 19,000 employees, a majority of whom were part-time employees. In addition, in certain of our markets, our service providers are self-employed and are not included in this total. We consider our relations with our employees and service providers to be satisfactory.
8
Table of Contents
Available Information
Corporate information and our press releases, Annual Reports on Form 10-K, Quarterly Reports on Form 10-Q and Current Reports on Form 8-K, and amendments thereto, are available free of charge on our website at www.weightwatchersinternational.com as soon as reasonably practicable after such material is electronically filed with or furnished to the Securities and Exchange Commission (i.e., generally the same day as the filing). Moreover, we also make available at that site the Section 16 reports filed electronically by our officers, directors and 10 percent shareholders. Usually these are publicly accessible no later than the business day following the filing.
We use our website at www.weightwatchersinternational.com, our corporate Facebook page (www.facebook.com/weightwatchers), Twitter account (@WeightWatchers), and Instagram account (Instagram.com/weightwatchers) as channels of distribution of Company information. The information we post through these channels may be deemed material. Accordingly, investors should monitor these channels, in addition to following our press releases, SEC filings and public conference calls and webcasts. The contents of our website and social media channels shall not be deemed to be incorporated herein by reference.
Our Amended and Restated Code of Business Conduct and Ethics, or the Code of Business Conduct and Ethics, and our Corporate Governance Guidelines are also available on our website at www.weightwatchersinternational.com.
9
Table of Contents
CAUTIONARY NOTICE REGARDING FORWARD-LOOKING STATEMENTS
Except for historical information contained herein, this Annual Report on Form 10-K includes “forward-looking statements,” within the meaning of Section 27A of the Securities Act of 1933, as amended, and Section 21E of the Securities Exchange Act of 1934, as amended, or the Exchange Act, including, in particular, the statements about our plans, strategies and prospects under the headings “Business” and “Management’s Discussion and Analysis of Financial Condition and Results of Operations.” We have generally used the words “may,” “will,” “could,” “expect,” “anticipate,” “believe,” “estimate,” “plan,” “intend” and similar expressions in this Annual Report on Form 10-K and the documents incorporated by reference herein to identify forward-looking statements. We have based these forward-looking statements on our current views with respect to future events and financial performance. Actual results could differ materially from those projected in these forward-looking statements. These forward-looking statements are subject to risks, uncertainties and assumptions, including, among other things:
| • | competition from other weight management industry participants or the development of more effective or more favorably perceived weight management methods; |
| • | our ability to continue to develop new, innovative services and products and enhance our existing services and products or the failure of our services and products to continue to appeal to the market, or our ability to successfully expand into new channels of distribution or respond to consumer trends; |
| • | the ability to successfully implement new strategic initiatives; |
| • | the effectiveness of our advertising and marketing programs, including the strength of our social media presence; |
| • | the impact on the Weight Watchers brand of actions taken by our franchisees, licensees, suppliers and other partners; |
| • | the impact of our debt service obligations and restrictive debt covenants; |
| • | the inability to refinance our debt obligations on favorable terms or at all; |
| • | uncertainties regarding the satisfactory operation of our information technology or systems; |
| • | the impact of security breaches or privacy concerns; |
| • | the recognition of asset impairment charges; |
| • | the loss of key personnel or consultants or failure to effectively manage and motivate our workforce; |
| • | the inability to renew certain of our licenses, or the inability to do so on terms that are favorable to us; |
| • | the expiration or early termination by us of leases; |
| • | risks and uncertainties associated with our international operations, including regulatory, economic, political and social risks and foreign currency risks; |
| • | uncertainties related to a downturn in general economic conditions or consumer confidence; |
| • | our ability to successfully make acquisitions or enter into joint ventures, including our ability to successfully integrate, operate or realize the anticipated benefits of such businesses; |
| • | the seasonal nature of our business; |
| • | the impact of events that discourage or impede people from gathering with others or accessing resources; |
| • | our ability to enforce our intellectual property rights both domestically and internationally, as well as the impact of our involvement in any claims related to intellectual property rights; |
| • | the outcomes of litigation or regulatory actions; |
10
Table of Contents
| • | the impact of existing and future laws and regulations; |
| • | our failure to maintain effective internal control over financial reporting; |
| • | the possibility that the interests of Artal, who effectively controls us, will conflict with other holders of our common stock; and |
| • | other risks and uncertainties, including those detailed from time to time in our periodic reports filed with the Securities and Exchange Commission. |
You should not put undue reliance on any forward-looking statements. You should understand that many important factors, including those discussed under the headings “Risk Factors” and “Management’s Discussion and Analysis of Financial Condition and Results of Operations,” could cause our results to differ materially from those expressed or suggested in any forward-looking statement. Except as required by law, we do not undertake any obligation to update or revise these forward-looking statements to reflect new information or events or circumstances that occur after the date of this Annual Report on Form 10-K or to reflect the occurrence of unanticipated events or otherwise.
11
Table of Contents
| Item 1A. | Risk Factors |
You should consider carefully, in addition to the other information contained in this Annual Report on Form 10-K and the exhibits hereto, the following risk factors in evaluating our business. Our business, financial condition or results of operations could be materially adversely affected by any of these risks. The following discussion of risks is not all inclusive but is designed to highlight what we believe are the most significant risks that we face. Additional risks and uncertainties, not presently known to us or that we currently deem immaterial, may also impair our business, financial condition or results of operations.
Competition from other weight management industry participants or the development of more effective or more favorably perceived weight management methods could result in decreased demand for our services and products.
The weight management industry is highly competitive. We compete against a wide range of providers of weight management services and products. Our competitors include: commercial weight management programs; Internet, free mobile and other weight management apps and other electronic weight management approaches; surgical procedures; the pharmaceutical industry; self-help weight management regimens and other self-help weight management products, services and publications, such as books, magazines, websites and social media groups; dietary supplements and meal replacement products; healthy lifestyle services, products and publications; weight management services administered by doctors, nutritionists and dieticians; government agencies and non-profit groups that offer weight management services; fitness centers and national drug store chains. Additional competitors may emerge as new or different services, products or methods of weight management are developed and marketed. More effective or more favorably perceived diet and weight management methods, including pharmaceutical treatments, fat and sugar substitutes or other technological and scientific advancements in weight management methods, also may be developed. This competition may reduce demand for our services and products.
The purchasing decisions of weight management consumers are highly subjective and can be influenced by many factors, such as brand image, marketing programs, cost, consumer trends and perception of the efficacy of the service and product offerings. Moreover, consumers can, and frequently do, change weight management approaches easily and at little cost. For example, fad diets and weight loss trends, such as low-carbohydrate diets, have adversely affected our revenues from time to time. More recently, our revenue was adversely affected by the popularity of mobile technology, which has led to increased trial of free mobile and other weight management apps and activity monitors. Any decrease in demand for our services and products may adversely affect our business, financial condition or results of operations.
If we do not continue to develop new, innovative services and products or if our services and products do not continue to appeal to the market, or if we are unable to successfully expand into new channels of distribution or respond to consumer trends, our business may suffer.
The weight management industry is subject to changing consumer demands based, in large part, on the efficacy and popular appeal of weight management programs. The popularity of weight management programs is dependent, in part, on their ease of use, cost and channels of distribution as well as consumer trends. For example, the increasing focus of consumers on more integrated lifestyle and fitness approaches rather than just food, nutrition and diet could adversely impact the popularity of our programs. Our future success depends on our ability to continue to develop and market new, innovative services and products and to enhance our existing services and products, each on a timely basis, to respond to new and evolving consumer demands, achieve market acceptance and keep pace with new nutritional, weight management, technological and other developments. We may not be successful in developing, introducing on a timely basis or marketing any new or enhanced services and products. Additionally, new or enhanced services or products may not appeal to the market or the market’s perception of us may not evolve alongside our services and products. Our future success also will depend, in part, on our ability to successfully distribute our services and products through appealing
12
Table of Contents
channels of distribution, such as mobile or social media. Our failure to develop new, innovative services and products and to enhance our existing services and products, the failure of our services and products to continue to appeal to the market or the failure to expand into appealing new channels of distribution could have an adverse impact on our ability to attract and retain members and subscribers and thus adversely affect our business, financial condition or results of operations.
We may not be able to successfully implement new strategic initiatives, which could adversely impact our business.
We are continuously evaluating changing consumer preferences and the competitive environment of our industry and seeking out opportunities to improve our performance through the implementation of selected strategic initiatives, such as our healthcare initiative. The goal of these efforts is to develop and implement a comprehensive and competitive business strategy which addresses the continuing changes in the weight management industry environment and our position within the industry. For example, as the healthcare industry continues to evolve its response to the obesity epidemic so do the requirements, both regulatory and business, for providers. If we do not successfully meet these requirements, we may not be perceived as an appropriate partner for certain purposes. We may not be able to successfully implement our strategic initiatives and realize the intended business opportunities, growth prospects, including new business channels, and competitive advantages. Our efforts to capitalize on business opportunities may not bring the intended results. Assumptions underlying expected financial results or consumer demand may not be met or economic conditions may deteriorate. We also may be unable to attract and retain highly qualified and skilled personnel to implement our strategic initiatives. If these or other factors limit our ability to successfully execute our strategic initiatives, our business activities, financial condition or results of operations may be adversely affected.
Our business depends on the effectiveness of our advertising and marketing programs, including the strength of our social media presence, to attract and retain members and subscribers.
Our business success depends on our ability to attract and retain members to our meetings and subscribers to our Online products. Our ability to attract and retain members and subscribers depends significantly on the effectiveness of our advertising and marketing practices. From time to time, we use the success stories of our members and subscribers, including in some cases celebrities, in our advertising and marketing programs to communicate on a personal level with consumers. Actions taken by these members, subscribers and celebrities that harm their personal reputation, or include the cessation of using our services and products, could have an adverse impact on the advertising and marketing campaigns in which they are featured. We also use social media channels as a means of communicating with consumers. Unauthorized or inappropriate use of these channels could result in harmful publicity or negative consumer experience which could have an adverse impact on the effectiveness of our marketing in these channels. In addition, substantial negative commentary by others on social media platforms could have an adverse impact on our reputation and ability to attract and retain members and subscribers. If our advertising and marketing campaigns do not generate a sufficient number of members and subscribers, our business, financial condition and results of operations will be adversely affected.
The Weight Watchers brand could be impaired due to actions taken by our franchisees, licensees, suppliers and other partners.
We believe that the Weight Watchers brand, including its widespread recognition and strong reputation in the market, is one of our most valuable assets and that it provides us with a competitive advantage. Our franchisees operate their businesses under our brand. In addition, we license the Weight Watchers brand to third parties for the manufacture and sale in retail stores by such parties of a variety of goods, including food products, and also endorse third-party branded consumer products. We also sell in our meeting rooms food and non-food products manufactured by third-party suppliers. Our franchisees, licensees, suppliers and other partners are independent third parties with their own financial objectives. Actions taken by them, including violations of generally accepted ethical business practices or breaches of law or contractual obligations, such as not following
13
Table of Contents
our program or not maintaining our quality and safety standards, could harm our brand. Also, Weight Watchers products may be subject to product recalls, litigation or other deficiencies. Any negative publicity associated with these actions or these third parties would adversely affect our brand and may result in decreased meeting attendance, Online product subscriptions and product sales and, as a result, lower revenues and profits.
Our debt service obligations could adversely affect our financial condition, and the restrictions of our debt covenants could impede our operations and flexibility.
As of January 2, 2016, our total debt was $2,235.0 million. In addition, at January 2, 2016, we had $0.2 million available under our revolving credit facility. Our debt consists entirely of variable-rate instruments so we are subject to the risk of higher interest rates. We seek to manage our exposure to interest rates through interest rate swaps. At the end of fiscal 2015, we had in effect an interest rate swap with a notional amount of $1.5 billion.
While there is no net debt to EBITDA (earnings before interest, taxes, depreciation and amortization) leverage ratio maintenance requirement on our $2,235.0 million of debt outstanding, our credit facilities contain customary covenants, including covenants that in certain circumstances restrict our ability to incur additional indebtedness, pay dividends on and redeem capital stock, make other payments, including investments, sell our assets and enter into consolidations, mergers and transfers of all or substantially all of our assets. A breach of any of these covenants could result in an event of default under the credit facilities. Under the terms of our credit facilities, depending on our leverage ratio, we are obligated to offer to prepay our term loan facilities in an aggregate amount determined by our excess cash flow. If an event of default exists under the credit facilities, the lenders could elect to cease making loans and declare all amounts outstanding thereunder to be immediately due and payable. If the lenders under the credit facilities accelerate the payment of the indebtedness, we may not be able to refinance such indebtedness, and our assets may not be sufficient to repay in full that indebtedness and our other indebtedness that would become due as a result of any such acceleration.
We may not be able to refinance our debt on favorable terms or at all depending on the condition of the capital markets and our financial condition at such time.
Our ability to make scheduled payments on or to refinance our debt obligations and to fund our planned capital expenditures and other ongoing liquidity needs depends on our future performance, which may be affected by financial, business, economic, demographic and other factors, such as attitudes toward weight management and pressure from our competitors. We have a term loan credit facility with a $144.3 million debt maturity obligation due April 2016. We expect to satisfy our debt obligations with respect to this April 2016 maturity with cash on hand.
We also have a term loan credit facility in an aggregate principal amount of $2.1 billion that will mature in April 2020. We expect to pay the principal and interest due in April 2020 from a combination of our cash flows provided by operating activities and by opportunistically using other means to repay or refinance our obligations as we determine appropriate. There can be no assurance that we will maintain a level of cash flows provided by operating activities in an amount sufficient to permit us to pay the principal and interest on all of our outstanding debt. If our cash flows and capital resources are insufficient to fund our debt service obligations, we may be forced to reduce or delay investments and capital expenditures, or to sell assets, seek additional capital or restructure or refinance our indebtedness. Our ability, if any, to restructure or refinance our debt will depend on the condition of the capital markets and our financial condition at such time. We also may not be able to secure future borrowings under our WWI Credit Facility (as defined below) or otherwise to fund our planned capital expenditures and other ongoing liquidity needs.
Any refinancing, if available on acceptable terms or at all, of our debt could be at higher interest rates and may require us to comply with more onerous covenants, which could further restrict our business operations. The terms of existing or future debt instruments may restrict us from adopting some of these alternatives. In addition,
14
Table of Contents
any deterioration in our performance would likely result in a reduction of our credit rating, which could harm our ability to incur additional indebtedness or the ability to refinance our debt obligations on favorable terms or at all.
Any failure of our technology or systems to perform satisfactorily could result in an adverse impact on our business.
We rely on software, hardware, network systems and similar technology, including cloud-based technology, that is either developed by us or licensed from or maintained by third parties to operate our websites, Online subscription product offerings and other services and products such as the recurring billing system associated with certain of our commitment plans, and to support our business operations. As much of this technology is complex, there may be future errors, defects or performance problems, including when we update our technology or integrate new technology to expand and enhance our capabilities. Our technology may malfunction or suffer from defects that become apparent only after extended use. In addition, our operations depend on our ability to protect our information technology systems against damage from fire, power loss, water, earthquakes, telecommunications failures, third-party cyber-attacks and similar unexpected adverse events. Interruptions in our websites, services and products or network systems could result from unknown technical defects, insufficient capacity or the failure of our third party providers to provide continuous and uninterrupted service. While we maintain disaster recovery capabilities to return to normal operation in a timely manner, we do not have a fully redundant system that includes an instantaneous recovery capability.
As a result of such possible defects, failures, interruptions or other problems, our services and products could be rendered unreliable or be perceived as unreliable by customers, which could result in harm to our reputation and brand. Any failure of our technology or systems could result in an adverse impact on our business.
Our reputation and the appeal of our services and product offerings may be harmed by security breaches or privacy concerns.
Breaches of security, vandalism and other malicious acts, which are increasingly negatively impacting companies, could result in unauthorized access to proprietary or customer information or data, including credit card transaction data, or cause interruptions to our services and products. Such unauthorized access could harm our reputation, expose us to liability claims and may result in the loss of existing or potential customers. We rely upon sophisticated information technology systems to operate our business. In the ordinary course of business, we collect, store and utilize confidential information (including, but not limited to, personal customer information and data), and it is critical that we do so in a secure manner to maintain the confidentiality and integrity of such confidential information as well as comply with applicable regulatory requirements and contractual obligations.
We also have outsourced significant elements of our information technology infrastructure and, as a result, we are managing many independent vendor relationships with third parties who may or could have access to our confidential information. The size and complexity of our information technology and information security systems, and those of our third-party vendors with whom we contract, make such systems potentially vulnerable to security breaches. While we have invested and developed systems and processes designed to protect such proprietary or customer information or data, there can be no assurance that our efforts will prevent service interruptions or security breaches.
Most states require that customers be notified if a security breach results in the disclosure of their personal financial account or other information, and additional states and governmental entities are considering such laws. In addition, other public disclosure laws may require that material security breaches be reported. If we experience a security breach and such notice or public disclosure is required in the future, our reputation and our business may be harmed. Prospective and existing customers, as well as companies and health plan providers who we currently or may in the future partner with, may have concerns regarding our use of private information or data collected on our websites or through our services and products, such as weight management information,
15
Table of Contents
financial data, email addresses and home addresses. These privacy concerns could keep customers from using our websites or purchasing our services or products, and third parties from partnering with us.
In addition, the transmission of computer viruses, or similar malware, could adversely affect our information technology systems and harm our business operations. As a result, it may become necessary to expend significant additional amounts of capital and other resources to protect against, or to alleviate, problems caused by security breaches. These expenditures, however, may not prove to be a sufficient remedy.
We may be required to recognize asset impairment charges for indefinite- and definite-lived assets.
In accordance with GAAP (as defined hereafter), we perform impairment reviews of our indefinite-lived assets, which include franchise rights acquired and goodwill, on at least an annual basis or more often if events so require. We also continually evaluate whether current factors or indicators, such as the deterioration in relevant, country macroeconomic conditions, an increased competitive environment, a decline in our financial performance, and/or other prevailing conditions in the capital markets, require the performance of an interim impairment assessment of those assets. The process of testing franchise rights acquired, goodwill and other indefinite-lived assets for impairment involves numerous judgments, assumptions and estimates made by management which inherently reflect a high degree of uncertainty. Certain factors, including the future profitability of our businesses, the price of our stock and macroeconomic conditions (both at the global and local levels), might have a negative impact on the fair value of these assets. In fiscal 2013, we recorded impairment charges in the aggregate of approximately $1.2 million related to franchise rights acquired in connection with our Mexico and Hong Kong operations. We may incur additional impairment charges in the future, which would have an adverse impact on our financial condition and results of operations.
Additionally, we evaluate definite-lived assets, both tangible, which includes our physical plant and equipment, and intangible, which includes both internally developed and purchased software, for impairment by comparing the net realizable value of the asset to the carrying value of the capitalized cost. If the value of those assets is not deemed to be recoverable, an assessment of the fair value of those assets is performed and to the extent the carrying value exceeds the fair value an impairment charge is recognized. Should our investment in capitalized definite-lived assets become impaired, there would also be an adverse impact on our reported financial results.
Loss of key personnel or consultants or failure to effectively manage and motivate our workforce could negatively impact our sales of services and products, business, financial condition and results of operations.
We depend on senior management and other key personnel and consultants, and the loss of certain personnel or consultants could result in the loss of management continuity and institutional knowledge and negatively affect our brand image and goodwill. In October 2015, Ms. Winfrey and the Company entered into a long-term, strategic partnership, which included her making a substantial equity investment in the Company, joining our Board of Directors, providing certain consulting services and granting us the right to use her name and marks. Our ability to maintain our brand image and leverage the goodwill associated with Ms. Winfrey’s name may be damaged if we were to lose her services or if the nature of our partnership changes. The loss of Ms. Winfrey’s services or partnership with us for any reason (including as a result of her death or disability), any negative market or industry perception with respect to her or her participation in the Company’s programs, or the failure by Ms. Winfrey to provide services in her discretion to promote the Company, our programs, services and products or to consult with us and participate in developing, planning, executing and enhancing our programs and related initiatives, all in accordance with our strategic partnership arrangements with her, could have an adverse effect on our business, financial condition and results of operations.
We also depend heavily upon our service providers to support our members and Personal Coaching subscribers in their weight management efforts. If we fail to appropriately manage and motivate our service
16
Table of Contents
providers, we may not be able to adequately service our customers which could negatively impact our sales of services and products. Changes in factors such as overall unemployment levels, local competition for qualified personnel, prevailing wage rates, changes in employment law, as well as rising employee benefits costs, including insurance in the areas in which we operate, could increase our labor costs and interfere with our ability to adequately retain qualified service providers to provide support to customers. Additionally, our inability to attract and retain qualified personnel could delay or hinder our successfully executing our strategic initiatives.
The inability to renew certain of our licenses, or the inability to do so on terms that are favorable to us, could have a material adverse effect on our financial results.
We have entered into licensing and endorsement relationships with numerous partners for the distribution and sale of certain products that are relevant and helpful to weight-conscious consumers. These arrangements are typically for fixed terms, following which the parties decide whether to extend the term of the arrangement. There is no guarantee that we will reach mutually agreeable terms with our partners for extending an arrangement. Similarly, in those instances where a licensee enjoys the option to extend the term of a license as a result of having achieved certain conditions, there is no guarantee that the licensee will avail itself of such option. Our financial results could be materially adversely affected if we are unable to extend a licensing or endorsement arrangement, if we are unable to do so on terms favorable to us, or if we cannot locate a suitable alternative to an incumbent licensee who has decided not to renew its arrangement.
Expiration or early termination by us of leases could have an adverse impact on our financial results.
Our operations, including corporate headquarters and back-office and customer service operations, are located in leased office space and many of our meetings are held in leased space in retail centers. As leases expire, we may not be able to renew them on acceptable terms or secure suitable replacement locations. If we decide to relocate or close meeting locations before the expiration of the applicable lease term, we may incur payments to landlords to terminate or “buy out” the remaining term of the lease. Any of the above events could adversely impact our financial results.
Our international operations expose us to regulatory, economic, political and social risks in the countries in which we operate.
The international nature of our operations involves a number of risks, including changes in US and foreign regulations, tariffs, taxes and exchange controls, economic downturns, inflation and political and social instability in the countries in which we operate and our dependence on foreign personnel. Foreign regulations may also restrict our ability to operate in some countries, acquire new businesses, recur bill our customers or repatriate cash from foreign subsidiaries back to the United States. We cannot be certain that we will be able to enter and successfully compete in additional foreign markets or that we will be able to continue to compete in the foreign markets in which we currently operate.
We are exposed to foreign currency risks from our international operations that could adversely affect our financial results.
A significant portion of our revenues and operating costs are denominated in foreign currencies. We are therefore exposed to fluctuations in the exchange rates between the US dollar and the currencies in which our foreign operations receive revenues and pay expenses. We do not currently hedge, and have not historically hedged, our operational exposure to foreign currency fluctuations. Our consolidated financial results are presented in US dollars and therefore, during times of a strengthening US dollar, our reported international revenues and earnings will be reduced because the local currency will translate into fewer US dollars. In addition, the assets and liabilities of our non-US subsidiaries are translated into US dollars at the exchange rates in effect at the balance sheet date. Revenues and expenses are translated into US dollars at the average exchange rate for the period. Translation adjustments arising from the use of differing exchange rates from period to period are
17
Table of Contents
recorded in shareholders’ equity as accumulated other comprehensive income (loss). Translation adjustments arising from intercompany receivables and payables with our foreign subsidiaries are generally recorded as a component of other expense (income). Accordingly, changes in currency exchange rates will cause our revenues, operating costs, net income and shareholders’ equity to fluctuate. For example, these changes had a negative impact on our fiscal 2015 financial results.
Our business may decline as a result of a downturn in general economic conditions or consumer confidence.
Our business is highly dependent on meeting fees, Online product subscriptions and product sales. A downturn in general economic conditions or consumer confidence in any of our major markets could result in people curtailing or reallocating their discretionary spending which, in turn, could reduce attendance at our meetings, Online product subscriptions and product sales. Any reduction in consumer spending may adversely affect our business, financial condition or results of operations.
We may not successfully make acquisitions or enter into joint ventures and we may not successfully integrate, operate or realize the anticipated benefits of such businesses.
As part of our strategic initiatives, we may pursue selected acquisitions or joint ventures. We may not be able to effect these transactions on commercially reasonable terms or at all. Any future acquisitions or joint ventures may require access to additional capital, and we may not have access to such capital on commercially reasonable terms or at all. Even if we enter into these transactions, we may not realize the benefits we anticipate or we may experience difficulties in integrating any acquired companies, technologies and products into our existing business or in providing our services and products in newly acquired markets; attrition of key personnel from acquired businesses; significant charges or expenses; higher costs of integration than we anticipated; or unforeseen operating difficulties that require significant financial and managerial resources that would otherwise be available for the ongoing development or expansion of our existing operations.
Our ability to influence the control of, or distributions from, our joint ventures may be limited by contract or otherwise. If any of the other investors in one of our joint ventures fails to observe its commitments, or its interests are different than ours, the joint venture may not be able to operate according to its business plan, we may be required to increase our level of commitment, or such entities may take actions which are not in our best interest. If we are unable to maintain our relationships with our joint venture partners, we could lose our ability to operate in the geographies and/or markets in which they operate, which could have an adverse effect on our business, financial condition or results of operations.
Consummating these transactions could also result in the incurrence of additional debt and related interest expense, as well as unforeseen contingent liabilities, all of which could have an adverse effect on our business, financial condition or results of operations. We may also issue additional equity in connection with these transactions, which would dilute our existing shareholders.
The seasonal nature of our business could cause our operating results to fluctuate.
We have experienced and expect to continue to experience fluctuations in our quarterly results of operations due to the seasonal nature of our business. The first quarter of the fiscal year typically results in the greatest revenue due to the importance of the winter season to our overall recruitment environment. In addition, given the subscription nature of our products, failure to realize recruitments during the winter season could negatively impact our performance for the remainder of the year. This seasonality could cause our share price to fluctuate as the results of an interim financial period may not be indicative of our full year results. Seasonality also impacts relative revenue and profitability of each quarter of the year, both on a quarter-to-quarter and year-over-year basis.
18
Table of Contents
Any event that discourages or impedes people from gathering with others or accessing resources could adversely affect our business.
Our meetings and Online businesses are subject to conditions beyond our control that may prevent or impede current or prospective members from attending or joining meetings, or subscribers from accessing our Online products, including extreme weather, terrorism, health epidemics, loss of resources such as electricity, national disasters and other extraordinary events. The occurrence of any event that discourages people from gathering with others or impedes their ability to access resources could adversely affect our business, financial condition or results of operations.
Third parties may infringe on our brand and other intellectual property rights, which may have an adverse impact on our business.
We currently rely on a combination of trademark, copyright, trade dress, trade secret, patent and other intellectual property laws and domain name dispute resolution systems to establish and protect our proprietary rights, including our brand. If we fail to successfully enforce our intellectual property rights, the value of our brand, services and products could be diminished and our business may suffer. Our precautions may not prevent misappropriation of our intellectual property, particularly in foreign countries where laws or law enforcement practices may not protect our proprietary rights as fully as in the United States. Any legal action that we may bring to protect our brand and other intellectual property could be unsuccessful and expensive and could divert management’s attention from other business concerns. In addition, legal standards relating to the validity, enforceability and scope of protection of intellectual property, especially in Internet-related businesses, are uncertain and evolving. These evolving legal standards may not sufficiently protect our intellectual property rights in the future.
We may be subject to intellectual property rights claims.
Third parties may make claims against us alleging infringement of their intellectual property rights. Any intellectual property claims, regardless of merit, could be time-consuming and expensive to litigate or settle and could significantly divert management’s attention from other business concerns. In addition, if we were unable to successfully defend against such claims, we may have to pay damages, stop selling the service or product or stop using the software, technology or content found to be in violation of a third party’s rights, seek a license for the infringing service, product, software, technology or content or develop alternative non-infringing services, products, software, technology or content. If we cannot license on reasonable terms, develop alternatives or stop using the service, product, software, technology or content for any infringing aspects of our business, we may be forced to limit our service and product offerings. Any of these results could reduce our revenues or our ability to compete effectively, increase our costs or harm our business.
Outcomes of litigation or regulatory actions could adversely impact our financial condition.
From time to time, we may be a party to lawsuits and regulatory actions relating to our business operations. For example, in the past, we have had disputes with our franchisees regarding operations and other contractual issues. Due to the inherent uncertainties of legal actions and regulatory proceedings, we cannot predict their outcomes with certainty. Therefore, it is possible that our results of operations, financial condition or cash flows could be adversely affected by the unfavorable resolution of one or more legal or regulatory actions. As we expand our offerings in certain healthcare channels, consumers may misconstrue our program as providing medical advice. As we clearly state in our consumer communications, most of our service providers do not have extensive training or certification in nutrition, diet or health fields beyond the training they receive from us. Despite our disclaimers, as more customers come to us through the healthcare channel they may misperceive that our service providers are providing medical advice regarding weight loss and related topics. We may also be subject to claims that our service providers have provided inappropriate advice or have inappropriately referred or failed to refer customers to health care providers when needed. Regardless of the outcome of any legal action
19
Table of Contents
or regulatory proceeding, such actions and proceedings could result in substantial costs and may require that our management devote substantial time and resources to defend us. For example, the previously disclosed adverse UK tax ruling relating to the self-employment status of our UK leaders resulted in an aggregate adverse charge of approximately $37.0 million.
Our businesses are subject to legislative and regulatory restrictions.
A number of laws and regulations govern our advertising, services, products, operations and relations with consumers, licensees, franchisees, employees and other service providers, and government authorities in the countries in which we operate.
Certain federal, state and foreign agencies, such as the FTC and FDA, regulate and enforce such laws and regulations relating to advertising, promotions, packaging, privacy, consumer pricing and billing arrangements, and other consumer protection matters. A determination by a federal, state or foreign agency, or a court in connection with a governmental enforcement action or private litigation, that any of our practices do not meet existing or new laws or regulations could result in liability, adverse publicity, and restrictions of our business operations. For example, during the mid-1990s, the FTC filed complaints against a number of commercial weight management providers alleging violations of federal law in connection with the use of advertisements that featured testimonials, claims for program success and program costs. In 1997, we entered into a consent order with the FTC settling all contested issues raised in the complaint filed against us. The consent order requires us to comply with certain procedures and disclosures in connection with our advertisements of services and products.
We are subject to many distinct employment, labor, commercial, benefits and tax laws and regulations in each country in which we operate, including regulations affecting our employment and wage and hour practices and our relations with our employees and service providers. If we are required to comply with new laws or regulations or interpretations of existing laws and regulations that differ from our interpretations, are unable to comply with these laws, regulations or interpretations, or are subject to litigation with respect to these laws, regulations or interpretations, our business and results of operations could be adversely affected.
Laws and regulations directly applicable to communications, operations or commerce over the Internet such as those governing intellectual property, privacy and taxation, are more prevalent and continue to evolve. If we are required to comply with new laws or regulations or interpretations of existing laws or regulations that differ from our interpretations, or if we are unable to comply with these laws, regulations or interpretations, our business and results of operations could be adversely affected.
Future laws or regulations, including laws or regulations affecting our advertising and marketing practices, consumer pricing and billing arrangements, relations with consumers, employees, service providers, licensees or franchisees, or our services and products, may have an adverse impact on us.
If we do not maintain effective internal control over financial reporting, we could fail to report our financial results accurately.
Effective internal control over financial reporting is necessary for us to provide reliable financial reports. In the past we have discovered, and in the future we may discover, areas of our internal control over financial reporting that need improvement. In the future, if we identify a control deficiency that rises to the level of a material weakness in our internal controls over financial reporting, this material weakness may adversely affect our ability to record, process, summarize and report financial information timely and accurately and, as a result, our financial statements may contain material misstatements or omissions. A material weakness is defined as a deficiency, or a combination of deficiencies, in internal control over financial reporting, such that there is reasonable possibility that a material misstatement of the annual or interim financial statements will not be prevented or detected on a timely basis.
20
Table of Contents
Artal effectively controls us and may have conflicts of interest with other shareholders in the future.
Artal effectively controls us and is effectively able to control the election and removal of our directors and determine our corporate and management policies, including potential mergers or acquisitions, payment of dividends, asset sales, the amendment of our articles of incorporation or bylaws and other significant corporate transactions. This concentration of our ownership may delay or deter possible changes in control of our company, which may reduce the value of an investment in our common stock. So long as Artal owns 10% or more of our common stock, Artal will have the right pursuant to an agreement with us to nominate directors to our Board of Directors in proportion to its stock ownership. In addition, Artal Luxembourg entered into a Voting Agreement with Ms. Winfrey on October 18, 2015, pursuant to which Ms. Winfrey has agreed to vote all of her shares of our common stock so as to elect such individuals designated as directors by Artal. The interests of Artal may not coincide with the interests of other holders of our common stock.
We are a “controlled company” within the meaning of the New York Stock Exchange rules and, as a result, qualify for exemptions from certain corporate governance requirements.
A group comprised of Artal and Ms. Winfrey controls a majority of the voting power of our outstanding common stock. Under the New York Stock Exchange, or the NYSE, rules, a listed company of which more than 50% of the voting power for the election of directors is held by another person or group of persons acting together is a “controlled company” and such a company may elect not to comply with certain NYSE corporate governance requirements, including (1) the requirement that a majority of the Board of Directors consist of independent directors, (2) the requirement that the nominating and corporate governance committee be composed entirely of independent directors with a written charter addressing the committee’s purpose and responsibilities, (3) the requirement that the compensation committee be composed entirely of independent directors with a written charter addressing the committee’s purpose and responsibilities, (4) that the compensation committee be required to consider certain independence factors when engaging compensation consultants, legal counsel and other committee advisors and (5) the requirement for an annual performance evaluation of the nominating and corporate governance and compensation committees. We have elected to be treated as a “controlled company.” Accordingly, our shareholders may not have the same protections afforded to shareholders of companies that are subject to all of the NYSE corporate governance requirements.
Our articles of incorporation and bylaws and Virginia corporate law contain provisions that may discourage a takeover attempt.
Provisions contained in our articles of incorporation and bylaws and the laws of Virginia, the state in which we are incorporated, could make it more difficult for a third party to acquire us, even if doing so might be beneficial to our shareholders. Provisions of our articles of incorporation and bylaws impose various procedural and other requirements, which could make it more difficult for shareholders to effect certain corporate actions. For example, our articles of incorporation authorize our Board of Directors to determine the rights, preferences, privileges and restrictions of unissued series of preferred stock, without any vote or action by our shareholders. Thus, our Board of Directors can authorize and issue shares of preferred stock with voting or conversion rights that could adversely affect the voting or other rights of holders of our common stock. These rights may have the effect of delaying or deterring a change of control of our company. In addition, a change of control of our company may be delayed or deterred as a result of our having three classes of directors. These provisions could limit the price that certain investors might be willing to pay in the future for shares of our common stock.
| Item 1B. | Unresolved Staff Comments |
None.
21
Table of Contents
| Item 2. | Properties |
We are currently headquartered in New York, New York in leased office space with our US back-office and customer support operations located in leased office spaces elsewhere in the United States. Each of our foreign country operations generally also has leased office space to support its operations. Our meetings are typically held in third-party locations (usually meeting rooms in well-located civic or other community centers) or space leased in retail centers.
Our website and digital products and services are hosted on hardware and software co-located at a third-party facility in New York and by third-party cloud service providers with facilities in various locations around the United States. We also maintain a disaster recovery site with hardware and software co-located at a third-party facility in Arizona.
| Item 3. | Legal Proceedings |
In re Weight Watchers International, Inc. Securities Litigation
In March 2014, two substantially identical putative class action complaints alleging violation of the federal securities laws were filed by individual shareholders against the Company, certain of the Company’s current and former officers and directors, and Artal Group, in the United States District Court for the Southern District of New York. The complaints were purportedly filed on behalf of all purchasers of the Company’s common stock, no par value per share, between February 14, 2012 and October 30, 2013, inclusive (referred to herein as the Class Period). The complaints allege that, during the Class Period, the defendants disseminated materially false and misleading statements and/or concealed material adverse facts. The complaints allege claims under Sections 10(b) and 20(a) of the Securities Exchange Act of 1934, as amended, and Rule 10b-5 thereunder. The plaintiffs seek to recover unspecified damages on behalf of the class members. In June 2014, the Court consolidated the cases and appointed lead plaintiffs and lead counsel. On August 12, 2014, the plaintiffs filed an amended complaint that, among other things, reduced the Class Period to between February 14, 2012 and February 13, 2013 and dropped all current officers and certain directors previously named as defendants. On October 14, 2014, the defendants filed a motion to dismiss. The plaintiffs filed an opposition to the defendants’ motion to dismiss on November 24, 2014 and the defendants filed a reply in support of their motion to dismiss on December 23, 2014. The Company continues to believe that the suits are without merit and intends to defend them vigorously.
Tracey Mead, Derivatively on Behalf of Weight Watchers International, Inc. vs. Artal Group et. al. and Weight Watchers International, Inc.
On May 29, 2014 and June 23, 2014, the Company received shareholder litigation demand letters alleging breaches of fiduciary duties and unjust enrichment by Company officers and directors and Artal, to the alleged injury of the Company. The allegations in the letters relate to those contained in the ongoing federal securities litigation described above. In response to the letters, pursuant to Virginia law, the Board of Directors has created a special committee to review and evaluate the facts and circumstances surrounding the claims made in the demand letters. The special committee has decided to undertake its review after receiving a decision on defendants’ motion to dismiss in the federal securities litigation given the overlapping issues.
On August 11, 2015, a purported shareholder derivative lawsuit was filed in New York State Court in Westchester County. The complaint alleges that certain Company directors and executive officers breached their various fiduciary duties by knowingly causing the Company to repurchase shares from Artal and from certain executive officers at artificially inflated prices in connection with a tender offer made to all shareholders. The complaint seeks an order for the defendants to disgorge all profits made from selling Company stock between March 16, 2012 and April 9, 2012, as well as an award for damages sustained by the alleged breaches of fiduciary duty. The parties sought to stay this suit pending a decision on defendants’ motion to dismiss in the federal securities litigation asserting similar allegations. The Court denied the stay, but at the preliminary court conference on December 17, 2015, the Court granted an adjournment and scheduled the next court conference for April 29, 2016. The Company believes that the suit is without merit and intends to defend it vigorously.
22
Table of Contents
Raymond Roberts v. Weight Watchers International, Inc.
On January 7, 2016, an OnlinePlus member filed a putative class action complaint against the Company in the Supreme Court of New York, New York County, asserting class claims for breach of contract and violations of the New York General Business Law.
On February 5, 2016, the Company removed the case to the United States District Court, Sothern District of New York. Specifically, the plaintiff is asserting that, as a result of the temporary glitches in the Company’s website and app in November and December 2015, the Company has: (1) breached its Subscription Agreement with its OnlinePlus members; and (2) engaged in misleading advertising and deceptive acts and practices in violation of Sections 349 and 350 of the New York General Business Law. The plaintiff is seeking unspecified actual, punitive and statutory damages, as well as his attorneys’ fees and costs incurred in connection with this action. The Company believes that the suit is without merit and intends to defend it vigorously.
Other Litigation Matters
Due to the nature of the Company’s activities, it is also, at times, subject to pending and threatened legal actions, including patent and other intellectual property actions, that arise out of the ordinary course of business. In the opinion of management, the disposition of any such matters is not expected to have a material effect on the Company’s results of operations, financial condition or cash flows. However, the results of legal actions cannot be predicted with certainty. Therefore, it is possible that the Company’s results of operations, financial condition or cash flows could be materially adversely affected in any particular period by the unfavorable resolution of one or more legal actions.
| Item 4. | Mine Safety Disclosures |
Not applicable.
23
Table of Contents
EXECUTIVE OFFICERS AND DIRECTORS OF THE COMPANY
Pursuant to General Instruction G(3) to Form 10-K, certain of the information regarding our directors and executive officers required by Items 401(a), (b) and (e) of Regulation S-K is hereby included in Part I of this Annual Report on Form 10-K.
Set forth below are the names, ages as of January 2, 2016 and current positions of our executive officers and directors. Directors are elected at the annual meeting of shareholders. Executive officers are appointed by, and hold office at, the discretion of our Board of Directors.
| Name |
Age | Position | ||||
| James R. Chambers |
58 | President and Chief Executive Officer, Director | ||||
| Michael F. Colosi |
50 | General Counsel and Secretary | ||||
| Nicholas P. Hotchkin |
50 | Chief Financial Officer | ||||
| Jeanine Lemmens(1) |
45 | President, United Kingdom | ||||
| Corinne Pollier(-Bousquet) |
51 | President, International | ||||
| Raymond Debbane(2) |
60 | Chairman of the Board of Directors | ||||
| Steven M. Altschuler, M.D.(2)(3) |
62 | Director | ||||
| Philippe J. Amouyal(2) |
57 | Director | ||||
| Cynthia Elkins(3) |
50 | Director | ||||
| Jonas M. Fajgenbaum |
43 | Director | ||||
| Denis F. Kelly(3) |
66 | Director | ||||
| Sacha Lainovic |
59 | Director | ||||
| Christopher J. Sobecki |
57 | Director | ||||
| Oprah Winfrey |
61 | Director | ||||
| (1) | We recently announced that Ms. Lemmens will leave the Company in April 2016. |
| (2) | Member of Compensation Committee. |
| (3) | Member of Audit Committee. |
James R. Chambers. Mr. Chambers has served as a director and our President and Chief Executive Officer since July 2013. He served as our President and Chief Operating Officer from January 2013 to July 2013. Prior to joining us, Mr. Chambers served as President of the U.S. Snacks and Confectionary business unit and General Manager of the Immediate Consumption Channel of Kraft Foods Inc., a global food and beverage company, from January 2010 to July 2011. Prior to joining Kraft, Mr. Chambers held various positions in the North America business unit at Cadbury plc, a beverage and confectionary company, from September 2005 to January 2010, most recently as the President and Chief Executive Officer. Mr. Chambers began his career at Nabisco, Inc. and also held various executive positions with Rémy Cointreau USA, Paxonix Inc., NetGrocer.com, Inc. and Information Resources, Inc. Mr. Chambers received a Bachelor’s degree in Civil Engineering from Princeton University and an M.B.A. from the Wharton School of Business of the University of Pennsylvania. Mr. Chambers is a director of Big Lots, Inc.
Michael F. Colosi. Mr. Colosi has served as our General Counsel and Secretary since May 2014. Prior to joining us, Mr. Colosi most recently served as Senior Vice President, General Counsel and Corporate Secretary of Kenneth Cole Productions, Inc. (KCP), a multi-brand retail, wholesale and licensing company, from March 2007 to February 2014. His service as General Counsel and Secretary of KCP commenced in July 2000 and July 2004, respectively. He also served as Corporate Vice President of KCP from July 2000 to February 2007. Prior to joining KCP, Mr. Colosi was Associate General Counsel and Assistant Secretary for The Warnaco Group, Inc., an international apparel company, from 1996 to 2000. Mr. Colosi received a Bachelor of Arts in Economics and English from Cornell University and a Juris Doctor from The University of Michigan Law School.
Nicholas P. Hotchkin. Mr. Hotchkin has served as our Chief Financial Officer since August 2012. Prior to joining us, Mr. Hotchkin had spent several years at Staples, Inc., a global leader in the office supply industry. Most recently, Mr. Hotchkin served as Senior Vice President of Finance for the U.S. Retail division of Staples
24
Table of Contents
based in Massachusetts, a position he held from May 2010 to August 2012. Before assuming that position, he had been Senior Vice President of Finance and Treasurer of Staples, a position he held from November 2006 to April 2010. Prior to joining Staples, Mr. Hotchkin held several corporate finance positions with Delphi Corporation and General Motors Corporation including assignments in the United States, Asia and Europe. Mr. Hotchkin received a B.A. in Economics from Harvard College and an M.B.A. from the Harvard Business School.
Jeanine Lemmens. Ms. Lemmens has served as our President, United Kingdom since May 2013. Prior to that time, Ms. Lemmens served as our Managing Director, Benelux from July 2006 to May 2013. Prior to joining us, beginning in December 1999, Ms. Lemmens held various senior management and strategic positions with Center Parcs Europe, an operator of European short holiday break villages, including most recently serving as the Director B2B Strategy / Marketing from November 2005 to July 2006. Prior to joining Center Parcs Europe, Ms. Lemmens was working as an accountant in the audit practice with Ernst & Young LLP where she serviced a range of clients including many commercial clients. Ms. Lemmens holds a Certified Public Accountant degree from Erasmus University in the Netherlands, an M.S. in Business Administration from Nyenrode Business University in the Netherlands and a Bachelors of Art degree in Hospitality Management from Hotel School, The Hague, Hospitality Business School in the Netherlands.
Corinne Pollier(-Bousquet). Ms. Pollier has served as our President, International since March 1, 2016. Prior to that time, Ms. Pollier served as our President, Continental Europe & Australia–New Zealand from January 2014 to March 2016, our President, Continental Europe from May 2013 to January 2014, our Senior Vice President of France and Switzerland from October 2008 to May 2013 and our General Manager of France from October 2003 to October 2008. Prior to joining us, from 1991 to 2003, Ms. Pollier was with VIVARTE Group (France), a European retailer of footwear and apparel, where she held various positions in the finance and planning analysis department from 1991 to 1995, various senior positions in the organization and strategy department from 1995 to 2000 and as General Manager of Kookai from 2001 to 2003. Ms. Pollier also held various product management and project management positions for the central buying office of Le Printemps department stores from 1987 to 1991. Ms. Pollier is a graduate of HEC Business School Paris.
Raymond Debbane. Mr. Debbane has been the Chairman of our Board of Directors since our acquisition by Artal Luxembourg S.A. on September 29, 1999. Mr. Debbane is a co-founder and the Chief Executive Officer of The Invus Group, LLC. Prior to forming The Invus Group, LLC in 1985, Mr. Debbane was a manager and consultant for The Boston Consulting Group in Paris, France. He holds an M.B.A. from Stanford Graduate School of Business, an M.S. in Food Science and Technology from the University of California, Davis and a B.S. in Agricultural Sciences and Agricultural Engineering from American University of Beirut. Mr. Debbane is the Chairman of the Board of Directors of Lexicon Pharmaceuticals, Inc., and a director of Blue Buffalo Pet Products, Inc. He is also the Chief Executive Officer and a director of Artal Group S.A. and the Chairman of the Board of Directors of a number of private companies of which Artal or Invus, L.P. are shareholders. Mr. Debbane was previously a director of Ceres, Inc.
Steven M. Altschuler, M.D. Dr. Altschuler has been a director since September 2012. Dr. Altschuler has served as the Chief Executive Officer of the University of Miami Health System and Senior Vice President for Healthcare at the University of Miami since January 2016. He previously served as the Chief Executive Officer of The Children’s Hospital of Philadelphia (CHOP), one of the leading children’s hospitals in the United States, from April 2000 until June 2015. Prior to assuming the role of Chief Executive Officer, Dr. Altschuler held several positions at CHOP, including Physician-in-Chief and chief of the Division of Gastroenterology, Hepatology and Nutrition. Prior to joining CHOP, Dr. Altschuler was faculty member and chair of the Department of Pediatrics at the Perelman School of Medicine at the University of Pennsylvania. Dr. Altschuler received a B.A. in mathematics and an M.D. from Case Western Reserve University. Dr. Altschuler is a director of Mead Johnson Nutrition Company, where he is the Chair of the Compensation and Management Development Committee and serves on the Nutrition Science and Technology Committee. Dr. Altschuler is also the Chair of the Board of Directors of Spark Therapeutics, Inc.
25
Table of Contents
Philippe J. Amouyal. Mr. Amouyal has been a director since November 2002. Mr. Amouyal is a Managing Director of The Invus Group, LLC, a position he has held since 1999. Previously, Mr. Amouyal was a Vice President and director of The Boston Consulting Group in Boston, MA. He holds an M.S. in Engineering and a DEA in Management from Ecole Centrale de Paris and was a Research Fellow at the Center for Policy Alternatives of the Massachusetts Institute of Technology. Mr. Amouyal is a director and member of the Compensation Committee of Lexicon Pharmaceuticals, Inc. and Blue Buffalo Pet Products, Inc., as well as a number of private companies of which Artal or Invus, L.P. are shareholders.
Cynthia Elkins. Ms. Elkins has been a director since March 2014. Since March 2011, Ms. Elkins has served as the Vice President of IT Americas at Genentech, Inc., a member of the Roche Group, a leading biotechnology company. She previously served as Genentech’s Senior Director of IT Enterprise Applications from December 2007 to February 2011. Prior to joining Genentech, Ms. Elkins was Vice President of Supplier Solutions and Commerce Services at Ariba, Inc. and Vice President of Product Engineering at ATP Inc. Prior to that, she held various IT positions at Aspect Telecommunications, VeriFone and Digital Equipment Corporation. Ms. Elkins received a B.S. in Applied Mathematics from the University of California, Los Angeles and an M.B.A. from Santa Clara University.
Jonas M. Fajgenbaum. Mr. Fajgenbaum has been a director since our acquisition by Artal Luxembourg S.A. on September 29, 1999. Mr. Fajgenbaum is a Managing Director of The Invus Group, LLC, which he joined in 1996. Prior to joining The Invus Group, LLC, Mr. Fajgenbaum was a consultant for McKinsey & Company in New York from 1994 to 1996. He graduated with a B.S. in Economics with a concentration in Finance from The Wharton School of the University of Pennsylvania and a B.A. in Economics from the University of Pennsylvania. Mr. Fajgenbaum is a director of a number of private companies of which Artal or Invus, L.P. are shareholders.
Denis F. Kelly. Mr. Kelly has been a director since May 2015. Mr. Kelly is a Partner, and served as a Managing Partner, of Scura Paley Securities LLC, a private investment banking firm which he co-founded, since 2001. From 1993 to 2001, he was a Managing Director of Prudential Securities Incorporated. Previously, he served as the President and Chief Executive Officer of Denbrook Capital Corporation, a merchant banking firm, from 1991 to 1993. From 1980 to 1991, Mr. Kelly held various positions at Merrill Lynch, including Managing Director of Mergers and Acquisitions and Managing Director of Merchant Banking. Mr. Kelly began his investment banking career at Lehman Brothers in 1974. Mr. Kelly received a B.A. from Amherst College and an M.B.A. from the Wharton School of Business of the University of Pennsylvania. Mr. Kelly is also a director of MSC Industrial Direct Co., Inc., where he serves as a member of the Audit Committee and the chairman of the Compensation Committee. Mr. Kelly previously served as a director of Kenneth Cole Productions, Inc., which is no longer a public company.
Sacha Lainovic. Mr. Lainovic has been a director since our acquisition by Artal Luxembourg S.A. on September 29, 1999. Since 2007, Mr. Lainovic has been Managing Partner of Invus Financial Advisors, LLC, a New York-based investment firm, which he co-founded. From 1985 to 2006, Mr. Lainovic was Executive Vice President of The Invus Group, LLC, which he co-founded. Prior to forming The Invus Group, LLC in 1985, Mr. Lainovic was a manager and consultant for The Boston Consulting Group in Paris, France. He holds an M.B.A. from Stanford Graduate School of Business and an M.S. in Engineering from Insa de Lyon in Lyon, France.
Christopher J. Sobecki. Mr. Sobecki has been a director since our acquisition by Artal Luxembourg S.A. on September 29, 1999. Mr. Sobecki is a Managing Director of The Invus Group, LLC, which he joined in 1989. He received an M.B.A. from Harvard Business School. He also obtained a B.S. in Industrial Engineering from Purdue University. Mr. Sobecki is a director of Lexicon Pharmaceuticals, Inc. and a number of private companies of which Artal or Invus, L.P. are shareholders.
26
Table of Contents
Oprah Winfrey. Ms. Winfrey has been a director since October 2015. Since January 2009, Ms. Winfrey has served as the Chairman of her cable network, OWN: Oprah Winfrey Network, taking on the role of CEO in July 2011. Previously, she founded Harpo, Inc. in 1986, under which she has launched numerous media and entertainment businesses, including O, The Oprah Magazine and Harpo Films, in addition to producing the award-winning talk show “The Oprah Winfrey Show” for 25 years. Ms. Winfrey is a global media leader, philanthropist, producer and actress. She also has been serving as a member of the Smithsonian’s advisory council since 2004.
27
Table of Contents
| Item 5. | Market for Registrant’s Common Equity, Related Shareholder Matters and Issuer Purchases of Equity Securities |
Our common stock is listed on the NYSE. Our common stock trades on the NYSE under the symbol “WTW.”
The following table sets forth, for the periods indicated, the high and low sales prices per share for our common stock as reported on the NYSE composite price history.
Fiscal 2015 (Year ended January 2, 2016)
| High | Low | |||||||
| First Quarter |
$ | 21.53 | $ | 6.71 | ||||
| Second Quarter |
$ | 8.93 | $ | 4.06 | ||||
| Third Quarter |
$ | 7.14 | $ | 3.67 | ||||
| Fourth Quarter |
$ | 28.05 | $ | 6.01 | ||||
Fiscal 2014 (Year ended January 3, 2015)
| High | Low | |||||||
| First Quarter |
$ | 33.43 | $ | 19.50 | ||||
| Second Quarter |
$ | 25.15 | $ | 19.52 | ||||
| Third Quarter |
$ | 27.90 | $ | 19.09 | ||||
| Fourth Quarter |
$ | 29.84 | $ | 21.21 | ||||
On October 9, 2003, our Board of Directors authorized, and we announced, a program to repurchase up to $250.0 million of our outstanding common stock. On each of June 13, 2005, May 25, 2006 and October 21, 2010, our Board of Directors authorized, and we announced, adding $250.0 million to this program. The repurchase program allows for shares to be purchased from time to time in the open market or through privately negotiated transactions. No shares will be purchased from Artal Holdings Sp. z o.o., Succursale de Luxembourg, or Artal Holdings, and its parents and subsidiaries under this program. The repurchase program currently has no expiration date. We repurchased no shares of our common stock during the fourth quarter of fiscal 2015. As of the end of fiscal 2015, $208.9 million remained available to purchase shares of our common stock under the repurchase program.
Holders
The approximate number of holders of record of our common stock as of February 1, 2016 was 287. This number does not include beneficial owners of our securities held in the name of nominees.
Dividends
On October 30, 2013, we announced that we suspended our quarterly cash dividend. Prior to the suspension, we had been issuing a quarterly cash dividend of $0.175 per share of our common stock every quarter for several fiscal years. We currently intend to use the annual cash savings from such dividend suspension to preserve financial flexibility while funding our strategic growth initiatives and building cash for future debt repayments. Any future determination to declare and pay dividends will be made at the discretion of our Board of Directors, after taking into account our financial results, capital requirements and other factors it may deem relevant. The WWI Credit Facility (as defined below) also contains restrictions on our ability to pay dividends on our common
28
Table of Contents
stock. See “Item 7. Management’s Discussion and Analysis of Financial Condition and Results of Operations—Liquidity and Capital Resources—Long-Term Debt” in Part II, and “Item 15. Exhibits and Financial Statement Schedules—Financial Statements—Note 7. Long-Term Debt”, of this Annual Report on Form 10-K for a description of the WWI Credit Facility.
Stock Performance Graph
The following graph sets forth the cumulative return on our common stock from December 31, 2010, the last trading day of our 2010 fiscal year, through December 31, 2015, the last trading day of our 2015 fiscal year, as compared to the cumulative return of the Standard & Poor’s 500 Index, or the S&P 500 Index, and the cumulative return of the Standard & Poor’s MidCap 400 Index, or the S&P MidCap 400 Index. We selected the S&P 500 Index because it is a broad index of equity markets. We selected the S&P MidCap 400 Index, which is generally comprised of issuers having a similar market capitalization with the Company at the times presented, because we believe that there are no other lines of business or published industry indices or peer groups that provide a more meaningful comparison of the cumulative return of our stock. The graph assumes that $100 was invested on December 31, 2010 in each of (1) our common stock, (2) the S&P 500 Index and (3) the S&P MidCap 400 Index, and that all dividends were reinvested.
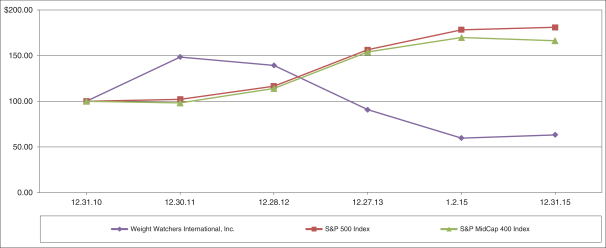
| Cumulative Total Return ($) | ||||||||||||||||||||||||
| Company/Index |
12.31.10 | 12.30.11 | 12.28.12 | 12.27.13 | 1.2.15 | 12.31.15 | ||||||||||||||||||
| Weight Watchers International, Inc. |
100.00 | 148.40 | 139.18 | 90.61 | 59.62 | 63.14 | ||||||||||||||||||
| S&P 500 Index |
100.00 | 102.11 | 116.48 | 156.21 | 178.25 | 180.75 | ||||||||||||||||||
| S&P MidCap 400 Index |
100.00 | 98.27 | 114.01 | 153.89 | 169.62 | 166.06 | ||||||||||||||||||
29
Table of Contents
| Item 6. | Selected Financial Data |
The following schedule sets forth our selected financial data for the last five fiscal years.
SELECTED FINANCIAL DATA
(in millions, except per share amounts)
| Fiscal 2015 (52 weeks) |
Fiscal 2014 (53 weeks) |
Fiscal 2013 (52 weeks) |
Fiscal 2012 (52 weeks) |
Fiscal 2011 (52 weeks) |
||||||||||||||||
| Revenues, net |
$ | 1,164.4 | $ | 1,479.9 | $ | 1,724.1 | $ | 1,839.4 | $ | 1,832.5 | ||||||||||
| Net income attributable to the Company |
$ | 32.9 | $ | 117.8 | $ | 202.7 | $ | 257.4 | $ | 304.9 | ||||||||||
| Working capital deficit |
$ | (144.2 | ) | $ | (6.0 | ) | $ | (30.1 | ) | $ | (229.9 | ) | $ | (279.7 | ) | |||||
| Total assets |
$ | 1,422.1 | $ | 1,534.6 | $ | 1,405.9 | $ | 1,218.6 | $ | 1,121.6 | ||||||||||
| Long-term debt |
$ | 2,021.3 | $ | 2,277.3 | $ | 2,358.0 | $ | 2,291.7 | $ | 926.9 | ||||||||||
| Earnings per share: |
||||||||||||||||||||
| Basic |
$ | 0.56 | $ | 2.08 | $ | 3.61 | $ | 4.27 | $ | 4.16 | ||||||||||
|
|
|
|
|
|
|
|
|
|
|
|||||||||||
| Diluted |
$ | 0.56 | $ | 2.08 | $ | 3.60 | $ | 4.23 | $ | 4.11 | ||||||||||
|
|
|
|
|
|
|
|
|
|
|
|||||||||||
| Dividends declared per common share |
$ | — | $ | — | $ | 0.53 | $ | 0.70 | $ | 0.70 | ||||||||||
|
|
|
|
|
|
|
|
|
|
|
|||||||||||
Items Affecting Comparability
Several events occurred during each of the last five fiscal years that affect the comparability of our financial statements. The nature of these events and their impact on underlying business trends are as follows:
Winfrey Transaction
On October 19, 2015, pursuant to the Winfrey Purchase Agreement, we issued and sold to Ms. Winfrey an aggregate of 6.4 million shares of our common stock for an aggregate cash purchase price of $43.2 million.
In consideration of Ms. Winfrey entering into the Strategic Collaboration Agreement and the performance of her obligations thereunder, on October 18, 2015, we granted Ms. Winfrey the Winfrey Option to purchase 3.5 million shares of our common stock at an exercise price of $6.97 per share.
In fiscal 2015, net income and earnings per fully diluted share, or EPS, were negatively impacted by expenses of $8.3 million after tax or $0.14 per fully diluted share in connection with the Winfrey Transaction. More specifically, we recorded compensation expense of $7.8 million after tax for the full value of the Winfrey Option in the fourth quarter of fiscal 2015 (based on the Black Scholes option pricing model), as well as $0.5 million after tax of expenses for legal, compliance and other fees in connection with the Winfrey Transaction. See “Item 1. Business—History—Winfrey Transaction” for additional details on the Winfrey Transaction.
Restructuring Charges
In fiscal 2015 and fiscal 2014, we recorded $8.4 million ($5.1 million after tax or $0.09 per fully diluted share) and $11.8 million ($7.2 million after tax or $0.13 per fully diluted share) of charges, respectively, associated with the restructuring of our organization.
Early Extinguishment of Debt
Net income and EPS for the full year of fiscal 2015 were impacted by an $11.4 million ($7.0 million after tax), or $0.12 per fully diluted share, gain on early extinguishment of debt in connection with the payment of an aggregate amount of cash proceeds totaling $134.6 million plus an amount sufficient to pay accrued and unpaid
30
Table of Contents
interest on the amount prepaid to prepay $148.0 million in aggregate principal amount of term loans under the Tranche B-1 Term Facility (defined hereafter).
Net income and EPS for the full year of fiscal 2013 were impacted by a $21.7 million ($13.3 million after
tax), or $0.24 per fully diluted share, early extinguishment of debt charge recorded in fiscal 2013 resulting from the write-off of fees in connection with our April 2013 debt refinancing.
Net Tax Benefit
In fiscal 2014, we recognized a $2.4 million net tax benefit related to an intercompany loan write-off in connection with the closure of our China business partially offset by the recognition of a valuation allowance related to tax benefits for foreign losses that are not expected to be realized.
UK Self-Employment Matter
We received an adverse tax ruling in the United Kingdom that our UK leaders should have been classified as employees for UK tax purposes and, as such, we should have withheld tax from our leaders pursuant to the “Pay As You Earn” and national insurance contributions collection rules and remitted such amounts to Her Majesty’s Revenue and Customs, or HMRC. In connection with this ruling, we recorded a charge of approximately $36.7 million, of which approximately $4.2 million was with respect to fiscal 2009 and approximately $32.5 million was with respect to fiscal years 2001 through 2008, to cost of revenues in the fourth quarter of fiscal 2009. We subsequently recorded a charge of approximately $4.1 million and $3.0 million in fiscal 2010 and fiscal 2011, respectively. In December 2012, we reached an agreement with HMRC to settle the matter in its entirety for approximately $36.8 million. Based upon the settlement amount, we determined that $14.5 million of the reserved amount represented an over-accrual and as such was reversed to cost of revenues. As part of the settlement amount, the settlement agreement provided for an amount of interest to be paid which resulted in a $7.1 million increase to interest expense. The net benefit associated with the settlement was an increase of $7.4 million to income before income taxes. The reserve for this matter at the end of fiscal 2012 equaled approximately $7.3 million in the aggregate based on the exchange rates at the end of fiscal 2012. In January 2013, $6.8 million was paid to HMRC, representing the balance due over the approximately $30.0 million paid to HMRC in February 2012, and the balance of the reserve was used to pay associated costs.
Long-Term Debt
On March 15, 2012, the composition of our then-existing credit facilities, or collectively, the Prior WWI Credit Facility, changed as a result of our amending and restating the Prior WWI Credit Facility to, among other things, extend the maturity of certain of our term loan facilities and our revolving credit facility and to obtain new commitments for the borrowing of an additional $1,449.4 million of term loans to finance the purchases of shares of our common stock in our previously disclosed “modified Dutch auction” tender offer for our common stock and from Artal Holdings pursuant to the related share purchase agreement in the first six months of fiscal 2012. Following the amendment of the Prior WWI Credit Facility, (i) $33.1 million in aggregate principal amount of the Term A-1 Loan and $301.8 million in aggregate principal amount of the Term C Loan were converted into, and $849.4 million in aggregate principal amount of commitments to borrow new term loans were provided under, the new Term E Loan (as defined hereafter), (ii) $107.0 million in aggregate principal amount of the Term B Loan and $119.1 million in aggregate principal amount of the Term D Loan were converted into, and $600.0 million in aggregate principal amount of commitments to borrow new term loans were provided under, the new Term F Loan, and (iii) $262.0 million in aggregate principal amount of commitments under the Revolver A-1 were converted into the new revolving credit facility, Revolver A-2. The loans outstanding under each term loan facility existing prior to the amendment of the Prior WWI Credit Facility and the loans and commitments outstanding under the Revolver A-1, in each case that were not converted into the Term E Loan, the Term F Loan or the Revolver A-2, as applicable, continued to remain outstanding under the Prior WWI Credit Facility as the Term A-1 Loan, the Term B Loan, the Term C Loan, the Term D Loan or the
31
Table of Contents
Revolver A-1, as applicable. In connection with this amendment, we incurred fees of approximately $26.2 million in the first quarter of fiscal 2012.
On April 2, 2013, we refinanced our credit facilities pursuant to a new Credit Agreement, or as amended, supplemented or otherwise modified, the Credit Agreement, among the Company, the lenders party thereto, JPMorgan Chase Bank, N.A., as administrative agent and an issuing bank, The Bank of Nova Scotia, as revolving agent, swingline lender and an issuing bank, and the other parties thereto. The Credit Agreement provides for (a) a revolving credit facility (including swing line loans and letters of credit) in an initial aggregate principal amount of $250.0 million that will mature on April 2, 2018, or the Revolving Facility, (b) an initial term B-1 loan credit facility in an aggregate principal amount of $300.0 million that will mature on April 2, 2016, or Tranche B-1 Term Facility, and (c) an initial term B-2 loan credit facility in an aggregate principal amount of $2,100.0 million that will mature on April 2, 2020, or Tranche B-2 Term Facility. We refer herein to the Tranche B-1 Term Facility together with the Tranche B-2 Term Facility as the Term Facilities, and the Term Facilities and Revolving Facility collectively as the WWI Credit Facility. In connection with this refinancing, we used the proceeds from borrowings under the Term Facilities to pay off a total of $2,399.9 million of outstanding loans, consisting of $128.8 million of Term B Loans, $110.6 million of Term C Loans, $117.6 million of Term D Loans, $1,125.0 million of Term E Loans, $817.9 million of Term F Loans, $21.2 million of loans under the Revolver A-1 and $78.8 million of loans under the Revolver A-2. Following the refinancing of a total of $2,399.9 million of loans, at April 2, 2013, we had $2,400.0 million debt outstanding under the Term Facilities and $248.8 million of availability under the Revolving Facility. We incurred fees of $44.8 million during the second quarter of fiscal 2013 in connection with this refinancing. In the second quarter of fiscal 2013, we wrote-off fees associated with this refinancing which resulted in our recording a charge of $21.7 million in early extinguishment of debt.
On September 26, 2014, we entered into an agreement with certain lenders amending the Credit Agreement that, among other things, eliminated the Financial Covenant (as defined in the Credit Agreement) with respect to the Revolving Facility. In connection with this amendment, we wrote-off deferred financing fees of approximately $1.6 million in the third quarter of fiscal 2014. Concurrently with and in order to effect this amendment, we reduced the amount of the Revolving Facility from $250.0 million to $50.0 million.
Under the terms of the Credit Agreement, depending on our Consolidated Leverage Ratio (as defined in the Credit Agreement), we are obligated to offer to prepay the Term Facilities in an aggregate amount determined by our excess cash flow (as defined in the Credit Agreement). On March 13, 2015, we commenced an offer to prepay at a discount to par up to $75.0 million in aggregate principal amount of term loans outstanding under the Tranche B-1 Term Facility. On March 20, 2015, we accepted offers with a discount equal to or greater than 9.00% in respect of such term loans. On March 25, 2015, we paid an aggregate amount of cash proceeds totaling $57.4 million plus an amount sufficient to pay accrued and unpaid interest on the amount prepaid to prepay $63.1 million in aggregate principal amount of such term loans under the Tranche B-1 Term Facility. This expenditure reduced, on a dollar for dollar basis, our $59.7 million obligation to make a mandatory excess cash flow prepayment offer to the term loan lenders under the terms of the Credit Agreement. In addition, we made a voluntary prepayment at par on March 25, 2015 of $2.5 million in respect of such term loans under the Tranche B-1 Term Facility to reduce the remaining excess cash flow prepayment obligation for fiscal 2015. As a result of this prepayment, we wrote-off fees of $0.3 million, incurred fees of $0.6 million and recorded a gain on early extinguishment of debt of $4.7 million, inclusive of these fees, in the first quarter of fiscal 2015.
On June 17, 2015, we commenced another offer to prepay at a discount to par up to $229.0 million in aggregate principal amount of term loans outstanding under the Tranche B-1 Term Facility. On June 22, 2015, we accepted offers with a discount equal to or greater than 9.00% in respect of such term loans. On June 26, 2015, we paid an aggregate amount of cash proceeds totaling $77.2 million plus an amount sufficient to pay accrued and unpaid interest on the amount prepaid to prepay $84.9 million in aggregate principal amount of such term loans under the Tranche B-1 Term Facility. As a result of this prepayment, we wrote-off fees of $0.3 million, incurred fees of $0.6 million and recorded a gain on early extinguishment of debt of $6.7 million, inclusive of these fees, in the second quarter of fiscal 2015.
32
Table of Contents
On July 14, 2015, we drew down the $48.0 million available on our Revolving Facility in order to enhance our cash position and to provide additional financial flexibility. The revolver borrowing has been classified as a short-term liability in consideration of the fact that the terms of the Revolving Facility require an assessment as to whether there have been any material adverse changes with respect to the Company in connection with our monthly interest elections. Although the revolver borrowing has been classified as a short-term liability, absent any change in fact and circumstance, we have the ability to extend and not repay the Revolving Facility until its due date of April 2, 2018.
For additional details on the WWI Credit Facility, see “Item 7. Management’s Discussion and Analysis of Financial Condition and Results of Operations—Liquidity and Capital Resources—Long-Term Debt” in Part II of this Annual Report on Form 10-K.
Working Capital
In fiscal 2015, the change in working capital was driven in large part by the increase in short-term debt due within one year and the decline in cash resulting from the prepayment of debt during the fiscal year. The refinancing of our credit facilities in April 2013 resulted in much lower debt repayments in fiscal 2013 and fiscal 2014 as compared to our debt repayments in fiscal 2011 and fiscal 2012. Our lower debt repayment obligations in fiscal 2013 and fiscal 2014 drove increases in cash in those years thereby lowering the working capital deficit.
Other Comprehensive Loss
Other comprehensive loss, net of taxes, was $18.3 million in fiscal 2015 as compared to $28.9 million in fiscal 2014 primarily due to the unfavorable impact of foreign currency translation adjustments and to a lesser extent the mark to market of our interest rate swap. In fiscal 2015, foreign currency translation adjustments unfavorably impacted results by $27.8 million ($17.0 million after tax) as compared to $19.2 million ($11.7 million after tax) in fiscal 2014 primarily due to the devaluation of the Euro, Canadian dollar, and the British Pound. In addition, due to hedge accounting, Changes in Other Comprehensive Loss decreased by $2.2 million ($1.4 million after tax) in fiscal 2015 as compared to $28.3 million ($17.3 million after tax) in fiscal 2014.
Acquisition of Additional Equity Interest in Brazil and Gain on Brazil Acquisition
Prior to March 12, 2014, the Company had owned 35% of Vigilantes do Peso Marketing Ltda., or VPM, a Brazilian limited liability partnership. On March 12, 2014, the Company acquired an additional 45% equity interest in VPM for a net purchase price of $14.2 million. VPM was converted into a joint-stock corporation prior to closing and subsequently operates as a subsidiary of the Company with rights to conduct typical business lines. As a result of the acquisition, the Company gained a direct controlling financial interest in VPM and began to consolidate this entity as of the date of acquisition.
As a result of our Brazil acquisition, we adjusted our previously held equity interest to fair value of $11.0 million and recorded a charge of $0.5 million associated with the settlement of the royalty-free arrangement of the Brazilian partnership. The net effect of these items resulted in our recognizing a gain of $10.5 million ($6.4 million after tax or $0.11 per fully diluted share) in fiscal 2014.
Acquisition of Wello
On April 16, 2014, the Company acquired Knowplicity, Inc., d/b/a Wello, an online fitness and personal training company for a net purchase price of $9.0 million. Payment was in the form of common stock issued of $4.2 million and cash of $4.8 million. As a result of the acquisition, Wello became a wholly-owned subsidiary of the Company and the Company began to consolidate the entity as of the date of acquisition.
33
Table of Contents
Acquisition of Weilos
On March 11, 2015, the Company acquired for a purchase price of $6.7 million Weilos, Inc., or Weilos, a California-based startup with an online social platform that provides a mobile health and weight loss community. Payment was in the form of common stock issued of $2.8 million, restricted stock issued of $0.1 million and cash of $2.8 million plus cash in reserves of $1.0 million. As a result of the acquisition, Weilos became a wholly owned subsidiary of the Company and the Company began to consolidate the entity as of the date of acquisition.
Franchisee Acquisitions
The following are our acquisitions since the beginning of fiscal 2011:
Acquisitions of Alberta and Saskatchewan, West Virginia, Columbus, Reno, Manitoba and Franklin and St. Lawrence Counties. On March 4, 2013, we acquired substantially all of the assets of our Alberta and Saskatchewan, Canada franchisees, Weight Watchers of Alberta Ltd. and Weight Watchers of Saskatchewan Ltd., for an aggregate purchase price of $35.0 million. On July 15, 2013, we acquired substantially all of the assets of our West Virginia franchisee, Weight Watchers of West Virginia, Inc., for a net purchase price of $16.0 million. On July 22, 2013, we acquired substantially all of the assets of our Columbus, Ohio franchisee, Weight Watchers of Columbus, Inc., for a net purchase price of $23.4 million and our Reno, Nevada franchisee, Weight Watchers of Northern Nevada, Inc., for a net purchase price of $4.0 million. On October 28, 2013, we acquired substantially all of the assets of our Manitoba, Canada franchisee, Weight Watchers of Manitoba Ltd., for a net purchase price of $5.2 million and our Franklin and St. Lawrence Counties, New York franchisee, Weight Watchers of Franklin and St. Lawrence Counties Inc., for a net purchase price of $0.3 million.
Acquisitions of Southeastern Ontario and Ottawa, Adirondacks and Memphis. On September 10, 2012, we acquired substantially all of the assets of our Southeastern Ontario and Ottawa, Canada franchisee, Slengora Limited, for a net purchase price of $16.8 million. On November 2, 2012, we acquired substantially all of the assets of our Adirondacks franchisee, Weight Watchers of the Adirondacks, Inc., for a purchase price of $3.4 million. On December 20, 2012, we acquired substantially all of the assets of our Memphis, Tennessee franchisee, Weight Watchers of the Mid-South, Inc., for a purchase price of $10.0 million.
These acquisitions were financed through cash from operations. These acquisitions have been accounted for as purchases and financial results have been included in our consolidated operating results since their respective dates of acquisition.
34
Table of Contents
| Item 7. | Management’s Discussion and Analysis of Financial Condition and Results of Operations |
You should read the following discussion in conjunction with the “Selected Financial Data” included in Item 6 of this Annual Report on Form 10-K and our consolidated financial statements and related notes included in Item 15 of this Annual Report on Form 10-K. This discussion contains forward-looking statements that involve risks and uncertainties, such as statements of our plans, objectives, expectations and intentions. The cautionary statements discussed in “Cautionary Notice Regarding Forward-Looking Statements” and elsewhere in this Annual Report on Form 10-K should be read as applying to all forward-looking statements wherever they appear in this Annual Report on Form 10-K. Our actual results could differ materially from those discussed here. Factors that could cause or contribute to these differences include, without limitation, those discussed in “Risk Factors” included in Item 1A of this Annual Report on Form 10-K.
Overview
We are a leading, global-branded consumer company and the world’s leading commercial provider of weight management services, operating globally through a network of Company-owned and franchise operations. With over five decades of weight management experience, expertise and know-how, we have established Weight Watchers as one of the most recognized and trusted brand names among weight-conscious consumers. Weight Watchers-branded products and services include meetings conducted by us and our franchisees, digital weight management products provided through our websites, mobile sites and apps, products sold at meetings, licensed products sold in retail channels and magazine subscriptions and other publications. Our primary sources of revenue are subscriptions for our monthly commitment plans for Weight Watchers meetings and Online subscriptions. Our “meetings” business refers to providing access to meetings to our monthly commitment plan subscribers, “pay-as-you-go” members, Total Access subscribers and other meeting members. “Online” refers to Weight Watchers Online, Weight Watchers OnlinePlus, Personal Coaching and other digital subscription products.
We operate in numerous countries around the world, including through our franchise operations. We have four reportable segments based on an integrated geographical structure as follows: North America, United Kingdom, Continental Europe (CE) and Other. See the section entitled “Business—Business Organization and Global Operations” in Item 1 of this Annual Report on Form 10-K for further information on these reportable segments and the countries in which we operate.
Components of our Results of Operations
Revenues
We derive our revenues principally from:
| • | Service Revenues. Our “Service Revenues” consist of “Meeting Fees” and “Online Subscription Revenues”. “Meeting Fees” consist of the fees associated with our monthly commitment plans for unlimited access to meetings and other payment arrangements for access to meetings, including our “pay-as-you-go” payment arrangement and fees associated with our Total Access product. “Online Subscription Revenues” consist of the fees associated with subscriptions for our Online subscription products, including our Personal Coaching product. |
| • | In-meeting product sales. We sell a range of products that complement our weight management program, including bars, snacks, cookbooks, food and restaurant guides with SmartPoints values, Weight Watchers magazines, SmartPoints calculators and fitness kits, and certain third-party products, such as activity-tracking monitors. |
| • | Licensing, franchise royalties and other. We license the Weight Watchers brand and our other intellectual property in certain categories of food and other relevant consumer products. We also endorse carefully selected branded consumer products. In addition, our franchisees typically pay us a royalty fee of 10% of their meeting fee revenues as well as purchase products for sale in their meetings. |
35
Table of Contents
| We also generate revenues from subscription sales for our magazines, third-party advertising in our publications, the sale of third-party Internet advertising, ecommerce fees and the sale of By Mail product. |
The following table sets forth our revenues by category for the past three fiscal years.
Revenue Sources
(in millions)
| Fiscal 2015 | Fiscal 2014 | Fiscal 2013 | ||||||||||
| (52 weeks) | (53 weeks) | (52 weeks) | ||||||||||
| Service Revenues |
$ | 937.4 | $ | 1,181.9 | $ | 1,360.8 | ||||||
| In-meeting product sales |
127.3 | 169.1 | 212.0 | |||||||||
| Licensing, franchise royalties and other |
99.7 | 128.9 | 151.4 | |||||||||
|
|
|
|
|
|
|
|||||||
| Total |
$ | 1,164.4 | $ | 1,479.9 | $ | 1,724.1 | ||||||
|
|
|
|
|
|
|
|||||||
Note: Totals may not sum due to rounding.
From fiscal 2013 through fiscal 2015, our revenues decreased at a compound annual rate of 17.8% primarily driven by a decline in Service Revenues. Additional revenue details are as follows:
| • | Service Revenues. Service Revenues declined at a compound annual rate of 17.0% from fiscal 2013 to fiscal 2015 due to a decline in Total Paid Weeks from negative recruitment trends in both our meetings and Online businesses in the majority of the countries in which we operate. See “—Material Trends— Performance Indicators” below for an explanation of our paid weeks metric. During this period, recruitment was the biggest challenge in our business, as we faced strong competition for consumer trial from an evolving competitor set, including mobile apps and activity monitors. Additionally, the increasing focus of consumers on more integrated lifestyle and fitness approaches rather than just food, nutrition and diet also negatively impacted our recruitment. |
| • | In-meeting product sales. Global in-meeting product sales were down 22.5% on a compound annual rate from fiscal 2013 through fiscal 2015. This decline was primarily driven by a decline in the number of members attending meetings during that period. In addition, our average product sales per attendee in our meetings business declined from $4.94 to $4.00 at a compound annual rate of 10.0% during this period primarily as a result of lower sales of enrollment products and a lack of successful new product and program launches. |
| • | Licensing, franchise royalties and other. All other revenues were down 18.8% on a compound annual rate from fiscal 2013 through fiscal 2015. This decline was driven in part by declining licensing revenues which declined at a compound annual rate of 18.6% from fiscal 2013 through fiscal 2015. Our licensing business was negatively impacted by competition from lower-priced, store-branded products as well as reduced consumer demand for products in the diet category. In addition, lower revenues from our franchisees, which declined at a compound annual rate of 19.4% during this period, were driven by market performance and our acquisition of seven of our franchisees in fiscal 2013. |
Cost of Revenues
Total cost of revenues primarily consists of expenses to operate our meetings, costs to sell products in our meeting rooms and on the Internet and costs to operate our website and Online products. Operating costs primarily consist of salary, commissions and expenses paid to our service providers, salary expense of field staff, meeting room rent, customer service costs (both in-house and third-party), program material expenses, depreciation and amortization associated with field automation, credit card and fulfillment fees, training and other expenses incurred to support our field organization. Operating costs also include costs associated with our 24/7 Expert Chat and Personal Coaching offerings introduced in December of 2014. Cost to sell products includes costs of products purchased from our third-party suppliers, inventory reserves, royalties, inbound and
36
Table of Contents
outbound shipping and related costs incurred in making our products available for sale or use. Costs to operate our website includes salaries and related benefits, depreciation and amortization of website development, credit card processing and other costs incurred in making our website available to our members.
Marketing Expenses
Marketing expenses primarily consist of costs to produce and advertise our brand and products on television, on the Internet, on the radio and in print, costs paid to third-party agencies who help us develop our marketing campaigns and strategy, expenses in support of market research, costs paid to our celebrity spokespersons, as well as costs incurred in connection with local marketing and promotions.
Selling, General and Administrative Expenses
Selling, general and administrative expenses consist of compensation, benefits and other related costs, including stock-based compensation, third-party consulting, temp help, audit, legal and litigation expenses as well as facility costs and depreciation and amortization of systems in support of the business infrastructure and head offices globally. General and administrative expenses also include amortization expense of certain of our intangible assets and certain one-time transaction expenses.
Gross Margin
The following table sets forth our gross profit and gross margin for the past three fiscal years, as adjusted to exclude the impact of charges from our previously disclosed 2015 and 2014 restructuring plans:
| (in millions) |
2015 | 2014 | 2013 | |||||||||
| Gross Profit |
$ | 574.1 | $ | 802.6 | $ | 1,001.1 | ||||||
| Gross Margin |
49.3 | % | 54.3 | % | 58.1 | % | ||||||
| Adjustments to Reported Amounts |
||||||||||||
| Restructuring charges(1) |
1.5 | 4.6 | — | |||||||||
|
|
|
|
|
|
|
|||||||
| Gross Profit, as adjusted(1) |
$ | 575.6 | $ | 807.2 | $ | 1,001.1 | ||||||
|
|
|
|
|
|
|
|||||||
| Gross Margin impact from above adjustments(1) |
(0.1 | %) | (0.3 | %) | 0.0 | % | ||||||
| Gross Margin, as adjusted(1) |
49.4 | % | 54.6 | % | 58.1 | % | ||||||
Note: Totals may not sum due to rounding
| (1) | “As adjusted” is a non-GAAP financial measure that adjusts the consolidated statements of net income for fiscal 2015 and 2014 to exclude the impact of the $1.5 million and $4.6 million of restructuring charges associated with our previously disclosed 2015 and 2014 restructuring plans, respectively. See “Non-GAAP Financial Measures” below for an explanation of our use of non-GAAP financial measures. |
From fiscal 2013 to fiscal 2015, our gross margin decline was primarily driven by declining revenues, including declining licensing revenues. In addition, particularly in the US meetings business, the impact of the cost associated with providing 24/7 Expert Chat and Personal Coaching and additional service provider compensation changes in fiscal 2015, as well as technology and training costs associated with the December 2014 introduction of new product offerings negatively impacted margin. Online Subscription Revenues were substantially flat as a percent of total revenues in fiscal 2015 as compared to both fiscal 2014 and fiscal 2013 and, as a result, we experienced little to no benefit of a mix shift to the higher margin business in fiscal 2015 and fiscal 2014.
37
Table of Contents
Operating Income Margin
The following table sets forth our Operating Income for the past three fiscal years, as adjusted to exclude the impact of charges from our previously disclosed 2015 and 2014 restructuring plans and the expenses associated with the Winfrey Transaction:
| (in millions) |
2015 | 2014 | 2013 | |||||||||
| Operating Income |
168.1 | $ | 299.3 | $ | 457.8 | |||||||
| Operating Income Margin |
14.4 | % | 20.2 | % | 26.5 | % | ||||||
| Adjustments to Reported Amounts |
||||||||||||
| Restructuring charges(1) |
8.4 | 11.8 | — | |||||||||
| Winfrey Transaction Expenses(1) |
13.6 | — | — | |||||||||
|
|
|
|
|
|
|
|||||||
| Operating Income, as adjusted(1) |
$ | 190.1 | $ | 311.2 | $ | 457.8 | ||||||
|
|
|
|
|
|
|
|||||||
| Operating Income Margin impact from above adjustments(1) |
-1.9 | % | -0.8 | % | 0.0 | % | ||||||
| Operating Income Margin, as adjusted(1) |
16.3 | % | 21.0 | % | 26.5 | % | ||||||
Note: Totals may not sum due to rounding
| (1) | “As adjusted” is a non-GAAP financial measure that adjusts the consolidated statements of net income for fiscal 2015 and 2014 to exclude the impact of the $8.4 million and $11.8 million of restructuring charges associated with our previously disclosed fiscal 2015 and 2014 restructuring plans, respectively, and the $13.6 million of expenses associated with the Winfrey Transaction, which includes $12.8 million of stock compensation related to the Winfrey Option. See “Non-GAAP Financial Measures” below for an explanation of our use of non-GAAP financial measures. |
In fiscal 2014, the decrease in operating income margin from fiscal 2013 was primarily the result of lower gross margin partially offset by lower marketing expense. The decline was primarily driven by lower TV media and production costs from first-time integrated, as well as the sharing among markets of, TV spots for both our meetings and Online businesses, and lower and more efficient digital marketing spend in the United States.
In fiscal 2015, the decrease in operating income margin from fiscal 2014 was primarily the result of lower gross margin and higher general and administrative expenses as a percentage of revenues, partially offset by lower marketing expense. Excluding expenses associated with the Winfrey Transaction, general and administrative expenses as a percentage of revenues were flat versus the prior year. The decline in marketing expense from fiscal 2014 was primarily driven by lower TV media and production costs globally as well as lower agency fees and celebrity and talent costs primarily in the United States.
Material Trends
Performance Indicators
Our management reviews and analyzes several key performance indicators in order to manage our business and assess the quality and potential variability of our cash flows and earnings. These key performance indicators include:
| • | Revenues—Our “Service Revenues” consist of “Meeting Fees” and “Online Subscription Revenues”. “Meeting Fees” consist of the fees associated with our monthly commitment plans for unlimited access to meetings and other payment arrangements for access to meetings, including our “pay-as-you-go” payment arrangement and fees associated with our Total Access product. “Online Subscription Revenues” consist of the fees associated with subscriptions for our Online subscription products, including our Personal Coaching product. |
| • | Paid Weeks—The “Paid Weeks” metric reports paid weeks by Weight Watchers customers in Company-owned operations for a given period as follows: (i) “Meeting Paid Weeks” is the sum of total paid commitment plan weeks (including Total Access) and total “pay-as-you-go” weeks; (ii) “Online Paid Weeks” is the total paid subscription weeks for our digital subscription products (including Personal Coaching); and (iii) “Total Paid Weeks” is the sum of Meeting Paid Weeks and Online Paid Weeks, in each case for a given period. |
38
Table of Contents
| • | Incoming Active Subscribers/Active Base—“Subscribers” refer to meetings members and Online subscribers who participate in recurring billing programs, such as our monthly commitment plans for our meetings business. The “Incoming Active Subscribers” metric reports active Weight Watchers subscribers in Company-owned operations at a given period start as follows: (i) “Incoming Active Meeting Subscribers” is the total Weight Watchers monthly commitment plan active subscribers (including Total Access); (ii) “Incoming Active Online Subscribers” is the total number of Weight Watchers Online, Weight Watchers OnlinePlus and Personal Coaching active subscribers; and (iii) “Incoming Active Subscribers” is the sum of Incoming Active Meeting Subscribers and Incoming Active Online Subscribers, in each case at a given period start. We also at times refer to such metrics as the “Incoming Active Base”. |
| • | End of Period Active Subscribers/Active Base—The “End of Period Active Subscribers” metric reports active Weight Watchers subscribers in Company-owned operations at a given period end as follows: (i) “End of Period Active Meeting Subscribers” is the total Weight Watchers monthly commitment plan active subscribers (including Total Access); (ii) “End of Period Active Online Subscribers” is the total number of Weight Watchers Online, Weight Watchers OnlinePlus and Personal Coaching active subscribers; and (iii) “End of Period Active Subscribers” is the sum of End of Period Active Meeting Subscribers and End of Period Active Online Subscribers, in each case at a given period end. We also at times refer to such metrics as the “End of Period Active Base”. |
| • | recruitments |
| • | attendance |
| • | Meeting Fees per Paid Week and in-meeting product sales per attendee |
| • | gross profit and operating expenses as a percentage of revenue |
Transformation Plan
As previously disclosed, the Company is currently executing a multi-year transformation plan. The four strategic areas of focus of this transformation plan are as follows: improving near-term performance, including strong cost management; repositioning our brand and improving our service and product offerings; targeting new channel growth in healthcare; and building organizational capabilities. As part of our focus on strong cost management, we successfully reduced our gross annualized expenses by $250 million by the end of fiscal 2015 versus our fiscal 2012 cost base. Prior to fiscal 2015, we achieved a gross cost-savings initiative totaling $150 million annually and, in fiscal 2015, we established an incremental $100 million annual gross cost-savings initiative, which we successfully achieved. See Note 19 of our consolidated financial statements, contained in Part IV, Item 15 of this Annual Report on Form 10-K for additional details on this initiative. The December 2015 launch of our comprehensive program innovation, Beyond the Scale, is a key component of our strategy to reposition our brand and improve our service and product offerings. This innovation expands our purpose from weight loss alone to more broadly helping people lead healthier, more active, happier lives. Management is confident that this innovation, together with our groundbreaking partnership with Ms. Winfrey, will accelerate the successful repositioning of our brand. As part of our partnership, and in furtherance of this repositioning of our brand, Ms. Winfrey was featured in our 2016 winter season television advertising in certain key markets. She will also continue to be a member and may, from time to time, candidly share her experiences and perspectives along the way of her weight loss journey. A key component of the organizational capabilities upgrade is our technology transformation, whereby we are replacing legacy technology systems and architecture to enable us to deliver product and program enhancements in a more agile, cost-effective manner. In fiscal 2015, we achieved significant milestones in this arena. For additional details on our investments in fiscal 2015 related to this technology transformation, see “—Liquidity and Capital Resources—Investing Activities—”. As we execute this transformation plan, management, from time to time, reviews the resulting revenues and associated costs to refine the plan in order to ensure resources are allocated efficiently and optimized. As management determines resources should be reallocated, they refine the transformation plan accordingly. For example, our investment strategy in the healthcare channel and related technology has evolved to focus on proving our internal capabilities
39
Table of Contents
to deliver against healthcare market needs. Management continues to believe that the Company has sufficient liquidity to execute the transformation plan and does not believe the Company is constrained by its capital structure. See “— Liquidity and Capital Resources”. While the Company’s turnaround is taking longer than management had previously anticipated, we made significant progress against this plan in fiscal 2015. Management remains committed to this transformation plan and its underlying strategies and is optimistic about the resulting turnaround.
Market Trends
We believe that our revenues and profitability can be sensitive to major trends in the weight management industry. In particular, we believe that our business could be adversely impacted by:
| • | increased competition from Internet, free mobile and other weight management apps and other electronic weight management approaches; |
| • | the development of more effective or more favorably perceived weight management methods, including pharmaceuticals; |
| • | a failure to develop and market new, innovative services and products or to successfully expand into new channels of distribution or respond to consumer trends, including consumer focus on integrated lifestyle and fitness approaches; |
| • | a failure to successfully implement new strategic initiatives; |
| • | a decrease in the effectiveness of our marketing, advertising, and social media programs; |
| • | an impairment of the Weight Watchers brand and our other intellectual property; |
| • | a failure of our technology or systems to perform as designed; and |
| • | a downturn in general economic conditions or consumer confidence. |
North America Metrics and Business Trends
In fiscal 2013, North America Total Paid Weeks declined 6.6%, driven by a decline in both Meeting Paid Weeks of 9.4% and Online Paid Weeks of 4.4%, versus the prior year. The decline in Meeting Paid Weeks primarily resulted from the lower Incoming Active Base in the meetings business at the beginning of fiscal 2013 versus the beginning of fiscal 2012 as well as from lower enrollments in fiscal 2013 versus the prior year, primarily in the United States, due to the difficulty in attracting members to our brand.
In fiscal 2014, North America Total Paid Weeks declined 16.8%, driven by a decline in both Online Paid Weeks of 17.5% and Meeting Paid Weeks of 15.8%, versus the prior year. Despite the launch of the new Simple Start program at the beginning of the year, as well as new advertising and promotional tactics, recruitment softness continued throughout the year. The popularity of activity monitors and free apps resulted in increased competition which exacerbated the negative trend we began to experience in fiscal 2013 in subscriptions for our Online subscription products. In addition, the increasing focus of consumers on more integrated lifestyle and fitness approaches rather than just food, nutrition and diet also negatively impacted our recruitments.
In fiscal 2015, North America Total Paid Weeks declined 20.9%, driven by a decline in both Online Paid Weeks of 22.6% and Meeting Paid Weeks of 18.8%, versus the prior year. The decline in North America Total Paid Weeks primarily resulted from the lower Incoming Active Base at the beginning of fiscal 2015 versus the beginning of fiscal 2014 as well as from lower recruitments in fiscal 2015 versus the prior year. In response to weakening recruitment trends in early fiscal 2015, North America introduced new advertising and promotions. Although recruitments remained lower year-over-year in fiscal 2015, the year-over-year recruitment trend in the second and third quarters of fiscal 2015 improved as compared to the first quarter of fiscal 2015, benefitting from these actions. In the fourth quarter of fiscal 2015, following the announcement of our partnership with Ms. Winfrey in October and our early December launch of our new program through the end of the fiscal 2015, recruitments increased as compared to the same period in the prior year.
40
Table of Contents
United Kingdom Metrics and Business Trends
In fiscal 2013, UK Total Paid Weeks declined 13.6% driven by a decline in Meeting Paid Weeks of 19.2% and a decline in Online Paid Weeks of 2.8% versus the prior year. The decline in Meeting Paid Weeks in fiscal 2013 was driven by the lower Incoming Active Meeting Subscribers at the beginning of fiscal 2013 versus the beginning of fiscal 2012 coupled with lower meeting recruitments in the year as compared to the prior year. In fiscal 2013, local competition in the United Kingdom significantly contributed to the decline in meeting recruitments.
In fiscal 2014, UK Total Paid Weeks declined 9.2% versus the prior year, driven by a decline in Meeting Paid Weeks of 9.6% and a decline in Online Paid Weeks of 8.6% versus the prior year. Total Paid Weeks performance in fiscal 2014 was driven by the lower Incoming Active Base at the beginning of fiscal 2014 versus the beginning of fiscal 2013 coupled with lower recruitments in fiscal 2014 as compared to the prior year. In response to weakening recruitment trends, early in fiscal 2014, the United Kingdom introduced new advertising, implemented new promotional tactics and invested in a local marketing campaign to combat a strong local competitor. As a result of these initiatives, the recruitment trend turned positive in the second half of fiscal 2014 as compared to the prior year period.
In fiscal 2015, UK Total Paid Weeks declined 14.3% versus the prior year, driven by a decline in Meeting Paid Weeks of 13.2% and a decline in Online Paid Weeks of 16.1% versus the prior year. Total Paid Weeks performance in fiscal 2015 was driven by the lower Incoming Active Base at the beginning of fiscal 2015 versus the beginning of fiscal 2014 coupled with lower recruitments in fiscal 2015 as compared to the prior year. Although recruitments in fiscal 2015 remained lower year-over-year, the year-over-year recruitment trend in the second, third and fourth quarters of fiscal 2015 in the United Kingdom improved as compared to the first quarter of fiscal 2015 driven by the use of new promotional tactics and the new program launch in early December 2015.
Continental Europe Metrics and Business Trends
In fiscal 2013, Continental Europe Total Paid Weeks increased 19.9%, driven primarily by an increase in Online Paid Weeks, up 38.4%, versus the prior year. Continental Europe benefitted from an increased number of Incoming Active Meeting Subscribers at the beginning of fiscal 2013 versus the beginning of fiscal 2012, which was partially offset by lower recruitments in fiscal 2013 versus the prior year.
In fiscal 2014, Continental Europe Total Paid Weeks increased 3.1% driven by an increase in Online Paid Weeks of 6.5%, partially offset by a decline in Meeting Paid Weeks of 2.5%, versus the prior year. This increase in Online Paid Weeks was driven by the higher number of Incoming Active Online Subscribers at the start of fiscal 2014 versus the start of fiscal 2013. The decrease in Meeting Paid Weeks was driver by a lower number of Incoming Active Meeting Subscribers at the start of fiscal 2014 versus the start of fiscal 2013 and recruitment declines. Although Total Paid Weeks continued to grow in fiscal 2014, it reflected a significant slowdown in the year-over-year trend.
In fiscal 2015, Continental Europe Total Paid Weeks declined 8.0% versus the prior year, driven by a decline in Meeting Paid Weeks of 9.8% and a decline in Online Paid Weeks of 6.9% versus the prior year. This decline in Meeting Paid Weeks was driven by the lower number of Incoming Active Meeting Subscribers at the start of fiscal 2015 versus the start of fiscal 2014 coupled with lower meeting recruitments in fiscal 2015 as compared to the prior year. Although the number of Incoming Active Online Subscribers at the start of fiscal 2015 was higher than at the start of fiscal 2014, recruitment softness in the year led to this decline in Online Paid Weeks compared to the prior year. Although recruitments in fiscal 2015 remained lower year-over-year, the year-over-year recruitment trend in the second, third and fourth quarters of fiscal 2015 in Continental Europe improved as compared to the first quarter of fiscal 2015 driven by the use of new promotional tactics and the new program launch in early December 2015.
41
Table of Contents
Fiscal 2016: Anticipated Business Metrics, Trends and Other Events
We expect that our fiscal 2016 revenues will increase as compared to fiscal 2015, driven by anticipated recruitments that will establish a strong foundation for revenue growth and increased profitability in fiscal 2016. Given the nature of our subscription-based payment model, revenue growth typically lags recruitment growth. We expect an increase in revenues despite the approximately $20.0 million negative impact of the lower fiscal 2016 Incoming Active Base versus the prior year and an anticipated $16.0 million negative impact of foreign currency on fiscal 2016 revenues based on current rates. We plan to use cash on hand to repay in full our $144.3 million debt obligations due April 2016 under the WWI Credit Facilities.
Non-GAAP Financial Measures
To supplement our consolidated results presented in accordance with accounting principles generally accepted in the United States, or GAAP, we have disclosed non-GAAP financial measures of operating results that exclude or adjust certain items. Gross profit and gross profit margin, operating income and operating income margin, net income attributable to the Company, selling, general and administrative expenses and earnings per fully diluted share, including components thereof, are discussed in this Annual Report on Form 10-K both as reported (on a GAAP basis) and as adjusted (on a non-GAAP basis), as applicable, as follows: (i) with respect to fiscal 2015 and 2014 to exclude the impact of charges associated with our previously disclosed plans to restructure our organization; (ii) with respect to fiscal 2015 to exclude the impact of (a) expenses associated with the Winfrey Transaction and (b) the gains on early extinguishment of debt associated with our previously reported debt prepayments in the period; (iii) with respect to fiscal 2014 to exclude the impact of (a) the net tax benefit related to an intercompany loan write-off in connection with the closure of our China business and the establishment of a valuation allowance related to tax benefits for foreign losses that are not expected to be realized and (b) the gain recognized in connection with our previously disclosed Brazil acquisition due to an adjustment of our previously held equity interest to fair value offset by a charge associated with the settlement of the royalty-free arrangement of the Brazil partnership; and (iv) with respect to fiscal 2013 to exclude the early extinguishment of debt charge. Income before taxes, effective tax rate, net income attributable to the Company and earnings per fully diluted share are discussed in this Annual Report on Form 10-K both as reported (on a GAAP basis) and as adjusted (on a non-GAAP basis) to exclude from fiscal 2013 the impact from the early extinguishment of debt charge recorded in connection with our previously announced April 2, 2013 refinancing of our long-term debt. We generally refer to such non-GAAP measures as excluding or adjusting for the impact of the expenses associated with the Winfrey Transaction, the restructuring charges, the gain on the early extinguishment of debt, the gain on the Brazil acquisition, the China tax benefit partially offset by the recognition of a valuation allowance and the early extinguishment of debt charge. Our management believes these non-GAAP financial measures provide supplemental information to investors regarding the performance of our business and are useful for period-over-period comparisons of the performance of our business. While we believe that these financial measures are useful in evaluating our business, this information should be considered as supplemental in nature and is not meant to be considered in isolation or as a substitute for the related financial information prepared in accordance with GAAP. In addition, these non-GAAP financial measures may not be the same as similarly entitled measures reported by other companies.
Use of Constant Currency
As exchange rates are an important factor in understanding period-to-period comparisons, we believe in certain cases the presentation of results on a constant currency basis in addition to reported results helps improve investors’ ability to understand our operating results and evaluate our performance in comparison to prior periods. Constant currency information compares results between periods as if exchange rates had remained constant period-over-period. We use results on a constant currency basis as one measure to evaluate our performance. In this Annual Report on Form 10-K, we calculate constant currency by calculating current-year results using prior-year foreign currency exchange rates. We generally refer to such amounts calculated on a
42
Table of Contents
constant currency basis as excluding or adjusting for the impact of foreign currency or being on a constant currency basis. These results should be considered in addition to, not as a substitute for, results reported in accordance with GAAP. Results on a constant currency basis, as we present them, may not be comparable to similarly titled measures used by other companies and are not measures of performance presented in accordance with GAAP.
Critical Accounting Policies
“Management’s Discussion and Analysis of Financial Condition and Results of Operations” is based upon our consolidated financial statements, which have been prepared in accordance with GAAP. The preparation of these financial statements requires us to make estimates and judgments that affect the reported amounts of assets, liabilities, revenues and expenses, and related disclosure of contingent assets and liabilities. On an ongoing basis, we evaluate our estimates and judgments, including those related to inventories, the impairment analysis for goodwill and other indefinite-lived intangible assets, share-based compensation, income taxes, tax contingencies and litigation. We base our estimates on historical experience and on various other factors and assumptions that we believe to be reasonable under the circumstances, the results of which form the basis for making judgments about the carrying values of assets and liabilities that are not readily apparent from other sources. Actual results may differ from these estimates.
We believe the following accounting policies are most important to the portrayal of our financial condition and results of operations and require our most significant judgments and estimates.
Revenue Recognition
We earn revenue by conducting meetings, for which we charge a fee, predominantly through monthly commitment plans, prepayment plans or the “pay-as-you-go” arrangement. We also earn revenue from monthly subscriptions for our Online products, selling products in our meetings, on the Internet and to our franchisees, collecting commissions from franchisees, collecting royalties related to licensing agreements, selling magazine subscriptions, selling advertising space on our website and in copies of our magazines, ecommerce fees and By Mail product sales.
Monthly commitment plans, prepaid meeting fees and magazine subscription revenue is recorded to deferred revenue and amortized into revenue over the period earned. Online Subscription Revenues are recognized over the period that products are provided. One-time sign-up fees are deferred and recognized over the expected customer relationship period. Online Subscription Revenues that are paid in advance are deferred and recognized on a straight-line basis over the subscription period. Revenue from “pay-as-you-go” meeting fees, product sales, ecommerce fees, By Mail, commissions and royalties is recognized when services are rendered, products are shipped to customers and title and risk of loss pass to the customers, and commissions and royalties are earned, respectively. Revenue from advertising in magazines is recognized when advertisements are published. Revenue from magazine sales is recognized when the magazine is sent to the customer. We generally charge non-refundable registration and starter fees in exchange for an introductory information session and materials we provide to new members in our meetings business. Revenue from these registration and starter fees are recognized when the service and products are provided, which is generally at the same time payment is received from the customer. Discounts to customers, including free registration offers, are recorded as a deduction from gross revenue in the period such revenue was recognized. Revenue from advertising on our website is recognized when the advertisement is viewed by the user.
We grant refunds in aggregate amounts that historically have not been material. Because the period of payment of the refund generally approximates the period revenue was originally recognized, refunds are recorded as a reduction of revenue when paid.
43
Table of Contents
Goodwill, Franchise Rights Acquired, and Other Intangible Assets
Finite-lived intangible assets are amortized using the straight-line method over their estimated useful lives of 3 to 20 years or, in the case of amortizable franchise rights acquired, over the remaining contractual period, which is generally less than one year.
We review goodwill and other indefinite-lived intangible assets, including franchise rights acquired with indefinite lives, for potential impairment on at least an annual basis or more often if events so require. In performing our goodwill impairment analysis for fiscal 2015, 2014 and 2013, no impairment was identified for any of our reporting units as the fair value of those units exceeded their carrying value. In performing the impairment analysis for fiscal 2015 and fiscal 2014, we determined that the carrying amounts of our franchise rights acquired with indefinite lives did not exceed their respective fair values and therefore, no impairment existed. In performing the impairment analysis for fiscal 2013, we determined that, based on the fair values calculated, the carrying amounts of the indefinite-lived franchise rights acquired related to our Mexico and Hong Kong operations exceeded their respective fair values and recorded impairment charges of $0.9 million and $0.2 million, respectively. We determined that the carrying amounts of the remainder of our franchise rights acquired with indefinite lives did not exceed their respective fair values as of the end of fiscal 2013, and therefore, no other impairment existed.
Although there is generally significant headroom in our impairment analysis (except for Brazil as discussed below), a change in the underlying assumptions will cause a change in the results of the tests and, as such, could result in an impairment of those assets, which would impact earnings. We would also be required to reduce the carrying amounts of the related assets on our balance sheet. We continue to evaluate these estimates and assumptions and believe that these assumptions are appropriate.
In performing our annual impairment analysis, we also considered the trading value of both our equity and debt. We continue to believe that these trading values do not reflect the anticipated positive impact of our transformation plan. For additional information on our transformation plan, see “—Transformation Plan”. However, if our transformation plan does not meet our expectations, or the trading values of both our equity and debt were to significantly decline from their current levels, we may have to take an impairment charge at the appropriate time, which could be material. For additional information on risks associated with our recognizing asset impairment charges, see “Item 1A. Risk Factors”.
The following is a more detailed discussion of our goodwill and franchise rights acquired impairment analysis.
Goodwill
In performing the impairment analysis for goodwill, the fair value for our reporting units is estimated using a discounted cash flow approach. This approach involves projecting future cash flows attributable to the reporting unit and discounting those estimated cash flows using an appropriate discount rate. The estimated fair value is then compared to the carrying value of the reporting unit. We have determined the appropriate reporting unit for purposes of assessing annual impairment to be the country for all reporting units. The values of goodwill in the United States, Canada, Brazil and other countries at January 2, 2016 were $94.8 million, $38.6 million, $15.9 million and $10.0 million, respectively.
Based on the results of our fiscal 2015 impairment analysis, we estimated that approximately 90% of our reporting units had a fair value at least 50% higher than the respective reporting unit’s carrying amount. In Brazil, which holds 10% of the Company’s goodwill, the fair value of this reporting unit exceeded its carrying value by approximately 20%.
44
Table of Contents
For all of the Company’s reporting units except for Brazil (see below), we estimated future cash flows by utilizing the historical debt-free cash flows attributable to that country and then applied expected future operating income growth rates for such country. We utilized operating income as the basis for measuring our potential growth because we believe it is the best indicator of the performance of our business. We then discounted the estimated future cash flows utilizing a discount rate which was calculated using the average cost of capital, which includes the cost of equity and the cost of debt. The cost of equity was determined by combining a risk-free rate of return and a market risk premium for the Company’s peer group. The risk-free rate of return was generally determined based on the average rate of long-term U.S. Treasury securities. The market risk premium was generally determined by reviewing external market data. The cost of debt was determined by estimating the Company’s current borrowing rate.
The following are the more significant assumptions utilized in our impairment analysis for fiscal 2015 and 2014:
| January 2, 2016 |
January 3, 2015 |
|||||||
| Debt-Free Cash Flow Growth Rate |
0% to 6% | -5% to 14% | ||||||
| Discount Rate |
9.3% | 10.3% | ||||||
As it relates to our impairment analysis for Brazil, we estimated future debt free cash flows in contemplation of our growth strategies for that market. In developing these projections, we considered the historical impact of similar growth strategies in other markets as well as the current market conditions in Brazil. We then discounted the estimated future cash flows utilizing a discount rate which was calculated using the average cost of capital, which included the cost of equity and the cost of debt. The cost of equity was determined by combining a risk-free rate of return and a market risk premium for the Company’s peer group. The risk-free rate of return was generally determined based on the average rate of long-term U.S. Treasury securities. The market risk premium was generally determined by reviewing external market data. Additional consideration was given to the current economic conditions in Brazil and the country specific risk thereon, as well as the risk associated with the rate of growth projected in the analysis. The cost of debt was determined by estimating the Company’s current borrowing rate. Accordingly, in our fiscal 2015 impairment analysis, we assumed a cumulative annual growth rate for our debt-free cash flows of 51% and a discount rate of 17.8%.
Franchise Rights Acquired
In performing the impairment analysis for our indefinite-lived franchise rights acquired, the fair value for our franchise rights acquired is estimated using a discounted cash flow approach referred to as the hypothetical start-up approach for our franchise rights related to our meetings business and a relief from royalty methodology for our franchise rights related to our Online business. The aggregate estimated fair value for these rights is then compared to the carrying value of the unit of accounting for those franchise rights. We have determined the appropriate unit of account for purposes of assessing annual impairment to be the combination of the rights in the meetings and Online businesses in the country in which the acquisitions have occurred. The values of these franchise rights in the United States, Canada, United Kingdom, Australia, New Zealand and other countries at January 2, 2016 were $675.6 million, $48.4 million, $11.8 million, $6.6 million, $4.8 million, and $0.1 million, respectively.
Based on the results of our fiscal 2015 impairment analysis, we estimated that approximately 99% of our franchise rights acquired had a fair value at least 50% higher than their carrying amount.
In our hypothetical start-up approach analysis for fiscal 2015 we assumed that the year of maturity was reached after 7 years. Subsequent to the year of maturity, we assumed debt-free cash flow growth rates based on our expected future operating income growth rates for such country. We utilized operating income as the basis
45
Table of Contents
for measuring our potential growth because we believe it is the best indicator of the performance of our business. We then discounted the estimated future cash flows utilizing discount rates consistent with those used in our goodwill impairment analysis as discussed above.
For fiscal 2015, the compound annual growth rates of our debt-free cash flows subsequent to the year of maturity used in our discounted cash flow analysis ranged from a decline of approximately 24% to growth of approximately 21%. For fiscal 2014, the compound annual growth rates subsequent to the year of maturity used in our discounted cash flow analysis ranged from a decline of approximately 9% to growth of approximately 16%.
Information concerning significant accounting policies affecting us is set forth in Note 2 of our consolidated financial statements, contained in Part IV, Item 15 of this Annual Report on Form 10-K.
46
Table of Contents
RESULTS OF OPERATIONS FOR FISCAL 2015 (52 weeks) COMPARED TO FISCAL 2014 (53 weeks)
The Company’s fiscal year ends on the Saturday closest to December 31st and consists of either 52- or 53-week periods. Fiscal 2015 contained 52 weeks, while fiscal 2014 contained 53 weeks. The 2014 1st week, which began on December 30, 2013 and ended January 5, 2014, contributed an additional $19.2 million in net revenues, or 1.3%, and additional operating income of $3.9 million, or 1.3%, to fiscal 2014. It also contributed 1.3 million, or 1.7%, of additional Meeting Paid Weeks, 1.8 million, or 1.8%, of additional Online Paid Weeks, and 3.1 million, or 1.8%, in additional Total Paid Weeks to fiscal 2014. The additional week in fiscal 2014 also resulted in an additional week of interest expense for that year.
The table below sets forth selected financial information for fiscal 2015 from our consolidated statements of net income for fiscal 2015 versus selected financial information for fiscal 2014 from our consolidated statements of net income for fiscal 2014.
Summary of Selected Financial Data
| (In millions, except per share amounts) | ||||||||||||||||||||
| Fiscal 2015 |
Fiscal 2014 |
Increase/ (Decrease) |
% Change |
% Change Constant Currency |
||||||||||||||||
| Revenues, net |
$ | 1,164.4 | $ | 1,479.9 | $ | (315.5 | ) | (21.3 | %) | (16.3 | %) | |||||||||
| Cost of revenues |
590.3 | 677.4 | (87.0 | ) | (12.8 | %) | (7.9 | %) | ||||||||||||
|
|
|
|
|
|
|
|
|
|
|
|||||||||||
| Gross profit |
574.1 | 802.6 | (228.5 | ) | (28.5 | %) | (23.4 | %) | ||||||||||||
| Gross Margin % |
49.3 | % | 54.2 | % | ||||||||||||||||
| Marketing expenses |
201.0 | 262.3 | (61.2 | ) | (23.3 | %) | (18.1 | %) | ||||||||||||
| Selling, general & administrative expenses |
205.0 | 241.0 | (36.0 | ) | (14.9 | %) | (11.4 | %) | ||||||||||||
|
|
|
|
|
|
|
|
|
|
|
|||||||||||
| Operating income |
168.1 | 299.3 | (131.3 | ) | (43.9 | %) | (37.6 | %) | ||||||||||||
| Operating Income Margin % |
14.4 | % | 20.2 | % | ||||||||||||||||
| Interest expense |
121.8 | 123.0 | (1.1 | ) | (0.9 | %) | (0.9 | %) | ||||||||||||
| Other expense, net |
2.0 | 3.2 | (1.2 | ) | (36.8 | %) | 51.3 | % | ||||||||||||
| Gain on Brazil acquisition |
— | (10.5 | ) | 10.5 | (100.0 | %) | — | |||||||||||||
| Early extinguishment of debt |
(11.4 | ) | — | (11.4 | ) | — | — | |||||||||||||
|
|
|
|
|
|
|
|
|
|
|
|||||||||||
| Income before income taxes |
55.6 | 183.7 | (128.1 | ) | (69.7 | %) | (59.5 | %) | ||||||||||||
| Provision for income taxes |
22.8 | 65.9 | (43.1 | ) | (65.4 | %) | (53.7 | %) | ||||||||||||
|
|
|
|
|
|
|
|
|
|
|
|||||||||||
| Net income |
32.8 | 117.7 | (85.0 | ) | (72.2 | %) | (62.6 | %) | ||||||||||||
| Net income attributable to the noncontrolling interest |
0.2 | 0.1 | 0.1 | 207.4 | % | 100.0 | % | |||||||||||||
|
|
|
|
|
|
|
|
|
|
|
|||||||||||
| Net income attributable to Weight Watchers International, Inc. |
$ | 32.9 | $ | 117.8 | $ | (84.8 | ) | (72.0 | %) | (62.8 | %) | |||||||||
|
|
|
|
|
|
|
|
|
|
|
|||||||||||
| Weighted average diluted shares outstanding |
59.0 | 56.7 | 2.3 | 4.0 | % | 4.0 | % | |||||||||||||
|
|
|
|
|
|
|
|
|
|
|
|||||||||||
| Diluted Earnings Per Share |
$ | 0.56 | $ | 2.08 | $ | (1.52 | ) | (73.1 | %) | (72.8 | %) | |||||||||
|
|
|
|
|
|
|
|
|
|
|
|||||||||||
Note: Totals may not sum due to rounding.
Certain results for fiscal 2015 are adjusted to exclude the impact of the $8.4 million of restructuring charges associated with our previously disclosed 2015 restructuring plan, the $13.6 million of expenses associated with the Winfrey Transaction, which includes $12.8 million of stock compensation related to the Winfrey Option, and the gain on early extinguishment of debt $11.4 million. See “Non-GAAP Financial Measures” above. The
47
Table of Contents
table below sets forth a reconciliation of certain of those components of our selected financial data for the fiscal year ended January 2, 2016 which have been adjusted.
| (in millions, except per share amounts) |
Gross Profit |
Gross Profit Margin |
Operating Income |
Operating Income Margin |
Net
Income Attributable to Company |
Diluted EPS |
||||||||||||||||||
| Fiscal 2015 |
$ | 574.1 | 49.3 | % | $ | 168.1 | 14.4 | % | $ | 32.9 | $ | 0.56 | ||||||||||||
| Adjustments to Reported Amounts(1) |
||||||||||||||||||||||||
| 2015 Restructuring charges(1) |
1.5 | 8.4 | 5.1 | 0.09 | ||||||||||||||||||||
| Winfrey Transaction Expenses(1) |
— | 13.6 | 8.3 | 0.14 | ||||||||||||||||||||
| Early extinguishment of debt(1) |
— | — | (7.0 | ) | (0.12 | ) | ||||||||||||||||||
|
|
|
|
|
|
|
|
|
|||||||||||||||||
| Total Adjustments |
1.5 | 22.0 | 6.5 | 0.1 | ||||||||||||||||||||
|
|
|
|
|
|
|
|
|
|||||||||||||||||
| Fiscal 2015, as adjusted(1) |
$ | 575.6 | 49.4 | % | $ | 190.1 | 16.3 | % | $ | 39.4 | $ | 0.67 | ||||||||||||
|
|
|
|
|
|
|
|
|
|||||||||||||||||
Note: Totals may not sum due to rounding
| (1) | “As adjusted” is a non-GAAP financial measure that adjusts the consolidated statements of net income for fiscal 2015 to exclude the impact of the $8.4 million ($5.1 million after tax) of restructuring charges associated with our previously disclosed 2015 restructuring plan, the $13.6 million ($8.3 million after tax) of expenses associated with the Winfrey Transaction, which includes $12.8 million of stock compensation related to the Winfrey Option, and the gain on early extinguishment of debt of $11.4 million ($7.0 million after tax). See “Non-GAAP Financials Measures” above for an explanation of our use of non-GAAP financial measures. |
Certain results for fiscal 2014 are adjusted to exclude the $11.8 million impact of charges from the previously disclosed 2014 restructuring plan, $10.5 million related to the gain on the Brazil acquisition and the $2.4 million net tax benefit related to an intercompany loan write-off in connection with the closure of our China business partially offset by the recognition of a valuation allowance related to tax benefits for foreign losses that are not expected to be realized. See “Non-GAAP Financial Measures” above. The table below sets forth a reconciliation of certain of those components of our selected financial data for the fiscal year ended January 3, 2015 which have been adjusted.
| (in millions, except per share amounts) |
Gross Profit |
Gross Profit Margin |
Operating Income |
Operating Income Margin |
Net
Income Attributable to Company |
Diluted EPS |
||||||||||||||||||
| Fiscal 2014 |
$ | 802.6 | 54.2 | % | $ | 299.3 | 20.2 | % | $ | 117.8 | $ | 2.08 | ||||||||||||
| Adjustments to Reported Amounts(1) |
||||||||||||||||||||||||
| 2014 Restructuring charges(1) |
4.6 | 11.8 | 7.2 | 0.13 | ||||||||||||||||||||
| Gain on Brazil acquisition(1) |
— | — | (6.4 | ) | (0.11 | ) | ||||||||||||||||||
| Tax benefit, net(1) |
— | — | (2.4 | ) | (0.04 | ) | ||||||||||||||||||
|
|
|
|
|
|
|
|
|
|||||||||||||||||
| Total Adjustments |
4.6 | 11.8 | (1.5 | ) | 0.03 | |||||||||||||||||||
|
|
|
|
|
|
|
|
|
|||||||||||||||||
| Fiscal 2014, as adjusted(1) |
$ | 807.2 | 54.5 | % | $ | 311.1 | 21.0 | % | $ | 116.3 | $ | 2.05 | ||||||||||||
|
|
|
|
|
|
|
|
|
|||||||||||||||||
| Note: | Totals may not sum due to rounding |
| (1) | As adjusted” is a non-GAAP financial measure that adjusts the consolidated statements of net income for fiscal 2014 to exclude the impact of the $11.8 million ($7.2 million after tax) of restructuring charges associated with our previously disclosed 2014 restructuring plan, the gain of $10.5 million ($6.4 million after tax) recognized in connection with our previously disclosed Brazil acquisition due to an adjustment to our previously held equity interest to fair value offset by a charge associated with the settlement of the royalty-free arrangement of the Brazilian partnership and the impact of the $2.4 million net tax benefit associated with an intercompany loan write-off in connection with the closure of our China business partially offset by the recognition of a valuation allowance related to tax benefits for foreign losses that are not expected to be realized. See “Non-GAAP Financials Measures” above for an explanation of our use of non-GAAP financial measures. |
Consolidated Results
Revenues
Revenues in fiscal 2015 declined by 21.3% versus fiscal 2014 driven by revenue declines in the meetings and Online businesses globally, particularly in North America. Excluding the impact of foreign currency, which
48
Table of Contents
negatively impacted our revenues for fiscal 2015 by $74.4 million, revenues in fiscal 2015 would have declined 16.3% versus fiscal 2014. See “—Segment Results” for additional details on revenues.
Cost of Revenues and Gross Profit
Total cost of revenues in fiscal 2015 declined $ 87.0 million, or 12.8%, versus the prior year. Excluding the impact of the 2015 and 2014 restructuring charges from fiscal 2015 and fiscal 2014, as applicable, total cost of revenues in fiscal 2015 would have declined $83.9 million, or 12.5%, versus the prior year. Gross profit for fiscal 2015 declined $228.5, million or 28.5%, versus the prior year. Excluding the impact of the 2015 and 2014 restructuring charges, gross profit for fiscal 2015 would have decreased by $231.6 million, or 28.7%, from fiscal 2014. Excluding the impact of foreign currency, which negatively impacted our gross profit for fiscal 2015 by $40.9 million, gross profit in fiscal 2015 would have decreased 23.4% versus fiscal 2014. Excluding the impact of the 2015 and 2014 restructuring charges, gross margin in fiscal 2015 would have been 49.4% as compared to gross margin of 54.5% in fiscal 2014. Gross margin compression was driven primarily by the decline in the North America gross margin. The decline in North America gross margin was driven primarily by fixed cost deleverage, and the impact of costs to support 24/7 Expert Chat and technology cost in support of our strategic initiatives. See “—Transformation Plan” for a discussion of our strategic initiatives.
Marketing
Marketing expenses for fiscal 2015 decreased $61.2 million, or 23.3%, versus fiscal 2014. Excluding the impact of foreign currency, which decreased marketing expenses for fiscal 2015 by $13.7 million, marketing expenses in fiscal 2015 would have declined 18.1% versus fiscal 2014. The decline in marketing expense was primarily driven by lower TV media and production costs globally as well as lower agency fees and celebrity and talent costs primarily in the United States. Marketing expenses as a percentage of revenue were 17.3% in fiscal 2015 as compared to 17.7% in the prior year.
Selling, General and Administrative
Selling, general and administrative expenses for fiscal 2015 decreased $36.0 million, or 14.9%, versus fiscal 2014. Excluding the impact of foreign currency, which decreased selling, general and administrative expenses for fiscal 2015 by $8.5 million, selling, general and administrative expenses in fiscal 2015 would have declined 11.4% versus fiscal 2014. Excluding the impact of restructuring charges from fiscal 2015 and the expenses associated with the Winfrey Transaction, and excluding the impact of restructuring charges from fiscal 2014, selling, general and administrative expenses for fiscal 2015 would have decreased by 21.1%, or 17.5% on a constant currency basis, versus fiscal 2014. In fiscal 2015, the Company continued its concerted efforts to reduce costs and continued to invest in certain strategic initiatives during fiscal 2015 which partially offset its reduced costs. See “—Transformation Plan” for a discussion of our strategic initiatives. Selling, general and administrative expenses as a percentage of revenue for fiscal 2015 increased to 17.6% from 16.3% for fiscal 2014. Excluding the impact of restructuring charges and the expenses associated with the Winfrey Transaction from fiscal 2015, and excluding the impact of restructuring charges from fiscal 2014, on a constant currency basis, selling, general and administrative expenses as a percentage of revenue for fiscal 2015 would have been 15.6% as compared to 15.8% for fiscal 2014.
Operating Income
Operating income for fiscal 2015 decreased $131.3 million, or 43.9%, versus fiscal 2014. Excluding the impact of foreign currency, which negatively impacted operating income for fiscal 2015 by $18.7 million, operating income in fiscal 2015 would have declined 37.6% versus the prior fiscal year. This decrease in operating income was predominately the result of lower operating income from North America in fiscal 2015 as compared to the prior year. Excluding the impact of restructuring charges and the expenses associated with the Winfrey Transaction from fiscal 2015, and excluding the impact of restructuring charges from fiscal 2014, our
49
Table of Contents
operating income margin in fiscal 2015 would have decreased to 16.3%, or 16.9% on a constant currency basis, from 21.0% in fiscal 2014. This decline in operating income margin was driven by the decline in gross margin, partially offset by the decline in marketing and selling, general and administrative expenses as a percentage of revenue as compared to the prior year.
Interest Expense
Interest expense in fiscal 2015 decreased $1.1 million, or 0.9%, versus fiscal 2014, which had an additional week of interest expense of approximately $2.3 million as discussed above. Excluding this additional week of interest expense from fiscal 2014, interest expense in fiscal 2015 would have increased by $1.1 million, or 0.9%, versus the prior year. This increase in interest expense was driven primarily by the full year impact of the $1.5 billion interest rate swap which became effective on March 31, 2014, the difference in the notional amount of our interest rate swaps in effect during fiscal 2015 versus the prior year and the interest associated with the revolver borrowing drawn down on July 14, 2015. This increase in interest expense was offset in part by the decrease in our average debt outstanding and a decline of $2.4 million in deferred financing costs which includes cycling against the write-off of $1.6 million recorded in connection with the reduction in the amount of the Revolving Facility from $250.0 million to $50.0 million as well as lower costs associated with lower debt. Our average debt outstanding decreased by $95.9 million to $2,277.0 million in fiscal 2015 from $2,372.9 million in fiscal 2014. This decrease was primarily due to our debt prepayments in March and June 2015. The effective interest rate on our debt, based on interest incurred and our average borrowings during fiscal 2015 and 2014 and excluding the impact of our interest rate swaps, increased by 0.12% per annum to 3.98% per annum at fiscal 2015 year end from 3.86% per annum at fiscal 2014 year end. Including the impact of our interest rate swaps, our effective interest rate on our debt, based on interest incurred and our average borrowings during fiscal 2015 and 2014, increased to 5.07% per annum at fiscal 2015 year end from 4.67% per annum at fiscal 2014 year end. See “—Liquidity and Capital Resources—Long-Term Debt” for additional details regarding interest rates on our debt outstanding, the amendment to our Revolving Facility and our debt prepayments. For additional details on our interest rate swap, see “Item 7A. Quantitative and Qualitative Disclosures about Market Risk” in Part III of this Annual Report on Form 10-K.
Early Extinguishments of Debt
In March 2015, we paid an aggregate amount of cash proceeds totaling $57.4 million plus an amount sufficient to pay accrued and unpaid interest on the amount prepaid to prepay $63.1 million in aggregate principal amount of term loans under the Tranche B-1 Term Facility. In June 2015, we paid an aggregate amount of cash proceeds totaling $77.2 million plus an amount sufficient to pay accrued and unpaid interest on the amount prepaid to prepay $84.9 million in aggregate principal amount of term loans under the Tranche B-1 Term Facility. As a result of these prepayments, we wrote-off fees of $0.6 million, incurred fees of $1.2 million and recorded a gain on early extinguishment of debt of $11.4 million, inclusive of these fees, in fiscal 2015.
Gain on Brazil Acquisition
In March 2014, we acquired an additional 45% equity interest in our Brazilian partnership thereby increasing our equity interest to 80%. As a result of this transaction, we adjusted our previously held equity interest to fair value and recorded a charge associated with the settlement of the royalty-free arrangement of our Brazilian partnership. The net effect of these items resulted in us recognizing a pre-tax gain of $10.5 million in fiscal 2014.
Other Expense, Net
Other expense, net, which consists of the impact of foreign currency on intercompany transactions, decreased by $1.2 million in fiscal 2015 versus the prior year.
50
Table of Contents
Tax
Our effective tax rate was 41.1% for fiscal 2015 as compared to 35.9% for fiscal 2014. This increase in effective tax rate was driven by increases in our net tax expense in fiscal 2015 associated with an increase in Federal and state tax reserves and the write-off of a deferred tax asset related to inventory reserves. This increase in net tax expense was offset by a decrease in net tax expense due to the change in the valuation allowance related to tax benefits for foreign losses that are not expected to be realized.
Net Income Attributable to the Company and Earnings Per Share
Net income attributable to the Company in fiscal 2015 reflected an $84.9 million, or 72.1%, decline from net income attributable to the Company in fiscal 2014. Excluding the impact of foreign currency, which negatively impacted net income attributable to the Company in fiscal 2015 by $11.0 million, net income attributable to the Company in fiscal 2015 would have declined by 62.8% versus the prior year. Excluding the impact of restructuring charges, expenses associated with the Winfrey Transaction and the gain on the early extinguishment of debt from fiscal 2015 and the impact of restructuring charges, the gain on the Brazil acquisition, and the China tax benefit partially offset by the recognition of a valuation allowance from fiscal 2014, net income attributable to the Company in fiscal 2015 would have declined 66.1%, or 56.6% on a constant currency basis, from net income attributable to the Company in fiscal 2014. This decline in net income attributable to the Company was primarily driven by the decrease in operating income in fiscal 2015 versus the prior year.
Earnings per fully diluted share, or EPS, in fiscal 2015 was $0.56. Excluding the impact of restructuring charges, expenses associated with the Winfrey Transaction and the gain on the early extinguishment of debt from fiscal 2015 and the impact of restructuring charges, the gain on the Brazil acquisition, and the China tax benefit partially offset by the recognition of a valuation allowance from fiscal 2014, EPS would have been $0.67 in fiscal 2015 as compared to $2.05 in the prior year. Foreign currency had a negative $0.19 impact on EPS in fiscal 2015. In addition, fiscal 2015 EPS was negatively impacted by $0.02 due to the increased share count resulting from Ms. Winfrey’s equity investment in the Company and the related Winfrey Option.
Segment Results
Metrics and Business Trends
The following tables set forth key metrics by reportable segment for fiscal 2015 and the percentage change in those metrics versus the prior year:
| Fiscal 2015 | ||||||||||||||||||||||||||||||||||||
| GAAP | Constant Currency | |||||||||||||||||||||||||||||||||||
| (in millions unless otherwise stated) |
Service Revenues |
Product Sales & Other |
Total Revenues |
Service Revenues |
Product Sales & Other |
Total Revenues |
Total Paid Weeks |
Incoming Active Base |
EOP Active Base |
|||||||||||||||||||||||||||
| (in thousands) | ||||||||||||||||||||||||||||||||||||
| North America |
$ | 639.4 | $ | 116.0 | $ | 755.4 | $ | 647.0 | $ | 116.9 | $ | 763.9 | 92.6 | 1,617.8 | 1,531.5 | |||||||||||||||||||||
| UK |
87.6 | 37.2 | 124.8 | 94.6 | 40.2 | 134.8 | 17.3 | 277.8 | 263.1 | |||||||||||||||||||||||||||
| CE |
176.1 | 53.0 | 229.1 | 211.1 | 63.3 | 274.4 | 32.8 | 551.9 | 530.7 | |||||||||||||||||||||||||||
|
Other(1) |
34.3 | 20.8 | 55.1 | 42.5 | 23.2 | 65.8 | 4.3 | 62.1 | 64.3 | |||||||||||||||||||||||||||
|
|
|
|
|
|
|
|
|
|
|
|
|
|
|
|
|
|
|
|||||||||||||||||||
| Total |
$ | 937.4 | $ | 227.1 | $ | 1,164.4 | $ | 995.3 | $ | 243.6 | $ | 1,238.8 | 147.0 | 2,509.5 | 2,389.6 | |||||||||||||||||||||
|
|
|
|
|
|
|
|
|
|
|
|
|
|
|
|
|
|
|
|||||||||||||||||||
| % Change Fiscal 2015 vs. Fiscal 2014 | ||||||||||||||||||||||||||||||||||||
| North America |
-19.5 | % | -24.3 | % | -20.3 | % | -19.1 | % | -24.0 | % | -19.9 | % | -20.9 | % | -21.7 | % | -5.3 | % | ||||||||||||||||||
| UK |
-19.4 | % | -22.8 | % | -20.4 | % | -7.9 | % | -11.7 | % | -9.1 | % | -14.3 | % | -6.6 | % | -5.3 | % | ||||||||||||||||||
| CE |
-23.7 | % | -22.0 | % | -23.3 | % | -8.4 | % | -6.3 | % | -7.9 | % | -8.0 | % | 4.4 | % | -3.8 | % | ||||||||||||||||||
|
Other(1) |
-28.6 | % | -26.9 | % | -27.9 | % | -15.9 | % | -20.9 | % | -17.7 | % | -11.0 | % | -12.6 | % | 3.7 | % | ||||||||||||||||||
| Total |
-20.7 | % | -23.8 | % | -21.3 | % | -15.9 | % | -17.8 | % | -16.3 | % | -17.3 | % | -15.3 | % | -4.8 | % | ||||||||||||||||||
Note: Totals may not sum due to rounding
| (1) | Represents Asia Pacific and emerging markets operations and franchise revenues. |
51
Table of Contents
| Fiscal 2015 | ||||||||||||||||||||||||||||||||||||||||
| Meeting Fees | Meeting Paid Weeks |
Incoming Active Meeting Subscribers |
EOP Active Meeting Subscribers |
Online Subscription Revenues |
Online Paid Weeks |
Incoming Active Online Subscribers |
EOP Active Online Subscribers |
|||||||||||||||||||||||||||||||||
| (in millions unless otherwise stated) |
GAAP | Constant Currency |
GAAP | Constant Currency |
||||||||||||||||||||||||||||||||||||
| (in thousands) | (in thousands) | |||||||||||||||||||||||||||||||||||||||
| North America |
$ | 399.5 | $ | 404.3 | 40.8 | 692.6 | 645.1 | $ | 239.9 | $ | 242.7 | 51.7 | 925.2 | 886.4 | ||||||||||||||||||||||||||
| UK |
65.1 | 70.3 | 10.7 | 158.1 | 153.2 | 22.4 | 24.2 | 6.6 | 119.7 | 109.9 | ||||||||||||||||||||||||||||||
| CE |
99.4 | 118.6 | 11.6 | 178.2 | 172.4 | 76.7 | 92.5 | 21.2 | 373.6 | 358.3 | ||||||||||||||||||||||||||||||
|
Other(1) |
23.8 | 29.8 | 2.4 | 26.4 | 27.2 | 10.5 | 12.7 | 1.9 | 35.6 | 37.2 | ||||||||||||||||||||||||||||||
|
|
|
|
|
|
|
|
|
|
|
|
|
|
|
|
|
|
|
|
|
|||||||||||||||||||||
| Total |
$ | 587.8 | $ | 623.1 | 65.5 | 1,055.4 | 997.9 | $ | 349.6 | $ | 372.1 | 81.4 | 1,454.1 | 1,391.8 | ||||||||||||||||||||||||||
|
|
|
|
|
|
|
|
|
|
|
|
|
|
|
|
|
|
|
|
|
|||||||||||||||||||||
| % Change Fiscal 2015 vs. Fiscal 2014 | ||||||||||||||||||||||||||||||||||||||||
| North America |
-19.5 | % | -19.0 | % | -18.9 | % | -16.9 | % | -6.9 | % | -19.6 | % | -19.2 | % | -22.6 | % | -25.0 | % | -4.2 | % | ||||||||||||||||||||
| UK |
-19.4 | % | -7.9 | % | -13.5 | % | -4.7 | % | -3.1 | % | -19.5 | % | -8.1 | % | -15.9 | % | -8.9 | % | -8.2 | % | ||||||||||||||||||||
| CE |
-25.5 | % | -10.8 | % | -9.6 | % | -2.9 | % | -3.3 | % | -21.2 | % | -5.2 | % | -7.0 | % | 8.4 | % | -4.1 | % | ||||||||||||||||||||
|
Other(1) |
-30.3 | % | -16.2 | % | -11.4 | % | -22.0 | % | 2.8 | % | -24.3 | % | -15.1 | % | -11.5 | % | -4.1 | % | 4.4 | % | ||||||||||||||||||||
| Total |
-21.1 | % | -16.3 | % | -16.2 | % | -13.3 | % | -5.4 | % | -20.1 | % | -15.2 | % | -18.3 | % | -16.7 | % | -4.3 | % | ||||||||||||||||||||
Note: Totals may not sum due to rounding
| (1) | Represents Asia Pacific and emerging markets operations and franchise revenues. |
North America Performance
The decline in North America revenues in fiscal 2015 versus the prior year was driven primarily by the decline in Service Revenues. The decline in North America Total Paid Weeks primarily resulted from the lower Incoming Active Base at the beginning of fiscal 2015 versus the beginning of fiscal 2014 as well as from lower recruitments in fiscal 2015 versus the prior year. In response to weakening recruitment trends in early fiscal 2015, North America introduced new advertising and promotions which benefitted year-over-year recruitment trends in both the second and third quarters of fiscal 2015. In the fourth quarter of fiscal 2015, following the announcement of our partnership with Ms. Winfrey in October and our early December launch of our new program through the end of fiscal 2015, recruitments increased as compared to the same period in the prior year.
The decline in North America product sales and other in fiscal 2015 versus the prior year was driven primarily by a decline in in-meeting product sales and to a lesser extent a decline in licensing revenue. In fiscal 2015, in-meeting product sales of $64.8 million decreased by $20.4 million, or 23.9%, versus the prior year. This decrease resulted primarily from a 17.5% attendance decline in fiscal 2015 as compared to the prior year. In-meeting product sales per attendee decreased by 7.7%, or 6.8% on a constant currency basis, in fiscal 2015 versus the prior year, driven primarily by a decline in sales across most product categories. Licensing revenue of $27.5 million declined $9.7 million, or 26.1%, from $37.2 million in the prior year.
United Kingdom Performance
The decline in UK revenues in fiscal 2015 versus the prior year was driven primarily by the decline in Service Revenues. The decline in UK Total Paid Weeks was driven by the lower Incoming Active Base at the beginning of fiscal 2015 versus the beginning of fiscal 2014 coupled with lower recruitments in fiscal 2015 as compared to the prior year. Recruitments in the UK Online business increased in fiscal 2015 as compared to fiscal 2014 driven by the use of new promotional tactics.
The decline in UK product sales and other in fiscal 2015 versus the prior year was driven by both the decline in in-meeting product sales and the decline in licensing revenue. In fiscal 2015, in-meeting product sales of $23.8 million decreased by $6.4 million, or 21.1%, versus fiscal 2014. Excluding the impact of foreign currency, which negatively impacted in-meeting product sales for fiscal 2015 by $2.0 million, in-meeting product
52
Table of Contents
sales in fiscal 2015 would have declined 14.6% versus the prior year. This decrease resulted primarily from a 14.4% attendance decline in fiscal 2015 as compared to fiscal 2014. In-meeting product sales per attendee decreased by 7.8%, but decreased a minimal 0.1% on a constant currency basis, in fiscal 2015 versus the prior year. Licensing revenue of $12.0 million declined $3.9 million, or 24.3%, or 18.5% on a constant currency basis, from $15.8 million in the prior year.
Continental Europe Performance
The decline in Continental Europe revenues in fiscal 2015 versus the prior year was driven primarily by the decline in Service Revenues. The decrease in Continental Europe Service Revenues in fiscal 2015 versus the prior year was primarily the result of a decrease in Meeting Fees and to a lesser extent by a decrease in Online Subscriptions Revenues. This decrease in Meeting Fees was driven by the lower Incoming Active Base at the beginning of fiscal 2015 versus the beginning of fiscal 2014 coupled with lower recruitments in fiscal 2015 as compared to the prior year. Although lower recruitments in the CE Online business in fiscal 2015 versus the prior year negatively impacted Online Paid Weeks, the higher number of Incoming Active Online Subscribers at the start of fiscal 2015 versus the start of fiscal 2014 benefitted Online Subscription Revenues in fiscal 2015.
Continental Europe product sales and other in fiscal 2015 was driven primarily by a decline in in-meeting product sales. In-meeting product sales of $34.2 million decreased by $12.1 million, or 26.1%, versus fiscal 2014. Excluding the impact of foreign currency, which negatively impacted in-meeting product sales for fiscal 2015 by $6.9 million, in-meeting product sales in fiscal 2015 would have declined 11.2% versus the prior year. This decrease resulted primarily from a 13.3% attendance decline in fiscal 2015 as compared to fiscal 2014. In-meeting product sales per attendee decreased by 14.8%, but increased by 2.4% on a constant currency basis, in fiscal 2015 versus the prior year primarily due to lower attendances partially offset by new product launches.
Other Performance
The decline in Other revenue in fiscal 2015 versus fiscal 2014 was primarily driven by revenue declines in Asia Pacific. The decrease in Other Service Revenues in fiscal 2015 versus the prior year was primarily driven by a decline in Other Meeting Paid Weeks, and to a lesser extent by a decline in Other Online Paid Weeks, in Asia Pacific. The declines in paid weeks in Asia Pacific were driven by the lower Incoming Active Base for each of the meetings and Online businesses at the beginning of fiscal 2015 versus the beginning of fiscal 2014 and lower recruitments in fiscal 2015 as compared to fiscal 2014.
The decline in Other product sales and other in fiscal 2015 versus fiscal 2014 was driven in part by a decline in Asia Pacific in-meeting product sales and licensing revenue and from a decline in revenue from our franchisees. Revenues from our franchisees totaled $9.9 million in fiscal 2015, a decline of $1.5 million, or 15%, from the prior year, driven in part by the decline in their meetings business performance, similar to that which we experienced in North America. In fiscal 2015, in-meeting product sales of $4.4 million decreased by $3.0 million, or 40.1%, or 28.2% on a constant currency basis, versus the prior year driven by volume declines as well as a decline in product sales per attendee in Asia Pacific of 22.6%, or 7.1% in constant currency.
RESULTS OF OPERATIONS FOR FISCAL 2014 (53 weeks) COMPARED TO FISCAL 2013 (52 weeks)
The Company’s fiscal year ends on the Saturday closest to December 31st and consists of either 52- or 53-week periods. Fiscal 2014 contained 53 weeks, while fiscal 2013 contained 52 weeks. The 2014 53rd week, which began on December 28, 2014 and ended on January 3, 2015, contributed 1.8 million, or 0.9%, to Total Paid Weeks for fiscal 2014. It also added 0.2 million, or 0.6%, in additional global attendances to fiscal 2014, and drove additional revenues of $14.0 million, or 0.9%, to fiscal 2014. Due to the timing of the 53rd week, additional marketing expense drove a decline in fiscal 2014 operating income. The 53rd week also resulted in an additional week of interest expense. As a result, in the aggregate the 53rd week had a negative $0.05 per share impact on fiscal 2014 EPS. The table below sets forth selected financial information for fiscal 2014 from our
53
Table of Contents
consolidated statements of net income for fiscal 2014 versus selected financial information for fiscal 2013 from our consolidated statements of net income for fiscal 2013.
Summary of Selected Financial Data
| (In millions, except per share amounts) | ||||||||||||||||
| Fiscal 2014 |
Fiscal 2013 |
Increase/ (Decrease) |
% Change |
|||||||||||||
| Revenues, net |
$ | 1,479.9 | $ | 1,724.1 | $ | (244.2 | ) | (14.2 | %) | |||||||
| Cost of revenues |
677.4 | 723.0 | (45.6 | ) | (6.3 | %) | ||||||||||
|
|
|
|
|
|
|
|
|
|||||||||
| Gross profit |
802.6 | 1,001.1 | (198.5 | ) | (19.8 | %) | ||||||||||
| Gross Margin % |
54.2 | % | 58.1 | % | ||||||||||||
| Marketing expenses |
262.3 | 295.6 | (33.3 | ) | (11.3 | %) | ||||||||||
| Selling, general & administrative expenses |
241.0 | 247.7 | (6.7 | ) | (2.7 | %) | ||||||||||
| Operating income |
299.3 | 457.8 | (158.4 | ) | (34.6 | %) | ||||||||||
| Operating Income Margin % |
20.2 | % | 26.6 | % | ||||||||||||
| Interest expense |
123.0 | 103.1 | 19.9 | 19.3 | % | |||||||||||
| Other expense, net |
3.2 | 0.6 | 2.6 | 100.0 | % | |||||||||||
| Gain on Brazil acquisition |
(10.5 | ) | — | (10.5 | ) | — | ||||||||||
| Early extinguishment of debt |
— | 21.7 | (21.7 | ) | (100.0 | %) | ||||||||||
|
|
|
|
|
|
|
|
|
|||||||||
| Income before income taxes |
183.7 | 332.4 | (148.6 | ) | (44.7 | %) | ||||||||||
| Provision for income taxes |
65.9 | 129.6 | (63.7 | ) | (49.1 | %) | ||||||||||
|
|
|
|
|
|
|
|
|
|||||||||
| Net income |
117.7 | 202.7 | (85.0 | ) | (41.9 | %) | ||||||||||
| Net income attributable to the noncontrolling interest |
0.1 | — | 0.1 | — | ||||||||||||
|
|
|
|
|
|
|
|
|
|||||||||
| Net income attributable to Weight Watchers International, Inc. |
$ | 117.8 | $ | 202.7 | $ | (85.0 | ) | (41.9 | %) | |||||||
|
|
|
|
|
|
|
|
|
|||||||||
| Weighted average diluted shares outstanding |
56.7 | 56.4 | 0.3 | 0.6 | % | |||||||||||
|
|
|
|
|
|
|
|
|
|||||||||
| Diluted Earnings Per Share |
$ | 2.08 | $ | 3.60 | $ | (1.52 | ) | (42.2 | %) | |||||||
|
|
|
|
|
|
|
|
|
|||||||||
Note: Totals may not sum due to rounding.
Certain results for fiscal 2014 are adjusted to exclude the $11.8 million impact of charges from the previously disclosed 2014 restructuring plan, $10.5 million related to the gain on the Brazil acquisition and the $2.4 million net tax benefit related to an intercompany loan write-off in connection with the closure of our China business partially offset by the recognition of a valuation allowance related to tax benefits for foreign losses that are not expected to be realized. See “Non-GAAP Financial Measures” above. The table below sets forth a reconciliation of certain of those components of our selected financial data for the fiscal year ended January 3, 2015 which have been adjusted.
| (in millions, except per share amounts) |
Gross Profit |
Gross Profit Margin |
Operating Income |
Operating Income Margin |
Net Income Attributable to Company |
Diluted EPS |
||||||||||||||||||
| Fiscal 2014 |
$ | 802.6 | 54.2 | % | $ | 299.3 | 20.2 | % | $ | 117.8 | $ | 2.08 | ||||||||||||
| Adjustments to Reported Amounts(1) |
||||||||||||||||||||||||
| 2014 Restructuring charges(1) |
4.6 | 11.8 | 7.2 | 0.13 | ||||||||||||||||||||
| Gain on Brazil acquisition(1) |
— | — | (6.4 | ) | (0.11 | ) | ||||||||||||||||||
| Tax benefit, net(1) |
— | — | (2.4 | ) | (0.04 | ) | ||||||||||||||||||
|
|
|
|
|
|
|
|
|
|||||||||||||||||
| Total Adjustments |
4.6 | 11.8 | (1.5 | ) | 0.03 | |||||||||||||||||||
|
|
|
|
|
|
|
|
|
|||||||||||||||||
| Fiscal 2014, as adjusted(1) |
$ | 807.2 | 54.5 | % | $ | 311.1 | 21.0 | % | $ | 116.3 | $ | 2.05 | ||||||||||||
|
|
|
|
|
|
|
|
|
|||||||||||||||||
54
Table of Contents
Note: Totals may not sum due to rounding
| (1) | As adjusted” is a non-GAAP financial measure that adjusts the consolidated statements of net income for fiscal 2014 to exclude the impact of the $11.8 million ($7.2 million after tax) of restructuring charges associated with our previously disclosed 2014 restructuring plan, the impact of the gain of $10.5 million ($6.4 million after tax) recognized in connection with our previously disclosed Brazil acquisition due to an adjustment to our previously held equity interest to fair value offset by a charge associated with the settlement of the royalty-free arrangement of the Brazilian partnership and the impact of the $2.4 million net tax benefit associated with an intercompany loan write-off in connection with the closure of our China business partially offset by the recognition of a valuation allowance related to tax benefits for foreign losses that are not expected to be realized. See “Non-GAAP Financials Measures” above for an explanation of our use of non-GAAP financial measures. |
Certain results for fiscal 2013 are adjusted to exclude the impact of the $21.7 million early extinguishment of debt charge. See “Non-GAAP Financial Measures” above. The table below sets forth a reconciliation of those components of our selected financial data for the fiscal year ended December 28, 2013 which have been adjusted.
| (in millions, except per share amounts) |
Income Before Taxes |
Net Income Attributable to Company |
Diluted EPS |
|||||||||
| Fiscal 2013 |
$ | 332.4 | $ | 202.7 | $ | 3.60 | ||||||
| Adjustments to Reported Amounts(1) |
||||||||||||
| Early extinguishment of debt(1) |
21.7 | 13.3 | 0.3 | |||||||||
|
|
|
|
|
|
|
|||||||
| Total Adjustments |
21.7 | 13.3 | 0.3 | |||||||||
|
|
|
|
|
|
|
|||||||
| Fiscal 2013, as adjusted(1) |
$ | 354.0 | $ | 216.0 | $ | 3.9 | ||||||
|
|
|
|
|
|
|
|||||||
Note: Totals may not sum due to rounding
| (1) | “As adjusted” is a non-GAAP financial measure that adjusts the consolidated statements of net income for fiscal 2013 to exclude the impact of the $21.7 million ($13.3 million after tax) early extinguishment of debt charge associated with our previously reported debt refinancing. See “Non-GAAP Financials Measures” above for an explanation of our use of non-GAAP financial measures. |
Consolidated Results
Revenues
Revenues in fiscal 2014 declined by 14.2% versus fiscal 2013 driven by revenue declines in the meetings and Online businesses globally, most notably in North America. See “—Segment Results” for additional details on revenues.
Cost of Revenues and Gross Profit
Total cost of revenues in fiscal 2014 declined $45.6 million, or 6.3%, versus the prior year. Excluding the impact of the 2014 restructuring charges, total cost of revenues in fiscal 2014 would have declined $50.3 million, or 7.0%, versus the prior year. Excluding the impact of the 2014 restructuring charges, gross profit for fiscal 2014 would have decreased by $193.9 million, or 19.4%, from fiscal 2013. Excluding the impact of the 2014 restructuring charges, gross margin in fiscal 2014 would have been 54.5%, as compared to gross margin of 58.1% in fiscal 2013. Gross margin compression was driven primarily by the decline in the North America gross margin, which was partially offset by an increase in gross margin in Continental Europe. The decline in North America gross margin was driven primarily by fixed cost deleverage and the impact of service provider compensation changes and training and technology in support of the Personal Coaching offering, 24/7 Expert Chat and healthcare initiatives.
Marketing
Marketing expenses for fiscal 2014 decreased $33.3 million, or 11.3%, versus fiscal 2013. The decline was primarily driven by lower TV media and production costs resulting from the integration of TV spots for both our meetings and Online businesses. The decline was also driven by lower and more efficient digital marketing spend
55
Table of Contents
in the United States. This decline was partially offset by the early launch of our winter season brand campaign in the United States. Marketing expenses as a percentage of revenue were 17.7% in fiscal 2014 as compared to 17.1% in the prior year.
Selling, General and Administrative
Selling, general and administrative expenses for fiscal 2014 decreased $6.8 million, or 2.7%, versus fiscal 2013. Excluding the impact of the 2014 restructuring charges, selling, general and administrative expenses for fiscal 2014 would have decreased by 5.6% versus fiscal 2013. In fiscal 2014, the Company made concerted efforts to adopt cost-savings initiatives, including rationalization of its workforce and reduction of its total payroll and discretionary spend. At the same time, the Company decided to invest in certain healthcare and technology initiatives, which partially offset the savings. Selling, general and administrative expenses as a percentage of revenue for fiscal 2014 increased to 16.3% from 14.4% for fiscal 2013. Excluding the impact of the 2014 restructuring charges, selling, general and administrative expenses as a percentage of revenue for fiscal 2014 increased to 15.8% from 14.4% for fiscal 2013.
Operating Income
Operating income for fiscal 2014 decreased $158.4 million, or 34.6%, versus fiscal 2013. This decrease in operating income was almost exclusively the result of lower operating income from North America in fiscal 2014 as compared to the prior year. Excluding the impact of the 2014 restructuring charges, our operating income margin in fiscal 2014 would have decreased to 21.0% from 26.5% in fiscal 2013. This decline in operating income margin was primarily driven by the decline in gross margin, higher selling, general and administrative and marketing expenses as a percentage of revenues, as compared to the prior year.
Interest Expense
Interest expense in fiscal 2014 increased $19.9 million, or 19.3%, versus fiscal 2013. Interest expense for fiscal 2014 included a $1.6 million write-off of deferred financing fees associated with the reduction of the amount of our Revolving Facility (defined hereafter). The increase in interest expense was primarily driven by the difference in the notional amount of our interest rate swaps in effect during fiscal 2014 versus the prior year, the 25 basis point increase related to the issuance of revised corporate ratings by S&P and Moody’s on February 21, 2014 and higher interest rates on our debt as a result of the April 2, 2013 debt refinancing. See “—Liquidity and Capital Resources—Long-Term Debt” for additional details regarding our Revolving Facility and interest rates on our debt. Our average debt outstanding decreased by $24.4 million to $2,372.9 million in fiscal 2014 from $2,397.3 million in fiscal 2013, however, the effective interest rate on our debt, excluding the impact of our interest rate swaps, increased by 0.37% to 3.86% in fiscal 2014 from 3.49% in fiscal 2013. Including the impact of our interest rate swaps, our effective interest rate increased to 4.67% in fiscal 2014 from 3.92% in fiscal 2013. For additional details on our interest rate swap see “—“Item 7A. Quantitative and Qualitative Disclosures about Market Risk” in Part III of this Annual Report on Form 10-K.
Gain on Brazil Acquisition
In March 2014, we acquired an additional 45% equity interest in our Brazilian partnership thereby increasing our equity interest to 80%. As a result of this transaction, we adjusted our previously held equity interest to fair value and recorded a charge associated with the settlement of the royalty-free arrangement of our Brazilian partnership. The net effect of these items resulted in us recognizing a pre-tax gain of $10.5 million in fiscal 2014.
56
Table of Contents
Other Expense, Net
Other expense, net, which consists of the impact of foreign currency on intercompany transactions, increased by $2.6 million in fiscal 2014 versus the prior year.
Tax
Our effective tax rate was 35.9% for fiscal 2014 as compared to 39.0% for fiscal 2013. The decrease was due mainly to the net tax benefit associated with the closure of our China business that was recorded in fiscal 2014 and a shift in the mix of our domestic and foreign earnings which resulted in lower state income taxes. These were offset by the recognition of a valuation allowance that was recorded in fiscal 2014 related to tax benefits previously recorded for foreign losses that are not expected to be realized.
Net Income Attributable to the Company and Earnings Per Share
Net income attributable to the Company in fiscal 2014 declined 41.9% versus fiscal 2013. Excluding the impact of the 2014 restructuring charges, the gain on the Brazil acquisition, the net tax benefit offset by the recognition of a valuation allowance, and the early extinguishment of debt charge, net income attributable to the Company in fiscal 2014 would have declined 46.2% versus the adjusted prior year. This decline in net income attributable to the Company was primarily driven by the decrease in operating income in fiscal 2014 versus the prior year.
EPS in fiscal 2014 decreased to $2.08 versus fiscal 2013. Excluding the impact of the 2014 restructuring charges, the gain on the Brazil acquisition, the net tax benefit offset by the recognition of a valuation allowance and the early extinguishment of debt charge, EPS would have been $2.05 in fiscal 2014 as compared to $3.86 in the prior year.
Segment Results
Metrics and Business Trends
The following tables set forth key metrics by reportable segment for fiscal 2014 and the percentage change in those metrics versus the prior year:
| Fiscal 2014 | ||||||||||||||||||||||||||||||||||||
| GAAP | Constant Currency | |||||||||||||||||||||||||||||||||||
| (in millions unless otherwise stated) |
Service Revenues |
Product Sales & Other |
Total Revenues |
Service Revenues |
Product Sales & Other |
Total Revenues |
Total Paid Weeks |
Incoming Active Base |
EOP Active Base |
|||||||||||||||||||||||||||
| (in thousands) | ||||||||||||||||||||||||||||||||||||
| North America |
$ | 794.4 | $ | 153.3 | $ | 947.7 | $ | 799.6 | $ | 153.8 | $ | 953.4 | 117.1 | 2,066.1 | 1,617.8 | |||||||||||||||||||||
| UK |
108.6 | 48.2 | 156.8 | 102.7 | 45.6 | 148.3 | 20.2 | 297.4 | 277.8 | |||||||||||||||||||||||||||
| CE |
230.9 | 68.0 | 298.9 | 230.5 | 67.6 | 298.1 | 35.6 | 528.4 | 551.9 | |||||||||||||||||||||||||||
|
Other(1) |
48.0 | 28.4 | 76.5 | 50.6 | 29.4 | 79.9 | 4.9 | 71.1 | 62.1 | |||||||||||||||||||||||||||
|
|
|
|
|
|
|
|
|
|
|
|
|
|
|
|
|
|
|
|||||||||||||||||||
| Total |
$ | 1,181.9 | $ | 298.0 | $ | 1,479.9 | $ | 1,183.4 | $ | 296.2 | $ | 1,479.6 | 177.8 | 2,962.9 | 2,509.5 | |||||||||||||||||||||
|
|
|
|
|
|
|
|
|
|
|
|
|
|
|
|
|
|
|
|||||||||||||||||||
| % Change Fiscal 2014 vs. Fiscal 2013 | ||||||||||||||||||||||||||||||||||||
| North America |
-18.0 | % | -21.9 | % | -18.6 | % | -17.4 | % | -21.6 | % | -18.1 | % | -16.8 | % | -12.3 | % | -21.7 | % | ||||||||||||||||||
| UK |
-5.5 | % | -16.6 | % | -9.2 | % | -10.6 | % | -21.2 | % | -14.1 | % | -9.2 | % | -14.3 | % | -6.6 | % | ||||||||||||||||||
| CE |
1.2 | % | -4.6 | % | -0.2 | % | 1.0 | % | -5.2 | % | -0.4 | % | 3.1 | % | 14.6 | % | 4.4 | % | ||||||||||||||||||
|
Other(1) |
-2.8 | % | -25.1 | % | -12.5 | % | 2.4 | % | -22.8 | % | -8.5 | % | -2.2 | % | -7.1 | % | -12.6 | % | ||||||||||||||||||
| Total |
-13.1 | % | -18.0 | % | -14.2 | % | -13.0 | % | -18.5 | % | -14.2 | % | -12.2 | % | -8.6 | % | -15.3 | % | ||||||||||||||||||
Note: Totals may not sum due to rounding
| (1) | Represents Asia Pacific and emerging markets operations and franchise revenues. |
57
Table of Contents
| Fiscal 2014 | ||||||||||||||||||||||||||||||||||||||||
| Meeting Fees | Meeting Paid Weeks |
Incoming Active Meeting Subscribers |
EOP
Active Meeting Subscribers |
Online Subscription Revenues |
Online Paid Weeks |
Incoming Active Online Subscribers |
EOP Active Online Subscribers |
|||||||||||||||||||||||||||||||||
| (in millions unless otherwise stated) |
GAAP | Constant Currency |
GAAP | Constant Currency |
||||||||||||||||||||||||||||||||||||
| (in thousands) | (in thousands) | |||||||||||||||||||||||||||||||||||||||
| North America |
$ | 496.2 | $ | 499.3 | 50.3 | 833.2 | 692.6 | $ | 298.2 | $ | 300.3 | 66.8 | 1,232.9 | 925.2 | ||||||||||||||||||||||||||
| UK |
80.8 | 76.4 | 12.4 | 166.0 | 158.1 | 27.9 | 26.4 | 7.9 | 131.4 | 119.7 | ||||||||||||||||||||||||||||||
| CE |
133.4 | 133.0 | 12.8 | 183.6 | 178.2 | 97.4 | 97.5 | 22.8 | 344.8 | 373.6 | ||||||||||||||||||||||||||||||
|
Other(1) |
34.1 | 35.6 | 2.7 | 33.9 | 26.4 | 13.9 | 15.0 | 2.1 | 37.1 | 35.6 | ||||||||||||||||||||||||||||||
|
|
|
|
|
|
|
|
|
|
|
|
|
|
|
|
|
|
|
|
|
|||||||||||||||||||||
| Total |
$ | 744.6 | $ | 744.3 | 78.2 | 1,216.7 | 1,055.4 | $ | 437.4 | $ | 439.1 | 99.6 | 1,746.2 | 1,454.1 | ||||||||||||||||||||||||||
|
|
|
|
|
|
|
|
|
|
|
|
|
|
|
|
|
|
|
|
|
|||||||||||||||||||||
| % Change Fiscal 2014 vs. Fiscal 2013 | ||||||||||||||||||||||||||||||||||||||||
| North America |
-16.6 | % | -16.1 | % | -15.8 | % | -11.7 | % | -16.9 | % | -20.1 | % | -19.6 | % | -17.5 | % | -12.6 | % | -25.0 | % | ||||||||||||||||||||
| UK |
-5.2 | % | -10.4 | % | -9.6 | % | -18.7 | % | -4.7 | % | -6.2 | % | -11.3 | % | -8.6 | % | -8.0 | % | -8.9 | % | ||||||||||||||||||||
| CE |
-2.8 | % | -3.1 | % | -2.5 | % | -0.9 | % | -2.9 | % | 7.3 | % | 7.4 | % | 6.5 | % | 25.0 | % | 8.4 | % | ||||||||||||||||||||
|
Other(1) |
0.3 | % | 4.8 | % | 6.2 | % | -3.4 | % | -22.0 | % | -9.6 | % | -2.9 | % | -11.0 | % | -10.2 | % | -4.1 | % | ||||||||||||||||||||
| Total |
-12.6 | % | -12.6 | % | -12.3 | % | -11.1 | % | -13.3 | % | -14.1 | % | -13.8 | % | -12.2 | % | -6.7 | % | -16.7 | % | ||||||||||||||||||||
Note: Totals may not sum due to rounding
| (1) | Represents Asia Pacific and emerging markets operations and franchise revenues. |
North America Performance
North America continued to face strong competition for consumer trial from an evolving competitor set, including mobile apps and activity monitors, during fiscal 2014. The Company believes this competition drove declines in all revenue categories in North America in fiscal 2014 versus the prior year. The decline in North America Total Paid Weeks primarily resulted from the lower Incoming Active Base at the beginning of fiscal 2014 versus the beginning of fiscal 2013 as well as from lower recruitments in fiscal 2014 versus the prior year. In response to weakening recruitment trends in early fiscal 2014, North America introduced new advertising and implemented new promotional tactics. In addition, the United States launched its 2014 winter season brand campaign one month early.
The decline in North America product sales and other was driven primarily by a decline in in-meeting product sales and to a lesser extent a decline in licensing revenue. In fiscal 2014, in-meeting product sales of $85.2 million decreased by $33.9 million, or 28.5%, versus the prior year. This decrease resulted primarily from a 15.3% attendance decline in fiscal 2014 as compared to the prior year. In-meeting product sales per attendee decreased by 15.5% in fiscal 2014 versus the prior year, driven primarily by a decline in sales of enrollment products. Licensing revenue of $37.2 million declined $1.4 million, or 3.7%, from $38.6 million in the prior year.
United Kingdom Performance
The decline in UK revenues in fiscal 2014 versus the prior year was driven primarily by the decline in product sales and to a lesser extent a decline in Service Revenues. The decline in UK Total Paid Weeks was driven by the lower Incoming Active Base at the beginning of fiscal 2014 versus the beginning of fiscal 2013 coupled with lower recruitments in fiscal 2014 as compared to the prior year. In response to weakening recruitment trends, primarily in the meetings business, early in fiscal 2014, the United Kingdom introduced new advertising, implemented new promotional tactics and invested in a local marketing campaign to combat a strong local competitor. As a result of these initiatives, although still negative in fiscal 2014, the United Kingdom experienced an improvement in its recruitment trend in the second half of fiscal 2014 as compared to the prior year period.
The decline in UK product sales and other in fiscal 2014 versus the prior year was driven primarily by a decline in in-meeting product sales and to a lesser extent a decline in licensing revenue. In fiscal 2014, in-meeting product sales
58
Table of Contents
of $30.2 million decreased by $5.7 million, or 15.9%, versus the prior year. This decrease resulted primarily from an 11.4% attendance decline in fiscal 2014 as compared to the prior year. In-meeting product sales per attendee also declined by 5.0%, or 10.3% on a constant currency basis, in fiscal 2014 versus the prior year driven by the impact of the Simple Start program on product sales. The decline in licensing revenue was driven by timing associated with brand marketing.
Continental Europe Performance
The decline in Continental Europe revenues in fiscal 2014 versus the prior year was driven primarily by the decline in product sales and other partially offset by an increase in Service Revenues. The increase in Continental Europe Service Revenues on a constant currency basis in fiscal 2014 versus fiscal 2013 was primarily the result of an increase in Online Subscription Revenues versus the prior year. This increase in Online Subscription Revenues was driven by the higher number of Incoming Active Online Subscribers at the start of fiscal 2014 versus the start of fiscal 2013 which drove higher Online Paid Weeks in the year as compared to the prior year. This increase in Online Subscription Revenues more than offset a lower number of Incoming Active Meeting Subscribers and recruitment softness in the meetings business, particularly in Germany, in fiscal 2014.
The decline in Continental Europe product sales and other in fiscal 2014 versus the prior year was driven primarily by both a decline in in-meeting product sales and a decline in licensing revenue. In fiscal 2014, in-meeting product sales of $46.3 million decreased by $1.7 million, or 3.6% (4.4% on a constant currency basis), versus the prior year. This decrease resulted primarily from a 5.2% attendance decline in fiscal 2014 as compared to the prior year. In fiscal 2014, licensing revenue of $10.1 million declined $2.0 million, or 16.2% (16.3% on a constant currency basis), from $12.1 million in the prior year driven by the timing associated with brand marketing.
Other Performance
The decline in Other revenue in fiscal 2014 versus the prior year was driven by revenue declines in Asia Pacific and with our franchisees, partially offset by the beneficial impact of the consolidation of the Brazil operations. The increase in Other Service Revenues in fiscal 2014 versus the prior year was driven by a 6.2% increase in Other Meeting Paid Weeks. The decline in fiscal 2014 Other Total Paid Weeks versus the prior year was driven by the lower Incoming Active Base at the beginning of fiscal 2014 versus the beginning of fiscal 2013 and higher recruitments as compared to the prior year.
The decline in Other product sales and other in fiscal 2014 versus the prior year was driven primarily by a decline in revenue from our franchisees and to a lesser extent our licensees. Revenues from our franchisees totaled $11.4 million in fiscal 2014, a decline of $4.6 million, or 28.8%, from the prior year, driven in part by the decline in their meetings business performance, similar to that which we experienced in North America, and in the number of franchises resulting from our recent franchise acquisitions. In fiscal 2014, licensing revenue declined in part due to the timing of brand revenue from our licensing partners. In fiscal 2014, in-meeting product sales of $7.4 million decreased by $1.6 million, or 17.5% (14.5% on a constant currency basis), versus the prior year driven by volume declines in Asia Pacific partially offset by the impact of the Brazil acquisition.
Liquidity and Capital Resources
Cash flows provided by operating activities have historically supplied, and are expected to continue to supply, us with our primary source of liquidity. We use these cash flows, supplemented with long-term debt and short-term borrowings, to fund our operations and global initiatives, pay down debt and opportunistically engage in selective acquisitions. See “—Transformation Plan” for a discussion of our strategic initiatives. On October 30, 2013, we announced that we suspended our quarterly cash dividend, as described below (see “—Dividends”). We believe that cash generated by our revenue forecast for fiscal 2016 of approximately $1.2 billion, our continued cost focus, the launch of our 2016 winter season program innovation, and our cash on hand
59
Table of Contents
of $241.5 million at the end of fiscal 2015 will provide us with sufficient liquidity to meet our obligations for the next twelve months, including our April 2016 debt maturity obligation of $144.3 million. Our cash on hand of $241.5 million at the end of fiscal 2015 includes the $43.2 million cash payment we received on October 19, 2015 in connection with the Winfrey Transaction and the $48.0 million of proceeds from our revolver borrowing under the Revolving Facility. The revolver borrowing is classified as a short-term liability in consideration of the fact that the terms of the Revolving Facility require an assessment as to whether there have been any material adverse changes with respect to the Company in connection with our monthly interest elections. Although the revolver borrowing is classified as a short-term liability, absent any change in fact and circumstance, we have the ability to extend and not repay the Revolving Facility until its due date of April 2, 2018.
Balance Sheet Working Capital
The following table sets forth certain relevant measures of our balance sheet working capital at:
| January 2, 2016 |
January 3, 2015 |
Increase/ (Decrease) |
||||||||||
| (in millions) | ||||||||||||
| Total current assets |
$ | 359.0 | $ | 425.7 | $ | (66.7 | ) | |||||
| Total current liabilities |
503.1 | 431.7 | 71.4 | |||||||||
|
|
|
|
|
|
|
|||||||
| Working capital deficit |
(144.2 | ) | (6.0 | ) | (138.1 | ) | ||||||
| Cash and cash equivalents |
241.5 | 301.2 | (59.7 | ) | ||||||||
| Current portion of long-term debt |
213.3 | 80.7 | 132.6 | |||||||||
|
|
|
|
|
|
|
|||||||
| Working capital deficit, excluding change in cash and cash equivalents and current portion of long-term debt |
$ | (172.4 | ) | $ | (226.5 | ) | $ | 54.1 | ||||
|
|
|
|
|
|
|
|||||||
We generally operate with negative working capital that is driven in part by our commitment and subscription plans which are our primary payment method. These plans require members and subscribers to pay us for meetings and Online subscription products, respectively, as applicable, before we pay for our obligations in the normal course of business. These prepayments are recorded as a current liability on our balance sheet which has resulted in, and in certain circumstances has helped drive, negative working capital. This core characteristic of our business model is expected to continue. However, during a period in which revenue is declining, we get less working capital benefit from this deferred revenue.
Including changes in cash and cash equivalents and the current portion of long-term debt, our working capital deficit increased by $138.1 million to $144.2 million at January 2, 2016 from $6.0 million at January 3, 2015. This increase in our working capital deficit was driven in large part by the principal debt maturity payment of $144.3 million due on April 2, 2016, reflected in current portion of long-term debt as of January 2, 2016 (included in long-term as of January 3, 2015), and to a lesser extent the decline in year-end cash in fiscal 2015 from fiscal 2014 of $59.7 million. Prepayments of debt during fiscal 2015 as detailed in the following paragraph totaled $150.5 million, which more than offset cash provided by operating activities, the $43.2 million cash payment we received in connection with the Winfrey Transaction and the $48.0 million of proceeds from our revolver borrowing under our Revolving Facility.
On March 25, 2015, we paid an aggregate amount of cash proceeds totaling $57.4 million plus an amount sufficient to pay accrued and unpaid interest on the amount prepaid to prepay $63.1 million in aggregate principal amount of term loans under the Tranche B-1 Term Facility. In addition, we made a voluntary prepayment at par of $2.5 million in respect of such term loans under the Tranche B-1 Term Facility to reduce our then remaining excess cash flow prepayment obligation. For a discussion of this obligation, see “—Long-Term Debt”. On June 26, 2015, we paid an aggregate amount of cash proceeds totaling $77.2 million plus an amount sufficient to pay accrued and unpaid interest on the amount prepaid to prepay $84.9 million in aggregate principal amount of term loans under the Tranche B-1 Term Facility. After making these prepayments and scheduled debt repayments of $21.0 million in fiscal 2015, the current portion of our long-term debt increased to $213.3 million versus the end of fiscal 2014.
60
Table of Contents
Excluding the changes in cash and cash equivalents and current portion of long-term debt at both dates, the working capital deficit at January 2, 2016 decreased by $54.2 million to $172.3 million from $226.5 million at January 3, 2015. The factors contributing to this decrease in our working capital deficit were: (i) a $31.6 million decrease in other operational liabilities arising from lower accrued liabilities and accounts payable balances versus year-end fiscal 2014 primarily driven by reduced marketing spend and a decline in technology transformation spend, (ii) a $17.7 million decrease in accrued salaries and wages driven by lower headcount and a lower bonus payment, (iii) a $7.7 million increase in prepaid income taxes, (iv) a $8.7 million increase in other current assets driven by a tax withholding receivable in Germany, (v) a $4.6 million decrease in deferred revenue driven by a decline in business performance and (vi) a $2.2 million decline in accrued interest. These factors were partially offset by: (i) a $4.5 million decrease in inventory, (ii) a $1.7 million increase in the derivative payable, (iii) a $2.7 million decrease in receivable and (iv) a $9.4 million decrease in income taxes in fiscal 2015.
Cash Flows
The following table sets forth a summary of the Company’s cash flows for the fiscal years ended:
| January 2, 2016 |
January 3, 2015 |
December 28, 2013 |
||||||||||
| (in millions) | ||||||||||||
| Net cash provided by operating activities |
$ | 54.8 | $ | 231.6 | $ | 323.5 | ||||||
| Net cash used in investing activities |
$ | (40.3 | ) | $ | (69.0 | ) | $ | (145.3 | ) | |||
| Net cash used in financing activities |
$ | (68.6 | ) | $ | (29.4 | ) | $ | (74.4 | ) | |||
Operating Activities
Fiscal 2015
Cash flows provided by operating activities of $54.8 million for fiscal 2015 reflected a decrease of $176.8 million from $231.6 million of cash flows provided by operating activities for fiscal 2014. The decrease in cash provided by operating activities was primarily the result of $84.9 million of lower net income attributable to the Company in fiscal 2015 as compared to the prior year and the year-over-year working capital deficit decrease of $84.1 million.
Fiscal 2014
Cash flows provided by operating activities of $231.6 million for fiscal 2014 decreased by $91.9 million from $323.5 million of cash flows provided by operating activities for fiscal 2013. The decrease in cash provided by operating activities was primarily the result of $85.0 million of lower net income attributable to the Company in fiscal 2014 as compared to the prior year.
Fiscal 2013
Cash flows provided by operating activities of $323.5 million for fiscal 2013 decreased by $13.2 million from $336.7 million in fiscal 2012. The decrease in cash provided by operating activities was primarily the result of lower net income in fiscal 2013 as compared to the prior year offset by the add back of the non-cash early extinguishment of debt charge and the intangible and long-lived asset impairment charges in fiscal 2013 as well as a payment to HMRC in fiscal 2012 in connection with the previously reported UK self-employment liability.
61
Table of Contents
Investing Activities
Fiscal 2015
Net cash used in investing activities totaled $40.3 million in fiscal 2015, a decrease of $28.7 million as compared to fiscal 2014. This decrease was primarily attributable to the lower investment in acquisitions in fiscal 2015 versus the prior year. For additional information on our acquisitions, see “Item 6. Selected Financial Data”. In addition, we invested $15.4 million less in our technology and operating infrastructure in the fiscal 2015 as compared to fiscal 2014. See “—Transformation Plan” for a discussion of our strategic initiatives driving our investing activities.
Fiscal 2014
Net cash used for investing activities totaled $69.0 million in fiscal 2014, a decrease of $76.4 million as compared to fiscal 2013. This decrease was primarily attributable to the lower aggregate investment in acquisitions in fiscal 2014 versus the prior year. For additional information on our acquisitions, see “Item 6. Selected Financial Data”. In addition, in fiscal 2014, although we invested in technology and operating infrastructure, as well as healthcare initiatives, we incurred lower capital expenditures as compared to fiscal 2013 which had expenditures in connection with the move of our headquarters and our previously disclosed retail initiative to upgrade our meetings centers.
Fiscal 2013
Net cash used for investing activities totaled $145.3 million in fiscal 2013, an increase of $35.9 million as compared to fiscal 2012. This increase was primarily attributable to the $83.8 million aggregate purchase price paid for franchise acquisitions completed in fiscal 2013. In fiscal 2013, we acquired substantially all of the assets of the following franchisees: Weight Watchers of Alberta Ltd. and Weight Watchers of Saskatchewan Ltd. for an aggregate purchase price of $35.0 million, Weight Watchers of West Virginia, Inc. for a net purchase price of $16.0 million, Weight Watchers of Columbus, Inc. for a net purchase price of $23.3 million, Weight Watchers of Northern Nevada, Inc. for a net purchase price of $4.0 million, Weight Watchers of Manitoba Ltd. for a net purchase price of $5.2 million, and Weight Watchers of Franklin and St. Lawrence Counties Inc. for a net purchase price of $0.3 million. In addition, we incurred capital expenditures in connection with the move of our headquarters, our retail initiative and capitalized software expenditures to support our customer relationship management platform and other global systems initiatives.
Financing Activities
Fiscal 2015
Net cash used in financing activities totaled $68.6 million in fiscal 2015, primarily due to $137.1 million of debt prepayments in connection with the debt tender offers discussed below and scheduled debt repayments of $21.0 million offset by the proceeds of our revolver borrowing of $48.0 million under the Revolving Facility as well as the $43.2 million cash payment we received, offset by $1.7 million of related legal fees, from the sale of our common stock to Ms. Winfrey in fiscal 2015. For a discussion of the debt tender offers, see “—Long-Term Debt”.
Fiscal 2014
Net cash used in financing activities totaled $29.4 million in fiscal 2014, primarily due to term loan payments under the WWI Credit Facility of $30.0 million.
62
Table of Contents
Fiscal 2013
Net cash used for financing activities totaled $74.4 million in fiscal 2013 and included $44.8 million of deferred financing fees in connection with our April 2013 debt refinancing. Additionally, term loan payments under our then-existing credit facility of $2.41 billion were offset by new borrowings of $2.40 billion in connection with our April 2013 debt refinancing. In addition, we paid $29.6 million of dividends to our shareholders which offset $18.3 million in proceeds from stock options exercised and the tax benefit thereon in fiscal 2013.
Long-Term Debt
We currently plan to meet our long-term debt obligations by using cash flows provided by operating activities and opportunistically using other means to repay or refinance our obligations as we determine appropriate.
The following schedule sets forth our long-term debt obligations at January 2, 2016:
Long-Term Debt
At January 2, 2016
(Balances in millions)
| Balance | ||||
| Revolving Facility due April 2, 2018 |
$ | 48.0 | ||
| Tranche B-1 Term Facility due April 2, 2016 |
144.3 | |||
| Tranche B-2 Term Facility due April 2, 2020 |
2,042.3 | |||
|
|
|
|||
| Total Debt |
2,234.6 | |||
| Less Current Portion |
213.3 | |||
|
|
|
|||
| Total Long-Term Debt |
$ | 2,021.3 | ||
|
|
|
|||
Our credit facilities at the end of the first quarter of fiscal 2013 consisted of the following term loan facilities and revolving credit facilities: a tranche B loan, or Term B Loan, a tranche C loan, or Term C Loan, a tranche D loan, or Term D Loan, a tranche E loan, or Term E Loan, a tranche F loan, or Term F Loan, revolving credit facility A-1, or Revolver A-1, and revolving credit facility A-2, or Revolver A-2.
On April 2, 2013, we refinanced our credit facilities pursuant to a new Credit Agreement, or as amended, supplemented or otherwise modified, the Credit Agreement, among the Company, the lenders party thereto, JPMorgan Chase Bank, N.A., as administrative agent and an issuing bank, The Bank of Nova Scotia, as revolving agent, swingline lender and an issuing bank, and the other parties thereto. The Credit Agreement provides for (a) a revolving credit facility (including swing line loans and letters of credit) in an initial aggregate principal amount of $250.0 million that will mature on April 2, 2018, or the Revolving Facility, (b) an initial term B-1 loan credit facility in an aggregate principal amount of $300.0 million that will mature on April 2, 2016, or Tranche B-1 Term Facility, and (c) an initial term B-2 loan credit facility in an aggregate principal amount of $2,100.0 million that will mature on April 2, 2020, or Tranche B-2 Term Facility. We refer herein to the Tranche B-1 Term Facility together with the Tranche B-2 Term Facility as the Term Facilities, and the Term Facilities and Revolving Facility collectively as the WWI Credit Facility. In connection with this refinancing, we used the proceeds from borrowings under the Term Facilities to pay off a total of $2,399.9 million of outstanding loans, consisting of $128.8 million of Term B Loans, $110.6 million of Term C Loans, $117.6 million of Term D Loans, $1,125.0 million of Term E Loans, $817.9 million of Term F Loans, $21.2 million of loans under the Revolver A-1 and $78.8 million of loans under the Revolver A-2. Following the refinancing of a total of $2,399.9 million of loans, at April 2, 2013, we had $2,400.0 million debt outstanding under the Term Facilities and $248.8 million of availability under the Revolving Facility. We incurred fees of $44.8 million during the
63
Table of Contents
second quarter of fiscal 2013 in connection with this refinancing. In the second quarter of fiscal 2013, we wrote-off fees associated with this refinancing which resulted in our recording a charge of $21.7 million in early extinguishment of debt.
On September 26, 2014, we entered into an agreement with certain lenders amending the Credit Agreement that, among other things, eliminated the Financial Covenant (as defined in the Credit Agreement) with respect to the Revolving Facility. In connection with this amendment, we wrote-off deferred financing fees of approximately $1.6 million in the third quarter of fiscal 2014. Concurrently with and in order to effect this amendment, we reduced the amount of the Revolving Facility from $250.0 million to $50.0 million.
Under the terms of the Credit Agreement, depending on our Consolidated Leverage Ratio (as defined in the Credit Agreement), we are obligated to offer to prepay the Term Facilities in an aggregate amount determined by our excess cash flow (as defined in the Credit Agreement). On March 13, 2015, we commenced an offer to prepay at a discount to par up to $75.0 million in aggregate principal amount of term loans outstanding under the Tranche B-1 Term Facility. On March 20, 2015, we accepted offers with a discount equal to or greater than 9.00% in respect of such term loans. On March 25, 2015, we paid an aggregate amount of cash proceeds totaling $57.4 million plus an amount sufficient to pay accrued and unpaid interest on the amount prepaid to prepay $63.1 million in aggregate principal amount of such term loans under the Tranche B-1 Term Facility. This expenditure reduced, on a dollar for dollar basis, our $59.7 million obligation to make a mandatory excess cash flow prepayment offer to the term loan lenders under the terms of the Credit Agreement. In addition, we made a voluntary prepayment at par on March 25, 2015 of $2.5 million in respect of such term loans under the Tranche B-1 Term Facility to reduce the remaining excess cash flow prepayment obligation for fiscal 2015. As a result of this prepayment, we wrote-off fees of $0.3 million, incurred fees of $0.6 million and recorded a gain on early extinguishment of debt of $4.7 million, inclusive of these fees, in the first quarter of fiscal 2015.
On June 17, 2015, we commenced another offer to prepay at a discount to par up to $229.0 million in aggregate principal amount of term loans outstanding under the Tranche B-1 Term Facility. On June 22, 2015, we accepted offers with a discount equal to or greater than 9.00% in respect of such term loans. On June 26, 2015, we paid an aggregate amount of cash proceeds totaling $77.2 million plus an amount sufficient to pay accrued and unpaid interest on the amount prepaid to prepay $84.9 million in aggregate principal amount of such term loans under the Tranche B-1 Term Facility. As a result of this prepayment, we wrote-off fees of $0.3 million, incurred fees of $0.6 million and recorded a gain on early extinguishment of debt of $6.7 million, inclusive of these fees, in the second quarter of fiscal 2015.
On July 14, 2015, we drew down the $48.0 million available on our Revolving Facility in order to enhance our cash position and to provide additional financial flexibility. The revolver borrowing has been classified as a short-term liability in consideration of the fact that the terms of the Revolving Facility require an assessment as to whether there have been any material adverse changes with respect to the Company in connection with our monthly interest elections. Although the revolver borrowing has been classified as a short-term liability, absent any change in fact and circumstance, we have the ability to extend and not repay the Revolving Facility until its due date of April 2, 2018.
At January 2, 2016, under the WWI Credit Facility, we had $2,186.6 million outstanding consisting entirely of term loans, and borrowings of $48.0 million outstanding under the Revolving Facility. In addition, at January 2, 2016, the Revolving Facility had $1.8 million in issued but undrawn letters of credit outstanding thereunder and $0.2 million in available unused commitments thereunder. The proceeds from borrowings under the Revolving Facility (including swing line loans and letters of credit) are available to be used for working capital and general corporate purposes.
At the end of fiscal 2015, fiscal 2014 and fiscal 2013, our debt consisted entirely of variable-rate instruments. Interest rate swaps were entered into to hedge a portion of the cash flow exposure associated with our variable-rate borrowings. The weighted average interest rate on our debt, exclusive of the impact of swaps,
64
Table of Contents
was approximately 3.93%, 3.90%, and 3.65% per annum at the end of fiscal 2015, fiscal 2014 and fiscal 2013, respectively. The weighted average interest rate on our debt, including the impact of swaps, was approximately 5.03%, 4.93%, and 4.08% per annum at the end of fiscal 2015, fiscal 2014 and fiscal 2013, respectively.
Borrowings under the Credit Agreement bear interest at a rate equal to, at our option, LIBOR plus an applicable margin or a base rate plus an applicable margin. LIBOR under the Tranche B-2 Term Facility is subject to a minimum interest rate of 0.75% and the base rate under the Tranche B-2 Term Facility is subject to a minimum interest rate of 1.75%. Under the terms of the Credit Agreement, in the event we receive a corporate rating of BB- (or lower) from S&P and a corporate rating of Ba3 (or lower) from Moody’s, the applicable margin relating to both of the Term Facilities would increase by 25 basis points. On February 21, 2014, both S&P and Moody’s issued revised corporate ratings of the Company of B+ and B1, respectively. As a result, effective February 21, 2014, the applicable margin on borrowings under the Tranche B-1 Term Facility went from 2.75% to 3.00% and on borrowings under the Tranche B-2 Term Facility went from 3.00% to 3.25%. The applicable margin relating to the Revolving Facility will fluctuate depending upon our Consolidated Leverage Ratio. At January 2, 2016, borrowings under the Tranche B-1 Term Facility bore interest at LIBOR plus an applicable margin of 3.00% and borrowings under the Tranche B-2 Term Facility bore interest at LIBOR plus an applicable margin of 3.25%. Based on our Consolidated Leverage Ratio as of January 2, 2016, borrowings under the Revolving Facility bore interest at LIBOR plus an applicable margin of 2.50%. On a quarterly basis, we will pay a commitment fee to the lenders under the Revolving Facility in respect of unutilized commitments thereunder, which commitment fee will fluctuate, but in no event exceed 0.50% per annum, depending upon our Consolidated Leverage Ratio. At our Consolidated Leverage Ratio of 7.52:1.00 as of January 2, 2016, the commitment fee was 0.50% per annum. We also will pay customary letter of credit fees and fronting fees under the Revolving Facility.
The Credit Agreement contains customary covenants including covenants that, in certain circumstances, restrict our ability to incur additional indebtedness, pay dividends on and redeem capital stock, make other payments, including investments, sell our assets and enter into consolidations, mergers and transfers of all or substantially all of our assets. The WWI Credit Facility does not require us to meet any financial maintenance covenants and is guaranteed by certain of our existing and future subsidiaries. Substantially all of our assets secure the WWI Credit Facility.
Dividends
On October 30, 2013, we announced that we suspended our quarterly cash dividend. We currently intend to use the annual cash savings to preserve financial flexibility while funding our strategic growth initiatives and building cash for future debt repayments. Any future determination to declare and pay dividends will be made at the discretion of our Board of Directors, after taking into account our financial results, capital requirements and other factors it may deem relevant. The WWI Credit Facility also contains restrictions on our ability to pay dividends on our common stock.
The WWI Credit Facility provides that we are permitted to pay dividends and extraordinary dividends, as well as repurchase shares of our common stock, so long as we are not in default under the WWI Credit Facility agreement. However, payment of extraordinary dividends and stock repurchases shall not exceed $100.0 million in the aggregate in any fiscal year if the Consolidated Leverage Ratio is greater than 3.25:1. As of January 2, 2016, our Consolidated Leverage Ratio was greater than 3.25:1 and we expect that it will remain above 3.25:1 for the foreseeable future.
Contractual Obligations
We are obligated under non-cancelable agreements primarily for office and rent facilities operating leases. Consolidated rent expense charged to operations under all our leases for fiscal 2015 was approximately $42.1 million.
65
Table of Contents
The following table summarizes our future contractual obligations as of the end of fiscal 2015:
| Payment Due by Period | ||||||||||||||||||||
| Total | Less than 1 Year |
1-3 Years | 3-5 Years | More than 5 Years |
||||||||||||||||
| (in millions) | ||||||||||||||||||||
| Long-Term Debt(1) |
||||||||||||||||||||
| Principal(2) |
$ | 2,234.5 | $ | 213.3 | $ | 42.0 | $ | 1,979.2 | $ | — | ||||||||||
| Interest(2) |
349.1 | 84.9 | 163.8 | 100.4 | — | |||||||||||||||
| Operating leases and non-cancelable agreements |
219.5 | 46.1 | 50.8 | 27.2 | 95.4 | |||||||||||||||
| Other long-term obligations(3) |
10.6 | 0.7 | 1.0 | 0.1 | 8.8 | |||||||||||||||
|
|
|
|
|
|
|
|
|
|
|
|||||||||||
| Total |
$ | 2,813.7 | $ | 345.0 | $ | 257.6 | $ | 2,106.9 | $ | 104.2 | ||||||||||
|
|
|
|
|
|
|
|
|
|
|
|||||||||||
| (1) | Due to the fact that all of our debt is variable rate based, we have assumed for purposes of this table that the interest rate on all of our debt as of the end of fiscal 2015 remains constant for all periods presented. The above does not include the impact of our interest rate swap which has a fair value of $44.2 million, or the $17.7 million of interest expense which is expected to be reclassified from accumulated other comprehensive loss into earnings in fiscal 2016. |
| (2) | The Revolving Facility principal amount of $48.0 million is classified as current and included in the “less than 1 year” caption. As we have the option to extend and not repay until 2018, interest amounts are included in the respective periods in the table above. |
| (3) | “Other long-term obligations” primarily consist of deferred rent costs. The provision for income tax contingencies included in other long-term liabilities on the consolidated balance sheet is not included in the table above due to the fact that the Company is unable to estimate the timing of payment for this liability. |
We currently plan to meet our long-term debt obligations by using cash flows provided by operating activities and opportunistically using other means to repay or refinance our obligations as we determine appropriate. We believe that cash flows from operating activities, together with cash on hand, will provide sufficient liquidity for the next 12 months to fund currently anticipated capital expenditure and working capital requirements, as well as debt service requirements.
Franchise Acquisitions
Although we did not acquire any franchises in fiscal 2015 and 2014, in fiscal 2013, we made the following franchise acquisitions:
In March 2013, we acquired substantially all of the assets of our Alberta and Saskatchewan, Canada franchisees, Weight Watchers of Alberta Ltd. and Weight Watchers of Saskatchewan Ltd., for an aggregate purchase price of $35.0 million.
In July 2013, we acquired substantially all of the assets of our West Virginia franchisee, Weight Watchers of West Virginia, Inc., for a net purchase price of $16.0 million, our Columbus, Ohio franchisee, Weight Watchers of Columbus, Inc., for a net purchase price of $23.3 million and our Reno, Nevada franchisee, Weight Watchers of Northern Nevada, Inc., for a net purchase price of $4.0 million.
In October 2013, we acquired substantially all of the assets of our Manitoba, Canada franchisee, Weight Watchers of Manitoba Ltd., for a net purchase price of $5.2 million and our Franklin and St. Lawrence Counties, New York franchisee, Weight Watchers of Franklin and St. Lawrence Counties Inc., for a net purchase price of $0.3 million.
Acquisition of Additional Equity Interest in Brazil
Prior to March 12, 2014, we had owned 35% of VPM, a Brazilian limited liability partnership. On March 12, 2014, we acquired an additional 45% equity interest in VPM for a net purchase price of $14.2 million.
66
Table of Contents
Acquisition of Wello
On April 16, 2014, we acquired Knowplicity, Inc., d/b/a Wello, an online fitness and personal training company, for a net purchase price of $9.0 million. Payment was in the form of common stock issued of $4.2 million and cash of $4.8 million.
Acquisition of Weilos
On March 11, 2015, we acquired Weilos, a California-based startup with an online social platform that provides a mobile health and weight loss community, for a purchase price of $6.7 million. Payment was in the form of common stock issued of $2.8 million, restricted stock issued of $0.1 million and cash of $2.8 million plus cash in reserves of $1.0 million.
Winfrey Transaction
On October 19, 2015, we issued and sold to Ms. Winfrey an aggregate of 6.4 million shares of our common stock for an aggregate cash purchase price of $43.2 million. For additional details on the Winfrey Transaction, see “Item 1. Business—History—Winfrey Transaction” in Part I of this Annual Report on Form 10-K.
Factors Affecting Future Liquidity
Any future acquisitions, joint ventures or other similar transactions could require additional capital and we cannot be certain that any additional capital will be available on acceptable terms or at all. Our ability to fund our capital expenditure requirements, interest, principal and dividend payment obligations and working capital requirements depends on our future operations, performance and cash flow. These are subject to prevailing economic conditions and to financial, business and other factors, some of which are beyond our control.
Off-Balance Sheet Transactions
As part of our ongoing business, we do not participate in transactions that generate relationships with unconsolidated entities or financial partnerships established for the purpose of facilitating off-balance sheet arrangements or other contractually narrow or limited purposes, such as entities often referred to as structured finance or special purpose entities.
Related Parties
For a discussion of related party transactions affecting us, see “Item 12. Certain Relationships and Related Transactions, and Director Independence” in Part III of this Annual Report on Form 10-K.
Seasonality
Our business is seasonal due to the importance of the winter season to our overall recruitment environment. Our advertising schedule generally supports the three key recruitment-generating seasons of the year: winter, spring and fall, with winter having the highest concentration of advertising spending.
| Item 7A. | Quantitative and Qualitative Disclosures about Market Risk |
We are exposed to market risks relating to interest rate changes and foreign currency fluctuations. All of our market risk sensitive instruments were entered into for purposes other than trading. The Company’s exposure to market risk as of the end of fiscal 2015 is described below.
Interest Rate Risk
Our exposure to market risk for changes in interest rates relates to interest expense of variable rate debt, in particular changes in LIBOR or the base rates which are used to determine the applicable interest rates for
67
Table of Contents
borrowings under the WWI Credit Facility. As of the end of fiscal 2015, borrowings under the Tranche B-1 Term Facility bore interest at LIBOR plus an applicable margin of 3.00%, borrowings under the Tranche B-2 Term Facility bore interest at LIBOR plus an applicable margin of 3.25% and borrowings under the Revolving Facility bore interest at LIBOR plus an applicable margin of 2.50%. As of the end of fiscal 2015, we had $48.0 million outstanding under the Revolving Facility. As of the end of fiscal 2015, we had in effect an interest rate swap with a notional amount totaling $1.5 billion to hedge a portion of our variable rate debt. As of such date, we had $2,234.6 million of variable rate debt, of which $0.7 million remained unhedged.
In January 2009, the Company entered into a forward-starting interest rate swap which had an effective date of January 4, 2010 and a termination date of January 27, 2014. From December 29, 2012 through April 1, 2013, this swap had qualified for hedge accounting, and therefore changes in the fair value of this derivative were recorded in accumulated other comprehensive income (loss). Effective April 2, 2013, due to the Company’s debt refinancing, the Company ceased the application of hedge accounting for this swap. Accordingly, changes in the fair value of this swap were recorded in earnings subsequent to April 2, 2013 and were immaterial for the fiscal year ended January 3, 2015.
On July 26, 2013, in order to hedge an additional portion of its variable rate debt, the Company entered into a forward-starting interest rate swap with an effective date of March 31, 2014 and a termination date of April 2, 2020. The initial notional amount of this swap was $1.5 billion. During the term of this swap, the notional amount will decrease from $1.5 billion effective March 31, 2014 to $1.25 billion on April 3, 2017 with a further reduction to $1.0 billion on April 1, 2019. This interest rate swap effectively fixes the variable interest rate on the notional amount of this swap at 2.38%. This swap qualifies for hedge accounting and, therefore, changes in the fair value of this swap have been recorded in accumulated other comprehensive income (loss).
At the end of fiscal 2015, borrowings under (a) the Tranche B-1 Term Facility bore interest at LIBOR plus an applicable margin of 3.00% and (b) the Tranche B-2 Term Facility bore interest at LIBOR plus an applicable margin of 3.25%. For the Tranche B-2 Term Facility, the minimum interest rate for LIBOR applicable to such facility pursuant to the terms of the Credit Agreement is set at 0.75%, referred to herein as the B-2 LIBOR Floor. In addition, at the end of fiscal 2015, our interest rate swap in effect had a notional amount of $1.5 billion. Accordingly, as of the end of fiscal 2015, based on the amount of variable rate debt including the impact of the interest rate swap and the B-2 LIBOR Floor, a hypothetical 50 basis point increase in interest rates would increase annual interest expense by approximately $2.9 million and a hypothetical 50 basis point decrease in interest rates would decrease annual interest expense by approximately $0.6 million. This increase or decrease is primarily driven by our Tranche B-1 Term Facility which had no interest rate swap associated with it and was not subject to the B-2 LIBOR Floor.
There have been no material changes to the Company’s exposure to market risk from the end of fiscal 2014 as compared to the end of fiscal 2015.
Foreign Currency Risk
Other than inter-company transactions between our domestic and foreign entities, we generally do not have significant transactions that are denominated in a currency other than the functional currency applicable to each entity. As a result, substantially all of our revenues and expenses in each jurisdiction in which we operate are in the same functional currency. In general, we are a net receiver of currencies other than the US dollar. Accordingly, changes in exchange rates may negatively affect our revenues and gross margins as expressed in US dollars. In the future, we may enter into forward and swap contracts to hedge transactions denominated in foreign currencies to reduce the currency risk associated with fluctuating exchange rates. Realized and unrealized gains and losses from any of these transactions may be included in net income for the period.
Fluctuations in currency exchange rates, particularly with respect to the euro, canadian dollar and pound sterling, may impact our shareholders’ equity. The assets and liabilities of our non-US subsidiaries are translated into US dollars at the exchange rates in effect at the balance sheet date. Revenues and expenses are translated into US dollars at the average exchange rate for the period. The resulting translation adjustments are recorded in shareholders’ equity as a component of accumulated other comprehensive loss. In addition, exchange rate fluctuations will cause the US dollar translated amounts to change in comparison to prior periods.
68
Table of Contents
| Item 8. | Financial Statements and Supplementary Data |
This information is incorporated by reference to our consolidated financial statements on pages F-1 through F-40 and our financial statement schedule on page S-1, including the report thereon of PricewaterhouseCoopers LLP on page F-2.
| Item 9. | Changes in and Disagreements with Accountants on Accounting and Financial Disclosure |
None.
| Item 9A. | Controls and Procedures |
Disclosure Controls and Procedures
We maintain disclosure controls and procedures that are designed to ensure that information required to be disclosed in our reports under the Exchange Act is recorded, processed, summarized and reported within the time periods specified in the Securities and Exchange Commission’s rules and forms, and that such information is accumulated and communicated to our management, including our principal executive officer and principal financial officer, as appropriate, to allow timely decisions regarding required disclosures. Any controls and procedures, no matter how well designed and operated, can provide only reasonable assurance of achieving the desired control objectives. Our management, with the participation of our principal executive officer and principal financial officer, has evaluated the effectiveness of the design and operation of our disclosure controls and procedures as of January 2, 2016, the end of fiscal 2015. Based upon that evaluation and subject to the foregoing, our principal executive officer and principal financial officer concluded that, as of the end of fiscal 2015, the design and operation of our disclosure controls and procedures were effective at the reasonable assurance level.
Internal Control Over Financial Reporting
Management’s Annual Report on Internal Control Over Financial Reporting
Our management is responsible for establishing and maintaining adequate internal control over financial reporting. Internal control over financial reporting is a process designed under the supervision and with the participation of our management, including our principal executive officer and principal financial officer, to provide reasonable assurance regarding the reliability of financial reporting and the preparation of financial statements for external purposes in accordance with accounting principles generally accepted in the United States of America (“GAAP”).
Our management assessed the effectiveness of our internal control over financial reporting as of January 2, 2016, the end of fiscal 2015. In making this assessment, our management used the criteria set forth by the Committee of Sponsoring Organizations of the Treadway Commission (COSO) in Internal Control—Integrated Framework (2013). Based on this assessment, our management, under the supervision and with the participation of our principal executive officer and principal financial officer, concluded that, as of January 2, 2016, our internal control over financial reporting was effective based on those criteria.
The effectiveness of our internal control over financial reporting as of January 2, 2016 has been audited by PricewaterhouseCoopers LLP, an independent registered public accounting firm, as stated in their report which appears on page F-2 to our consolidated financial statements.
Changes in Internal Control Over Financial Reporting
There was no change in our internal control over financial reporting that occurred during our most recent fiscal quarter that has materially affected, or is reasonably likely to materially affect, our internal control over financial reporting.
| Item 9B. | Other Information |
None.
69
Table of Contents
| Directors, Executive Officers and Corporate Governance; Executive Compensation; Security Ownership of Certain Beneficial Owners and Management and Related Shareholder Matters; Certain Relationships and Related Transactions, and Director Independence; Principal Accountant Fees and Services |
Information called for by Items 10, 11, 12, 13 and 14 of Part III of this Annual Report on Form 10-K is incorporated by reference from our definitive Proxy Statement to be filed in connection with our 2016 Annual Meeting of Shareholders pursuant to Regulation 14A, except that (i) certain of the information regarding our directors and executive officers called for by Items 401(a), (b) and (e) of Regulation S-K has been included in Part I of this Annual Report on Form 10-K; (ii) the information regarding certain Company equity compensation plans called for by Item 201(d) of Regulation S-K is set forth below and (iii) the information regarding our Amended and Restated Code of Business Conduct and Ethics, or the Code of Business Conduct and Ethics, called for by Item 406 of Regulation S-K is set forth below.
Securities Authorized for Issuance Under Equity Compensation Plans
The following table summarizes our equity compensation plan information as of January 2, 2016:
Equity Compensation Plan Information
| Plan category |
Number of securities to be issued upon exercise of outstanding options, warrants and rights(1) (a) |
Weighted-average exercise price of outstanding options, warrants and rights(2) (b) |
Number of securities remaining available for future issuance under equity compensation plans (excluding securities reflected in column (a))(3) (c) |
|||||||||
| Equity compensation plans approved by security holders |
6,603,327 | $ | 9.52 | 1,133,985 | ||||||||
| Equity compensation plans not approved by security holders |
— | — | — | |||||||||
|
|
|
|
|
|
|
|||||||
| Total |
6,603,327 | $ | 9.52 | 1,133,985 | ||||||||
|
|
|
|
|
|
|
|||||||
| (1) | Consists of 1,816,513 shares of our common stock issuable upon the exercise of outstanding options awarded under our Amended and Restated 2014 Stock Incentive Plan, or 2014 Plan, our 2008 Stock Incentive Plan, or 2008 Plan, and our 2004 Stock Incentive Plan, or 2004 Plan; 3,513,468 shares of our common stock issuable upon the exercise of the Winfrey Option granted pursuant to the Winfrey Option Agreement; and 1,273,346 shares of our common stock issuable upon the vesting of restricted stock units awarded under our 2014 Plan, 2008 Plan and 2004 Plan. The Winfrey Option was approved by the written consent of Artal Luxembourg which, as of the date thereof, controlled a majority of the voting power of our outstanding common stock. For additional details on the Winfrey Option and Winfrey Option Agreement, see “Item 1. Business—History—Winfrey Transaction” of this Annual Report on Form 10-K. |
| (2) | Includes weighted average exercise price of outstanding stock options of $11.79 and restricted stock units of $0. |
| (3) | Consists of shares of our common stock issuable under our 2014 Plan pursuant to various awards the Compensation and Benefits Committee may make, including non-qualified stock options, incentive stock options, stock appreciation rights, restricted stock units, restricted stock and other equity-based awards. In connection with the initial approval of our 2014 Plan on May 6, 2014, the 2014 Plan replaced the 2004 Plan and the 2008 Plan with respect to prospective equity grants. |
Code of Business Conduct and Ethics
We have adopted a Code of Business Conduct and Ethics for our officers, including our principal executive officer, principal financial officer, principal accounting officer or controller, and our employees and directors. Our Code of Business Conduct and Ethics is available on our website at www.weightwatchersinternational.com.
70
Table of Contents
In addition to any disclosures required under the Exchange Act, the date and nature of any substantive amendment of our Code of Business Conduct and Ethics or waiver thereof applicable to any of our principal executive officer, principal financial officer, principal accounting officer or controller or persons performing similar functions, and that relates to any element of the code of ethics definition enumerated in Item 406(b) of Regulation S-K, will be disclosed on our website at www.weightwatchersinternational.com within four business days of the date of such amendment or waiver. In the case of a waiver, the name of the person to whom the waiver was granted will also be disclosed on our website within four business days of the date of such waiver.
71
Table of Contents
| Item 15. | Exhibits and Financial Statement Schedules |
| 1. | Financial Statements |
The financial statements listed in the Index to Financial Statements and Financial Statement Schedule on page F-1 are filed as part of this Annual Report on Form 10-K.
| 2. | Financial Statement Schedule |
The financial statement schedule listed in the Index to Financial Statements and Financial Statement Schedule on page F-1 is filed as part of this Annual Report on Form 10-K.
| 3. | Exhibits |
The exhibits listed in the Exhibit Index are filed as part of this Annual Report on Form 10-K.
72
Table of Contents
WEIGHT WATCHERS INTERNATIONAL, INC. AND SUBSIDIARIES
INDEX TO FINANCIAL STATEMENTS AND FINANCIAL STATEMENT SCHEDULE COVERED BY
REPORT OF INDEPENDENT REGISTERED PUBLIC ACCOUNTING FIRM
Items 15(a) (1) & (2)
| Pages | ||||
| Report of Independent Registered Public Accounting Firm |
F-2 | |||
| Consolidated Balance Sheets at January 2, 2016 and January 3, 2015 |
F-3 | |||
| Consolidated Statements of Income for the fiscal years ended January 2, 2016, January 3, 2015 and December 28, 2013 |
F-4 | |||
| Consolidated Statements of Comprehensive Income for the fiscal years ended January 2, 2016, January 3, 2015 and December 28, 2013 |
F-5 | |||
| Consolidated Statements of Changes in Total Deficit for the fiscal years ended January 2, 2016, January 3, 2015 and December 28, 2013 |
F-6 | |||
| Consolidated Statements of Cash Flows for the fiscal years ended January 2, 2016, January 3, 2015 and December 28, 2013 |
F-7 | |||
| Notes to Consolidated Financial Statements |
F-8 | |||
| Schedule II—Valuation and Qualifying Accounts and Reserves for the fiscal years ended January 2, 2016, January 3, 2015 and December 28, 2013 |
S-1 | |||
All other schedules are omitted for the reason that they are either not required, not applicable, not material or the information is included in the consolidated financial statements or notes thereto.
F-1
Table of Contents
Report of Independent Registered Public Accounting Firm
To the Board of Directors and Shareholders of Weight Watchers International, Inc.
In our opinion, the consolidated financial statements listed in the accompanying index appearing on page F-1 present fairly, in all material respects, the financial position of Weight Watchers International, Inc. and its subsidiaries (the “Company”) at January 2, 2016 and January 3, 2015, and the results of their operations and their cash flows for each of the three years in the period ended January 2, 2016 in conformity with accounting principles generally accepted in the United States of America. In addition, in our opinion, the financial statement schedule listed in the accompanying index presents fairly, in all material respects, the information set forth therein when read in conjunction with the related consolidated financial statements. Also in our opinion, the Company maintained, in all material respects, effective internal control over financial reporting as of January 2, 2016, based on criteria established in Internal Control - Integrated Framework (2013) issued by the Committee of Sponsoring Organizations of the Treadway Commission (COSO). The Company’s management is responsible for these financial statements and financial statement schedule, for maintaining effective internal control over financial reporting and for its assessment of the effectiveness of internal control over financial reporting, included in Management’s Annual Report on Internal Control Over Financial Reporting appearing under Item 9A. Our responsibility is to express opinions on these financial statements, on the financial statement schedule, and on the Company’s internal control over financial reporting based on our integrated audits. We conducted our audits in accordance with the standards of the Public Company Accounting Oversight Board (United States). Those standards require that we plan and perform the audits to obtain reasonable assurance about whether the financial statements are free of material misstatement and whether effective internal control over financial reporting was maintained in all material respects. Our audits of the financial statements included examining, on a test basis, evidence supporting the amounts and disclosures in the financial statements, assessing the accounting principles used and significant estimates made by management, and evaluating the overall financial statement presentation. Our audit of internal control over financial reporting included obtaining an understanding of internal control over financial reporting, assessing the risk that a material weakness exists, and testing and evaluating the design and operating effectiveness of internal control based on the assessed risk. Our audits also included performing such other procedures as we considered necessary in the circumstances. We believe that our audits provide a reasonable basis for our opinions.
A company’s internal control over financial reporting is a process designed to provide reasonable assurance regarding the reliability of financial reporting and the preparation of financial statements for external purposes in accordance with generally accepted accounting principles. A company’s internal control over financial reporting includes those policies and procedures that (i) pertain to the maintenance of records that, in reasonable detail, accurately and fairly reflect the transactions and dispositions of the assets of the company; (ii) provide reasonable assurance that transactions are recorded as necessary to permit preparation of financial statements in accordance with generally accepted accounting principles, and that receipts and expenditures of the company are being made only in accordance with authorizations of management and directors of the company; and (iii) provide reasonable assurance regarding prevention or timely detection of unauthorized acquisition, use, or disposition of the company’s assets that could have a material effect on the financial statements.
Because of its inherent limitations, internal control over financial reporting may not prevent or detect misstatements. Also, projections of any evaluation of effectiveness to future periods are subject to the risk that controls may become inadequate because of changes in conditions, or that the degree of compliance with the policies or procedures may deteriorate.
/s/ PricewaterhouseCoopers LLP
New York, New York
March 2, 2016
F-2
Table of Contents
WEIGHT WATCHERS INTERNATIONAL, INC. AND SUBSIDIARIES
CONSOLIDATED BALANCE SHEETS AT
(IN THOUSANDS)
| January 2, 2016 |
January 3, 2015 |
|||||||
| ASSETS |
||||||||
| CURRENT ASSETS |
||||||||
| Cash and cash equivalents |
$ | 241,526 | $ | 301,212 | ||||
| Receivables (net of allowances: January 2, 2016—$2,226 and January 3, 2015—$3,287) |
29,281 | 31,960 | ||||||
| Inventories |
27,838 | 32,382 | ||||||
| Deferred income taxes |
7,516 | 23,744 | ||||||
| Prepaid expenses and other current assets |
52,812 | 36,367 | ||||||
|
|
|
|
|
|||||
| TOTAL CURRENT ASSETS |
358,973 | 425,665 | ||||||
| Property and equipment, net |
58,186 | 74,650 | ||||||
| Franchise rights acquired |
747,326 | 760,883 | ||||||
| Goodwill |
159,331 | 168,279 | ||||||
| Trademarks and other intangible assets, net |
66,339 | 68,115 | ||||||
| Deferred financing costs, net |
25,209 | 32,742 | ||||||
| Other noncurrent assets |
6,720 | 4,306 | ||||||
|
|
|
|
|
|||||
| TOTAL ASSETS |
$ | 1,422,084 | $ | 1,534,640 | ||||
|
|
|
|
|
|||||
| LIABILITIES AND TOTAL DEFICIT |
||||||||
| CURRENT LIABILITIES |
||||||||
| Portion of long-term debt due within one year |
$ | 213,323 | $ | 80,728 | ||||
| Accounts payable |
38,225 | 52,411 | ||||||
| Salaries and wages payable |
47,042 | 64,785 | ||||||
| Accrued marketing and advertising |
21,554 | 20,540 | ||||||
| Accrued interest |
20,739 | 22,965 | ||||||
| Other accrued liabilities |
56,477 | 81,653 | ||||||
| Derivative payable |
44,170 | 42,423 | ||||||
| Deferred revenue |
61,597 | 66,190 | ||||||
|
|
|
|
|
|||||
| TOTAL CURRENT LIABILITIES |
503,127 | 431,695 | ||||||
| Long-term debt |
2,021,250 | 2,277,272 | ||||||
| Deferred income taxes |
159,539 | 176,278 | ||||||
| Other |
23,876 | 16,883 | ||||||
|
|
|
|
|
|||||
| TOTAL LIABILITIES |
2,707,792 | 2,902,128 | ||||||
| Commitments and contingencies (Note 14) |
||||||||
| Redeemable noncontrolling interest |
4,450 | 5,553 | ||||||
| TOTAL DEFICIT |
||||||||
| Common stock, $0 par value; 1,000,000 shares authorized; 118,855 shares issued at January 2, 2016 and 112,195 shares issued at January 3, 2015 |
0 | 0 | ||||||
| Treasury stock, at cost, 55,301 shares at January 2, 2016 and 55,485 shares at January 3, 2015 |
(3,247,406 | ) | (3,253,597 | ) | ||||
| Retained earnings |
1,994,513 | 1,900,506 | ||||||
| Accumulated other comprehensive loss |
(37,265 | ) | (19,950 | ) | ||||
|
|
|
|
|
|||||
| TOTAL DEFICIT |
(1,290,158 | ) | (1,373,041 | ) | ||||
|
|
|
|
|
|||||
| TOTAL LIABILITIES AND TOTAL DEFICIT |
$ | 1,422,084 | $ | 1,534,640 | ||||
|
|
|
|
|
|||||
The accompanying notes are an integral part of the consolidated financial statements.
F-3
Table of Contents
WEIGHT WATCHERS INTERNATIONAL, INC. AND SUBSIDIARIES
CONSOLIDATED STATEMENTS OF INCOME FOR THE FISCAL YEARS ENDED
(IN THOUSANDS, EXCEPT PER SHARE AMOUNTS)
| January 2, 2016 |
January 3, 2015 |
December28, 2013 |
||||||||||
| (52 weeks) | (53 weeks) | (52 weeks) | ||||||||||
| Service revenues, net |
$ | 937,368 | $ | 1,181,945 | $ | 1,360,761 | ||||||
| Product sales and other, net |
227,051 | 297,971 | 363,362 | |||||||||
|
|
|
|
|
|
|
|||||||
| Revenues, net |
1,164,419 | 1,479,916 | 1,724,123 | |||||||||
|
|
|
|
|
|
|
|||||||
| Cost of services |
477,926 | 535,320 | 558,451 | |||||||||
| Cost of product sales and other |
112,406 | 142,045 | 164,560 | |||||||||
|
|
|
|
|
|
|
|||||||
| Cost of revenues |
590,332 | 677,365 | 723,011 | |||||||||
|
|
|
|
|
|
|
|||||||
| Gross profit |
574,087 | 802,551 | 1,001,112 | |||||||||
| Marketing expenses |
201,021 | 262,258 | 295,628 | |||||||||
| Selling, general and administrative expenses |
205,008 | 240,979 | 247,732 | |||||||||
|
|
|
|
|
|
|
|||||||
| Operating income |
168,058 | 299,314 | 457,752 | |||||||||
| Interest expense |
121,843 | 122,984 | 103,108 | |||||||||
| Other expense, net |
2,027 | 3,206 | 599 | |||||||||
| Gain on Brazil acquisition |
0 | (10,540 | ) | 0 | ||||||||
| (Gain) loss on early extinguishment of debt |
(11,426 | ) | 0 | 21,685 | ||||||||
|
|
|
|
|
|
|
|||||||
| Income before income taxes |
55,614 | 183,664 | 332,360 | |||||||||
| Provision for income taxes |
22,835 | 65,931 | 129,618 | |||||||||
|
|
|
|
|
|
|
|||||||
| Net income |
32,779 | 117,733 | 202,742 | |||||||||
| Net loss attributable to the noncontrolling interest |
166 | 54 | 0 | |||||||||
|
|
|
|
|
|
|
|||||||
| Net income attributable to Weight Watchers International, Inc. |
$ | 32,945 | $ | 117,787 | $ | 202,742 | ||||||
|
|
|
|
|
|
|
|||||||
| Earnings Per Share attributable to Weight Watchers International, Inc. |
||||||||||||
| Basic |
$ | 0.56 | $ | 2.08 | $ | 3.61 | ||||||
|
|
|
|
|
|
|
|||||||
| Diluted |
$ | 0.56 | $ | 2.08 | $ | 3.60 | ||||||
|
|
|
|
|
|
|
|||||||
| Weighted average common shares outstanding |
||||||||||||
| Basic |
58,369 | 56,607 | 56,144 | |||||||||
|
|
|
|
|
|
|
|||||||
| Diluted |
58,966 | 56,705 | 56,394 | |||||||||
|
|
|
|
|
|
|
|||||||
| Dividends declared per common share |
$ | 0.00 | $ | 0.00 | $ | 0.53 | ||||||
|
|
|
|
|
|
|
|||||||
The accompanying notes are an integral part of the consolidated financial statements.
F-4
Table of Contents
WEIGHT WATCHERS INTERNATIONAL, INC. AND SUBSIDIARIES
CONSOLIDATED STATEMENTS OF COMPREHENSIVE INCOME FOR THE FISCAL YEARS ENDED
(IN THOUSANDS)
| January 2, 2016 |
January 3, 2015 |
December 28, 2013 |
||||||||||
| (52 weeks) | (53 weeks) | (52 weeks) | ||||||||||
| Net income |
$ | 32,779 | $ | 117,733 | $ | 202,742 | ||||||
| Other comprehensive loss: |
||||||||||||
| Foreign currency translation adjustments |
(27,824 | ) | (19,167 | ) | (10,363 | ) | ||||||
| Income tax effect on foreign currency translation losses |
10,851 | 7,475 | 4,022 | |||||||||
|
|
|
|
|
|
|
|||||||
| Foreign currency translation adjustments, net of taxes |
(16,973 | ) | (11,692 | ) | (6,341 | ) | ||||||
|
|
|
|
|
|
|
|||||||
| Changes in (loss) gain on derivatives |
(2,096 | ) | (28,283 | ) | 3,277 | |||||||
| Income tax benefit (expense) on gain (loss) on derivatives |
817 | 11,030 | (1,278 | ) | ||||||||
|
|
|
|
|
|
|
|||||||
| Changes in (loss) gain on derivatives, net of taxes |
(1,279 | ) | (17,253 | ) | 1,999 | |||||||
|
|
|
|
|
|
|
|||||||
| Total other comprehensive loss |
(18,252 | ) | (28,945 | ) | (4,342 | ) | ||||||
|
|
|
|
|
|
|
|||||||
| Comprehensive income |
14,527 | 88,788 | 198,400 | |||||||||
| Less: Net loss attributable to the noncontrolling interest |
166 | 54 | 0 | |||||||||
| Less: Foreign currency translation losses, net of taxes attributable to the noncontrolling interest |
937 | 478 | 0 | |||||||||
|
|
|
|
|
|
|
|||||||
| Comprehensive loss attributable to the noncontrolling interest |
1,103 | 532 | 0 | |||||||||
|
|
|
|
|
|
|
|||||||
| Comprehensive income attributable to Weight Watchers International, Inc. |
$ | 15,630 | $ | 89,320 | $ | 198,400 | ||||||
|
|
|
|
|
|
|
|||||||
The accompanying notes are an integral part of the consolidated financial statements.
F-5
Table of Contents
WEIGHT WATCHERS INTERNATIONAL, INC. AND SUBSIDIARIES
CONSOLIDATED STATEMENTS OF CHANGES IN TOTAL DEFICIT
(IN THOUSANDS)
| Weight Watchers International, Inc. | ||||||||||||||||||||||||||||||||
| Redeemable Noncontrolling Interest |
Common Stock | Treasury Stock | Accumulated Other Comprehensive Income (Loss) |
Retained Earnings |
Total | |||||||||||||||||||||||||||
| Shares | Amount | Shares | Amount | |||||||||||||||||||||||||||||
| Balance at December 29, 2012 |
$ | 0 | 111,988 | $ | 0 | 56,234 | $ | (3,281,831 | ) | $ | 12,859 | $ | 1,603,513 | $ | (1,665,459 | ) | ||||||||||||||||
|
|
|
|
|
|
|
|
|
|
|
|
|
|
|
|
|
|||||||||||||||||
| Comprehensive (Loss) Income |
0 | (4,342 | ) | 202,742 | 198,400 | |||||||||||||||||||||||||||
| Issuance of treasury stock under stock plans |
(672 | ) | 25,425 | (10,304 | ) | 15,121 | ||||||||||||||||||||||||||
| Tax benefit of restricted stock units vested and stock options exercised |
537 | 537 | ||||||||||||||||||||||||||||||
| Cash dividends declared |
(29,459 | ) | (29,459 | ) | ||||||||||||||||||||||||||||
| Compensation expense on share-based awards |
4,255 | 4,255 | ||||||||||||||||||||||||||||||
|
|
|
|
|
|
|
|
|
|
|
|
|
|
|
|
|
|||||||||||||||||
| Balance at December 28, 2013 |
$ | 0 | 111,988 | $ | 0 | 55,562 | $ | (3,256,406 | ) | $ | 8,517 | $ | 1,771,284 | $ | (1,476,605 | ) | ||||||||||||||||
|
|
|
|
|
|
|
|
|
|
|
|
|
|
|
|
|
|||||||||||||||||
| Comprehensive (Loss) Income |
(532 | ) | (28,467 | ) | 117,787 | 89,320 | ||||||||||||||||||||||||||
| Issuance of treasury stock under stock plans |
(77 | ) | 2,809 | (2,559 | ) | 250 | ||||||||||||||||||||||||||
| Tax benefit of restricted stock units vested and stock options exercised |
(788 | ) | (788 | ) | ||||||||||||||||||||||||||||
| Cash dividends |
42 | 42 | ||||||||||||||||||||||||||||||
| Compensation expense on share-based awards |
10,533 | 10,533 | ||||||||||||||||||||||||||||||
| Acquisition of Wello |
207 | 4,207 | 4,207 | |||||||||||||||||||||||||||||
| Acquisition of Additional Equity Interest in Brazil |
6,157 | |||||||||||||||||||||||||||||||
| Distribution to noncontrolling interest |
(75 | ) | ||||||||||||||||||||||||||||||
| Other |
3 | |||||||||||||||||||||||||||||||
|
|
|
|
|
|
|
|
|
|
|
|
|
|
|
|
|
|||||||||||||||||
| Balance at January 3, 2015 |
$ | 5,553 | 112,195 | $ | 0 | 55,485 | $ | (3,253,597 | ) | $ | (19,950 | ) | $ | 1,900,506 | $ | (1,373,041 | ) | |||||||||||||||
|
|
|
|
|
|
|
|
|
|
|
|
|
|
|
|
|
|||||||||||||||||
| Comprehensive (Loss) Income |
(1,103 | ) | (17,315 | ) | 32,945 | 15,630 | ||||||||||||||||||||||||||
| Issuance of treasury stock under stock plans |
(184 | ) | 6,191 | (7,179 | ) | (988 | ) | |||||||||||||||||||||||||
| Tax benefit of restricted stock units vested and stock options exercised |
(932 | ) | (932 | ) | ||||||||||||||||||||||||||||
| Cash dividends |
3 | 3 | ||||||||||||||||||||||||||||||
| Compensation expense on share-based awards |
24,771 | 24,771 | ||||||||||||||||||||||||||||||
| Sale of common stock |
6,362 | 41,475 | 41,475 | |||||||||||||||||||||||||||||
| Acquisition of Weilos |
298 | 2,924 | 2,924 | |||||||||||||||||||||||||||||
|
|
|
|
|
|
|
|
|
|
|
|
|
|
|
|
|
|||||||||||||||||
| Balance at January 2, 2016 |
$ | 4,450 | 118,855 | $ | 0 | 55,301 | $ | (3,247,406 | ) | $ | (37,265 | ) | $ | 1,994,513 | $ | (1,290,158 | ) | |||||||||||||||
|
|
|
|
|
|
|
|
|
|
|
|
|
|
|
|
|
|||||||||||||||||
The accompanying notes are an integral part of the consolidated financial statements.
F-6
Table of Contents
WEIGHT WATCHERS INTERNATIONAL, INC. AND SUBSIDIARIES
CONSOLIDATED STATEMENTS OF CASH FLOWS FOR THE FISCAL YEARS ENDED
(IN THOUSANDS)
| January 2, 2016 |
January 3, 2015 |
December 28, 2013 |
||||||||||
| (52 Weeks) | (53 Weeks) | (52 Weeks) | ||||||||||
| Operating activities: |
||||||||||||
| Net income |
$ | 32,779 | $ | 117,733 | $ | 202,742 | ||||||
| Adjustments to reconcile net income to cash provided by operating activities: |
||||||||||||
| Depreciation and amortization |
53,171 | 49,234 | 47,909 | |||||||||
| Amortization of deferred financing costs |
6,886 | 9,305 | 7,672 | |||||||||
| Impairment of intangible and long-lived assets |
2,455 | 652 | 5,426 | |||||||||
| Share-based compensation expense |
24,771 | 10,533 | 4,255 | |||||||||
| Deferred tax provision |
12,098 | 29,099 | 34,358 | |||||||||
| Allowance for doubtful accounts |
(446 | ) | 99 | 596 | ||||||||
| Reserve for inventory obsolescence |
7,593 | 11,822 | 9,580 | |||||||||
| Foreign currency exchange rate loss |
1,526 | 2,984 | 659 | |||||||||
| Gain on Brazil acquisition |
0 | (10,540 | ) | 0 | ||||||||
| Loss on disposal of assets |
0 | 171 | 1,417 | |||||||||
| (Gain) loss on early extinguishment of debt |
(12,667 | ) | 0 | 21,685 | ||||||||
| Other items, net |
0 | (184 | ) | 0 | ||||||||
| Changes in cash due to: |
|
|||||||||||
| Receivables |
1,571 | 3,777 | 345 | |||||||||
| Inventories |
(3,055 | ) | (3,218 | ) | (2,226 | ) | ||||||
| Prepaid expenses |
(18,284 | ) | 1,341 | 1,037 | ||||||||
| Accounts payable |
(13,930 | ) | 7,807 | (3,607 | ) | |||||||
| UK self-employment liability |
0 | 0 | (7,272 | ) | ||||||||
| Accrued liabilities |
(30,906 | ) | 10,361 | 4,988 | ||||||||
| Deferred revenue |
1,256 | (7,915 | ) | (10,521 | ) | |||||||
| Income taxes |
(10,003 | ) | (1,442 | ) | 4,473 | |||||||
|
|
|
|
|
|
|
|||||||
| Cash provided by operating activities |
54,815 | 231,619 | 323,516 | |||||||||
|
|
|
|
|
|
|
|||||||
| Investing activities: |
||||||||||||
| Capital expenditures |
(3,952 | ) | (9,097 | ) | (40,657 | ) | ||||||
| Capitalized software expenditures |
(32,307 | ) | (42,589 | ) | (21,277 | ) | ||||||
| Cash paid for acquisitions |
(3,112 | ) | (16,678 | ) | (83,825 | ) | ||||||
| Other items, net |
(936 | ) | (628 | ) | 411 | |||||||
|
|
|
|
|
|
|
|||||||
| Cash used for investing activities |
(40,307 | ) | (68,992 | ) | (145,348 | ) | ||||||
|
|
|
|
|
|
|
|||||||
| Financing activities: |
||||||||||||
| Proceeds from new term loans |
0 | 0 | 2,400,000 | |||||||||
| Borrowings on revolver |
48,000 | 0 | 70,000 | |||||||||
| Payments on long-term debt |
(158,113 | ) | (30,000 | ) | (2,488,364 | ) | ||||||
| Payment of dividends |
(42 | ) | (80 | ) | (29,571 | ) | ||||||
| Proceeds from the sale of common stock, net of fees |
41,475 | 0 | 0 | |||||||||
| Deferred financing costs |
0 | 0 | (44,817 | ) | ||||||||
| Proceeds from stock options exercised |
95 | 658 | 16,187 | |||||||||
| Tax benefit of restricted stock units vested and stock options exercised |
0 | 1 | 2,132 | |||||||||
|
|
|
|
|
|
|
|||||||
| Cash used for financing activities |
(68,585 | ) | (29,421 | ) | (74,433 | ) | ||||||
|
|
|
|
|
|
|
|||||||
| Effect of exchange rate changes on cash and cash equivalents and other |
(5,609 | ) | (6,551 | ) | 607 | |||||||
|
|
|
|
|
|
|
|||||||
| Net (decrease) increase in cash and cash equivalents |
(59,686 | ) | 126,655 | 104,342 | ||||||||
| Cash and cash equivalents, beginning of fiscal year |
301,212 | 174,557 | 70,215 | |||||||||
|
|
|
|
|
|
|
|||||||
| Cash and cash equivalents, end of fiscal year |
$ | 241,526 | $ | 301,212 | $ | 174,557 | ||||||
|
|
|
|
|
|
|
|||||||
The accompanying notes are an integral part of the consolidated financial statements.
F-7
Table of Contents
WEIGHT WATCHERS INTERNATIONAL, INC. AND SUBSIDIARIES
NOTES TO CONSOLIDATED FINANCIAL STATEMENTS
(IN THOUSANDS, EXCEPT PER SHARE AMOUNTS)
| 1. | Basis of Presentation |
The accompanying consolidated financial statements include the accounts of Weight Watchers International, Inc. and all of its subsidiaries. The terms “Company” and “WWI” as used throughout these notes is used to indicate Weight Watchers International, Inc. and all of its operations consolidated for purposes of its financial statements. The Company’s “meetings” business refers to providing access to meetings to the Company’s monthly commitment plan subscribers, “pay-as-you-go” members, Total Access subscribers and other meeting members. “Online” refers to Weight Watchers Online, Weight Watchers OnlinePlus, Personal Coaching and other digital subscription products.
The consolidated financial statements have been prepared in conformity with accounting principles generally accepted in the United States of America (“GAAP”) and include all of the Company’s majority-owned subsidiaries. As further discussed in Note 4, (1) as a result of the acquisition of an additional equity interest in Vigilantes do Peso Marketing Ltda. (“VPM”) in March 2014, the Company gained a direct controlling financial interest in VPM and began to consolidate this entity as of the date of acquisition; (2) as a result of the acquisition of Knowplicity, Inc., d/b/a Wello, in April 2014, Wello became a wholly owned subsidiary of the Company and the Company began to consolidate the entity as of the date of acquisition and (3) as a result of the acquisition of Weilos, Inc. (“Weilos”), in March 2015, Weilos became a wholly owned subsidiary of the Company and the Company began to consolidate the entity as of the date of acquisition. All intercompany accounts and transactions have been eliminated in consolidation.
Out-of-Period Adjustments:
In fiscal 2015, the Company identified and recorded out-of-period adjustments related to immaterial errors in prior period financial statements that increased income before income taxes by $1,650, provision for income taxes by $1,970, and decreased net income attributable to the Company by $320.
2. Summary of Significant Accounting Policies
Fiscal Year:
The Company’s fiscal year ends on the Saturday closest to December 31st and consists of either 52 or 53-week periods. Fiscal year 2015 contained 52 weeks, fiscal year 2014 contained 53 weeks and fiscal year 2013 contained 52 weeks. In 2014, when the Company realigned its organizational structure and changed the determination of its reportable segments, the Company’s Online business accordingly changed its fiscal year end to be the same as the Company’s fiscal year end, which did not have a material effect on the consolidated financial statements. See Note 15 for further information on the Company’s reportable segments. In fiscal year 2013, the Company’s Online business’ fiscal year ended on December 31st. This difference in fiscal years did not have a material effect on the consolidated financial statements.
Use of Estimates:
The preparation of financial statements, in conformity with GAAP, requires management to make estimates and assumptions that affect the reported amounts of assets and liabilities, the disclosure of contingent assets and liabilities at the date of the financial statements, and the reported amounts of revenues and expenses during the reporting period. On an ongoing basis, the Company evaluates its estimates and judgments, including those related to inventories, the impairment analysis for goodwill and other indefinite-lived intangible assets, share-based compensation, income taxes, tax contingencies and litigation. The Company bases its estimates on historical experience and on various other factors and assumptions that it believes to be reasonable under the
F-8
Table of Contents
WEIGHT WATCHERS INTERNATIONAL, INC. AND SUBSIDIARIES
NOTES TO CONSOLIDATED FINANCIAL STATEMENTS
(IN THOUSANDS, EXCEPT PER SHARE AMOUNTS)
circumstances, the results of which form the basis for making judgments about the carrying values of assets and liabilities that are not readily apparent from other sources. Actual amounts could differ from these estimates.
Translation of Foreign Currencies:
For all foreign operations, the functional currency is the local currency. Assets and liabilities of these operations are translated into US dollars using the exchange rate in effect at the end of each reporting period. Income statement accounts are translated at the average rate of exchange prevailing during each reporting period. Translation adjustments arising from the use of differing exchange rates from period to period are included in accumulated other comprehensive income (loss).
Foreign currency gains and losses arising from the translation of intercompany receivables and intercompany payables with the Company’s international subsidiaries are recorded as a component of other expense (income), net, unless the receivable is considered long-term in nature, in which case the foreign currency gains and losses are recorded as a component of accumulated other comprehensive income (loss).
Cash Equivalents:
Cash and cash equivalents are defined as highly liquid investments with original maturities of three months or less. Cash balances may, at times, exceed insurable amounts. The Company believes it mitigates this risk by investing in or through major financial institutions. Cash includes balances due from third-party credit card companies.
Inventories:
Inventories, which consist of finished goods, are stated at the lower of cost or market on a first-in, first-out basis, net of reserves for obsolescence and shrinkage.
Property and Equipment:
Property and equipment are recorded at cost. For financial reporting purposes, equipment is depreciated on the straight-line method over the estimated useful lives of the assets (3 to 10 years). Leasehold improvements are amortized on the straight-line method over the shorter of the term of the lease or the useful life of the related assets. Expenditures for new facilities and improvements that substantially extend the useful life of an asset are capitalized. Ordinary repairs and maintenance are expensed as incurred. When assets are retired or otherwise disposed of, the cost and related depreciation are removed from the accounts and any related gains or losses are included in income.
Impairment of Long Lived Assets:
The Company reviews long-lived assets, including amortizable intangible assets, for impairment whenever events or changes in business circumstances indicate that the carrying amount of the assets may not be fully recoverable.
In fiscal 2015, the Company recorded an impairment charge of $2,028 related to internal-use computer software that was not expected to provide substantive service potential.
In fiscal 2015 and fiscal 2014, the Company recorded impairment charges of $427 and $652, respectively, related to property, plant and equipment that were expected to be disposed of before the end of their estimated useful lives.
F-9
Table of Contents
WEIGHT WATCHERS INTERNATIONAL, INC. AND SUBSIDIARIES
NOTES TO CONSOLIDATED FINANCIAL STATEMENTS
(IN THOUSANDS, EXCEPT PER SHARE AMOUNTS)
In fiscal 2013, the Company commenced the shutdown of its China operations and, as a result, recorded an impairment charge of $1,607 related to property, plant and equipment ($372) and amortizable intangible assets ($1,235). The Company also recorded an impairment charge of $2,653 in fiscal 2013 related to internal-use computer software that was not expected to provide substantive service potential.
Goodwill and Franchise Rights Acquired and Other Intangible Assets:
Finite-lived intangible assets are amortized using the straight-line method over their estimated useful lives of 3 to 20 years or, in the case of amortizable franchise rights acquired, over the remaining contractual period, which is generally less than one year.
The Company reviews goodwill and other indefinite-lived intangible assets, including franchise rights acquired with indefinite lives, for potential impairment on at least an annual basis or more often if events so require. The Company performed fair value impairment testing as of the end of fiscal 2015 and fiscal 2014 on its goodwill and other indefinite-lived intangible assets.
In performing the impairment analysis for the fiscal year ended January 2, 2016 and for the fiscal year ended January 3, 2015, the Company determined that the carrying amounts of its franchise rights acquired with indefinite lives did not exceed their respective fair values and therefore, no impairment existed. In performing the impairment analysis for the fiscal year ended December 28, 2013, the Company determined that, based on the fair values calculated, the carrying amounts of the indefinite-lived franchise rights acquired related to its Mexico and Hong Kong operations exceeded their respective fair values and recorded impairment charges of $935 and $231, respectively. The Company determined that the carrying amounts of the remainder of its franchise rights acquired with indefinite lives did not exceed their respective fair values as of the end of fiscal 2013, and therefore, no other impairment existed.
When determining fair value, the Company utilizes various assumptions, including projections of future cash flows, growth rates and discount rates. A change in these underlying assumptions will cause a change in the results of the tests and, as such, could cause fair value to be less than the carrying amounts and result in an impairment of those assets. In the event such a result occurred, the Company would be required to record a corresponding charge, which would impact earnings. The Company would also be required to reduce the carrying amounts of the related assets on its balance sheet. The Company continues to evaluate these estimates and assumptions and believes that these assumptions are appropriate.
The following is a discussion of the goodwill and franchise rights acquired impairment analysis.
Goodwill
In performing the impairment analysis for goodwill, the fair value for the Company’s reporting units is estimated using a discounted cash flow approach. This approach involves projecting future cash flows attributable to the reporting unit and discounting those estimated cash flows using an appropriate discount rate. The estimated fair value is then compared to the carrying value of the reporting unit. The Company has determined the appropriate reporting unit for purposes of assessing annual impairment to be the country for all reporting units. To date, the Company has not recorded an impairment of goodwill.
For all of the Company’s reporting units except for Brazil (see below), the Company estimated future cash flows by utilizing the historical debt-free cash flows attributable to that country and then applied expected future operating income growth rates for such country. The Company utilized operating income as the basis for measuring its potential growth because it believes it is the best indicator of the performance of its business. The
F-10
Table of Contents
WEIGHT WATCHERS INTERNATIONAL, INC. AND SUBSIDIARIES
NOTES TO CONSOLIDATED FINANCIAL STATEMENTS
(IN THOUSANDS, EXCEPT PER SHARE AMOUNTS)
Company then discounted the estimated future cash flows utilizing a discount rate which was calculated using the average cost of capital, which included the cost of equity and the cost of debt. The cost of equity was determined by combining a risk-free rate of return and a market risk premium for the Company’s peer group. The risk-free rate of return was generally determined based on the average rate of long-term U.S. Treasury securities. The market risk premium was generally determined by reviewing external market data. The cost of debt was determined by estimating the Company’s current borrowing rate.
As it relates to the impairment analysis for Brazil, the Company estimated future debt-free cash flows in contemplation of its growth strategies for that market. In developing these projections, the Company considered the historical impact of similar growth strategies in other markets as well as the current market conditions in Brazil. The Company then discounted the estimated future cash flows utilizing a discount rate which was calculated using the average cost of capital, which included the cost of equity and the cost of debt. The cost of equity was determined by combining a risk-free rate of return and a market risk premium for the Company’s peer group. The risk-free rate of return was generally determined based on the average rate of long-term U.S. Treasury securities. The market risk premium was generally determined by reviewing external market data. Additional consideration was given to the current economic conditions in Brazil and country specific risk as well as the rate of growth projected in the analysis. The cost of debt was determined by estimating the Company’s current borrowing rate.
Franchise Rights Acquired
In performing the impairment analysis for indefinite-lived franchise rights acquired, the fair value for franchise rights acquired is estimated using a discounted cash flow approach referred to as the hypothetical start-up approach for franchise rights related to the Company’s meetings business and a relief from royalty methodology for franchise rights related to the Company’s Online business. The aggregate estimated fair value for these rights is then compared to the carrying value of the unit of accounting for those franchise rights. The Company has determined the appropriate unit of account for purposes of assessing annual impairment to be the combination of the rights in the meetings and Online businesses in the country in which the acquisitions have occurred. The values of these franchise rights in the United States, Canada, United Kingdom, Australia, New Zealand and other countries at January 2, 2016 were $675,515, $48,435, $11,858, $6,563, $4,833, and $122, respectively, totaling $747,326 and the values at January 3, 2015 were $675,515, $57,579, $13,138, $7,272, $5,449 and $1,930, respectively, totaling $760,883.
The Company estimated future cash flows for each unit of accounting by utilizing a hypothetical start-up approach in which it assumed that the year of maturity was reached after 7 years. Subsequent to the year of maturity, the Company assumed debt-free cash flow growth rates based on its expected future operating income growth rates for such country. The Company utilized operating income as the basis for measuring its potential growth because it believes it is the best indicator of the performance of its business. The Company then discounted the estimated future cash flows utilizing discount rates consistent with those used in its goodwill impairment analysis as discussed above.
Other Intangible Assets
The Company expenses all software costs (including website development costs) incurred during the preliminary project stage and capitalizes all internal and external direct costs of materials and services consumed in developing software (including website development costs) once the development has reached the application development stage. Application development stage costs generally include software configuration, coding, installation to hardware and testing. These costs are amortized over their estimated useful life of 3 years for website development costs and from 3 to 5 years for all other software costs. All costs incurred for upgrades,
F-11
Table of Contents
WEIGHT WATCHERS INTERNATIONAL, INC. AND SUBSIDIARIES
NOTES TO CONSOLIDATED FINANCIAL STATEMENTS
(IN THOUSANDS, EXCEPT PER SHARE AMOUNTS)
maintenance and enhancements, including the cost of website content, which do not result in additional functionality, are expensed as incurred.
Revenue Recognition:
WWI earns revenue by conducting meetings, for which it charges a fee, predominantly through monthly commitment plans, prepayment plans or the “pay-as-you-go” arrangement. WWI also earns revenue from monthly subscriptions for its Online products, selling products in its meetings, on the Internet and to its franchisees, collecting commissions from franchisees, collecting royalties related to licensing agreements, selling magazine subscriptions, selling advertising space on its website and in copies of its magazines, ecommerce fees and By Mail product sales.
Monthly commitment plans, prepaid meeting fees and magazine subscription revenue is recorded to deferred revenue and amortized into revenue over the period earned. Online Subscription Revenues, consisting of the fees associated with subscriptions for the Company’s Online subscription products, including its Personal Coaching product, are recognized over the period that products are provided. One-time sign-up fees are deferred and recognized over the expected customer relationship period. Online Subscription Revenues that are paid in advance are deferred and recognized on a straight-line basis over the subscription period. Revenue from “pay-as-you-go” meeting fees, product sales, ecommerce fees, By Mail, commissions and royalties is recognized when services are rendered, products are shipped to customers and title and risk of loss pass to the customers, and commissions and royalties are earned, respectively. Revenue from advertising in magazines is recognized when advertisements are published. Revenue from magazine sales is recognized when the magazine is sent to the customer. In the meetings business, WWI generally charges non-refundable registration and starter fees in exchange for an introductory information session and materials it provides to new members. Revenue from these registration and starter fees is recognized when the service and products are provided, which is generally at the same time payment is received from the customer. Discounts to customers, including free registration offers, are recorded as a deduction from gross revenue in the period such revenue was recognized. Revenue from advertising on its website is recognized when the advertisement is viewed by the user.
The Company grants refunds in aggregate amounts that historically have not been material. Because the period of payment of the refund generally approximates the period revenue was originally recognized, refunds are recorded as a reduction of revenue when paid.
Advertising Costs:
Advertising costs consist primarily of television and digital media. All costs related to advertising are expensed in the period incurred, except for media production-related costs, which are expensed the first time the advertising takes place. Total advertising expenses for the fiscal years ended January 2, 2016, January 3, 2015 and December 28, 2013 were $191,060, $251,954, and $285,298, respectively.
Income Taxes:
Deferred income tax assets and liabilities result primarily from temporary differences between the financial statement and tax bases of assets and liabilities, using enacted tax rates in effect for the year in which differences are expected to reverse. If it is more-likely-than-not that some portion of a deferred tax asset will not be realized, a valuation allowance is recognized. The Company considers historic levels of income, estimates of future taxable income and feasible tax planning strategies in assessing the need for a tax valuation allowance.
F-12
Table of Contents
WEIGHT WATCHERS INTERNATIONAL, INC. AND SUBSIDIARIES
NOTES TO CONSOLIDATED FINANCIAL STATEMENTS
(IN THOUSANDS, EXCEPT PER SHARE AMOUNTS)
The Company recognizes a benefit for uncertain tax positions when a tax position taken or expected to be taken in a tax return is more-likely-than-not to be sustained upon examination by taxing authorities. The amount recognized is measured as the largest amount of benefit that is greater than 50% likely of being realized upon ultimate settlement. The Company recognizes accrued interest and penalties associated with uncertain tax positions as part of the provision for income taxes on its consolidated statements of income.
In addition, assets and liabilities acquired in purchase business combinations are assigned their fair values and deferred taxes are provided for lower or higher tax bases.
Derivative Instruments and Hedging:
The Company is exposed to certain risks related to its ongoing business operations, primarily interest rate risk and foreign currency risk. The primary risk managed by using derivative instruments is interest rate risk. Interest rate swaps are entered into to hedge a portion of the cash flow exposure associated with the Company’s variable-rate borrowings. The Company does not use any derivative instruments for trading or speculative purposes.
The Company recognizes the fair value of all derivative instruments as either assets or liabilities on the balance sheet. The Company has designated and accounted for interest rate swaps as cash flow hedges of its variable-rate borrowings. For derivative instruments that are designated and qualify as cash flow hedges, the effective portion of the gain or loss on the derivative is reported as a component of accumulated other comprehensive income (loss) and reclassified into earnings in the periods during which the hedged transactions affect earnings. Gains and losses on the derivative representing either hedge ineffectiveness or hedge components excluded from the assessment of effectiveness are recognized in current earnings.
The fair value of the Company’s interest rate swaps is reported in derivative payable and prepaid expenses and other current assets on its balance sheet. See Note 16 for a further discussion regarding the fair value of the Company’s interest rate swaps. The net effect of the interest payable and receivable under the Company’s interest rate swaps is included in interest expense on the statement of income.
Deferred Financing Costs:
Deferred financing costs consist of fees paid by the Company as part of the establishment, exchange and/or modification of the Company’s long-term debt. During the fiscal year ended January 2, 2016, in connection with the prepayment of debt, the Company wrote-off deferred financing fees of approximately $647, recorded a gain on early extinguishment of debt totaling $11,426, and incurred additional fees of approximately $1,241. During the fiscal year ended January 3, 2015, the Company wrote-off deferred financing fees of approximately $1,583 in connection with amending its Credit Agreement (as defined in Note 7). During the fiscal year ended December 28, 2013, the Company incurred fees of $44,817 associated with the refinancing of the WWI Credit Facility (as defined in Note 7). The Company wrote-off fees in connection with this refinancing which resulted in the Company recording a charge of $21,685 in early extinguishment of debt. Amortization expense for the fiscal years ended January 2, 2016, January 3, 2015 and December 28, 2013 was $6,886, $9,305 and $7,672, respectively.
Accumulated Other Comprehensive Loss:
The Company’s accumulated other comprehensive loss includes net income, changes in the fair value of derivative instruments and the effects of foreign currency translations. At January 2, 2016, January 3, 2015 and
F-13
Table of Contents
WEIGHT WATCHERS INTERNATIONAL, INC. AND SUBSIDIARIES
NOTES TO CONSOLIDATED FINANCIAL STATEMENTS
(IN THOUSANDS, EXCEPT PER SHARE AMOUNTS)
December 28, 2013 the cumulative balance of changes in fair value of derivative instruments, net of taxes, was $(23,135), $(21,856) and $(4,603), respectively. At January 2, 2016, January 3, 2015 and December 28, 2013, the cumulative balance of the effects of foreign currency translations, net of taxes, was $(14,130) and $1,906 and $13,120, respectively.
Restructuring Expense:
The Company records estimated expense for restructuring initiatives when such costs are deemed probable and estimable, when approved by the appropriate corporate authority and by accumulating detailed estimates of costs for such plans. These expenses include the estimated costs of employee severance and related benefits, impairment or accelerated depreciation of property, plant and equipment and capitalized software, and any other qualifying exit costs. Such costs represent the Company’s best estimate, but require assumptions about the plans that may change over time, including attrition rates. Estimates are evaluated periodically to determine whether an adjustment is required.
Reclassification:
Certain prior year amounts have been reclassified to conform to the current year presentation.
| 3. | Winfrey Transaction |
On October 18, 2015 (the “Agreement Date”), the Company entered into the following agreements with Oprah Winfrey: a Strategic Collaboration Agreement, the Winfrey Purchase Agreement (defined below), and the Winfrey Option Agreement (defined below). The transactions contemplated by these agreements are collectively referred to herein as the “Winfrey Transaction”. Details of the Strategic Collaboration Agreement, Winfrey Purchase Agreement and Winfrey Option Agreement are below. See Note 21 for related party transactions with Ms. Winfrey.
Strategic Collaboration Agreement
The Company and Ms. Winfrey granted each other certain intellectual property rights under the Strategic Collaboration Agreement. The agreement has an initial term of five years, with additional successive one-year renewal terms. During the term of this agreement, Ms. Winfrey will consult with the Company and participate in developing, planning, executing and enhancing the Weight Watchers program and related initiatives, and provide it with services in her discretion to promote the Company and its programs, products and services.
Winfrey Purchase Agreement
On October 19, 2015, pursuant to the Share Purchase Agreement between the Company and Ms. Winfrey (the “Winfrey Purchase Agreement”), the Company issued and sold to Ms. Winfrey an aggregate of 6,362 shares of the Company’s common stock (the “Purchased Shares”) at a price per share of $6.79 for an aggregate cash purchase price of $43,199. The Company recorded fees related to the issuance of the Purchased Shares totaling $2,315, of which $1,700 was recorded as a reduction of equity. The Purchased Shares are subject to certain demand registration rights and piggyback rights held by Ms. Winfrey under the Winfrey Purchase Agreement.
The Purchased Shares may not be transferred by Ms. Winfrey within the first two years of the Agreement Date, subject to certain limited exceptions. Thereafter, Ms. Winfrey may generally transfer up to 15% of the
F-14
Table of Contents
WEIGHT WATCHERS INTERNATIONAL, INC. AND SUBSIDIARIES
NOTES TO CONSOLIDATED FINANCIAL STATEMENTS
(IN THOUSANDS, EXCEPT PER SHARE AMOUNTS)
Purchased Shares prior to the third anniversary of the Agreement Date, up to 30% prior to the fourth anniversary of the Agreement Date and up to 60% prior to the fifth anniversary of the Agreement Date. On or after the fifth anniversary of the Agreement Date, Ms. Winfrey will be permitted to transfer all of the Purchased Shares. In the event that Ms. Winfrey proposes to transfer any Purchased Shares or Winfrey Option Shares (defined below), the Company will have (a) a right of first offer with respect to such shares if such transfer is (i) for 1% or more of the Company’s issued and outstanding common stock that is proposed to be made pursuant to Rule 144 under the Securities Act of 1933, as amended or (ii) proposed to be sold under a resale shelf registration statement or (b) a right of first refusal with respect to such shares if such transfer is (i) for 1% or more of the Company’s issued and outstanding common stock and is proposed to be made to a competitor of the Company or (ii) for 5% or more of the Company’s issued and outstanding common stock. Such transfer restrictions, right of first offer and right of first refusal terminate if Ms. Winfrey then has the right to be nominated as a director and has met certain eligibility requirements under the Winfrey Purchase Agreement, but is not elected as a director of the Company. If Ms. Winfrey is elected as a director of the Company, she shall receive compensation for her services as a director consistent with that of other non-executive directors of the Company. Such transfer restrictions also terminate if there is a change of control, including if another person (or group), other than Artal Luxembourg S.A. and Ms. Winfrey and their respective affiliates, acquires more than 50% of the total voting power of the Company.
Winfrey Option Agreement
In consideration of Ms. Winfrey entering into the Strategic Collaboration Agreement and the performance of her obligations thereunder, on the Agreement Date, the Company granted Ms. Winfrey a fully vested option (the “Winfrey Option”) to purchase 3,513 shares of common stock at an exercise price of $6.97 per share. The term sheet, and related terms and conditions, for the Winfrey Option are referred to herein as the “Winfrey Option Agreement”. Based on the Black Scholes option pricing method, the Company recorded $12,759 of compensation expense in the fourth quarter of fiscal 2015 for the Winfrey Option. At the date of the grant, the Company used a dividend yield of 0.0%, 63.88% volatility and a risk-free interest rate of 1.36%. Compensation expense is included as a component of selling, general and administrative expenses.
Subject to certain limited exceptions, shares of common stock issuable upon exercise of the Winfrey Option (the “Winfrey Option Shares”) generally may not be transferred by Ms. Winfrey within the first year of the Agreement Date. Thereafter, Ms. Winfrey generally may transfer up to 20% of the Winfrey Option Shares prior to the second anniversary of the Agreement Date, up to 40% prior to the third anniversary of the Agreement Date, up to 60% prior to the fourth anniversary of the Agreement Date and up to 80% prior to the fifth anniversary of the Agreement Date. On or after the fifth anniversary of the Agreement Date, Ms. Winfrey will be permitted to transfer all of the Winfrey Option Shares. Pursuant to the Winfrey Purchase Agreement, in the event that Ms. Winfrey proposes to transfer any Winfrey Option Shares, the Company will have a right of first offer or a right of first refusal with respect to such shares as described above. Such transfer restrictions terminate under the same director service and change of control circumstances that would result in the termination of the transfer restrictions relating to the Purchased Shares as described above.
| 4. | Acquisitions and Shutdown of China Operations |
Acquisitions of Franchisees
The acquisitions of franchisees have been accounted for under the purchase method of accounting and, accordingly, earnings of acquired franchisees have been included in the consolidated operating results of the Company since the applicable date of acquisition. During fiscal 2013, the Company acquired certain assets of its franchisees as outlined below.
F-15
Table of Contents
WEIGHT WATCHERS INTERNATIONAL, INC. AND SUBSIDIARIES
NOTES TO CONSOLIDATED FINANCIAL STATEMENTS
(IN THOUSANDS, EXCEPT PER SHARE AMOUNTS)
On March 4, 2013, the Company acquired substantially all of the assets of its Alberta and Saskatchewan, Canada franchisees, Weight Watchers of Alberta Ltd. and Weight Watchers of Saskatchewan Ltd., for an aggregate purchase price of $35,000. The total purchase price has been allocated to franchise rights acquired ($1,135), goodwill ($34,124), customer relationship value ($473), inventory ($218), fixed assets ($182) and prepaid expenses ($3) offset by deferred revenue of $1,135. The franchise rights acquired were amortized over a ten month useful life.
On July 15, 2013, the Company acquired substantially all of the assets of its West Virginia franchisee, Weight Watchers of West Virginia, Inc., for a net purchase price of $16,028 less assumed assets, plus assumed liabilities, net of $28. The total purchase price has been allocated to franchise rights acquired ($10,131), goodwill ($5,212), customer relationship value ($448) and fixed assets ($209).
On July 22, 2013, the Company acquired substantially all of the assets of its Columbus, Ohio franchisee, Weight Watchers of Columbus, Inc., for a net purchase price of $23,357 plus assumed liabilities of $143 and its Reno, Nevada franchisee, Weight Watchers of Northern Nevada, Inc., for a net purchase price of $3,969 plus assumed liabilities of $31. The aggregate total purchase price has been allocated to franchise rights acquired ($3,314), goodwill ($23,549), customer relationship value ($494), fixed assets ($116) and inventory ($27). The franchise rights acquired for the Columbus, Ohio franchise purchase were amortized over a five month useful life.
On October 28, 2013, the Company acquired substantially all of the assets of its Manitoba, Canada franchisee, Weight Watchers of Manitoba Ltd., for a net purchase price of $5,197 plus assumed liabilities of $28 and its Franklin and St. Lawrence Counties, New York franchisee, Weight Watchers of Franklin and St. Lawrence Counties Inc., for a net purchase price of $274 plus assumed liabilities of $1. The total purchase price of the Manitoba, Canada franchisee has been allocated to franchise rights acquired ($28), goodwill ($4,946), customer relationship value ($249), inventory ($1) and prepaid expenses ($1). The franchise rights acquired were amortized over a two month useful life. The total purchase price of the Franklin and St. Lawrence Counties, New York franchisee has been allocated to franchise rights acquired ($38), goodwill ($223), customer relationship value ($13) and prepaid expenses ($1). The franchise rights acquired were amortized over a nine month useful life.
The weighted-average amortization period of the customer relationships acquired in the above acquisitions was approximately 15 weeks. Due to the short-term nature of this asset, its estimated fair value has been recorded as a component of prepaid expenses and other current assets. The acquisitions resulted in goodwill related to, among other things, expected synergies in operations. The goodwill recorded in connection with these acquisitions represents the intangible assets that did not qualify for separate recognition in the financial statements. The Company expects that substantially all of the goodwill recorded in connection with the above acquisitions will be deductible for tax purposes. The effect of these franchise acquisitions was not material to the Company’s consolidated financial position, results of operations, or operating cash flows in the periods presented.
Acquisition of Additional Equity Interest in Brazil
Prior to March 12, 2014, the Company had owned 35% of VPM, a Brazilian limited liability partnership. On March 12, 2014, the Company acquired an additional 45% equity interest in VPM for a net purchase price of $14,181 less cash acquired of $2,262. VPM was converted into a joint-stock corporation prior to closing and subsequently operates as a subsidiary of the Company with rights to conduct typical business lines. As a result of the acquisition, the Company gained a direct controlling financial interest in VPM and began to consolidate this entity as of the date of acquisition.
F-16
Table of Contents
WEIGHT WATCHERS INTERNATIONAL, INC. AND SUBSIDIARIES
NOTES TO CONSOLIDATED FINANCIAL STATEMENTS
(IN THOUSANDS, EXCEPT PER SHARE AMOUNTS)
The equity interest held immediately before the acquisition was $12. An implied fair value technique was used to measure acquisition date fair value of the equity interest to be $11,029. As a result of this transaction, the Company adjusted its previously held equity interest to fair value of $11,017 and recorded a charge of $477 associated with the settlement of the royalty-free arrangement of the Brazilian partnership. The net effect of these items resulted in the Company recognizing a gain of $10,540 ($6,429 after tax or $0.11 per fully diluted share) in the first quarter of fiscal 2014.
The fair value of the redeemable noncontrolling interest has been valued at $6,157. In connection with the acquisition, a call option and a put option were granted related to the 20% interest in VPM not owned by the Company.
The net purchase price of the Brazil acquisition has been allocated as follows:
| Fair value of consideration transferred: |
||||
| Net purchase price |
$ | 14,181 | ||
| Less cash acquired |
2,262 | |||
|
|
|
|||
| Total |
11,919 | |||
| Gain on acquisition |
10,540 | |||
| Redeemable noncontrolling interest |
6,157 | |||
|
|
|
|||
| 28,616 | ||||
|
|
|
|||
| Identifiable assets acquired and liabilities assumed: |
||||
| Franchise rights acquired |
2,000 | |||
| Receivables |
1,139 | |||
| Fixed assets |
575 | |||
| Prepaid expenses |
421 | |||
| Inventory |
287 | |||
| Customer relationship value |
275 | |||
| Other assets |
199 | |||
| Accrued liabilities |
(1,063 | ) | ||
| Deferred tax on acquired intangibles |
(680 | ) | ||
| Deferred revenue |
(445 | ) | ||
| Income taxes payable |
(258 | ) | ||
| Accounts payable |
(91 | ) | ||
|
|
|
|||
| Total identifiable net assets |
2,359 | |||
|
|
|
|||
| Goodwill |
$ | 26,257 | ||
|
|
|
The acquisition resulted in goodwill related to, among other things, expected synergies in operations and the ability of the Company to provide VPM with various intellectual property and technology innovations which will afford additional future opportunities in the meetings and Online businesses within the market where VPM operates. The Company does not expect goodwill to be deductible for tax purposes.
Acquisition of Wello
On April 16, 2014, the Company acquired Knowplicity, Inc., d/b/a Wello, an online fitness and personal training company for a net purchase price of $8,977 less cash acquired of $11. Payment was in the form of common stock issued ($4,207) and cash ($4,770). The total purchase price of Wello has been allocated to
F-17
Table of Contents
WEIGHT WATCHERS INTERNATIONAL, INC. AND SUBSIDIARIES
NOTES TO CONSOLIDATED FINANCIAL STATEMENTS
(IN THOUSANDS, EXCEPT PER SHARE AMOUNTS)
goodwill ($6,204), website development ($4,516), prepaid expenses ($4) and fixed assets ($1) offset by deferred tax liabilities ($1,759). As a result of the acquisition, Wello became a wholly owned subsidiary of the Company and the Company began to consolidate the entity as of the date of acquisition. The acquisition resulted in goodwill related to, among other things, expected synergies in operations. The Company does not expect goodwill to be deductible for tax purposes.
Acquisition of Weilos
On March 11, 2015, the Company acquired for a purchase price of $6,674 Weilos, a California-based startup with an online social platform that provides a mobile health and weight loss community. Payment was in the form of common stock issued ($2,810), restricted stock issued ($114) and cash ($2,775) plus cash in reserves ($975). The total purchase price of Weilos has been allocated to goodwill ($5,588), identifiable intangibles ($1,741) and other assets ($24) offset by deferred tax liabilities ($679). Restricted shares with a fair value at the date of grant ($908) were issued to key employees, contingent upon 18 months post-combination employment, and are accounted for as stock compensation cost in the post-combination financial statements. As a result of the acquisition, Weilos became a wholly owned subsidiary of the Company and the Company began to consolidate the entity as of the date of acquisition. The acquisition resulted in goodwill related to, among other things, expected synergies in operations. The Company does not expect goodwill to be deductible for tax purposes.
Shutdown of China Operations
On December 12, 2013, the Company made a strategic decision to shut down its China operations. As a result of this decision, the Company incurred a charge of $2,500 related to severance and the impairment of property, plant and equipment and amortizable intangible assets.
| 5. | Franchise Rights Acquired, Goodwill and Other Intangible Assets |
The Company performed its annual impairment review of goodwill and other indefinite-lived intangible assets as of January 2, 2016 and January 3, 2015. As a result of this review, no impairment charges were recorded for the fiscal years ended January 2, 2016 and January 3, 2015.
Franchise rights acquired are due to acquisitions of the Company’s franchised territories as well as the acquisition of franchise promotion agreements and other factors associated with the acquired franchise territories. For the fiscal year ended January 2, 2016, the change in the carrying value of indefinite-lived franchise rights acquired is primarily due to the effect of exchange rate changes.
Goodwill primarily relates to the acquisition of the Company by H.J. Heinz Company in 1978, the acquisition of WeightWatchers.com, Inc. in 2005, the acquisitions of the Company’s franchised territories, the acquisitions of the majority interest in VPM and of Wello in fiscal 2014 and the acquisition of Weilos in fiscal 2015. See Note 4 for further information on certain acquisitions. For the fiscal year ended January 2, 2016, the change in the carrying amount of goodwill is due to the Weilos acquisition and the effect of exchange rate changes as follows:
| North America | UK | CE | Other | Total | ||||||||||||||||
| Balance as of January 3, 2015 |
$ | 134,611 | $ | 1,421 | $ | 7,661 | $ | 24,586 | $ | 168,279 | ||||||||||
| Goodwill acquired during the period |
5,588 | 0 | 0 | 0 | 5,588 | |||||||||||||||
| Effect of exchange rate changes |
(6,791 | ) | (51 | ) | (401 | ) | (7,293 | ) | (14,536 | ) | ||||||||||
|
|
|
|
|
|
|
|
|
|
|
|||||||||||
| Balance as of January 2, 2016 |
$ | 133,408 | $ | 1,370 | $ | 7,260 | $ | 17,293 | $ | 159,331 | ||||||||||
|
|
|
|
|
|
|
|
|
|
|
|||||||||||
F-18
Table of Contents
WEIGHT WATCHERS INTERNATIONAL, INC. AND SUBSIDIARIES
NOTES TO CONSOLIDATED FINANCIAL STATEMENTS
(IN THOUSANDS, EXCEPT PER SHARE AMOUNTS)
The carrying values of finite-lived intangible assets as of January 2, 2016 and January 3, 2015 were as follows:
| January 2, 2016 | January 3, 2015 | |||||||||||||||
| Gross Carrying Amount |
Accumulated Amortization |
Gross Carrying Amount |
Accumulated Amortization |
|||||||||||||
| Capitalized software costs |
$ | 119,658 | 86,134 | $ | 107,581 | $ | 72,590 | |||||||||
| Website development costs |
100,105 | 68,673 | 95,717 | 63,405 | ||||||||||||
| Trademarks |
10,960 | 10,435 | 10,836 | 10,213 | ||||||||||||
| Other |
7,976 | 7,118 | 7,014 | 6,825 | ||||||||||||
|
|
|
|
|
|
|
|
|
|||||||||
| Trademarks and other intangible assets |
$ | 238,699 | $ | 172,360 | $ | 221,148 | $ | 153,033 | ||||||||
|
|
|
|
|
|
|
|
|
|||||||||
| Franchise rights acquired |
4,182 | 4,059 | 4,735 | 3,690 | ||||||||||||
| Total finite-lived intangible assets |
$ | 242,881 | $ | 176,419 | $ | 225,883 | $ | 156,723 | ||||||||
Aggregate amortization expense for finite-lived intangible assets was recorded in the amounts of $34,719, $29,372, and $27,567, for the fiscal years ended January 2, 2016, January 3, 2015 and December 28, 2013, respectively. The franchise rights acquired related to the VPM acquisition are being amortized ratably over a 2 year period.
Estimated amortization expense of existing finite-lived intangible assets for the next five fiscal years and thereafter is as follows:
| 2016 |
$ | 32,094 | ||
| 2017 |
$ | 24,726 | ||
| 2018 |
$ | 8,451 | ||
| 2019 |
$ | 1,125 | ||
| 2020 and thereafter |
$ | 66 |
| 6. | Property and Equipment |
The components of property and equipment were:
| January 2, 2016 |
January 3, 2015 |
|||||||
| Equipment |
$ | 122,789 | $ | 124,788 | ||||
| Leasehold improvements |
79,115 | 79,496 | ||||||
|
|
|
|
|
|||||
| 201,904 | 204,284 | |||||||
| Less: Accumulated depreciation and amortization |
(143,718 | ) | (129,634 | ) | ||||
|
|
|
|
|
|||||
| $ | 58,186 | $ | 74,650 | |||||
|
|
|
|
|
|||||
Depreciation and amortization expense of property and equipment for the fiscal years ended January 2, 2016, January 3, 2015 and December 28, 2013 was $18,452, $20,635, and $20,342, respectively.
F-19
Table of Contents
WEIGHT WATCHERS INTERNATIONAL, INC. AND SUBSIDIARIES
NOTES TO CONSOLIDATED FINANCIAL STATEMENTS
(IN THOUSANDS, EXCEPT PER SHARE AMOUNTS)
| 7. | Long-Term Debt |
The components of the Company’s long-term debt were as follows:
| January 2, 2016 | January 3, 2015 | |||||||||||||||
| Balance | Effective Rate |
Balance | Effective Rate |
|||||||||||||
| Revolving Facility due April 2, 2018 |
$ | 48,000 | 2.75 | % | $ | 0 | 0.00 | % | ||||||||
| Tranche B-1 Term Facility due April 2, 2016 |
144,323 | 3.19 | % | 294,750 | 3.12 | % | ||||||||||
| Tranche B-2 Term Facility due April 2, 2020 |
2,042,250 | 4.00 | % | 2,063,250 | 3.96 | % | ||||||||||
|
|
|
|
|
|||||||||||||
| Total Debt |
2,234,573 | 3.98 | % | 2,358,000 | 3.86 | % | ||||||||||
| Less Current Portion |
213,323 | 80,728 | ||||||||||||||
|
|
|
|
|
|||||||||||||
| Total Long-Term Debt |
$ | 2,021,250 | $ | 2,277,272 | ||||||||||||
|
|
|
|
|
|||||||||||||
The Company’s credit facilities at the end of the first quarter of fiscal 2013 consisted of the following term loan facilities and revolving credit facilities: a tranche B loan (“Term B Loan”), a tranche C loan (“Term C Loan”), a tranche D loan (“Term D Loan”), a tranche E loan (“Term E Loan”), a tranche F loan (“Term F Loan”), revolving credit facility A-1 (“Revolver A-1” ) and revolving credit facility A-2 (“Revolver A-2”).
On April 2, 2013, the Company refinanced its credit facilities pursuant to a new Credit Agreement (as amended, supplemented or otherwise modified, the “Credit Agreement”) among the Company, the lenders party thereto, JPMorgan Chase Bank, N.A., as administrative agent and an issuing bank, The Bank of Nova Scotia, as revolving agent, swingline lender and an issuing bank, and the other parties thereto. The Credit Agreement provides for (a) a revolving credit facility (including swing line loans and letters of credit) in an initial aggregate principal amount of $250,000 that will mature on April 2, 2018 (the “Revolving Facility”), (b) an initial term B-1 loan credit facility in an aggregate principal amount of $300,000 that will mature on April 2, 2016 (the “Tranche B-1 Term Facility”) and (c) an initial term B-2 loan credit facility in an aggregate principal amount of $2,100,000 that will mature on April 2, 2020 (the “Tranche B-2 Term Facility”, and together with the Tranche B-1 Term Facility, the “Term Facilities”; the Term Facilities and Revolving Facility collectively, the “WWI Credit Facility”). In connection with this refinancing, the Company used the proceeds from borrowings under the Term Facilities to pay off a total of $2,399,904 of outstanding loans, consisting of $128,759 of Term B Loans, $110,602 of Term C Loans, $117,612 of Term D Loans, $1,125,044 of Term E Loans, $817,887 of Term F Loans, $21,247 of loans under the Revolver A-1 and $78,753 of loans under the Revolver A-2. Following the refinancing of a total of $2,399,904 of loans, at April 2, 2013, the Company had $2,400,000 debt outstanding under the Term Facilities and $248,848 of availability under the Revolving Facility. The Company incurred fees of $44,817 during the second quarter of fiscal 2013 in connection with this refinancing. In the second quarter of fiscal 2013, the Company wrote-off fees associated with this refinancing which resulted in the Company recording a charge of $21,685 in early extinguishment of debt.
On September 26, 2014, the Company and certain lenders entered into an agreement amending the Credit Agreement that, among other things, eliminated the Financial Covenant (as defined in the Credit Agreement) with respect to the Revolving Facility. In connection with this amendment, the Company wrote-off deferred financing fees of approximately $1,583 in the third quarter of fiscal 2014. Concurrently with and in order to effect this amendment, the Company reduced the amount of the Revolving Facility from $250,000 to $50,000.
Under the terms of the Credit Agreement, depending on the Company’s Consolidated Leverage Ratio (as defined in the Credit Agreement), the Company is obligated to offer to prepay the Term Facilities in an aggregate amount determined by its excess cash flow (as defined in the Credit Agreement). On March 13, 2015, the
F-20
Table of Contents
WEIGHT WATCHERS INTERNATIONAL, INC. AND SUBSIDIARIES
NOTES TO CONSOLIDATED FINANCIAL STATEMENTS
(IN THOUSANDS, EXCEPT PER SHARE AMOUNTS)
Company commenced an offer to prepay at a discount to par up to $75,000 in aggregate principal amount of term loans outstanding under the Tranche B-1 Term Facility. On March 20, 2015, the Company accepted offers with a discount equal to or greater than 9.00% in respect of such term loans. On March 25, 2015, the Company paid an aggregate amount of cash proceeds totaling $57,389 plus an amount sufficient to pay accrued and unpaid interest on the amount prepaid to prepay $63,065 in aggregate principal amount of such term loans under the Tranche B-1 Term Facility. This expenditure reduced, on a dollar for dollar basis, the Company’s $59,728 obligation to make a mandatory excess cash flow prepayment offer to the term loan lenders under the terms of the Credit Agreement. In addition, the Company made a voluntary prepayment at par on March 25, 2015 of $2,500 in respect of such term loans under the Tranche B-1 Term Facility to reduce the remaining excess cash flow prepayment obligation for fiscal 2014. As a result of this prepayment, the Company wrote-off fees of $326, incurred fees of $601 and recorded a gain on early extinguishment of debt of $4,749, inclusive of these fees, in the first quarter of fiscal 2015.
On June 17, 2015, the Company commenced another offer to prepay at a discount to par up to $229,000 in aggregate principal amount of term loans outstanding under the Tranche B-1 Term Facility. On June 22, 2015, the Company accepted offers with a discount equal to or greater than 9.00% in respect of such term loans. On June 26, 2015, the Company paid an aggregate amount of cash proceeds totaling $77,225 plus an amount sufficient to pay accrued and unpaid interest on the amount prepaid to prepay $84,862 in aggregate principal amount of such term loans under the Tranche B-1 Term Facility. As a result of this prepayment, the Company wrote-off fees of $321, incurred fees of $641 and recorded a gain on early extinguishment of debt of $6,677, inclusive of these fees, in the second quarter of fiscal 2015.
On July 14, 2015, the Company drew down the $48,000 available on its Revolving Facility in order to enhance its cash position and to provide additional financial flexibility. The revolver borrowing has been classified as a short-term liability in consideration of the fact that the terms of the Revolving Facility require an assessment as to whether there have been any material adverse changes with respect to the Company in connection with the Company’s monthly interest elections. Although the revolver borrowing has been classified as a short-term liability, absent any change in fact and circumstance, the Company has the ability to extend and not repay the Revolving Facility until its due date of April 2, 2018. At January 2, 2016, under the WWI Credit Facility, the Company had $2,186,573 outstanding consisting entirely of term loans, and borrowings of $48,000 outstanding under the Revolving Facility. In addition, at January 2, 2016, the Revolving Facility had $1,819 in issued but undrawn letters of credit outstanding thereunder and $181 in available unused commitments thereunder. The proceeds from borrowings under the Revolving Facility (including swing line loans and letters of credit) are available to be used for working capital and general corporate purposes.
Borrowings under the Credit Agreement bear interest at a rate equal to, at the Company’s option, LIBOR plus an applicable margin or a base rate plus an applicable margin. LIBOR under the Tranche B-2 Term Facility is subject to a minimum interest rate of 0.75% and the base rate under the Tranche B-2 Term Facility is subject to a minimum interest rate of 1.75%. Under the terms of the Credit Agreement, in the event the Company receives a corporate rating of BB- (or lower) from S&P and a corporate rating of Ba3 (or lower) from Moody’s, the applicable margin relating to both of the Term Facilities would increase by 25 basis points. On February 21, 2014, both S&P and Moody’s issued revised corporate ratings of the Company of B+ and B1, respectively. As a result, effective February 21, 2014, the applicable margin on borrowings under the Tranche B-1 Term Facility went from 2.75% to 3.00% and on borrowings under the Tranche B-2 Term Facility went from 3.00% to 3.25%. The applicable margin relating to the Revolving Facility will fluctuate depending upon the Company’s Consolidated Leverage Ratio. At January 2, 2016, borrowings under the Tranche B-1 Term Facility bore interest at LIBOR plus an applicable margin of 3.00% and borrowings under the Tranche B-2 Term Facility bore interest at LIBOR plus an applicable margin of 3.25%. Based on the Company’s Consolidated Leverage Ratio as of
F-21
Table of Contents
WEIGHT WATCHERS INTERNATIONAL, INC. AND SUBSIDIARIES
NOTES TO CONSOLIDATED FINANCIAL STATEMENTS
(IN THOUSANDS, EXCEPT PER SHARE AMOUNTS)
January 2, 2016, borrowings under the Revolving Facility bore interest at LIBOR plus an applicable margin of 2.50%. On a quarterly basis, the Company will pay a commitment fee to the lenders under the Revolving Facility in respect of unutilized commitments thereunder, which commitment fee will fluctuate depending upon the Company’s Consolidated Leverage Ratio. Based on the Company’s Consolidated Leverage Ratio as of January 2, 2016, the commitment fee was 0.50% per annum. For the fiscal year ended January 2, 2016, the Company paid $186 in commitment fees. The Company also will pay customary letter of credit fees and fronting fees under the Revolving Facility, which totaled $48 for the fiscal year ended January 2, 2016.
The Credit Agreement contains customary covenants including covenants that, in certain circumstances, restrict the Company’s ability to incur additional indebtedness, pay dividends on and redeem capital stock, make other payments, including investments, sell its assets and enter into consolidations, mergers and transfers of all or substantially all of its assets. The WWI Credit Facility does not require the Company to meet any financial maintenance covenants and is guaranteed by certain of the Company’s existing and future subsidiaries. Substantially all of the Company’s assets secure the WWI Credit Facility.
At January 2, 2016 and January 3, 2015, the Company’s debt consisted entirely of variable-rate instruments. Interest rate swaps were entered into to hedge a portion of the cash flow exposure associated with the Company’s variable-rate borrowings. The weighted average interest rate on the Company’s debt, exclusive of the impact of swaps, was approximately 3.93% and 3.90% per annum based on interest rates at January 2, 2016 and January 3, 2015, respectively. The weighted average interest rate on the Company’s debt, including the impact of swaps, was approximately 5.03% and 4.93% per annum based on interest rates at January 2, 2016 and January 3, 2015, respectively.
Maturities
At January 2, 2016, the aggregate amounts of the Company’s existing long-term debt maturing in each of the next five fiscal years were as follows:
| 2016 |
$ | 213,323 | ||
| 2017 |
21,000 | |||
| 2018 |
21,000 | |||
| 2019 |
21,000 | |||
| 2020 |
1,958,250 | |||
|
|
|
|||
| $ | 2,234,573 | |||
|
|
|
| 8. | Treasury Stock |
On October 9, 2003, the Company’s Board of Directors authorized and the Company announced a program to repurchase up to $250,000 of the Company’s outstanding common stock. On each of June 13, 2005, May 25, 2006 and October 21, 2010, the Company’s Board of Directors authorized and the Company announced adding $250,000 to the program. The repurchase program allows for shares to be purchased from time to time in the open market or through privately negotiated transactions. No shares will be purchased from Artal Holdings, Sp. z o.o., Succursale de Luxembourg and its parents and subsidiaries under the program. The repurchase program currently has no expiration date.
During the fiscal years ended January 2, 2016, January 3, 2015 and December 28, 2013, the Company purchased no shares of its common stock in the open market under the repurchase program. As of the end of fiscal 2015, $208,933 remained available to purchase shares of our common stock under the repurchase program.
F-22
Table of Contents
WEIGHT WATCHERS INTERNATIONAL, INC. AND SUBSIDIARIES
NOTES TO CONSOLIDATED FINANCIAL STATEMENTS
(IN THOUSANDS, EXCEPT PER SHARE AMOUNTS)
| 9. | Earnings Per Share |
Basic earnings per share (“EPS”) are calculated utilizing the weighted average number of common shares outstanding during the periods presented. Diluted EPS is calculated utilizing the weighted average number of common shares outstanding during the periods presented adjusted for the effect of dilutive common stock equivalents.
The following table sets forth the computation of basic and diluted EPS for the fiscal years ended:
| January 2, 2016 |
January 3, 2015 |
December 28, 2013 |
||||||||||
| Numerator: |
||||||||||||
| Net income attributable to Weight Watchers International, Inc. |
$ | 32,945 | $ | 117,787 | $ | 202,742 | ||||||
|
|
|
|
|
|
|
|||||||
| Denominator: |
||||||||||||
| Weighted average shares of common stock outstanding |
58,369 | 56,607 | 56,144 | |||||||||
| Effect of dilutive common stock equivalents |
597 | 98 | 250 | |||||||||
|
|
|
|
|
|
|
|||||||
| Weighted average diluted common shares outstanding |
58,966 | 56,705 | 56,394 | |||||||||
|
|
|
|
|
|
|
|||||||
| Earnings Per Share attributable to Weight Watchers International, Inc. |
||||||||||||
| Basic |
$ | 0.56 | $ | 2.08 | $ | 3.61 | ||||||
|
|
|
|
|
|
|
|||||||
| Diluted |
$ | 0.56 | $ | 2.08 | $ | 3.60 | ||||||
|
|
|
|
|
|
|
|||||||
The number of anti-dilutive common stock equivalents excluded from the calculation of the weighted average number of common shares for diluted EPS was 1,699, 3,073, and 1,285 for the years ended January 2, 2016, January 3, 2015 and December 28, 2013, respectively.
| 10. | Stock Plans |
Incentive Compensation Plans and Winfrey Option
On May 6, 2008 and May 12, 2004, respectively, the Company’s shareholders approved the 2008 Stock Incentive Plan (the “2008 Plan”) and the 2004 Stock Incentive Plan (the “2004 Plan”). On May 6, 2014, the Company’s shareholders approved the 2014 Stock Incentive Plan (as amended, the “2014 Plan” and together with the 2004 Plan and the 2008 Plan, the “Stock Plans”), which replaced the 2008 Plan and 2004 Plan for all equity-based awards granted on or after May 6, 2014. The 2014 Plan is designed to promote the long-term financial interests and growth of the Company by attracting, motivating and retaining employees with the ability to contribute to the success of the business and to align compensation for the Company’s employees over a multi-year period directly with the interests of the shareholders of the Company. The Company’s Board of Directors or a committee thereof administers the 2014 Plan.
Under the 2014 Plan, grants may take the following forms at the Compensation and Benefit Committee’s discretion: non-qualified stock options, incentive stock options, stock appreciation rights, restricted stock units (“RSUs”), restricted stock and other share-based awards. As of its effective date, the maximum number of shares of common stock available for grant under the 2014 Plan was 3,500, subject to increase and adjustment as set forth in the 2014 Plan.
Under the 2014 Plan, the Company also grants fully-vested shares of its common stock to certain members of its Board of Directors. While these shares are fully vested the directors are restricted from selling these shares while they are still serving on the Company’s Board of Directors. During the fiscal years ended January 2, 2016, January 3, 2015 and December 28, 2013, the Company granted 50, 20, and 14, fully-vested shares, respectively, and recognized compensation expense of $507, $497, and $524, respectively.
F-23
Table of Contents
WEIGHT WATCHERS INTERNATIONAL, INC. AND SUBSIDIARIES
NOTES TO CONSOLIDATED FINANCIAL STATEMENTS
(IN THOUSANDS, EXCEPT PER SHARE AMOUNTS)
From time to time, the Company has granted fully-vested shares of its common stock to individuals in connection with special circumstances. In fiscal 2015, the Company granted an aggregate of 105 fully-vested shares of its common stock to individuals under such special circumstances.
Under the Winfrey Option Agreement, the Company granted Ms. Winfrey a fully vested non-qualified option to purchase 3,513 shares of its common stock as more fully described in Note 3.
The Company issues common stock for share-based compensation awards from treasury stock. The total compensation cost that has been charged against income for these plans and the Winfrey Option, as applicable, was $24,771, $10,533, and $4,255 for the years ended January 2, 2016, January 3, 2015 and December 28, 2013, respectively. Such amounts have been included as a component of selling, general and administrative expenses. The total income tax benefit recognized in the income statement for all share-based compensation arrangements was $8,170, $3,285, and $1,174 for the years ended January 2, 2016, January 3, 2015 and December 28, 2013, respectively. The tax benefits realized from options exercised and RSUs vested totaled $274, $301, and $4,217 for the years ended January 2, 2016, January 3, 2015 and December 28, 2013, respectively. No compensation costs were capitalized. As of January 2, 2016, there was $19,600 of total unrecognized compensation cost related to stock options and RSUs granted under the Stock Plans. That cost is expected to be recognized over a weighted-average period of approximately 1.5 years.
While the Stock Plans permit various types of awards, other than the aforementioned shares issued to directors and certain individuals in connection with special circumstances, grants under the plans have historically been either non-qualified stock options or RSUs. In fiscal 2015, 2014 and 2013, the Company also granted special performance-based stock option awards. The following describes some further details of these awards.
Stock Option Awards Under Stock Plans
Option Awards with Time Vesting Criteria
Pursuant to the option components of the Stock Plans, the Company’s Board of Directors authorized the Company to enter into agreements under which certain employees received stock options with time vesting criteria (“Time Vesting Options”). The options are exercisable based on the terms outlined in the agreements. Time Vesting Options outstanding at January 2, 2016 and January 3, 2015 vest over a period of three to five years and the expiration term is ten years. Time Vesting Options outstanding at January 2, 2016 and January 3, 2015 have an exercise price between $3.97 and $63.59 per share.
The fair value of each of these option awards is estimated on the date of grant using the Black-Scholes option pricing model with the weighted average assumptions noted in the following table. Expected volatility is based on the historical volatility of the Company’s stock. Since the Company’s option exercise history is limited, it has estimated the expected term of these option grants to be the midpoint between the vesting period and the contractual term of each award. The risk free interest rate is based on the U.S. Treasury yield curve in effect on the date of grant which most closely corresponds to the expected term of the Time Vesting Options. The dividend yield is based on our historic average dividend yield. The Company did not grant any Time Vesting Options in fiscal 2014.
| January 2, 2016 |
January 3, 2015 |
December 28, 2013 | ||||
| Dividend yield |
0.0% | 0.0% | 0.8% | |||
| Volatility |
41.0% | 0.0% | 36.5% | |||
| Risk-free interest rate |
1.84% - 1.89% | 0% - 0% | 1.3% - 2.2% | |||
| Expected term (years) |
6.0 | 0.0 | 6.5 |
F-24
Table of Contents
WEIGHT WATCHERS INTERNATIONAL, INC. AND SUBSIDIARIES
NOTES TO CONSOLIDATED FINANCIAL STATEMENTS
(IN THOUSANDS, EXCEPT PER SHARE AMOUNTS)
Option Awards with Time and Performance Vesting Criteria
Pursuant to the option components of the Stock Plans, the Company’s Board of Directors authorized the Company to enter into agreements under which certain employees received stock options with both time and performance vesting criteria (“T&P Vesting Options”). As of the end of fiscal 2015, there were no outstanding T&P Vesting Options. The options were exercisable based on the terms outlined in the agreements. During fiscal 2015, fiscal 2014 and fiscal 2013, the Company granted 37, 1,601 and 687 T&P Vesting Options, respectively, to certain employees that would have vested based on the achievement of both time and performance vesting criteria. The time-vesting criteria would have been 100% satisfied on the third anniversary of the date of the grant and the performance criteria was contingent upon meeting or exceeding certain stock price hurdles. With respect to the performance-vesting criteria, the stock options would have fully vested in 20% increments upon the first date that the average closing stock price for the 20 consecutive preceding trading days was equal to or greater than specified stock price hurdles. The fair value of the T&P Vesting Options was estimated on the date of grant and was based on the likelihood of the Company achieving the performance conditions. The Company estimated the fair value using a Monte Carlo simulation that used various assumptions that included expected volatility, a risk free rate and an expected term.
Expected volatility was based on the historical volatility of the Company’s stock. The risk-free interest rate was based on the U.S. Treasury yield curve in effect on the date of grant which most closely corresponds to the performance measurement period. The expected term represents the period from the grant date to the end of the five year performance period. Compensation expense on T&P Vesting Options is recognized ratably over the three year required service period as this period is longer than the derived service period calculated by the Monte Carlo simulation.
| January 2, 2016 |
January 3, 2015 |
December 28, 2013 | ||||
| Dividend yield |
0.0% | 0.0% | 0.0% | |||
| Volatility |
40.5% | 37.8% | 36.5% | |||
| Risk-free interest rate |
1.6% | 1.4% - 1.8% | 2% | |||
| Expected term (years) |
5.0 | 5.0 | 5.0 |
On May 7, 2015, the Company’s shareholders approved an amendment to the 2014 Plan to permit a one-time stock option exchange program under which the Company would offer eligible employees the opportunity to exchange certain eligible T&P Vesting Options on a (a) two-for-one basis for new stock options for all eligible employees, other than the Company’s Chief Executive Officer (i.e., so that the new stock options would cover half as many shares as the corresponding surrendered options) and (b) 3.5-for-one basis for new stock options for the Company’s Chief Executive Officer (i.e., so that the new stock options would cover a number of shares equal to the quotient of the number of shares covered by the corresponding surrendered options divided by 3.5). The option exchange program was designed to create better incentives for employees to remain with the Company and contribute to the attainment of its business and financial objectives.
On May 22, 2015, the Company launched a tender offer in connection with the option exchange program which expired on June 22, 2015. Pursuant to the offer, employees tendered options to purchase 1,700 shares of common stock (representing 99.6% of the total shares of common stock underlying the options eligible for exchange) with a weighted-average exercise price of $24.68 per share. The Company cancelled and replaced those options on June 22, 2015 with options to purchase 734 shares of common stock with an exercise price of $5.25 per share, which was the closing price per share of the Company’s common stock on the New York Stock
F-25
Table of Contents
WEIGHT WATCHERS INTERNATIONAL, INC. AND SUBSIDIARIES
NOTES TO CONSOLIDATED FINANCIAL STATEMENTS
(IN THOUSANDS, EXCEPT PER SHARE AMOUNTS)
Exchange on June 22, 2015. The replacement options vest over three years, with 25% vesting on each of the first and second anniversaries of the date of grant and 50% vesting on the third anniversary of the date of grant. The option exchange resulted in an incremental stock option expense of $1,599, which was determined by comparing the fair value of the T&P Vesting Option as calculated based on a Monte Carlo simulation, to the fair value of the replacement options, as calculated using the Black-Scholes option pricing model, for the eligible options at the time of exchange. This incremental expense, along with the unamortized expense associated with the cancelled options, is being recognized ratably over the new vesting period of the replacement options, which is three years.
Option Activity
A summary of all option activity under the Stock Plans and the Winfrey Option (see Note 3 for additional disclosure regarding the Winfrey Option) for the year ended January 2, 2016 is presented below:
| Shares | Weighted- Average Exercise Price |
Weighted- Average Remaining Contractual Life (Yrs.) |
Aggregate Intrinsic Value |
|||||||||||||
| Outstanding at January 3, 2015 |
3,250 | $ | 30.72 | |||||||||||||
| Granted |
4,572 | 6.61 | ||||||||||||||
| Exercised |
(4 | ) | 22.67 | |||||||||||||
| Exchanged |
(1,700 | ) | 24.68 | |||||||||||||
| Cancelled |
(788 | ) | 31.94 | |||||||||||||
|
|
|
|||||||||||||||
| Outstanding at January 2, 2016 |
5,330 | $ | 11.79 | 9.2 | $ | 73,260 | ||||||||||
|
|
|
|||||||||||||||
| Exercisable at January 2, 2016 |
3,916 | $ | 10.62 | 9.3 | $ | 55,772 | ||||||||||
|
|
|
|||||||||||||||
The weighted-average grant-date fair value of all options granted (including the Winfrey Option as described in Note 3) was $4.86, $6.51, and $11.37 for the years ended January 2, 2016, January 3, 2015 and December 28, 2013, respectively. The total intrinsic value of Time Vesting Options exercised was $17, $62, and $9,858 for the years ended January 2, 2016, January 3, 2015 and December 28, 2013, respectively.
Cash received from Time Vesting Options exercised during the years ended January 2, 2016, January 3, 2015 and December 28, 2013 was $95, $658, and $16,187, respectively.
Restricted Stock Units Under Stock Plans
Pursuant to the restricted stock components of the Stock Plans, the Company’s Board of Directors authorized the Company to enter into agreements under which certain employees received RSUs. The RSUs are exercisable based on the terms outlined in the agreements. The RSUs vest over a period of three to five years.
F-26
Table of Contents
WEIGHT WATCHERS INTERNATIONAL, INC. AND SUBSIDIARIES
NOTES TO CONSOLIDATED FINANCIAL STATEMENTS
(IN THOUSANDS, EXCEPT PER SHARE AMOUNTS)
The fair value of RSUs is determined using the closing market price of the Company’s common stock on the date of grant. A summary of RSU activity under the Stock Plans for the year ended January 2, 2016 is presented below:
| Shares | Weighted-Average Grant-Date Fair Value |
|||||||
| Outstanding at January 3, 2015 |
838 | $ | 27.71 | |||||
| Granted |
780 | $ | 5.55 | |||||
| Vested |
(35 | ) | $ | 51.18 | ||||
| Forfeited |
(217 | ) | $ | 26.25 | ||||
|
|
|
|||||||
| Outstanding at January 2, 2016 |
1,366 | $ | 27.71 | |||||
|
|
|
|||||||
The weighted-average grant-date fair value of RSUs granted was $5.55, $24.37, and $38.40 for the years ended January 2, 2016, January 3, 2015 and December 28, 2013, respectively. The total fair value of RSUs vested during the years ended January 2, 2016, January 3, 2015 and December 28, 2013 was $1,804, $3,042, and $1,705, respectively.
| 11. | Income Taxes |
The following tables summarize the Company’s consolidated provision for US federal, state and foreign taxes on income:
| January 2, 2016 |
January 3, 2015 |
December 28, 2013 |
||||||||||
| Current: |
||||||||||||
| US federal |
$ | (6,862 | ) | $ | 12,904 | $ | 60,030 | |||||
| State |
1,859 | (131 | ) | 9,583 | ||||||||
| Foreign |
15,740 | 24,059 | 25,647 | |||||||||
|
|
|
|
|
|
|
|||||||
| $ | 10,737 | $ | 36,832 | $ | 95,260 | |||||||
|
|
|
|
|
|
|
|||||||
| Deferred: |
||||||||||||
| US federal |
$ | 10,756 | $ | 25,162 | $ | 30,513 | ||||||
| State |
1,890 | 2,876 | 3,487 | |||||||||
| Foreign |
(548 | ) | 1,061 | 358 | ||||||||
|
|
|
|
|
|
|
|||||||
| $ | 12,098 | $ | 29,099 | $ | 34,358 | |||||||
|
|
|
|
|
|
|
|||||||
| Total tax provision |
$ | 22,835 | $ | 65,931 | $ | 129,618 | ||||||
|
|
|
|
|
|
|
|||||||
The components of the Company’s consolidated income before income taxes consist of the following:
| January 2, 2016 |
January 3, 2015 |
December 28, 2013 |
||||||||||
| Domestic |
$ | 6,299 | $ | 88,024 | $ | 248,637 | ||||||
| Foreign |
49,315 | 95,640 | 83,723 | |||||||||
|
|
|
|
|
|
|
|||||||
| $ | 55,614 | $ | 183,664 | $ | 332,360 | |||||||
|
|
|
|
|
|
|
|||||||
F-27
Table of Contents
WEIGHT WATCHERS INTERNATIONAL, INC. AND SUBSIDIARIES
NOTES TO CONSOLIDATED FINANCIAL STATEMENTS
(IN THOUSANDS, EXCEPT PER SHARE AMOUNTS)
The difference between the US federal statutory tax rate and the Company’s consolidated effective tax rate is as follows:
| January 2, 2016 |
January 3, 2015 |
December 28, 2013 |
||||||||||
| US federal statutory rate |
35.0 | % | 35.0 | % | 35.0 | % | ||||||
| States income taxes (net of federal benefit) |
3.8 | 1.3 | 2.7 | |||||||||
| Reserves for uncertain tax positions |
3.5 | 0.4 | (0.1 | ) | ||||||||
| Foreign taxes |
(0.4 | ) | (0.6 | ) | 0.4 | |||||||
| (Decrease) increase in valuation allowance |
(2.2 | ) | 1.7 | 0.9 | ||||||||
| Loss on closure of China |
0.0 | (2.1 | ) | 0.0 | ||||||||
| Other |
1.4 | 0.2 | 0.1 | |||||||||
|
|
|
|
|
|
|
|||||||
| Effective tax rate |
41.1 | % | 35.9 | % | 39.0 | % | ||||||
|
|
|
|
|
|
|
|||||||
The deferred tax assets and liabilities recorded on the Company’s consolidated balance sheets are as follows:
| January 2, 2016 |
January 3, 2015 |
|||||||
| Provision for estimated expenses |
$ | 4,638 | $ | 7,863 | ||||
| Depreciation |
4,164 | 0 | ||||||
| Operating loss carryforwards |
34,285 | 37,746 | ||||||
| Salaries and wages |
641 | 9,567 | ||||||
| Share-based compensation |
14,330 | 6,653 | ||||||
| Other |
8,024 | 6,922 | ||||||
| Other comprehensive income |
24,778 | 13,060 | ||||||
| Less: valuation allowance |
(28,279 | ) | (34,640 | ) | ||||
|
|
|
|
|
|||||
| Total deferred tax assets |
$ | 62,581 | $ | 47,171 | ||||
|
|
|
|
|
|||||
| Depreciation |
$ | 0 | $ | (6,482 | ) | |||
| Other |
(1,823 | ) | (3,123 | ) | ||||
| Amortization |
(210,901 | ) | (188,745 | ) | ||||
|
|
|
|
|
|||||
| Total deferred tax liabilities |
$ | (212,724 | ) | $ | (198,350 | ) | ||
|
|
|
|
|
|||||
| Net deferred tax liabilities |
$ | (150,143 | ) | $ | (151,179 | ) | ||
|
|
|
|
|
|||||
Certain foreign operations of the Company have generated net operating loss carryforwards. If it has been determined that it is more-likely-than-not that the deferred tax assets associated with these net operating loss carryforwards will not be utilized, a valuation allowance has been recorded. As of January 2, 2016 and January 3, 2015, various foreign subsidiaries had net operating loss carryforwards of approximately $138,562 and $142,433, respectively, most of which can be carried forward indefinitely.
The Company’s undistributed earnings of substantially all of its foreign subsidiaries are not considered to be permanently reinvested. Accordingly, the Company has recorded all taxes, after taking into account foreign tax credits, on the undistributed earnings of these foreign subsidiaries.
The undistributed earnings of the remaining foreign subsidiaries are indefinitely invested outside the United States. We have not recorded a deferred tax liability of approximately $10,000 for the U.S. income taxes on the undistributed earnings of these foreign subsidiaries.
F-28
Table of Contents
WEIGHT WATCHERS INTERNATIONAL, INC. AND SUBSIDIARIES
NOTES TO CONSOLIDATED FINANCIAL STATEMENTS
(IN THOUSANDS, EXCEPT PER SHARE AMOUNTS)
A reconciliation of the beginning and ending amount of unrecognized tax benefits is as follows:
| January 2, 2016 |
January 3, 2015 |
December 28, 2013 |
||||||||||
| Balance at beginning of year |
$ | 6,268 | $ | 5,784 | $ | 5,319 | ||||||
| Additions based on tax positions related to the current year |
2,106 | 1,304 | 1,428 | |||||||||
| Reductions for tax positions of prior years |
(676 | ) | (820 | ) | (963 | ) | ||||||
|
|
|
|
|
|
|
|||||||
| Balance at end of year |
$ | 7,698 | $ | 6,268 | $ | 5,784 | ||||||
|
|
|
|
|
|
|
|||||||
At January 2, 2016, the total amount of unrecognized tax benefits that, if recognized, would affect our effective tax rate is $6,948. As of January 2, 2016, given the nature of the Company’s uncertain tax positions, it is reasonably possible that there will not be a significant change in the Company’s uncertain tax benefits within the next twelve months.
The Company recognizes interest and penalties related to unrecognized tax benefits in income tax expense. The Company had $1,229 and $2,300 of accrued interest and penalties at January 2, 2016 and January 3, 2015, respectively. The Company recognized $(266), $83, and $(1,188) in interest and penalties during the fiscal years ended January 2, 2016, January 3, 2015 and December 28, 2013, respectively.
The Company or one of its subsidiaries files income tax returns in the US federal jurisdiction, and various state and foreign jurisdictions. At January 2, 2016, with few exceptions, the Company was no longer subject to US federal, state or local income tax examinations by tax authorities for years prior to 2012, or non-US income tax examinations by tax authorities for years prior to 2009.
| 12. | Employee Benefit Plans |
The Company sponsors the Third Amended and Restated Weight Watchers Savings Plan (the “Savings Plan”) for salaried and certain hourly US employees of the Company. The Savings Plan is a defined contribution plan that provides for employer matching contributions of 100% of the employee’s tax deferred contributions up to 3% of an employee’s eligible compensation for the fiscal years ended January 2, 2016, January 3, 2015 and December 28, 2013. Expense related to these contributions for the fiscal years ended January 2, 2016, January 3, 2015 and December 28, 2013 was $2,454, $2,525, and $2,888, respectively.
During fiscal 2014, the Company received a favorable determination letter from the IRS that qualifies the Savings Plan under Section 401(a) of the Internal Revenue Code.
Pursuant to the Savings Plan, the Company also makes profit sharing contributions for all full-time salaried US employees who are eligible to participate in the Savings Plan (except for certain management personnel). The profit sharing contribution is a guaranteed monthly employer contribution on behalf of each participant based on the participant’s age and a percentage of the participant’s eligible compensation. The Savings Plan also has a discretionary supplemental profit sharing employer contribution component that is determined annually by the Compensation and Benefits Committee of the Company’s Board of Directors. Expense related to these contributions for the fiscal years ended January 2, 2016, January 3, 2015 and December 28, 2013 was $733, $266, and $1,658, respectively.
For certain US management personnel, the Company sponsors the Second Amended and Restated Weight Watchers Executive Profit Sharing Plan (“EPSP”). Under the IRS definition, the EPSP is considered a Nonqualified Deferred Compensation Plan. There is a promise of payment by the Company made on the
F-29
Table of Contents
WEIGHT WATCHERS INTERNATIONAL, INC. AND SUBSIDIARIES
NOTES TO CONSOLIDATED FINANCIAL STATEMENTS
(IN THOUSANDS, EXCEPT PER SHARE AMOUNTS)
employees’ behalf instead of an individual account with a cash balance. The EPSP provides for a guaranteed employer contribution on behalf of each participant based on the participant’s age and a percentage of the participant’s eligible compensation. The EPSP has a discretionary supplemental employer contribution component that is determined annually by the Compensation and Benefits Committee of the Company’s Board of Directors. The account is valued at the end of each fiscal month, based on an annualized interest rate of prime plus 2%, with an annualized cap of 15%. Expense related to this commitment for the fiscal years ended January 2, 2016, January 3, 2015 and December 28, 2013 was $1,950, $1,090, and $2,651, respectively.
| 13. | Cash Flow Information |
| January 2, 2016 |
January 3, 2015 |
December 28, 2013 |
||||||||||
| Net cash paid during the year for: |
||||||||||||
| Interest expense |
$ | 117,602 | $ | 123,100 | $ | 99,687 | ||||||
| Income taxes |
$ | 25,566 | $ | 35,232 | $ | 87,071 | ||||||
| Noncash investing and financing activities were as follows: |
||||||||||||
| Fair value of net assets/(liabilities) acquired in connection with acquisitions |
$ | 1,439 | $ | 359 | $ | (175 | ) | |||||
| Change in Capital expenditures and Capitalized software included in accounts payable and accrued expenses |
$ | (1,969 | ) | $ | 3,347 | $ | (5,432 | ) | ||||
| Dividends declared but not yet paid at year-end |
$ | 0 | $ | 0 | $ | 177 | ||||||
| 14. | Commitments and Contingencies |
In re Weight Watchers International, Inc. Securities Litigation
In March 2014, two substantially identical putative class action complaints alleging violation of the federal securities laws were filed by individual shareholders against the Company, certain of the Company’s current and former officers and directors, and Artal Group S.A. (“Artal”) in the United States District Court for the Southern District of New York. The complaints were purportedly filed on behalf of all purchasers of the Company’s common stock, no par value per share, between February 14, 2012 and October 30, 2013, inclusive (the “Class Period”). The complaints allege that, during the Class Period, the defendants disseminated materially false and misleading statements and/or concealed material adverse facts. The complaints allege claims under Sections 10(b) and 20(a) of the Securities Exchange Act of 1934, as amended, and Rule 10b-5 thereunder. The plaintiffs seek to recover unspecified damages on behalf of the class members. In June 2014, the Court consolidated the cases and appointed lead plaintiffs and lead counsel. On August 12, 2014, the plaintiffs filed an amended complaint that, among other things, reduced the Class Period to between February 14, 2012 and February 13, 2013 and dropped all current officers and certain directors previously named as defendants. On October 14, 2014, the defendants filed a motion to dismiss. The plaintiffs filed an opposition to the defendants’ motion to dismiss on November 24, 2014 and the defendants filed a reply in support of their motion to dismiss on December 23, 2014. The Company continues to believe that the suits are without merit and intends to defend them vigorously.
Tracey Mead, Derivatively on Behalf of Weight Watchers International, Inc. vs. Artal Group et. al. and Weight Watchers International, Inc.
On May 29, 2014 and June 23, 2014, the Company received shareholder litigation demand letters alleging breaches of fiduciary duties and unjust enrichment by Company officers and directors and Artal, to the alleged
F-30
Table of Contents
WEIGHT WATCHERS INTERNATIONAL, INC. AND SUBSIDIARIES
NOTES TO CONSOLIDATED FINANCIAL STATEMENTS
(IN THOUSANDS, EXCEPT PER SHARE AMOUNTS)
injury of the Company. The allegations in the letters relate to those contained in the ongoing federal securities litigation described above. In response to the letters, pursuant to Virginia law, the Board of Directors has created a special committee to review and evaluate the facts and circumstances surrounding the claims made in the demand letters. The special committee has decided to undertake its review after receiving a decision on defendants’ motion to dismiss in the federal securities litigation given the overlapping issues.
On August 11, 2015, a purported shareholder derivative lawsuit was filed in New York State Court in Westchester County. The complaint alleges that certain Company directors and executive officers breached their various fiduciary duties by knowingly causing the Company to repurchase shares from Artal and from certain executive officers at artificially inflated prices in connection with a tender offer made to all shareholders. The complaint seeks an order for the defendants to disgorge all profits made from selling Company stock between March 16, 2012 and April 9, 2012, as well as an award for damages sustained by the alleged breaches of fiduciary duty. The parties sought to stay this suit pending a decision on defendants’ motion to dismiss in the federal securities litigation asserting similar allegations. The Court denied the stay, but at the preliminary court conference on December 17, 2015, the Court granted an adjournment and scheduled the next court conference for April 29, 2016. The Company believes that the suit is without merit and intends to defend it vigorously.
Raymond Roberts v. Weight Watchers International, Inc.
On January 7, 2016, an OnlinePlus member filed a putative class action complaint against the Company in the Supreme Court of New York, New York County, asserting class claims for breach of contract and violations of the New York General Business Law. On February 5, 2016, the Company removed the case to the United States District Court, Sothern District of New York. Specifically, the plaintiff is asserting that, as a result of the temporary glitches in the Company’s website and app in November and December 2015, the Company has: (1) breached its Subscription Agreement with its OnlinePlus members; and (2) engaged in misleading advertising and deceptive acts and practices in violation of Sections 349 and 350 of the New York General Business Law. The plaintiff is seeking unspecified actual, punitive and statutory damages, as well as his attorneys’ fees and costs incurred in connection with this action. The Company believes that the suit is without merit and intends to defend it vigorously.
Other Litigation Matters
Due to the nature of the Company’s activities, it is also, at times, subject to pending and threatened legal actions that arise out of the ordinary course of business. In the opinion of management, the disposition of any such matters is not expected to have a material effect on the Company’s results of operations, financial condition or cash flows.
Commitments
Minimum commitments under non-cancelable obligations, primarily for office and rental facilities operating leases at January 2, 2016, consist of the following:
| 2016 |
$ | 46,086 | ||
| 2017 |
30,650 | |||
| 2018 |
20,214 | |||
| 2019 |
15,098 | |||
| 2020 |
12,093 | |||
| 2021 and thereafter |
95,437 | |||
|
|
|
|||
| Total |
$ | 219,578 | ||
|
|
|
F-31
Table of Contents
WEIGHT WATCHERS INTERNATIONAL, INC. AND SUBSIDIARIES
NOTES TO CONSOLIDATED FINANCIAL STATEMENTS
(IN THOUSANDS, EXCEPT PER SHARE AMOUNTS)
Total rent expense charged to operations under these operating leases for the fiscal years ended January 2, 2016, January 3, 2015 and December 28, 2013 was $42,133, $44,228, and $46,300, respectively.
| 15. | Segment and Geographic Data |
The Company has four reportable segments based on an integrated geographical structure as follows: North America, United Kingdom, Continental Europe (CE) and Other. Other consists of Asia Pacific and emerging markets operations and franchise revenues and related costs, all of which have been grouped together as if they were a single reportable segment because they do not meet any of the quantitative thresholds and are immaterial for separate disclosure. To be consistent with the information that is presented to the chief operating decision maker, the Company does not include intercompany activity in the segment results.
| Total Revenue for the Year Ended | ||||||||||||
| January 2, 2016 |
January 3, 2015 |
December 28, 2013 |
||||||||||
| North America |
$ | 755,396 | $ | 947,716 | $ | 1,163,002 | ||||||
| United Kingdom |
124,773 | 156,843 | 172,783 | |||||||||
| Continental Europe |
229,147 | 298,878 | 299,403 | |||||||||
| Other |
55,103 | 76,479 | 88,935 | |||||||||
|
|
|
|
|
|
|
|||||||
| Total revenue |
$ | 1,164,419 | $ | 1,479,916 | $ | 1,724,123 | ||||||
|
|
|
|
|
|
|
|||||||
| Net Income for the Year Ended | ||||||||||||
| January 2, 2016 |
January 3, 2015 |
December 28, 2013 |
||||||||||
| Segment operating income: |
||||||||||||
| North America |
$ | 140,579 | $ | 250,282 | $ | 403,104 | ||||||
| United Kingdom |
24,310 | 29,187 | 34,429 | |||||||||
| Continental Europe |
62,364 | 79,282 | 66,273 | |||||||||
| Other |
8,007 | 13,676 | 13,774 | |||||||||
|
|
|
|
|
|
|
|||||||
| Total segment operating income |
235,260 | 372,427 | 517,580 | |||||||||
| General corporate expenses |
(67,202 | ) | (73,113 | ) | (59,828 | ) | ||||||
| Interest expense |
121,843 | 122,984 | 103,108 | |||||||||
| Other expense, net |
2,027 | 3,206 | 599 | |||||||||
| Gain on Brazil acquisition |
0 | (10,540 | ) | 0 | ||||||||
| (Gain) loss on early extinguishment of debt |
(11,426 | ) | 0 | 21,685 | ||||||||
| Provision for taxes |
22,835 | 65,931 | 129,618 | |||||||||
|
|
|
|
|
|
|
|||||||
| Net income |
32,779 | 117,733 | 202,742 | |||||||||
| Net income attributable to noncontrolling interest |
166 | 54 | — | |||||||||
|
|
|
|
|
|
|
|||||||
| Net income attributable to Weight Watchers International, Inc. |
$ | 32,945 | $ | 117,787 | $ | 202,742 | ||||||
|
|
|
|
|
|
|
|||||||
F-32
Table of Contents
WEIGHT WATCHERS INTERNATIONAL, INC. AND SUBSIDIARIES
NOTES TO CONSOLIDATED FINANCIAL STATEMENTS
(IN THOUSANDS, EXCEPT PER SHARE AMOUNTS)
| Depreciation and Amortization for the Year Ended | ||||||||||||
| January 2, 2016 |
January 3, 2015 |
December 28, 2013 |
||||||||||
| North America |
$ | 47,128 | $ | 34,654 | $ | 35,928 | ||||||
| United Kingdom |
766 | 1,158 | 1,269 | |||||||||
| Continental Europe |
1,861 | 2,356 | 2,222 | |||||||||
| Other |
1,473 | 2,144 | 1,965 | |||||||||
|
|
|
|
|
|
|
|||||||
| Total segment depreciation and amortization |
51,228 | 40,312 | 41,384 | |||||||||
| General corporate depreciation and amortization |
8,829 | 18,227 | 14,197 | |||||||||
|
|
|
|
|
|
|
|||||||
| Depreciation and amortization |
$ | 60,057 | $ | 58,539 | $ | 55,581 | ||||||
|
|
|
|
|
|
|
|||||||
The following tables present information about the Company’s sources of revenue and other information by geographic area. There were no material amounts of sales or transfers among geographic areas and no material amounts of US export sales.
| Revenues for the Year Ended | ||||||||||||
| January 2, 2016 |
January 3, 2015 |
December 28, 2013 |
||||||||||
| Meeting Fees |
$ | 587,801 | $ | 744,560 | $ | 851,626 | ||||||
| Online Subscription Revenues |
349,567 | 437,385 | 509,135 | |||||||||
| In-meeting product sales |
127,291 | 169,101 | 211,963 | |||||||||
| Licensing, franchise royalties and other |
99,760 | 128,870 | 151,399 | |||||||||
|
|
|
|
|
|
|
|||||||
| $ | 1,164,419 | $ | 1,479,916 | $ | 1,724,123 | |||||||
|
|
|
|
|
|
|
|||||||
| Revenues for the Year Ended | ||||||||||||
| January 2, 2016 |
January 3, 2015 |
December 28, 2013 |
||||||||||
| United States |
$ | 700,972 | $ | 869,541 | $ | 1,067,200 | ||||||
| Canada |
54,277 | 78,175 | 95,802 | |||||||||
| United Kingdom |
124,773 | 156,843 | 172,783 | |||||||||
| Continental Europe |
229,147 | 298,878 | 299,403 | |||||||||
| Other |
55,250 | 76,479 | 88,935 | |||||||||
|
|
|
|
|
|
|
|||||||
| $ | 1,164,419 | $ | 1,479,916 | $ | 1,724,123 | |||||||
|
|
|
|
|
|
|
|||||||
| Long-Lived Assets | ||||||||||||
| January 2, 2016 |
January 3, 2015 |
December 28, 2013 |
||||||||||
| United States |
$ | 51,103 | $ | 67,903 | $ | 79,448 | ||||||
| Canada |
2,757 | 3,149 | 3,070 | |||||||||
| United Kingdom |
2,938 | 724 | 1,192 | |||||||||
| Continental Europe |
614 | 1,454 | 2,083 | |||||||||
| Other |
774 | 1,420 | 1,259 | |||||||||
|
|
|
|
|
|
|
|||||||
| $ | 58,186 | $ | 74,650 | $ | 87,052 | |||||||
|
|
|
|
|
|
|
|||||||
F-33
Table of Contents
WEIGHT WATCHERS INTERNATIONAL, INC. AND SUBSIDIARIES
NOTES TO CONSOLIDATED FINANCIAL STATEMENTS
(IN THOUSANDS, EXCEPT PER SHARE AMOUNTS)
| 16. | Fair Value Measurements |
Accounting guidance on fair value measurements for certain financial assets and liabilities requires that assets and liabilities carried at fair value be classified and disclosed in one of the following three categories:
| • | Level 1—Quoted prices in active markets for identical assets or liabilities. |
| • | Level 2—Observable inputs other than Level 1 prices, such as quoted prices for similar assets or liabilities; quoted prices in markets that are not active; or other inputs that are observable or can be corroborated by observable market data for substantially the full term of the assets or liabilities. |
| • | Level 3—Unobservable inputs that are supported by little or no market activity and that are significant to the fair value of the assets or liabilities. |
When measuring fair value, the Company is required to maximize the use of observable inputs and minimize the use of unobservable inputs.
Fair Value of Financial Instruments
The Company’s significant financial instruments include long-term debt and interest rate swap agreements. The fair value of the Company’s borrowings under the Revolving Facility approximates a carrying value of $48,000 due to the nature of the debt.
The fair value of the Company’s Term Facilities is determined by utilizing average bid prices on or near the end of each fiscal quarter (Level 2 input). As of January 2, 2016 and January 3, 2015, the fair value of the Company’s long-term debt was approximately $1,682,778 and $1,888,051, respectively, as compared to carrying value of $2,186,573 and $2,358,000, respectively.
Derivative Financial Instruments
The fair values for the Company’s derivative financial instruments are determined using observable current market information such as the prevailing LIBOR interest rate and LIBOR yield curve rates and include consideration of counterparty credit risk. See Note 17 for disclosures related to derivative financial instruments.
The following table presents the aggregate fair value of the Company’s derivative financial instruments:
| Fair Value Measurements Using: | ||||||||||||||||
| Total Fair Value |
Quoted Prices in Active Markets for Identical Assets (Level 1) |
Significant Other Observable Inputs (Level 2) |
Significant Unobservable Inputs (Level 3) |
|||||||||||||
| Interest rate swap liability at January 2, 2016 |
$ | 44,170 | $ | 0 | $ | 44,170 | $ | 0 | ||||||||
| Interest rate swap liability at January 3, 2015 |
$ | 42,423 | $ | 0 | $ | 42,423 | $ | 0 | ||||||||
The Company did not have any transfers into or out of Levels 1 and 2, and did not maintain any assets or liabilities classified as Level 3, during the fiscal years ended January 2, 2016 and January 3, 2015.
| 17. | Derivative Instruments and Hedging |
As of January 2, 2016 and January 3, 2015, the Company had in effect an interest rate swap with a notional amount totaling $1,500,000.
F-34
Table of Contents
WEIGHT WATCHERS INTERNATIONAL, INC. AND SUBSIDIARIES
NOTES TO CONSOLIDATED FINANCIAL STATEMENTS
(IN THOUSANDS, EXCEPT PER SHARE AMOUNTS)
In January 2009, the Company entered into a forward-starting interest rate swap which had an effective date of January 4, 2010 and a termination date of January 27, 2014. From December 29, 2012 through April 1, 2013, this swap had qualified for hedge accounting, and therefore changes in the fair value of this derivative were recorded in accumulated other comprehensive income (loss). Effective April 2, 2013, due to the Company’s debt refinancing, the Company ceased the application of hedge accounting for this swap. Accordingly, changes in the fair value of this swap were recorded in earnings subsequent to April 2, 2013 and were immaterial for the fiscal year ended January 3, 2015.
On July 26, 2013, in order to hedge an additional portion of its variable rate debt, the Company entered into a forward-starting interest rate swap with an effective date of March 31, 2014 and a termination date of April 2, 2020. The initial notional amount of this swap was $1,500,000. During the term of this swap, the notional amount will decrease from $1,500,000 effective March 31, 2014 to $1,250,000 on April 3, 2017 with a further reduction to $1,000,000 on April 1, 2019. This interest rate swap effectively fixes the variable interest rate on the notional amount of this swap at 2.38%. This swap qualifies for hedge accounting and, therefore, changes in the fair value of this swap have been recorded in accumulated other comprehensive income (loss).
As of January 2, 2016 and January 3, 2015, cumulative unrealized losses for qualifying hedges were reported as a component of accumulated other comprehensive loss in the amounts of $23,135 ($38,053 before taxes) and $21,856 ($35,830 before taxes), respectively.
The Company is hedging forecasted transactions for periods not exceeding the next six years. The Company expects approximately $10,796 ($17,698 before taxes) of derivative losses included in accumulated other comprehensive loss at January 2, 2016, based on current market rates, will be reclassified into earnings within the next 12 months.
| 18. | Accumulated Other Comprehensive Loss |
With respect to the disclosure of the amounts reclassified from accumulated other comprehensive income for the fiscal year ended January 3, 2015 the Company has revised the amounts previously disclosed to correct those amounts by increasing the amount reclassified related to the Loss on Qualifying Hedges from $7,413 to $19,815 and $4,522 to $12,087 on a pre- and after-tax basis, respectively.
F-35
Table of Contents
WEIGHT WATCHERS INTERNATIONAL, INC. AND SUBSIDIARIES
NOTES TO CONSOLIDATED FINANCIAL STATEMENTS
(IN THOUSANDS, EXCEPT PER SHARE AMOUNTS)
Amounts reclassified out of accumulated other comprehensive income (loss) are as follows:
Changes in Accumulated Other Comprehensive Income (Loss) by Component(a)
| Fiscal Year Ended January 2, 2016 | ||||||||||||
| Loss on Qualifying Hedges |
Foreign Currency Translation Adjustments |
Total | ||||||||||
| Beginning Balance at January 3, 2015 |
$ | (21,856 | ) | 1,906 | $ | (19,950 | ) | |||||
|
|
|
|
|
|
|
|||||||
| Other comprehensive loss before reclassifications, net of tax |
(16,371 | ) | (16,973 | ) | (33,344 | ) | ||||||
| Amounts reclassified from accumulated other comprehensive loss, net of tax(b) |
15,092 | 0 | 15,092 | |||||||||
|
|
|
|
|
|
|
|||||||
| Net current period other comprehensive loss including noncontrolling interest |
(1,279 | ) | (16,973 | ) | (18,252 | ) | ||||||
|
|
|
|
|
|
|
|||||||
| Less: net current period other comprehensive loss attributable to the noncontrolling interest |
0 | 937 | 937 | |||||||||
|
|
|
|
|
|
|
|||||||
| Ending Balance at January 2, 2016 |
$ | (23,135 | ) | $ | (14,130 | ) | $ | (37,265 | ) | |||
|
|
|
|
|
|
|
|||||||
| (a) | Amounts in parentheses indicate debits |
| (b) | See separate table below for details about these reclassifications |
| Fiscal Year Ended January 3, 2015 | ||||||||||||
| Loss on Qualifying Hedges |
Foreign Currency Translation Adjustments |
Total | ||||||||||
| Beginning Balance at December 28, 2013 |
$ | (4,603 | ) | $ | 13,120 | $ | 8,517 | |||||
|
|
|
|
|
|
|
|||||||
| Other comprehensive loss before reclassifications, net of tax |
(29,340 | ) | (11,692 | ) | (41,032 | ) | ||||||
| Amounts reclassified from accumulated other comprehensive income, net of tax(b) |
12,087 | 0 | 12,087 | |||||||||
|
|
|
|
|
|
|
|||||||
| Net current period other comprehensive loss including noncontrolling interest |
(17,253 | ) | (11,692 | ) | (28,945 | ) | ||||||
|
|
|
|
|
|
|
|||||||
| Less: net current period other comprehensive loss attributable to the noncontrolling interest |
0 | 478 | 478 | |||||||||
|
|
|
|
|
|
|
|||||||
| Ending Balance at January 3, 2015 |
$ | (21,856 | ) | $ | 1,906 | $ | (19,950 | ) | ||||
|
|
|
|
|
|
|
|||||||
| (a) | Amounts in parentheses indicate debits |
| (b) | See separate table below for details about these reclassifications |
F-36
Table of Contents
WEIGHT WATCHERS INTERNATIONAL, INC. AND SUBSIDIARIES
NOTES TO CONSOLIDATED FINANCIAL STATEMENTS
(IN THOUSANDS, EXCEPT PER SHARE AMOUNTS)
| Fiscal Year Ended December 28, 2013 | ||||||||||||
| Loss on Qualifying Hedges |
Foreign Currency Translation Adjustments |
Total | ||||||||||
| Beginning Balance at December 29, 2012 |
$ | (6,602 | ) | $ | 19,461 | $ | 12,859 | |||||
|
|
|
|
|
|
|
|||||||
| Other comprehensive loss before reclassifications, net of tax |
(4,124 | ) | (6,341 | ) | (10,465 | ) | ||||||
| Amounts reclassified from accumulated other comprehensive income, net of tax(b) |
6,123 | 0 | 6,123 | |||||||||
|
|
|
|
|
|
|
|||||||
| Net current period other comprehensive loss including noncontrolling interest |
1,999 | (6,341 | ) | (4,342 | ) | |||||||
|
|
|
|
|
|
|
|||||||
| Ending Balance at December 28, 2013 |
$ | (4,603 | ) | $ | 13,120 | $ | 8,517 | |||||
|
|
|
|
|
|
|
|||||||
| (a) | Amounts in parentheses indicate debits |
| (b) | See separate table below for details about these reclassifications |
Reclassifications out of Accumulated Other Comprehensive Income (Loss)(a)
| Fiscal Year Ended | ||||||||||||||
| January 2, 2016 |
January 3, 2015 |
December 28, 2013 |
||||||||||||
| Details about Other Comprehensive Income Components |
Amounts Reclassified from Accumulated Other Comprehensive Loss |
Affected Line Item in
the | ||||||||||||
| Loss on Qualifying Hedges |
||||||||||||||
| Interest rate contracts |
$ | (24,741 | ) | $ | (19,815 | ) | $ | (10,037 | ) | Interest expense | ||||
|
|
|
|
|
|
|
|||||||||
| (24,741 | ) | (19,815 | ) | (10,037 | ) | Income before income taxes | ||||||||
| 9,649 | 7,728 | 3,914 | Provision for income taxes | |||||||||||
|
|
|
|
|
|
|
|||||||||
| $ | (15,092 | ) | $ | (12,087 | ) | $ | (6,123 | ) | Net income | |||||
|
|
|
|
|
|
|
|||||||||
| (a) | Amounts in parentheses indicate debits to profit / loss |
| 19. | Restructuring Charges |
As previously disclosed, the Company established a new cost-savings initiative and, as part of this cost-savings initiative, in fiscal 2015, the Company undertook a plan of reduction in force which resulted in the elimination of certain positions and termination of employment for certain employees worldwide. In fiscal 2014, the Company reviewed its organization and undertook a restructuring which resulted in the elimination of certain positions and the termination of employment for certain employees worldwide.
In connection with these plans, the Company recorded restructuring charges in connection with employee termination benefit costs of $8,412 ($5,131 after tax) and $11,840 ($7,222 after tax) during the fiscal years ended January 2, 2016 and January 3, 2015, respectively. For the fiscal years ended January 2, 2016 and January 3, 2015, these charges impacted cost of revenues by $1,505 and $4,642, respectively, and selling, general and administrative expenses by $6,907 and $7,198, respectively. For the fiscal years ended January 2, 2016 and January 3, 2015, all restructuring charges were recorded to general corporate expense and therefore there was no impact to the segments.
F-37
Table of Contents
WEIGHT WATCHERS INTERNATIONAL, INC. AND SUBSIDIARIES
NOTES TO CONSOLIDATED FINANCIAL STATEMENTS
(IN THOUSANDS, EXCEPT PER SHARE AMOUNTS)
For the fiscal year ended January 2, 2016, the reconciliation of the liability balance for these restructuring charges was as follows:
| Balance as of January 3, 2015 |
$ | 2,570 | ||
| Provision |
8,412 | |||
| Payments |
(9,173 | ) | ||
|
|
|
|||
| Balance as of January 2, 2016 |
$ | 1,809 | ||
|
|
|
The Company expects the $1,809 liability as of January 2, 2016 to be paid in fiscal 2016.
| 20. | Recently Issued Accounting Pronouncements |
In May 2014, the Financial Accounting Standards Board (“FASB”) issued updated guidance on accounting for revenue from contracts with customers. The objective of this guidance is to provide a single, comprehensive revenue recognition model, to remove existing industry specific guidance and to expand qualitative and quantitative disclosures. The core principle of the new standard is for revenue recognition to depict transfer of control to the customer in an amount that reflects consideration to which an entity expects to be entitled. This guidance is effective for fiscal years beginning after December 15, 2017, and interim periods within those fiscal years, with early adoption not permitted. The Company is currently evaluating the impact that the adoption of this guidance will have on the consolidated financial position, results of operations or cash flows of the Company.
In August 2014, the FASB issued updated guidance on the disclosure of uncertainties about an entity’s ability to continue as a going concern. The update provides guidance about management’s responsibility to evaluate whether there is substantial doubt about an entity’s ability to continue as a going concern and to provide related footnote disclosures. In doing so, the amendments should reduce diversity in the timing and content of footnote disclosures. This guidance is effective for the annual period ending after December 15, 2016, and for annual periods and interim periods thereafter, with early adoption permitted. The Company is currently evaluating the impact that the adoption of this guidance will have on the Company.
In February 2015, the FASB issued amendments to the current consolidation guidance. The amendments affect both the variable interest entity and voting interest entity consolidation models. The new guidance is effective for the Company beginning January 1, 2016, with early adoption permitted. The adoption of this guidance will not have a material effect on the Company.
In April 2015, the FASB issued updated guidance to simplify the presentation of debt issuance costs. The amendments in this update require that debt issuance costs related to a recognized debt liability be presented in the balance sheet as a direct deduction from the carrying amount of that debt liability, consistent with debt discounts. In August 2015, the FASB issued updated guidance which clarifies the treatment of debt issuance costs from line-of-credit arrangements. In particular, this guidance clarifies that the Securities and Exchange Commission Staff would not object to an entity deferring and presenting debt issuance costs related to a line-of-credit arrangement as an asset and subsequently amortizing the deferred debt issuance costs ratably over the term of such arrangement, regardless of whether there are any outstanding borrowings on the line-of-credit arrangement. This guidance is effective for fiscal years beginning after December 15, 2015 and interim periods within those fiscal years, and should be applied on a retrospective basis with earlier adoption permitted for financial statements that have not been previously issued. The Company does not expect the adoption to have a material impact on the financial statements.
F-38
Table of Contents
WEIGHT WATCHERS INTERNATIONAL, INC. AND SUBSIDIARIES
NOTES TO CONSOLIDATED FINANCIAL STATEMENTS
(IN THOUSANDS, EXCEPT PER SHARE AMOUNTS)
In July 2015, the FASB issued updated guidance to simplify the measurement of inventory. Under this amendment, an entity using an inventory method other than last-in, first out or the retail inventory method should measure inventory at the lower of cost and net realizable value. The new guidance clarifies that net realizable value is the estimated selling prices in the ordinary course of business, less reasonably predictable costs of completion, disposal, and transportation. This guidance is effective for fiscal years beginning after December 15, 2016, including interim periods within those fiscal years, and should be applied prospectively with earlier adoption permitted as of the beginning of the interim or annual reporting period. The Company is currently evaluating the impact that the adoption of this guidance will have on the consolidated financial position of the Company.
In September 2015, the FASB issued updated guidance to simplify the accounting for adjustments made to provisional amounts recognized in a business combination, eliminating the requirement to retrospectively account for those adjustments. This guidance is effective for fiscal years beginning after December 15, 2015, including interim periods within those fiscal years, and should be applied prospectively with earlier adoption permitted as of the beginning of the interim or annual reporting period. There is no impact on the consolidated financial position, results of operations or cash flows of the Company as a result of this guidance.
In November 2015, the FASB issued updated guidance that in a classified statement of financial position, an entity shall classify deferred tax assets and liabilities as noncurrent amounts. This guidance is effective for fiscal years beginning after December 15, 2016, including interim periods within those fiscal years and earlier adoption is permitted. The Company does not expect the adoption to have a material impact on the financial statements.
| 21. | Related Party |
As more fully described in Note 3, on October 18, 2015, the Company entered into the Strategic Collaboration Agreement with Ms. Winfrey, under which she will consult with the Company and participate in developing, planning, executing and enhancing the Weight Watchers program and related initiatives, and provide it with services in her discretion to promote the Company and its programs, products and services.
In addition to the Strategic Collaboration Agreement, Ms. Winfrey and her related entities provided services to the Company totaling $647 for the fiscal year ended January 2, 2016, which services included advertising, production and related fees.
The Company’s accounts payable to parties related to Ms. Winfrey at January 2, 2016 was $574.
| 22. | Quarterly Financial Information (Unaudited) |
The following is a summary of the unaudited quarterly consolidated results of operations for the fiscal years ended January 2, 2016 and January 3, 2015.
| For the Fiscal Quarters Ended | ||||||||||||||||
| April 4, 2015 |
July 4, 2015 |
October 3, 2015 |
January 2, 2016 |
|||||||||||||
| Fiscal year ended January 2, 2016 |
||||||||||||||||
| Revenues, net |
$ | 322,103 | $ | 309,754 | $ | 273,324 | $ | 259,238 | ||||||||
| Gross profit |
157,303 | 159,364 | 136,622 | 120,798 | ||||||||||||
| Operating income |
18,044 | 70,580 | 63,108 | 16,326 | ||||||||||||
| Net (loss) income attributable to the Company |
(5,433 | ) | 27,877 | 21,790 | (11,309 | ) | ||||||||||
| Basic earnings per share |
$ | (0.10 | ) | $ | 0.49 | $ | 0.38 | $ | (0.18 | ) | ||||||
| Diluted earnings per share |
$ | (0.10 | ) | $ | 0.49 | $ | 0.38 | $ | (0.18 | ) | ||||||
F-39
Table of Contents
WEIGHT WATCHERS INTERNATIONAL, INC. AND SUBSIDIARIES
NOTES TO CONSOLIDATED FINANCIAL STATEMENTS
(IN THOUSANDS, EXCEPT PER SHARE AMOUNTS)
| For the Fiscal Quarters Ended | ||||||||||||||||
| March 29, 2014 |
June 28, 2014 |
September 27, 2014 |
January 3, 2015 |
|||||||||||||
| Fiscal year ended January 3, 2015 |
||||||||||||||||
| Revenues, net Gross profit |
$
|
409,358 222,900 |
|
$
|
397,547 225,814 |
|
$
|
345,184 187,567 |
|
$
|
327,827 166,270 |
| ||||
| Operating income |
51,053 | 114,564 | 91,394 | 42,303 | ||||||||||||
| Net income attributable to the Company |
21,531 | 54,002 | 37,892 | 4,362 | ||||||||||||
| Basic earnings per share |
$ | 0.38 | $ | 0.95 | $ | 0.67 | $ | 0.08 | ||||||||
| Diluted earnings per share |
$ | 0.38 | $ | 0.95 | $ | 0.67 | $ | 0.08 | ||||||||
Basic and diluted EPS are computed independently for each of the periods presented. Accordingly, the sum of the quarterly EPS amounts may not agree to the total for the year.
As discussed in further detail in Note 19, the Company recorded restructuring charges of $5,761 ($3,514 after tax), $232 ($142 after tax), $1,081 ($660 after tax) and $1,338 ($815 after tax) during the first, second, third and fourth quarters of fiscal 2015, respectively, in connection with employee termination benefit costs associated with its previously disclosed cost-savings initiative plan to restructure its organization, reducing gross profit, operating income, net income attributable to the Company and to EPS all four quarters of fiscal 2015. The Company recorded restructuring charges of $3,656 ($2,235 after tax), $6,498 ($3,964 after tax), $713 ($430 after tax) and $973 ($593 after tax) during the first, second, third and fourth quarters of fiscal 2014, respectively, in connection with employee termination benefit costs associated with its previously disclosed cost-savings initiative plan to restructure its organization, reducing gross profit, operating income, net income attributable to the Company and EPS all four quarters of fiscal 2014.
As discussed in further detail in Note 3, operating income, net income and EPS during the fourth quarter of fiscal 2015 were impacted by the Company recording expenses of $13,593 ($8,292 after tax and $0.13 per fully diluted share) in connection with the Winfrey Transaction in the fourth quarter of fiscal 2015.
As discussed in further detail in Note 7, net income and EPS were impacted by a gain on the early extinguishment of debt of $4,749 ($2,897 after tax), and $6,727 ($4,103 after tax), or $0.05 and $0.07 per fully diluted share, during the first and second quarters of fiscal 2015, respectively.
As discussed in Note 1, the Company identified and recorded out-of-period adjustments related to immaterial errors in prior period financial statements that impacted net income attributable to the Company by $420 and $410 for the second and fourth quarter of fiscal 2015, respectively.
As discussed in further detail in Note 4, in the first quarter of fiscal 2014, net income and EPS were impacted by a gain of $10,540 ($6,396 after tax), or $0.11 per fully diluted share, recognized in connection with the Brazil acquisition due to an adjustment of the Company’s previously held equity interest to fair value offset by a charge associated with the settlement of the royalty-free arrangement of the Brazilian partnership.
In the second quarter of fiscal 2014, net income and EPS were impacted by a $2,350, or $0.04 per fully diluted share, net tax benefit related to an intercompany loan write-off in connection with the closure of our China business partially offset by the recognition of a valuation allowance related to tax benefits for foreign losses that are not expected to be realized.
F-40
Table of Contents
SCHEDULE II—VALUATION AND QUALIFYING ACCOUNTS AND RESERVES
(IN THOUSANDS)
| Additions | ||||||||||||||||||||
| Balance at Beginning of Period |
Charged to Costs and Expenses |
Charged to Other Accounts |
Deductions(1) | Balance at End of Period |
||||||||||||||||
| FISCAL YEAR ENDED JANUARY 2, 2016 |
||||||||||||||||||||
| Allowance for doubtful accounts |
$ | 3,287 | $ | (446 | ) | $ | 0 | $ | (615 | ) | $ | 2,226 | ||||||||
| Inventory and other reserves |
$ | 7,107 | $ | 7,593 | $ | 0 | $ | (10,635 | ) | $ | 4,065 | |||||||||
| Tax valuation allowance |
$ | 34,640 | $ | 1,056 | $ | (2,631 | ) | $ | (4,785 | ) | $ | 28,280 | ||||||||
| FISCAL YEAR ENDED JANUARY 3, 2015 |
||||||||||||||||||||
| Allowance for doubtful accounts |
$ | 3,477 | $ | 99 | $ | 0 | $ | (289 | ) | $ | 3,287 | |||||||||
| Inventory and other reserves |
$ | 5,859 | $ | 11,822 | $ | 0 | $ | (10,574 | ) | $ | 7,107 | |||||||||
| Tax valuation allowance |
$ | 36,372 | $ | 3,183 | $ | 0 | $ | (4,915 | ) | $ | 34,640 | |||||||||
| FISCAL YEAR ENDED DECEMBER 28, 2013 |
||||||||||||||||||||
| Allowance for doubtful accounts |
$ | 3,447 | $ | 596 | $ | 0 | $ | (566 | ) | $ | 3,477 | |||||||||
| Inventory and other reserves |
$ | 6,942 | $ | 9,580 | $ | 0 | $ | (10,663 | ) | $ | 5,859 | |||||||||
| Tax valuation allowance |
$ | 31,015 | $ | 3,821 | $ | 2,429 | $ | (893 | ) | $ | 36,372 | |||||||||
| (1) | Primarily represents the utilization of established reserves, net of recoveries, where applicable. |
S-1
Table of Contents
EXHIBIT INDEX
| Exhibit Number |
Description | |||
| **3.1 | Amended and Restated Articles of Incorporation of Weight Watchers International, Inc. (filed as Exhibit 3.1 to Amendment No. 1 to the Company’s Registration Statement on Form 8-A as filed on January 6, 2012 (File No. 001-16769), and incorporated herein by reference). | |||
| **3.2 | Articles of Amendment to the Articles of Incorporation, as Amended and Restated, of Weight Watchers International, Inc. to Create a New Series of Preferred Stock Designated as Series B Junior Participating Preferred Stock, adopted as of November 14, 2001 (filed as Exhibit 3.2 to Amendment No. 1 to the Company’s Registration Statement on Form 8-A, as filed on January 6, 2012 (File No. 001-16769), and incorporated herein by reference). | |||
| **3.3 | Amended and Restated Bylaws of Weight Watchers International, Inc., as of November 14, 2013 (filed as Exhibit 3.1 to the Company’s Current Report on Form 8-K, as filed on November 18, 2013 (File No. 001-16769), and incorporated herein by reference). | |||
| **4.1 | Specimen of stock certificate representing Weight Watchers International, Inc.’s common stock, no par value (filed as Exhibit 4.1 to Amendment No. 1 to the Company’s Registration Statement on Form 8-A, as filed on January 6, 2012 (File No. 001-16769), and incorporated herein by reference). | |||
| **10.1 | License Agreement, dated as of September 29, 1999, between WW Foods, LLC and Weight Watchers International, Inc. (filed as Exhibit 10.4 to the Company’s Registration Statement on Form S-4, as filed on December 2, 1999 (File No. 333-92005), and incorporated herein by reference). | |||
| **10.2 | LLC Agreement, dated as of September 29, 1999, between H.J. Heinz Company and Weight Watchers International, Inc. (filed as Exhibit 10.7 to the Company’s Registration Statement on Form S-4, as filed on December 2, 1999 (File No. 333-92005), and incorporated herein by reference). | |||
| **10.3 | Operating Agreement, dated as of September 29, 1999, between Weight Watchers International, Inc. and H.J. Heinz Company (filed as Exhibit 10.8 to the Company’s Registration Statement on Form S-4, as filed on December 2, 1999 (File No. 333-92005), and incorporated herein by reference). | |||
| †**10.4 | Weight Watchers International, Inc. 2004 Stock Incentive Plan (filed as Appendix A of the Company’s Definitive Proxy Statement on Schedule 14A filed on April 8, 2004 (File No. 001-16769), and incorporated herein by reference). | |||
| †**10.5 | Amendment to Weight Watchers International, Inc. 2004 Stock Incentive Plan (filed as Exhibit 10.5 to the Company’s Quarterly Report on Form 10-Q for the fiscal quarter ended July 2, 2005, as filed on August 11, 2005 (File No. 001-16769), and incorporated herein by reference). | |||
| †**10.6 | Weight Watchers International, Inc. 2008 Stock Incentive Plan (filed as Appendix A of the Company’s Definitive Proxy Statement on Schedule 14A filed on March 31, 2008 (File No. 001-16769), and incorporated herein by reference). | |||
| **10.7 | Corporate Agreement, dated as of November 5, 2001, between Weight Watchers International, Inc. and Artal Luxembourg S.A. (filed as Exhibit 10.36 to Amendment No. 2 to the Company’s Registration Statement on Form S-1, as filed on November 9, 2001 (File No. 333-69362), and incorporated herein by reference). | |||
| **10.8 | Amendment, dated as of July 1, 2005, to the Corporate Agreement, dated as of November 5, 2001, by and between Weight Watchers International, Inc. and Artal Luxembourg S.A. (filed as Exhibit 10.4 to the Company’s Quarterly Report on Form 10-Q for the fiscal quarter ended July 2, 2005, as filed on August 11, 2005 (File No. 001-16769), and incorporated herein by reference). | |||
Table of Contents
| Exhibit Number |
Description | |||
| **10.9 | Registration Rights Agreement, dated as of September 29, 1999, among Weight Watchers International, Inc., H.J. Heinz Company and Artal Luxembourg S.A. (filed as Exhibit 10.38 to Amendment No. 1 to the Company’s Registration Statement on Form S-1, as filed on October 29, 2001 (File No. 333-69362), and incorporated herein by reference). | |||
| †**10.10 | Form of Amended and Restated Continuity Agreement, between Weight Watchers International, Inc. and certain key executives (Chief Executive Officer, Chief Financial Officer and General Counsel) (filed as Exhibit 10.1 to the Company’s Quarterly Report on Form 10-Q for the fiscal quarter ended July 2, 2011, as filed on August 11, 2011 (File No. 001-16769), and incorporated herein by reference). | |||
| †**10.11 | Form of Amended and Restated Continuity Agreement, between Weight Watchers International, Inc. and certain key executives (certain executive officers) (filed as Exhibit 10.2 to the Company’s Quarterly Report on Form 10-Q for the fiscal quarter ended July 2, 2011, as filed on August 11, 2011 (File No. 001-16769), and incorporated herein by reference). | |||
| **10.12 | Principal Stockholders Agreement among Weight Watchers International, Inc., WeightWatchers.com, Inc. and Artal Luxembourg S.A. dated as of June 13, 2005 (filed as Exhibit 10.3 to the Company’s Quarterly Report on Form 10-Q for the fiscal quarter ended July 2, 2005, as filed on August 11, 2005 (File No. 001-16769), and incorporated herein by reference). | |||
| †**10.13 | Form of Term Sheet for Employee Stock Awards and Form of Terms and Conditions for Employee Stock Awards (filed as Exhibit 10.34 to the Company’s Annual Report on Form 10-K for the fiscal year ended December 31, 2005, as filed on February 27, 2006 (File No. 001-16769), and incorporated herein by reference). | |||
| †**10.14 | Form of Term Sheet for Employee Restricted Stock Unit Awards and Form of Terms and Conditions for Employee Restricted Stock Unit Awards (filed as Exhibit 10.35 to the Company’s Annual Report on Form 10-K for the fiscal year ended December 31, 2005, as filed on February 27, 2006 (File No. 001-16769), and incorporated herein by reference). | |||
| †**10.15 | Form of Amended and Restated Directors Restricted Stock Agreement for Weight Watchers International, Inc. non-employee director restricted stock (filed as Exhibit 10.1 to the Company’s Quarterly Report on Form 10-Q for the fiscal quarter ended June 28, 2014, as filed on August 7, 2014 (File No. 001-16769), and incorporated herein by reference). | |||
| †**10.16 | Amended and Restated Weight Watchers International, Inc. 2014 Stock Incentive Plan (filed as Exhibit 10.1 to the Company’s Current Report on Form 8-K, as filed on May 8, 2015 (File No. 001-16769), and incorporated herein by reference). | |||
| †**10.17 | Summary of Non-Employee Director Compensation (filed as Exhibit 10 to the Company’s Current Report on Form 8-K, as filed on July 18, 2006 (File No. 001-16769), and incorporated herein by reference). | |||
| †**10.18 | Statement of Amendments to the Weight Watchers International, Inc. 2004 Stock Incentive Plan (filed as Exhibit 99.4 to the Company’s Current Report on Form 8-K, as filed on December 15, 2006 (File No. 001-16769), and incorporated herein by reference). | |||
| **10.19 | Amendment to Agreements, dated as of October 1, 2002, by and between Weight Watchers International, Inc., WW Foods, LLC and H.J. Heinz Company (filed as Exhibit 10.1 to the Company’s Quarterly Report on Form 10-Q for the fiscal quarter ended October 3, 2009, as filed on November 12, 2009 (File No. 001-16769), and incorporated herein by reference). | |||
| **10.20 | Amendment to Operating Agreement, dated August 4, 2009, by and between Weight Watchers International, Inc. and H.J. Heinz Company (filed as Exhibit 10.2 to the Company’s Quarterly Report on Form 10-Q for the fiscal quarter ended October 3, 2009, as filed on November 12, 2009 (File No. 001-16769), and incorporated herein by reference). | |||
Table of Contents
| Exhibit Number |
Description | |||
| †**10.21 | Second Amended and Restated Weight Watchers Executive Profit Sharing Plan, August 1, 2012 (filed as Exhibit 10.1 to the Company’s Quarterly Report on Form 10-Q for the fiscal quarter ended September 29, 2012, as filed on November 8, 2012 (File No. 001-16769), and incorporated herein by reference). | |||
| †**10.22 | Offer Letter, dated as of July 2, 2012, by and between Weight Watchers International, Inc. and Nicholas P. Hotchkin (filed as Exhibit 10.31 to the Company’s Annual Report on Form 10-K for the fiscal year ended December 29, 2012, as filed on February 27, 2013 (File No. 001-16769), and incorporated herein by reference). | |||
| †**10.23 | Offer Letter, dated as of December 6, 2012, by and between Weight Watchers International, Inc. and James Chambers (filed as Exhibit 10.34 to the Company’s Annual Report on Form 10-K for the fiscal year ended December 29, 2012, as filed on February 27, 2013 (File No. 001-16769), and incorporated herein by reference). | |||
| **10.24 | Credit Agreement, dated as of April 2, 2013, among Weight Watchers International, Inc., as the borrower, the lenders party thereto, JPMorgan Chase Bank, N.A., as the administrative agent and an issuing bank, and The Bank of Nova Scotia, as the revolving agent, a swingline lender and an issuing bank (filed as Exhibit 10.1 to the Company’s Quarterly Report on Form 10-Q for the fiscal quarter ended March 30, 2013, as filed on May 9, 2013 (File No. 001-16769), and incorporated herein by reference). | |||
| **10.25 | Amendment Agreement, dated as of September 26, 2014, relating to the Credit Agreement, dated as of April 2, 2013, among Weight Watchers International, Inc., as the Borrower, the Lenders party thereto, JPMorgan Chase Bank, N.A., as the Administrative Agent and an Issuing Bank, and The Bank of Nova Scotia, as the Revolving Agent, a Swingline Lender and an Issuing Bank (filed as Exhibit 10.1 to the Company’s Quarterly Report on Form 10-Q for the fiscal quarter ended September 27, 2014, as filed on November 5, 2014 (File No. 001-16769), and incorporated herein by reference). | |||
| †**10.26 | Severance Amendment, dated as of July 30, 2013, by and between Weight Watchers International, Inc. and James Chambers (filed as Exhibit 10.2 to the Company’s Current Report on Form 8-K, as filed on August 1, 2013 (File No. 001-16769), and incorporated herein by reference). | |||
| †**10.27 | Letter Agreement, dated as of May 8, 2013, by and between Weight Watchers International, Inc. and Nicholas Hotchkin (filed as Exhibit 10.2 to the Company’s Quarterly Report on Form 10-Q for the fiscal quarter ended June 29, 2013, as filed on August 8, 2013 (File No. 001-16769), and incorporated herein by reference). | |||
| †**10.28 | Letter Agreement, dated as of May 8, 2013, by and between Weight Watchers International, Inc. and James Chambers (filed as Exhibit 10.3 to the Company’s Quarterly Report on Form 10-Q for the fiscal quarter ended June 29, 2013, as filed on August 8, 2013 (File No. 001-16769), and incorporated herein by reference). | |||
| †**10.29 | Offer Letter, dated as of September 30, 2013, by and between Weight Watchers International, Inc. and Lesya Lysyj (filed as Exhibit 10.1 to the Company’s Quarterly Report on Form 10-Q for the fiscal quarter ended March 29, 2014, as filed on May 8, 2014 (File No. 001-16769), and incorporated herein by reference). | |||
| †**10.30 | Statement of Principal Terms and Conditions of Employment, dated June 5, 2013, by and between Weight Watchers (UK) Limited and Jeanine Lemmens (filed as Exhibit 10.35 to the Company’s Annual Report on Form 10-K for the fiscal year ended January 3, 2015, as filed on March 4, 2015 (File No. 001-16769), and incorporated herein by reference). | |||
Table of Contents
| Exhibit Number |
Description | |||
| †**10.31 | Offer Letter, dated as of July 4, 2013, by and between Weight Watchers (UK) Ltd and Jeanine Lemmens (filed as Exhibit 10.36 to the Company’s Annual Report on Form 10-K for the fiscal year ended January 3, 2015, as filed on March 4, 2015 (File No. 001-16769), and incorporated herein by reference). | |||
| †**10.32 | Letter Agreement, dated as of October 22, 2015, by and between Weight Watchers International, Inc. and Jeanine Lemmens (filed as Exhibit 10.1 to the Company’s Current Report on Form 8-K, as filed on October 23, 2015 (File No. 001-16769), and incorporated herein by reference). | |||
| †**10.33 | Offer Letter, dated as of March 3, 2014, by and between Weight Watchers International, Inc. and Michael F. Colosi (filed as Exhibit 10.1 to the Company’s Quarterly Report on Form 10-Q for the fiscal quarter ended April 4, 2015, as filed on May 14, 2015 (File No. 001-16769), and incorporated herein by reference). | |||
| †*10.34 | Employment Agreement, dated October 6, 2003, by and between Weight Watchers France S.A.R.L. and Corinne Pollier(-Bousquet) (the “Pollier Employment Agreement”). | |||
| †*10.35 | Addendum to the Pollier Employment Agreement, dated May 1, 2013, by and between Weight Watchers France S.A.R.L. and Corinne Pollier(-Bousquet). | |||
| †*10.36 | Letter Agreement, dated as of September 15, 2015, by and between Weight Watchers International, Inc. and Corinne Pollier(-Bousquet). | |||
| **10.37 | Share Purchase Agreement, dated October 18, 2015, between Weight Watchers International, Inc. and Oprah Winfrey (filed as Exhibit 10.1 to the Company’s Current Report on Form 8-K, as filed on October 19, 2015 (File No. 001-16769), and incorporated herein by reference). | |||
| †**10.38 | Option Agreement, dated October 18, 2015, between Weight Watchers International, Inc. and Oprah Winfrey (filed as Exhibit 10.2 to the Company’s Current Report on Form 8-K, as filed on October 19, 2015 (File No. 001-16769), and incorporated herein by reference). | |||
| *10.39 | Strategic Collaboration Agreement, dated October 18, 2015, between Weight Watchers International, Inc. and Oprah Winfrey. | |||
| *21.1 | Subsidiaries of Weight Watchers International, Inc. | |||
| *23.1 | Consent of Independent Registered Public Accounting Firm. | |||
| *31.1 | Rule 13a-14(a) Certification by James Chambers, Chief Executive Officer. | |||
| *31.2 | Rule 13a-14(a) Certification by Nicholas P. Hotchkin, Chief Financial Officer. | |||
| *32.1 | Certification of Chief Executive Officer and Chief Financial Officer pursuant to 18 U.S.C. Section 1350, as adopted pursuant to Section 906 of the Sarbanes-Oxley Act of 2002. | |||
| *Exhibit 101 | ||||
| *EX-101.INS | XBRL Instance Document | |||
| *EX-101.SCH | XBRL Taxonomy Extension Schema | |||
| *EX-101.CAL | XBRL Taxonomy Extension Calculation Linkbase | |||
| *EX-101.DEF | XBRL Taxonomy Extension Definition Linkbase | |||
| *EX-101.LAB | XBRL Taxonomy Extension Label Linkbase | |||
| *EX-101.PRE | XBRL Taxonomy Extension Presentation Linkbase | |||
| * | Filed herewith. |
| ** | Previously filed. |
| † | Represents a management arrangement or compensatory plan. |
Table of Contents
SIGNATURES
Pursuant to the requirements of Section 13 or 15(d) of the Securities Exchange Act of 1934, the registrant has duly caused this report to be signed on its behalf by the undersigned, thereunto duly authorized.
| WEIGHT WATCHERS INTERNATIONAL, INC. | ||||||||
| Date: March 2, 2016 | By: | /S/ JAMES CHAMBERS | ||||||
| James Chambers | ||||||||
| President, Chief Executive Officer and Director | ||||||||
| (Principal Executive Officer) | ||||||||
Table of Contents
SIGNATURES
Pursuant to the requirements of the Securities Exchange Act of 1934, this report has been signed below by the following persons on behalf of the registrant and in the capacities and on the dates indicated.
| Date: March 2, 2016 | By: | /S/ JAMES CHAMBERS | ||||||
| James Chambers | ||||||||
| President, Chief Executive Officer and Director | ||||||||
| (Principal Executive Officer) | ||||||||
| Date: March 2, 2016 | By: | /S/ NICHOLAS P. HOTCHKIN | ||||||
| Nicholas P. Hotchkin | ||||||||
| Chief Financial Officer | ||||||||
| (Principal Financial and Accounting Officer) | ||||||||
| Date: March 2, 2016 | By: | /S/ RAYMOND DEBBANE | ||||||
| Raymond Debbane | ||||||||
| Director | ||||||||
| Date: March 2, 2016 | By: | /S/ STEVEN M. ALTSCHULER | ||||||
| Steven M. Altschuler | ||||||||
| Director | ||||||||
| Date: March 2, 2016 | By: | /S/ PHILIPPE J. AMOUYAL | ||||||
| Philippe J. Amouyal | ||||||||
| Director | ||||||||
| Date: March 2, 2016 | By: | /S/ CYNTHIA ELKINS | ||||||
| Cynthia Elkins | ||||||||
| Director | ||||||||
| Date: March 2, 2016 | By: | /S/ JONAS M. FAJGENBAUM | ||||||
| Jonas M. Fajgenbaum | ||||||||
| Director | ||||||||
| Date: March 2, 2016 | By: | /S/ DENIS F. KELLY | ||||||
| Denis F. Kelly | ||||||||
| Director | ||||||||
| Date: March 2, 2016 | By: | /S/ SACHA LAINOVIC | ||||||
| Sacha Lainovic | ||||||||
| Director | ||||||||
| Date: March 2, 2016 | By: | /S/ CHRISTOPHER J. SOBECKI | ||||||
| Christopher J. Sobecki | ||||||||
| Director | ||||||||
| Date: March 2, 2016 | By: | /S/ OPRAH WINFREY | ||||||
| Oprah Winfrey | ||||||||
| Director | ||||||||