Attached files
| file | filename |
|---|---|
| EX-10.3 - EX-10.3 - CYPRESS SEMICONDUCTOR CORP /DE/ | cy-ex103_1397.htm |
| EX-21.1 - EX-21.1 - CYPRESS SEMICONDUCTOR CORP /DE/ | cy-ex211_6.htm |
| EX-10.18 - EX-10.18 - CYPRESS SEMICONDUCTOR CORP /DE/ | cy-ex1018_978.htm |
| EX-10.2 - EX-10.2 - CYPRESS SEMICONDUCTOR CORP /DE/ | cy-ex102_1396.htm |
| EX-31.2 - EX-31.2 - CYPRESS SEMICONDUCTOR CORP /DE/ | cy-ex312_9.htm |
| EX-23.1 - EX-23.1 - CYPRESS SEMICONDUCTOR CORP /DE/ | cy-ex231_7.htm |
| EX-31.1 - EX-31.1 - CYPRESS SEMICONDUCTOR CORP /DE/ | cy-ex311_8.htm |
| EX-32.1 - EX-32.1 - CYPRESS SEMICONDUCTOR CORP /DE/ | cy-ex321_10.htm |
| EX-32.2 - EX-32.2 - CYPRESS SEMICONDUCTOR CORP /DE/ | cy-ex322_11.htm |
UNITED STATES
SECURITIES AND EXCHANGE COMMISSION
Washington, D.C. 20549
Form 10-K
(Mark One)
|
ý |
ANNUAL REPORT PURSUANT TO SECTION 13 OR 15(d) OF THE SECURITIES EXCHANGE ACT OF 1934 |
For the fiscal year ended January 3, 2016
Or
|
¨ |
TRANSITION REPORT PURSUANT TO SECTION 13 OR 15(d) OF THE SECURITIES EXCHANGE ACT OF 1934 |
For the transition period from to .
Commission file number: 1-10079
CYPRESS SEMICONDUCTOR CORPORATION
(Exact name of registrant as specified in its charter)
|
Delaware |
|
94-2885898 |
|
(State or other jurisdiction of incorporation or organization) |
|
(I.R.S. Employer Identification No.) |
198 Champion Court, San Jose, California 95134
(Address of principal executive offices and zip code)
Registrant’s telephone number, including area code: (408) 943-2600
Securities registered pursuant to Section 12(b) of the Act:
|
Title of Each Class |
|
Name of Each Exchange on Which Registered |
|
Common Stock, $.01 par value |
|
The NASDAQ Stock Market |
Securities registered pursuant to Section 12(g) of the Act:
None
Indicate by check mark if the registrant is a well-known seasoned issuer, as defined in Rule 405 of the Securities Act. ý Yes ¨ No
Indicate by check mark if the registrant is not required to file reports pursuant to Section 13 or Section 15(d) of the Act. ¨ Yes ý No
Indicate by check mark whether the registrant (1) has filed all reports required to be filed by Section 13 or 15(d) of the Securities Exchange Act of 1934 during the preceding 12 months (or for such shorter period that the registrant was required to file such reports), and (2) has been subject to such filing requirements for the past 90 days. ý Yes ¨ No
Indicate by check mark whether the registrant has submitted electronically and posted on its corporate Website, if any, every Interactive Data File required to be submitted and posted pursuant to Rule 405 of Regulation S-T during the preceding 12 months ( or for such shorter period that the registrant was required to submit and post such files). ý Yes ¨ No
Indicate by check mark if disclosure of delinquent filers pursuant to Item 405 of Regulation S-K is not contained herein, and will not be contained, to the best of registrant’s knowledge, in definitive proxy or information statements incorporated by reference in Part III of this Form 10-K or any amendment to this Form 10-K. ¨
Indicate by check mark whether the registrant is a large accelerated filer, an accelerated filer, a non-accelerated filer, or a smaller reporting company. See the definitions of “larger accelerated filer,” “accelerated filer,” and “smaller reporting company” in Rule 12b-2 of the Exchange Act. (Check one):
Large accelerated filer ý Accelerated filer ¨ Non-accelerated filer ¨ Smaller reporting company ¨
Indicate by check mark whether the registrant is a shell company (as defined in Rule 12b-2 of the Act). ¨ Yes ý No
The market value of voting and non-voting common stock held by non-affiliates of the registrant, based upon the closing sale price of the common stock on June 28, 2015 as reported on the NASDAQ Global Select Market, was approximately $3.9 billion. Shares of common stock held by each executive officer and director and by each person who owns 5% or more of the outstanding common stock have been excluded from the foregoing calculation in that such persons may be deemed affiliates. This determination of affiliate status is not necessarily a conclusive determination for other purposes.
As of February 26, 2016, 314,558,619 shares of the registrant’s common stock were outstanding.
DOCUMENTS INCORPORATED BY REFERENCE
Portions of the Definitive Proxy Statement for the registrant’s Annual Meeting of Stockholders to be filed pursuant to Regulation 14A for the year ended January 3, 2016 are incorporated by reference in Items 10 - 14 of Part III of this Annual Report on Form 10-K.
|
|
||
|
|
|
|
|
|
|
Page |
|
|
|
|
|
Item 1 |
4 |
|
|
Item 1A |
18 |
|
|
Item 1B |
29 |
|
|
Item 2 |
29 |
|
|
Item 3 |
29 |
|
|
Item 4 |
29 |
|
|
|
|
|
|
|
|
|
|
Item 5 |
30 |
|
|
Item 6 |
35 |
|
|
Item 7 |
Management’s Discussion and Analysis of Financial Condition and Results of Operations |
36 |
|
Item 7A |
57 |
|
|
Item 8 |
59 |
|
|
Item 9 |
Changes in and Disagreements with Accountants on Accounting and Financial Disclosures |
110 |
|
Item 9A |
110 |
|
|
Item 9B |
111 |
|
|
|
|
|
|
|
|
|
|
Item 10 |
112 |
|
|
Item 11 |
112 |
|
|
Item 12 |
Security Ownership of Certain Beneficial Owners and Management and Related Stockholder Matters |
112 |
|
Item 13 |
Certain Relationships and Related Transactions and Director Independence |
112 |
|
Item 14 |
113 |
|
|
|
|
|
|
|
|
|
|
Item 15 |
114 |
|
|
118 |
||
2
The discussion in this Annual Report on Form 10-K contains statements that are not historical in nature, but are forward-looking statements within the meaning of Section 27A of the Securities Act of 1933, as amended, and Section 21E of the Securities Exchange Act of 1934, as amended, that involve risks and uncertainties, including, but not limited to, statements related to our manufacturing strategy; the expected timing and costs related to our integration with Spansion Inc. (“Spansion”) as a result of our recent merger; our ability to execute on planned synergies related to the merger; our expectations regarding dividends and stock repurchases; our expectations regarding future technology transfers and other licensing arrangements; our expectations regarding the timing and cost of our restructuring liabilities; our expectations regarding our active litigation matters and our intent to defend ourselves in those matters; the competitive advantage we believe we have with our patents as well as our proprietary programmable technologies and programmable products; our backlog as an indicator of future performance; the risk associated with our yield investment agreements; our foreign currency exposure and the impact exchange rates could have on our operating margins; the adequacy of our cash and working capital positions; the value and liquidity of our investments; including auction rate securities and our other debt investments; our ability to recognize certain unrecognized tax benefits within the next twelve months as well as the resolution of agreements with various foreign tax authorities; our investment strategy; the impact of interest rate fluctuations on our investments; the volatility of our stock price; the adequacy of our real estate properties; the utility of our non-GAAP reporting; the adequacy of our audits; and the potential impact of our indemnification obligations and the impact of new accounting standards on our financial statements. We use words such as “may,” “will,” “should,” “plan,” “anticipate,” “believe,” “expect,” “future,” “intend,” “estimate,” “predict,” “potential,” “continue,” and similar expressions to identify forward-looking statements. Such forward-looking statements are made as of the date hereof and are based on our current expectations, beliefs and intentions regarding future events or our financial performance and the information available to management as of the date hereof. Except as required by law, we assume no responsibility to update any such forward-looking statements. Our actual results could differ materially from those expected, discussed or projected in the forward-looking statements contained in this Annual Report on Form 10-K for any number of reasons, including, but not limited to, the state and future of the general economy and its impact on the markets and consumers we serve and our investments; our ability to effectively integrate our company with Spansion in a timely manner; our ability to attract and retain key personnel; our ability to timely deliver our proprietary and programmable technologies and products; the current credit conditions; our ability to expand our customer base; our ability to transform our business with a leading portfolio of programmable products; the number and nature of our competitors; the changing environment and/or cycles of the semiconductor industry; foreign currency exchange rates; our ability to efficiently manage our manufacturing facilities and achieve our cost goals emanating from our flexible manufacturing strategy; our ability to achieve our goals related to our restructuring activities; our success in our pending litigation matters; our ability to manage our investments and interest rate and exchange rate exposure; changes in the law; the results of our pending tax examinations; our ability to achieve liquidity in our investments; the failure or success of our Emerging Technology division; and/or the materialization of one or more of the risks set forth above or under Item 1A ( Risk Factors ) in this Annual Report on Form 10-K.
3
General
Cypress Semiconductor Corporation (“Cypress”) delivers high-performance, high-quality solutions at the heart of today’s most advanced embedded systems, from automotive, industrial and networking platforms to highly interactive consumer and mobile devices. With a broad, differentiated product portfolio that includes NOR flash memories, SRAM and F-RAM™, Traveo™ microcontrollers, the industry’s only PSoC® programmable system-on-chip solutions, analog and PMIC Power Management ICs, CapSense® capacitive touch-sensing controllers, and Wireless BLE Bluetooth Low-Energy and USB connectivity solutions, Cypress is committed to providing its customers worldwide with consistent innovation, best-in-class support and exceptional system value. Cypress serves numerous major markets, including automotive, industrial, communications, consumer, computation, data communications, mobile handsets and military markets.
Cypress was incorporated in California in December 1982. The initial public offering took place in May 1986, at which time our common stock commenced trading on the NASDAQ National Market. In February 1987, we were reincorporated in Delaware. Our stock is listed on the NASDAQ Global Select Market under the ticker symbol “CY”.
Our corporate headquarters are located at 198 Champion Court, San Jose, California 95134, and our main telephone number is (408) 943-2600. We maintain a website at www.cypress.com. The contents of our website are not incorporated into, or otherwise to be regarded as part of, this Annual Report on Form 10-K.
Our fiscal 2015 ended on January 3, 2016, fiscal 2014 ended on December 28, 2014, and fiscal 2013 ended on December 29, 2013.
Business Segments
As of the end of fiscal 2015, our organization included the following business segments:
|
Business Segments |
|
Description |
|
|
|
|
|
PSD: Programmable Systems Division |
|
PSD focuses on high-performance, programmable solutions. The programmable portfolio includes high-performance Traveo™ automotive microcontrollers, PSoC® programmable system-on-chip products, ARM® Cortex®-M4, -M3, -M0+ microcontrollers and R4 CPUs, analog PMIC Power Management ICs, CapSense® capacitive-sensing controllers, TrueTouch® touchscreen and fingerprint reader products, and PSoC Bluetooth Low Energy solutions for the Internet of Things (“IoT”). Effective March 12, 2015, PSD added Spansion’s microcontroller and analog products. |
|
|
|
|
|
MPD: Memory Products Division |
|
MPD focuses on high-performance parallel and serial NOR flash memories, NAND flash memories, static random access memory (SRAM), and high-reliability F-RAM™ ferroelectric memory devices. Its purpose is to enhance our position in these products and invent new products and derivatives. Effective March 12, 2015, MPD added Spansion’s Flash memory products. |
|
|
|
|
|
DCD: Data Communications Division |
|
DCD focuses on USB controllers, Bluetooth® Low Energy solutions that leverage Cypress’s PRoC™ programmable radio-on-chip technology, WirelessUSB™ solutions, module solutions such as trackpads and Bluetooth Low Energy modules, and controllers for the new USB Type-C standard, which enables data transmission and power delivery over a single cable with a slimmer plug. DCD focuses primarily on industrial, handset and consumer electronics markets and applications. |
|
|
|
|
|
ETD: Emerging Technologies Division |
|
Also known as our “startup” division, ETD includes subsidiaries AgigA, Tech Inc. and Deca Technologies Inc., as well as our foundry business and other development-stage activities. |
For additional information on our segments, see Note 20 of Notes to Consolidated Financial Statements under Item 8.
4
Recent Developments
Business Strategies
Cypress is committed to growing revenue in profitable and attractive markets, managing its expenses and to maintaining a strong balance sheet. We maintain many of our business operations in low-cost centers, including Malaysia, Thailand, India, the Philippines and China. In addition, we are using foundry partners to supplement our manufacturing needs.
In 2013, Cypress introduced the PSoC 4 programmable system-on-chip architecture and with a sophisticated 32-bit ARM® Cortex™-M0 processor and the high-performance analog and digital circuitry of PSoC 3 and PSoC 5LP, all in a small-footprint, low-power single-chip solution.
In 2014, Cypress introduced the CapSense MBR3 mechanical button replacement family and the industry’s most integrated one-chip Bluetooth Low Energy solutions for the IoT. The low-cost CapSense MBR3 capacitive touch-sensing controllers do not require coding, enabling designers to quickly implement sleek, reliable user interfaces for a broad range of markets. They offer leading noise immunity, proximity sensing and water tolerance. The new PSoC 4 BLE offers unprecedented ease-of-use and integration in a customizable solution for IoT applications, home automation, healthcare equipment, sports and fitness monitors, and other wearable devices. The PRoC™ BLE programmable radio-on-chip provides a cost-effective, turnkey solution for wireless human interface devices, remote controls and toys.
In March 2015, Cypress completed the merger (“Merger”) with Spansion for a total consideration of approximately $2.8 billion. Spansion was a leading designer, manufacturer and developer of embedded systems semiconductors with flash memory, microcontrollers, analog and mixed-signal products. Spansion’s broad portfolio of Traveo™ automotive MCUs, NOR flash and HyperFlash™ memories, and automotive power management ICs (PMICs) combined with Cypress’s flexible PSoC® solutions, CapSense® capacitive-sensing solutions, TrueTouch® touchscreen solutions and nonvolatile ferroelectric-RAMs (F-RAMs) to make Cypress the No. 3 supplier of automotive MCUs and memories. Spansion’s portfolio of ARM®-based MCUs complemented Cypress’s ARM-based PSoC solutions, and Spansion’s NOR and NAND flash memories enhanced the Cypress SRAM and nonvolatile memory portfolio, creating a global leader in embedded systems.
In August 2015, we completed the sale of the TrueTouch® mobile touchscreen business, which is a business unit within our Programmable Systems Division, to Parade Technologies (“Parade”) for total cash proceeds of $98.6 million pursuant to the definitive agreement. Post-sale, Cypress will continue to provide TrueTouch® solutions to its automotive, industrial and home appliance customers.
Our primary focus is profitable growth in our key markets. With the addition of the legacy Spansion business, we plan to capitalize on our expanded product portfolio and leadership positions in embedded processing and specialized memories to significantly extend our penetration of global markets such as automotive, industrial, communications, consumer, computation, data communications and military markets. Our revenue model is based on the following product and market strategies: (a) increasing market share in our memory products by leveraging our market position and expanding our portfolio with new and complementary products, (b) growing revenue from our high-performance, programmable solutions and derivatives including PSoC programmable system-on-chip products and microcontrollers in the automotive and industrial markets, (c) increasing our DCD revenue through the introduction of new products such as USB Type-C solutions, SuperSpeed USB 3.0 peripheral controllers and Bluetooth® Low Energy solutions that leverage Cypress’s PRoC™ programmable radio-on-chip technology for the IoT and other applications, and (d) revenue growth from ETD, which includes our internal startup companies. For profitability, our focus is to integrate the acquired Spansion business successfully and realize the anticipated product cost and operational cost synergies. Our integration effort includes the re-focusing of portions of legacy Spansion business to higher-margin opportunities, particularly in the Flash memory business segment. We monitor our operating expenses closely to improve our operating leverage as driven by various company-wide initiatives, including our World Class Cost program to continuously reduce cost line items as well as a Human Resources effort to reduce redundancy and improve efficiency across the company.
In order to achieve our goals on revenue growth and profitability, Cypress will continue to pursue the following strategies:
|
|
· |
Successfully integrate our business with Spansion. We are committed to integrating the business of Cypress and Spansion successfully to realize the anticipated cost synergies and improve the bottom line. |
|
|
· |
Cross-sell products from Cypress’s expanded product portfolio in the wake of the Spansion Merger. We will continue to take advantage of product and business synergies and grow our top-line revenue. |
|
|
· |
Focus on large and growing markets. We will continue to pursue business opportunities in large and growing markets, particularly the automotive and industrial markets. |
5
|
|
· |
Drive profitability. Cypress has implemented and maintained a tight, corporate wide focus on gross margin and operating expenses. We are committed to maintaining our current strong operating expense management without compromising our new product development and investments in our Emerging Technologies Division. |
|
|
· |
Drive programmable technologies, extend our leadership in programmable products and drive PSoC and microcontroller proliferation. We will continue to define, design and develop new programmable products and solutions that offer our customers increased flexibility and efficiency, higher performance, and higher levels of integration with a focus on analog functionality. We will continue to drive PSoC and microcontroller adoption in our key market segments. |
|
|
· |
Collaborate with customers to build system-level solutions. We work closely with our customers from initial product design through manufacturing and delivery to optimize their design efforts, help them achieve product differentiation, improve their time-to-market and help them to develop whole product solutions. |
|
|
· |
Leverage flexible manufacturing. Our manufacturing strategy combines capacity from leading foundries with output from our internal manufacturing facilities. This enables us to meet rapid swings in customer demand while reducing the burden of high fixed costs. |
|
|
· |
Identify and exit legacy or non-strategic, underperforming businesses. We will continue to monitor and, if necessary, to exit certain business units that are inconsistent with our future initiatives and long-term financial plans so that we can focus our resources and efforts on our core programmable and proprietary business model. The sale of our TrueTouch® mobile business to Parade Technologies, Ltd. during the third quarter of 2015 is an example of this business strategy. |
|
|
· |
Pursue complementary strategic relationships. We will continue to assess opportunities to develop strategic relationships through acquisitions, investments, licensing and joint development projects. We also will continue to make significant investments in current ventures as well as new ventures. |
As we continue to implement our strategies, there are many internal and external factors that could impact our ability to meet any or all of our objectives. Some of these factors are discussed under Item 1A.
Product/Service Overview
Programmable Solutions Division (PSD):
The Programmable Solutions Division designs and develops solutions for many of the world’s leading end-product manufacturers. PSD delivers high-performance, programmable solutions at the heart of today's most advanced embedded systems. The product portfolio includes high-performance Traveo™ automotive microcontrollers, the industry’s only PSoC® programmable system-on-chip solutions, ARM® Cortex®-M4, M3, M0+ microcontrollers and R4 CPUs, analog PMIC Power Management ICs, CapSense® capacitive touch-sensing controllers, TrueTouch® fingerprint readers, TrueTouch® touchscreen controllers and wireless BLE Bluetooth® Low-Energy devices. Our automotive business unit is part of PSD and is designed to offer complete solutions for systems such as instrument clusters, infotainment and body electronics. Cypress is committed to delivering best-in-class support, exceptional technical documentation and flexible, low-cost development kits for embedded system developers.
6
The following table summarizes the markets and certain applications related to our products in this segment:
|
Products |
|
Markets |
|
Applications |
|
Traveo™ MCUs and Flexible Microcontrollers |
|
Automotive, industrial, consumer, IoT, computation, white goods, communication |
|
Automotive body electronics, battery management, driver information systems, factory automation, machine-to-machine systems, building management systems, smart meters, printers and many other applications. |
|
PSoC® 1, PSoC 3, PSoC 4 and PSoC 5LP |
|
Consumer, handsets, Industrial, medical, IoT, communications, automotive |
|
IoT applications, industrial and automotive control applications, digital still and video cameras, home appliances, handheld devices and accessories, notebook computers, LCD monitors, medical devices, mice, keyboards, toys, e-Bikes and many other applications. |
|
CapSense® |
|
Handsets, consumer, industrial, IoT, computation, white goods, communication, automotive |
|
Notebook computers and PCs, home appliances, handheld devices, wearables, automotive control pads/media centers, digital cameras, toys, consumer products and many other applications. |
|
TrueTouch® |
|
Automotive, industrial |
|
Automotive infotainment systems, factory automation |
|
Analog PMICs, LED drivers and energy harvesting solutions |
|
Automotive, industrial, consumer, IoT |
|
Advanced Driver Assistance Systems (ADAS), body control modules, instrument cluster systems, front lighting systems, factory automation, IoT beacons, wireless sensor nodes and many other applications. |
Traveo™ MCUs and Flexible Microcontrollers. Our Traveo™ automotive MCU family offers high-performance Human Machine Interfaces for automotive dashboards. The microcontrollers integrate 2-D and 3-D graphic engines. This is a development where we are integrating our flash memory technologies with our microcontrollers and analog IP. This family also features our HyperBus memory interface. The combination of our HyperFlash memory with the HyperBus interface eliminates memory bottlenecks, increases performance, and extends the memory space for MCU and graphic engines without increasing the package pin count. Our Flexible Microcontroller (FM) portfolio, which is based on the ARM® Cortex®-M4, Cortex®-M3, Cortex®-M0+ CPUs, is a scalable platform for industrial and consumer applications.
PSoC Programmable System-on-Chip products. Our PSoC products are highly integrated, high-performance mixed-signal devices with an on-board microcontroller, programmable analog and digital blocks, SRAM and flash memory. They provide a low-cost, single-chip solution for a variety of consumer, industrial, medical, and system management applications. A single PSoC device can potentially integrate as many as 100 peripheral functions, saving customers design time, board space, power consumption and system costs. Because of its programmability, PSoC allows customers to make modifications at any point during the design cycle, providing unmatched flexibility.
Cypress’s PSoC 1 device offers performance, programmability and flexibility with a cost-optimized 8-bit M8 CPU subsystem. PSoC 3 uses an 8-bit, Intel® 8051-based microcontroller with 7.5 times more computing power than PSoC 1. The 32-bit, ARM® -Cortex™ M3-based PSoC 5LP has 25 times more computing power than PSoC 1. The analog-to-digital converters on PSoC 3 and PSoC 5LP are 256 times more accurate and 10 to 30 times faster than PSoC 1, and there are 10 times more programmable logic gates available. PSoC 4 is based on a 32-bit ARM Cortex-M0 processor combined with precision analog circuitry, high-performance digital blocks, fully-routable I/Os and our leading CapSense capacitive touch technology. Platform PSoC is supported by the unique PSoC Creator™ design tool that allows engineers to use intuitive schematic-based capture and dozens of PSoC Components™, free embedded ICs represented by icons that can be dragged and dropped into a design to integrate multiple ICs and system interfaces into one PSoC. PSoC 4 BLE, a Bluetooth Low Energy solution that integrates a Bluetooth Smart radio and balun into the PSoC 4 architecture, offers unprecedented ease-of-use and integration for IoT applications, home automation, healthcare equipment, sports and fitness monitors, and other wearable smart devices. Cypress has shipped more than two billion PSoC devices.
TrueTouch® Touchscreen solutions. TrueTouch® provides capacitive touchscreen solutions for automotive infotainment systems, industrial equipment and home appliances. The TrueTouch® family includes devices that perform traditional touchscreen functions including interpreting multitouch operation, single touches, and gestures such as tap, double-tap, pan, pinch, scroll and rotate. In 2015, Cypress introduced the Automotive TrueTouch® CYAT8168X controller family, which enables screen sizes up to 15-inches with industry-leading performance in harsh automotive environments. The controller uses Cypress’s proprietary AutoArmor™ technology for robust immunity to the strong electromagnetic interference (EMI) emissions found in cars, buses and trucks, and it provides liquid tolerance and tracking of fingers in gloves.
7
CapSense® solutions. Our CapSense capacitive touch-sensing solutions replace mechanical switches and buttons with simple, touch-sensitive controls by detecting the presence or absence of a conductive object (such as a finger) and measuring changes in capacitance. This technology lends itself equally well to buttons, sliders, touchpads, touchscreens and proximity sensors, taking industrial design possibilities to a much higher level. The CapSense portfolio supports all different ranges of general purpose inputs/outputs, buttons and slider devices. Cypress’s CapSense devices feature SmartSense™ technology, an automatic tuning solution that dynamically detects and adjusts a system’s capacitive-sensing parameters, eliminating the need for manual tuning. The low-cost CapSense MBR3 mechanical button replacement solution that does not require coding, enabling designers to quickly implement reliable user interfaces for a broad range of markets. MBR3 devices offer leading noise immunity, proximity sensing and water tolerance. CapSense has replaced more than 5 billion buttons, making Cypress the worldwide capacitive sensing market share leader.
Analog Semiconductors. Analog semiconductors measure, condition and regulate “real world” functions such as temperature, speed, sound and electrical current. Our lineup of power management integrated circuits (PMICs) includes DC/DC converters, voltage regulators and supervisors, and power monitoring and reset ICs. In addition, we offer a family of LED lighting driver ICs and energy harvesting solutions. These solutions target automotive and industrial applications, and our energy harvesting solutions are ideal for eliminating the need to replace batteries in IoT applications.
Memory Products Division (MPD):
Our Memory Products Division designs and manufactures the broadest portfolio of high-performance memories for embedded systems. Cypress has established itself as the marketshare leader in NOR Flash and SRAM memories that form the brains of today's most advanced embedded systems. The memory product portfolio includes the world's highest throughput QDR®-IV SRAMs, low-power MoBL® SRAMs, high-performance serial and parallel NOR Flash memories and high-reliability F-RAM™ ferroelectric memory devices that capture and protect the world's most-critical data. Cypress's industry-leading HyperFlash™ memories deliver 333 megabytes per second read throughput-more than five times faster than traditional Quad SPI flash, and one-third the number of pins of parallel NOR flash.
8
Our MPD Division also includes timing technology products and specialty memory offerings. The following table summarizes the markets and applications related to our products in this segment:
|
Products |
|
Markets |
|
Applications |
|
|
|
|
|
|
|
NOR Flash and HyperFlash™ |
|
Automotive, industrial, IoT, consumer |
|
Automotive advanced driver assistance systems (ADAS), automotive instrument cluster, automotive infotainment systems, networking routers and switches, high-definition televisions and set-top boxes, digital SLR cameras, toys, wearables and many other applications |
|
|
|
|
|
|
|
NAND Flash |
|
Industrial, IoT, consumer |
|
Set-top boxes, point-of-sale systems, security systems, wearables, toys, smart home appliances and many other applications. |
|
|
|
|
|
|
|
HyperRAM™ |
|
Automotive, industrial, IoT |
|
Automotive advanced driver assistance systems (ADAS), automotive instrument cluster, automotive infotainment systems, digital cameras, projectors, factory automation, medical equipment, home automation and appliances, handhelds and many other applications. |
|
|
|
|
|
|
|
Asynchronous SRAMs |
|
Consumer, networking, industrial |
|
Consumer electronics, switches and routers, test equipment, automotive and industrial electronics. |
|
|
|
|
|
|
|
Synchronous SRAMs |
|
Telecommunications, networking |
|
Enterprise routers and switches, wireless base stations, high bandwidth applications and industrial and defense electronics. |
|
|
|
|
|
|
|
nvSRAMs |
|
Networking, industrial |
|
Redundant array of independent disk (RAID) servers, point of sale terminals, set-top boxes, copiers, industrial automation, printers, single-board computers and gaming. |
|
|
|
|
|
|
|
F-RAMs |
|
Automotive, medical |
|
Smart electric meters, aerospace, medical systems, automotive, industrial controls, electronic point-of-sale terminals, printers and wireless (RFID) memory. |
|
|
|
|
|
|
|
Dual-port |
|
Networking, telecommunication |
|
Medical and instrumentation, storage, wireless infrastructure, military communications, image processors and base stations. |
|
|
|
|
|
|
|
First-in, first-out (FIFO) |
|
Video, data communications, telecommunications, networking |
|
Video, data communications, telecommunications, and network switching/routing. |
|
|
|
|
|
|
|
Programmable clocks |
|
Communications, computation |
|
Set-top boxes, copiers, printers, HDTV, Industrial automation, printers, single-board computers, IP phones, storage devices, servers and routers. |
|
|
|
|
|
|
|
RoboClock® buffers |
|
Communications |
|
Base stations, high-end telecom equipment (switches, routers), servers and storage. |
NOR Flash memories and HyperFlash™. Cypress offers the broadest portfolio of NOR flash memories for embedded systems. The portfolio features the highest-performance HyperFlash™ and Quad SPI NOR flash memories delivering up to 333MB/s read bandwidth, with the industry leading program and erase, and extended automotive temperature ranges (-40°C to 125°C). Our HyperBus™ interface is being implemented broadly by many of our partners. It is being designed across our industrial, automotive, and communication segments.
NAND Flash memories. Our NAND products add reliable, high-density data storage to our flash product line. Cypress applies its stringent process for qualification, testing, extended temperature support and packaging to its line of SLC NAND products. Our high-performance and high-reliability SLC NAND product portfolio is available in 1Gb - 16 Gb densities. There are two standard product families offering 1bit and 4bit ECC SLC NAND. We also offer SecureNAND™, which is an SLC NAND with enhanced security features.
9
HyperRAM™. Our HyperRAM™ memory is the first companion device to our HyperFlash™ memory and the second device to operate on our 12-pin HyperBus interface. With a read throughput up to 333 megabytes-per-second, the HyperRAM devices are ideal for SoCs with limited RAM providing a scalable solution for extending fast read and write operations externally, allowing fast delivery of high-resolution graphics in the early part of the boot process for automotive, industrial and IoT applications.
Asynchronous SRAMs. We manufacture a wide selection of fast asynchronous and micropower SRAMs with densities ranging from 16 Kbits to 64 Mbits. These memories are available in many combinations of bus widths, packages and temperature ranges, and include offering for the automotive market. They are ideal for use in point-of-sale terminals, gaming machines, network switches and routers, IP phones, IC testers, DSLAM Cards and various automotive applications.
Synchronous SRAMs. Our high-speed synchronous SRAMs include standard synchronous pipelined, No Bus Latency (NoBL), Quad Data Rate (QDR®), and Double Data Rate (DDR) SRAMs, and are typically used in networking applications. NoBL synchronous SRAMs are optimized for high-speed applications that require maximum bus bandwidth up to 250 MHz, including those in the networking, instrumentation, video and simulation businesses. Double Data Rate SRAMs target network applications and servers that operate at data rates up to 633 MHz. Quad Data Rate products are targeted toward next-generation networking applications, particularly switches and routers that operate at data rates beyond 633 MHz, and offer twice the bus bandwidth of DDR SRAMs. Cypress introduced the industry’s first 65-nm QDR and DDR SRAMs. The 144-Mbit and 72-Mbit devices, developed with foundry partner UMC, feature the industry’s fastest clock speeds and operate at half the power of their 90-nm predecessors. They are ideal for networking, medical imaging and military signal processing. In 2014, Cypress introduced the industry’s first QDR-IV SRAM, which enables 100-400 Gigabit line card rates for next-generation routers and switches.
nvSRAMs. nvSRAMs are products that operate similar to standard asynchronous SRAM and reliably store data into an internal nonvolatile array during unanticipated power outages. The competitive advantage of an nvSRAM is infinite endurance and much faster read/write speed than a serial flash or EEPROM. Additionally, these high-speed nonvolatile SRAM devices can store data for more than 20 years without battery backup. These memories are ideal for redundant array of independent disks (“RAID”) storage arrays, metering applications, multifunction printers and other industrial applications, such as PLCs. Cypress offers parallel nvSRAMs with an integrated real-time clock, providing failsafe battery-free data backup in mission-critical applications.
F-RAMs. Cypress’s F-RAM memories offer extremely low power with the same non-volatility as nvSRAM products. F-RAM memory cells are immune to gamma radiation and EMI, making them well-suited to certain aerospace and medical systems. Other applications include automotive, smart electric meters, industrial controls, electronic point-of-sale terminals, printers and wireless (RFID) memory.
Dual-Port Memories. Dual ports, which can be accessed by two different processors or buses simultaneously, target shared-memory and switching applications, including networking switches and routers, cellular base stations, mass-storage devices and telecommunications equipment. We offer a portfolio of more than 250 synchronous and asynchronous dual-port interconnects ranging in densities from 8 Kbits to 36 Mbits with speeds of up to 250 MHz. Our dual ports are compelling solutions for interprocessor communication in a broad range of applications. For high-volume multiprocessor applications (wireless handsets, PDAs, consumer, etc.) we offer the MoBL™ (More Battery-Life™) dual port, providing a low cost, quick time-to-market interconnect solution with the industry’s lowest power-consumption.
FIFO Memories. FIFOs are used as a buffer between systems operating at different frequencies. Our high-performance FIFO products provide the ideal solution to interconnect problems such as flow control, rate matching, and bus matching. Our FIFO portfolio is comprised of more than 100 synchronous and asynchronous memories in a variety of speeds, bus widths, densities and packages. Using industry-standard pinouts, these products are easily integrated into new and existing designs. Unidirectional, bidirectional, tri-bus and double sync configurations are available with built-in expansion logic and message-passing capabilities for various markets including video, data communications, telecommunications and network switching/routing.
Programmable Clocks. Programmable timing solutions such as our InstaClock device combine high performance with the flexibility and fast time to market of field-programmable devices at a cost that is competitive against custom clocks at equivalent volumes. Working with our easy-to-use CyberClocks™ software, designers can optimize device parameters such as drive strength, phased-lock loop bandwidth and crystal input capacitive loading. Our programmable clocks are ideal for devices requiring multiple frequencies including Ethernet, PCI, USB, HDTV, and audio applications. Additionally, the FleXO™ family of high-performance clock generators can be instantly programmed in the factory or field to any frequency up to 650 MHz, accelerating time to market and improving manufacturing quality.
10
RoboClock™ Clock Buffers. Our RoboClock family of clock buffers features programmable output skew, programmable multiply/divide factor, and fault-tolerant, user-selectable, redundant reference clocks. Designers can control output skew and multiply and divide factors to help accommodate last-minute design changes. RoboClock offers a high-performance timing solution for designers of communications, computation and storage networking applications.
Data Communications Division (DCD):
The Data Communications Division delivers flexible connectivity solutions that form the nervous system within the most-advanced embedded systems. Today Cypress is enabling the world to migrate to SuperSpeed USB 3.0 with the flexible EZ-USB® FX3™ peripheral controller and SuperSpeed USB 3.0 hubs. Cypress is leading the industry with the world's first programmable USB Type-C and USB Power Delivery solutions, including the EZ-PD™ Type-C controllers. Cypress's PRoC™ BLE Bluetooth® Low-Energy wireless devices are enabling PC peripherals and smart remote control OEMs to upgrade to BLE. Additionally, Cypress offers certified BLE modules that streamline the design of IoT products and other wireless applications.
The following table summarizes the markets and applications related to our products in this segment:
|
Products |
|
Markets |
|
Applications |
|
|
|
|
|
|
|
USB controllers |
|
Industrial, handset, PC and peripherals, consumer electronics |
|
Printers, cameras, machine vision and other industrial equipment, mice, keyboards, handheld devices, gamepads and joysticks, VoIP phones, headsets, presenter tools, dongles, point of sale devices and bar code scanners. |
|
|
|
|
||
|
EZ-PD™ controllers for USB-C with Power Delivery |
|
PC and peripherals, consumer electronics, IoT |
|
USB-C power adapters, USB-C adapter cables, monitors, docking stations and many other applications |
|
|
|
|
||
|
Bluetooth® Low Energy and WirelessUSB™ solutions |
|
IoT, PC peripherals |
|
Wearables, mice, keyboards, wireless headsets, consumer electronics, gamepads, remote controls, toys, presenter tools and many other applications. |
|
|
|
|
|
|
|
Trackpad Solutions |
|
PCs, consumer |
|
Cypress has applied its capacitive sensing expertise to the trackpad market for laptop computers and consumer devices. Trackpads offer cursor control and other functions, and Cypress’s solution has been adopted by multiple PC manufacturers. |
11
USB controllers. Cypress is a market leader in USB with more than one billion devices shipped. USB provides the primary connection between a PC and peripherals, including keyboards, mice, printers, joysticks, scanners and modems. It is also used to connect non-PC systems, such as smartphones, handheld games, digital still cameras and portable media players. The USB standard facilitates a “plug-and-play” architecture that enables instant recognition and interoperability when a USB-compatible peripheral is connected to a system. We offer a full range of USB solutions, including low-speed (1.5 Mbps), full-speed (12 Mbps), high-speed (480 Mbps) and now “SuperSpeed” (up to 5 Gbps) USB products. We also offer a variety of USB hubs, transceivers, serial interface engines and embedded-host products for a broad range of applications.
Bluetooth Low Energy and Wireless USB solutions. Designed for short-range wireless connectivity, WirelessUSB enables personal computer peripherals, gaming controllers, remote controls, toys, and other point-to-point or multipoint-to-point applications to “cut the cord” with a low-cost, 2.4-GHz wireless solution. The WirelessUSB system acts as a USB human interface device, so the connectivity is transparent to the designer at the operating system level. WirelessUSB also operates as a simple, cost-effective wireless link in a host of other applications including industrial, consumer, and medical markets. Our PRoC™ BLE (Programmable Radio-on-a-Chip Bluetooth Low Energy) solution combines a Bluetooth Smart radio, an ARM Cortex-M0 processor and CapSense capacitive touch-sensing in a single chip. The highly-integrated PRoC BLE device provides a cost-effective, turnkey solution for wireless human interface devices, remote controls and toys. We also offer certified EZ-BLE PRoC and EZ-BLE PSoC modules that streamline wireless design even further.
Trackpad. We design and manufacture turnkey Trackpad sensor module solutions. By leveraging the flexibility and power of Cypress touch technologies, we provide solutions ranging from low power, two-finger gesture to feature-rich, true multi-touch solutions. Our design library contains solutions that can be used off-the-shelf; in addition, we offer custom product development for specific form factors and features based on customer requirements. These products are ideal for Windows laptop, Google Chromebook, PC peripheral, and remote control applications. Trackpad modules promote fast time-to-market and cost effective solutions for touch-enable end products.
Emerging Technologies and Other (ETD):
Cypress’s Emerging Technology Division consists of businesses outside our core semiconductor business. It includes majority-owned subsidiaries AgigA Tech, Inc., Deca Technologies Inc., foundry services, other development stage activities and certain corporate expenses.
AgigA Tech, Inc. AgigA Tech, a majority-owned and fully independent subsidiary of Cypress, is an industry pioneer in the development of high-speed, high-density, battery-free non-volatile memory solutions. Its flagship product, AGIGARAM®, merges NAND Flash, DRAM and an ultracapacitor power source into a highly reliable non-volatile memory subsystem, delivering unlimited read/write performance at RAM speeds, while also safely backing up all data when power is interrupted. The patent-pending approach couples innovations in power management, high-speed data movement and systems knowledge, while leveraging high-volume, readily available memory technologies to provide a unique non-volatile solution scalable to very high densities. AGIGARAM earned an Edison Award for innovation. Cypress sampled the industry’s first DDR4 Nonvolatile DIMM, which operates in the standard DIMM sockets of next-generation, Intel-based server platforms.
Deca Technologies Inc. (“Deca”). Deca is a majority-owned and fully independent subsidiary of Cypress. Headquartered in Tempe, AZ., with global capabilities, Deca has pioneered a breakthrough approach to wafer level packaging and interconnect technology inspired by SunPower Corporation’s unique solar wafer fabrication methodology. Deca’s initial product offering includes a series of wafer level chip scale packaging (WLCSP) solutions serving several of the top 25 semiconductor producers. Deca’s approach enables industry-leading cycle times, flexibility and value for WLCSP, which is one of the semiconductor industry’s fastest growing electronic interconnect technologies. Sunpower Corporation is a minority investor in Deca. Deca shipped its 100-millionth component in 2014.
Cypress Foundry Solutions. Cypress Foundry Solutions provides both custom and standard foundry services out of the Cypress wafer fabrication facility in Bloomington, MN. This eight-inch wafer fab manufactures in high volume down to the 90nm node. It offers process technologies that integrate Silicon Oxide Nitride Oxide Silicon (SONOS)-based nonvolatile memory and precision analog/mixed-signal capabilities. The facility has been accredited as a Category 1A Trusted Fab for fabrication, design, and testing of U.S. Department of Defense (DoD) Trusted Microelectronics. Additionally, customers get access to Cypress’s vast design and technology IP portfolio to enable fast time to market.
12
Mergers and Acquisitions
On March 12, 2015, we completed the merger with Spansion Inc. ("Spansion") pursuant to the Agreement and Plan of Merger and Reorganization, as of December 1, 2014 (the "merger agreement"), for a total consideration of approximately $2.8 billion. In accordance with the terms of the merger agreement, Spansion shareholders received 2.457 Cypress shares for each Spansion share they owned. The merger has been accounted for under the acquisition method of accounting in accordance with Financial Accounting Standards Board Accounting Standard Topic 805, Business Combinations, with Cypress treated as the accounting acquirer. Spansion was a leading designer, manufacturer and developer of embedded systems semiconductors with flash memory, microcontrollers, analog and mixed-signal products. Spansion’s broad portfolio of ARMTM-based microcontrollers complemented the flexible PSoC solutions from Cypress, and Spansion’s leadership in specialty memories enhanced the Cypress memory portfolio creating a global leader in embedded systems.
For additional information on this acquisition, see Note 2 of Notes to Consolidated Financial Statements under Item 8.
Divestitures
On August 1, 2015, we completed the sale of the TrueTouch® mobile touchscreen business, which is a business unit within our Programmable Systems Division, to Parade Technologies (“Parade”) for total cash proceeds of $98.6 million pursuant to the definitive agreement signed on June 11, 2015. Of the total cash proceeds, $10.0 million are held in an escrow account until January 2017 subject to any indemnity claims on post-closing adjustments, per the terms of the agreement. Post-sale, Cypress will continue to provide TrueTouch® solutions to its automotive, industrial and home appliance customers and to its mobile customers. In connection with the transaction, we sold certain assets associated with the disposed business mostly consisting of inventory with a net book value of $10.5 million and recognized a gain of $66.5 million in the third fiscal quarter of fiscal 2015. This gain has been presented as a separate line item "Gain on divestiture of TrueTouch® mobile business" in the Consolidated Statements of Operations.
Also in connection with the transaction, we entered into a Manufacturing Service Agreement (MSA) in which we agreed to sell finished wafers and devices to Parade during the one-year period following the close of the transaction. The terms of the MSA indicated that we would sell finished products to Parade at agreed-upon prices that were considered below fair market value, indicating that there was an embedded fair value that would be realized by Parade through those terms. Accordingly, we have allocated $19.9 million from the $98.6 million proceeds to the fair value of the MSA based on the forecasted wafer sales to Parade for the subsequent one-year period. Such amount was deferred on our consolidated balance sheet initially and is being amortized to revenue as we sell products to Parade. During the fiscal year ended January 3, 2016 we recognized $5.7 million of revenue from amortization of such deferred revenue.
For additional information on this divestiture, see Note 3 of Notes to Consolidated Financial Statements under Item 8.
Manufacturing
Our core manufacturing strategy-“flexible manufacturing”-combines capacity from external foundries with output from our internal manufacturing facilities. This initiative allows us to meet rapid swings in customer demand while lessening the burden of high fixed costs, a capability that is particularly important with our rapidly evolving product portfolio.
We currently manufacture approximately 50% of our semiconductor products at our wafer manufacturing facilities in Bloomington, Minnesota and Austin, Texas. External wafer foundries, mainly in Asia, manufactured the balance of our products and we expect that our wafer foundry partners will continue to increase their manufacturing as a percentage of total output.
We conduct assembly and test operations at our facilities in the Philippines and Bangkok, Thailand. These facilities account for approximately 42% of the total assembly output and 52% of the total test output. Various subcontractors in Asia perform the balance of the assembly and test operations.
Our facilities in the Philippines and Bangkok, Thailand perform assembly and test operations, manufacturing volume products and packages where our ability to leverage manufacturing costs is high. The Philippines facility has ten fully integrated, automated manufacturing lines enabling complete assembly and test operations (Autolines). These autolines require fewer people to run and have shorter manufacturing cycle times than conventional assembly/test operations, which enable us to respond more rapidly to changes in demand.
13
We have a strategic foundry partnership with HuaHong Grace Semiconductor Manufacturing Corporation (“Grace”), located in Shanghai, China. Our agreement with them transferred certain proprietary process technologies and provided additional production capacity to augment output from our manufacturing facilities. Since 2007, when we completed the transfer of our 0.35-micron SONOS, 0.13-micron SRAM and LOGIC processes and 0.09-micron SRAM, we have been purchasing products from Grace that are manufactured using these processes. In the fourth quarter of fiscal 2014, the Company, through a wholly-owned subsidiary, purchased 6.9 million ordinary shares of Hua Hong Semiconductor Limited (HHSL) for an aggregate price of $10.0 million in connection with their initial public offering. HHSL is the parent company of Grace Semiconductor Manufacturing Corporation.
We also have a strategic foundry partnership with United Microelectronics Corporation (“UMC”), located in Taiwan. We use UMC’s 65nm process to produce our leading edge SRAM products which we have been shipping since 2008. Since 2008, we have continuously introduced higher density SRAM products up to 144Mb. We have also utilized UMC’s 65nm baseline to create derivative processes and products including our USB3.0 controllers and Asynchronous SRAMs. Additionally Cypress and UMC are collaborating on qualifying Cypress’s embedded non-volatile memory technology in UMC’s 55nm and 40nm flows under licensing agreement. These technologies will be used for Cypress’s future generation products and be offered as part of general foundry offering by UMC producing royalty revenue for Cypress.
As part of our acquisition of Ramtron, we acquired a commercial manufacturing agreement for F-RAM products with Texas Instruments (“TI”). Under that agreement, the Company provides certain design, testing and other activities associated with product development, and TI provides certain foundry and related services. As amended on November 30, 2012, the agreement provides for automatic renewals unless written notice of termination is given prior to the end of any renewal period. If notice of termination is given, the agreement terminates one year thereafter and the Company may place last orders and take delivery of product during the following year. The agreement contains various obligations of the parties, including our obligations regarding minimum orders and negotiated pricing of products we purchase.
As part of our merger with Spansion, we acquired agreements with Fujitsu Semiconductor Limited (“FSL”), XMC and SK Hynix Inc. (“SK Hynix”). Agreements with FSL include agreements for the supply of product wafer foundry services, sort services and assembly and test services relating to the microcontroller and analog businesses. These agreements are at competitive market rates and enable us to leverage FSL’s existing manufacturing capabilities and relationships with its partners spanning across various technologies, processes, geometries and wafer sizes in their wafer fabrication facilities and package solutions in their back-end manufacturing facilities, until such time that we can either move these internally to our fabrication and back-end facilities or find alternative solutions. For FSL, the fabrication facilities are all located in Japan, while the back-end facilities are in Japan and other Asian countries. The supply agreements do not call for any minimum purchase commitments. The arrangement with XMC provides production support for advanced NOR technology products at 65, 45 and development of 32 nanometers. The arrangement with SK Hynix provides for the development and supply of SLC NAND products at the 4x and 3x nodes.
Research and Development
Research and development efforts are focused on the development and design of new semiconductor products, as well as the continued development of advanced software platforms primarily for our programmable solutions. Also included are the consolidated costs of research and development associated with our ETD division. Our goal is to increase efficiency in order to maintain our competitive advantage. Our research and development organization works closely with our manufacturing facilities, suppliers and customers to improve our semiconductor designs and lower our manufacturing costs. During fiscal 2015, 2014 and 2013, research and development expenses totaled $281 million, $164.5 million, and $190.9 million, respectively.
We have both central and division-specific design groups that focus on new product creation and improvement of design methodologies. These groups conduct ongoing efforts to reduce design cycle time and increase first pass yield through structured re-use of intellectual property blocks from a controlled intellectual property library, development of computer-aided design tools and improved design business processes. Design and related software development work primarily occurs at design centers located in the United States, Europe, India and China.
Customers, Sales and Marketing
We sell our semiconductor products through several channels: sales through global domestically-based distributors; sales through international distributors and manufacturing representative firms; and sales by our sales force to direct original equipment manufacturers and their suppliers. Our marketing and sales efforts are organized around five regions: North Americas, Europe, Japan, Korea and China.
14
Our marketing activities target customers, reference design houses and our potential partners; and include a combination of direct marketing activities such as trade shows, events and marketing We augment our sales effort with field application engineers, specialists in our products, technologies and services who work with customers to design our products into their systems. Field application engineers also help us identify emerging markets and new products.
Outstanding accounts receivable from three of our distributors, accounted for 42%, 11% and 9%, respectively, of our consolidated accounts receivable as of January 3, 2016. Outstanding accounts receivable from two of our distributors, accounted for 12%, and 11% respectively, of our consolidated accounts receivable as of December 28, 2014 .
Revenue generated through Fujitsu Electronics Inc., Avnet, Inc., and Arrow electronics, three of our distributors, accounted for 25%, 10% and 7%, respectively, of our consolidated revenue for fiscal 2015. There were no end customers whose total purchases exceeded 10% of our consolidated revenue for fiscal 2015.
Revenue generated through Avnet, Inc., Weikeng Industrial Co. Ltd and Future, Inc., three of our distributors, accounted for 13%, 10% and 10%, respectively, of our consolidated revenue for fiscal 2014. There were no end customers whose total purchases exceeded 10% of our consolidated revenue for fiscal 2014.
Revenue generated through Avnet, Inc. and Macnica Inc., two of our distributors, accounted for 11% and 10% respectively, of our consolidated revenue for fiscal 2013. Samsung Electronics (“Samsung”), an end customer, purchased our products from our distributors and directly from Cypress and accounted for 12% of our consolidated revenue for fiscal 2013.
Backlog
Our sales typically rely upon standard purchase orders for delivery of products with relatively short delivery lead times. Customer relationships are generally not subject to long-term contracts. However, we have entered into long-term supply agreements with certain customers. These long-term supply agreements generally do not contain minimum purchase commitments. Products to be delivered and the related delivery schedules under these long-term contracts are frequently revised to reflect changes in customer needs. Accordingly, our backlog at any particular date is not necessarily representative of actual sales for any succeeding period and we believe that our backlog is not a meaningful indicator of future revenues.
Competition
The semiconductor industry is intensely competitive and continually evolving. This intense competition results in a challenging operating environment for most companies in this industry. This environment is characterized by the potential erosion of product sale prices over the life of each product, rapid technological change, limited product life cycles, greater brand recognition and strong domestic and foreign competition in many markets. Our ability to compete successfully depends on many factors, including:
|
|
· |
our success in developing new products and manufacturing technologies; |
|
|
· |
delivery, performance, quality and price of our products; |
|
|
· |
diversity of our products and timeliness of new product introductions; |
|
|
· |
cost effectiveness of our design, development, manufacturing and marketing efforts; |
|
|
· |
quality of our customer service, relationships and reputation; |
|
|
· |
overall success with which our customers market their products and solutions that incorporate our products; and |
|
|
· |
number and nature of our competitors and general economic conditions. |
We face competition from domestic and foreign semiconductor manufacturers, many of which have advanced technological capabilities and have increased their participation in the markets in which we operate. We compete with a large number of companies primarily in the automotive, industrial, communications, consumer, computation, data communications, mobile handsets and military markets. Companies that compete directly with our semiconductor businesses include, but are not limited to, Intel, Analog Devices, Atmel, NXP Semiconductors NV, GSI Technology, Integrated Device Technology, Integrated Silicon Solution, Lattice Semiconductor, Linear Technology, Maxim Integrated Products, Microchip Technology, Renesas, Silicon Laboratories, ST Microelectronics, Synaptics, Texas Instruments and Xilinx.
15
Environmental Regulations
We use, generate and discharge hazardous chemicals and waste in our research and development and manufacturing activities. United States federal, state and local regulations, in addition to those of other foreign countries in which we operate, impose various environmental rules and obligations, which are becoming increasingly stringent over time, intended to protect the environment and in particular regulate the management and disposal of hazardous substances. We also face increasing complexity in our product design as we adjust to new and future requirements relating to the materials composition of our products, including the restrictions on lead and other hazardous substances that apply to specified electronic products put on the market in the European Union (Restriction on the Use of Hazardous Substances Directive 2002/95/EC, also known as the “RoHS Directive”) and similar legislation in China and California. We are committed to the continual improvement of our environmental systems and controls. However, we cannot provide assurance that we have been, or will at all times be, in complete compliance with all environmental laws and regulations. Other laws impose liability on owners and operators of real property for any contamination of the property even if they did not cause or know of the contamination. While to date we have not experienced any material adverse impact on our business from environmental regulations, we cannot provide assurance that environmental regulations will not impose expensive obligations on us in the future, or otherwise result in the incurrence of liability such as the following:
|
|
· |
a requirement to increase capital or other costs to comply with such regulations or to restrict discharges; |
|
|
· |
liabilities to our employees and/or third parties; and |
|
|
· |
business interruptions as a consequence of permit suspensions or revocations or as a consequence of the granting of injunctions requested by governmental agencies or private parties. |
Intellectual Property
We have an active program to obtain patent and other intellectual property protection for our proprietary technologies, products and other inventions that are aligned with our strategic initiatives. We rely on a combination of patents, copyrights, trade secrets, trademarks and proprietary information to maintain and enhance our competitive position in the domestic and international markets we serve. As of the end of fiscal 2015 we had approximately 7,000 issued patents and approximately 1,200 additional patent applications on file domestically and internationally. In addition, in fiscal 2016 we are preparing to file up to 90 new patent applications in the United States and up to 70 foreign applications in countries such as China, Taiwan, Korea, Europe and India. The average remaining life of our patent portfolio is approximately 10 years.
In addition to factors such as innovation, technological expertise and experienced personnel, we believe that patents are increasingly important to remain competitive in our industry, defend our position in existing markets and to facilitate the entry of our proprietary products, such as PSoC ®, into new markets. As our technologies are deployed in new applications and we face new competitors, we will likely subject ourselves to new potential infringement claims and discover third party infringement of our intellectual property. Patent litigation, if and when instituted against us, could result in substantial costs and a diversion of our management’s attention and resources. We are committed to vigorously defending and protecting our investment in our intellectual property. Therefore, the strength of our intellectual property program, including the breadth and depth of our portfolio, will be critical to our success in the new markets we intend to pursue.
We perform an analysis of our intellectual property portfolio on an on-going basis to ensure we are deriving the full value of our assets. Accordingly, we continue to evaluate certain unaligned patents as well as other monetization models for our patent portfolio.
Financial Information about Segments and Geographic Areas
Financial information about segments and geographic area is incorporated herein by reference to Note 20 of Notes to Consolidated Financial Statements under Item 8.
International revenues have historically accounted for a significant portion of our total revenues. Our manufacturing and certain finance operations in the Philippines and Malaysia, as well as our sales and support offices and design centers in other parts of the world, face risks frequently associated with foreign operations, including, but not limited to:
|
|
· |
currency exchange fluctuations, including the weakening of the U.S. dollar; |
|
|
· |
the devaluation of local currencies; |
|
|
· |
political instability; |
|
|
· |
labor issues; |
|
|
· |
changes in local economic conditions; |
|
|
· |
import and export controls; |
16
|
|
· |
potential shortage of electric power supply; and |
|
|
· |
changes in tax laws, tariffs and freight rates. |
|
|
· |
potential violations by our international employees or third party agents of international or U.S. laws relevant to foreign operations (such as FCPA) and. |
|
|
· |
access to capital or credit at competitive rates |
To the extent any such risks materialize, our business, financial condition or results of operations could be seriously harmed.
Employees
As of January 3, 2016 we had 6,279 employees. Geographically, 2,100 employees were located in the United States, 1,041 employees were located in the Philippines, 989 in Thailand, 757 in Japan, 257 employees were located in Malaysia, 472 employees were located in India and 663 employees were located in other countries. Of the total employees, 3,715 employees were associated with manufacturing, 1,149 employees were associated with selling, general and administrative functions and 1,415 employees were associated with research and development.
Approximately 475 employees are represented by a collective bargaining agreement. We have never experienced organized work stoppages.
Executive Officers of the Registrant as of March 1, 2016
Certain information regarding each of our executive officers is set forth below:
|
Name |
|
Age |
|
Position |
|
T. J. Rodgers |
|
67 |
|
President, Chief Executive Officer and Director |
|
Thad Trent |
|
48 |
|
Executive Vice President, Finance and Administration and Chief Financial Officer |
|
Dana C. Nazarian |
|
47 |
|
Executive Vice President, Memory Products Division |
|
Hassane El-Khoury |
|
35 |
|
Executive Vice President, Programmable Systems Division |
T.J. Rodgers is a founder of Cypress and has been a Director and its President and Chief Executive Officer since 1982. Mr. Rodgers sits on the board of directors of Cypress’s internal subsidiaries as well as Bloom Energy, a privately held fuel cell company. Mr. Rodgers was also a member of the Board of Trustees of Dartmouth College until June 2012.
Thad Trent has been the Chief Financial Officer and Executive Vice President of Finance & Administration at Cypress Semiconductor Corporation since June 2014. Prior to his current position, Mr. Trent served as Cypress’s Vice President of Finance. Mr. Trent is a 22-year veteran of the technology industry. He held finance management roles at publicly traded companies Wind River Systems and Wyle Electronics, as well as two technology startups. Mr. Trent joined Cypress in 2005 and served as Vice President of Finance since 2010. Most recently, he has led the finance activities for business units, sales and marketing, and distribution groups, and he has supervised financial reporting, accounting, and planning and analysis. Mr. Trent sits on the board of directors of Cypress’s internal subsidiaries.
Dana C. Nazarian was named Executive Vice President of Memory Products Division in February 2009. Mr. Nazarian started his career with Cypress in 1988. Prior to his current position, Mr. Nazarian held various management positions, which included oversight of significant operations in our former Round Rock, Texas facility and Vice President of our Synchronous SRAM business unit.
Hassane El-Khoury was named Executive Vice president of the Programmable Systems Division in 2012. Prior to his current position, Mr. El-Khoury served as Cypress’s Automotive Business Unit Senior Director since 2010. After working as an engineer at Continental Automotive Systems, he joined Cypress’s automotive business unit and expanded the Company’s presence in the Human-Machine Interface and Body Electronics segments of the automotive marketplace.
Available Information
We make available our Annual Reports on Form 10-K, Quarterly Reports on Form 10-Q, Current Reports on Form 8-K and amendments to those reports filed or furnished pursuant to Section 13(a) or Section 15(d) of the Securities Exchange Act of 1934, as amended, free of charge on our website at www.cypress.com , as soon as reasonably practicable after they are electronically filed with or furnished to the Securities and Exchange Commission (“SEC”). Additionally, copies of materials filed by us with the SEC may be accessed at the SEC’s Public Reference Room at 100 F Street, N.E., Washington, D.C. 20549 or at www.sec.gov. For information about the SEC’s Public Reference Room, contact 1-800-SEC-0330.
17
Unfavorable economic and market conditions, domestically and internationally, may adversely affect our business, financial condition, results of operations and cash flows.
We have significant customer sales both in the U.S. and internationally. We are also reliant upon U.S. and international suppliers, manufacturing partners and distributors. We are therefore susceptible to adverse U.S. and international economic and market conditions. If any of our manufacturing partners, customers, distributors or suppliers experience serious financial difficulties or cease operations, our business will be adversely affected. In addition, the adverse impact of an unfavorable economy on consumers, including high unemployment rates, may adversely impact consumer spending, which will adversely impact demand for consumer products such as certain end products in which our products are embedded. In addition, prices of certain commodities, including oil, metals, grains and other food products, are subject to fluctuations arising from changes in domestic and international supply and demand, labor costs, competition, market speculation, government regulations and periodic delays in delivery. High or volatile commodity prices increase the cost of doing business and adversely affect consumers’ discretionary spending. As a result of the difficulty that businesses (including our customers) may have in obtaining credit, the increasing and/or volatile costs of commodities and the decreased consumer spending that may result from weakness in the general global economy, global economic and market turmoil are likely to have an adverse impact on our business, financial condition, results of operations and cash flows.
The trading price of our common stock has been and will likely continue to be volatile due to various factors, some of which are beyond our control, and each of which could adversely affect our stockholders’ value.
The trading price of our common stock has been and will likely continue to be volatile due to various factors, some of which are beyond our control, including, but not limited to:
|
|
· |
Revenue fluctuations due to unexpected shifts in customer orders; |
|
|
· |
Announcements about our earnings or the earnings of our competitors that are not in line with analyst expectations; |
|
|
· |
Our ability to achieve the planned synergies in the recent merger with Spansion; |
|
|
· |
Credit conditions and our ability to refinance our existing debt at commercially reasonable terms, which may limit the Company’s working capital; |
|
|
· |
Quarterly variations in our results of operations or those of our competitors; |
|
|
· |
Announcements by us or our competitors of acquisitions, new products, significant contracts, design wins, commercial relationships or capital commitments; |
|
|
· |
The perceptions of general market conditions in the semiconductor industry and global market conditions; |
|
|
· |
Our ability to develop and market new and enhanced products on a timely basis; |
|
|
· |
Any major change in our board or senior management; |
|
|
· |
Changes in governmental regulations or in the status of our regulatory compliance that impact our business; |
|
|
· |
Recommendations by securities analysts or changes in earnings estimates concerning us or our customers or competitors; |
|
|
· |
The volume of short sales, hedging and other derivative transactions on shares of our common stock; |
|
|
· |
Economic conditions and growth expectations in the markets we serve; |
|
|
· |
Changes in our policy regarding dividends or our ability to declare a dividend; and |
|
|
· |
Our ability to execute our lean inventory initiative to reduce excess inventory, which could lead to a disruption in the supply of our products and adversely affect our business. |
Further, the stock market in general, and the market for technology companies in particular, have experienced extreme price and volume fluctuations. These broad market and industry factors may seriously harm the market price of our common stock, regardless of our actual operating performance. In the past, following periods of volatility in the overall market and the market price of a company’s securities, securities class action litigation has often been instituted against these companies. This litigation, if instituted against us, could result in substantial costs and a diversion of our management’s attention and resources. Finally, our executive officers, who may hold a substantial number of shares of our common stock, may from time to time pledge all or a portion of their holdings as collateral or include such holdings in margin accounts. If our stock price were to drop suddenly, such margin accounts could be called and the shares in such accounts may be automatically sold by a third party in the open market, even during a blackout period.
18
We may in the future incur impairments in the value of our goodwill, intangibles and property, plant and equipment.
Goodwill represents the excess of the purchase price over the fair value of the net tangible and identifiable intangible assets acquired in a business combination. We test goodwill for impairment annually, and more frequently when events occur or circumstances change that would more likely than not reduce the fair value of a reporting unit below its carrying amount. Additionally, our other long-lived assets which include intangibles and property, plant and equipment are evaluated for impairments whenever events or changes in circumstances indicate the carrying value may not be recoverable. Either of these situations may occur for various reasons, including changes in actual or expected income or cash. We continue to evaluate current conditions to assess whether any impairment exists. Impairments could occur in the future if any of the following occur: market or interest rate environments deteriorate, significant adverse changes in business climate, unanticipated competition, loss of key customers, changes in technology, expected future cash flows of our reporting units decline, or reporting unit carrying values change materially compared with changes in respective fair values.
We utilize debt financing and such indebtedness could adversely affect our business, financial condition, results of operations, earnings per share and our ability to meet our payment obligations.
We routinely incur indebtedness to finance our operations and from time to time we have significant amounts of outstanding indebtedness and substantial debt service requirements. Our amended and restated senior secured credit facility with a group of lenders led by Morgan Stanley Senior Funding, Inc., provides for a $540 million revolving credit facility and a $100 million term loan. The credit facility contains customary affirmative, negative and financial covenants, including a maximum total leverage ratio and a minimum fixed charge coverage ratio. Our ability to meet our payment and other obligations and covenants under our indebtedness depends on our ability to generate significant cash flow. This, to some extent, is subject to general economic, financial, competitive, legislative and regulatory factors as well as other factors that are beyond our control. There is no assurance that our business will generate cash flow from operations, or that future borrowings will be available to us under our existing or any amended credit facilities or otherwise, in an amount sufficient to enable us to meet payment obligations under indebtedness we may under take from time to time. If we are not able to generate sufficient cash flow to service our debt obligations, we may need to refinance or restructure our debt, sell assets, reduce or delay capital investments, or seek to raise additional capital. There is no assurance that we will be able to implement any of these alternatives on commercially reasonable terms, if at all. If we are unable to implement one or more of these alternatives, we may not be able to meet our payment obligations under any indebtedness we owe. As of January 3, 2016, our outstanding debt included $449.0 million related to our Senior Secured Revolving Credit Facility, $150 million of 2% Senior Exchange notes assumed from Spansion, $97.2 million Term Loan A, net of costs, $7.2 million of capital leases and $3.0 million of equipment loans. See Note 14 for more information on our Senior Secured Revolving Credit Facility, 2.0% Senior Exchange notes assumed from Spansion and our Term Loan A and Note 19 on our capital leases.
If we fail to compete successfully in our highly competitive industry and markets, our business, financial condition and results of operations will be seriously harmed.
The semiconductor industry is intensely competitive. This intense competition results in a difficult operating environment that is marked by erosion of average selling prices over the life of each product and rapid technological change resulting in limited product life cycles. In order to offset selling price decreases, we attempt to decrease the manufacturing costs of our products and to introduce new, higher priced products that incorporate advanced features. If these efforts are not successful or do not occur in a timely manner, or if our newly introduced products do not gain market acceptance, our business, financial condition and results of operations could be seriously harmed.
Our ability to compete successfully in the rapidly evolving semiconductor industry depends on many factors, including:
|
|
· |
our success in developing and marketing new products, software platforms and manufacturing technologies and bringing them to market on a timely basis; |
|
|
· |
the quality and price of our products; |
|
|
· |
the pace at which customers incorporate our products into their systems, as is sometimes evidenced by design wins; |
|
|
· |
the diversity of our product lines; |
|
|
· |
the cost effectiveness of our design, development, manufacturing, support and marketing efforts, especially as compared to our competitors; |
|
|
· |
our success in developing and introducing firmware in a timely manner; |
|
|
· |
our customer service and customer satisfaction; |
|
|
· |
our ability to successfully execute our flexible manufacturing strategy; |
|
|
· |
the number, strength and nature of our competitors, the markets they target and the rate and success of their technological advances; |
19
|
|
· |
the success of certain of our development activity which is a part of our Emerging Technologies business segment; |
|
|
· |
our ability to get competitive terms with our vendors, manufacturing partners and suppliers; |
|
|
· |
general economic conditions; and |
|
|
· |
our access to and the availability of working capital. |
Although we believe we currently compete effectively in the above areas to the extent they are within our control, given the pace of change in our industry, our current abilities are not guarantees of future success. If we are unable to compete successfully in this environment, our business, financial condition and results of operations will be seriously harmed.
We may fail to realize all of the anticipated benefits of our acquisition of Spansion
On March 12, 2015, we completed our acquisition of Spansion. The success of the transaction will depend, in part, on our ability to achieve the anticipated cost synergies and other strategic benefits from combining the businesses of Cypress and Spansion. We expect to benefit from operational synergies resulting from the consolidation of capabilities and elimination of redundancies as well as greater efficiencies from increased scale, market integration and more automation. However, to realize these anticipated benefits, we must successfully combine the businesses of Cypress and Spansion. If we are not able to achieve these objectives, the anticipated cost synergies and other strategic benefits of the transaction may not be realized fully or at all or may take longer to realize than expected. We may fail to realize some or all of the anticipated benefits of the transaction in the amounts and times projected for a number of reasons, including that the integration may take longer than anticipated or be more costly than anticipated.
The failure to integrate successfully the businesses and operations of Cypress and Spansion in the expected time frame may adversely affect our future results.
Prior to the completion of the transaction, Cypress and Spansion historically operated as independent companies. Our management may face significant challenges in consolidating the functions of Cypress and Spansion and their subsidiaries, integrating their technologies, organizations, ERP systems, procedures, policies and operations, as well as addressing differences in the business cultures of the two companies and retaining key personnel. In connection with the acquisition, we are integrating certain operations of Cypress and Spansion, including, among other things, back-office operations, information technology and regulatory compliance. The integration of the two companies will be complex and time consuming, and require substantial resources and effort. The integration process and other disruptions resulting from the transaction may disrupt each company’s ongoing businesses or cause inconsistencies in standards, controls, procedures and policies that adversely affect our relationships with our members and other market participants, employees, regulators and others with whom we have business or other dealings. If we fail to manage the integration of these businesses effectively, our growth strategy and future profitability could be negatively affected, and we may fail to achieve the intended benefits of the transaction.
We have incurred costs in connection with our acquisition of Spansion and will continue to incur costs in connection with the transaction.
We have incurred significant costs associated with transaction fees, professional services and other costs related to the transaction and we will continue to incur additional costs, including restructuring costs, in connection with the integration of the business. Specifically, through January 3, 2016, we have incurred $84.6 million for costs in addition to restructuring and other items associated with the merger and integration. Although we expect that the realization of efficiencies related to the integration of the businesses will offset merger-related and restructuring costs over time, this net benefit may not be achieved in the near term, or at all.
We face significant volatility in supply and demand conditions for our products, and this volatility, as well as any failure by us to accurately forecast future supply and demand conditions, could materially and negatively impact our business.
The semiconductor industry has historically been characterized by wide fluctuations in the demand for, and supply of, semiconductors. Demand for our products depends in large part on the continued growth of various electronics industries that use our products, including, but not limited to:
|
|
· |
automotive applications including advanced driver assistance systems (ADAS), instrument clusters, infotainment systems, body electronics, HVAC controls, event data recorders, powertrains and electric vehicle/hybrid-electric vehicle systems; |
|
|
· |
industrial systems including factory automation equipment, smart electric meters, aerospace, industrial controls, point-of-sale terminals and test equipment |
|
|
· |
consumer electronics including wearable electronics, smartphones, gaming consoles, gamepads, remote controls, toys, presenter tools, TVs, set-top boxes and fitness equipment; |
|
|
· |
wireless telecommunications equipment; |
20
|
|
· |
computers and computer-related peripherals; |
|
|
· |
medical equipment; and |
|
|
· |
networking equipment. |
Any downturn, shift in product launch schedule or reduction in the growth of these industries could seriously harm our business, financial condition and results of operations. In particular, our TrueTouch family of products is highly concentrated in consumer handset markets which are susceptible to changes in the general economy, consumer acceptance, design wins, competition and price.
We order materials and build our products based primarily on our internal forecasts, customer and distributor forecasts and secondarily on existing orders, which may be cancelled under many circumstances. Because our markets can be volatile, are based on consumer demand and subject to rapid technological and price changes, our forecasts may be inaccurate, causing us to make too many or too few of certain products.
Also, our customers frequently place orders requesting product delivery almost immediately after the order is made, which makes forecasting customer demand even more difficult, particularly when supply is abundant. If we experience inadequate demand or a significant shift in the mix of product orders that makes our existing capacity and capability inadequate, our fixed costs per semiconductor produced will increase, which will harm our financial condition and results of operations. Alternatively, if we should experience a sudden increase in demand, we will need to quickly ramp our inventory and/or manufacturing capacity to adequately respond to our customers. If we or our manufacturing partners are unable to ramp our inventory or manufacturing capacity in a timely manner or at all, we risk losing our customers’ business, which could have a negative impact on our financial performance and reputation.
If we fail to develop, introduce and sell new products or fail to develop and implement new technologies, our ability to compete in our end markets will suffer and our financial results could be adversely impacted.
Like many semiconductor companies, which operate in a highly competitive, quickly changing environment marked by rapid obsolescence of existing products, our future success depends on our ability to develop and introduce new products that customers choose to buy. Our new products, for example PSoC® products, BLE, USB-Type C, Traveo and our ETD companies are an important strategic focus for us and therefore, they tend to consume a significant amount of our resources. The new products the market requires tend to be increasingly complex, incorporating more functions and operating at faster speeds than old products. Increasing complexity generally requires smaller features on a chip. This makes manufacturing new generations of products substantially more difficult than prior generations.
Despite the significant amount of resources we commit to new products, there can be no guarantee that such products will perform as expected or at all, be introduced on time to meet customer schedules or gain market acceptance. If we fail to introduce new product designs or technologies in a timely manner or are unable to manufacture products according to the requirements of these designs, or if our customers do not successfully introduce new systems or products incorporating our products, or market demand for our new products does not materialize as anticipated, our business, financial condition and results of operations could be materially harmed.
The complex nature of our manufacturing activities, our broad product portfolio, and our increasing reliance on third-party manufacturers makes us highly susceptible to manufacturing problems and these problems can have a substantial negative impact on us if they occur.
Making semiconductors is a highly complex and precise process, requiring production in a tightly controlled, clean environment. Even very small impurities in our manufacturing materials, defects in the masks used to print circuits on a wafer or other problems in the wafer fabrication process can cause a substantial percentage of wafers to be rejected or numerous chips on each wafer to be non-functional. We and, similarly, our third party foundry partners, may experience problems in achieving an acceptable success rate in the manufacture of wafers and the likelihood of facing such difficulties is higher in connection with the transition to new manufacturing methods. The interruption of wafer fabrication or the failure to achieve acceptable manufacturing yields at any of our facilities, or the facilities of our third-party foundry partners, would seriously harm our business, financial condition and results of operations. We may also experience manufacturing problems in our assembly and test operations and in the introduction of new packaging materials.
21
We are increasingly dependent upon third parties to manufacture, distribute, generate a significant portion of our product sales, fulfill our customer orders and transport our product. Problems in the performance or availability of these companies could seriously harm our financial performance.
Although many of our products are fabricated in our manufacturing facilities located in Minnesota, Austin, Malaysia and the Philippines, we rely to a significant extent on independent contractors to manufacture and assemble our products. In addition, if market demand for our products exceeds our internal manufacturing capacity and available capacity from our foundry partners, we may seek additional foundry manufacturing arrangements.
A shortage in foundry manufacturing capacity, which is more likely to occur at times of increasing demand, could hinder our ability to meet demand for our products and therefore adversely affect our operating results. In addition, greater demand for wafers produced by any such foundries without an offsetting increase in foundry capacity raises the likelihood of potential wafer price increases. Our operations would be disrupted if any of our foundry partners terminates its relationship with us or has financial issues and we are unable to arrange a satisfactory alternative to fulfill customer orders on a timely basis and in a cost-effective manner. There are also only a few foundry vendors that have the capabilities to manufacture our most advanced products. If we engage alternative sources of supply, we may encounter start-up difficulties, yield issues or incur additional costs. Shipments could be delayed significantly while these sources are qualified for volume production.
While a high percentage of our products are assembled, packaged and tested at our manufacturing facilities located in the Philippines and Malaysia, we rely on independent subcontractors to assemble, package and test the balance of our products. We cannot be certain that these subcontractors will continue to assemble, package and test products for us on acceptable economic and quality terms or at all and it might be difficult for us to find alternatives if they do not do so.
Our foundry partners and assembly and test subcontractors have operations in locations that may suffer the impact of certain natural disasters, which could impact their ability to provide us with our products. We monitor these events closely, but if one of our third party manufacturing partners were to suffer significant damage to its operations as a result of a natural disaster, our ability to timely meet consumer demand would suffer which would materially harm our results of operations.
Our channel partners include distributors and resellers. We continue to expand and change our relationships with our distributors. Worldwide sales through our distributors accounted for approximately 71% of our net sales in fiscal year 2015. We rely on many distributors to assist us in creating customer demand, providing technical support and other value-added services to our customers, filling customer orders and stocking our products. We face ongoing business risks due to our reliance on our channel partners to create and maintain customer relationships where we have a limited or no direct relationship. Should our relationships with our channel partners or their effectiveness decline, we face the risk of declining demand which could affect our revenue and results of operations. Our contracts with our distributors may be terminated by either party upon notice. In addition, our distributors are located all over the world and are of various sizes and financial conditions. Any disruptions to our distributors’ operations such as lower sales, lower earnings, debt downgrades, the inability to access capital markets and higher interest rates could have an adverse impact on our business.
We also rely on independent carriers and freight haulers to move our products between manufacturing plants and our customers’ facilities. Transport or delivery problems due to their error or because of unforeseen interruptions in their business due to factors such as strikes, political instability, terrorism, natural disasters or accidents could seriously harm our business, financial condition and results of operations and ultimately impact our relationship with our customers.
We may be unable to protect our intellectual property rights adequately.
The protection of our intellectual property rights, as well as those of our subsidiaries, is essential to keeping others from copying the innovations that are critical to our existing and future products. It may be possible for an unauthorized third party to reverse-engineer or decompile our software products. The process of seeking patent protection can be long and expensive and we cannot be certain that any currently pending or future applications will actually result in issued patents, or that, even if patents are issued, they will be respected by third parties. Furthermore, our flexible fab initiative requires us to enter into technology transfer agreements with external partners, providing third party access to our intellectual property and resulting in additional risk. In some cases, these technology transfer and/or license agreements are with foreign companies and subject our intellectual property to regulation in foreign countries which may afford less protection and/or result in increased costs to enforce such agreements or intellectual property rights. We anticipate that we will continue to enter into these kinds of licensing arrangements in the future. Consequently, we may become involved in litigation, in the United States or abroad, to enforce our patents or other intellectual property rights, to protect our trade secrets and know-how, to determine the validity or scope of the proprietary rights of others or to defend against claims of invalidity. We are also from time to time involved in litigation relating to alleged infringement by us of others’ patents or other intellectual property rights.
22
Moreover, a key element of our strategy is to enter new markets with our products. If we are successful in entering these new markets, we will likely be subject to additional risks of potential infringement claims against us as our technologies are deployed in new applications and face new competitors. We may be unable to detect the unauthorized use of, or take appropriate steps to enforce, our intellectual property rights, particularly in certain international markets, making misappropriation of our intellectual property more likely. Patent litigation, if necessary or if and when instituted against us, could result in substantial costs and a diversion of our management’s attention and resources.
We also rely on trade secret protection for our technology, in part through confidentiality and other written agreements with our employees, consultants and third parties. Through these and other written agreements, we attempt to control access to and distribution of our intellectual property documentation and other proprietary technology information. Despite our efforts to protect our proprietary rights, former employees, consultants or third parties may, in an unauthorized manner, attempt to use, copy or otherwise obtain and market or distribute our intellectual property rights or technology or otherwise develop a product with the same functionality as our technology. Policing unauthorized use of our intellectual property rights is difficult, and nearly impossible on a worldwide basis. Therefore, we cannot be certain that the steps we have taken or will take in the future will prevent misappropriation of our technology or intellectual property rights, particularly in foreign countries where we do business or where our technology is sold or used, where the laws may not protect proprietary rights as fully as do the laws of the United States or where the enforcement of such laws is not common or effective.
We may be involved in intellectual property litigation and face significant expenses as a result of ongoing or future litigation.
Other companies or entities also have commenced, and may again commence, actions seeking to establish the invalidity of our patents. While we intend to defend these actions vigorously, there is no guarantee of success, and such effort takes significant financial and time resources from the Company. In the event that one or more of our patents are challenged, a court or the United States Patent and Trademark Office may invalidate the patent(s) or determine that the patent(s) is not enforceable, which could harm our competitive position. If our patents are invalidated, or if the scope of the claims in any of these patents is limited by a court or USPTO decision, we could be prevented from pursuing certain litigation matters or licensing the invalidated or limited portion of such patents. Such adverse decisions could negatively impact our future, expected revenue.
Intellectual property litigation is frequently expensive to both the winning party and the losing party and could take up significant amounts of management’s time and attention. In addition, if we lose such a lawsuit, a court could find that our intellectual property rights are invalid, enabling our competitors to use our technology, or require us to pay substantial damages and/or royalties or prohibit us from using essential technologies. For these and other reasons, this type of litigation could seriously harm our business, financial condition and results of operations. Also, although in certain instances we may seek to obtain a license under a third party’s intellectual property rights in order to bring an end to certain claims or actions asserted against us, we may not be able to obtain such a license on reasonable terms or at all. We believe we have meritorious defenses and claims in our current litigation and we intend to defend and pursue such claims vigorously. Unfortunately, such litigation and other claims are subject to inherent uncertainties.
We face additional problems and uncertainties associated with international operations that could seriously harm us.
International revenues historically accounted for a significant portion of our total revenues. Our manufacturing, assembly, test operations and certain finance operations located in outside of the United States, as well as our international sales offices and design centers, face risks frequently associated with foreign operations including but not limited to:
|
|
· |
currency exchange fluctuations; |
|
|
· |
the devaluation of local currencies; |
|
|
· |
political instability; |
|
|
· |
labor issues; |
|
|
· |
the impact of natural disasters on local infrastructures and economies; |
|
|
· |
changes in local economic conditions; |
|
|
· |
import and export controls; |
|
|
· |
potential shortage of electric power supply; |
|
|
· |
potential violations by our international employees or third party agents of international or U.S. laws relevant to foreign operations (such as FCPA) and |
|
|
· |
changes in tax laws, tariffs and freight rates. |
To the extent any such risks materialize, our business, financial condition or results of operations could be seriously harmed.
23
We compete with others to attract and retain key personnel, and any loss of, or inability to attract, such personnel would harm us.
To a greater degree than most non-technology companies, we depend on the efforts and abilities of certain key members of management and technical personnel to execute on the strategic initiatives of our business. Our future success depends, in part, upon our ability to retain such personnel and to attract and retain other highly qualified personnel, particularly product and process engineers. We compete for these individuals with certain of our competitors, other companies, academic institutions, government entities and other organizations. Competition for such personnel is intense and we may not be successful in hiring or retaining new or existing qualified personnel. Equity awards are critical to our ability to hire and retain such key personnel. In addition, we may also need to significantly increase our cash based compensation to retain such personnel.
Our financial results could be adversely impacted if our Emerging Technologies businesses fail to develop and successfully bring to market new and proprietary products.
We have made a financial and personnel commitment to our Emerging Technologies businesses. Despite the significant amount of resources we commit to our Emerging Technologies businesses, there can be no guarantee that such Emerging Technologies businesses will perform as expected or at all, launch new products and solutions as expected or gain market acceptance. If our Emerging Technologies businesses’ fail to introduce new product and solutions or successfully develop new technologies, or if our customers do not successfully introduce new systems or products incorporating the products or solutions offered by our Emerging Technologies businesses or market demand for the products or solutions offered by our Emerging Technologies businesses do not materialize as anticipated, our business, financial condition and results of operations could be materially harmed.
Any guidance that we may provide about our business or expected future results may differ significantly from actual results.
From time to time we have shared our views in press releases or SEC filings, on public conference calls and in other contexts about current business conditions and our expectations as to our future results of operations. Correctly identifying the key factors affecting business conditions and predicting future events is inherently an uncertain process, especially in uncertain economic times. Given the complexity and volatility of our business, our analyses and forecasts have in the past and will likely in the future, prove to be materially incorrect. We offer no assurance that such predictions or analyses will ultimately be accurate, and investors should treat any such predictions or analyses with appropriate caution. Any analysis or forecast that we make which ultimately proves to be inaccurate may adversely affect our stock price.
We are subject to many different environmental, health and safety laws, regulations and directives, and compliance with them may be costly.
We are subject to many different international, federal, state and local governmental laws and regulations related to, among other things, the storage, use, discharge and disposal of toxic, volatile or otherwise hazardous chemicals used in our manufacturing process, conflict mineral and data privacy legislation, as well as the health and safety regulations related to our employees. Compliance with these regulations can be costly. We cannot assure you that we have been, or will be at all times in complete compliance with such laws and regulations. If we violate or fail to comply with these laws and regulations, we could be fined or otherwise sanctioned by the regulators. Under certain environmental laws, we could be held responsible, without regard to fault, for all of the costs relating to any contamination at our or our predecessors’ past or present facilities and at third party waste disposal sites. We could also be held liable for any and all consequences arising out of human exposure to such substances or other environmental damage.
Over the last several years, there has been increased public awareness of the potentially negative environmental impact of semiconductor manufacturing operations. This attention and other factors may lead to changes in environmental regulations that could force us to purchase additional equipment or comply with other potentially costly requirements. If we fail to control the use of, or to adequately restrict the discharge of, hazardous substances under present or future regulations, we could face substantial liability or suspension of our manufacturing operations, which could seriously harm our business, financial condition and results of operations.
We face increasing complexity in our product design as we adjust to new and future requirements relating to the material composition of our products, including the restrictions on lead and other hazardous substances that apply to specified electronic products put on the market in the European Union, China and California. Other countries, including at the federal and state levels in the United States, are also considering similar laws and regulations. Certain electronic products that we maintain in inventory may be rendered obsolete if they are not in compliance with such laws and regulations, which could negatively impact our ability to generate revenue from those products. Although we cannot predict the ultimate impact of any such new laws and regulations, they will likely result in additional costs, or in the worst case decreased revenue, and could even require that we redesign or change how we manufacture our products. Such redesigns result in additional costs and possible delayed or lost revenue.
24
Business disruptions could seriously harm our future revenue and financial condition and increase our costs and expenses.
Our worldwide operations could be adversely affected if disrupted for any reason, including natural disasters such as earthquakes, tsunamis, floods, hurricanes, typhoons, telecommunication or information technology system failures, regulatory or political issues, power or water shortages, fires, extreme weather conditions, medical epidemics or pandemics or other man- made disasters or catastrophic events. While we maintain business interruption insurance for our primary foreign manufacturing operations, we are self-insured for any loss or damage to our primary manufacturing facility. As such, the occurrence of any of these business disruptions for us or our third party manufacturers, partners or customers could result in significant losses, seriously harm our revenue and financial condition, adversely affect our competitive position, increase our costs and expenses, and require substantial expenditures and recovery time in order to fully resume operations. Our corporate headquarters, and a portion of our research and development activities, are located in California, and other critical business operations and some of our suppliers are located in California and Asia, near major earthquake faults known for seismic activity. The manufacture of product components, the final assembly of our products and other critical operations are concentrated in certain geographic locations, including the Philippines, Malaysia, China and India. We also rely on major logistics hubs primarily in Asia to manufacture and distribute our products. The ultimate impact on us, our significant suppliers and our general infrastructure of being located near major earthquake faults and being consolidated in certain geographical areas is unknown. However in the event of a major earthquake or other natural disaster or catastrophic event, our revenue, profitability and financial condition could suffer.
System security risks, data protection or privacy breaches, cyber-attacks and systems integration issues could disrupt our internal operations and/or harm the reputation of the Company, and any such disruption or harm could cause a reduction in our expected revenue, increase our expenses, negatively impact our results of operation or otherwise adversely affect our stock price.
Experienced computer programmers and hackers may be able to penetrate our network security and misappropriate or compromise our confidential and proprietary information, create system disruptions or cause shutdowns. Computer programmers and hackers also may be able to develop and deploy viruses, worms, and other malicious software programs that attack our products or otherwise exploit any security vulnerabilities of our products. The costs to us to eliminate or alleviate cyber or other security problems, bugs, viruses, worms, malicious software programs and security vulnerabilities could be significant, and our efforts to address these problems may not be successful and could result in interruptions and delays that may impede our sales, manufacturing, distribution or other critical functions.
We manage and store various proprietary information and sensitive or confidential data relating to our business on the cloud. Breaches of our security measures or the accidental loss, inadvertent disclosure or unapproved dissemination of proprietary information or sensitive or confidential data about us, including the potential loss or disclosure of such information or data as a result of fraud, trickery or other forms of deception, could expose us to a risk of loss or misuse of this information, result in litigation and potential liability for us, damage our brand and reputation or otherwise harm our business. In addition, the cost and operational consequences of implementing further data protection measures could be significant.
Portions of our IT infrastructure also may experience interruptions, delays or cessations of service or produce errors in connection with systems integration or migration work that takes place from time to time. We may not be successful in implementing new systems and transitioning data, which could cause business disruptions and be more expensive, time consuming, disruptive and resource-intensive. Such disruptions could adversely impact our ability to fulfill orders and interrupt other processes. Delayed sales, lower margins or lost customers resulting from these disruptions have adversely affected us in the past, and in the future could adversely affect our financial results, stock price and reputation.
We maintain self-insurance for certain indemnities we have made to our officers and directors, and if a significant payment were to arise out of such liabilities, it could harm our financial condition and results of operation.
Our certificate of incorporation, by-laws and indemnification agreements require us to indemnify our officers and directors for certain liabilities that may arise in the course of their service to us. We self-insure with respect to these indemnifiable claims. If we were required to pay a significant amount on account of these liabilities for which we self-insure, our business, financial condition and results of operations could be seriously harmed.
25
New regulations related to “conflict minerals” may force us to incur additional expenses, may make our supply chain more complex and may result in damage to our reputation with customers.
On August 22, 2012, under the Dodd-Frank Wall Street Reform and Consumer Protection Act of 2010, or the Dodd-Frank Act, the SEC adopted new requirements for companies that use certain minerals and metals, known as conflict minerals, in their products, whether or not these products are manufactured by third parties. These requirements require companies to do diligence, disclose and report whether or not such minerals originate from the Democratic Republic of Congo and adjoining countries. We have undertaken the necessary diligence to determine whether such minerals are used in the manufacture of our products. However, the implementation of these new requirements could adversely affect the sourcing, availability and pricing of such minerals if they are found to be used in the manufacture of our products. In addition, regardless of our findings, we will incur additional costs to comply with the disclosure requirements, including costs related to determining the source of any of the relevant minerals and metals used in our products. Since our supply chain is complex, we may not be able to sufficiently verify the origins for these minerals and metals used in our products through the due diligence procedures that we implement, which may harm our reputation. In such event, we may also face difficulties in satisfying customers who require that all of the components of our products are certified as conflict mineral free. The next report is due on May 31, 2016 for the 2015 calendar year.
Changes in U.S. and International tax legislation regarding our foreign earnings could materially impact our business.
A majority of our revenue is generated from customers located outside the U.S. and a substantial portion of our assets, including employees, are located outside the U.S. United States income tax has not been provided on a portion of earnings of our non-U.S. subsidiaries to the extent that such earnings are considered to be indefinitely reinvested. In the past, the administration has considered initiatives which could substantially reduce our ability to defer U.S. taxes including: limitations on deferral of U.S. taxation of foreign earnings eliminate utilization or substantially reduce our ability to claim foreign tax credits, and eliminate various tax deductions until foreign earnings are repatriated to the U.S. If any of these proposals are constituted into law, they could have a negative impact on our financial position and results of operations.
We are subject to examination by the U.S. Internal Revenue Service (the “IRS”), and from time to time we are subject to income tax audits or similar proceedings in other jurisdictions in which we do business, and as a result we may incur additional costs and expenses or owe additional taxes, interest and penalties which will negatively impact our operating results.
We are subject to income taxes in the U.S. and certain foreign jurisdictions, and our determination of our tax liability is subject to review by applicable domestic and foreign tax authorities. The results of these US and certain foreign jurisdiction examinations may result in a decrease of our current estimate of unrecognized tax benefits or increase of actual tax liabilities which could negatively impact our financial position, results of operations and cash flows.
Tax bills are introduced from time to time to reform U.S. taxation of international business activities. The Organization for Economic Co-operation and Development, or OECD, also recently released guidance covering various topics, including country-by-country reporting, definitional changes to permanent establishment and Base Erosion and Profit Shifting, or BEPS, an initiative that aims to standardize and modernize global tax policy. Depending on the final guidance and legislation ultimately enacted, if any, there may be significant consequences for us due to the large scale of our international business activities.
In addition, policies regarding corporate income taxes in numerous jurisdictions are under heightened scrutiny. As a result, decisions by tax authorities regarding treatments and positions of corporate income taxes could be subject to legislative investigation and inquiry, which could result in changes in tax policies or prior tax rulings. There can be no assurance as to the outcome of these investigations and inquiries. As such, the taxes we previously paid may be subject to change and our taxes may increase in the future, which could have an adverse effect on our results of operations, financial condition and our corporate reputation.
26
If the tax incentive or tax holiday arrangements we have negotiated in Malaysia, Philippines and Thailand change or cease to be in effect or applicable, in part or in whole, for any reason, or if our assumptions and interpretations regarding tax laws and incentive or holiday arrangements prove to be incorrect, the amount of corporate income taxes we have to pay could significantly increase.
We have structured our operations to maximize the benefit from various tax incentives and tax holidays extended to us in various jurisdictions to encourage investment or employment. Each such tax incentive is separate and distinct from the others, and may be granted, withheld, extended, modified, truncated, complied with or terminated independently without any effect on the other incentives. The tax incentives are presently scheduled to expire at various dates generally beginning in 2018, subject in certain cases to potential extensions, which we may or may not be able to obtain. Absent these tax incentives, the corporate income tax rate in these jurisdictions that would otherwise apply to us would be between 20% to 30%. The tax incentives that we have negotiated are also subject to our compliance with various operating and other conditions. If we cannot, or elect not to, comply with the operating conditions included in any particular tax incentive, we will lose the related tax benefits and we could be required to refund previously realized material tax benefits. Depending on the incentive at issue, we could also be required to modify our operational structure and tax strategy, which may not be as beneficial to us as the benefits provided under the present tax concession arrangements. Our interpretations and conclusions regarding the tax incentives are not binding on any taxing authority, and if our assumptions about tax and other laws are incorrect or if these tax incentives are substantially modified or rescinded we could suffer material adverse tax and other financial consequences, which would increase our expenses, reduce our profitability and adversely affect our cash flows.
The accumulation of changes in our shares by “5-percent stockholders” could trigger an ownership change for U.S. income tax purposes, in which case our ability to utilize our net operating losses would be limited and therefore impact our future tax benefits.
Cypress is a publicly traded company whose stockholders can change on a daily basis. These changes are beyond our control. The U.S. Internal Revenue Code (Section 382) restricts a company’s ability to benefit from net operating losses if a “Section 382 Ownership Change” occurs. An ownership change for purposes of U.S. tax law Section 382 may result from ownership changes that increase the aggregate ownership of “5-percent stockholders,” by more than 50 percentage points over a testing period, generally three years (“Section 382 Ownership Change”). We experienced a Section 382 Ownership Change upon the acquisition of Spansion. The resulting limitations accompanying the ownership change are reflected in our deferred tax assets with no permanent limitation in our ability to utilize our tax attributes.
Acquisition and investments could result in operating difficulties, dilution, and other harmful consequences that may adversely impact our business and results of operations.
Acquisitions are an important element of our overall corporate strategy and use of capital. These transactions could be material to our financial condition and results of operations. We expect to continue to evaluate and enter into discussions regarding a wide array of potential strategic transactions. The process of integrating an acquired company, business, or technology has created, and will continue to create, unforeseen operating difficulties and expenditures. The areas where we face risks include, but are not limited to:
|
|
· |
Diversion of management time and focus from operating our business to integration challenges; |
|
|
· |
Cultural challenges associated with integrating employees from the acquired company into our organization, and retention of employees from the businesses we acquire; |
|
|
· |
Successfully transitioning the current customer, supplier, foundry and other partnering relationships of the acquired company; |
|
|
· |
Implementation or remediation of controls, procedures, and policies at the acquired company; |
|
|
· |
Integration of the acquired company’s accounting, human resource, and other administrative systems, and coordination of product, engineering, and sales and marketing functions; |
|
|
· |
In the case of acquired companies with global operations, the need to integrate operations across different cultures and languages and to address the particular economic, currency, political, and regulatory risks associated with specific countries; |
|
|
· |
Failure to successfully further develop the acquired business or technology; |
|
|
· |
Liability for activities of the acquired company before the acquisition, including intellectual property infringement claims, violations of laws, commercial disputes, tax liabilities, and other known and unknown liabilities; and |
|
|
· |
Pending litigation or other known or unknown claims in connection with the acquired company, including claims by stockholders for breach of fiduciary duties, terminated employees, customers, former stockholders, or other third parties. |
Our failure to address these and other risks or other problems encountered in connection with our past or current acquisitions and investments could cause us to fail to realize the anticipated benefits of such acquisitions or investments, incur unanticipated liabilities, and harm our business generally. Current and future acquisitions could also result in dilutive issuances of our equity securities, the incurrence of debt, contingent liabilities, or amortization expenses, or write-offs of goodwill, any of which could harm our financial condition or results. As a result, the anticipated benefit of many of our acquisitions may not be realized.
27
We invest in companies for strategic reasons and may not realize a return on our investments.
We make investments in companies to further our strategic objectives and support our key business initiatives. Such investments include equity instruments of private companies, and many of these instruments are non-marketable at the time of our initial investment. These companies range from early-stage companies that are often still defining their strategic direction to more mature companies with established revenue streams and business models. The success of these companies is dependent on product development, market acceptance, operational efficiency, and other key business factors as well as their ability to secure additional funding, obtain favorable investment terms for future financings, or participate in liquidity events such as public offerings, mergers, and private sales. If any of these companies fail, we could lose all or part of our investment in that company. If we determine that other-than-temporary decline in the fair value exists for an equity investment in a company in which we have invested, we write down the investment to its fair value and recognize the related write-down as an investment loss.
When the strategic objectives of an investment have been achieved, or if the investment or business diverges from our strategic objectives, we may decide to dispose of the investment. We may incur losses on the disposal of our investments. Additionally, for cases in which we are required under equity method accounting to recognize a proportionate share of another company's income or loss, such income or loss may impact our earnings. Gains or losses from equity securities could vary from expectations depending on gains or losses realized on the sale or exchange of securities, gains or losses from equity method investments, and impairment charges for equity and other investments.
We may have fluctuations in the amount and frequency of our stock repurchases.
On October 20, 2015, our Board of Directors approved a new share repurchase plan pursuant to which we are authorized to repurchase our common stock in an aggregate amount not to exceed $450 million. Although our Board of Directors has approved a share repurchase program, the share repurchase program does not obligate us to repurchase any specific dollar amount or number of shares. The stock repurchase could affect the price of our stock and increase volatility and may be suspended or terminated at any time without prior notice and in compliance with legal and regulatory requirements, which may result in a decrease in the trading price of our common stock.
There can be no assurance we will continue to declare dividends and that our cash distributions on common stock will continue to be considered a return of capital.
In the second quarter of fiscal 2011, our Board of Directors adopted a policy pursuant to which the Company would pay quarterly cash distributions on our common stock. We intend to continue to pay such distributions subject to capital availability and periodic determinations by our Board of Directors that cash distributions are in the best interest of our shareholders and are in compliance with all laws and agreements of Cypress applicable to the declaration and payment of cash distributions. Based upon our lack of current earnings and profits, in the United States, prior to 2016, these distributions have been treated for income tax purposes as a return of capital.
Future distributions may be affected by, among other factors:
|
|
· |
our views on potential future capital requirements for investments in acquisitions and the funding of our research and development; |
|
|
· |
stock repurchase programs; |
|
|
· |
changes in federal and state income tax laws or corporate laws; |
|
|
· |
changes to our business model; and |
|
|
· |
debt payments. |
Our distribution payments may change from time to time, and we cannot provide assurance that we will continue to declare distributions in any particular amounts or at all. In addition, we cannot provide assurance that the cash distributions will continue to be treated for income tax purposes as a return of capital. A reduction in our distribution payments or a change in the tax treatment of future distributions could have a negative effect on our stock price.
28
If we are unable to obtain stockholder approval of additional shares for our share-based compensation award programs in the future, we could be at a competitive disadvantage in the marketplace for qualified personnel.
Our compensation program, which includes cash and share-based compensation award components, has been instrumental in attracting, hiring, motivating, and retaining qualified personnel. Competition for qualified personnel in our industry is extremely intense, particularly for engineering and other technical personnel. Our success depends on our continued ability to attract, hire, motivate, and retain qualified personnel and our share-based compensation award programs provide us with a competitive compensatory tool for this purpose. The continued use of our share-based compensation program is necessary for us to compete for engineering and other technical personnel and professional talent. In the future, if we are unable to obtain stockholder approval of additional shares for our share-based compensation award programs, we could be at a competitive disadvantage in the marketplace for qualified personnel.
None.
Our executive offices are located in San Jose, California. The following tables summarize our primary properties as of the end of fiscal 2015:
|
Location |
|
Square Footage |
|
Primary Use |
|
Owned: |
|
|
|
|
|
United States : |
|
|
|
|
|
Bloomington, Minnesota |
|
337,000 |
|
Manufacturing, research and development |
|
San Jose, California |
|
171,000 |
|
Administrative offices, research and development |
|
Austin, Texas |
|
1,514,000 |
|
Manufacturing, research and development and administrative offices |
|
Colorado Springs, Colorado |
|
70,400 |
|
Administrative offices, research and development |
|
Lynnwood, Washington |
|
67,000 |
|
Administrative offices, research and development |
|
Asia : |
|
|
|
|
|
Cavite, Philippines |
|
253,000 |
|
Manufacturing, research and development |
|
Bangkok |
|
253,000 |
|
Manufacturing, research and development |
|
Penang, Malaysia |
|
175,000 |
|
Manufacturing, research and development and administrative offices |
We have an additional 760,000 square feet of leased space for research and development, administrative, sales offices and design centers located in the United States, Asia and Europe. We believe that our current properties are suitable and adequate for our foreseeable needs. We may need to exit facilities as we continue to evaluate our business model and cost structure.
Information with respect to this item may be found in Note 19 of Notes to Consolidated Financial Statements under Item 8, which is incorporated herein by reference.
Not applicable.
29
|
ITEM 5. |
MARKET FOR REGISTRANT’S COMMON EQUITY, RELATED STOCKHOLDER MATTERS AND ISSUER PURCHASES OF EQUITY SECURITIES |
Market Information, Holders of Common Equity, Dividends and Performance Graph
On November 12, 2009, our common stock was listed on the NASDAQ Global Select Market under the trading symbol “CY.” Prior to November 12, 2009, our common stock was listed on the New York Stock Exchange. The following table sets forth the high and low per share prices for our common stock:
|
|
|
Low |
|
|
High |
|
||
|
Fiscal 2015: |
|
|
|
|
|
|
|
|
|
Fourth quarter |
|
$ |
8.11 |
|
|
$ |
10.96 |
|
|
Third quarter |
|
$ |
8.55 |
|
|
$ |
12.46 |
|
|
Second quarter |
|
$ |
11.65 |
|
|
$ |
14.46 |
|
|
First quarter |
|
$ |
13.39 |
|
|
$ |
16.25 |
|
|
Fiscal 2014: |
|
|
|
|
|
|
|
|
|
Fourth quarter |
|
$ |
14.42 |
|
|
$ |
14.68 |
|
|
Third quarter |
|
$ |
9.96 |
|
|
$ |
10.23 |
|
|
Second quarter |
|
$ |
10.42 |
|
|
$ |
10.66 |
|
|
First quarter |
|
$ |
10.00 |
|
|
$ |
10.27 |
|
|
Fiscal 2013: |
|
|
|
|
|
|
|
|
|
Fourth quarter |
|
$ |
8.97 |
|
|
$ |
10.34 |
|
|
Third quarter |
|
$ |
9.05 |
|
|
$ |
13.10 |
|
|
Second quarter |
|
$ |
9.60 |
|
|
$ |
11.55 |
|
|
First quarter |
|
$ |
9.84 |
|
|
$ |
11.37 |
|
As of February 26, 2016, there were approximately 1,550 registered holders of record of our common stock.
Dividends
During fiscal 2015, we paid dividends of $128.0 million, at a rate of $0.11 per share of common stock paid in each quarter of the fiscal year.
During fiscal 2014, we paid dividends of $69.2 million, at a rate of $0.11 per share of common stock paid in each quarter of the fiscal year.
During fiscal 2013, we paid dividends of $64.8 million, at a rate of $0.11 per share of common stock paid in each quarter of the fiscal year.
30
The following line graph compares the yearly percentage change in the cumulative total stockholder return on our common stock against the cumulative total return of the Standard and Poor (“S&P”) 500 Index and the S&P Semiconductors Index for the last five fiscal years:
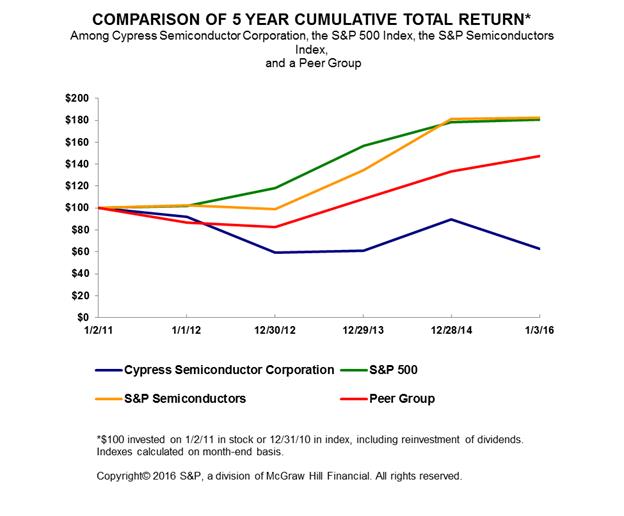
*$100 invested on 1/2/11 in stock or 12/31/10 in index, including reinvestment of dividends.
Indexes calculated on month-end basis. Indexes calculated on month-end basis.
|
|
January 1, 2012 |
December 30, 2012 |
December 29, 2013 |
December 28, 2014 |
January 3, 2016 |
|
Cypress** |
91.88 |
59.52 |
60.86 |
89.78 |
62.70 |
|
S&P 500 Index |
102.11 |
118.45 |
156.82 |
178.29 |
180.75 |
|
S&P Semiconductors Index |
102.24 |
98.75 |
134.24 |
181.05 |
182.64 |
|
Peer Group |
86.90 |
82.79 |
108.54 |
133.55 |
147.18 |
|
** |
All closing prices underlying this table have been adjusted for cash dividends, stock splits and stock dividends. |
31
Securities Authorized for Issuance under Equity Compensation Plans
Equity Compensation Plan Information:
The following table summarizes certain information with respect to our common stock that may be issued under the existing equity compensation plans as of January 3, 2016:
|
Plan Category |
Number of Securities to be Issued Upon Exercise of Outstanding Options, Warrants and Rights (a) |
|
|
|
Weighted-Average Exercise Price of Outstanding Options, Warrants and Rights (b) |
|
|
|
Number of Securities Remaining Available for Future Issuance Under Equity Compensation Plans (Excluding Securities Reflected in Column (a)) (c) |
|
|
|||
|
|
(In millions, except per-share amounts) |
|
|
|||||||||||
|
Equity compensation plans approved by shareholders |
|
16.8 |
|
(1) |
|
$ |
10.4 |
|
(3) |
|
|
26.7 |
|
(6) |
|
Equity compensation plans not approved by shareholders |
|
11.1 |
|
(2) |
|
$ |
5.6 |
|
(4) |
|
|
10.1 |
|
(7) |
|
Total |
|
27.9 |
|
|
|
$ |
7.99 |
|
(5) |
|
|
36.8 |
|
|
|
(1) |
Includes 8.3 million shares of full value awards (restricted stock units, restricted stock awards and performance stock units) |
|
(2) |
Includes 2.7 million shares of full value awards (restricted stock units, restricted stock awards and performance stock units) |
|
(3) |
Excludes the impact of 8.3 million shares of full value awards (restricted stock units, restricted stock awards and performance stock units) which have no exercise price. |
|
(4) |
Excludes the impact of 2.7 million shares of full value awards (restricted stock units, restricted stock awards and performance stock units) which have no exercise price. |
|
(5) |
Excludes the impact of 11.1 million shares of full value awards (restricted stock units, restricted stock awards and performance stock units) which have no exercise price. |
|
(6) |
Includes 25 million shares available for future issuance under Cypress’s 2013 Stock Plan and 1.7 million shares available for future issuance under Cypress’s Employee Stock Purchase Plan. |
|
(7) |
Includes two thousand shares available for future issuance under the assumed Ramtron Plan and 10.1 million shares available for future issuance under the assumed Spansion Plan. |
See Note 8 of Notes to Consolidated Financial Statements under Item 8 for further discussion of Cypress’s stock plans.
Recent Sales of Unregistered Securities
None.
Purchases of Equity Securities by the Issuer and Affiliated Purchasers
Stock Buyback Programs:
Approval of a New $450 Million Stock Buyback Program
On October 20, 2015, our Board of Directors (the “Board”) approved a new share repurchase plan pursuant to which we are authorized to repurchase our common stock in an aggregate amount not to exceed $450 million. In connection with the approval of the new share repurchase plan, the share repurchase plan previously approved in September 2011 was terminated. The new share repurchase plan may be funded all or in part by term loans under the Amended Credit Facility. The share repurchase program does not obligate us to repurchase any specific number of shares and may be suspended or terminated at any time without prior notice and in compliance with legal and regulatory requirements.
32
The table below sets forth information with respect to repurchases of our common stock made during fiscal 2013, 2014 and 2015 under these programs:
|
|
|
Total Number of Shares Purchased |
|
|
Average Price Paid per Share |
|
|
Total Number of Shares Purchased as Part of Publicly Announced Programs |
|
|
Total Dollar Value of Shares That May Yet Be Purchase Under the Plans or Programs |
|
||||
|
|
|
(In thousands, except per-share amounts) |
|
|||||||||||||
|
Authorized fund under 2011 Repurchase program: |
|
|
— |
|
|
$ |
— |
|
|
|
— |
|
|
$ |
400,000 |
|
|
Repurchases in fiscal 2013: |
|
|
|
|
|
|
|
|
|
|
|
|
|
|
|
|
|
December 31, 2012—March 31, 2013 |
|
|
411 |
|
|
$ |
10.49 |
|
|
|
411 |
|
|
$ |
84,059 |
|
|
April 1, 2013—June 30, 2013 |
|
|
10 |
|
|
$ |
10.71 |
|
|
|
10 |
|
|
$ |
83,952 |
|
|
July 1, 2013—September 29, 2013 |
|
|
9 |
|
|
$ |
11.41 |
|
|
|
9 |
|
|
$ |
83,856 |
|
|
September 30, 2013—December 29, 2013 |
|
|
23 |
|
|
$ |
9.46 |
|
|
|
23 |
|
|
$ |
83,675 |
|
|
Total repurchases in fiscal 2013 |
|
|
453 |
|
|
|
|
|
|
|
453 |
|
|
$ |
83,675 |
|
|
Repurchases in fiscal 2014: |
|
|
|
|
|
|
|
|
|
|
|
|
|
|
|
|
|
December 30, 2013—March 30, 2014 |
|
|
18 |
|
|
$ |
10.23 |
|
|
|
18 |
|
|
$ |
83,490 |
|
|
March 31, 2014—June 29, 2014 |
|
|
7 |
|
|
$ |
9.72 |
|
|
|
7 |
|
|
$ |
83,425 |
|
|
June 30, 2014—September 28, 2014 |
|
|
3 |
|
|
$ |
10.53 |
|
|
|
3 |
|
|
$ |
83,398 |
|
|
September 29, 2014—December 28, 2014 |
|
|
5 |
|
|
$ |
10.27 |
|
|
|
5 |
|
|
$ |
83,341 |
|
|
Total repurchases in fiscal 2014 |
|
|
33 |
|
|
|
|
|
|
|
33 |
|
|
$ |
83,341 |
|
|
Repurchases in fiscal 2015: |
|
|
|
|
|
|
|
|
|
|
|
|
|
|
|
|
|
December 29, 2014—March 29, 2015 |
|
|
6 |
|
|
$ |
14.66 |
|
|
|
6 |
|
|
$ |
83,252 |
|
|
March 30, 2015—June 28, 2015 |
|
|
818 |
|
|
$ |
12.75 |
|
|
|
818 |
|
|
$ |
72,672 |
|
|
June 29, 2015—September 27, 2015 |
|
|
2 |
|
|
$ |
10.62 |
|
|
|
2 |
|
|
$ |
72,648 |
|
|
Total repurchases in fiscal 2015 |
|
|
826 |
|
|
|
|
|
|
|
826 |
|
|
$ |
72,648 |
|
|
Total repurchases under this program |
|
|
1,312 |
|
|
|
|
|
|
|
1,312 |
|
|
|
|
|
|
Authorized fund under 2015 Repurchase program: |
|
|
|
|
|
|
|
|
|
|
|
|
|
$ |
450,000 |
|
|
September 28, 2015—January 3, 2016 |
|
|
5,658 |
|
|
$ |
9.99 |
|
|
|
5,658 |
|
|
$ |
393,475 |
|
|
Total repurchases in fiscal 2015 |
|
|
5,658 |
|
|
|
|
|
|
|
5,658 |
|
|
$ |
393,475 |
|
|
Total repurchases under this program |
|
|
5,658 |
|
|
|
|
|
|
|
5,658 |
|
|
|
|
|
Yield Enhancement Program (“YEP”):
In fiscal 2009, the Audit Committee approved a yield enhancement strategy intended to improve the yield on our available cash. As part of this program, the Audit Committee authorized us to enter into short-term yield enhanced structured agreements, typically with maturities of 90 days or less, correlated to our stock price. Under the agreements we have entered into to date, we pay a fixed sum of cash upon execution of an agreement in exchange for the financial institution’s obligations to pay either a pre-determined amount of cash or shares of our common stock depending on the closing market price of our common stock on the expiration date of the agreement. Upon expiration of each agreement, if the closing market price of our common stock is above the pre-determined price, we will have our cash investment returned plus a yield substantially above the yield currently available for short-term cash investments. If the closing market price is at or below the pre-determined price, we will receive the number of shares specified at the agreement’s inception. As the outcome of these arrangements is based entirely on our stock price and does not require us to deliver either shares or cash, other than the original investment, the entire transaction is recorded in equity. The shares received upon the maturing of a yield enhancement structure are included in our “shares of common stock held in treasury” in the Consolidated Balance Sheets under Item 8.
We have entered into various yield enhanced structured agreements based upon a comparison of the yields available in the financial markets for similar maturities against the expected yield to be realized per the structured agreement and the related risks associated with this type of arrangement. We believe the risk associated with these types of agreements is no different than alternative investments available to us with equivalent counterparty credit ratings. All counterparties to a yield enhancement program have a credit rating of at least Aa2 or A as rated by major independent rating agencies. For all such agreements that matured to date, the yields of the structured agreements were far superior to the yields available in the financial markets primarily due to the volatility of our stock price and the pre-payment aspect of the agreements. The counterparty is willing to pay a premium over the yields available in the financial markets due to the structure of the agreement.
33
The following table summarizes the activity of our settled yield enhanced structured agreements during fiscal 2015 and 2014:
|
Periods |
|
Aggregate Price Paid |
|
|
Total Cash Proceeds Received Upon Maturity |
|
|
Yield Realized |
|
|
Total Number of Shares Received Upon Maturity |
|
|
Average Price Paid per Share |
|
|||||
|
Fiscal 2015: |
|
(in thousands) |
|
|
|
|
|
|
|
|
|
|||||||||
|
Settled through cash proceeds |
|
$ |
28,966 |
|
|
$ |
29,353 |
|
|
$ |
387 |
|
|
|
— |
|
|
$ |
— |
|
|
Settled through issuance of common stock |
|
|
9,601 |
|
|
|
— |
|
|
|
— |
|
|
|
1,000,000 |
|
|
$ |
9.60 |
|
|
Total for fiscal 2015 |
|
$ |
38,567 |
|
|
$ |
29,353 |
|
|
$ |
387 |
|
|
|
1,000,000 |
|
|
|
9.60 |
|
|
|
|
|
|
|
|
|
|
|
|
|
|
|
|
|
|
|
|
|
|
|
|
Fiscal 2014: |
|
|
|
|
|
|
|
|
|
|
|
|
|
|
|
|
|
|
|
|
|
Settled through cash proceeds |
|
$ |
19,415 |
|
|
$ |
19,733 |
|
|
$ |
318 |
|
|
|
— |
|
|
$ |
— |
|
|
Settled through issuance of common stock |
|
|
— |
|
|
|
— |
|
|
|
— |
|
|
|
— |
|
|
|
— |
|
|
Total for fiscal 2014 |
|
$ |
19,415 |
|
|
$ |
19,733 |
|
|
$ |
318 |
|
|
|
— |
|
|
$ |
— |
|
There was no activity of our yield enhanced structured agreements during fiscal 2013.
34
The following selected consolidated financial data is not necessarily indicative of results of future operations, and should be read in conjunction with Management’s Discussion and Analysis of Financial Condition and Results of Operations under Item 7, and the Consolidated Financial Statements and Notes to Consolidated Financial Statements under Item 8:
|
|
|
Year Ended |
|
|||||||||||||||||
|
|
|
January 3, 2016 (2) |
|
|
December 28, 2014 (2) |
|
|
December 29, 2013 |
|
|
December 30, 2012 |
|
|
January 1, 2012 |
|
|||||
|
|
|
|
|
|
|
(In thousands, except per-share amounts) |
|
|||||||||||||
|
Consolidated Statement of Operations Data: |
|
|
|
|
|
|
|
|
|
|
|
|
|
|
|
|
|
|
|
|
|
Revenues |
|
$ |
1,607,853 |
|
|
$ |
725,497 |
|
|
$ |
722,693 |
|
|
$ |
769,687 |
|
|
$ |
995,204 |
|
|
Cost of revenues |
|
$ |
1,207,850 |
|
|
$ |
361,820 |
|
|
$ |
384,121 |
|
|
$ |
376,887 |
|
|
$ |
448,602 |
|
|
Operating income (loss) |
|
$ |
(336,905 |
) |
|
$ |
22,873 |
|
|
$ |
(58,195 |
) |
|
$ |
(18,915 |
) |
|
$ |
153,719 |
|
|
Income (loss) attributable to Cypress (3) |
|
$ |
(378,867 |
) |
|
$ |
17,936 |
|
|
$ |
(48,242 |
) |
|
$ |
(23,444 |
) |
|
$ |
167,839 |
|
|
Noncontrolling interest, net of income taxes |
|
$ |
(2,271 |
) |
|
$ |
(1,418 |
) |
|
$ |
(1,845 |
) |
|
$ |
(1,614 |
) |
|
$ |
(882 |
) |
|
Net income (loss) (3) |
|
$ |
(381,138 |
) |
|
$ |
16,518 |
|
|
$ |
(50,087 |
) |
|
$ |
(25,058 |
) |
|
$ |
166,957 |
|
|
Adjust for net loss (income) attributable to noncontrolling interest |
|
$ |
2,271 |
|
|
$ |
1,418 |
|
|
$ |
1,845 |
|
|
$ |
1,614 |
|
|
$ |
882 |
|
|
Net income (loss) attributable to Cypress |
|
$ |
(378,867 |
) |
|
$ |
17,936 |
|
|
$ |
(48,242 |
) |
|
$ |
(23,444 |
) |
|
$ |
167,839 |
|
|
Net income (loss) per share—basic: |
|
|
|
|
|
|
|
|
|
|
|
|
|
|
|
|
|
|
|
|
|
attributable to Cypress |
|
$ |
(1.25 |
) |
|
$ |
0.11 |
|
|
$ |
(0.32 |
) |
|
$ |
(0.16 |
) |
|
$ |
1.02 |
|
|
Net income (loss) per share—basic |
|
$ |
(1.25 |
) |
|
$ |
0.11 |
|
|
$ |
(0.32 |
) |
|
$ |
(0.16 |
) |
|
$ |
1.02 |
|
|
Net income (loss) per share—diluted: |
|
|
|
|
|
|
|
|
|
|
|
|
|
|
|
|
|
|
|
|
|
attributable to Cypress |
|
$ |
(1.25 |
) |
|
$ |
0.11 |
|
|
$ |
(0.32 |
) |
|
$ |
(0.16 |
) |
|
$ |
0.90 |
|
|
Net income (loss) per share—diluted |
|
$ |
(1.25 |
) |
|
$ |
0.11 |
|
|
$ |
(0.32 |
) |
|
$ |
(0.16 |
) |
|
$ |
0.90 |
|
|
Dividends per share: |
|
|
|
|
|
|
|
|
|
|
|
|
|
|
|
|
|
|
|
|
|
Declared |
|
$ |
0.44 |
|
|
$ |
0.44 |
|
|
$ |
0.44 |
|
|
$ |
0.44 |
|
|
$ |
0.27 |
|
|
Paid |
|
$ |
0.44 |
|
|
$ |
0.44 |
|
|
$ |
0.44 |
|
|
$ |
0.42 |
|
|
$ |
0.18 |
|
|
Shares used in per-share calculation: |
|
|
|
|
|
|
|
|
|
|
|
|
|
|
|
|
|
|
|
|
|
Basic |
|
|
302,036 |
|
|
|
159,031 |
|
|
|
148,558 |
|
|
|
149,266 |
|
|
|
164,495 |
|
|
Diluted |
|
|
302,036 |
|
|
|
169,122 |
|
|
|
148,558 |
|
|
|
149,266 |
|
|
|
186,895 |
|
|
|
|
As of |
|
|||||||||||||||||
|
|
|
January 3, 2016 |
|
|
December 28, 2014 |
|
|
December 29, 2013 |
|
|
December 30, 2012 |
|
|
January 1, 2012 |
|
|||||
|
|
|
|
|
|
|
(In thousands) |
|
|||||||||||||
|
Consolidated Balance Sheet Data: |
|
|
|
|
|
|
|
|
|
|
|
|
|
|
|
|
|
|
|
|
|
Cash, cash equivalents and short-term investments |
|
$ |
227,561 |
|
|
$ |
118,812 |
|
|
$ |
104,462 |
|
|
$ |
117,210 |
|
|
$ |
166,330 |
|
|
Working capital (3) |
|
$ |
322,376 |
|
|
$ |
37,479 |
|
|
$ |
13,871 |
|
|
$ |
20,060 |
|
|
$ |
79,190 |
|
|
Total assets (3) |
|
$ |
4,004,261 |
|
|
$ |
743,281 |
|
|
$ |
762,884 |
|
|
$ |
830,554 |
|
|
$ |
810,090 |
|
|
Debt (1) |
|
$ |
688,265 |
|
|
$ |
243,250 |
|
|
$ |
248,230 |
|
|
$ |
264,942 |
|
|
$ |
45,767 |
|
|
Stockholders’ equity (3) |
|
$ |
2,712,685 |
|
|
$ |
201,865 |
|
|
$ |
175,683 |
|
|
$ |
175,786 |
|
|
$ |
397,842 |
|
|
(1) |
The debt in fiscal year 2015 primarily included $449.0 million related to our Senior Secured Revolving Credit Facility, $150 million of 2% Senior Exchange notes assumed from Spansion, $97.2 million Term Loan A, net of costs, $7.2 million of capital leases and $3.0 million of equipment loans. The debt in fiscal year 2014 primarily included $227.0 million related to our revolving credit facility, $10.3 million of capital leases, and $5.9 million of equipment loans. The debt in fiscal year 2013 primarily included $227.0 million related to our revolving credit facility, $12.5 million of capital leases, and $8.7 million of equipment loans. The debt in fiscal year 2012 included $232.0 million related to our revolving credit facility, $15.0 million of capital leases, $11.5 million of equipment loans, $3.3 million of a mortgage note related to Ramtron, and $3.1 million of advances received for the sale of certain of our auction rate securities. See Note 14 for more information on revolving credit facility, equipment loans and mortgage note and Note 19 for more information on capital leases. |
|
(2) |
During the fourth quarter of fiscal 2014, the Company changed from recognizing revenue for sales to certain distributors at the time of shipment, as compared to when resold by the distributor to the end customer, as it determined it could reliably estimate returns and pricing concessions on certain product families and with certain distributors. This change increased fiscal 2014 revenues by $12.3 million, net income by $6.2 million and net income per share, basic and diluted, by $0.04. The change increased 2015 revenue by $40.9 million and decreased net loss by $25 million and net income per share, basic and diluted, by $0.07. See additional disclosures on this change in revenue recognition in Footnote 1 to the consolidated financial statements. |
35
The Management’s Discussion and Analysis of Financial Condition and Results of Operations contain forward-looking statements within the meaning of Section 27A of the Securities Act of 1933, as amended, and Section 21E of the Securities Exchange Act of 1934, as amended that involve risks and uncertainties, which are discussed under Item 1A.
EXECUTIVE SUMMARY
General
Cypress Semiconductor Corporation (“Cypress”) delivers high-performance, high-quality solutions at the heart of today’s most advanced embedded systems, from automotive, industrial and networking platforms to highly interactive consumer and mobile devices. With a broad, differentiated product portfolio that includes NOR flash memories, F-RAM™ and SRAM, Traveo™ microcontrollers, the industry’s only PSoC® programmable system-on-chip solutions, analog and PMIC Power Management ICs, CapSense® capacitive touch-sensing controllers, and Wireless BLE Bluetooth Low-Energy and USB connectivity solutions, Cypress is committed to providing its customers worldwide with consistent innovation, best-in-class support and exceptional system value.
Merger with Spansion
On March 12, 2015, we completed the merger (“Merger”) with Spansion Inc. (“Spansion”) pursuant to the Agreement and Plan of Merger and Reorganization, as of December 1, 2014 (the “Merger Agreement”), for a total consideration of approximately $2.8 billion. In accordance with the terms of the Merger Agreement, Spansion shareholders received 2.457 Cypress shares for each Spansion share they owned. The Merger has been accounted for under the acquisition method of accounting in accordance with Financial Accounting Standards Board Accounting Standard Topic 805, Business Combinations, with Cypress treated as the accounting acquirer. The post-Merger company is expected to realize more than $160 million in cost synergies on an annualized basis within two years, and create a leading global provider of microcontrollers and specialized memories needed in today's embedded systems.
The following Management’s Discussion and Analysis of Financial Condition and Results of Operations includes the financial results of legacy Spansion beginning March 12, 2015. The comparability of our operating results for the year ended January 3, 2016 to the same period in fiscal 2014 is significantly impacted by our Merger. In our discussion and analysis of comparative periods, we have quantified the contribution of additional revenue or expense resulting from this transaction wherever such amounts were material and identifiable. While identified amounts may provide indications of general trends, the analysis cannot completely address the effects attributable to integration efforts.
Divestiture of TrueTouch® Business
On August 1, 2015, we completed the sale of the TrueTouch® mobile touchscreen business, which is a business unit within our Programmable Systems Division, to Parade Technologies (“Parade”) for total cash proceeds of $98.6 million pursuant to the definitive agreement signed on June 11, 2015. Of the total cash proceeds, $10.0 million are held in an escrow account until January 2017 subject to any indemnity claims on post-closing adjustments, per the terms of the agreement. Post-sale, Cypress will continue to provide TrueTouch® solutions to its automotive, industrial and home appliance customers and to its mobile customers. In connection with the transaction, we sold certain assets associated with the disposed business mostly consisting of inventory with a net book value of $10.5 million and recognized a gain of $66.5 million in the third fiscal quarter of fiscal 2015. This gain has been presented as a separate line item “Gain on divestiture of TrueTouch® mobile business” in the Consolidated Statements of Operations.
Also in connection with the transaction, we entered into a Manufacturing Service Agreement (MSA) in which we agreed to sell finished wafers and devices to Parade during the one-year period following the close of the transaction. The terms of the MSA indicated that we would sell finished products to Parade at agreed-upon prices that were considered below fair market value, indicating that there was an embedded fair value that would be realized by Parade through those terms. Accordingly, we have allocated $19.9 million from the $98.6 million proceeds to the fair value of the MSA based on the forecasted wafer sales to Parade for the subsequent one-year period. Such amount was deferred on our consolidated balance sheet initially and is being amortized to revenue as we sell products to Parade. During the year ended January 3, 2016, we recognized $5.7 million of revenue from amortization of such deferred revenue.
36
As of the end of fiscal 2015, our organization included the following business segments:
|
Business Segments |
|
Description |
|
|
|
|
|
PSD: Programmable Systems Division |
|
PSD focuses on high-performance, programmable solutions. The programmable portfolio includes high-performance Traveo™ automotive microcontrollers, PSoC® programmable system-on-chip products, ARM® Cortex®-M4, -M3, -M0+ microcontrollers and R4 CPUs, analog PMIC Power Management ICs, CapSense® capacitive-sensing controllers, TrueTouch® touchscreen and fingerprint reader products, and PSoC Bluetooth Low Energy solutions for the IoT. PSD added Spansion’s microcontroller and analog products starting March 12, 2015. |
|
|
|
|
|
MPD: Memory Products Division |
|
MPD focuses on high-performance parallel and serial NOR flash memories, NAND flash memories, static random access memory (SRAM), and high-reliability F-RAM™ ferroelectric memory devices. Its purpose is to enhance our position in these products and invent new products and derivatives. MPD added Spansion’s Flash memory products starting March 12, 2015. |
|
|
|
|
|
DCD: Data Communications Division |
|
DCD focuses on USB controllers, Bluetooth® Low Energy solutions that leverage Cypress’s PRoC™ programmable radio-on-chip technology, WirelessUSB™ solutions, module solutions such as trackpads and Bluetooth Low Energy modules, and controllers for the new USB Type-C standard, which enables data transmission and power delivery over a single cable with a slimmer plug. DCD focuses primarily on industrial, handset and consumer electronics markets and applications. |
|
|
|
|
|
ETD: Emerging Technologies Division |
|
Also known as our “startup” division, ETD includes subsidiaries AgigA Tech Inc. and Deca Technologies Inc., as well as our foundry business and other development-stage activities. |
Our primary focus is profitable growth in our key markets. With the addition of the legacy Spansion business, we plan to capitalize on our expanded product portfolio and leadership positions in embedded processing and specialized memories to significantly extend our penetration of global markets such as automotive, industrial, communications, consumer, computation, data communications, mobile handsets and military. Our revenue model is based on the following product and market strategies: (a) increasing market share in our memory products by leveraging our market position and expanding our portfolio with new and complementary products, (b) growing revenue from our high-performance, programmable solutions and derivatives including PSoC programmable system-on-chip products and microcontrollers in the automotive and industrial markets, (c) increasing our DCD revenue through the introduction of new products such as USB Type-C solutions, SuperSpeed USB 3.0 peripheral controllers and Bluetooth® Low Energy solutions that leverage Cypress’s PRoC™ programmable radio-on-chip technology for the IoT and other applications, and (d) revenue growth from ETD, which includes our internal startup companies. For profitability, our focus is to integrate the acquired Spansion business successfully and realize the anticipated product cost and operational cost synergies. Our integration effort includes the re-focusing of portions of legacy Spansion business to higher-margin opportunities, particularly in the Flash memory business. We monitor our operating expenses closely to improve our operating leverage as driven by various company-wide initiatives, including our World Class Cost program to continuously reduce cost line items as well as a Human Resources effort to reduce redundancy and improve efficiency across the company.
In order to achieve our goals on revenue growth and profitability, Cypress will continue to pursue the following strategies:
|
|
· |
Successfully integrate our business with Spansion. We are committed to integrating the business of Cypress and Spansion successfully to realize the anticipated cost synergies and improve the bottom line. |
|
|
· |
Cross-sell products from Cypress’s expanded product portfolio in the wake of the Spansion Merger. We will continue to take advantage of product and business synergies and grow our top-line revenue. |
|
|
· |
Focus on large and growing markets. We will continue to pursue business opportunities in large and growing markets, particularly the automotive and industrial markets. |
|
|
· |
Drive profitability. Cypress has implemented and maintained a tight, corporate wide focus on gross margin and operating expenses. We are committed to maintaining our current strong operating expense management without compromising our new product development and investments in our Emerging Technologies Division. |
|
|
· |
Drive programmable technologies, extend our leadership in programmable products and drive PSoC and microcontroller proliferation. We will continue to define, design and develop new programmable products and solutions that offer our customers increased flexibility and efficiency, higher performance, and higher levels of integration with a focus on analog functionality. We will continue to drive PSoC and microcontroller adoption in our key market segments. |
37
|
|
· |
Collaborate with customers to build system-level solutions. We work closely with our customers from initial product design through manufacturing and delivery to optimize their design efforts, help them achieve product differentiation, improve their time-to-market and help them to develop whole product solutions. |
|
|
· |
Leverage flexible manufacturing. Our manufacturing strategy combines capacity from leading foundries with output from our internal manufacturing facilities. This enables us to meet rapid swings in customer demand while reducing the burden of high fixed costs. |
|
|
· |
Identify and exit legacy or non-strategic, underperforming businesses. We will continue to monitor and, if necessary, to exit certain business units that are inconsistent with our future initiatives and long-term financial plans so that we can focus our resources and efforts on our core programmable and proprietary business model. The sale of our TrueTouch® mobile touchscreen business to Parade Technologies, Ltd. during the third quarter of 2015 is an example of this business strategy. |
|
|
· |
Pursue complementary strategic relationships. We will continue to assess opportunities to develop strategic relationships through acquisitions, investments, licensing and joint development projects. We also will continue to make significant investments in current ventures as well as new ventures. |
As we continue to implement our strategies, there are many internal and external factors that could impact our ability to meet any or all of our objectives. Some of these factors are discussed under Item 1A.
Manufacturing Strategy
Our core manufacturing strategy—”flexible manufacturing”—combines capacity from foundries with output from our internal manufacturing facilities. This strategy is intended to allow us to meet rapid swings in customer demand while lessening the burden of high fixed costs, a capability that is particularly important in high-volume consumer markets that we serve with our leading programmable product portfolio.
RESULTS OF OPERATIONS
Revenues
Our total revenues increased by $882.4 million or 121.6% to $1,607.9 million for the year ended January 3, 2016 compared to the prior year. For the year ended January 3, 2016, $962.3 million of the increase was attributable to revenue contributions from the acquired Spansion business which is included in the PSD and MPD divisions. The overall increase was partially offset by decrease in revenue from TrueTouch® mobile business as a result of divestiture of the business on August 1, 2015. The overall average selling price of our products, including Spansion products, for the year ended January 3, 2016 was $1.09. Excluding Spansion products, our ASP for the year ended January 3, 2016 was $1.14, which increased by $0.05 compared with the same period in the prior year.
The Company operates on a 52 or 53 week year ending on the Sunday nearest to December 31. Fiscal 2014 and 2013 were each 52 weeks and fiscal 2015 was a 53-week year, with the extra week in the fourth fiscal quarter. The additional week in 2015 did not materially affect the Company's results of operations or financial position.
We have experienced, and expect to continue to experience, moderate pricing pressure in certain product lines, primarily due to competitive conditions. We have in the past been able to, and expect in the future to be able to, moderate average selling price declines in our product lines by introducing new products with more features and higher prices. We may be unable to maintain average selling prices for our products as a result of increased pricing pressure in the future, which could adversely affect our operating results.
Consistent with our accounting policies and generally accepted accounting principles, we have historically recognized a significant portion of revenue through distributors at the time the distributor resold the product to its end customer (also referred to as the sell-through basis of revenue recognition) given the difficulty in estimating the ultimate price of these product shipments and amount of potential returns. We continually reassess our ability to reliably estimate the ultimate price of these products and, over the past several years, we have made investments in our systems and processes around our distribution channel to improve the quality of the information we receive from our distributors. Given these ongoing investments, and based on the financial framework we use for estimating potential price adjustments, beginning in the fourth quarter of 2014, we concluded that we have become able to reasonably estimate returns and pricing concessions on certain product families and with certain distributors, and recognized revenue at the time we shipped these specific products to the identified distributors, less our estimate of future price adjustments and returns. During the year ended January 3, 2016, we recognized an incremental $40.9 million of revenue on additional product families for which revenue was previously recognized on a sell-through basis as we determined that we could reasonably estimate returns and pricing concessions at the time of shipment to distributors. This change resulted in a decrease to the net loss of $25.0 million for the year ended January 3, 2016 or $0.07 per basic and diluted share.
38
The following table summarizes our consolidated revenues by segments:
|
|
|
Year Ended |
|
|||||||||
|
|
|
January 3, 2016 |
|
|
December 28, 2014 |
|
|
December 29, 2013 |
|
|||
|
|
|
|
|
|
|
(In thousands) |
|
|
|
|
|
|
|
Programmable Systems Division |
|
$ |
613,884 |
|
|
$ |
283,206 |
|
|
$ |
292,707 |
|
|
Memory Products Division |
|
|
871,640 |
|
|
|
347,887 |
|
|
|
338,986 |
|
|
Data Communications Division |
|
|
72,791 |
|
|
|
70,378 |
|
|
|
79,410 |
|
|
Emerging Technologies and Other |
|
|
49,538 |
|
|
|
24,026 |
|
|
|
11,590 |
|
|
Total revenues |
|
$ |
1,607,853 |
|
|
$ |
725,497 |
|
|
$ |
722,693 |
|
Programmable Systems Division:
Revenues from the Programmable Systems Division in fiscal 2015 increased by $330.7 million or 116.8% compared to fiscal 2014. The increase in fiscal 2015 was primarily due to the $402.3 million of revenue contribution from the Spansion microcontroller and analog business for fiscal 2015. Excluding the impact of Spansion revenues, PSD decreased by $71.6 million for fiscal 2015, or 25.3%, compared to the prior year primarily due to weakness in our end customers’ handset/mobile business demand, decrease in revenue from TrueTouch® mobile business as a result of divestiture of the business on August 1, 2015 and incremental revenue in fiscal 2014 as a result of the change in accounting for certain distributor revenues. The decrease was partially offset by an increase in sales of PSD products to the automotive applications, where we experienced a ramp in volume from recent design wins.
Revenues from the Programmable Systems Division in fiscal 2014 decreased by $9.5 million or 3.2% compared to fiscal 2013. The revenue decrease in fiscal 2014 was primarily attributable to declines in sales of our TrueTouch® touchscreen products due to a decrease in revenue from our handset customers and lower average selling prices. The decrease was partially offset by an increase in sales of PSD products to industrial and automotive customers where we experienced a ramp in volume from new design wins. Fiscal 2014 revenue also included $8.2 million of incremental revenue as a result of the change in accounting for certain distributor revenues as discussed above.
Memory Products Division:
Revenues from the Memory Products Division increased in fiscal 2015 by $523.8 million or 150.6% compared to fiscal 2014. The increase was primarily due to $560.0 million of revenue contribution from the Spansion flash memory business for fiscal 2015. Excluding the impact of Spansion revenues, MPD decreased by $36.2 million or 10.4% in fiscal 2015 compared to the prior year primarily driven by sales decrease in the communication market segment.
Revenues from the Memory Products Division in fiscal 2014 increased by $8.9 million or 2.6% as compared to fiscal 2013, primarily due to an increase in sales of nonvolatile products associated with our acquisition of Ramtron in fiscal 2012, offset by a decrease in SRAM products driven by a continuing decrease in demand from wireless and wireline end customers. Fiscal 2014 revenue also included $4.1 million of incremental revenue as a result of the change in accounting for certain distributor revenues as discussed above.
Data Communications Division:
Revenue for the Data Communication Division in fiscal 2015 increased by $2.4 million or 3.4% compared to fiscal 2014 due to increasing revenue in our super speed USB products, offset by a decline in our trackpad products..
Revenue for the Data Communication Division in fiscal 2014 decreased by $9.0 million or 11.4% compared to fiscal 2013 due to declining revenue in our legacy high-speed USB controllers, optical navigation and trackpad products.
Emerging Technologies and Other:
Revenues from the Emerging Technologies Division increased by $25.5 million or 106.2% in fiscal 2015 compared to the prior year primarily due to the overall increase in demand at all of our Emerging Technologies companies. The increase was also attributable to increase in our Foundry revenues as we began selling products to Parade Technologies in August 2015 under the Manufacturing Services Agreement, which was signed in connection with our disposition of TrueTouch® mobile business.
39
Revenue from the Emerging Technologies Division in fiscal 2014 increased by $12.4 million or 107.3% compared to fiscal 2013 due to increased revenue in all three business - Deca Tech, Agiga Tech and our foundry business. The increase is due to the overall increase in demand as certain of our Emerging Technologies companies begin to ramp production with new customer design wins.
Cost of Revenues/Gross Margin
|
|
|
Year Ended |
|
|||||||||
|
|
|
January 3, 2016 |
|
|
December 28, 2014 |
|
|
December 29, 2013 |
|
|||
|
|
|
|
|
|
|
(In thousands) |
|
|
|
|
|
|
|
Cost of revenues |
|
$ |
1,207,850 |
|
|
$ |
361,820 |
|
|
$ |
384,121 |
|
|
Gross margin percentage |
|
|
24.9 |
% |
|
|
50.1 |
% |
|
|
46.8 |
% |
Gross margin consists of Revenues less Cost of revenues, and gross margin percentage is percentage of gross margin to revenue. Our gross margin can vary in any period depending on factors such as the mix of types of products sold and the impact of changes to inventory provisions, such as the write-down of inventory. Our gross margin is significantly impacted by the mix of products we sell, which is often difficult to estimate with accuracy. Therefore, if we achieve significant revenue growth in our lower margin product lines, or if we are unable to earn as much revenue as we expect from higher margin product lines, our gross margin may be negatively impacted.
Gross margin percentage declined to 24.9% in fiscal 2015 from 50.1% in fiscal 2014. The decrease in gross margin for fiscal 2015 was primarily due to impact of the merger with Spansion, which historically had lower gross margins than Cypress, and $133.0 million of additional inventory reserves which were recorded on inventory assumed as a part of the Merger. The additional reserves on inventory were recognized as part of our strategy to focus on high margin, profitable business as a combined company. Total charges to cost of sales for inventory provisions, including reserves on inventory assumed as part of the Merger, totaled $152.5 million for fiscal 2015 and $19.8 million for fiscal 2014, unfavorably impacting our gross margin by 9.5% and 3.0%, respectively. Sales of inventory that was previously written-off or written-down totaled $6.4 million for fiscal 2015 and $3.7 million for fiscal 2014, favorably impacting our gross margin by 0.4% and 1.0%, respectively. Our gross margin for fiscal 2015 was also impacted by $84.4 million of amortization of fair value adjustments, net of reserves, relating to acquired legacy Spansion inventory.
Gross margin percentage increased to 50.1% in fiscal 2014 from 46.8% in fiscal 2013 primarily driven by lower cost of revenue expenses associated with the inventory acquired in the Ramtron acquisition, higher factory absorption and product and customer mix. Charges to cost of revenue for inventory reserve provisions were $19.8 million during fiscal 2014 and $12.8 million for fiscal 2013, unfavorably impacting our gross margin by 3% and 2%, respectively. The benefit realized from sales of inventory previously reserved were $3.7 million and $5.1 million for fiscal year 2014 and fiscal 2013, favorably impacting our gross margin by 1% and 1%, respectively.
Research and Development (“R&D”)
|
|
|
Year Ended |
|
|||||||||
|
|
|
January 3, 2016 |
|
|
December 28, 2014 |
|
|
December 29, 2013 |
|
|||
|
|
|
(In thousands) |
|
|||||||||
|
R&D expenses |
|
$ |
281,391 |
|
|
$ |
164,560 |
|
|
$ |
190,906 |
|
|
As a percentage of revenues |
|
|
17.5 |
% |
|
|
22.7 |
% |
|
|
26.4 |
% |
R&D expenditures increased by $116.8 million in fiscal 2015 compared to fiscal 2014. The increase was mainly attributable to $108.3 million of additional expenses due to the Merger, primarily comprised of $63.0 million of labor costs due to additional headcount, $24.0 million of building, repairs and other overhead expenses, $7.7 million of material costs on R&D projects, $8.5 million of professional services related to Information technology and other outside services and $9.5 million of increase in stock-based compensation expense.
R&D expenditures decreased by $26.3 million in fiscal 2014 compared to fiscal 2013. The decrease was primarily attributable to a decrease of $9.9 million in stock-based compensation and a decrease of $1.0 million in deferred compensation expense. There was an additional decrease in consulting fees and other outside services of $2.9 million and $10.0 million, respectively, as a result of a worldwide cost cutting effort. As a percentage of revenues, R&D expenses were lower in fiscal 2014 driven by the decrease in total expense in the same period.
40
Selling, General and Administrative (“SG&A”)
|
|
|
Year Ended |
|
|
|||||||||
|
|
|
January 3, 2016 |
|
|
December 28, 2014 |
|
|
December 29, 2013 |
|
|
|||
|
|
|
|
|
|
|
(In thousands) |
|
|
|
|
|
|
|
|
SG&A expenses |
|
$ |
323,570 |
|
|
$ |
170,741 |
|
|
$ |
182,671 |
|
|
|
As a percentage of revenues |
|
|
20.1 |
% |
|
|
23.5 |
% |
|
|
25.3 |
% |
|
SG&A expenses increased by $152.8 million in fiscal 2015 compared to fiscal 2014. The increase was mainly due to $99.6 million of expenses from the Merger, primarily comprised of $50.0 million of labor costs due to additional headcount, $39.0 million of building, supplies, repairs and other overhead expenses, and $15.0 million of professional services expense related to information technology, legal and finance. Additionally, we also incurred $17.4 million of costs for professional fees for legal and audit services related to the Merger integration activities, $5.0M of termination costs on legacy Spansion patent license agreement and $30.6 million of increase in stock-based compensation expense primarily related to the 2015 PARS grants.
SG&A expenses decreased by $11.9 million in fiscal 2014 or 6.5% compared to fiscal 2013. The decrease was primarily attributable to a decrease in stock-based compensation of $13.4 million, a $7.9 million decrease in headcount related expenditures, a $2.0 million decrease in deferred compensation expense, a $1.6 million decrease in variable bonus-related expense, offset by $7.3 million of acquisition related expenditures associated with our proposed merger with Spansion, an increase of $2.7 million in legal fees and $1.3 million in accrued estimated legal settlements.
Amortization of Acquisition-Related Intangible Assets
During fiscal 2015, amortization of acquisition-related intangible assets increased by $101.7 million compared to fiscal 2014. The increase is primarily due to the amortization on the intangibles acquired in connection with the Merger.
During fiscal 2014, amortization of acquisition-related intangible assets decreased by $1.1 million compared to fiscal 2013. The decrease is primarily related to certain intangible assets acquired during fiscal 2012 that were fully amortized during fiscal 2013.
Restructuring
In March 2015, we began the implementation of planned cost reduction and restructuring activities in connection with the Merger. As part of this Spansion integration-related restructuring plan, we expect to eliminate approximately 1,000 positions from the combined workforce across all business and functional areas on a global basis. The restructuring charge of $90.1 million recorded for the year ended January 3, 2016 primarily consists of severance costs, lease termination costs and impairment of property, plant and equipment. The lease termination costs include approximately $18 million relating to the buildings Spansion had leased prior to the Merger, which we decided not to occupy in the post-Merger period. The initial term of the lease commenced on January 1, 2015 and will expire on December 31, 2026.
The following table summarizes the restructuring charges recorded in our Consolidated Statements of Operations for the periods presented pursuant to the Spansion Integration-Related Restructuring Plan:
|
|
Year Ended |
|
|
|
|
January 3, 2016 |
|
|
|
|
(In thousands) |
|
|
|
Personnel costs |
$ |
58,972 |
|
|
Lease termination costs and other related charges |
|
18,016 |
|
|
Impairment of property, plant and equipment |
|
12,531 |
|
|
Other |
|
565 |
|
|
Total restructuring and other charges (benefit) |
$ |
90,084 |
|
We anticipate that the remaining restructuring accrual balance will be paid out in cash through 2016 for employee terminations and over the remaining lease term through 2026 for the excess lease obligation.
41
In the fourth quarter of fiscal 2015, we have realized approximately $137.7 million of synergy savings on an annualized basis from the restructuring actions taken. Upon completion of all of our actions, we anticipate our annualized synergy savings in the fourth quarter of fiscal 2016 to be approximately $160 million. When complete, we estimate approximately 40% of the savings will impact cost of goods sold and the remaining 60% will impact operating expenses. There can be no assurance that we will achieve these anticipated savings.
Gain on Divestiture of TruTouch® Mobile Business
In connection with the sale of the TrueTouch® mobile touchscreen business to Parade for total cash proceeds of $98.6 million, we sold certain assets associated with the disposed business mostly consisting of inventory with a net book value of $10.5 million and recognized a gain of $66.5 million in fiscal 2015, net of the amount of gain deferred in connection with an ongoing manufacturing service agreement we entered into with Parade in connection with the divestiture.
Interest expense
Interest expense for fiscal 2015 was $16.4 million and represents accretion of interest expense on 2.00% Senior Exchangeable Notes, interest expense incurred on our revolving line of credit, Term Loan A and other debt.
Interest expense for fiscal 2014 and fiscal 2013 was $5.8 million and $8.1 million, respectively, and represents interest expense incurred on our revolving line of credit and other term debt.
Refer to Note 14 of Notes to Consolidated Financial Statements under Item 8 for more information about our credit facilities.
Other Income (expense), Net
The following table summarizes the components of other income (expense), net:
|
|
|
Year Ended |
|
|||||||||
|
|
|
January 3, 2016 |
|
|
December 28, 2014 |
|
|
December 29, 2013 |
|
|||
|
|
|
|
|
|
|
(In thousands) |
|
|
|
|
|
|
|
Interest income |
|
$ |
885 |
|
|
$ |
362 |
|
|
$ |
301 |
|
|
Changes in fair value of investments under the deferred compensation plan |
|
|
(1,354 |
) |
|
|
3,014 |
|
|
|
6,371 |
|
|
Impairment of investments |
|
|
— |
|
|
|
— |
|
|
|
25 |
|
|
Foreign currency exchange gains (losses), net |
|
|
744 |
|
|
|
1,382 |
|
|
|
2,791 |
|
|
Unrealized loss on marketable securities |
|
|
(4,655 |
) |
|
|
(1,495 |
) |
|
|
— |
|
|
Gain on sale of equity investments |
|
|
276 |
|
|
|
— |
|
|
|
908 |
|
|
Others |
|
|
335 |
|
|
|
40 |
|
|
|
(59 |
) |
|
Other income (expense), net |
|
$ |
(3,769 |
) |
|
$ |
3,303 |
|
|
$ |
10,337 |
|
Employee Deferred Compensation Plan
We have a deferred compensation plan, which provides certain key employees, including our executive management, with the ability to defer the receipt of compensation in order to accumulate funds for retirement on a tax-deferred basis. We do not make contributions to the deferred compensation plan and we do not guarantee returns on the investments. Participant deferrals and investment gains and losses remain as our liabilities and the underlying assets are subject to claims of general creditors. In fiscal 2015, 2014 and 2013, we recognized changes in fair value of the assets under the deferred compensation plan in “Other income (expense), net” of $1.4 million of interest expense, $3.0 million and $6.4 million of interest income, respectively. The increase or decrease in the fair value of the investments relates to the increased or decreased performance of the portfolio on a year over year basis. Refer to Note 17 of Notes to Consolidated Financial Statements under Item 8 for more information about our deferred compensation plan.
Gain on Sale of Investments in Marketable Equity Securities
In the second quarter of fiscal 2013, we sold our investment in a certain marketable equity security for $2.2 million, which resulted in a realized gain of $1.1 million.
In connection with the acquisition of Ramtron, we recognized a gain of $1.7 million on our initial investment in Ramtron of $3.4 million. For more information about our acquisition, refer to Note 2 of Notes to Consolidated Financial Statements under Item 8.
42
Unrealized loss on marketable securities
In the fourth quarter of fiscal 2014, the Company, through a wholly-owned subsidiary, purchased 6.9 million ordinary shares of Hua Hong Semiconductor Limited (HHSL) for an aggregate price of $10.0 million in connection with their initial public offering. HHSL is the parent company of Grace Semiconductor Manufacturing Corporation, which is one of our strategic foundry partners. We recorded an unrealized loss on our investment in HHSL’s ordinary shares of $4.7 million and $1.5 million in fiscal 2015 and 2014, respectively, as a result of the decline in the fair market value of the investment.
Equity in Net Loss of Equity Method Investee
During fiscal 2015, we invested an additional $28.0 million in a battery company. The additional investment in this company increased our ownership interest in the company’s outstanding stock from 26.2% as of December 28, 2014 to 38.7% as of January 3, 2016. We have accounted for our investment in this entity under the equity method of accounting since the fourth quarter of fiscal 2014, when we changed from the cost method of accounting to the equity method of accounting. Under the equity method of accounting, we are required to record our interest in the investee's reported net income or loss for each reporting period. Additionally, we are required to present our prior period financial results to reflect the equity method of accounting from the date of the initial investment in the company. Our results of operations include charges of $7.1 million, $5.1 million and $1.9 million, respectively, for the fiscal years ended 2015, 2014 and 2013. Refer to Note 15 of Notes to Consolidated Financial Statements under Item 8 for more detailed discussion.
Income Taxes
Our income tax expense was $16.9 million in fiscal 2015. Our income tax benefit was $1.2 million and $7.8 million for fiscal 2014 and 2013, respectively. The tax expense for fiscal 2015 was primarily a result of non-U.S. income taxes on income earned in foreign jurisdictions. The tax benefit in fiscal 2014 was primarily attributable to a release of previously accrued taxes of approximately $8.3 million related to settlements with taxing authorities and the lapsing of statutes of limitations, primarily offset by income taxes associated with our non-U.S. operations. The tax benefit in fiscal 2013 was primarily attributable to a release of previously accrued taxes of approximately $13.8 million related to settlements with taxing authorities and the lapsing of statutes of limitation, primarily offset by income taxes associated with our non-U.S. operations.
Our effective tax rate varies from the U.S. statutory rate primarily due to earnings of foreign subsidiaries taxed at different rates and a full valuation allowance on net operating losses incurred in the U.S. The calculation of tax liabilities involves dealing with uncertainties in the application of complex global tax regulations. We regularly assess our tax positions in light of legislative, bilateral tax treaty, regulatory and judicial developments in the many countries in which we and our affiliates do business.
Non-U.S. tax authorities have completed their income tax examinations of our subsidiary in Israel for fiscal years 2008-2013 and our branch in Germany for fiscal years 2010 to 2013. Both Israel and Germany examinations did not result in material adjustments to our tax liabilities. Income tax examinations of our Malaysian subsidiary for the fiscal years 2007 to 2012 and our Thailand subsidiary for fiscal year 2010 are in progress. We do not believe the ultimate outcome of these examinations will result in a material increase to our tax liability.
International revenues account for a significant portion of our total revenues, such that a material portion of our pretax income is earned and taxed outside the U.S. at rates ranging from 0% to 25%. The impact on our provision for income taxes of foreign income being taxed at rates different than the U.S. federal statutory rate was an expense of approximately $22.4 million, and benefit of $37.5 million and $15.4 million in 2015, 2014 and 2013, respectively. The foreign jurisdictions with lower tax rates as compared to the U.S. statutory federal rate that had the most significant impact on our provision for foreign income taxes in the periods presented include the Cayman Islands, Malaysia, Philippines and Thailand.
On July 27, 2015, in Altera Corp. v. Commissioner, the U.S. Tax Court issued an opinion related to the treatment of stock-based compensation expense in an intercompany cost-sharing arrangement. On February 19, 2016, the Internal Revenue Service appealed the decision. A final decision has yet to be issued. At this time, the U.S. Department of the Treasury has not withdrawn the requirement to include stock-based compensation from its regulations. Due to the uncertainty surrounding the status of the current regulations, questions related to the scope of potential impact, and the risk of the Tax Court’s decision being overturned upon appeal, we have not recorded any impact related to this issue as of January 3, 2016.
43
LIQUIDITY AND CAPITAL RESOURCES
The following table summarizes our consolidated cash, cash equivalents and short-term investments and working capital:
|
|
|
As of |
|
|||||
|
|
|
January 3, 2016 |
|
|
December 28, 2014 |
|
||
|
|
|
(In thousands) |
|
|||||
|
Cash, cash equivalents and short-term investments |
|
$ |
227,561 |
|
|
$ |
118,812 |
|
|
Working capital |
|
$ |
322,376 |
|
|
$ |
37,479 |
|
Key Components of Cash Flows
|
|
|
Year Ended |
|
|||||||||
|
|
|
January 3, 2016 |
|
|
December 28, 2014 |
|
|
December 29, 2013 |
|
|||
|
|
|
|
|
|
|
(In thousands) |
|
|||||
|
Net cash provided by operating activities |
|
$ |
8,801 |
|
|
$ |
103,336 |
|
|
$ |
67,568 |
|
|
Net cash provided by (used in) investing activities |
|
$ |
(79,087 |
) |
|
$ |
(42,156 |
) |
|
$ |
261 |
|
|
Net cash used in financing activities |
|
$ |
193,240 |
|
|
$ |
(43,453 |
) |
|
$ |
(45,023 |
) |
Fiscal 2015:
Operating Activities
In fiscal 2015, net cash provided by operating activities was $8.8 million compared to net cash provided by operating activities of $103.3 million in fiscal 2014. Net cash provided by operating activities in fiscal 2015 was primarily due to a net loss of $378.9 million adjusted for a net non-cash items of $293.6 million and a net cash provided by change in operating assets and liabilities of $96.4 million. The non-cash adjustments primarily consisted of depreciation and amortization of $243.8 million, stock based compensation expense of $93.5 million, non-cash restructuring charges of $8.6 million and, gain on the sale of our TrueTouch® mobile business of $66.5 million. The net cash provided by changes in operating assets and liabilities was due a decrease in inventories of $228.3 million offset by an increase in accounts receivables of $117.4 million, increase in other assets of $6.0 million, decrease in accounts payable, accrued and other liabilities of $54.3 million and a decrease in deferred income of $14.2 million. The decrease in inventory was primarily due to $133.0 million of reserves recorded to write down inventory assumed from the Merger and was recognized as part of the Company's strategy to focus on high margin, profitable business as a combined company and to move away from the production and sale of inventory associated with non-strategic businesses.
Investing Activities
In fiscal 2015, we used $79.1 million of cash in our investing activities compared to $42.2 million in fiscal 2014. The cash we used in investing activities in fiscal 2015 was primarily due to $105.1 million in net cash paid on the Merger as part of purchase consideration, $47.2 million of cash used for property and equipment expenditures $28.0 million cash paid for equity investments and $6.1 million paid for a cost method investment. These increases were partially offset by $17.4 million of proceeds from the sales or maturities of investments and $98.6 million of cash proceeds from the sale of our TrueTouch® Mobile business, of the total cash proceeds received from the sale of our TrueTouch® mobile business, $10.0 million are held in an Escrow account until January 2017.
Financing Activities
In fiscal 2015, we generated $193.2 million of cash from our financing activities compared to $43.4 million in fiscal 2014. The cash we used in our financing activities in fiscal 2015 was primarily related our net borrowings on the revolving credit facility of $537.0 million, borrowings of $97.2 million on Term Loan A, net of costs, proceeds from settlement of capped calls which were assumed as part of the Merger of $25.3 million and net proceeds from the issuance of common shares under our employee stock plans of $52.3 million. The increases were offset by $315.0 million repayment of line of credit facility, $128.0 million of dividend payments, $55.1 million of repurchase of treasury stock and $9.6 million cash used for yield enhanced structured agreements settled in common stock.
44
Fiscal 2014:
Operating Activities
In fiscal 2014, net cash provided by operating activities was $103.3 million compared to $67.6 million in fiscal 2013. The increase in operating cash flows for fiscal 2014 was primarily due to an increase in net income of $66.2 million compared to fiscal 2013. Our operating cash flow for 2014 of $103.3 million was primarily due to our net income of $16.5 million, net favorable non-cash adjustments to our net income including stock-based compensation of $50.2 million and depreciation and amortization of $46.7 million, and a net change in working capital of $15.7 million.
Investing Activities
In fiscal 2014, net cash used in investing activities was $42.2 million compared to net cash used in investing activities of $0.3 million in fiscal 2013. The net cash used in our investing activities in fiscal 2014 was primarily due to investment purchases of $23.4 million, purchases of property and equipment of $20.9 million and investments made in other entities accounted for under the cost or equity method of accounting of $18.4 million, offset by the proceeds from sales of investments of $16.6 million.
Financing Activities
In fiscal 2014, net cash used in financing activities was $43.4 million compared to $45.0 million in fiscal 2013. The cash we used in our financing activities in fiscal 2014 was primarily due to payment of dividends of $69.2 million and the repayment of debt and obligations under capital leases of $6.3 million, offset by net proceeds of $32 million from the issuance of common shares under our employee stock plans.
Fiscal 2013:
Operating Activities
In fiscal 2013, net cash provided by operating activities was $67.6 million compared to $135 million in fiscal 2012. The decrease in operating cash flows for fiscal 2013 was primarily due to an increase in net loss of $24.8 million compared to fiscal 2012. Our operating cash flow for fiscal 2013 of $67.6 million was primarily due to our net loss of $50.1 million, offset by net favorable non-cash adjustments to our net loss including stock-based compensation of $73.0 million, depreciation and amortization of $48.4 million, and a net change in working capital of $20.1 million.
Investing Activities
In fiscal 2013, net cash provided by investing activities was $0.3 million compared to net cash used in investing activities of $113.0 million in fiscal 2012. The cash provided by our investing activities in fiscal 2013 was primarily due to sales of investments of $64.4 million offset by investment purchases of $23.1 million, and purchases of property and equipment of $36.6 million primarily for our Emerging Technologies Division.
Financing Activities
In fiscal 2013, net cash used in financing activities was $45.0 million compared to $58.5 million in fiscal 2012. The cash we used in our financing activities in fiscal 2013 was primarily due to payment of dividends of $64.8 million, repayment on our long term revolving credit facility (Credit facility) of $145.0 million and repayment of other debt of $17.1 million, partially offset by net proceeds of $38.7 million from the issuance of common shares under our employee stock plans, and borrowings of $140.0 million on our Credit facility.
45
Liquidity and Contractual obligations
Stock Repurchase Programs:
On October 20, 2015, our Board authorized a new $450 million stock buyback program. In connection with the approval of the new share repurchase plan, the share repurchase plan previously approved in September 2011 was terminated. The program allows us to purchase our common stock or enter into equity derivative transactions related to our common stock. The timing and actual amount expended with the new authorized funds will depend on a variety of factors including the market price of our common stock, regulatory, legal, and contractual requirements, alternatives uses of cash, availability of on shore cash and other market factors. The program does not obligate us to repurchase any particular amount of common stock and may be modified or suspended at any time at our discretion. From September 2011 through the termination of the program, we used $327.4 million from the program to repurchase 24.4 million shares at an average share price of $13.4. Under the new program authorized in October, 2015 through the end of fiscal 2015, we used $56.5 million to repurchase 5.7 million share at an average price of $10.0.
As of February 26, 2016, we repurchased a total of 29.3 million shares for a total cost of $237.8 million under the new program. As of February 26, 2016, the total dollar value of shares that may yet be purchased under the program is approximately $212.2 million.
Yield Enhancement Program (“YEP”):
As discussed under Item 5 above and in Note 14 of the Notes to Consolidated Financial Statements under Item 8, we have periodically entered into short term yield enhanced structured agreements since fiscal 2009.
In fiscal 2014, we entered into short-term yield enhanced structured agreements with maturities ranging from 30 to 45 days at an aggregate price of $19.4 million. Upon settlement of these agreements, we received $19.7 million in cash. In fiscal 2013 we didn’t enter into any short-term yield enhanced structured agreements.
In fiscal 2015, we entered into a short-term yield enhanced structured agreements with maturities ranging from 10 to 30 days at an aggregate price of $38.6 million. Upon settlement of these agreements, we received $29.4 million in cash and one million shares at an average price of $9.60.
Senior Secured Revolving Credit Facility
On October 17, 2013, we amended our credit facility to reduce the revolving commitments to $300 million. In connection with the reduction, certain financial covenants were amended. The amended financial covenants include the following conditions: 1) maximum senior secured leverage ratio of 2.50 to 1.00 through January 1, 2017 and 2.25 to 1.00 thereafter, 2) maximum total leverage ratio of 4.25 to 1.00 through January 3, 2015, 3.5 to 1.00 through January 1, 2017 and 3.00 to 1.00 thereafter, 3) minimum fixed charge coverage ratio of 1.00 to 1.00, and 4) minimum liquidity of at least $100 million. Borrowings are collateralized by substantially all assets of the company.
On March 12, 2015, we amended and restated our existing senior secured revolving credit facility (“Credit Facility”) and increased the size of the Credit Facility from $300 million to $450 million. The restated agreement also contains an option permitting us to arrange additional commitments of $250 million (“Incremental Availability”) and specifies that the proceeds of these loans may be used for working capital, acquisitions, stock repurchases and general corporate purposes. The borrowings under the Credit Facility will bear interest, at the Company's option, at an adjusted base rate plus a spread of 1.25%, or an adjusted LIBOR rate plus a spread of 2.25%. The borrowings under the Credit Facility are collateralized by substantially all of the Company's assets. The financial covenants were amended to include the following conditions: 1) maximum total leverage ratio of 3.50 to 1.00 through January 1, 2017, and 3.00 to 1.00 thereafter, 2) minimum fixed charge coverage ratio of 1.00 to 1.00. At January 3, 2016, the Company's outstanding borrowings of $449.0 million were recorded as part of long-term liabilities and are presented as “Long-term revolving credit facility and long term debt” on the Consolidated Balance Sheet. We incurred financing costs of $2.3 million to the new lenders of the Credit Facility which has been capitalized and recognized in other long-term assets on the Consolidated Balance Sheet. These costs will be amortized over the life of the Credit Facility.
As per the terms of the Credit Facility, we entered into a Joinder Agreement on December 22, 2015 under which we borrowed an additional $97.2 million (“Term Loan A”), net of costs. Term Loan A is subject to, at the Company’s option, either an interest rate equal to (i) 3.25% over LIBOR or (ii) an interest rate equal to 2.25% over the greater of (x) the prime lending rate published by the Wall Street Journal, (y) the federal funds effective rate plus 0.50%, and (z) the LIBOR rate for a one month interest period plus 1%. The Company paid a 1.00% upfront fee in connection with the Term Loan A.
46
The Credit Facility, as amended, provides for a $450 million revolving credit facility and generally contains the same representations and warranties, covenants, and events of default that it contained prior to the effectiveness of the Amendment. The Amendment did not change the interest rate or maturity applicable to the Credit Facility and the Credit Facility remains guaranteed by certain present and future wholly-owned material domestic subsidiaries (the “Guarantors”) and secured by a security interest in substantially all of our assets and the Guarantors.
On January 6, 2016, we entered into an Incremental Revolving Joinder Agreement to our Credit Facility to increase the amount of revolving commitments under our Credit Facility by an additional $90 million. The total aggregate amount of revolving commitments under the Credit Facility starting January 6, 2016 is $540 million.
The proceeds of the loans made under the Credit Facility may be used for working capital, acquisitions, stock repurchases and general corporate purposes. As of the filing date of this Form 10-K, $449.5 million aggregate principal amount of loans and letters of credit are outstanding under the Credit Facility and none of the Incremental Availability has been used.
As of January 3, 2016, we were in compliance with all of the financial covenants under the Credit Facility.
Refer to Note 14 of Notes to Consolidated Financial Statements under Item 8 for more information on our senior secured revolving credit facility.
Contractual Obligations
The following table summarizes our contractual obligations as of January 3, 2016:
|
|
|
Total |
|
|
2016 |
|
|
2017 and 2018 |
|
|
2019 and 2020 |
|
|
After 2020 |
|
|||||
|
|
|
(In thousands) |
|
|||||||||||||||||
|
Purchase obligations (1) |
|
$ |
167,415 |
|
|
$ |
160,532 |
|
|
$ |
6,883 |
|
|
$ |
— |
|
|
$ |
— |
|
|
Equipment loan |
|
|
3,003 |
|
|
|
3,003 |
|
|
|
— |
|
|
|
— |
|
|
|
— |
|
|
Operating lease commitments (2) |
|
|
74,815 |
|
|
|
16,171 |
|
|
|
22,240 |
|
|
|
12,569 |
|
|
|
23,835 |
|
|
Capital lease commitments |
|
|
7,314 |
|
|
|
6,715 |
|
|
|
599 |
|
|
|
— |
|
|
|
— |
|
|
2.00% Senior Exchangeable Notes |
|
|
149,990 |
|
|
|
— |
|
|
|
— |
|
|
|
149,990 |
|
|
|
— |
|
|
Term Loan A |
|
|
100,000 |
|
|
|
5,000 |
|
|
|
15,000 |
|
|
|
80,000 |
|
|
|
— |
|
|
Interest payments on debt |
|
|
79,915 |
|
|
|
18,817 |
|
|
|
36,598 |
|
|
|
24,500 |
|
|
|
— |
|
|
Senior Secured Revolving Credit Facility |
|
|
449,000 |
|
|
|
— |
|
|
|
— |
|
|
|
449,000 |
|
|
|
— |
|
|
License fee commitments (3) |
|
|
5,880 |
|
|
|
5,880 |
|
|
|
— |
|
|
|
— |
|
|
|
— |
|
|
Total contractual obligations |
|
$ |
1,037,332 |
|
|
$ |
216,118 |
|
|
$ |
81,320 |
|
|
$ |
716,059 |
|
|
$ |
23,835 |
|
|
(1) |
Purchase obligations primarily include non-cancelable purchase orders for materials, services, manufacturing equipment, building improvements and supplies in the ordinary course of business. Purchase obligations are defined as enforceable agreements that are legally binding on us and that specify all significant terms, including quantity, price and timing. |
|
(2) |
Operating leases includes payments relating to Spansion's lease for office space in San Jose for a new headquarters entered on May 22, 2014, which is no longer required. The lease is for a period of 12 years, with two options to extend for periods of five years each after the initial lease term. The term of the lease commenced on January1, 2015 and expires on December 31, 2026. |
|
(3) |
On April 30, 2012, we entered into a patent license agreement whereby we paid a total patent license fee of $14.0 million in fiscal 2012 and committed to pay another $5.9 million on or before April 30, 2016 representing fees for future purchases of patents and patent related services. In June 2015, the Company paid an additional license fee of $18.5 million under the existing license agreement due to the merger with Spansion in March 2015. |
As of January 3, 2016 our unrecognized tax benefits were $28.4 million, which were classified as long-term liabilities. We believe it is possible that we may recognize approximately $7 million of our existing unrecognized tax benefits within the next twelve months as a result of the lapse of statutes of limitations and the resolution of agreements with domestic and various foreign tax authorities.
47
Sale of Spansion's Sunnyvale property
On January 23, 2014, Spansion sold its property in Sunnyvale, California, consisting of 24.5 acres of land with approximately 471,000 square feet of buildings that included its headquarters building and submicron development center, a Pacific Gas & Electric transmission facility and a warehouse building, for net consideration of $59.0 million. Spansion concurrently leased back approximately 170,000 square feet of the headquarters building on a month-to-month basis with the option to continue the lease for up to 24 months; thereafter either party could terminate the lease. The first six months of the lease were rent free; thereafter the rents were lower than the market rates. For accounting purposes, these rents were deemed to have been netted against the sale proceeds and represent prepaid rent. As such, the use of the property after its sale constituted continuing involvement, and recognition of the sale of the property was deferred until the lease period ended. In the third quarter of fiscal 2015, we terminated the lease on the Sunnyvale building and recognized an immaterial gain.
Equity Investment Commitments
As disclosed in Note 19 of the Notes to the Consolidated Financial Statements, we have committed to purchase additional preferred stock from a company that operates in the area of advanced battery storage. During the fiscal year ended January 3, 2016, we purchased $28.0 million of preferred stock which was recorded as part of our investments in non-marketable securities. Subject to the attainment of certain milestones, we may purchase additional preferred stock of this company.
Capital Resources and Financial Condition
Our long-term strategy is to maintain a minimum amount of cash for operational purposes and to invest the remaining amount of our cash in interest-bearing and highly liquid cash equivalents and debt securities, the purchase of our stock through our stock buyback program and payments of regularly scheduled cash dividends. In addition we may use excess cash to invest in our ETD, enter into strategic investments and partnerships and pursue acquisitions. As of January 3, 2016 in addition to $226.7 million in cash and cash equivalents, we had $0.9 million invested in short-term investments for a total cash and short-term investment position of $227.6 million that is available for use in current operations.
As of January 3, 2016, approximately 63.0% of our cash and cash equivalents and available-for-sale investments are held outside of the United States. While these amounts are primarily invested in U.S. dollars, a portion is held in foreign currencies. All offshore balances are exposed to local political, banking, currency control and other risks. In addition, these amounts, if repatriated may be subject to tax and other transfer restrictions.
We believe that liquidity provided by existing cash, cash equivalents and investments and our borrowing arrangements will provide sufficient capital to meet our requirements for at least the next twelve months. However, should prevailing economic conditions, debt covenants constraints, and/or financial, business and other factors beyond our control adversely affect our estimates of our future cash requirements, we could be required to fund our cash requirements by alternative financing. There can be no assurance that additional financing, if needed, would be available on terms acceptable to us or at all. We may also choose at any time to raise additional capital or debt to strengthen our financial position, facilitate growth, enter into strategic initiatives including the acquisition of other companies, repurchases of shares of stock or increase our dividends or pay a special dividend and provide us with additional flexibility to take advantage of other business opportunities that arise.
Non-GAAP Financial Measures
To supplement its consolidated financial results presented in accordance with GAAP, Cypress uses non-GAAP measures to assess the following financial measures which are adjusted from the most directly comparable GAAP financial measures:
|
|
· |
Revenue |
|
|
· |
Gross margin |
|
|
· |
Research and development expenses |
|
|
· |
Selling, general and administrative expenses |
|
|
· |
Operating income (loss) |
|
|
· |
Net income (loss) |
|
|
· |
Diluted net income (loss) per share |
48
The non-GAAP measures set forth above exclude charges primarily related to Spansion merger costs and related amortization, which represented approximately 83% of total adjustments for the year ended January 3, 2016 as well as stock-based compensation, restructuring charges, acquisition-related expenses and other adjustments. Management believes that these non-GAAP financial measures reflect an additional and useful way of viewing aspects of Cypress’s operations that, when viewed in conjunction with Cypress’s GAAP results, provide a more comprehensive understanding of the various factors and trends affecting Cypress’s business and operations. Management uses these non-GAAP measures for strategic and business decision-making, internal budgeting, forecasting and resource allocation processes. In addition, these non-GAAP financial measures facilitate management’s internal comparisons to Cypress’s historical operating results and comparisons to competitors’ operating results. Pursuant to the requirements of Regulation G and to make clear to our investors the adjustments we make to GAAP measures, we have provided a reconciliation of the non-GAAP measures to the most directly comparable GAAP financial measures.
|
|
|
Year Ended |
|
|||||||||
|
|
|
January 3, 2016 |
|
|
December 28, 2014 |
|
|
December 29, 2013 |
|
|||
|
|
|
(In thousands, except per shares amounts) |
|
|||||||||
|
Non-GAAP revenue |
|
$ |
1,626,603 |
|
|
$ |
725,497 |
|
|
$ |
722,693 |
|
|
Non-GAAP gross margin |
|
$ |
573,518 |
|
|
$ |
381,716 |
|
|
$ |
377,261 |
|
|
Non-GAAP research and development expenses |
|
$ |
252,244 |
|
|
$ |
147,098 |
|
|
$ |
161,764 |
|
|
Non-GAAP selling, general and administrative expenses |
|
$ |
231,198 |
|
|
$ |
137,858 |
|
|
$ |
143,071 |
|
|
Non-GAAP operating income |
|
$ |
90,075 |
|
|
$ |
96,759 |
|
|
$ |
72,426 |
|
|
Non-GAAP pretax profit |
|
$ |
78,213 |
|
|
$ |
91,187 |
|
|
$ |
66,013 |
|
|
Non-GAAP net income attributable to Cypress |
|
$ |
70,532 |
|
|
$ |
87,291 |
|
|
$ |
63,221 |
|
|
Non-GAAP diluted net income per share attributable to Cypress |
|
$ |
0.21 |
|
|
$ |
0.52 |
|
|
$ |
0.39 |
|
We believe that providing these Non-GAAP financial measures, in addition to the GAAP financial results, are useful to investors because they allow investors to see our results “through the eyes” of management as these Non-GAAP financial measures reflect our internal measurement processes. Management believes that these Non-GAAP financial measures enable investors to better assess changes in each key element of our operating results across different reporting periods on a consistent basis and provides investors with another method for assessing our operating results in a manner that is focused on the performance of our ongoing operations.
49
CYPRESS SEMICONDUCTOR CORPORATION
RECONCILIATION OF GAAP FINANCIAL MEASURES TO NON-GAAP FINANCIAL MEASURES
(In thousands, except per-share data)
(Unaudited)
|
|
|
Twelve Months Ended |
|
|||||||||||||||||||||
|
|
|
January 3, |
|
|
% of |
|
|
December 28, |
|
|
% of |
|
|
December 29, |
|
|
% of |
|
||||||
|
|
|
2016 |
|
|
Revenue |
|
|
2014 |
|
|
Revenue |
|
|
2013 |
|
|
Revenue |
|
||||||
|
GAAP Revenues |
|
$ |
1,607,853 |
|
|
|
|
|
|
$ |
725,497 |
|
|
|
|
|
|
$ |
722,693 |
|
|
|
|
|
|
Revenue from intellectual property license (1) |
|
|
18,750 |
|
|
|
|
|
|
|
— |
|
|
|
|
|
|
|
— |
|
|
|
|
|
|
Non-GAAP Revenues |
|
$ |
1,626,603 |
|
|
|
|
|
|
$ |
725,497 |
|
|
|
|
|
|
$ |
722,693 |
|
|
|
|
|
|
GAAP gross margin |
|
$ |
400,003 |
|
|
|
24.9 |
% |
|
$ |
363,677 |
|
|
|
50.1 |
% |
|
$ |
338,572 |
|
|
|
46.8 |
% |
|
Stock-based compensation expense |
|
|
16,459 |
|
|
|
1.0 |
% |
|
|
13,209 |
|
|
|
1.8 |
% |
|
|
12,789 |
|
|
|
1.8 |
% |
|
Changes in value of deferred compensation plan |
|
|
(37 |
) |
|
|
0.0 |
% |
|
|
427 |
|
|
|
0.1 |
% |
|
|
854 |
|
|
|
0.1 |
% |
|
Ramtron acquisition related expense |
|
|
— |
|
|
|
0.0 |
% |
|
|
(86 |
) |
|
|
0.0 |
% |
|
|
24,805 |
|
|
|
3.4 |
% |
|
Impairment of assets, restructuring and other charges |
|
|
(687 |
) |
|
|
0.0 |
% |
|
|
4,489 |
|
|
|
0.6 |
% |
|
|
241 |
|
|
|
0.0 |
% |
|
Effect of Non-GAAP revenue from intellectual property license |
|
|
18,750 |
|
|
|
0.8 |
% |
|
|
— |
|
|
|
0.0 |
% |
|
|
— |
|
|
|
0.0 |
% |
|
Spansion merger costs and related amortization |
|
|
139,030 |
|
|
|
8.6 |
% |
|
|
— |
|
|
|
0.0 |
% |
|
|
— |
|
|
|
0.0 |
% |
|
Non-GAAP gross margin |
|
$ |
573,518 |
|
|
|
35.3 |
% |
|
$ |
381,716 |
|
|
|
52.6 |
% |
|
$ |
377,261 |
|
|
|
52.2 |
% |
|
GAAP research and development expenses |
|
$ |
281,391 |
|
|
|
|
|
|
$ |
164,560 |
|
|
|
|
|
|
$ |
190,906 |
|
|
|
|
|
|
Stock-based compensation expense |
|
|
(25,719 |
) |
|
|
|
|
|
|
(16,187 |
) |
|
|
|
|
|
|
(26,042 |
) |
|
|
|
|
|
Changes in value of deferred compensation plan |
|
|
233 |
|
|
|
|
|
|
|
(793 |
) |
|
|
|
|
|
|
(1,744 |
) |
|
|
|
|
|
Ramtron acquisition related expense |
|
|
— |
|
|
|
|
|
|
|
— |
|
|
|
|
|
|
|
(252 |
) |
|
|
|
|
|
Impairment of assets, restructuring and other charges |
|
|
(980 |
) |
|
|
|
|
|
|
(482 |
) |
|
|
|
|
|
|
(1,104 |
) |
|
|
|
|
|
Spansion merger costs and related amortization |
|
|
(2,681 |
) |
|
|
|
|
|
|
— |
|
|
|
|
|
|
|
— |
|
|
|
|
|
|
Non-GAAP research and development expenses |
|
$ |
252,244 |
|
|
|
|
|
|
$ |
147,098 |
|
|
|
|
|
|
$ |
161,764 |
|
|
|
|
|
|
GAAP selling, general and administrative expenses |
|
$ |
295,477 |
|
|
|
|
|
|
$ |
176,244 |
|
|
|
|
|
|
$ |
182,671 |
|
|
|
|
|
|
Stock-based compensation expense |
|
|
(51,350 |
) |
|
|
|
|
|
|
(20,774 |
) |
|
|
|
|
|
|
(34,187 |
) |
|
|
|
|
|
Changes in value of deferred compensation plan |
|
|
260 |
|
|
|
|
|
|
|
(1,855 |
) |
|
|
|
|
|
|
(3,795 |
) |
|
|
|
|
|
Ramtron acquisition related expense |
|
|
— |
|
|
|
|
|
|
|
(14,330 |
) |
|
|
|
|
|
|
(1,168 |
) |
|
|
|
|
|
Impairment of assets, restructuring and other charges |
|
|
(177 |
) |
|
|
|
|
|
|
(97 |
) |
|
|
|
|
|
|
(450 |
) |
|
|
|
|
|
Legal and other |
|
|
(1,198 |
) |
|
|
|
|
|
|
(1,330 |
) |
|
|
|
|
|
|
— |
|
|
|
|
|
|
Spansion merger costs and related amortization |
|
|
(11,814 |
) |
|
|
|
|
|
|
— |
|
|
|
|
|
|
|
— |
|
|
|
|
|
|
Non-GAAP selling, general and administrative expenses |
|
$ |
231,198 |
|
|
|
|
|
|
$ |
137,858 |
|
|
|
|
|
|
$ |
143,071 |
|
|
|
|
|
|
GAAP operating income (loss) |
|
$ |
(336,905 |
) |
|
|
|
|
|
$ |
22,873 |
|
|
|
|
|
|
$ |
(58,195 |
) |
|
|
|
|
|
Stock-based compensation expense |
|
|
93,527 |
|
|
|
|
|
|
|
50,170 |
|
|
|
|
|
|
|
73,020 |
|
|
|
|
|
|
Gain from divestiture transaction |
|
|
(66,472 |
) |
|
|
|
|
|
|
— |
|
|
|
|
|
|
|
— |
|
|
|
|
|
|
Ramtron acquisition-related expense |
|
|
5,220 |
|
|
|
|
|
|
|
14,244 |
|
|
|
|
|
|
|
34,056 |
|
|
|
|
|
|
Changes in value of deferred compensation plan |
|
|
(531 |
) |
|
|
|
|
|
|
3,075 |
|
|
|
|
|
|
|
6,393 |
|
|
|
|
|
|
Impairment of assets, restructuring and other charges |
|
|
184 |
|
|
|
|
|
|
|
5,067 |
|
|
|
|
|
|
|
17,152 |
|
|
|
|
|
|
Legal and other |
|
|
1,450 |
|
|
|
|
|
|
|
1,330 |
|
|
|
|
|
|
|
— |
|
|
|
|
|
|
Effect of Non-GAAP revenue from intellectual property license |
|
|
18,750 |
|
|
|
|
|
|
|
— |
|
|
|
|
|
|
|
— |
|
|
|
|
|
|
Spansion merger costs and related amortization |
|
|
374,852 |
|
|
|
|
|
|
|
— |
|
|
|
|
|
|
|
— |
|
|
|
|
|
|
Non-GAAP operating income (loss) |
|
$ |
90,075 |
|
|
|
|
|
|
$ |
96,759 |
|
|
|
|
|
|
$ |
72,426 |
|
|
|
|
|
|
GAAP pretax profit (loss) |
|
$ |
(364,178 |
) |
|
|
(22.6 |
)% |
|
$ |
15,345 |
|
|
|
2.1 |
% |
|
$ |
(57,847 |
) |
|
|
(8.0 |
)% |
|
Stock-based compensation expense |
|
|
93,527 |
|
|
|
5.8 |
% |
|
|
50,170 |
|
|
|
6.9 |
% |
|
|
73,020 |
|
|
|
10.1 |
% |
|
Gain from divestiture transaction |
|
|
(66,472 |
) |
|
|
(4.1 |
)% |
|
|
|
|
|
|
0.0 |
% |
|
|
|
|
|
|
0.0 |
% |
|
Ramtron acquisition-related expense |
|
|
5,220 |
|
|
|
0.3 |
% |
|
|
14,244 |
|
|
|
2.0 |
% |
|
|
34,056 |
|
|
|
4.7 |
% |
|
Changes in value of deferred compensation plan |
|
|
820 |
|
|
|
0.1 |
% |
|
|
61 |
|
|
|
0.0 |
% |
|
|
22 |
|
|
|
0.0 |
% |
|
Impairment of assets, restructuring and other charges |
|
|
458 |
|
|
|
0.0 |
% |
|
|
3,737 |
|
|
|
0.5 |
% |
|
|
17,152 |
|
|
|
2.4 |
% |
|
Legal and other |
|
|
1,450 |
|
|
|
0.1 |
% |
|
|
1,330 |
|
|
|
0.2 |
% |
|
|
— |
|
|
|
0.0 |
% |
|
Effect of Non-GAAP revenue from intellectual property license |
|
|
18,291 |
|
|
|
1.1 |
% |
|
|
|
|
|
|
0.0 |
% |
|
|
|
|
|
|
0.0 |
% |
|
Investment related losses (gains) |
|
|
4,058 |
|
|
|
0.3 |
% |
|
|
1,495 |
|
|
|
0.2 |
% |
|
|
— |
|
|
|
0.0 |
% |
|
Tax-related, interest income, interest expense and other expenses |
|
|
3,039 |
|
|
|
0.2 |
% |
|
|
(263 |
) |
|
|
0.0 |
% |
|
|
(2,267 |
) |
|
|
(0.3 |
)% |
|
Losses from equity method investment |
|
|
7,148 |
|
|
|
0.3 |
% |
|
|
5,068 |
|
|
|
0.7 |
% |
|
|
1,877 |
|
|
|
0.3 |
% |
|
Spansion merger costs and related amortization |
|
|
374,852 |
|
|
|
23.3 |
% |
|
|
— |
|
|
|
0.0 |
% |
|
|
— |
|
|
|
0.0 |
% |
|
Non-GAAP pretax profit (loss) |
|
$ |
78,213 |
|
|
|
4.8 |
% |
|
$ |
91,187 |
|
|
|
12.6 |
% |
|
$ |
66,013 |
|
|
|
9.2 |
% |
50
|
|
|
Twelve Months Ended |
|
|||||||||||||||||||||
|
|
|
January 3, |
|
|
% of |
|
|
December 28, |
|
|
% of |
|
|
December 29, |
|
|
% of |
|
||||||
|
|
|
2016 |
|
|
Revenue |
|
|
2014 |
|
|
Revenue |
|
|
2013 |
|
|
Revenue |
|
||||||
|
GAAP net income (loss) attributable to Cypress |
|
$ |
(378,867 |
) |
|
|
|
|
|
$ |
17,936 |
|
|
|
|
|
|
$ |
(48,242 |
) |
|
|
|
|
|
Stock-based compensation expense |
|
|
93,527 |
|
|
|
|
|
|
|
50,170 |
|
|
|
|
|
|
|
73,020 |
|
|
|
|
|
|
Gain from divestiture transaction |
|
|
(66,472 |
) |
|
|
|
|
|
|
- |
|
|
|
|
|
|
|
- |
|
|
|
|
|
|
Ramtron acquisition-related expense |
|
|
5,220 |
|
|
|
|
|
|
|
14,244 |
|
|
|
|
|
|
|
34,056 |
|
|
|
|
|
|
Changes in value of deferred compensation plan |
|
|
820 |
|
|
|
|
|
|
|
61 |
|
|
|
|
|
|
|
22 |
|
|
|
|
|
|
Impairment of assets, restructuring and other charges |
|
|
458 |
|
|
|
|
|
|
|
3,737 |
|
|
|
|
|
|
|
17,151 |
|
|
|
|
|
|
Legal and other |
|
|
1,450 |
|
|
|
|
|
|
|
1,330 |
|
|
|
|
|
|
|
- |
|
|
|
|
|
|
Effect of Non-GAAP revenue from intellectual property license |
|
|
18,291 |
|
|
|
|
|
|
|
- |
|
|
|
|
|
|
|
- |
|
|
|
|
|
|
Investment related losses (gains) |
|
|
4,058 |
|
|
|
|
|
|
|
1,495 |
|
|
|
|
|
|
|
(2,266 |
) |
|
|
|
|
|
Tax-related, interest income, interest expense and other expenses |
|
|
10,047 |
|
|
|
|
|
|
|
(6,750 |
) |
|
|
|
|
|
|
(12,398 |
) |
|
|
|
|
|
Losses from equity method investment |
|
|
7,148 |
|
|
|
|
|
|
|
5,068 |
|
|
|
|
|
|
|
1,878 |
|
|
|
|
|
|
Spansion merger costs and related amortization |
|
|
374,852 |
|
|
|
|
|
|
|
— |
|
|
|
|
|
|
|
— |
|
|
|
|
|
|
Non-GAAP net income attributable to Cypress |
|
$ |
70,532 |
|
|
|
|
|
|
$ |
87,291 |
|
|
|
|
|
|
$ |
63,221 |
|
|
|
|
|
|
GAAP net income (loss) per share attributable to Cypress - diluted |
|
$ |
(1.25 |
) |
|
|
|
|
|
$ |
0.11 |
|
|
|
|
|
|
$ |
(0.31 |
) |
|
|
|
|
|
Stock-based compensation expense |
|
|
0.31 |
|
|
|
|
|
|
|
0.30 |
|
|
|
|
|
|
|
0.45 |
|
|
|
|
|
|
Gain from divestiture transaction |
|
|
(0.22 |
) |
|
|
|
|
|
|
— |
|
|
|
|
|
|
|
— |
|
|
|
|
|
|
Ramtron acquisition-related expense |
|
|
0.02 |
|
|
|
|
|
|
|
0.08 |
|
|
|
|
|
|
|
0.21 |
|
|
|
|
|
|
Changes in value of deferred compensation plan |
|
|
— |
|
|
|
|
|
|
|
— |
|
|
|
|
|
|
|
— |
|
|
|
|
|
|
Impairment of assets, restructuring and other charges |
|
|
— |
|
|
|
|
|
|
|
0.02 |
|
|
|
|
|
|
|
0.11 |
|
|
|
|
|
|
Effect of Non-GAAP revenue from intellectual property license |
|
|
0.06 |
|
|
|
|
|
|
|
— |
|
|
|
|
|
|
|
— |
|
|
|
|
|
|
Investment related losses (gains) |
|
|
0.01 |
|
|
|
|
|
|
|
0.01 |
|
|
|
|
|
|
|
(0.01 |
) |
|
|
|
|
|
Tax-related, interest income, interest expense and other expenses |
|
|
0.02 |
|
|
|
|
|
|
|
(0.04 |
) |
|
|
|
|
|
|
(0.08 |
) |
|
|
|
|
|
Losses from equity method investment |
|
|
0.02 |
|
|
|
|
|
|
|
0.03 |
|
|
|
|
|
|
|
|
|
|
|
|
|
|
Legal and other |
|
|
— |
|
|
|
|
|
|
|
0.01 |
|
|
|
|
|
|
|
— |
|
|
|
|
|
|
Non-GAAP share count adjustment |
|
|
— |
|
|
|
|
|
|
|
— |
|
|
|
|
|
|
|
0.02 |
|
|
|
|
|
|
Spansion merger costs and related amortization |
|
|
1.24 |
|
|
|
|
|
|
|
— |
|
|
|
|
|
|
|
— |
|
|
|
|
|
|
Non-GAAP net income per share attributable to Cypress - diluted |
|
$ |
0.21 |
|
|
|
|
|
|
$ |
0.52 |
|
|
|
|
|
|
$ |
0.39 |
|
|
|
|
|
|
(1) |
Non-GAAP revenue includes for the three and twelve months ended January 3, 2016 includes $6.25 million and $17.5 million of Samsung intellectual property licensing revenue, not included in GAAP revenue as a result of the effect of purchase accounting for the Spansion Merger. |
CRITICAL ACCOUNTING POLICIES AND ESTIMATES
The discussion and analysis of our financial condition and results of operations are based upon our consolidated financial statements included in this Annual Report on Form 10-K and the data used to prepare them. Our consolidated financial statements have been prepared in accordance with accounting principles generally accepted in the United States and we are required to make estimates, judgments and assumptions in the course of such preparation. Note 1 of Notes to Consolidated Financial Statements under Item 8 describes the significant accounting policies and methods used in the preparation of the consolidated financial statements. On an ongoing basis, we re-evaluate our judgments and estimates including those related to revenue recognition, allowances for doubtful accounts receivable, inventory valuation, valuation of long-lived assets, goodwill and financial instruments, stock-based compensation, and settlement costs, and income taxes. We base our estimates and judgments on historical experience, knowledge of current conditions and our beliefs of what could occur in the future considering available information. Actual results may differ from these estimates under different assumptions or conditions. Our critical accounting policies that are affected by significant estimates, assumptions and judgments used in the preparation of our consolidated financial statements are as follows:
Revenue Recognition:
We generate revenues by selling products to distributors, various types of manufacturers including original equipment manufacturers (“OEMs”) and electronic manufacturing service providers (“EMSs”). We recognize revenue on sales to OEMs and EMSs provided that persuasive evidence of an arrangement exists, the price is fixed or determinable, title has transferred, collection of resulting receivables is reasonably assured, there are no customer acceptance requirements, and there are no remaining significant obligations.
51
Sales to certain distributors are made under agreements which provide the distributors with price protection, stock rotation and other allowances under certain circumstances. When we determine that the uncertainties associated with the rights given to these distributors, revenues and costs related to distributor sales are deferred until products are sold by the distributors to the end customers. In those circumstances, revenues are recognized upon receiving notification from the distributors that products have been sold to the end customers. In these cases, at the time of shipment to distributors, we record a trade receivable for the selling price since there is a legally enforceable right to receive payment, relieves inventory for the value of goods shipped since legal title has passed to the distributors, and defers the related margin and price adjustment as deferred income on sales to distributors on the Consolidated Balance Sheets. Any effects of distributor price adjustments are recorded as a reduction to deferred income at the time the distributors sell the products to the end customers and the distributor submits a valid claim for the price adjustment.
We have historically recognized a significant portion of revenue through distributors at the time the distributor resold the product to its end customer (also referred to as the sell-through basis of revenue recognition) given the difficulty in estimating the ultimate price of these product shipments and amount of potential returns. We continuously reassesses our ability to reliably estimate the ultimate price of these products and, over the past several years, have made investments in our systems and process around our distribution channel to improve the quality of the information it receives from our distributors. Given these ongoing investments, and based on the financial framework for estimating potential price adjustments, beginning the fourth quarter of 2014, we concluded that we were able to reasonable estimate returns and pricing concessions on certain product families and with certain distributors, and we recognized revenue at the time it shipped these specific products to the identified distributors, less its estimate of future price adjustments and returns. As a result of this change, we recognized an incremental $12.3 million of revenue during the fourth quarter of fiscal 2014. The impact of this change resulted in an increase of $6.2 million to net income attributable to Cypress for fiscal 2014, or $0.04 per basic and diluted share. During fiscal 2015, we recognized $40.9 million of incremental revenue from this change, which resulted in a decrease in net loss of $25.0 million or $0.07 per basic and diluted shares. During fiscal 2015, we recognized $780.8 million or 68% of distribution revenue on a sell-in basis.
We record as a reduction to revenues reserves for sales returns, price protection and allowances, based upon historical experience rates and for any specific known customer amounts. We also provide certain distributors and EMSs with volume-pricing discounts, such as rebates and incentives, which are recorded as a reduction to revenues at the time of sale. Historically these volume discounts have not been significant.
Our revenue reporting is highly dependent on receiving pertinent, accurate and timely data from our distributors. Distributors provide us periodic data regarding the product, price, quantity, and end customer when products are resold as well as the quantities of our products they still have in stock. Because the data set is large and complex and because there may be errors in the reported data, we must use estimates and apply judgments to reconcile distributors’ reported inventories to their activities. Actual results could vary materially from those estimates.
Business Combinations:
We apply the provisions of Accounting Standards Codification 805, Business Combinations (“ASC 805”), in the accounting for acquisitions. It requires us to recognize separately from goodwill the assets acquired and the liabilities assumed at their acquisition date fair values. Goodwill as of the acquisition date is measured as the excess of consideration transferred over the net of the acquisition date fair values of the assets acquired and the liabilities assumed. While we use our best estimates and assumptions to accurately value assets acquired and liabilities assumed at the acquisition date as well as contingent consideration, where applicable, our estimates are inherently uncertain and subject to refinement. As a result, during the measurement period, which may be up to one year from the acquisition date, we record adjustments to the assets acquired and liabilities assumed with the corresponding offset to goodwill. Upon the conclusion of the measurement period or final determination of the values of assets acquired or liabilities assumed, whichever comes first, any subsequent adjustments are recorded to our Consolidated Statements of Operations. Accounting for business combinations requires the Company's management to make significant estimates and assumptions, especially at the acquisition date including our estimates for intangible assets, contractual obligations assumed, restructuring liabilities, pre-acquisition contingencies and contingent consideration, where applicable. Although we believe the assumptions and estimates it has made have been reasonable and appropriate, they are based in part on historical experience and information obtained from the management of the acquired companies and are inherently uncertain. Critical estimates in valuing certain of the intangible assets we have acquired include but are not limited to: future expected cash flows from product sales, customer contracts and acquired technologies, expected costs to develop in-process research and development into commercially viable products and estimated cash flows from the projects when completed and discount rates. Unanticipated events and circumstances may occur that may affect the accuracy or validity of such assumptions, estimates or actual results.
52
Allowances for Doubtful Accounts Receivable:
We maintain an allowance for doubtful accounts for losses that we estimate will arise from our customers’ inability to make required payments. We make estimates of the collectability of our accounts receivable by considering factors such as historical bad debt experience, specific customer creditworthiness, the age of the accounts receivable balances and current economic trends that may affect a customer’s ability to pay. If the data we use to calculate the allowance for doubtful accounts does not reflect the future ability to collect outstanding receivables, additional provisions for doubtful accounts may be needed and our results of operations could be materially affected.
Valuation of Inventories:
Management periodically reviews the adequacy of our inventory reserves. We record a write-down for our inventories which have become obsolete or are in excess of anticipated demand or net realizable value. We perform a detailed review of inventories each quarter that considers multiple factors including demand forecasts, product life cycle status, product development plans and current sales levels. Inventory reserves are not relieved until the related inventory has been sold or scrapped. Our inventories may be subject to rapid technological obsolescence and are sold in a highly competitive industry. If there were a sudden and significant decrease in demand for our products, or if there were a higher incidence of inventory obsolescence because of rapidly changing technology and customer requirements, we could be required to record additional write-downs, and our gross margin could be adversely affected. In fiscal 2015, we recorded approximately $133 million of inventory reserves to write down inventory assumed as part of the merger.
Valuation of Long-Lived Assets:
Our business requires heavy investment in manufacturing facilities and equipment that are technologically advanced but can quickly become significantly under-utilized or rendered obsolete by rapid changes in demand. In addition, we have recorded intangible assets with finite lives related to our acquisitions.
We evaluate our long-lived assets, including property, plant and equipment and purchased intangible assets with finite lives, for impairment whenever events or changes in circumstances indicate that the carrying value of such assets may not be recoverable. Factors considered important that could result in an impairment review include significant underperformance relative to expected historical or projected future operating results, significant changes in the manner of use of the assets or the strategy for our business, significant negative industry or economic trends, and a significant decline in our stock price for a sustained period of time. Impairments are recognized based on the difference between the fair value of the asset and its carrying value, and fair value is generally measured based on discounted cash flow analysis. If there is a significant adverse change in our business in the future, we may be required to record impairment charges on our long-lived assets.
Valuation of Goodwill:
Goodwill represents the excess of the purchase price over the fair value of the net tangible and identifiable intangible assets acquired in a business combination. We assess our goodwill for impairment on an annual basis and, if certain events or circumstances indicate that an impairment loss may have been incurred, on an interim basis. In accordance with ASU 2011-08, Testing Goodwill for Impairment, qualitative factors can be assessed to determine whether it is necessary to perform the current two-step test for goodwill impairment. If we believe, as a result of our qualitative assessment, that it is more-likely-than-not that the fair value of a reporting unit is less than its carrying amount, the quantitative impairment test is required. Otherwise, no further testing is required.
We have four reporting units of which two, Memory Products division (MPD) and Programmable Systems Division (PSD), have goodwill. Determining the number of reporting units and the fair value of a reporting unit requires us to make judgments and involves the use of significant estimates and assumptions. We also make judgments and assumptions in allocating assets and liabilities to each of our reporting units. We base our fair value estimates on assumptions we believe to be reasonable but that are also unpredictable and inherently uncertain.
53
The changes in the carrying amount of goodwill for the year ended January 3, 2016 were as follows:
|
|
|
MPD |
|
|
PSD |
|
|
Total |
|
|||
|
|
|
(in thousands) |
|
|||||||||
|
Goodwill as of December 28, 2014 |
|
$ |
33,860 |
|
|
$ |
31,836 |
|
|
$ |
65,696 |
|
|
Goodwill from merger with Spansion (1) |
|
|
739,036 |
|
|
|
937,000 |
|
|
|
1,676,036 |
|
|
Measurement period adjustments |
|
|
(2,850 |
) |
|
|
— |
|
|
|
(2,850 |
) |
|
Goodwill as of January 3, 2016 |
|
$ |
770,046 |
|
|
$ |
968,836 |
|
|
$ |
1,738,882 |
|
|
(1) |
Refer Note 2 for further details. |
On the first day of our fourth quarter of fiscal 2015, we performed our annual goodwill impairment assessment using the two-step quantitative goodwill impairment test. The first step of the quantitative goodwill impairment test is to identify a potential impairment by comparing the fair value of a reporting unit with its carrying amount. The second step compares the implied fair value of the reporting unit’s goodwill with the carrying amount of that goodwill. The implied fair value of goodwill is determined in the same manner as the amount of goodwill recognized in a business combination.
We estimated the fair values of our reporting units using a combination of the income and market approach. These valuation approaches consider a number of factors that include, but are not limited to, forecasted financial information, growth rates, terminal or residual values, discount rates and comparable multiples from publicly traded companies in our industry and require us to make certain assumptions and estimates regarding industry economic factors and the future profitability of our business.
The income approach utilizes estimates of discounted future cash flows. Key assumptions used in the market approach include the selection of appropriate benchmark companies and the selection of an appropriate market value multiple for each reporting unit based on a comparison of the reporting unit with the benchmark companies as of the impairment testing date.
In performing our 2015 assessment, we applied a weighting of 75% to the income approach and 25% to the market approach. Given that the reporting units are transitioning out of a period of declining revenue and profit, we believe the income approach is a better indication of the going concern value of the reporting units as it better captures the expected improvement in revenue and profit. As such, we placed more weighing on the income approach. Furthermore, as the market approach reflected general macroeconomic concerns that were evidenced in valuations for multiple publicly traded companies, the Company concluded this approach was not as relevant to the impairment calculation.
Based on our goodwill impairment testing, we determined that there was no impairment of our goodwill. The fair value of our MPD reporting unit exceeded its carrying value by 53% and the fair value of our PSD reporting unit exceeded its carrying value by 9%. As a result, if we applied a hypothetical 10% decrease to the fair value of each reporting unit, it would have resulted in the fair value of our PSD reporting unit being less than its carrying value. As an overall test of the reasonableness of estimated fair values of our two reporting units, we reconciled the combined fair value estimates of our reporting units to our market capitalization as of the valuation date. The reconciliation confirmed that the fair values were relatively representative of the market views when applying a reasonable control premium to the market capitalization. However, any significant reductions in the actual amount of future cash flows realized by our reporting units, reductions in the value of market comparables, or reductions in our market capitalization could impact future estimates of the fair values of our reporting units. Such events could ultimately result in a material charge to our results of operations in future periods due to the potential for a write-down of the goodwill associated with our reporting units.
54
Based on our testing, we determined that there was a risk of our PSD reporting unit failing the first step of goodwill impairment test in future periods. For this reporting unit, the underlying assumptions we used in assessing fair value include, but are not limited to, declines in our stock price or our peers’ stock prices, relatively small declines in the future performance and cash flows of the reporting unit or small changes in other key assumptions, such as revenue growth rates and discount rates. Specifically, the income approach valuation for PSD included the following assumptions for 2015:
|
|
|
Year Ended |
|
|
|
|
|
January 3, 2016 |
|
|
|
Discount rate |
|
|
9% |
|
|
Long-term growth rate |
|
|
4% |
|
|
Tax rate |
|
|
28% |
|
|
Risk free rate |
|
|
4% |
|
|
Peer company beta |
|
|
0.97 |
|
Our PSD reporting unit is highly sensitive to management’s plans for increasing sales and gross margins by expanding PSOC 3/4/5 and the Automotive business as well as the achievement of our cost reduction initiatives. If the actual revenue growth and profitability improvements forecasted for the PSD reporting unit do not achieve the levels we estimated in assessing the fair value of the PSD reporting unit, the fair value of the PSD reporting unit may decline. A future decline in the fair value of the PSD reporting unit may result in the recognition of an impairment charge to our earnings as a result of a write-down of the value of the goodwill associated with that reporting unit.
Our next annual evaluation of the goodwill by reporting unit will be performed on the first day of the fourth quarter of fiscal year 2016, or earlier if indicators of potential impairment exist. Such indicators include, but are not limited to, challenging economic conditions, such as a decline in our operating results, an unfavorable industry or macroeconomic environment, a substantial decline in our stock price, or any other adverse change in market conditions. Such conditions could have the effect of changing one of the critical assumptions or estimates we use to calculate the fair value of our reporting units, which could result in a decrease in fair value and require us to record goodwill impairment charges.
In fiscal 2014, we elected to perform a qualitative analysis for impairment on goodwill rather than to perform the two-step quantitative goodwill impairment test. We assessed qualitative factors to determine whether it was necessary to perform the two-step goodwill impairment test. After assessing many qualitative factors pertinent to our Company we determined that it was more likely than not that the fair value of our reporting unit exceeds its carrying amount. In assessing the qualitative factors, we considered the impact of these key factors: 1) change in the industry and competitive environment, 2) market capitalization, 3) stock price and 4) overall financial performance. Based on the results of the testing, no goodwill impairment was recognized in fiscal 2014.
In fiscal 2013, we elected to perform the two-step quantitative goodwill impairment test. Based on the results of the testing, no goodwill impairment was recognized in 2013.
Fair Value of Financial Instruments:
Fair value is the price that would be received to sell an asset or paid to transfer a liability in an orderly transaction between market participants at the measurement date. Our financial assets and financial liabilities that require recognition under the guidance generally include available-for-sale investments, employee deferred compensation plan and foreign currency derivatives. The guidance establishes a hierarchy for inputs used in measuring fair value that maximizes the use of observable inputs and minimizes the use of unobservable inputs by requiring that the observable inputs be used when available. Observable inputs are inputs that market participants would use in pricing the asset or liability developed based on market data obtained from sources independent of us. Unobservable inputs are inputs that reflect our assumptions about the assumptions market participants would use in pricing the asset or liability developed based on the best information available in the circumstances. As such, fair value is a market-based measure considered from the perspective of a market participant who holds the asset or owes the liability rather than an entity-specific measure. The hierarchy is broken down into three levels based on the reliability of inputs as follows:
|
|
· |
Level 1 includes instruments for which quoted prices in active markets for identical assets or liabilities that we have the ability to access. Our financial assets utilizing Level 1 inputs include U.S. treasuries, money market funds, marketable equity securities and our employee deferred compensation plan assets with the exception of our stable value funds which are considered Level 2 instruments. |
55
|
|
· |
Level 2 includes instruments for which the valuations are based on quoted prices for similar assets or liabilities, quoted prices in markets that are not active, or other inputs that are observable or can be corroborated by observable data for substantially the full term of the assets or liabilities. Level 2 assets consist of certain marketable debt instruments for which values are determined using inputs that are observable in the market or can be derived principally from or corroborated by observable market data. Our Level 2 instruments include certain U.S. government securities, commercial paper, corporate notes and bonds, assets held-for-sale and our employee deferred compensation plan liabilities and our stable value funds included in our deferred compensation plan assets. |
|
|
· |
Level 3 includes valuations based on inputs that are unobservable and significant to the overall fair value measurement. Consideration is given to the risk inherent in the valuation technique and the risk inherent in the inputs to the model. Financial assets utilizing Level 3 inputs primarily include auction rate securities. We do not have any financial assets or liabilities utilizing Level 3 inputs. |
Cash Flow Hedges:
The Company enters into cash flow hedges to protect non-functional currency revenues, inventory purchases and certain other operational expenses against variability in cash flows due to foreign currency fluctuations. The Company’s foreign currency forward contracts that were designated as cash flow hedges have maturities between three and nine months. All hedging relationships are formally documented, and the hedges are designed to offset changes to future cash flows on hedged transactions at the inception of the hedge. The Company recognizes derivative instruments from hedging activities as either assets or liabilities on the balance sheet and measures them at fair value on a monthly basis. The Company records changes in the intrinsic value of its cash flow hedges in accumulated other comprehensive income on the Consolidated Balance Sheets, until the forecasted transaction occurs. Interest charges or “forward points” on the forward contracts are excluded from the assessment of hedge effectiveness and are recorded in other income (expense), net in the Consolidated Statements of Operations. When the forecasted transaction occurs, the Company reclassifies the related gain or loss on the cash flow hedge to revenue or costs, depending on the risk hedged. In the event the underlying forecasted transaction does not occur, or it becomes probable that it will not occur, the Company will reclassify the gain or loss on the related cash flow hedge from accumulated other comprehensive income to other income (expense), net in its Consolidated Statements of Operations at that time.
The Company evaluates hedge effectiveness at the inception of the hedge prospectively as well as retrospectively and records any ineffective portion of the hedge in other income (expense), net in its Consolidated Statements of Operations. Refer Note 11 for further details on cash flow and balance sheet hedges.
Stock-Based Compensation:
Under the fair value recognition provisions of the guidance, we recognize stock-based compensation net of an estimated forfeiture rate and only recognize compensation cost for those shares expected to vest over the requisite service period of the awards. Determining the appropriate fair value model and calculating the fair value of share-based payment awards require the input of highly subjective assumptions, including measurement of level of achievement of performance milestones, the expected life of the share-based payment awards and stock price volatility. The assumptions used in calculating the fair value of share-based payment awards represent management’s best estimates, but these estimates involve inherent uncertainties and the application of management judgment. As a result, if factors change and we use different assumptions, our stock-based compensation expense could be materially different in the future. In addition, we are required to estimate the expected forfeiture rate and only recognize expense for those shares expected to vest. If our actual forfeiture rate is materially different from our estimate, our future stock-based compensation expense could be significantly different from what we have recorded.
Employee Benefit Plans:
In connection with the Merger, we assumed the Spansion Innovates Group Cash Balance Plan (a defined benefit pension plan) in Japan. A defined benefit pension plan is accounted for on an actuarial basis, which requires the selection of various assumptions such as turnover rates, discount rates and other factors. The discount rate assumption is determined by comparing the projected benefit payments to the Japanese corporate bonds yield curve as of end of the most recently completed fiscal year. The benefit obligation is the projected benefit obligation (PBO), which represents the actuarial present value of benefits expected to be paid upon retirement. This liability is recorded in other long term liabilities on the Consolidated Balance Sheets. Net periodic pension cost is recorded in the Consolidated Statements of Operations and includes service cost. Service cost represents the actuarial present value of participant benefits earned in the current year. Interest cost represents the time value of money associated with the passage of time on the PBO. Gains or losses resulting from a change in the PBO if actual results differ from actuarial assumptions will be accumulated and amortized over the future life of the plan participants if they exceed 10% of the PBO, being the corridor amount. If the amount of a net gain or loss does not exceed the corridor amount, it will be recorded to other comprehensive income (loss). See Note 17 for further details of the pension plans.
56
Accounting for Income Taxes:
Our global operations involve manufacturing, research and development and selling activities. Profits from non-U.S. activities are subject to local country taxes but are not subject to U.S. tax until repatriated to the U.S. United States income tax has not been provided on a portion of earnings of our non-U.S. subsidiaries to the extent that such earnings are considered to be indefinitely reinvested. We record a valuation allowance to reduce our deferred tax assets to the amount that is more likely than not to be realized. We consider historical levels of income, expectations and risks associated with estimates of future taxable income and ongoing prudent and feasible tax planning strategies in assessing the need for the valuation allowance. Should we determine that we would be able to realize deferred tax assets in the future in excess of the net recorded amount, we would record an adjustment to the deferred tax asset valuation allowance. This adjustment would increase income in the period such determination is made.
The calculation of tax liabilities involves dealing with uncertainties in the application of complex global tax regulations. We recognize potential liabilities for anticipated tax audit issues in the U.S. and other tax jurisdictions based on our estimate of whether, and the extent to which, additional taxes will be due. If payment of these amounts ultimately proves to be unnecessary, the reversal of the liabilities would result in tax benefits being recognized in the period when we determine the liabilities are no longer necessary. If the estimate of tax liabilities proves to be less than the ultimate tax assessment, a further charge to expense would result.
Recent Accounting Pronouncements
See “Recent Accounting Pronouncements” in Note 1 of Notes to Consolidated Financial Statements under Item 8 of this Annual Report on Form 10-K.
Interest Rate Risks
Our investment portfolio consists of a variety of financial instruments that expose us to interest rate risk, including, but not limited to, money market funds, certificate of deposit and corporate securities. These investments are generally classified as available-for-sale and, consequently, are recorded on our balance sheets at fair market value with their related unrealized gain or loss reflected as a component of accumulated other comprehensive income in stockholders’ equity. Due to the relatively short-term nature of our investment portfolio, we do not believe that an immediate 10% increase in interest rates would have a material effect on the fair market value of our portfolio. Since we believe we have the ability to liquidate this portfolio, we do not expect our operating results or cash flows to be materially affected to any significant degree by a sudden change in market interest rates on our investment portfolio.
Foreign Currency Exchange Risk
We operate and sell products in various global markets and purchase capital equipment using foreign currencies but predominantly the U.S. dollar. Pursuant to our Merger, we are exposed to certain risks associated with changes in foreign currency exchange rates in Japanese yen and other foreign currencies and are exposed to foreign currency exchange rate fluctuations.
For example,
|
|
· |
sales of our products to Fujitsu are denominated in U.S. dollars, Japanese yen and Euro; |
|
|
· |
some of our manufacturing costs are denominated in Japanese yen, and other foreign currencies such as the Thai baht and Malaysian ringgit; |
|
|
· |
some of our operating expenses are denominated in Japanese yen and |
|
|
· |
some fixed asset purchases and sales are denominated in other foreign currencies. |
Consequently, movements in exchange rates could cause our net sales and our expenses to fluctuate, affecting our profitability and cash flows. We use foreign currency forward contracts to reduce our foreign exchange exposure on our foreign currency denominated assets and liabilities. We also hedge a percentage of our forecasted revenue denominated in Japanese yen with foreign currency forward contracts. The objective of these contracts is to mitigate impact of foreign currency exchange rate movements to our operating results on a short term basis. We do not use these contracts for speculative or trading purposes.
57
We recognize derivative instruments from hedging activities as either assets or liabilities on the balance sheet and measure them at fair value. Gains and losses resulting from changes in fair value are accounted for depending on the use of the derivative and whether it is designated and qualifies for hedge accounting. To receive hedge accounting treatment, all hedging relationships are formally documented at the inception of the hedge, and the hedges must be highly effective in offsetting changes to future cash flows on hedged transactions. We record changes in the intrinsic value of these cash flow hedges in accumulated other comprehensive loss on the Consolidated Balance Sheets, until the forecasted transaction occurs. When the forecasted transaction occurs, we reclassify the related gain or loss on the cash flow hedge to the appropriate revenue or expense line of the Consolidated Statements of Operations. In the event the underlying forecasted transaction does not occur, or it becomes probable that it will not occur, we will reclassify the gain or loss on the related cash flow hedge from accumulated other comprehensive loss to other income (expense), net in our Consolidated Statements of Operations at that time.
We evaluate hedge effectiveness at the inception of the hedge prospectively as well as retrospectively and record any ineffective portion of the hedging instruments in other income (expense), net in our Consolidated Statements of Operations.
We analyzed our foreign currency exposure, including our hedging strategies, to identify assets and liabilities denominated in other currencies. For those assets and liabilities, we evaluated the effects of a 10% shift in exchange rates between those currencies and the U.S. dollar. We have determined that there would be an immaterial effect on our results of operations from such a shift. Please see Note 11 of Notes to Consolidated Financial Statements under Item 8 for details on the contracts.
58
INDEX TO CONSOLIDATED FINANCIAL STATEMENTS
|
|
Page |
|
60 |
|
|
|
|
|
61 |
|
|
|
|
|
62 |
|
|
|
|
|
63 |
|
|
|
|
|
64 |
|
|
|
|
|
66 |
|
|
|
|
|
108 |
|
|
|
|
|
117 |
59
CYPRESS SEMICONDUCTOR CORPORATION
|
|
|
January 3, 2016 |
|
|
December 28, 2014 |
|
||
|
|
|
(In thousands, except per-share amounts) |
|
|||||
|
ASSETS |
|
|
|
|
|
|
|
|
|
Current assets: |
|
|
|
|
|
|
|
|
|
Cash and cash equivalents |
|
$ |
226,690 |
|
|
$ |
103,736 |
|
|
Short-term investments |
|
|
871 |
|
|
|
15,076 |
|
|
Accounts receivable, net |
|
|
292,736 |
|
|
|
75,984 |
|
|
Inventories |
|
|
243,595 |
|
|
|
88,227 |
|
|
Other current assets |
|
|
86,880 |
|
|
|
29,288 |
|
|
Total current assets |
|
|
850,772 |
|
|
|
312,311 |
|
|
Property, plant and equipment, net |
|
|
425,003 |
|
|
|
237,763 |
|
|
Goodwill |
|
|
1,738,882 |
|
|
|
65,696 |
|
|
Intangible assets, net |
|
|
789,195 |
|
|
|
33,918 |
|
|
Other long-term assets |
|
|
200,409 |
|
|
|
93,593 |
|
|
Total assets |
|
$ |
4,004,261 |
|
|
$ |
743,281 |
|
|
LIABILITIES AND EQUITY |
|
|
|
|
|
|
|
|
|
Current liabilities: |
|
|
|
|
|
|
|
|
|
Accounts payable |
|
$ |
143,383 |
|
|
$ |
42,678 |
|
|
Accrued compensation and employee benefits |
|
|
54,850 |
|
|
|
35,182 |
|
|
Deferred margin on sales to distributors |
|
|
73,370 |
|
|
|
75,569 |
|
|
Dividends payable |
|
|
36,520 |
|
|
|
17,931 |
|
|
Income taxes payable |
|
|
3,262 |
|
|
|
2,710 |
|
|
Current portion of long-term debt |
|
|
14,606 |
|
|
|
6,143 |
|
|
Other current liabilities |
|
|
202,405 |
|
|
|
94,619 |
|
|
Total current liabilities |
|
|
528,396 |
|
|
|
274,832 |
|
|
Deferred income taxes and other tax liabilities |
|
|
51,737 |
|
|
|
18,784 |
|
|
Revolving credit facility and long-term debt |
|
|
673,659 |
|
|
|
237,107 |
|
|
Other long-term liabilities |
|
|
37,784 |
|
|
|
10,693 |
|
|
Total liabilities |
|
|
1,291,576 |
|
|
|
541,416 |
|
|
Commitments and contingencies (Note 19) |
|
|
— |
|
|
|
— |
|
|
Equity: |
|
|
|
|
|
|
|
|
|
Preferred stock, $.01 par value, 5,000 shares authorized; none issued and outstanding |
|
|
— |
|
|
|
— |
|
|
Common stock, $.01 par value, 650,000 and 650,000 shares authorized; 481,912 and 306,167 shares issued; 332,276 and 163,013 shares outstanding at January 3, 2016 and December 28, 2014, respectively |
|
|
4,637 |
|
|
|
3,039 |
|
|
Additional paid-in-capital |
|
|
5,623,411 |
|
|
|
2,675,170 |
|
|
Accumulated other comprehensive loss |
|
|
(227 |
) |
|
|
(46 |
) |
|
Accumulated deficit |
|
|
(758,780 |
) |
|
|
(379,913 |
) |
|
Stockholders’ equity before treasury stock |
|
|
4,869,041 |
|
|
|
2,298,250 |
|
|
Less: shares of common stock held in treasury, at cost; 149,636 and 143,154 shares at January 3, 2016 and December 28, 2014, respectively |
|
|
(2,148,193 |
) |
|
|
(2,090,493 |
) |
|
Total Cypress stockholders’ equity |
|
|
2,720,848 |
|
|
|
207,757 |
|
|
Non-controlling interest |
|
|
(8,163 |
) |
|
|
(5,892 |
) |
|
Total equity |
|
|
2,712,685 |
|
|
|
201,865 |
|
|
Total liabilities and equity |
|
$ |
4,004,261 |
|
|
$ |
743,281 |
|
The accompanying notes are an integral part of these consolidated financial statements.
60
CYPRESS SEMICONDUCTOR CORPORATION
CONSOLIDATED STATEMENTS OF OPERATIONS
|
|
|
Year Ended |
|
|||||||||
|
|
|
January 3, 2016 |
|
|
December 28, 2014 |
|
|
December 29, 2013 |
|
|||
|
|
|
(In thousands, except per-share amounts) |
|
|||||||||
|
Revenues |
|
$ |
1,607,853 |
|
|
$ |
725,497 |
|
|
$ |
722,693 |
|
|
Costs and expenses: |
|
|
|
|
|
|
|
|
|
|
|
|
|
Cost of revenues |
|
|
1,207,850 |
|
|
|
361,820 |
|
|
|
384,121 |
|
|
Research and development |
|
|
281,391 |
|
|
|
164,560 |
|
|
|
190,906 |
|
|
Selling, general and administrative |
|
|
323,570 |
|
|
|
170,741 |
|
|
|
182,671 |
|
|
Amortization of acquisition-related intangible assets |
|
|
108,335 |
|
|
|
6,683 |
|
|
|
7,833 |
|
|
Restructuring costs (benefit) |
|
|
90,084 |
|
|
|
(1,180 |
) |
|
|
15,357 |
|
|
Gain on divestiture of TrueTouch® Mobile business |
|
|
(66,472 |
) |
|
|
— |
|
|
|
— |
|
|
Total costs and expenses, net |
|
|
1,944,758 |
|
|
|
702,624 |
|
|
|
780,888 |
|
|
Operating income (loss) |
|
|
(336,905 |
) |
|
|
22,873 |
|
|
|
(58,195 |
) |
|
Interest expense |
|
|
(16,356 |
) |
|
|
(5,763 |
) |
|
|
(8,112 |
) |
|
Other income (expense), net |
|
|
(3,769 |
) |
|
|
3,303 |
|
|
|
10,337 |
|
|
Income (loss) before income taxes and non-controlling interest |
|
|
(357,030 |
) |
|
|
20,413 |
|
|
|
(55,970 |
) |
|
Income tax benefit (provision) |
|
|
(16,960 |
) |
|
|
1,173 |
|
|
|
7,761 |
|
|
Equity in net loss of equity method investee |
|
|
(7,148 |
) |
|
|
(5,068 |
) |
|
|
(1,878 |
) |
|
Net Income (loss) |
|
|
(381,138 |
) |
|
|
16,518 |
|
|
|
(50,087 |
) |
|
Net income (loss) attributable to non-controlling interest, net of taxes |
|
|
2,271 |
|
|
|
1,418 |
|
|
|
1,845 |
|
|
Net income (loss) attributable to Cypress |
|
|
(378,867 |
) |
|
|
17,936 |
|
|
|
(48,242 |
) |
|
Net income (loss) per share attributable to Cypress: |
|
|
|
|
|
|
|
|
|
|
|
|
|
Basic |
|
$ |
(1.25 |
) |
|
$ |
0.11 |
|
|
$ |
(0.32 |
) |
|
Diluted |
|
$ |
(1.25 |
) |
|
$ |
0.11 |
|
|
$ |
(0.32 |
) |
|
Cash dividends declared per share |
|
$ |
0.44 |
|
|
$ |
0.44 |
|
|
$ |
0.44 |
|
|
Shares used in net income (loss) per share calculation: |
|
|
|
|
|
|
|
|
|
|
|
|
|
Basic |
|
|
302,036 |
|
|
|
159,031 |
|
|
|
148,558 |
|
|
Diluted |
|
|
302,036 |
|
|
|
169,122 |
|
|
|
148,558 |
|
The accompanying notes are an integral part of these consolidated financial statements
61
CYPRESS SEMICONDUCTOR CORPORATION
CONSOLIDATED STATEMENTS OF COMPREHENSIVE INCOME (LOSS)
|
|
|
Twelve Months Ended |
|
|||||||||
|
|
|
January 3, 2016 |
|
|
December 28, 2014 |
|
|
December 29, 2013 |
|
|||
|
|
|
(In thousands) |
|
|||||||||
|
Net income (loss) |
|
$ |
(381,138 |
) |
|
$ |
16,518 |
|
|
$ |
(50,087 |
) |
|
Other comprehensive income (loss), net of taxes: |
|
|
|
|
|
|
|
|
|
|
|
|
|
Net change in unrealized gains (losses) on available-for-sale securities |
|
|
28 |
|
|
|
131 |
|
|
|
267 |
|
|
Reclassification of net realized (gains) losses on available-for-sale securities included in net income (loss) |
|
|
— |
|
|
|
171 |
|
|
|
885 |
|
|
Net unrecognized gain on the Defined Benefit Plan |
|
|
26 |
|
|
|
— |
|
|
|
— |
|
|
Net unrealized gain (loss) on cash flow hedges: |
|
|
|
|
|
|
|
|
|
|
|
|
|
Net unrealized gain (loss) arising during the period |
|
|
(1,651 |
) |
|
|
— |
|
|
|
— |
|
|
Net (gain) reclassified into earnings for revenue hedges (effective portion) |
|
|
(1,678 |
) |
|
|
— |
|
|
|
— |
|
|
Net loss reclassified into earnings for expense hedges (ineffective portion) |
|
|
80 |
|
|
|
|
|
|
|
— |
|
|
Net loss reclassified into earnings for expense hedges (effective portion) |
|
|
3,014 |
|
|
|
— |
|
|
|
— |
|
|
Net unrealized gain (loss) on cash flow hedges |
|
|
(235 |
) |
|
|
— |
|
|
|
— |
|
|
Other comprehensive gain (loss) |
|
|
(181 |
) |
|
|
302 |
|
|
|
1,152 |
|
|
Comprehensive income (loss) |
|
|
(381,319 |
) |
|
|
16,820 |
|
|
|
(48,935 |
) |
|
Comprehensive loss attributable to non-controlling interest |
|
|
2,271 |
|
|
|
1,418 |
|
|
|
1,845 |
|
|
Comprehensive income (loss) attributable to Cypress |
|
$ |
(379,048 |
) |
|
$ |
18,238 |
|
|
$ |
(47,090 |
) |
The accompanying notes are an integral part of these consolidated financial statements.
62
CYPRESS SEMICONDUCTOR CORPORATION
CONSOLIDATED STATEMENTS OF STOCKHOLDERS’ EQUITY
|
|
|
Common Stock |
|
|
Additional Paid-In |
|
|
Accumulated Other Comprehensive |
|
|
Accumulated |
|
|
Treasury Stock |
|
|
Noncontrolling |
|
|
Total |
|
|||||||||||||||
|
|
|
Shares |
|
|
Amount |
|
|
Capital |
|
|
Income (Loss) |
|
|
Deficit |
|
|
Shares |
|
|
Amount |
|
|
Interest |
|
|
Equity |
|
|||||||||
|
|
|
(In thousands) |
|
|||||||||||||||||||||||||||||||||
|
Balances at January 2, 2013 |
|
|
286,903 |
|
|
$ |
2,868 |
|
|
$ |
2,612,579 |
|
|
$ |
(444 |
) |
|
$ |
(349,607 |
) |
|
$ |
142,679 |
|
|
$ |
(2,085,570 |
) |
|
$ |
(4,039 |
) |
|
$ |
175,787 |
|
|
Comprehensive income: |
|
|
|
|
|
|
|
|
|
|
|
|
|
|
|
|
|
|
|
|
|
|
|
|
|
|
|
|
|
|
|
|
|
|
|
|
|
Net income attributable to Cypress |
|
|
— |
|
|
|
— |
|
|
|
— |
|
|
|
— |
|
|
|
(48,242 |
) |
|
|
— |
|
|
|
— |
|
|
|
— |
|
|
|
(48,242 |
) |
|
Net unrealized gain on available-for-sale investments |
|
|
— |
|
|
|
— |
|
|
|
— |
|
|
|
267 |
|
|
|
— |
|
|
|
— |
|
|
|
— |
|
|
|
— |
|
|
|
267 |
|
|
Issuance of common shares under employee stock plans |
|
|
9,443 |
|
|
|
95 |
|
|
|
43,249 |
|
|
|
— |
|
|
|
— |
|
|
|
— |
|
|
|
— |
|
|
|
— |
|
|
|
43,344 |
|
|
Withholding of common shares for tax obligations on vested restricted shares |
|
|
— |
|
|
|
— |
|
|
|
— |
|
|
|
— |
|
|
|
— |
|
|
|
453 |
|
|
|
(4,663 |
) |
|
|
— |
|
|
|
(4,663 |
) |
|
Stock-based compensation |
|
|
— |
|
|
|
— |
|
|
|
75,447 |
|
|
|
— |
|
|
|
— |
|
|
|
— |
|
|
|
— |
|
|
|
— |
|
|
|
75,447 |
|
|
Dividends |
|
|
— |
|
|
|
— |
|
|
|
(65,822 |
) |
|
|
— |
|
|
|
— |
|
|
|
— |
|
|
|
— |
|
|
|
— |
|
|
|
(65,822 |
) |
|
Noncontrolling interest |
|
|
— |
|
|
|
— |
|
|
|
— |
|
|
|
— |
|
|
|
— |
|
|
|
— |
|
|
|
— |
|
|
|
(435 |
) |
|
|
(435 |
) |
|
Balances at December 29, 2013 |
|
|
296,346 |
|
|
$ |
2,963 |
|
|
$ |
2,665,453 |
|
|
$ |
(177 |
) |
|
$ |
(397,849 |
) |
|
$ |
143,132 |
|
|
$ |
(2,090,233 |
) |
|
$ |
(4,474 |
) |
|
$ |
175,683 |
|
|
Comprehensive income: |
|
|
|
|
|
|
|
|
|
|
|
|
|
|
|
|
|
|
|
|
|
|
|
|
|
|
|
|
|
|
|
|
|
|
|
|
|
Net income attributable to Cypress |
|
|
— |
|
|
|
— |
|
|
|
— |
|
|
|
— |
|
|
|
17,936 |
|
|
|
— |
|
|
|
— |
|
|
|
— |
|
|
|
17,936 |
|
|
Net unrealized gain on available-for-sale investments |
|
|
— |
|
|
|
— |
|
|
|
— |
|
|
|
131 |
|
|
|
— |
|
|
|
— |
|
|
|
— |
|
|
|
— |
|
|
|
131 |
|
|
Yield enhancement structured agreements, net |
|
|
— |
|
|
|
— |
|
|
|
318 |
|
|
|
— |
|
|
|
— |
|
|
|
— |
|
|
|
— |
|
|
|
— |
|
|
|
318 |
|
|
Issuance of common shares under employee stock plans |
|
|
9,821 |
|
|
|
76 |
|
|
|
33,071 |
|
|
|
— |
|
|
|
— |
|
|
|
— |
|
|
|
— |
|
|
|
— |
|
|
|
33,147 |
|
|
Withholding of common shares for tax obligations on vested restricted shares |
|
|
— |
|
|
|
— |
|
|
|
— |
|
|
|
— |
|
|
|
— |
|
|
|
22 |
|
|
|
(260 |
) |
|
|
— |
|
|
|
(260 |
) |
|
Stock-based compensation |
|
|
— |
|
|
|
— |
|
|
|
46,663 |
|
|
|
— |
|
|
|
— |
|
|
|
— |
|
|
|
— |
|
|
|
— |
|
|
|
46,663 |
|
|
Dividends |
|
|
— |
|
|
|
— |
|
|
|
(70,335 |
) |
|
|
— |
|
|
|
— |
|
|
|
— |
|
|
|
— |
|
|
|
— |
|
|
|
(70,335 |
) |
|
Noncontrolling interest |
|
|
— |
|
|
|
— |
|
|
|
— |
|
|
|
— |
|
|
|
— |
|
|
|
— |
|
|
|
— |
|
|
|
(1,418 |
) |
|
|
(1,418 |
) |
|
Balances at December 28, 2014 |
|
|
306,167 |
|
|
$ |
3,039 |
|
|
$ |
2,675,170 |
|
|
$ |
(46 |
) |
|
$ |
(379,913 |
) |
|
|
143,154 |
|
|
$ |
(2,090,493 |
) |
|
$ |
(5,892 |
) |
|
$ |
201,865 |
|
|
Comprehensive income: |
|
|
|
|
|
|
|
|
|
|
|
|
|
|
|
|
|
|
|
|
|
|
|
|
|
|
|
|
|
|
|
|
|
|
|
|
|
Net income attributable to Cypress |
|
|
— |
|
|
|
— |
|
|
|
— |
|
|
|
— |
|
|
|
(378,867 |
) |
|
|
— |
|
|
|
— |
|
|
|
— |
|
|
|
(378,867 |
) |
|
Net unrealized gain on available-for-sale investments |
|
|
— |
|
|
|
— |
|
|
|
— |
|
|
|
(181 |
) |
|
|
— |
|
|
|
|
|
|
|
— |
|
|
|
— |
|
|
|
(181 |
) |
|
Changes in employee deferred compensation plan assets |
|
|
— |
|
|
|
— |
|
|
|
— |
|
|
|
— |
|
|
|
— |
|
|
|
— |
|
|
|
(227 |
) |
|
|
— |
|
|
|
(227 |
) |
|
Yield enhancement structured agreements, net |
|
|
— |
|
|
|
(96 |
) |
|
|
(9,118 |
) |
|
|
— |
|
|
|
— |
|
|
|
1,000 |
|
|
|
— |
|
|
|
— |
|
|
|
(9,214 |
) |
|
Assumption of stock options and awards related to Spansion Merger |
|
|
163,932 |
|
|
|
— |
|
|
|
2,666,865 |
|
|
|
— |
|
|
|
— |
|
|
|
— |
|
|
|
— |
|
|
|
— |
|
|
|
2,666,865 |
|
|
Assumption of 2.00% Senior Exchangeable Notes related to Spansion Merger |
|
|
— |
|
|
|
— |
|
|
|
287,362 |
|
|
|
— |
|
|
|
— |
|
|
|
— |
|
|
|
— |
|
|
|
— |
|
|
|
287,362 |
|
|
Issuance of common shares under employee stock plans |
|
|
11,813 |
|
|
|
1,694 |
|
|
|
53,863 |
|
|
|
— |
|
|
|
— |
|
|
|
— |
|
|
|
— |
|
|
|
— |
|
|
|
55,557 |
|
|
Withholding of common shares for tax obligations on vested restricted shares |
|
|
— |
|
|
|
— |
|
|
|
— |
|
|
|
— |
|
|
|
— |
|
|
|
234 |
|
|
|
(2,455 |
) |
|
|
— |
|
|
|
(2,455 |
) |
|
Repurchase of common shares |
|
|
|
|
|
|
|
|
|
|
|
|
|
|
|
|
|
|
|
|
|
|
5,248 |
|
|
|
(55,018 |
) |
|
|
|
|
|
|
(55,018 |
) |
|
Stock-based compensation |
|
|
— |
|
|
|
— |
|
|
|
95,814 |
|
|
|
— |
|
|
|
— |
|
|
|
— |
|
|
|
— |
|
|
|
— |
|
|
|
95,814 |
|
|
Dividends |
|
|
— |
|
|
|
— |
|
|
|
(146,545 |
) |
|
|
— |
|
|
|
— |
|
|
|
— |
|
|
|
— |
|
|
|
— |
|
|
|
(146,545 |
) |
|
Noncontrolling interest |
|
|
— |
|
|
|
— |
|
|
|
— |
|
|
|
— |
|
|
|
— |
|
|
|
— |
|
|
|
— |
|
|
|
(2,271 |
) |
|
|
(2,271 |
) |
|
Balances at January 3, 2016 |
|
|
481,912 |
|
|
$ |
4,637 |
|
|
$ |
5,623,411 |
|
|
$ |
(227 |
) |
|
$ |
(758,780 |
) |
|
|
149,636 |
|
|
$ |
(2,148,193 |
) |
|
$ |
(8,163 |
) |
|
$ |
2,712,685 |
|
The accompanying notes are an integral part of these consolidated financial statements.
63
CYPRESS SEMICONDUCTOR CORPORATION
CONSOLIDATED STATEMENTS OF CASH FLOWS
|
|
|
Year Ended |
|
|||||||||
|
|
|
January 3, 2016 |
|
|
December 28, 2014 |
|
|
December 29, 2013 |
|
|||
|
|
|
(In thousands) |
|
|||||||||
|
Cash flows from operating activities: |
|
|
|
|
|
|
|
|
|
|
|
|
|
Net income (loss) |
|
$ |
(381,138 |
) |
|
$ |
16,518 |
|
|
$ |
(50,087 |
) |
|
Adjustments to reconcile income (loss) to net cash provided by operating activities: |
|
|
|
|
|
|
|
|
|
|
|
|
|
Stock-based compensation expense |
|
|
93,527 |
|
|
|
50,170 |
|
|
|
73,020 |
|
|
Depreciation and amortization |
|
|
241,584 |
|
|
|
46,734 |
|
|
|
48,393 |
|
|
Restructuring costs |
|
|
8,581 |
|
|
|
(1,180 |
) |
|
|
15,357 |
|
|
(Gain) loss on sale or retirement of property and equipment, net |
|
|
424 |
|
|
|
(196 |
) |
|
|
— |
|
|
Gain on divestiture of TrueTouch® Mobile business |
|
|
(66,472 |
) |
|
|
— |
|
|
|
— |
|
|
Equity in loss of equity method investee |
|
|
7,148 |
|
|
|
5,068 |
|
|
|
1,878 |
|
|
Accretion of interest expense on convertible notes |
|
|
2,537 |
|
|
|
— |
|
|
|
— |
|
|
Unrealized loss from trading securities |
|
|
3,191 |
|
|
|
1,667 |
|
|
|
— |
|
|
Other |
|
|
3,042 |
|
|
|
272 |
|
|
|
(718 |
) |
|
Changes in operating assets and liabilities, net of effects of an acquisition and divestiture: |
|
|
|
|
|
|
|
|
|
|
|
|
|
Accounts receivable |
|
|
(117,371 |
) |
|
|
5,099 |
|
|
|
1,837 |
|
|
Inventories |
|
|
288,264 |
|
|
|
9,140 |
|
|
|
29,419 |
|
|
Other current and long-term assets |
|
|
(5,977 |
) |
|
|
10,560 |
|
|
|
8,354 |
|
|
Accounts payable and other liabilities |
|
|
(54,294 |
) |
|
|
(13,126 |
) |
|
|
(51,270 |
) |
|
Deferred margin on sales to distributors |
|
|
(14,245 |
) |
|
|
(27,390 |
) |
|
|
(8,615 |
) |
|
Net cash provided by operating activities |
|
|
8,801 |
|
|
|
103,336 |
|
|
|
67,568 |
|
|
Cash flows from investing activities: |
|
|
|
|
|
|
|
|
|
|
|
|
|
Proceeds from maturities of available-for-sale investments |
|
|
800 |
|
|
|
16,556 |
|
|
|
58,684 |
|
|
Proceeds from sales of available-for-sale investments |
|
|
16,584 |
|
|
|
— |
|
|
|
5,730 |
|
|
Purchases of marketable securities |
|
|
(1,530 |
) |
|
|
(23,425 |
) |
|
|
(23,137 |
) |
|
Business acquisition, net of cash acquired |
|
|
(105,130 |
) |
|
|
— |
|
|
|
— |
|
|
Acquisition of property, plant and equipment |
|
|
(47,206 |
) |
|
|
(20,947 |
) |
|
|
(36,627 |
) |
|
Proceeds from divestiture |
|
|
88,635 |
|
|
|
3,240 |
|
|
|
— |
|
|
Proceeds from sales of property and equipment |
|
|
— |
|
|
|
— |
|
|
|
6,661 |
|
|
Cash paid for cost and equity method investments |
|
|
(34,126 |
) |
|
|
(18,400 |
) |
|
|
(11,961 |
) |
|
Contributions to (distributions from) deferred compensation plan |
|
|
1,511 |
|
|
|
(1,283 |
) |
|
|
(1,247 |
) |
|
Proceeds from sales of equity investments |
|
|
— |
|
|
|
— |
|
|
|
2,158 |
|
|
Other |
|
|
1,375 |
|
|
|
2,103 |
|
|
|
— |
|
|
Net cash provided by (used in) investing activities |
|
|
(79,087 |
) |
|
|
(42,156 |
) |
|
|
261 |
|
64
CYPRESS SEMICONDUCTOR CORPORATION
CONSOLIDATED STATEMENTS OF CASH FLOWS (CONTINUED)
|
|
|
Year Ended |
|
|||||||||
|
|
|
January 3, 2016 |
|
|
December 28, 2014 |
|
|
December 29, 2013 |
|
|||
|
|
|
(In thousands) |
|
|||||||||
|
Cash flows from financing activities: |
|
|
|
|
|
|
|
|
|
|
|
|
|
Repurchase of treasury stock |
|
|
(55,018 |
) |
|
|
— |
|
|
|
— |
|
|
Issuance of common shares under employee stock plans |
|
|
52,857 |
|
|
|
31,755 |
|
|
|
38,681 |
|
|
Yield enhancement structured agreements settled in cash, net |
|
|
387 |
|
|
|
318 |
|
|
|
— |
|
|
Yield enhancement structured agreements settled in common stock, net |
|
|
(9,601 |
) |
|
|
— |
|
|
|
— |
|
|
Payments of dividends |
|
|
(127,995 |
) |
|
|
(69,248 |
) |
|
|
(64,819 |
) |
|
Proceeds from settlement of capped calls |
|
|
25,293 |
|
|
|
— |
|
|
|
— |
|
|
Repayment of equipment leases, loans and others |
|
|
(9,420 |
) |
|
|
(6,278 |
) |
|
|
(8,880 |
) |
|
Borrowings under revolving credit facility and line of credit |
|
|
537,000 |
|
|
|
264,000 |
|
|
|
140,000 |
|
|
Borrowings under Term Loan A |
|
|
97,228 |
|
|
|
— |
|
|
|
— |
|
|
Repayments of revolving credit facility and line of credit loan |
|
|
(315,000 |
) |
|
|
(264,000 |
) |
|
|
(145,000 |
) |
|
Financing costs |
|
|
(2,491 |
) |
|
|
— |
|
|
|
(3,276 |
) |
|
Repayments of other financing agreements |
|
|
— |
|
|
|
— |
|
|
|
(3,140 |
) |
|
Proceeds from sale of shares to noncontrolling interest |
|
|
— |
|
|
|
— |
|
|
|
1,411 |
|
|
Net cash provided by (used in) financing activities |
|
|
193,240 |
|
|
|
(43,453 |
) |
|
|
(45,023 |
) |
|
Net increase in cash and cash equivalents |
|
|
122,954 |
|
|
|
17,727 |
|
|
|
22,806 |
|
|
Cash and cash equivalents, beginning of year |
|
|
103,736 |
|
|
|
86,009 |
|
|
|
63,203 |
|
|
Cash and cash equivalents, end of year |
|
$ |
226,690 |
|
|
$ |
103,736 |
|
|
$ |
86,009 |
|
|
Supplemental disclosures: |
|
|
|
|
|
|
|
|
|
|
|
|
|
Dividends payable |
|
$ |
36,549 |
|
|
$ |
17,931 |
|
|
$ |
16,850 |
|
|
Cash paid for income taxes |
|
$ |
8,736 |
|
|
$ |
4,598 |
|
|
$ |
6,921 |
|
|
Cash paid for interest |
|
$ |
9,670 |
|
|
$ |
5,774 |
|
|
$ |
4,825 |
|
|
Unpaid purchases of property, plant and equipment |
|
$ |
6,663 |
|
|
$ |
1,688 |
|
|
$ |
— |
|
The accompanying notes are an integral part of these consolidated financial statements.
65
CYPRESS SEMICONDUCTOR CORPORATION
NOTES TO CONSOLIDATED FINANCIAL STATEMENTS
NOTE 1. DESCRIPTION OF BUSINESS AND SUMMARY OF SIGNIFICANT ACCOUNTING POLICIES
Description of Business
Cypress Semiconductor Corporation (“Cypress” or the “Company”) designs, develops, manufactures and markets high-performance, high quality, mixed-signal, programmable solutions that provide customers with rapid time-to-market and exceptional system value. The Company’s offerings include the NOR flash memories, F-RAMTM and SRAM, TraveoTM microcontrollers, the industry’s only PSoC® programmable system-on-chip solutions, analog and PMIC Power Management ICs, Capsense® capacitive touch-sensing controllers, and Wireless BLE Bluetooth Low-Energy and universal serial bus (“USB”) connectivity solutions. The Company serves numerous markets including industrial, mobile handsets, consumer, computation, data communications, automotive, and military markets.
The Company’s operations outside of the United States include its assembly and test plants in Malaysia and the Philippines, and sales offices and design centers located in various parts of the world.
On March 12, 2015, the Company completed the merger (“Merger”) with Spansion Inc. ("Spansion") pursuant to the Agreement and Plan of Merger and Reorganization, as of December 1, 2014 (the "Merger Agreement"), for a total consideration of approximately $2.8 billion. In accordance with the terms of the Merger Agreement, Spansion shareholders received 2.457 Cypress shares for each Spansion share they owned. The shareholders of each company initially owned approximately 50% of the post-merger company. The Merger has been accounted for under the acquisition method of accounting in accordance with Financial Accounting Standards Board Accounting Standard Topic 805, Business Combinations, with Cypress treated as the accounting acquirer. See Note 2 for a detailed discussion of the Merger with Spansion.
Basis of Preparation
The Company reports on a fiscal-year basis. The Company ends its quarters on the Sunday closest to the end of the applicable calendar quarter, except in a 53-week fiscal year, in which case the additional week falls into the fourth quarter of that fiscal year. Fiscal 2015 ended on January 3, 2016, Fiscal 2014 ended on December 28, 2014 and fiscal 2013 ended on December 29, 2013. Fiscal 2015 contained 53 weeks. Fiscal years 2014 and 2013 each contained 52 weeks. The additional week in 2015 did not materially affect the Company's results of operations or financial position.
The preparation of consolidated financial statements in conformity with accounting principles generally accepted in the United States requires management to make estimates and assumptions that affect the amounts reported in the consolidated financial statements and accompanying notes. Actual results could differ from those estimates.
The consolidated financial statements are prepared in accordance with accounting principles generally accepted in the United States ("U.S. GAAP") and include the accounts of Cypress and all of its subsidiaries. All significant inter-company transactions and balances have been eliminated in consolidation.
The following reclassifications have been made in the presentation of Cypress’s Consolidated Balance Sheet as of December 28, 2014 to conform to current year classification:
|
·$6.1 million reclassified from other current liabilities to current portion of long-term debt, |
|
·$10.1 million reclassified from other long-term liabilities to revolving credit facility and long-term debt, and ·$19.6 million reclassified from deferred margin on sales to distributors to other current liabilities. |
During fiscal 2014, the Company recorded out-of-period correcting adjustments to write off certain manufacturing and subcontractor costs that were capitalized within other current assets in previous periods. These corrections resulted in a decrease of net income of $2.6 million for the twelve months ended December 28, 2014. The Company recorded these corrections in the aggregate totaling $2.6 million in cost of revenues in the twelve months ended December 28, 2014. Management assessed the impact of these errors and concluded that the amounts were not material, either individually or in the aggregate, to any prior periods.
66
Fair Value of Financial Instruments
For certain of the Company’s financial instruments, including cash equivalents, accounts receivable, accounts payable and other current liabilities, the carrying amounts approximate their fair value due to the relatively short maturity of these items. See Note 5 for a detailed discussion of fair value measurements.
Cash and Cash Equivalents
Highly liquid investments with original or remaining maturities of ninety days or less at the date of purchase are considered cash equivalents.
Investments
All of the Company’s investments in equity securities in publicly traded companies are classified as trading securities. All of the Company’s investments in debt securities are classified as available-for-sale securities. Available-for-sale debt securities with maturities greater than twelve months are classified as short-term when they are intended for use in current operations. Investments in available-for-sale securities are reported at fair value with unrealized gains and losses, net of tax, as a component of “Accumulated other comprehensive income (loss)” in the Consolidated Balance Sheets. The Company also has minority equity investments in privately-held companies. Minority equity investments in which the Company’s ownership interest is less than 20% are carried at cost less any other than temporary impairment write-downs. Minority equity investments in which the Company’s ownership interest is 20% or greater are accounted for using the equity method of accounting. Under the equity method of accounting, the Company is required to record its interest in the investee's reported net income or loss for each reporting period. None of the Company’s equity investments are a variable interest entity. The Company’s minority equity investments are included in “Other assets” in the Consolidated Balance Sheets.
The Company monitors its investments for impairment periodically and records appropriate reductions in carrying values when the declines are determined to be other-than-temporary. See Note 5 for a detailed discussion of the impairment losses recorded on the Company’s investments.
Inventories
Inventories are stated at the lower of standard cost (which approximates actual cost on a first-in, first-out basis) or market. Market is based on estimated net realizable value. The Company writes down its inventories which have become obsolete or are in excess of anticipated demand or net realizable value based upon assumptions about demand forecasts, product life cycle status, product development plans and current sales levels. Inventory reserves are not relieved until the related inventory has been sold or scrapped.
Long-Lived Assets
Property, plant and equipment are stated at cost, less accumulated depreciation. Depreciation is computed for financial reporting purposes using the straight-line method over the estimated useful lives of the assets. Leasehold improvements and leasehold interests are amortized over the shorter of the estimated useful lives of the assets or the remaining term of the lease. Estimated useful lives are as follows:
|
|
|
|
|
Equipment |
|
3 to 10 years |
|
Buildings and leasehold improvements |
|
5 to 20 years |
|
Furniture and fixtures |
|
3 to 7 years |
The Company evaluates its long-lived assets, including property, plant and equipment and intangible assets with finite lives, for impairment whenever events or changes in circumstances indicate that the carrying value of such assets may not be recoverable. Factors considered important that could result in an impairment review include significant underperformance relative to expected historical or projected future operating results, significant changes in the manner of use of assets, significant negative industry or economic trends, and a significant decline in the Company’s stock price for a sustained period of time. Impairment is recognized based on the difference between the estimated fair value of the asset and its carrying value. Estimated fair value is generally measured based on quoted market prices, if available, appraisals or discounted cash flow analyses.
67
Goodwill and Intangible Assets
Goodwill and intangible assets with indefinite lives are not amortized but are tested for impairment on an annual basis or whenever events or changes in circumstances indicate that the carrying amount of these assets may not be recoverable.
The Company assesses goodwill for impairment on an annual basis on the first day of the fourth quarter of our fiscal year and if certain events or circumstances indicate that an impairment loss may have been incurred, on an interim basis. In accordance with ASU 2011-08, Testing Goodwill for Impairment, qualitative factors can be assessed to determine whether it is necessary to perform the current two-step test for goodwill impairment. If an entity believes, as a result of its qualitative assessment, that it is more-likely-than-not that the fair value of a reporting unit is less than its carrying amount, the quantitative impairment test is required. Otherwise, no further testing is required.
Purchased intangible assets with finite useful lives are amortized using the straight-line method over their estimated useful lives and are reviewed for impairment as discussed above. See Note 4 for more information.
Revenue Recognition
The Company generates revenues by selling products to distributors, various types of manufacturers including original equipment manufacturers (“OEMs”) and electronic manufacturing service providers (“EMSs”). The Company recognizes revenues on sales to OEMs and EMSs upon shipment provided that persuasive evidence of an arrangement exists, the price is fixed or determinable, title has transferred, collection of resulting receivables is reasonably assured, there are no customer acceptance requirements, and there are no significant remaining obligations.
Sales to certain distributors are made under agreements which provide the distributors with price protection, stock rotation and other allowances under certain circumstances. When the Company determines that the uncertainties exist for the rights given to these distributors, revenues and costs related to distributor sales are deferred until products are sold by the distributors to the end customers. In those circumstances, revenues are recognized upon receiving notification from the distributors that products have been sold to the end customers. In these cases, at the time of shipment to distributors, the Company records a trade receivable for the selling price since there is a legally enforceable right to receive payment, relieves inventory for the value of goods shipped since legal title has passed to the distributors, and defers the related margin and price adjustment as deferred income on sales to distributors on the Consolidated Balance Sheets. Any effects of distributor price adjustments are recorded as a reduction to deferred income at the time the distributors sell the products to the end customers and the distributor submits a valid claim for the price adjustment.
The Company has historically recognized a significant portion of revenue through distributors at the time the distributor resold the product to its end customer (also referred to as the sell-through basis of revenue recognition) given the difficulty in estimating the ultimate price of these product shipments and amount of potential returns. The Company continuously reassesses its ability to reliably estimate the ultimate price of these products and, over the past several years, has made investments in its systems and process around the distribution channel to improve the quality of the information it receives from its distributors. Given these ongoing investments, and based on the financial framework for estimating potential price adjustments, beginning the fourth quarter of 2014, the Company concluded that it was able to reasonably estimate returns and pricing concessions on certain product families and with certain distributors, and recognized revenue at the time it shipped these specific products to the identified distributors, less its estimate of future price adjustments and returns. As a result of this change, the Company recognized an incremental $12.3 million of revenue during the fourth quarter of fiscal 2014. The impact of this change resulted in an increase of $6.2 million to net income attributable to Cypress for fiscal 2014, or $0.04 per basic and diluted share. During fiscal 2015, the Company recognized $40.9 million of incremental revenue from this change on additional product families, which resulted in a decrease to the net loss of $25.0 million or $0.07 per basic and diluted shares.
The Company records as a reduction to revenues reserves for sales returns, price protection and allowances based upon historical experience rates and for any specific known customer amounts. The Company also provides certain distributors and EMSs with volume-pricing discounts, such as rebates and incentives, which are recorded as a reduction to revenues at the time of sale. Historically these volume discounts have not been significant.
68
Employee Benefit Plans
In connection with the Merger, the Company assumed the Spansion Innovates Group Cash Balance Plan (a defined benefit pension plan) in Japan. A defined benefit pension plan is accounted for on an actuarial basis, which requires the selection of various assumptions such as turnover rates, discount rates and other factors. The discount rate assumption is determined by comparing the projected benefit payments to the Japanese corporate bonds yield curve as of end of the most recently completed fiscal year. The benefit obligation is the projected benefit obligation (PBO), which represents the actuarial present value of benefits expected to be paid upon retirement. This liability is recorded in other long term liabilities on the Consolidated Balance Sheets. Net periodic pension cost is recorded in the Consolidated Statements of Operations and includes service cost. Service cost represents the actuarial present value of participant benefits earned in the current year. Interest cost represents the time value of money associated with the passage of time on the PBO. Gains or losses resulting from a change in the PBO if actual results differ from actuarial assumptions will be accumulated and amortized over the future life of the plan participants if they exceed 10% of the PBO, being the corridor amount. If the amount of a net gain or loss does not exceed the corridor amount, it will be recorded to other comprehensive income (loss). See Note 17 for further details of the pension plans.
Cash Flow Hedges
The Company enters into cash flow hedges to protect non-functional currency inventory purchases and certain other operational expenses and has an on-going program of cash flow hedges to protect its non-functional currency revenues against variability in cash flows due to foreign currency fluctuations. The Company does not enter into derivative securities for speculative purposes. The Company’s foreign currency forward contracts that were designated as cash flow hedges have maturities between three and nine months. The maximum original duration of any contract allowable under the Company’s hedging policy is thirteen months. All hedging relationships are formally documented, and the hedges are designed to offset changes to future cash flows on hedged transactions at the inception of the hedge. The Company recognizes derivative instruments from hedging activities as either assets or liabilities on the balance sheet and measures them at fair value on a monthly basis. The Company records changes in the intrinsic value of its cash flow hedges in accumulated other comprehensive income on the Consolidated Balance Sheets, until the forecasted transaction occurs. Interest charges or “forward points” on the forward contracts are excluded from the assessment of hedge effectiveness and are recorded in other income (expense), net in the Consolidated Statements of Operations. When the forecasted transaction occurs, the Company reclassifies the related gain or loss on the cash flow hedge to revenue or costs, depending on the risk hedged. In the event the underlying forecasted transaction does not occur, or it becomes probable that it will not occur, the Company will reclassify the gain or loss on the related cash flow hedge from accumulated other comprehensive income to other income (expense), net in its Consolidated Statements of Operations at that time.
The Company evaluates hedge effectiveness at the inception of the hedge prospectively as well as retrospectively and records any ineffective portion of the hedge in other income (expense), net in its Consolidated Statements of Operations.
See Note 11 for further details of the contracts.
Shipping and Handling Costs
The Company records costs related to shipping and handling in cost of revenues.
Advertising Costs
Advertising costs consist of development and placement costs of the Company’s advertising campaigns and are charged to expense when incurred. Advertising expense was $5.0 million, $3.7 million and $2.9 million for fiscal years 2015, 2014 and 2013, respectively.
Foreign Currency Transactions
The Company uses the United States dollar as the functional currency for all of its foreign entities. Assets and liabilities of these entities are remeasured into the United States dollar using exchange rates in effect at the end of the period, except for non-monetary assets and liabilities, such as property, plant and equipment, which are remeasured using historical exchange rates. Revenues and expenses are remeasured using average exchange rates in effect for the period, except for items related to assets and liabilities, such as depreciation, that are remeasured using historical exchange rates. The total gains (losses) from foreign currency re-measurement for fiscal years 2015, 2014 and 2013 were $0.7 million, $1.4 million and $2.8 million, respectively and are included in “Other income (expense), net” in the Consolidated Statements of Operations. For additional details related to items included in “Other income (expense), net,” see Note 13.
69
Concentration of Credit Risk
Financial instruments that potentially subject the Company to concentrations of credit risk are primarily cash equivalents, debt investments and trade accounts receivable. The Company’s investment policy requires cash investments to be placed with high-credit quality institutions and limits the amount of credit risk from any one issuer. The Company performs ongoing credit evaluations of its customers’ financial condition whenever deemed necessary and generally does not require collateral. The Company maintains an allowance for doubtful accounts based upon the expected collectability of all accounts receivable.
Outstanding accounts receivable from three of the Company’s distributors, accounted for 42%, 11% and 9%, respectively, of the consolidated accounts receivable as of January 3, 2016. Outstanding accounts receivable from three of the Company’s distributors, accounted for 12%, 11% and 9%, of the consolidated accounts receivable as of December 28, 2014.
Revenue generated through three of the Company’s distributors accounted for 25%, 10%, and 7%, respectively, of the consolidated revenue for fiscal 2015 . No end customer accounted for 10% of the consolidated revenue for fiscal 2015.
Revenue generated through three of the Company’s distributors, accounted for 13%, 10% and 10% respectively, of the consolidated revenue for fiscal 2014. No end customers accounted for 10% or more of the consolidated revenue for fiscal 2014.
Revenue generated through two of the Company’s distributors accounted for 11% and 10%, respectively, of the consolidated revenue for fiscal 2013. One end customer purchased the Company’s products both from the Company’s distributors and directly from the Company. Shipments to this end customer accounted for 12% of the consolidated revenue for fiscal 2013.
Income Taxes
The provision for income taxes is determined using the asset and liability approach of accounting for income taxes. Under this approach, deferred taxes represent the future tax consequences expected to occur when the reported amounts of assets and liabilities are recovered or paid. The provision for income taxes represents income taxes paid or payable for the current year plus the change in deferred taxes during the year. Deferred taxes result from differences between the financial and tax basis of the Company’s assets and liabilities and are adjusted for changes in tax rates and tax laws when changes are enacted. Valuation allowances are recorded to reduce deferred tax assets when management cannot conclude that it is more likely than not that a tax benefit will be realized.
The calculation of tax liabilities involves dealing with uncertainties in the application of complex global tax regulations. The Company recognizes potential liabilities for anticipated tax audit issues in the United States and other tax jurisdictions based on its estimate of whether, and the extent to which, additional taxes will be due. If payment of these amounts ultimately proves to be unnecessary, the reversal of the liabilities would result in tax benefits being recognized in the period when the Company determines the liabilities are no longer necessary. If the estimate of tax liabilities proves to be less than the ultimate assessment, a further charge to expense would result.
Impact of Recently Issued Accounting Pronouncements
In February 2015, the Financial Accounting Standards Board (“FASB”) issued Accounting Standards Update (ASU) 2015-02, Amendments to the Consolidation Analysis, which is intended to improve upon and simplify the consolidation assessment required to evaluate whether organizations should consolidate certain legal entities such as limited partnerships, limited liability corporations, and securitization structures. The new accounting guidance is effective for interim and fiscal years beginning after December 15, 2015. The Company does not believe that the adoption of this guidance will have any material impact on its financial condition or results of operations.
In May 2014, the FASB issued an ASU on revenue from contracts with customers, ASU No. 2014-09, "Revenue from Contracts with Customers." This standard update outlines a single comprehensive model for entities to use in accounting for revenue arising from contracts with customers and supersedes most current revenue recognition guidance. The guidance is effective for annual reporting periods including interim reporting periods beginning after December 15, 2017. Early adoption is permitted for annual reporting periods including interim reporting periods beginning after December 15, 2016. As the new standard will supersede substantially all existing revenue guidance affecting the Company under GAAP, it could impact revenue and cost recognition on sales across all the Company's business segments, in addition to its business processes and its information technology systems. The Company is currently evaluating the impact, if any, the adoption of this standard will have on its Consolidated Financial Statements.
70
In July 2015, the FASB issued ASU 2015-11, "Inventory (Topic 330): Simplifying the Measurement of Inventory," which applies to inventory that is measured using first-in, first-out ("FIFO") or average cost. Under the updated guidance, an entity should measure inventory that is within scope at the lower of cost and net realizable value, which is the estimated selling prices in the ordinary course of business, less reasonably predictable costs of completion, disposal and transportation. Subsequent measurement is unchanged for inventory that is measured using last-in, last-out ("LIFO"). This ASU is effective for annual and interim periods beginning after December 15, 2016, and should be applied prospectively with early adoption permitted at the beginning of an interim or annual reporting period. The Company is currently evaluating the impact the pronouncement will have on the Company’s financial statements and related disclosures.
In February 2016, the FASB issued an ASU 2016-02, “Leases (Topic 842).” The core principle of Topic 842 is that a lessee should recognize the assets and liabilities that arise from leases. All leases create an asset and a liability for the lessee in accordance with FASB Concepts Statement No. 6, Elements of Financial Statements, and, therefore, recognition of those lease assets and lease liabilities represents an improvement over previous GAAP, which did not require lease assets and lease liabilities to be recognized for most leases. This ASU is effective for annual and interim periods beginning after December 15, 2018. Early adoption is permitted. The recognition, measurement, and presentation of expenses and cash flows arising from a lease by a lessee have not significantly changed from previous GAAP. The Company is currently evaluating the impact the pronouncement will have on the Company’s financial statements and related disclosures.
71
Recently Adopted Accounting Pronouncements
In April 2015, the Financial Accounting Standards Board issued ASU 2015-03, Simplifying the Presentation of Debt Issuance Costs, which changes the presentation of debt issuance costs in the financial statements. Under the ASU, an entity presents such costs in the balance sheet as a direct deduction from the related debt liability rather than as an asset. The new accounting guidance is effective for interim and fiscal years beginning after December 15, 2015. The Company early adopted ASU 2015-03 for the fiscal year 2015 and presented the debt issuance costs related to the new Term Loan debt as a direct deduction from the related debt liability.
In August 2015, FASB issued ASU No. 2015-15, “Presentation and Subsequent Measurement of Debt Issuance Costs Associated With Line-of-Credit Arrangements — Amendments to SEC Paragraphs Pursuant to Staff Announcement at June 18, 2015 EITF Meeting”. FASB ASU No. 2015-15 amends subtopic 835-30 to include that the SEC would not object to the deferral and presentation of debt issuance costs as an asset and subsequent amortization of the deferred costs over the term of the line-of-credit arrangement, regardless of whether there are any outstanding borrowings on the line-of-credit arrangement. The Company early adopted ASU 2015-15 for the fiscal year ended January 3, 2016. The Company has chosen to continue presentation of debt issuance costs as an asset for its revolving line of credit borrowings.
In September 2015, the FASB issued ASU No. 2015-16, “Simplifying the Accounting for Measurement-Period Adjustments.” This ASU simplifies the treatment of adjustments to provisional amounts recognized in the period for items in a business combination for which the accounting is incomplete at the end of the reporting period. The amendments require that an acquirer recognize adjustments to provisional amounts that are identified during the measurement period in the reporting period in which the adjustment amounts are determined. The amendments require that the acquirer record, in the same period’s financial statements, the effect on earnings of changes in depreciation, amortization, or other income effects, if any, as a result of the change to the provisional amounts, calculated as if the accounting had been completed at the acquisition date. The amendments in this ASU are effective for fiscal years beginning after December 15, 2015 and for interim periods therein. The Company early adopted ASU 2015-16 standard for the fiscal year ended January 3, 2016.
In November 2015, the FASB issued Accounting Standards Update (ASU) No. 2015-17, Income Taxes (Topic 740): Balance Sheet Classification of Deferred Taxes, which simplifies the presentation of deferred income taxes. This ASU requires that deferred tax assets and liabilities be classified as non-current in a statement of financial position. The standard is effective in the annual reporting periods beginning after December 15, 2018. Early adoption is permitted for any interim and annual financial statements that have not yet been issued. The Company early adopted ASU 2015-17 and prospectively applied ASU 2015-17 to fiscal year 2015.
NOTE 2. MERGER WITH SPANSION
On March 12, 2015, Cypress completed its merger with Spansion ("the Merger") pursuant to the Agreement and Plan of Merger and Reorganization, as of December 1, 2014 ("the Merger Agreement") for a total purchase consideration of approximately $2.8 billion. In accordance with the terms of the Merger Agreement, Spansion shareholders received 2.457 Cypress shares for each Spansion share they owned. The Merger has been accounted for under the acquisition method of accounting in accordance with ASC 805, Business Combinations, with Cypress treated as the accounting acquirer. The Company incurred $37.5 million in Merger costs for the fiscal year ended January 3, 2016, which were recorded in the selling, general and administrative expense line of the Consolidated Statements of Operations.
The total purchase consideration of approximately $2.8 billion consists of the following:
|
|
|
Purchase Consideration |
|
|
|
|
|
(In thousands) |
|
|
|
Fair value of Cypress common stock issued to Spansion shareholders |
|
$ |
2,570,458 |
|
|
Fair value of partially vested Spansion equity awards assumed by Cypress |
|
|
6,825 |
|
|
Fair value of vested Spansion options assumed by Cypress |
|
|
89,582 |
|
|
Cash provided by Cypress to repay Spansion term loan |
|
|
150,000 |
|
|
Total purchase consideration |
|
$ |
2,816,865 |
|
72
In connection with the Merger, the Company assumed stock options and RSUs originally granted by Spansion and converted them into Cypress stock options and RSUs. The fair value of the stock options assumed were determined using a Black-Scholes valuation model with market-based assumptions. The fair value of partially vested Spansion equity awards is $15.68 per share, the Cypress closing stock price on March 12, 2015. The fair value of unvested equity awards relating to future services, and not yet earned, will be recorded as operating expenses over the remaining service periods. Option pricing models require the use of highly subjective market assumptions, including expected stock price volatility, which if changed can materially affect fair value estimates.
The table below represents the final allocation of the purchase price to the net assets acquired based on their estimated fair values as of March 12, 2015.
|
|
|
Fair Values as of March 12, 2015 |
|
|
Changes through January 3, 2016 |
|
|
Final allocation as of January 3, 2016 |
|
|||
|
|
|
(In thousands) |
|
|||||||||
|
Cash and cash equivalents |
|
$ |
44,870 |
|
|
|
— |
|
|
$ |
44,870 |
|
|
Short-term investments |
|
|
1,433 |
|
|
|
— |
|
|
|
1,433 |
|
|
Accounts receivable, net |
|
|
99,977 |
|
|
|
(590 |
) |
(2) |
|
99,387 |
|
|
Inventories |
|
|
450,634 |
|
|
|
— |
|
|
|
450,634 |
|
|
Other current assets |
|
|
58,959 |
|
|
|
(2,329 |
) |
(3) |
|
56,630 |
|
|
Property, plant and equipment, net |
|
|
356,908 |
|
|
|
— |
|
|
|
356,908 |
|
|
Intangible assets, net |
|
|
860,700 |
|
|
|
— |
|
|
|
860,700 |
|
|
Goodwill (2) |
|
|
1,676,036 |
|
|
|
(2,850 |
) |
|
|
1,673,186 |
|
|
Other long-term assets |
|
|
63,497 |
|
|
|
— |
|
|
|
63,497 |
|
|
Total assets acquired |
|
|
3,613,014 |
|
|
|
(5,769 |
) |
|
|
3,607,245 |
|
|
Accounts payable |
|
|
(155,336 |
) |
|
|
— |
|
|
|
(155,336 |
) |
|
Accrued compensation and benefits |
|
|
(44,669 |
) |
|
|
— |
|
|
|
(44,669 |
) |
|
Income taxes payable |
|
|
(1,399 |
) |
|
|
— |
|
|
|
(1,399 |
) |
|
Other current liabilities |
|
|
(158,083 |
) |
|
|
(30 |
) |
(4) |
|
(158,113 |
) |
|
Deferred income taxes and other long term liabilities |
|
|
(24,001 |
) |
|
|
5,799 |
|
(5) |
|
(18,202 |
) |
|
Other non current liabilities |
|
|
(21,477 |
) |
|
|
— |
|
|
|
(21,477 |
) |
|
Long-term debt (1) |
|
|
(391,184 |
) |
|
|
— |
|
|
|
(391,184 |
) |
|
Total liabilities assumed |
|
|
(796,149 |
) |
|
|
5,769 |
|
|
|
(790,380 |
) |
|
Fair value of net assets acquired |
|
$ |
2,816,865 |
|
|
$ |
— |
|
|
$ |
2,816,865 |
|
|
(1) Includes the fair value of the debt and equity components of Spansion's Exchangeable 2.00% Senior Notes assumed by the Company. |
|
(2) The Company determined that one customer account receivable balance that the Company assessed as collectible at the time of the Merger was determined uncollectible which led to a decrease of $0.6 million in the fair value of accounts receivables with a corresponding increase in goodwill. (3) The Company obtained new information regarding the valuation of other receivables as of the acquisition date which led to a decrease in the fair value of current assets of $2.3 million, and a corresponding increase in goodwill. (4) The Company obtained new information regarding the valuation of accrued liabilities as of the acquisition date which led to a net increase in the fair value of other current liabilities of $30 thousand, and a corresponding increase in goodwill. (5) The Company obtained additional information related to its deferred income taxes which led to an increase in the deferred income taxes and other long term liabilities and a corresponding decrease in goodwill. |
|
|
The Company does not believe that the measurement period adjustments had a material impact on the Consolidated Statement of Operations, Balance Sheet or Cash Flows in any period previously reported and, therefore, no retrospective adjustment was made to the Company's previously issued Consolidated Financial Statements.
73
The table below shows the valuation of the intangible assets acquired from Spansion Inc. along with their estimated remaining useful lives:.
|
|
|
As of March 12, 2015 |
|
|
|
Estimated range of lives (in years) |
|
|
|
|
|
Gross |
|
|
|
|
||
|
|
|
(In thousands) |
|
|
|
|
|
|
|
Existing Technology |
|
$ |
507,100 |
|
|
|
4 to 6 |
|
|
In-Process Research and Development Technology |
|
|
212,300 |
|
|
|
N/A |
|
|
Backlog |
|
|
14,500 |
|
|
|
1 |
|
|
Customer/Distributor Relationships |
|
|
97,300 |
|
|
|
9 |
|
|
License Agreements |
|
|
9,400 |
|
|
|
3 |
|
|
Trade Name / Trademarks |
|
|
20,100 |
|
|
|
10 |
|
|
Total intangible assets |
|
$ |
860,700 |
|
|
|
|
|
In-process research and development ("IPR&D") consists of 21 projects, primarily relating to the development of process technologies to manufacture NOR, NAND, Analog, and MCU products. The projects are expected to be completed over the next 2 years. The estimated remaining costs to complete the IPR&D projects were $15.3 million as of the acquisition date. The acquired IPR&D will not be amortized until completion of the related products which is determined by when the underlying projects reach technological feasibility and commence commercial production. Upon completion, each IPR&D project will be amortized over its useful life; useful lives for IPR&D are expected to range between 4 years and 6 years.
As of January 3, 2016 five out of 21 projects originally identified, representing $36.2 million of the total capitalized IPR&D of $212.3 million, had reached technological feasibility and were transferred to developed technology. Refer to Note 4 for further details. No impairments have been identified as of January 3, 2016.
The purchase price has been allocated based on the estimated net tangible and intangible assets of Spansion that existed on the date of the Merger. The fair value of identifiable intangible assets acquired was based on estimates and assumptions made by management at the time of the Merger. During the fourth quarter of 2015, as additional information became available, the Company finalized its purchase price allocation that resulted in change in values allocated to identifiable assets and liabilities.
Identifiable intangible assets
Developed technologies acquired primarily consist of Spansion's existing technologies related to embedded systems semiconductors, which include flash memory, microcontroller, mixed-signal and analog products. An income approach was used to value Spansion’s developed technologies. Using this approach, the estimated fair value was calculated using expected future cash flows from specific products discounted to their net present values at an appropriate risk-adjusted rate of return. A discount rate of 7.5% was used to discount the cash flows to the present value.
Customer relationships represent the fair value of projected cash flows that will be derived from the sale of products to Spansion’s existing customers based on existing, in-process, and future versions of the existing technology. Customer relationships were valued utilizing a form of the income approach known as the “distributor” method since the primary income producing asset of the business was determined to be the technology assets. Under this premise, the margin a distributor owns is deemed to be the margin attributable to the customer relationships. This isolates the cash flows attributable to the customer relationships that a market participant would be willing to pay for.
IPR&D represents the estimated fair values of incomplete Spansion research and development projects that had not reached technological feasibility as of the date of Merger. In the future, the fair value of each project at the Merger date will be either amortized or impaired depending on whether the projects are completed or abandoned. The fair value of IPR&D was determined using the multi-period excess earnings method under the income approach. This method reflects the present value of the projected cash flows that are expected to be generated by the IPR&D less charges representing the contribution of other assets to those cash flows. A discount rate of 10.5% was used to discount the cash flows to the present value.
Trade names and trademarks are considered a type of guarantee of a certain level of quality or performance represented by the Spansion brand. Trade names and trademarks were valued using the “relief-from-royalty income” approach. This method is based on the assumption that in lieu of ownership, a market participant would be willing to pay a royalty in order to exploit the related benefits of this asset. A discount rate of 9.0% was used to discount the cash flows to the present value.
74
License agreements represent the estimated fair value of Spansion’s existing license agreements under which Spansion generates revenue by licensing its intellectual property to third parties and assists its customers in developing and prototyping their designs by providing software and hardware development tools, drivers and simulation models for system-level integration. License agreements were valued using a form of the income approach known as the of “multi-period excess earnings” approach. Under this approach, the expected cash flows associated with the License agreements were projected then discounted to present value at a rate of return that considers the relative risk of achieving the cash flows and the time value of money. A discount rate of 5.0% was used to discount the cash flows to the present value.
Goodwill
The excess of the fair value of the Merger consideration over the fair values of these identifiable assets and liabilities was recorded as goodwill. The goodwill recognized is primarily attributable to the assembled workforce, a reduction in costs and other synergies, and an increase in product development capabilities. The goodwill resulting from the Merger is not expected to be deductible for tax purposes. Goodwill has been allocated to the reporting units expected to benefit from the Merger.
Pro forma consolidated results of operations
The following unaudited pro forma consolidated results of operations for the fiscal year ended January 3, 2016 assume as if the Merger had occurred at the beginning of fiscal year 2014. The pro forma information includes adjustments to amortization and depreciation for intangible assets and property, plant and equipment, adjustments to stock-based compensation expense, and interest expense for the incremental indebtedness incurred. The pro forma results for the year ended January 3, 2016 also include utilization of the net increase in the cost basis of acquired inventory and the Merger related expenses. The pro forma data are for informational purposes only and are not necessarily indicative of the consolidated results of operations of the combined business had the Merger actually occurred at the beginning of fiscal year 2014 or of the results of future operations of the combined business. Consequently, actual results will differ from the unaudited pro forma information presented below.
|
|
|
Years Ended |
|
|||||
|
|
|
January 3, 2016 |
|
|
December 28, 2014 |
|
||
|
|
|
(In thousands) |
|
|||||
|
Revenues |
|
$ |
1,796,266 |
|
|
$ |
1,977,352 |
|
|
Net loss |
|
$ |
(340,465 |
) |
|
$ |
(597,980 |
) |
|
Net loss per share attributable to Cypress |
|
|
|
|
|
|
|
|
|
Basic |
|
$ |
(0.76 |
) |
|
$ |
(2.72 |
) |
|
Diluted |
|
$ |
(0.76 |
) |
|
$ |
(2.72 |
) |
NOTE 3. DIVESTITURES
Sale of TrueTouch® mobile touchscreen business
On August 1, 2015, the Company completed the sale of the TrueTouch® Mobile touchscreen business to Parade Technologies (“Parade”) for total cash proceeds of $98.6 million pursuant to the definitive agreement signed on June 11, 2015. Of the total cash proceeds, $10.0 million are held in an escrow account until January 2017 subject to any indemnity claims on post-closing adjustments, per the terms of the agreement. In connection with the transaction, the Company sold certain assets associated with the disposed business mostly consisting of inventory with a net book value of $10.5 million and recognized a total gain of $66.5 million in the third fiscal quarter of 2015. This gain has been presented as a separate line item "Gain on divestiture of TrueTouch® mobile business" in the Consolidated Statements of Operations.
Also in connection with the transaction, the Company entered into a Manufacturing Service Agreement (MSA) in which the Company agreed to sell finished products and devices to Parade during the one-year period following the close of the transaction. The terms of the MSA indicated that the Company would sell finished wafers to Parade at agreed-upon prices that were considered below fair market value, indicating that there was an embedded fair value that would be realized by Parade through those terms. Accordingly, the Company has allocated $19.9 million out of the $98.6 million proceeds to the fair value of the MSA based on the forecasted wafer sales to Parade for the subsequent one-year period. Such amount was deferred on the Company’s consolidated balance sheet initially and is being amortized to revenue as the Company sells products to Parade. During the year ended January 3, 2016, the Company recognized $5.7 million of revenue from amortization of such deferred revenue.
75
The following table summarizes the components of the gain:
|
|
|
(In thousands) |
|
|
|
Cash Proceeds (a) |
|
$ |
98,635 |
|
|
Deferred Revenue |
|
|
(19,867 |
) |
|
Assets Sold: |
|
|
|
|
|
Property, plant and equipment, net |
|
|
(69 |
) |
|
Inventories |
|
|
(9,290 |
) |
|
Prepaid Expenses |
|
|
(1,115 |
) |
|
Transaction and other costs |
|
|
(1,822 |
) |
|
Gain on Divestiture |
|
$ |
66,472 |
|
|
|
(a) |
Includes $10.0 million held in escrow account until January 2017 per the terms of the agreement. |
NOTE 4. GOODWILL AND INTANGIBLE ASSETS
Goodwill
Goodwill represents the excess of the purchase price over the fair value of the net tangible and identifiable intangible assets acquired in a business combination. The Company’s impairment review process compares the fair value of the reporting unit in which the goodwill resides to its carrying value. The Company has four reporting units of which two, Memory Products division (MPD) and Programmable Systems Division (PSD), have goodwill.
The changes in the carrying amount of goodwill for the year ended January 3, 2016, are as follows:
|
|
|
MPD |
|
|
PSD |
|
|
Total |
|
|||
|
|
|
(in thousands) |
|
|||||||||
|
Goodwill as of December 28, 2014 |
|
$ |
33,860 |
|
|
$ |
31,836 |
|
|
$ |
65,696 |
|
|
Goodwill from merger with Spansion (1) |
|
|
739,036 |
|
|
|
937,000 |
|
|
|
1,676,036 |
|
|
Measurement period adjustments |
|
|
(2,850 |
) |
|
|
— |
|
|
|
(2,850 |
) |
|
Goodwill as of January 3, 2016 |
|
$ |
770,046 |
|
|
$ |
968,836 |
|
|
$ |
1,738,882 |
|
|
(1) |
Refer Note 2 for further details. |
In fiscal 2015, the Company elected to perform a two-step quantitative goodwill impairment test for each of its reporting units. The first step of the quantitative goodwill impairment test is to identify a potential impairment by comparing the fair value of a reporting unit with its carrying amount. The second step compares the implied fair value of the reporting unit’s goodwill with the carrying amount of that goodwill. The implied fair value of goodwill is determined in the same manner as the amount of goodwill recognized in a business combination. Based on this test, the Company determined that no impairment was indicated as the estimated fair value of each of the reporting units exceeded its respective carrying value. The Company estimated the fair values of its reporting units using a combination of the income and market approach. These valuation approaches consider a number of factors that include, but are not limited to, forecasted financial information, growth rates, terminal or residual values, discount rates and comparable multiples from publicly traded companies in the Company’s industry and require the Company to make certain assumptions and estimates regarding industry economic factors and the future profitability of its’ business.
76
Based on the Company’s goodwill impairment testing, the Company determined that there was no impairment of goodwill. The fair value of the MPD reporting unit exceeded its carrying value by 53% and the fair value of PSD reporting unit exceeded its carrying value by 9%. Based on the Company’s testing, the Company determined that there is a risk of the PSD reporting unit failing the first step of goodwill impairment test in future periods. For this reporting unit, declines in the Company’s stock price or peers’ stock price, relatively small declines in the future performance and cash flows of the reporting unit or small changes in other key assumptions, such as revenue growth rates and discount rates, may result in the recognition of a material impairment charge to the Company’s earnings as a result of a write-down of the carrying value of the goodwill associated with that reporting unit. The income approach valuations for PSD included the following assumptions for 2015:
|
|
|
Year Ended |
|
|
|
|
|
January 3, 2016 |
|
|
|
Discount rate |
|
|
9% |
|
|
Long-term growth rate |
|
|
4% |
|
|
Tax rate |
|
|
28% |
|
|
Risk free rate |
|
|
4% |
|
|
Peer company beta |
|
|
0.97 |
|
The Company’s next annual evaluation of the goodwill by reporting unit will be performed on the first day of the fourth quarter of fiscal year 2016, or earlier if indicators of potential impairment exist. Such indicators include, but are not limited to, challenging economic conditions, such as a decline in the Company’s operating results, an unfavorable industry or macroeconomic environment, a substantial decline in the Company’s stock price, or any other adverse change in market conditions. Such conditions could have the effect of changing one of the critical assumptions or estimates that the Company uses to calculate the fair value of its reporting units, which could result in a decrease in fair value and require the Company to record a material goodwill impairment charge.
In fiscal 2014, the Company elected to perform a qualitative analysis for impairment on goodwill rather than to perform the two-step quantitative goodwill impairment test. The Company assessed qualitative factors to determine whether it was necessary to perform the two-step goodwill impairment test. After assessing many qualitative factors pertinent to the Company, it determined that it was more likely than not that the fair value of our reporting unit exceeds its carrying amount. In assessing the qualitative factors, the Company considered the impact of these key factors: 1) change in the industry and competitive environment, 2) market capitalization, 3) stock price and 4) overall financial performance. Based on the results of the testing, no goodwill impairment was recognized in fiscal 2014.
In fiscal 2013, the Company elected to perform the two-step quantitative goodwill impairment test. The first step of the quantitative goodwill impairment test is to identify a potential impairment by comparing the fair value of a reporting unit with its carrying amount. The second step compares the implied fair value of the reporting unit’s goodwill with the carrying amount of that goodwill. The implied fair value of goodwill is determined in the same manner as the amount of goodwill recognized in a business combination. Based on the results of the testing, no goodwill impairment was recognized in fiscal 2013.
Intangible Assets
The following tables present details of the Company’s total intangible assets:
|
|
|
As of January 3, 2016 |
|
|
As of December 28, 2014 |
|
||||||||||||||||||
|
|
|
Gross |
|
|
Accumulated Amortization |
|
|
Net (c) |
|
|
Gross |
|
|
Accumulated Amortization |
|
|
Net |
|
||||||
|
|
|
(In thousands) |
|
|||||||||||||||||||||
|
Acquisition-related intangible assets (a) |
|
$ |
1,012,472 |
|
|
$ |
(226,417 |
) |
|
$ |
786,055 |
|
|
$ |
151,773 |
|
|
$ |
(118,357 |
) |
|
$ |
33,416 |
|
|
Non-acquisition related intangible assets (b) |
|
|
13,368 |
|
|
|
(10,228 |
) |
|
|
3,140 |
|
|
|
10,523 |
|
|
|
(10,021 |
) |
|
|
502 |
|
|
Total intangible assets |
|
$ |
1,025,840 |
|
|
$ |
(236,645 |
) |
|
$ |
789,195 |
|
|
$ |
162,296 |
|
|
$ |
(128,378 |
) |
|
$ |
33,918 |
|
|
(a) |
Refer Note 2 for details on valuation of the intangible assets acquired from Spansion Inc. |
|
(b) |
The increase in the Gross Carrying value relates to new license agreement entered into during fiscal 2015. |
|
(c) |
The Net Acquisition-related intangible assets contains $176.1 million of IPR&D which remain to attain technological feasibility and commercial production. |
77
As of January 3, 2016, $36.2 million of the total capitalized IPR&D of $212.3 million had reached technological feasibility and was transferred to developed technology, to be amortized over the estimated useful life of 5 years and amortization of $2.6 million was recorded during the twelve months ended January 3, 2016 for these projects. The Company expects the remaining projects to attain technological feasibility and commence commercial production by the second half of fiscal 2016.
As of January 3, 2016, the estimated future amortization expense of intangible assets was as follows:
|
Fiscal Year |
|
(In thousands) |
|
|
|
2016 |
|
|
123,968 |
|
|
2017 |
|
|
120,966 |
|
|
2018 |
|
|
118,477 |
|
|
2019 |
|
|
111,249 |
|
|
2020 and future |
|
|
138,319 |
|
|
Total future amortization expense |
|
$ |
612,979 |
|
NOTE 5. FAIR VALUE MEASUREMENTS
Assets/Liabilities Measured at Fair Value on a Recurring Basis
The following table presents the Company’s fair value hierarchy for its financial assets and liabilities measured at fair value on a recurring basis as of January 3, 2016 and December 28, 2014:
|
|
|
As of January 3, 2016 |
|
|
As of December 28, 2014 |
|
||||||||||||||||||
|
|
|
Level 1 |
|
|
Level 2 |
|
|
Total |
|
|
Level 1 |
|
|
Level 2 |
|
|
Total |
|
||||||
|
|
|
(In thousands) |
|
|||||||||||||||||||||
|
Financial Assets |
|
|
|
|
|
|
|
|
|
|
|
|
|
|
|
|
|
|
|
|
|
|
|
|
|
Reported as cash equivalents: |
|
|
|
|
|
|
|
|
|
|
|
|
|
|
|
|
|
|
|
|
|
|
|
|
|
Money market funds |
|
$ |
119 |
|
|
$ |
— |
|
|
$ |
119 |
|
|
$ |
7,665 |
|
|
$ |
— |
|
|
$ |
7,665 |
|
|
Total cash equivalents |
|
|
119 |
|
|
|
— |
|
|
|
119 |
|
|
|
7,665 |
|
|
|
— |
|
|
|
7,665 |
|
|
Reported as short-term investments: |
|
|
|
|
|
|
|
|
|
|
|
|
|
|
|
|
|
|
|
|
|
|
|
|
|
U.S. treasuries |
|
|
— |
|
|
|
— |
|
|
|
— |
|
|
|
4,993 |
|
|
|
— |
|
|
|
4,993 |
|
|
Corporate notes and bonds |
|
|
— |
|
|
|
— |
|
|
|
— |
|
|
|
— |
|
|
|
5,599 |
|
|
|
5,599 |
|
|
Federal agency |
|
|
— |
|
|
|
— |
|
|
|
— |
|
|
|
— |
|
|
|
3,615 |
|
|
|
3,615 |
|
|
Certificates of deposit |
|
|
— |
|
|
|
871 |
|
|
|
871 |
|
|
|
— |
|
|
|
869 |
|
|
|
869 |
|
|
Total short-term investments |
|
|
— |
|
|
|
871 |
|
|
|
871 |
|
|
|
4,993 |
|
|
|
10,083 |
|
|
|
15,076 |
|
|
Reported as long-term investments: |
|
|
|
|
|
|
|
|
|
|
|
|
|
|
|
|
|
|
|
|
|
|
|
|
|
Marketable equity securities |
|
|
6,516 |
|
|
|
— |
|
|
|
6,516 |
|
|
|
8,493 |
|
|
|
— |
|
|
|
8,493 |
|
|
Total long-term investments |
|
|
6,516 |
|
|
|
— |
|
|
|
6,516 |
|
|
|
8,493 |
|
|
|
— |
|
|
|
8,493 |
|
|
Employee deferred compensation plan assets: |
|
|
|
|
|
|
|
|
|
|
|
|
|
|
|
|
|
|
|
|
|
|
|
|
|
Cash equivalents |
|
|
3,333 |
|
|
|
— |
|
|
|
3,333 |
|
|
|
2,957 |
|
|
|
— |
|
|
|
2,957 |
|
|
Mutual funds |
|
|
22,023 |
|
|
|
— |
|
|
|
22,023 |
|
|
|
24,114 |
|
|
|
— |
|
|
|
24,114 |
|
|
Equity securities |
|
|
8,624 |
|
|
|
— |
|
|
|
8,624 |
|
|
|
9,352 |
|
|
|
— |
|
|
|
9,352 |
|
|
Fixed income |
|
|
— |
|
|
|
3,227 |
|
|
|
3,227 |
|
|
|
— |
|
|
|
3,798 |
|
|
|
3,798 |
|
|
Money market funds |
|
|
4,042 |
|
|
|
— |
|
|
|
4,042 |
|
|
|
3,895 |
|
|
|
— |
|
|
|
3,895 |
|
|
Total employee deferred compensation plan assets |
|
|
38,022 |
|
|
|
3,227 |
|
|
|
41,249 |
|
|
|
40,318 |
|
|
|
3,798 |
|
|
|
44,116 |
|
|
Foreign Exchange Forward Contracts |
|
|
— |
|
|
|
966 |
|
|
|
966 |
|
|
|
— |
|
|
|
— |
|
|
|
— |
|
|
Total financial assets |
|
$ |
44,657 |
|
|
$ |
5,064 |
|
|
$ |
49,721 |
|
|
$ |
61,469 |
|
|
$ |
13,881 |
|
|
$ |
75,350 |
|
|
Financial Liabilities |
|
|
|
|
|
|
|
|
|
|
|
|
|
|
|
|
|
|
|
|
|
|
|
|
|
Foreign Exchange Forward Contracts |
|
|
— |
|
|
|
1,283 |
|
|
|
1,283 |
|
|
|
— |
|
|
|
— |
|
|
|
— |
|
|
Employee deferred compensation plan liability |
|
|
— |
|
|
|
41,457 |
|
|
|
41,457 |
|
|
|
— |
|
|
|
43,452 |
|
|
|
43,452 |
|
|
Total financial liabilities |
|
$ |
— |
|
|
$ |
42,740 |
|
|
$ |
42,740 |
|
|
$ |
— |
|
|
$ |
43,452 |
|
|
$ |
43,452 |
|
78
Valuation Techniques:
|
|
· |
Level 1—includes instruments for which quoted prices in active markets for identical assets or liabilities that the Company has the ability to access. The Company’s financial assets utilizing Level 1 inputs include U.S. treasuries, money market funds, marketable equity securities and our employee deferred compensation plan assets. |
|
|
· |
Level 2—includes instruments for which the valuations are based on quoted prices for similar assets or liabilities, quoted prices in markets that are not active, or other inputs that are observable or can be corroborated by observable data for substantially the full term of the assets or liabilities. The Company’s Level 2 instruments include certain U.S. government securities, commercial paper, corporate notes and bonds and our employee deferred compensation plan liabilities. Foreign currency forward contracts are classified as Level 2 because the valuation inputs are based on observable market data of similar instruments. The Company principally executes its foreign currency contracts in the retail market in an over-the-counter environment with a relatively high level of price transparency. The market participants and the Company’s counterparties are large money center banks and regional banks. The valuation inputs for the Company’s foreign currency contracts are based on observable market data from public data sources (specifically, forward points, LIBOR rates, volatilities and credit default rates at commonly quoted intervals) and do not involve management judgment. |
|
|
· |
Level 3—includes instruments for which the valuations are based on inputs that are unobservable and significant to the overall fair value measurement. As of January 3, 2016 and December 28, 2014, the Company did not own any financial assets utilizing Level 3 inputs. |
The Company determines the basis of the cost of a security sold or the amount reclassified out of accumulated other comprehensive income into earnings using the specific identification method.
There were no material transfers between Level 1, Level 2 and Level 3 fair value hierarchies during fiscal 2015 and 2014.
Assets Measured at Fair Value on a Nonrecurring Basis
Certain of the Company’s assets, including intangible assets, goodwill and cost-method investments, are measured at fair value on a nonrecurring basis if impairment is indicated.
As of January 3, 2016, the carrying value of the Company’s senior secured revolving line of credit was $449.0 million. The fair value of the Company’s line of credit approximates its fair value since it bears an interest rate that is similar to existing market rates.
The Company's 2.00% Senior Exchangeable Notes assumed as part of the Merger is traded in the market and is categorized as Level 2. The carrying value and the estimated fair value of the debt portion of the Notes as of January 3, 2016 is $131.8 million and $279.6 million respectively. See Note 14 for further details.
Investments in Equity Securities
Privately-held equity investments are accounted for under the cost method if the Company has less than 20 % ownership interest, and it does not have the ability to exercise significant influence over the operations of the privately-held companies. The Company’s total investments in equity securities accounted for under the cost method included long-term investments in non-marketable equity securities (investments in privately-held companies) are $9.2 million and $5.9 million, as of January 3, 2016 and December 28, 2014, respectively.
Privately-held equity investments are accounted for under the equity method of accounting if the Company has an ownership interest of 20% or greater or if it has the ability to exercise significant influence over the operations of the privately-held companies. The Company’s total investments in equity securities accounted for under the equity method of accounting are $41.3 million and $20.5 million as of January 3, 2016 and December 28, 2014, respectively.
In February 2012, the Company entered into a Stock Purchase Agreement (the “Agreement”) with a company that designs, develops and manufactures products in the area of advanced battery storage for mobile consumer devices. Pursuant to the terms of the Agreement, the Company has so far purchased $56.0 million of preferred voting stock from the company and has committed to purchase additional preferred stock in a series of subsequent closings subject to certain performance milestones that must be fulfilled within a defined and agreed-upon timeline. In fiscal 2016, the Company plans to make investments subject to the attainment of certain milestones and the timing of additional capital requests which could vary substantially. As of January 3, 2016 and December 28, 2014, the Company owned 38.7 % and 26.2% respectively, of the company. Since the fourth quarter of fiscal 2014, the company accounts for its investment in the company under the equity method of accounting.
79
The remaining privately-held equity investments are accounted for under the cost method and are periodically reviewed for other-than-temporary declines in fair value
During fiscal 2013, the Company sold its equity investment in one publicly traded company for $2.2 million and recognized a gain of $1.1 million in “Other income (expense), net”.
In fiscal 2014, the Company, through its wholly-owned subsidiary, purchased 6.9 million ordinary shares of Hua Hong Semiconductor Limited (HHSL) for an aggregate price of $10.0 million in connection with their initial public offering. HHSL is the parent company of Grace Semiconductor Manufacturing Corporation, which is one of the Company’s strategic foundry partners. The Company recorded an unrealized loss on its investment in HHSL’s ordinary shares of $4.7 million and $1.5 million in "Other income (expense), net" as a result of the decline in the fair market value of the investment as of January 3, 2016 and December 28, 2014, respectively.
The Company’s investments are periodically reviewed for other-than-temporary declines in fair value by considering available evidence, including general market conditions, financial condition, pricing in recent rounds of financing, if any, earnings and cash flow forecasts, recent operational performance and any other readily available market data.
NOTE 6. INVESTMENTS
Available-For-Sale Securities and Other Investments
The following tables summarize the Company’s available-for-sale securities and other investments:
|
|
|
As of January 3, 2016 |
|
|
As of December 28, 2014 |
|
||||||||||||||||||||||||||
|
|
|
Cost |
|
|
Gross Unrealized Gains |
|
|
Gross Unrealized Losses |
|
|
Fair Value |
|
|
Cost |
|
|
Gross Unrealized Gains |
|
|
Gross Unrealized Losses |
|
|
Fair Value |
|
||||||||
|
|
|
(In thousands) |
|
|||||||||||||||||||||||||||||
|
Reported as cash equivalents: |
|
|
|
|
|
|
|
|
|
|
|
|
|
|
|
|
|
|
|
|
|
|
|
|
|
|
|
|
|
|
|
|
|
Money market funds |
|
$ |
119 |
|
|
$ |
— |
|
|
$ |
— |
|
|
$ |
119 |
|
|
$ |
7,665 |
|
|
$ |
— |
|
|
$ |
— |
|
|
$ |
7,665 |
|
|
Total cash equivalents |
|
|
119 |
|
|
|
— |
|
|
|
— |
|
|
|
119 |
|
|
|
7,665 |
|
|
|
— |
|
|
|
— |
|
|
|
7,665 |
|
|
Reported as short-term investments: |
|
|
|
|
|
|
|
|
|
|
|
|
|
|
|
|
|
|
|
|
|
|
|
|
|
|
|
|
|
|
|
|
|
Corporate notes and bonds |
|
|
— |
|
|
|
— |
|
|
|
— |
|
|
|
— |
|
|
|
5,616 |
|
|
|
— |
|
|
|
(17 |
) |
|
|
5,599 |
|
|
Federal agency |
|
|
— |
|
|
|
— |
|
|
|
— |
|
|
|
— |
|
|
|
3,617 |
|
|
|
— |
|
|
|
(2 |
) |
|
|
3,615 |
|
|
U.S. treasuries |
|
|
— |
|
|
|
— |
|
|
|
— |
|
|
|
— |
|
|
|
5,002 |
|
|
|
— |
|
|
|
(9 |
) |
|
|
4,993 |
|
|
Commercial paper |
|
|
— |
|
|
|
— |
|
|
|
— |
|
|
|
— |
|
|
|
— |
|
|
|
— |
|
|
|
— |
|
|
|
— |
|
|
Certificates of deposit |
|
|
871 |
|
|
|
— |
|
|
|
— |
|
|
|
871 |
|
|
|
869 |
|
|
|
— |
|
|
|
— |
|
|
|
869 |
|
|
Total short-term investments |
|
|
871 |
|
|
|
— |
|
|
|
— |
|
|
|
871 |
|
|
|
15,104 |
|
|
|
— |
|
|
|
(28 |
) |
|
|
15,076 |
|
|
Total available-for-sale securities and other investments |
|
$ |
990 |
|
|
$ |
— |
|
|
$ |
— |
|
|
$ |
990 |
|
|
$ |
22,769 |
|
|
$ |
— |
|
|
$ |
(28 |
) |
|
$ |
22,741 |
|
As of January 3, 2016, the contractual maturities of the Company’s available-for-sale investments and certificates of deposit were as follows (the table below does not include our investments in marketable equity securities):
|
|
|
Cost |
|
|
Fair Value |
|
||
|
|
|
(In thousands) |
|
|||||
|
Maturing within one year |
|
$ |
990 |
|
|
$ |
990 |
|
|
Total |
|
$ |
990 |
|
|
$ |
990 |
|
Realized gains and realized losses from sales of available-for-sale in fiscal 2015, 2014 and 2013 were not material.
80
NOTE 7. ASSETS HELD FOR SALE
Fixed Assets
During fiscal 2014, certain equipment which had been classified as held for sale in fiscal 2013 was sold resulting in a gain of $0.6 million. During fiscal 2013, we incurred a $6.7 million restructuring charge to write down this equipment to the then current fair value of $2.3 million.
NOTE 8.EMPLOYEE STOCK PLANS AND STOCK-BASED COMPENSATION
The Company’s equity incentive plans are broad-based, long-term programs intended to attract and retain talented employees and align stockholder and employee interests.
The Company currently has the following employee stock plans:
1999 Stock Option Plan (“1999 Plan”):
The 1999 Plan expired in March 2009. There are currently no shares available for grant under the 1999 Plan. Under the 1999 Plan 2.0 million shares are issued and outstanding. Any outstanding shares cancelled or forfeited under the 1999 Plan will not be available for any future grants since the 1999 Plan expired.
2013 Stock Option Plan (“2013 Plan”):
At the 2013 Annual Shareholders Meeting, the Company’s shareholders approved the extension of the 1994 Stock Plan to January 15, 2024 and renamed the plan as the 2013 Stock Plan. The 2013 Plan provides for (1) the discretionary granting of Options, Stock Appreciation Rights ("SARs"), Restricted Stock Awards ("RSAs") or Restricted Stock Units ("RSUs") to Employees, Consultants and Outside Directors, which Options may be either Incentive Stock Options (for Employees only) or NonstatutoryStock Options, as determined by the Administrator at the time of grant; and (2) the grant of Nonstatutory Stock Options, SARs, Restricted Stock or RSUs to Outside Directors pursuant to an automatic, non-discretionary formula. Options or awards granted under the 2013 Stock Plan generally expire over terms not exceeding eight years from the date of grant, subject to earlier termination upon the cessation of employment or service of the recipients. The maximum aggregate number of shares authorized for issuance under the 2013 Stock Plan is 145.2 million shares. As of January 3, 2016, 25.0 million options or 13.3 million RSUs and RSAs were available for grant under the 2013 Stock Plan. In the first quarter of fiscal 2015, in connection with the Merger, Cypress’ the shareholders approved an increase in the number of shares issuable under the Cypress 2013 Stock Plan by 29.3 million shares that could be issued as full value awards (such as restricted stock units (RSUs), and performance stock units (PSUs)), or as appreciation awards (such as stock options and/or stock appreciation rights)(if awards are granted only in the form of RSUs or other full value awards, this increase in shares would allow for the issuance of only up to 15.6 million shares, to a total of 31.0 million reserved but unissued shares under the 2013 Stock Plan).
2010 Equity Incentive Award Plan (“2010 Plan”)
In connection with the Company’s Merger with Spansion, it assumed their 2010 Plan, as amended, which reserves a total of 10.1 million shares of common stock for issuance under stock options, stock appreciation rights, restricted stock units, restricted stock, performance awards, stock payments, dividend equivalents and deferred stock to its employees, consultants and non-employee members of its Board of Directors. The 2010 Plan provides that incentive stock options may only be granted to employees of the Company or its subsidiaries. All stock options expire if not exercised by the seventh anniversary of the grant date. Annual RSU awards granted generally vest over a period of two to four years. Options granted become exercisable in full or in installments pursuant to the terms of each agreement evidencing options granted. The exercise of stock options and issuance of restricted stock and restricted stock units is satisfied by issuing authorized common stock or treasury stock. Shares that are subject to or underlie awards that expire or for any reason are cancelled, terminated or forfeited, or fail to vest will again be available for grant under the 2010 Plan. Grants from this plan are limited to employees who joined Cypress as part of the Merger and grants to new Cypress employees. As of January 3, 2016, 10.1 million shares of stock options or RSUs and RSAs were available for grant under the 2010 Plan.
81
2012 Incentive Award Plan (“2012 Plan”):
In connection with the Company’s acquisition of Ramtron in 2012, it assumed their 2012 Plan, as amended, which reserves a total of 1.2 million shares of common stock for issuance under stock option or restricted stock grants. The exercise price of all non-qualified stock options must be no less than 100% of the fair market value on the effective date of the grant under the 2012 Plan, and the maximum term of each grant is seven years. The 2012 Plan permits the issuance of incentive stock options, the issuance of restricted stock, and other types of awards. Restricted stock grants generally vest five years from the date of grant. Options granted become exercisable in full or in installments pursuant to the terms of each agreement evidencing options granted. The exercise of stock options and issuance of restricted stock and restricted stock units is satisfied by issuing authorized common stock or treasury stock. Grants from this plan are limited to employees who joined Cypress as part of the Ramtron acquisition and grants to new Cypress employees. As of January 3, 2016, 2 thousand shares of stock options or RSUs and RSAs were available for grant under the 2012 Plan.
Employee Stock Purchase Plan (“ESPP”) :
At the 2013 Annual Shareholders Meeting, the Company’s shareholders approved an extension of the ESPP Plan to May 10, 2023. The Company’s ESPP allows eligible employees to purchase shares of our common stock through payroll deductions. The ESPP contains consecutive 18 -month offering periods composed of three six -month exercise periods. The shares can be purchased at the lower of 85% of the fair market value of the common stock at the date of commencement of the offering period or at the last day of each six -month exercise period. Purchases are limited to 10% of an employee’s eligible compensation, subject to a maximum annual employee contribution limit of $21,250. As of January 3, 2016 1.7 million shares were available for future issuance under the ESPP.
Stock-Based Compensation
The following table summarizes the stock-based compensation expense by line item in the Consolidated Statement of Operations:
|
|
|
Year Ended |
|
|||||||||
|
|
|
January 3, 2016 |
|
|
December 28, 2014 |
|
|
December 29, 2013 |
|
|||
|
|
|
|
|
|
|
(In thousands) |
|
|
|
|
|
|
|
Cost of revenues |
|
$ |
16,459 |
|
|
$ |
13,209 |
|
|
$ |
12,789 |
|
|
Research and development |
|
|
25,719 |
|
|
|
16,187 |
|
|
|
26,042 |
|
|
Selling, general and administrative |
|
|
51,349 |
|
|
|
20,774 |
|
|
|
34,189 |
|
|
Total stock-based compensation expense |
|
$ |
93,527 |
|
|
$ |
50,170 |
|
|
$ |
73,020 |
|
In connection with the Merger, the Company assumed stock options and full value awards originally granted by Spansion. Stock-based compensation expense in fiscal 2015 included $21.6 million related to assumed Spansion stock options and RSUs respectively.
As stock-based compensation expense recognized in the Consolidated Statements of Operations is based on awards ultimately expected to vest, it has been adjusted for estimated forfeitures. The accounting guidance requires forfeitures to be estimated at the time of grant and revised, if necessary, in subsequent periods if actual forfeitures differ from those estimates.
Consolidated cash proceeds from the issuance of shares under the employee stock plans were $52.9 million, $32.0 million and $43.3 million for fiscal 2015, fiscal 2014 and 2013, respectively. No income tax benefit was realized from stock option exercises for fiscal 2015, 2014 and 2013. As of January 3, 2016 and December 28, 2014 stock-based compensation capitalized in inventories totaled $4.3 million and $2.0 million, respectively.
82
The following table summarizes the stock-based compensation expense by type of awards:
|
|
|
Year Ended |
|
|||||||||
|
|
|
January 3, 2016 |
|
|
December 28, 2014 |
|
|
December 29, 2013 |
|
|||
|
|
|
|
|
|
|
(In thousands) |
|
|
|
|
|
|
|
Stock options |
|
$ |
1,920 |
|
|
$ |
4,717 |
|
|
$ |
8,747 |
|
|
Restricted stock units and restricted stock awards |
|
|
74,897 |
|
|
|
37,837 |
|
|
|
54,359 |
|
|
ESPP |
|
|
16,710 |
|
|
|
7,616 |
|
|
|
9,914 |
|
|
Total stock-based compensation expense |
|
$ |
93,527 |
|
|
$ |
50,170 |
|
|
$ |
73,020 |
|
The following table summarizes the unrecognized stock-based compensation balance, net of estimated forfeitures, by type of awards as of January 3, 2016:
|
(In thousands) |
|
|
|
|
|
Weighted-Average Amortization Period |
|
|
|
|
|
|
|
|
|
(In years) |
|
|
|
Stock options |
|
$ |
2,631 |
|
|
|
1.27 |
|
|
Restricted stock units and restricted stock awards |
|
|
82,087 |
|
|
|
1.57 |
|
|
ESPP |
|
|
18,364 |
|
|
|
0.67 |
|
|
Total unrecognized stock-based compensation balance, net of estimated forfeitures |
|
$ |
103,082 |
|
|
|
1.40 |
|
Valuation Assumptions
The Company estimates the fair value of its stock-based equity awards using the Black-Scholes valuation model. Assumptions used in the Black-Scholes valuation model were as follows:
|
|
|
Year Ended |
||||||
|
|
|
January 3, 2016 |
|
|
December 28, 2014 |
|
December 29, 2013 |
|
|
Stock Option Plans: |
|
|
|
|
|
|
|
|
|
Expected life |
|
|
— |
|
|
4.4-5.7 years |
|
4.2-5.3 years |
|
Volatility |
|
|
— |
|
|
39.7%-41.1% |
|
38.2%-41.9% |
|
Risk-free interest rate |
|
|
— |
|
|
0.26%-1.75% |
|
0.93%-1.85% |
|
Dividend yield |
|
|
— |
|
|
4.2%-4.4% |
|
3.8%-4.5% |
|
ESPP: |
|
|
|
|
|
|
|
|
|
Expected life |
|
0.5-1.5 years |
|
|
0.5-1.5 years |
|
0.5-1.5 years |
|
|
Volatility |
|
35.9%-46.6% |
|
|
31.0%-36.1% |
|
38.4%-46.3% |
|
|
Risk-free interest rate |
|
0.09%-0.86% |
|
|
0.03%-0.35% |
|
0.08%-0.32% |
|
|
Dividend yield |
|
4.5%-5.2% |
|
|
4.2%-4.4% |
|
3.8%-4.5% |
|
Expected life: Expected life is based on historical exercise patterns, giving consideration to the contractual terms of the awards and vesting schedules. In addition, employees who display similar historical exercise behavior are grouped separately into two classes (executive officers and other employees) in determining the expected life.
Volatility: The Company determined that implied volatility of publicly traded call options and quotes from option traders is more reflective of market conditions and, therefore, can reasonably be a better indicator of expected volatility than historical volatility. Therefore, volatility is based on a blend of historical volatility of the Company’s common stock and implied volatility.
Risk-free interest rate: The risk-free interest rate is based on the U.S. Treasury yield curve in effect at the time of grant.
Dividend yield: The expected dividend is based on the Company’s history and expected dividend payouts.
83
Employee Equity Award Activities
As of January 3, 2016, 35.1 million stock options, or 23.4 million RSUs/PSUs, were available for grant under the 2013 Stock Plan, the 2010 Equity Incentive Award Plan (formerly the Spansion 2010 Equity Incentive Award Plan) and the 2012 Incentive Award Plan (formerly the Ramtron Plan).
Stock Options:
As a part of the Merger, Cypress assumed all outstanding Spansion options and these options were converted into options to purchase Cypress common stock at the agreed upon conversion ratio. The exercise price per share for each assumed Spansion option is equal to exercise price per share of Spansion option divided by 2.457.
The following table summarizes the Company’s stock option activities:
|
|
|
Year Ended |
|
|||||||||||||||||||||
|
|
|
January 3, 2016 |
|
|
December 28, 2014 |
|
|
December 29, 2013 |
|
|||||||||||||||
|
|
|
Shares |
|
|
Weighted- Average Exercise Price per Share |
|
|
Shares |
|
|
Weighted- Average Exercise Price per Share |
|
|
Shares |
|
|
Weighted- Average Exercise Price per Share |
|
||||||
|
|
|
(In thousands, except per-share amounts) |
|
|||||||||||||||||||||
|
Options outstanding, beginning of year |
|
|
14,463 |
|
|
$ |
9.24 |
|
|
|
19,060 |
|
|
$ |
8.33 |
|
|
|
22,760 |
|
|
$ |
7.25 |
|
|
Options assumed as a part of the Merger |
|
|
8,976 |
|
|
$ |
12.86 |
|
|
|
— |
|
|
— |
|
|
|
— |
|
— |
|
|||
|
Granted |
|
|
— |
|
|
$ |
— |
|
|
|
522 |
|
|
$ |
10.24 |
|
|
|
4,122 |
|
|
$ |
11.40 |
|
|
Exercised |
|
|
(5,391 |
) |
|
$ |
5.71 |
|
|
|
(4,027 |
) |
|
$ |
4.47 |
|
|
|
(5,622 |
) |
|
$ |
5.19 |
|
|
Forfeited or expired |
|
|
(1,208 |
) |
|
$ |
12.75 |
|
|
|
(1,092 |
) |
|
$ |
11.59 |
|
|
|
(2,200 |
) |
|
$ |
11.09 |
|
|
Options outstanding, end of year |
|
|
16,840 |
|
|
$ |
7.99 |
|
|
|
14,463 |
|
|
$ |
9.24 |
|
|
|
19,060 |
|
|
$ |
8.33 |
|
|
Options exercisable, end of year |
|
|
14,366 |
|
|
$ |
7.40 |
|
|
|
9,787 |
|
|
$ |
8.05 |
|
|
|
12,346 |
|
|
$ |
6.39 |
|
The weighted-average grant-date fair value was $2.22 per share for options granted in fiscal 2014 and $2.63 per share in options granted during fiscal 2013. The Company did not grant any new stock options during 2015.
The aggregate intrinsic value of the options outstanding and options exercisable as of January 3, 2016 was $48.1 and $47.9 million respectively. The aggregate intrinsic value represents the total pre-tax intrinsic value which would have been received by the option holders had all option holders exercised their options as of January 3, 2016 and does not include substantial tax payments.
The aggregate intrinsic value of the options outstanding and options exercisable as of December 28, 2014 was $82.8 million and $68.0 million, respectively. The aggregate intrinsic value represents the total pre-tax intrinsic value which would have been received by the option holders had all option holders exercised their options as of December 28, 2014 and does not include substantial tax payments.
The aggregate pre-tax intrinsic value of option exercises, which represents the difference between the exercise price and the value of Cypress common stock at the time of exercise, was $41.8 million in fiscal 2015, $26.4 million in fiscal 2014 and $31.9 million in fiscal 2013.
The aggregate grant date fair value of the options which vested in fiscal 2015, fiscal 2014 and 2013 was $5.6 million $6.9 million and $10.1 million, respectively.
84
The following table summarizes information about options outstanding and exercisable as of January 3, 2016:
|
|
|
Options Outstanding |
|
|
Options Exercisable |
|
||||||||||||||
|
Range of Exercise Price |
|
Shares |
|
|
Weighted- Average Remaining Contractual Life |
|
|
Weighted- Average Exercise Price per Share |
|
|
Shares |
|
|
Weighted- Average Exercise Price per Share |
|
|||||
|
|
|
|
|
|
|
(In years) |
|
|
|
|
|
|
|
|
|
|
|
|
|
|
|
$2.72-$3.99 |
|
|
1,821,541 |
|
|
|
0.81 |
|
|
$ |
3.57 |
|
|
|
1,812,477 |
|
|
$ |
3.57 |
|
|
$4.01-$4.09 |
|
|
1,815,277 |
|
|
|
3.01 |
|
|
$ |
4.09 |
|
|
|
1,815,277 |
|
|
$ |
4.09 |
|
|
$4.15-$4.22 |
|
|
173,644 |
|
|
|
0.51 |
|
|
$ |
4.17 |
|
|
|
173,644 |
|
|
$ |
4.17 |
|
|
$4.28-$4.28 |
|
|
1,981,218 |
|
|
|
1.35 |
|
|
$ |
4.28 |
|
|
|
1,981,218 |
|
|
$ |
4.28 |
|
|
$4.30-$6.17 |
|
|
2,162,508 |
|
|
|
2.80 |
|
|
$ |
5.44 |
|
|
|
2,150,857 |
|
|
$ |
5.44 |
|
|
$6.22-$8.10 |
|
|
2,112,745 |
|
|
|
2.11 |
|
|
$ |
7.61 |
|
|
|
2,112,745 |
|
|
$ |
7.61 |
|
|
$8.43-$10.92 |
|
|
1,133,060 |
|
|
|
4.38 |
|
|
$ |
9.97 |
|
|
|
697,698 |
|
|
$ |
9.90 |
|
|
$11.27-$11.27 |
|
|
1,812,686 |
|
|
|
4.87 |
|
|
$ |
11.27 |
|
|
|
1,072,597 |
|
|
$ |
11.27 |
|
|
$11.32-$11.40 |
|
|
181,205 |
|
|
|
3.02 |
|
|
$ |
11.33 |
|
|
|
167,965 |
|
|
$ |
11.33 |
|
|
$11.55-$23.23 |
|
|
3,645,837 |
|
|
|
4.54 |
|
|
$ |
13.67 |
|
|
|
2,381,600 |
|
|
$ |
14.50 |
|
|
|
|
|
16,839,721 |
|
|
|
3.04 |
|
|
$ |
7.99 |
|
|
|
14,366,078 |
|
|
$ |
7.40 |
|
The total number of exercisable in-the-money options was 8.4 million shares as of January, 2016.
As of January 3, 2016, stock options vested and expected to vest totaled 16.6 million shares, with a weighted-average remaining contractual life of 3.0 years and a weighted-average exercise price of $7.95 per share. The aggregate intrinsic value was $48.0 million.
Restricted Stock Units, Performance-Based Restricted Stock Units and Restricted Stock Awards:
The following table summarizes the Company’s restricted stock unit and restricted stock award activities:
|
|
|
Year Ended |
|
|||||||||||||||||||||
|
|
|
January 3, 2016 |
|
|
December 28, 2014 |
|
|
December 29, 2013 |
|
|||||||||||||||
|
|
|
Shares |
|
|
Weighted- Average Grant Date Fair Value per Share |
|
|
Shares |
|
|
Weighted- Average Grant Date Fair Value per Share |
|
|
Shares |
|
|
Weighted- Average Grant Date Fair Value per Share |
|
||||||
|
|
|
(In thousands, except per-share amounts) |
|
|||||||||||||||||||||
|
Non-vested, beginning of year |
|
|
7,838 |
|
|
$ |
10.98 |
|
|
|
8,652 |
|
|
$ |
11.97 |
|
|
|
7,887 |
|
|
$ |
14.52 |
|
|
Granted and assumed |
|
|
10,172 |
|
|
$ |
14.78 |
|
|
|
6,344 |
|
|
$ |
10.16 |
|
|
|
7,040 |
|
|
$ |
11.40 |
|
|
Released |
|
|
(3,594 |
) |
|
$ |
5.60 |
|
|
|
(4,363 |
) |
|
$ |
11.58 |
|
|
|
(2,378 |
) |
|
$ |
9.77 |
|
|
Forfeited |
|
|
(3,363 |
) |
|
$ |
11.66 |
|
|
|
(2,795 |
) |
|
$ |
11.21 |
|
|
|
(3,897 |
) |
|
$ |
14.74 |
|
|
Non-vested, end of year |
|
|
11,053 |
|
|
$ |
13.43 |
|
|
|
7,838 |
|
|
$ |
10.98 |
|
|
|
8,652 |
|
|
$ |
11.97 |
|
Of the total awards granted and assumed in 2015, 3.2 million awards were performance-based units granted for the performance-based restricted stock program (PARS) for 2015, 1.6 million awards were service-based units granted under the 2015 PARS program, which employees are eligible to earn 100% if they remain an employee of the Company through specified dates between fiscal 2016 and 2018, and 23 thousand awards were granted to individuals subject to the achievement of specific milestones. Of the total awards granted in 2014, 2.6 million awards were performance-based units granted for the 2014 PARS program, 0.6 million awards were service-based units granted under the 2014 PARS program and 0.3 million awards were granted to individuals subject to the achievement of specific milestones. Of the total awards granted in 2013, 4.6 million awards were performance-based units granted for the 2013 PARS program and 0.2 million awards were granted to individuals subject to the achievement of specific milestones.
85
Of the total awards released in 2015, 0.6 million and 0.5 million awards were released for the performance-based units and service-based units, respectively granted under the 2014 PARS program and 0.2 million shares were released to individuals who achieved the specific milestones set upon grant. Of the total awards released in 2014, 2.4 million awards were released for the performance-based units granted under the 2013 PARS program and 46 thousand shares were released to individuals who achieved the specific milestones set upon grant. Of the total awards released in 2013, 1.0 million awards were released for the 2012 PARS program and 0.1 million shares were released to individuals who achieved the specific milestones set upon grant.
A portion of the non-vested balance as of January 3, 2016 included 5.3 million units for the PARS programs. These PARS were issued to certain senior-level employees in fiscal 2014 and 2015 and can be earned ratably over a period of one to three years, subject to the achievement of certain milestones that were set by the Compensation Committee in advance. Any share not earned due to not achieving the full performance milestone are forfeited and returned to the pool.
The PSUs and RSUs under Cypress’s 2015 PARS Program were granted by the Company in the first and second quarters of fiscal 2015 with an extended measurement period of three years. These awards were issued to certain senior-level employees and the PSU portion of the award can be earned over a period of one to three years, subject to the achievement of certain performance milestones that were set by the Compensation Committee in advance. Each participating employee is given a target number of PSUs under each milestone, which can be earned independent of the outcomes of other milestones. Any portion of PSUs not earned due to not achieving the performance milestone is forfeited and returned to the pool. The following milestones for the 2015 PSUs were approved by the Compensation Committee:
|
|
|
· Total Shareholder Return (TSR) Factor, for the applicable measurement period of one, two and three years as compared to a group of peer companies chosen by the Compensation Committee. If the Company ranks in the 65th percentile of peers, 100% of the target PSUs is earned by employees. If the Company exceeds a 65th percentile ranking, employees can earn as high as 200% of the target RSUs. If the Company ranks in the 25th percentile or less, no PSUs are earned by employees under this milestone. If TSR is negative for the measurement period, only 50% of target PSUs are earned. · Realization of an annualized target Merger synergy over the three year period from fiscal 2015 to fiscal 2017. Employees are eligible to earn their target PSUs if the cost synergies associated with the Merger achieves the stated goal for each of the years between fiscal 2015 and 2017. The payouts under this milestone are adjusted on a linear scale between the 0% payout and the 100% payout and then between the 100% payout to 200% maximum payout, depending on the achievement of synergy savings target as specified in the grant agreement. · Achievement of target non-GAAP earnings per share (EPS). Employees are eligible to earn their target PSUs if the Company achieves the target non-GAAP EPS for the specified periods. The payouts under this milestone are adjusted on a linear scale between the 0% payout and the 100% payout and then between the 100% payout to 200% maximum payout, depending on the achievement of this milestone. The measurement period will be for the Company’s reported non-GAAP EPS in the fourth quarter of 2015 and 2016 as well as an annual non-GAAP EPS for fiscal 2017. |
The three milestones for the 2014 PARS Program, as approved by the Compensation Committee, were as follows:
|
|
· |
Milestone #1-our Chief Executive Officer’s annual goals, or CSFs. The CEO CSFs represent the action items that are most critical to the Company’s short- and long-term success. In order for a participant to earn 100% of the shares underlying Milestone #1, our CEO had to obtain 85 points or greater under the CEO CSFs and achievement then scaled down linearly to 0% of shares earned if the CEO CSF score was less than 60 points. |
|
|
· |
Milestone #2-required the Company to achieve a specific revenue amount during fiscal year 2015. In order for a participant to earn 100% of the RSUs underlying Milestone #2, the Company had to achieve a specific revenue amount level in fiscal year 2015 which scaled down linearly to 0% of the shares earned if the dollar value of the specific revenue amount was less than target. |
|
|
· |
Milestone #3-required the participant to remain employed through January 30, 2016. 75% of Milestone #3 targeted PARS vest on January 30, 2015 and the remaining 25% will vest on January 30, 2016. |
Both Milestones #1 and #2 were multiplied by a Total Shareholder Return (TSR) Factor, for the applicable milestone performance period as compared to the performance of a Peer Group of Companies as detailed in our 2014 Proxy. The TSR factor which adjusted on a linear scale was .625 if Cypress was at the 10th or lower rank order percentile, 1.0 if Cypress was in the 40th and 60th rank percentile and 1.375 if Cypress was at the 90th or higher rank order percentile.
ESPP:
During fiscal 2015, 2014 and 2013, the Company issued 2.6 million, 1.5 million and 1.5 million shares under its ESPP with weighted-average price of $8.69, $8.93 and $9.21 per share, respectively.
86
NOTE 9. BALANCE SHEET COMPONENTS
Accounts Receivable, Net
|
|
|
As of |
|
|||||
|
|
|
January 3, 2016 |
|
|
December 28, 2014 |
|
||
|
|
|
(In thousands) |
|
|||||
|
Accounts receivable, gross |
|
$ |
295,803 |
|
|
$ |
79,091 |
|
|
Allowances for doubtful accounts receivable and sales returns |
|
|
(3,067 |
) |
|
|
(3,107 |
) |
|
Accounts receivable, net |
|
$ |
292,736 |
|
|
$ |
75,984 |
|
Inventories
|
|
|
As of |
|
|||||
|
|
|
January 3, 2016 |
|
|
December 28, 2014 |
|
||
|
|
|
(In thousands) |
|
|||||
|
Raw materials |
|
$ |
13,516 |
|
|
$ |
4,753 |
|
|
Work-in-process |
|
|
192,245 |
|
|
|
64,003 |
|
|
Finished goods |
|
|
37,834 |
|
|
|
19,471 |
|
|
Total inventories |
|
$ |
243,595 |
|
|
$ |
88,227 |
|
Total inventories include gross inventory of $385.2 million and inventory provisions of $141.6 million as of January 3, 2016. Total inventories include gross inventory of $121.8 million and inventory provisions of $33.5 million as of December 28, 2014. During the year ended January 3, 2016, the Company recorded $133 million of provisions to write down inventory assumed from the Merger and were recognized as part of the Company's strategy to focus on high margin, profitable business as a combined company and to move away from the production and sale of inventory associated with non-strategic business.
Other Current Assets
|
|
|
As of |
|
|||||
|
|
|
January 3, 2016 |
|
|
December 28, 2014 |
|
||
|
|
|
(In thousands) |
|
|||||
|
Prepaid tooling assets |
|
$ |
19,379 |
|
|
$ |
3,880 |
|
|
Restricted cash relating to pension plan (see Note 17) |
|
|
3,730 |
|
|
|
— |
|
|
Foundry service prepayments - ST |
|
|
5,753 |
|
|
|
— |
|
|
Prepaid expenses |
|
|
30,934 |
|
|
|
17,897 |
|
|
Other current assets |
|
|
27,084 |
|
|
|
7,511 |
|
|
Total other current assets |
|
$ |
86,880 |
|
|
$ |
29,288 |
|
Property, Plant and Equipment, Net
|
|
|
As of |
|
|||||
|
|
|
January 3, 2016 |
|
|
December 28, 2014 |
|
||
|
|
|
(In thousands) |
|
|||||
|
Land |
|
$ |
37,819 |
|
|
$ |
18,570 |
|
|
Equipment |
|
|
1,191,469 |
|
|
|
1,017,121 |
|
|
Buildings, building and leasehold improvements |
|
|
314,017 |
|
|
|
221,465 |
|
|
Construction in progress |
|
|
28,050 |
|
|
|
12,093 |
|
|
Furniture and fixtures |
|
|
12,946 |
|
|
|
6,902 |
|
|
Total property, plant and equipment, gross |
|
|
1,584,301 |
|
|
|
1,276,151 |
|
|
Less: accumulated depreciation and amortization |
|
|
(1,159,298 |
) |
|
|
(1,038,388 |
) |
|
Total property, plant and equipment, net |
|
$ |
425,003 |
|
|
$ |
237,763 |
|
87
Other Long-term Assets
|
|
|
As of |
|
|||||
|
|
|
January 3, 2016 |
|
|
December 28, 2014 |
|
||
|
|
|
(In thousands) |
|
|||||
|
Employee deferred compensation plan |
|
$ |
41,249 |
|
|
$ |
44,116 |
|
|
Investments in Equity securities |
|
|
57,030 |
|
|
|
34,992 |
|
|
Deferred tax assets |
|
|
4,080 |
|
|
|
1,187 |
|
|
Long term license |
|
|
24,079 |
|
|
|
4,633 |
|
|
Restricted cash relating to pension plan (see Note 17) |
|
|
3,462 |
|
|
|
— |
|
|
Long term receivable from sale of TrueTouch ® Mobile business (see Note 3) |
|
|
10,000 |
|
|
|
— |
|
|
Foundry service prepayments - LT |
|
|
26,237 |
|
|
|
— |
|
|
Other assets |
|
|
34,272 |
|
|
|
8,665 |
|
|
Total other long-term assets |
|
$ |
200,409 |
|
|
$ |
93,593 |
|
Other Current Liabilities
|
|
|
As of |
|
|||||
|
|
|
January 3, 2016 |
|
|
December 28, 2014 |
|
||
|
|
|
(In thousands) |
|
|||||
|
Employee deferred compensation plan |
|
$ |
41,457 |
|
|
$ |
43,452 |
|
|
Restructuring accrual - ST (see Note 10) |
|
|
7,270 |
|
|
|
1,177 |
|
|
License commitment |
|
|
18,496 |
|
|
|
— |
|
|
Deferred Revenue on sale of TrueTouch® mobile business (see Note 3) |
|
|
15,295 |
|
|
|
— |
|
|
Deferred liability - distributor price adjustments |
|
|
52,712 |
|
|
|
19,618 |
|
|
Other current liabilities |
|
|
67,175 |
|
|
|
30,372 |
|
|
Total other current liabilities |
|
$ |
202,405 |
|
|
$ |
94,619 |
|
Other Long-Term Liabilities
|
|
|
As of |
|
|||||
|
|
|
January 3, 2016 |
|
|
December 28, 2014 |
|
||
|
|
|
(In thousands) |
|
|||||
|
Long-term pension liabilities |
|
$ |
8,712 |
|
|
$ |
5,768 |
|
|
Restructuring accrual - LT (see Note 10) |
|
|
14,217 |
|
|
|
— |
|
|
Other long-term liabilities |
|
|
14,855 |
|
|
|
4,925 |
|
|
Total other long-term liabilities |
|
$ |
37,784 |
|
|
$ |
10,693 |
|
Sale of Spansion's Sunnyvale property
On January 23, 2014, Spansion sold its property in Sunnyvale, California, consisting of 24.5 acres of land with approximately 471,000 square feet of buildings that included its headquarters building and submicron development center, a Pacific Gas & Electric transmission facility and a warehouse building, for net consideration of $59.0 million. Spansion concurrently leased back approximately 170,000 square feet of the headquarters building on a month-to-month basis with the option to continue the lease for up to 24 months; thereafter, either party could terminate the lease. The first six months of the lease were rent free; thereafter, the rents were lower than the market rates. For accounting purposes, these rents were deemed to have been netted against the sale proceeds and represent prepaid rent. As such, the use of the property after its sale constituted continuing involvement and recognition of the sale of the property was deferred until the lease period ends. In the third quarter of fiscal 2015, the Company terminated the lease on the Sunnyvale building and recognized an immaterial gain.
88
NOTE 10. RESTRUCTURING
Spansion Integration-Related Restructuring Plan
In March 2015, the Company began the implementation of planned cost reduction and restructuring activities in connection with the Merger. As part of this plan, the Company expects to eliminate approximately 1,000 positions from the combined workforce across all business and functional areas on a global basis. The restructuring charge of $90.1 million recorded for the fiscal year ended January 3, 2016 primarily consists of severance costs, lease termination costs and impairment of property, plant and equipment. The lease termination costs include approximately $18 million relating to the buildings Spansion had leased prior to the Merger, which the Company decided not to occupy in the post-merger period. The initial term of the lease commenced on January 1, 2015 and will expire on December 31, 2026.
The following table summarizes the restructuring charges recorded in the Company’s Consolidated Statements of Operations for the periods presented pursuant to the Spansion Integration-Related Restructuring Plan:
|
|
|
Year Ended |
|
|
|
|
|
January 3, 2016 |
|
|
|
|
|
(In thousands) |
|
|
|
Personnel costs |
|
$ |
58,972 |
|
|
Lease termination costs and other related charges |
|
|
18,016 |
|
|
Impairment of property, plant and equipment |
|
|
12,531 |
|
|
Other |
|
|
565 |
|
|
Total restructuring and other charges |
|
$ |
90,084 |
|
Restructuring activity under the Spansion Integration – Related Restructuring Plan during fiscal year ended January 3, 2016:
|
|
|
Year Ended |
|
|
|
|
|
January 3, 2016 |
|
|
|
|
|
(In thousands) |
|
|
|
Accrued restructuring balance as of December 28, 2014 |
|
$ |
— |
|
|
Provision |
|
|
81,041 |
|
|
Cash payments and other |
|
|
(59,554 |
) |
|
Accrued restructuring balance as of January 3, 2016 |
|
$ |
21,487 |
|
The provision for restructuring expense in the table above does not include the charge to write off certain leasehold improvements from the first quarter of 2015, which totaled $9.0 million.
The Company anticipates that the remaining restructuring accrual balance will be paid out in cash through the first quarter of 2016 for employee terminations and over the remaining lease term through 2026 for the excess lease obligation.
NOTE 11. FOREIGN CURRENCY DERIVATIVES
The Company enters into multiple foreign exchange forward contracts to hedge certain operational exposures resulting from movements in Japanese yen and euro exchange rates. The Company does not enter into derivative securities for speculative purposes. The Company’s hedging policy is designed to mitigate the impact of foreign currency exchange rate movements on its operating results. Some foreign currency forward contracts are considered to be economic hedges that are not designated as hedging instruments while others are designated as cash flow hedges. Whether designated or undesignated, these forward contracts protect the Company against the variability of forecasted foreign currency cash flows resulting from revenues, expenses and net asset or liability positions designated in currencies other than the U.S. dollar. The maximum original duration of any contract allowable under the Company’s hedging policy is thirteen months.
89
Cash Flow Hedges
The Company enters into cash flow hedges to protect non-functional currency revenues, inventory purchases and certain other operational expenses against variability in cash flows due to foreign currency fluctuations. The Company’s foreign currency forward contracts that were designated as cash flow hedges have maturities between three and nine months. All hedging relationships are formally documented, and the hedges are designed to offset changes to future cash flows on hedged transactions at the inception of the hedge. The Company recognizes derivative instruments from hedging activities as either assets or liabilities on the balance sheet and measures them at fair value on a monthly basis. The Company records changes in the intrinsic value of its cash flow hedges in accumulated other comprehensive income on the Consolidated Balance Sheets, until the forecasted transaction occurs. Interest charges or “forward points” on the forward contracts are excluded from the assessment of hedge effectiveness and are recorded in other income (expense), net in the Consolidated Statements of Operations. When the forecasted transaction occurs, the Company reclassifies the related gain or loss on the cash flow hedge to revenue or costs, depending on the risk hedged. In the event the underlying forecasted transaction does not occur, or it becomes probable that it will not occur, the Company will reclassify the gain or loss on the related cash flow hedge from accumulated other comprehensive income to other income (expense), net in its Consolidated Statements of Operations at that time.
The Company evaluates hedge effectiveness at the inception of the hedge prospectively as well as retrospectively and records any ineffective portion of the hedge in other income (expense), net in its Consolidated Statements of Operations.
At January 3, 2016, the Company had outstanding forward contracts to buy ¥2,690.0 million for $22.7 million.
Non-designated hedges
Total notional amounts of outstanding contracts were as summarized below. The duration or each contract is approximately thirty days:
|
Buy / Sell |
|
January 3, 2016 |
|
|
|
(in millions) |
|
US dollar / Japanese Yen |
|
$19.4 / ¥2,333 |
|
US dollar / EUR |
|
$7.3/€6.8 |
NOTE 12. ACCUMULATED OTHER COMPREHENSIVE LOSS
The components of Accumulated other comprehensive loss were as follows:
|
|
|
Accumulated net unrealized losses on available-for-sale investments |
|
|
Cumulative translation adjustment and other |
|
|
Unrecognized Gain on the Defined Benefit Plan |
|
|
Accumulated other comprehensive loss (income) |
|
||||
|
|
|
(in thousands) |
|
|||||||||||||
|
Balance as of December 29, 2013 |
|
$ |
(183 |
) |
|
$ |
6 |
|
|
$ |
— |
|
|
$ |
(177 |
) |
|
Other comprehensive income (loss) before reclassification |
|
|
131 |
|
|
|
— |
|
|
|
— |
|
|
|
131 |
|
|
Balance as of December 28, 2014 |
|
$ |
(52 |
) |
|
$ |
6 |
|
|
$ |
— |
|
|
$ |
(46 |
) |
|
Other comprehensive income (loss) before reclassification |
|
|
(1,623 |
) |
|
|
— |
|
|
|
— |
|
|
|
(1,623 |
) |
|
Amounts reclassified to earnings |
|
|
1,416 |
|
|
|
— |
|
|
|
— |
|
|
|
1,416 |
|
|
Net unrecognized gain on the Defined Benefit Plan |
|
|
— |
|
|
|
— |
|
|
|
26 |
|
|
|
26 |
|
|
Balance as of January 3, 2016 |
|
$ |
(259 |
) |
|
$ |
6 |
|
|
$ |
26 |
|
|
$ |
(227 |
) |
90
NOTE 13. OTHER INCOME (EXPENSE), NET
The following table summarizes the components of “other income (expense), net,” recorded in the Consolidated Statements of Operations:
|
|
|
Year Ended |
|
|||||||||
|
|
|
January 3, 2016 |
|
|
December 28, 2014 |
|
|
December 29, 2013 |
|
|||
|
|
|
(In thousands) |
|
|||||||||
|
Interest income |
|
$ |
885 |
|
|
$ |
362 |
|
|
$ |
301 |
|
|
Changes in fair value of investments under the deferred compensation plan |
|
|
(1,354 |
) |
|
|
3,014 |
|
|
|
6,371 |
|
|
Unrealized loss on marketable securities |
|
|
(4,655 |
) |
|
|
(1,495 |
) |
|
|
— |
|
|
Impairment of investments |
|
|
— |
|
|
|
— |
|
|
|
25 |
|
|
Foreign currency exchange gains (losses), net |
|
|
744 |
|
|
|
1,382 |
|
|
|
2,791 |
|
|
Gain on sale of equity investments |
|
|
276 |
|
|
|
— |
|
|
|
908 |
|
|
Other |
|
|
335 |
|
|
|
40 |
|
|
|
(59 |
) |
|
Other income (expense), net |
|
$ |
(3,769 |
) |
|
$ |
3,303 |
|
|
$ |
10,337 |
|
NOTE 14. DEBT AND EQUITY TRANSACTIONS
Debt is comprised of the following:
|
|
|
As of |
|
|||||
|
|
|
January 3, 2016 |
|
|
December 28, 2014 |
|
||
|
|
|
(In thousands) |
|
|||||
|
Current portion of long-term debt |
|
|
|
|
|
|
|
|
|
Capital lease obligations |
|
$ |
6,603 |
|
|
$ |
3,227 |
|
|
Equipment loans |
|
|
3,003 |
|
|
|
2,916 |
|
|
Term Loan A |
|
|
5,000 |
|
|
|
— |
|
|
Current portion of long-term debt |
|
|
14,606 |
|
|
|
6,143 |
|
|
Revolving credit facility and long-term debt |
|
|
|
|
|
|
|
|
|
Credit facility |
|
|
449,000 |
|
|
|
227,000 |
|
|
Term Loan A |
|
|
92,228 |
|
|
|
— |
|
|
2% Senior Exchangeable Notes |
|
|
131,845 |
|
|
|
— |
|
|
Capital lease obligations |
|
|
586 |
|
|
|
7,105 |
|
|
Equipment loans |
|
|
— |
|
|
|
3,002 |
|
|
Revolving credit facility and long-term debt |
|
|
673,659 |
|
|
|
237,107 |
|
|
Total debt |
|
$ |
688,265 |
|
|
$ |
243,250 |
|
Senior Secured Revolving Credit Facility
On March 12, 2015, the Company amended and restated its existing senior secured revolving credit facility ("Credit Facility") and increased the size of the Credit Facility from $300 million to $450 million. The restated agreement also contains an option permitting the Company to arrange additional commitments of $250 million (“Incremental Availability”) and specifies that the proceeds of these loans may be used for working capital, acquisitions, stock repurchases and general corporate purposes. The borrowings under the Credit Facility will bear interest, at the Company's option, at an adjusted base rate plus a spread of 1.25%, or an adjusted LIBOR rate plus a spread of 2.25%. The borrowings under the Credit Facility are collateralized by substantially all of the Company's assets. The financial covenants were amended to include the following conditions: 1) maximum total leverage ratio of 3.50 to 1.00 through January 1, 2017, and 3.00 to 1.00 thereafter, 2) minimum fixed charge coverage ratio of 1.00 to 1.00. At January 3, 2016, the Company's outstanding borrowings of $449.0 million were recorded as part of long-term liabilities and are presented as “Long-term revolving credit facility and long term debt” on the Consolidated Balance Sheet. The Company incurred financing costs of $2.3 million to the new lenders of the Credit Facility which has been capitalized and recognized in other long-term assets on the Consolidated Balance Sheet. These costs will be amortized over the life of the Credit Facility.
91
As per the terms of the Credit Facility, the Company entered into a Joinder Agreement on December 22, 2015 under which the Company borrowed an additional $100 million (“Term Loan A”). Term Loan A is subject to, at the Company’s option, either an interest rate equal to (i) 3.25% over LIBOR or (ii) an interest rate equal to 2.25% over the greater of (x) the prime lending rate published by the Wall Street Journal, (y) the federal funds effective rate plus 0.50%, and (z) the LIBOR rate for a one month interest period plus 1%. The Company paid a 1.00% upfront fee in connection with the Term Loan A. Such Term Loan A is payable in quarterly installments equal to 1.25% per quarter for 2016, 1.875% per quarter for 2017 and 2018, and 2.50% per quarter thereafter, with the remaining outstanding principle amount due at final maturity on March 12, 2020. It may be voluntarily prepaid at the Company’s option and is subject to mandatory prepayments equal to (i) 50% of excess cash flow, as defined in the agreement, (stepping down to 25% and 0% based on a decrease in total leverage ratio over time) at the end of each fiscal year, (ii) the net cash proceeds from certain asset sales (subject to certain reinvestment rights) and (iii) the proceeds from any debt issuances not otherwise permitted under the Credit Agreement. The Company incurred financing costs of $2.8 million to the lenders of Term Loan A which has been capitalized and recognized as a deduction of the Term Loan A balance in “Long-term revolving credit facility and long term debt” on the Consolidated Balance Sheet. These costs will be amortized over the life of Term Loan A.
The Credit Facility, as amended, provides for a $450 million revolving credit facility and generally contains the same representations and warranties, covenants, and events of default that it contained prior to the effectiveness of the Amendment. The Amendment did not change the interest rate or maturity applicable to the Credit Facility and the Credit Facility remains guaranteed by certain present and future wholly-owned material domestic subsidiaries of the Company (the “Guarantors”) and secured by a security interest in substantially all assets of the Company and the Guarantors.
On January 6, 2016, subsequent to fiscal 2015, the Company entered into an Incremental Revolving Joinder Agreement to its Credit Facility to increase the amount of revolving commitments under our Credit Facility by an additional $90 million. The total aggregate amount of revolving commitments under the Credit Facility starting January 6, 2016 is $540 million.
The proceeds of the loans made under the Credit Facility may be used for working capital, acquisitions, stock repurchases and general corporate purposes. As January 3, 2016, $549 million aggregate principal amount of loans, including Term Loan A, and letters of credit are outstanding under the Credit Facility and none of the Incremental Availability has been used.
As of January 3, 2016, the Company was in compliance with all of the financial covenants under the Credit Facility.
2.00% Senior Exchangeable Notes
Pursuant to the Merger, Cypress assumed Spansion's 2.00% Senior Exchangeable Notes (the Notes) on March 12, 2015. The Notes are governed by a Supplemental Indenture, dated March 12, 2015, between the Company, Spansion and Wells Fargo Bank, National Association, as Trustee. They are fully and unconditionally guaranteed on a senior unsecured basis by the Company. The Notes will mature on September 1, 2020, unless earlier repurchased or converted, and bear interest of 2.00% per year payable semi-annually in arrears on March 1 and September 1, commencing on March 1, 2014. The Notes may be due and payable immediately in certain events of default.
As of January 3, 2016, the Notes are exchangeable for 184.068 shares of common stock per $1,000 principal amount of the Notes (equivalent to an exchange price of $5.43) subject to adjustments for dividends, anti-dilutive issuances and make-whole adjustments upon a fundamental change. A fundamental change includes a change in control, delisting of the Company’s stock and liquidation, consolidation or merger of the Company. According to the Indenture, a change in control occurs when a person or group becomes the beneficial owner directly or indirectly, of more than 50% of the Company’s common stock. In the case of a consolidation or merger, if the surviving entity continues to be listed, no change of control will be triggered. Prior to June 1, 2020, the Notes will be exchangeable under certain specified circumstances as described in the Indenture.
The Notes were valued as of March 12, 2015 as a part of the Merger and the Company separated the Notes into debt and equity components according to the accounting guidance for convertible debt instruments that may be fully or partially settled in cash upon conversion. The carrying amount of the debt component, which approximates its fair value, was estimated by using an interest rate for nonconvertible debt, with terms similar to the Notes. The excess of the principal amount of the Notes over the fair value of the debt component was recorded as a debt discount and a corresponding increase in additional paid-in capital. The debt discount is accreted to the carrying value of the Notes over their term as interest expense using the interest method. The amount recorded to additional paid-in capital will not to be remeasured as long as it continues to meet the conditions for equity classification. As of March 12, 2015, as a part of the Merger valuation, the Company recorded $129.3 million as debt and $287.3 million as additional paid-in capital in stockholders’ equity. On June 9, 2015, the Company settled ten of the Notes in both cash and shares owing to a receipt of notice of conversion in the first quarter of fiscal 2015.
92
The net carrying amount of liability component of the Notes as of January 3, 2016 consists of the following:
|
|
|
(in thousands) |
|
|
|
Principal amount |
|
$ |
150,000 |
|
|
Settlement due to notice from bondholder |
|
|
(10 |
) |
|
Unamortized debt discount |
|
|
(18,145 |
) |
|
Net carrying value |
|
$ |
131,845 |
|
The following table presents the interest expense recognized on the Notes during the fiscal year ended January 3, 2016:
|
|
|
Year Ended |
|
|
|
|
|
January 3, 2016 |
|
|
|
|
|
( in thousands) |
|
|
|
Contractual interest expense at 2% per annum |
|
$ |
2,441 |
|
|
Accretion of debt discount |
|
|
2,700 |
|
|
Total |
|
$ |
5,141 |
|
Capped Calls
In connection with the Notes, Spansion had entered into capped call transactions in fiscal 2013 with certain bank counterparties to reduce the potential dilution to their common stock upon exchange of the Notes. The fair value of the capped call assumed as a part of the Merger was $25.3 million. In March 2015, the Company and the counterparties agreed to terminate and unwind the capped calls and the Company received a cash settlement of $25.3 million which has been recorded as a credit to additional paid-in-capital on the Consolidated Balance Sheet as of January 3, 2016.
Equipment Loans
In December 2011, the Company obtained equipment loans from a certain financial institution for an aggregate amount of $14.1 million. These loans are collateralized by certain of the Company’s manufacturing equipment and bear interest of 3.15% to 3.18% per annum and are payable in 60 equal installments which commenced in January 2012. The related master loan agreement includes a variety of standard covenants. All of the outstanding balance as of January 3, 2016 was recorded as part of “Other current liabilities.” At January 3, 2016 and December 28, 2014, the fair value of the equipment loans approximated the carrying value. The fair value was estimated using discounted cash flow analysis using relevant factors that might affect the fair value, such as present value factors and risk-free interest rates based on the U.S. Treasury yield curve.
The schedule of principal payments under equipment loans is as follows:
|
Fiscal Year |
|
(In thousands) |
|
|
|
2016 |
|
$ |
3,003 |
|
|
Total |
|
$ |
3,003 |
|
Stock Buyback Programs:
On October 20, 2015, the Company’s Board authorized a new $450 million stock buyback program. In connection with the approval of the new share repurchase plan, the share repurchase plan previously approved in September 2011 was terminated. The program allows the Company to purchase its common stock or enter into equity derivative transactions related to our common stock. The timing and actual amount expended with the new authorized funds will depend on a variety of factors including the market price of the Company’s common stock, regulatory, legal, and contractual requirements, alternatives uses of cash, availability of on shore cash and other market factors. The program does not obligate the Company to repurchase any particular amount of common stock and may be modified or suspended at any time at the Company’s discretion. From September 2011 through the termination of the program, the Company used $327.4 million from the program to repurchase 24.4 million shares at an average share price of $13.4. Under the new program authorized in October, 2015 through the end of fiscal 2015, the Company used $56.5 million to repurchase 5.7 million share at an average price of $10.00.
93
Yield Enhancement Program:
In fiscal 2009, the Audit Committee approved a yield enhancement strategy intended to improve the yield on the Company’s available cash. As part of this program, the Audit Committee authorized the Company to enter into short-term yield enhanced structured agreements, typically with maturities of 90 days or less, correlated to the Company’s stock price. Under the agreements the Company entered into to date, it pays a fixed sum of cash upon execution of an agreement in exchange for the financial institution’s obligations to pay either a pre-determined amount of cash or shares of the Company’s common stock depending on the closing market price of the Company’s common stock on the expiration date of the agreement. Upon expiration of each agreement, if the closing market price of the Company’s common stock is above the pre-determined price, the Company will have its cash investment returned plus a yield substantially above the yield currently available for short-term cash investments. If the closing market price is at or below the pre-determined price, the Company will receive the number of shares specified at the agreement’s inception. As the outcome of these arrangements is based entirely on the Company’s stock price and does not require the Company to deliver either shares or cash, other than the original investment, the entire transaction is recorded in equity.
The Company enters into a yield enhanced structured agreement based upon a comparison of the yields available in the financial markets for similar maturities against the expected yield to be realized per the structured agreement and the related risks associated with this type of arrangement. The Company believes the risk associated with these types of agreements is no different than alternative investments available to the Company with equivalent counterparty credit ratings. All counterparties to a yield enhancement program have a credit rating of at least Aa2 or A as rated by major independent rating agencies. For all such agreements that matured to date, the yields of the structured agreements were far superior to the yields available in the financial markets primarily due to the volatility of the Company’s stock price and the pre-payment aspect of the agreements. The counterparty is willing to pay a premium over the yields available in the financial markets due to the structure of the agreement.
The Company had no activity related to yield enhanced structured agreements during fiscal 2013. The following table summarizes the activity of the Company’s settled yield enhanced structured agreements during fiscal 2015 and 2014:
|
Periods |
|
Aggregate Price Paid |
|
|
Total Cash Proceeds Received Upon Maturity |
|
|
Yield Realized |
|
|
Total Number of Shares Received Upon Maturity |
|
|
Average Price Paid per Share |
|
|||||
|
Fiscal 2015: |
|
(in thousands) |
|
|
|
|
|
|
|
|
|
|||||||||
|
Settled through cash proceeds |
|
$ |
28,966 |
|
|
$ |
29,353 |
|
|
$ |
387 |
|
|
|
— |
|
|
$ |
— |
|
|
Settled through issuance of common stock |
|
|
9,601 |
|
|
|
— |
|
|
|
— |
|
|
|
1,000,000 |
|
|
|
9.6 |
|
|
Total for fiscal 2015 |
|
$ |
38,567 |
|
|
$ |
29,353 |
|
|
$ |
387 |
|
|
|
1,000,000 |
|
|
|
9.6 |
|
|
|
|
|
|
|
|
|
|
|
|
|
|
|
|
|
|
|
|
|
|
|
|
Fiscal 2014: |
|
|
|
|
|
|
|
|
|
|
|
|
|
|
|
|
|
|
|
|
|
Settled through cash proceeds |
|
$ |
19,415 |
|
|
$ |
19,733 |
|
|
$ |
318 |
|
|
|
— |
|
|
$ |
— |
|
|
Settled through issuance of common stock |
|
|
— |
|
|
|
— |
|
|
|
— |
|
|
|
— |
|
|
|
— |
|
|
Total for fiscal 2014 |
|
$ |
19,415 |
|
|
$ |
19,733 |
|
|
$ |
318 |
|
|
|
— |
|
|
$ |
— |
|
.
Dividends
During fiscal 2015, the Company paid total cash dividends of $128.0 million, consisting of dividends of $0.11 per share of common stock paid in all four quarters of the fiscal year. On November 9, 2015 the Company’s Board declared a cash dividend of $0.11 per share payable to holders of record of the Company’s common stock at the close of business day on December 31, 2015. This cash dividend was paid on January 21, 2016 and totaled $36.5 million.
During fiscal 2014, the Company paid total cash dividends of $69.2 million, consisting of dividends of $0.11 per share of common stock paid in all four quarters of the fiscal year. On November 24, 2014 the Company’s Board declared a cash dividend of $0.11 per share payable to holders of record of the Company’s common stock at the close of business day on December 26, 2014. This cash dividend was paid on January 15, 2015 and totaled $17.9 million.
During fiscal 2013, the Company paid total cash dividends of $64.8 million, consisting of dividends of $0.11 per share of common stock paid in all four quarters of the fiscal year. On November 1, 2013 the Company’s Board declared a cash dividend of $0.11 per share payable to holders of record of the Company’s common stock at the close of business day on December 23, 2013. This cash dividend was paid on January 15, 2014 and totaled $16.9 million.
94
NOTE 15. EQUITY METHOD INVESTMENT
During fiscal 2014, the Company invested an additional $15 million in a company that designs, develops and manufactures products in the area of advanced batter storage for mobile consumer devices. The additional investment in this company increased the Company’s ownership interest in the company’s outstanding stock from 17.6% to 26.2% as of December 28, 2014 and required the Company to change from the cost method of accounting to the equity method of accounting for this investment. Under the equity method of accounting, the Company is required to record its interest in the investee's reported net income or loss for each reporting period. Additionally, the Company is required to present its prior period financial results to reflect the equity method of accounting from the date of the initial investment in the company.
During fiscal 2015, the Company invested an additional $28.0 million, which increased its cumulative total investment to $41.3 million, representing 38.7% of such investee's outstanding voting shares as of January 3, 2016.
Cypress's results of operations include charges of $7.1 million, $5.1 million and $1.9 million, respectively, for the fiscal years ended 2015, 2014 and 2013, for this investment which were recorded in "Equity in Net loss of equity method investee" in the Company's Consolidated Statements of Operations.
NOTE 16. NET INCOME (LOSS) PER SHARE
Basic net income (loss) per share is computed using the weighted-average common shares outstanding. Diluted net income per share is computed using the weighted-average common shares outstanding and any dilutive potential common shares. Diluted net loss per common share is computed using the weighted-average common shares outstanding and excludes all dilutive potential common shares when the Company is in a net loss position their inclusion would be anti-dilutive. The Company’s dilutive securities primarily include stock options, restricted stock units and restricted stock awards.
The following table sets forth the computation of basic and diluted net income (loss) per share:
|
|
|
Year Ended |
|
|||||||||
|
|
|
January 3, 2016 |
|
|
December 28, 2014 |
|
|
December 29, 2013 |
|
|||
|
|
|
(In thousands, except per-share amounts) |
|
|||||||||
|
Net Income (Loss) per Share—Basic: |
|
|
|
|
|
|
|
|
|
|
|
|
|
Net income (loss) attributable to Cypress for basic computation |
|
$ |
(378,867 |
) |
|
$ |
17,936 |
|
|
$ |
(48,242 |
) |
|
Weighted-average common shares for basic computation |
|
|
302,036 |
|
|
|
159,031 |
|
|
|
148,558 |
|
|
Net income (loss) per share—basic |
|
$ |
(1.25 |
) |
|
$ |
0.11 |
|
|
$ |
(0.32 |
) |
|
Net Income (Loss) per Share—Diluted: |
|
|
|
|
|
|
|
|
|
|
|
|
|
Net income (loss) attributable to Cypress for diluted computation |
|
$ |
(378,867 |
) |
|
$ |
17,936 |
|
|
$ |
(48,242 |
) |
|
Weighted-average common shares for basic computation |
|
|
302,036 |
|
|
|
159,031 |
|
|
|
148,558 |
|
|
Effect of dilutive securities: |
|
|
|
|
|
|
|
|
|
|
|
|
|
Stock options, restricted stock units, restricted stock awards and other |
|
|
— |
|
|
|
10,091 |
|
|
|
— |
|
|
Weighted-average common shares for diluted computation |
|
|
302,036 |
|
|
|
169,122 |
|
|
|
148,558 |
|
|
Net income (loss) per share—diluted |
|
$ |
(1.25 |
) |
|
$ |
0.11 |
|
|
$ |
(0.32 |
) |
Anti-Dilutive Securities:
The following securities were excluded from the computation of diluted Net income (loss) per share as their impact was anti-dilutive:
|
|
|
Year Ended |
|
|||||||||
|
|
|
January 3, 2016 |
|
|
December 28, 2014 |
|
|
December 29, 2013 |
|
|||
|
|
|
|
|
|
|
(In thousands) |
|
|||||
|
Stock options, restricted stock units and restricted stock awards |
|
|
6,828 |
|
|
|
8,708 |
|
|
|
8,023 |
|
95
NOTE 17. EMPLOYEE BENEFIT PLANS
Pension Plans
The Company sponsors defined benefit pension plans covering employees in certain of its international locations. The Company does not have defined-benefit pension plans for its United States-based employees. Pension plan benefits are based primarily on participants’ compensation and years of service credited as specified under the terms of each country’s plan. The funding policy is consistent with the local requirements of each country.
As of January 3, 2016 and December 28, 2014, projected benefit obligations totaled $8.4 million and $9.0 million, respectively, and the fair value of plan assets was $3.3 million and $3.4 million, respectively.
Spansion Innovates Group Cash balance plan (Defined Benefit Plan)
In connection with the Merger, the Company assumed the Spansion Innovates Group Cash Balance Plan (a defined benefit pension plan) in Japan. Defined benefit pension plans are accounted for on an actuarial basis, which requires the selection of various assumptions such as turnover rates, discount rates and other factors. The discount rate assumption is determined by comparing the projected benefit payments to the Japanese corporate bonds yield curve as of end of the fiscal year. The benefit obligation is the projected benefit obligation (PBO), which represents the actuarial present value of benefits expected to be paid upon retirement. This liability is recorded in other long term liabilities on the Consolidated Balance Sheets. Net periodic pension cost is recorded in the Consolidated Statements of Operations and includes service cost. Service cost represents the actuarial present value of participant benefits earned in the current year. Interest cost represents the time value of money associated with the passage of time on the PBO. Gains or losses resulting from a change in the PBO if actual results differ from actuarial assumptions will be accumulated and amortized over the future life of the plan participants if they exceed 10% of the PBO, being the corridor amount. If the amount of a net gain or loss does not exceed the corridor amount, they will be recorded in other comprehensive income.
Also in connection with the assumption of this pension plan liability, the Company assumed the restricted cash balance, which relates to the underfunded portion of the pension liability. The pension liability will be paid out by fiscal 2017 in annual installments according to the employee's election. As of January 3, 2016 the Company has a pension liability of $3.9 million and $3.7 million recorded as a part of the accrued compensation and employee benefits, and other long-term liabilities, respectively, on the Consolidated Balance Sheet. As of January 3, 2016, the Company has restricted cash of $3.7 million and $3.5 million recorded in other current assets and other long-term assets, respectively, on the Consolidated Balance Sheet.
The plan is unfunded as of January 3, 2016. This status is not indicative of the Company’s ability to pay ongoing pension benefits. The Company recorded a net periodic cost of $0.9 million for the year ended January 3, 2016. The Company has accrued a liability of $1.7 million as of January 3, 2016 which has been recorded in other long term liabilities on the Consolidated Balance Sheet. The Company expects to contribute an immaterial amount towards the Cash Balance Plan for fiscal 2016.
Key Employee Bonus Plan (“KEBP”)
The Company has a key employee bonus plan, which provides for incentive payments to certain key employees including all executive officers except the Chief Executive Officer. Payments under the plan are determined based upon certain performance measures, including the Company’s Non-GAAP actual PBT% compared to a target as well as achievement of strategic, operational and financial goals established for each key employee. The Company recorded total charges of $0.5 million under the plan in fiscal 2015, $2.7 million under the plan in fiscal 2014 and $7.4 million in fiscal 2013.
Performance Bonus Plan
The Company has a performance bonus plan which provides for incentive payments to the Company’s CEO under a shareholder approved Plan. Payments under the plan are determined based upon the attainment and certification of certain objective performance criteria established by the Committee. Under the plan, the Company recorded total charges of less than $0.1 million for fiscal 2015, 2014 and 2013.
96
Performance Profit Sharing Plan (“PPSP”)
The Company has a performance profit sharing plan, which provides incentive payments to all of its employees. Payments under the plan are determined based upon the Company’s earnings per share and the employees’ percentage of success in achieving certain performance goals. The Company recorded total charges of $0.2 million under the plan in fiscal 2015, $1.1 million under the plan in fiscal 2014 and $2.7 million in fiscal 2013.
Deferred Compensation Plan
The Company has a deferred compensation plan, which provides certain key employees, including its executive management, with the ability to defer the receipt of compensation in order to accumulate funds for retirement on a tax-deferred basis. The Company does not make contributions to the deferred compensation plan or guarantee returns on the investments. Participant deferrals and investment gains and losses remain the Company’s assets and are subject to claims of general creditors.
Under the deferred compensation plan the assets are recorded at fair value in each reporting period with the offset being recorded in “Other income (expense), net.” The liabilities are recorded at fair value in each reporting period with the offset being recorded as an operating expense or income. As of January 3, 2016 and December 28, 2014, the fair value of the assets was $41.2 million and $44.1 million, respectively, and the fair value of the liabilities was $41.5 million and $43.5 million, respectively.
All expense and income recorded under the deferred compensation plan were included in the following line items in the Consolidated Statements of Operations:
|
|
|
Year Ended |
|
|||||||||
|
|
|
January 3, 2016 |
|
|
December 28, 2014 |
|
|
December 29, 2013 |
|
|||
|
|
|
|
|
|
|
(In thousands) |
|
|||||
|
Changes in fair value of assets recorded in: |
|
|
|
|
|
|
|
|
|
|
|
|
|
Other income (expense), net |
|
$ |
(1,353 |
) |
|
$ |
3,014 |
|
|
$ |
6,371 |
|
|
Changes in fair value of liabilities recorded in: |
|
|
|
|
|
|
|
|
|
|
|
|
|
Cost of revenues |
|
|
38 |
|
|
|
427 |
|
|
|
(854 |
) |
|
Research and development expenses |
|
|
233 |
|
|
|
(793 |
) |
|
|
(1,744 |
) |
|
Selling, general and administrative expenses |
|
|
260 |
|
|
|
(1,855 |
) |
|
|
(3,795 |
) |
|
Total income (expense), net |
|
$ |
(822 |
) |
|
$ |
793 |
|
|
$ |
(22 |
) |
401(k) Plan
The Company sponsors a 401(k) plan which provides participating employees with an opportunity to accumulate funds for retirement on a tax deferred basis. The Company does not make contributions to the 401(k) plan and all employee contributions are fully vested.
97
NOTE 18. INCOME TAXES
The geographic distribution of income (loss) before income taxes and the components of income tax benefit (provision) are summarized below:
|
|
|
Year Ended |
|
|||||||||
|
|
|
January 3, 2016 |
|
|
December 28, 2014 |
|
|
December 29, 2013 |
|
|||
|
|
|
|
|
|
|
(In thousands) |
|
|
|
|
|
|
|
United States loss |
|
$ |
(476,014 |
) |
|
$ |
(109,307 |
) |
|
$ |
(122,162 |
) |
|
Foreign income |
|
|
111,836 |
|
|
|
124,652 |
|
|
|
64,314 |
|
|
Income (loss) before income taxes |
|
|
(364,178 |
) |
|
|
15,345 |
|
|
|
(57,848 |
) |
|
Income tax benefit (provision): |
|
|
|
|
|
|
|
|
|
|
|
|
|
Current tax benefit (expense): |
|
|
|
|
|
|
|
|
|
|
|
|
|
Federal |
|
|
219 |
|
|
|
5,551 |
|
|
|
12,026 |
|
|
State |
|
|
55 |
|
|
|
(49 |
) |
|
|
(120 |
) |
|
Foreign |
|
|
(17,189 |
) |
|
|
(4,732 |
) |
|
|
(4,292 |
) |
|
Total current tax benefit (expense) |
|
|
(16,915 |
) |
|
|
770 |
|
|
|
7,614 |
|
|
Deferred tax benefit (expense): |
|
|
|
|
|
|
|
|
|
|
|
|
|
Federal |
|
|
(610 |
) |
|
|
— |
|
|
|
— |
|
|
State |
|
|
(155 |
) |
|
|
— |
|
|
|
— |
|
|
Foreign |
|
|
720 |
|
|
|
403 |
|
|
|
147 |
|
|
Total deferred tax benefit (expense) |
|
|
(45 |
) |
|
|
403 |
|
|
|
147 |
|
|
Income tax benefit (provision) |
|
$ |
(16,960 |
) |
|
$ |
1,173 |
|
|
$ |
7,761 |
|
Income tax benefit (provision) differs from the amounts obtained by applying the statutory United States federal income tax rate to income (loss) before taxes as shown below:
|
|
|
Year Ended |
|
|||||||||
|
|
|
January 3, 2016 |
|
|
December 28, 2014 |
|
|
December 29, 2013 |
|
|||
|
|
|
|
|
|
|
(In thousands) |
|
|
|
|
|
|
|
Benefit (provision) at U.S. statutory rate of 35% |
|
$ |
127,462 |
|
|
$ |
(5,371 |
) |
|
$ |
19,589 |
|
|
Foreign income at other than U.S. rates |
|
|
(22,385 |
) |
|
|
37,477 |
|
|
|
15,425 |
|
|
Future benefits not recognized |
|
|
(126,846 |
) |
|
|
(35,107 |
) |
|
|
(41,797 |
) |
|
Reversal of previously accrued taxes |
|
|
10,939 |
|
|
|
8,286 |
|
|
|
13,872 |
|
|
Tax impact of acquisitions |
|
|
(6,457 |
) |
|
|
(2,538 |
) |
|
|
1,061 |
|
|
Foreign withholding taxes |
|
|
(243 |
) |
|
|
(1,195 |
) |
|
|
(535 |
) |
|
State income taxes, net of federal benefit |
|
|
(138 |
) |
|
|
(49 |
) |
|
|
93 |
|
|
Other, net |
|
|
708 |
|
|
|
(330 |
) |
|
|
53 |
|
|
Income tax benefit (provision) |
|
$ |
(16,960 |
) |
|
$ |
1,173 |
|
|
$ |
7,761 |
|
98
The components of deferred tax assets and liabilities were as follows:
|
|
|
As of |
|
|||||
|
|
|
January 3, 2016 |
|
|
December 28, 2014 |
|
||
|
|
|
(In thousands) |
|
|||||
|
Deferred tax assets: |
|
|
|
|
|
|
|
|
|
Credits and net operating loss carryovers |
|
$ |
624,086 |
|
|
$ |
265,827 |
|
|
Reserves and accruals |
|
|
160,804 |
|
|
|
55,678 |
|
|
Excess of book over tax depreciation |
|
|
12,463 |
|
|
|
32,892 |
|
|
Deferred income |
|
|
20,059 |
|
|
|
6,197 |
|
|
Total deferred tax assets |
|
|
817,412 |
|
|
|
360,594 |
|
|
Less valuation allowance |
|
|
(525,021 |
) |
|
|
(358,424 |
) |
|
Deferred tax assets, net |
|
|
292,391 |
|
|
|
2,170 |
|
|
Deferred tax liabilities: |
|
|
|
|
|
|
|
|
|
Foreign earnings |
|
|
(184,671 |
) |
|
|
— |
|
|
Intangible assets arising from acquisitions |
|
|
(108,784 |
) |
|
|
— |
|
|
Total deferred tax liabilities |
|
|
(293,455 |
) |
|
|
— |
|
|
Net deferred tax assets |
|
$ |
(1,064 |
) |
|
$ |
2,170 |
|
The Company has the following tax loss and credit carryforwards available to offset future income tax liabilities:
|
Carryforward |
|
Amount |
|
|
Expiration Date |
|
|
|
|
($ in millions) |
|
|
|
|
|
Federal net operating loss carryforward |
|
|
1,708 |
|
|
2020-2035 |
|
Federal research credit carryforward |
|
|
136 |
|
|
2018-2035 |
|
International foreign tax credit carryforward |
|
|
13 |
|
|
2016-2023 |
|
State research credit carryforward |
|
|
105 |
|
|
Indefinite |
|
State net operating loss carryforward |
|
|
761 |
|
|
2016-2035 |
The federal and state net operating loss carryforward is from acquired companies and the annual use of such loss is subject to significant limitations under Internal Revenue Code Section 382. Foreign tax credits may only be used to offset tax attributable to foreign source income.
As of January 3, 2016 of the total deferred tax assets of $817.4 million, a valuation allowance of $525.0 million has been recorded for the portion which is not more likely than not to be realized. As of December 28, 2014, of the total deferred tax assets of $360.6 million, a valuation allowance of $358.4 million has been recorded for the portion which is not more likely than not to be realized. The Company’s determination of the need for a valuation allowance each year is based on a jurisdictional assessment.
The Company received tax deductions from the gains realized by employees on the exercise of certain non-qualified stock options for which the benefit is recognized as a component of stockholders’ equity. When recognized, the tax benefit related to $648.3 million of the Company’s net operating loss carry forwards will be accounted for as an increase to additional paid-in capital rather than a reduction of the income tax provision.
The Protecting Americans from Tax Hikes (PATH) Act (“Act”) (H.R 2029) was signed into law on December 18, 2015. The Act contains a number of provisions including, most notably, permanent extension of the United States federal research tax credit and extension of the refundable AMT credit in lieu of bonus depreciation. The Act did not have a material impact on the Company’s effective tax rate for fiscal 2015 due to the effect of the valuation allowance on the Company's deferred tax assets.
United States income taxes and foreign withholding taxes have not been provided on a cumulative total of $339.1 million and $298.6 million of undistributed earnings for certain non-United States subsidiaries as of January 3, 2016 and December 28, 2014, respectively, because portion of such earnings are intended to be indefinitely reinvested. Upon distribution of those earnings in the form of dividends or otherwise, the Company would be subject to U.S. income taxes (subject to an adjustment for foreign tax credits). It is not practicable to determine the income tax liability that might be incurred if these earnings were to be distributed.
99
The Company’s global operations involve manufacturing, research and development, and selling activities. The Company’s operations outside the U.S. are in certain countries that impose a statutory tax rate both higher and lower than the U.S. The Company is subject to tax holidays in the Philippines, Malaysia and Thailand where it manufactures and designs certain products. These tax holidays are scheduled to expire at varying times within the next six years. The Company’s tax benefit of these tax holidays for the year ended January 3, 2016 had an insignificant impact on earnings per share. Overall, the Company expects its foreign earnings to be taxed at rates lower than the statutory tax rate in the U.S.
Unrecognized Tax Benefits
The following table is a reconciliation of unrecognized tax benefits:
|
|
|
(In thousands) |
|
|
|
Unrecognized tax benefits, as of December 30, 2012 |
|
$ |
31,466 |
|
|
Decrease related to settlements with taxing authorities |
|
|
(9,216 |
) |
|
Increase based on tax positions related to current year |
|
|
962 |
|
|
Increase based on tax positions related to prior year |
|
|
163 |
|
|
Decrease related to lapsing of statute of limitation |
|
|
(4,762 |
) |
|
Unrecognized tax benefits, as of December 29, 2013 |
|
$ |
18,613 |
|
|
Decrease related to settlements with taxing authorities |
|
|
(6,361 |
) |
|
Increase based on tax positions related to current year |
|
|
993 |
|
|
Decrease related to lapsing of statute of limitation |
|
|
(1,638 |
) |
|
Unrecognized tax benefits, as of December 28, 2014 |
|
$ |
11,607 |
|
|
Decrease related to settlements with taxing authorities |
|
|
(838 |
) |
|
Decrease related to lapsing of statute of limitation |
|
|
(818 |
) |
|
Decrease based on tax positions related to prior year |
|
|
(10,272 |
) |
|
Increase based on tax positions related to current year |
|
|
6,487 |
|
|
Increases in balances related to tax positions taken during prior periods (including those related to acquisitions made during the year) |
|
|
108,677 |
|
|
Unrecognized tax benefits, as of January 3, 2016 |
|
$ |
114,843 |
|
Gross unrecognized tax benefits increased by $103 million during fiscal year 2015, resulting in gross unrecognized tax benefits of $115 million as of January 3, 2016. The increase in gross unrecognized tax benefits is primarily a result of our Merger with Spansion. Uncertain tax positions assumed in connection with merger and acquisitions are initially estimated as of the acquisition date.
During fiscal year 2015, the Company recognized $2 million of previously unrecognized tax benefits as a result of either the expiration of the statute of limitations for certain audit periods or settlement with taxing authorities.
The Company recognized interest and penalties related to unrecognized tax benefits within the provision for income taxes line in the accompanying consolidated statements of operations. The Company recognized approximately $6 million of expense related to interest and penalties in fiscal year 2015. Accrued interest and penalties are included within other long-term liabilities in the consolidated balance sheets. As of January 3, 2016 and December 28, 2014, the combined amount of cumulative accrued interest and penalties was approximately $12 million and $3 million, respectively. The increase in cumulative accrued interest and penalties is primarily a result of the Merger with Spansion.
As of January 3, 2016 and December 28, 2014, the amounts of unrecognized tax benefits that, if recognized, would affect the Company’s effective tax rate totaled $28.4 million and $12.9 million, respectively.
Management believes events that could occur in the next 12 months and cause a material change in unrecognized tax benefits include, but are not limited to, the following:
|
|
· |
completion of examinations by the U.S. or foreign taxing authorities; and |
|
|
· |
expiration of statute of limitations on the Company’s tax returns. |
100
The calculation of unrecognized tax benefits involves dealing with uncertainties in the application of complex global tax regulations. The Company regularly assesses its tax positions in light of legislative, bilateral tax treaty, regulatory and judicial developments in the countries in which it does business. The Company believes it is possible that it may recognize approximately $7.0 million of its existing unrecognized tax benefits within the next twelve months as a result of the lapse of statutes of limitations and the resolution of agreements with domestic and various foreign tax authorities.
Classification of Interest and Penalties
Our policy is to classify interest expense and penalties, if any, as components of income tax provision in the Consolidated Statements of Operations. As of January 3, 2016 and December 28, 2014, the amount of accrued interest and penalties totaled $12.0 million and $3.0 million, respectively. The Company recorded a charge or (benefit) from interest and penalties of $9.1 million, ($2.8) million and $1.9 million during fiscal 2015, 2014 and 2013, respectively.
Tax Examinations
The following table summarizes the Company’s major tax jurisdictions and the tax years that remain subject to examination by such jurisdictions as of January 3, 2016:
|
Tax Jurisdictions |
|
Tax Years |
|
United States |
|
2009 and onward |
|
Philippines |
|
2011 and onward |
|
Israel |
|
2014 and onward |
|
India |
|
2009 and onward |
|
Thailand |
|
2010 and onward |
|
Malaysia |
|
2007 and onward |
|
Switzerland |
|
2008 and onward |
|
California |
|
2010 and onward |
Non-U.S. tax authorities have completed their income tax examinations of the Company’s subsidiary in Israel for fiscal years 2008-2013 and its branch in Germany for fiscal years 2010 to 2013. Both Israel and Germany examinations did not result in material adjustments to the Company’s tax liabilities. Income tax examinations of the Company’s Malaysian subsidiary for the fiscal years 2007 to 2012 and its Thailand subsidiary for fiscal year 2010 are in progress. The Company does not believe the ultimate outcome of these examinations will result in a material increase to its tax liability.
NOTE 19. COMMITMENTS AND CONTINGENCIES
Product Warranties
The Company warrants its products against defects in materials and workmanship for a period of one year and that product warranty is generally limited to a refund of the original purchase price of the product or a replacement part. The Company estimates warranty costs based on historical warranty claim experience. Warranty returns are recorded as an allowance for sales returns. The allowance for sales returns is reviewed quarterly to verify that it properly reflects the remaining obligations based on the anticipated returns over the balance of the obligation period.
The following table presents warranty reserve activities:
|
|
|
Year Ended |
|
|||||||||
|
|
|
January 3, 2016 |
|
|
December 28, 2014 |
|
|
December 29, 2013 |
|
|||
|
|
|
(In thousands) |
|
|||||||||
|
Beginning balance |
|
$ |
2,370 |
|
|
$ |
2,628 |
|
|
$ |
3,360 |
|
|
Warranties assumed as part of the merger |
|
|
1,254 |
|
|
|
— |
|
|
|
— |
|
|
Provisions |
|
|
2,820 |
|
|
|
1,449 |
|
|
|
390 |
|
|
Settlements made |
|
|
(2,348 |
) |
|
|
(1,707 |
) |
|
|
(1,122 |
) |
|
Ending balance |
|
$ |
4,096 |
|
|
$ |
2,370 |
|
|
$ |
2,628 |
|
101
Patent License Agreement
In December 2015, the Company entered into a strategic Patent License Agreement (“Agreement”) with Round Rock LLC (“Round Rock”) under which the Company and its majority-owned subsidiaries received a license to Round Rock’s substantial patent portfolio. This transaction allowed the Company and Round Rock to continue to develop its strategic relationship regarding patent monetization and litigation defense. Under the terms of the Agreement, the Company paid a license fee of $6 million. One of the benefits that the Company received from the Agreement was the avoidance of future litigation expenses as well as future customer disruption and based upon its analysis, it determined that a portion of the license fee that the Company will pay Round Rock represents the cumulative cost relating to prior years. As such, the Company recorded, $2.2 million charge to cost of revenues in fiscal 2015. The Company capitalized $3.8 million on the Consolidated Balance Sheet of which $0.8 million in Current assets, and $3.0 million in Long-term assets on the Consolidated Balance Sheet as of January 3, 2016 and will amortize over the purchased life of the patent portfolio.
On April 30, 2012, the Company entered into a strategic Patent License Agreement (“PLA”) with IV Global Licensing LLC (“IV”) under which the Company and its majority-owned subsidiaries received a license to IV’s substantial patent portfolio. This transaction allowed the Company and IV to continue to develop their strategic relationship regarding patent monetization and litigation defense. Under the terms of the PLA, the Company paid a license fee of $14 million and to purchase certain litigation defense services from IV in the future. In addition, in a related agreement, IV is expected to make certain patent purchases from the Company in the near term. The exact terms and conditions of the PLA are subject to confidentiality provisions, and are the subject of an application for confidential treatment to be filed with the SEC. In June 2015, the Company paid an additional license fee of $18.5 million under the existing license agreement due to the merger with Spansion in March 2015.
One of the benefits that the Company received from the PLA was the avoidance of future litigation expenses as well as future customer disruption and based upon the Company’s analysis, using a relief from royalty method, the Company determined that a portion of the license fee that it will pay IV represents the cumulative cost relating to prior years. As such, the Company recorded, $7.1 million which was recorded as a charge to cost of revenues in fiscal 2012. The Company originally capitalized $6.9 million on the Consolidated Balance Sheet and an additional $18.5 million due to the acquisition of Spansion as discussed above and are amortizing over the remaining life of the patent portfolio. Amortization expense was $4.4 million, $0.8 million and $0.8 million in fiscal years January 3, 2016, December 28, 2014 and December 29, 2013, respectively. The remaining capitalized balance of the PLA is $18.7 million and $5.6 million in Current assets, and $13.2 million and $3.8 million in Long-term assets on the Consolidated Balance Sheet as of January 3, 2016 and December 28, 2014, respectively.
Capital Leases
On July 19, 2011, we entered into a capital lease agreement which allows us to borrow up to $35.0 million to finance the acquisition of certain manufacturing equipment. We have the option of purchasing the tools from the lessor at specified intervals during the lease term. The master lease contains standard covenants. Assets purchased under the capital lease are included in “Property, plant and equipment, net” as manufacturing equipment and the amortization is included in depreciation. As of January 3, 2016 the gross value and net book value of manufacturing equipment purchased under capital lease was $20.5 million and $11.9 million, respectively. As of January 3, 2016, the total minimum lease payments under our capital leases amounted to $7.2 million.
Future minimum payments, by year and in the aggregate, under the capitalized lease consist of the following:
|
Fiscal Year |
|
(In thousands) |
|
|
|
2016 |
|
$ |
6,715 |
|
|
2017 |
|
|
599 |
|
|
2018 |
|
|
— |
|
|
Total minimum lease payments |
|
|
7,314 |
|
|
Less: amount representing interest |
|
|
(125 |
) |
|
Present value of net minimum lease payments |
|
$ |
7,189 |
|
102
Operating Lease Commitments
We lease certain facilities and equipment under non-cancelable operating lease agreements that expire at various dates through fiscal 2018. Some leases include renewal options, which would permit extensions of the expiration dates at rates approximating fair market rental values.
As of January 3, 2016 future minimum lease payments under non-cancelable operating leases were as follows:
|
Fiscal Year |
|
(In thousands) |
|
|
|
2016 |
|
|
16,171 |
|
|
2017 |
|
|
13,076 |
|
|
2018 |
|
|
9,164 |
|
|
2019 |
|
|
6,541 |
|
|
2020 |
|
|
6,028 |
|
|
2021 and Thereafter |
|
|
23,835 |
|
|
Total |
|
$ |
74,815 |
|
Rental expenses totaled $17.1 million, $6.8 million and $7.2 million in fiscal 2015, 2014 and 2013, respectively.
Equity Investment Commitments
We have committed to purchase additional preferred stock from a company that works in the area of advanced battery storage. In fiscal 2015, we invested $28.0 million in this company. Subject to the attainment of certain milestones, we intend to purchase additional preferred stock in this company.
Litigation and Asserted Claims
In a matter associated with Ramtron International Corporation (“Ramtron”), a wholly owned subsidiary of Cypress, bankruptcy proceedings are ongoing in Italy where the trustee for four bankrupt entities of Finmek S.pA. is seeking refunds of payments made by Finmek to Ramtron prior to Finmek’s bankruptcy in 2004. In November 2014, one of the courts presiding over these proceedings found that two payments should be refunded to Finmek, which currently total $0.5 million, including interest and fees. We believe this ruling was made in error and are appealing this decision. Due to the current stage of the proceedings and the appellate process, the Company cannot reasonably estimate the range of possible loss, if any.
In 2013, a former employee filed a grievance against the Company seeking back pay and reinstatement or front pay. That matter was tried before an administrative law judge in July 2014. In December 2014, the administrative law judge issued a ruling in favor of the former employee for amounts totaling $1.3 million. We believe the ruling was erroneous and are currently appealing the decision. Due to the current stage of the proceedings and the appellate process, the Company cannot reasonably estimate the range of possible loss, if any.
On May 6, 2015, the Company entered into a confidential settlement agreement with GSI Technology, Inc. under which all outstanding patent and antitrust disputes and actions between the companies were settled. As a part of the settlement, both companies agreed to dismiss with prejudice all pending litigation. The settlement did not have a material effect on the Company’s business, financial condition, cash flows or results of operations.
In the LongPath Capital, LLC (“LongPath”) appraisal case, Petitioner LongPath sought an appraisal of the fair value of the shares of Ramtron common stock held by LongPath prior to the Company's acquisition of Ramtron in 2012. In June 2013, the Company paid the purchase price of $3.10 per share to LongPath, or $1.5 million, to cut off the accrual of statutory interest on the principal. As a result, the Company's potential exposure was limited to any premium on the purchase price that might be awarded by the court plus the interest accrued prior to June 2013. On June 30, 2015, the Delaware Court of Chancery ruled that the fair value of Ramtron as of the merger date was $3.07 per share, $0.03 below the purchase price, rejecting LongPath's claim that Ramtron should have been valued at over $4.00 per share. LongPath did not appeal the ruling and the case is now closed and did not have a material impact on the Company’s financial statements.
Pursuant to a confidential settlement agreement, the Company’s six-patent infringement case against LG Electronics, Inc. (“LG”) (Case No. 13-cv-04034-SBA), which was filed in August 2013, and the six petitions filed by LG for inter partes review of the asserted patents were settled effective as of July 28, 2015. The settlement did not have a material effect on the Company’s business, financial condition, cash flows or results of operations.
103
The Company has reached a settlement in the pending class action claims in three Canadian provinces relating to the original SRAM class action case that was resolved in the United States in 2010. As with the case in the United States, the Company is confident that it did not engage in any antitrust activity, however given that it was the last remaining defendant and the cost of continued litigation would far exceed the cost of a nominal settlement, the Company agreed to settle the case. The settlement did not have a material effect on the Company’s business, financial condition, cash flows or results of operations.
After our announcement of the Merger in December 2014, two separate putative class action complaints (Walter Jeter v. Spansion Inc., et. al. (No. 114CV274635) and Shiva Y. Stein v. Spansion Inc., el. al. (No. 114CV274924)) were filed in Santa Clara County Superior Court, alleging claims of breach of fiduciary duty against the Spansion’s board of directors and naming Cypress as a defendant for aiding and abetting the alleged breach of fiduciary duty. While Cypress believes these lawsuits to be meritless, Spansion and Cypress entered into a memorandum of understanding with plaintiffs, the terms of which required additional disclosures by the Company and payment of nominal attorneys’ fees to the class counsel. Final resolution of these litigations will require court approval of a final settlement agreement. Due to the current stage of the proceedings, the Company cannot reasonably estimate the range of possible loss, if any.
The Company is involved in various trademark opposition proceedings with Kingston Technology Corporation (“Kingston”) concerning Kingston’s “HYPERX” trademark and the Company’s “HYPERRAM trademark. These proceedings are in the early stages, preventing an accurate assessment of potential outcomes.
The Company is currently a party to various other legal proceedings, claims, disputes and litigation arising in the ordinary course of business. Based on its own investigations, the Company believes the ultimate outcome of the current legal proceedings, individually and in the aggregate, will not have a material adverse effect on its business, financial position, cash flows or results of operations. However, because of the nature and inherent uncertainties of the litigation, should the outcome of these actions be unfavorable, the Company's business, financial condition, cash flows or results of operations could be materially and adversely affected.
Indemnification Obligations
We are a party to a variety of agreements pursuant to which we may be obligated to indemnify another party to such agreements with respect to certain matters. Typically, these obligations arise in the context of contracts we have entered into, under which we customarily agree to hold the other party harmless against losses arising from a breach of representations and covenants or terms and conditions related to such matters as the sale and/or delivery of our products, title to assets sold, certain intellectual property claims, defective products, specified environmental matters and certain income taxes. In these circumstances, payment by us is customarily conditioned on the other party making a claim pursuant to the procedures specified in the particular contract, which procedures typically allow us to challenge the other party’s claims and vigorously defend ourselves and the third party against such claims. Further, our obligations under these agreements may be limited in terms of time, amount or the scope of our responsibility and in some instances, we may have recourse against third parties for certain payments made under these agreements.
It is not possible to predict the maximum potential amount of future payments under these agreements due to the conditional nature of our obligations and the unique facts and circumstances involved in each particular agreement. Historically, payments we have made under these agreements have not had a material effect on our business, financial condition, cash flows or results of operations. We believe that if we were to incur a loss in any of these matters, such loss would not have a material effect on our business, financial condition, cash flows or results of operations, although there can be no assurance of this. As of January 3, 2016 we had no reason to believe a loss exceeding amounts already recognized had been incurred.
NOTE 20. SEGMENT, GEOGRAPHICAL AND CUSTOMER INFORMATION
Segment Information
Operating segments are identified as components of an enterprise for which separate discrete financial information is available for evaluation by the chief operating decision-maker, or decision-making group, in making decisions on how to allocate resources and assess performance. The Company’s chief operating decision maker is considered to be the chief executive officer.
In connection with the Merger, the Company has aligned Spansion's two major product groups with Cypress's existing business segments: legacy Spansion flash memory products are reported in the Company's Memory Products Division and legacy Spansion microcontroller and analog products are reported in the Company's Programmable Systems Division.
104
The Company operates in the following four reportable business segments:
|
Business Segments |
|
Description |
|
|
|
|
|
PSD: Programmable Systems Division |
|
PSD focuses on high-performance, programmable solutions. The programmable portfolio includes high-performance Traveo™ automotive microcontrollers, PSoC® programmable system-on-chip products, ARM® Cortex®-M4, -M3, -M0+ microcontrollers and R4 CPUs, analog PMIC Power Management ICs, CapSense® capacitive-sensing controllers, TrueTouch® touchscreen and fingerprint reader products, and PSoC Bluetooth Low Energy solutions for the IoT. Effective March 12, 2015, PSD added Spansion’s microcontroller and analog products. |
|
|
|
|
|
MPD: Memory Products Division |
|
MPD focuses on high-performance parallel and serial NOR flash memories, NAND flash memories, static random access memory (SRAM), and high-reliability F-RAM™ ferroelectric memory devices. Its purpose is to enhance our position in these products and invent new products and derivatives. Effective March 12, 2015, MPD added Spansion’s Flash memory products. |
|
|
|
|
|
DCD: Data Communications Division |
|
DCD focuses on USB controllers, Bluetooth® Low Energy solutions that leverage Cypress’s PRoC™ programmable radio-on-chip technology, WirelessUSB™ solutions, module solutions such as trackpads and Bluetooth Low Energy modules, and controllers for the new USB Type-C standard, which enables data transmission and power delivery over a single cable with a slimmer plug. DCD focuses primarily on industrial, handset and consumer electronics markets and applications. |
|
|
|
|
|
ETD: Emerging Technologies Division |
|
Also known as our “startup” division, ETD includes subsidiaries AgigA Tech Inc. and Deca Technologies Inc., as well as our foundry business and other development-stage activities. |
The following tables set forth certain information relating to the reportable business segments:
Revenues:
|
|
|
Year Ended |
|
|||||||||
|
|
|
January 3, 2016 |
|
|
December 28, 2014 |
|
|
December 29, 2013 |
|
|||
|
|
|
(In thousands) |
|
|||||||||
|
Programmable Systems Division |
|
$ |
613,884 |
|
|
$ |
283,206 |
|
|
$ |
292,707 |
|
|
Memory Products Division |
|
|
871,640 |
|
|
|
347,887 |
|
|
|
338,986 |
|
|
Data Communications Division |
|
|
72,791 |
|
|
|
70,378 |
|
|
|
79,410 |
|
|
Emerging Technologies and Other |
|
|
49,538 |
|
|
|
24,026 |
|
|
|
11,590 |
|
|
Total revenues |
|
$ |
1,607,853 |
|
|
$ |
725,497 |
|
|
$ |
722,693 |
|
105
Income (Loss) from Operations before Income Taxes:
|
|
|
Year Ended |
|
|||||||||
|
|
|
January 3, 2016 |
|
|
December 28, 2014 |
|
|
December 29, 2013 |
|
|||
|
|
|
(In thousands) |
|
|||||||||
|
Programmable Systems Division |
|
$ |
(70,644 |
) |
|
$ |
(18,981 |
) |
|
$ |
(20,105 |
) |
|
Memory Products Division |
|
|
105,940 |
|
|
|
134,283 |
|
|
|
111,667 |
|
|
Data Communications Division |
|
|
(15,822 |
) |
|
|
(10,130 |
) |
|
|
(7,452 |
) |
|
Emerging Technologies and Other |
|
|
(7,730 |
) |
|
|
(13,992 |
) |
|
|
(20,860 |
) |
|
Unallocated items: |
|
|
|
|
|
|
|
|
|
|
|
|
|
Stock-based compensation expense |
|
|
(93,527 |
) |
|
|
(50,170 |
) |
|
|
(73,020 |
) |
|
Restructuring (charges) benefit |
|
|
(90,084 |
) |
|
|
1,180 |
|
|
|
(15,357 |
) |
|
Amortization of intangibles and other acquisition-related costs |
|
|
(143,487 |
) |
|
|
(13,955 |
) |
|
|
(34,056 |
) |
|
Impairment of assets and other |
|
|
— |
|
|
|
(7,760 |
) |
|
|
(1,795 |
) |
|
Gain on divestiture of TrueTouch® Mobile business |
|
|
66,472 |
|
|
|
— |
|
|
|
— |
|
|
Changes in value of deferred compensation plan |
|
|
(820 |
) |
|
|
— |
|
|
|
— |
|
|
Impact of purchase accounting and other |
|
|
(107,328 |
) |
|
|
(62 |
) |
|
|
5,008 |
|
|
Income (loss) from operations before income taxes |
|
$ |
(357,030 |
) |
|
$ |
20,413 |
|
|
$ |
(55,970 |
) |
Depreciation:
|
|
|
Year Ended |
|
|||||||||
|
|
|
January 3, 2016 |
|
|
December 28, 2014 |
|
|
December 29, 2013 |
|
|||
|
|
|
(In thousands) |
|
|||||||||
|
Programmable Systems Division |
|
$ |
10,484 |
|
|
$ |
13,613 |
|
|
$ |
14,642 |
|
|
Memory Products Division |
|
|
89,156 |
|
|
|
15,998 |
|
|
|
16,332 |
|
|
Data Communications Division |
|
|
1,946 |
|
|
|
3,234 |
|
|
|
3,851 |
|
|
Emerging Technologies and Other |
|
|
24,910 |
|
|
|
6,960 |
|
|
|
4,680 |
|
|
Total depreciation |
|
$ |
126,496 |
|
|
$ |
39,805 |
|
|
$ |
39,505 |
|
Geographical Information
The following table presents our total revenues by geographical locations:
|
|
|
Year Ended |
|
|||||||||
|
|
|
January 3, 2016 |
|
|
December 28, 2014 |
|
|
December 29, 2013 |
|
|||
|
|
|
(In thousands) |
|
|||||||||
|
United States |
|
$ |
181,913 |
|
|
$ |
89,521 |
|
|
$ |
75,052 |
|
|
Europe |
|
|
181,663 |
|
|
|
100,510 |
|
|
|
61,003 |
|
|
Asia: |
|
|
|
|
|
|
|
|
|
|
|
|
|
China |
|
|
414,299 |
|
|
|
294,655 |
|
|
|
254,993 |
|
|
South Korea |
|
|
68,464 |
|
|
|
82,089 |
|
|
|
96,811 |
|
|
Japan |
|
|
467,823 |
|
|
|
64,926 |
|
|
|
81,856 |
|
|
Rest of the world |
|
|
293,691 |
|
|
|
93,796 |
|
|
|
152,978 |
|
|
Total revenues |
|
$ |
1,607,853 |
|
|
$ |
725,497 |
|
|
$ |
722,693 |
|
106
Property, plant and equipment, net, by geographic locations were as follows:
|
|
|
As of |
|
|||||
|
|
|
January 3, 2016 |
|
|
December 28, 2014 |
|
||
|
|
|
(In thousands) |
|
|||||
|
United States |
|
$ |
269,304 |
|
|
$ |
128,544 |
|
|
Philippines |
|
|
90,356 |
|
|
|
90,641 |
|
|
Thailand |
|
|
34,233 |
|
|
|
— |
|
|
Japan |
|
|
9,537 |
|
|
|
67 |
|
|
Other |
|
|
21,573 |
|
|
|
18,511 |
|
|
Total property, plant and equipment, net |
|
$ |
425,003 |
|
|
$ |
237,763 |
|
We track our assets by physical location. Although management reviews asset information on a corporate level and allocates depreciation expense by segment, our chief operating decision maker does not review asset information on a segment basis.
Customer Information
Outstanding accounts receivable from three of our distributors, accounted for 42%, 11% and 9% , respectively, of our consolidated accounts receivable as of January 3, 2016 .Outstanding accounts receivable from three of our distributors, accounted for 12%, 11% and 9% , respectively, of our consolidated accounts receivable as of December 28, 2014 .
Revenue generated through three of our distributors, accounted for 25%, 10% and 7% respectively, of our consolidated revenue for fiscal 2015. No end customer accounted for 10% or more of the Company’s revenue for fiscal 2015.
Revenue generated through three of our distributors, accounted for 13%, 10% and 10% respectively, of our consolidated revenue for fiscal 2014.
Revenue generated through two of our distributors accounted for 11%, and 10%, respectively, of our consolidated revenue for fiscal 2013. One end customer purchases our products both from our distributors and directly from us. Shipments to this end customer accounted for 12% of our consolidated revenue for fiscal 2013.
NOTE 21. SUBSEQUENT EVENT
Joinder Agreement
On January 6, 2016, we entered into an Incremental Revolving Joinder Agreement to our Credit Facility to increase the amount of revolving commitments under our Credit Facility by an additional $90 million. The total aggregate amount of revolving commitments under the Credit Facility starting January 6, 2016 is $540 million.
$450 million stock buyback program
From January 3, 2016 through February 26, 2016, the Company repurchased 23.7 million shares for a total cost of $181.3 million.
Under the new program authorized in October, 2015 through February 26, 2016, the Company repurchased a total of 29.3 million shares for a total cost of $237.8 million. As of February 26, 2016, the total dollar value of shares that may yet be purchased under the program is approximately $212.2 million.
107
Report of Independent Registered Public Accounting Firm
To the Board of Directors and Stockholders of Cypress Semiconductor Corporation:
In our opinion, the consolidated financial statements listed in the index appearing under Item 15(a)(1) present fairly, in all material respects, the financial position of Cypress Semiconductor Corporation and its subsidiaries (the “Company”) at January 3, 2016 and December 28, 2014 and the results of their operations and their cash flows for each of the three years in the period ended January 3, 2016 in conformity with accounting principles generally accepted in the United States of America. In addition, in our opinion, the financial statement schedule listed in the index appearing under Item 15(a)(2) presents fairly, in all material respects, the information set forth therein when read in conjunction with the related consolidated financial statements. Also in our opinion, the Company maintained, in all material respects, effective internal control over financial reporting as of January 3, 2016, based on criteria established in Internal Control—Integrated Framework (2013), issued by the Committee of Sponsoring Organizations of the Treadway Commission (COSO). The Company’s management is responsible for these financial statements and financial statement schedule, for maintaining effective internal control over financial reporting and for its assessment of the effectiveness of internal control over financial reporting, included in the accompanying Management’s Report on Internal Control over Financial Reporting appearing under Item 9A. Our responsibility is to express opinions on these financial statements, on the financial statement schedule, and on the Company’s internal control over financial reporting based on our integrated audits. We conducted our audits in accordance with the standards of the Public Company Accounting Oversight Board (United States). Those standards require that we plan and perform the audits to obtain reasonable assurance about whether the financial statements are free of material misstatement and whether effective internal control over financial reporting was maintained in all material respects. Our audits of the financial statements included examining, on a test basis, evidence supporting the amounts and disclosures in the financial statements, assessing the accounting principles used and significant estimates made by management, and evaluating the overall financial statement presentation. Our audit of internal control over financial reporting included obtaining an understanding of internal control over financial reporting, assessing the risk that a material weakness exists, and testing and evaluating the design and operating effectiveness of internal control based on the assessed risk. Our audits also included performing such other procedures as we considered necessary in the circumstances. We believe that our audits provide a reasonable basis for our opinions.
As discussed in Note 1 to the consolidated financial statements, the Company changed the manner in which it has classified deferred taxes on its consolidated balance sheet as of January 3, 2016.
A company’s internal control over financial reporting is a process designed to provide reasonable assurance regarding the reliability of financial reporting and the preparation of financial statements for external purposes in accordance with generally accepted accounting principles. A company’s internal control over financial reporting includes those policies and procedures that (i) pertain to the maintenance of records that, in reasonable detail, accurately and fairly reflect the transactions and dispositions of the assets of the company; (ii) provide reasonable assurance that transactions are recorded as necessary to permit preparation of financial statements in accordance with generally accepted accounting principles, and that receipts and expenditures of the company are being made only in accordance with authorizations of management and directors of the company; and (iii) provide reasonable assurance regarding prevention or timely detection of unauthorized acquisition, use, or disposition of the company’s assets that could have a material effect on the financial statements.
Because of its inherent limitations, internal control over financial reporting may not prevent or detect misstatements. Also, projections of any evaluation of effectiveness to future periods are subject to the risk that controls may become inadequate because of changes in conditions, or that the degree of compliance with the policies or procedures may deteriorate.
As described in Management’s Report on Internal Control over Financial Reporting appearing under Item 9A, management has excluded Spansion Inc. from its assessment of internal control over financial reporting as of January 3, 2016 because it was acquired by the Company in a purchase business combination during 2015. We have also excluded Spansion Inc. from our audit of internal control over financial reporting. The total assets of this acquisition are 19% and total revenues represent 59% of the related consolidated financial statement amounts as of and for the year ended January 3, 2016.
/s/ PricewaterhouseCoopers LLP
San Jose, California
March 1, 2016
108
UNAUDITED QUARTERLY FINANCIAL DATA
Fiscal 2015
|
|
|
Three Months Ended |
|
|||||||||||||
|
|
|
January 3, 2016 |
|
|
September 27, 2015 (3)(5) |
|
|
June 28, 2015 |
|
|
March 29, 2015 (4) |
|
||||
|
|
(In thousands, except per-share amounts) |
|
||||||||||||||
|
Revenues |
|
$ |
450,128 |
|
|
$ |
463,810 |
|
|
$ |
484,778 |
|
|
$ |
209,137 |
|
|
Gross margin |
|
$ |
143,248 |
|
|
$ |
160,376 |
|
|
$ |
138,073 |
|
|
$ |
(35,652 |
) |
|
Net income (loss) |
|
$ |
(72,797 |
) |
|
$ |
29,791 |
|
|
$ |
(90,691 |
) |
|
$ |
(247,441 |
) |
|
Adjust for net loss attributable to non-controlling interest |
|
$ |
467 |
|
|
$ |
521 |
|
|
$ |
640 |
|
|
$ |
643 |
|
|
Net income attributable to Cypress |
|
$ |
(72,330 |
) |
|
$ |
30,312 |
|
|
$ |
(90,051 |
) |
|
$ |
(246,798 |
) |
|
Net income per share–basic |
|
$ |
(0.22 |
) |
|
$ |
0.09 |
|
|
$ |
(0.27 |
) |
|
$ |
(1.26 |
) |
|
Net income per share–diluted |
|
$ |
(0.22 |
) |
|
$ |
0.08 |
|
|
$ |
(0.27 |
) |
|
$ |
(1.26 |
) |
Fiscal 2014
|
|
|
Three Months Ended |
|
|||||||||||||
|
|
|
December 28, 2014 (2) |
|
|
September 28, 2014 |
|
|
June 29, 2014 |
|
|
March 30, 2014 (1) |
|
||||
|
|
|
(In thousands, except per-share amounts) |
|
|||||||||||||
|
Revenues |
|
$ |
184,097 |
|
|
$ |
187,516 |
|
|
$ |
183,601 |
|
|
$ |
170,283 |
|
|
Gross margin |
|
$ |
93,702 |
|
|
$ |
96,883 |
|
|
$ |
95,370 |
|
|
$ |
77,723 |
|
|
Net income (loss) |
|
$ |
3,076 |
|
|
$ |
12,554 |
|
|
$ |
9,157 |
|
|
$ |
(8,269 |
) |
|
Adjust for net loss attributable to non-controlling interest |
|
|
426 |
|
|
|
286 |
|
|
|
370 |
|
|
|
335 |
|
|
Net income (loss) attributable to Cypress |
|
$ |
3,502 |
|
|
$ |
12,840 |
|
|
$ |
9,527 |
|
|
$ |
(7,934 |
) |
|
Net income (loss) per share–basic |
|
$ |
0.02 |
|
|
$ |
0.08 |
|
|
$ |
0.06 |
|
|
$ |
(0.05 |
) |
|
Net income (loss) per share–diluted |
|
$ |
0.02 |
|
|
$ |
0.08 |
|
|
$ |
0.06 |
|
|
$ |
0.05 |
|
|
(1) |
In the first quarter of fiscal 2014, the Company changed the manner in which it accounted for one of its investments in an entity from the cost method of accounting to the equity method of accounting. The Company has restated is historical financial statements for all periods presented as if the Company had accounted for its investment in the entity under the equity method of accounting. See Note 15 of the notes to the consolidated financial statements. |
|
(2) |
During the fourth quarter of fiscal 2014, the Company changed from recognizing revenue for sales to certain distributors at the time of shipment, as compared to when resold by the distributor to the end customer, as it determined it could reliably estimate returns and pricing concessions on certain product families and with certain distributors. This change increased revenues in the fiscal fourth quarter of fiscal 2014 by $12.3 million, net income by $6.2 million and net income per share, basic and diluted, by $0.04. The change increased 2015 revenue by $40.9 million and net income (loss) by $25 million and net income (loss) per share, basic and diluted, by $0.07. See additional disclosures on this change in revenue recognition in Footnote 1 to the consolidated financial statements. |
|
(3) |
During the third quarter of fiscal 2015, the impact from the change in methodology, for recognizing revenue for sales to certain distributors at the time of shipment, was increase in revenue of $17.3 million, increase in net income of $9.4 million or $0.03 per basic and diluted share. |
|
(4) |
During the first quarter of fiscal 2015, the impact from the change in methodology, for recognizing revenue for sales to certain distributors at the time of shipment, was increase in revenue of $33.5 million, increase in net income of $17.5 million or $0.09 per basic and diluted share. |
|
(5) |
In the third quarter of fiscal 2015, the Company completed the sale of its TrueTouch® Mobile business to Parade Technologies and recorded a total gain of $66.5 million. |
Basic and diluted earnings per share are computed independently for each of the quarters presented. Therefore, the sum of quarterly basic and diluted per share information may not equal annual basic and diluted earnings per share.
109
None.
Evaluation of Disclosure Controls and Procedures
We maintain “disclosure controls and procedures,” as such term is defined in Rules 13a-15(e) and 15d-15(e) under the Securities Exchange Act of 1934, as amended (the “Exchange Act”), that are designed to ensure that information required to be disclosed by us in reports that we file or submit under the Exchange Act is recorded, processed, summarized, and reported within the time periods specified in Securities and Exchange Commission rules and forms, and that such information is accumulated and communicated to our management, including our Chief Executive Officer and Chief Financial Officer, as appropriate, to allow timely decisions regarding required disclosure. In designing and evaluating our disclosure controls and procedures, management recognized that disclosure controls and procedures, no matter how well conceived and operated, can provide only reasonable, not absolute, assurance that the objectives of the disclosure controls and procedures are met. Additionally, in designing disclosure controls and procedures, our management necessarily was required to apply its judgment in evaluating the cost-benefit relationship of possible disclosure controls and procedures. The design of any disclosure controls and procedures also is based in part upon certain assumptions about the likelihood of future events, and there can be no assurance that any design will succeed in achieving its stated goals under all potential future conditions.
Based on their evaluation as of the end of the period covered by this Annual Report on Form 10-K and subject to the foregoing, our Chief Executive Officer and Chief Financial Officer have concluded that our disclosure controls and procedures were effective at the reasonable assurance level.
Management’s Report on Internal Control over Financial Reporting
Our management is responsible for establishing and maintaining adequate internal control over financial reporting as defined in Rule 13a-15(f) of the Exchange Act. Because of its inherent limitations, internal control over financial reporting may not prevent or detect misstatements and can only provide reasonable assurance with respect to financial statement preparation. Also, projections of any evaluation of effectiveness to future periods are subject to the risk that controls may become inadequate because of changes in conditions, or that the degree of compliance with the policies or procedures may deteriorate.
We assessed the effectiveness of our internal control over financial reporting as of January 3, 2016. In making this assessment, we used the criteria set forth by the Committee of Sponsoring Organizations of the Treadway Commission (“COSO”) in Internal Control—Integrated Framework (2013). Based on our assessment using those criteria, our management (including our Chief Executive Officer and Chief Financial Officer) concluded that our internal control over financial reporting was effective as of January 3, 2016.
On March 12, 2015, we completed our merger with Spansion. In connection with the merger, one of our wholly-owned subsidiaries merged with and into Spansion, and Spansion and its subsidiaries became part of our consolidated group of subsidiaries. Management considered the transaction material to the results of operations, cash flows and financial position from the date of the merger through January 3, 2016 and believes that the internal controls and procedures of Spansion and its subsidiaries have a material effect on internal control over financial reporting. As a result of the merger with Spansion, certain systems and processes were integrated through January 3, 2016 and are included in the scope of management’s assessment of internal control over financial reporting. Due to the timing of the merger, certain systems and processes from Spansion were not integrated. As permitted by the SEC, management’s assessment as of January 3, 2016 did not include the internal control over financial reporting of Spansion, which is included in our consolidated financial statements as of January 3, 2016. Spansion constituted approximately 19% of our total assets at January 3, 2016 and approximately 59% of total revenues for the year ended January 3, 2016. SEC guidance provides that an assessment of a recently acquired business may be omitted in management’s report on internal control over financial reporting in the year of the acquisition.
Based on our assessment, which excluded an assessment of internal controls over financial reporting for Spansion, and using the criteria listed above, our management (including our Chief Executive Officer and Chief Financial Officer) concluded that our internal control over financial reporting was effective as of January 3, 2016.
110
Our independent registered public accounting firm, PricewaterhouseCoopers LLP, has issued a report on our internal control over financial reporting. The report on the audit of internal control over financial reporting appears on page 108 of this Annual Report on Form 10-K.
Changes in Internal Control over Financial Reporting
There were no changes in our internal control over financial reporting that occurred during the fourth quarter of fiscal 2015 that have materially affected, or are reasonably likely to materially affect, our internal control over financial reporting.
None.
111
Certain information required by Part III is omitted from this Annual Report on Form 10-K. We will file a definitive proxy statement pursuant to Regulation 14A (the “Proxy Statement”) not later than 120 days after the end of the fiscal year covered by this Annual Report on Form 10-K, and certain information included therein is incorporated herein by reference.
The information required by this item concerning directors is incorporated by reference from the information set forth in the section titled “Proposal One―Election of Directors” in our Proxy Statement for the 2016 Annual Meeting of Stockholders to be filed with the SEC within 120 days of the fiscal year ended January 3, 2016 (2016 Proxy Statement).
The information required by this item concerning delinquent filers pursuant to Item 405 of Regulation S-K is incorporated by reference from the information set forth in the section titled “Section 16(a) Beneficial Ownership Reporting Compliance” in the 2016 Proxy Statement.
The information required by this item concerning executive officers is incorporated by reference from Item 1 of this Annual Report on Form 10-K.
We have adopted a code of ethics that applies to all of our directors, officers and employees. We have made the code of ethics available, free of charge, on our website at www.cypress.com.
The information required by this item concerning executive compensation is incorporated by reference from the information set forth in the sections titled “Compensation Discussion and Analysis” and “Executive Compensation Tables” in our 2016 Proxy Statement.
The information required by this item concerning compensation of directors is incorporated by reference from the information set forth in the section titled “Director Compensation” in our 2016 Proxy Statement.
The information required by this item concerning our compensation committee is incorporated by reference from the information set forth in the sections titled “Compensation Committee Interlocks and Insider Participation” and “Report of the Compensation Committee of the Board of Directors” in our in our 2016 Proxy Statement.
Quarterly Executive Incentive Payments
There were no performance incentive payments earned by our executive officers in accordance with the terms of our Key Employee Bonus Plan (the “KEBP”) and the Performance Bonus Plan (the “PBP”) for the fourth quarter and the annual portion of fiscal 2015.
|
ITEM 12. |
SECURITY OWNERSHIP OF CERTAIN BENEFICIAL OWNERS AND MANAGEMENT AND RELATED STOCKHOLDER MATTERS |
The information required by this item concerning security ownership of certain beneficial owners, directors and executive officers is incorporated by reference from the information set forth in the section titled “Security Ownership of Certain Beneficial Owners and Management” in our 2016 Proxy Statement.
The information required by this item regarding our equity compensation plans is incorporated by reference from Item 5 of this Annual Report on Form 10-K
The information required by this item concerning transactions with certain persons is incorporated by reference from the information set forth in the sections titled “ Policies and Procedures with Respect to Related Person Transactions” and “Certain Relationships and Related Transactions” in our 2016 Proxy Statement.
112
The information required by this item concerning director independence is incorporated by reference from the information set forth in the section titled “Corporate Governance” in our Proxy Statement.
The information required by this item concerning fees and services is incorporated by reference from the information set forth in the section titled “Proposal Two—Ratification of the Selection of Independent Registered Public Accounting Firm” in our 2016 Proxy Statement.
The information required by this item regarding the audit committee’s pre-approval policies and procedures is incorporated by reference from the information set forth in the section titled “Proposal Two—Ratification of the Selection of Independent Registered Public Accounting Firm” in our 2016 Proxy Statement.
113
|
(a) |
The following documents are filed as a part of this Annual Report on Form 10-K: |
|
1. |
Financial Statements: |
|
|
Page |
|
60 |
|
|
61 |
|
|
63 |
|
|
64 |
|
|
66 |
|
2. |
Financial Statement Schedule: |
The exhibits listed below are required to be filed as exhibits to the Cypress Semiconductor’s Annual Report on Form 10-K for the year ended January 3, 2016.
|
3. |
Exhibits: |
|
|
|
|
|
Incorporated by Reference |
||||
|
Exhibit Number |
|
Exhibit Description |
|
Form |
|
Filing Date/ Period End Date |
|
Filed Herewith |
|
2.1 |
|
Agreement and Plan of Merger and Reorganization, dated as of December 1, 2014, by and among Cypress Semiconductor Corporation, a Delaware corporation, Mustang Acquisition Corporation, a wholly owned subsidiary of Cypress Semiconductor Corporation and a Delaware corporation, and Spansion Inc., a Delaware corporation. |
|
8-K |
|
12/1/2014 |
|
|
|
|
|
|
|
|
|
|
|
|
|
3.1 |
|
Second Restated Certificate of Incorporation of Cypress Semiconductor Corporation. |
|
10-K |
|
12/31/2000 |
|
|
|
|
|
|
|
|
|
|
|
|
|
3.2 |
|
Amended and Restated Bylaws of Cypress Semiconductor Corporation. |
|
8-K |
|
3/12/2015 |
|
|
|
|
|
|
|
|
|
|
|
|
|
4.1 |
|
Supplemental Indenture, dated March 12, 2015, by and between Spansion LLC, Spansion Inc., Spansion Technology LLC and the other guarantors from time to time party thereto, Cypress Semiconductor Corporation and Wells Fargo Bank, National Association, as trustee. |
|
8-K(1) |
|
3/12/2015 |
|
|
|
|
|
|
|
|
|
|
|
|
|
10.1 |
|
Form of Indemnification Agreement. |
|
S-1 |
|
3/4/1987 |
|
|
|
|
|
|
|
|
|
|
|
|
|
10.2 + |
|
Cypress Semiconductor Corporation Non-Qualified Deferred Compensation Plan I. |
|
|
|
|
|
X |
|
|
|
|
|
|
|
|
|
|
|
10.3 + |
|
Cypress Semiconductor Corporation Non-Qualified Deferred Compensation Plan II. |
|
|
|
|
|
X |
|
|
|
|
|
|
|
|
|
|
|
10.4 |
|
Lease Agreement dated as of June 27, 2003 between Wachovia Development Corporation and Cypress Semiconductor Corporation. |
|
10-Q |
|
6/29/2003 |
|
|
|
|
|
|
|
|
|
|
|
|
|
10.5 |
|
Participation Agreement dated as of June 27, 2003 by and among Cypress Semiconductor Corporation, Wachovia Development Corporation and Wachovia Bank, National Association. |
|
10-Q |
|
6/29/2003 |
|
|
|
|
|
|
|
|
|
|
|
|
|
10.6 |
|
First Amendment to Certain Operative Agreements dated March 28, 2005 between Wachovia Development Corporation and Cypress Semiconductor Corporation. |
|
10-Q |
|
4/3/2005 |
|
|
|
|
|
|
|
|
|
|
|
|
|
10.7 + |
|
Cypress Semiconductor Corporation 2006 Key Employee Bonus Plan (KEBP) Summary. |
|
10-K |
|
1/1/2006 |
|
|
|
|
|
|
|
|
|
|
|
|
|
10.8 + |
|
Cypress Semiconductor Corporation Performance Profit Sharing Plan (PPSP) Summary. |
|
10-K |
|
1/1/2006 |
|
|
|
|
|
|
|
|
|
|
|
|
|
10.9 |
|
Memorandum of Agreement between GNPower Ltd. Co. and Cypress Manufacturing Ltd. |
|
10-Q |
|
10/1/2006 |
|
|
|
|
|
|
|
|
|
|
|
|
|
|
||||||||
|
|
|
|
|
|
|
|
|
|
|
10.10 |
|
Guaranty dated December 12, 2006 by and between Grace Semiconductor USA, Inc., CIT Technologies Corporation and Cypress Semiconductor Corporation. |
|
10-K |
|
12/31/2006 |
|
|
114
|
|
|
|
|
Incorporated by Reference |
||||
|
Exhibit Number |
|
Exhibit Description |
|
Form |
|
Filing Date/ Period End Date |
|
Filed Herewith |
|
|
|
|
|
|
|
|
|
|
|
10.11 |
|
Guaranty dated February 1, 2007 by and between Grace Semiconductor USA, Inc., CIT Technologies Corporation and Cypress Semiconductor Corporation. |
|
10-K |
|
12/31/2006 |
|
|
|
|
|
|
|
|
|
|
|
|
|
10.12 |
|
Guaranty dated March 19, 2007 by and between Grace Semiconductor USA, Inc., CIT Technologies Corporation and Cypress Semiconductor Corporation. |
|
10-Q |
|
4/1/2007 |
|
|
|
|
|
|
|
|
|
|
|
|
|
10.13 |
|
Guaranty dated May 15, 2007 by and between Grace Semiconductor USA, Inc., CIT Technologies Corporation and Cypress Semiconductor Corporation. |
|
10-Q |
|
7/1/2007 |
|
|
|
|
|
|
|
|
|
|
|
|
|
10.14 |
|
Guaranty dated June 15, 2007 by and between Grace Semiconductor USA, Inc., CIT Technologies Corporation and Cypress Semiconductor Corporation. |
|
10-Q |
|
7/1/2007 |
|
|
|
|
|
|
|
|
|
|
|
|
|
10.15 |
|
Guaranty dated December 15, 2007 by and between Grace Semiconductor USA, Inc., CIT Technologies Corporation and Cypress Semiconductor Corporation. |
|
10-K |
|
12/30/2007 |
|
|
|
|
|
|
|
|
|
|
|
|
|
10.16 |
|
Guaranty, dated March 24, 2008, by and between Grace Semiconductor USA, Inc., CIT Technologies Corporation and Cypress Semiconductor Corporation. |
|
10-Q |
|
3/30/2008 |
|
|
|
|
|
|
|
|
|
|
|
|
|
10.17 + |
|
1999 Non-Statutory Stock Option Plan, as amended and restated. |
|
S-8 |
|
10/24/2008 |
|
|
|
|
|
|
|
|
|
|
|
|
|
10.18 + |
|
Employee Qualified Stock Purchase Plan, as amended and restated. |
|
|
|
|
|
X |
|
|
|
|
|
|
|
|
|
|
|
10.19 + |
|
Amended and Restated Cypress Semiconductor Corporation 2013 Stock Plan. |
|
10-Q |
|
9/27/2015 |
|
|
|
|
|
|
|
|
|
|
|
|
|
10.20 + |
|
Form of Restricted Stock Unit Agreement under the Cypress Semiconductor Corporation 2013 Stock Plan. |
|
10-Q |
|
9/27/2015 |
|
|
|
|
|
|
|
|
|
|
|
|
|
10.21 + |
|
Amended Form of Restricted Stock Unit and Performance Stock Unit Grant Agreement under the 2015 PARS Grant program. |
|
10-Q |
|
6/28/2015 |
|
|
|
|
|
|
|
|
|
|
|
|
|
10.22 + |
|
2012 Incentive Award Plan, as amended and restated. |
|
S-8 |
|
12/12/2012 |
|
|
|
|
|
|
|
|
|
|
|
|
|
10.23 + |
|
Spansion Inc. 2010 Equity Incentive Award Plan |
|
S-8(1) |
|
5/10/2010 |
|
|
|
|
|
|
|
|
|
|
|
|
|
10.24 + |
|
Amendment to Spansion Inc. 2010 Equity Incentive Award Plan |
|
8-K(1) |
|
5/14/2010 |
|
|
|
|
|
|
|
|
|
|
|
|
|
10.25 |
|
Form of Cypress Support Agreement. |
|
8-K |
|
12/1/2014 |
|
|
|
|
|
|
|
|
|
|
|
|
|
10.26 |
|
Form of Spansion Support Agreement. |
|
8-K |
|
12/1/2014 |
|
|
|
|
|
|
|
|
|
|
|
|
|
10.27 + |
|
Thad Trent Employment Agreement |
|
10-K |
|
2/17/2015 |
|
|
|
|
|
|
|
|
|
|
|
|
|
10.28 + |
|
J. Daniel McCranie Employment Agreement |
|
10-K |
|
2/17/2015 |
|
|
|
|
|
|
|
|
|
|
|
|
|
10.29+ |
|
Separation Agreement with J. Daniel McCranie. |
|
10-Q |
|
3/29/2015 |
|
|
|
|
|
|
|
|
|
|
|
|
|
10.30 |
|
Amendment and Restatement Agreement, dated as of March 12, 2015, by and among Cypress Semiconductor Corporation, Cypress Semiconductor (Minnesota) Inc., Spansion Inc., Spansion LLC, Spansion Technology LLC, Spansion International AM, Inc., Spansion International Trading, Inc., the lenders party thereto, and Morgan Stanley Senior Funding, Inc., as administrative agent. |
|
8-K |
|
3/12/2015 |
|
|
|
|
|
|
|
|
|
|
|
|
|
10.31 |
|
Amended and Restated Credit and Guaranty Agreement, dated as of March 12, 2015, by and among Cypress Semiconductor Corporation, the guarantors from time to time party thereto, the lenders from time to time party thereto, Morgan Stanley Senior Funding, Inc., as administrative agent and collateral agent, East West Bank, Silicon Valley Bank and SunTrust Bank, as syndication agents and documentation agents, and Morgan Stanley Bank, N.A., as Issuing Bank. |
|
8-K |
|
3/12/2015 |
|
|
|
|
|
|
|
|
|
|
|
|
|
10.32 |
|
Amended and Restated Pledge and Security Agreement, dated as of March 12, 2015, by and among Cypress Semiconductor Corporation and the other grantors from time to time party thereto, and Morgan Stanley Senior Funding, Inc., as collateral agent. |
|
8-K |
|
3/12/2015 |
|
|
|
|
|
|
|
|
|
|
|
|
|
10.33 |
|
Joinder Agreement dated as of December 22, 2015. |
|
8-K |
|
12/22/2015 |
|
|
|
|
|
|
|
|
|
|
|
|
|
10.34 |
|
Incremental Revolving Joinder Agreement dated as of January 6, 2016. |
|
8-K |
|
12/22/2015 |
|
|
|
|
|
|
|
|
|
|
|
|
|
10.35 |
|
Lease Agreement between Spansion Inc. and Hines VAP No. Cal. Properties, LP, effective May 20, 2014. |
|
10-Q(1) |
|
5/20/2014 |
|
|
|
|
|
|
|
|
|
|
|
|
|
10.36++ |
|
Distribution Agreement between Cypress Semiconductor Corporation and Fujitsu Electronics Incorporated dated September 10, 2015. |
|
10-Q |
|
9/27/2015 |
|
|
|
|
|
|
|
|
|
|
|
|
|
21.1 |
|
Subsidiaries of Cypress Semiconductor Corporation. |
|
|
|
|
|
X |
|
|
|
|
|
|
|
|
|
|
|
23.1 |
|
Consent of Independent Registered Public Accounting Firm. |
|
|
|
|
|
X |
|
|
|
|
|
|
|
|
|
|
115
|
|
|
|
|
Incorporated by Reference |
||||
|
Exhibit Number |
|
Exhibit Description |
|
Form |
|
Filing Date/ Period End Date |
|
Filed Herewith |
|
24.1 |
|
Power of Attorney (reference is made to the signature page of this Annual Report on Form 10-K). |
|
|
|
|
|
X |
|
|
|
|
|
|
|
|
|
|
|
31.1 |
|
Certification of Chief Executive Officer Pursuant to Section 302 of the Sarbanes-Oxley Act of 2002. |
|
|
|
|
|
X |
|
|
|
|
|
|
|
|
|
|
|
31.2 |
|
Certification of Chief Financial Officer Pursuant to Section 302 of the Sarbanes-Oxley Act of 2002. |
|
|
|
|
|
X |
|
|
|
|
|
|
|
|
|
|
|
32.1+++ |
|
Certification of Chief Executive Officer Pursuant to 18 U.S.C. Section 1350, as Adopted Pursuant to Section 906 of the Sarbanes-Oxley Act of 2002. |
|
|
|
|
|
|
|
|
|
|
|
|
|
|
|
|
|
32.2+++ |
|
Certification of Chief Financial Officer Pursuant to 18 U.S.C. Section 1350, as Adopted Pursuant to Section 906 of the Sarbanes-Oxley Act of 2002. |
|
|
|
|
|
|
|
|
|
|
|
|
|
|
|
|
|
101.INS |
|
XBRL Instance Document. |
|
|
|
|
|
X |
|
|
|
|
|
|
|
|
|
|
|
101.SCH |
|
XBRL Taxonomy Extension Schema Document. |
|
|
|
|
|
X |
|
|
|
|
|
|
|
|
|
|
|
101.CAL |
|
XBRL Taxonomy Extension Calculation Linkbase Document. |
|
|
|
|
|
X |
|
|
|
|
|
|
|
|
|
|
|
101.DEF |
|
XBRL Taxonomy Extension Definition Linkbase Document. |
|
|
|
|
|
X |
|
|
|
|
|
|
|
|
|
|
|
101.LAB |
|
XBRL Taxonomy Extension Label Linkbase Document. |
|
|
|
|
|
X |
|
|
|
|
|
|
|
|
|
|
|
101.PRE |
|
XBRL Taxonomy Extension Presentation Linkbase Document. |
|
|
|
|
|
X |
|
+ |
Identifies a management contract or compensatory plans or arrangements required to be filed as an exhibit. |
|
++ |
Confidential treatment has been granted with respect to portions of this exhibit. |
|
+++ |
Exhibits 32.1 and 32.2 are being furnished and shall not be deemed to be “filed” for purposes of Section 18 of the Securities Exchange Act of 1934, as amended (the Exchange Act), or otherwise subject to the liability of that section, nor shall such exhibits be deemed to be incorporated by reference in any registration statement or other document filed under the Securities Act of 1933, as amended, or the Exchange Act, except as otherwise specifically stated in such filing. |
|
(1) |
Indicates a filing of Spansion Inc. |
116
VALUATION AND QUALIFYING ACCOUNTS
|
|
|
Balance at Beginning of Period |
|
|
Charges (Releases) to Expenses/Revenues |
|
|
Deductions |
|
|
Balance at End of Period |
|
||||
|
|
|
(In thousands) |
|
|||||||||||||
|
Allowance for doubtful accounts receivable: |
|
|
|
|
|
|
|
|
|
|
|
|
|
|
|
|
|
Year ended January 3, 2016 |
|
$ |
738 |
|
|
$ |
576 |
|
|
$ |
(125 |
) |
|
$ |
1,189 |
|
|
Year ended December 28, 2014 |
|
$ |
719 |
|
|
$ |
39 |
|
|
$ |
(20 |
) |
|
$ |
738 |
|
|
Year ended December 29, 2013 |
|
$ |
769 |
|
|
$ |
51 |
|
|
$ |
(101 |
) |
|
$ |
719 |
|
|
|
|
|
|
|
|
|
|
|
|
|
|
|
|
|
|
|
|
Deferred tax valuation allowance |
|
|
|
|
|
|
|
|
|
|
|
|
|
|
|
|
|
Year ended January 3, 2016 |
|
$ |
358,424 |
|
|
$ |
166,597 |
|
(1) |
$ |
— |
|
|
$ |
525,021 |
|
|
Year ended December 28, 2014 |
|
$ |
334,671 |
|
|
$ |
23,753 |
|
(1) |
$ |
— |
|
|
$ |
358,424 |
|
|
Year ended December 29, 2013 |
|
$ |
307,199 |
|
|
$ |
27,472 |
|
(1) |
$ |
— |
|
|
$ |
334,671 |
|
|
(1) |
Represents the change in valuation allowance primarily related to federal and state deferred tax assets that management has determined not likely to be realized due, in part, to projections of future taxable income |
117
Pursuant to the requirements of Section 13 or 15(d) of the Securities Exchange Act of 1934, the registrant has duly caused this report to be signed on its behalf by the undersigned, thereto duly authorized.
|
|
CYPRESS SEMICONDUCTOR CORPORATION |
|
|
|
|
|
|
Date: March 1, 2016 |
By: |
/ S / Thad Trent |
|
|
|
Thad Trent Executive Vice President, Finance and Administration and Chief Financial Officer |
118
POWER OF ATTORNEY
KNOW ALL PERSONS BY THESE PRESENTS, that each person whose signature appears below constitutes and appoints T.J. Rodgers and Thad Trent, jointly and severally, his attorneys-in-fact, each with the power of substitution, for him in any and all capacities, to sign any amendments to this report, and to file the same, with exhibits thereto and other documents in connection therewith, with the Securities and Exchange Commission, hereby ratifying and confirming all that each of said attorneys-in-fact, or his substitute or substitutes, may do or cause to be done by virtue hereof.
Pursuant to the requirements of the Securities Exchange Act of 1934, this report has been signed by the following persons on behalf of the registrant and in the capacities and on the dates indicated.
|
Signature |
|
Title |
|
Date |
|
|
|
|
|
|
|
/ S / T. J. RODGERS |
|
President, Chief Executive Officer and Director (Principal Executive Officer) |
|
March 1, 2016 |
|
T. J. Rodgers |
|
|
|
|
|
|
|
|
|
|
|
/ S / THAD TRENT |
|
Executive Vice President, Finance and Administration and Chief Financial Officer (Principal Financial and Accounting Officer) |
|
March 1, 2016 |
|
Thad Trent |
|
|
|
|
|
|
|
|
|
|
|
/ S / W. STEVE ALBRECHT |
|
Director |
|
March 1, 2016 |
|
W. Steve Albrecht |
|
|
|
|
|
|
|
|
|
|
|
/ S / ERIC A. BENHAMOU |
|
Director |
|
March 1, 2016 |
|
Eric A. Benhamou |
|
|
|
|
|
|
|
|
|
|
|
/ S / RAYMOND BINGHAM |
|
Chairman of the Board of Directors |
|
March 1, 2016 |
|
Raymond Bingham |
|
|
|
|
|
|
|
|
|
|
|
/ S / JOHN KISPERT |
|
Director |
|
March 1, 2016 |
|
John Kispert |
|
|
|
|
|
|
|
|
|
|
|
/ S / O. C. KWON |
|
Director |
|
March 1, 2016 |
|
O. C. Kwon |
|
|
|
|
|
|
|
|
|
|
|
/ S / WILBERT G.M. VAN DEN HOEK |
|
Director |
|
March 1, 2016 |
|
Wilbert G.M. Van Den Hoek |
|
|
|
|
|
|
|
|
|
|
|
/ S / MICHAELS. WISHART |
|
Director |
|
March 1, 2016 |
|
Michael S. Wishart |
|
|
|
|
119