Attached files
| file | filename |
|---|---|
| 8-K - BLOUNT INTERNATIONAL INC | form8-k.htm |
Exhibit 99.1

Selected Information March 2016 Blount International

Disclaimer CERTAIN STATEMENTS CONTAINED IN THIS COMMUNICATION ARE FORWARD LOOKING BASED ON ASSUMPTIONS OF FUTURE EVENTS WHICH MAY NOT PROVE TO BE ACCURATE. THEY INVOLVE RISK AND UNCERTAINTY. ACTUAL RESULTS MAY DIFFER MATERIALLY FROM THOSE EXPECTED OR IMPLIED. WE DISCLAIM ANY INTENTION OR OBLIGATION TO UPDATE OR REVISE FORWARD-LOOKING STATEMENTS AS A RESULT OF DEVELOPMENTS OCCURRING AFTER THE DATE HEREOF, EXCEPT AS REQUIRED BY LAW. WE DIRECT YOU TO THE CAUTIONARY STATEMENTS DETAILED IN RECENT NEWS RELEASES AND SEC FILINGS. THIS COMMUNICATION INCLUDES THE PRESENTATION AND DISCUSSION OF CERTAIN FINANCIAL INFORMATION THAT DIFFERS FROM WHAT IS REPORTED UNDER ACCOUNTING PRINCIPLES GENERALLY ACCEPTED IN THE UNITED STATES (“GAAP”). THESE NON-GAAP FINANCIAL MEASURES, INCLUDING EBITDA, MANAGEMENT EBITDA, MANAGEMENT PF EBITDA AND BANK EBITDA, ARE PRESENTED IN ORDER TO SUPPLEMENT THE READERS’ UNDERSTANDING AND ASSESSMENT OF THE FINANCIAL PERFORMANCE OF BLOUNT INTERNATIONAL, INC. WE HAVE PROVIDED RECONCILIATIONS OF SUCH NON-GAAP FINANCIAL MEASURES TO THE MOST DIRECTLY COMPARABLE GAAP FINANCIAL MEASURES ON PAGE 5 OF THIS COMMUNICATION. READERS ARE ENCOURAGED TO REVIEW THE RELATED GAAP FINANCIAL MEASURES AND SUCH RECONCILIATIONS, AND READERS SHOULD CONSIDER NON-GAAP MEASURES ONLY AS SUPPLEMENTS TO, NOT AS SUBSTITUTES FOR OR AS SUPERIOR MEASURES TO, MEASURES OF FINANCIAL PERFORMANCE PREPARED IN ACCORDANCE WITH GAAP Blount International

3 Well-Established Brands and Leading Market Share Blount has a leading market share in cutting chain and other chain saw accessories and is known for both quality and value amongst professional and consumer end users 2014 Global Market Size Saw Chain Manufacturers – 387 million Feet Others 0% Blount 53% OEM X 38% China 9% Guide Bars – 30 million Units Others 1% Blount 37% OEM X 25% OEM Y 6% China 30% Source: Company estimates. Blount International 1
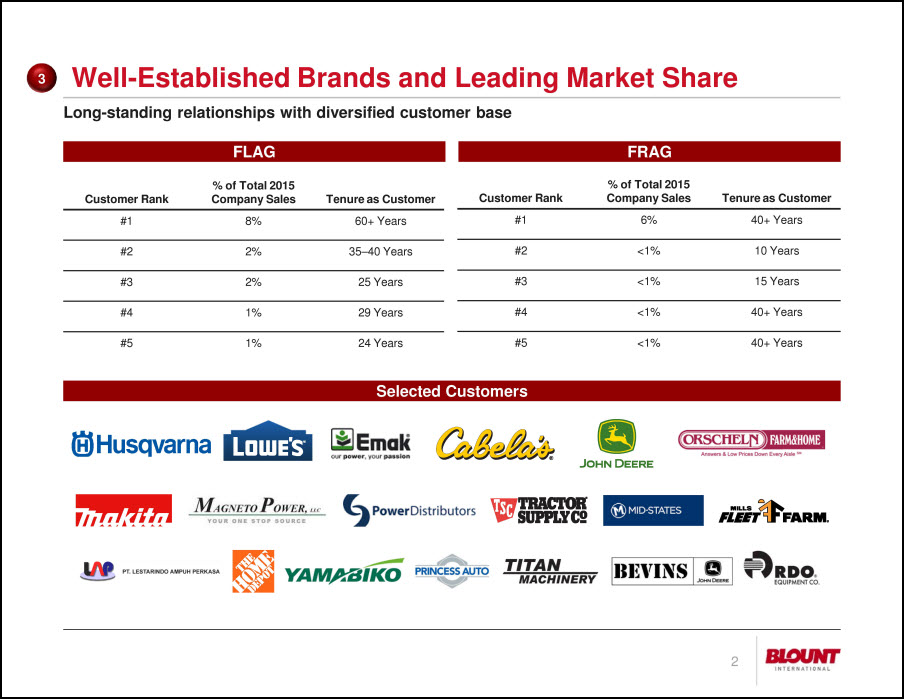
3 Well-Established Brands and Leading Market Share Long-standing relationships with diversified customer base FLAG Customer Rank % of Total 2015 Company Sales Tenure as Customer #1 8% 60+ Years #2 2% 35–40 Years #3 2% 25 Years #4 1% 29 Years #5 1% 24 Years FRAG Customer Rank % of Total 2015 Company Sales Tenure as Customer #1 6% 40+ Years #2 <1% 10 Years #3 <1% 15 Years #4 <1% 40+ Years #5 <1% 40+ Years Selected Customers Blount International 2

2014 to 2015 Blount Revenue Bridge Blount Revenue Bridge FLAG $ mm FX Impact $945 ($6) ($2) ($40) ($33) ($6) ($30) $2 $829 $500 $750 $1,000 2014A U.S. Sales P&V Foreign Currency P&V(1) USD in Foreign Markets FX Translation KOX, PBL & Mix FRAG CCF 2015A Commentary 63% of Blount revenue reduction directly attributable to currency fluctuations, both translational and through volume effects due to sales in USD in foreign countries 26% of Blount revenue reduction due to FRAG underperformance from sustained down cycle in U.S. agricultural markets Blount has achieved less drastic reductions compared to other blue-chip agricultural businesses (20%+ drops in 2015) Chain Sales Performance(2) 2014 Sales Short Term Impact Revenue Impact Volume Price Revenue USD in U.S. 21% Local Currency in Foreign Markets 23% USD in Foreign Markets 56% OE Softness Distributor Consolidation (9.8%) 2.5% (7.6%) Near-Term Translation Impact (1.6%) (15.4%) (16.8%) Volume – destocking Price (14.0%) (1.3%) (15.1%) Note: Gross revenue used as proxy for net due to lack of data for FLAG currency and chain revenue breakdowns. 1. Normal course price and volume fluctuations in foreign countries; not directly attributable to foreign exchange. 2. Excludes KOX and PBL. Blount International 3

2014 to 2015 EBITDA Bridge EBITDA Bridge ($ mm) FLAG $138 $1 ($14) ($2) ($1) $3 ($18) ($6) $1 ($1) $101 $9 $110 $0 $40 $80 $120 $160 2014A Management EBITDA FX Translation USD in Foreign Markets U.S. Sales Other Mix Steel Other Cost / Mix FRAG CCF Corporate 2015A Management EBITDA PF/Due Diligence Adjustments 2015A Bank EBITD(2) 1. Management EBITDA as used throughout this communication is a non-GAAP financial measure that has previously been disclosed by the Company under the label “Adjusted EBITDA” and is reconciled to the nearest GAAP measure for the periods 2013 through 2015 on page 5 of this communication. 2. Bank EBITDA as used throughout this communication is a non-GAAP financial measure that presents “Consolidated EBITDA” as it is expected to be calculated under the credit facilities expected to be used by the acquirers to finance a portion of the merger consideration (the “Credit Facilities”). Bank EBITDA is reconciled to the nearest GAAP measure on page 5 of this communication. Blount International 4

Bank EBITDA Reconciliation Bank EBITDA Reconciliation ($ mm) 2013A 2014A 2015A Operating Income $37.5 $64.2 ($46.8) Depreciation 33.5 31.4 30.6 Non-cash acquisition accounting 14.8 13.6 11.8 EBITDA, Reported $85.7 $109.2 ($4.4) Management adjustments: Impairment of acquired intangible assets 1 24.9 21.1 78.8 Stock-based compensation 5.6 4.9 6.0 Asset write-off 1.2 -- -- Pension settlement -- -- 10.2 Acquisition costs -- -- 7.7 Facility closure & restructuring 6.0 2.8 2.5 Total Management adjustments 37.7 28.8 105.2 Management EBITDA $123.5 $138.0 $100.8 Proforma adjustments:(1) Q3'15 reduction in force savings -- -- 2.5 Internal control remediation costs 2 3.3 0.4 2.9 Public company cost savings 1.5 1.5 1.7 Other PF adjustments 0.4 (1.7) (0.5) Total proforma adjustments(2) 5.2 0.2 6.6 Management PF EBITDA (before defined benefit plan cash costs) $128.7 $138.2 $107.5 Due diligence adjustments: Remove defined benefit plans GAAP expense 3a 8.2 4.7 7.6 Include defined benefit plans gross cash costs 3b (8.1) (13.4) (5.3) Bank EBITDA (after defined benefit plan cash costs) $128.9 $129.6 $109.8 Commentary 1) Represents non-cash impairment charges for trademark intangible assets and goodwill, with the impairment triggered as a result of weakening economic conditions and declining sales primarily in the FRAG business 2) The company incurred internal control remediation costs that have been added back. The higher than average advisor costs are a result of (i) the remediation of internal control issues, and (ii) higher than normal external audit fees as a result of the increased level of work required to perform the audits 3) Defined benefit plan net cash a. GAAP defined benefit plan expense that has been historically recorded is not generally reflective of actual cash defined benefit plan costs. b. In adjustment 3a, the GAAP defined benefit plan cost was excluded. This adjustment, 3b, presents the pre-tax defined benefit plan cash cost, which reflects the Company’s actual historical cash outflow related to defined benefit pension plans Currency: $mm Note FY13 FY14 FY15 Removed defined benefit plan GAAP P&L expense a 8.2 4.7 7.6 Include defined benefit plan gross cash cost b (8.1) (13.4) (5.3) Net adjustment for defined benefit plans costs $0.1 ($8.7) $2.3 Note: Numbers may not sum due to rounding. 1. Cost savings expected to result from the acquisition are included in the Credit Facilities definition labeled “Consolidated EBITDA.” 2. Pro forma adjustments for the three fiscal years 2013, 2014, and 2015 allocated to segments as follows (respectively): FLAG – 56%, 43%, 69%; FRAG – 20%, 51%, 27%; CCF / Corporate – 24%, 6%, 4%. Blount International 5