Attached files
| file | filename |
|---|---|
| EX-21 - EX-21 - AMERICAN VANGUARD CORP | d238269dex21.htm |
| EX-10.18 - EX-10.18 - AMERICAN VANGUARD CORP | d238269dex1018.htm |
| EX-31.2 - EX-31.2 - AMERICAN VANGUARD CORP | d238269dex312.htm |
| EX-32.1 - EX-32.1 - AMERICAN VANGUARD CORP | d238269dex321.htm |
| EX-23 - EX-23 - AMERICAN VANGUARD CORP | d238269dex23.htm |
| EX-31.1 - EX-31.1 - AMERICAN VANGUARD CORP | d238269dex311.htm |
Table of Contents
UNITED STATES
SECURITIES AND EXCHANGE COMMISSION
Washington, D.C. 20549
FORM 10-K
| x | ANNUAL REPORT PURSUANT TO SECTION 13 OR 15(d) OF THE SECURITIES EXCHANGE ACT OF 1934 |
For The Year Ended December 31, 2015
OR
| ¨ | TRANSITION REPORT PURSUANT TO SECTION 13 OR 15(d) OF THE SECURITIES EXCHANGE ACT OF 1934 |
For The Transition Period From To
Commission file number 001-13795
AMERICAN VANGUARD CORPORATION
| Delaware | 95-2588080 | |
| (State or other jurisdiction of Incorporation or organization) |
(I.R.S. Employer Identification Number) | |
| 4695 MacArthur Court, Newport Beach, California | 92660 | |
| (Address of principal executive offices) | (Zip Code) | |
(949) 260-1200
(Registrant’s telephone number, including area code)
Securities registered pursuant to Section 12(b) of the Act:
| Title of each class: |
Name of each exchange on which registered: | |
| Common Stock, $.10 par value | New York Stock Exchange |
Securities registered pursuant to Section 12(g) of the Act:
NONE
Indicate by check mark if the registrant is a well-known seasoned issuer, as defined in Rule 405 of the Securities Act. Yes ¨ No x
Indicate by check mark whether the registrant is not required to file reports pursuant to Section 13 or Section 15 (d) of the Act. Yes ¨ No x
Indicate by check mark whether the registrant (1) has filed all reports required to be filed by Section 13 or 15 (d) of the Securities Exchange Act of 1934 during the preceding 12 months (or for such shorter period that the registrant was required to file such reports), and (2) has been subject to such filing requirements for the past 90 days. Yes x No ¨
Indicate by check mark whether the registrant has submitted electronically and posted on its corporate Web site, if any, every Interactive Data File required to be submitted and posted pursuant to Rule 405 of Regulation S-T (§232.405 of this chapter) during the preceding 12 months (or for such shorter period that the registrant was required to submit and post such files). Yes x No ¨
Indicate by check mark if disclosure of delinquent filers pursuant to Item 405 of Regulation S-K is not contained herein, and will not be contained, to the best of registrant’s knowledge, in definitive proxy or information statements incorporated by reference in Part III of this Form 10-K or any amendment to this Form 10-K. x
Indicate by check mark whether the registrant is a large accelerated filer, an accelerated filer, or a non-accelerated filer. See definition of “accelerated filer and large accelerated filer” in Rule 12b-2 of the Exchange Act. (Check one):
| Large accelerated filer | ¨ | Accelerated filer | x | |||
| Non-accelerated filer | ¨ | Smaller reporting company | ¨ | |||
Indicate by check mark whether the registrant is a shell company (as defined in Rule 12b-2 of the Act). Yes ¨ No x
The aggregate market value of the voting stock of the registrant held by non-affiliates is $392.9 million. This figure is estimated as of June 30, 2015 at which date the closing price of the registrant’s Common Stock on the New York Stock Exchange was $13.80 per share. For purposes of this calculation, shares owned by executive officers, directors, and 5% stockholders known to the registrant have been deemed to be owned by affiliates. The number of shares of $.10 par value Common Stock outstanding as of June 30, 2015, was 29,167,289. The number of shares of $.10 par value Common Stock outstanding as of February 22, 2016 was 29,214,568.
Table of Contents
AMERICAN VANGUARD CORPORATION
AND SUBSIDIARIES
December 31, 2015
i
Table of Contents
AMERICAN VANGUARD CORPORATION
AND SUBSIDIARIES
(Dollars in thousands, except per share data)
Unless otherwise indicated or the context otherwise requires, the terms “Company,” “we,” “us,” and “our” refer to American Vanguard Corporation and its consolidated subsidiaries (“AVD”).
Forward-looking statements in this report, including without limitation, statements relating to the Company’s plans, strategies, objectives, expectations, intentions, and adequacy of resources, are made pursuant to the safe harbor provisions of the Private Securities Litigation Reform Act of 1995. Investors are cautioned that such forward-looking statements involve risks and uncertainties. (Refer to Part I, Item 1A, Risk Factors and Part II, Item 7, Management’s Discussion and Analysis of Financial Condition and Results of Operation, included in this Annual Report.)
| ITEM 1 | BUSINESS |
AVD was incorporated under the laws of the State of Delaware in January 1969 and operates as a holding company. Unless the context otherwise requires, references to the “Company” or the “Registrant,” in this Annual Report refer to AVD. The Company conducts its business through its subsidiaries, AMVAC Chemical Corporation (“AMVAC”), GemChem, Inc. (“GemChem”), 2110 Davie Corporation (“DAVIE”), Quimica Amvac de Mexico S.A. de C.V. (“AMVAC M”), AMVAC Mexico Sociedad de Responsabilidad Limitada (“AMVAC M Srl”), AMVAC de Costa Rica Sociedad de Responsabilidad Limitada (“AMVAC CR Srl”), AMVAC Switzerland GmbH (“AMVAC S”), AMVAC do Brasil Representácoes Ltda (“AMVAC B”), AMVAC CV (“AMVAC CV”), AMVAC Netherlands BV (“AMVAC BV”) and Envance Technologies, LLC (“Envance”).
Based on similar economic and operational characteristics, the Company’s business is aggregated into one reportable segment. Refer to Part II, Item 7 for selective enterprise information.
AMVAC
AMVAC is a California corporation that traces its history from 1945 and is a specialty chemical manufacturer that develops and markets products for agricultural, commercial and consumer uses. It manufactures and formulates chemicals for crops, turf and ornamental plants, and human and animal health protection. These chemicals, which include insecticides, fungicides, herbicides, molluscicides, growth regulators, and soil fumigants, are marketed in liquid, powder, and granular forms. In prior years, AMVAC considered itself a distributor-formulator, but now AMVAC primarily manufactures, distributes, and formulates its own proprietary products or custom manufactures or formulates for others. AMVAC has historically expanded its business through both the acquisition of established chemistries (which it has revived in the marketplace) and the development and commercialization of new compounds through licensing arrangements. Below is a description of the Company’s acquisition/licensing activity over the past five years.
On October 26, 2015, AMVAC entered into a license and supply agreement with Badische Anilin-und Soda-Fabrik (“BASF”) under which BASF sold and AMVAC acquired certain assets relating to the imazaquin product line. Imazaquin is an herbicide that is used on soybeans and for certain non-crop applications.
On April 29, 2015 the registrant’s international subsidiary, AMVAC C.V., completed the acquisition of certain assets related to the bromacil herbicide product line from DuPont Crop Protection. The assets acquired included the Hyvar® and Krovar® trademarks, product registrations, product registration data, customer information, access to certain know-how, technical registrations and associated registration data in all markets outside of North America. Bromacil is a broad spectrum residual herbicide used on crops such as pineapples, citrus, agave and asparagus, and is marketed globally under the Hyvar® and Krovar® brands
On April 6, 2015 the registrant’s international subsidiary, AMVAC C.V., completed the acquisition of certain assets related to the Nemacur® insecticide/nematicide product line from Adama Agricultural Solutions Ltd (“Adama”). The assets acquired include trademarks, product registrations, associated registration data, and customer information that relate to the marketing and sale of this crop protection product in Europe. Nemacur is used to control soil insects and nematodes on many fruit and vegetable crops.
On March 25, 2013, AVD made an equity investment in TyraTech Inc. (“TyraTech”), a Delaware corporation that specializes in developing, marketing and selling pesticide products containing natural oils and other natural ingredients. As of December 31, 2015, the Company’s ownership position in TyraTech was approximately 15.11%.
On October 7, 2011, AMVAC completed the acquisition of the international rights to the cotton defoliant product tribufos (sold under the trade name Def ®) from Bayer CropScience AG (“BCS AG”). The acquired assets include registrations and data rights, rights relating to manufacturing and formulation know-how, inventories and the trademark Def.
1
Table of Contents
AMERICAN VANGUARD CORPORATION
AND SUBSIDIARIES
(Dollars in thousands, except per share data)
Def complements AMVAC’s existing cotton defoliant product Folex®, which it has marketed since 2002. This acquisition also complements the U.S. rights to Def that the Company purchased from BCS AG on July 21, 2010. Both Folex and Def are fast and effective cotton defoliants that facilitate the removal of leaves surrounding the cotton boll and, in combination with other products, function as a harvest aid.
Seasonality
The agricultural chemical industry, in general, is cyclical in nature. The demand for AMVAC’s products tends to be seasonal. Seasonal usage, however, does not necessarily follow calendar dates, but more closely follows varying growing seasonal patterns, weather conditions, geography, weather related pressure from pests and customer marketing programs.
Backlog
AMVAC does not believe that backlog is a significant factor in its business. AMVAC primarily sells its products on the basis of purchase orders, although from time to time it has entered into requirements contracts with certain customers.
Customers
The Company’s largest three customers accounted for 18%, 12% and 8% of the Company’s sales in 2015; 20%, 11% and 8% in 2014; and 17%, 13%, and 8% in 2013.
Distribution
AMVAC predominantly distributes its products domestically through national distribution companies and buying groups or co-operatives, that purchase AMVAC’s goods on a purchase order basis and, in turn, sell them to retailers/growers/end-users. The Company’s domestic and international distributors, agents, or customers typically have long-established relationships with retailers/end-users, far-reaching logistics and transportation capabilities and customer service expertise. The markets for AMVAC products vary by region, target crop, use and type of distribution channel. AMVAC’s customers are experts at addressing these markets. The Company manages its international sales through its Netherlands’ entity which has sales offices in Mexico or Costa Rica and, employed sales force executives or sales agents in other territories.
Competition
In its many marketplaces, AMVAC faces competition from both domestic and foreign manufacturers. Many of our competitors are larger and have substantially greater financial and technical resources than AMVAC. AMVAC’s ability to compete depends on its ability to develop additional applications for its current products and expand its product lines and customer base. AMVAC competes principally on the basis of the quality and efficacy of its products, price and the technical service and support given to its customers.
Generally, the treatment against pests of any kind is broad in scope, there being more than one way or one product for treatment, eradication, or suppression. In some cases, AMVAC has attempted to position itself in smaller niche markets which are no longer addressed by larger companies. In other cases, for example in the Midwestern corn market, the Company competes directly with larger competitors.
Manufacturing
Through its four domestic manufacturing facilities (see Item 2, Properties), AMVAC synthesizes many of the technical grade active ingredients that are in its end-use products. Further, AMVAC formulates and packages the majority of its end-use products at its own facilities or at the facilities of third-party formulators.
Raw Materials
AMVAC utilizes numerous companies to supply the various raw materials and components used in manufacturing its products. Many of these materials are readily available from domestic sources. In those instances where there is a single source of supply or where the source is not domestic, AMVAC seeks to secure its supply by either long-term (multi-year) arrangements or purchasing on long lead times from its suppliers. AMVAC believes that it is considered to be a valued customer to such sole-source suppliers.
2
Table of Contents
AMERICAN VANGUARD CORPORATION
AND SUBSIDIARIES
(Dollars in thousands, except per share data)
Intellectual Property
AMVAC’s proprietary product formulations are protected, to the extent possible, as trade secrets and, to a lesser extent, by patents. Certain of the Company’s closed delivery systems are patented and AMVAC has made applications for related inventions to expand its equipment portfolio, particularly with respect to its Smart Integrated Multi-Product Precision Application System, (“SIMPAS”) technology. Further, AMVAC’s trademarks bring value to its products in both domestic and foreign markets. AMVAC considers that, in the aggregate, its trademarks, licenses, and patents constitute a valuable asset. While it does not regard its business as being materially dependent upon any single trademark, license, or patent, it believes that its developmental equipment technology may bring significant value in future years.
EPA Registrations
AMVAC’s products also receive protection afforded by the terms of the Federal Insecticide, Fungicide and Rodenticide Act (“FIFRA”) legislation. The legislation makes it unlawful to sell any pesticide in the United States, unless such pesticide has first been registered by the United States Environmental Protection Agency (“U.S. EPA”). Substantially all of AMVAC’s products are subject to U.S. EPA registration and periodic re-registration requirements and are registered in accordance with FIFRA. This registration by U.S. EPA is based, among other things, on data demonstrating that the product will not cause unreasonable adverse effects on human health or the environment, when it is used according to approved label directions. In addition, each state, requires a specific registration before any of AMVAC’s products can be marketed or used in that state. State registrations are predominantly renewed annually with a smaller number of registrations that are renewed on a multiple year basis. Foreign jurisdictions typically have similar registration requirements by statute. The U.S. EPA, state, and foreign agencies have required, and may require in the future, that certain scientific data requirements be performed on registered products sold by AMVAC. AMVAC, on its own behalf and in joint efforts with other registrants, has furnished, and is currently furnishing, certain required data relative to specific products.
Under FIFRA, the federal government requires registrants to submit a wide range of scientific data to support U.S. registrations. This requirement results in operating expenses in such areas as regulatory compliance with U.S. EPA and other such bodies in the markets in which the Company sells its products, and the production of new products or new formulations of existing products. AMVAC expensed $9,831, $14,084, and $16,526 during 2015, 2014 and 2013 respectively, on these activities.
| 2015 | 2014 | 2013 | ||||||||||
| Registration |
$ | 6,375 | $ | 9,188 | $ | 11,556 | ||||||
| Product Development |
3,456 | 4,896 | 4,970 | |||||||||
|
|
|
|
|
|
|
|||||||
| $ | 9,831 | $ | 14,084 | $ | 16,526 | |||||||
|
|
|
|
|
|
|
|||||||
3
Table of Contents
AMERICAN VANGUARD CORPORATION
AND SUBSIDIARIES
(Dollars in thousands, except per share data)
Environmental
During 2015, AMVAC continued activities to address environmental issues associated with its facility in Commerce, CA. (the “Facility”). An outline of the history of those activities follows.
In 1995, the California Department of Toxic Substances Control (“DTSC”) conducted a Resource Conservation and Recovery Act (“RCRA”) Facility Assessment (“RFA”) of those facilities having hazardous waste storage permits. In March 1997, the RFA culminated in DTSC accepting the Facility into its Expedited Remedial Action Program. Under this program, the Facility was required to conduct an environmental investigation and health risk assessment. Depending on the findings of these investigations, the Facility might also be required to develop and implement remedial measures to address any historical environmental impairment.
This activity then took two paths: first, the RCRA permit closure and second, the larger site characterization.
With respect to the RCRA permit closure, in 1998, AMVAC began the formal process to close its hazardous waste permit at the Facility (which had allowed AMVAC to store hazardous waste longer than 90 days) as required by federal regulations. Formal regulatory closure actions began in 2005 and were completed in 2008, as evidenced by DTSC’s October 1, 2008 acknowledgement of AMVAC’s Closure Certification Report.
With respect to the larger site characterization, soil and groundwater characterization activities began in December 2002 in accordance with the Site Investigation Plan that was approved by DTSC. Additional activities were conducted from 2003 to 2014, with oversight provided by DTSC. Additional review of groundwater and soil data is being conducted in response to federally-mandated initiatives of similarly affected sites. Risk assessment activities have been concluded. The Company submitted a draft remedial action plan to DTSC in February 2015, received formal DTSC comments in January 2016, and will submit a revised remedial action plan in early 2016. Until the remedial action plan has been submitted and comments are received from DTSC, it is uncertain whether the cost associated with further investigation and potential remediation activities will have a material impact on the Company’s consolidated financial statements or its results of operations. Thus, the Company is unable to determine what sort of remediation is probable, nor can the cost of remediation be reasonably estimated (the scope can vary depending upon the risk assessment and many other factors). Accordingly, the Company has not recorded a loss contingency with respect thereto.
AMVAC is subject to numerous federal and state laws and governmental regulations concerning environmental matters and employee health and safety at its four manufacturing facilities. The Company continually adapts its manufacturing process to the environmental control standards of the various regulatory agencies. The U.S. EPA and other federal and state agencies have the authority to promulgate regulations that could have an impact on the Company’s operations.
AMVAC expends substantial funds to minimize the discharge of materials in the environment and to comply with the governmental regulations relating to protection of the environment. Wherever feasible, AMVAC recovers and recycles raw materials and increases product yield in order to partially offset increasing pollution abatement costs.
The Company is committed to a long-term environmental protection program that reduces emissions of hazardous materials into the environment, as well as to the remediation of identified existing environmental concerns.
Employees
As of December 31, 2015, the Company employed 347 employees. The Company employed 382 employees as of December 31, 2014 and 499 employees as of December 31, 2013. From time to time, due to the seasonality of its business, AMVAC uses temporary contract personnel to perform certain duties primarily related to packaging of its products. None of the Company’s employees are subject to a collective bargaining agreement. The Company believes it maintains positive relations with its employees.
4
Table of Contents
AMERICAN VANGUARD CORPORATION
AND SUBSIDIARIES
(Dollars in thousands, except per share data)
Domestic operations
AMVAC is a California corporation that was incorporated under the name of Durham Chemical in August 1945. The name of the corporation was subsequently changed to AMVAC in January 1973. As the Company’s main operating subsidiary, AMVAC owns and/or operates the Company’s domestic manufacturing facilities and is also the parent company (owns 99%) of AMVAC CV. AMVAC manufactures, formulates, packages and sells its products in the USA and is a wholly owned subsidiary of AVD.
GemChem is a California corporation that was incorporated in 1991 and was subsequently purchased by the Company in 1994. GemChem sells into the pharmaceutical, cosmetic and nutritional markets, in addition to purchasing key raw materials for the Company. GemChem is a wholly owned subsidiary of AVD.
DAVIE owns real estate for corporate use only. See also Part I, Item 2 of this Annual Report. DAVIE is a wholly owned subsidiary of AVD.
On November 30, 2012, AMVAC and TyraTech formed a Delaware limited liability company, Envance, in which the Company owned 60% and TyraTech held 40% of the equity interest. Subsequently, on April 1, 2015, the Company entered into an agreement with TyraTech to change its ownership from 60% to 87%. Envance has the rights to develop and commercialize pesticide products and technologies made from natural oils in global consumer, commercial, professional, crop protection and seed treatment markets and has begun bringing products to market. Envance is headquartered in TyraTech’s facility in Research Triangle Park, North Carolina.
International operations
In July 2012, the Company formed AMVAC C.V., which is incorporated in the Netherlands, for the purpose of managing foreign sales on behalf of the Company. AMVAC C.V. is owned jointly by AMVAC as the general partner, and AVD International, LLC (also formed in July 2012 as a wholly owned subsidiary of AMVAC), as the limited partner, and is therefore a wholly owned subsidiary of AMVAC.
AMVAC BV is a registered Dutch private limited liability company that was formed in July 2012. AMVAC BV is located in the Netherlands and is wholly owned by AMVAC C.V. During 2015, the international business sold the Company’s products in 54 countries, as compared to 57 countries in 2014.
The Company opened an office in 2008 in Costa Rica, to conduct business in Costa Rica and other countries in Central America. The office is operated by AMVAC CR Srl and markets chemical products for agricultural and commercial uses.
The Company opened an office in Basel, Switzerland in 2006. The office is operated by AMVAC S. The Company formed the new subsidiary to expand its resources dedicated to business development opportunities to maintain the Company’s registrations in that country. Also in 2006, the Company formed a Brazilian entity which operates as AMVAC B. It functions primarily to maintain the Company’s registrations in that country.
The Company opened an office in 1998 in Mexico to conduct business primarily in Mexico. The office is operated by AMVAC M Srl and markets chemical products for agricultural and commercial uses. In November 2013, a Mexican entity, AMVAC M Srl, was incorporated to conduct business in Mexico; this entity is part of the new international business structure and is a wholly owned subsidiary of AMVAC BV.
The Company classifies as export sales all products bearing foreign labeling shipped to a foreign destination.
| 2015 | 2014 | 2013 | ||||||||||
| Export sales |
$ | 77,295 | $ | 73,706 | $ | 69,772 | ||||||
| Percentage of net sales |
26.7 | % | 24.7 | % | 18.3 | % | ||||||
5
Table of Contents
AMERICAN VANGUARD CORPORATION
AND SUBSIDIARIES
(Dollars in thousands, except per share data)
Risk Management
The Company regularly monitors matters, whether insurable or not, that could pose material risk to its operations, financial performance or the safety of its employees and neighbors. The Risk Committee of the Board of Directors (“Board”) was formed in 2010, consists of three members of the Board and meets regularly. In fact, all members of the Board attend Risk Committee meetings. Working with senior management, the committee continuously evaluates the Company’s risk profile, identifies mitigation measures and ensures that the Company is prudently managing these risks. In support of the Risk Committee, senior management has appointed a risk manager and designated several senior executives to lead teams focused on addressing each of several of the most material risks facing the Company; these groups perform analysis with the benefit of operational knowledge. The top risks identified by management and being addressed by risk teams (in no particular order) include: adverse political and regulatory climate; managing high levels of inventory and associated reduced levels of manufacturing activity; succession planning and bench strength; maintaining a competitive edge in the marketplace; the possibility of an environmental event; undervaluation of the Company; availability of acquisition and licensing targets and cyber terrorism. Over the course of 2015, the Company continued to implement its enterprise risk management program, which extends to all areas of potential risk and is a permanent feature in the Company’s operation. In addition, the Company continually evaluates insurance levels for product liability, property damage and other potential areas of risk. Management believes its facilities and equipment are adequately insured against loss from usual business risks.
Available Information
The Company makes available free of charge (through its website, www.american-vanguard.com), its Annual Report on Form 10-K, Quarterly Reports on Form 10-Q, current reports on Form 8-K, and all amendments to those reports as soon as reasonably practicable after such material is electronically filed with the Securities and Exchange Commission (“SEC”). Such reports are also available free of charge on the SEC website, www.sec.gov. Also available free of charge on the Company’s website are the Company’s Audit Committee, Compensation Committee, Finance Committee and Nominating and Corporate Governance Committee Charters, the Company’s Corporate Governance Guidelines, the Company’s Code of Conduct and Ethics, the Company’s Employee Complaint Procedures for Accounting and Auditing Matters and the Company’s policy on Stockholder Nomination and Communication. The Company’s Internet website and the information contained therein or incorporated therein are not intended to be incorporated into this Annual Report on Form 10-K.
| ITEM 1A. | RISK FACTORS |
The regulatory climate has grown increasingly challenging to the Company’s interests both domestically and internationally—Various agencies within the U.S. (both federal and state) and foreign governments continue to exercise increased scrutiny in permitting continued uses (or the expansion of such uses) of older chemistries, including many of the Company’s products and, in some cases, have initiated or entertained challenges to these uses. The challenge of the regulatory climate is even more pronounced in certain other geographical regions where the Company faces resistance to the continued use of certain of its products. There is no guarantee that this climate will change in the near term or that the Company will be able to maintain or expand the uses of many of its products in the face of these regulatory challenges.
U.S. EPA has proposed further limitations on the continued registration of organophosphates—On September 25, 2015 the U.S. EPA published in the Federal Register draft human health risk assessments for four of the Company’s organophosphate (“OP”) compounds (marketed under the names Bidrin, Counter, Folex and Mocap) in which it recommends the application of a 10X safety factor under the FQPA (Food Quality Protection Act) in light of the alleged possibility of neurodevelopmental harm to women and children based on epidemiological data. The agency is seeking public comment on these risk assessments and has indicated its current intention to apply this safety factor to all registered OPs, as they come up for review or renewal. There are at least 10 other companies that have OP products which are sold (and used) in the U.S. The Company, like many in our industry, believes that the basis for applying this safety factor is unsound and that there is no causal link between the perceived harm and the use of its products. Accordingly, the Company intends to take all action necessary to defend its registrations. It is expected we will be joined in this effort by other companies who are similarly concerned about the potential impact of U.S. EPA’s action. Further, there is no guarantee that the Company’s actions will alter the course that U.S. EPA has proposed and, if the agency’s position becomes final, some uses of the company’s OP products could be limited or cancelled. Such action could have a material adverse effect upon the Company’s financial performance in future reporting periods.
6
Table of Contents
AMERICAN VANGUARD CORPORATION
AND SUBSIDIARIES
(Dollars in thousands, except per share data)
Use of the Company’s products is subject to continuing challenges from activist groups—Use of agrochemical products, including the Company’s products is regularly challenged by activist groups in many jurisdictions under a multitude of federal and state statutes, including FIFRA, the Food Quality Protection Act, Endangered Species Act, and the Clean Water Act, to name a few. These challenges typically take the form of lawsuits or administrative proceedings against the U.S. EPA and/or other federal or state agencies, the filing of amicus briefs in pending actions, the introduction of legislation that is inimical to the Company’s interests, and/or adverse comments made in response to public comment invited by U.S. EPA in the course of registration, re-registration or label expansion. It is possible that one or more of these challenges could succeed, resulting in a material adverse effect upon one or more of the Company’s products.
The distribution and sale of the Company’s products are subject to prior governmental approvals and thereafter ongoing governmental regulation—The Company’s products are subject to laws administered by federal, state and foreign governments, including regulations requiring registration, approval and labeling of its products. The labeling requirements restrict the use of, and type of, application for our products. More stringent restrictions could make our products less available, which would adversely affect our revenues and profitability. Substantially all of the Company’s products are subject to the U.S. EPA, and similar agencies in the jurisdictions in which we do business, registration and re-registration requirements, and are registered in accordance with FIFRA. Such registration requirements are based, among other things, on data demonstrating that the product will not cause unreasonable adverse effects on human health or the environment when used according to approved label directions. All states, where any of the Company’s products are used, also require registration before our products can be marketed or used in that state. Governmental regulatory authorities have required, and may require in the future, that certain scientific data requirements be performed on the Company’s products. The Company, on its behalf and also in joint efforts with other registrants, has and is currently furnishing certain required data relative to its products. There can be no assurance, however, that the U.S. EPA or similar agencies will not request that certain tests or studies be repeated or that more stringent legislation or requirements will not be imposed in the future. The Company can provide no assurance that any testing approvals or registrations will be granted on a timely basis, if at all, or that its resources will be adequate to meet the costs of regulatory compliance.
The manufacturing of the Company’s products is subject to governmental regulations—The Company currently owns and operates three manufacturing facilities in Los Angeles, California; Axis, Alabama; and Marsing, Idaho and owns and has manufacturing services provided in a fourth facility in Hannibal, Missouri (the “Facilities”). The Facilities operate under the terms and conditions imposed by state and local authorities. The manufacturing of key ingredients for certain of the Company’s products occurs at the Facilities. An inability to renew or maintain a license or permit, or a significant increase in the fees for such licenses or permits, could impede the Company’s manufacture of one or more of its products, and/or increase the cost of production; this, in turn, would materially and adversely affect the Company’s ability to provide its products in a timely and affordable manner.
The Company may be subject to environmental liabilities—While the Company expends substantial funds to minimize the discharge of materials into the environment and to comply with governmental regulations relating to protection of the environment and its workforce, federal and state authorities may nevertheless seek fines and penalties for any violation of the various laws and governmental regulations. In addition, while the Company continually adapts its manufacturing processes to the environmental control standards of regulatory authorities, it cannot completely eliminate the risk of accidental contamination or injury from hazardous or regulated materials. Further, these various governmental agencies could, among other things, impose liability on the Company for cleaning up the damage resulting from the release of pesticides and other agents into the environment, including with respect to subsurface environmental contamination at its Los Angeles-based manufacturing facility, which has been the subject of characterization, risk assessment and remediation planning for several years. In short, the Company may be held liable for significant damages or fines relating to any environmental contamination or injury, which could have a material adverse effect on the Company’s financial condition and results of operations.
The Company’s business may be adversely affected by cyclical and seasonal effects—Demand for the Company’s products tends to be seasonal. Seasonal usage follows varying agricultural seasonal patterns, weather conditions and weather related pressure from pests, and customer marketing programs and requirements. Weather patterns can have an impact on the Company’s operations. For example, the end user of its products may, because of weather patterns, delay or intermittently disrupt field work during the planting season, which may result in a reduction of the use of some products and therefore may reduce the Company’s revenues and profitability. In light of the possibility of adverse seasonal effects, there can be no assurance that the Company will maintain sales performance at historical levels in any particular region.
7
Table of Contents
AMERICAN VANGUARD CORPORATION
AND SUBSIDIARIES
(Dollars in thousands, except per share data)
The Company’s financial performance may be disproportionately affected by the strength or weakness of specific markets—From 2010 through 2012, the Company enjoyed dramatic growth in its corn product lines sold primarily into the Midwestern United States. By 2013, those products accounted for approximately 38% of the Company’s total net sales. However, due to prolonged wet conditions in early 2013, excess inventory of corn crop inputs (including some of the Company’s products) accumulated in the distribution channel. This market condition continued to affect the company’s overall financial performance adversely for the full years of 2014 and 2015. Sales of the Company’s corn product lines represented 19% of the Company’s sales in both 2014 and 2015. There is no guarantee that Midwest crop market conditions will return to the pre-2014 historical level or that other conditions adversely affecting the market will not come about.
The Company is dependent upon certain sole source suppliers for certain of its raw materials and active ingredients— There are a limited number of suppliers of certain important raw materials used by the Company in many of its products. Certain of these raw materials are available solely from sources overseas or from single sources domestically. Further, in conjunction with the purchase and/or licensing of various product lines (including Impact® , Force®, and Scepter®), the Company has entered into multi-year supply arrangements under which such counterparties are the sole source of either active ingredients and/or formulated end-use product and, in some cases, the manufacturer has entered the market as a competitor. There is no guarantee that any or all of these sole source manufacturers will be willing or able to supply these products to the Company reliably, continuously and at the levels anticipated by the Company or required by the market. If these sources prove to be unreliable and the Company is not able to supplant or otherwise second source these suppliers, it is possible that the Company will not realize its projected sales, which, in turn, could adversely affect the Company’s results of operations.
To the extent that capacity utilization is not fully realized at its manufacturing facilities, the Company may experience lower profitability—The Company has pursued a business strategy of acquiring manufacturing facilities at a steep discount to their replacement value. These acquisitions have enabled the Company to be more independent of overseas manufacturers than some of our competitors. While the Company endeavors continuously to maximize utilization of these facilities, our success in these endeavors is dependent upon many factors beyond our control, including fluctuating market conditions, product life cycles, weather conditions, availability of raw materials and regulatory constraints, among other things. There can be no assurance that the Company will be able to maximize its utilization of capacity at its manufacturing facilities, particularly when, as is currently the case, inventory of goods manufactured by the Company are at higher-than-normal levels. There is no assurance that absorption of factory costs will improve to the point that will enable the Company to return to its historically higher levels of profitability.
The Company’s continued success depends, in part, upon a limited number of key employees—Within certain functions, the Company relies heavily on a small number of key employees to manage ongoing operations and to perform strategic planning. In some cases, there are no internal candidates who are qualified to succeed these key personnel in the short term. In the event that the Company was to lose one or more key employees, there is no guarantee that Company could replace them with people having comparable skills. Further, the loss of key personnel could adversely affect the operation of the business.
The Company faces competition in certain markets from new technologies, both genetic and chemical—The Company faces competition from larger companies that market new chemistries, genetically modified (“GMO”) seeds and other similar technologies (e.g., RNA interference) in certain of the crop protection sectors in which the Company competes, particularly that of corn. In fact, many growers that have chosen to use GMO seeds have reduced their use of the types of pesticides sold by the Company. There is no guarantee that the Company will maintain its market share or pricing levels in sectors that are subject to competition from companies that market these technologies.
The Company faces competition from generic competitors that source product from countries having lower cost structures—The Company continues to face competition from competitors throughout the globe that may enter the market through either offers to pay data compensation, or similar means in foreign jurisdictions, and then subsequently source material from countries having lower cost structures (typically India and China). These competitors typically tend to operate at thinner gross margins and, with low costs of goods, can drive pricing and profitability of subject product lines downward. There is no guarantee that the Company will maintain market share and pricing over generic competitors or that such competitors will not offer generic versions of the Company’s products in the future.
The Company’s key customers typically carry competing product lines and may be influenced by the Company’s larger competitors—A significant portion of the Company’s products are sold to national distributors in the United States,
8
Table of Contents
AMERICAN VANGUARD CORPORATION
AND SUBSIDIARIES
(Dollars in thousands, except per share data)
which also carry product lines of competitors that are much larger than the Company. Typically, revenues from the sales of these competing product lines and related program incentives constitute a greater part of our distributors’ income than do revenues from sales and program incentives arising from the Company’s product lines. Further, these distributors are often under pressure to market competing product lines rather than the Company’s. In light of these facts, there is no assurance that such customers will continue to market our products aggressively or successfully or that the Company will be able to influence such customers to continue to purchase our products instead of those of our competitors.
Industry consolidation may threaten the Company’s position in various markets. The agchem industry continues to undergo significant consolidation. Many of the Company’s competitors have grown or are about to grow through mergers and acquisitions. As a result, these competitors will tend to realize greater economies of scale, more diverse portfolios and greater influence throughout the distribution channels. Consequently, the Company may find it more difficult to compete in many markets. While such merger activity may generate acquisition opportunities for the Company, there is no guarantee that the Company will benefit from such opportunities. Further, there is a risk that the Company’s future performance may be hindered by the growth of its competitors through consolidation.
The Company is dependent on a limited number of customers, which makes it vulnerable to the continued relationship with and financial health of those customers—In 2015, three customers accounted for 38% of the Company’s sales. The Company’s future prospects may depend on the continued business of such customers and on our continued status as a qualified supplier to such customers. The Company cannot guarantee that our current significant customers will continue to buy products from us at current levels. The loss of a key customer could have a material adverse effect on the Company’s financial condition and results of operations.
The carrying value of certain assets on the Company’s consolidated balance sheets may be subject to impairment depending upon market trends and other factors—The Company regularly reviews the carrying value of certain assets, including long-lived assets, inventory, fixed assets and intangibles. Depending upon the class of assets in question, the Company takes into account various factors including, among others, sales, trends, market conditions, cash flows, profit margins and the like. Based upon this analysis, where circumstances warrant the Company may leave such carrying values unchanged or adjust them as appropriate. There is no guarantee that these carrying values can be maintained indefinitely, and it is possible that one or more such assets could be subject to impairment which, in turn, could have an adverse impact upon the financial performance of the Company.
Reduced financial performance may limit the Company’s ability to borrow under its credit facility—The Company has historically grown net sales through both expansion of current product lines and acquisition of product lines from third parties. In order to finance acquisitions, where necessary, the Company has drawn upon its senior credit facility. However, the Company’s borrowing capacity under the senior credit facility depends, in part, upon its satisfaction of a negative covenant that sets a maximum ratio of borrowed debt to earnings (as measured over the trailing 12 month period). There is no guarantee that the Company will continue to generate earnings necessary to ensure that it has sufficient borrowing capacity to support future acquisitions or that the lender group will amend the senior credit facility to provide for such borrowing capacity.
Dependence on the Company’s banking relationship—The Company’s main bank is Bank of the West, a wholly-owned subsidiary of the French bank, BNP Paribas. Bank of the West has been the Company’s primary bank for more than 30 years. Bank of the West is the syndication manager for the Company’s loans and from time to time, acts as the counterparty on the Company’s derivative transactions. In addition to Bank of the West, the syndicated banks include Wells Fargo Bank, N.A., BMO Harris Financing, Inc., MUFG Union Bank, N.A., Agstar Financial Services PCA and Greenstone Farm Credit Services, ACA, FLCA. The Company reviews the creditworthiness of its banks on a quarterly basis via credit agencies and also has face-to-face meetings with senior management of the banks. Management believes that the Company has an excellent working relationship with Bank of the West and the other financial institutions in the Company’s lender group. In light of the uncertainties in global financial markets, there is no guarantee, however, that the Company’s lenders will be either willing or able to continue lending to the Company at such rates and in such amounts as may be necessary to meet the Company’s working capital needs.
The Company’s growth has been fueled in part by acquisition—Over the past few decades, the Company’s growth has been driven by acquisition and licensing of both established and developmental products from third parties. There is no guarantee that acquisition targets or licensing opportunities meeting the Company’s investment criteria will remain available or will be affordable. If such opportunities do not present themselves, then the Company may be unable to record consistent growth in future years.
9
Table of Contents
AMERICAN VANGUARD CORPORATION
AND SUBSIDIARIES
(Dollars in thousands, except per share data)
| ITEM 1B. | UNRESOLVED STAFF COMMENTS |
None
| ITEM 2 | PROPERTIES |
AMVAC owns in fee the Facility constituting approximately 152,000 square feet of improved land in Commerce, California (“Commerce”) on which its West Coast manufacturing and some of its warehouse facilities and offices are located.
DAVIE owns in fee approximately 72,000 square feet of warehouse, office and laboratory space on approximately 118,000 square feet of land in Commerce, California, which is leased to AMVAC. In 2013, the Company made a significant investment in the Glenn A. Wintemute Research Center, which houses the Company’s primary research laboratory supporting synthesis, formulation and other new product endeavors.
On December 28, 2007, pursuant to the provisions of the definitive Sale and Purchase Agreement (the “Agreement”) dated as of November 27, 2006 between AMVAC and BASF, AMVAC purchased the global Counter product line. AMVAC purchased certain manufacturing assets relating to the production of Counter and Thimet and located at BASF’s multi-plant facility situated in Hannibal, Missouri (the “Hannibal Site”). Subject to the terms and conditions of the Agreement, AMVAC purchased certain buildings, manufacturing equipment, office equipment, fixtures, supplies, records, raw materials, intermediates and packaging constituting the “T/C Unit” of the Hannibal Site. The parties entered into a ground lease and a manufacturing and shared services agreement, under which BASF continues to supply various shared services to AMVAC for the Hannibal Site.
On March 7, 2008, AMVAC acquired from Bayer CropScience Limited Partnership, (“BCS LP”), a U.S. business of BCS, a facility (the “Marsing Facility”) located in Marsing, ID, which consists of approximately 17 acres of improved real property, 15 of which are owned by AMVAC and two of which AMVAC leases from the City of Marsing for a term of 25 years. The Marsing Facility is engaged in the blending of liquid and powder raw materials and the packaging of finished liquid, powder and pelletized products for sale into the US agricultural market. With this acquisition, AMVAC acquired the ability to formulate flowable materials. In connection with the acquisition, AMVAC and BCS LP agreed to enter into a master processor agreement under which AMVAC provides certain third party manufacturing services to BCS LP on an ongoing basis that continued into 2015. Following the termination of the master supply agreement, AMVAC and BCS LP have continued to trade on a normal commercial basis.
In 2001, AMVAC completed the acquisition of a manufacturing facility (the “Axis Facility”) from E.I. DuPont de Nemours and Company (“DuPont”). The Axis Facility is one of three such units located on DuPont’s 510 acre complex in Axis, Alabama. The acquisition consisted of a long-term ground lease of 25 acres and the purchase of all improvements thereon. The facility is a multi-purpose plant designed for synthesis of active ingredients and formulation and packaging of finished products.
The production areas of AMVAC’s facilities are designed to run on a continuous 24 hour per day basis. AMVAC regularly adds chemical processing equipment to enhance or expand its production capabilities. AMVAC believes its facilities are in good operating condition, are suitable and adequate for current needs, can be modified to accommodate future needs, have flexibility to change products, and can produce at greater rates as required. Facilities and equipment are insured against losses from fire as well as other usual business risks. The Company knows of no material defects in title to, or encumbrances on, any of its properties except that substantially all of the Company’s assets are pledged as collateral under the Company’s loan agreements with its primary lender group. For further information, refer to note 2 of the Notes to the Consolidated Financial Statements in Part IV, Item 15 of this Annual Report.
AMVAC owns approximately 42 acres of unimproved land in Texas for possible future expansion.
The Company leases approximately 23,800 square feet of office space located at 4695 MacArthur Court in Newport Beach, California. The premises serve as the Company’s corporate headquarters. On July 1, 2016, the leased office space will be reduced to 19,953 square feet and the term of the lease will be extended to expire June 30, 2021, under the terms of the sixth amendment to the lease dated as of September 28, 2015.
10
Table of Contents
AMERICAN VANGUARD CORPORATION
AND SUBSIDIARIES
(Dollars in thousands, except per share data)
AMVAC BV’s, GemChem’s, AMVAC M’s, AMVAC M Srl’s, AMVAC CR Srl’s and AMVAC S’s facilities consist of administration and sales offices which are leased.
| ITEM 3 | LEGAL PROCEEDINGS |
A. DBCP Cases
Over the course of the past 30 years, AMVAC and/or the Company have been named or otherwise implicated in a number of lawsuits concerning injuries allegedly arising from either contamination of water supplies or personal exposure to 1, 2-dibromo-3-chloropropane (“DBCP®”). DBCP was manufactured by several chemical companies, including Dow Chemical Company, Shell Oil Company and AMVAC and was approved by the U.S. EPA to control nematodes. DBCP was also applied on banana farms in Latin America. The U.S. EPA suspended registrations of DBCP in October 1979, except for use on pineapples in Hawaii. The U.S. EPA suspension was partially based on 1977 studies by other manufacturers that indicated a possible link between male fertility and exposure to DBCP among their factory production workers involved with producing the product.
At present, there are three domestic lawsuits and approximately 85 Nicaraguan lawsuits filed by former banana workers in which AMVAC has been named as a party. Only two of the Nicaraguan actions have actually been served on AMVAC.
As described more fully below, activity in domestic cases during 2015 is as follows: in Hawaii, Patrickson, et. al. v. Dole Food Company, et. al which had been dismissed in 2011 (for expiration of the statute of limitations), remains on appeal; and Adams, from which co-defendant Dole was dismissed, is on appeal with respect to such dismissal and, at any rate, involves claims that pre-dated AMVAC’s sales into the relevant market. All but one matter that had been pending in Louisiana and Delaware have been dismissed (and affirmed on appeal) based upon the applicable statutes of limitation. The pending Delaware matter is more fully described below. With respect to Nicaraguan matters, there was no change in status during 2015.
Delaware Matter
On or about May 31, 2012, HendlerLaw, P.C., which represents plaintiffs in seven related matters that had been pending before the United States District Court for the Eastern District of Louisiana (the “Hendler-Louisiana Cases” referred to in the Company’s Form 10-K for the period ended December 31, 2011 as Aguilar et al., v. Dole Fruit Company, Inc., et al (U.S.D.C., E.D. of LA No. CV-01305-CJB-SS)), filed nine separate actions, eight with the United States District Court for the District of Delaware (USCD DE No. 1:12-CV-00696-RGA)) and one with the Superior Court of the State of Delaware (which, for purposes of this filing shall be referred to as Chaverri et al. v. Dole Food Company, Inc. et al., case no. N12C-06-017-JOH). Six of the eight Hendler – Delaware cases and Chaverri involve claims for personal injury allegedly arising from exposure to DBCP on behalf of 235 banana workers from Costa Rica, Ecuador and Panama. Dole subsequently brought a motion to dismiss these seven matters under the “first-to-file” theory of jurisdiction, specifically in light of the fact that they involved identical claims and claimants as those appearing in the Hendler – Louisiana cases. These Delaware matters have been consolidated into one matter (the “Hendler-Delaware Case”). On August 21, 2012, the U.S. District Court in the Hendler-Delaware case granted defendants’ motion to dismiss the actions with prejudice, finding that the same claimants and claims had been pending in the Hendler-Louisiana cases where they had been first filed.
In October 2012, the federal district court in Louisiana granted defendant’s motion for summary judgment and dismissed the Hendler-Louisiana Cases for plaintiffs’ failure to bring the action within the applicable statute of limitations. Plaintiffs appealed the dismissal of the Hendler-Louisiana cases and, on September 19, 2013, the Fifth Circuit Court of Appeal upheld the lower court’s decision, finding no reason to reverse the dismissal.
On October 16, 2013, Plaintiffs filed a notice of appeal in the Hendler-Delaware case. Oral argument was heard before the Third Circuit Court of Appeal on June 24, 2014 in connection with that appeal, and, on August 11, 2015, the Third Circuit upheld the lower court’s dismissal of the Hendler-Delaware case. However, plaintiffs petitioned for rehearing en banc, arguing that, despite the fact that the same plaintiffs had made the same claims before another court (namely, the Louisiana court in the Hendler-Louisiana cases), because the Louisiana court had not decided the case on the merits (but, rather, on the basis of the statute of limitations), the Delaware trial court lacked the power to dismiss the Hendler-Delaware case with prejudice. On September 22, 2015, the Third Circuit vacated its previous ruling (to uphold the lower court dismissal) and the appeal was reheard en banc on February 17, 2016. The Company expects that a decision will be issued in 9 to 12 months. The Company believes the Hendler-Delaware case has no merit and, further, that a loss is neither probable nor reasonably estimable; accordingly, it has not recorded a loss contingency.
11
Table of Contents
AMERICAN VANGUARD CORPORATION
AND SUBSIDIARIES
(Dollars in thousands, except per share data)
Hawaiian Matters
Patrickson, et. al. v. Dole Food Company, et al In October 1997, AMVAC was served with two complaints in which it was named as a defendant, filed in the Circuit Court, First Circuit, State of Hawai’i and in the Circuit Court of the Second Circuit, State of Hawai’i (two identical suits) entitled Patrickson, et. al. v. Dole Food Company, et. al (“Patrickson Case”) alleging damages sustained from injuries (including sterility) to banana workers caused by plaintiffs’ exposure to DBCP while applying the product in their native countries. Other named defendants include: Dole Food Company, Shell Oil Company and Dow Chemical Company. After several years of law and motion activity, the court granted judgment in favor of the defendants based upon the statute of limitations on July 28, 2010. On August 24, 2010, the plaintiffs filed a notice of appeal. On April 8, 2011, counsel for plaintiffs filed a pleading to withdraw and to substitute new counsel. On October 21, 2015, the Hawai’i Supreme Court granted the appeal and overturned the lower court decision, ruling that the State of Hawai’i now recognizes cross-jurisdictional tolling, that plaintiffs filed their complaint within the applicable statute of limitations and that the matter is to be remanded to the lower court for further adjudication. No discovery has taken place in this matter, and, at this stage in the proceedings, the Company does not believe that a loss is either probable or reasonably estimable and, accordingly, has not recorded a loss contingency for this matter.
Adams v. Dole Food Company et al On approximately November 23, 2007, AMVAC was served with a suit filed by two former Hawaiian pineapple workers (and their spouses), alleging that they had testicular cancer due to DBCP exposure: Adams v. Dole Food Company et al in the First Circuit for the State of Hawaii. Plaintiff alleges that they were exposed to DBCP between 1971 and 1975. AMVAC denies that any of its product could have been used at the times and locations alleged by these plaintiffs. Following the dismissal of Dole Food Company on the basis of the exclusive remedy of worker’s compensation benefits, plaintiffs appealed the dismissal. That appeal has been pending since 2012. Plaintiffs’ counsel petitioned the court for substitution of counsel, but was denied on November 14, 2012. There has been no activity in the case since that time, and there is no estimated date of opinion. The Company does not believe that a loss is either probable or reasonably estimable and has not recorded a loss contingency for this matter.
Nicaraguan Matters
A review of court filings in Chinandega, Nicaragua, has found 85 suits alleging personal injury allegedly due to exposure to DBCP and involving approximately 3,592 plaintiffs have been filed against AMVAC and other parties. Of these cases, only two – Flavio Apolinar Castillo et al. v. AMVAC Chemical Corporation et al., No. 535/04 and Luis Cristobal Martinez Suazo et al. v. AMVAC Chemical Corporation et al., No. 679/04 Castillo and Suazo, (which were filed in 2004 and involve 15 banana workers) have been served on AMVAC. All but one of the suits in Nicaragua have been filed pursuant to Special Law 364, an October 2000 Nicaraguan statute that contains substantive and procedural provisions that Nicaragua’s Attorney General previously expressed as unconstitutional. Each of the Nicaraguan plaintiffs’ claims $1,000 in compensatory damages and $5,000 in punitive damages. In all of these cases, AMVAC is a joint defendant with Dow Chemical Company and Dole Food Company, Inc. AMVAC contends that the Nicaragua courts do not have jurisdiction over it and that Public Law 364 violates international due process of law. AMVAC has objected to personal jurisdiction and demanded under Law 364 that the claims be litigated in the United States. In 2007, the court denied these objections, and AMVAC appealed the denial. It is not presently known as to how many of these plaintiffs actually claim exposure to DBCP at the time AMVAC’s product was allegedly used nor is there any verification of the claimed injuries. Further, to date, plaintiffs have not had success in enforcing Nicaraguan judgments against domestic companies before U.S. courts. With respect to these Nicaraguan matters, AMVAC intends to defend any claim vigorously. Furthermore, the Company does not believe that a loss is either probable or reasonably estimable and has not recorded a loss contingency for these matters.
B. Other Matters
U.S. EPA RCRA Matter On or about March 24, 2015, Region 4 of the U.S. EPA issued to registrant’s principal operating subsidiary, AMVAC, an Opportunity to Show Cause why U.S. EPA should not take formal action under Section 3008(a) of the Resource Conservation and Recovery Act (RCRA) for potential noncompliance arising from AMVAC’s importation, transportation and storage of used, depleted Lock‘N Load containers having residual amounts of its product Thimet. AMVAC believes that these containers were properly handled and stored under, among others, the applicable provisions of the FIFRA relating to recycling and disposal of depleted, refillable containers (and their contents). AMVAC responded to the substance of the show cause letter on April 10, 2015 and has engaged in multiple discussions with U.S. EPA on the matter. While violations of RCRA, if any, may carry civil penalties, it is too early in the matter to determine whether a loss is probable or reasonably estimable. Accordingly, registrant has not recorded a loss contingency on this matter.
U.S. EPA RMP Matter On October 28 2015, Region 4 of the U.S. EPA provided AMVAC with notice of potential violations under Section 112(r)(7) of the Clean Air Act relating to the Company’s risk management program (“RMP”) at the its Axis, Alabama manufacturing facility. The notice arose from an inspection of the subject facility conducted by a U.S. EPA consultant on August 6, 2014 and cited several potential violations relating largely to processes, documentation and
12
Table of Contents
AMERICAN VANGUARD CORPORATION
AND SUBSIDIARIES
(Dollars in thousands, except per share data)
training. The potential violations could carry civil, administrative or criminal penalties under applicable law. The Company has investigated the matters cited in the notice, and has established a timeline for furnishing a formal response and otherwise meeting with the agency. At this stage, however, it is too early to determine whether a loss is probable or reasonably estimable. Accordingly, registrant has not recorded a loss contingency on this matter.
Galvan v. AMVAC In an action entitled Graciela Galvan v. AMVAC Chemical Corp. filed on April 7, 2014 with the Superior Court for the State of California for the County of Orange (No. 00716103CXC) plaintiff, a former employee, alleges violations of wages and hours requirements under the California Labor Code. The Company has completed the deposition of putative class representative and participated in mediation on the matter. The Company continues to believe that all of the claims are without merit and intends to defend the matter vigorously. Further, the Company does not believe that a loss is probable or reasonably estimable and has not recorded a loss contingency for the matter.
Navarro v. AMVAC On May 28, 2015, former employee, Silvano Navarro (who abandoned his position after electing not to take a leave of absence under FMLA) delivered a written claim to the Company in which he alleged that he was damaged due to discrimination for disability and a host of other labor and employment charges. Subsequently, the unemployment compensation board (in an unrelated proceeding) ruled against awarding Mr. Navarro unemployment compensation, finding that he had left his position of his own choice, that the Company had offered him a leave of absence and that, even after his departure, his managers tried to get him to return to work. The parties met in November 2015 to mediate the matter and discontinued the mediation in order to complete further internal investigation. The Company believes that a loss is probable and reasonably estimable and has recorded a loss contingency for the matter in an amount that is not material.
Schiemer Farms v. AMVAC On or about May 12, 2015, Farmers Supply Co-op, made a written claim against the Company for losses from the alleged failure of the Company’s soil fumigant, Vapam, to control weeds on an onion crop that was harvested in late 2014. The grower alleges a loss of yield in the amount of $1.2 million. The Company has been in informal discussion with claimant (which applied the product) and grower and does not believe that claimant is entitled to the relief that it seeks. The parties have been in settlement discussions for the past few months. Based upon its understanding of the facts at this stage, the Company believes that a loss is probable and reasonably estimable and has recorded a loss contingency for the matter in an amount that is not material.
Walker v. AMVAC On or about May 9, 2015, former consultant, Larry Walker, made a written claim against the Company for alleged breach of contract and patent infringement arising from the Company’s having obtained a patent (US PTO 8,921,270) for use of the compound ametryn as a standalone burndown herbicide on corn. Mr. Walker alleges, among other things, that he invented the claims set forth in that patent. The Company believes that Mr. Walker’s allegations have no merit and that its own scientists invented the patented method. At this stage, the Company does not believe that a loss is either probable or reasonably estimable and has not recorded a loss contingency for the matter.
| ITEM 4 | MINE SAFETY DISCLOSURES |
Not Applicable
| ITEM 5 | MARKET FOR REGISTRANT’S COMMON EQUITY, RELATED STOCKHOLDER MATTERS AND ISSUER PURCHASES OF EQUITY SECURITIES |
Market Information
Effective March 6, 2006, the Company listed its $0.10 par value common stock (“Common Stock”) on the New York Stock Exchange under the ticker symbol AVD. From January 1998 through March 5, 2006, the Common Stock was listed on the American Stock Exchange under the ticker symbol AVD. The Company’s Common Stock traded on The NASDAQ Stock Market under the symbol AMGD from March 1987 through January 1998.
13
Table of Contents
AMERICAN VANGUARD CORPORATION
AND SUBSIDIARIES
(Dollars in thousands, except per share data)
The following table sets forth the range of high and low sales prices as reported for the Company’s Common Stock for the calendar quarters indicated.
| High | Low | |||||||
| Calendar 2015 |
||||||||
| First quarter |
$ | 12.53 | $ | 9.73 | ||||
| Second quarter |
15.25 | 10.48 | ||||||
| Third quarter |
14.10 | 10.84 | ||||||
| Fourth quarter |
16.06 | 11.83 | ||||||
| Calendar 2014 |
||||||||
| First quarter |
$ | 24.54 | $ | 20.85 | ||||
| Second quarter |
22.20 | 12.41 | ||||||
| Third quarter |
13.96 | 10.93 | ||||||
| Fourth quarter |
13.27 | 9.50 | ||||||
Holders
As of February 17, 2016, the number of stockholders of the Company’s Common Stock was approximately 5,129, which includes beneficial owners with shares held in brokerage accounts under street name and nominees.
Dividends
The Company has issued a cash dividend in each of the last nineteen years dating back to 1996. Cash dividends issued during the past three years are summarized in the table below.
| Declaration Date |
Distribution Date | Record Date | Dividend Per Share |
Total Paid |
||||||||
| March 16, 2015 |
April 17, 2015 | April 3, 2015 | $ | 0.02 | $ | 572 | ||||||
|
|
|
|
|
|||||||||
| Total 2015 |
$ | 0.02 | $ | 572 | ||||||||
|
|
|
|
|
|||||||||
| December 11, 2014 |
January 9, 2015 | December 26, 2014 | $ | 0.02 | $ | 569 | ||||||
| September 19, 2014 |
October 22, 2014 | October 8, 2014 | 0.05 | 1,417 | ||||||||
| June 9, 2014 |
July 17, 2014 | July 3, 2014 | 0.05 | 1,420 | ||||||||
| March 10, 2014 |
April 18, 2014 | April 4, 2014 | 0.05 | 1,417 | ||||||||
|
|
|
|
|
|||||||||
| Total 2014 |
$ | 0.17 | $ | 4,823 | ||||||||
|
|
|
|
|
|||||||||
| December 18, 2013 |
January 10, 2014 | December 27, 2013 | $ | 0.05 | $ | 1,418 | ||||||
| September 9, 2013 |
October 18, 2013 | October 4, 2013 | 0.05 | 1,415 | ||||||||
| June 10, 2013 |
July 19, 2013 | July 5, 2013 | 0.05 | 1,413 | ||||||||
| March 11, 2013 |
April 19, 2013 | April 5, 2013 | 0.07 | 1,976 | ||||||||
|
|
|
|
|
|||||||||
| Total 2013 |
$ | 0.22 | $ | 6,222 | ||||||||
|
|
|
|
|
|||||||||
Purchases of Equity Securities by the Issuer
In June 2013, the Board of Directors authorized the Company to repurchase its common stock with the intent of offsetting dilution caused by incentive stock compensation. Shares repurchased during 2014 and 2013 are summarized in the table below.
| Purchased From |
Purchased To | Shares | Average Price | Total Cost |
||||||||||
| January 1, 2014 |
March 31, 2014 | 70,000 | 21.87 | 1,531 | ||||||||||
|
|
|
|
|
|
|
|||||||||
| Total 2014 |
$ | 21.87 | $ | 1,531 | ||||||||||
|
|
|
|
|
|
|
|||||||||
| October 1, 2013 |
December 31, 2013 | 70,000 | 27.63 | 1,934 | ||||||||||
|
|
|
|
|
|
|
|||||||||
| Total 2013 |
$ | 27.63 | $ | 1,934 | ||||||||||
|
|
|
|
|
|
|
|||||||||
14
Table of Contents
AMERICAN VANGUARD CORPORATION
AND SUBSIDIARIES
(Dollars in thousands, except per share data)
Securities Authorized for Issuance Under Equity Compensation Plans
| Plan Category |
Number of securities to be issued upon exercise of outstanding options, warrants, and rights (a) |
Weighted- average exercise price of outstanding options, warrants, rights (b) |
Number of securities remaining available for future issuance under equity compensation plans (excluding securities reflected in column (a) (c) 1 |
|||||||||
| Equity compensation plans approved by security holders |
725,255 | $ | 9.55 | 902,000 | ||||||||
|
|
|
|
|
|
|
|||||||
| Total |
725,255 | $ | 9.55 | 902,000 | ||||||||
|
|
|
|
|
|
|
|||||||
| 1 | These stocks remain authorized for future issuance under the Equity Incentive Plan of 1993, as amended (“the Plan”). However, under section 15 of the Plan, future issuances are not permitted after May 12, 2015. Accordingly, the Company intends to seek stockholders’ approval to extend the term of such plan in connection with its 2016 Annual Stockholders’ Meeting. |
15
Table of Contents
AMERICAN VANGUARD CORPORATION
AND SUBSIDIARIES
(Dollars in thousands, except per share data)
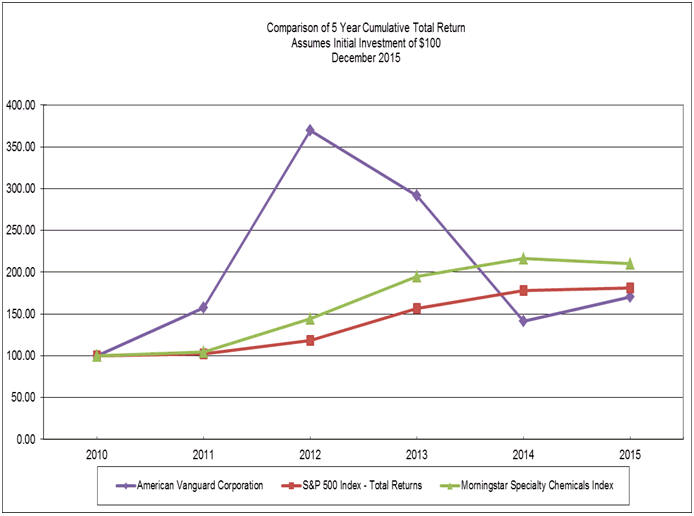
Stock Performance Graph
The following graph presents a comparison of the cumulative, five-year total return for the Company, the S&P 500 Stock Index, and a peer group (Specialty Chemical Industry). The graph assumes that the beginning values of the investments in the Company, the S&P 500 Stock Index, and the peer group of companies each was $100 on December 31, 2010. All calculations assume reinvestment of dividends. Returns over the indicated period should not be considered indicative of future returns.
16
Table of Contents
AMERICAN VANGUARD CORPORATION
AND SUBSIDIARIES
(Dollars in thousands, except per share data)
| ITEM 6 | SELECTED FINANCIAL DATA |
| 2015 | 2014 | 2013 | 2012 | 2011 | ||||||||||||||||
| Net sales |
$ | 289,382 | $ | 298,634 | $ | 381,021 | $ | 366,190 | $ | 301,080 | ||||||||||
|
|
|
|
|
|
|
|
|
|
|
|||||||||||
| Gross profit |
$ | 111,902 | $ | 114,496 | $ | 171,347 | $ | 161,125 | $ | 123,068 | ||||||||||
|
|
|
|
|
|
|
|
|
|
|
|||||||||||
| Operating income |
$ | 11,524 | $ | 6,710 | $ | 55,735 | $ | 59,323 | $ | 39,226 | ||||||||||
|
|
|
|
|
|
|
|
|
|
|
|||||||||||
| Income before income tax expense and loss on equity investment |
$ | 8,962 | $ | 3,644 | $ | 53,834 | $ | 56,852 | $ | 35,223 | ||||||||||
|
|
|
|
|
|
|
|
|
|
|
|||||||||||
| Net income attributable to American Vanguard |
$ | 6,591 | $ | 4,841 | $ | 34,449 | $ | 36,867 | $ | 22,068 | ||||||||||
|
|
|
|
|
|
|
|
|
|
|
|||||||||||
| Earnings per common share |
$ | .23 | $ | .17 | $ | 1.22 | $ | 1.32 | $ | 0.80 | ||||||||||
|
|
|
|
|
|
|
|
|
|
|
|||||||||||
| Earnings per common share—assuming dilution |
$ | .23 | $ | .17 | $ | 1.19 | $ | 1.28 | $ | 0.79 | ||||||||||
|
|
|
|
|
|
|
|
|
|
|
|||||||||||
| Total assets(1) |
$ | 443,539 | $ | 472,321 | $ | 446,438 | $ | 399,563 | $ | 342,122 | ||||||||||
|
|
|
|
|
|
|
|
|
|
|
|||||||||||
| Working capital |
$ | 160,549 | $ | 205,804 | $ | 139,007 | $ | 108,647 | $ | 104,713 | ||||||||||
|
|
|
|
|
|
|
|
|
|
|
|||||||||||
| Long-term debt less current installments(1) |
$ | 68,321 | $ | 98,605 | $ | 50,671 | $ | 35,869 | $ | 51,481 | ||||||||||
|
|
|
|
|
|
|
|
|
|
|
|||||||||||
| Stockholders’ equity |
$ | 268,395 | $ | 261,003 | $ | 257,795 | $ | 225,436 | $ | 187,072 | ||||||||||
|
|
|
|
|
|
|
|
|
|
|
|||||||||||
| Weighted average shares outstanding—basic |
28,673 | 28,436 | 28,301 | 27,914 | 27,559 | |||||||||||||||
|
|
|
|
|
|
|
|
|
|
|
|||||||||||
| Weighted average shares outstanding—assuming dilution |
29,237 | 28,912 | 28,899 | 28,756 | 27,875 | |||||||||||||||
|
|
|
|
|
|
|
|
|
|
|
|||||||||||
| Dividends per share of common stock |
$ | 0.02 | $ | 0.17 | $ | 0.22 | $ | 0.22 | $ | 0.08 | ||||||||||
|
|
|
|
|
|
|
|
|
|
|
|||||||||||
The selected consolidated financial data set forth above with respect to each of the calendar years in the five-year period ended December 31, 2015, have been derived from the Company’s consolidated financial statements and are qualified in their entirety by reference to the more detailed consolidated financial statements and the independent registered public accounting firm’s reports thereon, which are included elsewhere in this Report on Form 10-K for each of the three years in the period ended December 31, 2015. See Item 7, “Management’s Discussion and Analysis of Financial Condition and Results of Operation.”
| (1) | In April 2015, The Financial Accounting Standards Board (“FASB”) issued Accounting Standards Update (“ASU”) 2015-03, Interest – Imputation of Interest (Subtopic 835-30): Simplifying the Presentation of Debt Issuance Costs. This ASU requires that debt issuance costs related to a recognized debt liability be presented in the balance sheet as a direct deduction from the carrying amount of that debt liability, consistent with debt discounts. The Company adopted this new standard and retrospectively applied to the five-year period ended December 31, 2015. |
| ITEM 7 | MANAGEMENT’S DISCUSSION AND ANALYSIS OF FINANCIAL CONDITION AND RESULTS OF OPERATIONS |
FORWARD-LOOKING STATEMENTS/RISK FACTORS:
The Company, from time-to-time, may discuss forward-looking statements including assumptions concerning the Company’s operations, future results and prospects. Generally, “may,” “could,” “will,” “would,” “expect,” “believe,” “estimate,” “anticipate,” “intend,” “continue” and similar words identify forward-looking statements. Forward-looking statements appearing in this Report are made pursuant to the safe harbor provisions of the Private Securities Litigation Reform Act of 1995. Forward-looking statements are based on our current expectations and are subject to risks and uncertainties that can cause actual results and events to differ materially from those set forth in or implied by the forward-looking statements and related assumptions contained in the entire Report. Such factors include, but are not limited to: product demand and market acceptance risks; the effect of economic conditions; weather conditions; changes in regulatory policy; the impact of competitive products and pricing; changes in foreign exchange rates; product development and commercialization difficulties; capacity and supply constraints or difficulties; availability of capital resources; general business regulations, including taxes and other risks as detailed from time-to-time in the Company’s reports and filings filed with the U.S. SEC. It is not possible to foresee or identify all such factors. We urge you to consider these factors carefully in evaluating the forward-looking statements contained in this Report.
17
Table of Contents
AMERICAN VANGUARD CORPORATION
AND SUBSIDIARIES
(Dollars in thousands, except per share data)
Results of Operations
2015 Compared with 2014:
| 2015 | 2014 | Change | ||||||||||
| Net sales: |
||||||||||||
| Insecticides |
$ | 117,180 | $ | 135,705 | $ | (18,525 | ) | |||||
| Herbicides/soil fumigants/fungicides |
111,897 | 101,785 | 10,112 | |||||||||
| Other, including plant growth regulators |
29,013 | 30,220 | (1,207 | ) | ||||||||
|
|
|
|
|
|
|
|||||||
| Total crop |
258,090 | 267,710 | (9,620 | ) | ||||||||
| Non-crop |
31,292 | 30,924 | 368 | |||||||||
|
|
|
|
|
|
|
|||||||
| $ | 289,382 | $ | 298,634 | $ | (9,252 | ) | ||||||
|
|
|
|
|
|
|
|||||||
| Cost of goods sold: |
||||||||||||
| Insecticides |
$ | 77,288 | $ | 85,124 | $ | (7,836 | ) | |||||
| Herbicides/soil fumigants/fungicides |
65,507 | 59,855 | 5,652 | |||||||||
| Other, including plant growth regulators |
18,097 | 21,098 | (3,001 | ) | ||||||||
|
|
|
|
|
|
|
|||||||
| Total crop |
160,892 | 166,077 | (5,185 | ) | ||||||||
| Non-crop |
16,588 | 18,061 | (1,473 | ) | ||||||||
|
|
|
|
|
|
|
|||||||
| $ | 177,480 | $ | 184,138 | $ | (6,658 | ) | ||||||
|
|
|
|
|
|
|
|||||||
| Gross margin: |
||||||||||||
| Insecticides |
$ | 39,892 | $ | 50,581 | $ | (10,689 | ) | |||||
| Herbicides/soil fumigants/fungicides |
46,390 | 41,930 | 4,460 | |||||||||
| Other, including plant growth regulators |
10,916 | 9,122 | 1,794 | |||||||||
|
|
|
|
|
|
|
|||||||
| Gross margin crop |
97,198 | 101,633 | (4,435 | ) | ||||||||
| Gross margin non-crop |
14,704 | 12,863 | 1,841 | |||||||||
|
|
|
|
|
|
|
|||||||
| $ | 111,902 | $ | 114,496 | $ | (2,594 | ) | ||||||
|
|
|
|
|
|
|
|||||||
| Gross margin crop |
38 | % | 38 | % | ||||||||
| Gross margin non-crop |
46 | % | 42 | % | ||||||||
| Total gross margin |
39 | % | 38 | % | ||||||||
| Net sales: |
||||||||||||
| U.S |
212,087 | 224,928 | (12,841 | ) | ||||||||
| International |
77,295 | 73,706 | 3,589 | |||||||||
|
|
|
|
|
|
|
|||||||
| $ | 289,382 | $ | 298,634 | $ | (9,252 | ) | ||||||
|
|
|
|
|
|
|
|||||||
Net sales in 2015 declined by approximately 3%, as compared to the prior year. This is largely attributable to lower sales of our cotton insecticide caused by fewer planted acres in several key selling geographies and lighter foliar pest pressure. We experienced another year of solid performance from our soil fumigant products, which are used in the potato and various vegetable/fruit markets. Sales also benefited from the introduction of several new High Concentration (HC) soil insecticides, and from increased international sales of our insecticides Mocap® and Nemacur® along with first year sales of our recently acquired bromacil herbicide products.
Our international business continued to perform well during the twelve months ended December 31, 2015 with net sales of $77,295 which was a 5% improvement over the prior year. Sales benefited from our April, 2015 acquisition of two product lines – European Nemacur purchased from Adama and the Hyvar/Krovar (bromacil) products purchased from DuPont. In 2015, the Company recorded stronger sales in Mexico and the Asian market, somewhat lower sales in Europe and Canada, and relatively flat sales in other geographic regions.
In the Midwest corn market, distributors and retailers continued to work down inventories of many crop protection products and growers remained cautious regarding input purchases due to the low corn commodity price. During the year, we have seen excess inventories decline significantly and corn commodity price stabilize, both of which should provide a basis for more normal buying patterns to resume. Despite conservative procurement described above and continued reduced insect pressure as a result of two years of harsh winter weather, the Company’s 2015 sales of insecticide and herbicide products for corn remained essentially flat with the prior year.
18
Table of Contents
AMERICAN VANGUARD CORPORATION
AND SUBSIDIARIES
(Dollars in thousands, except per share data)
The Company’s total net sales for the year ended December 31, 2015 were down 3% to $289,382, as compared to $298,634 for the year ended December 31, 2014. Net sales of our crop business in 2015 were $258,090, which constitutes a decrease of nearly 3% as compared to net sales of $267,710 for that business in 2014. Net sales of our non-crop products in 2015 were $31,292, which is an increase of approximately 1% as compared to $30,924 in 2014. A more detailed discussion of product groups and products having a material effect on net sales for each of the crop and non-crop businesses appears below.
In our Crop business, net sales of insecticides in 2015 ended at $117,180, which was a 14% decline as compared to $135,705 in 2014. For the same period, annual net sales of our granular soil insecticides were down 4% below 2014, primarily driven by reduced equipment sales, while sales of our corn soil insecticides remained relatively flat. We had increased year-over-year performance from our Nemacur and Mocap products in international markets offset by a decline in domestic Thimet® sales due to seasonally delayed purchasing which are likely to shift to later in the 2015-2016 season. Among our non-granular insecticide products for crop applications, net sales of our cotton foliar insecticide Bidrin® were down due to fewer planted acres in several prime/high usage areas of the Southeast region and lighter pest pressure.
Within the product group of herbicides/soil fumigants/fungicides, our crop net sales in 2015 were up 10% to $111,897 as compared to $101,785 in 2014. Our fumigant product line continued to perform well. Midwest restocking demand for our post-emergent corn herbicide Impact resulted in increased sales and the addition of newly acquired bromacil products Hyvar® and Krovar® contributed to an overall increase in our herbicide category. Within this group, fungicides were essentially flat with the prior year.
Within our other products group (which includes plant growth regulators, molluscicides and third party manufacturing activity), we experienced a decrease of approximately 4% in net sales, ending at $29,013 in 2015, as compared to $30,220 in 2014. The major drivers of this performance were flat year-over-year sales of our cotton defoliant Folex®; a decline in our specialty fruit product NAA® and toll manufacturing; offset by an increase in sales of our potato sprout inhibitor SmartBlock® and our molluscicide Metaldehyde.
Within our non-crop business, 2015 net sales increased by 1% to $31,292 as compared to $30,924 recorded in 2014. Naled sales (our Dibrom® brand mosquito adulticide) rose 5% in 2015, and we saw slight increases in several of our products that have faced generic competition. Offsetting those gains, we posted either flat or lower year-over-year sales in our consumer bug/insect sprays, pest strips and pharmaceutical product lines.
Our cost of sales for 2015 was $177,480 or 61% of net sales. This compared to $184,138 or 62% of net sales for 2014. The decrease in cost of sales as a percentage of net sales in 2015 was driven primarily as a result of reduced factory costs, which reduced cost of sales by approximately 1.8%. This was partially offset by inflation in raw material prices, which on average amounted to an increase in cost of sales approximately ¾ of one percent. Together these factors resulted in the reduction in cost of sales by 1%.
Gross profit for 2015 declined by $2,594 to end at $111,902 for the year ended December 31, 2015, as compared to $114,496 for the prior year. Gross margin percentage for 2015 improved by 1% and ended at 39%, as compared to 38% for 2014. The improvement was driven by improved factory cost recovery.
19
Table of Contents
AMERICAN VANGUARD CORPORATION
AND SUBSIDIARIES
(Dollars in thousands, except per share data)
Operating expenses in 2015 decreased by $7,408 to $100,378 or 34% of sales as compared to $107,786 or 36% in 2014. The differences in operating expenses by department are as follows:
| 2015 | 2014 | Change | ||||||||||
| Selling |
$ | 27,360 | $ | 31,593 | $ | (4,233 | ) | |||||
| General and administrative |
28,516 | 27,057 | 1,459 | |||||||||
| Research, product development and regulatory |
18,808 | 21,206 | (2,398 | ) | ||||||||
| Freight, delivery and warehousing |
25,694 | 27,930 | (2,236 | ) | ||||||||
|
|
|
|
|
|
|
|||||||
| $ | 100,378 | $ | 107,786 | $ | (7,408 | ) | ||||||
|
|
|
|
|
|
|
|||||||
| • | Selling expenses decreased by $4,233 to end at $27,360 for the year ended December 31, 2015, as compared to $31,593 in 2014. The main drivers for the decrease are cost reduction actions in our advertising and marketing efforts and reductions in costs associated with both international and domestic field sales operations. |
| • | General and administrative expenses increased by $1,459 to $28,516 for the year ended December 31, 2015, as compared to $27,057 in 2014. The main drivers for the increase are primarily due to increase in legal expense, amortization expense from the product line acquisitions completed during the early part of 2015 and incentive compensation costs. |
| • | Research, product development and regulatory expenses decreased by $2,398 to $18,808 for the year ended December 31, 2015, as compared to $21,206 in 2014. This was driven by timing of product defense studies and from the benefits of the consolidation of two industry wide task force groups. |
| • | Freight, delivery and warehousing costs for the year ended December 31, 2015 decreased by $2,236 to $25,694, as compared to $27,930 in 2014. As a percentage of sales, freight costs reduced slightly year over year, at 8.9% in 2015, as compared to 9.3% in 2014. |
Net interest expense was $2,562 in 2015, as compared to $3,066 in 2014. Interest costs are summarized in the following table:
| 2015 | 2014 | |||||||||||||||||||||||
| Average Indebtedness and Interest expense |
Average Debt | Interest Expense |
Interest Rate | Average Debt | Interest Expense |
Interest Rate | ||||||||||||||||||
| Working capital revolver |
94,765 | 2,027 | 2.1 | % | 94,899 | 2,385 | 2.5 | % | ||||||||||||||||
| Notes payable |
6,809 | 266 | 3.9 | % | 161 | 5 | 3.1 | % | ||||||||||||||||
| Amortization of deferred loan fees |
— | 291 | — | — | 328 | — | ||||||||||||||||||
| Amortization of other deferred liabilities |
— | 135 | — | — | 322 | — | ||||||||||||||||||
| Other interest expense |
— | 53 | — | — | 113 | — | ||||||||||||||||||
|
|
|
|
|
|
|
|
|
|
|
|
|
|||||||||||||
| Subtotal |
$ | 101,574 | $ | 2,772 | 2.7 | % | $ | 95,060 | $ | 3,153 | 3.3 | % | ||||||||||||
| Capitalized interest |
— | (210 | ) | — | — | (87 | ) | — | ||||||||||||||||
|
|
|
|
|
|
|
|
|
|
|
|
|
|||||||||||||
| Total |
$ | 101,574 | $ | 2,562 | 2.5 | % | $ | 95,060 | $ | 3,066 | 3.2 | % | ||||||||||||
|
|
|
|
|
|
|
|
|
|
|
|
|
|||||||||||||
The Company’s average overall debt for the year ended December 31, 2015 was $101,574 as compared to $95,060 for the comparable period of the previous year. As can be seen from the above table, on a gross basis, our effective interest rate decreased to 2.1%, as compared to 2.5% in 2014, due to lower interest rates on our new senior credit facility agreement and the absence of a fixed rate swap. After adjustments related to capitalized interest and including expenses related to the amortization of deferred liabilities, the overall effective rate was 2.5% for 2015 as compared to 3.2% in 2014. Reduction in deferred liabilities related to product line acquisitions contributed to the reduction in our effective interest rate in 2015. The table below shows the amount of outstanding debt and the related notional amount on the interest rate swap contract at each of the balance sheet dates:
20
Table of Contents
AMERICAN VANGUARD CORPORATION
AND SUBSIDIARIES
(Dollars in thousands, except per share data)
| Outstanding Variable Rate Debt |
Notional Amount on Interest Rate Swap |
Percentage of Notional Amount to Debt |
||||||||||
| At December 31, 2013 |
51,550 | 36,750 | 71.3 | % | ||||||||
| At December 31, 2014 |
99,400 | — | — | |||||||||
| At December 31, 2015 |
69,000 | — | — | |||||||||
Income tax expense for 2015 was $2,009, as compared to a benefit of $451 for 2014. The effective tax rate for 2015 was 22.4%, whereas for 2014 the benefit was 12.4%. The increase in the effective tax rate was driven by additional income generated in the U.S. as compared to the previous year. The ratio of domestic to foreign income has a material impact on the Company’s overall effective tax rate.
For the year ended December 31, 2015, the Company recorded losses on its equity investment of $629 and a loss on dilution of the Company’s stockholding in the amount of $7. This resulted in a total loss for 2015 of $636. For the same period of 2014, the Company recorded losses on its equity investment of $983 and offset the losses with gains on dilution in the amount of $954. This resulted in a net loss for 2014 of $29. In 2015 we adjusted our net income attributable to American Vanguard by $274 for the non-controlling interest’s share of the net losses of our majority-owned subsidiary, Envance, as compared to $775 in 2014.
Net income attributable to American Vanguard ended at $6,591 or $0.23 per diluted share in 2015 as compared to $4,841 or $.17 per diluted share in 2014.
Liquidity and Capital Resources
The Company generated $78,568 of cash from operating activities provided during the year ended December 31, 2015, as compared to using $34,095 in the prior year.
Net income of $6,317, plus non-cash depreciation, amortization of intangibles, other assets and discounted future liabilities generated a total of $28,206. Stock based compensation of $3,858, loss from equity method investment of $629, plus a loss on dilution of $7, and change in value of deferred income taxes of $27, provided a net cash inflow of $32,727, as compared to $33,034 for the same period of 2014.
As of December 31, 2015, our working capital has reduced to $160,549, as compared to $205,804 as of December 31, 2014. This decrease was mainly driven by decreased inventory levels and to a lesser extent reduced, accounts receivables and an increase in deferred revenues. These improvements were somewhat offset by reduced accounts payable and accrued program costs.
At December 31, 2015, our receivables (net of allowances) were $75,389 as compared to $88,423 at the end of the prior year. This is primarily a result of a number of customers making early payments during the last quarter of 2015. As a result of early payments, deferred revenue as of December 31, 2015 was $8,888, as compared to $898 at December 31, 2014.
Inventories ended the year at $136,477, as compared to $165,631 at December 31, 2014. The decrease in inventory during the year has been achieved by continuing to hold down manufacturing output in our factories, as channel inventory has been worked through the distribution channel to the growers. During 2015, channel inventories of the Company’s products levels have declined to a level which approaches more normal levels. It should also be noted that the Company purchases and holds raw material, intermediate or finished goods inventory from time to time based on a single annual purchase from a single source or supplier, potentially resulting in peaks in the carrying value of inventory. Furthermore, in order to achieve efficient manufacturing runs, the Company may manufacture a particular product only one time a year and then carry high levels of that inventory for a period of time.
Timing of payments made on prepaid expenses and other assets caused a decrease of $2,082 during the year. As we held down manufacturing activity, accounts payable decreased by $5,068. Furthermore, the Company reduced its income tax receivable by $4,872 with the receipt of tax refund and overpayments following the filing of our 2014 federal and state tax returns and 2014 carry back claim to 2012.
Our program accruals have decreased by $8,175 to end at $44,371 at December 31, 2015, as compared to $52,546 at December 31, 2014, reflecting primarily the mix of business that has driven the financial performance for 2015. The
21
Table of Contents
AMERICAN VANGUARD CORPORATION
AND SUBSIDIARIES
(Dollars in thousands, except per share data)
Company accrues programs in line with the growing season upon which specific products are targeted. Typically crop products have a growing season that ends on September 30th of each year. During the 2015 year, the Company made accruals for programs in the amount of $61,514 and made payments in the amount of $69,689. During the prior year, the Company made accruals in the amount of $59,671 and made payments in the amount of $60,755.
The Company used $43,691 in investing activities in the year ended December 31, 2015 as compared to $7,680 in the same period of 2014. The Company spent $36,667 on product lines acquisitions during the year, $6,899 on fixed assets primarily focused on continuing to invest in manufacturing infrastructure, and $125 on investments.
Our financing activities used a net cash of $33,811 in 2015, as compared to providing a net cash of $41,156 in 2014. The main driver for the change is the pay down on the Company’s senior secured credit facility. The Company further paid $1,141 in dividends, payment of other notes payable and of long-term liabilities primarily associated with liabilities under deferred purchase agreements on product acquisitions in the amount of $1,543. The Company received $317 from the sales of common stock under its ESPP plan (including associated tax benefits) and the tax effect from the share-based compensation of $924, as compared to receiving $1,666 from the sales of common stock under its ESPP plan and $300 from the tax effect from the share based compensation for 2014. The Company’s net borrowings under its senior secured credit facility decreased by $30,400 to end at $69,000 as of December 31, 2015, as compared to $99,400 at the end of prior year.
The Company has various loans in place that together constitute the short-term and long-term loan balances shown in the consolidated balance sheets as at December 31, 2015 and December 31, 2014. These are summarized in the following table:
| Indebtedness |
At December 31, 2015 | At December 31, 2014 | ||||||||||||||||||||||
| $000’s |
Long-term | Short-term | Total | Long-term | Short-term | Total | ||||||||||||||||||
| Revolving line of credit |
$ | 69,000 | — | $ | 69,000 | $ | 99,400 | — | $ | 99,400 | ||||||||||||||
| Deferred loan fees |
(679 | ) | — | (679 | ) | (850 | ) | — | (850 | ) | ||||||||||||||
| Notes payable |
— | 55 | 55 | 55 | 71 | 126 | ||||||||||||||||||
|
|
|
|
|
|
|
|
|
|
|
|
|
|||||||||||||
| Total indebtedness |
$ | 68,321 | $ | 55 | $ | 68,376 | $ | 98,605 | $ | 71 | $ | 98,676 | ||||||||||||
|
|
|
|
|
|
|
|
|
|
|
|
|
|||||||||||||
On June 17, 2013, AMVAC, the Company’s principal operating subsidiary, as borrower, and affiliates (including the Company), as guarantors and/or borrowers, entered into a Second Amended and Restated Credit Agreement (the “New Credit Agreement”) with a group of commercial lenders led by Bank of the West (AMVAC’s primary bank) as agent, swing line lender and L/C issuer. The new facility also includes both AMVAC C.V. and AMVAC Netherlands BV (both Dutch subsidiaries) as borrowers. The New Credit Agreement supersedes the Amended and Restated Credit Agreement (“First Amendment”) dated as of January 10, 2011. The New Credit Agreement is a senior secured lending facility with a five year term and consists of a revolving line of credit up to $200 million and an accordion feature for up to $100 million. In connection with AMVAC’s entering into the New Credit Agreement, all outstanding indebtedness under the First Amendment was rolled over into the New Credit Agreement, including the conversion of term loans into revolving debt.
On July 18, 2014, AMVAC, as borrower, and affiliates (including the Company), as guarantors and/or borrowers, entered into a First Amendment to Second Amended and Restated Credit Agreement (the “First Amendment”) with a group of commercial lenders led by Bank of the West (AMVAC’s primary bank) as agent, swing line lender and L/C issuer. Under the First Amendment, the Consolidated Funded Debt Ratio was increased for the third and fourth quarters of 2014 and the first quarter of 2015, and, further, borrowers were permitted to pay cash dividends to stockholders during the first and second quarters of 2015 notwithstanding rolling twelve-month net income levels. Under the New Credit Agreement, the Company has three key covenants (with which it was in compliance throughout the year). The covenants are as follows: (1) the Company must maintain its borrowings below a certain consolidated funded debt ratio (taking into account the Company’s twelve month trailing EBITDA), (2) the Company has a limitation on its annual spending on the acquisition of fixed asset capital additions, and (3) the Company must maintain a certain consolidated fixed charge coverage ratio.
As of April 14, 2015, AMVAC, registrant’s principal operating subsidiary, as borrower, and affiliates (including registrant), as guarantors and/or borrowers, entered into a Second Amendment to the Second Amended and Restated Credit Agreement (the “Second Amendment”) with a group of commercial lenders led by Bank of the West (AMVAC’s primary
22
Table of Contents
AMERICAN VANGUARD CORPORATION
AND SUBSIDIARIES
(Dollars in thousands, except per share data)
bank) as agent, swing line lender and L/C issuer. Under the Second Amendment, the Consolidated Funded Debt Ratio was increased for the second, third and fourth quarters of 2015 (to 3.5-to-1 from 3.25-to-1) and a fixed charge covenant, requiring, in effect, that the ratio of consolidated current assets to consolidated current liabilities exceed 1.2-to-1 for the duration of the term of the credit facility, was added. The Company is in compliance with all key covenants within the New Credit Agreement as amended at December 31, 2015.
During 2014, the Company had in place one interest rate swap contract that terminated on December 31, 2014. While in place, the interest rate swap contract was accounted for under ASC 815 as a cash flow hedge. The effective portion of the gains or losses on the interest rate swap are reported as a component of other comprehensive income and reclassified into earnings in the same period or periods during which the hedged transactions affect earnings. As a result of the termination of the swap contract, no balances remain in other comprehensive income at December 31, 2014. Up until the termination of the swap contract, the Company used a pay fixed, receive 1Month LIBOR (London Interbank Offered Rate) interest rate swap to manage the interest expense generated by variable rate debt. During 2014, the use of the interest rate swap resulted in a fixed interest rate of 1.73% for the portion of variable rate debt that was covered by the swap contract. This interest rate swap contract was put in place on March 30, 2011 and ended on December 31, 2014.
Contractual Obligations and Off-Balance Sheet Arrangements
We believe that the combination of our cash flows from operations, current cash on hand and the availability under the Company’s credit facility will be sufficient to meet our working capital and capital expenditure requirements and will provide us with adequate liquidity to meet our anticipated operating needs for at least the next 12 months. Although operating activities are expected to provide cash, to the extent of growth in the future, our operating and investing activities will use cash and, consequently, this growth may require us to access some or all of the availability under the credit facility. It is also possible that additional sources of finance may be necessary to support additional growth.
The following summarizes our contractual obligations at December 31, 2015, and the effects such obligations are expected to have on cash flows in future periods:
| Payments Due by Period | ||||||||||||||||||||
| Total | Less than 1 Year |
1—3 Years |
4—5 Years |
After 5 Years |
||||||||||||||||
| Long-term debt |
$ | 69,000 | $ | — | $ | 69,000 | $ | — | $ | — | ||||||||||
| Notes payable |
55 | 55 | — | — | — | |||||||||||||||
|
|
|
|
|
|
|
|
|
|
|
|||||||||||
| Sub-total long-term debt |
69,055 | 55 | 69,000 | — | — | |||||||||||||||
| Estimated interest liability(1) |
4,298 | 1,749 | 2,549 | — | — | |||||||||||||||
| Accrued royalty obligations |
1,294 | 427 | 440 | 222 | 205 | |||||||||||||||
| Deferred earn outs on product acquisitions |
480 | 441 | 39 | — | — | |||||||||||||||
| Employment agreements |
2,321 | 1,210 | 1,111 | — | — | |||||||||||||||
| Operating leases—rental properties |
5,608 | 812 | 1,720 | 1,778 | 1,298 | |||||||||||||||
| Operating leases—vehicles |
970 | 521 | 421 | 28 | — | |||||||||||||||
|
|
|
|
|
|
|
|
|
|
|
|||||||||||
| $ | 84,026 | $ | 5,215 | $ | 75,280 | $ | 2,028 | $ | 1,503 | |||||||||||
|
|
|
|
|
|
|
|
|
|
|
|||||||||||
| (1) | Estimated interest liability has been calculated using the effective rate for each category of debt over the remaining term of the debt and taking into account scheduled repayments. The revolving line has been assumed to be constant (i.e. $69,000) throughout the remaining term. All of our debt is linked to LIBOR rates. |
There were no off-balance sheet arrangements as of December 31, 2015.
Under the terms of the credit facility, all debt outstanding is due when the agreement expires on June 17, 2018.
In addition to the above contractual obligations, $2,007 of unrecognized tax benefits and $335 of accrued penalties and interest have been recorded as long term liabilities as of December 31, 2015. We are uncertain as to if or when such amounts may be settled or any tax benefits may be realized.
23
Table of Contents
AMERICAN VANGUARD CORPORATION
AND SUBSIDIARIES
(Dollars in thousands, except per share data)
Results of Operations
2014 Compared with 2013:
| 2014 | 2013 | Change | ||||||||||
| Net sales: |
||||||||||||
| Insecticides |
$ | 135,705 | $ | 193,623 | $ | (57,918 | ) | |||||
| Herbicides/soil fumigants/fungicides |
101,785 | 121,042 | (19,257 | ) | ||||||||
| Other, including plant growth regulators |
30,220 | 31,849 | (1,629 | ) | ||||||||
|
|
|
|
|
|
|
|||||||
| Total crop |
267,710 | 346,514 | (78,804 | ) | ||||||||
| Non-crop |
30,924 | 34,507 | (3,583 | ) | ||||||||
|
|
|
|
|
|
|
|||||||
| $ | 298,634 | $ | 381,021 | $ | (82,387 | ) | ||||||
|
|
|
|
|
|
|
|||||||
| Cost of goods sold: |
||||||||||||
| Insecticides |
$ | 85,124 | $ | 109,269 | $ | (24,145 | ) | |||||
| Herbicides/soil fumigants/fungicides |
59,855 | 65,613 | (5,758 | ) | ||||||||
| Other, including plant growth regulators |
21,098 | 16,357 | 4,741 | |||||||||
|
|
|
|
|
|
|
|||||||
| Total crop |
166,077 | 191,239 | (25,162 | ) | ||||||||
| Non-crop |
18,061 | 18,435 | (374 | ) | ||||||||
|
|
|
|
|
|
|
|||||||
| $ | 184,138 | $ | 209,674 | $ | (25,536 | ) | ||||||
|
|
|
|
|
|
|
|||||||
| Gross margin: |
||||||||||||
| Insecticides |
$ | 50,581 | $ | 84,354 | $ | (33,773 | ) | |||||
| Herbicides/soil fumigants/fungicides |
41,930 | 55,429 | (13,499 | ) | ||||||||
| Other, including plant growth regulators |
9,122 | 15,492 | (6,370 | ) | ||||||||
|
|
|
|
|
|
|
|||||||
| Gross margin crop |
101,633 | 155,275 | (53,642 | ) | ||||||||
| Gross margin non-crop |
12,863 | 16,072 | (3,209 | ) | ||||||||
|
|
|
|
|
|
|
|||||||
| $ | 114,496 | $ | 171,347 | $ | (56,851 | ) | ||||||
|
|
|
|
|
|
|
|||||||
| Gross margin crop |
38 | % | 45 | % | ||||||||
| Gross margin non-crop |
42 | % | 47 | % | ||||||||
| Total gross margin |
38 | % | 45 | % | ||||||||
Net sales in 2014 dropped by 22% over the prior year, primarily due to the impact of carryover corn products inventory in the Midwest distribution channel. This condition arose from vigorous procurement of these products in 2012 and early 2013, followed by adverse weather conditions that reduced usage during the 2013 planting season. Throughout 2014, many distributors, retailers and corn growers were still drawing down their inventories of the Company’s corn products and reduced their orders materially. With that reduced purchasing from the Company, we have seen the level of excess inventory of these products decline significantly. The combined sales of our corn herbicide and our granular soil insecticides declined by more than 55% in 2014, from the prior year, and in fact this decline in our corn product sales constituted virtually all of the overall revenue drop in 2014.
Market conditions in our non-corn products were balanced in 2014, resulting in nearly neutral results for those crop sectors. While cotton planting increased approximately one million acres above the prior year, lighter foliar pest pressure and inclement late season weather (hail in Arkansas and frost in Texas) resulted in a relatively flat performance for our cotton products. Modest gains by our products for the potato market were offset by slightly weaker sales in some of our specialty applications for vegetable/fruit markets and pharmaceuticals.
Overall financial performance for the year ended December 31, 2014 was significantly reduced as compared to the same period in 2013, with both net sales and net income lower. The Company’s total net sales for the period were down nearly 22% to $298,634, as compared to $381,021 for the year ended December 31, 2013. Net sales of our crop business in 2014 were $267,710, which constitutes a decrease of nearly 23% as compared to net sales of $346,514 for that business in 2013. Net sales of our non-crop products in 2014 were $30,924, which is a reduction of approximately 10% as compared to $34,507 in 2013. A more detailed discussion of product groups and products having a material effect on net sales for each of the crop and non-crop businesses appears below.
24
Table of Contents
AMERICAN VANGUARD CORPORATION
AND SUBSIDIARIES
(Dollars in thousands, except per share data)
In our Crop business, net sales of insecticides in 2014 ended at $135,705, which was a 30% decline as compared to $193,623 in 2013. Within the Crop business, annual net sales of our granular soil insecticides were $106,478, down nearly 37% below 2013, driven by reduced restocking orders for our primary corn soil insecticides – Aztec®, Smartchoice®, Force and Counter®. These declines were slightly offset by year-over-year increases in Thimet, Nemacur, and Mocap, much of that coming from our international business. Among our non-granular insecticide products for crop applications, net sales of Bidrin, bifenthrin, permethrin and acephate remained relatively flat with the prior year.
Within the product group of herbicides/soil fumigants/fungicides, our crop net sales in 2014 were down 16% to $101,785 vs. $121,042 in 2013. Within this group, we had mixed results. The positive drivers were our fumigant and fungicide products posting a combined gain of approximately 3% with stronger potato usage contributing to both categories. Conversely, weak Midwest restocking demand for our post-emergent corn herbicide Impact resulted in a 39% decline in our herbicide category. Within our other products group (which includes plant growth regulators, molluscicides and third party manufacturing activity), we experienced a decrease of 5% in net sales, with net sales of $30,220 in 2014 vs. $31,849 in 2013. The major drivers of this performance were modest declines in our cotton defoliant Folex, our specialty fruit product NAA, and our molluscicide Metaldehyde.
Within our non-crop business, 2014 net sales were down by 10% to $30,924 vs. $34,507 recorded in 2013. Naled® sales (our Dibrom brand mosquito adulticide) were down nearly 14% due to light Gulf Coast storm activity offset by a 31% increase in our pest strips business. Additionally, net sales of our PCNB fungicide for turf uses were flat. Finally, we experienced a year-over-year decline in Pharmaceutical sales of approximately 14%, primarily due to continuing generic competition from Chinese suppliers.
Our cost of sales for 2014 was $184,138 or 62% of net sales. This compared to $209,674 or 55% of net sales for 2013. The increase in cost of sales as a percentage of net sales in 2014 arose primarily as a result of increased under recovery of factory costs, which increased cost of sales from 55% in 2013, to 60% in 2014. In addition, raw material costs have remained relatively flat during 2014 while factory costs increased slightly. Overall, the inflation in cost of goods sold has amounted to approximately three quarters of one percent of sales. The balance of the increase in cost of goods as a percentage of sales is attributed to the specific mix of sales in 2014, as compared to 2013.
Gross profit for 2014 declined by $56,851 to end at $114,496 for the year ended December 31, 2014, as compared to $171,347 for the prior year. Gross margin percentage for 2014 declined by 7% and ended at 38%, as compared to 45% for 2013. The majority of the reduction is driven by the 5% impact of increased factory cost under recovery mentioned above. In addition, a further reduction of 2% in gross margin percentage was caused by a combination of changes in product volume and mix, and increases in factory costs due to inflation.
Operating expenses in 2014 decreased by $7,826 to $107,786 or 36% of sales as compared to $115,612 or 30% in 2013. The differences in operating expenses by department are as follows:
| 2014 | 2013 | Change | ||||||||||
| Selling |
$ | 31,593 | $ | 32,929 | $ | (1,336 | ) | |||||
| General and administrative |
27,057 | 33,536 | (6,479 | ) | ||||||||
| Research, product development and regulatory |
21,206 | 21,644 | (438 | ) | ||||||||
| Freight, delivery and warehousing |
27,930 | 27,503 | 427 | |||||||||
|
|
|
|
|
|
|
|||||||
| $ | 107,786 | $ | 115,612 | $ | (7,826 | ) | ||||||
|
|
|
|
|
|
|
|||||||
| • | Selling expenses decreased by $1,336 to end at $31,593 for the year ended December 31, 2014, as compared to $32,929 in 2013. The main drivers for the decrease are cost reduction actions across a range of expenses including reduced travel and administration of our foreign subsidiaries. |
| • | General and administrative expenses decreased by $6,479 to $27,057 for the year ended December 31, 2014, as compared to $33,536 in 2013. The main drivers for the reduced expenses are lower incentive compensation, and lower legal costs. These cost reductions were partly offset by the expenses associated with a reduction in personnel during the final quarter of the year. |
25
Table of Contents
AMERICAN VANGUARD CORPORATION
AND SUBSIDIARIES
(Dollars in thousands, except per share data)
| • | Research, product development costs and regulatory expenses decreased by $438 to $21,206 for the year ended December 31, 2014, as compared to $21,644 in 2013. This change is primarily driven by a decrease in the use of outside legal services for registration review and other registration expenses. |
| • | Freight, delivery and warehousing costs for the year ended December 31, 2014 increased by $427 to $27,930, as compared to $27,503 in 2013. As a percentage of sales, freight costs increased to 9.3% of net sales during 2014, as compared to 7.2% of net sales during 2013. This is primarily due to high volume of our heavier products such as fumigants sold domestically, continued growth of our international business and storage costs for higher-than-normal levels of inventory. |
Net interest expense was $3,066 in 2014, as compared to $1,901 in 2013. Interest costs are summarized in the following table:
| 2014 | 2013 | |||||||||||||||||||||||
| Average Indebtedness and Interest expense |
Average Debt | Interest Expense |
Interest Rate | Average Debt | Interest Expense |
Interest Rate | ||||||||||||||||||
| Term loan |
$ | — | $ | — | — | $ | 23,318 | $ | 880 | 3.8 | % | |||||||||||||
| Working capital revolver |
94,899 | 2,385 | 2.5 | % | 29,284 | 899 | 3.1 | % | ||||||||||||||||
|
|
|
|
|
|
|
|
|
|
|
|
|
|||||||||||||
| Average |
94,899 | 2,385 | 2.5 | % | 52,602 | 1,779 | 3.4 | % | ||||||||||||||||
|
|
|
|
|
|
|
|
|
|
|
|
|
|||||||||||||
| Notes payable |
161 | 5 | 3.1 | % | 270 | 8 | 3.0 | % | ||||||||||||||||
|
|
|
|
|
|
|
|
|
|
|
|
|
|||||||||||||
| Amortization of deferred loan fees |
— | 328 | — | — | 180 | — | ||||||||||||||||||
| Amortization of other deferred liabilities |
— | 322 | — | — | 167 | — | ||||||||||||||||||
| Other interest expense |
— | 113 | — | — | 41 | — | ||||||||||||||||||
|
|
|
|
|
|
|
|
|
|
|
|
|
|||||||||||||
| Subtotal |
$ | 95,060 | $ | 3,153 | 3.3 | % | $ | 52,872 | $ | 2,175 | 4.1 | % | ||||||||||||
| Capitalized interest |
— | (87 | ) | — | — | (274 | ) | — | ||||||||||||||||
|
|
|
|
|
|
|
|
|
|
|
|
|
|||||||||||||
| Total |
$ | 95,060 | $ | 3,066 | 3.2 | % | $ | 52,872 | $ | 1,901 | 3.6 | % | ||||||||||||
|
|
|
|
|
|
|
|
|
|
|
|
|
|||||||||||||
The Company’s average overall debt for the year ended December 31, 2014 was $95,060 as compared to $52,872 for the comparable period of the previous year. As can be seen from the above table, on a gross basis, our effective interest rate decreased to 2.5%, as compared to 3.4% in 2013, due to lower interest rates on our new senior credit facility agreement. After deductions of capitalized interest and including expenses related to the amortization of deferred liabilities, our effective rate was 3.2% for 2014 as compared to 3.6% in 2013. Lower amortization of discounting on deferred liabilities related to product line acquisitions contributed to the reduction in our effective interest rate in 2014. The table below shows the amount of outstanding debt and the related notional amount on the interest rate swap contract at each of the balance sheet dates:
| Outstanding Variable Rate Debt |
Notional Amount on Interest Rate Swap |
Percentage of Notional Amount to Debt |
||||||||||
| At December 31, 2012 |
$ | 46,000 | $ | 44,250 | 96.2 | % | ||||||
| At December 31, 2013 |
51,550 | 36,750 | 71.3 | % | ||||||||
| At December 31, 2014 |
99,400 | — | — | |||||||||
Income tax benefit for 2014 was $451, as compared to an expense of $18,916 for 2013. The effective tax rate for 2013 was 35%, whereas for 2014 the benefit was 12.4%. The lower effective tax rate was driven by the increase in income in foreign tax jurisdictions where tax rates are lower than the U.S. statutory rates and lower income generated in the U.S. Further, there was a benefit of $328 related to the release of the reserve for a discrete item. The release of the income tax reserve resulted from the lapse of a statute for a tax year in which the Company is no longer subject to examination. The decrease in the tax rate is partially offset by the reduction in the domestic production deduction resulting from carryback to 2012 of certain tax attributes.
26
Table of Contents
AMERICAN VANGUARD CORPORATION
AND SUBSIDIARIES
(Dollars in thousands, except per share data)
For the year ended December 31, 2014, we included losses on equity investment of $983, as compared to $986 in the same period of 2013. This loss was offset by a gain in dilution of the Company’s shareholding in the amount of $954 at December 31, 2014. No gain was recognized in 2013. In 2014 we adjusted our net income attributable to American Vanguard by $775 for the non-controlling interest’s share of the net losses of our majority-owned subsidiary, Envance, as compared to $517 in 2013. In 2012, the adjustment to our net income attributable to American Vanguard for such losses was $41.
Net income attributable to American Vanguard ended at $4,841 or $0.17 per diluted share in 2014 as compared to $34,449 or $1.19 per diluted share in 2013.
Recently Issued Accounting Guidance
In February 2016, The Financial Accounting Standards Board (“FASB”) issued Accounting Standards Update (“ASU”) 2015-17, Leases. The new standard establishes a right-of-use (ROU) model that requires a lessee to record a ROU asset and a lease liability on the balance sheet for all leases with terms longer than 12 months. Leases will be classified as either finance or operating, with classification affecting the pattern of expense recognition in the income statement. The new standard is effective for fiscal years beginning after December 15, 2018, including interim periods within those fiscal years. A modified retrospective transition approach is required for lessees for capital and operating leases existing at, or entered into after, the beginning of the earliest comparative period presented in the financial statements, with certain practical expedients available. The Company is currently evaluating the impact of our pending adoption of the new standard on our consolidated financial statements.
In November 2015, FASB issued ASU 2015-17, Income Taxes (Topic 740). Current GAAP requires an entity to separate deferred income tax liabilities and assets into current and noncurrent amounts in a classified statement of financial position. To simplify the presentation of deferred income taxes, the amendments in this ASU require that deferred tax liabilities and assets be classified as noncurrent in a classified statement of financial position. The amendments in this ASU apply to all entities that present a classified statement of financial position. The new standard is effective for fiscal years beginning after December 15, 2016, including interim periods within those fiscal years with early adoption permitted. The Company will follow the guidance for fiscal year 2016.
In September 2015, FASB issued ASU 2015-16, Business Combination (Topic 805). Under a Business Combination, GAAP requires that during the measurement period, the acquirer retrospectively adjusts the provisional amounts recognized at the acquisition date with a corresponding adjustment to goodwill. Those adjustments are required when new information is obtained about facts and circumstances that existed as of the acquisition date that, if known, would have affected the measurement of the amounts initially recognized or would have resulted in the recognition of additional assets or liabilities. The acquirer also must revise comparative information for prior periods presented in financial statements as needed, including revising depreciation, amortization, or other income effects as a result of changes made to provisional amounts. The amendments in this ASU eliminate the requirement to retrospectively account for those adjustments. The new standard is effective for fiscal years beginning after December 15, 2015, including interim periods within those fiscal years. The Company will follow the guidance in this ASU when applying Topic 805.
In July 2015, FASB issued ASU 2015-11, Inventory (Topic 330). Topic 330 currently requires an entity to measure inventory at the lower of cost or market, where market could be replacement cost, net realizable value, or net realizable value less an approximately normal profit margin. This ASU limits the scope to inventory that is measured using first-in, first-out (FIFO) or average cost and requires inventory be measured at the lower of costs or net realizable value. The new standard is effective for fiscal years beginning after December 15, 2016, including interim periods within those fiscal years. The Company will evaluate the impact of this adoption for fiscal year 2017.
In April 2015, FASB issued ASU 2015-03, Interest – Imputation of Interest (Subtopic 835-30): Simplifying the Presentation of Debt Issuance Costs. This ASU requires that debt issuance costs related to a recognized debt liability be presented in the balance sheet as a direct deduction from the carrying amount of that debt liability, consistent with debt discounts. The recognition and measurement guidance for debt issuance costs are not affected by the amendments in this ASU. ASU 2015-03 is effective for financials statement issued for fiscal years beginning after December 15, 2015, with early adoption permitted. The Company evaluated the impact and has elected an early adoption of this update in the quarter ended June 30, 2015. This change was applied retrospectively to fiscal year 2014 and was immaterial to the consolidated financial statements. In conjunction with this adoption, the Company has made an accounting policy election to present debt issuance costs related to revolving line of credit arrangements as a deduction from the related liability.
In August 2014, FASB issued ASU 2014-15, Presentation of Financial Statements – Going Concern (Subtopic 205-40): Disclosure of Uncertainties about an Entity’s Ability to Continue as a Going Concern. This ASU requires that management of an entity assesses whether there is substantial doubt about the ability of the entity to continue as a going concern and for making the appropriate disclosures. The assessment must be performed at each annual and interim reporting period, and there is substantial doubt about an entity’s ability to continue as a going concern if it is probable that the entity will be unable to meet its obligations as they become due within 12 months of the date of the financial statements are issued. In the assessment, management must consider the information available at the date of issuance of the financial statements, as well as mitigating factors and plans to alleviate the substantial doubt. ASU 2014-15 is effective for annual period ending after December 15, 2016 and interim periods thereafter. Early application is permitted. Upon adoption, the Company will follow the guidance in this ASU when assessing going concern.
27
Table of Contents
AMERICAN VANGUARD CORPORATION
AND SUBSIDIARIES
(Dollars in thousands, except per share data)
In June 2014, FASB issued ASU 2014-12, Compensation—Stock Compensation (Topic 718): Accounting for Share-Based Payments When the Terms of an Award Provide That a Performance Target Could Be Achieved after the Requisite Service Period, a consensus of the FASB Emerging Issues Task Force. ASU 2014-12 requires that a performance target that affects vesting of share-based payment awards and that could be achieved after the requisite service period be treated as a performance condition. Compensation cost should be recognized in the period in which it becomes probable that the performance target will be achieved and should represent the compensation cost attributable to the periods for which the requisite service has already been rendered. If the performance target becomes probable of being achieved before the end of the requisite service period, the remaining unrecognized compensation cost should be recognized prospectively over the remaining requisite service period. The total amount of compensation cost recognized during and after the requisite service period should reflect the number of awards that are expected to vest and should be adjusted to reflect those awards that ultimately vest. The requisite service period ends when the employee can cease rendering service and still be eligible to vest in the award if the performance target is achieved. ASU 2014-12 is effective for all entities for interim and annual periods beginning after December 15, 2015, with early adoption permitted. An entity may apply the amendments in ASU 2014-12 either (i) prospectively to all awards granted or modified after the effective date or (ii) retrospectively to all awards with performance targets that are outstanding as of the beginning of the earliest annual period presented in the financial statements and to all new or modified awards thereafter. The adoption of ASU 2014-12 is not expected to have a material impact on the Company’s consolidated financial condition or results of operations. The Company adopted this ASU for interim and annual periods of 2015.
In May 2014, the FASB issued ASU 2014-09, Revenue from Contracts with Customers. ASU 2014-09 outlines a new, single comprehensive model for entities to use in accounting for revenue arising from contracts with customers and supersedes most current revenue recognition guidance, including industry-specific guidance. This new revenue recognition model provides a five-step analysis in determining when and how revenue is recognized. The new model will require revenue recognition to depict the transfer of promised goods or services to customers in an amount that reflects the consideration a company expects to receive in exchange for those goods or services. The standard is effective for annual periods beginning after December 15, 2017, and interim periods therein, using either of the following transition methods: (i) a full retrospective approach reflecting the application of the standard in each prior reporting period with the option to elect certain practical expedients, or (ii) a retrospective approach with the cumulative effect of initially adopting ASU 2014-09 recognized at the date of adoption (which includes additional footnote disclosures). The Company is currently evaluating the impact of our pending adoption of ASU 2014-09 on our consolidated financial statements and has not yet determined the method by which we will adopt the standard in 2018 or its impact on our consolidated financial statements.
Foreign Exchange
Management does not believe that the fluctuation in the value of the dollar in relation to the currencies of its customers in the last three fiscal years has adversely affected the Company’s ability to sell products at agreed upon prices denominated in U.S. dollars. No assurance can be given, however, that adverse currency exchange rate fluctuations will not occur in the future. Should adverse currency exchange rate fluctuations occur in geographies where the Company sells/exports its products, management is not certain such fluctuations will or will not materially impact the Company’s operating results.
Inflation
Management continues to believe inflation has not had a significant impact on the Company’s operations during the past three years. The Company is working diligently with its critical raw material suppliers to control inflationary pressures, conducting contract negotiations with focus on two key market shifts: first, the low global price of oil and natural gas has arrested some suppliers’ ability to implement price increases to the Company, and second, the Company is examining our international suppliers’ currency gains versus the US dollar, and using this knowledge to forestall inflation in raw materials that are purchased in dollar terms. The Company recognizes there is long-term pressure on demand for raw materials in the developing world and is utilizing its expertise to minimize inflationary pressure.
CRITICAL ACCOUNTING POLICIES
Certain of the Company’s policies require the application of judgment by management in selecting the appropriate assumptions for calculating financial estimates. These judgments are based on historical experience, terms of existing contracts, commonly accepted industry practices and other assumptions that the Company believes are reasonable under the circumstances. These estimates and assumptions are reviewed periodically and the effects of revisions are reflected in the consolidated financial statements in the period that revisions are determined to be necessary. Actual results may differ from these estimates under different outcomes or conditions.
28
Table of Contents
AMERICAN VANGUARD CORPORATION
AND SUBSIDIARIES
(Dollars in thousands, except per share data)
The Company’s critical accounting policies and estimates include:
Revenue Recognition and Allowance for Doubtful Accounts—Revenue from sales are recognized at the time title and the risks of ownership pass. This is when the customer has made the fixed commitment to purchase the goods, the products are shipped per the customer’s instructions, the sales price is fixed and determinable, and collection is reasonably assured. The Company has in place procedures to ensure that revenue is recognized when earned. The procedures are subject to management’s review and from time to time certain sales are excluded until it is clear that the title has passed and there is no further recourse to the Company. From time to time, the Company may offer a program to eligible customers in good standing that provides extended payment terms on a portion of the sales on selected products. The Company analyzes these extended payment programs in connection with its revenue recognition policy to ensure all revenue recognition criteria are satisfied at the time of sale. Allowance for doubtful accounts is established based on estimates of losses related to customer receivable balances. Estimates are developed using either standard quantitative measures based on historical losses, adjusted for current economic conditions or by evaluating specific customer accounts for risk of loss.
Accrued Program Costs—In accordance with FASB’s Accounting Standards Codification (“ASC”) 605, the Company classifies certain payments to its customers as a reduction of sales revenues. The Company describes these payments as “Programs”. Programs are a critical part of doing business in the U.S. agricultural chemicals business market place. For accounting purposes, programs are recorded as a reduction in gross sales and include market pricing adjustments, volume take up or other key performance indicator driven payments made to distributors, retailers or growers at the end of a growing season. Each quarter management compares each sale transaction with program guidelines to determine what program liability has been incurred. Once this initial calculation is made for the specific quarter, sales and marketing management along with executive and financial management review the accumulated program balance and make assessments of whether or not customers are tracking in a manner that indicates that they will meet the requirements set out in the terms and conditions attached to each program. If management believes that customers are falling short of their annual goals then periodic adjustments will be made to the accumulated accrual to properly reflect the Company’s best estimate of the liability at the balance sheet date. The majority of adjustments are made at the end of the crop season, at which time customer performance can be fully assessed. Programs are paid out predominantly on an annual basis, usually in the final quarter of the financial year or the first quarter of the following year.
Inventories —The Company values its inventories at lower of cost or market. Cost is determined by the first-in, first-out (“FIFO”) method, including material, labor, factory overhead and subcontracting services. The Company writes down and makes adjustments to its inventory net realizable value following assessments of slow moving and obsolete inventory and other annual adjustments to ensure that our standard costs continue to closely reflect manufacturing cost. The Company recorded an inventory reserve allowance of $4,020 at December 31, 2015, as compared to $2,995 at December 31, 2014.
Long-lived Assets—Long-lived assets primarily consist of the costs of Smartbox and Lock and Load containers. The carrying value of long-lived assets is reviewed for impairment quarterly and/or whenever events or changes in circumstances indicate that the carrying value of such assets may not be recoverable. The Company evaluates recoverability of an asset group by comparing the carrying value to the future undiscounted cash flows that it expects to generate from the asset group. If the comparison indicates that the carrying value of an asset group is not recoverable, measurement of the impairment loss is based on the fair value of the asset. There were no circumstances that would indicate any impairment of the carrying value of these long-lived assets and no impairment losses were recorded in 2015 or 2014.
Property, Plant and Equipment and Depreciation— Property, plant and equipment includes the cost of land, buildings, machinery and equipment, office furniture and fixtures, automobiles, construction projects and significant improvements to existing plant and equipment. Interest costs related to significant construction projects are capitalized at the Company’s current weighted average effective interest rate. Expenditures for minor repairs and maintenance are expensed as incurred. When property or equipment is sold or otherwise disposed of, the related cost and accumulated depreciation is removed from the respective accounts and the gain or loss realized on disposition is reflected in earnings. All plant and equipment is depreciated using the straight-line method, utilizing the estimated useful property lives. Building lives range from 10 to 30 years; machinery and equipment lives range from 3 to 15 years; office furniture and fixture lives range from 3 to 10 years; automobile lives range from 3 to 6 years; construction projects and significant improvements to existing plant and equipment lives range from 3 to 15 years when placed in service.
29
Table of Contents
AMERICAN VANGUARD CORPORATION
AND SUBSIDIARIES
(Dollars in thousands, except per share data)
Foreign Currency Translation—Assets and liabilities of foreign subsidiaries, where the local currency is the functional currency, have been translated at period end exchange rates, and profit and loss accounts have been translated using weighted average yearly exchange rates. Adjustments resulting from translation have been recorded in the equity section of the balance sheet as cumulative translation adjustments in other comprehensive income (loss). The effects of foreign currency exchange gains and losses on transactions that are denominated in currencies other than the Company’s functional currency are remeasured to the functional currency using the end of the period exchange rates. The effects of remeasurement related to foreign currency transactions are included in operations.
Derivative financial instruments and hedge activities—In accordance with ASC 815, Derivatives and Hedging, the Company recognizes all derivative instruments as either other assets or other liabilities at fair value on the balance sheet. In accordance with the hierarchy contained in ASC 820, Fair Value Measurements, the Company calculated fair value using observable inputs other than Level 1 quoted prices (Level 2). During 2014, the Company had in place one interest rate swap contract that terminated on December 31, 2014. While in place, the interest rate swap contract was accounted for under ASC 815 as a cash flow hedge. The effective portion of the gains or losses on the interest rate swap are reported as a component of other comprehensive income and reclassified into earnings in the same period or periods during which the hedged transactions affect earnings. As a result of the termination of the swap contract (as mentioned above), no balances remain in other comprehensive income at December 31, 2014. There was no swap contract in place during 2015 or at December 31, 2015.
Goodwill and Other Intangible Assets—The primary identifiable intangible assets of the Company relate to assets associated with its product acquisitions. The Company adopted the provisions of ASC 350, under which identifiable intangibles with finite lives are amortized and those with indefinite lives are not amortized. The estimated useful life of an identifiable intangible asset to the Company is based upon a number of factors including the effects of demand, competition, and expected changes in the marketability of the Company’s products. The Company re-evaluates whether these intangible assets are impaired on a quarterly and an annual basis and anytime when there is a specific indicator for impairment, relying on a number of factors including operating results, business plans and future cash flows. Identifiable intangible assets that are subject to amortization are evaluated for impairment using a process similar to that used to evaluate long-lived assets. The impairment test for identifiable intangible assets not subject to amortization consists of either a qualitative assessment or a comparison of the fair value of the intangible asset with its carrying amount. An impairment loss, if any, is recognized for the amount by which the carrying value exceeds the fair value of the asset. Fair value is typically estimated using a discounted cash flow analysis. When determining future cash flow estimates, the Company considers historical results adjusted to reflect current and anticipated operating conditions. Estimating future cash flows requires significant judgment by the Company, in such areas as: future economic conditions, industry-specific conditions, product pricing and necessary capital expenditures. The use of different assumptions or estimates for future cash flows could produce different impairment amounts (or none at all) for long-lived assets, goodwill and identifiable intangible assets. The Company performed an impairment review for the year ended December 31, 2015 and 2014 and recorded immaterial impairment losses.
Fair Value of Financial Instruments—The carrying values of cash, receivables and accounts payable approximate their fair values because of the short maturity of these instruments. The fair value of the Company’s long-term debt and note payable to our lender group is estimated based on the quoted market prices for the same or similar issues or on the current rates offered to the Company for debt of the same remaining maturities. Such fair value approximates the respective carrying values of the Company’s long-term debt and note payable to bank.
The Company’s cash flow hedge related to a variable debt instrument and outstanding foreign currency derivative used to hedge foreign currency balances (when in place) are measured at fair value on a recurring basis. There was no such derivative instrument in place at December 31, 2015.
The valuation techniques used to measure the fair value of the derivative financial instruments above, in which the selected counterparties are required to have high credit ratings, were derived from pricing models, such as discounted cash flow techniques, with all significant inputs derived from, or corroborated by, observable market data. The Company’s discounted cash flow techniques use observable market inputs, such as LIBOR-based yield curves and foreign currency forward rates.
30
Table of Contents
AMERICAN VANGUARD CORPORATION
AND SUBSIDIARIES
(Dollars in thousands, except per share data)
| ITEM 7A | QUANTITATIVE AND QUALITATIVE DISCLOSURES ABOUT MARKET RISK |
The Company is exposed to market risk related to changes in interest rates, primarily from its borrowing activities. The Company’s indebtedness to its primary lender is evidenced by a line of credit with a variable rate of interest, which fluctuates with changes in the lender’s reference rate. The Company may use derivative financial instruments for trading purposes to protect trading performance from exchange rate fluctuations on material contracts.
The Company conducts business in various foreign currencies, primarily when doing business in Europe, Mexico, Central and South America. Therefore changes in the value of the currencies of such countries or regions affect the Company’s financial position and cash flows when translated into U.S. Dollars. The Company has mitigated, and will continue to mitigate, a portion of its currency exchange exposure through natural hedges based on the operation of decentralized foreign operating companies in which the majority of all costs are local-currency based. A 10% change in the value of all foreign currencies would have an immaterial effect on the Company’s financial position and cash flows. As part of an on-going process of assessing business risk, management has identified risk factors which are disclosed in Item 1A. Risk Factors of this Report.
| ITEM 8 | FINANCIAL STATEMENTS AND SUPPLEMENTARY DATA |
The Financial Statements and Supplementary Data required by this item are listed at Part IV, Item 15, Exhibits, Financial Statement Schedules.
| ITEM 9 | CHANGES IN AND DISAGREEMENTS WITH ACCOUNTANTS ON ACCOUNTING AND FINANCIAL DISCLOSURE |
None.
| ITEM 9A | CONTROLS AND PROCEDURES |
Disclosure Controls and Procedures
Management, under the supervision of the Company’s Chief Executive Officer and Chief Financial Officer, periodically evaluate the effectiveness of the design and operation of the Company’s disclosure controls and procedures (as defined in Exchange Act Rules 13a-15(e) and 15d-15(e)). Based upon this evaluation, as of December 31, 2015, the Chief Executive Officer and the Chief Financial Officer have concluded that these disclosure controls and procedures are effective in ensuring that the information required to be disclosed in reports filed under the Securities Exchange Act of 1934 is (i) recorded, processed, summarized and reported on a timely basis, and (ii) accumulated and communicated to the Company’s management, including the Chief Executive Officer and Chief Financial Officer, as appropriate to allow timely decisions regarding required disclosure.
Management’s Report on Internal Control over Financial Reporting
Management of the Company is responsible for establishing and maintaining adequate internal control over financial reporting as defined in Rules 13a-15(f) and 15d-15(f) of the Securities Exchange Act of 1934 for AVD and its subsidiaries (“the Company”). The Company’s internal control system over financial reporting is designed to provide reasonable assurance to management and the Board of Directors as to the fair, reliable and timely preparation and presentation of consolidated financial statements in accordance with accounting principles generally accepted in the United States of America filed with the SEC.
Because of its inherent limitations, internal control over financial reporting may not prevent or detect misstatements. Therefore, even processes determined to be effective can provide only reasonable assurance with respect to the financial statement preparation and presentation.
Management conducted an evaluation of the Company’s internal controls over financial reporting based on a framework set forth by the Committee of Sponsoring Organizations of the Treadway Commission in Internal Control—Integrated Framework (2013). This evaluation included review of the documentation of controls, evaluation of the design effectiveness of controls, testing of the effectiveness of controls and a conclusion on the evaluation. Based on this evaluation, management believes that as of December 31, 2015, the Company’s internal control over financial reporting is effective.
31
Table of Contents
AMERICAN VANGUARD CORPORATION
AND SUBSIDIARIES
(Dollars in thousands, except per share data)
BDO USA, LLP, the independent registered public accounting firm that audited the consolidated financial statements included in the Annual Report on Form 10-K, was engaged to attest to and report on the effectiveness of AVD’s internal control over financial reporting as of December 31, 2015. Its reports are included herein.
Changes in Internal Controls over Financial Reporting
There were no changes in internal controls over financial reporting during the quarter ended December 31, 2015 that have materially affected, or are reasonably likely to materially affect, the Company’s internal control over financial reporting.
32
Table of Contents
Report of Independent Registered Public Accounting Firm
Board of Directors and Stockholders
American Vanguard Corporation
Newport Beach, California
We have audited American Vanguard Corporation and Subsidiaries’ internal control over financial reporting as of December 31, 2015, based on criteria established in Internal Control—Integrated Framework (2013) issued by the Committee of Sponsoring Organizations of the Treadway Commission (the COSO criteria). American Vanguard Corporation and Subsidiaries’ management is responsible for maintaining effective internal control over financial reporting and for its assessment of the effectiveness of internal control over financial reporting, included in the accompanying Item 9A, Management’s Report on Internal Control Over Financial Reporting. Our responsibility is to express an opinion on the company’s internal control over financial reporting based on our audit.
We conducted our audit in accordance with the standards of the Public Company Accounting Oversight Board (United States). Those standards require that we plan and perform the audit to obtain reasonable assurance about whether effective internal control over financial reporting was maintained in all material respects. Our audit included obtaining an understanding of internal control over financial reporting, assessing the risk that a material weakness exists, and testing and evaluating the design and operating effectiveness of internal control based on the assessed risk. Our audit also included performing such other procedures as we considered necessary in the circumstances. We believe that our audit provides a reasonable basis for our opinion.
A company’s internal control over financial reporting is a process designed to provide reasonable assurance regarding the reliability of financial reporting and the preparation of financial statements for external purposes in accordance with generally accepted accounting principles. A company’s internal control over financial reporting includes those policies and procedures that (1) pertain to the maintenance of records that, in reasonable detail, accurately and fairly reflect the transactions and dispositions of the assets of the company; (2) provide reasonable assurance that transactions are recorded as necessary to permit preparation of financial statements in accordance with generally accepted accounting principles, and that receipts and expenditures of the company are being made only in accordance with authorizations of management and directors of the company; and (3) provide reasonable assurance regarding prevention or timely detection of unauthorized acquisition, use, or disposition of the company’s assets that could have a material effect on the financial statements.
Because of its inherent limitations, internal control over financial reporting may not prevent or detect misstatements. Also, projections of any evaluation of effectiveness to future periods are subject to the risk that controls may become inadequate because of changes in conditions, or that the degree of compliance with the policies or procedures may deteriorate.
In our opinion, American Vanguard Corporation and Subsidiaries maintained, in all material respects, effective internal control over financial reporting as of December 31, 2015, based on the COSO criteria.
We also have audited, in accordance with the standards of the Public Company Accounting Oversight Board (United States), the consolidated balance sheets of American Vanguard Corporation and Subsidiaries as of December 31, 2015 and 2014, and the related consolidated statements of operations and comprehensive income, stockholders’ equity, and cash flows for each of the three years in the period ended December 31, 2015 and our report dated March 1, 2016 expressed an unqualified opinion thereon.
/s/ BDO USA, LLP
Costa Mesa, California
March 1, 2016
33
Table of Contents
AMERICAN VANGUARD CORPORATION
AND SUBSIDIARIES
| ITEM 9B | OTHER INFORMATION |
None.
| ITEM 10 | DIRECTORS, EXECUTIVE OFFICERS AND CORPORATE GOVERNANCE |
The information set forth under the captions “Executive Officers of the Company,” “Election of Directors,” “Information about the Board of Directors and Committees of the Board” and “Transactions with Management and Others—Section 16(a) Beneficial Ownership Reporting Compliance” in our definitive proxy statement for our Annual Meeting of Stockholders to be held in 2016 (the “Proxy Statement”), which will be filed with the SEC within 120 days of the end of our fiscal year ended December 31, 2015, is incorporated herein by reference.
| ITEM 11 | EXECUTIVE COMPENSATION |
Except as specifically provided, the information set forth under the captions “Compensation of Executive Officers” and “Information about the Board of Directors and Committees of the Board—Compensation of Directors” in the Proxy Statement is incorporated herein by reference.
| ITEM 12 | SECURITY OWNERSHIP OF CERTAIN BENEFICIAL OWNERS AND MANAGEMENT AND RELATED STOCKHOLDER MATTERS |
The disclosure contained in Part II, Item 5 under “Equity Compensation Plan Information” is incorporated herein by reference. Information regarding security ownership of certain beneficial owners and management is incorporated by reference to the information set forth under the caption “Security Ownership of Certain Beneficial Owners and Management” in the Proxy Statement.
| ITEM 13 | CERTAIN RELATIONSHIPS AND RELATED TRANSACTIONS, AND DIRECTOR INDEPENDENCE |
The information set forth under the captions “Transactions with Management and Others” and “Information about the Board of Directors and Committees of the Board” in the Proxy Statement is incorporated herein by reference.
| ITEM 14 | PRINCIPAL ACCOUNTANT FEES AND SERVICES |
Information regarding principal accountant fees and services is incorporated by reference to the information set forth under the caption “Ratification of the Selection of Independent Registered Public Accounting Firm—Relationship of the Company with Independent Registered Public Accounting Firm” in the Proxy Statement.
34
Table of Contents
AMERICAN VANGUARD CORPORATION
AND SUBSIDIARIES
| ITEM 15 | EXHIBITS AND FINANCIAL STATEMENT SCHEDULES |
| (a) | The following documents are filed as part of this report: |
Index to Consolidated Financial Statements and Supplementary Data:
| (b) | Exhibits: |
The exhibits listed on the accompanying Index to Exhibits, pages 63-64 are filed as part of this annual report.
| (c) | Valuation and qualifying accounts: |
Schedule II-A—Valuation and Qualifying Accounts
Allowance for Doubtful Accounts Receivable (in thousands)
| Fiscal Year Ended |
Balance at Beginning of Period |
Additions Charged to | Deductions | Balance at End of Period |
||||||||||||||||
| Costs and Expenses |
Other | |||||||||||||||||||
| December 31, 2015 |
$ | 166 | $ | 332 | $ | — | $ | (75 | ) | $ | 423 | |||||||||
| December 31, 2014 |
$ | 392 | $ | 75 | $ | — | $ | (301 | ) | $ | 166 | |||||||||
| December 31, 2013 |
$ | 623 | $ | — | $ | (231 | ) | $ | — | $ | 392 | |||||||||
35
Table of Contents
AMERICAN VANGUARD CORPORATION
AND SUBSIDIARIES
Pursuant to the requirements of Section 13 or 15(d) of the Securities Exchange Act of 1934, American Vanguard Corporation has duly caused this report to be signed on its behalf by the undersigned, thereunto duly authorized.
AMERICAN VANGUARD CORPORATION
(Registrant)
| By: | /s/ ERIC G. WINTEMUTE |
By: | /s/ DAVID T. JOHNSON | |||||
| Eric G. Wintemute Chief Executive Officer and Chairman of the Board |
David T. Johnson Chief Financial Officer and Principal Accounting Officer | |||||||
| March 1, 2016 | March 1, 2016 | |||||||
Pursuant to the requirements of the Securities Exchange Act of 1934, this report has been signed below by the following persons on behalf of the Registrant and in the capacities indicated.
| By: | /s/ ERIC G. WINTEMUTE |
By: | /s/ DAVID T. JOHNSON | |||||
| Eric G. Wintemute Principal Executive Officer and Chairman of the Board |
David T. Johnson Principal Financial Officer and Principal Accounting Officer | |||||||
| March 1, 2016 | March 1, 2016 | |||||||
| By: | /s/ DEBRA EDWARDS |
By: | /s/ JOHN L. KILLMER | |||||
| Debra Edwards Director |
John L. Killmer Director | |||||||
| March 1, 2016 | March 1, 2016 | |||||||
| By: | /s/ LAWRENCE S. CLARK |
By: | /s/ SCOTT D. BASKIN | |||||
| Lawrence S. Clark Director |
Scott D. Baskin Director | |||||||
| March 1, 2016 | March 1, 2016 | |||||||
| By: | /s/ MORTON D. ERLICH |
By: | /s/ ALFRED INGULLI | |||||
| Morton D. Erlich Director |
Alfred Ingulli Director | |||||||
| March 1, 2016 | March 1, 2016 | |||||||
| By: | /s/ ESMAIL ZIRAKPARVAR |
|||||||
| Esmail Zirakparvar Director |
||||||||
| March 1, 2016 | ||||||||
36
Table of Contents
AMERICAN VANGUARD CORPORATION
AND SUBSIDIARIES
Report of Independent Registered Public Accounting Firm
To the Board of Directors and Stockholders
American Vanguard Corporation
Newport Beach, California
We have audited the accompanying consolidated balance sheets of American Vanguard Corporation and Subsidiaries (the “Company”) as of December 31, 2015 and 2014 and the related consolidated statements of operations and comprehensive income, stockholders’ equity, and cash flows for each of the three years in the period ended December 31, 2015. In connection with our audits of the financial statements, we have also audited the financial statement schedule listed in the accompanying index under Item 15(c). These consolidated financial statements and schedule are the responsibility of the Company’s management. Our responsibility is to express an opinion on these consolidated financial statements and schedule based on our audits.
We conducted our audits in accordance with the standards of the Public Company Accounting Oversight Board (United States). Those standards require that we plan and perform the audit to obtain reasonable assurance about whether the financial statements are free of material misstatement. An audit includes examining, on a test basis, evidence supporting the amounts and disclosures in the financial statements, assessing the accounting principles used and significant estimates made by management, as well as evaluating the overall presentation of the financial statements and schedule. We believe that our audits provide a reasonable basis for our opinion.
In our opinion, the consolidated financial statements referred to above present fairly, in all material respects, the financial position of American Vanguard Corporation and Subsidiaries at December 31, 2015 and 2014, and the results of its operations and its cash flows for each of the three years in the period ended December 31, 2015, in conformity with accounting principles generally accepted in the United States of America.
As discussed in notes to the consolidated financial statements in paragraph Recently Issued Accounting Guidance, the Company changed its method of presentation of debt issuance costs in 2015 due to the adoption of Financial Accounting Standards Board Accounting Standards Update 2015-03, Simplifying the Presentation of Debt Issuance Costs. This change was applied retrospectively to all periods presented.
Also, in our opinion, the financial statement schedule, when considered in relation to the basic consolidated financial statements taken as a whole, presents fairly, in all material respects, the information set forth therein.
We also have audited, in accordance with the standards of the Public Company Accounting Oversight Board (United States), American Vanguard Corporation and Subsidiaries’ internal control over financial reporting as of December 31, 2015, based on criteria established in Internal Control—Integrated Framework (2013) issued by the Committee of Sponsoring Organizations of the Treadway Commission (COSO) and our report dated March 1, 2016 expressed an unqualified opinion thereon.
/s/ BDO USA, LLP
Costa Mesa, California
March 1, 2016
37
Table of Contents
AMERICAN VANGUARD CORPORATION
AND SUBSIDIARIES
December 31, 2015 and 2014
(In thousands, except share data)
| 2015 | 2014 | |||||||
| Assets | ||||||||
| Current assets: |
||||||||
| Cash and cash equivalents |
$ | 5,524 | $ | 4,885 | ||||
| Receivables: |
||||||||
| Trade, net of allowance for doubtful accounts of $423 and $166, respectively |
72,835 | 86,027 | ||||||
| Other |
2,554 | 2,396 | ||||||
|
|
|
|
|
|||||
| 75,389 | 88,423 | |||||||
|
|
|
|
|
|||||
| Inventories |
136,477 | 165,631 | ||||||
| Prepaid expenses |
11,172 | 13,415 | ||||||
| Income taxes receivable |
168 | 5,964 | ||||||
| Deferred income tax assets |
8,101 | 8,731 | ||||||
|
|
|
|
|
|||||
| Total current assets |
236,831 | 287,049 | ||||||
| Property, plant and equipment, net |
47,972 | 50,026 | ||||||
| Intangible assets, net of applicable amortization |
129,160 | 100,211 | ||||||
| Other assets |
29,576 | 35,035 | ||||||
|
|
|
|
|
|||||
| $ | 443,539 | $ | 472,321 | |||||
|
|
|
|
|
|||||
| Liabilities and Stockholders’ Equity | ||||||||
| Current liabilities: |
||||||||
| Current installments of other notes payable |
$ | 55 | $ | 71 | ||||
| Current installments of other liabilities |
514 | 1,357 | ||||||
| Accounts payable |
15,343 | 20,411 | ||||||
| Deferred revenue |
8,888 | 898 | ||||||
| Accrued program costs |
44,371 | 52,546 | ||||||
| Accrued expenses and other payables |
7,111 | 5,962 | ||||||
|
|
|
|
|
|||||
| Total current liabilities |
76,282 | 81,245 | ||||||
| Long-term debt and other notes payable, excluding current installments |
68,321 | 98,605 | ||||||
| Other liabilities, excluding current installments |
3,054 | 3,309 | ||||||
| Deferred income tax liabilities |
27,556 | 28,159 | ||||||
|
|
|
|
|
|||||
| Total liabilities |
175,213 | 211,318 | ||||||
|
|
|
|
|
|||||
| Commitments and contingent liabilities |
||||||||
| Stockholders’ equity: |
||||||||
| Preferred stock, $.10 par value per share; authorized 400,000 shares; none issued |
— | — | ||||||
| Common stock, $.10 par value per share; authorized 40,000,000 shares; issued 31,638,225 shares in 2015 and 31,550,477 shares in 2014 |
3,164 | 3,156 | ||||||
| Additional paid-in capital |
68,534 | 66,232 | ||||||
| Accumulated other comprehensive loss |
(3,541 | ) | (1,970 | ) | ||||
| Retained earnings |
208,507 | 202,488 | ||||||
|
|
|
|
|
|||||
| 276,664 | 269,906 | |||||||
| Less treasury stock at cost, 2,450,634 shares in 2015 and in 2014 |
(8,269 | ) | (8,269 | ) | ||||
|
|
|
|
|
|||||
| American Vanguard Corporation stockholders’ equity |
268,395 | 261,637 | ||||||
| Non-controlling interest |
(69 | ) | (634 | ) | ||||
|
|
|
|
|
|||||
| Total stockholders’ equity |
268,326 | 261,003 | ||||||
|
|
|
|
|
|||||
| $ | 443,539 | $ | 472,321 | |||||
|
|
|
|
|
|||||
See summary of significant accounting policies and notes to consolidated financial statements.
38
Table of Contents
AMERICAN VANGUARD CORPORATION
AND SUBSIDIARIES
CONSOLIDATED STATEMENTS OF OPERATIONS AND COMPREHENSIVE INCOME
Years ended December 31, 2015, 2014 and 2013
(In thousands, except per share data)
| 2015 | 2014 | 2013 | ||||||||||
| Net sales |
$ | 289,382 | $ | 298,634 | $ | 381,021 | ||||||
| Cost of sales |
177,480 | 184,138 | 209,674 | |||||||||
|
|
|
|
|
|
|
|||||||
| Gross profit |
111,902 | 114,496 | 171,347 | |||||||||
| Operating expenses |
100,378 | 107,786 | 115,612 | |||||||||
|
|
|
|
|
|
|
|||||||
| Operating income |
11,524 | 6,710 | 55,735 | |||||||||
| Interest expense, net |
2,772 | 3,153 | 2,175 | |||||||||
| Interest capitalized |
(210 | ) | (87 | ) | (274 | ) | ||||||
|
|
|
|
|
|
|
|||||||
| Income before provision for income taxes and loss on equity investment |
8,962 | 3,644 | 53,834 | |||||||||
| Income taxes expense (benefit) |
2,009 | (451 | ) | 18,916 | ||||||||
|
|
|
|
|
|
|
|||||||
| Income before loss on equity investment |
6,953 | 4,095 | 34,918 | |||||||||
| Less net loss from equity method investment |
(636 | ) | (29 | ) | (986 | ) | ||||||
|
|
|
|
|
|
|
|||||||
| Net income |
6,317 | 4,066 | 33,932 | |||||||||
| Add back net loss attributable to non-controlling interest |
274 | 775 | 517 | |||||||||
|
|
|
|
|
|
|
|||||||
| Net income attributable to American Vanguard |
$ | 6,591 | $ | 4,841 | $ | 34,449 | ||||||
|
|
|
|
|
|
|
|||||||
| Change in fair value of interest rate swaps |
— | 340 | 388 | |||||||||
| Foreign currency translation adjustment |
(1,571 | ) | (1,262 | ) | 326 | |||||||
|
|
|
|
|
|
|
|||||||
| Comprehensive income |
$ | 5,020 | $ | 3,919 | $ | 35,163 | ||||||
|
|
|
|
|
|
|
|||||||
| Earnings per common share—basic |
$ | .23 | $ | .17 | $ | 1.22 | ||||||
|
|
|
|
|
|
|
|||||||
| Earnings per common share—assuming dilution |
$ | .23 | $ | .17 | $ | 1.19 | ||||||
|
|
|
|
|
|
|
|||||||
| Weighted average shares outstanding—basic |
28,673 | 28,436 | 28,301 | |||||||||
|
|
|
|
|
|
|
|||||||
| Weighted average shares outstanding—assuming dilution |
29,237 | 28,912 | 28,899 | |||||||||
|
|
|
|
|
|
|
|||||||
See summary of significant accounting policies and notes to consolidated financial statements.
39
Table of Contents
AMERICAN VANGUARD CORPORATION
AND SUBSIDIARIES
CONSOLIDATED STATEMENTS OF STOCKHOLDERS’ EQUITY
Years ended December 31, 2015, 2014 and 2013
(In thousands, except share data)
| Common Stock | Treasury Stock | |||||||||||||||||||||||||||||||||||||||
| Shares | Amount | Additional Paid-in Capital |
Retained Earnings |
Accumulated Other Comprehensive Income/(loss) |
Shares | Amount | AVD Total |
Non- Controlling Interest |
Total | |||||||||||||||||||||||||||||||
| Balance, December 31, 2012 |
30,766,730 | $ | 3,077 | $ | 54,323 | $ | 174,243 | $ | (1,762 | ) | 2,310,634 | $ | (4,804 | ) | $ | 225,077 | $ | 359 | $ | 225,436 | ||||||||||||||||||||
| Stocks issued under ESPP |
27,923 | 3 | 740 | — | — | — | — | 743 | — | 743 | ||||||||||||||||||||||||||||||
| Cash dividends on common stock ($0.22 per share) |
— | — | — | (6,222 | ) | — | — | — | (6,222 | ) | — | (6,222 | ) | |||||||||||||||||||||||||||
| Foreign currency translation adjustment, net |
— | — | — | — | 326 | — | — | 326 | — | 326 | ||||||||||||||||||||||||||||||
| Stock based compensation |
— | — | 3,819 | — | — | — | — | 3,819 | — | 3,819 | ||||||||||||||||||||||||||||||
| Changes in fair value of interest swap |
— | — | — | — | 388 | — | — | 388 | — | 388 | ||||||||||||||||||||||||||||||
| Stock options exercised and grants of restricted stock units |
298,129 | 29 | 838 | — | — | — | — | 867 | — | 867 | ||||||||||||||||||||||||||||||
| Excess tax benefits from share based payment arrangements |
— | — | 440 | — | — | — | — | 440 | — | 440 | ||||||||||||||||||||||||||||||
| Shares repurchased |
— | — | — | — | — | 70,000 | (1,934 | ) | (1,934 | ) | — | (1,934 | ) | |||||||||||||||||||||||||||
| Net (loss) income |
— | — | — | 34,449 | — | — | — | 34,449 | (517 | ) | 33,932 | |||||||||||||||||||||||||||||
|
|
|
|
|
|
|
|
|
|
|
|
|
|
|
|
|
|
|
|
|
|||||||||||||||||||||
| Balance, December 31, 2013 |
31,092,782 | 3,109 | 60,160 | 202,470 | (1,048 | ) | 2,380,634 | (6,738 | ) | 257,953 | (158 | ) | 257,795 | |||||||||||||||||||||||||||
| Stocks issued under ESPP |
47,213 | 6 | 800 | — | — | — | — | 806 | — | 806 | ||||||||||||||||||||||||||||||
| Cash dividends on common stock ($0.17 per share) |
— | — | — | (4,823 | ) | — | — | — | (4,823 | ) | — | (4,823 | ) | |||||||||||||||||||||||||||
| Foreign currency translation adjustment, net |
— | — | — | — | (1,262 | ) | — | — | (1,262 | ) | — | (1,262 | ) | |||||||||||||||||||||||||||
| Stock based compensation |
— | — | 4,153 | — | — | — | — | 4,153 | — | 4,153 | ||||||||||||||||||||||||||||||
| Changes in fair value of interest swap |
— | — | — | — | 340 | — | — | 340 | — | 340 | ||||||||||||||||||||||||||||||
| Stock options exercised and grants of restricted stock units |
410,482 | 41 | 819 | — | — | — | — | 860 | — | 860 | ||||||||||||||||||||||||||||||
| Excess tax benefits from share based payment arrangements |
— | — | 300 | — | — | — | — | 300 | — | 300 | ||||||||||||||||||||||||||||||
| Shares repurchased |
— | — | — | — | — | 70,000 | (1,531 | ) | (1,531 | ) | — | (1,531 | ) | |||||||||||||||||||||||||||
| Non-controlling interest contribution |
— | — | — | — | — | — | — | — | 299 | 299 | ||||||||||||||||||||||||||||||
| Net (loss) income |
— | — | — | 4,841 | — | — | — | 4,841 | (775 | ) | 4,066 | |||||||||||||||||||||||||||||
|
|
|
|
|
|
|
|
|
|
|
|
|
|
|
|
|
|
|
|
|
|||||||||||||||||||||
| Balance, December 31, 2014 |
31,550,477 | 3,156 | 66,232 | 202,488 | (1,970 | ) | 2,450,634 | (8,269 | ) | 261,637 | (634 | ) | 261,003 | |||||||||||||||||||||||||||
| Stocks issued under ESPP |
50,452 | 5 | 568 | — | — | — | — | 573 | — | 573 | ||||||||||||||||||||||||||||||
| Cash dividends on common stock ($0.02 per share) |
— | — | — | (572 | ) | — | — | — | (572 | ) | — | (572 | ) | |||||||||||||||||||||||||||
| Foreign currency translation adjustment, net |
— | — | — | — | (1,571 | ) | — | — | (1,571 | ) | — | (1,571 | ) | |||||||||||||||||||||||||||
| Stock based compensation |
— | — | 3,881 | — | — | — | — | 3,881 | — | 3,881 | ||||||||||||||||||||||||||||||
| Stock options exercised and grants of restricted stock units |
37,296 | 3 | (259 | ) | — | — | — | — | (256 | ) | — | (256 | ) | |||||||||||||||||||||||||||
| Tax effect from share based compensation |
— | — | (924 | ) | — | — | — | — | (924 | ) | — | (924 | ) | |||||||||||||||||||||||||||
| Adjustment and purchase of non-controlling interest |
— | — | (964 | ) | — | — | — | — | (964 | ) | 839 | (125 | ) | |||||||||||||||||||||||||||
| Net (loss) income |
— | — | — | 6,591 | — | — | — | 6,591 | (274 | ) | 6,317 | |||||||||||||||||||||||||||||
|
|
|
|
|
|
|
|
|
|
|
|
|
|
|
|
|
|
|
|
|
|||||||||||||||||||||
| Balance, December 31, 2015 |
31,638,225 | $ | 3,164 | $ | 68,534 | $ | 208,507 | $ | (3,541 | ) | 2,450,634 | $ | (8,269 | ) | $ | 268,395 | $ | (69 | ) | $ | 268,326 | |||||||||||||||||||
|
|
|
|
|
|
|
|
|
|
|
|
|
|
|
|
|
|
|
|
|
|||||||||||||||||||||
See summary of significant accounting policies and notes to consolidated financial statements
40
Table of Contents
AMERICAN VANGUARD CORPORATION
AND SUBSIDIARIES
CONSOLIDATED STATEMENTS OF CASH FLOWS
Years ended December 31, 2015, 2014 and 2013
(In thousands)
| 2015 | 2014 | 2013 | ||||||||||
| Increase cash |
||||||||||||
| Cash flows from operating activities: |
||||||||||||
| Net income |
$ | 6,317 | $ | 4,066 | $ | 33,932 | ||||||
| Adjustments to reconcile net income to net cash provided by (used in) operating activities: |
||||||||||||
| Depreciation and amortization of fixed and intangible assets |
16,474 | 16,332 | 14,845 | |||||||||
| Amortization of other long term assets |
5,275 | 5,811 | 4,598 | |||||||||
| Amortization of discounted liabilities |
140 | 324 | 174 | |||||||||
| Stock-based compensation |
3,881 | 4,153 | 3,819 | |||||||||
| Excess tax benefit from share based compensation |
(23 | ) | (300 | ) | (440 | ) | ||||||
| Increase in deferred income taxes |
27 | 2,619 | 2,523 | |||||||||
| Operating loss from equity method investment |
629 | 983 | 986 | |||||||||
| Loss (gain) from dilution of equity method investment |
7 | (954 | ) | — | ||||||||
| Changes in assets and liabilities associated with operations: |
||||||||||||
| Decrease (increase) in net receivables |
13,034 | (13,471 | ) | 2,351 | ||||||||
| Decrease (increase) in inventories |
29,154 | (25,801 | ) | (51,879 | ) | |||||||
| Decrease (increase) in income tax receivable/payable, net |
4,872 | 4,424 | (10,961 | ) | ||||||||
| Decrease (increase) in prepaid expenses and other assets |
2,082 | (4,743 | ) | (19,733 | ) | |||||||
| (Decrease) increase in accounts payable |
(5,068 | ) | (19,951 | ) | 8,252 | |||||||
| Increase (decrease) in deferred revenue |
7,990 | (2,890 | ) | (16,639 | ) | |||||||
| (Decrease) increase in other payables, accrued program costs and expenses |
(6,223 | ) | (4,697 | ) | 21,958 | |||||||
|
|
|
|
|
|
|
|||||||
| Net cash provided by (used in) operating activities |
78,568 | (34,095 | ) | (6,214 | ) | |||||||
|
|
|
|
|
|
|
|||||||
| Cash flows from investing activities: |
||||||||||||
| Capital expenditures |
(6,899 | ) | (7,180 | ) | (15,260 | ) | ||||||
| Investment |
(125 | ) | (500 | ) | (3,687 | ) | ||||||
| Acquisitions of intangible assets |
(36,667 | ) | — | — | ||||||||
|
|
|
|
|
|
|
|||||||
| Net cash used in investing activities |
(43,691 | ) | (7,680 | ) | (18,947 | ) | ||||||
|
|
|
|
|
|
|
|||||||
| Cash flows from financing activities: |
||||||||||||
| Net (payments) borrowings under line of credit agreement |
(30,520 | ) | 47,850 | 51,550 | ||||||||
| Payments on long-term debt |
— | — | (46,000 | ) | ||||||||
| Payment on other long-term liabilities |
(1,543 | ) | (1,756 | ) | (1,831 | ) | ||||||
| Excess tax benefit from share based compensation |
23 | 300 | 440 | |||||||||
| Decrease in other notes payable |
— | — | (6,154 | ) | ||||||||
| Repurchases of common stock |
— | (1,531 | ) | (1,934 | ) | |||||||
| Proceeds from the issuance of common stock (sale of stock under ESPP and exercise of stock options) |
317 | 1,666 | 1,610 | |||||||||
| Non-controlling interest contribution |
— | 299 | — | |||||||||
| Payment of cash dividends |
(1,141 | ) | (5,672 | ) | (4,804 | ) | ||||||
|
|
|
|
|
|
|
|||||||
| Net cash (used in) provided by financing activities |
(32,864 | ) | 41,156 | (7,123 | ) | |||||||
|
|
|
|
|
|
|
|||||||
| Net increase (decrease) in cash and cash equivalents |
2,013 | (619 | ) | (32,284 | ) | |||||||
| Effect of exchange rate changes on cash |
(1,374 | ) | (1,176 | ) | 488 | |||||||
| Cash and cash equivalents at beginning of year |
4,885 | 6,680 | 38,476 | |||||||||
|
|
|
|
|
|
|
|||||||
| Cash and cash equivalents at end of year |
$ | 5,524 | $ | 4,885 | $ | 6,680 | ||||||
|
|
|
|
|
|
|
|||||||
| Supplemental cash flow information: |
||||||||||||
| Cash paid (received) during the year for: |
||||||||||||
| Interest |
$ | 2,750 | $ | 2,298 | $ | 1,777 | ||||||
|
|
|
|
|
|
|
|||||||
| Income taxes |
$ | (3,697 | ) | $ | (8,206 | ) | $ | 25,271 | ||||
|
|
|
|
|
|
|
|||||||
See summary of significant accounting policies and notes to the consolidated financial statements
41
Table of Contents
AMERICAN VANGUARD CORPORATION
AND SUBSIDIARIES
SUMMARY OF SIGNIFICANT ACCOUNTING POLICIES AND
NOTES TO CONSOLIDATED FINANCIAL STATEMENTS
Years Ended December 31, 2015, 2014 and 2013
(Dollars in thousands, except per share data)
Description of Business, Basis of Consolidation and Significant Accounting Policies
American Vanguard Corporation (the “Company”) is primarily a specialty chemical manufacturer that develops and markets safe and effective products for agricultural, commercial and consumer uses. The Company manufactures and formulates chemicals for crops, human and animal protection. The consolidated financial statements include the accounts of the Company, its wholly-owned subsidiaries and Envance, its majority owned subsidiary. All significant intercompany accounts and transactions have been eliminated in consolidation. The Company operates within a single operating segment.
Based on similar economic and operational characteristics, the Company’s business is aggregated into one reportable segment. Selective enterprise information is as follows:
| 2015 | 2014 | 2013 | ||||||||||
| Net sales: |
||||||||||||
| Insecticides |
$ | 117,180 | $ | 135,705 | $ | 193,623 | ||||||
| Herbicides/soil fumigants/fungicides |
111,897 | 101,785 | 121,042 | |||||||||
| Other, including plant growth regulators |
29,013 | 30,220 | 31,849 | |||||||||
|
|
|
|
|
|
|
|||||||
| Total crop |
258,090 | 267,710 | 346,514 | |||||||||
| Non-crop |
31,292 | 30,924 | 34,507 | |||||||||
|
|
|
|
|
|
|
|||||||
| $ | 289,382 | $ | 298,634 | $ | 381,021 | |||||||
|
|
|
|
|
|
|
|||||||
| Gross profit: |
||||||||||||
| Crop |
$ | 97,198 | $ | 101,633 | $ | 155,275 | ||||||
| Non-crop |
14,704 | 12,863 | 16,072 | |||||||||
|
|
|
|
|
|
|
|||||||
| $ | 111,902 | $ | 114,496 | $ | 171,347 | |||||||
|
|
|
|
|
|
|
|||||||
Due to elements inherent to the Company’s business, such as differing and unpredictable weather patterns, crop growing cycles, changes in product mix of sales and ordering patterns that may vary in timing, measuring the Company’s performance on a quarterly basis (gross profit margins on a quarterly basis may vary significantly) even when such comparisons are favorable, is not as good an indicator as full-year comparisons.
Cost of Sales—In addition to normal cost centers (i.e., direct labor, raw materials) included in cost of sales, the Company also includes such cost centers as Health and Safety, Environmental, Maintenance and Quality Control in cost of sales.
Operating Expenses—Operating expenses include cost centers for Selling, General and Administrative, Research, Product Development, and Regulatory, and finally, Freight, Delivery and Warehousing.
| 2015 | 2014 | 2013 | ||||||||||
| Selling |
$ | 27,360 | $ | 31,593 | $ | 32,929 | ||||||
| General and administrative |
28,516 | 27,057 | 33,536 | |||||||||
| Research, product development and regulatory |
18,808 | 21,206 | 21,644 | |||||||||
| Freight, delivery and warehousing |
25,694 | 27,930 | 27,503 | |||||||||
|
|
|
|
|
|
|
|||||||
| $ | 100,378 | $ | 107,786 | $ | 115,612 | |||||||
|
|
|
|
|
|
|
|||||||
42
Table of Contents
Advertising Expense—The Company expenses advertising costs in the period incurred. Advertising expenses, which include promotional costs, are recognized in operating costs (specifically in selling expenses) in the consolidated statements of operations and were $3,535 in 2015, $4,322 in 2014 and $4,011 in 2013.
Cash and cash equivalent—The Company’s cash and cash equivalent consist primarily of certificates of deposit with an initial term of less than three months. For purposes of the consolidated statements of cash flows, the Company considers all highly liquid debt instruments with original maturities of three months or less to be cash equivalents.
Inventories — The Company values its inventories at lower of cost or market. Cost is determined by the first-in, first-out (“FIFO”) method, including material, labor, factory overhead and subcontracting services. The Company writes down and makes adjustments to its inventory carrying values as a result of net realizable value assessments of slow moving and obsolete inventory and other annual adjustments to ensure that our standard costs continue to closely reflect manufacturing cost. The Company recorded an inventory reserve allowance of $4,020 at December 31, 2015, as compared to $2,995 at December 31, 2014.
The components of inventories consist of the following:
| 2015 | 2014 | |||||||
| Finished products |
$ | 120,456 | $ | 142,853 | ||||
| Raw materials |
16,021 | 22,778 | ||||||
|
|
|
|
|
|||||
| $ | 136,477 | $ | 165,631 | |||||
|
|
|
|
|
|||||
Revenue Recognition and Allowance for Doubtful Accounts—Revenue from sales is recognized at the time title and the risks of ownership pass. This is when the customer has made the fixed commitment to purchase the goods, the products are shipped per the customer’s instructions, the sales price is fixed and determinable, and collection is reasonably assured. The Company has in place procedures to ensure that revenue is recognized when earned. The procedures are subject to management’s review and from time to time certain sales are excluded until it is clear that the title has passed and there is no further recourse to the Company. From time to time, the Company may offer a program to eligible customers in good standing that provides extended payment terms on a portion of the sales on selected products. The Company analyzes these extended payment programs in connection with its revenue recognition policy to ensure all revenue recognition criteria are satisfied at the time of sale. Allowance for doubtful accounts is established based on estimates of losses related to customer receivable balances. Estimates are developed using either standard quantitative measures based on historical losses, adjusted for current economic conditions or by evaluating specific customer accounts for risk of loss.
Accrued Program Costs—In accordance with Financial Accounting Standards Board (“FASB”) Accounting Standards Codification (“ASC”) 605, the Company classifies certain payments to its customers as a reduction of sales revenues. The Company describes these payments as “Programs”. Programs are a critical part of doing business in the U.S. agricultural chemicals business market place. For accounting purposes, programs are recorded as a reduction in gross sales and include market pricing adjustments, volume take up or other key performance indicator driven payments made to distributors, retailers or growers at the end of a growing season. Each quarter management compares each sale transaction with program guidelines to determine what program liability has been incurred. Once this initial calculation is made for the specific quarter, sales and marketing management along with executive and financial management review the accumulated program balance and make assessments of whether or not customers are tracking in a manner that indicates that they will meet the requirements set out in the terms and conditions attached to each program. If management believes that customers are falling short of their annual goals then periodic adjustments will be made to the accumulated accrual to properly reflect the Company’s best estimate of the liability at the balance sheet date. The majority of adjustments are made at the end of the crop season, at which time customer performance can be fully assessed. Programs are paid out predominantly on an annual basis, usually in the final quarter of the financial year or the first quarter of the following year.
Long-lived Assets—Long-lived assets primarily consist of the costs of Smartbox and Lock and Load containers. The carrying value of long-lived assets is reviewed for impairment quarterly and/or whenever events or changes in circumstances indicate that the carrying value of such assets may not be recoverable. The Company evaluates recoverability of an asset group by comparing the carrying value to the future undiscounted cash flows that it expects to generate from the asset group. If the comparison indicates that the carrying value of an asset group is not recoverable, measurement of the impairment loss is based on the fair value of the asset. There were no circumstances that would indicate any impairment of the carrying value of these long-lived assets and no impairment losses were recorded in 2015 or 2014.
43
Table of Contents
Property, Plant and Equipment and Depreciation—Property, plant and equipment includes the cost of land, buildings, machinery and equipment, office furniture and fixtures, automobiles, construction projects and significant improvements to existing plant and equipment. Interest costs related to significant construction projects are capitalized at the Company’s current weighted average effective interest rate. Expenditures for minor repairs and maintenance are expensed as incurred. When property or equipment is sold or otherwise disposed of, the related cost and accumulated depreciation is removed from the respective accounts and the gain or loss realized on disposition is reflected in operations. All plant and equipment is depreciated using the straight-line method, utilizing the estimated useful property lives. Building lives range from 10 to 30 years; machinery and equipment lives range from 3 to 15 years; office furniture and fixture lives range from 3 to 10 years; automobile lives range from 3 to 6 years; construction projects and significant improvements to existing plant and equipment lives range from 3 to 15 years when placed in service.
Foreign Currency Translation—Assets and liabilities of foreign subsidiaries, where the local currency is the functional currency, have been translated at period end exchange rates, and profit and loss accounts have been translated using weighted average yearly exchange rates. Adjustments resulting from translation have been recorded in the equity section of the balance sheet as cumulative translation adjustments in other comprehensive income (loss). The effects of foreign currency exchange gains and losses on transactions that are denominated in currencies other than the Company’s functional currency are remeasured to the functional currency using the end of the period exchange rates. The effects of remeasurement related to foreign currency transactions are included in operations.
Derivative financial instruments and hedge activities—In accordance with FASB ASC 815, Derivatives and Hedging, the Company recognizes all derivative instruments as either other assets or other liabilities at fair value on the balance sheet. In accordance with the hierarchy contained in FASB ASC 820, Fair Value Measurements, the Company calculated fair value using observable inputs other than Level 1 quoted prices (Level 2). During 2014, the Company had in place one interest rate swap contract that terminated on December 31, 2014. While in place, the interest rate swap contract was accounted for under FASB ASC 815 as a cash flow hedge. The effective portion of the gains or losses on the interest rate swap are reported as a component of other comprehensive income and reclassified into earnings in the same period or periods during which the hedged transactions affect earnings. As a result of the termination of the swap contract (as mentioned above), no balances remain in other comprehensive income at December 31, 2014. There was no swap contract in place during 2015 or at December 31, 2015.
The following tables illustrate the impact of derivatives on the Company’s statement of operations for the year ended December 31, 2015 and 2014.
| The Effect of Derivative Instruments on the Statement of Financial Performance For the Year Ended December 31 |
||||||||||||||||||||||||||||||||
| Derivatives in ASC 815 Cash Flow Hedging Relationships |
Amount of Gain or (Loss) Recognized in OCI on Derivative (Effective Portion) |
Location of Gain or (Loss) Reclassified from Accumulated OCI into Income (Effective Portion) |
Amount of Gain or (Loss) Reclassified from Accumulated OCI into Income (Effective Portion) |
Location of Gain or (Loss) Recognized in Income on Derivative (Ineffective Portion) |
Amount of Gain or (Loss) Recognized in Income on Derivative (Ineffective Portion) |
|||||||||||||||||||||||||||
| 2015 | 2014 | 2015 | 2014 | 2015 | 2014 | |||||||||||||||||||||||||||
| Interest rate contracts |
$ | 0 | $ | (30 | ) | Interest expense | $ | (0 | ) | $ | (594 | ) | Interest expense | $ | (0 | ) | $ | (3 | ) | |||||||||||||
|
|
|
|
|
|
|
|
|
|
|
|
|
|||||||||||||||||||||
| Total |
$ | 0 | $ | (30 | ) | $ | (0 | ) | $ | (594 | ) | $ | (0 | ) | $ | (3 | ) | |||||||||||||||
|
|
|
|
|
|
|
|
|
|
|
|
|
|||||||||||||||||||||
The counterparty to the interest rate derivative financial instrument was held by the Company during 2014 is Bank of the West, the Company’s primary bank. Pledged cash collateral was not required under the interest rate swap contract. There were no derivative financial instruments at December 31, 2015.
Goodwill and Other Intangible Assets—The primary identifiable intangible assets of the Company relate to assets associated with its product acquisitions. The Company adopted the provisions of FASB ASC 350, under which identifiable intangibles with finite lives are amortized and those with indefinite lives are not amortized. The estimated useful life of an identifiable intangible asset to the Company is based upon a number of factors including the effects of demand, competition, and expected changes in the marketability of the Company’s products. The Company re-evaluates whether these intangible assets are impaired on a quarterly and an annual basis and anytime when there is a specific indicator for impairment, relying on a number of factors including operating results, business plans and future cash flows. Identifiable intangible assets that are subject to amortization are evaluated for impairment using a process similar to that used to evaluate long-lived assets. The impairment test for identifiable intangible assets not subject to amortization consists of either a qualitative assessment or a
44
Table of Contents
comparison of the fair value of the intangible asset with its carrying amount. An impairment loss, if any, is recognized for the amount by which the carrying value exceeds the fair value of the asset. Fair value is typically estimated using a discounted cash flow analysis. When determining future cash flow estimates, the Company considers historical results adjusted to reflect current and anticipated operating conditions. Estimating future cash flows requires significant judgment by the Company, in such areas as: future economic conditions, industry-specific conditions, product pricing and necessary capital expenditures. The use of different assumptions or estimates for future cash flows could produce different impairment amounts (or none at all) for long-lived assets, goodwill and identifiable intangible assets. The Company has performed an impairment review for the years ended December 31, 2015 and 2014 and recorded immaterial impairment losses.
Fair Value of Equity Investment—The Company utilizes the equity method of accounting with respect to its investment in TyraTech Inc. (“TyraTech”), a Delaware corporation that specializes in developing, marketing and selling pesticide products containing essential oils and other natural ingredients. In February 2014, TyraTech issued 37,391,763 shares, raising approximately £1.87 ($3.1) million. In July 2014, TyraTech issued a further 50,000,000 shares and raised approximately £3.5 ($5.9) million. Due to the share issuance in both periods, the Company recognized a total gain of $954 from the dilution of the Company’s ownership position pursuant to ASC 323. In October 2014, the Company exercised warrants in the amount of $500 and purchased 6,155,000 shares in TyraTech. In November 2015, TyraTech issued a further 105,333,333 shares and raised approximately £3.2 ($4.8) million. Due to the share issuance, the Company recognized a loss of $7 (for 2015) from the dilution of the Company’s ownership position pursuant to ASC 323. As of December 31, 2015, the Company’s ownership position in TyraTech was approximately 15.11%. As a result of the reduced equity share, the Company re-assessed its choice of equity method accounting for the investment and determined that it retains significant influence by retaining one out of the five board seats and accordingly, this method of accounting continues to be appropriate. At December 31, 2015, the carrying value of the Company’s investment in TyraTech was $2,536 and the quoted market value based on TyraTech’s share price (Level 1 input) was $1,850. At December 31, 2015, the Company performed an impairment review of its investment in TyraTech and concluded that the current condition was temporary and consequently determined that no impairment change was appropriate. TyraTech’s shares trade on the AIM market of the London Stock Exchange under the trading symbol ‘TYR’. The Company’s equity investment is included in other assets on the consolidated balance sheet.
Fair Value of Financial Instruments—The carrying values of cash, receivables and accounts payable approximate their fair values because of the short maturity of these instruments. The fair value of the Company’s long-term debt and note payable to our lender group is estimated based on the quoted market prices for the same or similar issues or on the current rates offered to the Company for debt of the same remaining maturities. Such fair value approximates the respective carrying values of the Company’s long-term debt and note payable to bank.
The Company measures fair value based on the prices that would be received to sell an asset or paid to transfer a liability in an orderly transaction between market participants at the measurement date. Fair value measurements are based on a three-tier hierarchy that prioritizes the inputs used to measure fair value. These tiers include the following:
Level 1: Quoted prices (unadjusted) in active markets for identical assets or liabilities that are accessible at the measurement date. The fair value hierarchy gives the highest priority to Level 1 inputs.
Level 2: Observable prices that are based on inputs not quoted on active markets, but corroborated by market data. These inputs include quoted prices for similar assets or liabilities; quoted market prices in markets that are not active; or other inputs that are observable or can be corroborated by observable market data for substantially the full term of the assets or liabilities.
Level 3: Unobservable inputs are used when little or no market data is available. The fair value hierarchy gives the lowest priority to Level 3 inputs.
Income Taxes—The Company utilizes the liability method of accounting for income taxes as set forth in ASC 740. Under the liability method, deferred taxes are determined based on the temporary differences between the financial statement and tax basis of assets and liabilities using tax rates expected to be in effect during the years in which the basis differences reverse. A valuation allowance is recorded when it is more likely than not that some of the deferred tax assets will not be realized. In determining the need for valuation allowances, the Company considers projected future taxable income and the availability of tax planning strategies. If in the future the Company determines that it would not be able to realize its recorded deferred tax assets, an increase in the valuation allowance would be recorded, decreasing earnings in the period in which such determination is made.
45
Table of Contents
The Company assesses its income tax positions and records tax benefits for all years subject to examination based upon the Company’s evaluation of the facts, circumstances and information available at the reporting date. For those tax positions where there is greater than 50% likelihood that a tax benefit will be sustained, the Company has recorded the largest amount of tax benefit that may potentially be realized upon ultimate settlement with a taxing authority that has full knowledge of all relevant information. For those income tax positions where there is less than 50% likelihood that a tax benefit will be sustained, no tax benefit has been recognized in the financial statements.
Per Share Information—FASB ASC 260 requires dual presentation of basic earnings per share (“EPS”) and diluted EPS on the face of all income statements. Basic EPS is computed as net income divided by the weighted average number of shares of common stock outstanding during the period. Diluted EPS reflects potential dilution to EPS that could occur if securities or other contracts, which, for the Company, consists of restricted stock grants and options to purchase shares of the Company’s common stock, are exercised as calculated using the treasury stock method.
The components of basic and diluted earnings per share were as follows:
| 2015 | 2014 | 2013 | ||||||||||
| Numerator: |
||||||||||||
| Net income attributable to American Vanguard |
$ | 6,591 | $ | 4,841 | $ | 34,449 | ||||||
|
|
|
|
|
|
|
|||||||
| Denominator: |
||||||||||||
| Weighted average shares outstanding—basic |
28,673 | 28,436 | 28,301 | |||||||||
| Dilutive effect of stock options and grants |
564 | 476 | 598 | |||||||||
|
|
|
|
|
|
|
|||||||
| 29,237 | 28,912 | 28,899 | ||||||||||
|
|
|
|
|
|
|
|||||||
The Company excluded 1,616 stock options from the computation of diluted earnings per share for the year ended December 31, 2014, because they are anti-dilutive. For the years ended December 31, 2015 and 2013, no options were excluded from the computation.
Accounting Estimates—The preparation of financial statements in conformity with accounting principles generally accepted in the United States of America (“U.S. GAAP”) requires management to make estimates and assumptions that affect the reported amounts of assets, liabilities, revenues, and expenses at the date that the financial statements are prepared. Significant estimates relate to the allowance for doubtful accounts, inventory reserves, impairment of long-lived assets, accrued program costs, and stock based compensation and actual results could materially differ from those estimates.
Reclassifications—Certain prior years’ amounts have been reclassified to conform to the current year’s presentation.
Total comprehensive income—In addition to net income, total comprehensive income includes changes in equity that are excluded from the consolidated statements of operations and are recorded directly into a separate section of stockholders’ equity on the consolidated balance sheets. For the year ended December 31, 2015, total comprehensive income consisted of net income attributable to American Vanguard and foreign currency translation adjustments. In 2014, total comprehensive income consisted of net income attributable to American Vanguard, the change in fair value of interest rate swaps and foreign currency translation adjustments.
Stock-Based Compensation—The Company accounts for stock-based awards to employees and directors pursuant to ASC 718. When applying the provisions of ASC 718, the Company also applies the provisions of Staff Accounting Bulletin (“SAB”) No. 107 and SAB No. 110.
ASC 718 requires companies to estimate the fair value of share-based payment awards on the date of grant. The value of the portion of the award that is ultimately expected to vest is recognized as expense over the requisite service periods in the Company’s Consolidated Statement of Operations.
Stock-based compensation expense recognized during the period is based on the fair value of the portion of share-based payment awards that is ultimately expected to vest during the period. Stock-based compensation expense recognized is reduced for forfeitures pursuant to ASC 718. Estimated forfeitures recognized in the Company’s Consolidated Statement of Operations reduced compensation expense by $529, $247, and $247 for the years ended December 31, 2015, 2014, and 2013, respectively. The Company estimates that 6.6% of all restricted stock grants, 6.9% of the performance based restricted shares and 3.6% of all stock option grants that are currently vesting will be forfeited. These estimates are reviewed quarterly and revised as necessary.
46
Table of Contents
The below tables illustrate the Company’s stock based compensation, unamortized stock-based compensation, and remaining weighted average period for the year ended December 31, 2015, 2014 and 2013. This projected expense will change if any stock options and restricted stock are granted or cancelled prior to the respective reporting periods or if there are any changes required to be made for estimated forfeitures.
Stock-Based Compensation |
Unamortized Stock-Based Compensation |
Remaining Weighted Average Period (years) |
||||||||||
| December 31, 2015 |
||||||||||||
| Incentive Stock Options |
$ | 431 | $ | 887 | 2.0 | |||||||
| Performance Based Options |
149 | 331 | 2.0 | |||||||||
| Restricted Stock |
2,972 | 2,153 | 1.3 | |||||||||
| Performance Based Restricted Stock |
329 | 583 | 1.5 | |||||||||
|
|
|
|
|
|||||||||
| Total |
$ | 3,881 | $ | 3,954 | ||||||||
|
|
|
|
|
|||||||||
| December 31, 2014 |
||||||||||||
| Incentive Stock Options |
$ | 22 | $ | 1,457 | 3.0 | |||||||
| Performance Based Options |
— | 551 | 3.0 | |||||||||
| Restricted Stock |
3,963 | 4,829 | 1.8 | |||||||||
| Performance Based Restricted Stock |
168 | 1,249 | 2.1 | |||||||||
|
|
|
|
|
|||||||||
| Total |
$ | 4,153 | $ | 8,086 | ||||||||
|
|
|
|
|
|||||||||
| December 31, 2013 |
||||||||||||
| Incentive Stock Options |
$ | 764 | $ | 21 | 0.5 | |||||||
| Restricted Stock |
2,965 | 5,435 | 1.9 | |||||||||
| Performance Based Restricted Stock |
90 | 564 | 2.4 | |||||||||
|
|
|
|
|
|||||||||
| Total |
$ | 3,819 | $ | 6,020 | ||||||||
|
|
|
|
|
|||||||||
The Company uses the Black-Scholes option-pricing model (“Black-Scholes model”) to value option grants using the following weighted average assumptions:
| 2014 | ||||
| Risk free interest rate |
2.0 | % | ||
| Dividend yield |
0.9 | % | ||
| Volatility factor |
48.9 | % | ||
| Weighted average life (years) |
6.5 years | |||
The weighted average grant-date fair values of options granted during 2014 was $5.27. There were no option shares granted during 2015 and 2013.
The expected volatility and expected life assumptions are highly complex and use subjective variables. The variables take into consideration, among other things, actual and projected employee stock option exercise behavior. The Company estimates the expected term or vesting period using the “safe harbor” provisions of SAB 107 and SAB 110. The Company used historical volatility as a proxy for estimating expected volatility.
The Company values restricted stock grants using the Company’s traded stock price on the date of grant. The weighted average grant-date fair values of restricted stock grants during 2015, 2014, and 2013 were $12.68, $14.81, and $30.91, respectively.
47
Table of Contents
Recently Issued Accounting Guidance
In February 2016, The Financial Accounting Standards Board (“FASB”) issued Accounting Standards Update (“ASU”) 2015-17, Leases. The new standard establishes a right-of-use (ROU) model that requires a lessee to record a ROU asset and a lease liability on the balance sheet for all leases with terms longer than 12 months. Leases will be classified as either finance or operating, with classification affecting the pattern of expense recognition in the income statement. The new standard is effective for fiscal years beginning after December 15, 2018, including interim periods within those fiscal years. A modified retrospective transition approach is required for lessees for capital and operating leases existing at, or entered into after, the beginning of the earliest comparative period presented in the financial statements, with certain practical expedients available. The Company is currently evaluating the impact of our pending adoption of the new standard on our consolidated financial statements.
In November 2015, FASB issued ASU 2015-17, Income Taxes (Topic 740). Current GAAP requires an entity to separate deferred income tax liabilities and assets into current and noncurrent amounts in a classified statement of financial position. To simplify the presentation of deferred income taxes, the amendments in this ASU require that deferred tax liabilities and assets be classified as noncurrent in a classified statement of financial position. The amendments in this ASU apply to all entities that present a classified statement of financial position. The new standard is effective for fiscal years beginning after December 15, 2016, including interim periods within those fiscal years with early adoption permitted. The Company will follow the guidance for fiscal year 2016.
In September 2015, FASB issued ASU 2015-16, Business Combination (Topic 805). Under a Business Combination, GAAP requires that during the measurement period, the acquirer retrospectively adjusts the provisional amounts recognized at the acquisition date with a corresponding adjustment to goodwill. Those adjustments are required when new information is obtained about facts and circumstances that existed as of the acquisition date that, if known, would have affected the measurement of the amounts initially recognized or would have resulted in the recognition of additional assets or liabilities. The acquirer also must revise comparative information for prior periods presented in financial statements as needed, including revising depreciation, amortization, or other income effects as a result of changes made to provisional amounts. The amendments in this ASU eliminate the requirement to retrospectively account for those adjustments. The new standard is effective for fiscal years beginning after December 15, 2015, including interim periods within those fiscal years. The Company will follow the guidance in this ASU when applying Topic 805.
In July 2015, FASB issued ASU2015-11, Inventory (Topic 330). Topic 330 currently requires an entity to measure inventory at the lower of cost or market, where market could be replacement cost, net realizable value, or net realizable value less an approximately normal profit margin. This ASU limits the scope to inventory that is measured using first-in, first-out (FIFO) or average cost and requires inventory be measured at the lower of costs or net realizable value. The new standard is effective for fiscal years beginning after December 15, 2016, including interim periods within those fiscal years. The Company will evaluate the impact of this adoption for fiscal year 2017.
In April 2015, FASB issued ASU 2015-03, Interest – Imputation of Interest (Subtopic 835-30): Simplifying the Presentation of Debt Issuance Costs. This ASU requires that debt issuance costs related to a recognized debt liability be presented in the balance sheet as a direct deduction from the carrying amount of that debt liability, consistent with debt discounts. The recognition and measurement guidance for debt issuance costs are not affected by the amendments in this ASU. ASU 2015-03 is effective for financials statement issued for fiscal years beginning after December 15, 2015, with early adoption permitted. The Company evaluated the impact and has elected an early adoption of this update in the quarter ended June 30, 2015. This change was applied retrospectively to fiscal year 2014 and was immaterial to the consolidated financial statements. In conjunction with this adoption, the Company has made an accounting policy election to present debt issuance costs related to revolving line of credit arrangements as a deduction from the related liability.
In August 2014, FASB issued ASU 2014-15, Presentation of Financial Statements – Going Concern (Subtopic 205-40): Disclosure of Uncertainties about an Entity’s Ability to Continue as a Going Concern. This ASU requires that management of an entity assesses whether there is substantial doubt about the ability of the entity to continue as a going concern and for making the appropriate disclosures. The assessment must be performed at each annual and interim reporting period, and there is substantial doubt about an entity’s ability to continue as a going concern if it is probable that the entity will be unable to meet its obligations as they become due within 12 months of the date on which the financial statements are issued. In the assessment, management must consider the information available at the date of issuance of the financial statements, as well as mitigating factors and plans to alleviate the substantial doubt. ASU 2014-15 is effective for annual period ending after December 15, 2016 and interim periods thereafter. Early application is permitted. Upon adoption, the Company will follow the guidance in this ASU when assessing going concern.
In June 2014, FASB issued ASU 2014-12, Compensation—Stock Compensation (Topic 718): Accounting for Share-Based Payments When the Terms of an Award Provide That a Performance Target Could Be Achieved after the Requisite Service Period, a consensus of the FASB Emerging Issues Task Force. ASU 2014-12 requires that a performance target that affects vesting of share-based payment awards and that could be achieved after the requisite service period be treated as a performance condition. Compensation cost should be recognized in the period in which it becomes probable that the performance target will be achieved and should represent the compensation cost attributable to the periods for which the requisite service has already been rendered. If the performance target becomes probable of being achieved before the end of the requisite service period, the remaining unrecognized compensation cost should be recognized prospectively over the remaining requisite service period. The total amount of compensation cost recognized during and after the requisite service period should reflect the number of awards that are expected to vest and should be adjusted to reflect those awards that ultimately vest. The requisite service period ends when the employee can cease rendering service and still be eligible to vest in the award if the performance target is achieved. ASU 2014-12 is effective for all entities for interim and annual periods
48
Table of Contents
beginning after December 15, 2015, with early adoption permitted. An entity may apply the amendments in ASU 2014-12 either (i) prospectively to all awards granted or modified after the effective date or (ii) retrospectively to all awards with performance targets that are outstanding as of the beginning of the earliest annual period presented in the financial statements and to all new or modified awards thereafter. The adoption of ASU 2014-12 is not expected to have a material impact on the Company’s consolidated financial condition or results of operations. The Company adopted this ASU for interim and annual periods of 2015.
In May 2014, the FASB issued ASU 2014-09, Revenue from Contracts with Customers. ASU 2014-09 outlines a new, single comprehensive model for entities to use in accounting for revenue arising from contracts with customers and supersedes most current revenue recognition guidance, including industry-specific guidance. This new revenue recognition model provides a five-step analysis in determining when and how revenue is recognized. The new model will require revenue recognition to depict the transfer of promised goods or services to customers in an amount that reflects the consideration a company expects to receive in exchange for those goods or services. The standard is effective for annual periods beginning after December 15, 2017, and interim periods therein, using either of the following transition methods: (i) a full retrospective approach reflecting the application of the standard in each prior reporting period with the option to elect certain practical expedients, or (ii) a retrospective approach with the cumulative effect of initially adopting ASU 2014-09 recognized at the date of adoption (which includes additional footnote disclosures). The Company is currently evaluating the impact of our pending adoption of ASU 2014-09 on our consolidated financial statements and have not yet determined the method by which we will adopt the standard in 2018 or its impact on our consolidated financial statements.
(1) Property, Plant and Equipment
Property, plant and equipment at December 31, 2015 and 2014 consist of the following:
| 2015 | 2014 | Estimated useful lives |
||||||||||
| Land |
$ | 2,458 | $ | 2,458 | ||||||||
| Buildings and improvements |
14,726 | 14,380 | 10 to 30 years | |||||||||
| Machinery and equipment |
113,506 | 107,899 | 3 to 15 years | |||||||||
| Office furniture, fixtures and equipment |
4,997 | 4,698 | 3 to 10 years | |||||||||
| Automotive equipment |
491 | 374 | 3 to 6 years | |||||||||
| Construction in progress |
3,413 | 3,432 | ||||||||||
|
|
|
|
|
|||||||||
| 139,591 | 133,241 | |||||||||||
| Less accumulated depreciation |
(91,619 | ) | (83,215 | ) | ||||||||
|
|
|
|
|
|||||||||
| $ | 47,972 | $ | 50,026 | |||||||||
|
|
|
|
|
|||||||||
For the years ended December 31, 2015, 2014, and 2013, the Company’s aggregate depreciation expense related to property and equipment was $8,953, $9,622, and $8,493, respectively. For the years ended December 31, 2015 and 2014, the Company eliminated from assets and accumulated depreciation $549 and $5,358 of fully depreciated assets, respectively. There was no such elimination in 2013.
49
Table of Contents
(2) Long-Term Debt
Long-term debt of the Company at December 31, 2015 and 2014 is summarized as follows:
| 2015 | 2014 | |||||||
| Revolving line of credit(a) |
$ | 69,000 | $ | 99,400 | ||||
| Notes payable |
55 | 126 | ||||||
|
|
|
|
|
|||||
| 69,055 | 99,526 | |||||||
| Less current installments |
(55 | ) | (71 | ) | ||||
| Less deferred loan fees |
(679 | ) | (850 | ) | ||||
|
|
|
|
|
|||||
| $ | 68,321 | $ | 98,605 | |||||
|
|
|
|
|
|||||
Approximate principal payments on long-term debt at December 31, 2015 are as follows:
| 2016 |
$ | 55 | ||
| 2017 |
— | |||
| 2018 |
69,000 | |||
|
|
|
|||
| $ | 69,055 | |||
|
|
|
| a) | On July 11, 2014, AMVAC Chemical Corporation (“AMVAC”), the Company’s principal operating subsidiary, as borrower, and affiliates (including the Company), as guarantors and/or borrowers, entered into a First Amendment to Second Amended and Restated Credit Agreement (the “First Amendment”) with a group of commercial lenders led by Bank of the West (AMVAC’s primary bank) as agent, swing line lender and L/C issuer. The First Amendment amends the Second Amended and Restated Credit Agreement (“2013 Credit Agreement”) dated as of June 17, 2013. Under the terms of the First Amendment, the Consolidated Funded Debt Ratio was increased for the third and fourth quarters of 2014 and the first quarter of 2015, and, further, borrowers are permitted to pay cash dividends to stockholders during the first and second quarters of 2015, notwithstanding prior levels of net income. The 2013 Credit Agreement, as amended by the First Amendment (the “Credit Agreement”) is a senior secured lending facility with a five year term and consisting of a revolving line of credit of $200 million and an accordion feature for up to $100 million. The Credit Agreement includes both AMVAC CV and AMVAC BV as borrowers. Under the Credit Agreement, revolving loans bear interest at a variable rate based, at borrower’s election with proper notice, on either (i) LIBOR plus the “Applicable Rate” which is based upon the Consolidated Funded Debt Ratio (“Eurocurrency Rate Loan”) or (ii) the greater of (x) the Prime Rate, (y) the Federal Funds Rate plus 0.5%, and (z) the Daily One-Month LIBOR Rate plus 1.00%, plus, in the case of (x), (y) or (z) the Applicable Rate (“Alternate Base Rate Loan”). Interest payments for Eurocurrency Rate Loans are payable on the last day of each interest period (either one, two, three or six months, as selected by the borrower) and the maturity date, while interest payments for Alternate Base Rate Loans are payable on the last business day of each month and the maturity date. The senior secured revolving line of credit matures on June 17, 2018. |
The Company has used a pay fixed, receive 1M LIBOR (London Interbank Offered Rate) interest rate swap to manage the interest expense generated by variable rate debt. At December 31, 2015 and December 31, 2014 the Company did not have an interest rate swap in place. At December 31, 2013, the Company had in place an interest rate swap, the use of which resulted in a fixed interest rate of 3.39% for the portion of variable rate debt that was covered by the interest rate swap contract. The interest rate swap contract was put in place on March 30, 2011 and expired on December 31, 2014. The table below shows the amount of outstanding debt and the related notional amount on the interest rate swap contract at each of the balance sheet dates:
| Outstanding Variable Rate Debt |
Notional Amount on Interest Rate Swap |
|||||||
| At December 31, 2013 |
51,550 | 36,750 | ||||||
| At December 31, 2014 |
99,400 | — | ||||||
| At December 31, 2015 |
69,000 | — | ||||||
50
Table of Contents
Under the New Credit Agreement, the Company has three key covenants (with which it was in compliance throughout the year and as of December 31, 2015). The covenants are as follows: (1) the Company must maintain its borrowings below a certain consolidated funded debt ratio, (2) the Company has a limitation on its annual spending on the acquisition of fixed asset capital additions, and (3) the Company must maintain a certain consolidated fixed charge coverage ratio.
As of April 14, 2015, AMVAC, registrant’s principal operating subsidiary, as borrower, and affiliates (including registrant), as guarantors and/or borrowers, entered into a Second Amendment to Second Amended and Restated Credit Agreement (the “Second Amendment”) with a group of commercial lenders led by Bank of the West (AMVAC’s primary bank) as agent, swing line lender and L/C issuer. Under the Second Amendment, the Consolidated Funded Debt Ratio was increased for the second, third and fourth quarters of 2015 (to 3.5-to-1 from 3.25-to-1) and a fixed charge covenant, requiring, in effect, that the ratio of consolidated current assets to consolidated current liabilities exceed 1.2-to-1 for the duration of the term of the credit facility, was added.
At December 31, 2015, total indebtedness is $69,055 as compared to $99,526 at December 31, 2014. At December 31, 2015, based on its performance against the most restrictive covenants listed above, the Company has the capacity to increase its borrowings by up to the maximum of $67,624 according to the terms of the Credit Agreement.
Substantially all of the Company’s assets are pledged as collateral under the Credit Agreement.
The Company’s main bank is Bank of the West, a wholly-owned subsidiary of the French bank, BNP Paribas. Bank of the West has been the Company’s bank for more than 30 years. Bank of the West is the syndication manager for the Company’s loans and acts as the counterparty on the Company’s derivative transactions.
The Company has various loans in place that together constitute the short-term and long-term loan balances shown in the consolidated balance sheets at December 31, 2015 and December 31, 2014. These are summarized in the following table:
| Indebtedness |
December 31, 2015 | December 31, 2014 | ||||||||||||||||||||||
| $000’s |
Long-term | Short-term | Total | Long-term | Short-term | Total | ||||||||||||||||||
| Revolving line of credit |
$ | 69,000 | $ | — | $ | 69,000 | $ | 99,400 | $ | — | $ | 99,400 | ||||||||||||
| Deferred loan fees |
(679 | ) | — | (679 | ) | (850 | ) | — | (850 | ) | ||||||||||||||
| Notes payable |
— | 55 | 55 | 55 | 71 | 126 | ||||||||||||||||||
|
|
|
|
|
|
|
|
|
|
|
|
|
|||||||||||||
| Total indebtedness |
$ | 68,321 | $ | 55 | $ | 68,376 | $ | 98,605 | $ | 71 | $ | 98,676 | ||||||||||||
|
|
|
|
|
|
|
|
|
|
|
|
|
|||||||||||||
The average amount outstanding on the senior secured revolving line of credit during the years ended December 31, 2015 and 2014 was $94,765 and $94,899, respectively. The weighted average interest rate on the revolving credit line during the years ended December 31, 2015 and 2014 was 2.1% and 2.5% respectively.
(3) Income Taxes
The components of income tax (benefit) expense are:
| 2015 | 2014 | 2013 | ||||||||||
| Current: |
||||||||||||
| Federal |
$ | 573 | $ | (4,256 | ) | $ | 12,285 | |||||
| State |
417 | 251 | 3,007 | |||||||||
| Foreign |
991 | 934 | 1,101 | |||||||||
| Deferred: |
||||||||||||
| Federal |
(319 | ) | 3,492 | 2,213 | ||||||||
| State |
347 | (872 | ) | 310 | ||||||||
|
|
|
|
|
|
|
|||||||
| $ | 2,009 | $ | (451 | ) | $ | 18,916 | ||||||
|
|
|
|
|
|
|
|||||||
51
Table of Contents
Total income tax expense differed from the amounts computed by applying the U.S. Federal income tax rate of 35.0% to income before income tax expense as a result of the following:
| 2015 | 2014 | 2013 | ||||||||||
| Computed tax expense at statutory federal rates |
$ | 3,010 | $ | 1,536 | $ | 18,678 | ||||||
| Increase (decrease) in taxes resulting from: |
||||||||||||
| State taxes, net of federal income tax benefit |
454 | (11 | ) | 1,983 | ||||||||
| Domestic production deduction |
(179 | ) | 420 | (1,142 | ) | |||||||
| Income tax credits |
(662 | ) | (728 | ) | (724 | ) | ||||||
| Foreign tax rate differential |
(1,590 | ) | (2,159 | ) | (1,459 | ) | ||||||
| Subpart F income |
9 | 338 | — | |||||||||
| Equity Investment |
223 | 10 | 345 | |||||||||
| Stock Based Compensation |
244 | 219 | 461 | |||||||||
| State Tax Rate Change |
185 | (257 | ) | 83 | ||||||||
| Unrecognized tax benefits |
168 | 32 | 419 | |||||||||
| Foreign Tax Gross Up |
83 | 10 | 24 | |||||||||
| Meals and Entertainment |
73 | 76 | 103 | |||||||||
| Other expenses |
(9 | ) | 63 | 145 | ||||||||
|
|
|
|
|
|
|
|||||||
| $ | 2,009 | $ | (451 | ) | $ | 18,916 | ||||||
|
|
|
|
|
|
|
|||||||
Income before provision for income taxes and losses on equity investment are:
| 2015 | 2014 | 2013 | ||||||||||
| Domestic |
$ | 1,589 | $ | (5,196 | ) | $ | 46,520 | |||||
| Foreign |
7,373 | 8,840 | 7,314 | |||||||||
|
|
|
|
|
|
|
|||||||
| $ | 8,962 | $ | 3,644 | $ | 53,834 | |||||||
|
|
|
|
|
|
|
|||||||
Temporary differences between the financial statement carrying amounts and tax bases of assets and liabilities that give rise to significant portions of the net deferred tax liability at December 31, 2015 and 2014 relate to the following:
| 2015 | 2014 | |||||||
| Current: |
||||||||
| Inventories |
$ | 5,949 | $ | 5,558 | ||||
| State income taxes |
(215 | ) | (633 | ) | ||||
| Vacation pay accrual |
796 | 776 | ||||||
| Accrued bonuses |
543 | 95 | ||||||
| Bad debt |
45 | 45 | ||||||
| Prepaid expenses |
(1,157 | ) | (1,314 | ) | ||||
| Stock compensation |
1,781 | 2,446 | ||||||
| Other |
359 | 1,758 | ||||||
|
|
|
|
|
|||||
| Net deferred tax asset |
$ | 8,101 | $ | 8,731 | ||||
|
|
|
|
|
|||||
| Non-Current: |
||||||||
| Plant and equipment, principally due to differences in depreciation and capitalized interest |
$ | (30,038 | ) | $ | (28,365 | ) | ||
| NOL Carryforward |
658 | 361 | ||||||
| Tax credit |
524 | 319 | ||||||
| Other |
1,300 | (474 | ) | |||||
|
|
|
|
|
|||||
| Net deferred tax liability |
(27,556 | ) | (28,159 | ) | ||||
|
|
|
|
|
|||||
| Total net deferred tax liability |
$ | (19,455 | ) | $ | (19,428 | ) | ||
|
|
|
|
|
|||||
52
Table of Contents
The following is a roll-forward of the Company’s total gross unrecognized tax liabilities, not including interest and penalties, for the fiscal years ended December 31, 2015 and 2014:
| 2015 | 2014 | |||||||
| Balance at beginning of year |
$ | 1,958 | $ | 1,692 | ||||
| Additions for tax positions related to the current year |
85 | 140 | ||||||
| Additions for tax positions related to the prior year |
86 | 499 | ||||||
| Deletion for tax positions related to the prior year |
(122 | ) | (373 | ) | ||||
|
|
|
|
|
|||||
| Balance at end of year |
$ | 2,007 | $ | 1,958 | ||||
|
|
|
|
|
|||||
The Company recognizes accrued interest and penalties related to unrecognized tax benefits in the provision for income taxes in the Company’s consolidated financial statements. For the year ended December 31, 2015 and 2014, the Company had recognized approximately $335 and $215, respectively in interest and penalties related to unrecognized tax benefits accrued.
It is expected that the amount of unrecognized tax benefits will change within the next 12 months; however we do not expect the change to have a significant impact on our consolidated financial statements. At this time, an estimate of the range of the reasonable possible outcomes cannot be made.
The Company believes it is more likely than not that the deferred tax assets detailed in the table above will be realized in the normal course of business. It is the intent of the Company that undistributed earnings of foreign subsidiaries are permanently reinvested and, accordingly, no deferred liability for federal and state income taxes has been recorded. The amount of undistributed earnings was $29,774 and $22,944 as of December 31, 2015 and December 31, 2014, respectively. Upon distribution of earnings in the form of dividends or otherwise, the Company would be subject to both federal and state income taxes (less any applicable foreign tax credits) and withholding taxes payable to the various foreign countries. Determination of the unrecognized deferred income tax liability is not practical due to the complexities of a hypothetical calculation.
The Company is subject to U.S. federal income tax as well as to income tax in multiple state jurisdictions. Federal income tax returns of the Company are subject to Internal Revenue Service (“IRS”) examination for the 2012 through 2014 tax years. State income tax returns are subject to examination for the 2011 through 2014 tax years.
The Company has been notified by the IRS of its intent to examine the Company’s federal income tax returns for the years ended December 31, 2012 through December 31, 2014. Currently the results of the audit are not determinable since the audit is still in its initial phase.
(4) Litigation and Environmental
A. DBCP Cases
Over the course of the past 30 years, AMVAC and/or the Company have been named or otherwise implicated in a number of lawsuits concerning injuries allegedly arising from either contamination of water supplies or personal exposure to 1, 2-dibromo-3-chloropropane (“DBCP®”). DBCP was manufactured by several chemical companies, including Dow Chemical Company, Shell Oil Company and AMVAC and was approved by the U.S. EPA to control nematodes. DBCP was also applied on banana farms in Latin America. The U.S. EPA suspended registrations of DBCP in October 1979, except for use on pineapples in Hawaii. The U.S. EPA suspension was partially based on 1977 studies by other manufacturers that indicated a possible link between male fertility and exposure to DBCP among their factory production workers involved with producing the product.
At present, there are three domestic lawsuits and approximately 85 Nicaraguan lawsuits filed by former banana workers in which AMVAC has been named as a party. Only two of the Nicaraguan actions have actually been served on AMVAC.
As described more fully below, activity in domestic cases during 2015 is as follows: in Hawaii, Patrickson, et. al. v. Dole Food Company, et. al which had been dismissed in 2011 (for expiration of the statute of limitations), remains on appeal; and Adams, from which co-defendant Dole was dismissed, is on appeal with respect to such dismissal and, at any rate,
53
Table of Contents
involves claims that pre-dated AMVAC’s sales into the relevant market. All but one matter that had been pending in Louisiana and Delaware have been dismissed (and affirmed on appeal) based upon the applicable statutes of limitation. The pending Delaware matter is more fully described below. With respect to Nicaraguan matters, there was no change in status during 2015.
Delaware Matter
On or about May 31, 2012, HendlerLaw, P.C., which represents plaintiffs in seven related matters that had been pending before the United States District Court for the Eastern District of Louisiana (the “Hendler-Louisiana Cases” referred to in the Company’s Form 10-K for the period ended December 31, 2011 as Aguilar et al., v. Dole Fruit Company, Inc., et al (U.S.D.C., E.D. of LA No. CV-01305-CJB-SS)), filed nine separate actions, eight with the United States District Court for the District of Delaware (USCD DE No. 1:12-CV-00696-RGA)) and one with the Superior Court of the State of Delaware (which, for purposes of this filing shall be referred to as Chaverri et al. v. Dole Food Company, Inc. et al., case no. N12C-06-017-JOH). Six of the eight Hendler – Delaware cases and Chaverri involve claims for personal injury allegedly arising from exposure to DBCP on behalf of 235 banana workers from Costa Rica, Ecuador and Panama. Dole subsequently brought a motion to dismiss these seven matters under the “first-to-file” theory of jurisdiction, specifically in light of the fact that they involved identical claims and claimants as those appearing in the Hendler – Louisiana cases. These Delaware matters have been consolidated into one matter (the “Hendler-Delaware Case”). On August 21, 2012, the U.S. District Court in the Hendler-Delaware case granted defendants’ motion to dismiss the actions with prejudice, finding that the same claimants and claims had been pending in the Hendler-Louisiana cases where they had been first filed.
In October 2012, the federal district court in Louisiana granted defendant’s motion for summary judgment and dismissed the Hendler-Louisiana Cases for plaintiffs’ failure to bring the action within the applicable statute of limitations. Plaintiffs appealed the dismissal of the Hendler-Louisiana cases and, on September 19, 2013, the Fifth Circuit Court of Appeal upheld the lower court’s decision, finding no reason to reverse the dismissal.
On October 16, 2013, Plaintiffs filed a notice of appeal in the Hendler-Delaware case. Oral argument was heard before the Third Circuit Court of Appeal on June 24, 2014 in connection with that appeal, and, on August 11, 2015, the Third Circuit upheld the lower court’s dismissal of the Hendler-Delaware case. However, plaintiffs petitioned for rehearing en banc, arguing that, despite the fact that the same plaintiffs had made the same claims before another court (namely, the Louisiana court in the Hendler-Louisiana cases), because the Louisiana court had not decided the case on the merits (but, rather, on the basis of the statute of limitations), the Delaware trial court lacked the power to dismiss the Hendler-Delaware case with prejudice. On September 22, 2015, the Third Circuit vacated its previous ruling (to uphold the lower court dismissal) and the appeal was reheard en banc on February 17, 2016. The Company expects that a decision will be issued in 9 to 12 months. The Company believes the Hendler-Delaware case has no merit and, further, that a loss is neither probable nor reasonably estimable; accordingly, it has not recorded a loss contingency.
54
Table of Contents
Hawaiian Matters
Patrickson, et. al. v. Dole Food Company, et al In October 1997, AMVAC was served with two complaints in which it was named as a defendant, filed in the Circuit Court, First Circuit, State of Hawai’i and in the Circuit Court of the Second Circuit, State of Hawai’i (two identical suits) entitled Patrickson, et. al. v. Dole Food Company, et. al (“Patrickson Case”) alleging damages sustained from injuries (including sterility) to banana workers caused by plaintiffs’ exposure to DBCP while applying the product in their native countries. Other named defendants include: Dole Food Company, Shell Oil Company and Dow Chemical Company. After several years of law and motion activity, the court granted judgment in favor of the defendants based upon the statute of limitations on July 28, 2010. On August 24, 2010, the plaintiffs filed a notice of appeal. On April 8, 2011, counsel for plaintiffs filed a pleading to withdraw and to substitute new counsel. On October 21, 2015, the Hawai’i Supreme Court granted the appeal and overturned the lower court decision, ruling that the State of Hawai’i now recognizes cross-jurisdictional tolling, that plaintiffs filed their complaint within the applicable statute of limitations and that the matter is to be remanded to the lower court for further adjudication. No discovery has taken place in this matter, and, at this stage in the proceedings, the Company does not believe that a loss is either probable or reasonably estimable and, accordingly, has not recorded a loss contingency for this matter.
Adams v. Dole Food Company et al On approximately November 23, 2007, AMVAC was served with a suit filed by two former Hawaiian pineapple workers (and their spouses), alleging that they had testicular cancer due to DBCP exposure: Adams v. Dole Food Company et al in the First Circuit for the State of Hawaii. Plaintiff alleges that they were exposed to DBCP between 1971 and 1975. AMVAC denies that any of its product could have been used at the times and locations alleged by these plaintiffs. Following the dismissal of Dole Food Company on the basis of the exclusive remedy of worker’s compensation benefits, plaintiffs appealed the dismissal. That appeal has been pending since 2012. Plaintiffs’ counsel petitioned the court for substitution of counsel, but was denied on November 14, 2012. There has been no activity in the case since that time, and there is no estimated date of opinion. The Company does not believe that a loss is either probable or reasonably estimable and has not recorded a loss contingency for this matter.
Nicaraguan Matters
A review of court filings in Chinandega, Nicaragua, has found 85 suits alleging personal injury allegedly due to exposure to DBCP and involving approximately 3,592 plaintiffs have been filed against AMVAC and other parties. Of these cases, only two – Flavio Apolinar Castillo et al. v. AMVAC Chemical Corporation et al., No. 535/04 and Luis Cristobal Martinez Suazo et al. v. AMVAC Chemical Corporation et al., No. 679/04 Castillo and Suazo, (which were filed in 2004 and involve 15 banana workers) have been served on AMVAC. All but one of the suits in Nicaragua have been filed pursuant to Special Law 364, an October 2000 Nicaraguan statute that contains substantive and procedural provisions that Nicaragua’s Attorney General previously expressed as unconstitutional. Each of the Nicaraguan plaintiffs’ claims $1,000 in compensatory damages and $5,000 in punitive damages. In all of these cases, AMVAC is a joint defendant with Dow Chemical Company and Dole Food Company, Inc. AMVAC contends that the Nicaragua courts do not have jurisdiction over it and that Public Law 364 violates international due process of law. AMVAC has objected to personal jurisdiction and demanded under Law 364 that the claims be litigated in the United States. In 2007, the court denied these objections, and AMVAC appealed the denial. It is not presently known as to how many of these plaintiffs actually claim exposure to DBCP at the time AMVAC’s product was allegedly used nor is there any verification of the claimed injuries. Further, to date, plaintiffs have not had success in enforcing Nicaraguan judgments against domestic companies before U.S. courts. With respect to these Nicaraguan matters, AMVAC intends to defend any claim vigorously. Furthermore, the Company does not believe that a loss is either probable or reasonably estimable and has not recorded a loss contingency for these matters.
B. Other Matters
U.S. EPA RCRA Matter On or about March 24, 2015, Region 4 of the U.S. EPA issued to registrant’s principal operating subsidiary, AMVAC, an Opportunity to Show Cause why U.S. EPA should not take formal action under Section 3008(a) of the Resource Conservation and Recovery Act (RCRA) for potential noncompliance arising from AMVAC’s importation, transportation and storage of used, depleted Lock‘N Load containers having residual amounts of its product Thimet. AMVAC believes that these containers were properly handled and stored under, among others, the applicable provisions of the FIFRA relating to recycling and disposal of depleted, refillable containers (and their contents). AMVAC responded to the substance of the show cause letter on April 10, 2015 and has engaged in multiple discussions with U.S. EPA on the matter. While violations of RCRA, if any, may carry civil penalties, it is too early in the matter to determine whether a loss is probable or reasonably estimable. Accordingly, registrant has not recorded a loss contingency on this matter.
U.S. EPA RMP Matter On October 28 2015, Region 4 of the U.S. EPA provided AMVAC with notice of potential violations under Section 112(r)(7) of the Clean Air Act relating to the Company’s risk management program (“RMP”) at the its Axis, Alabama manufacturing facility. The notice arose from an inspection of the subject facility conducted by a U.S. EPA consultant on August 6, 2014 and cited several potential violations relating largely to processes, documentation and training. The potential violations could carry civil, administrative or criminal penalties under applicable law. The Company has investigated the matters cited in the notice, and has established a timeline for furnishing a formal response and otherwise meeting with the agency. At this stage, however, it is too early to determine whether a loss is probable or reasonably estimable. Accordingly, registrant has not recorded a loss contingency on this matter.
55
Table of Contents
Galvan v. AMVAC In an action entitled Graciela Galvan v. AMVAC Chemical Corp. filed on April 7, 2014 with the Superior Court for the State of California for the County of Orange (No. 00716103CXC) plaintiff, a former employee, alleges violations of wages and hours requirements under the California Labor Code. The Company has completed the deposition of putative class representative and participated in mediation on the matter. The Company continues to believe that all of the claims are without merit and intends to defend the matter vigorously. Further, the Company does not believe that a loss is probable or reasonably estimable and has not recorded a loss contingency for the matter.
Navarro v. AMVAC On May 28, 2015, former employee, Silvano Navarro (who abandoned his position after electing not to take a leave of absence under FMLA) delivered a written claim to the Company in which he alleged that he was damaged due to discrimination for disability and a host of other labor and employment charges. Subsequently, the unemployment compensation board (in an unrelated proceeding) ruled against awarding Mr. Navarro unemployment compensation, finding that he had left his position of his own choice, that the Company had offered him a leave of absence and that, even after his departure, his managers tried to get him to return to work. The parties met in November 2015 to mediate the matter and discontinued the mediation in order to complete further internal investigation. The Company believes that a loss is probable and reasonably estimable and has recorded a loss contingency for the matter in an amount that is not material.
Schiemer Farms v. AMVAC On or about May 12, 2015, Farmers Supply Co-op, made a written claim against the Company for losses from the alleged failure of the Company’s soil fumigant, Vapam, to control weeds on an onion crop that was harvested in late 2014. The grower alleges a loss of yield in the amount of $1.2 million. The Company has been in informal discussion with claimant (which applied the product) and grower and does not believe that claimant is entitled to the relief that it seeks. The parties have been in settlement discussions for the past few months. Based upon its understanding of the facts at this stage, the Company believes that a loss is probable and reasonably estimable and has recorded a loss contingency for the matter in an amount that is not material.
Walker v. AMVAC On or about May 9, 2015, former consultant, Larry Walker, made a written claim against the Company for alleged breach of contract and patent infringement arising from the Company’s having obtained a patent (US PTO 8,921,270) for use of the compound ametryn as a standalone burndown herbicide on corn. Mr. Walker alleges, among other things, that he invented the claims set forth in that patent. The Company believes that Mr. Walker’s allegations have no merit and that its own scientists invented the patented method. At this stage, the Company does not believe that a loss is either probable or reasonably estimable and has not recorded a loss contingency for the matter.
(5) Employee Deferred Compensation Plan and Employee Stock Purchase Plan
The Company maintains a deferred compensation plan (“the Plan”) for all eligible employees. The Plan calls for each eligible employee, at the employee’s election, to participate in an income deferral arrangement under Internal Revenue Code Section 401(k). The plan allows eligible employees to make contributions which cannot exceed 100% of compensation, or the annual dollar limit set by the Internal Revenue Code. The Company matches the first 5% of employee contributions. The Company’s contributions to the Plan amounted to $1,261, $1,445 and $1,330 in 2015, 2014 and 2013, respectively.
During 2001, the Company’s Board of Directors adopted the AVD Employee Stock Purchase Plan (the “ESPP Plan”). The Plan allows eligible employees to purchase shares of common stock through payroll deductions at a discounted price. An aggregate of approximately 1,000,000 shares of the Company’s Common Stock, par value $.10 per share (subject to adjustment for any stock dividend, stock split or other relevant changes in the Company’s capitalization) may be sold pursuant to the Plan, which is intended to qualify under Section 423 of the Internal Revenue Code. The Plan allows for purchases in a series of offering periods, each six months in duration, with new offering periods (other than the initial offering period) commencing on January 1 and July 1 of each year. The initial offering period commenced on July 1, 2001. Pursuant to action taken by the Company’s Board of Directors in December 10, 2010, the expiration of the Plan was extended to December 31, 2013. The Plan was amended and restated on June 30, 2011 following stockholders’ ratification of the extended expiration date. In December 2013, the Board of Directors resolved to extend the expiration date of the Plan five years, that is, until December 31, 2018. Under the Plan, as amended as of June 30, 2011, 995,000 shares of the Company’s common stock were authorized. As of December 31, 2015 and 2014, 803,555 and 854,007 shares remained available under the plan, respectively. The expense recognized under the Plan was immaterial during the years ended December 31, 2015 and 2014.
Shares of common stock purchased through the Plan in 2015, 2014 and 2013 were 50,452, 47,213 and 27,923, respectively.
56
Table of Contents
(6) Major Customers and Export Sales
In 2015, there were three companies that accounted for 18%, 12% and 8% of the Company’s consolidated sales. In 2014, there were three companies that accounted for 20%, 11%, and 8% of the Company’s consolidated sales. In 2013, there were three companies that accounted for 17%, 13% and 8% of the Company’s consolidated sales.
The Company primarily sells its products to large distributors, buying cooperatives and groups and extends credit based on an evaluation of the customer’s financial condition. The Company had three significant customers who each accounted for approximately 14%, 11% and 10% of the Company’s receivables as of December 31, 2015. The Company had three significant customers who each accounted for approximately 21%, 12% and 10% of the Company’s receivables as of December 31, 2014 and 14%, 10% and 8% of the Company’s receivables as of December 31, 2013. The Company has long-standing relationships with its customers and the Company considers the credit risk to be low.
Worldwide export sales for 2015, 2014 and 2013 were as follows:
| 2015 | 2014 | 2013 | ||||||||||
| Mexico |
$ | 17,096 | $ | 14,601 | $ | 15,661 | ||||||
| South & Central America |
15,970 | 16,585 | 15,491 | |||||||||
| Europe |
12,350 | 13,249 | 12,942 | |||||||||
| Asia |
13,847 | 7,683 | 8,129 | |||||||||
| Africa |
8,622 | 9,310 | 8,322 | |||||||||
| Australia |
4,158 | 4,202 | 2,692 | |||||||||
| Canada |
1,585 | 4,910 | 3,976 | |||||||||
| Middle East |
3,230 | 3,166 | 2,500 | |||||||||
| Other |
437 | — | 59 | |||||||||
|
|
|
|
|
|
|
|||||||
| $ | 77,295 | $ | 73,706 | $ | 69,772 | |||||||
|
|
|
|
|
|
|
|||||||
(7) Royalties
The Company entered into a licensing agreement in December 2012 that requires a minimum annual royalty payable through 2022. Those agreements related to the acquisition of certain products as well as various licensing arrangements, none of which contained a minimum royalty provision. Certain royalty agreements contain confidentiality covenants. Royalty expenses were $111, $33 and $116 for 2015, 2014 and 2013, respectively.
(8) Product Acquisitions
During 2015, the Company entered into two acquisitions with a combined purchase consideration of $36,667. The combined allocation of the 2015 acquisitions was $29,567 to product rights, $5,100 to trademarks and $2,000 to customer lists. The amount of goodwill allocated to the product acquisitions was not material. Results of the 2015 acquisitions were included in the Company’s operations from the dates of the respective acquisitions.
Pro forma financial information for these acquisitions has not been included as the computation of such information is impracticable and too onerous due to system limitation and unavailability of historical data. The acquisitions completed in 2015 were as follows:
On April 29, 2015 the registrant’s international subsidiary, AMVAC C.V., completed the acquisition of certain assets relating the bromacil herbicide product line from Dupont Crop Protection. The assets acquired included the Hyvar® and Krovar® trademarks, product registrations, product registration data, customer information, access to certain know-how, technical registrations and associated registration data in all markets outside of North America. Bromacil is a broad spectrum residual herbicide used on crops such as pineapples, citrus, agave and asparagus, and is marketed globally under the Hyvar® and Krovar® brands. Bromacil herbicides are important weed control tools and are used in countries such as Japan, Philippines, Thailand, Mexico, Cost Rica and Brazil. The acquisition is consistent with the Company’s long term strategic plan. The Company assessed the acquisition as a business combination under ASC 805 (Business Combinations). During the quarter ended December 31, 2015, the Company finalized purchase accounting entries including allocating the entire consideration to product lines, trademarks and customer lists.
On April 6, 2015 the registrant’s international subsidiary, AMVAC C.V., completed the acquisition of certain assets relating to the Nemacur® insecticide/nematicide product line from Adama Agricultural Solutions Ltd (“Adama”). The assets acquired include all trademarks, product registrations, associated registration data, and customer information that relate to the marketing and sale of this crop protection product in Europe. Nemacur is a highly effective insecticide/nematicide used to control soil insects and nematodes on many fruit and vegetable crops. The acquisition is consistent with the Company’s long term strategic plan. The Company assessed the acquisition as a business combination under ASC 805 (Business Combinations). During the quarter ended December 31, 2015, the Company finalized purchase accounting entries including allocating the entire considerations to product lines, trademarks and customer lists.
57
Table of Contents
The following schedule represents intangible assets recognized in connection with product acquisitions (See description of Business, Basis of Consolidation and Significant Accounting Policies for the Company’s accounting policy regarding intangible assets):
| Amount | ||||
| Intangible assets at December 31, 2012 |
$ | 113,521 | ||
| Impact of movement in exchange rates |
(162 | ) | ||
| Amortization expense |
(6,352 | ) | ||
|
|
|
|||
| Intangible assets at December 31, 2013 |
$ | 107,007 | ||
| Write off during fiscal 2014 |
(319 | ) | ||
| Impact of movement in exchange rates |
(86 | ) | ||
| Amortization expense |
(6,391 | ) | ||
|
|
|
|||
| Intangible assets at December 31, 2014 |
$ | 100,211 | ||
| Additions during fiscal 2015 |
36,667 | |||
| Write offs during fiscal 2015 |
(33 | ) | ||
| Impact of movement in exchange rates |
(197 | ) | ||
| Amortization expense |
(7,488 | ) | ||
|
|
|
|||
| Intangible assets at December 31, 2015 |
$ | 129,160 | ||
|
|
|
|||
The following schedule represents the gross carrying amount and accumulated amortization of the intangible assets. Product rights are amortized over their expected useful lives of 25 years. Customer lists are amortized over their expected useful lives of ten years, and trademarks are amortized over their expected useful lives of 25 years.
| 2015 | 2014 | |||||||||||||||||||||||
| $000’s |
Gross | Accumulated Amortization |
Net Book Value |
Gross | Accumulated Amortization |
Net Book Value |
||||||||||||||||||
| Product Rights |
$ | 167,694 | $ | 56,233 | $ | 111,461 | $ | 138,466 | $ | 49,796 | $ | 88,670 | ||||||||||||
| Customer Lists |
3,091 | 744 | 2,347 | 1,091 | 437 | 654 | ||||||||||||||||||
| Trademarks |
18,041 | 2,689 | 15,352 | 12,941 | 2,054 | 10,887 | ||||||||||||||||||
|
|
|
|
|
|
|
|
|
|
|
|
|
|||||||||||||
| Total Intangibles |
$ | 188,826 | $ | 59,666 | $ | 129,160 | $ | 152,498 | $ | 52,287 | $ | 100,211 | ||||||||||||
|
|
|
|
|
|
|
|
|
|
|
|
|
|||||||||||||
The following schedule represents future amortization charges related to intangible assets:
| Year ending December 31, |
||||
| 2016 |
$ | 8,068 | ||
| 2017 |
8,068 | |||
| 2018 |
8,068 | |||
| 2019 |
8,068 | |||
| 2020 |
8,068 | |||
| Thereafter |
88,820 | |||
|
|
|
|||
| $ | 129,160 | |||
|
|
|
|||
58
Table of Contents
The following schedule represents the Company’s obligations under product acquisitions and licensing agreements:
| Amount | ||||
| Obligations under acquisition agreements at December 31, 2012 |
$ | 11,900 | ||
| Adjustment to deferred liabilities |
(297 | ) | ||
| FX impact |
(1 | ) | ||
| Amortization of discounted liabilities |
174 | |||
| Payments on existing obligations |
(7,890 | ) | ||
|
|
|
|||
| Obligations under acquisition agreements at December 31, 2013 |
$ | 3,886 | ||
| Adjustment to deferred liabilities |
(32 | ) | ||
| Amortization of discounted liabilities |
324 | |||
| Payments on existing obligations |
(1,686 | ) | ||
|
|
|
|||
| Obligations under acquisition agreements at December 31, 2014 |
$ | 2,492 | ||
| Additional obligations acquired |
1,867 | |||
| Adjustment to deferred liabilities |
65 | |||
| Amortization of discounted liabilities |
135 | |||
| Payments on existing obligations |
(2,524 | ) | ||
|
|
|
|||
| Obligations under acquisition agreements at December 31, 2015 |
$ | 2,035 | ||
|
|
|
|||
In each of the past three fiscal years, the Company has remeasured the fair value of the earn out liabilities related to the acquisitions completed in the first quarter of 2010. Based on the remeasurement; in 2015, the fair value was increased by $65 and thereby increased operating expenses by $65; in 2014, the fair value was reduced by $32, thereby reduced operating expenses by $32; and in 2013, the fair value was reduced by $297, thereby reduced operating expenses by $297.
As of December 31, 2015, the $2,035 in remaining obligations under product acquisitions and licensing agreements is included in other liabilities.
(9) Commitments
The Company has various lease agreements for offices as well as long-term ground leases for its facilities at Axis, AL, Hannibal, MO and Marsing, ID. The office leases contain provisions to pass through to the Company its pro-rata share of certain of the building’s operating expenses. The long-term ground lease at Axis, AL is for twenty years (commencing May 2001) with up to five automatic renewals of three years each for a total of thirty-five years. The long-term ground lease at Hannibal, MO is for a period of 20 years (commencing December 2007) with automatic one year extensions thereafter, subject to termination with a twelve-month notice. The long-term ground lease at Marsing is for a period of 25 years (commencing in March 2008). Rent expense for the years ended December 31, 2015, 2014 and 2013 was $947, $1,012 and $939. In addition, the Company has various vehicle lease agreements for its sales force. Vehicle lease expense for the years ended December 31, 2015, 2014 and 2013 was $435, $442, and $334.
Future minimum lease payments under the terms of the leases are as follows:
| Year ending December 31, |
||||
| 2016 |
$ | 1,333 | ||
| 2017 |
1,126 | |||
| 2018 |
1,015 | |||
| 2019 |
900 | |||
| 2020 |
906 | |||
| Thereafter |
1,298 | |||
|
|
|
|||
| $ | 6,578 | |||
|
|
|
|||
(10) Research and Development
Research and development expenses which are included in operating expenses were $6,337, $8,591and $8,604 for the years ended December 31, 2015, 2014 and 2013.
59
Table of Contents
(11) Equity Plan Awards
Under the Company’s Equity Incentive Plan of 1993, as amended (“the Plan”), all employees are eligible to receive non-assignable and non-transferable restricted stock, options to purchase common stock, and other forms of equity. As of December 31, 2015, the number of securities remaining available for future issuance under the Plan is 902,000.
Incentive Stock Option Plans (“ISOP”)
Under the terms of the Company’s ISOP, under which options to purchase common stock can be issued, all employees are eligible to receive non-assignable and non-transferable options to purchase shares. The exercise price of any option may not be less than the fair market value of the shares on the date of grant; provided, however, that the exercise price of any option granted to an eligible employee owning more than 10% of the outstanding common stock may not be less than 110% of the fair market value of the shares underlying such option on the date of grant. No options granted may be exercisable more than ten years after the date of grant.
In 2014, the Company granted incentive stock options to purchase 277,025 shares of common stock to employees. Of these options, 26,483 option shares vest on each of the first, second, and third anniversaries of the date of grant and the balance will cliff vest after three years of service. All options granted are non-assignable and non-transferable. In 2015 and 2013, no options were granted.
Option activity within each plan is as follows:
| Incentive Stock Option Plans |
Weighted Average Price Per Share |
Exercisable Weighted Average Price Per Share |
||||||||||
| Balance outstanding, December 31, 2012 |
705,345 | $ | 7.70 | $ | 7.95 | |||||||
|
|
|
|||||||||||
| Options exercised, |
(126,149 | ) | 7.50 | |||||||||
| Options forfeited |
(18,167 | ) | 7.50 | |||||||||
|
|
|
|
|
|||||||||
| Balance outstanding, December 31, 2013 |
561,029 | $ | 7.76 | $ | 7.70 | |||||||
|
|
|
|||||||||||
| Options granted, |
277,025 | 11.49 | ||||||||||
| Options exercised, |
(113,150 | ) | 7.50 | |||||||||
|
|
|
|
|
|||||||||
| Balance outstanding, December 31, 2014 |
724,904 | $ | 9.22 | $ | 7.82 | |||||||
|
|
|
|||||||||||
| Options exercised, |
(63,950 | ) | 7.50 | |||||||||
| Options forfeited, |
(34,109 | ) | 12.00 | |||||||||
|
|
|
|
|
|||||||||
| Balance outstanding, December 31, 2015 |
626,845 | $ | 9.25 | $ | 7.73 | |||||||
|
|
|
|
|
|
|
|||||||
Information relating to stock options at December 31, 2015 summarized by exercise price is as follows:
| Outstanding Weighted Average | Exercisable Weighted Average |
|||||||||||||||||||
| Exercise Price Per Share |
Shares | Remaining Life (Months) |
Exercise Price |
Shares | Exercise Price |
|||||||||||||||
| Incentive Stock Option Plan: |
||||||||||||||||||||
| $7.50 |
357,250 | 59 | $ | 7.50 | 357,250 | $ | 7.50 | |||||||||||||
| $11.32-$14.75 |
269,595 | 104 | $ | 11.56 | 16,679 | $ | 12.69 | |||||||||||||
|
|
|
|
|
|
|
|
|
|||||||||||||
| 626,845 | $ | 9.25 | 373,929 | $ | 7.73 | |||||||||||||||
|
|
|
|
|
|
|
|
|
|||||||||||||
60
Table of Contents
The weighted average exercise prices for options granted and exercisable and the weighted average remaining contractual life for options outstanding as of December 31, 2015 and 2014 was as follows:
| Number of Shares |
Weighted Average Exercise Price |
Weighted Average Remaining Contractual Life (Months) |
Intrinsic Value (thousands) |
|||||||||||||
| As of December 31, 2015: |
||||||||||||||||
| Incentive Stock Option Plans: |
||||||||||||||||
| Outstanding |
626,845 | $ | 9.25 | 79 | $ | 2,990 | ||||||||||
| Expected to Vest |
616,987 | $ | 9.21 | 78 | $ | 2,965 | ||||||||||
| Exercisable |
373,929 | $ | 7.73 | 59 | $ | 2,353 | ||||||||||
| As of December 31, 2014: |
||||||||||||||||
| Incentive Stock Option Plans: |
||||||||||||||||
| Outstanding |
724,904 | $ | 9.22 | 90 | $ | 1,774 | ||||||||||
| Expected to Vest |
713,172 | $ | 9.19 | 89 | $ | 1,773 | ||||||||||
| Exercisable |
447,879 | $ | 7.82 | 71 | $ | 1,738 | ||||||||||
The total intrinsic value of options exercised during 2015, 2014 and 2013 was $361, $1,480, and $2,365, respectively. Cash received from stock options exercised during 2015, 2014, and 2013 was $480, $849, and $946, respectively.
Nonstatutory Stock Options (“NSSO”)
The Company did not grant any non-statutory stock options during the three years ended December 31, 2015.
Restricted Stock Grants
During 2015, the Company issued a total of 73,201 shares of restricted common stock to certain employees and non-executive board members. Of these, 21,005 shares vest immediately, 7,500 shares vest after 90 days from date of grant, 3,196 shares will vest one-third each year on the anniversaries of the employee’s employment date and the balance will cliff vest after three years of service. The fair values of the grants range from $11.42 to $14.28 per share based on the publicly traded share prices at the date of grants. The total fair value of $928 is being recognized over the vesting period, which is representative of the related service periods. During 2015, 31,431 shares of common stock granted to employees were forfeited.
During 2014, the Company issued a total of 240,724 shares of restricted common stock to certain employees and non-executive board members. Vesting ranges from immediate to three years from the date of grant. The fair values of the grants range from $13.84 to $14.92 per share based on the publicly traded share prices. The total fair value of $3,566 is being recognized over the related service periods. During 2014, 20,772 shares of common stock granted to employees were forfeited. During 2013, the Company issued a total of 162,336 shares of restricted common stock to certain employees and non-executive board members. Vesting ranges from immediate to three years from the date of grant. The fair values of the grants range from $23.43 to $31.83 per share based on the publicly traded share prices at the date of grants. The total fair value of $5,018 is being recognized over the vesting period, which is representative of the related service periods. During 2013, 11,999 shares of common stock granted to employees were forfeited.
61
Table of Contents
A status summary of non-vested shares as of December 31, 2015 and 2014, are presented below:
| December 31, 2015 | December 31, 2014 | |||||||||||||||
| Number of Shares |
Weighted Average Grant Date Fair Value |
Number of Shares |
Weighted Average Grant Date Fair Value |
|||||||||||||
| Nonvested shares at January 1st |
560,842 | $ | 21.44 | 376,702 | $ | 24.85 | ||||||||||
| Granted |
73,201 | 12.68 | 240,724 | 14.81 | ||||||||||||
| Vested |
(239,771 | ) | 20.23 | (35,812 | ) | 14.74 | ||||||||||
| Forfeited |
(31,431 | ) | 22.02 | (20,772 | ) | 17.91 | ||||||||||
|
|
|
|
|
|
|
|
|
|||||||||
| Nonvested shares at December 31st |
362,841 | $ | 20.43 | 560,842 | $ | 21.44 | ||||||||||
|
|
|
|
|
|
|
|
|
|||||||||
Performance Based Stock Grants
During 2015, the Company granted a total of 10,696 performance based shares. Of these, 7,500 shares will cliff vest on January 5, 2018 with a measurement period commencing January 1, 2015 and ending December 31, 2017 and 3,196 shares will cliff vest on August 1, 2018 with a measurement period commencing July 1, 2015 and ending June 30, 2018, provided that the employees are continuously employed by the Company during the vesting period. Eighty percent of these performance based shares are based upon financial performance of the Company, specifically, an earnings before income tax (“EBIT”) goal weighted at 50% and a net sales goal weighted at 30%. The remaining 20% of performance based shares are based upon AVD stock price appreciation over the same performance measurement period. The EBIT and net sales goals measure the relative growth of the Company’s EBIT and net sales for the performance measurement period, as compared to the median growth of EBIT and net sales for an identified peer group. The stockholder return goal measures the relative growth of the fair market value of the Company’s stock price over the performance measurement period, as compared to that of the Russell 2000 Index and the median fair market value of the common stock of the comparator companies, identified in the Company’s 2015 Proxy Statement. All parts of these awards vest in three years, but are subject to reduction to a minimum (or even zero) for meeting less than the targeted performance and to increase to a maximum of 200% for meeting in excess of the targeted performance.
During 2014, the Company granted a total of 79,270 performance based shares that will cliff vest on May 23, 2017, provided that employees are continuously employed by the Company during the vesting period. Of these performance based shares, 80% are based upon financial performance of the Company, specifically, EBIT goal weighted at 50% and a net sales goal weighted at 30% for the period commencing April 1, 2014 and ending December 31, 2016; the remaining 20% of performance based shares are based upon AVD stock price appreciation (stockholder return) over the same performance measurement period. The net sales and EBIT goal measures the relative growth of the Company’s net sales and EBIT for the performance measurement period, as compared to the median growth of net sales and EBIT for an identified peer group. The stockholder return goal measures the relative growth of the fair market value of the Company’s stock price over the performance measurement period, as compared to that of the Russell 2000 Index and the median fair market value of the common stock of the comparator companies. All parts of these awards vest in three years, but are subject to reduction to a minimum (or even zero) for meeting less than the targeted performance and to increase to a maximum of 200% for meeting in excess of the targeted performance.
During 2013, the Company granted a total of 24,637 performance based shares that will cliff vest after three years of service. Of these performance based shares, 80% are based upon net income and net sales for the period commencing April 1, 2013 and ending December 31, 2015; the remaining 20% of performance based shares are based upon the Company’s stock price appreciation over the course of the period commencing June 6, 2013 and ending on December 31, 2015. Both parts of these awards vest in three years, but are subject to reduction to a minimum (or even zero) for meeting less than the targeted performance and to increase to a maximum of 200% for meeting in excess of the targeted performance.
As of December 31, 2015, performance based shares related to EBIT and net sales have an average fair value of $11.86 per share. The fair value was determined by using the publicly traded share price as of the date of grant. The performance based shares related to the Company’s stock price have an average fair value of $9.48 per share. The fair value was determined by using the Monte Carlo valuation method. For awards with performance conditions, the Company recognizes share-based compensation cost on a straight-line basis for each performance criteria over the implied service period.
62
Table of Contents
As of December 31, 2014, performance based shares related to net sales and EBIT were average fair valued at $14.92 per share. The fair value was determined by using the publicly traded share price as of the date of grant. The performance based shares related to AVD stock price were average fair valued at $12.85 per share. The fair value was determined by using the Monte Carlo valuation method. The Company is recognizing as expense the value of these shares over the required service period of three years.
As of December 31, 2013, performance based shares related to net income and net sales have an average fair value of $30.13 per share. The fair value was determined by using the publicly traded share price as of the date of grant. The performance based shares related to the Company’s stock price have an average fair value of $15.31 per share. The fair value was determined by using the Monte Carlo valuation method. For awards with performance conditions, the Company recognizes share-based compensation cost on a straight-line basis for each performance criteria over the implied service period when the Company believes it is probable that the performance targets, as defined in the agreements, will be achieved.
During 2015, 2014 and 2013, the Company recognized stock-based compensation expense related to performance based shares of $329, $168 and $90, respectively. There were no performance based shares issued by the Company prior to those issued during the quarter ended June 30, 2013.
As of December 31, 2015, the Company had approximately $583 of unamortized stock-based compensation expenses related to unvested performance based shares. This amount will be recognized over the weighted-average period of 1.5 years. This projected expense will change if any performance based shares are granted or cancelled prior to the respective reporting periods or if there are any changes required to be made for estimated forfeitures.
As of December 31, 2014, the Company had approximately $1,249 of unamortized stock-based compensation expenses related to unvested performance based shares. This amount will be recognized over the weighted-average period of 2.1 years. This projected expense will change if any performance based shares are granted or cancelled prior to the respective reporting periods or if there are any changes required to be made for estimated forfeitures.
As of December 31, 2013, the Company had approximately $564 of unamortized stock-based compensation expenses related to unvested performance based shares. This amount will be recognized over the weighted-average period of 2.4 years. This projected expense will change if any performance based shares are granted or cancelled prior to the respective reporting periods or if there are any changes required to be made for estimated forfeitures.
A status summary of non-vested shares as of December 31, 2015 and 2014, are presented below:
| December 31, 2015 | December 31, 2014 | |||||||||||||||
| Number of Shares |
Weighted Average Grant Date Fair Value |
Number of Shares |
Weighted Average Grant Date Fair Value |
|||||||||||||
| Nonvested shares at January 1st |
103,907 | $ | 17.77 | 24,637 | $ | 28.28 | ||||||||||
| Granted |
10,696 | 11.38 | 79,270 | 14.51 | ||||||||||||
| Forfeited |
(10,200 | ) | 18.43 | — | — | |||||||||||
|
|
|
|
|
|
|
|
|
|||||||||
| Nonvested shares at December 31st |
104,403 | $ | 17.05 | 103,907 | $ | 17.77 | ||||||||||
|
|
|
|
|
|
|
|
|
|||||||||
Performance Incentive Stock Option Plan
During 2015, the Company did not grant any employees performance incentive stock options to acquire shares of common stock.
During 2014, the Company granted performance incentive stock options to purchase 107,689 shares of common stock to employees. Of these performance based stock options, 80% are based upon financial performance of the Company, specifically, an earnings before interest and tax (“EBIT”) goal weighted at 50% and a net sales goal weighted at 30% for the period commencing January 1, 2015 and ending December 31, 2017; the remaining 20% of performance based shares are based upon AVD stock price appreciation (stockholder return) over the same performance measurement period. The net sales and EBIT goal measures the relative growth of the Company’s net sales and EBIT for the performance measurement period, as compared to the median growth of net sales and EBIT for an identified peer group. The stockholder return goal measures
63
Table of Contents
the relative growth of the fair market value of the Company’s stock price over the performance measurement period, as compared to that of the Russell 2000 Index and the median fair market value of the common stock of the comparator companies. All parts of these options vest in three years, but are subject to reduction to a minimum (or even zero) for meeting less than the targeted performance and to increase to a maximum of 200% for meeting in excess of the targeted performance. There were no performance based stock options issued by the Company prior to those issued during 2014.
Performance option activity is as follows:
| Incentive Stock Option Plans |
Weighted Average Price Per Share |
Exercisable Weighted Average Price Per Share |
||||||||||
| Balance outstanding, December 31, 2014 |
107,689 | $ | 11.49 | $ | — | |||||||
| Options forfeited |
(9,279 | ) | 11.49 | |||||||||
|
|
|
|
|
|
|
|||||||
| Balance outstanding, December 31, 2015 |
98,410 | $ | 11.49 | $ | — | |||||||
|
|
|
|
|
|
|
|||||||
Information relating to performance stock options at December 31, 2015 summarized by exercise price is as follows:
| Outstanding Weighted Average | Exercisable Weighted Average |
|||||||||||||||||||
| Exercise Price Per Share |
Shares | Remaining Life (Months) |
Exercise Price |
Shares | Exercise Price |
|||||||||||||||
| Performance Incentive Stock Option Plan: |
||||||||||||||||||||
| $11.49 |
98,410 | 24 | $ | 11.49 | — | $ | — | |||||||||||||
|
|
|
|
|
|
|
|
|
|||||||||||||
| 98,410 | $ | 11.49 | — | $ | — | |||||||||||||||
|
|
|
|
|
|
|
|
|
|||||||||||||
The weighted average exercise prices for performance options granted and exercisable and the weighted average remaining contractual life for performance options outstanding as of December 31, 2014 and 2015 was as follows:
| Number of Shares |
Weighted Average Exercise Price |
Weighted Average Remaining Contractual Life (Months) |
Intrinsic Value (thousands) |
|||||||||||||
| As of December 31, 2014: |
||||||||||||||||
| Performance Incentive Stock Option Plans: |
||||||||||||||||
| Outstanding |
107,689 | $ | 11.49 | 36 | $ | 14 | ||||||||||
| Expected to Vest |
107,689 | $ | 11.49 | 36 | $ | 14 | ||||||||||
| Exercisable |
— | $ | — | — | $ | — | ||||||||||
| As of December 31, 2015: |
||||||||||||||||
| Performance Incentive Stock Option Plans: |
||||||||||||||||
| Outstanding |
98,410 | $ | 11.49 | 24 | $ | 248 | ||||||||||
| Expected to Vest |
58,410 | $ | 11.49 | 24 | $ | 147 | ||||||||||
| Exercisable |
— | $ | — | — | $ | — | ||||||||||
64
Table of Contents
(12) Accumulated Other Comprehensive Loss
The following table lists the beginning balance, annual activity and ending balance of each component of accumulated other comprehensive income:
| Interest Rate Swap |
FX Translation |
Total | ||||||||||
| Balance, December 31, 2012 |
$ | (728 | ) | $ | (1,034 | ) | $ | (1,762 | ) | |||
| Other comprehensive income/(loss) before reclassifications |
(75 | ) | 326 | 251 | ||||||||
| Amounts reclassified from AOCI |
712 | — | 712 | |||||||||
| Tax effect |
(249 | ) | — | (249 | ) | |||||||
|
|
|
|
|
|
|
|||||||
| Balance, December 31, 2013 |
$ | (340 | ) | $ | (708 | ) | $ | (1,048 | ) | |||
| Other comprehensive income/(loss) before reclassifications |
(30 | ) | (1,262 | ) | (1,292 | ) | ||||||
| Amounts reclassified from AOCI |
594 | — | 594 | |||||||||
| Tax effect |
(224 | ) | — | (224 | ) | |||||||
|
|
|
|
|
|
|
|||||||
| Balance, December 31, 2014 |
$ | — | $ | (1,970 | ) | $ | (1,970 | ) | ||||
| Other comprehensive loss before reclassifications |
— | (1,571 | ) | (1,571 | ) | |||||||
|
|
|
|
|
|
|
|||||||
| Balance, December 31, 2015 |
$ | — | $ | (3,541 | ) | $ | (3,541 | ) | ||||
|
|
|
|
|
|
|
|||||||
(13) Equity Method Investment
The Company utilizes the equity method of accounting with respect to its investment in TyraTech Inc. (“TyraTech”), a Delaware corporation that specializes in developing, marketing and selling pesticide products containing essential oils and other natural ingredients. In February 2014, TyraTech issued 37,391,763 shares, raising approximately £1.87 ($3.1) million. In July 2014, TyraTech issued a further 50,000,000 shares and raised approximately £3.5 ($5.9) million. Due to the share issuance in both periods, the Company recognized a total gain of $954 from the dilution of the Company’s ownership position as required by ASC 323. In October 2014, the Company exercised warrants in the amount of $500 and purchased 6,155,000 shares in TyraTech. In November 2015, TyraTech issued a further 105,333,333 shares and raised approximately £3.2 ($4.8) million. Due to the share issuance, the Company recognized a loss of $7 (for 2015) from the dilution of the Company’s ownership position as required by ASC 323. As of December 31, 2015, the Company’s ownership position in TyraTech was approximately 15.11%. As a result of the reduced equity share, the Company re-assessed its choice of equity method accounting for the investment and determined that it retains significant influence by retaining one out of five board seats and accordingly, this method of accounting continues to be appropriate. At December 31, 2015, the carrying value of the Company’s investment in TyraTech was $2,536 and the quoted market value based on TyraTech’s share price (Level 1 input) was $1,850.
At December 31, 2015, the Company performed an impairment review of its investment in TyraTech and concluded that the current condition was temporary and consequently determined that no impairment charge was appropriate. TyraTech’s shares trade on the AIM market of the London Stock Exchange under the trading symbol ‘TYR’. The Company’s equity investment is included in other assets on the consolidated balance sheet.
65
Table of Contents
(14) Quarterly Data—Unaudited
| March 31 | June 30 | September 30 | December 31 | |||||||||||||
| Quarterly Data—2015 |
||||||||||||||||
| Net sales |
$ | 66,565 | $ | 66,523 | $ | 72,486 | $ | 83,808 | ||||||||
| Gross profit |
24,650 | 25,121 | 31,433 | 30,698 | ||||||||||||
| Net income attributable to American Vanguard |
51 | 781 | 2,772 | 2,987 | ||||||||||||
| Basic net income per share |
0.00 | 0.03 | 0.10 | .10 | ||||||||||||
| Diluted net income per share |
0.00 | 0.03 | 0.09 | .10 | ||||||||||||
| Quarterly Data—2014 |
||||||||||||||||
| Net sales |
$ | 81,095 | $ | 68,313 | $ | 71,635 | $ | 77,591 | ||||||||
| Gross profit |
28,905 | 26,060 | 28,293 | 31,238 | ||||||||||||
| Net income attributable to American Vanguard |
2,159 | 145 | 732 | 1,805 | ||||||||||||
| Basic net income per share |
0.08 | 0.01 | 0.03 | 0.06 | ||||||||||||
| Diluted net income per share |
0.07 | 0.01 | 0.03 | 0.06 | ||||||||||||
Note: Totals may not agree with full year amounts due to rounding and separate calculations each quarter.
(15) Subsequent Event—Unaudited
On March 1, 2016, the Company, through its subsidiary in the Netherlands, acquired a 15% ownership position in Bi-PA NV/SA (“Bi-PA”). Bi-PA is a Belgian joint venture that is involved in the development and marketing of biological crop protection products.
66
Table of Contents
EXHIBIT INDEX
ITEM 15
| Exhibit Number |
Description of Exhibit | |
| 3.1 | Amended and Restated Certificate of Incorporation of American Vanguard Corporation (filed as Exhibit 3.1 to the Company’s Form 10-K for the year ended December 31, 2003, which was filed on March 30, 2004 with the Securities Exchange Commission and incorporated herein by reference). | |
| 3.2 | Certificate of Amendment of Amended and Restated Certificate of Incorporation of American Vanguard Corporation (filed as Exhibit 3.2 to the Company’s Form 10-Q/A for the period ended June 30, 2004, which was filed with the Securities Exchange Commission on February 23, 2005 and incorporated herein by reference). | |
| 3.3 | Amended and Restated Bylaws of American Vanguard Corporation (filed as Exhibit 3.1 to the Company’s Form 10-Q for the period ended March 31, 2008, which was filed with the Securities Exchange Commission on May 12, 2008 and incorporated herein by reference.) | |
| 4 | Form of Indenture (filed as Exhibit 4 to the Company’s Registration Statement on Form S-3 (File No. 333-122981) and incorporated herein by reference). | |
| 10.1 | American Vanguard Corporation Employee Stock Purchase Plan (filed as Appendix B to the Company’s Proxy Statement filed with the Securities and Exchange Commission on May 31, 2001 and incorporated herein by reference). | |
| 10.2 | American Vanguard Corporation Fourth Amended and Restated Stock Incentive Plan (filed as Appendix A to the Company’s Proxy Statement filed with the Securities and Exchange Commission on May 11, 2004 and incorporated herein by reference). | |
| 10.3 | Form of Incentive Stock Option Agreement under the American Vanguard Corporation Fourth Amended and Restated Stock Incentive Plan , (filed as Exhibit 10.3 with the Company’s Annual Report on Form 10-K for the period ended December 31, 2004, which was filed with the Securities and Exchange Commission on March 16, 2005 and incorporated herein by reference). | |
| 10.4 | Form of Non-Qualified Stock Option Agreement under the American Vanguard Corporation Fourth Amended and Restated Stock Incentive Plan , (filed as Exhibit 10.4 with the Company’s Annual Report on Form 10-K for the period ended December 31, 2004, which was filed with the Securities and Exchange Commission on March 16, 2005 and incorporated herein by reference). | |
| 10.5 | Employment Agreement between American Vanguard Corporation and Eric G. Wintemute dated January 15, 2008 (filed as Exhibit 10.5 to the Company’s Annual Report on Form 10-K for the year ended December 31, 2007, which was filed with the Securities Exchange Commission on March 17, 2008 and incorporated herein by reference). | |
| 10.8 | Form of Change of Control Severance Agreement, dated effective as of January 1, 2004, between American Vanguard Corporation and its executive and senior officers (filed as Exhibit 10.2 to the Company’s Form 10-Q for the period ended March 31, 2004, which was filed with the Securities Exchange Commission on May 10, 2005 and incorporated herein by reference.) | |
| 10.9 | Form of Amendment of Change of Control Severance Agreement, dated effective as of July 11, 2008, between American Vanguard Corporation and named executive officers and senior officers (filed as Exhibit 99.1 to the Company’s Form 8-K, which was filed on July 11, 2008 with the Securities and Exchange Commission and incorporated herein by reference). | |
| 10.10 | Form of Indemnification Agreement between American Vanguard Corporation and its Directors (filed with the Company’s Annual Report on Form 10-K for the period ended December 31, 2004, which was filed with the Securities and Exchange Commission on March 16, 2005 and incorporated herein by reference). | |
| 10.11 | Description of Compensatory Arrangements Applicable to Non-Employee Directors for 2005 (filed as Exhibit 10.1 to the Company’s Form 8-K, which was filed with the Securities and Exchange Commission on June 15, 2005 and incorporated herein by reference). | |
| 10.12 | American Vanguard Corporation Employee Stock Purchase Plan amended and restated as of June 30, 2011 (incorporated herein by reference). | |
67
Table of Contents
| Exhibit Number |
Description of Exhibit | |
| 10.13 | Form of Restricted Stock Agreement between American Vanguard Corporation and named executive officers (filed as Exhibit 99.1 to the Company’s Form 8-K, which was filed with the Securities Exchange Commission on July 24, 2008 and incorporated herein by reference). | |
| 10.14 | Form of Amended and Restated Change of Control Severance Agreement effective as of January 1, 2014 (filed as Exhibit 10.14 to the Company’s 10-K, which was filed with the Securities Exchange Commission on February 28, 2014 and incorporated herein by reference). | |
| 10.15 | Form of American Vanguard Corporation Amended and Restated Stock Incentive Plan TSR-Based Restricted Stock Units Award Agreement dated June 6, 2013 (filed as Exhibit 10.15 to the Company’s 10-K, which was filed with the Securities Exchange Commission on February 28, 2014 and incorporated herein by reference). | |
| 10.16 | Form of American Vanguard Corporation Amended and Restated Stock Incentive Plan Performance-Based Restricted Stock Units Award Agreement dated June 6, 2013 (filed as Exhibit 10.16 to the Company’s 10-K, which was filed with the Securities Exchange Commission on February 28, 2014 and incorporated herein by reference). | |
| 10.17 | Second Amended and Restated Credit Agreement dated as of June 17, 2013 among AMVAC Chemical Corporation [and certain affiliates] and Bank of the West (as Agent, Swing Line Lender, L/C Issuer, Sole Arranger and Syndication Agent), BMO Harris Bank, N.A. and Wells Fargo Bank, N.A. (as Documentation Agents) and the Lenders (filed as Exhibit 10.1 to the Company’s Form 8-K, which was filed with the Securities Exchange Commission on June 20, 2013 and incorporated herein by reference). | |
| 10.18 | Employment Agreement dated as of December 31, 2014 by and between AMVAC Chemical Corporation and Ulrich Trogele.* | |
| 21 | List of Subsidiaries of the Company.* | |
| 23 | Consent of BDO USA, LLP, Independent Registered Public Accounting Firm.* | |
| 31.1 | Certification of Chief Executive Officer Pursuant to Section 302 of the Sarbanes-Oxley Act of 2002.* | |
| 31.2 | Certification of Chief Financial Officer Pursuant to Section 302 of the Sarbanes-Oxley Act of 2002.* | |
| 32.1 | Certifications Pursuant to 18 U.S.C. Section 1350 as adopted Pursuant to Section 906 of the Sarbanes-Oxley Act of 2002.* | |
| 101 | The following materials from American Vanguard Corp’s Annual Report on Form 10-K for the year ended December 31, 2015, formatted in XBRL (Extensible Business Reporting Language): (i) Consolidated Balance Sheets; (ii) Consolidated Statements of Operations and Comprehensive Income; (iii) Consolidated Statements of Cash Flows; (iv) Consolidated Statements of Stockholders’ Equity; and (v) Notes to Consolidated Financial Statements, tagged as blocks of text.* | |
| * | Filed herewith. |
68