Attached files
| file | filename |
|---|---|
| EX-10.19 - EX-10.19 - ALMOST FAMILY INC | afam-20160101ex101920542.htm |
| EX-31.1 - EX-31.1 - ALMOST FAMILY INC | afam-20160101ex31175f5c4.htm |
| EX-23.1 - EX-23.1 - ALMOST FAMILY INC | afam-20160101ex2312008e9.htm |
| EX-31.2 - EX-31.2 - ALMOST FAMILY INC | afam-20160101ex3120e3b7e.htm |
| EX-2.4 - EX-2.4 - ALMOST FAMILY INC | afam-20160101ex2447cc5d2.htm |
| EX-2.5 - EX-2.5 - ALMOST FAMILY INC | afam-20160101ex254a46415.htm |
| EX-32.1 - EX-32.1 - ALMOST FAMILY INC | afam-20160101ex321083e2a.htm |
| EX-21 - EX-21 - ALMOST FAMILY INC | afam-20160101ex21d3e757b.htm |
| EX-32.2 - EX-32.2 - ALMOST FAMILY INC | afam-20160101ex322e38125.htm |
UNITED STATES
SECURITIES AND EXCHANGE COMMISSION
Washington, D.C. 20549
FORM 10-K
☒ANNUAL REPORT PURSUANT TO SECTION 13 OR 15(d) OF THE SECURITIES EXCHANGE ACT OF 1934
For the fiscal year ended January 1, 2016
OR
☐TRANSITION REPORT PURSUANT TO SECTION 13 OR 15(d) OF THE SECURITIES EXCHANGE ACT OF 1934
For the transition period from to
Commission file number 001-09848

ALMOST FAMILY, INC.
(Exact name of Registrant as specified in its charter)
|
Delaware |
|
06-1153720 |
|
(State or other jurisdiction of incorporation or organization) |
|
(I.R.S. Employer Identification Number) |
9510 Ormsby Station Road, Suite 300, Louisville, Kentucky 40223
(Address of principal executive offices)
(502) 891-1000
(Registrant’s telephone number, including area code)
Not Applicable
(Former name, former address and former fiscal year, if changed since last report)
Securities registered pursuant to Section 12(b) of the Act
|
Title of each class |
|
Name of each exchange on which registered |
|
Common Stock, par value $0.10 per share |
|
NASDAQ Global Select Market |
Securities registered pursuant to Section 12(g) of the Act: None
Indicate by check mark if the registrant is a well-known seasoned issuer, as defined in Rule 405 of the Securities Act. Yes ☐ No ☒
Indicate by check mark if the registrant is not required to file reports pursuant to Section 13 or Section 15(d) of the Exchange Act. Yes ☐ No ☒
Indicate by check mark whether the Registrant (1) has filed all reports required to be filed by Section 13 or 15(d) of the Securities Exchange Act of 1934 during the preceding 12 months (or for such shorter period that the registrant was required to file such reports), and (2) has been subject to such filing requirements for the past 90 days. Yes ☒ No ☐
Indicate by check mark whether the registrant has submitted electronically and posted on its corporate Web site, if any, every Interactive Data File required to be submitted and posted pursuant to Rule 405 of Regulation S-T (§232.405 of this chapter) during the preceding 12 months (or for such shorter period that the registrant was required to submit and post such files). Yes ☒ No ☐
Indicate by check mark if disclosure of delinquent filers pursuant to Item 405 of Regulation S-K is not contained herein, and will not be contained, to the best of the Registrant’s knowledge, in definitive proxy or information statements incorporated by reference in Part III of this Form 10-K or any amendment to this Form 10-K. ☒
Indicate by check mark whether the registrant is a large accelerated filer, an accelerated filer, a non-accelerated filer, or a smaller reporting company. See the definitions of “large accelerated filer,” “accelerated filer” and “smaller reporting company” in Rule 12b-2 of the Exchange Act. (Check one):
|
Large accelerated filer ☐ |
|
Accelerated filer ☒ |
|
Non-accelerated filer ☐ |
|
Smaller reporting company ☐ |
|
(Do not check if a smaller reporting company) |
|
|
Indicate by check mark whether the registrant is a shell company (as defined in Rule 12b-2 of the Exchange Act) Yes☐ No ☒
The aggregate market value of the registrant’s common stock held by non-affiliates of the registrant as of the last day of the second fiscal quarter ended July 3, 2015 was $334,169,264 based on the last sale price of a share of the common stock as of July 2, 2015 ($39.21), as reported by the NASDAQ Global Market.
Indicate the number of shares outstanding of each of the issuer’s classes of common stock, as of the latest practicable date.
|
Class |
|
Outstanding at March 2, 2016 |
|
Common Stock, $0.10 par value per share |
|
10,299,575 Shares |
DOCUMENTS INCORPORATED BY REFERENCE
Portions of the 2016 definitive proxy statement relating to the registrant’s Annual Meeting of Stockholders are incorporated by reference in Part III to the extent described therein.
TABLE OF CONTENTS
|
|
4 | |
|
|
|
|
| 4 | ||
|
|
|
|
| 17 | ||
|
|
|
|
| 28 | ||
|
|
|
|
| 28 | ||
|
|
|
|
| 28 | ||
|
|
|
|
| 28 | ||
|
|
|
|
|
|
29 | |
|
|
|
|
| 29 | ||
|
|
|
|
| 31 | ||
|
|
|
|
|
Management’s Discussion and Analysis of Financial Condition and Results of Operations |
32 | |
|
|
|
|
| 50 | ||
|
|
|
|
| 51 | ||
|
|
|
|
|
Changes in and Disagreements with Accountants on Accounting and Financial Disclosure |
77 | |
|
|
|
|
| 77 | ||
|
|
|
|
| 77 | ||
|
|
|
|
|
|
77 | |
|
|
|
|
| 77 | ||
|
|
|
|
| 78 | ||
|
|
|
|
|
|
80 | |
|
|
|
|
| 80 | ||
2
In this report, the terms “Company,” “we,” “us” or “our” mean Almost Family, Inc. and all subsidiaries included in our consolidated financial statements.
Special Caution Regarding Forward-Looking Statements
Certain statements contained in this annual report on Form 10-K, including, without limitation, statements containing the words “believes,” “anticipates,” “intends,” “expects,” “assumes,” “trends” and similar expressions, constitute “forward-looking statements” within the meaning of the Private Securities Litigation Reform Act of 1995. Forward-looking statements are based upon the Company’s current plans, expectations and projections about future events. However, such statements involve known and unknown risks, uncertainties and other factors that may cause the actual results, performance or achievements of the Company to be materially different from any future results, performance or achievements expressed or implied by such forward-looking statements. These factors include, among others, the following:
|
· |
general economic and business conditions; |
|
· |
demographic changes; |
|
· |
changes in, or failure to comply with, existing governmental regulations; |
|
· |
legislative proposals for healthcare reform; |
|
· |
changes in Medicare and Medicaid reimbursement levels; |
|
· |
changes in laws and regulations with respect to Accountable Care Organizations; |
|
· |
effects of competition in the markets in which the Company operates; |
|
· |
liability and other claims asserted against the Company; |
|
· |
potential audits and investigations by government and regulatory agencies, including the impact of any negative publicity or litigation; |
|
· |
ability to attract and retain qualified personnel; |
|
· |
availability and terms of capital; |
|
· |
loss of significant contracts or reduction in revenues associated with major payor sources; |
|
· |
ability of customers to pay for services; |
|
· |
business disruption due to natural disasters or terrorist acts; |
|
· |
ability to successfully integrate the operations of acquired businesses and achieve expected synergies and operating efficiencies from the acquisition, in each case within expected time-frames or at all; |
|
· |
ability to successfully develop investments made by our healthcare innovations segment, in light of the highly speculative nature of these early stage investments; |
|
· |
significant deterioration in economic conditions and significant market volatility; |
|
· |
effect on liquidity of the Company’s financing arrangements; and |
|
· |
changes in estimates and judgments associated with critical accounting policies and estimates. |
For a detailed discussion of these and other factors that could cause the Company’s actual results to differ materially from the results contemplated by the forward-looking statements, please refer to Item 1A. “Risk Factors” and Item 7 “Management’s Discussion and Analysis of Financial Condition and Results of Operations” elsewhere in this report. The reader should not place undue reliance on forward-looking statements, which speak only as of the date of this report. Except as required by law, the Company does not intend to publicly release any revisions to forward-looking statements to reflect unforeseen or other events after the date of this report. The Company has provided a detailed discussion of risk factors within this annual report on Form 10-K and various filings with the Securities and Exchange Commission (“SEC”). The reader is encouraged to review these risk factors and filings.
3
Introduction
Almost Family, Inc. TM and subsidiaries (collectively “Almost Family”) is a leading, regionally focused provider of home health services. We have service locations in Florida, Ohio, Tennessee, New York, Kentucky, Connecticut, New Jersey, Massachusetts, Indiana, Illinois, Pennsylvania, Georgia, Missouri, Mississippi and Alabama (in order of revenue significance in 2015).
We were incorporated in Delaware in 1985. Through a predecessor merged into the Company in 1991, we have been providing health care services, primarily home health care, since 1976. We reported approximately $532 million of revenues for the year ended January 1, 2016. Unless otherwise indicated, the financial information included in Part I is for continuing operations.
Website Access to Our Reports
Our annual reports on Form 10-K, quarterly reports on Form 10-Q, current reports on Form 8-K, and all amendments to those reports are available free of charge on our website at www.almostfamily.com as soon as reasonably practicable after such material is electronically filed with or furnished to the SEC. Information contained on Almost Family’s website is not part of this annual report on Form 10-K and is not incorporated by reference in this document.
How We Are Currently Organized and Operate
The Company has two divisions, Home Health care and Healthcare Innovations. The Home Health care division is comprised of two reportable segments, Visiting Nurse Services (VN or Visiting Nurse) and Personal Care Services (PC or Personal Care). Healthcare Innovations is also a reporting segment. Reportable segments have been identified based upon how management has organized the business by services provided to customers and the criteria in Accounting Standards Codification (ASC) Topic 280, Segment Reporting.
Our VN segment provides a comprehensive range of Medicare-certified home health nursing services to patients in need of recuperative care, typically following a period of hospitalization or care in another type of inpatient facility. Our services are often provided to patients in lieu of additional care in other settings, such as long term acute care hospitals, inpatient rehabilitation hospitals or skilled nursing facilities. Our nurses, therapists, medical social workers and home health aides work closely with patients and their families to design and implement an individualized treatment response to a physician-prescribed plan of care. Under the umbrella of our “Senior Advocacy” mission, we offer special clinically-based protocols customized to meet the needs of the increasingly medically complex, chronic and co-morbid patient populations we serve. Examples include Optimum Balance, Silver Steps, Cardiocare, Orthopedic and Conjestive Heart Failure in the Home. VN Medicare revenues are generated on a per episode basis rather than a fee per visit or hourly basis. Approximately 94% of the VN segment revenues are generated from the Medicare program while the balance is generated from Medicaid and private insurance programs.
Our PC segment provides services in patients’ homes primarily on an as-needed, hourly basis. These services include personal care, medication management, meal preparation, caregiver respite and homemaking. Our services are often provided to patients who would otherwise be admitted to skilled nursing facilities for long term custodial care. PC revenues are generated on an hourly basis. Approximately 83% of the PC segment revenues are generated from Medicaid and other government programs while the balance is generated from insurance programs and private pay patients.
The Healthcare Innovations segment includes our developmental activity outside of the traditional home health business platform.
4
Additional financial information about our segments can be found in Part II, Item 8, “Notes to Consolidated Financial Statements” and related notes included elsewhere in this Form 10-K.
Our View on Reimbursement and Diversification of Risk
Our Company is highly dependent on government reimbursement programs which pay for the majority of the services we provide to our patients and customers. Reimbursement under these programs, primarily Medicare and Medicaid, is subject to frequent changes as policy makers balance constituents’ needs for health care services within the constraints of the specific government’s fiscal budgets. Medicare and Medicaid, respectively, are consuming a greater percentage of federal and states’ budgets, which is exacerbated in times of economic downturn. We believe that these financial issues are cyclical in nature rather than indicative of the long-term prospect for Medicare and Medicaid funding of health care services. Additionally, we believe our services offer the lowest cost alternative to institutional care and are a part of the solution to the federal government’s Medicare and states’ Medicaid financing problems.
We believe that an important key to our historical success and to our future success is our ability to adapt our operations to meet changes in reimbursement as they occur. One important way in which we have achieved this adaptability in the past, and in which we plan to achieve it in the future, is to maintain some level of diversification in our business mix.
The execution of our business plan will place primary emphasis on the development of our home health operations. As our business grows, we may evaluate opportunities for the provision of other health care services in patients’ homes that would be consistent with our Senior Advocacy mission.
Our Business Plan
Our future success depends on our ability to execute our business plan. Over the next three to five years we will try to accomplish the following:
|
· |
Generate meaningful same store sales growth through the focused provision of high quality services and attending to the needs of our patients; |
|
· |
Drive our costs down, while continuing to provide high quality patient care, by improving the productivity of our work force through improved monitoring, tighter controls, workflow automation, use of technology and other opportunities for efficiency gains; |
|
· |
Expand the significance of our home health services by selectively acquiring other quality providers, through the startup of new agencies and potentially by providing new services in patients’ homes consistent with our Senior Advocacy mission; |
|
· |
Make additional strategic investments which expand our Healthcare Innovation segment in its mission to find solutions for more effective, efficient and appropriate delivery of homecare; and |
|
· |
Expand our capital base through both earnings performance and by seeking additional capital investments in our Company. |
5
Overview of Our Services
Home Health Division Services
Operating Locations
Our operating locations for our VN and PC Segments in our home health division as of fiscal year end were as follows:
|
|
|
2015 |
|
2014 |
|
||||
|
|
|
Branches |
|
Branches |
|
||||
|
|
|
Visiting |
|
Personal |
|
Visiting |
|
Personal |
|
|
Geographic Clusters |
|
Nurse |
|
Care |
|
Nurse |
|
Care |
|
|
Southeast |
|
|
|
|
|
|
|
|
|
|
Florida |
|
48 |
|
7 |
|
51 |
|
7 |
|
|
Tennessee |
|
23 |
|
8 |
|
23 |
|
8 |
|
|
Georgia |
|
9 |
|
— |
|
9 |
|
— |
|
|
Mississippi |
|
2 |
|
— |
|
2 |
|
— |
|
|
Alabama |
|
1 |
|
— |
|
1 |
|
— |
|
|
|
|
|
|
|
|
|
|
|
|
|
Northeast |
|
|
|
|
|
|
|
|
|
|
Pennsylvania |
|
6 |
|
2 |
|
8 |
|
2 |
|
|
New Jersey |
|
6 |
|
— |
|
6 |
|
— |
|
|
New York |
|
5 |
|
7 |
|
— |
|
— |
|
|
Massachusetts |
|
5 |
|
— |
|
5 |
|
— |
|
|
Connecticut |
|
4 |
|
8 |
|
3 |
|
7 |
|
|
|
|
|
|
|
|
|
|
|
|
|
Midwest |
|
|
|
|
|
|
|
|
|
|
Kentucky |
|
21 |
|
4 |
|
21 |
|
4 |
|
|
Ohio |
|
16 |
|
38 |
|
12 |
|
33 |
|
|
Indiana |
|
9 |
|
— |
|
11 |
|
— |
|
|
Missouri |
|
4 |
|
— |
|
4 |
|
— |
|
|
Illinois |
|
3 |
|
— |
|
4 |
|
— |
|
|
|
|
|
|
|
|
|
|
|
|
|
Total |
|
162 |
|
74 |
|
160 |
|
61 |
|
Late in the fourth quarter of 2015, we closed or merged certain underperforming locations in Florida, Pennsylvania, Indiana, and Illinois. On August 29 and on November 5, 2015, we acquired operating locations in New York and Connecticut, and Ohio, respectively.
Visiting Nurse Services
Our VN segment services consist primarily of the provision of skilled in-home medical services to patients in need of short-term recuperative health care. Our patients are referred to us by their physicians or upon discharge from a hospital or other type of in-patient facility. We operate 94 Medicare-certified home health agencies with a total of 162 locations. In the fiscal year ended January 1, 2016, approximately 94% of our visiting nurse segment revenues were derived from the Medicare program.
Our Visiting Nurse segment provides a comprehensive range of Medicare-certified home health nursing services. We receive payment from Medicare, Medicaid and private insurance companies. Our professional staff includes registered nurses, licensed practical nurses, physical, speech and occupational therapists, and medical social workers. They fulfill medical treatment plans prescribed by physicians. Our professional staff is subject to state licensing requirements in the particular states in which they practice. Para-professional staff members (primarily home health aides) also provide care to these patients.
6
Our Visiting Nurse segment operations located in Florida normally experience higher admissions during the first quarter and lower admissions during the third quarter than in the other quarters due to seasonal population fluctuations.
Personal Care Services
Our PC segment services are also provided in patients’ homes. These services (generally provided by para-professional staff such as home health aides) are generally of a custodial rather than skilled nature. Generally, PC revenues are generated on an hourly basis. We currently operate 74 Personal Care locations. In the fiscal year ended January 1, 2016, approximately 83% of our personal care segment revenues were derived from the Medicaid program.
Healthcare Innovations Segment
Our HealthCare Innovations (HCI) business segment was created to house and separately report on our developmental activities outside our traditional home health business platform. These activities are intended ultimately, whether directly or indirectly, to benefit our patients and payers through the enhanced provision of home health services. HCI activities all share a common goal of improving patient experiences and quality outcomes, while lowering costs. These include, but are not limited to: technology, information, population health management, risk-sharing, assessments, care coordination and transitions, clinical advancements, enhanced patient engagement and informed clinical decision making. We believe these activities help us discover valuable insight and experiences that would not otherwise be gained in the routine operation of our core home health business segments. Further, we believe these innovation activities, will play an important role in collaborating with policy makers, payers, providers, and anyone who assumes financial risk for managing patient populations, to seek to reduce costs, and improve quality by providing increasingly more care for more patients in their homes than ever before.
As discussed further below, the HCI segment now includes: a) Imperium Health Management, an ACO enablement company, b) an investment in NavHealth, a population-health analytics company, c) Ingenios Health, a Nurse-Practitioner-oriented and mobile technology-enabled health risk assessment company primarily serving managed care organizations; and d) Long Term Solutions, an in-home assessment company serving the long-term care insurance industry.
Some of these initiatives are highly speculative and have been made in development stage enterprises. There can be no assurance that we will receive any return on, or of, the capital we invest in these ventures. However, we believe these activities already have, and will continue to help us, discover valuable insights and experiences we would not otherwise gain in the routine operation of our core home health business segments. These endeavors are part of a growing number of care-related innovations and reforms. We expect more will be attempted over the next several years.
Imperium
Imperium’s purpose is to assist independent primary care physician practices in establishing and successfully operating Accountable Care Organizations (“ACOs”) first made possible by 2010’s Affordable Care Act. Through improved care management, in a coordinated effort led by primary care physicians, with nurses and home health agencies using evidence-based clinical standards, we seek to reduce avoidable hospitalizations, emergent care, and non-impactful health care services. We seek to work together with primary care physicians to manage high-cost patients in lower-cost settings, with a goal of generating, and sharing in, savings to the Medicare program. By linking physicians with home health care through the ACO vehicle we seek to deliver meaningful savings to the healthcare system and participate in a share of those savings under the Medicare Shared Savings Program (“MSSP”) and such other similar models as may evolve in the future.
In the past year, Imperium has rapidly expanded its customer base growing from 3 ACOs under contract in 2013, to 7 in 2014 , 11 in 2015 and 14 in 2016. In terms of covered Medicare beneficiaries, Imperium has grown from 23,000 in 2013, to 45,000 in 2014 and 85,000 in 2015 and now has 124,000 in 2016. While we intend to work together toward the development of additional ACO relationships in markets in which Almost Family also provides home health services, Imperium also currently has, and will continue to seek, ACO customers in other service territories. We own 61.5% of Imperium and consolidate its result in our financial statements. We report a provision for noncontrolling
7
interests (NCI) to reflect the income or losses attributable to the 38.5% interest that we do not own. Additionally, due to certain put-call arrangements we also reflect a mandatorily redeemable noncontrolling interest amount of $3.6 million related to Imperium between the liability and equity sections of our balance sheet.
CMS announced the first year financial reconciliation and quality performance results for ACOs in September of 2014, in which, fifty-three ACOs generated shared savings during their first performance year ended December 31, 2013. ACOs that generated savings earned a performance payment, if they met the quality standard. CMS announced the second year results in September of 2015. An Imperium serviced ACO received an MSSP payment in the first and second CMS results. Imperium received its share $1.4 million in 2015 for 2014 services and $1.6 million in 2014 for 2013 services. There can be no assurance that future payments will be made by CMS, the structure of MSSP payments will remain as currently deployed, or that an MSSP payment will be received in 2016 related to our 2015 services or any future period.
NavHealth
NavHealth is a development-stage enterprise whose business plan is focused on the development of technology-based tools designed to help health systems anticipate and inform a patient’s journey through the health care system. Among its other objectives, NavHealth seeks to develop and market a software platform designed to assist health care providers, managed care organizations and insurers in their efforts to aggregate patient data from various sources, improve patient engagement, satisfaction and outcomes and lower the overall cost of healthcare delivery. We are co-invested in NavHealth with founders Aneesh Chopra and Hunch Analytics which Chopra co-founded with Sanju Bansal. Mr. Bansal is the co-founder and former COO of MicroStrategy (MSTR), a worldwide provider of enterprise software for cloud business intelligence and big data services. We made an initial $1 million noncontrolling investment in NavHealth on January 29, 2015 and may, at our option, invest another $1 million. We account for this non-controlling investment under the cost method.
Ingenios Health Co.
Ingenios Health Co. (“Ingenios”) is a provider of technology enabled in-home clinical assessments for Medicare Advantage, Managed Medicaid and Commercial Exchange lives in seven states and Washington, D.C. We believe new health assessment capabilities provide the key element in the evolution of improved care planning and delivery as healthcare delivery and reimbursement models evolve.
Long-Term Solutions
On January 5, 2016, we acquired Long Term Solutions, Inc. (“LTS”). See “Acquisitions” for additional information. LTS performs in-home nursing assessments for the long-term care insurance industry. LTS also provides a suite of planning and support services to insurance companies, employers and direct to individuals and families throughout the United States. LTS, through its network of thousands of assessment service partners provides assessments in all 50 U.S. states and a number of foreign countries. LTS estimates that the majority of its assessments result in the patient ultimately receiving home health, assisted living or skilled nursing care in accordance with their long-term care insurance benefits. One of every four of LTS’s 2015 assessments was performed in territories currently served by our home health operations.
The American Association for Long-Term Care Insurance (“AALTCI”) estimates that the industry paid over $7.5 billion in claims covering 273,000 beneficiaries across the US in its most recently studied year and that over two thirds of all newly-opened long term care insurance claims paid for care in the home or in an assisted living community setting. The AALTCI also reported total benefit payments increased by 13 percent and the number of long term care insurance policyholders on claim grew 3.4 percent. According to the National Association of Insurance Commissioners (“NAIC”) the top 100 plans in the US cover 7.2 million lives.
8
Compensation for Home Health Services
We are compensated for our home health services by (i) Medicare (Visiting Nurse segment only), (ii) Medicaid, (iii) other third party payors (e.g., insurance companies and other sources), and (iv) private pay (paid by personal funds). The rates of reimbursement we receive from Medicare, Medicaid and other government programs are generally dictated by those programs. In determining charge rates for goods and services provided to our other customers, we evaluate several factors including cost and market competition. We sometimes negotiate contract rates with third party providers such as insurance companies.
Our reliance on government sponsored reimbursement programs makes us vulnerable to possible legislative and administrative regulation changes and budget cut-backs that could adversely affect the number of persons eligible for such programs, the amount of allowed reimbursements or other aspects of the programs, any of which could materially affect us. In addition, loss of certification or qualification under Medicare or Medicaid programs could materially affect our ability to effectively market our services.
The following table sets forth our revenues from operations derived from each major payor class during the indicated periods (by percentage of net revenues) for the fiscal years ended:
|
Payor Group |
|
January 1, 2016 |
|
December 31, 2014 |
|
December 31, 2013 |
|
|
Medicare |
|
71.4 |
% |
72.4 |
% |
71.2 |
% |
|
Medicaid and Other Government Programs |
|
22.5 |
% |
19.6 |
% |
22.5 |
% |
|
Insurance and private pay |
|
6.1 |
% |
8.0 |
% |
6.3 |
% |
Medicare revenues are earned in our VN segment, where they account for 94% of segment revenues. Historical changes in payment sources are primarily a result of changes in the types of customers we attract.
See “Government Regulation” and “Risk Factors.” We will monitor the effects of such items and may consider modifications to our expansion and development strategy when and if necessary.
Acquisitions
The Company has completed several acquisitions over the past three years and will continue to seek to acquire other quality providers of Medicare-certified home health and/or personal care services, along with making investments in healthcare innovators through our Healthcare Innovations segment.
Factors which may affect future acquisition decisions include, but are not limited to, the quality and potential profitability of the business under consideration, and our profitability and ability to finance the transaction.
2016 Acquisitions
On January 5, 2016, we acquired 100% of the equity of Long Term Solutions, Inc. (“LTS”). LTS is a provider of in-home nursing assessments for the long-term care insurance industry. LTS provides assessments in all 50 U.S. states and a number of foreign countries. The purchase price of $37 million was funded through borrowings on the Company’s bank credit facility, seller notes and issuance of the Company’s common stock. LTS’s post acquisition operating results will be reported in our Healthcare Innovations business segment.
On January 5, 2016, we purchased the assets of a Medicare-certified home health agency owned by Bayonne Visiting Nurse Association (‘Bayonne”) located in New Jersey. Bayonne’s post acquisition operating results will be reported in our VN segment.
2015 Acquisitions
On November 5, 2015, we acquired the stock of Black Stone Operations, LLC (“Black Stone”). Black Stone is a provider of in-home personal care and skilled home health services in western Ohio and operates under the name “Home Care by Black Stone.” The purchase price of $40 million was funded through borrowings on the Company’s bank credit
9
facility, seller notes and issuance of the Company’s common stock. Black Stone’s post acquisition operating results are reported in our VN and PC segments.
On July 22, 2015, we acquired 100% of the equity of Ingenios Health Co. (“Ingenios”) for approximately $11.4 million of the Company’s common stock plus $2 million in cash. Ingenios is a leading provider of technology enabled in-home clinical assessments for Medicare Advantage, Managed Medicaid and Commercial Exchange lives in seven states and Washington, D.C. The post acquisition operating results of Ingenios are reported in our Healthcare Innovations business segment.
On August 29, 2015, we acquired 100% of the equity of Bracor, Inc. (dba “WillCare”). Willcare, based in Buffalo, NY, owned and operated VN and PC branch locations in New York (12) and Connecticut (1). The purchase price was approximately $50.8 million. The transaction was funded by borrowings under the Company’s bank credit facility. WillCare’s New York and Connecticut post acquisition operating results are reported in our VN and PC segments.
On March 1, 2015, we acquired the stock of WillCare’s Ohio operations for $3.0 million. WillCare’s Ohio post acquisition operating results are reported in our VN and PC segments.
On January 29, 2015, we acquired a noncontrolling interest in a development stage analytics and software company, NavHealth, Inc. (“NavHealth”). The investment is an asset of our Healthcare Innovations segment.
2014 Acquisitions
During 2014, we completed a small acquisition using cash on hand to expand existing VN segment operations in Kentucky.
2013 Acquisitions
On December 6, 2013, we acquired the stock of Omni Home Health Holdings, Inc. (“SunCrest”). The total purchase price was $76.6 million. The transaction was funded primarily from borrowings from our senior secured revolving credit facility and cash on hand. SunCrest’s post acquisition operating results are included in our VN segment and our PC segment.
On October 4, 2013, we acquired a controlling interest in Imperium Health Management, LLC (“Imperium”). Imperium is a development-stage enterprise that provides strategic health management services to Accountable Care Organizations (“ACOs”). We acquired 61.5% interest for a total of $5.8 million. The transaction was funded with cash on hand. Imperium’s post acquisition operating results are included in our Healthcare Innovations segment.
On July 17, 2013, we acquired the assets of the Medicare-certified home agencies owned by Indiana Home Care Network (“IHCN”). IHCN operated six home health agencies primarily in northern Indiana. The total purchase price was $12.5 million and was funded with cash on hand and Almost Family, Inc. common stock. ICHN’s post acquisition operating results are reported in our VN segment.
Competition, Marketing and Customers
The visiting nurse industry is highly competitive and fragmented. Competitors include larger publicly held companies such as Amedisys, Inc. (NasdaqGS: AMED), Kindred Healthcare, Inc. (NYSE: KND), and LHC Group, Inc. (NasdaqGS: LHCG), and numerous privately held multi-site home care companies, privately held single-site agencies and a significant number of hospital-based agencies. Competition for customers at the local market level is very fragmented and market specific. Generally, each local market has its own competitive profile and no one competitor has significant market share across all our markets. To the best of our knowledge, no individual provider has more than 6% share of the national Medicare home health market.
We believe the primary competitive factors are quality of service and reputation among referral sources. We market our services through our site managers and marketing staff. These individuals contact referral sources in their areas to
10
market our services. Major referral sources include: physicians, hospital discharge planners, Offices on Aging, social workers, and group living facilities. We also utilize, to a lesser degree, consumer-direct sales, marketing and advertising programs designed to attract customers.
The personal care industry is likewise highly competitive and fragmented. Competitors include home health providers, senior adult associations, and the private hiring of caregivers. We market our services primarily through our site managers, and we compete by offering a high quality of care and by helping families identify and access solutions for care. Major referral sources include case managers, physicians and hospital discharge planners.
Our healthcare innovations segment competes in new industries, some of which were created by the Patient Protection and Affordable Care Act (the “ACA”), signed into law in March 2010. In certain cases, we operate in relatively new and unproven markets which include new competitors that are identified regularly and which range in size from start-up companies to larger publicly held companies like Universal American Corp. (NYSE: UAM). We market our services directly to our customers.
Government Regulation
Medicare Home Health Program
Payment Methodology
As shown in “Compensation for Services” above, approximately 71% of our 2015 consolidated net service revenues were derived from the Medicare Program. Medicare reimburses home health care providers under the Prospective Payment System (“PPS”), which pays a fixed, predetermined rate for services and supplies under an episode of care. An episode of home health care spans a 60-day period, starting with the first day a billable visit is furnished to a Medicare beneficiary and ending 60 days later. If a patient is still in treatment on the 60th day, a new episode begins on the 61st day, commonly referred to as a recertification episode, regardless of whether a billable visit is rendered on that day and ends 60 days later.
Payment rates are subject to adjustment based on certain variables including, but not limited to: (a) a case-mix adjustment, which drives the home health resource group (“HHRG”) to which the Medicare patient is assigned based on such factors as the patient’s clinical, functional, and services utilization characteristics; (b) geographic wage adjustment, including rural rate add-ons, if any; (c) a payment adjustment based upon the level of therapy services required (thresholds set at 6, 14 and 20 visits); (d) a low utilization payment adjustment (“LUPA”) if the number of visits was fewer than five; (e) an outlier payment if our patient’s care was unusually costly (capped at 10% of total reimbursement at the agency level); (f) a partial payment if our patient transferred to another provider or we received a patient from another provider before completing the episode; (g) the number of episodes of care provided to a patient; and (h) sequestration, a 2% legislated reduction pursuant to the Budget Control Act (“BCA”) signed into law on August 2, 2011, which was effective for episodes ended after March 31, 2013.
In establishing payment rates for the last three years, the Medicare Program recalibrated the national average case-mix levels and maintained budget neutrality by making a corresponding adjustment to the National, Standardized 60-Day Episode Payment Rate (“Base Episode Payment Rate”). These nominal case-mix and payment rate recalibrations result in a lower case mix and higher base rates and are intended to have no effect on payments actually made. We have presented the Base Episode Payment Rate established by the Medicare Program for all episodes of care ended on or after
11
the applicable time periods, along with the Base Episode Payment Rate for each period as if the case-mix resets were in effect for all prior periods below:
|
|
|
|
|
Base Episode Payment Rate |
|
||
|
|
|
Base Episode |
|
Adjusted for Case-mix |
|
||
|
Period |
|
Payment Rate (1) |
|
Recalibrations (2) |
|
||
|
January 1, 2016 through December 31, 2016 |
|
$ |
2,965 |
|
$ |
2,965 |
|
|
January 1, 2015 through December 31, 2015 |
|
|
2,961 |
|
|
2,990 |
|
|
January 1, 2014 through December 31, 2014 |
|
|
2,869 |
|
|
3,003 |
|
|
January 1, 2013 through December 31, 2013 |
|
|
2,138 |
|
|
3,013 |
|
|
(1) |
Reflects the payment rates as published by the Medicare Program. |
|
(2) |
Presents the payment rates on a consistent basis as if the case-mix recalibrations had been in effect for all periods presented. As applicable, adjusted payment rates for each of the years 2013-2015 were calculated by multiplying the actual Base Episode Payment by 1.3464 (2014 Final Rule), then by 1.014 (2015 Final Rule) and then by 1.0097 (2016 Final Rule). |
After determining the appropriate PPS payment rate, we record net revenues as services are rendered to patients over the 60-day episode period. At the end of each month, a portion of our revenue is estimated for episodes that have not yet completed, which are generally referred to as episodes in progress. As a result, net service revenues recorded for an episode in progress is subject to change if the actual number of visits differs from the number anticipated at the start of care. Our revenue recognition under the Medicare reimbursement program is discussed in greater detail in Part II, Item 7 “Critical Accounting Policies” and Item 8, “Notes to Consolidated Financial Statements”.
Rebasing and Other Statutory Rate Reductions
The Patient Protection and Affordable Care Act (the “ACA”), signed into law in March 2010, has adversely impacted our business and it is reasonable to expect it to have an impact on our business in the future. Specifically, the ACA provisions:
|
· |
Outlined annual rate reductions from 2011 through 2017 for Medicare reimbursement rates for home health care services we provide to our patients; |
|
· |
Established statutory reductions to the annual inflationary rate adjustments we would have otherwise received; |
|
· |
Established certain “productivity” adjustments reducing the reimbursement rates we would have otherwise received; |
|
· |
Required Centers for Medicare and Medicaid Services (“CMS”) to recalculate or “rebase” home health reimbursement to more closely align with the costs of providing care; |
|
· |
Limited any reduction in reimbursement rates resulting from “rebasing” to a maximum of 3.5% per year in each of the four phase-in years; and |
|
· |
Required the Medicare Payment Advisory Commission (“MedPac”) and the US Department of Health and Human Services (“HHS”) Secretary to assess and report on the impact of rebasing on access and quality of care. |
On October 29, 2015, CMS issued its 2016 Home Health Prospective Payment System Rate Update. CMS is implementing a 0.13% increase in the National, Standardized 60-Day Episode Payment Amount consisting of a 2.9% “market basket” increase minus a 0.6% productivity adjustment, a 2.71% ($80.95 per episode) rebasing cut, a 0.97% case mix creep cut and an increase of 1.87% to maintain budget neutrality with respect to recalibration of the home health case mix model for 2016. The impact of recalibration of the case-mix model on the Company results in 2016 will depend upon the Company’s actual patient mix in that period. CMS is also implementing a “Value Based Purchasing” (VBP) demonstration in 9 states (including Florida, Tennessee and Massachusetts where the Company generated 38.1% of its fiscal year 2015 revenues) under which certain 2016 agency specific performance measures would be used to establish individual agency reimbursement rates for 2018. CMS estimates that two thirds of providers will be a plus or minus 1.5% adjustment to 2018 revenue rates. Investors are encouraged to read the rule in its entirety at http://federalregister.gov/a/2015-27931.
12
Potential Future Developments in Medicare Home Health
While there have been many changes enacted over the past several years, the Congress and/or CMS may take future actions which could have an adverse impact on our business, including possible:
|
· |
Acceleration or compressing of the rebasing period to a period shorter than the currently legislated 2014-2017 four-year phase in; |
|
· |
Changes in cost sharing between the Medicare program (“Program”) and beneficiaries (i.e., co-pays); |
|
· |
Removal of or changes to codes in the case-mix system or recalibration of the case-mix system including further case-mix creep coding adjustments, all of which could result in changes to rates under the national standardized 60-day episodic payment; |
|
· |
Post-acute care bundling; |
|
· |
Removal or reductions to established statutory reductions to the annual inflationary rate adjustments we would have otherwise received; |
|
· |
“Productivity” payment reductions to reimbursement rates we would have otherwise received; |
|
· |
Changes that put providers “at risk” for patient outcomes, |
|
· |
Addition of new pre-authorization requirements for home health services, and |
|
· |
Other types of changes of which we may not currently be aware. |
We are unable to predict when or whether any of these types of changes may be enacted or what impact, if any, they may have on our business.
Medicaid Reimbursement
As shown in “Compensation for Services” above, approximately 22% of our 2015 consolidated net service revenues were derived from state Medicaid and Other Government Programs, with approximately 9.1%, 5.5%, 3.2% and 1.7% generated from Medicaid reimbursement programs in the states of Ohio, Connecticut, Tennessee and Kentucky, respectively. Net service revenues under such state programs are derived from services provided under a per visit, per hour or unit basis (as opposed to episodic). Revenues are calculated and recorded using payor-specific or patient-specific fee schedules based on the contracted rates.
The financial condition of the Medicaid programs in each of the states in which we operate is cyclical with some currently facing significant budget issues. States may be expected from time to time to take actions or evaluate taking actions to control the rate of growth of Medicaid expenditures. Among these actions are the following:
|
· |
redefining eligibility standards for Medicaid coverage, |
|
· |
redefining coverage criteria for home and community based care services, |
|
· |
slowing payments to providers by increasing the minimum time in which payments are made, |
|
· |
limiting reimbursement rate increases or implementing rate cuts, |
|
· |
increased utilization of self-directed care alternatives, |
|
· |
shifting beneficiaries from traditional coverage to Medicaid managed care providers, and |
|
· |
changing regulations under which providers must operate. |
Medicaid programs, while partially federally funded, are administered by the individual states under the broad supervision of CMS. Accordingly, developments typically occur on a state-by-state basis. Specific programs and changes are enacted regularly. Any such changes, if enacted, could adversely impact our operations.
Medicare and Medicaid Reimbursement Summary
The health care industry has experienced, and is expected to continue to experience, extensive and dynamic periods of change. In addition to economic forces and regulatory influences, continuing political debate subjects the health care industry to significant reform. Health care reforms have been enacted as discussed elsewhere in this document and
13
proposals for additional changes are continuously formulated by departments of the Federal government, Congress, and state legislatures. Such governmental payors provide for approximately 94% of our consolidated net service revenues, including Medicare Advantage plans run by private insurers which are also dependent on federal funding.
We expect legislators and government officials to continuously review and assess alternative health care delivery systems and payment methodologies. Changes in the law or new interpretations of existing laws may have a dramatic effect on the definition of permissible or impermissible activities, the relative cost of doing business, and the methods and amounts of payments for medical care by both governmental and other payors. We expect legislative changes intended to “balance the budget” and slow the annual rate of growth of Medicare and Medicaid to continue. Such future changes may further impact reimbursement for our services. There can be no assurance that future legislation or regulatory changes will not have a material adverse effect on our results of operations.
Governments might take or consider taking further actions because the number of Medicare and Medicaid beneficiaries and their related expenditures are growing at a faster rate than the governments’ revenue. Medicare and Medicaid are consuming increasing percentages of budgets and may expand further driven by state based exchanges resulting from the ACA and implementing regulations. Health care financing issues are exacerbated when revenues slow in a down economy. We believe that these financing issues are cyclical in nature rather than indicative of the long-term prospect for Medicare and Medicaid funding of health care services for the populations we serve. Additionally, we believe our services offer the lowest cost alternative to institutional care and are a critical part of the solution to our nation’s health care financing problems.
Given the broad and far reaching implications of all the changes in the rapidly evolving environment in which we operate, the incomplete nature of these changes, the pace at which the changes are taking place and the prospects for future changes to be made, we cannot predict the ultimate impact, which may be material and adverse, that health care reform efforts and resulting Medicare and Medicaid reimbursement rates will have on our liquidity, our results of operations, the realizability of the carrying amounts of our intangible assets, including goodwill, or our financial condition. Further, we are unable to predict what effect, if any, such material adverse effect, if it were to occur, might have on our ability to continue to comply with the financial covenants of our revolving credit facility and our ability to continue to access debt capital through that facility.
Permits and Licensure
Many states require companies providing certain health care services to be licensed as home health agencies. In addition, certain health care practitioners employed by us require state licensure and/or registration and must comply with laws and regulations governing standards of practice. The failure to obtain, renew or maintain any of the required regulatory approvals or licenses could adversely affect our business. We believe we are currently licensed appropriately where required by the laws of the states in which we operate. There can be no assurance that either the states or the federal government will not impose additional regulations upon our activities which might adversely affect our results of operations, financial condition, or liquidity.
Certificates of Need
Certain states require companies providing health care services to obtain a certificate of need issued by a state health-planning agency. Where required by law, we have obtained certificates of need from those states. There can be no assurance that we will be able to obtain any certificates of need which may be required in the future, if we expand the scope of our services or if state laws change to impose additional certificate of need requirements, and any attempt to obtain additional certificates of need will cause us to incur certain expenses.
Medicare and Medicaid Participation
Effective March 25, 2011, CMS implemented new enrollment regulations which were a response to aspects of the ACA designed to enhance enrollment procedures to protect against fraud. The regulations authorize the establishment of risk categories with risk level dictating the enrollment screening activities, i.e., more rigorous screening as the perceived risk increases. For Medicare, there are three categories of providers i.e., “limited,” “moderate,” or “high” risk, and CMS has
14
placed newly enrolling home health agencies in the “high risk” category, with existing enrolled home health agencies categorized as “moderate risk.” In addition to the low risk provider screening procedures, providers in the moderate risk category will be subject to unannounced site visits. For high risk providers, any individual with a 5% or more ownership interest will be subject to fingerprint-based criminal history record checks. Additionally, the new regulations authorize Medicare and state Medicaid agencies to impose temporary enrollment moratoria for a particular type of provider if determined to be necessary to combat fraud, waste, or abuse. To the extent that home health agencies are subject to a moratorium, any newly enrolling home health agency, including any change of ownership subject to the 36 month rule, and any expansion to add a branch would be affected by the moratorium.
Other Regulations
A series of laws and regulations dating back to the Omnibus Budget Reconciliation Act of 1987 (“OBRA 1987”) and through the ACA and related subsequent legislation have been enacted and apply to us. Changes in applicable laws and regulations have occurred from time to time since OBRA 1987 including reimbursement reductions and changes to payment rules. Changes are also expected to occur continuously for the foreseeable future.
As a provider of services under Medicare and Medicaid programs, we are subject to the Medicare and Medicaid anti-kickback statute and other “fraud and abuse laws.” The anti-kickback statute prohibits any bribe, kickback, rebate or remuneration of any kind in return for, or as an inducement for, the referral of Medicare or Medicaid patients. We may also be affected by the Federal physician self-referral prohibition, known as the “Stark” law, which, with certain exceptions, prohibits physicians from referring patients to entities in which they have a financial interest or from which they receive financial benefit. Penalties for violations of the federal Stark law include payment sanctions, civil monetary penalties, and/or program exclusion. Many states in which we operate have adopted similar self-referral laws, as well as laws that prohibit certain direct or indirect payments or fee-splitting arrangements between health care providers, if such arrangements are designed to induce or to encourage the referral of patients to a particular provider.
As a result of the Health Insurance Portability and Accountability Act of 1996 and other legislative and administrative initiatives, Federal and state enforcement efforts against the health care industry have increased dramatically, subjecting all health care providers to increased risk of scrutiny and increased compliance costs.
We are subject to routine and periodic surveys, audits and investigations by various governmental agencies. In addition to surveys to determine compliance with the conditions of participation, CMS has engaged a number of contractors (including Fiscal Intermediaries, Recovery Audit Contractors, Program Safeguard Contractors, Zone Program Integrity Contractors, and Medicaid Integrity Contributors) to conduct audits to evaluate billing practices and identify overpayments. In addition to audits by CMS contractors, individual states are implementing similar programs such as using Medicaid Recovery Audit Contractors. We believe that we are in material compliance with applicable laws. However, we are unable to predict what additional government regulations, if any, affecting our business may be enacted in the future, how existing or future laws and regulations might be interpreted or whether we will be able to comply with such laws and regulations either in the markets in which we presently conduct, or wish to commence, business.
Medicare Accountable Care Organizations (ACOs)
The ACA also established ACOs as a tool to improve quality and lower costs through increased care coordination in the Medicare fee-for-service (“FFS”) program, also known as “Original Medicare.” The Medicare FFS program covers approximately 70% of the Medicare recipients or approximately 36 million eligible Medicare beneficiaries. ACOs are groups of doctors and other healthcare providers working together to provide high quality services and care for their patients. Provider and beneficiary participation in an ACO is purely voluntary and Medicare beneficiaries retain their current ability to seek treatment from any provider they wish. ACOs are legal entities that contract with CMS for three-year periods. Beneficiaries are assigned to ACOs using an “attribution” model based on a plurality of services provided by the primary care physician. Beneficiaries still have the right to use any doctor or hospital who accepts Medicare, at any time. In order to receive revenues from CMS under the MSSP, the ACO must meet certain minimum savings rates (i.e. save the federal government money) and meet certain quality measures. More specifically, the ACOs costs of medical expenses for its members during a relevant measurement year must be below the ACOs benchmark by a minimum amount as established by CMS for such ACO.
15
CMS established the MSSP to facilitate coordination and cooperation among providers to improve the quality of care for Medicare FFS beneficiaries and reduce unnecessary costs. Eligible providers, hospitals, and suppliers may participate in the MSSP by creating, participating in or contracting with an ACO. The MSSP is designed to improve beneficiary outcomes and increase value of care by (1) promoting accountability for the care of Medicare FFS beneficiaries; (2) requiring coordinated care for all services provided under Medicare FFS; and (3) encouraging investment in infrastructure and redesigned care processes. The MSSP will reward ACOs that reduce health care costs below their benchmark while also meeting performance standards on quality of care. Under the final MSSP rules, Medicare will continue to pay individual providers and suppliers for specific items and services as it currently does under the FFS payment methodologies. MSSP rules require CMS to develop a benchmark for savings to be achieved by each ACO, if the ACO is to receive shared savings or for ACOs that have elected to accept responsibility for losses. An ACO that meets the program’s quality performance standards will be eligible to receive a share of the savings to the extent its assigned beneficiary medical expenditures are below its own medical expenditure benchmark provided by CMS.
Insurance Programs and Costs
We bear significant risk under our large-deductible workers’ compensation insurance program and our self-insured employee health program. Under the workers’ compensation insurance program, we bear risk up to $400,000 per incident except for the recent Black Stone acquisition that had not yet been folded into our program that has a stop loss of $750,000, after which stop-loss insurance coverage is maintained.
We purchase stop-loss insurance for the employee health plan that places a specific limit, generally $300,000, on our exposure for any individual covered life. The ACA also includes regulatory changes related to employer sponsored health insurance benefit plans, the most significant of which was initially effective for the Company January 1, 2015. However, certain components continue to evolve, be delayed or have additional developments. Management has implemented portions of its procedures and is currently working to evaluate the implications of these changes and to develop appropriate courses of action for the Company. At this time, we are unable to predict the full impact of such changes on our health insurance benefit programs or the costs of such programs to the Company.
Malpractice and general patient liability claims for incidents which may give rise to litigation have been asserted against us by various claimants. The claims are in various stages of processing and some may ultimately be brought to trial. We are aware of incidents that have occurred through January 1, 2016, that may result in the assertion of additional claims. We currently carry professional and general liability insurance coverage (on a claims made basis) for this exposure with no deductible.
We also carry D&O coverage for potential claims against our directors and officers, including securities actions, with deductibles ranging from $175,000 to $500,000 per claim.
Total premiums, excluding estimated exposure to claims and deductibles, for all our non-health insurance programs were approximately $4.8 million for the contract year ended May 31, 2015.
We record estimated liabilities for our insurance programs based on information provided by the third-party plan administrators, historical claims experience, the life cycle of claims, expected costs of claims incurred but not paid, and expected costs to settle unpaid claims. We monitor our estimated insurance-related liabilities and related insurance recoveries on a monthly basis and have recorded amounts due under insurance policies in other current assets, while recording the estimated carrier liability in other current liabilities in our consolidated balance sheets. As facts change, it may become necessary to make adjustments that could be material to our results of operations and financial condition.
We believe that our present insurance coverage is adequate. As part of our on-going risk management, regulatory compliance and cost control efforts, we continually seek alternatives that might provide a different balance of cost and risk, including potentially accepting additional self-insurance risk in lieu of higher premium costs.
16
Executive Officers of the Registrant
See Part III, Item 10 of this Form 10-K for information about the Company’s executive officers.
Employees and Labor Relations
As of January 1, 2016, we had approximately 14,200 employees. None of our employees are represented by a labor organization. We believe our relationship with our employees is satisfactory.
Described below and elsewhere in this report are risks, uncertainties and other factors that can adversely affect our business, results of operations, cash flow, liquidity or financial condition. Investing in our common stock involves a degree of risk. You should consider carefully the following risks, as well as other information in this filing and the incorporated documents before investing in our common stock.
Risks Related to Our Industry
Complying with health care reform legislation and the implementing regulations and programmatic guidelines could have a material adverse impact on our results of operations or financial condition in ways not currently anticipated by us.
Part I, Item 1, “Government Regulation” summarizes US health care reform activities pertinent to our operations. Very often, sweeping new legislation is followed by subsequent legislation to address previously unanticipated consequences, or to further define provisions that were too vague to implement based on the language of the original legislation and by legal actions to challenge its constitutionality. In our view it is reasonable to expect this to occur over the next few years. As a result of the broad scope of the ACA and related legislation, the significant changes it will effect in the healthcare industry and society generally, and the complexity of the technical issues it addresses, we are unable to predict, at this time, all the ramifications the ACA and the implementing regulations may have on our business as a health care provider or a sponsor of an employee health insurance benefit plan. The ACA and implementing regulations and programmatic guidelines could have a material adverse impact on our results of operations or financial condition in ways not currently anticipated by us.
Additionally, we may be unable to take actions to mitigate any or all of the negative implications of the ACA and implementing regulations or programmatic guidelines which may result in unfavorable earnings, losses, or impairment charges.
The ACA and related subsequent legislation may be modified through future legislative action or judicial challenge. We can provide you with no assurance that the ultimate outcome of the ACA, health care reform efforts and/or the federal budget and resulting Medicare reimbursement rates will not have a material adverse effect on our liquidity, our results of operation, the realizability of the carrying amounts of our intangible assets, including goodwill, or our financial condition. Further, we are unable to predict what effect, if any, such material adverse effect, if it were to occur, might have on our ability to continue to comply with the financial covenants of our revolving credit facility and our ability to continue to access debt capital through that facility.
The current status of Federal and State budgets may have a material adverse effect on our future results of operations and financial condition, as well as our ability to access credit and capital.
There can be no assurance that Federal and State governments will be able to operate balanced budgets. While the ultimate outcome of these events cannot be predicted, they may have a material adverse effect on the Company. Historic economic conditions, stimulus efforts by the Federal government and costly new programs created by ACA have placed significant strain on Federal and state budgets, many of which are in a deficit position. Efforts to reduce spending at the Federal and/or state levels may result in reductions in reimbursement by Medicare, Medicaid and other third-party payors along with tax increases, which may in turn result in decreased revenue growth and a decrease in our profitability.
17
Our contractors and suppliers may also be negatively impacted by these conditions and our ability to provide patient care at a lower cost may diminish and reduce our profitability. Future disruptions in the credit and capital markets, if any, may restrict our access to capital. As a result, our ability to incur additional indebtedness to fund acquisitions and operations may be constrained. If the Federal and State budgets’ conditions deteriorate or do not improve, our results of operations or financial condition could be materially and adversely affected.
Our profitability depends principally on the level of government-mandated payment rates. Reductions in rates, or rate increases that do not cover cost increases, may adversely affect our business.
We generally receive fixed payments from Medicare and Medicaid for our services based on the level of care that we provide patients. Consequently, our profitability largely depends upon our ability to manage the cost of providing services. Although current Medicare legislation provides for an annual adjustment of the various payment rates based on the increase or decrease of the medical care expenditure category of the Consumer Price Index, these Medicare payment rate increases may be less than actual inflation or could be eliminated or reduced in any given year. Consequently, if our cost of providing services, which consists primarily of labor costs, is greater than the respective Medicare or Medicaid payment rate, our profitability would be negatively impacted.
If any of our agencies fail to comply with the conditions of participation in the Medicare program, that agency could be terminated from the Medicare program, which would adversely affect our net service revenue and profitability.
Each of our home care agencies must comply with the extensive conditions of participation in the Medicare program. If any of our agencies fail to meet any of the Medicare conditions of participation, that agency may receive a notice of deficiency from the applicable state surveyor. If that agency then fails to institute a plan of correction to correct the deficiency within the correction period provided by the state surveyor, that agency could be terminated from the Medicare program. Additionally, failure to comply with the conditions of participation related to enrollment could result in a deactivation or revocation of billing privileges. To the extent that billing privileges are revoked there is a mandated one to three-year bar to re-enrollment. The failure to pass a site verification visit, for example, could result in a revocation of billing privileges with a mandated two-year bar to re-enrollment. Although the revocation would only immediately affect the particular enrollment subject to the revocation, CMS has indicated that following a revocation it will review the enrollment files for providers under common ownership or control to determine if a similar sanction is warranted for any of the other related providers. Any termination of one or more of our home care agencies from the Medicare program for failure to satisfy the program’s conditions of participation could adversely affect our net service revenue and profitability.
Any changes to the laws and regulations governing our business, or the interpretation and enforcement of those laws or regulations, could cause us to modify our operations and could negatively impact our operating results.
The federal government and the states in which we operate regulate our industry extensively. The laws and regulations governing our operations, along with the terms of participation in various government programs, regulate how we do business, the services we offer, and our interactions with patients and the public. These laws and regulations, and their interpretations, are subject to frequent change. Changes in existing laws and regulations, or their interpretations, or the enactment of new laws or regulations could reduce our profitability by:
|
· |
increasing our liability; |
|
· |
increasing our administrative and other costs; |
|
· |
increasing or decreasing mandated services; |
|
· |
forcing us to restructure our relationships with referral sources and providers; or |
|
· |
requiring us to implement additional or different programs and systems. |
Violation of the laws governing our operations, or changes in interpretations of those laws, could result in the imposition of fines, civil or criminal penalties, the termination of our rights to participate in federal and state-sponsored programs, the suspension or revocation of our licenses, or claims for damages. If we become subject to material fines or if other sanctions or other corrective actions are imposed on us, we might suffer a substantial reduction in profitability.
18
We have been and could become the subject of governmental investigations, claims and litigation that could have a material adverse effect on our financial position, results of operation and liquidity.
Over the years, we, and the industry as a whole, have been the subject of civil investigations, and qui tam or “whistleblower” suits relating to its Medicare-reimbursed operations. For further discussion, please refer to Part I, “Legal Proceedings” and Part II, Item 8, “Notes to Consolidated Financial Statements”. We may become, or unknown to us may already be, the subject of investigations, qui tams, or lawsuits that could have a material adverse effect on our financial position, results of operation and liquidity.
Governmental agencies and their agents, such as the Medicare Administrative Contractors, fiscal intermediaries and carriers, as well as the OIG, CMS and state Medicaid programs, conduct audits of our health care operations. Depending on the nature of the conduct found in such audits and whether the underlying conduct could be considered systemic, the resolution of these audits could have a material adverse effect on our financial position, results of operation and liquidity.
For example, home health providers, including the Company, have received pre-pay Additional Development Requests (“ADR”) in addition to Recovery Audit Contractor audits (“RAC”) from the Palmetto Government Benefits Administration (“PGBA”) as a result of additional CMS funding allocations to the Medicare Administrative Contractors (“MACs”) to conduct pre-payment reviews. ADR and RAC audits are both general and focused in nature. The PGBA acts as one of our four fiscal intermediaries, but processes the majority of our claims. We would expect ADR and RAC audits to continue in the future. If such ADR or RAC audits result in reimbursement adjustments, we may suffer reduced profitability. Further, our appeal rights related to such audits may lead to cash flow delays due to significant backlog at the Administrative Law Judge level. ADR and RAC backlog was so significant in the hospital industry that CMS agreed to settle all ADR and RAC denials at $0.68 for each dollar denied. There can be no assurances that CMS will settle such claims for home health providers.
If we are unable to maintain relationships with existing patient referral sources or to establish new referral sources, our growth and profitability could be adversely affected.
Our success depends significantly on referrals from physicians, hospitals, case managers and other patient referral sources in the communities that our home care agencies serve, as well as on our ability to maintain good relationships with these referral sources. Our referral sources are not contractually obligated to refer home care patients to us and may refer their patients to other providers. Our growth and profitability depend on our ability to establish and maintain close working relationships with these patient referral sources and to increase awareness and acceptance of the benefits of home care by our referral sources and their patients. We cannot assure you that we will be able to maintain our existing referral source relationships or that we will be able to develop and maintain new relationships in existing or new markets. Our loss of, or failure to maintain, existing relationships or our failure to develop new relationships could adversely affect our ability to expand our operations and operate profitably.
We are subject to federal and state laws that govern our financial relationships with physicians and other healthcare providers, including potential or current referral sources.
We are required to comply with federal and state laws, generally referred to as “anti-kickback laws,” that prohibit certain direct and indirect payments or fee-splitting arrangements between healthcare providers that are designed to encourage the referral of patients to a particular provider for medical services. We are also required to comply with the “Stark” laws, which places restrictions on physicians who refer patients to entities in which they have a financial interest or from which they receive financial benefit. In addition to the federal anti-kickback and Stark laws, some of the states in which we operate have enacted laws prohibiting certain business relationships between physicians and other providers of healthcare services. We currently have contractual relationships with certain physicians who provide consulting services to our Company. Many of these physicians are current or potential referral sources. Although we believe our physician consultant arrangements currently comply with state and federal anti-kickback and Stark laws, we cannot assure you that courts or regulatory agencies will not interpret these laws in ways that will implicate our physician consultant arrangements. Violations of anti-kickback and similar laws could lead to fines or sanctions, including under the False Claims Act, that may have a material adverse effect on our operations.
19
We may be subject to substantial malpractice or other similar claims.
The services we offer involve an inherent risk of professional liability and related substantial damage awards. On any given day, we have thousands of nurses, therapists and other direct care personnel driving to and from patients’ homes where they deliver medical and other care. Due to the nature of our business, we and the caregivers who provide services on our behalf may be the subject of medical malpractice claims. These caregivers could be considered our agents, and, as a result, we could be held liable for their medical negligence. We cannot predict the effect that any claims of this nature, regardless of their ultimate outcome, could have on our business, reputation, or on our ability to attract and retain patients and employees. We maintain malpractice and various other liability insurance or re-insurance policies and are responsible for deductibles and, as applicable, amounts in excess of the limits of our coverage. Although we contract with highly rated carriers, we cannot guarantee collection of amounts expected to be recovered under various insurance or reinsurance policies.
Delays in reimbursement may cause liquidity problems.
Our business is characterized by delays in reimbursement from the time we provide services to the time we receive reimbursement or payment for these services. Data submission requirements change from time to time for payors, payments to us may be delayed pending additional data or documentation requests by the fiscal intermediary, or our ability to effectively respond to such requirements may delay our payment cycle. If we have information system problems or issues that arise with Medicare or Medicaid, we may encounter delays in our payment cycle. Such a timing delay may cause working capital shortages. Working capital management, including prompt and diligent billing and collection, is an important factor in our results of operations and liquidity. System problems, Medicare or Medicaid issues or industry trends may extend our collection period, adversely impact our working capital. Our working capital management procedures may not successfully negate this risk. There are often timing delays when attempting to collect funds from Medicaid programs. Delays in receiving reimbursement or payments from these programs may adversely impact our working capital.
The home health care industry is highly competitive.
Our home health care agencies compete with local and regional home health care companies, hospitals, nursing homes, and other businesses that provide home nursing services, some of which are large established companies that have significantly greater resources than we do. Our primary competition comes from local companies in each of our markets, and these privately-owned or hospital-owned health care providers vary by region and market. We compete based on the availability of personnel; the quality, expertise, and value of our services; and in select instances, on the price of our services. Increased competition in the future from existing competitors or new entrants may limit our ability to maintain or increase our market share. We cannot assure you that we will be able to compete successfully against current or future competitors or that competitive pressures will not have a material adverse impact on our business, financial condition, or results of operations.
Some of our existing and potential new competitors may enjoy greater name recognition and greater financial, technical, and marketing resources than we do. This may permit our competitors to devote greater resources than we can to the development and promotion of services. These competitors may undertake more far-reaching and effective marketing campaigns and may offer more attractive opportunities to existing and potential employees and services to referral sources.
We expect our competitors to develop new strategic relationships with providers, referral sources, and payors, which could result in increased competition. The introduction of new and enhanced service offerings, in combination with industry consolidation and the development of strategic relationships by our competitors, could cause a decline in revenue or loss of market acceptance of our services or make our services less attractive. Additionally, we compete with a number of non-profit organizations that can finance acquisitions and capital expenditures on a tax-exempt basis or receive charitable contributions that are unavailable to us.
We expect that industry forces will continue to have an impact on our business and that of our competitors. In recent years, the health care industry has undergone significant changes driven by efforts to reduce costs, and we expect these
20
cost containment measures to continue in the future. Frequent regulatory changes in our industry, including reductions in reimbursement rates and changes in services covered, have increased competition among home health care providers. If we are unable to react competitively to new developments, our operating results may suffer.
Portions of our Healthcare Innovations segment competes in relatively new and developing markets.
Portions of our Healthcare Innovations segment compete in new and developing markets with new competitors or solutions developed and introduced to the market regularly. Such new products may capture market share more quickly or may have access to more capital than the capital we have allocated for such projects. Our efforts to bring new solutions to the market may prove unsuccessful, may prove to be unprofitable or may prove to be more costly to bring to market than anticipated. Our investments in these activities are highly speculative in nature and subject to loss.
A shortage of qualified registered nursing staff, physical therapists, occupational therapists and other caregivers could adversely affect our ability to attract, train and retain qualified personnel and could increase operating costs.
We rely significantly on our ability to attract and retain caregivers who possess the skills, experience, and licenses necessary to meet the requirements of our patients. We compete for personnel with other providers of health care services. Our ability to attract and retain caregivers depends on several factors, including our ability to provide these caregivers with attractive assignments and competitive benefits and salaries. We cannot assure you that we will succeed in any of these areas. In addition, there are occasional shortages of qualified healthcare personnel in some of the markets in which we operate. As a result, we may face higher costs of attracting caregivers and providing them with attractive benefit packages than we originally anticipated, and if that occurs, our profitability could decline. Finally, although this is currently not a significant factor in our existing markets, if we expand our operations into geographic areas where healthcare providers have historically unionized, we cannot assure you that the negotiation of collective bargaining agreements will not have a negative effect on our ability to timely and successfully recruit qualified personnel. Generally, if we are unable to attract and retain caregivers, the quality of our services may decline, and we could lose patients and referral sources.
Risks Related to Our Business
We depend on government sponsored reimbursement programs with Medicare accounting for the largest portion of our revenues.
For the years ended January 1, 2016, December 31, 2014 and 2013, we received 71%, 72% and 71%, respectively, of our revenue from Medicare. Reductions in Medicare reimbursement have historically and may continue to adversely impact our profitability. Such reductions in payments to us could be caused by:
|
· |
administrative or legislative changes to the base episode rate; |
|
· |
the elimination or reduction of annual rate increases based on medical inflation; |
|
· |
the imposition by Medicare of co-payments or other mechanisms shifting responsibility for a portion of payment to beneficiaries; |
|
· |
adjustments to the relative components of the wage index; |
|
· |
changes to or imposition of regulations impacting our case-mix or therapy thresholds; or |
|
· |
other adverse changes to the way we are paid for delivering our services. |
Our non-Medicare revenues and profitability also are affected by the continuing efforts of third-party payors to contain or reduce the costs of health care by lowering reimbursement rates, narrowing the scope of covered services, increasing case management review of services, and negotiating reduced contract pricing. Any changes in reimbursement levels from these third-party payor sources and any changes in applicable government regulations could have a material adverse effect on our revenues and profitability. We can provide no assurance that we will continue to maintain the current payor or revenue mix.
Our reliance on government sponsored reimbursement programs such as Medicare and Medicaid makes us vulnerable to possible legislative and administrative regulations and budget cut-backs that could adversely affect the number of
21
persons eligible for such programs, the amount of allowed reimbursements or other aspects of the programs, any of which could materially affect us. In addition, loss of certification or qualification under Medicare or Medicaid programs could materially affect our ability to effectively market our services.
We have a significant dependence on state Medicaid reimbursement programs.
Approximately 22%, 20% and 23% of our fiscal years 2015, 2014 and 2013 revenues, respectively, were derived from state Medicaid and other government programs, many of which currently face significant budget issues. Further, the acquisitions completed by us in 2015 and 2013 increased our dependence on Medicaid reimbursement. Specifically, for the year ended January 1, 2016, approximately 9.1%, 5.5%, 3.2% and 1.7% of our revenues were generated from Medicaid reimbursement programs in the states of Ohio, Connecticut, Tennessee and Kentucky, respectively and 8.8%, 5.5%, 2.5% and 1.8% for the year ended December 31, 2014, respectively. Such amounts for Ohio, Connecticut and Kentucky were 11.7%, 7.1% and 2.3%, respectively for the year ended December 31, 2013.
The financial condition of the Medicaid programs in each of the states in which we operate is cyclical and many may be expected from time to time to take actions or evaluate taking actions to control the rate of growth of Medicaid expenditures. Among these actions are the following:
|
· |
redefining eligibility standards for Medicaid coverage, |
|
· |
redefining coverage criteria for home and community based care services, |
|
· |
slowing payments to providers by increasing the minimum time in which payments are made, |
|
· |
limiting reimbursement rate increases, |
|
· |
increased utilization of self-directed care alternatives, |
|
· |
shifting beneficiaries from traditional coverage to Medicaid managed care providers, and |
|
· |
changing regulations under which providers must operate. |
States may be expected to address these issues because the number of Medicaid beneficiaries and their related expenditures are growing at a faster rate than the government’s revenue. Medicaid is consuming a greater percentage of states’ budgets. This issue is exacerbated when revenues slow in a slowing economy. It is possible that the actions taken by the state Medicaid programs in the future could have a significant unfavorable impact on our results of operations, financial condition and liquidity.
Migration of our Medicare beneficiary patients to Medicare managed care providers could negatively impact our operating results.
Historically, we have generated a substantial portion of our revenue from the Medicare fee-for-service market. The Congress continues to allocate significant additional funds and other incentives to Medicare managed care providers in order to promote greater participation in those plans by Medicare beneficiaries. If these increased funding levels have the intended result, the size of the potential Medicare fee-for-service market could decline, thereby reducing the size of our potential patient population, which could cause our operating results to suffer.
Our growth strategy depends on our ability to manage growing and changing operations.
Our business plan calls for significant growth in our business over the next several years. This growth will place significant demands on our management and information technology systems, internal controls, and financial and professional resources. In addition, we will need to further develop our financial controls and reporting systems to accommodate future growth. This could require us to incur expenses for hiring additional qualified personnel, retaining professionals to assist in developing the appropriate control systems, and expanding our information technology infrastructure. Our inability to manage growth effectively could have a material adverse effect on our financial results.
22
Our home health growth strategy depends on our ability to develop and to acquire additional agencies on favorable terms and to integrate and operate these agencies effectively. If we are unable to do so, our future growth and operating results could be negatively impacted.
With regard to development, we expect to continue to open agencies in our existing and new markets. Our new agency growth, however, will depend on several factors, including our ability to:
|
· |
obtain locations for agencies in markets where need exists; |
|
· |
identify and hire a sufficient number of sales personnel and appropriately trained home care and other health care professionals; |
|
· |
obtain adequate financing to fund growth; and |
|
· |
operate successfully under applicable government regulations. |
With regard to acquisitions, we are focusing significant time and resources on the acquisition of home healthcare providers, or of certain of their assets, in targeted markets. We may be unable to identify, negotiate, and complete suitable acquisition opportunities on reasonable terms. We may incur future liabilities related to acquisitions. Should any of the following problems, or others, occur as a result of our acquisition strategy, the impact could be material:
|
· |
difficulties integrating personnel from acquired entities and other corporate cultures into our business; |
|
· |
difficulties integrating information systems; |
|
· |
the potential loss of key employees or referral sources of acquired companies or a reduction in patient referrals by hospitals from which we have acquired home health care agencies; |
|
· |
the assumption of liabilities and exposure to undisclosed liabilities of acquired companies; |
|
· |
the acquisition of an agency with undisclosed compliance problems; |
|
· |
the diversion of management attention from existing operations; |
|
· |
difficulties in recouping partial episode payments and other types of misdirected payments for services from the previous owners; or |
|
· |
an unsuccessful claim for indemnification rights from previous owners for acts or omissions arising prior to the date of acquisition. |
CMS has placed certain limitations on the sale or transfer of the Medicare Provider Agreement for any Medicare-certified home health agency that has been in existence for less than 36 months or that has undergone a change of ownership in the last 36 months. This limitation may reduce the number of home health agencies that otherwise would have been available for acquisition and may limit our ability to successfully pursue our acquisition strategy.
We have invested in development stage companies which may require further funding to support their respective business plans, which may ultimately prove unsuccessful.
Through our Imperium acquisition, we provide strategic health management services to ACOs that have been approved to participate in the Medicare Shared Savings Program (“MSSP”). In addition to our ownership interests in ACOs, we also have service agreements with ACOs that provide for sharing of MSSPs received by the ACO, if any. During 2013, we invested $5.8 million in our Imperium acquisition of which $3 million went to fund operations in pursuit of its business plan. In 2015, we also invested $1.0 million for a noncontrolling interest in NavHealth and $13.1 million in Ingenios Health. These investments are highly speculative, are at risk and we may choose to make further investments, all of which may ultimately provide no return and could lead to a total loss of our investment.
ACOs are entities that contract with CMS to serve the Medicare fee-for-service population with the goal of better care for individuals, improved health for populations and lower costs. ACOs share savings with CMS to the extent that the actual costs of serving assigned beneficiaries are below certain trended benchmarks of such beneficiaries and certain quality performance measures are achieved.
CMS made its first MSSP payments to ACOs for the first measurement periods ending December 31, 2013 in the third quarter of 2014, while issuing its second year payments in the third quarter of 2015. Imperium received a MSSP
23
payment in the third quarters of 2015 and 2014 for $1.4 million and $1.6 million, respectively, while breaking even for the year at the operating income level.
We expect our Imperium and Ingenios operations to negatively impact our cash flows. Notwithstanding our efforts, our ACOs may be unable to meet the required savings rates or may not satisfy the quality measures and efforts to drive other revenue may not cover operating costs of these investments. In addition, as the MSSP is a new program, it presents challenges and risks associated with the timeliness and accuracy of data and interpretation of complex rules, which may have a material adverse effect on our ability to recoup any of our investments. Further, there can be no assurance that we will maintain positive relations with our ACO partners or significant customers, which could result in a loss of our investment.
In addition, CMS, the US Office of Inspector General, the Internal Revenue Service, the Federal Trade Commission, US Department of Justice, and various states have adopted or are considering adopting new legislation, rules, regulations and guidance relating to formation and operation of ACOs. Such laws may, among other things, require ACOs to become subject to financial regulation such as maintaining deposits of assets with the states in which they operate, the filing of periodic reports with the insurance department and/or department of health, or holding certain licenses or certifications in the jurisdictions in which the ACOs operate. Failure to comply with legal or regulatory restrictions may result in CMS terminating the ACOs agreement with CMS and/or subjecting the ACO to loss of the right to engage in some or all business in a state, payments fines or penalties, or may implicate federal and state fraud and abuse laws relating to anti-trust, physician fee-sharing arrangements, anti-kickback prohibitions, prohibited referrals, any of which may adversely affect our operations and/or profitability.
We may require additional capital to pursue our acquisition strategy.
At January 1, 2016, we had cash and cash equivalents of approximately $7.5 million and additional borrowing capacity of approximately $32.1 million. Based on our current plan of operations, including acquisitions, we cannot assure you that this amount will be sufficient, nor continue to be fully available, to support our current growth strategies. We cannot readily predict the timing, size, and success of our acquisition efforts and the associated capital commitments. If we do not have sufficient cash resources, our growth could be limited unless we obtain additional equity or debt financing.
We last issued additional shares of our common stock in the third quarter of 2009, other than in conjunction with acquisitions in 2015 and 2013 and employee benefit plans. At some future point, we may elect to issue additional equity or debt securities in conjunction with raising capital or completing an acquisition. We cannot assure you that such issuances will not be dilutive to existing shareholders. Conversely, our board may approve stock repurchase programs in the future, which may use funds previously otherwise available for the pursuit of growth.
Our business depends on our information systems. Our inability to effectively integrate, manage, and keep secure our information systems could disrupt our operations.
Our business depends on effective and secure information systems that assist us in, among other things, monitoring utilization and other cost factors, processing claims, reporting financial results, measuring outcomes and quality of care, managing regulatory compliance controls, and maintaining operational efficiencies. These systems include software developed in-house and systems provided by external contractors and other service providers. To the extent that these external contractors or other service providers become insolvent or fail to support the software or systems, our operations could be negatively affected. Our agencies also depend upon our information systems for accounting, billing, collections, risk management, quality assurance, payroll, learning management and other information. If we experience a reduction in the performance, reliability, or availability of our information systems, our operations and ability to process transactions and produce timely and accurate reports could be adversely affected.
Our information systems and applications require continual maintenance, upgrading, and enhancement to meet our operational needs. Our acquisitions require transitions and integration of various information systems. We regularly upgrade and expand our information systems’ capabilities. If we experience difficulties with the transition and integration of information systems or are unable to implement, maintain, or expand our systems properly, we could
24
suffer from, among other things, operational disruptions, regulatory problems, working capital disruptions and increases in administrative expenses.
Our business requires the secure transmission of confidential information over public networks. Advances in computer capabilities, new discoveries in the field of cryptography or other events or developments could result in compromises or breaches of our security systems and patient data stored in our information systems. Anyone who circumvents our security measures could misappropriate our confidential information or cause interruptions in our services or operations. The Internet is a public network, and data is sent over this network from many sources. In the past, computer viruses or software programs that disable or impair computers have been distributed and have rapidly spread over the Internet. Computer viruses could be introduced into our systems, or those of our providers or regulators, which could disrupt our operations or make our systems inaccessible to our providers or regulators. We may be required to expend significant capital and other resources to protect against the threat of security breaches or to alleviate problems caused by breaches. Our security measures may be inadequate to prevent security breaches, and our business operations would be negatively impacted by cancellation of contracts and loss of patients if security breaches are not prevented.
Further, our information systems are vulnerable to damage or interruption from fire, flood, natural disaster, power loss, telecommunications failure, break-ins and similar events. A failure to implement our disaster recovery plans or ultimately restore our information systems after the occurrence of any of these events could have a material adverse effect on our business, financial condition and results of operations.
Because of the confidential health information we store and transmit, loss of electronically-stored information for any reason could expose us to a risk of regulatory action, litigation, reputation damage, possible liability and loss.
We face additional federal requirements in the transmission and retention and protection of health information.
The Health Insurance Portability and Accountability Act of 1996 (“HIPAA”) was enacted to ensure that employees can retain and at times transfer their health insurance when they change jobs and to simplify healthcare administrative processes. The enactment of HIPAA expanded protection of the privacy and security of personal medical data and required the adoption of standards for the exchange of electronic health information. Among the standards that the Secretary of Health and Human Services has adopted pursuant to HIPAA are standards for electronic transactions and code sets, unique identifiers for providers, employers, health plans and individuals, security and electronic signatures, privacy and enforcement. Failure to comply with HIPAA could result in fines and penalties that could have a material adverse effect on us.
The Health Information Technology for Economic and Clinical Health Act (HITECH Act), effective February 22, 2010, sets forth health information security breach notification requirements. The HITECH Act requires patient notification for all breaches, media notification of breaches of over 500 patients and at least annual reporting of all breaches to the Secretary of HHS. The HITECH Act also includes 4 tiers of sanctions for breaches ($100 to $1.5 million). Failure to comply with HITECH could result in fines and penalties that could have a material adverse effect on us.
We develop portions of our clinical software system in-house. Failure of, or problems with, our system could harm our business and operating results.
We develop and utilize a proprietary clinical software system to collect assessment data, log patient visits, generate medical orders, and monitor treatments and outcomes in accordance with established medical standards. The system integrates billing and collections functionality as well as accounting, human resource, payroll, and employee benefits programs provided by third parties. Problems with, or the failure of, our technology and systems could negatively impact data capture, billing, collections, and management and reporting capabilities. Any such problems or failures could adversely affect our operations and reputation, result in significant costs to us, and impair our ability to provide our services in the future. The costs incurred in correcting any errors or problems may be substantial and could adversely affect our profitability.
25
We depend on outside software providers.
We depend on the proper functioning and availability of our information systems in operating our business, some of which are provided and/or hosted by outside software providers. These information systems and applications require continual maintenance, upgrading, and enhancement to meet our operational needs. If our providers are unable to maintain or expand our information systems properly, we could suffer from operational disruptions and an increase in administrative expenses, among other things. The regulatory environment related to information security and privacy is evolving and increasingly demanding. Furthermore, we also rely on cloud computing and other similar hosted technologies that result in third parties holding significant amounts of customer or employee information on our behalf. If the security and information systems of our or of outsourced third party providers we use to store or process such information are compromised or if we, or such third parties, otherwise fail to comply with applicable laws and regulations, we could face litigation and the imposition of penalties that could adversely affect our financial performance. Our reputation as a brand or as an employer could also be adversely affected from security breaches or regulatory violations, which could impair our sales or ability to attract and keep qualified employees.
Our insurance coverage may not be sufficient for our business needs and/or the cost of such coverage may adversely impact our results of operations.
We bear significant insurance risk under our large-deductible workers’ compensation insurance program and our self-insured employee health program. We also carry D&O coverage for potential claims against our directors and officers, including securities actions. For additional information, please refer to Part I, Item 1, “Insurance Programs and Costs” and Part II, Item 8, “Notes to Consolidated Financial Statements.” Claims made to date or in the future may exceed the limits of such insurance, if any. Such claims, if successful and in excess of such limits, could have a material adverse effect on our ability to conduct business or on our assets. Benefits provided by our employer sponsored health insurance plan may require changes as a result of the ACA or other regulatory action. Such changes may have an adverse impact on our operating results.
Our insurance coverage also includes fire, property damage, and general liability with varying limits. Although we maintain insurance consistent with industry practice, we cannot assure you that the insurance we maintain will satisfy claims made against us. In addition, as a result of operating in the home healthcare industry, our business entails an inherent risk of claims, losses, and potential lawsuits alleging employee accidents that may occur in a patient’s home. Finally, insurance coverage may not continue to be available to us at commercially reasonable rates, in adequate amounts or on satisfactory terms. Any claims made against us, regardless of their merit or eventual outcome, could damage our reputation and business.
We estimate Medicare and Medicaid liabilities that may be payable by us in the future. These liabilities may be subject to audit or further review, and we may owe additional amounts beyond what we expect and have reserved.
The Company is paid for its services primarily by federal and state third-party reimbursement programs, commercial insurance companies, and patients. Revenues are recorded at established rates in the period during which the services are rendered. Appropriate allowances are recorded when the services are rendered, if necessary, to give recognition to third party payment arrangements.
Laws and regulations governing the Medicare and Medicaid programs are extremely complex and subject to interpretation. It is common for issues to arise related to: 1) medical coding, particularly with respect to Medicare, 2) patient eligibility, particularly related to Medicaid, and 3) other reasons unrelated to credit risk, all of which may result in adjustments to recorded revenue amounts. Management continuously evaluates the potential for revenue adjustments and when appropriate provides allowances for losses based upon the best available information. There is at least a reasonable possibility that recorded estimates could change by material amounts in the near term.
We depend on the services of our executive officers and other key employees.
Our success depends upon the continued employment of certain members of our senior management team, including our Chairman and Chief Executive Officer, William B. Yarmuth, and our other named executive officers. We also depend
26
upon the continued employment of the individuals that manage several of our key functional areas, including operations, business development, accounting, finance, human resources, marketing, information systems, contracting and compliance. The departure of any member of our senior management team or inability to appropriately implement succession plans may materially affect our operations.
Our operations could be affected by natural disasters.
A substantial number of our agencies are located in Florida or coastal regions in the northeast, increasing our exposure to hurricanes and other natural disasters. The occurrence of natural disasters in the markets in which we operate could not only affect the day-to-day operations of our agencies but also could disrupt our relationships with patients, employees and referral sources located in the affected areas. In addition, any episode of care that is not completed due to the impact of a natural disaster will generally result in lower revenue for the episode. We cannot assure you that hurricanes or other natural disasters will not have a material adverse impact on our business, financial condition or results of operations in the future.
Risks Related to Ownership of Our Common Stock
The price of our common stock may be volatile and this may adversely affect our stockholders.
The price at which our common stock trades may be volatile. The stock market has from time to time experienced significant price and volume fluctuations that have affected the market prices of securities, particularly securities of health care companies. The market price of our common stock may be influenced by many factors, including:
|
· |
our operating and financial performance; |
|
· |
variances in our quarterly financial results compared to expectations; |
|
· |
the depth and liquidity of the market for our common stock; |
|
· |
future sales of common stock or the perception that sales could occur; |
|
· |
investor perception of our business and our prospects; |
|
· |
developments relating to litigation or governmental investigations; |
|
· |
changes or proposed changes in health care laws or regulations or enforcement of these laws and regulations, or announcements relating to these matters; or |
|
· |
general industry, economic and stock market conditions. |
In addition, the stock market in general has experienced price and volume fluctuations that have often been unrelated or disproportionate to the operating performance of health care provider companies. These broad market and industry factors may materially reduce the market price of our common stock, regardless of our operating performance. In the past, securities class-action litigation has often been brought against companies following periods of volatility in the market price of their respective securities. We may become involved in this type of litigation in the future. Litigation of this type is often expensive to defend and may divert our management team’s attention as well as resources from the operation of our business.
Sales of substantial amounts of our common stock, or the availability of those shares for future sale, could adversely affect our stock price and limit our ability to raise capital.
At January 1, 2016, outstanding shares of our common stock totaled 10,021,395. In 2013, we established the 2013 Stock and Incentive Compensation Plan for the benefit of employees and directors providing for the issuance of up to 700,000 shares of common stock. As of January 1, 2016, shares of our common stock remained reserved for issuance pursuant to our incentive compensation plans totaled 373,615 and shares of our common stock reserved for issuance pursuant to our employee stock purchase plan totaled 300,000. The market price of our common stock could decline as a result of sales of substantial amounts of our common stock to the public or the perception that substantial sales could occur. These sales also may make it more difficult for us to sell common stock in the future to raise capital.
27
We do not regularly pay dividends on our common stock and you should not expect to receive dividends on shares of our common stock.
Although our board of directors declared a special cash dividend of $2.00 per common share to shareholders of record on December 20, 2012, we do not regularly pay dividends and intend to retain all future earnings to finance the continued growth and development of our business. In addition, we do not anticipate paying any cash dividends on our common stock in the foreseeable future. Any future payment of cash dividends will depend upon our financial condition, capital requirements, earnings, and other factors deemed relevant by our board of directors.
Our Board of Directors may use anti-takeover provisions or issue stock to discourage control contests.
We have implemented anti-takeover provisions or provisions that could have an anti-takeover effect, including advance notice requirements for director nominations and stockholder proposals. These provisions, and others that the Board of Directors may adopt hereafter, may discourage offers to acquire us and may permit our Board of Directors to choose not to entertain offers to purchase us, even if such offers include a substantial premium to the market price of our stock. Therefore, our stockholders may be deprived of opportunities to profit from a sale of control.
ITEM 1B. UNRESOLVED STAFF COMMENTS
NONE.
Our executive offices are located in Louisville, Kentucky, in approximately 33,000 square feet of space leased from an unaffiliated party.
We have 274 real estate location leases ranging from approximately 100 to 33,000 square feet of space in their respective locations. See Part I, Item 1, “Business - Operating Segments” and Part II, Item 8, “Notes to Consolidated Financial Statements.” We believe that our facilities are adequate to meet our current needs, and that additional or substitute facilities will be available if needed.
From time to time, we are subject to various legal actions arising in the ordinary course of our business, including claims for damages for personal injuries. In our opinion, after discussion with legal counsel, the ultimate resolution of any of these pending ordinary course claims and legal proceedings will not have a material effect on our financial position or results of operations.
The Company is in the process of complying with a civil subpoena from the United States Department of Justice received in January of 2016 related to two locations acquired along with SunCrest in late 2013. SunCrest had previously acquired the locations in its merger with Omni Home Health in 2011. The subpoena seeks the production of various pre-acquisition business records limited to certain Omni operations in Sarasota and Tampa, Florida for the years 2007-2011. The Company is cooperating fully with this investigation. The subject operations generated less than 1% of the Company’s consolidated revenues in 2015.
ITEM 4. MINE SAFETY DISCLOSURES
Not applicable.
28
ITEM 5. MARKET FOR THE REGISTRANT’S COMMON EQUITY, RELATED STOCKHOLDER MATTERS AND ISSUER PURCHASES OF EQUITY SECURITIES
Our common stock is traded on the NASDAQ Global Select market under the symbol “AFAM” Set forth below are the high and low sale prices for the common stock for the periods indicated as reported by NASDAQ:
|
Closing Common Stock Prices |
|
|
|
|
|
|
Quarter Ended: |
|
High |
|
Low |
|
|
January 1, 2016 |
|
44.70 |
|
37.75 |
|
|
October 2, 2015 |
|
49.74 |
|
39.14 |
|
|
July 3, 2015 |
|
47.76 |
|
36.59 |
|
|
April 3, 2015 |
|
46.55 |
|
28.68 |
|
|
December 31, 2014 |
|
30.30 |
|
26.35 |
|
|
September 30, 2014 |
|
28.76 |
|
22.47 |
|
|
June 30, 2014 |
|
24.29 |
|
19.98 |
|
|
March 31, 2014 |
|
33.27 |
|
22.21 |
|
On March 1, 2016, the last reported sale price for the common stock reported by NASDAQ was $39.08 and there were approximately 312 holders of record of our common stock. We did not pay dividends in 2015 or 2014. We do not intend to pay additional dividends on our common stock and will retain our earnings for future operations and the growth of our business.
29
STOCK PERFORMANCE GRAPH
The following stock performance graph does not constitute soliciting material and should not be deemed filed or incorporated by reference into any other Company filing under the Securities Act of 1933 or the Securities Exchange Act of 1934, except to the extent the Company specifically incorporates the performance graph by reference therein.
The Performance Graph below compares the cumulative total stockholder return on our common stock, $0.10 par value per share, for the five-year period ended January 1, 2016, with the cumulative total return on the Russell 2000 index and an industry peer group over the same period (assuming the investment of $100 in each on December 31, 2010 and the reinvestment of dividends, if any). The peer group we selected is comprised of: Amedisys, Inc. (AMED) and LHC Group, Inc. (LHCG). The cumulative total stockholder return on the following graph is historical and is not necessarily indicative of future stock price performance.
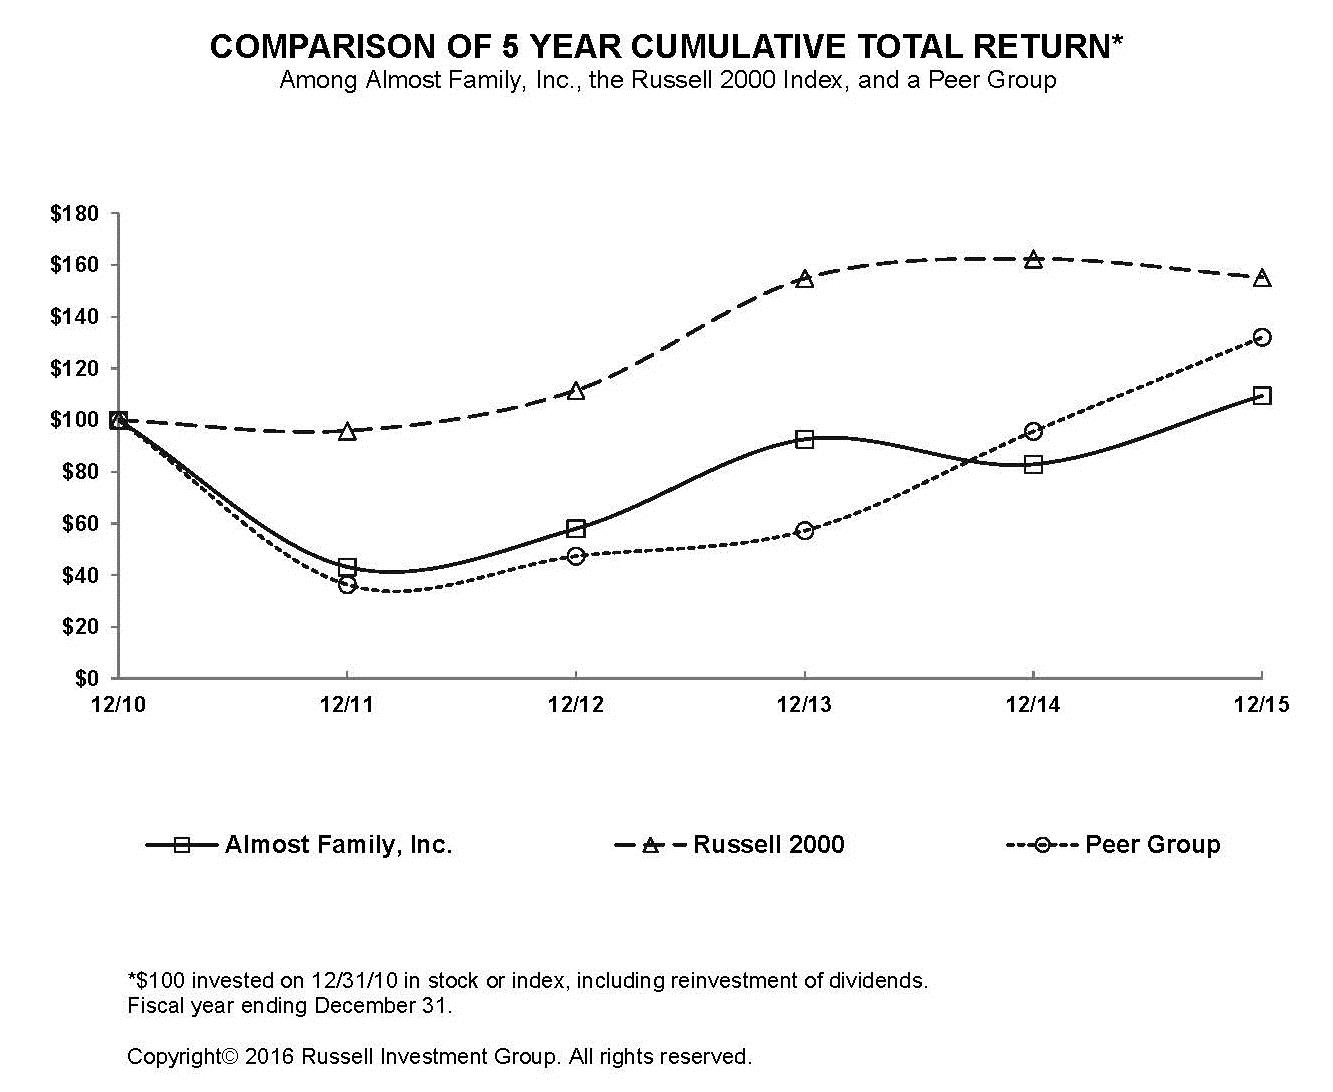
|
|
|
12/10 |
|
12/11 |
|
12/12 |
|
12/13 |
|
12/14 |
|
12/15 |
|
|
|
|
|
|
|
|
|
|
|
|
|
|
|
|
|
Almost Family, Inc. |
|
100 |
|
43.15 |
|
57.98 |
|
92.52 |
|
82.85 |
|
109.40 |
|
|
Russell 2000 |
|
100 |
|
95.82 |
|
111.49 |
|
154.78 |
|
162.35 |
|
155.18 |
|
|
Peer Group |
|
100 |
|
36.30 |
|
47.33 |
|
57.19 |
|
95.63 |
|
132.01 |
|
30
ITEM 6. SELECTED FINANCIAL DATA
The following table sets forth selected financial information derived from the consolidated financial statements of the Company for the periods and at the dates indicated. The information should be read in conjunction with the consolidated financial statements and related notes included elsewhere in this and prior year Form 10-Ks.
|
|
|
Fiscal Year ended |
Calendar Year |
|
|||||||||||||
|
(In thousands except per share data) |
|
January 1, 2016 (1) |
|
2014 |
|
2013 |
|
2012 |
|
2011 |
|
||||||
|
Results of operations data: |
|
|
|
|
|
|
|
|
|
|
|
|
|
|
|
|
|
|
Net service revenues |
|
$ |
532,214 |
|
$ |
495,829 |
|
$ |
356,912 |
|
$ |
340,620 |
|
$ |
329,644 |
|
|
|
Income from continued operations attributable to Almost Family, Inc. |
|
$ |
20,009 |
|
$ |
13,763 |
|
$ |
8,784 |
|
$ |
16,802 |
|
$ |
19,337 |
|
|
|
Discontinued operations |
|
|
— |
|
|
— |
|
|
(558) |
|
|
482 |
|
|
1,465 |
|
|
|
Net income attributable to Almost Family, Inc. |
|
$ |
20,009 |
|
$ |
13,763 |
|
$ |
8,226 |
|
$ |
17,284 |
|
$ |
20,802 |
|
|
|
|
|
|
|
|
|
|
|
|
|
|
|
|
|
|
|
|
|
|
Per share: |
|
|
|
|
|
|
|
|
|
|
|
|
|
|
|
|
|
|
Basic: |
|
|
|
|
|
|
|
|
|
|
|
|
|
|
|
|
|
|
Number of shares |
|
|
9,505 |
|
|
9,333 |
|
|
9,279 |
|
|
9,285 |
|
|
9,278 |
|
|
|
Income from continued operations attributable to Almost Family, Inc. |
|
$ |
2.11 |
|
$ |
1.47 |
|
$ |
0.95 |
|
$ |
1.81 |
|
$ |
2.08 |
|
|
|
Discontinued operations |
|
|
— |
|
|
— |
|
|
(0.06) |
|
|
0.05 |
|
|
0.16 |
|
|
|
Net income attributable to Almost Family, Inc. |
|
$ |
2.11 |
|
$ |
1.47 |
|
$ |
0.89 |
|
$ |
1.86 |
|
$ |
2.24 |
|
|
|
|
|
|
|
|
|
|
|
|
|
|
|
|
|
|
|
|
|
|
Diluted: |
|
|
|
|
|
|
|
|
|
|
|
|
|
|
|
|
|
|
Number of shares |
|
|
9,745 |
|
|
9,462 |
|
|
9,374 |
|
|
9,324 |
|
|
9,360 |
|
|
|
Income from continued operations attributable to Almost Family, Inc. |
|
$ |
2.05 |
|
$ |
1.45 |
|
$ |
0.94 |
|
$ |
1.80 |
|
$ |
2.07 |
|
|
|
Discontinued operations |
|
|
— |
|
|
— |
|
|
(0.06) |
|
|
0.05 |
|
|
0.16 |
|
|
|
Net income attributable to Almost Family, Inc. |
|
$ |
2.05 |
|
$ |
1.45 |
|
$ |
0.88 |
|
$ |
1.85 |
|
$ |
2.22 |
|
|
|
|
|
|
|
|
|
|
|
|
|
|
|
|
|
|
|
|
|
|
Dividend declared per share |
|
$ |
— |
|
$ |
— |
|
$ |
— |
|
$ |
2 |
|
$ |
— |
|
|
(1) - See page 35 for discussion regarding the Company’s change to a 52-53 week reporting calendar in 2015.
|
|
|
January 1, |
December 31, |
|
|||||||||||||
|
|
|
2016 |
|
2014 |
|
2013 |
|
2012 |
|
2011 |
|
||||||
|
Balance sheet data |
|
|
|
|
|
|
|
|
|
|
|
|
|
|
|
|
|
|
Working capital |
|
$ |
54,643 |
|
$ |
40,274 |
|
$ |
44,148 |
|
$ |
62,541 |
|
$ |
63,394 |
|
|
|
Total assets |
|
|
464,769 |
|
|
345,258 |
|
|
354,362 |
|
|
249,259 |
|
|
251,160 |
|
|
|
Long-term liabilities |
|
|
136,048 |
|
|
60,432 |
|
|
83,436 |
|
|
17,846 |
|
|
15,708 |
|
|
|
Total liabilities |
|
|
190,869 |
|
|
112,066 |
|
|
136,669 |
|
|
44,944 |
|
|
44,863 |
|
|
|
Noncontrolling interest-redeemable - Healthcare Innovations |
|
|
3,639 |
|
|
3,639 |
|
|
3,639 |
|
|
— |
|
|
— |
|
|
|
Stockholders’ equity |
|
|
270,261 |
|
|
229,553 |
|
|
214,054 |
|
|
204,315 |
|
|
206,297 |
|
|
31
ITEM 7. MANAGEMENT’S DISCUSSION AND ANALYSIS OF FINANCIAL CONDITION AND RESULTS OF OPERATIONS
OVERVIEW
The Company has two divisions, Home Health care and Healthcare Innovations. The Home Health care division is comprised of two reportable segments, Visiting Nurse Services (VN or Visiting Nurse) and Personal Care Services (PC or Personal Care). Our Healthcare Innovations division is also a reporting segment. Reportable segments have been identified based upon how management has organized the business by services provided to customers and the criteria in ASC Topic 280, Segment Reporting.
Our VN segment provides skilled medical services in patients’ homes largely to enable recipients to reduce or avoid periods of hospitalization and/or nursing home care. VN Medicare revenues are generated primarily on a per episode basis rather than a fee per visit or an hourly basis. Approximately 94% of the VN segment revenues are generated from the Medicare program while the balance is generated from Medicaid and private insurance programs.
Our PC segment services are also provided in patients’ homes. These services (generally provided by paraprofessional staff such as home health aides) are generally of a custodial rather than skilled nature. PC revenues are generated primarily on an hourly basis. Approximately 83% of the PC segment revenues are generated from Medicaid and other government programs while the balance is generated from insurance programs and private pay patients.
Our HealthCare Innovations (“HCI”) business segment was created to house and separately report on its developmental activities outside our traditional home health business platform. These activities are intended ultimately, whether directly or indirectly, to benefit patients and payers through the enhanced provision of home health services. Its activities all share a common goal of improving patient experiences and quality outcomes, while lowering costs. These include, but are not limited to: technology, information, population health management, risk-sharing, assessments, care coordination and transitions, clinical advancements, enhanced patient engagement and informed clinical decision making. We believe these activities help us discover valuable insight and experiences that would not otherwise be gained in the routine operation of its core home health business segments. Further, we believe these innovation activities, will play an important role in collaborating with policy makers, payers, providers, and anyone who assumes financial risk for managing patient populations, to seek to reduce costs and improve quality by providing increasingly more care for more patients in their homes than ever before.
The HCI segment now includes: a) Imperium Health Management, an ACO enablement company, b) an investment in NavHealth, a population-health analytics company, c) Ingenios Health, a Nurse-Practitioner-oriented and mobile technology-enabled health risk assessment company primarily serving managed care organizations; and d) Long Term Solutions, an in-home assessment company serving the long-term care insurance industry.
During 2015, we completed four acquisitions and made a cost based investment. On November 5, 2015, we completed the acquisition of Black Stone Operations, LLC (“Black Stone”). Black Stone owned and operated personal care and skilled home health services in western Ohio. On August 29, 2015, we completed the acquisition of Bracor, Inc. (dba “WillCare”). Willcare owned and operated VN and PC branch locations in New York (12) and Connecticut (1). On March 1, 2015 we acquired the stock of WillCare’s Ohio operations. On July 22, 2015, we acquired Ingenios Health Co. (“Ingenios”). Ingenios is a leading provider of technology enabled in-home clinical assessments for Medicare Advantage, Managed Medicaid and Commercial Exchange lives in 7 states and Washington, D.C. The results of the Black Stone and WillCare acquisitions are reported in our VN and PC segments, while our Ingenios acquisition results are included in the Healthcare Innovations segment.
On January 29, 2015, we acquired a noncontrolling interest in a development stage analytics and software company, NavHealth, Inc. (“NavHealth”). The investment is an asset of our Healthcare Innovations segment.
During the second quarter of 2014, we acquired a small home health agency in southern Kentucky using cash on hand to expand existing VN segment operations. During 2013, we completed three acquisitions. On December 6, 2013, the Company completed the acquisition of Omni Home Health Holdings, Inc. (“SunCrest”). SunCrest subsidiaries owned
32
and operated 60 Medicare-certified home health agencies and 9 private duty agencies in Florida, Tennessee, Georgia, Pennsylvania, Kentucky, Illinois, Indiana, Mississippi and Alabama. On October 4, 2013, we acquired a controlling interest in Imperium Health Management, LLC (“Imperium”), a development-stage enterprise that provides strategic health management services to Accountable Care Organizations (“ACOs”). On July 17, 2013, the Company acquired the assets of the Medicare-certified home health agencies owned by Indiana Home Care Network (“IHCN”). The results of operations for SunCrest and IHCN are principally reported within the Company’s Visiting Nurse reportable segment, while Imperium results are included in the Healthcare Innovations segment.
Our View on Reimbursement and Diversification of Risk
Our Company is highly dependent on government reimbursement programs which pay for the majority of the services we provide to our patients. Reimbursement under these programs, primarily Medicare and Medicaid, is subject to frequent changes as policy makers balance their own needs to meet the health care needs of constituents while also meeting their fiscal objectives. Medicare and Medicaid are consuming a greater percentage of federal and states’ budgets, respectively, which is exacerbated in times of economic downturn. We believe that these financial issues are cyclical in nature rather than indicative of the long-term prospect for Medicare and Medicaid funding of health care services. Additionally, we believe our services offer the lowest cost alternative to institutional care and is a part of the solution to both balancing the federal budget and the states’ Medicaid financing problems.
We believe that an important key to our historical success and to our future success is our ability to adapt our operations to meet changes in reimbursement as they occur. One important way in which we have achieved this adaptability in the past, and in which we plan to achieve it in the future, is to maintain some level of diversification in our business mix.
The execution of our business plan will place primary emphasis on the development of our home health operations. As our business grows, we may evaluate opportunities for the provision of other health care services in patients’ homes that would be consistent with our Senior Advocacy mission.
Our Business Plan
Our future success depends on our ability to execute our business plan. Over the next three to five years we will try to accomplish the following:
|
· |
Generate meaningful same store sales growth through the focused provision of high quality services and attending to the needs of our patients; |
|
· |
Drive our costs down, while continuing to provide high-quality patient care, by improving the productivity of our work force through improved monitoring, tighter controls, workflow automation, use of technology and other opportunities for efficiency gains; |
|
· |
Expand the significance of our home health services by selectively acquiring other quality providers, through the startup of new agencies and potentially by providing new services in patients’ homes consistent with our Senior Advocacy mission; |
|
· |
Make additional strategic investments which expand our Healthcare Innovation segment in its mission to find solutions for more effective, efficient and appropriate delivery of homecare; and |
|
· |
Expand our capital base through both earnings performance and by seeking additional capital investments in our Company. |
Health Care Reform Legislation and Medicare Regulations
The Federal Government has been pursuing a comprehensive reform of the US healthcare system since early 2009. Numerous changes have been enacted, proposed and continue to be debated, which are discussed in more detail in Part I, Item 1, “Government Regulation” and Part I, Item 1A, “Risk Factors.” Many of the change provisions do not take
33
effect for an extended period of time and most will require the publication of implementing regulations and/or the issuance of programmatic guidelines.
It is reasonable to expect that the implementation of the ACA and other changes and potential changes described in Part I, Item 1, Government Regulation, might have a more immediate and negative impact on those providers generating lower margins than us, with more leverage relative to earnings than us, with less capital resources than us, or with less ability to adapt their operations. We believe this may result in a contraction of the number of home health providers. In the event of such a contraction in the number of providers, we believe the surviving providers may benefit from a higher rate of admissions growth than would have otherwise occurred. Those surviving providers may earn incremental margins on those higher admissions that may serve to offset a portion of the rate reduction from the Medicare program. However, there can be no assurance that we will be successful in attracting such higher admissions.
It is also reasonable to expect that future rate cuts will present additional opportunities for us to make acquisitions of other providers at valuations and on terms that are attractive to us and enable us to spread our segment and unallocated corporate overhead expenses across a larger business base. However, there can be no assurance that we will be successful in making such acquisitions or that such opportunities will present themselves.
As a result of the broad scope of health care reform, the significant changes it will effect in the healthcare industry and society generally, and the complexity of the technical issues it addresses, we are unable to predict, at this time, all the ramifications health care reform may have on our business as a health care provider or a sponsor of an employee health insurance benefit plan. These matters could have a material adverse impact on our results of operations or financial condition in ways not currently anticipated by us. This may increase our costs, decrease our revenues, expose us to expanded liability or require us to revise the ways in which we conduct our business. Refer to the results of operations for the impact of these items on revenue, operating and net income for the years ended January 1, 2016, December 31, 2014 and 2013.
Management is continuing its work to evaluate the implications of these changes and to develop appropriate courses of action for the Company. Additionally, we may be unable to take actions to mitigate any, or all, of the negative implications of these matters.
We contemplate formulating and taking actions intended to mitigate or otherwise offset some of the negative effects of reimbursement changes. These actions may include any or all of the following:
|
· |
Attempting to increase our revenues by: investing more resources in sales and marketing activities, development of diagnosis related specialty programs and increasing our educational programs regarding the value of home health to drive admission growth, establishing startup branch operations to expand our service territories, and acquisitions of underperforming providers with strong referral relationships, |
|
· |
Attempting to reduce our costs by: developing a more efficient delivery model, increasing the productivity standards for our staff, optimizing the appropriate use of different levels of professional staff, limiting or eliminating the growth in wage rates, limiting or reducing the size of our work force, closing unprofitable branch operations and accelerating our efforts to evaluate the use of various technological approaches to the delivery of patient care to improve patient outcomes and/or improve the productivity of our workforce, |
|
· |
Evaluating the potential implications of health care reform on our employee benefit plans, and possible changes we may need to make to our plans, and |
|
· |
Potentially other actions we deem appropriate including evaluation of potential additional service offerings in patients’ homes consistent with our Senior Advocacy mission or changing the mix of the types of services we provide. |
Although we will attempt to mitigate or otherwise offset the negative effect of health care reform on our revenue and our employee benefit plans, our actions may not ultimately be cost effective or prove successful.
34
Seasonality
Our Visiting Nurse segment operations located in Florida (which generated approximately 24% of that segment’s revenues in fiscal year 2015) normally experience higher admissions during the first quarter and lower admissions during the third quarter than in the other quarters due to seasonal population fluctuations.
Fiscal Year End
Effective with the first quarter of 2015, the Company adopted a 52-53 week fiscal reporting calendar under which it will report its annual results going forward in four equal 13-week quarters. Every fifth year, one quarter will include 14 weeks and that year will include 53 weeks of operating results. Once fully adopted, this approach will minimize the impact of calendar differences when comparing different historical periods.
As a result of the change in the fiscal reporting calendar, fiscal year 2015 ended January 1, 2016 also included the New Year’s Day holiday observed January 1, 2016. As such the fiscal year ended January 1, 2016 is 366 days, one more day than it would have been if the change had not been made which reduced diluted earnings per share by $0.03.
Critical Accounting Policies
The accompanying consolidated financial statements have been prepared in conformity with accounting principles generally accepted in the United States. When more than one accounting principle, or the method of its application, is generally accepted, we select the principle or method that is appropriate in the specific circumstances. Application of these accounting principles requires us to make estimates about the future resolution of existing uncertainties; actual results could differ from these estimates. We evaluate our estimates, including those related to revenue recognition, collectability of accounts receivable, insurance reserves, goodwill, intangibles, income taxes, stock-based compensation, litigation, and contingencies on an on-going basis. We base these estimates on our historical experience and other assumptions that we believe are appropriate under the circumstances. In preparing these consolidated financial statements, we have made our best estimates and judgments of the amounts and disclosures included in the consolidated financial statements.
Revenue Recognition
We recognize revenues when patient services are provided, primarily in our patients’ homes. Net service revenues are stated at amounts estimated by us to be their net realizable values. We are paid for our services primarily by federal and state third-party reimbursement programs and, to a lesser degree, commercial insurance companies and patients.
Medicare Episodic Revenues
Approximately 71% of our consolidated net service revenues are derived from the Medicare program. Net service revenues are recorded under the Medicare prospective payment program (“PPS”) based on a 60-day episode payment rate that is subject to adjustment based on certain variables including, but not limited to: (a) changes in the base episode payments established by the Medicare program; (b) adjustments to the base episode payments for case-mix and geographic wages; (c) a low utilization payment adjustment (“LUPA”) if the number of visits was fewer than five; (d) a partial payment if our patient transferred to another provider or we received a patient from another provider before completing the episode; (e) a payment adjustment based upon the level of therapy services required (thresholds set at 6, 14 and 20 visits); (f) an outlier payment if our patient’s care was unusually costly (capped at 10% of total reimbursement at the agency level); (g) the number of episodes of care provided to a patient; and (h) 2% sequestration reduction for episodes ending after March 31, 2013.
At the beginning of each Medicare episode, we calculate an estimate of the amount of expected reimbursement based on the variables outlined above and recognize Medicare revenue on an episode-by-episode basis during the course of each episode over its expected number of visits. Over the course of each episode, as changes in the variables become known, we calculate and record adjustments as needed to reflect changes in expectations for that episode from those established at the start of the 60 day period until its ultimate outcome at the end of the 60 day period is known.
35
Non-Medicare Revenues
Substantially all remaining revenues are derived from services provided under a per visit, per hour or unit basis (as opposed to episodic) for which revenues are calculated and recorded using payor-specific or patient-specific fee schedules based on the contracted rates in each third party payor agreement.
Contingent Service Revenues
Our Healthcare Innovations segment provides strategic health management services to ACOs that have been approved to participate in the “MSSP.” In addition to having ownership interests in a few ACOs, we also have service agreements with ACOs that provide for sharing of MSSP payments received by the ACO, if any. ACOs are entities that contract with Centers for Medicare and Medicaid Services (CMS) to serve the Medicare fee-for-service population with the goal of better care for individuals, improved health for populations and lower costs. ACOs share savings with CMS to the extent that the actual costs of serving assigned beneficiaries are below certain trended benchmarks of such beneficiaries and certain quality performance measures are achieved. The MSSP is relatively new and therefore has limited historical experience, which impacts the Company’s ability to accurately accumulate and interpret the data available for calculating an ACOs’ shared savings, if any. MSSP payments are not recognized in revenue until persuasive evidence of an arrangement exists, services have been rendered, the payment is fixed and determinable and collectability is assured, which generally is satisfied only upon cash receipt. Under such agreements, we recognized $1.4 million in MSSP payments for cash received during 2015 related to savings generated for the program period ended December 31, 2014 and $1.6 million for savings generated for the program period ended December 31, 2013, which accounted for 41% and 63%, respectively of our healthcare innovations segment revenues. No revenue has been recognized related to MSSP payments for savings generated through December 31, 2015, if any.
Revenue Adjustments
Laws and regulations governing the Medicare and Medicaid programs are extremely complex and subject to interpretation. As a result, we may adjust previously recorded revenue amounts due to issues related to: a) medical coding, particularly with respect to Medicare, b) patient eligibility, particularly with respect to Medicaid, and c) other reasons unrelated to credit risk. Revenue adjustments, if any, to reflect actual payment amounts for completed episodes or services provided under per visit, per hour or unit basis which differ from our estimates or audit adjustments are recorded when known and estimable. Historically, revenue adjustments have not been significant and as such, we believe that net service revenues and accounts receivable - net reflect their net realizable value. Changes in estimates related to prior periods (increased) decreased revenues by approximately ($365,000), ($320,000) and $114,000 in the years ended January 1, 2016 and December 31, 2014 and 2013, respectively.
Accounts Receivable
Accounts receivable are reported at their estimated net realizable value and are net of estimated allowances for uncollectible accounts and adjustments. Accounts receivable consist primarily of amounts due from third-party payors and patients. We evaluate the collectability of our accounts receivable based on certain factors, such as payor types, historical collection trends and aging categories. We calculate our reserve for uncollectible accounts based on the length of time that the receivables are past due. The percentage applied to the receivable balances for each payor’s various aging categories is based on historical collection experience, business and economic conditions and reimbursement trends.
Insurance Programs
We bear significant risk under our large-deductible workers’ compensation insurance program and our self-insured employee health program. Under the workers’ compensation insurance program, we bear risk up to $400,000 per incident, except for an acquisition that has not been folded into our program and carries a stop-loss of $750,000. We purchase stop-loss insurance for the employee health plan that places a specific limit, generally $300,000, on our exposure for any individual covered life.
36
Malpractice and general patient liability claims for incidents which may give rise to litigation have been asserted against us by various claimants. The claims are in various stages of processing and some may ultimately be brought to trial. We are aware of incidents that have occurred through January 1, 2016 that may result in the assertion of additional claims. We currently carry professional and general liability insurance coverage (on a claims made basis) for this exposure with no deductible. We also carry D&O coverage (also on a claims made basis) for potential claims against our directors and officers, including securities actions, with deductibles ranging from $175,000 to $500,000 per claim.
We record estimated liabilities for our insurance programs based on information provided by the third-party plan administrators, historical claims experience, the life cycle of claims, expected costs of claims incurred but not paid, and expected costs to settle unpaid claims. We monitor our estimated insurance-related liabilities and recoveries, if any, on a monthly basis and as required by ASU 2010-24, Health Care Entities (Topic 954): Presentation of Insurance Claims and Related Insurance Recoveries, record amounts due under insurance policies in other current assets, while recording the estimated carrier liability in other current liabilities in the consolidated balance sheets. As facts change, it may become necessary to make adjustments that could be material to our results of operations and financial condition.
Goodwill and Other Intangible Assets
Intangible assets are stated at fair value at the time of acquisition and goodwill represents the excess cost over the fair value of net assets acquired and liabilities assumed. Finite lived intangible assets are amortized on a straight-line basis over the estimated useful life of the asset. Goodwill and indefinite-lived assets are not amortized. We perform impairment tests of goodwill and indefinite lived assets as required by ASC Topic 350, Intangibles - Goodwill and Other on at least an annual basis. An impairment analysis requires numerous subjective assumptions and estimates to determine fair value of the respective reporting units. We estimate the fair value of the related reporting units using a combined market approach (guideline company and similar transaction method) and income approach (discounted cash flow analysis). These models are based on our projections of future revenues and operating costs and are reconciled to our consolidated market capitalization. Discounted cash flow models are highly reliant on various assumptions. Significant assumptions we utilize in these models for the current year included: projected business results and future industry direction, long-term growth factor of 3% and weighted-average cost of capital of 15%. We use assumptions that we deem to be reasonable estimates of likely future events and compares the total fair values of each reporting unit to our overall market capitalization, and implied control premium, to determine if the fair values are reasonable compared to external market indicators. Subsequent changes in these key assumptions could affect the results of future goodwill impairment reviews.
Important to our overall impairment conclusion was the comparison of the aggregate fair values of the reporting units to our overall market capitalization at the annual assessment date, including the implied control premium, to determine if the fair values are reasonable compared to external market indicators. The aggregate fair value for each reporting unit did not exceed our market value as of the annual impairment testing date. A negative control premium indicates the high degree of conservatism built into our fair value models.
Because the fair value results for each reporting unit did not indicate a potential impairment existed, we did not recognize any goodwill impairment during the fiscal years ending January 1, 2016, December 31, 2014 and December 31, 2013. Specifically, our VN and PC reporting unit fair values were significantly over their carrying value. Based on the sensitivity analysis performed on two key assumptions in the discounted cash flow models of each reporting unit, a 100 basis point change in either assumption (either individually or in the aggregate) would not result in any impairment of our goodwill within either reporting unit.
In calculating the fair value of VN within the model, we considered our cash flow projections and weighted average cost of capital to be conservative. Assuming no changes in the key assumptions identified and projected results, we currently anticipate the future fair value of both the VN and PC reporting units to increase over time; however, future declines in the operating results of either reporting unit could indicate a need to reevaluate the fair value of these businesses under U.S. GAAP requirements and may ultimately result in an impairment to goodwill. We will continue to monitor for any potential indicators of impairment.
37
Accounting for Income Taxes
We account for taxes in accordance with ASC Topic 740, Income Taxes. As of January 1, 2016, we have net deferred tax liabilities of approximately $13.1 million. The net deferred tax liability is composed of approximately $19.1 million of deferred tax assets and approximately $32.2 million of deferred tax liabilities. We have provided a valuation allowance against certain deferred tax assets based upon our estimates of realizability of those assets through future taxable income. This valuation allowance was based in large part on our history of generating operating income or losses in individual tax locales and expectations for the future. Our ability to generate the expected amounts of taxable income from future operations is dependent upon general economic conditions, competitive pressures on revenues and margins and legislation and regulation at all levels of government. Further, we have book goodwill of $113.2 million which is not deductible for tax purposes. The remaining deductible goodwill provides an annual tax deduction approximating $10.0 million through 2021. We have considered the above factors in reaching our conclusion that it is more likely than not that future taxable income will be sufficient to fully utilize the deferred tax assets (net of the valuation allowance) as of January 1, 2016.
RESULTS OF OPERATIONS
Year Ended January 1, 2016 Compared with Year Ended December 31, 2014
(In thousands)
|
|
|
January 1, |
|
December 31, |
|
|
|
|
|
|
||||||
|
|
|
2016 (2) |
|
2014 |
|
Change |
|
|||||||||
|
Consolidated |
|
Amount |
|
% Rev |
|
Amount |
|
% Rev |
|
Amount |
|
% |
|
|||
|
Home Health Operations |
|
|
|
|
|
|
|
|
|
|
|
|
|
|
|
|
|
Net service revenues: |
|
|
|
|
|
|
|
|
|
|
|
|
|
|
|
|
|
Visiting Nurse |
|
$ |
401,051 |
|
75.8 |
% |
$ |
380,788 |
|
77.2 |
% |
$ |
20,263 |
|
5.3 |
% |
|
Personal Care |
|
|
127,712 |
|
24.2 |
% |
|
112,497 |
|
22.8 |
% |
|
15,215 |
|
13.5 |
% |
|
|
|
|
528,763 |
|
100.0 |
% |
|
493,285 |
|
100.0 |
% |
|
35,478 |
|
7.2 |
% |
|
Operating income before corporate expenses: |
|
|
|
|
|
|
|
|
|
|
|
|
|
|
|
|
|
Visiting Nurse |
|
|
49,872 |
|
12.4 |
% |
|
42,899 |
|
11.3 |
% |
|
6,973 |
|
16.3 |
% |
|
Personal Care |
|
|
14,170 |
|
11.1 |
% |
|
12,453 |
|
11.1 |
% |
|
1,717 |
|
13.8 |
% |
|
|
|
|
64,042 |
|
12.1 |
% |
|
55,352 |
|
11.2 |
% |
|
8,690 |
|
15.7 |
% |
|
Healthcare Innovations |
|
|
|
|
|
|
|
|
|
|
|
|
|
|
|
|
|
Revenue |
|
|
3,451 |
|
100.0 |
% |
|
2,544 |
|
100.0 |
% |
|
907 |
|
35.7 |
% |
|
Operating income before noncontrolling interest |
|
|
(1,217) |
|
-35.3 |
% |
|
(13) |
|
-0.5 |
% |
|
(1,204) |
|
NM |
|
|
|
|
|
|
|
|
|
|
|
|
|
|
|
|
|
|
|
|
Corporate expenses |
|
|
26,583 |
|
5.0 |
% |
|
25,558 |
|
5.2 |
% |
|
1,025 |
|
4.0 |
% |
|
Deal, transition and other costs |
|
|
4,139 |
|
0.8 |
% |
|
5,304 |
|
1.1 |
% |
|
(1,165) |
|
-22.0 |
% |
|
Operating income |
|
|
32,103 |
|
6.0 |
% |
|
24,477 |
|
4.9 |
% |
|
7,626 |
|
31.2 |
% |
|
Interest expense, net |
|
|
(2,006) |
|
-0.4 |
% |
|
(1,442) |
|
-0.3 |
% |
|
(564) |
|
39.1 |
% |
|
Income tax expense |
|
|
(10,556) |
|
-2.0 |
% |
|
(9,511) |
|
-1.9 |
% |
|
(1,045) |
|
11.0 |
% |
|
Net income |
|
$ |
19,541 |
|
3.7 |
% |
$ |
13,524 |
|
2.7 |
% |
$ |
6,017 |
|
44.5 |
% |
|
|
|
|
|
|
|
|
|
|
|
|
|
|
|
|
|
|
|
Adjusted EBITDA-HHO (1) |
|
$ |
43,938 |
|
8.3 |
% |
$ |
35,841 |
|
7.2 |
% |
$ |
8,097 |
|
22.6 |
% |
|
Adjusted Earnings-HHO (1) |
|
$ |
21,411 |
|
4.0 |
% |
$ |
16,924 |
|
3.4 |
% |
$ |
4,487 |
|
26.5 |
% |
|
(1) |
See page 48 for GAAP reconciliation of Adjusted EBITDA from home health operations and Adjusted earnings from home health operations. |
|
(2) |
See page 35 for discussion regarding the Company’s change to a 52-53 week reporting calendar in 2015. |
Approximately $31.2 million of our $35.5 million year over year increase in Home Health revenue was a result of our acquisition of WillCare and Black Stone. Refer to VN and PC segment discussions for further operating performance details. Refer to “Fiscal Year End” related to our 52-53 week reporting conversion.
38
Healthcare Innovations’ operating loss was primarily due to the expected losses of our third quarter 2015 acquisition of Ingenios and to a lesser degree, higher losses in Imperium primarily related to a lower MSSP payments in 2015, as compared to 2014.
Corporate expenses as a percentage of revenue decreased slightly to 5.0% in 2015 from 5.2% in 2014. Deal, transition and other costs for 2015 include a net benefit of $4.2 million related to legal settlements, which was offset by $2.5 million of deal and transition costs related to our 2015 acquisitions, the $1.8 million provision for the Chapter 7 bankruptcy filing of a specific payor and $1.4 million related to the fourth quarter of 2015 closure of underperforming branch locations in the VN segment. Deal and transition costs in 2014 primarily related to the completion of the transition of our 2013 acquisitions.
Interest expense increased $0.6 million due to borrowings on our line of credit in conjunction with 2015 acquisitions.
Our effective tax rate for 2015 was 34.5% compared to 41.0% for 2014. The lower effective tax rate for 2015 was primarily related to the tax treatment of a legal settlement. Excluding the non-taxable settlement and other nondeductible deal costs, our effective tax rate for 2015 would have been 40.5%.
Visiting Nurse Segment-Years Ended January 1, 2016 and December 31, 2014
Approximately 94% of the VN segment revenues were generated from the Medicare program while the balance was generated from Medicaid and private insurance programs. In addition to our focus on operating income from the
39
Visiting Nurse segment, we also measure this segment’s performance in terms of admissions, episodes, visits, patient months of care, revenue per episode and visits per episode. (In thousands, except statistical information)
|
|
January 1, |
|
December 31, |
|
|
|
|
|
|
||||||
|
|
2016 (2) |
|
2014 |
|
Change |
|
|||||||||
|
|
Amount |
|
% Rev |
|
Amount |
|
% Rev |
|
Amount |
|
% |
|
|||
|
Net service revenues |
$ |
401,051 |
|
100.0 |
% |
$ |
380,788 |
|
100.0 |
% |
$ |
20,263 |
|
5.3 |
% |
|
Cost of service revenues |
|
194,098 |
|
48.4 |
% |
|
186,837 |
|
49.1 |
% |
|
7,261 |
|
3.9 |
% |
|
Gross margin |
|
206,953 |
|
51.6 |
% |
|
193,951 |
|
50.9 |
% |
|
13,002 |
|
6.7 |
% |
|
General and administrative expenses: |
|
|
|
|
|
|
|
|
|
|
|
|
|
|
|
|
Salaries and benefits |
|
115,002 |
|
28.7 |
% |
|
110,480 |
|
29.0 |
% |
|
4,522 |
|
4.1 |
% |
|
Other |
|
42,079 |
|
10.5 |
% |
|
40,572 |
|
10.7 |
% |
|
1,507 |
|
3.7 |
% |
|
Total general and administrative expenses |
|
157,081 |
|
39.2 |
% |
|
151,052 |
|
39.7 |
% |
|
6,029 |
|
4.0 |
% |
|
Operating income before corporate expenses |
$ |
49,872 |
|
12.4 |
% |
$ |
42,899 |
|
11.3 |
% |
$ |
6,973 |
|
16.3 |
% |
|
|
|
|
|
|
|
|
|
|
|
|
|
|
|
|
|
|
Average number of locations |
|
163 |
|
|
|
|
167 |
|
|
|
|
(4) |
|
-2.4 |
% |
|
|
|
|
|
|
|
|
|
|
|
|
|
|
|
|
|
|
All payors: |
|
|
|
|
|
|
|
|
|
|
|
|
|
|
|
|
Patients Months |
|
333,343 |
|
|
|
|
319,430 |
|
|
|
|
13,913 |
|
4.4 |
% |
|
Admissions |
|
102,381 |
|
|
|
|
98,634 |
|
|
|
|
3,747 |
|
3.8 |
% |
|
Billable Visits |
|
2,621,443 |
|
|
|
|
2,507,067 |
|
|
|
|
114,376 |
|
4.6 |
% |
|
|
|
|
|
|
|
|
|
|
|
|
|
|
|
|
|
|
Medicare: |
|
|
|
|
|
|
|
|
|
|
|
|
|
|
|
|
Admissions (1) |
|
91,027 |
|
88.9 |
% |
|
87,650 |
|
88.9 |
% |
|
3,377 |
|
3.9 |
% |
|
Revenue (in thousands) |
$ |
377,724 |
|
94.2 |
% |
$ |
365,075 |
|
95.9 |
% |
$ |
12,649 |
|
3.5 |
% |
|
Revenue per admission |
$ |
4,150 |
|
|
|
$ |
4,165 |
|
|
|
$ |
(16) |
|
-0.4 |
% |
|
Billable visits (1) |
|
2,356,687 |
|
89.9 |
% |
|
2,259,896 |
|
90.1 |
% |
|
96,791 |
|
4.3 |
% |
|
Recertifications |
|
47,999 |
|
|
|
|
47,875 |
|
|
|
|
124 |
|
0.3 |
% |
|
Payor mix % of Admissions |
|
|
|
|
|
|
|
|
|
|
|
|
|
|
|
|
Traditional Medicare Episodic |
|
84.1 |
% |
|
|
|
84.0 |
% |
|
|
|
0.1 |
% |
|
|
|
Replacement Plans Paid Episodically |
|
4.1 |
% |
|
|
|
3.4 |
% |
|
|
|
0.7 |
% |
|
|
|
Replacement Plans Paid Per Visit |
|
11.8 |
% |
|
|
|
12.6 |
% |
|
|
|
(0.8) |
% |
|
|
|
|
|
|
|
|
|
|
|
|
|
|
|
|
|
|
|
|
Non-Medicare: |
|
|
|
|
|
|
|
|
|
|
|
|
|
|
|
|
Admissions (1) |
|
11,354 |
|
11.1 |
% |
|
10,984 |
|
11.1 |
% |
|
370 |
|
3.4 |
% |
|
Revenue (in thousands) |
$ |
23,327 |
|
5.8 |
% |
$ |
15,713 |
|
4.1 |
% |
$ |
7,614 |
|
48.5 |
% |
|
Revenue per admission |
$ |
2,055 |
|
|
|
$ |
1,431 |
|
|
|
$ |
624 |
|
43.6 |
% |
|
Billable visits (1) |
|
264,756 |
|
10.1 |
% |
|
247,171 |
|
9.9 |
% |
|
17,585 |
|
7.1 |
% |
|
Recertifications |
|
2,991 |
|
|
|
|
1,865 |
|
|
|
|
1,126 |
|
60.4 |
% |
|
Payor mix % of Admissions |
|
|
|
|
|
|
|
|
|
|
|
|
|
|
|
|
Medicaid & other governmental |
|
30.6 |
% |
|
|
|
23.3 |
% |
|
|
|
7.3 |
% |
|
|
|
Private payors |
|
69.4 |
% |
|
|
|
76.7 |
% |
|
|
|
(7.3) |
% |
|
|
|
(1) |
Percentages pertain to percentage of total admissions or total billable visits, as applicable. |
|
(2) |
See page 35 for discussion regarding the Company’s change to a 52-53 week reporting calendar in 2015. |
VN segment net service revenues increased primarily due to the WillCare and Black Stone acquisitions which increased net service revenues by $15.3 million. The acquisitions increased operating income before corporate expenses by $3.0 million.
Substantially all of the changes in cost of service revenues and general and administrative expenses were due to the WillCare and Black Stone acquisitions.
40
Excluding the effects of the WillCare and Black Stone acquisitions, operating income before corporate expenses improved $3.9 million primarily due to higher volumes and an effective Medicare rate increase of about 1%.
Gross margin as a percent of revenue decreased 0.7% primarily due to organic volume growth, the Medicare rate increase and lower cost per visit. Total general and administrative expenses declined slightly as a percentage of revenue to 39.2% from 39.7% in the prior year primarily due to organic volume growth and the Medicare rate increase.
As a result, VN segment operating income before corporate expenses improved to $49.9 million from $42.9 million in the prior year, which VN segment operating income as a percentage of revenue increased to 12.4% from 11.3% in the prior year.
Personal Care Segment-Years Ended January 1, 2016 and December 31, 2014
Approximately 83% of the PC segment revenues were generated from Medicaid and other government programs while the balance is generated from insurance programs and private pay patients. (In thousands, except statistical information)
|
|
|
January 1, |
|
December 31, |
|
|
|
|
|
|
||||||
|
|
|
2016 (1) |
|
2014 |
|
Change |
|
|||||||||
|
|
|
Amount |
|
% Rev |
|
Amount |
|
% Rev |
|
Amount |
|
% |
|
|||
|
Net service revenues |
|
$ |
127,712 |
|
100.0 |
% |
$ |
112,497 |
|
100.0 |
% |
$ |
15,215 |
|
13.5 |
% |
|
Cost of service revenues |
|
|
86,642 |
|
67.8 |
% |
|
76,865 |
|
68.3 |
% |
|
9,777 |
|
12.7 |
% |
|
Gross margin |
|
|
41,070 |
|
32.2 |
% |
|
35,632 |
|
31.7 |
% |
|
5,438 |
|
15.3 |
% |
|
General and administrative expenses: |
|
|
|
|
|
|
|
|
|
|
|
|
|
|
|
|
|
Salaries and benefits |
|
|
17,373 |
|
13.6 |
% |
|
14,523 |
|
12.9 |
% |
|
2,850 |
|
19.6 |
% |
|
Other |
|
|
9,527 |
|
7.5 |
% |
|
8,656 |
|
7.7 |
% |
|
871 |
|
10.1 |
% |
|
Total general and administrative expenses |
|
|
26,900 |
|
21.1 |
% |
|
23,179 |
|
20.6 |
% |
|
3,721 |
|
16.1 |
% |
|
Operating income before corporate expenses |
|
$ |
14,170 |
|
11.1 |
% |
$ |
12,453 |
|
11.1 |
% |
$ |
1,717 |
|
13.8 |
% |
|
|
|
|
|
|
|
|
|
|
|
|
|
|
|
|
|
|
|
Average number of locations |
|
|
65 |
|
|
|
|
61 |
|
|
|
|
4 |
|
6.6 |
% |
|
|
|
|
|
|
|
|
|
|
|
|
|
|
|
|
|
|
|
Admissions |
|
|
6,944 |
|
|
|
|
6,458 |
|
|
|
|
486 |
|
7.5 |
% |
|
Patient months of care |
|
|
110,082 |
|
|
|
|
89,880 |
|
|
|
|
20,202 |
|
22.5 |
% |
|
Billable hours |
|
|
5,792,106 |
|
|
|
|
5,304,089 |
|
|
|
|
488,017 |
|
9.2 |
% |
|
Revenue per billable hour |
|
$ |
22.05 |
|
|
|
$ |
21.21 |
|
|
|
$ |
0.84 |
|
4.0 |
% |
|
(1) |
See page 35 for discussion regarding the Company’s change to a 52-53 week reporting calendar in 2015. |
PC segment net revenue increased due to the WillCare and Black Stone acquisitions which increased net service revenues by $15.9 million and operating income before corporate expenses by $2.5 million.
Excluding the effects of the WillCare and Black Stone acquisitions, net service revenues decreased $0.7 million or 0.6%, to $111.8 million in 2015 from $112.5 million in 2014 primarily due to a rate reduction for a specific program in Ohio. Cost of service revenues as a percentage of net service revenues decreased slightly to 67.8% in 2015 from 68.3% in 2014.
Total general and administrative expenses increased as a percent of net service revenues to 21.1% from 20.6% in 2014.
As a result, PC segment operating income before corporate expenses increased to $14.2 million from $12.5 million in 2014, while operating income before corporate expenses as a percentage of revenue was unchanged.
41
Year Ended December 31, 2014 Compared with Year Ended December 31, 2013
(in thousands)
|
|
|
December 31, |
|
December 31, |
|
|
|
|||||||||
|
|
|
2014 |
|
2013 |
|
Change |
|
|||||||||
|
Consolidated |
|
Amount |
|
% Rev |
|
Amount |
|
% Rev |
|
Amount |
|
% |
|
|||
|
Home Health Operations |
|
|
|
|
|
|
|
|
|
|
|
|
|
|
|
|
|
Net service revenues: |
|
|
|
|
|
|
|
|
|
|
|
|
|
|
|
|
|
Visiting Nurse |
|
$ |
380,788 |
|
77.2 |
% |
$ |
263,789 |
|
73.9 |
% |
$ |
116,999 |
|
44.4 |
% |
|
Personal Care |
|
|
112,497 |
|
22.8 |
% |
|
92,927 |
|
26.1 |
% |
|
19,570 |
|
21.1 |
% |
|
|
|
|
493,285 |
|
100.0 |
% |
|
356,716 |
|
100.0 |
% |
|
136,569 |
|
38.3 |
% |
|
Operating income before corporate expenses: |
|
|
|
|
|
|
|
|
|
|
|
|
|
|
|
|
|
Visiting Nurse |
|
|
42,899 |
|
11.3 |
% |
|
28,393 |
|
10.8 |
% |
|
14,506 |
|
51.1 |
% |
|
Personal Care |
|
|
12,453 |
|
11.1 |
% |
|
11,411 |
|
12.3 |
% |
|
1,042 |
|
9.1 |
% |
|
|
|
|
55,352 |
|
11.2 |
% |
|
39,804 |
|
11.2 |
% |
|
15,548 |
|
39.1 |
% |
|
Healthcare Innovations |
|
|
|
|
|
|
|
|
|
|
|
|
|
|
|
|
|
Revenue |
|
|
2,544 |
|
100.0 |
% |
|
196 |
|
100.0 |
% |
|
2,348 |
|
1,198.0 |
% |
|
Operating (loss) income before noncontrolling interest |
|
|
(13) |
|
-0.5 |
% |
|
(482) |
|
-245.9 |
% |
|
469 |
|
NM |
% |
|
|
|
|
|
|
|
|
|
|
|
|
|
|
|
|
|
|
|
Corporate expenses |
|
|
25,558 |
|
5.2 |
% |
|
20,206 |
|
5.7 |
% |
|
5,352 |
|
26.5 |
% |
|
Deal, transition and other costs |
|
|
5,304 |
|
1.1 |
% |
|
4,321 |
|
1.2 |
% |
|
983 |
|
22.7 |
% |
|
Operating income |
|
|
24,477 |
|
4.9 |
% |
|
14,795 |
|
4.1 |
% |
|
9,682 |
|
65.4 |
% |
|
Interest expense, net |
|
|
(1,442) |
|
-0.3 |
% |
|
(169) |
|
0.0 |
% |
|
(1,273) |
|
753.3 |
% |
|
Income tax expense |
|
|
(9,511) |
|
-1.9 |
% |
|
(6,020) |
|
-1.7 |
% |
|
(3,491) |
|
58.0 |
% |
|
Net income from continuing operations |
|
$ |
13,524 |
|
2.7 |
% |
$ |
8,606 |
|
2.4 |
% |
$ |
4,918 |
|
57.1 |
% |
|
|
|
|
|
|
|
|
|
|
|
|
|
|
|
|
|
|
|
Adjusted EBITDA-HHO(1) |
|
$ |
35,841 |
|
7.2 |
% |
$ |
23,637 |
|
6.6 |
% |
$ |
12,204 |
|
51.6 |
% |
|
Adjusted Earnings-HHO(1) |
|
$ |
16,924 |
|
3.4 |
% |
$ |
11,532 |
|
3.2 |
% |
$ |
5,392 |
|
46.8 |
% |
|
(1) |
See page 48 for GAAP reconciliation of Adjusted EBITDA from Home Health operations and Adjusted earnings from Home Health operations. |
Approximately $127.6 million of our $136.6 million year over year increase in Home Health revenue was a result of our acquisition of SunCrest. The balance was generated from organic growth, partially offset by Medicare rate cuts in the VN segment. Refer to VN and PC segment discussions for further operating performance details.
Healthcare Innovations revenue increased $2.3 million year over year due to the receipt in 2014 of $1.6 million for Imperium’s share of an MSSP payment, as a part of the first ever payments from CMS to ACOs under the ACA. Additionally, Imperium earns certain fees from ACOs that are not subject to earning an MSSP payment. Our Healthcare Innovations segment operations broke even in 2014, while losing $0.5 million in 2013.
Corporate expenses increased by $5.4 million to $25.6 million from $20.2 million in the prior year, while declining as a percentage of revenue to 5.2% from 5.7% last year. The 2014 period includes $4.4 million of incremental home office costs associated with the SunCrest acquisition. Additionally, 2014 included a $3.3 million provision for performance incentive programs while the prior year provision was zero.
During 2014, we consolidated several overlapping-territory Florida branches related to the SunCrest acquisition and closed SunCrest’s Nashville based home office completing the last substantial steps of our integration plan. As a result, deal, transition and other include certain one-time lease and related abandonment charges. Deal, transition and other in 2014 also includes a $1.0 million benefit from insurance recoveries, net of costs incurred during 2014, related to legal defense costs incurred by the Company primarily in 2011 and 2010. The underlying cases were dismissed in 2014.
42
Interest expense increased $1.3 million due to borrowings on our line of credit in conjunction with the SunCrest acquisition.
Our effective tax rate in 2014 was 41.0% compared to 41.9% for 2013. The lower income tax rate in 2013 occurred primarily due to the Work Opportunity Tax Credit (WOTC) not being extended for 2012 until 2013 which resulted in our 2013 effective tax rate including the WOTC benefit for 2 years (2013 and 2012).
43
Visiting Nurse Segment-Years Ended December 31, 2014 and 2013
Approximately 96% of the VN segment revenues were generated from the Medicare program while the balance was generated from Medicaid and private insurance programs. (In thousands, except statistical information)
|
|
December 31, |
|
December 31, |
|
|
|
|||||||||
|
|
2014 |
|
2013 |
|
Change |
|
|||||||||
|
|
Amount |
|
% Rev |
|
Amount |
|
% Rev |
|
Amount |
|
% |
|
|||
|
Net service revenues |
$ |
380,788 |
|
100.0 |
% |
$ |
263,789 |
|
100.0 |
% |
$ |
116,999 |
|
44.4 |
% |
|
Cost of service revenues |
|
186,837 |
|
49.1 |
% |
|
127,695 |
|
48.4 |
% |
|
59,142 |
|
46.3 |
% |
|
Gross margin |
|
193,951 |
|
50.9 |
% |
|
136,094 |
|
51.6 |
% |
|
57,857 |
|
42.5 |
% |
|
General and administrative expenses: |
|
|
|
|
|
|
|
|
|
|
|
|
|
|
|
|
Salaries and benefits |
|
110,480 |
|
29.0 |
% |
|
80,337 |
|
30.5 |
% |
|
30,143 |
|
37.5 |
% |
|
Other |
|
40,572 |
|
10.7 |
% |
|
27,364 |
|
10.4 |
% |
|
13,208 |
|
48.3 |
% |
|
Total general and administrative expenses |
|
151,052 |
|
39.7 |
% |
|
107,701 |
|
40.8 |
% |
|
43,351 |
|
40.3 |
% |
|
Operating income before corporate expenses |
$ |
42,899 |
|
11.3 |
% |
$ |
28,393 |
|
10.8 |
% |
$ |
14,506 |
|
51.1 |
% |
|
|
|
|
|
|
|
|
|
|
|
|
|
|
|
|
|
|
Average number of locations |
|
167 |
|
|
|
|
111 |
|
|
|
|
56 |
|
50.5 |
% |
|
|
|
|
|
|
|
|
|
|
|
|
|
|
|
|
|
|
All payors: |
|
|
|
|
|
|
|
|
|
|
|
|
|
|
|
|
Patients Months |
|
319,430 |
|
|
|
|
214,279 |
|
|
|
|
105,151 |
|
49.1 |
% |
|
Admissions |
|
98,634 |
|
|
|
|
64,304 |
|
|
|
|
34,330 |
|
53.4 |
% |
|
Billable Visits |
|
2,507,067 |
|
|
|
|
1,759,864 |
|
|
|
|
747,203 |
|
42.5 |
% |
|
|
|
|
|
|
|
|
|
|
|
|
|
|
|
|
|
|
Medicare: |
|
|
|
|
|
|
|
|
|
|
|
|
|
|
|
|
Admissions (1) |
|
87,650 |
|
88.9 |
% |
|
58,441 |
|
90.9 |
% |
|
29,209 |
|
50.0 |
% |
|
Revenue (in thousands) |
$ |
365,075 |
|
95.9 |
% |
$ |
254,012 |
|
96.3 |
% |
$ |
111,063 |
|
43.7 |
% |
|
Revenue per admission |
$ |
4,165 |
|
|
|
$ |
4,346 |
|
|
|
$ |
(181) |
|
-4.2 |
% |
|
Billable visits (1) |
|
2,259,896 |
|
90.1 |
% |
|
1,668,346 |
|
94.8 |
% |
|
591,550 |
|
35.5 |
% |
|
Recertifications |
|
47,875 |
|
|
|
|
33,597 |
|
|
|
|
14,278 |
|
42.5 |
% |
|
Payor mix % of Admissions |
|
|
|
|
|
|
|
|
|
|
|
|
|
|
|
|
Traditional Medicare Episodic |
|
84.0 |
% |
|
|
|
91.9 |
% |
|
|
|
(7.9) |
% |
|
|
|
Replacement Plans Paid Episodically |
|
3.4 |
% |
|
|
|
2.6 |
% |
|
|
|
0.8 |
% |
|
|
|
Replacement Plans Paid Per Visit |
|
12.6 |
% |
|
|
|
5.5 |
% |
|
|
|
7.1 |
% |
|
|
|
|
|
|
|
|
|
|
|
|
|
|
|
|
|
|
|
|
Non-Medicare: |
|
|
|
|
|
|
|
|
|
|
|
|
|
|
|
|
Admissions (1) |
|
10,984 |
|
11.1 |
% |
|
5,863 |
|
9.1 |
% |
|
5,121 |
|
87.3 |
% |
|
Revenue (in thousands) |
$ |
15,713 |
|
4.1 |
% |
$ |
9,777 |
|
3.7 |
% |
$ |
5,936 |
|
60.7 |
% |
|
Revenue per admission |
$ |
1,431 |
|
|
|
$ |
1,668 |
|
|
|
$ |
(237) |
|
-14.2 |
% |
|
Billable visits (1) |
|
247,171 |
|
9.9 |
% |
|
91,518 |
|
5.2 |
% |
|
155,653 |
|
170.1 |
% |
|
Recertifications |
|
1,865 |
|
|
|
|
1,230 |
|
|
|
|
635 |
|
51.6 |
% |
|
Payor mix % of Admissions |
|
|
|
|
|
|
|
|
|
|
|
|
|
|
|
|
Medicaid & other governmental |
|
23.3 |
% |
|
|
|
24.1 |
% |
|
|
|
(0.8) |
% |
|
|
|
Private payors |
|
76.7 |
% |
|
|
|
75.9 |
% |
|
|
|
0.8 |
% |
|
|
|
(1) |
Percentages pertain to percentage of total admissions or total billable visits, as applicable. |
Visiting Nurse segment net service revenues increased primarily due to the SunCrest acquisition which increased net service revenues by $111.3 million. The SunCrest acquisition increased operating income before corporate expenses by $15.6 million.
44
Substantially all of the changes in cost of service revenues and general and administrative expenses were due to the SunCrest acquisition.
Excluding the effects of the SunCrest acquisition, operating income before corporate expenses improved $1.0 million as volume growth and cost improvements more than offset the impact of Medicare rate cuts which reduced revenue and operating income by $4.2 million. Medicare rate cuts were comprised of a 1.15% 2014 rate cut on episodes ending after December 31, 2013 and a 2.0% Medicare sequestration cut effective for episodes ended after March 2013.
Salaries and wages in 2014 included approximately $0.5 million of costs associated with employee pay increases in effect for the last five months of the year.
Personal Care Segment-Years Ended December 31, 2014 and 2013
Approximately 79% of the PC segment revenues were generated from Medicaid and other government programs while the balance is generated from insurance programs and private pay patients. (In thousands, except statistical information)
|
|
|
December 31, |
|
December 31, |
|
|
|
|||||||||
|
|
|
2014 |
|
|
2013 |
Change |
|
|||||||||
|
|
|
Amount |
|
% Rev |
|
Amount |
|
% Rev |
|
Amount |
|
% |
|
|||
|
Net service revenues |
|
$ |
112,497 |
|
100.0 |
% |
$ |
92,927 |
|
100.0 |
% |
$ |
19,570 |
|
21.1 |
% |
|
Cost of service revenues |
|
|
76,865 |
|
68.3 |
% |
|
62,621 |
|
67.4 |
% |
|
14,244 |
|
22.7 |
% |
|
Gross margin |
|
|
35,632 |
|
31.7 |
% |
|
30,306 |
|
32.6 |
% |
|
5,326 |
|
17.6 |
% |
|
General and administrative expenses: |
|
|
|
|
|
|
|
|
|
|
|
|
|
|
|
|
|
Salaries and benefits |
|
|
14,523 |
|
12.9 |
% |
|
12,349 |
|
13.3 |
% |
|
2,174 |
|
17.6 |
% |
|
Other |
|
|
8,656 |
|
7.7 |
% |
|
6,546 |
|
7.0 |
% |
|
2,110 |
|
32.2 |
% |
|
Total general and administrative expenses |
|
|
23,179 |
|
20.6 |
% |
|
18,895 |
|
20.3 |
% |
|
4,284 |
|
22.7 |
% |
|
Operating income before corporate expenses |
|
$ |
12,453 |
|
11.1 |
% |
$ |
11,411 |
|
12.3 |
% |
$ |
1,042 |
|
9.1 |
% |
|
|
|
|
|
|
|
|
|
|
|
|
|
|
|
|
|
|
|
Average number of locations |
|
|
61 |
|
|
|
|
61 |
|
|
|
|
— |
|
0.0 |
% |
|
|
|
|
|
|
|
|
|
|
|
|
|
|
|
|
|
|
|
Admissions |
|
|
6,458 |
|
|
|
|
4,723 |
|
|
|
|
1,735 |
|
36.7 |
% |
|
Patient months of care |
|
|
89,880 |
|
|
|
|
80,045 |
|
|
|
|
9,835 |
|
12.3 |
% |
|
Billable hours |
|
|
5,304,089 |
|
|
|
|
4,682,590 |
|
|
|
|
621,499 |
|
13.3 |
% |
|
Revenue per billable hour |
|
$ |
21.21 |
|
|
|
$ |
19.85 |
|
|
|
$ |
1.36 |
|
6.9 |
% |
Net service revenues increased $19.6 million, or 21.1%, to $112.5 million in 2014 from $92.9 million in 2013, primarily due to the SunCrest acquisition which increased revenues by $16.2 million, with the remainder due to organic volume growth. Cost of service revenues as a percentage of net service revenues increased slightly to 68.3% in 2014 from 67.4% in 2013, primarily due to changes in business mix partially due to the SunCrest acquisition.
Total general and administrative expenses as a percent of net service revenues increased to 20.6% in 2014 from 20.3% in 2013.
As a result, PC segment operating income before corporate expenses increased to $12.5 million from $11.4 million in 2013, while operating income before corporate expenses as a percentage of revenue decreased 1.2%.
Liquidity and Capital Resources
We believe that a certain amount of debt has an appropriate place in our overall capital structure, when reimbursement
45
visibility permits, and it is not our strategy to eliminate all debt financing. We believe that our cash flow from operations, cash on hand, and borrowing capacity on our bank credit facility, described below, will be sufficient to cover operating needs, future capital expenditure requirements and scheduled debt payments of miscellaneous small borrowing arrangements. In addition, it is likely that we will pursue growth from acquisitions, partnerships and other ventures that would be funded from excess cash from operations, cash on hand, credit available under the bank credit agreement and other financing arrangements that are normally available in the marketplace. Further, our board may pursue a stock repurchase program or may decide to pay special dividends in the future.
Revolving Credit Facility
We have a senior secured revolving credit facility with J.P. Morgan Securities LLC as Administrative Agent, Bank of America, N.A. as Syndication Agent, and certain other lenders (the “Facility”). The Facility consists of a $175 million credit line with a maturity date of November 15, 2020 and an “accordion” feature providing future expansion of the Facility to $250 million. Borrowings (other than letters of credit) under the credit facility generally will bear interest at a rate varying from London Interbank Offered Rate (LIBOR) rate plus 1.75% to LIBOR rate plus 3.00%, depending on leverage. The Facility is secured by substantially all of our assets and the stock of our subsidiaries. Debt issuance costs of $1.2 million are recorded in prepaid and other assets and is being amortized through November 15, 2020.
Borrowings under the Facility are subject to various covenants including a multiple of 3.5 times earnings before interest, taxes, depreciation and amortization (“EBITDA”). EBITDA may include “Acquired EBITDA” from pro-forma acquisitions as defined. Borrowings under the Facility may be used for general corporate purposes, including acquisitions. Application of the Facility’s borrowing formula as of January 1, 2016, would have permitted $43.4 million to be used. We had irrevocable letters of credit totaling $11.3 million outstanding in connection with our self-insurance programs, which resulted in a total of $32.1 million being available for use at January 1, 2016. As of January 1, 2016, we were in compliance with the various financial covenants. Under the most restrictive of its covenants, we were required to maintain minimum net worth of at least $177.5 million at January 1, 2016. At such date, our net worth was approximately $270.3 million.
The effective interest rates on our borrowings were 3.5% and 2.7% for 2015 and 2014, respectively.
We believe the Facility will be sufficient to fund our operating needs and expansion plans for at least the next year. We will continue to evaluate additional capital, including possible debt and equity investments in the Company, to support a more rapid development of the business than would be possible with internal funds.
Cash Flows
Key elements to the Consolidated Statements of Cash Flows were as follows for the fiscal years: (in thousands):
|
Net Change in Cash and Cash Equivalents (in thousands) |
|
2015 |
|
2014 |
|
2013 |
|
|||
|
Provided by (used in): |
|
|
|
|
|
|
|
|
|
|
|
Operating activities |
|
$ |
21,206 |
|
$ |
6,986 |
|
$ |
19,546 |
|
|
Investing activities |
|
|
(86,695) |
|
|
(2,200) |
|
|
(90,967) |
|
|
Financing activities |
|
|
66,125 |
|
|
(10,146) |
|
|
55,209 |
|
|
Discontinued operations |
|
|
— |
|
|
— |
|
|
2,338 |
|
|
Net increase (decrease) in cash and cash equivalents |
|
$ |
636 |
|
$ |
(5,360) |
|
$ |
(13,874) |
|
2015 Compared to 2014
Net cash provided by operating activities resulted primarily from current period net income of $19.5 million, plus certain non-cash items, net of changes in accounts receivable, accounts payable and accrued expenses. Accounts receivable days sales outstanding, which were 58 at January 1, 2016 and 55 at December 31, 2014, increasing due to collection delays, primarily in the PC segment, as a result of changes in patient enrollment and billing requirements enacted by the Medicaid managed care providers in Tennessee.
46
The cash used in investing activities was primarily due to our 2015 acquisitions, capital expenditures of $3.1 million and a $1.0 million cost basis investment.
The cash provided by financing activities resulted from $67.3 million of new borrowings on the revolving credit facility and $1.2 million debt issuance costs incurred with the new five year $175 million credit facility.
2014 Compared to 2013
Net cash provided by operating activities resulted primarily from 2014 period net income of $13.5 million, plus certain non-cash items, which was partially offset by a net cash outflow related to the acquired SunCrest business. Conversion of SunCrest payroll, payment of other liabilities in excess of acquired cash and payment of SunCrest transition and severance related costs reduced cash flow from operating activities by $11.6 million. In addition, SunCrest clinical system conversions, transition of billing and collection activities from the SunCrest home office to our Louisville home office at the end of third quarter of 2014 and some non-SunCrest payer specific conversions to managed care combined to increase accounts receivable by $10.8 million. Conversely, tax benefits related to the SunCrest acquisition increased operating cash flow by $7.8 million. Cash from operating activities for 2014 was also reduced due to payment delays related to the conversion to managed care payers with longer payment cycles in certain same store PC segment markets.
The cash used in investing activities was primarily due to an April 2014 acquisition and capital expenditures.
The cash used in financing activities was primarily related to a $9.6 million payment on the line of credit drawn in connection with the 2013 SunCrest acquisition.
Acquisitions
The Company completed several acquisitions over the past three years and will continue to actively seek to acquire other quality providers of home health services like our current operations.
Factors which may affect future acquisition decisions include, but are not limited to, the quality and potential profitability of the business under consideration, potential regulatory limitations and our profitability and ability to finance the transaction. See Part II, Item 8, Notes 12 and 14 to the accompanying Notes to Consolidated Financial Statements for details regarding these acquisitions.
2016 Acquisitions
On January 5, 2016, we acquired 100% of the equity of Long Term Solutions, Inc. (“LTS”). LTS is a provider of in-home nursing assessments for the long-term care insurance industry. LTS provides assessments in all 50 U.S. states and a number of foreign countries. The purchase price of $37 million was funded through borrowings on the Company’s bank credit facility, seller notes and issuance of the Company’s common stock. LTS’s post acquisition operating results will be reported in our Healthcare Innovations business segment.
On January 5, 2016, we purchased the assets of a Medicare-certified home health agency owned by Bayonne Visiting Nurse Association (‘Bayonne”) located in New Jersey. Bayonne’s post acquisition operating results will be reported in our VN segment.
2015 Acquisitions
On November 5, 2015, we acquired the stock of Black Stone Operations, LLC (“Black Stone”). Black Stone is a provider of in-home personal care and skilled home health services in western Ohio and operates under the name “Home Care by Black Stone”. The purchase price of $40 million was funded through borrowings on the Company’s bank credit facility, seller notes and issuance of the Company’s common stock. Black Stone’s post acquisition operating results are primarily reported in our VN and PC segments.
On August 29, 2015, we acquired 100% of the equity of Bracor, Inc. (dba “WillCare”). WillCare, based in Buffalo, NY, reported $72 million in revenue for the year ended December 31, 2014 with VN and PC branch locations in New York (12) and Connecticut (1). The purchase price was approximately $50.8 million. The transaction was funded by
47
borrowings under the Company’s bank credit facility. On March 1, 2015, we acquired the stock of WillCare’s Ohio operations for $3.0 million.
On July 22, 2015, we acquired 100% of the equity of Ingenios Health Co. (“Ingenios”) for approximately $11.4 million of the Company’s common stock plus $2 million in cash. Ingenios is a leading provider of technology enabled in-home clinical assessments for Medicare Advantage, Managed Medicaid and Commercial Exchange lives in 7 states and Washington, D.C.
On January 29, 2015, we acquired a noncontrolling interest in a development stage analytics and software company, NavHealth, Inc. (NavHealth). The investment is an asset of our Healthcare Innovations segment.
2014 Acquisitions
During 2014, we completed a small acquisition using cash on hand to expand existing VN segment operations.
2013 Acquisitions
During 2013, in conjunction with our SunCrest and IHCN Acquisitions, we acquired 60 VN and 13 PC branch locations in Tennessee, Pennsylvania, Georgia, Indiana, Mississippi, Illinois, Florida and Alabama (in order of revenue significance). We funded these acquisitions with cash on hand of $31.8 million, $0.5 million in stock, issuance of a $1.5 million promissory note and borrowings of $56.0 million on our senior secured revolving credit facility.
In October of 2013, we also acquired a controlling interest in Imperium, a development-stage enterprise that provides strategic health management services to Accountable Care Organizations (“ACOs”). We acquired a 61.5% interest in Imperium for a total of $5.8 million of which $3 million went into Imperium for its general corporate purposes including pursuit of its business plan. The transaction was funded from cash on hand.
Contractual Obligations
The following table provides information about the payment dates of our contractual obligations at January 1, 2016, excluding current liabilities except for the current portion of long-term debt and additional consideration related to acquisitions (in thousands):
|
|
|
2016 |
|
2017 |
|
2018 |
|
2019 |
|
2020 |
|
Thereafter |
|
Total |
|
|||||||
|
Revolving credit facility |
|
$ |
— |
|
$ |
— |
|
$ |
— |
|
$ |
— |
|
$ |
113,790 |
|
$ |
— |
|
$ |
113,790 |
|
|
Notes payable |
|
|
— |
|
|
— |
|
|
5,000 |
|
|
1,500 |
|
|
— |
|
|
— |
|
|
6,500 |
|
|
Operating leases |
|
|
8,439 |
|
|
5,930 |
|
|
3,698 |
|
|
2,153 |
|
|
1,634 |
|
|
2,793 |
|
|
24,647 |
|
|
Total |
|
$ |
8,439 |
|
$ |
5,930 |
|
$ |
8,698 |
|
$ |
3,653 |
|
$ |
115,424 |
|
$ |
2,793 |
|
$ |
144,937 |
|
Letters of Credit
We have outstanding letters of credit totaling $11.3 million at January 1, 2016, which benefit our third-party insurer/administrators for our self-insurance programs. The amount of such insurance program letters of credit is subject to negotiation annually upon renewal and may vary in the future based upon such negotiation, our historical claims experience and expected future claims. It is reasonable to expect that the amount of the letter of credit will increase in the future, however, we are unable to predict to what degree.
We currently have no contingent obligations related to acquisition agreements.
Our commitments and contingencies are also impacted by our general and professional liabilities, pending litigation and investigations, and health care reform discussed elsewhere in this form 10-K. Please refer to Part I, Item 1, “Government Regulation”, Part I, Item 1A, “Risk Factors”, Part I, Item 3 “Legal Proceedings”, Part II, Item 7, “Management’s Discussion and Analysis of Financial Condition and Results of Operations — Overview” and Part II, Item 8, “Notes to Consolidated Financial Statements”.
48
Impact of Inflation
We do not believe that inflation has had a material effect on income during the past several years.
Non-GAAP Financial Measures
The information provided in this Annual Report use certain non-GAAP financial measures as defined under SEC rules. In accordance with SEC rules, the Company has provided, in the supplemental information and the footnotes to the tables, a reconciliation of those measures to the most directly comparable GAAP measures.
Adjusted Earnings from Home Health Operations
Adjusted earnings from home health operations (“Adjusted Earnings-HHO”) is not a measure of financial performance under accounting principles generally accepted in the United States of America (“US GAAP”). It should not be considered in isolation or as a substitute for net income, operating income, cash flows from operating, investing or financing activities, or any other measure calculated in accordance with generally accepted accounting principles. We believe the use of non-GAAP measures on a consolidated and business segment basis assists investors in understanding the ongoing operating performance by presenting comparable financial results between periods. The non-GAAP information provided is used by us and may not be determined in a manner consistent with the methodologies used by other companies.
|
|
|
|
Fiscal Year ended |
|
|||||||
|
(in thousands) |
|
|
January 1, 2016 |
|
December 31, 2014 |
|
December 31, 2013 |
|
|||
|
Net income attributable to Almost Family, Inc. |
|
|
$ |
20,009 |
|
$ |
13,763 |
|
$ |
8,226 |
|
|
Addbacks: |
|
|
|
|
|
|
|
|
|
|
|
|
Deal, transition and other, net of tax |
|
|
|
737 |
|
|
3,156 |
|
|
2,572 |
|
|
Loss on discontinued operations, net of tax |
|
|
|
— |
|
|
— |
|
|
558 |
|
|
Adjusted earnings |
|
|
|
20,746 |
|
|
16,919 |
|
|
11,356 |
|
|
Healthcare Innovations operating (gain) loss after NCI, net of tax |
|
|
|
665 |
|
|
5 |
|
|
176 |
|
|
Adjusted Earnings-HHO |
|
|
$ |
21,411 |
|
$ |
16,924 |
|
$ |
11,532 |
|
|
Per share amounts-basic: |
|
|
|
|
|
|
|
|
|
|
|
|
Average shares outstanding |
|
|
|
9,505 |
|
|
9,333 |
|
|
9,279 |
|
|
Net income attributable to Almost Family, Inc. |
|
|
$ |
2.11 |
|
$ |
1.47 |
|
$ |
0.89 |
|
|
Addbacks: |
|
|
|
|
|
|
|
|
|
|
|
|
Deal, transition and other, net of tax |
|
|
|
0.08 |
|
|
0.34 |
|
|
0.28 |
|
|
Loss on discontinued operations, net of tax |
|
|
|
— |
|
|
— |
|
|
0.05 |
|
|
Adjusted earnings |
|
|
|
2.18 |
|
|
1.81 |
|
|
1.22 |
|
|
Healthcare Innovations operating loss after NCI, net of tax |
|
|
|
0.07 |
|
|
0.00 |
|
|
0.02 |
|
|
Adjusted Earnings-HHO |
|
|
$ |
2.25 |
|
$ |
1.81 |
|
$ |
1.24 |
|
|
Per share amounts-diluted: |
|
|
|
|
|
|
|
|
|
|
|
|
Average shares outstanding |
|
|
|
9,745 |
|
|
9,462 |
|
|
9,374 |
|
|
Net income attributable to Almost Family, Inc. |
|
|
$ |
2.05 |
|
$ |
1.45 |
|
$ |
0.88 |
|
|
Addbacks: |
|
|
|
|
|
|
|
|
|
|
|
|
Deal, transition and other, net of tax |
|
|
|
0.08 |
|
|
0.33 |
|
|
0.27 |
|
|
Loss on discontinued operations, net of tax |
|
|
|
— |
|
|
— |
|
|
0.06 |
|
|
Adjusted earnings |
|
|
|
2.13 |
|
|
1.79 |
|
|
1.21 |
|
|
Healthcare Innovations operating loss after NCI, net of tax |
|
|
|
0.07 |
|
|
0.00 |
|
|
0.02 |
|
|
Adjusted Earnings-HHO |
|
|
$ |
2.20 |
|
$ |
1.79 |
|
$ |
1.23 |
|
|
(1) |
See page 35 for discussion regarding the Company’s change to a 52-53 week reporting calendar in 2015. |
49
Adjusted EBITDA from Home Health Operations
Adjusted earnings before interest, income tax, depreciation, amortization, amortization of stock-based compensation, Healthcare Innovations operating loss and deal, transition and other from Home Health Operations (Adjusted EBITDA-HHO) is not a measure of financial performance under U.S. GAAP. It should not be considered in isolation or as a substitute for net income, operating income, cash flows from operating, investing or financing activities, or any other measure calculated in accordance with generally accepted accounting principles. The items excluded from Adjusted EBITDA-HHO are significant components in understanding and evaluating financial performance and liquidity. Management routinely calculates and communicates Adjusted EBITDA-HHO and believes that it is useful to investors because it is commonly used as an analytical indicator within our industry to evaluate performance, measure leverage capacity and debt service ability, and to estimate current or prospective enterprise value. Adjusted EBITDA is used in certain covenants contained in our Credit Facility.
The following table sets forth a reconciliation of net income to Adjusted EBITDA-HHO for the fiscal year (in thousands):
|
|
|
|
Fiscal Year ended |
|
|||||||
|
(in thousands) |
|
|
January 1, 2016 (1) |
|
December 31, 2014 |
|
December 31, 2013 |
|
|||
|
Net income attributable to Almost Family, Inc. |
|
|
$ |
20,009 |
|
$ |
13,763 |
|
$ |
8,226 |
|
|
Add back: |
|
|
|
|
|
|
|
|
|
|
|
|
Interest expense, net |
|
|
|
2,006 |
|
|
1,442 |
|
|
167 |
|
|
Income tax expense |
|
|
|
10,556 |
|
|
9,511 |
|
|
6,020 |
|
|
Depreciation and amortization |
|
|
|
3,628 |
|
|
4,103 |
|
|
2,862 |
|
|
Stock-based compensation |
|
|
|
2,121 |
|
|
1,814 |
|
|
1,465 |
|
|
Deal, transition and other costs |
|
|
|
4,139 |
|
|
5,304 |
|
|
4,323 |
|
|
Adjusted EBITDA |
|
|
|
42,459 |
|
|
35,937 |
|
|
23,063 |
|
|
Healthcare Innovations operating (gain) loss |
|
|
|
1,479 |
|
|
(96) |
|
|
574 |
|
|
Adjusted EBITDA-HHO |
|
|
$ |
43,938 |
|
$ |
35,841 |
|
$ |
23,637 |
|
|
(1) |
See page 35 for discussion regarding the Company’s changed to a 52-53 week reporting calendar in 2015. |
ITEM 7A. Quantitative and Qualitative Disclosures About Market Risk
Derivative Instruments
We do not use derivative instruments.
Market Risk of Financial Instruments
Our primary market risk exposure with regard to financial instruments is to changes in interest rates.
At January 1, 2016, a hypothetical 100 basis point increase in short-term interest rates would result in a reduction of approximately $1.2 million in our annual pre-tax earnings.
50
ITEM 8. FINANCIAL STATEMENTS AND SUPPLEMENTARY DATA
ALMOST FAMILY, INC. AND SUBSIDIARIES
CONSOLIDATED STATEMENTS OF INCOME
(In thousands, except per share data)
|
|
|
|
Fiscal Year ended |
|
|||||||
|
|
|
|
January 1, 2016 |
|
December 31, 2014 |
|
December 31, 2013 |
|
|||
|
Net service revenues |
|
|
$ |
532,214 |
|
$ |
495,829 |
|
$ |
356,912 |
|
|
Cost of service revenues (excluding depreciation and amortization) |
|
|
|
281,842 |
|
|
263,994 |
|
|
190,548 |
|
|
Gross margin |
|
|
|
250,372 |
|
|
231,835 |
|
|
166,364 |
|
|
General and administrative expenses: |
|
|
|
|
|
|
|
|
|
|
|
|
Salaries and benefits |
|
|
|
147,849 |
|
|
139,793 |
|
|
102,005 |
|
|
Other |
|
|
|
66,281 |
|
|
62,261 |
|
|
45,243 |
|
|
Deal, transition and other non-recurring costs |
|
|
|
4,139 |
|
|
5,304 |
|
|
4,323 |
|
|
Total general and administrative expenses |
|
|
|
218,269 |
|
|
207,358 |
|
|
151,571 |
|
|
Operating income |
|
|
|
32,103 |
|
|
24,477 |
|
|
14,793 |
|
|
Interest expense, net |
|
|
|
(2,006) |
|
|
(1,442) |
|
|
(167) |
|
|
Income before income taxes |
|
|
|
30,097 |
|
|
23,035 |
|
|
14,626 |
|
|
Income tax expense |
|
|
|
(10,556) |
|
|
(9,511) |
|
|
(6,020) |
|
|
Net income from continuing operations |
|
|
|
19,541 |
|
|
13,524 |
|
|
8,606 |
|
|
|
|
|
|
|
|
|
|
|
|
|
|
|
Discontinued operations: |
|
|
|
|
|
|
|
|
|
|
|
|
(Loss) gain from operations, net of tax of $882 |
|
|
|
— |
|
|
— |
|
|
(729) |
|
|
Gain on sale, net of tax of $973 |
|
|
|
— |
|
|
— |
|
|
171 |
|
|
(Loss) gain on discontinued operations |
|
|
|
— |
|
|
— |
|
|
(558) |
|
|
|
|
|
|
|
|
|
|
|
|
|
|
|
Net income |
|
|
|
19,541 |
|
|
13,524 |
|
|
8,048 |
|
|
Net (income) loss attributable to noncontrolling interest |
|
|
|
468 |
|
|
239 |
|
|
178 |
|
|
Net income attributable to Almost Family, Inc. |
|
|
$ |
20,009 |
|
$ |
13,763 |
|
$ |
8,226 |
|
|
|
|
|
|
|
|
|
|
|
|
|
|
|
Per share amounts-basic: |
|
|
|
|
|
|
|
|
|
|
|
|
Average shares outstanding |
|
|
|
9,505 |
|
|
9,333 |
|
|
9,279 |
|
|
Income from continued operations attributable to Almost Family, Inc. |
|
|
$ |
2.11 |
|
$ |
1.47 |
|
$ |
0.95 |
|
|
Discontinued operations |
|
|
|
— |
|
|
— |
|
|
(0.06) |
|
|
Net income attributable to Almost Family, Inc. |
|
|
$ |
2.11 |
|
$ |
1.47 |
|
$ |
0.89 |
|
|
|
|
|
|
|
|
|
|
|
|
|
|
|
Per share amounts-diluted: |
|
|
|
|
|
|
|
|
|
|
|
|
Average shares outstanding |
|
|
|
9,745 |
|
|
9,462 |
|
|
9,374 |
|
|
Income from continued operations attributable to Almost Family, Inc. |
|
|
$ |
2.05 |
|
$ |
1.45 |
|
$ |
0.94 |
|
|
Discontinued operations |
|
|
|
— |
|
|
— |
|
|
(0.06) |
|
|
Net income attributable to Almost Family, Inc. |
|
|
$ |
2.05 |
|
$ |
1.45 |
|
$ |
0.88 |
|
The accompanying notes to consolidated financial statements are an integral part of these financial statements.
51
ALMOST FAMILY, INC. AND SUBSIDIARIES
(In thousands)
|
|
|
|
|
||||
|
|
|
January 1, 2016 |
|
December 31, 2014 |
|
||
|
ASSETS |
|
|
|
|
|
|
|
|
CURRENT ASSETS: |
|
|
|
|
|
|
|
|
Cash and cash equivalents |
|
$ |
7,522 |
|
$ |
6,886 |
|
|
Accounts receivable - net |
|
|
92,270 |
|
|
74,602 |
|
|
Prepaid expenses and other current assets |
|
|
9,672 |
|
|
10,420 |
|
|
TOTAL CURRENT ASSETS |
|
|
109,464 |
|
|
91,908 |
|
|
PROPERTY AND EQUIPMENT - NET |
|
|
10,000 |
|
|
5,575 |
|
|
GOODWILL |
|
|
277,061 |
|
|
192,523 |
|
|
OTHER INTANGIBLE ASSETS |
|
|
64,629 |
|
|
54,402 |
|
|
OTHER ASSETS |
|
|
3,615 |
|
|
850 |
|
|
TOTAL ASSETS |
|
$ |
464,769 |
|
$ |
345,258 |
|
|
|
|
|
|
|
|
|
|
|
LIABILITIES AND STOCKHOLDERS’ EQUITY |
|
|
|
|
|
|
|
|
CURRENT LIABILITIES: |
|
|
|
|
|
|
|
|
Accounts payable |
|
$ |
12,297 |
|
$ |
9,257 |
|
|
Accrued other liabilities |
|
|
42,524 |
|
|
42,326 |
|
|
Current portion - notes payable and capital leases |
|
|
— |
|
|
51 |
|
|
TOTAL CURRENT LIABILITIES |
|
|
54,821 |
|
|
51,634 |
|
|
|
|
|
|
|
|
|
|
|
LONG-TERM LIABILITIES: |
|
|
|
|
|
|
|
|
Revolving credit facility |
|
|
113,790 |
|
|
46,447 |
|
|
Deferred tax liabilities |
|
|
13,094 |
|
|
11,280 |
|
|
Seller notes |
|
|
6,556 |
|
|
1,500 |
|
|
Other liabilities |
|
|
2,608 |
|
|
1,205 |
|
|
TOTAL LONG-TERM LIABILITIES |
|
|
136,048 |
|
|
60,432 |
|
|
TOTAL LIABILITIES |
|
|
190,869 |
|
|
112,066 |
|
|
|
|
|
|
|
|
|
|
|
NONCONTROLLING INTEREST - REDEEMABLE - |
|
|
|
|
|
|
|
|
HEALTHCARE INNOVATIONS |
|
|
3,639 |
|
|
3,639 |
|
|
|
|
|
|
|
|
|
|
|
STOCKHOLDERS’ EQUITY: |
|
|
|
|
|
|
|
|
Preferred stock, par value $0.05; authorized 2,000 shares; none issued or outstanding |
|
|
— |
|
|
— |
|
|
Common stock, par value $0.10; authorized 25,000; 10,125 and 9,574 issued and outstanding |
|
|
1,013 |
|
|
957 |
|
|
Treasury stock, at cost, 103 and 94 shares |
|
|
(2,731) |
|
|
(2,392) |
|
|
Additional paid-in capital |
|
|
127,253 |
|
|
105,862 |
|
|
Noncontrolling interest - nonredeemable |
|
|
(730) |
|
|
(420) |
|
|
Retained earnings |
|
|
145,456 |
|
|
125,546 |
|
|
TOTAL STOCKHOLDERS’ EQUITY |
|
|
270,261 |
|
|
229,553 |
|
|
TOTAL LIABILITIES AND STOCKHOLDERS’ EQUITY |
|
$ |
464,769 |
|
$ |
345,258 |
|
The accompanying notes to consolidated financial statements are an integral part of these financial statements.
52
ALMOST FAMILY, INC. AND SUBSIDIARIES
CONSOLIDATED STATEMENTS OF STOCKHOLDERS’ EQUITY
(In thousands)
|
|
|
|
|
|
|
|
|
|
|
|
|
|
|
|
|
|
|
Non- |
|
|
|
|
|
Non- |
|
||
|
|
|
|
|
|
|
|
|
|
|
|
|
Additional |
|
|
|
|
controlling |
|
Total |
|
|
controlling |
|
||||
|
|
|
Common Stock |
|
Treasury Stock |
|
Paid-in |
|
Retained |
|
Interest - Non- |
|
Stockholders’ |
|
|
Interest - |
|
|||||||||||
|
|
|
Shares |
|
Amount |
|
Shares |
|
Amount |
|
Capital |
|
Earnings |
|
redeemable |
|
Equity |
|
|
Redeemable |
|
|||||||
|
Balance, December 31, 2012 |
|
9,421 |
|
$ |
942 |
|
(91) |
|
$ |
(2,320) |
|
$ |
101,945 |
|
$ |
103,748 |
|
$ |
— |
|
$ |
204,315 |
|
|
$ |
— |
|
|
Stock award maturities, net of shares surrendered or withheld |
|
1 |
|
|
1 |
|
(1) |
|
|
(20) |
|
|
17 |
|
|
— |
|
|
— |
|
|
(2) |
|
|
|
— |
|
|
Share awards and related compensation |
|
52 |
|
|
5 |
|
— |
|
|
— |
|
|
1,460 |
|
|
— |
|
|
— |
|
|
1,465 |
|
|
|
— |
|
|
Tax loss from stock-based compensation |
|
— |
|
|
— |
|
— |
|
|
— |
|
|
(62) |
|
|
— |
|
|
— |
|
|
(62) |
|
|
|
— |
|
|
Stock provided in acquisitions |
|
26 |
|
|
2 |
|
— |
|
|
— |
|
|
498 |
|
|
— |
|
|
— |
|
|
500 |
|
|
|
— |
|
|
Acquired noncontrolling interest |
|
— |
|
|
— |
|
— |
|
|
— |
|
|
0 |
|
|
— |
|
|
(193) |
|
|
(193) |
|
|
|
3,639 |
|
|
Net loss noncontrolling interests - redeemable |
|
— |
|
|
— |
|
— |
|
|
— |
|
|
— |
|
|
— |
|
|
— |
|
|
— |
|
|
|
(185) |
|
|
Noncontrolling interests - redeemable fair value accretion |
|
— |
|
|
— |
|
— |
|
|
— |
|
|
— |
|
|
(185) |
|
|
— |
|
|
(185) |
|
|
|
185 |
|
|
Net loss noncontrolling interests - nonredeemable |
|
— |
|
|
— |
|
— |
|
|
— |
|
|
— |
|
|
— |
|
|
7 |
|
|
7 |
|
|
|
— |
|
|
Net income attributable to Almost Family, Inc. |
|
— |
|
|
— |
|
— |
|
|
— |
|
|
— |
|
|
8,226 |
|
|
— |
|
|
8,226 |
|
|
|
— |
|
|
Balance, December 31, 2013 |
|
9,500 |
|
$ |
950 |
|
(92) |
|
$ |
(2,340) |
|
$ |
103,858 |
|
$ |
111,789 |
|
$ |
(186) |
|
$ |
214,071 |
|
|
$ |
3,639 |
|
|
Stock award maturities, net of shares surrendered or withheld |
|
14 |
|
|
1 |
|
(2) |
|
|
(52) |
|
|
156 |
|
|
— |
|
|
— |
|
|
105 |
|
|
|
— |
|
|
Share awards and related compensation |
|
60 |
|
|
6 |
|
— |
|
|
— |
|
|
1,808 |
|
|
— |
|
|
— |
|
|
1,814 |
|
|
|
— |
|
|
Tax gain from stock-based compensation |
|
— |
|
|
— |
|
— |
|
|
— |
|
|
40 |
|
|
— |
|
|
— |
|
|
40 |
|
|
|
— |
|
|
Net loss noncontrolling interests - redeemable |
|
— |
|
|
— |
|
— |
|
|
— |
|
|
— |
|
|
— |
|
|
— |
|
|
— |
|
|
|
(6) |
|
|
Noncontrolling interests - redeemable fair value accretion |
|
— |
|
|
— |
|
— |
|
|
— |
|
|
— |
|
|
(6) |
|
|
— |
|
|
(6) |
|
|
|
6 |
|
|
Net loss noncontrolling interests - nonredeemable |
|
— |
|
|
— |
|
— |
|
|
— |
|
|
— |
|
|
— |
|
|
(234) |
|
|
(234) |
|
|
|
— |
|
|
Net income attributable to Almost Family, Inc. |
|
— |
|
|
— |
|
— |
|
|
— |
|
|
— |
|
|
13,763 |
|
|
— |
|
|
13,763 |
|
|
|
— |
|
|
Balance, December 31, 2014 |
|
9,574 |
|
$ |
957 |
|
(94) |
|
$ |
(2,392) |
|
$ |
105,862 |
|
$ |
125,546 |
|
$ |
(420) |
|
$ |
229,553 |
|
|
$ |
3,639 |
|
|
Stock award maturities, net of shares surrendered or withheld |
|
10 |
|
|
1 |
|
(9) |
|
|
(339) |
|
|
128 |
|
|
— |
|
|
— |
|
|
(210) |
|
|
|
— |
|
|
Share awards and related compensation |
|
100 |
|
|
11 |
|
— |
|
|
— |
|
|
2,110 |
|
|
— |
|
|
— |
|
|
2,121 |
|
|
|
— |
|
|
Tax gain from stock-based compensation |
|
— |
|
|
— |
|
— |
|
|
— |
|
|
215 |
|
|
— |
|
|
— |
|
|
215 |
|
|
|
— |
|
|
Stock provided in acquisitions |
|
441 |
|
|
44 |
|
— |
|
|
— |
|
|
18,938 |
|
|
— |
|
|
— |
|
|
18,982 |
|
|
|
(99) |
|
|
Net loss noncontrolling interests - redeemable |
|
— |
|
|
— |
|
— |
|
|
— |
|
|
— |
|
|
— |
|
|
— |
|
|
— |
|
|
|
99 |
|
|
Noncontrolling interests - redeemable fair value accretion |
|
— |
|
|
— |
|
— |
|
|
— |
|
|
— |
|
|
(99) |
|
|
— |
|
|
(99) |
|
|
|
— |
|
|
Net loss noncontrolling interests - nonredeemable |
|
— |
|
|
— |
|
— |
|
|
— |
|
|
— |
|
|
— |
|
|
(310) |
|
|
(310) |
|
|
|
— |
|
|
Net income attributable to Almost Family, Inc. |
|
— |
|
|
— |
|
— |
|
|
— |
|
|
— |
|
|
20,009 |
|
|
— |
|
|
20,009 |
|
|
|
— |
|
|
Balance, January 1, 2016 |
|
10,125 |
|
$ |
1,013 |
|
(103) |
|
$ |
(2,731) |
|
$ |
127,253 |
|
$ |
145,456 |
|
$ |
(730) |
|
$ |
270,261 |
|
|
$ |
3,639 |
|
The accompanying notes to consolidated financial statements are an integral part of these financial statements.
53
ALMOST FAMILY, INC. AND SUBSIDIARIES
CONSOLIDATED STATEMENTS OF CASH FLOWS
(in thousands)
|
|
|
Fiscal Year ended |
|
|||||||
|
|
|
January 1, 2016 |
|
December 31, 2014 |
|
December 31, 2013 |
|
|||
|
Cash flows from operating activities: |
|
|
|
|
|
|
|
|
|
|
|
Net income |
|
$ |
19,541 |
|
$ |
13,524 |
|
$ |
8,048 |
|
|
Loss on discontinued operations, net of tax |
|
|
— |
|
|
— |
|
|
(558) |
|
|
Net income from continuing operations |
|
|
19,541 |
|
|
13,524 |
|
|
8,606 |
|
|
Adjustments to reconcile income to net cash provided by operating activities: |
|
|
|
|
|
|
|
|
|
|
|
Depreciation and amortization |
|
|
4,208 |
|
|
4,103 |
|
|
2,862 |
|
|
Provision for uncollectible accounts |
|
|
12,743 |
|
|
9,417 |
|
|
5,378 |
|
|
Stock-based compensation |
|
|
2,121 |
|
|
1,814 |
|
|
1,465 |
|
|
Deferred income taxes |
|
|
3,914 |
|
|
5,500 |
|
|
2,099 |
|
|
|
|
|
42,527 |
|
|
34,358 |
|
|
20,410 |
|
|
Change in certain net assets and liabilities, net of the effects of acquisitions: |
|
|
|
|
|
|
|
|
|
|
|
(Increase) decrease in: |
|
|
|
|
|
|
|
|
|
|
|
Accounts receivable |
|
|
(17,393) |
|
|
(25,613) |
|
|
(4,440) |
|
|
Prepaid expenses and other current assets |
|
|
2,402 |
|
|
(647) |
|
|
4,229 |
|
|
Other assets |
|
|
(585) |
|
|
165 |
|
|
235 |
|
|
Accounts payable and accrued expenses |
|
|
(5,745) |
|
|
(1,277) |
|
|
(888) |
|
|
Net cash provided by operating activities |
|
|
21,206 |
|
|
6,986 |
|
|
19,546 |
|
|
Cash flows from investing activities: |
|
|
|
|
|
|
|
|
|
|
|
Capital expenditures |
|
|
(3,117) |
|
|
(1,231) |
|
|
(2,502) |
|
|
Cost basis investment |
|
|
(1,000) |
|
|
— |
|
|
— |
|
|
Acquisitions, net of cash acquired |
|
|
(82,578) |
|
|
(969) |
|
|
(88,465) |
|
|
Net cash used in investing activities |
|
|
(86,695) |
|
|
(2,200) |
|
|
(90,967) |
|
|
Cash flows from financing activities: |
|
|
|
|
|
|
|
|
|
|
|
Credit facility borrowings |
|
|
233,425 |
|
|
66,632 |
|
|
56,000 |
|
|
Credit facility repayments |
|
|
(166,082) |
|
|
(76,185) |
|
|
— |
|
|
Debt issuance fees |
|
|
(1,161) |
|
|
— |
|
|
— |
|
|
Proceeds from stock option exercises |
|
|
128 |
|
|
156 |
|
|
11 |
|
|
Purchase of common stock in connection with share awards |
|
|
(338) |
|
|
(52) |
|
|
(20) |
|
|
Tax impact of share awards |
|
|
215 |
|
|
40 |
|
|
(62) |
|
|
Payment of special dividend |
|
|
(50) |
|
|
(35) |
|
|
— |
|
|
Principal payments on notes payable and capital leases |
|
|
(12) |
|
|
(702) |
|
|
(720) |
|
|
Net cash provided by (used in) financing activities |
|
|
66,125 |
|
|
(10,146) |
|
|
55,209 |
|
|
Cash flows from discontinued operations: |
|
|
|
|
|
|
|
|
|
|
|
Operating activities |
|
|
— |
|
|
— |
|
|
(742) |
|
|
Investing activities |
|
|
— |
|
|
— |
|
|
3,080 |
|
|
Net cash from discontinued operations |
|
|
— |
|
|
— |
|
|
2,338 |
|
|
Net change in cash and cash equivalents |
|
|
636 |
|
|
(5,360) |
|
|
(13,874) |
|
|
Cash and cash equivalents at beginning of period |
|
|
6,886 |
|
|
12,246 |
|
|
26,120 |
|
|
Cash and cash equivalents at end of period |
|
$ |
7,522 |
|
$ |
6,886 |
|
$ |
12,246 |
|
|
Supplemental disclosures of cash flow information: |
|
|
|
|
|
|
|
|
|
|
|
Cash payment of interest, net of amounts capitalized |
|
$ |
1,890 |
|
$ |
1,264 |
|
$ |
97 |
|
|
Cash payment of taxes |
|
$ |
4,651 |
|
$ |
1,953 |
|
$ |
6,084 |
|
|
Summary of non-cash investing and financing activities: |
|
|
|
|
|
|
|
|
|
|
|
Acquisitions funded by notes payable |
|
$ |
5,000 |
|
$ |
— |
|
$ |
1,500 |
|
|
Acquisitions funded by stock |
|
$ |
18,982 |
|
$ |
— |
|
$ |
500 |
|
The accompanying notes to consolidated financial statements are an integral part of these financial statements.
54
ALMOST FAMILY, INC. AND SUBSIDIARIES
NOTES TO CONSOLIDATED FINANCIAL STATEMENTS
(Unless otherwise indicated all dollar and share amounts are in thousands)
NOTE 1 - SUMMARY OF SIGNIFICANT ACCOUNTING POLICIES
Basis of Consolidation and Description Of Business
The consolidated financial statements include the accounts of Almost Family, Inc. (a Delaware corporation) and its wholly-owned subsidiaries (collectively “Almost Family” or the “Company”). The Company is a leading, regionally focused provider of home health services and has service locations in Florida, Ohio, Tennessee, New York, Kentucky, Connecticut, New Jersey, Massachusetts, Indiana, Illinois, Pennsylvania, Georgia, Missouri, Mississippi and Alabama (in order of revenue significance).
The Company was incorporated in Delaware in 1985. Through a predecessor that merged into the Company in 1991, the Company has been providing health care services, primarily home health care, since 1976. All material intercompany transactions and accounts have been eliminated in consolidation.
On November 5, 2015, the Company completed the acquisition of Black Stone Operations, LLC (“Black Stone”). Black Stone owned and operated personal care and skilled home health services in western Ohio. On August 29, 2015, the Company completed the acquisition of Bracor, Inc. (dba WillCare). WillCare owned and operated Visiting Nurse (“VN”) and Personal Care (“PC”) branch locations in New York (12), and Connecticut (1). On July 22, 2015, the Company acquired Ingenios Health (“Ingenios”). Ingenios is a leading provider of technology enabled in-house clinical assessments for Medicare Advantage, Managed Medicaid and Commercial Exchange lives in seven states and Washington, D.C. On March 2, 2015, the Company acquired the stock of Willcare’s Ohio operations. On January 29, 2015, the Company acquired a noncontrolling interest in a development stage analytics and software company, NavHealth, Inc. (“NavHealth”). The results of operations for WillCare and Black Stone are reported in the Company’s VN and PC segments, while Ingenios results are included in the Company’s Healthcare Innovations segment.
On December 6, 2013, the Company completed the acquisition of Omni Home Health Holdings, Inc. (“SunCrest”). Branded principally under the SunCrest name, its subsidiaries owned and operated 66 Medicare-certified home health agencies and 9 private duty agencies in Florida, Tennessee, Georgia, Pennsylvania, Kentucky, Illinois, Indiana, Mississippi and Alabama. On October 4, 2013, the Company acquired a controlling interest in Imperium Health Management, LLC (“Imperium”), a development-stage enterprise that provides strategic health management services to Accountable Care Organizations (“ACOs”). On July 17, 2013, the Company acquired the assets of the Medicare-certified home health agencies owned by Indiana Home Care Network (“IHCN”). The acquisitions are more fully described in Note 12, “Acquisitions”. The results of operations for SunCrest and IHCN are principally reported within the Company’s VN reportable segment, while Imperium results are included in the Company’s Healthcare Innovations segment. The Company’s consolidated financial statements are prepared in accordance with U.S. generally accepted accounting principles (US GAAP). All intercompany balances and transactions have been eliminated.
Fiscal Year End
Effective with the first quarter of 2015, the Company adopted a 52-53 week fiscal reporting calendar under which it will report its annual results going forward in four equal 13-week quarters. Every fifth year, one quarter will include 14 weeks and that year will include 53 weeks of operating results.
New Accounting Pronouncements
The Financial Accounting Standards Board (“FASB”) issued Accounting Standards Update (“ASU”) No. 2014-09, Revenue from Contracts with Customers (Topic 606), during the second quarter of 2014. Topic 606 affects virtually all aspects of an entity’s revenue recognition, including determining the measurement of revenue and the timing of when it
55
is recognized for the transfer of goods or services to customers. Topic 606 is effective for annual reporting periods beginning after December 15, 2017. The Company is currently evaluating the effect of the adoption of Topic 606 on its financial position and results of operations.
In April 2014, the FASB issued ASU No. 2014-18, Reporting Discontinued Operations and Disclosures of Disposals of Components of an Entity, which includes amendments of Accounting Standards Codification (ASC 205 Presentation of Financial Statements and ASC 360 Property, Plant and Equipment) which limits the requirement for discontinued operations treatment to the disposal of a component of an entity, or a group of components of an entity, that represents a strategic shift that has (or will have) a major effect on an entity’s operations and financial results. Additionally, this new guidance no longer precludes discontinued operations presentation based on continuing involvement or cash flows following the disposal. This guidance became effective prospectively for the Company on January 1, 2015, and will impact the Company’s determination and disclosure of discontinued operations treatment for subsequent qualifying divestitures, if any.
In April 2015, the FASB issued ASU No. 2015-03, Interest – Imputation of Interest (Subtopic 835-30): Simplifying the Presentation of Debt Issuance Costs. In certain cases, Subtopic 835-30 requires that debt issuance costs related to a recognized debt liability be presented in the balance sheet as a direct deduction from the carrying amount of that debt liability. Subtopic 835-30 is effective for annual and interim periods beginning after December 15, 2015. The Company does not expect ASU No. 2015-03 to materially affect its financial position and results of operation.
In April 2015, the FASB issued ASU No. 2015-05, Intangibles – Goodwill and Other – Internal-Use Software (Subtopic 350-40): Customer’s Accounting for Fees Paid in a Cloud Computing Arrangement. Subtopic 350-40 provides guidance that all software licenses included in cloud computing arrangement be accounted for consistent with other licenses of intangible assets. However if a cloud computing arrangement does not include a software license, the arrangement should be accounted for as a service contract, the accounting for which did not change. Subtopic 350-40 is effective for annual and interim periods beginning after December 15, 2015. The Company does not expect ASU No. 2015-05 to materially affect its financial position and results of operations.
In November 2015, the FASB issued ASU no. 2015-17, Balance Sheet Classification of Deferred Taxes. The new guidance requires that all deferred tax assets and liabilities, along with any related valuation allowance, be classified as noncurrent on the balance sheet. As a result, each jurisdiction will now only have one net noncurrent deferred tax asset or liability. The Company elected to early adopt this guidance with retrospective treatment which required reclassification of the consolidated balance sheet. Accordingly, $12.2 million was reclassified in the prior year presentation to confirm with the current year presentation.
Cash and Cash Equivalents
The Company considers all highly liquid debt instruments purchased with an original maturity of three months or less to be cash equivalents.
Uninsured deposits at January 1, 2016 and December 31, 2014 were approximately $4,681 and $4,183 respectively. These amounts have been deposited with national financial institutions.
Property and Equipment
Property and equipment are stated at cost. Depreciation is computed using the straight-line method over the estimated useful lives (generally two to ten years for medical and office equipment and three years for internally developed software). Leasehold improvements are depreciated over the terms of the respective leases (generally three to ten years). Such costs are periodically reviewed for recoverability when impairment indicators are present. Such indicators include, among other factors, operating losses, unused capacity, market value declines and technological obsolescence. Recorded values of asset groups of property, plant and equipment that are not expected to be recovered through undiscounted future net cash flows are written down to current fair value, which generally is determined from estimated discounted future net cash flows (assets held for use) or net realizable value (assets held for sale).
56
Goodwill and Other Intangible Assets
Goodwill and indefinite lived intangible assets acquired are stated at fair value at the date of acquisition. Subsequent to acquisition, the Company conducts annual reviews for impairment, or more frequently if circumstances indicate impairment may have occurred. The Company reviews goodwill for impairment based on its identified reporting units, which are the same as its reportable segments. The Company tests goodwill for impairment by comparing the carrying value to the estimated fair value of its reporting units, determined using a combination of the market approach (guideline company and similar transaction method) and income approach (discounted cash flow analysis). The Company annually tests its indefinite-lived intangible assets, principally trade names, certificates of need, provider numbers and licenses. Specifically trade names are tested using a “relief-from-royalty” valuation method compared to the carrying value. Significant assumptions inherent in the valuation methodologies for goodwill and other intangibles are employed and include, but are not limited to, such estimates as future projected business results, growth rates, legislated changes in payment rates, weighted-average cost of capital for a market participant, royalty and discount rates. The Company has completed its most recent annual impairment tests as of January 1, 2016 and determined that no impairment existed.
Finite-lived intangible assets are amortized on a straight-line basis over their estimated useful lives, such as the cost of non-compete agreements for which their estimated useful life is usually 3 years, beginning after the earn-out period, if any.
The following table summarizes the activity related to the Company’s goodwill and other intangible assets:
|
|
|
|
|
|
Other Intangible Assets |
|
||||||||||
|
|
|
|
|
Certificates |
|
|
|
|
|
|
|
|
||||
|
|
|
|
|
of Need and |
|
Trade |
|
Non-compete |
|
|
|
|
||||
|
|
|
Goodwill |
|
Licenses |
|
Names |
|
Agreements |
|
Total |
|
|||||
|
Balances at December 31, 2013 |
|
$ |
192,489 |
|
$ |
38,321 |
|
$ |
14,781 |
|
$ |
72 |
|
$ |
53,174 |
|
|
Acquisitions |
|
|
— |
|
|
1,290 |
|
|
— |
|
|
— |
|
|
1,290 |
|
|
Changes |
|
|
34 |
|
|
— |
|
|
— |
|
|
— |
|
|
— |
|
|
Amortization |
|
|
— |
|
|
— |
|
|
(10) |
|
|
(52) |
|
|
(62) |
|
|
Balances at December 31, 2014 |
|
$ |
192,523 |
|
$ |
39,611 |
|
$ |
14,771 |
|
$ |
20 |
|
$ |
54,402 |
|
|
Acquisitions |
|
|
84,538 |
|
|
6,433 |
|
|
3,640 |
|
|
180 |
|
|
10,253 |
|
|
Amortization |
|
|
— |
|
|
— |
|
|
(10) |
|
|
(16) |
|
|
(26) |
|
|
Balances at January 1, 2016 |
|
$ |
277,061 |
|
$ |
46,044 |
|
$ |
18,401 |
|
$ |
184 |
|
$ |
64,629 |
|
See Note 12 for further discussion of acquisitions.
The following table summarizes the Company’s goodwill and other intangible assets by segment:
|
|
|
|
|
Other Intangible Assets |
|
|||||||||||
|
|
|
|
|
Certificates |
|
|
|
|
|
|
|
|||||
|
|
|
|
|
of Need and |
|
Trade |
|
Non-compete |
|
|
|
|||||
|
|
|
Goodwill |
|
Licenses |
|
Names |
|
Agreements |
|
Total |
|
|||||
|
Visiting Nurse |
|
$ |
147,368 |
|
$ |
38,831 |
|
$ |
11,391 |
|
$ |
10 |
|
$ |
50,232 |
|
|
Personal Care |
|
|
37,571 |
|
|
780 |
|
|
3,380 |
|
|
10 |
|
|
4,170 |
|
|
Healthcare Innovations |
|
|
7,584 |
|
|
— |
|
|
— |
|
|
— |
|
|
— |
|
|
December 31, 2014 balance |
|
$ |
192,523 |
|
$ |
39,611 |
|
$ |
14,771 |
|
$ |
20 |
|
$ |
54,402 |
|
|
|
|
|
|
|
|
|
|
|
|
|
|
|
|
|
|
|
|
Visiting Nurse |
|
$ |
186,384 |
|
$ |
42,884 |
|
$ |
13,206 |
|
$ |
92 |
|
$ |
56,182 |
|
|
Personal Care |
|
|
72,773 |
|
|
3,160 |
|
|
5,195 |
|
|
92 |
|
|
8,447 |
|
|
Healthcare Innovations |
|
|
17,904 |
|
|
— |
|
|
— |
|
|
— |
|
|
— |
|
|
January 1, 2016 balance |
|
$ |
277,061 |
|
$ |
46,044 |
|
$ |
18,401 |
|
$ |
184 |
|
$ |
64,629 |
|
57
Capitalization Policies
Maintenance, repairs and minor replacements are charged to expense as incurred. Major renovations and replacements are capitalized to appropriate property and equipment accounts. Upon sale or retirement of property, the cost and related accumulated depreciation are eliminated from the accounts and the related gain or loss is recognized in the consolidated statement of income.
The Company capitalizes the cost of internally developed computer software for the Company’s own use. Software development costs of approximately $788, $327 and $647 were capitalized in the years ended January 1, 2016, December 31, 2014 and 2013, respectively.
Insurance Programs
The Company bears significant risk under its large-deductible workers’ compensation insurance program and its self-insured employee health program. Under the workers’ compensation insurance program, the Company bears risk up to $400 per incident, except for a recent acquisition that has not yet been folded into the Company’s program and has a stop-loss of $750, after which stop-loss coverage is maintained. The Company purchases stop-loss insurance for the employee health plan that places a specific limit, generally $300, on its exposure for any individual covered life.
Malpractice and general patient liability claims for incidents which may give rise to litigation have been asserted against the Company by various claimants. The claims are in various stages of processing and some may ultimately be brought to trial. The Company currently carries professional and general liability insurance coverage (on a claims made basis) for this exposure with no deductible. The Company also carries D&O coverage (also on a claims made basis) for potential claims against the Company’s directors and officers, including securities actions, with deductibles ranging from $175 to $500 per claim.
The Company records estimated liabilities for its insurance programs based on information provided by the third-party plan administrators, historical claims experience, the life cycle of claims, expected costs of claims incurred but not paid, and expected costs to settle unpaid claims. The Company monitors its estimated insurance-related liabilities and recoveries, if any, on a monthly basis and records amounts due under insurance policies in other current assets, while recording the estimated carrier liability in other current liabilities. As facts change, it may become necessary to make adjustments that could be material to the Company’s results of operations and financial condition.
Accounting for Income Taxes
The Company recognizes deferred tax assets and liabilities for the expected future tax consequences of events that have been included in the financial statements or tax returns. Under this method, deferred tax assets and liabilities are determined based on the difference between the Company’s book and tax bases of assets and liabilities and tax carry-forwards using enacted tax rates in effect for the year in which the differences are expected to reverse. The effect of changes in tax rates on deferred taxes is recognized in the period in which the enactment dates change. Valuation allowances are established when necessary on a jurisdictional basis to reduce deferred tax assets to the amounts expected to be realized.
Seasonality
The Company’s VN segment operations located in Florida (which generated approximately 24% of that segment’s revenues in the year ended January 1, 2016) normally experience higher admissions during the first quarter and lower admissions during the third quarter than in the other quarters due to seasonal population fluctuations.
Net Service Revenues
The Company is paid for its services primarily by federal and state third-party reimbursement programs, commercial insurance companies, and patients. Revenues are recorded at established rates in the period during which the services are
58
rendered. Appropriate allowances to give recognition to third party payment arrangements are recorded when the services are rendered.
Approximately 71% of the Company’s consolidated net service revenues are derived from the Medicare program. Net service revenues are recorded under the Medicare prospective payment program (PPS) based on a 60-day episode payment rate that is subject to adjustment based on certain variables including, but not limited to: (a) changes in the base episode payments established by the Medicare program; (b) adjustments to the base episode payments for case-mix and geographic wages; (c) a low utilization payment adjustment (LUPA) if the number of visits was fewer than five; (d) a partial payment if a patient is transferred to another provider or if a patient is received from another provider before completing the episode; (e) a payment adjustment based upon the level of therapy services required (thresholds set at 6, 14 and 20 visits); (f) an outlier payment if the patient’s care was unusually costly (capped at 10% of total reimbursement); (g) the number of episodes of care provided to a patient; and (h) a 2% reduction for sequestration.
At the beginning of each Medicare episode the Company calculates an estimate of the amount of expected reimbursement based on the variables outlined above and recognizes Medicare revenue on an episode-by-episode basis during the course of each episode over its expected number of visits. Over the course of each episode, as changes in the variables become known, adjustments are calculated and recorded as needed to reflect changes in expectations for that episode from those established at the start of the 60 day period until its ultimate outcome at the end of the 60 day period is known.
Substantially all remaining revenues are earned on a per visit, hour or unit basis (as opposed to episodic). For all services provided, the Company uses either payor-specific or patient-specific fee schedules for the recording of revenues at the amounts actually expected to be received.
Laws and regulations governing the Medicare and Medicaid programs are extremely complex and subject to interpretation. It is common for issues to arise related to: 1) medical coding, particularly with respect to Medicare, 2) patient eligibility, particularly related to Medicaid, and 3) other reasons unrelated to credit risk, all of which may result in adjustments to recorded revenue amounts. The Company continuously evaluates the potential for revenue adjustments and when appropriate provides allowances for losses based upon the best available information. There is at least a reasonable possibility that recorded estimates could change by material amounts in the near term. Changes in estimates related to prior periods (increased) decreased revenues by approximately ($365), ($320), and $114 in the years ended January 1, 2016, December 31, 2014 and 2013, respectively.
59
Revenue and Receivable Concentrations
The following table sets forth the percent of the Company’s revenues generated from Medicare, state Medicaid programs and other payors for the fiscal year ended:
|
|
|
January 1, 2016 |
|
December 31, 2014 |
|
December 31, 2013 |
|
|
Medicare |
|
71.4 |
% |
72.4 |
% |
71.2 |
% |
|
Medicaid & other government programs: |
|
|
|
|
|
|
|
|
Ohio |
|
9.1 |
% |
8.8 |
% |
11.7 |
% |
|
Connecticut |
|
5.5 |
% |
5.5 |
% |
7.1 |
% |
|
Tennessee |
|
3.2 |
% |
2.5 |
% |
0.2 |
% |
|
Kentucky |
|
1.7 |
% |
1.8 |
% |
2.3 |
% |
|
New York |
|
1.7 |
% |
— |
% |
— |
% |
|
Florida |
|
0.9 |
% |
0.6 |
% |
0.7 |
% |
|
Others |
|
0.4 |
% |
0.4 |
% |
0.5 |
% |
|
Subtotal |
|
22.5 |
% |
19.6 |
% |
22.5 |
% |
|
All other payors |
|
6.1 |
% |
8.0 |
% |
6.3 |
% |
|
Total |
|
100.0 |
% |
100.0 |
% |
100.0 |
% |
Concentrations in the Company’s accounts receivable were as follows:
|
|
|
January 1, 2016 |
|
December 31, 2014 |
|
||||||
|
|
|
Amount |
|
Percent |
|
Amount |
|
Percent |
|
||
|
Medicare |
|
$ |
50,369 |
|
45.9 |
% |
$ |
46,342 |
|
55.5 |
% |
|
Medicaid & other government programs: |
|
|
|
|
|
|
|
|
|
|
|
|
Ohio |
|
|
8,627 |
|
7.9 |
% |
|
9,239 |
|
11.1 |
% |
|
Tennessee |
|
|
8,038 |
|
7.3 |
% |
|
5,617 |
|
6.7 |
% |
|
New York |
|
|
3,207 |
|
2.9 |
% |
|
— |
|
— |
% |
|
Kentucky |
|
|
3,055 |
|
2.8 |
% |
|
3,686 |
|
4.4 |
% |
|
Florida |
|
|
2,702 |
|
2.5 |
% |
|
1,804 |
|
2.2 |
% |
|
Connecticut |
|
|
2,693 |
|
2.5 |
% |
|
3,982 |
|
4.8 |
% |
|
Others |
|
|
1,156 |
|
1.1 |
% |
|
1,031 |
|
1.2 |
% |
|
Subtotal |
|
|
29,478 |
|
26.9 |
% |
|
25,359 |
|
30.4 |
% |
|
All other payors |
|
|
29,937 |
|
27.3 |
% |
|
11,781 |
|
14.1 |
% |
|
Subtotal |
|
|
109,784 |
|
100.0 |
% |
|
83,482 |
|
100.0 |
% |
|
Allowances |
|
|
(17,514) |
|
|
|
|
(8,880) |
|
|
|
|
Total |
|
$ |
92,270 |
|
|
|
$ |
74,602 |
|
|
|
The ability of payors to meet their obligations depends upon their financial stability, future legislation and regulatory actions. The Company does not believe there are any significant credit risks associated with receivables from Federal and state third-party reimbursement programs. The allowance for uncollectible accounts principally consists of management’s estimate of amounts that may prove uncollectible for coverage, eligibility and technical reasons.
60
Payor Mix Concentrations and Related Aging of Accounts Receivable
The approximate breakdown by payor classification as a percent of total accounts receivable, net of contractual allowances, if any, were as follows:
|
|
|
January 1, 2016 |
|
||||||||
|
Payor |
|
0-90 |
|
91-180 |
|
181-365 |
|
>1 yr. |
|
Total |
|
|
Medicare |
|
26 |
% |
10 |
% |
7 |
% |
3 |
% |
46 |
% |
|
Medicaid & Government |
|
12 |
% |
4 |
% |
8 |
% |
3 |
% |
27 |
% |
|
Self Pay |
|
6 |
% |
1 |
% |
1 |
% |
1 |
% |
9 |
% |
|
Insurance |
|
7 |
% |
2 |
% |
5 |
% |
4 |
% |
18 |
% |
|
Total |
|
51 |
% |
17 |
% |
21 |
% |
11 |
% |
100 |
% |
|
|
|
December 31, 2014 |
|
||||||||
|
Payor |
|
0-90 |
|
91-180 |
|
181-365 |
|
>1 yr. |
|
Total |
|
|
Medicare |
|
36 |
% |
13 |
% |
7 |
% |
0 |
% |
56 |
% |
|
Medicaid & Government |
|
19 |
% |
6 |
% |
4 |
% |
1 |
% |
30 |
% |
|
Self Pay |
|
1 |
% |
0 |
% |
2 |
% |
0 |
% |
3 |
% |
|
Insurance |
|
6 |
% |
3 |
% |
2 |
% |
0 |
% |
11 |
% |
|
Total |
|
62 |
% |
22 |
% |
15 |
% |
1 |
% |
100 |
% |
Variations between years are largely attributable to the WillCare and Black Stone acquisitions.
Allowance for Uncollectible Accounts by Payor Mix and Related Aging
The Company records an estimated allowance for uncollectible accounts by applying estimated bad debt percentages to its accounts receivable aging. The percentages to be applied by payor type are based on the Company’s historical collection and loss experience. The Company’s effective allowances for uncollectible accounts as a percent of accounts receivable were as follows:
|
|
|
January 1, 2016 |
|
||||||||
|
Payor |
|
0-90 |
|
91-180 |
|
181-365 |
|
>1 yr. |
|
>2 yrs. |
|
|
Medicare |
|
3 |
% |
6 |
% |
36 |
% |
55 |
% |
100 |
% |
|
Medicaid & Government |
|
4 |
% |
5 |
% |
44 |
% |
46 |
% |
100 |
% |
|
Self Pay |
|
4 |
% |
3 |
% |
34 |
% |
59 |
% |
100 |
% |
|
Insurance |
|
3 |
% |
5 |
% |
36 |
% |
56 |
% |
100 |
% |
|
Total |
|
3 |
% |
5 |
% |
38 |
% |
53 |
% |
100 |
% |
|
|
|
December 31, 2014 |
|
||||||||
|
Payor |
|
0-90 |
|
91-180 |
|
181-365 |
|
>1 yr. |
|
>2 yrs. |
|
|
Medicare |
|
0 |
% |
0 |
% |
8 |
% |
75 |
% |
100 |
% |
|
Medicaid & Government |
|
1 |
% |
8 |
% |
31 |
% |
66 |
% |
100 |
% |
|
Self Pay |
|
1 |
% |
12 |
% |
51 |
% |
74 |
% |
100 |
% |
|
Insurance |
|
5 |
% |
22 |
% |
46 |
% |
83 |
% |
100 |
% |
|
Total |
|
1 |
% |
6 |
% |
23 |
% |
74 |
% |
100 |
% |
Variations between years are largely attributable to the WillCare and Black Stone acquisitions.
The Company’s allowance for uncollectible accounts at January 1, 2016 and December 31, 2014 was approximately $17,514 and $8,880, respectively. The increase is primarily due to the timing of write-offs and to a lesser degree, the 2015 acquisitions.
61
Contingent Service Revenues
The Company, through its Imperium acquisition, provides strategic health management services to ACOs that have been approved to participate in the Medicare Shared Savings Program (“MSSP”). In some cases, the Company also had ownership interests in ACOs beginning January 1, 2015.
ACOs are entities that contract with CMS to serve the Medicare fee-for-service population with the goal of better care for individuals, improved health for populations and lower costs. ACOs share savings with CMS to the extent that the actual costs of serving assigned beneficiaries are below certain trended benchmarks of such beneficiaries and certain quality performance measures are achieved. The MSSP is relatively new and therefore has limited historical experience, which impacts the Company’s ability to accurately accumulate and interpret the data available for calculating an ACOs’ shared savings, if any. MSSP payments are not recognized in revenue until persuasive evidence of an agreement exists, services have been rendered, the payment is fixed and determinable and collectability is insured, which is generally satisfied upon cash receipt. Under such agreements, the Company recognized $1.4 million and $1.6 million in MSSP payments for cash received during 2015 and 2014, respectively, related to savings generated for the program period ended December 31, 2013 and December 31, 2014, respectively, which is included in the Company’s Healthcare Innovations segment revenues. The Company has yet to recognize MSSP payments, if any, for savings generated through January 1, 2016
Weighted Average Shares
Net income per share is presented as a unit of basic shares outstanding and diluted shares outstanding. Diluted shares outstanding is computed based on the weighted average number of common shares and common equivalent shares outstanding. Common equivalent shares result from dilutive stock options and unvested restricted shares. The following table is a reconciliation of basic to diluted shares used in the earnings per share calculation for the fiscal year ended:
|
|
|
January 1, 2016 |
|
December 31, 2014 |
|
December 31, 2013 |
|
|
Basic weighted average outstanding shares |
|
9,505 |
|
9,333 |
|
9,279 |
|
|
Dilutive effect of outstanding compensation awards |
|
240 |
|
129 |
|
95 |
|
|
Diluted weighted average outstanding shares |
|
9,745 |
|
9,462 |
|
9,374 |
|
The assumed conversions to common stock of 20, 94, and 195 of the Company’s outstanding stock options were excluded from the diluted EPS computation in 2015, 2014, and 2013, respectively, because these items, on an individual basis, have an anti-dilutive effect on diluted EPS.
Use of Estimates
The preparation of financial statements in conformity with accounting principles generally accepted in the United States requires management to make estimates and assumptions that affect the reported amounts of assets and liabilities and disclosure of contingent assets and liabilities at the date of the financial statements and reported amounts of revenues and expenses during the reporting period. Actual results could differ from those estimates.
Financial Statement Reclassifications
Certain prior period amounts and data have been reclassified in the financial statements and related notes in order to conform to the 2015 presentation.
Stock-Based Compensation
Stock options and restricted stock are granted under various stock compensation programs to employees and independent directors. The Company accounts for such grants in accordance with ASC Topic 718, Compensation — Stock Compensation and amortizes the fair value of awards, after estimated forfeiture, on a straight-line basis over the requisite service periods.
62
Accounting for Leases
The Company accounts for operating leases using the straight-line rents method, which amortizes contracted total rents due evenly over the lease term.
Advertising Costs
The Company expenses the costs of advertising, as incurred. Advertising expense was $393, $306 and $326 for the years ended January 1, 2016, December 31, 2014 and 2013, respectively.
NOTE 2 - ACCRUED LIABILITIES
Accrued liabilities consist of the following as of fiscal year ended:
|
|
|
|
|
|
|
|
|
|
|
|
January 1, 2016 |
|
December 31, 2014 |
|
||
|
Wages and employee benefits |
|
$ |
20,687 |
|
$ |
20,084 |
|
|
Insurance accruals |
|
|
14,541 |
|
|
14,217 |
|
|
Accrued taxes |
|
|
643 |
|
|
563 |
|
|
Kentucky Medicaid cost report payable |
|
|
616 |
|
|
1,360 |
|
|
Accrued professional fees and other |
|
|
6,037 |
|
|
6,102 |
|
|
|
|
$ |
42,524 |
|
$ |
42,326 |
|
NOTE 3 - PROPERTY AND EQUIPMENT, NET
Property and equipment, net, consist of the following as of the fiscal year ended:
|
|
|
|
|
|
|
|
|
|
|
|
January 1, 2016 |
|
December 31, 2014 |
|
||
|
Leasehold improvements |
|
$ |
2,312 |
|
$ |
1,367 |
|
|
Medical equipment |
|
|
1,561 |
|
|
937 |
|
|
Computer equipment |
|
|
14,633 |
|
|
9,607 |
|
|
Internally developed software |
|
|
1,744 |
|
|
1,071 |
|
|
Office and other equipment |
|
|
6,369 |
|
|
4,502 |
|
|
Vehicles |
|
|
162 |
|
|
449 |
|
|
|
|
|
26,781 |
|
|
17,933 |
|
|
Less accumulated depreciation |
|
|
(16,781) |
|
|
(12,358) |
|
|
|
|
$ |
10,000 |
|
$ |
5,575 |
|
Depreciation and amortization expense related to property, plant and equipment is recorded in general and administrative expenses - other and was $3,321, $3,850 and $2,594 for the years ended January 1, 2016, December 31, 2014 and 2013, respectively.
NOTE 4 - REVOLVING CREDIT FACILITY
The Company has a senior revolving credit facility with J.P. Morgan Securities LLC as Administrative Agent, Bank of America, N.A. as Syndication Agent and certain other lenders (the “Facility”). The Facility consists of a $175 million credit line with a maturity date of November 15, 2020 and an accordion feature which permits expansion up to $250 million. Borrowings, other than letters of credit, under the credit facility generally will bear interest at a rate varying from London Interbank Offered Rate (“LIBOR”) rate plus 1.75% to LIBOR rate plus 3.00%, depending on leverage. The Facility is secured by substantially all of the Company's assets and the stock of its subsidiaries. Debt issuance costs of $1.2 million are recorded in prepaid and other assets and is being amortized through November 15, 2020.
Borrowings under the Facility are subject to various covenants including a multiple of 3.5 times earnings before interest, taxes, depreciation and amortization (“EBITDA”). EBITDA may include “Acquired EBITDA” from pro-forma acquisitions as defined. Borrowings under the Facility may be used for general corporate purposes, including
63
acquisitions. Application of the Facility’s borrowing formula as of January 1, 2016, would have permitted $43.4 million to be used. We had irrevocable letters of credit totaling $11.3 million outstanding in connection with our self-insurance programs, which resulted in a total of $32.1 million being available for use at January 1, 2016. As of January 1, 2016, we were in compliance with the various financial covenants. Under the most restrictive of its covenants, we were required to maintain minimum net worth of at least $177.5 million at January 1, 2016. At such date, our net worth was approximately $270.2 million.
The effective interest rates on our borrowings were 3.5% and 2.7% for 2015 and 2014, respectively.
NOTE 5 - FAIR VALUE MEASUREMENTS
The Company’s financial instruments consist of cash, accounts receivable, payables and debt instruments. Due to their short-term nature, the book values of cash, accounts receivable and payables are considered representative of their respective fair values. The fair value of the Company’s debt instruments approximates their carrying values as substantially all of such debt instruments have rates which fluctuate with changes in market rates.
As of January 1, 2016, the Company does not have any assets or liabilities carried at fair value that are measured on a recurring basis.
NOTE 6 - INCOME TAXES
The provision for income taxes consists of the following as of the fiscal year ended:
|
|
|
|
|
|
|
|
|
|
|
|
|
|
|
January 1, 2016 |
|
December 31, 2014 |
|
December 31, 2013 |
|
|||
|
Federal - current |
|
$ |
5,283 |
|
$ |
2,829 |
|
$ |
3,557 |
|
|
State and local - current |
|
|
1,359 |
|
|
1,182 |
|
|
364 |
|
|
Deferred |
|
|
3,914 |
|
|
5,500 |
|
|
2,099 |
|
|
|
|
$ |
10,556 |
|
$ |
9,511 |
|
$ |
6,020 |
|
A reconciliation of the statutory to the effective rate of the Company is as follows as of the fiscal year ended:
|
|
|
|
|
|
|
|
|
|
|
|
January 1, 2016 |
|
December 31, 2014 |
|
December 31, 2013 |
|
|
Tax provision using statutory rate |
|
35.0 |
% |
35.0 |
% |
35.0 |
% |
|
State and local taxes, net of Federal benefit |
|
4.4 |
% |
4.7 |
% |
5.7 |
% |
|
Valuation allowance |
|
0.2 |
% |
1.0 |
% |
-0.6 |
% |
|
Noncontrolling interest related |
|
0.6 |
% |
0.4 |
% |
0.5 |
% |
|
Legal settlement related |
|
-5.1 |
% |
-0.1 |
% |
1.3 |
% |
|
Tax provision for continuing operations |
|
35.1 |
% |
41.0 |
% |
41.9 |
% |
The Company has provided a valuation allowance against certain net deferred tax assets based upon management’s estimation of realizability of those assets through future taxable income. This valuation allowance was based in large part on the Company’s history of generating operating income or losses in individual tax locales and expectations for the future. The Company’s ability to generate the expected amounts of taxable income from future operations to realize its recorded net deferred tax assets is dependent upon general economic conditions, competitive pressures on revenues and margins and legislation and regulation at all levels of government. There can be no assurances that the Company will meet its expectations of future taxable income. However, management has considered the above factors in reaching its conclusion that it is more likely than not that future taxable income will be sufficient to realize the deferred tax assets (net of valuation allowance) as of January 1, 2016.
During 2015, the valuation allowance increased by $0.02 million due to a change in expected realizability of deferred tax assets.
64
The principal tax carry-forwards and temporary differences were as follows as of the fiscal year ended:
|
|
|
January 1, 2016 |
|
December 31, 2014 |
|
||
|
Deferred tax assets |
|
|
|
|
|
|
|
|
Non-deductible reserves and allowances |
|
$ |
12,855 |
|
$ |
9,853 |
|
|
Insurance accruals |
|
|
3,431 |
|
|
3,174 |
|
|
Net operating loss carryforwards |
|
|
4,550 |
|
|
1,484 |
|
|
|
|
|
20,836 |
|
|
14,511 |
|
|
Valuation allowance |
|
|
(1,762) |
|
|
(1,746) |
|
|
Total deferred tax assets |
|
|
19,074 |
|
|
12,765 |
|
|
|
|
|
|
|
|
|
|
|
Deferred tax liabilities |
|
|
|
|
|
|
|
|
Goodwill & intangibles |
|
|
(30,719) |
|
|
(23,038) |
|
|
Accelerated depreciation |
|
|
(1,449) |
|
|
(1,007) |
|
|
Total deferred tax liabilities |
|
|
(32,168) |
|
|
(24,045) |
|
|
Net deferred tax liabilities |
|
$ |
(13,094) |
|
$ |
(11,280) |
|
|
|
|
|
|
|
|
|
|
|
Total net deferred tax liabilities are reflected in the accompanying balance sheet as long-term liabilities. |
|
||||||
The Company had book goodwill of $113.2 million and $65.4 million at January 1, 2016 and December 31, 2014, respectively, which was not deductible for tax purposes.
State operating loss carryforwards totaling $28.8 million at January 1, 2016 are being carried forward in jurisdictions where the Company is permitted to use tax losses from prior periods to reduce future taxable income. If not used to offset future taxable income, these losses will expire between 2016 and 2035. Due to uncertainty regarding the Company’s ability to use some of the carryforwards, a valuation allowance has been established on $28.4 million of state net operating loss carryforwards. Based on the Company’s historical record of producing taxable income and expectations for the future, the Company has concluded that future operating income will be sufficient to give rise to taxable income sufficient to utilize the remaining state net operating loss carryforwards.
US GAAP prescribes a recognition threshold and measurement attribute for the accounting and financial statement disclosure of tax positions taken or expected to be taken in a tax return. The evaluation of a tax position is a two-step process. The first step requires the Company to determine whether it is more likely than not that a tax position will be sustained upon examination based on the technical merits of the position. The second step requires the Company to recognize in the financial statements each tax position that meets the more likely than not criteria, measured at the amount of benefit that has a greater than 50% likelihood of being realized. The Company’s unrecognized tax benefits would affect the tax rate, if recognized. The Company includes the full amount of unrecognized tax benefits in other noncurrent liabilities in the consolidated balance sheets. The Company anticipates it is reasonably possible an increase or decrease in the amount of unrecognized tax benefits could be made in the next twelve months. However, the Company does not presently anticipate that any increase or decrease in unrecognized tax benefits will be material to the consolidated financial statements. Changes in unrecognized tax benefits were as follows.
|
|
|
|
January 1, 2016 |
|
December 31, 2014 |
|
December 31, 2013 |
|||
|
Beginning of fiscal year |
|
$ |
1,186 |
|
$ |
— |
|
$ |
— |
|
|
Increases related to positions taken on items from prior years |
|
|
— |
|
|
— |
|
|
— |
|
|
Decreases related to positions taken on items from prior years |
|
|
— |
|
|
— |
|
|
— |
|
|
Increases related to positions taken in the current year |
|
|
1,284 |
|
|
1,186 |
|
|
— |
|
|
Lapse of statute of limitations |
|
|
— |
|
|
— |
|
|
— |
|
|
Settlement of uncertain tax positions with tax authorities |
|
|
— |
|
|
— |
|
|
— |
|
|
Balance at end of fiscal year |
|
$ |
2,470 |
|
$ |
1,186 |
|
$ |
— |
|
For federal tax purposes, the Company is currently subject to examinations for tax years after 2011, while for state purposes, tax years after 2006 are subject to examination, depending on the specific state rules and regulations. The
65
Internal Revenue Service completed an examination of the December 31, 2011 tax year and is currently conducting an examination of Omni Home Health Holdings, Inc.’s federal tax returns for the year ended December 31, 2012 and the period ended December 6, 2013.
The Company may from time to time be assessed interest and penalties by major tax jurisdictions, although any such assessments historically have been minimal and immaterial to its financial results. Assessments for interest and/or penalties are classified in the financial statements as general and administrative - other.
NOTE 7 - STOCKHOLDERS’ EQUITY
Employee Stock Incentive Plans
The Company has a 2000 Employee Stock Option Plan which initially provided for options to purchase up to 1,000 shares of the Company’s common stock to key employees, officers and directors. The Board of Directors determines the amount and terms of the options, which cannot exceed ten years. At January 1, 2016, options for 96 shares were outstanding under this plan. There are no shares available for future grant.
The 2007 Stock and Incentive Compensation Plan provided for stock awards up to 500 shares of the Company’s common stock to employees, non-employee directors or independent contractors, with a maximum number of full value restricted share awards up to 200. As of January 1, 2016, options for 237 shares were outstanding under this plan, while 162 restricted shares had been awarded. There are no shares available for future grant.
The 2013 Stock and Incentive Compensation Plan provides for stock awards up to 700 shares of the Company’s common stock to employees, non-employee directors or independent contractors. As of January 1, 2016, options for 134 shares had been granted and were outstanding under this plan, while 192 restricted shares had been awarded. There are 374 shares available for future grant.
Historically, the Company has issued restricted share and/or option awards to employees and non-employee directors. The Board of Directors determines the amount and terms of the options, which cannot exceed ten years. Under both the 2013 and 2007 Stock and Incentive Compensation Plans, restricted share awards cliff vest on the third anniversary, while option share awards vest annually in 25% increments over four years.
Changes in award shares outstanding are summarized as follows:
|
|
|
Restricted shares |
|
Options |
|
|||||||||
|
|
|
|
|
|
|
|
|
|
|
|
|
Aggregate |
|
|
|
|
|
|
|
Wtd. Avg. |
|
|
|
Wtd. Avg. |
|
Intrinsic |
|
|||
|
|
|
Shares |
|
Grant Price |
|
Shares |
|
Ex. Price |
|
Value |
|
|||
|
December 31, 2012 |
|
50 |
|
$ |
31.35 |
|
341 |
|
$ |
25.62 |
|
$ |
4,300 |
|
|
Granted |
|
58 |
|
|
20.29 |
|
68 |
|
|
20.71 |
|
|
1,191 |
|
|
Vested or Exercised |
|
(8) |
|
|
19.57 |
|
(2) |
|
|
12.29 |
|
|
(52) |
|
|
Forfeited |
|
— |
|
|
— |
|
(24) |
|
|
(30.29) |
|
|
(1,644) |
|
|
December 31, 2013 |
|
100 |
|
$ |
24.12 |
|
383 |
|
$ |
24.52 |
|
|
5,251 |
|
|
Granted |
|
61 |
|
|
23.27 |
|
70 |
|
|
24.28 |
|
|
977 |
|
|
Vested or Exercised |
|
(39) |
|
|
27.35 |
|
(13) |
|
|
2.87 |
|
|
(460) |
|
|
Forfeited |
|
— |
|
|
— |
|
(13) |
|
|
(24.57) |
|
|
(816) |
|
|
December 31, 2014 |
|
122 |
|
$ |
22.68 |
|
427 |
|
$ |
24.89 |
|
$ |
5,696 |
|
|
Granted |
|
100 |
|
|
39.97 |
|
56 |
|
|
37.30 |
|
|
52 |
|
|
Vested or Exercised |
|
(45) |
|
|
22.87 |
|
(12) |
|
|
23.97 |
|
|
(171) |
|
|
Forfeited |
|
— |
|
|
— |
|
(4) |
|
|
(26.35) |
|
|
(258) |
|
|
January 1, 2016 |
|
177 |
|
$ |
32.39 |
|
467 |
|
$ |
26.39 |
|
|
5,529 |
|
Aggregate intrinsic value represents the estimated value of the Company’s common stock at the end of the period in excess of the weighted average exercise price multiplied by the number of options outstanding or exercisable.
66
The following table summarizes information about stock options at January 1, 2016:
|
|
|
Options Outstanding |
|
Options Exercisable |
|
||||||||||
|
|
|
|
|
Wtd. Avg. |
|
|
|
|
|
Wtd. Avg. |
|
|
|
||
|
Range of |
|
|
|
Remaining |
|
Wtd. Avg. |
|
|
|
Remaining |
|
Wtd. Avg. |
|
||
|
Exercise |
|
|
|
Contractual |
|
Exercise |
|
|
|
Contractual |
|
Exercise |
|
||
|
Price |
|
Shares |
|
Life |
|
Price |
|
Shares |
|
Life |
|
Price |
|
||
|
$0.00-20.00 |
|
107 |
|
1.61 |
|
$ |
19.41 |
|
100 |
|
1.39 |
|
$ |
19.41 |
|
|
$20.01-30.00 |
|
213 |
|
6.52 |
|
$ |
22.92 |
|
122 |
|
5.47 |
|
$ |
22.81 |
|
|
Over $30.00 |
|
147 |
|
5.81 |
|
$ |
36.46 |
|
90 |
|
3.81 |
|
$ |
35.95 |
|
|
|
|
467 |
|
5.17 |
|
$ |
26.39 |
|
312 |
|
3.69 |
|
$ |
25.49 |
|
The following table details exercisable options and related information for year end:
|
|
|
January 1, 2016 |
|
December 31, 2014 |
|
December 31, 2013 |
|
|||
|
Exercisable at end of year |
|
|
312 |
|
|
273 |
|
|
259 |
|
|
Weighted average price |
|
$ |
25.49 |
|
$ |
25.59 |
|
$ |
24.89 |
|
|
|
|
|
|
|
|
|
|
|
|
|
|
Weighted average fair value of options granted during the year |
|
$ |
12.35 |
|
$ |
11.61 |
|
$ |
9.59 |
|
The following table details unvested option activity for the year ended January 1, 2016:
|
|
|
|
|
Wtd. Avg. |
|
|
|
|
|
Shares |
|
Ex. Price |
|
|
|
December 31, 2014 |
|
154 |
|
$ |
23.65 |
|
|
Vested |
|
55 |
|
|
24.73 |
|
|
Granted |
|
56 |
|
|
37.30 |
|
|
Forfeited |
|
— |
|
|
(24.08) |
|
|
January 1, 2016 |
|
155 |
|
$ |
28.20 |
|
The fair value of each option award is estimated on the date of grant using the Monte Carlo option valuation model with suboptimal exercise behavior. The Monte Carlo model places greater emphasis on market evidence and predicts more realistic results because it considers open form information including volatility, employee exercise behaviors and turnover. Stock options have a contractual term of 10 years. The following assumptions were used in determining the fair value of option awards for 2015, 2014 and 2013:
|
|
|
Equivalent |
|
Equivalent |
|
Implied |
|
Grant date |
|
interest rate |
|
volatility |
|
expected lives |
|
March 2, 2015 |
|
2.07 |
% |
32.50 |
% |
6.86 |
|
March 17, 2014 |
|
2.68 |
% |
40.00 |
% |
8.32 |
|
March 1, 2013 |
|
1.86 |
% |
40.00 |
% |
8.33 |
Expected volatility is based on an analysis that looks at the unbiased standard deviation of the Company’s common stock over the option term as well as implied volatilities of all long-term exchange traded options for the Company. The expected life of the options represents the period of time that the Company expects the options granted to be outstanding. The risk-free rate is based on the U.S. Treasury yield curve in effect at the time of the grant of the option for the expected term of the instrument. A 0% dividend yield was assumed as no dividend payout over the term of the award is expected.
As of January 1, 2016, there was $3,589 of total unrecognized compensation cost, after estimated forfeitures, related to unvested share-based compensation granted under the plans. That cost is expected to be recognized over a weighted-average period of 2.37 years. The total fair value of option shares vested during the years ended January 1, 2016 and December 31, 2014 was $487 and $446, respectively.
67
Employee Stock Purchase Plan
The Company has an Employee Stock Purchase Plan (“2009 ESPP”) which, if implemented, could provide employees of the Company and its subsidiaries with an opportunity to participate in the growth of the Company and to further align the interest of the employees with the interests of the Company through the purchase of shares of the Company’s Common Stock. Under the 2009 ESPP, 300 shares of the Company’s Common Stock have been authorized for issuance. As of January 1, 2016, all 300 shares remain available for issuance.
NOTE 8 - RETIREMENT PLAN
The Company administers a 401(k) defined contribution retirement plan for the benefit of the majority of its employees. Employees may participate in the plan immediately upon employment. The Company matches contributions in an amount equal to one-quarter of the first 5% of each participant’s contribution to the plan after completion of one year of service with the Company. 401(k) assets are held by an independent trustee, are not assets of the Company, and accordingly are not reflected in the Company’s balance sheets. The Company’s retirement plan expense was approximately $1,080, $910 and $550 for the years ended January 1, 2016, December 31, 2014, and 2013, respectively.
NOTE 9 - COMMITMENTS AND CONTINGENCIES
Operating Leases
The Company leases certain real estate, office space, and equipment under non-cancelable operating leases expiring at various dates through 2025 and which contain various renewal and escalation clauses. Rent expense amounted to approximately $11,356, $12,846 and $8,619 for years ended January 1, 2016, December 31, 2014 and 2013, respectively. At January 1, 2016, minimum rental payments under these leases were as follows:
|
2016 |
|
$ |
8,439 |
|
|
2017 |
|
|
5,930 |
|
|
2018 |
|
|
3,698 |
|
|
2019 |
|
|
2,153 |
|
|
2020 |
|
|
1,634 |
|
|
Thereafter |
|
|
2,793 |
|
|
Total |
|
$ |
24,647 |
|
Legal Proceedings
From time to time, the Company is subject to various legal actions arising in the ordinary course of the Company’s business, including claims for damages for personal injuries. In the Company’s opinion, after discussion with legal counsel, the ultimate resolution of any of these pending ordinary course claims and legal proceedings will not have a material effect on the Company’s financial position or results of operations.
The Company is in the process of complying with a civil subpoena from the United States Department of Justice received in January of 2016 related to two locations acquired along with SunCrest in late 2013. SunCrest had previously acquired the locations in its merger with Omni Home Health in 2011. The subpoena seeks the production of various pre-acquisition business records limited to certain Omni operations in Sarasota and Tampa, Florida for the years 2007-2011. The Company is cooperating fully with this investigation. The subject operations generated less than 1% of the Company’s consolidated revenues in 2015.
NOTE 10 - SEGMENT DATA
At January 1, 2016, the Company has two divisions, Home Health care and Healthcare Innovations. The Home Health care division is comprised of two reportable segments, Visiting Nurses Services (VN or Visiting Nurse) and Personal Care Services (PC or Personal Care). Healthcare Innovations is also a reportable segment.
68
Consistent with information given to the chief operating decision maker, the Company does not allocate certain corporate expenses to the reportable segments. These expenses are included in Unallocated below. The Company evaluates the performance of its business segments based on operating income. Intercompany and intersegment transactions have been eliminated. Segment information within the consolidated financial statements have been recast for all periods presented to conform with the new segment reporting structure.
The Company’s VN segment provides skilled medical services in patients’ homes largely to enable recipients to reduce or avoid periods of hospitalization and/or nursing home care. VN Medicare revenues are generated on a per episode basis rather than a fee per visit or day of care. Approximately 94% of the VN segment revenues are generated from the Medicare program, while the balance is generated from Medicaid and private insurance programs.
The Company’s PC segment services are also provided in patients’ homes. These services (generally provided by paraprofessional staff such as home health aides) are generally of a custodial rather than skilled nature. PC revenues are generated on an hourly basis. Approximately 83% of the PC segment revenues are generated from Medicaid and other government programs, while the balance is generated from insurance programs and private pay patients.
The Company’s Healthcare Innovations business segment was created to house and separately report on our developmental activities outside the traditional home health business platform. These activities are intended ultimately, whether directly or indirectly, to benefit the Company’s patients and payers through the enhanced provision of home health services. The activities all share a common goal of improving patient experiences and quality outcomes while lowering costs. They include, but are not limited to, items such as: technology, information, population health management, risk-sharing, care coordination and transitions, clinical advancements, enhanced patient engagement and informed clinical decision.
69
|
|
|
Fiscal Year ended |
|
|||||||
|
|
|
January 1, 2016 |
|
December 31, 2014 |
|
December 31, 2013 |
|
|||
|
Net service revenues |
|
|
|
|
|
|
|
|
|
|
|
Home Health |
|
|
|
|
|
|
|
|
|
|
|
Visiting Nurse |
|
$ |
401,051 |
|
$ |
380,788 |
|
$ |
263,789 |
|
|
Personal Care |
|
|
127,712 |
|
|
112,497 |
|
|
92,927 |
|
|
Healthcare Innovations |
|
|
3,451 |
|
|
2,544 |
|
|
196 |
|
|
|
|
$ |
532,214 |
|
$ |
495,829 |
|
$ |
356,912 |
|
|
|
|
|
|
|
|
|
|
|
|
|
|
Operating income (loss) |
|
|
|
|
|
|
|
|
|
|
|
Home Health |
|
|
|
|
|
|
|
|
|
|
|
Visiting Nurse |
|
$ |
49,872 |
|
$ |
42,899 |
|
$ |
29,533 |
|
|
Personal Care |
|
|
14,170 |
|
|
12,453 |
|
|
11,599 |
|
|
Healthcare Innovations |
|
|
(1,217) |
|
|
(13) |
|
|
(482) |
|
|
Unallocated |
|
|
(30,722) |
|
|
(30,862) |
|
|
(25,857) |
|
|
|
|
$ |
32,103 |
|
$ |
24,477 |
|
$ |
14,793 |
|
|
|
|
|
|
|
|
|
|
|
|
|
|
Identifiable assets |
|
|
|
|
|
|
|
|
|
|
|
Home Health |
|
|
|
|
|
|
|
|
|
|
|
Visiting Nurse |
|
$ |
310,317 |
|
$ |
259,521 |
|
|
|
|
|
Personal Care |
|
|
111,524 |
|
|
67,238 |
|
|
|
|
|
Healthcare Innovations |
|
|
22,024 |
|
|
9,254 |
|
|
|
|
|
Unallocated |
|
|
20,904 |
|
|
9,245 |
|
|
|
|
|
|
|
$ |
464,769 |
|
$ |
345,258 |
|
|
|
|
|
|
|
|
|
|
|
|
|
|
|
|
|
Identifiable liabilities |
|
|
|
|
|
|
|
|
|
|
|
Home Health |
|
|
|
|
|
|
|
|
|
|
|
Visiting Nurse |
|
$ |
31,570 |
|
$ |
28,180 |
|
|
|
|
|
Personal Care |
|
|
24,425 |
|
|
19,498 |
|
|
|
|
|
Healthcare Innovations |
|
|
1,525 |
|
|
191 |
|
|
|
|
|
Unallocated |
|
|
133,349 |
|
|
64,197 |
|
|
|
|
|
|
|
$ |
190,869 |
|
$ |
112,066 |
|
|
|
|
|
|
|
|
|
|
|
|
|
|
|
|
|
Noncontrolling Interest - Redeemable |
|
|
|
|
|
|
|
|
|
|
|
Healthcare Innovations |
|
$ |
3,639 |
|
$ |
3,639 |
|
|
3,639 |
|
|
|
|
|
|
|
|
|
|
|
|
|
|
Capital expenditures |
|
|
|
|
|
|
|
|
|
|
|
Home Health |
|
|
|
|
|
|
|
|
|
|
|
Visiting Nurse |
|
$ |
1,388 |
|
$ |
465 |
|
$ |
764 |
|
|
Personal Care |
|
|
203 |
|
|
149 |
|
|
267 |
|
|
Healthcare Innovations |
|
|
108 |
|
|
— |
|
|
— |
|
|
Unallocated |
|
|
1,418 |
|
|
617 |
|
|
1,471 |
|
|
|
|
$ |
3,117 |
|
$ |
1,231 |
|
$ |
2,502 |
|
|
|
|
|
|
|
|
|
|
|
|
|
|
Depreciation and amortization |
|
|
|
|
|
|
|
|
|
|
|
Home Health |
|
|
|
|
|
|
|
|
|
|
|
Visiting Nurse |
|
$ |
1,210 |
|
$ |
1,250 |
|
$ |
1,004 |
|
|
Personal Care |
|
|
264 |
|
|
271 |
|
|
224 |
|
|
Healthcare Innovations |
|
|
97 |
|
|
— |
|
|
— |
|
|
Unallocated |
|
|
2,637 |
|
|
2,582 |
|
|
1,634 |
|
|
|
|
$ |
4,208 |
|
$ |
4,103 |
|
$ |
2,862 |
|
70
NOTE 11 — DISCONTINUED OPERATIONS
The Company follows the guidance in Accounting Standards Codification (ASC) 205-20, Discontinued Operations and, when appropriate, reclassifies operating units closed, sold or held for sale out of continuing operations and into discontinued operations for all periods presented. In 2013, the Company completed the sale of two Alabama locations, which operated in the VN segment. The operations and gain on sale related to the Alabama operations were reclassified from continuing operations into discontinued operations for all periods presented. The operations and any related gain on sale for these operations were reclassified from continuing operations into discontinued operations for all periods presented. The effective tax rate for discontinued operations is high in 2013 due primarily to the impact of writing off non-deductible goodwill in addition to providing a valuation allowance for Alabama net operating loss carryforwards. Unless otherwise noted, amounts in these Notes to Consolidated Financial Statements exclude amounts attributable to discontinued operations.
NOTE 12 - ACQUISITIONS
The Company completed each of the following acquisitions in pursuit of its strategy for operational expansion in the eastern United States through an expanded service base and enhanced position in certain geographic areas. The purchase price of each acquisition was determined based on the Company’s analysis of comparable acquisitions, expected cash flows and arm’s length negotiation with the sellers. Each acquisition was included in the Company’s consolidated financial statements from the respective acquisition date.
Goodwill recognized from the acquisitions primarily relates to expected contributions of each entity to the overall corporate strategy in addition to synergies and acquired workforce, which are not separable from goodwill. Goodwill and other intangible assets generated in asset purchase transactions are expected to be amortizable for tax purposes on a straight-line basis over 15 years, unless otherwise noted. Goodwill and other intangible assets generated in stock purchase transactions are not amortizable, unless otherwise noted.
On November 5, 2015, the Company acquired the stock of Black Stone Operations, LLC (“Black Stone”). Black Stone is a provider of in-home personal care and skilled home health services in western Ohio and operates under the name “Home Care by Black Stone”. The purchase price of $40 million was funded through borrowings on the Company’s bank credit facility, seller notes and issuance of the Company’s common stock. Black Stone’s post acquisition operating results are reported in the Company’s VN and PC segments and Healthcare Innovations segment.
On August 29, 2015, the Company acquired 100% of the equity of Bracor, Inc. (dba “WillCare”). Willcare, based in Buffalo, NY, owned and operated VN and PC branch locations in New York (12) and Connecticut (1). The purchase price was approximately $50.8 million. The transaction was funded by borrowings under the Company’s bank credit facility. WillCare’s post acquisition operating results are reported in the Company’s VN and PC segments.
On July 22, 2015, the Company acquired 100% of the equity of Ingenios Health Co. (“Ingenios”) for approximately $11.4 million of the Company’s common stock plus $2 million in cash. Ingenios is a leading provider of technology enabled in-home clinical assessments for Medicare Advantage, Managed Medicaid and Commercial Exchange lives in seven states and Washington, D.C. The post acquisition operating results of Ingenios are reported in the Company’s Healthcare Innovations business segment.
On March 1, 2015, the Company acquired the stock of WillCare’s Ohio operations for $3.0 million.
71
The following table summarizes the preliminary fair value estimates as of the respective acquisition dates of the assets acquired and liabilities assumed for the Willcare, Ingenios and Black Stone acquisitions in 2015:
|
|
|
|
Preliminary Purchase |
|
|
|
|
|
|
|
Price Allocation |
|
|
|
|
Accounts receivable |
|
|
$ |
13,039 |
|
|
|
Property, plant & equipment |
|
|
|
4,654 |
|
|
|
Other assets |
|
|
|
1,818 |
|
|
|
Goodwill |
|
|
|
84,538 |
|
|
|
Other intangibles |
|
|
|
10,810 |
|
|
|
Assets acquired |
|
|
|
114,859 |
|
|
|
Liabilities assumed |
|
|
|
(8,299) |
|
|
|
Net assets acquired |
|
|
$ |
106,560 |
|
|
On January 29, 2015, the Company acquired a noncontrolling interest in a development stage analytics and software company, NavHealth, Inc. (NavHealth). The investment is an asset of the Company’s Healthcare Innovations segment.
During 2014, the Company completed a small acquisition using cash on hand to expand existing VN segment operations.
On December 6, 2013, the Company acquired the stock of SunCrest. SunCrest and its subsidiaries owned and operated 66 Medicare-certified home health agencies and 9 private duty agencies in Florida, Tennessee, Georgia, Pennsylvania, Kentucky, Illinois, Indiana, Mississippi and Alabama. The total SunCrest purchase price for the stock was $76.6 million, subject to a working capital adjustment. The purchase price consisted of cash consideration of $75.1 million and a $1.5 million note payable, net of acquired cash balances of $2.2 million.
On October 4, 2013, the Company acquired 61.5% of Imperium for $5.8 million, of which $3.0 million was working capital for Imperium. Imperium is a development-stage enterprise that provides strategic health management services to ACOs. Substantially all of the purchase price was allocated to goodwill. The Company is party to a put and call arrangement with respect to the remaining 38.5% non-controlling interest in Imperium. The redemption value for both the put and the call arrangement is equal to fair value. Due to the existing put and call arrangements, the non-controlling interest is considered to be redeemable and is recorded on the balance sheet as a redeemable non-controlling interest outside of permanent equity. The redeemable non-controlling interest is recognized at the higher of 1) the accumulated earnings associated with the non-controlling interest or 2) the redemption value as of the balance sheet date.
On July 17, 2013, the Company acquired the assets of the Medicare-certified home agencies owned by IHCN. IHCN operated six home health agencies primarily in northern Indiana for a total purchase price of $12.5 million consisting of cash and $0.5 million of Almost Family, Inc. common stock. A preliminary allocation of purchase price resulted primarily in the allocation of $9.9 million to goodwill, $1.8 million to identified intangibles with the remainder primarily due to property plant and equipment and accounts receivable.
72
NOTE 13 - QUARTERLY FINANCIAL DATA— (UNAUDITED)
Summarized quarterly financial data are as follows for the fiscal years ended January 1, 2016 and December 31, 2014:
|
|
|
|
|
|
|
|
|
|
|
|
|
|
|
|
|
|
|
|
|
|
|
|
|
|
|
|
|
|
|
|
|
|
|
|
|
|
|
|
|
|
|
|
|
|
||||||||
|
|
|
Jan. 1, 2016 |
|
Oct. 2, 2015 |
|
Jul. 3, 2015 |
|
Apr. 3, 2015 |
|
Dec. 31, 2014 |
|
Sept. 30, 2014 |
|
Jun. 30, 2014 |
|
Mar. 31, 2014 |
|
||||||||
|
Net service revenues |
|
$ |
145,217 |
|
$ |
131,232 |
|
$ |
127,366 |
|
$ |
128,399 |
|
$ |
124,756 |
|
$ |
125,540 |
|
$ |
125,193 |
|
$ |
120,340 |
|
|
Gross margin |
|
|
67,521 |
|
|
61,757 |
|
|
61,023 |
|
|
60,072 |
|
|
58,366 |
|
|
59,020 |
|
|
59,636 |
|
|
54,813 |
|
|
Net income attributable to |
|
|
|
|
|
|
|
|
|
|
|
|
|
|
|
|
|
|
|
|
|
|
|
|
|
|
Almost Family, Inc. |
|
$ |
2,760 |
|
$ |
7,799 |
|
$ |
5,010 |
|
$ |
4,394 |
|
$ |
4,747 |
|
$ |
3,782 |
|
$ |
3,961 |
|
$ |
1,273 |
|
|
|
|
|
|
|
|
|
|
|
|
|
|
|
|
|
|
|
|
|
|
|
|
|
|
|
|
|
Average shares outstanding |
|
|
|
|
|
|
|
|
|
|
|
|
|
|
|
|
|
|
|
|
|
|
|
|
|
|
Basic |
|
|
9,775 |
|
|
9,604 |
|
|
9,393 |
|
|
9,353 |
|
|
9,352 |
|
|
9,347 |
|
|
9,338 |
|
|
9,293 |
|
|
Diluted |
|
|
10,000 |
|
|
9,822 |
|
|
9,569 |
|
|
9,521 |
|
|
9,474 |
|
|
9,443 |
|
|
9,431 |
|
|
9,426 |
|
|
|
|
|
|
|
|
|
|
|
|
|
|
|
|
|
|
|
|
|
|
|
|
|
|
|
|
|
Net income attributable to Almost Family, Inc. per share |
|
|
|
|
|
|
|
|
|
|
|
|
|
|
|
|
|
|
|
|
|
|
|
|
|
|
Basic |
|
$ |
0.27 |
|
$ |
0.81 |
|
$ |
0.53 |
|
$ |
0.47 |
|
$ |
0.50 |
|
$ |
0.40 |
|
$ |
0.42 |
|
$ |
0.14 |
|
|
Diluted |
|
$ |
0.27 |
|
$ |
0.79 |
|
$ |
0.52 |
|
$ |
0.46 |
|
$ |
0.49 |
|
$ |
0.40 |
|
$ |
0.42 |
|
$ |
0.14 |
|
NOTE 14 - SUBSEQUENT EVENTS
Management has evaluated all events and transactions that occurred after January 1, 2016. The following non-recognized subsequent events were noted:
On January 5, 2016, the Company acquired 100% of the equity of Long Term Solutions, Inc. (“LTS”). LTS is a provider of in-home nursing assessments for the long-term care insurance industry. LTS provides assessments in all 50 U.S. states and a number of foreign countries. The purchase price of $37 million was funded through borrowings on the Company’s bank credit facility, seller notes and issuance of the Company’s common stock. LTS’s post acquisition operating results will be reported in the Company’s Healthcare Innovations business segment.
On January 5, 2016, the Company purchased the assets of a Medicare-certified home health agency owned by Bayonne Visiting Nurse Association (Bayonne) located in New Jersey. Bayonne’s post acquisition operating results will be reported in the Company’s VN segment.
73
Report of Independent Registered Public Accounting Firm
The Board of Directors and Shareholders of Almost Family, Inc. and subsidiaries
We have audited the accompanying consolidated balance sheets of Almost Family, Inc. and subsidiaries as of January 1, 2016 and December 31, 2014, and the related consolidated statements of income, stockholders' equity, and cash flows for each of the three years in the period ended January 1, 2016. Our audits also included the financial statement schedule listed in the Index at Item 15(a) 2. These financial statements and schedule are the responsibility of the Company's management. Our responsibility is to express an opinion on these financial statements and schedule based on our audits.
We conducted our audits in accordance with the standards of the Public Company Accounting Oversight Board (United States). Those standards require that we plan and perform the audit to obtain reasonable assurance about whether the financial statements are free of material misstatement. An audit includes examining, on a test basis, evidence supporting the amounts and disclosures in the financial statements. An audit also includes assessing the accounting principles used and significant estimates made by management, as well as evaluating the overall financial statement presentation. We believe that our audits provide a reasonable basis for our opinion.
In our opinion, the financial statements referred to above present fairly, in all material respects, the consolidated financial position of Almost Family, Inc. and subsidiaries at January 1, 2016 and December 31, 2014, and the consolidated results of their operations and their cash flows for each of the three years in the period ended January 1, 2016, in conformity with U.S. generally accepted accounting principles. Also, in our opinion, the related financial statement schedule, when considered in relation to the basic financial statements taken as a whole, presents fairly in all material respects the information set forth therein.
We also have audited, in accordance with the standards of the Public Company Accounting Oversight Board (United States), Almost Family, Inc. and subsidiaries’ internal control over financial reporting as of January 1, 2016, based on criteria established in Internal Control-Integrated Framework issued by the Committee of Sponsoring Organizations of the Treadway Commission (2013 framework) and our report dated March 2, 2016 expressed an unqualified opinion thereon.
/s/ Ernst & Young LLP
Louisville, Kentucky
March 2, 2016
74
Management’s Report on Internal Control over Financial Reporting
The consolidated financial statements appearing in this Annual Report have been prepared by management that is responsible for their preparation, integrity and fair presentation. The statements have been prepared in accordance with U.S. generally accepted accounting principles, which requires management to make estimates and assumptions that affect the amounts reported in the consolidated financial statements and accompanying notes.
Our management is responsible for establishing and maintaining adequate internal control over financial reporting (as defined in Rules 13a-15(f) and 15d-15(f) of the Securities Exchange Act of 1934, as amended). Our internal control system was designed to provide reasonable assurance regarding the reliability of financial reporting and the preparation of financial statements for external purposes in accordance with generally accepted accounting principles.
All internal control systems, no matter how well designed, have inherent limitations. Therefore, even those systems determined to be effective can provide only reasonable assurance with respect to financial statement preparation and presentation. Further, because of changes in conditions, the effectiveness of an internal control system may vary over time.
Under the supervision and with the participation of our management, including our Chief Executive Officer (CEO) and Principal Financial Officer (PFO), we conducted an evaluation of the effectiveness of our internal control over financial reporting as of January 1, 2016 based on the framework in Internal Control — Integrated Framework issued by the Committee of Sponsoring Organizations of the Treadway Commission (2013 framework) (COSO) with the exception of the operations of WillCare Healthcare, Ingenios Health Holdings, Inc. and Black Stone Operations, LLC, which constituted 25% of total assets as of January 2, 2016 and 6% of net service revenues for the fiscal year then ended. Based on that evaluation, our management concluded our internal control over financial reporting was effective based on the criteria described above as of January 1, 2016.
Ernst & Young LLP, an independent registered public accounting firm, has audited and reported on the effectiveness of our internal control over financial reporting. The report of Ernst & Young LLP is contained in this Annual Report.
|
/s/ William B. Yarmuth |
|
/s/ C. Steven Guenthner |
|
William B. Yarmuth |
|
C. Steven Guenthner |
|
Chairman and Chief Executive Officer |
|
President & Principal Financial Officer |
|
|
|
|
|
Date: March 2, 2016 |
|
March 2, 2016 |
75
Report of Independent Registered Public Accounting Firm
The Board of Directors and Stockholders of Almost Family, Inc. and subsidiaries
We have audited Almost Family, Inc. and subsidiaries’ internal control over financial reporting as of January 1, 2016, based on criteria established in Internal Control—Integrated Framework issued by the Committee of Sponsoring Organizations of the Treadway Commission (2013 framework) (the COSO criteria). Almost Family, Inc. and subsidiaries’ management is responsible for maintaining effective internal control over financial reporting, and for its assessment of the effectiveness of internal control over financial reporting included in the accompanying Management’s Report on Internal Control over Financial Reporting. Our responsibility is to express an opinion on the company’s internal control over financial reporting based on our audit.
We conducted our audit in accordance with the standards of the Public Company Accounting Oversight Board (United States). Those standards require that we plan and perform the audit to obtain reasonable assurance about whether effective internal control over financial reporting was maintained in all material respects. Our audit included obtaining an understanding of internal control over financial reporting, assessing the risk that a material weakness exists, testing and evaluating the design and operating effectiveness of internal control based on the assessed risk, and performing such other procedures as we considered necessary in the circumstances. We believe that our audit provides a reasonable basis for our opinion.
A company’s internal control over financial reporting is a process designed to provide reasonable assurance regarding the reliability of financial reporting and the preparation of financial statements for external purposes in accordance with generally accepted accounting principles. A company’s internal control over financial reporting includes those policies and procedures that (1) pertain to the maintenance of records that, in reasonable detail, accurately and fairly reflect the transactions and dispositions of the assets of the company; (2) provide reasonable assurance that transactions are recorded as necessary to permit preparation of financial statements in accordance with generally accepted accounting principles, and that receipts and expenditures of the company are being made only in accordance with authorizations of management and directors of the company; and (3) provide reasonable assurance regarding prevention or timely detection of unauthorized acquisition, use or disposition of the company’s assets that could have a material effect on the financial statements.
Because of its inherent limitations, internal control over financial reporting may not prevent or detect misstatements. Also, projections of any evaluation of effectiveness to future periods are subject to the risk that controls may become inadequate because of changes in conditions, or that the degree of compliance with the policies or procedures may deteriorate.
As indicated in the accompanying Management’s Report on Internal Control over Financial Reporting, management’s assessment of and conclusion on the effectiveness of internal control over financial reporting did not include the internal controls of Willcare HealthCare, Ingenios Health Holdings, Inc., and Black Stone Operations, LLC, which are included in the 2015 consolidated financial statements of Almost Family, Inc. and subsidiaries and constituted 25% of total assets as of January 1, 2016 and 6% of net service revenues for the year then ended. Our audit of internal control over financial reporting of Almost Family, Inc. and subsidiaries also did not include an evaluation of the internal control over financial reporting of Willcare HealthCare, Ingenios Health Holdings, Inc., and Black Stone Operations, LLC.
In our opinion, Almost Family, Inc. and subsidiaries maintained, in all material respects, effective internal control over financial reporting as of January 1, 2016, based on the COSO criteria.
We also have audited, in accordance with the standards of the Public Company Accounting Oversight Board (United States), the consolidated balance sheets of Almost Family Inc. and subsidiaries as of January 1, 2016 and December 31, 2014 and the related consolidated statements of income, stockholders’ equity and cash flows for each of the three years in the period ended January 1, 2016 of Almost Family, Inc. and subsidiaries and our report dated March 2, 2016 expressed an unqualified opinion thereon.
/s/ Ernst & Young LLP
Louisville, Kentucky
March 2, 2016
76
ITEM 9. CHANGES IN AND DISAGREEMENTS WITH ACCOUNTANTS ON ACCOUNTING AND FINANCIAL DISCLOSURE
None.
ITEM 9A. CONTROLS AND PROCEDURES
Disclosure Controls and Procedures — As of January 1, 2016, the Company’s management, with participation of the Company’s Chief Executive Officer and Principal Financial Officer, evaluated the effectiveness of the Company’s disclosure controls and procedures as defined in Exchange Act Rules 13a-15(e) and 15d-15(e). Based on that evaluation, the Chief Executive Officer and Principal Financial Officer concluded that the Company’s disclosure controls and procedures were effective as of January 1, 2016.
Internal Control — Pursuant to Section 404 of the Sarbanes-Oxley Act of 2002, we have included a report that provides management’s assessment of our internal control over financial reporting as part of this Annual Report on Form 10-K for the year ended January 1, 2016. Management’s report is included in Item 8 of this report under the caption entitled “Management’s Report on Internal Control Over Financial Reporting,” and is incorporated herein by reference. Our independent registered public accounting firm has issued an attestation report on the effectiveness of our internal control over financial reporting. This attestation report is included in item 8 of this report under the caption entitled “Report of Independent Registered Public Accounting Firm” and is incorporated herein by reference.
Changes in Internal Control Over Financial Reporting - There were no changes in the Company’s internal control over financial reporting during the fourth quarter of 2015, that have materially affected, or are reasonably likely to materially affect, Almost Family, Inc.’s internal control over financial reporting.
None.
ITEM 10. DIRECTORS, EXECUTIVE OFFICERS AND CORPORATE GOVERNANCE
The information required by this Item is set forth in the Registrant’s definitive proxy statement to be filed with the Commission no later than 120 days after January 1, 2016, except for the information regarding executive officers of the Company. The information required by this Item contained in such definitive proxy statement is incorporated herein by reference.
The following table sets forth certain information with respect to the Company’s executive officers.
|
Name |
|
Age |
|
Position with the Company |
|
William B. Yarmuth (1) |
|
63 |
|
Chairman of the Board and Chief Executive Officer |
|
C. Steven Guenthner (2) |
|
55 |
|
President and Principal Financial Officer |
|
P. Todd Lyles (3) |
|
54 |
|
Senior Vice President — Administration |
|
Daniel J. Schwartz (4) |
|
49 |
|
Senior Vice President and Chief Operating Officer |
|
Rajneesh Kaushal (5) |
|
55 |
|
Senior Vice President and Chief Clinical Officer |
|
Jeffrey T. Reibel (6) |
|
44 |
|
Vice President and Chief Accounting Officer |
Executive officers of the Company are elected by the Board of Directors and serve at the pleasure of the Board of Directors with the exception of William B. Yarmuth who has an employment agreement with the Company. There are no family relationships between any director or executive officer.
|
(1) |
William B. Yarmuth has been a director and officer of the Company since 1991. Mr. Yarmuth became Chairman and Chief Executive Officer in 1992; he also served as President until the appointment of Steve Guenthner as |
77
President in 2012. Mr. Yarmuth has served as a member of the board of directors of Industrial Services of America, Inc. since June 2014. |
|
(2) |
C. Steven Guenthner has been President and Principal Financial Officer since June of 2012. Prior to which, Mr. Guenthner served as Senior Vice President and Chief Financial Officer of the Company for twenty years. From 1983 through 1992, Mr. Guenthner was employed as a C.P.A. with Arthur Andersen LLP. |
|
(3) |
P. Todd Lyles joined the Company as Senior Vice President Planning and Development in 1997 and now serves as Senior Vice President — Administration. Prior to joining the Company Mr. Lyles was Vice President Development for the Kentucky Division of Columbia/HCA, a position he had held since 1993. Mr. Lyles experience also includes 8 years with Humana Inc. in various financial and hospital management positions. |
|
(4) |
Daniel J. Schwartz joined the Company as Senior Vice President - Operations in April 2013, becoming Senior Vice President and Chief Operating Officer in December 2013. Mr. Schwartz’s healthcare operations management experience includes previously serving as Chief Operating Officer of Addus Healthcare, Inc. from January 2011 until November 2012; owner of New Paradigm Senior Services, LLC from April 2010 until January 2011; and Senior Vice President — North American Operations for Sunrise Senior Living, Inc. from 2006 until April 2010. Mr. Schwartz served Sunrise Senior Living, Inc. a total of 15 years. Mr. Schwartz also served as chief operating officer of New Perspective Senior Living from November 2012 until joining the Company. |
|
(5) |
Rajneesh Kaushal joined the company as Senior Vice President in October 2011 and now also serves as Chief Clinical Officer. Prior to joining the Company, Mr. Kaushal had served as Executive Vice President and Chief Clinical Officer for AccentCare, a national home health care company, which merged with Guardian Home Care Holdings (Guardian) in December of 2010. Mr. Kaushal joined Guardian in 2006 and his experience also includes hospital and post-acute care geriatrics. |
|
(6) |
Jeffrey T. Reibel, a C.P.A., joined the Company in September of 2010 as Vice President of Finance and became Vice President and Chief Accounting Officer in 2012. Prior to joining the Company, Mr. Reibel served as Chief Executive Officer of a private compliance company he founded in 2006. Mr. Reibel’s experience also includes three years as Controller and Principal Accounting Officer for a publicly traded company in addition to twelve years with Ernst & Young LLP, specializing in audits of public companies and various clients in the healthcare industry, including home health. |
Code of Ethics
The Company has adopted a Code of Ethics for Senior Financial Officers that applies to its chief executive officer, principal financial officer, chief accounting officer and any person performing similar functions. The Company has made the Code of Ethics available on its website at www.almostfamily.com and will post any waivers to the Code of Ethics on the website.
ITEMS 11, 12, 13 and 14. EXECUTIVE COMPENSATION; SECURITY OWNERSHIP OF CERTAIN BENEFICIAL OWNERS AND MANAGEMENT AND RELATED STOCKHOLDER MATTERS; CERTAIN RELATIONSHIPS AND RELATED TRANSACTIONS AND DIRECTOR INDEPENDENCE; AND PRINCIPAL ACCOUNTANT FEES AND SERVICES
The Registrant intends to file a definitive proxy statement with the Commission pursuant to Regulation 14A (17 CFR 240.14a) not later than 120 days after the close of the fiscal year covered by this report. In accordance with General Instruction G(3) to Form 10-K, the information called for by Items 11, 12, 13 and 14 is incorporated herein by reference to portions of the definitive proxy statement.
78
Equity Compensation Plans
As of January 1, 2016, shares of common stock authorized for issuance under our equity compensation plans are summarized in the following table. See note 7 to the consolidated financial statements for a description of the plans. The table below is furnished pursuant to item 12.
|
|
|
Shares to be |
|
Weighted |
|
Shares |
|
|
|
|
|
Issued Upon |
|
Average Option |
|
Available for |
|
|
|
Plan Category |
|
Exercise |
|
Exercise Price |
|
Future Grants |
|
|
|
|
|
|
|
|
|
|
|
|
|
Plans approved by shareholders |
|
466,752 |
|
$ |
26.39 |
|
373,615 |
|
|
Plans not approved by shareholders |
|
— |
|
|
— |
|
— |
|
|
Total |
|
466,752 |
|
$ |
26.39 |
|
373,615 |
|
79
ITEM 15.EXHIBITS AND FINANCIAL STATEMENT SCHEDULES
|
|
|
|
Page Number |
|
(a) |
The following items are filed as part of this report: |
|
|
|
|
|
|
|
|
|
1. |
Index to Consolidated Financial Statements |
|
|
|
|
|
|
|
|
|
Consolidated Statements of Income for the years ended January 1, 2016, December 31, 2014 and 2013 |
51 |
|
|
|
|
|
|
|
|
Consolidated Balance Sheets as of January 1, 2016 and December 31, 2014 |
52 |
|
|
|
|
|
|
|
|
53 |
|
|
|
|
|
|
|
|
|
54 |
|
|
|
|
|
|
|
|
|
55 |
|
|
|
|
|
|
|
|
|
74 |
|
|
|
|
|
|
|
|
2. |
Index to Financial Statement Schedule |
|
|
|
|
|
|
|
|
|
86 |
|
|
|
|
|
|
|
|
|
All other Schedules have been omitted because they are either not required, not applicable or, the information has otherwise been supplied in the financial statements or notes thereto. |
|
|
|
|
|
|
|
(b) |
Exhibits required to be filed by Item 601 of Regulation S-K are set forth below: |
|
|
80
|
Number |
|
Description of Exhibit |
|
|
|
|
|
2.1 |
|
Share Purchase Agreement dated as of February 24, 2015 by and among Almost Family, Inc, National Health Industries, Inc., Bracor, Inc. and Bracor’s shareholders, Summer Street Capital II, L.P., Summer Street Capital NYS Fund II, L.P., David W. Brason, Todd W. Brason and David W. Brason Multi-Generational Irrevocable Trust. (Schedules have been omitted pursuant to Item 601(b)(2) of Regulation S-K. Almost Family hereby undertakes to furnish supplementally copies of any of the omitted schedules upon request by the U.S. Securities and Exchange Commission.) (incorporated by reference to the Exhibit 2.1 to Registrant’s Report on Form 10-K for the year ended December 31, 2014). |
|
|
|
|
|
2.2 |
|
Stock Purchase Agreement dated as of February 24, 2015 by and among Almost Family, Inc, National Health Industries, Inc., and Bracor, Inc. (Schedules have been omitted pursuant to Item 601(b)(2) of Regulation S-K. Almost Family hereby undertakes to furnish supplementally copies of any of the omitted schedules upon request by the U.S. Securities and Exchange Commission.) (incorporated by reference to the Exhibit 2.1 to Registrant’s Report on Form 10-K for the year ended December 31, 2014). |
|
|
|
|
|
2.3 |
|
Closing Letter Agreement dated August 28, 2015, as amendment to Share Purchase Agreement dated as of February 24, 2015 by and among Almost Family, Inc., National Health Industries, Inc., Bracor, Inc. and Bracor’s shareholders, Summer Street Capital II, L.P., Summer Street Capital NYS Fund II, L.P., David W. Brason, Todd W. Brason and David W. Brason Multi-Generational Irrevocable Trust (Schedules have been omitted pursuant to Item 601(b)(2) of Regulation S-K. Almost Family hereby undertakes to furnish supplementally copies of any of the omitted schedules upon request by the U.S. Securities and Exchange Commission.) (incorporated by reference to Exhibit 2.2 to the Company’s Current Report on Form 8-K filed on September 2, 2015). |
|
|
|
|
|
2.4* |
|
Agreement and Plan of Merger dated as of November 3, 2015 by and among Almost Family, Inc., National Health Industries, Inc., AFAM Acquisition, LLC, Black Stone Operations, LLC, Black Stone Companies of Ohio, Inc., ERH Development, LLC, Warren County Community Services, LLC, LEC Community Services, Inc., Primrose Retirement Communities, LLC, Kimberly Payne and David Brixey. (Schedules have been omitted pursuant to Item 601(b)(2) of Regulation S-K. Almost Family hereby undertakes to furnish supplementally copies of any of the omitted schedules upon request by the U.S. Securities and Exchange Commission.) |
|
|
|
|
|
2.5* |
|
Stock Purchase Agreement dated as of January 2, 2016 by and among National Health Industries, Inc., Almost Family, Inc., Long Term Solutions, Inc., and Anne Harrington, Noreen Guanci, Noreen Guanci 2009 Irrevocable Trust and Richard Guanci 2009 Irrevocable Trust. (Schedules have been omitted pursuant to Item 601(b)(2) of Regulation S-K. Almost Family hereby undertakes to furnish supplementally copies of any of the omitted schedules upon request by the U.S. Securities and Exchange Commission.) |
|
|
|
|
|
3.1 |
|
Certificate of Incorporation, as amended, of the Registrant (incorporated by reference to Exhibit No. 3.1 of the Registrant’s Annual Report on Form 10-K for the year ended March 31, 1997 and Exhibit 3.1 of the Registrant’s Quarterly Report Form 10-Q for the quarter ended September 30, 2008) |
|
|
|
|
|
3.2 |
|
Amended and Restated Bylaws of the Registrant (incorporated by reference to Exhibit 3.1 of the Registrant’s Current Report on Form 8-K as filed on June 8, 2012) |
|
|
|
|
81
|
4.1 |
|
Form of Senior Indenture – (incorporated by reference to Exhibit 4.1 to the Company’s Registration Statement on form S-3 filed on May 29, 2015, SEC File No. 333-204584.) |
|
|
|
|
|
4.2 |
|
Form of Subordinated Indenture – (incorporated by reference to Exhibit 4.2 to the Company’s Registration Statement on form S-3 filed on May 29, 2015, SEC File No. 333-204584.) |
|
|
|
|
|
4.3 |
|
Other Debt Instruments — copies of other debt instruments for which the total debt is less than 10% of assets will be furnished to the Commission upon request. |
|
|
|
|
|
10.1+ |
|
Employment Agreement, dated January 1, 1996, between the Company and William B. Yarmuth (incorporated by reference to Exhibit 10.24 to the Registrant’s report on Form 10-K for the year ended March 31, 1996). |
|
|
|
|
|
10.2+ |
|
2007 Stock and Incentive Compensation Plan (incorporated by reference to Appendix A of the Definitive Proxy Statement on Schedule 14A as filed on June 25, 2007). |
|
|
|
|
|
10.3+ |
|
Amended and Restated 2000 Stock Option Plan (incorporated by reference to Exhibit 4.1 to the Registrant’s Registration Statement on Form S-8 Reg. No. 333-88744). |
|
|
|
|
|
10.4+ |
|
Amended and Restated Non-Employee Directors Deferred Compensation Plan (incorporated by reference to the Exhibit 10.13 to Registrant’s Report on Form 10-K for the year ended December 31, 2009). |
|
|
|
|
|
10.5+ |
|
Forms of Stock Option Agreements and Restricted Stock Award Agreement pursuant to 2007 Stock and Incentive Plan (incorporated by reference to Exhibit 10.15 to the Registrant’s report on Form 10-K for the year ended December 31, 2008). |
|
|
|
|
|
10.6+ |
|
Amendment dated January 1, 2009 to Employment Agreement effective January 1, 1996, between the Registrant and William B. Yarmuth (incorporated by reference to Exhibit 10.20 to the Registrant’s report on Form 10-K for the year ended December 31, 2008). |
|
|
|
|
|
10.7+ |
|
Amendment to Amended and Restated 2000 Stock Option Plan dated January 1, 2009 (incorporated by reference to Exhibit 10.22 to the Registrant’s report on Form 10-K for the year ended December 31, 2008). |
|
|
|
|
|
10.8+ |
|
Almost Family, Inc. 2009 Employee Stock Purchase Plan (incorporated by reference to Appendix A of the Definitive Proxy Statement on Schedule 14A as filed on July 1, 2009). |
|
|
|
|
|
10.9 |
|
Credit Agreement, dated as of December 2, 2010 among Almost Family, Inc., the lenders party thereto, JPMorgan Chase Bank, N.A. as Administrative Agent and Bank of America, N.A., as Syndication Agent. (Incorporated by reference to Exhibit 10.1 of the Registrant’s Current Report on Form 8-K dated December 2, 2010). |
|
|
|
|
|
10.10+ |
|
2013 Stock and Incentive Plan (incorporated by reference to Appendix A of the Definitive Proxy Statement on Schedule 14A as filed on April 4, 2013). |
|
|
|
|
|
10.11+ |
|
Forms of Stock Option Agreement and Restricted Stock Award Agreement pursuant to 2013 Stock and Incentive Compensation Plan (incorporated by reference to Exhibit 10.1 of the Registrant’s Quarterly Report on Form 10-Q for the quarterly period ended March 31, 2013) |
82
|
|
|
|
|
10.12+ |
|
Offer of Employment letter dated March 12, 2013, between the Registrant and Daniel Schwartz (incorporated by reference to Exhibit 10.2 of the Registrant’s Quarterly Report on Form 10-Q for the quarterly period ended June 30, 2013). |
|
|
|
|
|
10.13 |
|
Third Amendment to Credit Agreement, dated as of February 12, 2015 among Almost Family, Inc., the lenders party thereto, JPMorgan Chase Bank, N.A. as Administrative Agent and Bank of America, N.A., as Syndication Agent. (incorporated by reference to Exhibit 10.1 of the Registrant’s Current Report on Form 8-K as filed February 18, 2015). |
|
|
|
|
|
10.14 |
|
Consolidated Amended and Restated Guaranty and Ratification Agreement dated as of February 12, 2015 (incorporated by reference to Exhibit 10.2 of the Registrant’s Current Report on Form 8-K as filed February 18, 2015). |
|
10.15 |
|
Consolidated Amended and Restated Pledge of Equity Interests dated as of February 12, 2015 (incorporated by reference to Exhibit 10.3 of the Registrant’s Current Report on Form 8-K as filed February 18, 2015). |
|
10.16 |
|
Consolidated Amended and Restated Security Agreement dated as of February 12, 2015(incorporated by reference to Exhibit 10.4 of the Registrant’s Current Report on Form 8-K as filed February 18, 2015). |
|
10.17 |
|
Second Amendment to Credit Agreement dated as of December 6, 2013 by and among Almost Family, Inc. and JPMorgan Chase Bank, N.A., for itself and as Administrative Agent under the Credit Agreement dated as of December 2, 2010 (incorporated by reference to the Exhibit 10.14 to Registrant’s Report on Form 10-K for the year ended December 31, 2014). |
|
|
|
|
|
10.18 |
|
Letter Agreement dated as of December 10, 2012 by and among Almost Family, Inc. and JPMorgan Chase Bank, N.A., for itself and as Administrative Agent under the Credit Agreement dated as of December 2, 2010 (incorporated by reference to the Exhibit 10.15 to Registrant’s Report on Form 10-K for the year ended December 31, 2014). |
|
|
|
|
|
10.19* |
|
Fourth Amendment to Credit Agreement dated as of November 4, 2015 by and among Almost Family, Inc. and JPMorgan Chase Bank, N.A., for itself and as Administrative Agent under the Credit Agreement dated as of December 2, 2010. |
|
|
|
|
|
21* |
|
List of Subsidiaries of Almost Family, Inc. |
|
|
|
|
|
23.1* |
|
Consent of Ernst & Young LLP |
|
|
|
|
|
31.1* |
|
Certification of Chief Executive Officer pursuant to Rule 13a-14(a) and Rule 15d-14(a) of the Securities Exchange Act, as amended. |
|
|
|
|
|
31.2* |
|
Certification of Principal Financial Officer pursuant to Rule 13a-14(a) and Rule 15d-14(a) of the Securities Exchange Act, as amended. |
|
|
|
|
|
32.1* |
|
Certification of Chief Executive Officer pursuant to 18 U.S.C 1350, as adopted pursuant to section 906 of the Sarbanes Oxley Act of 2002. |
|
|
|
|
83
|
32.2* |
|
Certification of Principal Financial Officer pursuant to 18 U.S.C 1350, as adopted pursuant to section 906 of the Sarbanes Oxley Act of 2002. |
|
|
|
|
|
101* |
|
Financial statements from the annual report on Form 10-K of Almost Family, Inc. for the fiscal year ended January 1, 2016, filed on March 2, 2016, formatted in XBRL: (i) Consolidated Balance Sheets, (ii) Consolidated Statements of Income, (iii) Consolidated Statements of Cash Flows, (iv) Consolidated Statements of Stockholders’ Equity, and (v) the Notes to Consolidated Financial Statements. |
*Denotes filed herein.
+Denotes compensatory plan or management contract.
84
SIGNATURES
Pursuant to the requirements of Section 13 or 15(d) of the Securities Exchange Act of 1934, the registrant has duly caused this report to be signed on its behalf by the undersigned, thereunto duly authorized.
ALMOST FAMILY, INC.
|
By: |
/s/ William B. Yarmuth |
March 2, 2016 |
|
|
William B. Yarmuth |
|
||
|
Chairman, Chief Executive Officer |
|
||
|
|
|
|
|
|
By: |
/s/ C. Steven Guenthner |
March 2, 2016 |
|
|
C. Steven Guenthner |
|
||
|
President and Principal Financial Officer |
|
||
Pursuant to the requirements of the Securities Exchange Act of 1934, as amended, this report has been signed below by the following persons on behalf of the registrant and in the capacities and on the dates indicated.
|
Signature |
|
Title |
|
Date |
|
|
|
|
|
|
|
|
|
By: |
/s/ William B. Yarmuth |
|
Director, Chief Executive Officer |
|
March 2, 2016 |
|
|
William B. Yarmuth |
|
(principal executive officer) |
|
|
|
|
|
|
|
|
|
|
By: |
/s/ C. Steven Guenthner |
|
President and Principal Financial Officer |
|
March 2, 2016 |
|
|
C. Steven Guenthner |
|
|
|
|
|
|
|
|
|
|
|
|
By: |
/s/ Jeffrey T. Reibel |
|
Vice President of Finance and Chief Accounting Officer |
|
March 2, 2016 |
|
|
Jeffrey T. Reibel |
|
|
|
|
|
|
|
|
|
|
|
|
By: |
/s/ Steven B. Bing |
|
Director |
|
March 2, 2016 |
|
|
Steven B. Bing |
|
|
|
|
|
|
|
|
|
|
|
|
By: |
/s/ Donald G. McClinton |
|
Director |
|
March 2, 2016 |
|
|
Donald G. McClinton |
|
|
|
|
|
|
|
|
|
|
|
|
By: |
/s/ Tyree G. Wilburn |
|
Director |
|
March 2, 2016 |
|
|
Tyree G. Wilburn |
|
|
|
|
|
|
|
|
|
|
|
|
By: |
/s/ Jonathan D. Goldberg |
|
Director |
|
March 2, 2016 |
|
|
Jonathan D. Goldberg |
|
|
|
|
|
|
|
|
|
|
|
|
By: |
/s/ W. Earl Reed, III |
|
Director |
|
March 2, 2016 |
|
|
W. Earl Reed, III |
|
|
|
|
|
|
|
|
|
|
|
|
By: |
/s/ Henry M. Altman, Jr. |
|
Director |
|
March 2, 2016 |
|
|
Henry M. Altman, Jr. |
|
|
|
|
85
ALMOST FAMILY, INC. AND SUBSIDIARIES
VALUATION AND QUALIFYING ACCOUNTS
(In thousands)
|
|
|
Col. A |
|
Col. B |
|
Col. C |
|
Col. D |
|
Col. E |
|
|||||
|
|
|
|
|
|
Additions/(Deductions) |
|
|
|
|
|
|
|
||||
|
|
|
|
|
|
(1) |
|
(2) |
|
|
|
|
|
|
|
||
|
|
|
Balance at |
|
Charged to |
|
Charged to |
|
|
|
|
Balance at |
|
||||
|
|
|
Beginning |
|
Costs and |
|
Other |
|
(3) |
|
End of |
|
|||||
|
Description |
|
of Period |
|
Expenses |
|
Accounts |
|
Deductions |
|
Period |
|
|||||
|
|
|
|
|
|
|
|
|
|
|
|
|
|
|
|
|
|
|
Allowances: |
|
|
|
|
|
|
|
|
|
|
|
|
|
|
|
|
|
Year Ended January 1, 2016 |
|
$ |
8,880 |
|
|
12,743 |
|
|
1,891 |
|
|
(6,000) |
|
$ |
17,514 |
|
|
|
|
|
|
|
|
|
|
|
|
|
|
|
|
|
|
|
|
Year Ended December 31, 2014 |
|
$ |
15,586 |
|
$ |
9,413 |
|
$ |
— |
|
$ |
(16,119) |
|
$ |
8,880 |
|
|
|
|
|
|
|
|
|
|
|
|
|
|
|
|
|
|
|
|
Year Ended December 31, 2013 |
|
$ |
5,236 |
|
$ |
5,526 |
|
$ |
8,910 |
|
$ |
(4,086) |
|
$ |
15,586 |
|
|
(1) |
Charged to bad debt expense. |
|
(2) |
Acquired uncollectible accounts reserves, primarily SunCrest acquisition related. |
|
(3) |
Write-off of accounts. |
86