Attached files
| file | filename |
|---|---|
| EX-31.2 - EX-31.2 - Press Ganey Holdings, Inc. | pgnd-20151231ex312a00e4a.htm |
| EX-31.1 - EX-31.1 - Press Ganey Holdings, Inc. | pgnd-20151231ex3111555e1.htm |
| EX-21.1 - EX-21.1 - Press Ganey Holdings, Inc. | pgnd-20151231ex211f7838c.htm |
| EX-32.1 - EX-32.1 - Press Ganey Holdings, Inc. | pgnd-20151231ex321c06ee8.htm |
| EX-23.1 - EX-23.1 - Press Ganey Holdings, Inc. | pgnd-20151231ex2313b6d6d.htm |
UNITED STATES
SECURITIES AND EXCHANGE COMMISSION
Washington, D.C. 20549
Form 10-K
(Mark One)
☒ANNUAL REPORT PURSUANT TO SECTION 13 OR 15(d) OF THE SECURITIES EXCHANGE ACT OF 1934
For the Annual Period Ended December 31, 2015
or
☐TRANSITION REPORT PURSUANT TO SECTION 13 OR 15(d) OF THE SECURITIES EXCHANGE ACT OF 1934
For the transition period from to
Press Ganey Holdings, Inc.
(Exact name of registrant as specified in its charter)
|
|
|
|
|
Delaware |
001-37398 |
20‑0259496 |
|
(State or other jurisdiction of |
(Commission File Number) |
(I.R.S. Employer |
|
|
401 Edgewater Place |
|
|
|
Suite 500 |
|
|
|
Wakefield, Massachusetts 01880 |
|
|
|
(Address of Principal Executive Offices) (Zip Code) |
|
(781) 295‑5000
(Registrant’s telephone number, including area code)
Securities registered pursuant to Section 12(b) of the Act:
|
Title of each class |
|
Name of each exchange on which registered |
|
Common Stock, $0.01 par value per share |
|
New York Stock Exchange |
Securities registered pursuant to section 12(g) of the Act: None
Indicate by check mark if the registrant is a well‑known seasoned issuer, as defined in Rule 405 of the Securities Act. Yes ☐ No ☒
Indicate by check mark if the registrant is not required to file reports pursuant to Section 13 or Section 15(d) of the Act. Yes ☐ No ☒
Indicate by check mark whether the registrant (1) has filed all reports required to be filed by Section 13 or 15(d) of the Securities Exchange Act of 1934 during the preceding 12 months (or for such shorter period that the registrant was required to file such reports), and (2) has been subject to such filing requirements for the past 90 days. ☒ Yes ☐ No
Indicate by check mark whether the registrant has submitted electronically and posted on its corporate Web site, if any, every Interactive Data File required to be submitted and posted pursuant to Rule 405 of Regulation S-T during the preceding 12 months (or for such shorter period that the registrant was required to submit and post such files). ☒ Yes ☐ No
Indicate by check mark if disclosure of delinquent filers pursuant to Item 405 of Regulation S K is not contained herein, and will not be contained, to the best of registrant’s knowledge, in definitive proxy or information statements incorporated by reference in Part III of this Form 10 K or any amendment to this Form 10 K. ☒
Indicate by check mark whether the registrant is a large accelerated filer, an accelerated filer, a non‑accelerated filer, or a smaller reporting company. See the definitions of “large accelerated filer,” “accelerated filer” and “smaller reporting company” in Rule 12b‑2 of the Exchange Act.
|
Large accelerated filer ☐ |
Accelerated filer ☐ |
Non‑accelerated filer ☒ |
Smaller reporting company ☐ |
Indicate by check mark whether the registrant is a shell company (as defined in Rule 12-b2 of the Exchange Act). ☐ Yes ☒ No
The aggregate market value of the voting stock held by non-affiliates of the registrant as of the last business day of the registrant’s most recently completed second fiscal quarter (June 30, 2015), was $578 million based upon the closing sale price of the registrant’s common stock as reported on the New York Stock Exchange. There were 52,803,214 shares of common stock outstanding as of February 26, 2016.
DOCUMENTS INCORPORATED BY REFERENCE
The information required by Part III of this Form 10-K, to the extent not set forth herein, is incorporated herein by reference to the registrant’s definitive proxy statement relating to the 2016 annual meeting of stockholders to be filed with the Securities and Exchange Commission not later than 120 days after the end of the registrant’s fiscal year ended December 31, 2015.
PRESS GANEY HOLDINGS, INC.
|
|
|
|
Page |
|
PART I |
|
|
|
|
|
1 | ||
|
|
18 | ||
|
|
39 | ||
|
|
39 | ||
|
|
40 | ||
|
|
40 | ||
|
|
|
|
|
|
PART II |
|
|
|
|
|
40 | ||
|
|
43 | ||
|
Management’s Discussion and Analysis of Financial Condition and Results of Operations |
|
44 | |
|
|
57 | ||
|
|
58 | ||
|
|
|
|
|
|
|
Consolidated Financial Statements |
|
|
|
|
|
60 | |
|
|
|
61 | |
|
|
|
62 | |
|
|
|
63 | |
|
|
|
64 | |
|
|
|
|
|
|
Changes in and Disagreements with Accountants on Accounting and Financial Disclosure |
|
83 | |
|
|
83 | ||
|
|
83 | ||
|
|
|
|
|
|
PART III |
|
|
|
|
|
83 | ||
|
|
84 | ||
|
Security Ownership of Certain Beneficial Owners and Management and Related Stockholder Matters |
|
84 | |
|
Certain Relationships and Related Transactions, and Director Independence |
|
84 | |
|
|
84 | ||
|
|
|
|
|
|
PART IV |
|
|
|
|
|
85 | ||
|
|
87 | ||
SPECIAL NOTE REGARDING FORWARD‑LOOKING STATEMENTS
This annual report contains forward‑looking statements that are subject to risks and uncertainties. We make such forward‑looking statements in reliance on the safe harbor provisions of the Private Securities Litigation Reform Act of 1995 and other federal securities laws. All statements other than statements of historical fact or relating to present facts or current conditions included in this annual report are forward‑looking statements. Forward‑looking statements give our current expectations and projections relating to our business, financial condition, results of operations, plans, objectives and future performance. You can identify forward‑looking statements by the fact that they do not relate strictly to historical or current facts. These statements may include words such as “anticipate,” “estimate,” “expect,” “project,” “plan,” “intend,” “believe,” “may,” “should,” “can have,” “likely” and other words and terms of similar meaning in connection with any discussion of the timing or nature of future operating or financial performance or other events.
The forward‑looking statements contained in this annual report are based on assumptions that we have made in light of our industry experience and our perceptions of historical trends, current conditions, expected future developments and other factors we believe are appropriate under the circumstances. As you read and consider the information contained in this annual report, you should understand that these statements are not guarantees of performance or results. They involve risks, uncertainties (many of which are beyond our control) and assumptions. Although we believe that these forward‑looking statements are based on reasonable assumptions, you should be aware that many important factors could affect our actual operating and financial performance and cause our performance to differ materially from the performance anticipated in the forward‑looking statements. We believe these factors include those described herein under “Risk Factors” and “Management’s Discussion and Analysis of Financial Condition and Results of Operations.” Should one or more of these risks or uncertainties materialize, or should any of these assumptions prove incorrect, our actual operating and financial performance may vary in material respects from the performance projected in these forward‑looking statements.
Any forward‑looking statement made by us in this annual report speaks only as of the date on which we make it. Factors or events that could cause our actual operating and financial performance to differ may emerge from time to time, and it is not possible for us to predict all of them. We undertake no obligation to publicly update any forward‑looking statement, whether as a result of new information, future developments or otherwise, except as may be required by law.
PART I
Company Overview
Press Ganey is a leading provider of patient experience and caregiver measurement, performance analytics and strategic advisory solutions for healthcare organizations across the continuum of care. Our mission is to help healthcare organizations reduce patient suffering and improve the quality, safety and experience of care. We provide our clients with an innovative digital platform that captures the perspectives of patients, physicians, nurses and other healthcare employees and enables our clients to benchmark, analyze and improve the patient and caregiver experience. We support clients in achieving the “Quadruple Aim” of improving the patient experience, improving population health, reducing costs and engaging caregivers. We believe we offer a powerful value proposition to the healthcare industry, as we help drive transformational change through performance transparency, safety and high reliability initiatives, better care coordination and sustainable performance improvements.
1
Founded in 1985, Press Ganey is recognized as a pioneer and thought leader in the approximately $4.2 billion U.S. market for patient experience measurement and performance improvement solutions. In the past seven years, we have successfully acquired and integrated nine businesses to support our growth, further enhancing our comprehensive suite of solutions. We believe clients value our scientific rigor in capturing and analyzing the patient and caregiver experience, as well as our ability to interpret data and create actionable insights that positively impact safety, clinical, operational and financial performance of healthcare organizations. We combine proprietary information with advanced analytics on our digital platform to present targeted findings and predictive insights for improving patient care, employee engagement and overall outcomes. Our solutions identify key causes of variability in performance and correlate these to best practices observed across a wide population of patients and providers. We utilize data on a secure, client‑specific basis, as well as on an aggregated, de‑identified basis, to enable our clients to understand their own performance with a high degree of specificity and to benchmark their performance against other providers and industry best practices. We believe our clients view us as a trusted partner that shares their commitment to reducing patient and caregiver suffering through continuous, patient‑centric performance improvement.
Our clients are represented across the continuum of care and include hospitals, medical practices and other healthcare providers. As of January 1, 2016, we served more than 26,000 healthcare facilities, including over 60% of acute care hospitals in the United States, over 80% of acute care hospitals in the United States with more than 100 beds and over 75% of medical practices in the United States with more than 50 physicians. We have strong and long‑standing relationships with distinguished healthcare providers, including over 80% of major teaching hospitals in the United States as of January 1, 2016. From 2013 to 2015, our average annual revenue retention rate was approximately 95%, which we believe is indicative of strong client satisfaction with our solutions and the nature of our long‑term strategic client relationships. With our continued focus on innovation and thought leadership, we believe we have a significant opportunity to both expand our engagements within our existing client base and to increase the total number of healthcare organizations we serve.
Healthcare providers increasingly recognize that patient‑centric strategies can improve their performance from a safety, clinical, operational, financial and branding perspective. Our clients often cite moving their organization to a “patient‑centric culture” as a top priority. We believe that we are well‑positioned to benefit from our clients’ shift in strategic focus, which is a function of numerous trends in the healthcare industry, including:
|
· |
Continued growth in U.S. healthcare spending; |
|
· |
The shift from volume to value‑based payment models; |
|
· |
Increased focus on population health to minimize costly interventions by promoting community well‑being; |
|
· |
Increased consumerism, including demands for quality and price transparency; |
|
· |
Renewed focus on eliminating preventable harm through safety initiatives; and |
|
· |
Expanding regulatory requirements focused on value‑based reimbursement, including patient experience. |
Our solutions focus on providing our clients with a digital platform to support the transition toward patient‑centric care. Through our focus on the patient experience and caregiver engagement, we help our clients achieve their strategic objectives to eliminate serious safety events, improve care coordination, adopt performance transparency, build and enhance their brand position and, ultimately, reduce patient and caregiver suffering. In 2013, we introduced Census‑Based Surveying, enabling technology-based data collection as part of our digital platform to allow our clients to more efficiently capture the voice of every patient. This method expands on traditional data collection methods through electronic means and organizes the data within our proprietary platform. Offering convenience and flexibility to patients as well as a common data structure for analysis, this innovative approach has resulted in significantly greater data collection and more detailed, real-time analytic insights, thereby accelerating related performance improvement cycles. In addition, more comprehensive data has enabled healthcare providers to offer performance transparency, presenting relevant, statistically-valid performance information online directly to consumers.
2
Industry Overview
We operate in the large and growing healthcare industry, which is under increasing pressure to lower costs while concurrently improving the safety, quality and experience of care. The current market for patient experience measurement and performance improvement solutions is approximately $4.2 billion and is projected to grow to approximately $6.0 billion by 2018. We believe the market for our solutions will increase due to the projected growth in U.S. healthcare spending, a shift to value‑based care and population health management, the movement within health systems to design patient-centric delivery systems, the rise of consumerism in healthcare and expanding government regulations.
Projected Growth in U.S. Healthcare Spending
Healthcare spending represents a significant and growing portion of the U.S. gross domestic product, or GDP. According to National Health Expenditures data reported by the Centers for Medicare & Medicaid Services (CMS), the United States spent $3.1 trillion on healthcare in 2014, accounting for nearly 18% of GDP. Healthcare spending growth is expected to continue to outpace the rest of the U.S. economy. According to CMS, the projected average annual growth of healthcare spending from 2014 through 2024 is 5.8%, which is greater than the expected average annual GDP growth over the same period. By 2024, overall U.S. healthcare spending is expected to reach $5.4 trillion. The majority of healthcare spending passes through hospitals and physician practices. Of the $3.1 trillion projected to have been spent in 2014, a projected $978.3 billion went to hospital care and a projected $615.0 billion went to physicians and clinical services.
Shift to Value‑Based Healthcare
We believe the current fee‑for‑service healthcare payment model has contributed to the significant growth in U.S. healthcare spending. Under the current system, providers are reimbursed based on volume of services provided, and end‑users are shielded from the cost of care through health insurance and government healthcare programs such as Medicaid and Medicare. In response, commercial and government payors, as well as healthcare providers, are shifting away from this inefficient model and towards value‑based models of care delivery and reimbursement.
The transition away from the traditional fee‑for‑service payment model to a value‑based care delivery model is occurring across the United States. In January 2015, the U.S. government outlined a plan to transition 90% of Medicare fee‑for‑service payments to alternative payment models or reimbursements based on quality and value by the end of 2018. We believe that better understanding of the patients’ needs and preferences, as well as a greater focus on treating patients like consumers, will be key to a successful transition for healthcare providers to ensure they maintain reimbursement levels.
Finally, with the emergence of new payment models, quality measures and readmission penalties, there is an increased need for both payors and providers to successfully manage the health of their patient populations by engaging patients more actively in prevention and care management than ever before. The main goal of population health management is prevention, which is a stark change from typical care delivery in the United States, which focuses on the treatment of illness in high‑acuity, expensive settings, such as an emergency room. While population health management focuses partly on high‑risk patients who generate the majority of health costs, it seeks to systematically promote wellness and actively manage chronic conditions. To achieve and sustain cost reduction and encourage proper utilization, providers will also need to engage patients in shared decision making. In order to design a more patient‑centric system that encourages patient engagement, providers will need to develop new frameworks in which every patient is given a voice in their care. Sustainability of these new frameworks will require operational integration and advanced analytics that will drive targeted, continuous improvements on a daily basis.
We believe that patient-centricity results in more engaged patients and caregivers, which ultimately drives improved clinical outcomes and lower costs. Our data consistently show a statistically significant correlation between patient experience and quality and cost metrics.
3
Rise of Consumerism in Healthcare
Today, consumers are incentivized to make better‑informed healthcare decisions and healthier lifestyle choices as they bear more financial responsibility for their healthcare costs under increasingly restricted networks and high‑deductible health plans. We believe this shift in financial responsibility has made direct consumer spending the fastest‑growing segment of healthcare costs in the United States.
As consumers shoulder more financial responsibility for their care, they are also more engaged in their healthcare purchasing decisions. In this context, the availability and reliability of physician performance ratings, healthcare cost data and quality measures have become increasingly important. Historically, objective data were difficult to find, or not available, and individuals would rely on non-scientific information from sources such as family, friends, insurance networks and referrals from doctors to make healthcare decisions. Today, consumers can access and obtain standardized, detailed cost, quality, experience and outcome metrics associated with specific providers, procedures and medications. To retain existing patients and grow market share, providers will need to collect, display and improve these metrics. More comprehensive patient experience data have enabled healthcare providers to engage in patient loyalty initiatives and brand management through transparency. The shift to a more informed and engaged consumer is resulting in new challenges and opportunities for healthcare organizations and is driving demand for patient experience measurement and performance improvement solutions such as ours.
Expanding Government Regulations
Numerous government regulations have been implemented over the past several years that have increased the relevance and importance of patient experience measurement and performance improvement solutions. The Affordable Care Act is and will continue to be a catalyst for significant transformation toward more patient‑centric, value‑driven care across the U.S. healthcare industry.
The Affordable Care Act expanded healthcare coverage for the uninsured and also introduced a wide variety of reforms to the Medicare payment system that encourage a movement from fee‑for‑service to value‑based, patient‑centric care. With the passage of the Affordable Care Act, most healthcare providers are required, or will be required in the future, to participate in Consumer Assessment of Healthcare Providers and Systems, or CAHPS, programs. CAHPS programs were developed by CMS and produced the first nationally standardized instruments for collecting and reporting patients’ perspectives of care to enable comparisons within care settings such as hospitals, home health, physician practices and dialysis providers.
Hospital participation in the hospital CAHPS, or HCAHPS, program has been mandatory for all hospitals subject to the Inpatient Prospective Payment System, or IPPS, since July 2007, and hospitals risk losing a percentage of their annual payment update, or APU, if they fail to report CAHPS data for any calendar quarter. Similar reporting mandates are in place for accountable care organizations (ACO CAHPS), medical groups (PQRS CAHPS), home health agencies (HH CAHPS), hospice providers (Hospice CAHPS) and in-center hemodialysis facilities (ICH CAHPS). We are in the preliminary voluntary reporting phase for outpatient and ambulatory surgery (OAS CAHPS). Additional surveys have been created or are under development for pediatric hospitals (Child HCAHPS), emergency departments (ED CAHPS), inpatient rehabilitation hospitals and long-term acute care hospitals.
Beginning in 2013, under the Hospital Value‑Based Purchasing program, Medicare began withholding 1% of Medicare payments to hospitals, a figure which will increase to 2% by 2017. This pool of withheld funding is then re‑allocated to hospitals based on their performance relative to other hospitals on patient experience and clinical quality measures, among other metrics. Medicare is in the process of implementing the Merit-based Incentive Payment System, a program to tie physician reimbursement to performance. The amount of reimbursement at risk will increase from 4% for 2019 payment to 9% in 2022, with a portion specifically tied to quality measurement and clinical practice improvement activities, including patient experience, care coordination and patient safety. To further support their goal of connecting payment to quality, CMS has also introduced a value-based purchasing demonstration project for home health agencies. Commercial payors are also implementing programs similar to regulatory value‑based payment models.
4
We believe these reforms represent a significant shift in the healthcare marketplace. Providers have a financial incentive to reduce the costs of care, focus on preventive medicine and better engage consumers.
Our Strengths
Established position of industry leadership. For more than 30 years, we have partnered with healthcare organizations to improve the patient experience and drive better safety, clinical, operational and financial outcomes. As of January 1, 2016, we served more than 26,000 healthcare facilities across the continuum of care, representing over 60% of acute care hospitals in the United States, over 80% of acute care hospitals in the United States with more than 100 beds, over 80% of major teaching hospitals in the United States and over 75% of medical practices in the United States with more than 50 physicians. Through scientific and clinical rigor, we believe we have developed a reputation as an authority on patient‑centric care, and we are recognized for our thought leadership and innovation. We are credited with:
|
· |
Leadership in the patient experience movement by re-engaging caregivers in the “noble cause of reducing patient suffering”; |
|
· |
Advancing the performance transparency movement to increase physician accountability, influence patient loyalty and manage brand perceptions; |
|
· |
Launching the “Zero Harm” pledge to engage healthcare organizations in a commitment to eliminate serious safety events and improve outcomes; |
|
· |
Introducing the Compassionate Connected Care model to promote patient-focused behaviors that reduce patient suffering; |
|
· |
Promoting the important role of both physician and nursing leadership in achieving patient-centered care through alignment with organizational goals and collaboration across caregivers; and |
|
· |
Founding The Institute for Innovation, a non‑profit organization, in 2013 to advance the patient experience and to act as an incubator for forward‑thinking industry solutions. |
Our thought leadership efforts provide opportunities for an ongoing dialogue with healthcare providers at the executive level and with other key stakeholders in healthcare organizations.
Comprehensive suite of integrated solutions that drives measurable value. We offer a suite of solutions that integrates the experiences of patients, physicians, nurses and employees to pinpoint opportunities to reduce patient suffering, drive engagement and improve performance. We analyze data to identify actionable insights that promote care coordination and communication, and simultaneously improve the safety, quality, and experience of care. Our solutions are complementary, providing additional safety, clinical, operational and financial value when used as a full suite. Our proprietary reporting methodologies enable clients to understand the full patient care experience with a high degree of specificity and to contextualize it across specialty or healthcare settings. We believe that dashboard views of our data sets housed on our digital platform present the information in an optimal way to assist our clients in understanding and applying the insights to effect positive change across all levels of their organizations. Our advisors interpret findings, create actionable plans and evaluate progress with our clients’ executives and managers to continually assess improvement goals and opportunities. A team of our professional consultants facilitates change through culture transformation and operational redesign to eliminate safety events and improve care reliability.
5
Digital platform of actionable insights derived from advanced analytics. The foundation of our offering is an information asset and digital platform that offers real-time, secure information to our clients in an easily accessible format that is focused on driving targeted action plans to continuously improve the quality of care. Our solutions identify key causes of variability in performance, and correlate these to best practices observed across a wide population of providers. We utilize data on a secure, client‑specific basis, as well as on an aggregated, de‑identified basis, to enable our clients to understand their own performance with a high degree of specificity and to benchmark their performance against other providers and industry best practices. Our online portal averaged 266,000 monthly client logins in 2015, indicating the high level of engagement and interaction with the technology. We invest significant resources in our research department. Our data scientists identify common variables in the process of care and outcomes for our clients and deliver these insights through an intuitive, decision‑oriented framework designed to promote action and improvement. Our digital platform enables our clients to better understand the entire experience of care from the patient and caregiver perspective and address current and potential future deficiencies in care.
Large, continuously expanding information asset. We believe our patient experience database is one of the largest and most comprehensive of its kind. With over 30 years in the industry and approximately 23 million patient experiences captured in 2015, we believe that our information asset is difficult to replicate and offers a competitive advantage. Our continued investments in our digital platform and technology-based solutions, such as Census‑Based Surveying, provide our clients with the ability to significantly increase their insight into the experiences of patients, physicians, nurses and employees. We utilize multiple forms of data collection, including electronic mail and phone, in order to expand our information asset. In 2015, we distributed over 140 million surveys, including 56 million electronically and 84 million by mail. We believe our extensive information asset deepens our understanding of the patient experience and caregiver engagement, and enhances the statistical significance, benchmarking strength and value of our insights.
Highly recurring revenue model with inherent scalability and operating leverage. We believe we have an attractive business model due to the recurring nature of our revenue, scalability of our solutions and operating leverage. Our average annual revenue retention rate from 2013 to 2015 was approximately 95% and our average client revenue retention rate from 2013 to 2015 was approximately 97%, which we believe reflects strong client satisfaction with our solutions. Our information asset and technology platform can be utilized to support new products, and our business model has operating leverage with greater profitability on incremental revenue. Historically, we have invested a portion of our free cash flow in our product suite, which has enabled us to maintain a competitive advantage while continuing to deliver greater value.
Experienced management team with a track record of performance. Our senior management team has extensive experience in the healthcare industry and a deep understanding of the patient experience and performance improvement market. In addition, our senior management team has a proven track record of successful strategic acquisitions. In the past seven years, we have successfully acquired and integrated nine businesses to support our growth, further enhancing our comprehensive suite of solutions and expanding our market leadership position. With our talented management team, we believe we are well‑positioned for long‑term growth.
Our Business Strategy
In order to maintain and grow our industry-leading position, we are pursuing the following business strategies to reduce suffering and improve care coordination:
Empower healthcare providers to improve the patient experience. We are a mission‑driven organization that focuses on reducing suffering and improving the experiences of patients and caregivers. We partner with our clients, including hospitals, medical practices and other healthcare providers across the continuum of care, to deliver insights that are tailored to each client’s specific needs. We plan to continue our relationships with healthcare providers that share our mission of reducing patient suffering and improving the patient experience and caregiver engagement. Through our thought leadership initiatives, we aim to advance the industry conversation and offer our clients exclusive access to these insights. Through our conferences, summits and symposia, we create a forum for our clients to explore solutions to the industry’s challenges, share best practices and network with other executives.
6
Drive value through thought leadership and product innovation. We help our clients anticipate and respond to industry trends, such as increased consumerism, the demand for performance transparency, the goal of zero harm, the challenge of physician and caregiver burnout and the shift to value‑based payment models. Our thought leadership helps us identify commercial opportunities for new products that allow clients to improve care coordination and safety, clinical, operational and financial performance. We intend to continue to invest in technology and human capital in order to increase the quality, accuracy and timeliness of our offerings and develop new products by leveraging the insights provided by our clients, thought leadership and from mining our own product data.
Expand our existing client relationships. We believe we have a significant opportunity to expand our relationships with our existing clients by continuing to demonstrate the value of our suite of solutions in delivering improved safety, clinical, operational and financial outcomes. We will continue to focus on building strategic relationships with our clients’ senior executives as well as direct program managers, which we believe is a key strategy in maintaining and improving our high client and revenue retention rates. With a focus on technology‑based innovation, we will seek to expand our solutions and to increase the sophistication of our analytics, the power of our digital platform and the ease of use for our clients. We intend to increase engagement with existing clients that are impacted by expanded CAHPS regulatory requirements and to enhance our clients’ understanding of the complete patient experience.
Attract new clients and expand our patient experience database to maximize insight. We intend to add new client relationships, thereby enhancing the depth and accuracy of our information asset and expanding our insights across the continuum of healthcare providers. With the benefit of what we believe is a strong value proposition and related brand equity, we intend to increase our client base through targeted expansion strategies focusing on hospitals, medical practices and other healthcare providers. We also plan to expand into market segments that are in the process of implementing or preparing for CAHPS programs.
Support advanced strategic transformation with professional services. We offer a variety of professional services to assist and enable clients to maximize their transition to a patient‑centric care model. Our data scientists support clients with targeted analytics and provide interpretation of the patient experience data, and our advisors assist in the development of detailed action plans that support our clients’ long‑term strategies. Through our consulting team, we offer operational redesign and transformative cultural initiatives to eliminate harm, achieve high reliability and implement advanced patient-centric care strategies. We offer learning solutions that enable our clients to manage human capital development and to train their professionals for maximum improvement in clinical outcomes, safety and efficiency.
Expand our capabilities through strategic acquisitions and partnerships. We have a strong track record of identifying, acquiring and integrating high‑quality technology and service providers that complement and enhance the value of our existing offerings. We target companies that provide a natural extension of our solutions and are aligned with our mission. We will seek to acquire businesses that strengthen our capabilities, particularly where specific insights can be translated into our analytics platform to provide a more scalable solution and where technologies increase the flexibility of our data set or the ease of use for our clients. Between January 1, 2009 and December 31, 2015, we have successfully acquired and integrated nine companies, which we believe has significantly increased our value proposition to our collective client base. We may also seek strategic partnerships that allow us to pursue new opportunities with greater flexibility and lower capital at risk while also providing us with access to new technologies, services and solutions.
Our Solutions
Our solutions enable healthcare providers across the continuum of care to identify opportunities to reduce patient and caregiver suffering and improve their safety, clinical, operational and financial performance. Through our offerings, we provide insights based on patient, physician, nurse and employee feedback, as well as other clinical data. Through our digital platform, we offer advanced analytics tools which our clients use to understand patient and caregiver feedback and prioritize opportunities. Our solutions help interpret the data and drive continuous improvement initiatives, which are promoted across client organizations through our educational and advisory capabilities.
7
Our unique approach enables clients to measure and understand the patient and caregiver experience of care. Our solutions complement each other and provide optimal value when delivered together. Our comprehensive suite of solutions includes:
Press Ganey Solutions
|
Patient Experience Solutions |
Caregiver Engagement Solutions |
Clinical and Quality Solutions |
Consulting Solutions |
|
•Patient experience measurement, insights and advisory services |
•Physician, nurse and employee engagement measurement, insights and advisory services |
•Nursing quality indicators •Patient reported outcome measures •Core measures and eMeasures |
•Patient safety and care reliability •Patient experience improvement •Process flow •Advanced analytics and insights •Cultural alignment |
Patient Experience Solutions
We measure and analyze data collected directly from patients. We provide real-time analytics and insights that enable our healthcare clients to understand their data and improve the patient experience.
Patient Experience Insights. In 2015, we measured approximately 23 million patient experiences through paper, phone, mobile and other electronic modes, including approximately eight million through our digital platform. Each piece of data collected is stored in our data warehouse and client data can be viewed through our proprietary reporting platform and compared against timely benchmark data.
Through Census‑Based Surveying, which uses email and mobile technologies to efficiently capture the voice of every patient, we have significantly increased the amount of data collected for our clients. This innovative approach delivers more detailed and reliable insights, thereby accelerating performance improvement cycles. In addition, deeper data collection has enabled our clients to rapidly achieve statistically significant samples at the provider level to power online performance transparency initiatives in an increasingly competitive and consumer-driven environment.
Many of our clients use their patient experience data to participate in regulatory and pay for performance initiatives such as the CAHPS programs. We actively help our clients prepare for and satisfy reporting requirements under these types of programs. A number of key programs we support include ACO CAHPS, PQRS CAHPS, Child HCAHPS, ED CAHPS, HCAHPS, HH CAHPS, Hospice CAHPS, ICH CAHPS and OAS CAHPS. We strive to help our clients meet their regulatory requirements while simultaneously delivering a more complete picture of the patient experience for overall improvement initiatives.
Our patient experience solutions include advanced analytics and insights that identify drivers that most influence performance and outcomes from the process of care. These insights are delivered through an intuitive, decision‑oriented framework designed to promote action and improvement by healthcare organizations.
The breadth of our data and online analytics presented through our digital platform allows us to provide industry benchmark comparisons based on client‑defined segments, such as geographic, community or other custom peer groups. We believe that our intuitive and timely reporting present the information in an optimal way to assist our clients in understanding and applying the insights to deliver sustainable improvement.
As part of our patient experience solutions, our clients are supported by advisory services from healthcare professionals who interpret patient experience results and construct continuous improvement plans. Our advisors assist with the implementation of key initiatives and work with the client to ensure progress through quarterly executive business reviews in which organizational improvement goals are evaluated, performance is assessed and market updates are shared.
8
Caregiver Engagement Solutions
Physician, Nurse and Employee Alignment and Engagement. Our engagement solutions measure physician, nurse and employee experiences and uniquely offer tiering by engagement level to enable clients to develop action plans based on readiness for change. We capture the key drivers of engagement by measuring perceptions of the healthcare organization’s mission, performance and quality, along with perceptions of its senior leadership, department managers, and team. Our alignment and engagement solutions are powered by our digital platform that integrates the voices of physicians, nurses and employees to prioritize improvement via the Engagement Portal. By capturing caregiver feedback across care settings and pairing it with our patient insights, our solutions enable organizations to achieve greater accountability and foster a patient‑centric, safety-focused culture.
The Engagement Portal provides meaningful insights, including caregiver engagement scores, strengths and concerns, key drivers, and domain scores for leadership, organization, department and staff. Our findings enable our clients to focus on human capital initiatives, prioritize systemic change, implement work unit interventions and align employees around patient experience goals and business strategies. As a result, our clients have the tools to understand where and how to drive cultural change to engage employees and retain key talent.
In addition, as part of our engagement solutions, our clients are supported by advisory services from healthcare professionals who interpret engagement results and develop action plans based on readiness for change by work group. Our advisors have expertise in developing engaged workforces, prioritizing systemic changes and aligning physicians with improvement strategies.
Clinical and Quality Solutions
We offer clinical and quality solutions to understand patient reported outcome measures, or PROMs, nursing quality measures and clinical outcomes data. These solutions, supported by clinicians and quality experts, enable collaborative decision‑making across a health system or organization to achieve performance improvement.
Nursing Performance Indicators. Our National Database of Nursing Quality Indicators, or NDNQI, program collects data on a key set of nursing‑sensitive process, structure and outcome measures, enabling targeted action‑planning and intervention for clients. NDNQI helps hospitals achieve the highest levels of nursing excellence by tracking progress and meeting performance requirements for the Magnet Recognition Program, developed by the American Nurses Credentialing Center, that recognizes healthcare organizations for quality patient care, nursing excellence and innovations in professional nursing practice. As of January 1, 2016, we had more than 2,060 U.S. hospitals and 98% of Magnet‑recognized facilities participating in our NDNQI program.
Patient Reported Outcome Measures (PROMs). We are in the early stages of expanding our PROMs offering as the market demand for patient reported data grows. Our solution captures patients’ perceptions of the impact of medical care on their functional status and quality of life in a standardized format at defined points of time. The data is analyzed, scored and used both in clinical decision making and to assess medical practice efficacy and efficiency. Our PROMs solution engages patients in their care setting and provides a more complete picture of patients’ perceptions of outcome. Established for its value in clinical trials and research, PROMs is emerging as a critical measurement approach in the industry, with CMS recently implementing its first mandatory bundled payment program that includes a PROMs component in its quality assessment metrics.
9
Core Measures and Clinical Quality eMeasures. Our software data collection solution enables providers to track, submit and analyze data on core measures. Implemented by CMS in 2003, core measures track a variety of evidence‑based standards of care which lead to improved clinical outcomes. Core measures data submission and scores impact reimbursement through CMS mandatory reporting and valued‑based payment models. New and emerging regulatory reporting mandates are gradually shifting away from core measures and toward Clinical Quality eMeasures (eCQMs). Our Hospital eMeasures (HeM) solution supports client requirements under this new mode of data collection and reporting. HeM was certified by the Office of the National Coordinator to acute care hospitals’ eCQM reporting requirements and currently, more than 100 hospitals are using our solution. Clients are supported by clinical performance advisors who offer a deep understanding of the complexities and nuances of the national and other value-based reporting programs. Our core measures solution delivers reliable and timely reporting with comprehensive data collection, concurrent abstraction, reporting and analysis and support from quality experts.
Consulting Solutions
We offer a broad range of consulting solutions designed to enhance the patient experience through organizational transformation that engages and aligns physician and nurse leadership. Our experienced consultants assist organizations through assessments, coaching, training, or the execution of best practices designed to overcome cultural barriers, implement tactical solutions such as nurse and leadership rounding programs, evaluate and modify caregiver and patient flow, create customized physician communication programs and deliver a comprehensive approach to reduce patient harm through building and sustaining a culture of safety and high reliability. Our consultants help organizations design, implement and sustain comprehensive patient experience strategies that aim to reduce patient suffering, engage key stakeholders and build compassionate connected care systems. Our approach brings together expertise focused on organizational culture and operational efficiency—all driven by our data and analytics capabilities.
Thought Leadership Initiatives
With over 30 years of experience, our brand is recognized in the industry for thought leadership and innovation. We believe our thought leadership insights support our clients in achieving the “Quadruple Aim” of improving the patient experience, managing population health, controlling costs and engaging caregivers. Our thought leadership forums include national and regional conferences, executive summits, publications, white papers, speaking engagements, webinars, blogs and newsletters. In addition, our management team frequently meets with C‑suite executives to discuss our solutions and our mission to reduce patient suffering. The cornerstone event of the year is our National Client and Executive Leadership Conference (NCC), a three day conference that drew nearly 2,800 participants in 2015, including more than 500 executives. With over 70 continuing education‑accredited sessions, the NCC provides both educational and networking opportunities, as clients convene to discuss the future of the healthcare industry, learn best practices and connect with other healthcare professionals.
In 2015, we hosted several executive-level events, including the Transparency Summit, Pediatric Summit, Emergency Department Summit and Patient Experience Summit, drawing a total of over 340 leaders from across the country. We also held the annual HPI Safety Summit, established in 2004, with over 600 in attendance.
Our annual regional symposia, which historically have drawn over 1,000 attendees in total, constitute another leading forum for clients to collaborate with peers and explore the path to improving the patient experience. The regional symposia provide attendees with insights and innovative strategies for creating a patient‑centric organization.
In 2013, in an effort to further advance the study and understanding of the patient experience and support our mission to reduce patient suffering, we launched the Institute for Innovation, a non‑profit organization. Today, the founding executive council of the Institute for Innovation is comprised of 28 leading healthcare organizations from around the United States, with broad representation from a number of disciplines within the healthcare industry. The Institute for Innovation is investing in research to advance the healthcare industry’s understanding of the patient experience and the improvement of patient care from both the patient and healthcare provider perspective. All research results are published to help drive improvement in the healthcare industry.
10
Clients
We have strong and long‑standing relationships with our clients. We provide our patient experience services to our clients under contracts that typically have terms of one year or more. Our average annual revenue retention rate from 2013 to 2015 was approximately 95% and our average client revenue retention rate from 2013 to 2015 was approximately 97%, which we believe reflects strong client satisfaction with our solutions. We believe our clients view us as a trusted partner that shares their commitment to reducing patient suffering through continuous, patient‑centric performance improvement.
Our clients are represented across the continuum of care and include hospitals, medical practices and other healthcare providers. As of January 1, 2016, we served more than 26,000 healthcare facilities, including over 60% of acute care hospitals in the United States, over 80% of acute care hospitals in the United States with more than 100 beds and over 75% of medical practices in the United States with more than 50 physicians. No single client represented more than 3% of our revenues in 2015.
Our Technology
Through the application of our digital platform, we help our clients achieve insight and improvement in patient experience, workforce engagement, clinical effectiveness, operational and financial outcomes, and transparency initiatives. A significant proportion of our capital expenditures are invested in our technology infrastructure, applications, and warehousing capabilities to improve what we believe is one of the largest and most advanced patient experience and performance improvement technology platforms in the industry. Our platform captured approximately 1.7 billion distinct medical events in 2015, providing for a significant amount of patient experience data that we analyzed on behalf of our clients.
As a result of our recent investments in our information technology infrastructure, we have the ability to apply our Census‑Based Surveying to collect and analyze significantly larger data sets. Our proprietary algorithms convert this raw data into comparative information that allows clients to benchmark their current performance against their own historic scores and those of their peers. The investment in increased analytical power, coupled with increasing levels of statistical significance of our data at the physician, unit, service and facility level, has increased both the quality and scope of the analytics we are able to provide to our clients.
Privacy Management and Security
We collect, process, use and store a large amount of information from patients and clients and their employees. This data is often accessed by us and our clients through transmissions over public and private networks, including the Internet. Patients provide us with personal data about themselves or their family members, which may reveal health‑related information or other personal information. Patient health information is among the most sensitive of personal information, and it is critically important that information about an individual’s healthcare is properly protected from inappropriate access, use or disclosure. Numerous federal and state laws and regulations govern collection, dissemination, use and confidentiality of personally identifiable health information. See “Government Regulation.”
We continuously enhance and expand our privacy and security practices and devote significant resources to the collection, processing, analysis, reporting and use of patient health information and personally identifiable and other sensitive information. We employ a wide variety of methods to manage privacy and security, including:
|
· |
governance, frameworks, and models to promote good decision making and accountability; |
|
· |
a layered approach to privacy management and data security to avoid single points of failure; |
|
· |
ongoing evaluation of privacy and security practices to promote continuous improvement; |
|
· |
use of safeguards and controls, including administrative, technical, and physical safeguards; |
11
|
· |
collaboration with our clients on best security and privacy practices; and |
|
· |
working closely with leading researchers, policy makers, thought leaders and others in a variety of fields relevant to the application of effective privacy and security practices. |
Intellectual Property
We protect our proprietary technology and intellectual property rights by relying on United States and worldwide federal, state and common law rights, as well as contractual restrictions, including those regarding patents, copyrights, trademarks and trade secrets. We control access to our proprietary technology and intellectual property, in part, by entering into confidentiality and proprietary rights agreements with our employees, contractors and business partners. We also control the use of our proprietary technology and intellectual property through provisions in our client agreements, business partner agreements and website terms of use.
Our registered trademarks in the United States include “Press Ganey,” as well as others. We have three United States patents and intend to pursue additional patents to the extent we believe that patent protection would be beneficial or cost effective.
Sales and Marketing
Our sales and marketing teams consists of over 70 sales professionals and we offer geographically‑based client support through our team of healthcare professionals, including over 300 market/client‑facing personnel. Sales and marketing activities represent a significant portion of our total operating expenses and account for a significant portion of the costs that we incur in acquiring new clients and retaining existing clients.
Our sales and marketing efforts reinforce our thought leadership, best practices and innovation, and in turn our brand is recognized in the industry for these qualities. In particular, we promote awareness of our brand through our thought leadership initiatives, which are intended to elevate the market dialogue and act as a platform for our interaction with the media. Our communications efforts also ensure an ongoing dialogue with key stakeholders, offering thought leadership, best practices materials, regulatory insights and product updates. We also design, organize and host market‑leading events, including our National Client and Executive Leadership Conference, HPI Safety Summit, topical executive summits, regional symposia and client‑user groups. In addition, our online content is further leveraged to improve search engine optimization and strengthen our corporate website. Through these efforts, we promote client retention, illustrate the value of our complementary solutions and attract new clients.
Competition
We compete with a broad and diverse set of businesses in a fragmented and rapidly changing market. Competition in the patient experience and performance improvement industry is largely based on analytical capabilities and healthcare industry expertise, breadth and depth of services, the size and quality of the underlying datasets and benchmarks, ease of use, reputation, innovation, security, price, reliability and client service. While we believe that no competitor provides the breadth of our suite of solutions or the size and quality of our datasets and benchmarks, we nevertheless compete with other companies with regards to specific products or solutions and markets or care settings. We compete with various large and small healthcare data, analytics, services and consulting companies.
We expect that competition will continue to increase as a result of consolidation in both the information technology and healthcare industries. The anticipated growth in healthcare spending, the shift to a value‑based payment model, the rise of consumerism and changes in government regulation may draw increasing attention to healthcare data and analytics, and new competitors, such as management consultants, technology companies and start‑ups may enter the market, and we may face increased competition from these sources.
12
Government Regulation
Data Privacy and Security Laws and Regulations
We are subject to data privacy and security regulation by both the United States federal government and states, as well as foreign countries, in which we conduct our business. The Health Insurance Portability and Accountability Act of 1996, as amended by the Health Information Technology for Economic and Clinical Health Act (HITECH), and their respective implementing regulations, including the Omnibus Final Rule published on January 25, 2013 (which we collectively refer to as “HIPAA”), imposes specified requirements relating to the privacy, security and transmission of individually identifiable health information. Violations of HIPAA may result in criminal and civil penalties, including fines, and could damage our reputation and harm our business.
HITECH also increased the civil and criminal penalties that may be imposed against covered entities, business associates and possibly other persons, and gave state Attorneys General new authority to file civil actions for damages or injunctions in federal courts to enforce the federal HIPAA laws and seek attorney’s fees and costs associated with pursuing federal civil actions. A violation can be measured by the number of individuals affected or the number of days per calendar year a covered entity or business associate is not in compliance, with each individual affected by a violation or each day not in compliance counting as a single violation. The penalty for identical violations during a calendar year may not exceed $1.5 million, but because a violation of each section of the Privacy or Security Rule is considered unique under the law, total penalties have in the past and could exceed many multiples of $1.5 million in the future. HITECH also significantly strengthened enforcement by requiring HHS to conduct periodic audits of covered entities and business associates to confirm compliance, which HHS is currently conducting, and authorizing states’ Attorneys General to bring civil actions seeking either injunctions or damages in response to violations of the HIPAA Privacy Rule and Security Rule that threaten the privacy of state residents. In addition, state laws govern the privacy and security of health and other personally identifiable information in certain circumstances, many of which differ from each other in significant ways, thus complicating compliance efforts.
Among other things, HITECH makes HIPAA’s privacy and security standards directly applicable to “business associates,” defined as independent contractors or agents of covered entities that create, receive, maintain or transmit protected health information in connection with providing a service for or on behalf of a covered entity. Under HIPAA and our contractual agreements with our clients, we are considered a “business associate” of our clients and thus are directly subject to HIPAA’s privacy and security standards. To provide our covered entity clients with services that involve the use or disclosure of protected health information, HIPAA requires our clients to enter into business associate agreements with us. Those agreements must, among other things, require us to:
|
· |
limit how we will use and disclose the protected health information; |
|
· |
implement reasonable administrative, physical and technical safeguards to protect information from misuse; |
|
· |
enter into similar agreements with our agents and subcontractors that have access to the information; |
|
· |
report security incidents, breaches and other inappropriate uses or disclosures of the information; and |
|
· |
assist our clients with certain of their duties under the applicable data privacy and security regulations. |
If we are unable to properly protect the privacy and security of health and other personally identifiable information entrusted to us, our operations may be perceived as not secure, we may incur significant liabilities and clients may curtail their use of, or stop using, our solutions. In addition, if we fail to comply with the terms of our business associate agreements with our clients, we are liable not only contractually, but also directly under HIPAA.
13
Other Healthcare Laws
In the United States, participants in the healthcare industry, including our clients, are required to comply with extensive and complex state and federal laws and regulations. Such laws include state and federal anti‑kickback, fraud and abuse, false claims, privacy and security and physician sunshine laws and regulations. Although many regulatory and governmental requirements do not directly apply to our business, our clients are required to comply with these laws, which in turn, may impact our business as a result of our contractual obligations.
We have attempted to structure our operations to comply with applicable legal requirements, but there can be no assurance that our operations will not be challenged or impacted by enforcement initiatives. If our operations are found to be in violation of any of such laws or any other governmental regulations that apply to us, we may be subject to penalties, including civil and criminal penalties, damages, fines, the curtailment or restructuring of our operations, exclusion from participation in federal and state healthcare programs and imprisonment of our directors or senior management, any of which could adversely affect our ability to operate our business and our financial results.
Healthcare Reform
In the United States, federal and state legislatures and agencies periodically consider legislative reforms that may contain proposals to increase governmental involvement in healthcare, lower reimbursement rates or otherwise change the environment in which healthcare industry participants operate. Our business could be affected by changes in healthcare laws, including the Affordable Care Act, which was enacted in March 2010. The Affordable Care Act is changing how healthcare services are covered, delivered and reimbursed through, among other things, expanded coverage of individuals, changes in Medicare program spending and insurance market reforms. While many of the provisions of the Affordable Care Act and other healthcare reform laws will not be directly applicable to us, they may affect the business of many of our clients, which may in turn affect the demand for our services. Although we are unable to predict or otherwise quantify the likely impact of the Affordable Care Act or other healthcare reform laws on our business model, financial condition or results of operations, negative changes in the business of our clients may negatively impact our business.
CMS
A significant portion of our revenues is attributable to providing services which assist clients with their compliance with regulations promulgated by CMS. With the passage of the Affordable Care Act in 2010, most healthcare providers are required, or will be required in the future, to participate in CAHPS programs. CAHPS programs were developed by CMS and produced the first nationally standardized instruments for collecting and reporting patients’ perspectives of care to enable comparisons across numerous provider sectors such as hospitals, home health agencies, physician practices, and dialysis providers. Hospital participation in the HCAHPS program is mandated by CMS, and hospitals risk losing a percentage of their annual payment update, or APU, if they fail to report CAHPS data for any calendar quarter. As the largest CAHPS data submitter in the United States, we are currently designated by CMS as a certified vendor to offer HCAHPS Surveys, HHCAHPS Surveys, ICH CAHPS Surveys, Hospice CAHPS Surveys, OAS CAHPS Surveys, ACO CAHPS Surveys and PQRS CAHPS Surveys, including related data collection and submission services. If we are unable to maintain our current certifications, or secure certifications for future CMS mandated surveys, we would not be able to administer these surveys on behalf of our clients.
Certain survey data collected and reported by us is used by CMS to determine, in part, the amount of reimbursement paid to hospitals, and any errors in data collection, survey sampling, or statistical reporting could result in reduced reimbursement to our hospital clients if we are unable to correct these errors, and this could, in turn, result in litigation against us. For example, hospitals subject to the IPPS annual payment update provisions must collect and submit HCAHPS data in order to receive their full IPPS annual payment. IPPS hospitals that fail to publicly report required quality measures, which include the HCAHPS data, may have their annual payment reduced by 25%. In addition, CMS publicly publishes the reported survey data and any errors could result in incorrect scoring of our hospital client, which may damage the hospital’s reputation and lead to litigation against us. We may be required to indemnify against such claims, and defending against any such claims could be costly, and time consuming.
14
Other Laws
Existing and new laws and regulations affecting the healthcare, information technology and Internet industries could create unexpected liabilities for us, cause us to incur additional costs, or restrict our operations. Many of the laws that affect us, particularly those applying to healthcare, are very complex and may be subject to varying interpretations by courts and other governmental authorities. Our failure, or the failure of our clients, to accurately anticipate the application of these laws and regulations, or the failure to comply, could create liability for us, result in adverse publicity and negatively affect our businesses.
Employees
As of December 31, 2015, we had 1,058 full‑time employees. None of our employees are represented by labor unions or subject to collective bargaining agreements. We consider our employee relations to be good.
Legal Proceedings
We are not currently party to any material legal proceedings.
Segment and Geographic Information
See Note 14 – Segment and Geographic Information in the Notes to Consolidated Financial Statements for information about our operating segment and our revenues and assets by geographic area.
15
Executive Officers of the Registrant
The following table sets forth the name and position of each of our executive officers and their age as of the date of this annual report:
|
Name |
Age |
Position |
|
Patrick T. Ryan |
57 |
Chief Executive Officer and Director |
|
Joseph Greskoviak |
51 |
President and Chief Operating Officer |
|
Breht T. Feigh |
49 |
Chief Financial Officer |
|
Patricia L. Riskind |
50 |
Chief Client Experience Officer |
|
Patricia Cmielewski |
46 |
Chief Marketing Officer and Chief of Staff |
|
Devin J. Anderson |
46 |
General Counsel and Corporate Secretary |
Patrick T. Ryan. Patrick T. Ryan has served as our Chief Executive Officer since February 2012 and has served on our Board of Directors since February 2012. Previously, Mr. Ryan served as the Chief Executive Officer of The Broadlane Group from 2008 until 2010, a healthcare cost management and supply chain organization. Mr. Ryan served as Chief Executive Officer of PolyMedica Corporation from 2004 until 2007, the parent company of Liberty Medical Supply, a direct‑to‑consumer provider of diabetes testing supplies and related services. Mr. Ryan has served as a director of Affiliated Managers Group, Inc. since 2007, and is a member of its audit, compensation and nominating committees, and is also a former member of the Massachusetts Hospital Association’s Committee on Governance. Mr. Ryan also served on the Boards of Trustees of the Beth Israel Deaconess Medical Center, Lahey Health and Atrius Health. Mr. Ryan earned a B.A. from the University of Rochester. Mr. Ryan’s experience in the healthcare industry and executive experience led to the conclusion that Mr. Ryan should serve as a director of the Company.
Joseph Greskoviak. Joseph Greskoviak has served as our President since September 2012 and our Chief Operating Officer since October 2013. Previously, Mr. Greskoviak served as our Chief Strategic and Sales Officer from June 2012 until September 2012. Before joining the Company, Mr. Greskoviak served as President of the MedAssets’ spend and clinical resource management business from 2010 until 2012, where he oversaw the acquisition of Broadlane by MedAssets. Prior to the acquisition, Mr. Greskoviak spent 12 years at Broadlane, serving in various management roles including Executive Vice President and Chief Development Officer. Mr. Greskoviak earned a B.A. from DePaul University.
Breht T. Feigh. Breht T. Feigh has served as our Chief Financial Officer since August 2015. Previously, Mr. Feigh served as the Executive Vice President and Chief Development Officer of American Dental Partners, Inc., a provider of practice management services to multidisciplinary dental groups, from January 2013 until July 2015, the Chief Financial Officer from 2001 until January 2013 and various other positions, including Vice President, Strategic Initiatives, from 1997 to 2001. Mr. Feigh earned a B.S., with highest distinction, from Indiana University and holds an M.Sc., with distinction, from the London School of Economics and Political Science.
Patricia L. Riskind. Patricia L. Riskind has served as our Chief Client Experience Officer since September 2013. Previously, Ms. Riskind served as our Senior Vice President of Client Services from August 2012 until September 2013 and as our Senior Vice President of Medical Sales from November 2009 until August 2012. Ms. Riskind founded PatientImpact LLC, a healthcare data and analytics e‑survey company that was acquired by Press Ganey in 2009. Prior to starting PatientImpact LLC, Ms. Riskind co‑founded 3d Health, Inc., an ambulatory strategy consulting firm. Ms. Riskind is the president of The Kellogg Graduate School’s Health Enterprise Management Alumni Club and a member of the American College of Healthcare Executives, the Health Information Management Systems Society, and the Society for Healthcare Strategy and Market Development. Ms. Riskind earned a B.A. from Brown University and an M.B.A. from the Kellogg School of Management at Northwestern University.
16
Patricia Cmielewski. Patricia Cmielewski has served as Chief Marketing Officer and Chief of Staff since March 2012. Prior to joining the Company, Ms. Cmielewski was the Senior Vice President of strategic marketing at Broadlane from July 2010 until April 2011. Ms. Cmielewski served as Senior Vice President of strategic marketing at Liberty Medical Supply from September 2005 until July 2009. Ms. Cmielewski received a B.A. in advertising from Penn State University and an M.B.A. from Boston University.
Devin J. Anderson. Devin J. Anderson has served as our General Counsel and Corporate Secretary since October 2012. Prior to joining the Company, Mr. Anderson served as the Chief Legal Officer of Medco International B.V., the international division of Medco Health Solutions, Inc., a pharmacy benefit manager and provider of pharmaceutical products and services, from 2010 until 2012. From 2008 until 2010, Mr. Anderson served as Chief Counsel of Medco’s wholly owned subsidiary, Liberty Healthcare Group. Prior to joining Medco, Mr. Anderson served as the Executive Vice President, General Counsel and Secretary of PolyMedica Corporation, the parent company of Liberty Medical Supply, a direct‑to‑consumer provider of diabetes testing supplies and related services. Mr. Anderson earned a B.A., with distinction, from the University of Maine and a J.D., magna cum laude, from Boston University School of Law.
Controlled Company
Vestar Capital Partners, LLC (“Vestar”) holds a majority of the voting power of our outstanding common stock and, as a result, we qualify as a “controlled company” within the meaning of the NYSE Listed Company Manual. As a controlled company, we are exempt from certain corporate governance requirements of the NYSE that would require:
|
· |
a majority of the board of directors to be “independent directors,” as defined under the rules of the NYSE; |
|
· |
a nominating and corporate governance committee comprised entirely of independent directors; and |
|
· |
a compensation committee comprised entirely of independent directors. |
In accordance with those exemptions, our Nominating and Corporate Governance Committee and Compensation Committee are not composed entirely of independent directors.
17
The risk factors set forth in this Item 1A should be read in conjunction with “Management’s Discussion and Analysis of Financial Condition and Results of Operations” and our consolidated financial statements and the related notes thereto included elsewhere in this annual report. The occurrence of any of the events or developments described below could harm our business, financial condition, results of operations and growth prospects and cause the market price of our common stock to decline.
Risks Related to Our Business
Because our clients are concentrated in the healthcare industry, our revenue and operating results may be adversely affected by changes in regulations, a business downturn or consolidation in the healthcare industry.
Substantially all of our revenue is derived from clients in the healthcare industry. As a result, our business, financial condition and results of operations are influenced by conditions affecting this industry, including changing political, economic, competitive and regulatory influences that may affect the procurement practices and operation of healthcare providers and payors. Third‑party payors, including government healthcare programs and large private purchasers of healthcare services, are continuing to implement cost‑ containment measures and placing increasing cost pressure on providers. Healthcare providers may react to these cost pressures and other uncertainties by curtailing or deferring purchases, including purchases of our products and solutions. Moreover, there has been consolidation of companies and providers in the healthcare industry, a trend which we believe will continue to grow. Consolidation in this industry, including the potential acquisition of certain of our clients, could adversely affect aggregate client budgets for our products and solutions or could result in the termination of a client’s relationship with us. When companies consolidate, overlapping services previously purchased separately are usually purchased only once by the combined company, leading to a loss of revenue by the service provider. Other services that were previously purchased by one of the companies may be curtailed or may be cancelled completely by the consolidated company. The impact of these developments on the healthcare industry is difficult to predict and could have an adverse effect on our revenue and a corresponding effect on our operating and net income.
In addition, there have been and continue to be a number of legislative initiatives to contain healthcare costs. For example, in March 2010, the Affordable Care Act was signed into law. The Affordable Care Act makes extensive changes to the current system of healthcare insurance and benefits that includes changes in Medicare and Medicaid payment policies and other healthcare delivery reforms aimed at improving quality and decreasing costs, comparative effectiveness research, and independent payment advisory boards, among other provisions. While we believe our business has been impacted positively by certain of these changes, these provisions could negatively impact our clients and cause them to curtail or defer spending, which could result in a decreased demand for our products and solutions.
Other legislative changes have also been proposed and adopted in the United States since the Affordable Care Act was enacted. On August 2, 2011, the Budget Control Act of 2011, among other things, created measures for spending reductions by the U.S. Congress. A Joint Select Committee on Deficit Reduction, tasked with recommending a targeted deficit reduction of at least $1.2 trillion for the years 2013 through 2021, was unable to reach required goals, thereby triggering the legislation’s automatic reduction to several government programs. This includes aggregate reductions of Medicare payments to providers of up to 2% per fiscal year, which went into effect in April 2013, due to subsequent legislation, and will remain in effect through 2025 unless additional U.S. Congressional action is taken. On January 2, 2013, the American Taxpayer Relief Act of 2012 was signed into law, which, among other things, further reduced Medicare payments to several providers, including many of our clients.
There can be no assurances that healthcare reform will not adversely impact either our operating results or the manner in which we operate our business. We expect that additional state and federal healthcare reform measures will be adopted in the future, any of which could limit the amounts that federal and state governments will pay for healthcare products and services. Any further reductions in spending by the federal or state governments could result in additional economic pressure on our clients and lead to reduced demand for our products and solutions or create additional pricing pressure.
18
If our clients do not continue to purchase our products and solutions, or we are unable to attract new clients, our business and operating results could be materially and adversely affected.
We generate substantially all of our revenue by selling our products and solutions to healthcare providers. Our operating results will depend, in part, on our ability to acquire new clients, to deliver a successful client experience and to maintain and grow our client relationships over time. If we are unsuccessful in marketing and selling our products and solutions or unable to deliver a positive client experience, our clients could terminate or fail to renew their agreements with us, which could have a material adverse effect on our business, financial condition and results of operations.
Our ability to attract and retain clients, and to generate revenue from our products and solutions, depends on a number of factors, including:
|
· |
the value proposition that we provide to our clients; |
|
· |
the strength of the healthcare industry; |
|
· |
the competition for our clients’ spend; and |
|
· |
the strength of our brand. |
Sales and marketing activities represent a significant portion of our total operating expenses and account for a significant portion of the costs that we incur in acquiring new clients and retaining existing clients. We expect that sales and marketing expenses will continue to increase in absolute dollars as we seek to expand our client base. If we are unable to increase the total number of our clients or unable to allocate a significant part of our resources to sales and marketing activities, our revenue may not grow and our operating results could be materially and adversely affected.
Our clients may not purchase our products and solutions or our clients may reduce their purchasing volumes if we do not demonstrate the value proposition for their investment, and we may not be able to replace existing clients with new clients. In addition, our clients may not renew their contracts with us on the same terms, or at all, because of dissatisfaction with our service. If our clients do not renew their contracts, or if we are unable to attract new clients, our business, financial position and results of operations could be materially and adversely affected.
The loss of several of our large clients or a significant reduction in business from such clients would adversely affect our operating results.
Our average annual revenue retention rate from 2013 to 2015 was approximately 95%, however we may not be able to maintain our existing client base and our historical revenue retention rate in the future. As the healthcare industry continues to undergo consolidation, some of our existing clients may merge with one another or be acquired by other organizations. We cannot assure you that any such future consolidation will not cause us to lose our existing clients or result in reduced demand for our services. In the future, we may also become more dependent on one client or a group of clients and a loss of several of our large clients or a significant reduction in business from such clients, regardless of the reason, may have a negative effect on our business, financial position and results of operations. As a result, we cannot assure you that we will maintain our existing client base, maintain or increase the level of revenue or profits generated by our existing clients, or be able to attract new clients.
We may not maintain our current rate of revenue growth.
We believe that our continued revenue growth will depend on, among other factors, our ability to:
|
· |
retain our existing clients; |
|
· |
attract new clients; |
19
|
· |
demonstrate to current and potential clients that our products and solutions provide a meaningful value proposition for their business; |
|
· |
provide our clients with superior user experiences; |
|
· |
successfully invest in growth opportunities; |
|
· |
continue to develop and diversify our product offerings and solutions for our clients; |
|
· |
react to changes in the healthcare industry, technology and challenges from our existing and future competitors. |
We may not be successful in our efforts to do any of the foregoing, and any failure to be successful in these matters could materially and adversely affect our revenue growth. You should not consider our past revenue growth, which was driven in part by our recent strategic acquisitions and capital investments, to be indicative of our future performance. If our growth rates were to decline significantly or become negative, it could adversely affect our financial condition and results of operations.
We may be unable to effectively execute our growth strategy which could have an adverse effect on our business and competitive position in the industry.
Our business strategy includes increasing our market share and presence through sales to new and existing clients by enhancing engagement of our products and solutions, introducing new products and solutions and maintaining strong relationships with our existing clients. Some of the risks that we may encounter in executing our growth strategy include:
|
· |
expenses, delays and difficulties of identifying and developing new products or solutions and integrating such new products or solutions into our existing suite of solutions; |
|
· |
inability to generate sufficient revenue from new products and solutions to offset investment costs; |
|
· |
inability to effectively identify, manage and exploit existing market opportunities; |
|
· |
inability to retain and grow our client base and increase our clients’ utilization of, and spending on, our products and solutions; |
|
· |
inability to recruit, train and retain skilled and experienced personnel who can demonstrate our value proposition to our clients; |
|
· |
increased competition from new and existing competitors; |
|
· |
lengthy sales cycles, or clients delaying purchasing decisions due to economic conditions; |
|
· |
reduced spending within the healthcare industry; and |
|
· |
failure of our market to grow at the expected rate or reach a certain size. |
If any of these risks are realized, our business, and our competitive position in the industry, could suffer.
20
We have recently experienced, and expect to continue to experience, significant growth, which has placed, and will continue to place, significant demands on our management and our operational and financial infrastructure. We expect that our growth strategy will require us to commit substantial financial, operational and technical resources, and we expect that our sales and marketing costs will continue to increase in the near term. As our operations grow in size, scope and complexity, we will need to scale our systems and infrastructure accordingly and may determine that we need to open additional offices and make other capital investments, which will require significant expenditures and put further pressure on our management resources. If we fail to maintain the necessary level of discipline and efficiency, or if we fail to allocate limited resources effectively within our organization as it grows, our business, financial condition and results of operations may suffer.
We may not be able to develop new products and solutions, or enhancements to our existing products and solutions, or be able to achieve widespread acceptance of new products or solutions.
Our identification of new products, solutions and features that may be useful to our clients may not result in timely or commercially successful development of such products, solutions and features. In addition, the success of certain new products and solutions may be dependent on continued growth in our client base and we are not able to accurately predict the volume or speed with which existing and new clients will adopt such new products and solutions. Because the healthcare industry continues to change and evolve, we may be unable to accurately predict and develop new products, solutions and features to address the needs of our existing and potential clients. Our failure to release new products, solutions and/or enhancements that demonstrate to such clients that we are able to provide a meaningful value proposition for their business could result in loss of revenue, reduce our ability to meet our contractual obligations and be detrimental to our business and reputation.
When we develop new products and solutions, we typically incur expenses and expend resources upfront to market, promote and sell the new offering. Therefore, these new products and solutions must achieve high levels of market acceptance in order to justify the amount of our investment in developing and bringing them to market. If our new products, solutions or features are not accepted or are not utilized by our existing or potential clients, we may not be able to recover the cost associated with the development of such products, solutions or features, which could have a material adverse effect on our financial and operating performance. Continued growth of our client base is dependent on our ability to provide relevant products and solutions in a timely and effective manner. The success of our business will depend on our ability to continue providing our products and solutions as well as enhancing our product offerings and solutions to effectively address the needs of healthcare providers across the continuum of care.
Technological developments could render our products and solutions obsolete or uncompetitive.
The technologies supporting the industries we serve and our platforms for delivering our solutions to our clients are susceptible to rapid changes and in order to be competitive we must consistently develop cost effective technologies for secure and reliable data collection and analysis. We may not be able to develop new technologies, update our existing technologies or adapt to the changing technological landscape as necessary for our business, or we may not do so as quickly or cost effectively as our competition.
We may be unable to effectively identify, complete or integrate the operations of future acquisitions, joint ventures, collaborative arrangements or other growth investments.
As part of our growth strategy, we have completed nine acquisitions over the last six years and we actively review possible acquisitions, joint ventures, collaborative arrangements or growth investments that complement or enhance our business. There can be no assurance that our growth strategy or investment plans will be successful or will produce a sufficient or any return on our investments. Further, we may not be able to identify, complete or integrate the operations of future acquisitions, joint ventures, collaborative arrangements or other growth investments. In addition, if we finance acquisitions, joint ventures, collaborative arrangements or other growth initiatives by issuing equity securities, our existing stockholders may be diluted, which could affect the market price of our common stock. As a result, if we fail to properly evaluate and execute acquisitions and investments, our business prospects may be seriously
21
harmed. Some of the risks that we may encounter in implementing our acquisition, joint venture, collaborative arrangement or growth investment strategies include:
|
· |
expenses, delays or difficulties in identifying and integrating acquired companies or joint venture operations, collaborative arrangements or other growth investments into our company; |
|
· |
expenses associated with entry into markets or care settings in which we have little or no prior experience; |
|
· |
inability to retain personnel after future acquisitions; |
|
· |
diversion of management’s attention from other initiatives and/or day‑to‑day operations to effectively execute our growth strategy; and |
|
· |
inability to generate sufficient revenue, profit and cash flow from acquisitions, joint ventures, collaborative arrangements or other growth investments to offset our investment costs. |
Any of these risks could harm our business, financial position and operating results. In addition, for legal, technical or business reasons, we may not be able to successfully assimilate and integrate the business, technologies, solutions, personnel or operations of any company we acquire as quickly or fully as we would like. The integration of any acquired company may require, among other things, coordination of administrative, sales and marketing, accounting and finance functions, harmonization of legal and privacy policies and expansion of information and management systems on account of our new operations. Moreover, the anticipated benefits of any acquisition, investment or business relationship may not be realized or we may be exposed to unknown liabilities.
We cannot assure you that we will be able to manage our growth effectively, which could have a material adverse effect on our business, financial condition, results of operations and growth prospects.
If we are successful in expanding our client base and growing our business, our existing operations may not be as scalable as we anticipate, and we may need to expend significant resources to enhance our information technology infrastructure, financial and accounting systems and controls, and also hire a significant number of qualified client support personnel, professional services personnel, software engineers, technical personnel, and management personnel in order to provide services to existing and new clients. As a result, our operating expenses may increase more than expected, which could adversely affect business, financial condition and results or operations. In addition, identifying and recruiting qualified personnel and training them requires significant time and expense and our business may be adversely affected if our efforts to expand and train qualified personnel do not generate a corresponding increase in revenues. If our existing operations are not as scalable as we anticipate or if we are unable to manage our growth effectively, the quality of our products and solutions and our reputation may suffer, which could adversely affect our business, financial condition, results of operations and growth prospects.
We operate in an increasingly competitive market, which could adversely affect our revenue and market share.
Our future growth and success will depend on our ability to successfully compete with other companies that provide similar services in the same or related care settings, some of which may have financial, marketing, technical and other advantages. We also expect that competition will continue to increase as a result of consolidation in both the information technology and healthcare industries. If one or more of our competitors or potential competitors were to merge or partner with one another, it could adversely affect our ability to compete effectively and reduce our market share. In addition, the anticipated growth in healthcare spending, the shift to value‑based payment models, the rise of consumerism and changes in government regulation may draw increasing attention to healthcare data and analytics, and new competitors, such as consultants, technology companies and start‑ups may enter the market, and we may face increasing competition from these sources.
The ability of our clients or other competitors to replicate our products and solutions could adversely affect the terms and conditions we are able to negotiate in our contracts. We are competing with other companies to be the first to deliver timely, scientific and prospective analytics that integrate operational, safety, financial and clinical data, and any
22
company that introduces new products in any of these areas will be at a distinct competitive advantage. In addition, some of our products and solutions allow healthcare providers to outsource business processes that have been or could be performed internally. Therefore, we must ensure that our products and solutions are more efficient and economical than our client’s internal operations.
If for any reason we experience increased competition in our market, it could result in greater pricing pressure, an increase in our marketing expenditures or market share losses, which could adversely affect our business, financial condition and results of operations. There can be no assurance that we will continue to compete successfully against existing or new competitors.
If we fail to promote and maintain awareness of our brand in a cost‑effective manner, our business might suffer.
Promoting and maintaining awareness of our brand in a cost‑effective manner is critical to continuing the widespread acceptance of Press Ganey as a thought leader in the industry and is an important element in attracting and retaining clients and qualified employees. The importance of brand recognition is likely to increase as competition in our market increases. Successful promotion of our brand will depend largely on the effectiveness of our marketing efforts and on our ability to provide reliable and useful products and solutions at competitive prices. Our efforts to build and maintain our brand nationally have involved and will continue to involve significant expense. Brand promotion activities may not yield increased revenue, and even if they do, any increased revenue may not offset the expenses we incur in promoting and maintaining our brand. In addition, third parties’ use of trademarks or branding similar to ours could materially harm our business or result in litigation and other costs. If we fail to successfully promote and maintain our brand, or incur substantial expenses in an unsuccessful attempt to promote and maintain our brand, we may fail to attract enough new clients or retain our existing clients to the extent necessary to realize a sufficient return on our brand‑building efforts, which could adversely affect our business and our ability to attract and retain qualified employees.
We may not be able to maintain our certification to conduct CMS mandated surveys, and this could adversely affect our business.
A significant portion of our revenues from survey product offerings is attributable to providing survey services to assist clients in their compliance with regulations promulgated by CMS. As the largest CAHPS data submitter in the United States, we are currently designated by CMS as a certified vendor to offer HCAHPS Surveys, HH CAHPS Surveys, ICH CAHPS Surveys, Hospice CAHPS Surveys, OAS CAHPS Surveys, ACO CAHPS Surveys and PQRS CAHPS Surveys, including related data collection and submission services. If we are unable to maintain these certifications, or secure certifications for future CMS mandated surveys, we would not be able to administer these surveys on behalf of our clients. The failure to maintain our status as a certified vendor would adversely affect our business, financial condition and results of operations.
We depend on our senior management, and we may be materially harmed if we lose any member of our senior management.
We are dependent upon the services of our senior management team. The loss of service of any member of our senior management could materially harm our business. The employment agreements we have entered into with certain members of our senior management, including our chief executive officer, Patrick T. Ryan, are terminable at will and, therefore, we may not be able to retain their services as expected. Additionally, we do not maintain any “key‑man” life insurance policies on the lives of our executives or any of our employees. This lack of insurance means that we may not have adequate compensation for the loss of the services of these individuals. Our future performance will depend, in part, on our ability to successfully integrate newly hired executive officers into our management team and our ability to develop an effective working relationship among senior management. The loss of key management personnel or our inability to attract and retain qualified management personnel could have a material, adverse effect our financial and operating performance. A decision by any of these individuals to leave our company, compete with us or reduce their involvement in our business could have a material adverse effect on our business.
23
Our business will suffer if we fail to attract, retain and motivate highly‑skilled employees.
Our ability to successfully execute our business plan depends upon our ability to attract, retain and motivate highly‑skilled employees. As we expand our business, we will need to hire additional personnel to support our information technology, product development and sales and marketing operations. We may not be able to attract or retain highly‑skilled employees in the future due to the intense competition for qualified personnel within our industry. If we are not able to attract, retain and motivate necessary personnel to accomplish our business objectives, we may experience constraints that will significantly impede our development objectives and our ability to implement our business strategy. Failure to attract new personnel as needed and retain and motivate our current personnel could have a material adverse effect on our business.
Government regulation may subject us to liability or require us to change the way we do business.
The laws and regulations that govern our business change rapidly. Evolving areas of law that are relevant to our business include privacy and security laws, encryption laws, content regulation, information security accountability regulation, consumer protection laws and regulations that may govern the manner in which we contact patients of our clients, sales and use tax laws and regulations and attempts to regulate activities on the Internet. In addition to being directly subject to certain requirements of the Health Insurance Portability and Accountability Act of 1996, as amended by the Health Information Technology for Economic and Clinical Health Act of 2009, or HITECH, implementing regulations promulgated by the U.S. Department of Health and Human Services, or “HHS,” including what are referred to as the “Privacy Rule” and the “Security Rule” (collectively, “HIPAA”), we are required through contracts with our clients to protect the privacy and security of certain personnel and health related information. The rapidly evolving and uncertain regulatory environment could require us to change how we do business or incur additional costs. Changes in these laws may limit our data access, use and disclosure and may require increased expenditures by us or may dictate that we not offer certain types of products or solutions. Failure to comply with applicable laws and regulations could subject us to civil and criminal penalties, subject us to contractual penalties, including termination of our client agreements, damage our reputation and have a detrimental impact on our business. The occurrence of any of the foregoing could impact our ability to provide the same level of service and solutions to our clients, force us to modify our product offerings and solutions or increase our costs, which could materially and adversely affect our business financial condition and results of operations.
If we fail to comply with current or future laws or regulations governing the collection, dissemination, use and confidentiality of personally identifiable information, including patient health information, our business could suffer.
The privacy and security of personally identifiable information, also known as personal data, collected, stored, maintained, received or transmitted electronically is a major issue in our industry. While we strive to comply with all applicable privacy and security laws and regulations, as well as our own posted privacy policies and industry best practices, such laws, regulations and related legal standards for privacy and security continue to evolve and any failure or perceived failure to comply with applicable laws, regulations and standards may result in threatened or actual proceedings, actions and public statements against us by government entities, private parties, consumer advocacy groups or others, or could cause us to lose clients, which could have a material adverse effect on our business, financial condition and results of operations.
Recently, there has been an increase in public awareness of privacy issues in the wake of revelations about data security breaches suffered by well‑known companies and institutions and the activities of various government agencies and lawsuits filed in response to these breaches. Concerns about our practices with regard to the collection, use, disclosure or security of personally identifiable information or other privacy‑related matters, even if unfounded and even if we are in compliance with applicable laws, could damage our reputation and harm our business. In addition, we may incur significant costs in monitoring and complying with the multitude of evolving laws and regulations relating to privacy and security, the scope of which is changing and subject to differing interpretations. We cannot provide assurances with regard to how governmental regulation and other legal obligations related to privacy and security will be interpreted, enforced or applied to our operations.
24
Patients enter personal data about themselves or their family members when completing our surveys, which may reveal health‑related information or other personal information. Numerous federal, state and foreign laws and regulations govern collection, dissemination, use and confidentiality of personally identifiable health information, including:
|
· |
state privacy and confidentiality laws (including state laws requiring the disclosure of breaches); |
|
· |
Medicaid and Medicare laws; |
|
· |
HIPAA; and |
|
· |
CMS standards for electronic transmission of health data. |
HIPAA establishes a set of national privacy and security standards for the protection of individually identifiable health information, including what is known as protected health information, by health plans, healthcare clearinghouses and healthcare providers, or “covered entities,” and their “business associates,” which are persons or entities that perform certain services for, or on behalf of, a covered entity that involve the use or disclosure of protected health information. We are subject to HIPAA as a business associate of covered entities. In addition to imposing privacy and security requirements, HIPAA also creates obligations for us to report certain unauthorized use or disclosures of unsecured protected health information, known as a “breach,” to our covered entity clients. The 2013 final HITECH rule, known as the Omnibus Final Rule, promulgated by HHS, modified the breach reporting standard in a manner that made more data security incidents qualify as reportable breaches. Violations of HIPAA may result in criminal and civil penalties, including fines, and could damage our reputation and harm our business. HITECH increased civil penalty amounts for violations of HIPAA, resulting in resolution amounts trending upward in recent years and possible maximum civil money penalties of $50,000 per violation of the Privacy and Security Rule. A violation can be measured by the number of individuals affected or the number of days per calendar year a covered entity or business associate is not in compliance, with each individual affected by a violation or each day not in compliance counting as a single violation. The penalty for identical violations during a calendar year may not exceed $1.5 million, but because each violation of each section of the Privacy or Security Rule is considered unique under the law, total penalties have in the past exceeded and in the future could exceed many multiples of $1.5 million. HITECH also significantly strengthened enforcement by requiring HHS to conduct periodic audits to confirm compliance and authorizing state Attorneys General to bring civil actions seeking either injunctions or damages in response to violations of the HIPAA Privacy Rule and Security Rule that threaten the privacy of state residents.
Among other things, HITECH makes certain portions of the HIPAA Privacy Rule and Security Rule directly applicable to “business associates.” Under HIPAA and our contractual agreements with our clients, we are considered a “business associate” to our clients and thus are directly subject to HIPAA. To provide our covered entity clients with services that involve the use or disclosure of protected health information, HIPAA requires us to enter into business associate agreements with our clients. Those agreements must, among other things, require us to:
|
· |
limit how we will use and disclose the protected health information; |
|
· |
implement reasonable administrative, physical and technical safeguards to protect information from misuse; |
|
· |
enter into similar agreements with our agents and subcontractors that have access to the information; |
|
· |
report security incidents, breaches and other inappropriate uses or disclosures of the information; and |
|
· |
assist the client in question with certain of its duties under the HIPAA Privacy Rule and Security Rule. |
If we are unable to properly protect the privacy and security of health information entrusted to us, our solutions may be perceived as not secure, we may incur significant liabilities and clients may curtail their use of or stop using our
25
solutions. In addition, if we fail to comply with the terms of our business associate agreements with our clients, we are liable not only contractually, but also directly under HIPAA. We cannot assure you that we will comply with all of the provisions of HIPAA that are applicable to our business, or that we will be able to address all of the risks that HIPAA creates for our clients. In addition, we are unable to predict how these standards might change or be enforced in the future or how those changes, or other changes in applicable laws and regulations, could affect our business and our clients’ businesses.
In addition, a state’s Attorney General can bring civil or criminal actions against a person subject to HIPAA on behalf of residents adversely affected by violations of HIPAA. A state’s Attorney General can either seek to enjoin further violations or obtain monetary damages on behalf of the residents harmed. HHS is also currently performing audits of covered entities and business associates to ensure that policies required under HIPAA are in place. Additionally, several state civil lawsuits have found companies liable for negligence, recklessness, or other civil torts where the court has found that the company failed to comply with HIPAA. If we fail to comply with any or all of our obligations under HIPAA, we may face civil or criminal liability. Finally, individuals harmed by violations will be able to recover a percentage of monetary penalties or a monetary settlement based upon methods established by HHS. In addition, future laws or changes to current laws may necessitate costly adaptations to our operating systems and the conduct of our business generally. As part of our operations, we have access to, collect, process, transfer or maintain information covered under HIPAA. Our security measures may not be successful in protecting such data, which could expose us to liability under HIPAA. Such liability could result in fines or other sanctions and/or negative publicity, which could have an adverse effect on our reputation, operating results and business.
Data security and integrity are critically important to our business, and actual or attempted breaches of security, unauthorized disclosure of information, denial of service attacks or the perception that personal and/or other sensitive or confidential information in our possession is not secure, could result in a material loss of business, substantial legal liability or significant harm to our reputation.
We receive, collect, process, use and store a large amount of information from our survey respondents and clients and our own employees, including personally identifiable, protected health and other sensitive and confidential information. This data is often accessed by us and our clients through transmissions over public and private networks, including the Internet. The secure transmission of such information over the Internet and other mechanisms is essential to maintain confidence in our IT systems. We have implemented security measures, technical controls and contractual precautions designed to identify, detect and prevent unauthorized access, alteration, use or disclosure of our and our clients’ and employees’ data. However, there is no guarantee that these measures can provide absolute security. Beyond external criminal activity, systems that access or control access to our services and databases may be compromised as a result of human error, fraud or malice on the part of employees or third parties, or may result from accidental technological failure. Because the techniques used to obtain unauthorized access, disable service or sabotage systems change frequently, may originate from less regulated and remote areas around the world and generally are not recognized until launched against us, we may be unable to proactively address these techniques or to implement adequate preventative measures.
If someone is able to circumvent or breach our security systems, they could steal any information located therein or cause interruptions to our operations. Security breaches or attempts thereof could also damage our reputation and expose us to a risk of monetary loss and/or litigation, fines and sanctions. We also face risks associated with security breaches affecting third parties that conduct business with us or our clients and others who interact with our data. While we maintain insurance that covers certain security and privacy breaches, we may not carry appropriate insurance or maintain sufficient coverage to compensate for all potential liability.
We are subject to diverse laws and regulations mandating that affected individuals are notified if their information is accessed or acquired by unauthorized persons. Complying with these numerous and complex regulations in the event of a security breach would be expensive and difficult, and failure to comply with these regulations could result in regulatory scrutiny, fines and civil liability. In addition, any security breach or attempt thereof could result in liability for stolen assets or information, additional costs associated with repairing any system damage, incentives offered to clients or other business partners to maintain business relationships after a breach, and implementation of measures to
26
prevent future breaches, including organizational changes, deployment of additional personnel and protection technologies, employee training and engagement of third‑party experts and consultants.
We cannot assure you that any of our third‑party service providers with access to our or our clients and/or employees’ personally identifiable and other sensitive or confidential information will maintain appropriate policies and practices regarding data privacy and security in compliance with all applicable laws or that they will not experience data security breaches or attempts thereof, which could have a corresponding effect on our business. For example, we outsource certain aspects of the storage and transmission of survey data and client information to third parties. While we attempt to address the associated risks by requiring all such third‑party providers with data access to sign agreements, including business associate agreements, if necessary, obligating them to take security measures to protect such data, we cannot assure you that these contractual measures and our own privacy and security‑related safeguards will protect us from the risks associated with the third‑party storage and transmission of such information.
We face several risks relating to our ability to collect and use the data on which our business relies.
Our ability to provide timely and accurate patient experience measurements and improvement solutions to our clients depends on our ability to collect large quantities of high‑quality data through surveys. We believe that we currently have the rights necessary to collect and use the data that we incorporate into our products and solutions. In the future, data providers could seek to withdraw their data from us, legislation could be passed restricting the use of this data or we could be otherwise restricted in collecting and using the data that are incorporated into our products and solutions. In addition, if receptivity to our survey methods by respondents declines, or, for some other reason, their willingness to complete and return surveys declines, or if we cannot rely on the integrity of the data we receive, our revenue could be adversely affected with a corresponding effect on our business, financial condition and results of operations.
Our business and operating results could be adversely affected if we experience business interruptions, errors or failure in connection with our or third‑party information technology and communication systems and other software and hardware products used in connection with our business.
Our ability to provide timely and accurate patient experience measurements and improvement solutions to our clients depends on the efficient and uninterrupted operation of our information technology and communication systems and other software and hardware used in connection with our business and those of our external service providers (whose products and services are not within our control, making it more difficult for us to correct any defects). Despite any precautions we may take, our systems, software and hardware and those of our external service providers could be exposed to damage or interruption from circumstances beyond our or their control, such as fire, natural disasters, systems failures, power outages, cyber‑attacks, terrorism, energy loss, telecommunications failure, security breaches and attempts thereof and computer viruses. An operational error, delay, failure or outage in our information technology and communication systems, software and hardware or those of our external service providers could result in loss of clients, damage to client relationships, reduced revenue and profits, refunds of client charges and damage to our reputation, and may result in additional expense to repair or replace damaged equipment and remedy data loss or corruption resulting from the interruption. Our preventative measures and backup systems and procedures may not prevent an interruption of services and our disaster recovery planning may not be adequate or account for all contingencies. Additionally, our insurance may not adequately compensate us for all losses or failures that may occur. The occurrence of any one of the above events could have a material adverse effect on our business, financial condition, results of operations and reputation.
We may be liable to our clients and may lose clients if we are unable to collect and maintain client data or if we lose client data.
We collect and manage a large amount of data for our clients and other third parties. Increasingly, we are relying on technology to help us organize, sort and analyze this data. Any material hardware failures or errors in our programs or systems could result in data loss or data corruption or cause the information that we collect to be incomplete or incorrect. Furthermore, our ability to collect and report data may be interrupted or limited by a number of factors, including network failures, software errors or problems with third‑party suppliers. In addition, computer viruses may
27
harm our systems, causing us to lose data, and the transmission of computer viruses from our systems to our clients’ or other third parties’ systems could expose us to litigation and related liabilities and costs. If we supply inaccurate information or experience interruptions in our ability to capture, store, supply, utilize, and report information, our reputation could be harmed and we could lose existing clients and experience difficulties in attracting new clients.
Protection of our intellectual property may be difficult and costly, and our inability to protect our intellectual property could reduce the value of our products and solutions.
We strive to protect our intellectual property rights, including trade secrets, by relying on United States and worldwide federal, state and common law rights, as well as contractual restrictions with our employees, contractors, clients, vendors and other third parties. However, effective intellectual property protection is expensive to obtain, develop and maintain, both in terms of initial and ongoing registration or prosecution requirements and expenses and the costs of defending our rights. We may not be able to successfully secure the intellectual property registrations that we apply for worldwide. Similarly, our existing intellectual property rights and related registrations may be challenged in the future and could be opposed, invalidated, canceled or narrowed by a third party. In the future, litigation may be necessary to enforce our intellectual property rights or to determine the validity and scope of the patents, intellectual property or other proprietary rights of third parties, which could be time consuming and costly and have an adverse effect on our business and financial condition.
Despite our efforts to protect our intellectual property rights, our business could be harmed if unauthorized parties infringe upon or misappropriate our intellectual property, proprietary systems, content, platform, services or other information. Additionally, our existing confidentiality and/or invention assignment agreements with employees, contractors and others who participate in development activities could be breached, or we may not enter into sufficient and adequate agreements with such individuals in the first instance, in either case potentially resulting in the unauthorized use or disclosure of our trade secrets and other intellectual property rights. Individuals not subject to invention assignment agreements may make adverse ownership claims to our current and future intellectual property. Our trade secrets and other intellectual property could also be independently developed by competitors without liability to us. Additionally, our competitors may develop similar intellectual property, duplicate our products and/or solutions or design around any patents or other intellectual property rights we hold. We may not have adequate remedies for such breaches, uses or disclosures, or protections against such competitor developments, all of which may adversely affect our business.
In addition, the laws of some foreign countries do not protect our proprietary rights to the same extent as the laws of the United States, and effective intellectual property protection and mechanisms for the enforcement of same may not be available in those jurisdictions. We may need to expend additional resources to defend our intellectual property in these countries, and the inability to defend the same could impair our brand or adversely affect the growth of our business internationally.
We may be liable for infringing the intellectual property rights of others.
We cannot assure you that we are not infringing or violating, and have not infringed or violated, any third‑party intellectual property rights, or that we will not be accused of doing so in the future. Intellectual property infringement claims could be made against us, especially as the number of our competitors grows. These claims, even if not meritorious, could be expensive, time‑consuming, cause product release delays and divert our attention from operating our company and result in a temporary or permanent inability to use the intellectual property subject to such claim. In addition, if we and/or our affiliates and clients become liable to third parties for infringing their intellectual property rights, we could be required to pay a substantial damage award and develop comparable non‑infringing intellectual property, to obtain a license or to cease providing the products or solutions that contain the infringing intellectual property. We may be unable to develop non‑infringing intellectual property or obtain a license on commercially reasonable terms, if at all.
28
Our overall business, financial condition or operating results may be materially and adversely impacted by an economic downturn.
Our business could be significantly affected by general economic conditions. The U.S. and global economies have recovered from a significant prolonged downturn but prospects for sustained economic recovery remain uncertain. Certain economic metrics have not recovered to pre‑2008 levels when the U.S. economy was significantly weakened by a financial crisis. Additionally, in October 2013, the U.S. federal government shutdown caused uncertainty in the federal government’s ability to meet its debt payments. A future U.S. government shutdown may occur and any resulting failure of the United States to meet its debt obligations, or the perceived risk of such a failure, could have a material adverse effect on the financial markets and economic conditions in the United States and throughout the world. To the extent that economic conditions remain uncertain, our business, financial condition and operating results could be significantly and adversely affected. For example, clients may delay or decrease spending with us or may not pay us.
We may experience errors in our software products that administer and report on hospital performance and inaccuracies in the solutions that we deliver to our clients. Any such errors or inaccuracies could result in action taken against us that could have an adverse effect on our reputation and business and expose us to liability.
Certain survey data collected and reported by us is used by CMS to determine, in part, the amount of reimbursement paid to hospitals, and any errors in data collection, survey sampling, or statistical reporting could result in reduced reimbursement to our hospital clients if we are unable to correct these errors, and this could, in turn, result in litigation against us. For example, hospitals subject to the Medicare IPPS annual payment update provisions must collect and submit HCAHPS data in order to receive their full IPPS annual payment. IPPS hospitals that fail to publicly report required quality measures, which include the HCAHPS data, may have their annual payment reduced by 2.0%. In addition, CMS publicly publishes the reported survey data and any errors could result in incorrect scoring of our hospital client, which may damage the hospital’s reputation and lead to litigation against us. We may be required to indemnify against such claims, and defending against any such claims could be costly, time consuming and could negatively affect our business.
In addition, many of the solutions that we deliver to our clients are analytically and technologically complex. Errors or inaccuracies in these solutions could materially adversely impact the ability of our clients to improve the patient experience and their operational and financial performance. In the event of errors or inaccuracies, our clients may seek compensation from us or may seek to terminate their agreements with us, withhold payments due to us, seek refunds from us of part or all of the fees charged under our agreements or initiate litigation or other dispute resolution procedures.
Failure to offer high‑quality technical support services may materially and adversely affect our relationships with our clients and harm our financial results.
Our clients depend on our support services to resolve any technical issues relating to our solutions. In addition, our sales are highly dependent on the quality of our products and solutions, our business reputation and strong recommendations from our existing clients. Failure to maintain high‑quality and highly responsive technical support, or a market perception that we do not maintain high‑quality and highly responsive support, could harm our reputation, adversely affect our ability to sell our offerings to existing and prospective clients and harm our business, operating results and financial condition.
We offer technical support services with our products and solutions and may be unable to respond quickly enough to accommodate short‑term increases in client demand for support services. It is difficult to predict client demand for technical support services and if client demand increases significantly, we may be unable to provide satisfactory support services to our clients and their employees. Additionally, increased client demand for these services, without corresponding increases in revenue, could increase our expenses and materially and adversely affect our operating results.
29
If our clients who operate as not‑for‑profit entities lose their tax‑exempt status, those clients would suffer significant adverse tax consequences which, in turn, could adversely affect their ability to purchase products or solutions from us.
State tax authorities have challenged the tax‑exempt status of hospitals and other healthcare facilities claiming such status on the basis that they are operating as charitable and/or religious organizations. The outcome of these cases has been mixed with some facilities retaining their tax‑exempt status and others being denied the ability to continue operating as not‑for‑ profit, tax‑exempt entities under state law. In addition, many states have removed sales tax exemptions previously available to not‑for‑profit entities, and both the Internal Revenue Service and the U.S. Congress are investigating the practices of not‑for‑profit hospitals. Those facilities denied tax exemptions could be subject to the imposition of tax penalties and assessments which could have a material adverse impact on their cash flow, financial strength, and, in some cases, continuing viability. If the tax‑exempt status of any of our clients is revoked or compromised by new legislation or interpretation of existing legislation, that client’s financial health could be adversely affected, which could negatively affect our sales to those clients.
Near‑term declines in revenues from new or renewed contracts with existing clients may not be reflected immediately in our operating results and may be difficult to discern.
Maintaining our high revenue retention rate depends on us renewing contracts with our clients, while the amount of recurring revenues from new or renewed contracts with existing clients depends on their expected spending on our products and solutions compared to their spending during previous periods. A decline in new or renewed contracts and revenues from such contracts in any one quarter may not be fully reflected in our revenue retention rate for that period or our revenue for that period. Such declines, however, could negatively affect our revenue in future periods and the effect of significant downturns in sales of, and market demand for, our products and solutions, and potential changes in our rate of renewals or renewal terms, may not be fully reflected in our results of operations until future periods. Our sales model also makes it difficult for us to rapidly increase our total revenue through additional sales in any period, as revenue from new clients must be recognized ratably over the applicable term of the contracts, which are typically 12 months. Accordingly, the effect of changes in the industry that impact our business or changes we experience in our new sales may not be reflected in our short‑term results of operations.
We have significant goodwill and identifiable intangible assets recorded on our balance sheet that may be subject to impairment losses that would materially reduce our reported assets and earnings.
As of December 31, 2015, our balance sheet included goodwill of $410.8 million and identifiable intangible assets of $362.8 million, which represented 43.9% and 38.8% of our total assets as of such date, respectively. We are required to annually test goodwill and identifiable intangible assets for impairment. Additionally, impairment of such assets must be tested whenever events or changes in circumstances indicate that impairment may have occurred, and we cannot predict accurately the timing of any impairment of assets. If the testing performed indicates that impairment has occurred, we are required to record a non‑cash impairment charge for the difference between the carrying value of the asset and the implied fair value of the asset in the period the determination is made. There are inherent uncertainties in the estimates, judgments and assumptions used in assessing differences between the carrying values of goodwill and intangible assets and their implied fair value. Economic, legal, regulatory, competitive, reputational, contractual, and other factors could result in future declines in the operating results of our business or market value declines that do not support the carrying value of goodwill and identifiable intangible assets. For example, a significant decline in the demand for one of our product offerings could impact the fair value of the related intangible asset, which in turn could result in an impairment. Any impairment in the value of our goodwill and/or intangible assets would result in a reduction in our reported assets and earnings for the period in which an impairment is recognized, and any such reduction could be material.
30
If we are required to collect and pay back taxes on our product offerings and solutions, or if any such taxes are imposed, we may incur unplanned expenses and experience a decrease in our future sales.
We may become subject to sales and use taxes and related interest and penalties for past sales in states where we believe no compliance is necessary. If we are required to collect and pay back taxes and the associated interest and penalties, and if our clients fail or refuse to reimburse us for all or a portion of these amounts, we will incur unplanned expenses that may be substantial. Moreover, the imposition of any such taxes on our product offerings and solutions will effectively increase the cost of such offerings and solutions to our clients and may adversely affect our ability to retain existing clients or to gain new clients in the states in which such taxes are imposed.
Risks Related to Our Indebtedness
The agreements governing our 2015 Credit Agreement impose significant operating and financial restrictions on our company and our subsidiaries, which may prevent us from capitalizing on business opportunities, and we have pledged substantially all of our assets to secure indebtedness under our 2015 Credit Agreement.
Our 2015 Credit Agreement (as defined herein) imposes significant operating and financial restrictions on us and our subsidiaries. These restrictions limit our and our subsidiaries’ ability, among other things, to:
|
· |
incur additional indebtedness or guarantee indebtedness; |
|
· |
pay certain dividends or make certain distributions on our capital stock or repurchase our capital stock; |
|
· |
prepay certain junior indebtedness; |
|
· |
create liens; |
|
· |
make certain investments, including certain acquisitions; |
|
· |
place restrictions on the ability of subsidiaries to pay dividends or make other payments to Press Ganey; |
|
· |
engage in transactions with equity holders or other affiliates; |
|
· |
sell assets; |
|
· |
consolidate or merge with or into other companies or sell all or substantially all of our assets; |
|
· |
alter the business we conduct; and |
|
· |
make certain amendments to our organizational documents. |
In addition, the restrictive covenants in our 2015 Credit Agreement require us to maintain a financial ratio at specified levels. See Note 8 – Revolving Credit Facility and Long-Term Debt in the Notes to Consolidated Financial Statements. Our ability to comply with that financial ratio may be affected by events beyond our control, and we may be unable to comply with that covenant.
As a result of these covenants and restrictions, we will be limited in how we conduct our business and we may be unable to raise additional debt or other financing to compete effectively or take advantage of new business opportunities. The terms of any future indebtedness we may incur could include more restrictive covenants. We may not be able to maintain compliance with these covenants in the future and, if we fail to do so, we may not be able to obtain waivers from the lenders and/or amend the covenants.
31
As of December 31, 2015, the total outstanding amount under our Term Loan (as defined herein) was $182.7 million, no borrowings were outstanding under our Revolving Credit Facility (as defined herein) and we had $74.9 million of availability under our Revolving Credit Facility (after giving effect to a $0.1 million letter of credit outstanding thereunder). We expect borrowings under our 2015 Credit Agreement to fluctuate based on our working capital needs and the financing of acquisitions. Obligations under our 2015 Credit Agreement are guaranteed by our subsidiaries and secured by substantially all of our and our subsidiaries’ assets.
If we cannot make scheduled payments under our 2015 Credit Agreement or other indebtedness, we will be in default and the lenders under our 2015 Credit Agreement and the lenders or holders of other indebtedness could declare all outstanding principal and interest to be due and payable, the lenders under our Revolving Credit Facility could terminate their commitments to lend money, lenders under our 2015 Credit Agreement and other secured lenders could foreclose against the assets securing their claims and we could be forced into bankruptcy or liquidation. All of these events could result in the loss of your investment in our common stock.
Servicing our indebtedness will require a significant amount of cash. Our ability to generate sufficient cash depends on many factors, some of which are not within our control.
Our ability to make payments on our indebtedness will depend on our ability to generate cash in the future. To a certain extent, this is subject to general economic, financial, competitive, regulatory and other factors that are beyond our control. If we are unable to generate sufficient cash flow to service our debt and meet our other commitments, we may need to restructure or refinance all or a portion of our debt, sell material assets or operations or raise additional debt or equity capital. We may not be able to effect any of these actions on a timely basis, on commercially reasonable terms or at all, and these actions may not be sufficient to meet our capital requirements. In addition, the terms of our existing or future debt arrangements may restrict us from effecting any of these alternatives.
We and our subsidiaries are able to incur substantial debt.
We are and will be able to incur substantial additional indebtedness in the future. Although the terms of our 2015 Credit Agreement restrict our ability to incur additional debt, they do not prohibit us from incurring additional indebtedness. These restrictions also do not prevent us from incurring obligations, such as trade payables and similar obligations, that do not constitute indebtedness as defined under our 2015 Credit Agreement. To the extent new debt is added to our current debt levels, the substantial leverage risks described in the preceding two risk factors would increase.
Risks Related to Our Common Stock
We are classified as a “controlled company” within the meaning of the NYSE Listed Company Manual and, as a result, we qualify for, and intend to continue to rely on, certain exemptions from certain corporate governance requirements of the NYSE.
Vestar controls a majority of the voting power of our outstanding common stock. As a result, we qualify as a “controlled company” within the meaning of the NYSE Listed Company Manual. Under the rules of the NYSE, a company of which more than 50% of the outstanding voting power is held by an individual, group or another company is a “controlled company.” As a controlled company, we are exempt from certain corporate governance requirements of the NYSE that would require:
|
· |
a majority of the board of directors to be “independent directors,” as defined under the rules of the NYSE; |
|
· |
a nominating and corporate governance committee comprised entirely of independent directors; and |
|
· |
a compensation committee comprised entirely of independent directors. |
In accordance with those exemptions, our Nominating and Corporate Governance Committee and Compensation Committee are not composed entirely of independent directors. Accordingly, you may not have the same
32
protections afforded to stockholders of companies that are subject to all of the stock exchange corporate governance requirements of the NYSE.
Our majority stockholder has the ability to control significant corporate activities and our majority stockholder’s interests may not coincide with yours.
Vestar owns approximately 57.5% of our common stock as of December 31, 2015. So long as Vestar continues to hold a majority of our outstanding shares, Vestar will have the ability to control the outcome of matters submitted to a vote of stockholders and, through our Board of Directors, the ability to control decision‑making with respect to our business direction and policies. Matters over which Vestar will, directly or indirectly, exercise control include:
|
· |
the election of our Board of Directors and the appointment and removal of our officers; |
|
· |
mergers and other business combination transactions, including proposed transactions that would result in our stockholders receiving a premium price for their shares; |
|
· |
other material acquisitions or dispositions of businesses or assets; |
|
· |
the incurrence of indebtedness and the issuance of equity securities; |
|
· |
the repurchase of stock and payment of dividends; and |
|
· |
the issuance of shares to management under our equity incentive plans. |
As a result of Vestar’s control, we may take actions that our other stockholders do not view as beneficial, which may adversely affect our results of operations and financial condition and cause the value of your investment in our common stock to decline. In addition, Vestar is in the business of making investments in companies and may, from time to time, acquire interests in businesses that directly or indirectly compete with our business, as well as businesses that are significant existing or potential clients. Vestar or any of its portfolio companies may acquire or seek to acquire assets that we seek to acquire and, as a result, those acquisition opportunities may not be available to us or may be more expensive for us to pursue.
Even if Vestar’s ownership of our shares falls below a majority, Vestar may continue to be able to influence or effectively control our decisions. Under our amended and restated certificate of incorporation, Vestar and its affiliates do not have any obligation to present to us, and Vestar may separately pursue, corporate opportunities of which they become aware, even if those opportunities are ones that we would have pursued if granted the opportunity.
Certain of our directors are under no obligation to present us with business opportunities, which may prevent us from pursuing potentially profitable transactions.
Certain of our directors are affiliated with Vestar. Pursuant to our amended and restated certificate of incorporation, no such person is liable to us for breach of any fiduciary or other duty, as a director or officer or otherwise, by reason of the fact that such person, acting in good faith, pursues or acquires any business opportunity presented to Vestar or any of its officers, directors, managers, principals, members, partners, affiliates and employees, directs any such business opportunity to another person or fails to present any such business opportunity, or information regarding any such business opportunity, to us unless any such business opportunity is expressly offered to such director or officer solely in his or her capacity as our director or officer. This may impact our ability to pursue certain transactions on a timely basis or at all and could have a material adverse effect on our business, financial condition and results of operations.
33
The price of our common stock may be volatile and fluctuate substantially, which could result in substantial losses for purchasers of our common stock.
The market price of our common stock may be highly volatile and subject to wide fluctuations. The stock market in general has experienced extreme volatility that has often been unrelated to the operating performance of particular companies. The market price for our common stock may be influenced by many factors, including:
|
· |
actual or anticipated fluctuations in our financial condition and operating results or variations in the financial results of companies that are perceived to be similar to us; |
|
· |
actual or anticipated changes in our growth rate relative to our competitors; |
|
· |
competition from existing products or new products that may emerge; |
|
· |
development of new technologies that may address our markets and may make our technology less attractive; |
|
· |
announcements by us, our partners or our competitors of significant acquisitions, strategic partnerships, joint ventures, collaborations or capital commitments; |
|
· |
the recruitment or departure of key personnel; |
|
· |
failure to meet or exceed financial estimates and projections of securities analysts or the investment community or that we provide to the public; |
|
· |
changes in laws and regulations that affect the healthcare industry; |
|
· |
general economic, industry and market conditions; and |
|
· |
the other factors described in this “Risk Factors” section. |
34
Future sales of our common stock in the public market could cause the market price of our common stock to drop significantly, even if our business is doing well, and any additional capital raised by us through the sale of equity securities could adversely affect the market price of our common stock.
We and our stockholders, including Vestar, may sell additional shares of common stock in subsequent public offerings and we may also issue additional shares of common stock to finance future acquisitions. We have 350,000,000 shares of common stock authorized and there were 52,803,214 shares of common stock outstanding as of February 26, 2016.
We cannot predict the size of future issuances or sales of our common stock or the effect, if any, that future issuances and sales of our common stock will have on the market price of our common stock. Issuances or sales of substantial amounts of our common stock (including sales pursuant to Vestar’s registration rights, sales by members of management and shares issued in connection with an acquisition), or the perception that such sales could occur, may adversely affect prevailing market prices for shares of our common stock.
We are an “emerging growth company,” and the reduced disclosure requirements applicable to emerging growth companies may make our common stock less attractive to investors.
We are an “emerging growth company,” as defined in the JOBS Act. For so long as we remain an emerging growth company, we are permitted and intend to rely on exemptions from certain disclosure, reporting and governance requirements that are applicable to other public companies that are not emerging growth companies. These exemptions include:
|
· |
not being required to comply with the auditor attestation requirements of Section 404 of the Sarbanes‑Oxley Act of 2002 (the “Sarbanes-Oxley Act”); |
|
· |
not being required to comply with any requirement that may be adopted by the Public Company Accounting Oversight Board regarding mandatory audit firm rotation or a supplement to the auditor’s report providing additional information about the audit and the financial statements; |
|
· |
reduced disclosure obligations regarding executive compensation in our periodic reports, proxy statements and registration statements; and |
|
· |
exemptions from the requirements of holding a nonbinding advisory vote on executive compensation and stockholder approval of any “golden parachute” payments not previously approved. |
As a result, the information that we provide to our stockholders may be different than the information provided by other public reporting companies. If some investors find our common stock less attractive as a result, there may be a less active trading market for our common stock and our stock price may be reduced or more volatile.
We have incurred increased costs as a result of operating as a public company, and our management is required to devote substantial time to new compliance initiatives and corporate governance practices.
As a public company, we have incurred and will continue to incur (particularly if we no longer qualify as an emerging growth company) significant legal, accounting and other expenses that we did not incur as a private company. The Sarbanes‑Oxley Act, the Dodd‑Frank Wall Street Reform and Consumer Protection Act, the listing requirements of the NYSE and other applicable securities rules and regulations impose various requirements on public companies, including establishment and maintenance of effective disclosure and financial controls and corporate governance practices. Our management and other personnel need to devote a substantial amount of time to these compliance initiatives. Moreover, these rules and regulations increase our legal and financial compliance costs and make some activities more time‑consuming and costly. For example, these rules and regulations may make it more difficult and more expensive for us to obtain director and officer liability insurance, which in turn could make it more difficult for us to attract and retain qualified members of our Board of Directors.
35
We continue to evaluate these rules and regulations, and cannot predict or estimate the amount of additional costs we may incur in the future or the timing of such costs. These rules and regulations are often subject to varying interpretations, in many cases due to their lack of specificity, and, as a result, their application in practice may evolve over time as new guidance is provided by regulatory and governing bodies. This could result in continuing uncertainty regarding compliance matters and higher costs necessitated by ongoing revisions to disclosure and governance practices.
If we fail to maintain proper and effective internal controls over financial reporting, our ability to produce accurate and timely financial statements could be impaired and investors’ views of us could be harmed.
The Sarbanes-Oxley Act requires, among other things, that we maintain effective internal control over financial reporting and disclosure controls and procedures. In particular, we must perform system and process evaluation and testing of our internal control over financial reporting to allow management to report on the effectiveness of our internal control over financial reporting, beginning with our Annual Report on Form 10-K for the fiscal year ending December 31, 2016. Our compliance with this obligation will require that we incur substantial costs and expend significant management efforts. Any delay in the implementation of, or disruption in the transition to, new or enhanced systems, procedures or controls, may cause our operations to suffer. In addition, we will be required to have our independent registered accounting firm attest to the effectiveness of our internal control over financial reporting beginning with our Annual Report on Form 10-K following the date on which we are no longer an emerging growth company. There is no guarantee that our efforts will result in management’s ability to conclude, or, if applicable, our independent registered public accounting firm’s ability to attest that our internal control over financial reporting is effective.
If we are not able to conclude, or if our independent registered public accounting firm is not able to attest, that our internal control over financial reporting is effective, or if we or our independent registered public accounting firm identify deficiencies in our internal control over financial reporting that are deemed to be material weaknesses, our ability to produce accurate and timely financial statements could be impaired, the market price of our common stock could decline and we could be subject to sanctions or investigations by the NYSE, the SEC or other regulatory authorities, which would require additional financial and management resources. This, in turn, could adversely affect our ability to access the capital markets.
Anti‑takeover provisions in our charter documents and Delaware law might discourage or delay acquisition attempts for us that you might consider favorable. Provisions in our debt agreements may also require an acquirer to refinance our outstanding indebtedness if a change of control occurs, which could discourage or increase the costs of a takeover.
Our amended and restated certificate of incorporation and amended and restated bylaws contain provisions that may make the acquisition of our company more difficult without the approval of our Board of Directors. In particular, these provisions:
|
· |
authorize the issuance of undesignated preferred stock, the terms of which may be established and the shares of which may be issued without stockholder approval, and which may include super voting, special approval, dividend or other rights or preferences superior to the rights of the holders of common stock; |
|
· |
prohibit stockholder action by written consent, requiring all stockholder actions be taken at a meeting of our stockholders, if Vestar ceases to own more than 50% of our common stock; |
|
· |
provide that the Board of Directors is expressly authorized to make, alter or repeal our amended and restated bylaws; |
|
· |
establish advance notice requirements for nominations for elections to our Board of Directors or for proposing matters that can be acted upon by stockholders at stockholder meetings; |
36
|
· |
establish a classified Board of Directors, as a result of which our Board of Directors is divided into three classes, with each class serving for staggered three‑year terms, which prevents stockholders from electing an entirely new Board of Directors at an annual meeting; |
|
· |
provide that, if Vestar ceases to own more than 50% of our common stock, directors may only be removed from office for cause and only upon the affirmative vote of at least 75% of the voting power of our outstanding shares of common stock entitled to vote in the election of directors; |
|
· |
prohibit stockholders, other than Vestar for so long as it beneficially owns at least 50% of our common stock, from calling special meetings of stockholders; and |
|
· |
require the approval of holders of at least 75% of the outstanding shares of our voting common stock to amend our amended and restated certificate of incorporation and for stockholders to amend our amended and restated bylaws, in each case if Vestar ceases to own more than 50% of our common stock. |
These anti‑takeover provisions and other provisions under Delaware law could discourage, delay or prevent a transaction involving a change in control of our company, even if doing so would benefit our stockholders. These provisions could also discourage proxy contests and make it more difficult for you and other stockholders to elect directors of your choosing and to cause us to take other corporate actions you desire.
Under our 2015 Credit Agreement, a takeover of our company would likely constitute a “change of control” and be deemed to be an event of default under such facilities, which would therefore require a third‑party acquirer to refinance any outstanding indebtedness under the 2015 Credit Agreement in connection with such takeover. This change of control provision, and similar provisions in future agreements, are likely to increase the costs of any takeover and may discourage, delay or prevent an acquisition of our company by a third party.
Limitations on director and officer liability and indemnification of our company’s officers and directors by us may discourage stockholders from bringing suit against an officer or director.
Limitations on director and officer liability and indemnification of our directors and officers by us may discourage stockholders from bringing suit against an officer or director. Our amended and restated certificate of incorporation provides, with certain exceptions as permitted by Delaware law, that a director or officer shall not be personally liable to us or our stockholders for the breach of any fiduciary duty as a director or officer, except for acts or omissions which involve intentional misconduct, fraud or a knowing violation of law, or unlawful payments of dividends. These provisions may discourage stockholders from bringing suit against a director or officer for breach of a fiduciary duty and may reduce the likelihood of derivative litigation brought by stockholders on our behalf against a director or officer.
37
Our amended and restated certificate of incorporation provides that certain persons bringing an unsuccessful action against us or our officers or directors may be obligated to reimburse us for any costs we have incurred in connection with such unsuccessful action.
Our amended and restated certificate of incorporation provides, to the fullest extent permitted by law, in the event that any current or former stockholder, any current or former director, or any person acting on behalf of such stockholder or director (including any third party that receives substantial assistance from any such person or entity if such person or entity has a direct financial interest in the claim or proceeding of such third party), which we collectively refer to as claiming parties, (x) initiates, asserts or joins, offers substantial assistance to, or has a direct financial interest in (1) any derivative action or proceeding brought on our behalf, (2) any claim of breach of a fiduciary duty owed by any of our directors, officers, employees or agents to us or our stockholders, (3) any action against us or any of our directors, officers, employees or agents arising pursuant to any provision of the General Corporation Law of the State of Delaware (the “DGCL”), our amended and restated certificate of incorporation or our amended and restated bylaws, or (4) any action asserting a claim governed by the internal affairs doctrine, each of the foregoing, a claim, or joins any such claim as a named party, and (y) does not thereby obtain a judgment on the merits that substantially achieves, in substance and amount, the full remedy or relief sought in the claim, then such claiming party may be obligated to reimburse us and our officers and directors for all fees, costs and expenses (including attorneys’ fees and the fees of experts) actually and reasonably incurred by us or our officers and directors in defending such claim.
This fee‑shifting provision of our amended and restated certificate of incorporation is not limited to specific types of actions, but is potentially applicable to all actions to the fullest extent permitted by law. Fee‑shifting provisions are relatively new and untested. The case law and potential legislative action on fee‑shifting provisions are evolving and there exists considerable uncertainty regarding the validity of, and potential judicial and legislative responses to, such provisions. For example, it is unclear whether our ability to invoke the fee‑shifting provision of our amended and restated certificate of incorporation in connection with claims under the federal securities laws would be pre‑empted by federal law. Similarly, it is unclear how courts might apply the standard that a claiming party must obtain a judgment that substantially achieves, in substance and amount, the full remedy sought. The application of the fee‑shifting provision of our amended and restated certificate of incorporation in connection with such claims, if any, will depend in part on future developments of the law, and the Delaware Corporation Law Council has recently recommended that the DGCL be amended to expressly prohibit companies from including fee‑shifting provisions in their certificate of incorporation or bylaws for claims brought against officers and directors for violation of their state law duties. We cannot assure you that we will or will not invoke the fee‑shifting provision of our amended and restated certificate of incorporation in any particular dispute. In addition, given the unsettled state of the law related to fee‑shifting provisions, such as ours, we may incur significant additional costs associated with resolving disputes with respect to such provision, which could adversely affect our business, financial condition and results of operations.
If a stockholder that brings any such claim, suit, action or proceeding is unable to obtain the judgment sought, the attorneys’ fees and other litigation expenses that might be shifted to a claiming party are potentially significant. This fee‑shifting provision, therefore, may dissuade or discourage current or former stockholders from initiating lawsuits or claims against us or our directors and officers. In addition, it may impact the fees, contingent or otherwise, required by potential plaintiffs’ attorneys to represent our stockholders or otherwise discourage plaintiffs’ attorneys from representing our stockholders at all. As a result, this provision may limit the ability of stockholders to affect the management and direction of our company, particularly through litigation or the threat of litigation.
38
Our amended and restated certificate of incorporation designates the Court of Chancery of the State of Delaware as the sole and exclusive forum for certain types of actions and proceedings that may be initiated by our stockholders, which may limit our stockholders’ ability to obtain a favorable judicial forum for disputes with us or our directors, officers or employees.
Our amended and restated certificate of incorporation provides that, subject to limited exceptions, the Court of Chancery of the State of Delaware will be the sole and exclusive forum for (i) any derivative action or proceeding brought on our behalf, (ii) any action asserting a claim of breach of a fiduciary duty owed by any of our directors, officers or other employees to us or our stockholders, (iii) any action asserting a claim against us arising pursuant to any provision of the DGCL, our certificate of incorporation or our bylaws, or (iv) any other action asserting a claim against us that is governed by the internal affairs doctrine. Any person or entity purchasing or otherwise acquiring any interest in shares of our capital stock shall be deemed to have notice of and to have consented to the provisions of our certificate of incorporation described above. This choice of forum provision may limit a stockholder’s ability to bring a claim in a judicial forum that it finds favorable for disputes with us or our directors, officers or other employees, which may discourage such lawsuits against us and our directors, officers and employees. Alternatively, if a court were to find these provisions of our amended and restated certificate of incorporation inapplicable to, or unenforceable in respect of, one or more of the specified types of actions or proceedings, we may incur additional costs associated with resolving such matters in other jurisdictions, which could adversely affect our business, financial condition and results of operations.
We do not anticipate paying any cash dividends on shares of our common stock in the foreseeable future.
We do not anticipate that we will pay any cash dividends on shares of our common stock for the foreseeable future. Any determination to pay dividends in the future will be at the discretion of our Board of Directors and will depend upon results of operations, financial condition, contractual restrictions, including those under our 2015 Credit Agreement, any potential indebtedness we may incur, restrictions imposed by applicable law and other factors our Board of Directors deems relevant.
We are a holding company and rely on dividends, distributions and other payments, advances and transfers of funds from our subsidiaries to meet our obligations.
We are a holding company that does not conduct any business operations of our own. As a result, we are largely dependent upon cash dividends and distributions and other transfers from our subsidiaries to meet our obligations. The deterioration of income from, or other available assets of, our subsidiaries for any reason could limit or impair their ability to pay dividends or other distributions to us.
Item 1B. Unresolved Staff Comments
None.
Our principal executive office in Wakefield, Massachusetts is under lease until September 2017. We lease additional space in various locations in South Bend, Indiana, Chicago, Illinois, Charlotte, North Carolina, Overland Park, Kansas, Baltimore, Maryland and Virginia Beach, Virginia.
The aggregate square footage of office space under lease as of December 31, 2015 was 190,392. Our office leases call for future minimum lease payments of approximately $8.4 million and have terms that expire between 2016 and 2021, exclusive of renewal options that can be exercised. We currently do not own any real estate and are not subletting any office space to third parties.
39
From time to time, we may be involved in various legal proceedings and subject to claims that arise in the ordinary course of business. Although the results of litigation and claims are inherently unpredictable and uncertain, we are not currently a party to any legal proceedings the outcome of which, if determined adversely to us, are believed to, either individually or taken together, have a material adverse effect on our business, operating results, cash flows or financial condition. Regardless of the outcome, litigation has the potential to have an adverse impact on us because of defense and settlement costs, diversion of management resources, and other factors.
Item 4. Mine Safety Disclosures
Not applicable.
Item 5. Market for Registrant’s Common Equity, Related Stockholder Matters and Issuer Purchases of Equity Securities
Market Information
Our common stock began trading on the New York Stock Exchange under the symbol “PGND” on May 21, 2015. Prior to that, three was no public market for our common stock. The following table sets forth the range of the reported high and low sale prices of our common stock for the period from May 21, 2015 to December 31, 2015.
|
|
|
High |
|
Low |
|
||
|
Year Ended December 31, 2015 |
|
|
|
|
|
|
|
|
Second Quarter (beginning May 21, 2015) |
|
$ |
29.62 |
|
$ |
26.20 |
|
|
Third Quarter |
|
$ |
35.09 |
|
$ |
25.72 |
|
|
Fourth Quarter |
|
$ |
36.15 |
|
$ |
28.83 |
|
Stockholders
On February 26, 2016, the last reported sale price of our common stock on the New York Stock Exchange was $27.06 per share. The approximate number of holders of record of our common stock at February 26, 2016 was 177. This number does not include stockholders for whom shares were held in a “nominee” or “street” name.
Dividends
We have not declared or paid any cash dividends on our common stock since we became a public company in May 2015. We do not currently anticipate declaring or paying any cash dividends. Additionally, our credit agreement contains restrictions on our ability to pay cash dividends (see Item 7, “Management’s Discussion and Analysis of Financial Condition and Results of Operations – Liquidity and Capital Resources”).
Stock Performance Graph
Our performance graph below compares the cumulative total stockholder return on our common stock from May 21, 2015 through December 31, 2015 with the cumulative total return of the Russell 2000 Index and the NYSE Composite. The graph assumes an investment of $100 in our common stock and in each of the indices on May 21, 2015 and relative performance is tracked through December 31, 2015. We paid no dividends on our common stock during the period covered by the graph. Measurement points are May 21, 2015 and the last trading day of each subsequent month end through December 31, 2015.
The comparisons in the graph below are based on historical data and are not intended to forecast the potential future performance of our common stock.
This graph is not deemed to be “filed” with the SEC or subject to the liabilities of Section 18 of the Exchange Act of 1934, as amended (the “Exchange Act”), and the graph shall not be deemed to be incorporated by reference into any prior or subsequent filing by Press Ganey Holdings, Inc. under the Securities Act of 1933, as amended, (the “Securities Act”) or the Exchange Act.
40
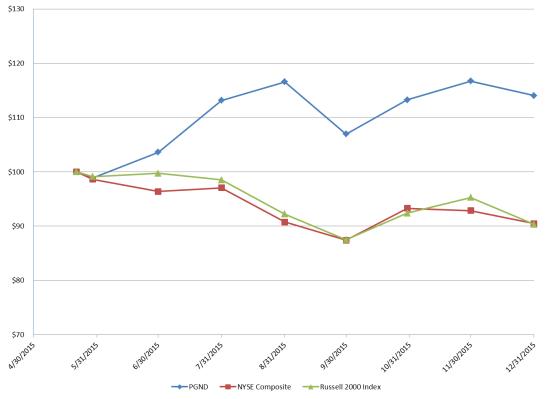
Repurchases of Equity Securities
The following table provides information about purchases we made during the three months ended December 31, 2015 of equity securities that are registered by us pursuant to Section 12 of Exchange Act:
|
|
|
Total Number of Shares Purchased (1) |
|
Average Price Paid per Share |
|
Total Number of Shares Purchased as Part of Publicly Announced Plans or Programs |
|
Approximate Dollar Value of Shares that May Yet Be Purchased Under the Plans or Programs |
|
|||
|
October 1 - 31, 2015 |
|
8,173 |
|
$ |
29.86 |
|
|
— |
|
|
— |
|
|
November 1 - 30, 2015 |
|
17,031 |
|
$ |
33.22 |
|
|
— |
|
|
— |
|
|
December 1 - 31, 2015 |
|
4,390 |
|
$ |
31.97 |
|
|
— |
|
|
— |
|
|
Total |
|
29,594 |
|
$ |
32.11 |
|
|
— |
|
|
— |
|
|
(1) |
Our employees surrendered an aggregate of 29,594 shares to us in satisfaction of minimum tax withholding obligations associated with the vesting of restricted stock during the three months ended December 31, 2015. |
Unregistered Sales of Equity Securities
None.
41
Use of Proceeds from Registered Securities
On May 27, 2015, we completed our IPO of 8,900,000 shares of common stock and, upon the underwriters’ exercise of their option to purchase additional shares, issued an additional 1,335,000 shares for a total of 10,235,000 shares issued at an offering price of $25.00 per share. Proceeds from the IPO were approximately $234.4 million, net of underwriting discounts and commissions and offering-related transaction costs incurred. All of the shares were sold pursuant to our registration statement on Form S-1, as amended (File No. 333-203248), that was declared effective by the SEC on May 20, 2015.
We used $223.0 million of the proceeds from the IPO to repay $223.0 million of principal on our First Lien Term Loan (as defined herein).
42
Item 6. Selected Financial Data
The selected consolidated financial and operating data set forth below with respect to our consolidated statements of operations for fiscal years 2015, 2014 and 2013 and consolidated balance sheets as of December 31, 2015 and 2014 are derived from our audited consolidated financial statements included elsewhere in this annual report. Data with respect to the consolidated statement of income for fiscal year 2012 and consolidated balance sheets as of December 31, 2013 and 2012 are derived from our audited historical consolidated financial statements, which are not included in this report. The data set forth below should be read in conjunction with Item 7, “Management’s Discussion and Analysis of Financial Condition and Results of Operations” and our consolidated financial statements and notes thereto included elsewhere in this annual report.
|
|
|
Year Ended December 31, |
|
||||||||||
|
|
|
2015 |
|
2014 |
|
2013 |
|
2012 |
|
||||
|
|
|
(in thousands, except share and per share data) |
|
||||||||||
|
Statement of Operations Data: |
|
|
|
|
|
|
|
|
|
|
|
|
|
|
Revenue |
|
$ |
318,694 |
|
$ |
281,612 |
|
$ |
260,420 |
|
$ |
231,351 |
|
|
Cost of revenue, excluding depreciation and amortization |
|
|
149,235 |
|
|
121,807 |
|
|
113,675 |
|
|
101,155 |
|
|
General and administrative |
|
|
143,561 |
|
|
70,432 |
|
|
71,926 |
|
|
70,679 |
|
|
Depreciation and amortization |
|
|
41,224 |
|
|
35,102 |
|
|
32,468 |
|
|
27,202 |
|
|
Impairment charges |
|
|
— |
|
|
— |
|
|
2,579 |
|
|
— |
|
|
Loss on disposal of property and equipment |
|
|
307 |
|
|
1,719 |
|
|
274 |
|
|
— |
|
|
Total operating expenses |
|
|
334,327 |
|
|
229,060 |
|
|
220,922 |
|
|
199,036 |
|
|
Income (loss) from operations |
|
|
(15,633) |
|
|
52,552 |
|
|
39,498 |
|
|
32,315 |
|
|
Other income (expense): |
|
|
|
|
|
|
|
|
|
|
|
|
|
|
Interest expense, net |
|
|
(11,163) |
|
|
(19,832) |
|
|
(24,644) |
|
|
(32,157) |
|
|
Extinguishment of debt |
|
|
(1,750) |
|
|
(2,894) |
|
|
(7,922) |
|
|
(7,185) |
|
|
Management fee of related party |
|
|
(553) |
|
|
(1,047) |
|
|
(907) |
|
|
(968) |
|
|
Total other expense, net |
|
|
(13,466) |
|
|
(23,773) |
|
|
(33,473) |
|
|
(40,310) |
|
|
Income (loss) before income taxes |
|
|
(29,099) |
|
|
28,779 |
|
|
6,025 |
|
|
(7,995) |
|
|
Provision for (benefit from) income taxes |
|
|
7,528 |
|
|
13,196 |
|
|
5,926 |
|
|
(604) |
|
|
Net income (loss) |
|
$ |
(36,627) |
|
$ |
15,583 |
|
$ |
99 |
|
$ |
(7,391) |
|
|
Per Share Data: |
|
|
|
|
|
|
|
|
|
|
|
|
|
|
Earnings (net loss) per share: |
|
|
|
|
|
|
|
|
|
|
|
|
|
|
Basic and diluted |
|
$ |
(0.75) |
|
$ |
0.36 |
|
$ |
0.00 |
|
$ |
(0.17) |
|
|
Weighted average of common shares outstanding: |
|
|
|
|
|
|
|
|
|
|
|
|
|
|
Basic and diluted |
|
|
48,891,327 |
|
|
43,313,200 |
|
|
43,313,200 |
|
|
43,313,200 |
|
|
Statement of Cash Flows Data: |
|
|
|
|
|
|
|
|
|
|
|
|
|
|
Net cash provided by operating activities |
|
$ |
88,641 |
|
$ |
54,768 |
|
$ |
53,911 |
|
$ |
44,897 |
|
|
Net cash used in investing activities |
|
|
(38,343) |
|
|
(47,591) |
|
|
(20,043) |
|
|
(43,085) |
|
|
Net cash provided by (used in) financing activities |
|
|
(22,025) |
|
|
(32,850) |
|
|
(9,078) |
|
|
1,362 |
|
|
|
|
As of December 31, |
|
||||||||||
|
|
|
2015 |
|
2014 |
|
2013 |
|
2012 |
|
||||
|
|
|
(in thousands) |
|
||||||||||
|
Balance Sheet Data: |
|
|
|
|
|
|
|
|
|
|
|
|
|
|
Cash |
|
$ |
35,235 |
|
$ |
6,962 |
|
$ |
32,635 |
|
$ |
7,845 |
|
|
Working capital(1)(2) |
|
|
28,352 |
|
|
(2,532) |
|
|
22,803 |
|
|
4,896 |
|
|
Total debt (including current portion)(2) |
|
|
189,267 |
|
|
418,319 |
|
|
434,423 |
|
|
431,851 |
|
|
Total assets(2) |
|
|
935,829 |
|
|
897,590 |
|
|
888,200 |
|
|
876,677 |
|
|
Total shareholders’ equity |
|
|
562,609 |
|
|
280,644 |
|
|
266,207 |
|
|
265,028 |
|
|
(1) |
Calculated as current assets minus current liabilities. |
|
(2) |
Prior year amounts related to deferred financing fees and deferred income taxes have been reclassified to reflect retrospective adoption of ASU 2015-03 and ASU 2015-17, respectively. See Note 2 – Summary of Significant Accounting Policies in the Notes to Consolidated Financial Statements for additional details. |
43
Item 7. Management’s Discussion and Analysis of Financial Condition and Results of Operations
You should read the following discussion and analysis of our financial condition and results of operations together with “Selected Financial Data” and our consolidated financial statements and the related notes thereto included elsewhere in this annual report. Some of the information contained in this discussion and analysis or set forth elsewhere in this annual report, including information with respect to our plans and strategy for our business and related financing, includes forward‑looking statements that involve risks and uncertainties. See “Special Note Regarding Forward‑Looking Statements.” As a result of many factors, including those factors set forth in the “Risk Factors” section of this annual report, our actual results could differ materially from the results described in or implied by the forward‑looking statements contained in the following discussion and analysis.
Executive Overview
We are a leading provider of patient experience and caregiver measurement, performance analytics and strategic advisory solutions for healthcare organizations across the continuum of care. Our mission is to help healthcare organizations reduce patient suffering and improve the quality, safety and experience of care. We provide our clients with an innovative digital platform that captures the perspectives of patients, physicians, nurses and other healthcare employees and enables our clients to benchmark, analyze and improve the patient and caregiver experience. We support clients in achieving the “Quadruple Aim” of improving the patient experience, improving population health, reducing costs and engaging caregivers. We believe we offer a powerful value proposition to the healthcare industry, as we help drive transformational change through performance transparency, safety and high reliability initiatives, better care coordination and sustainable performance improvements.
Factors Affecting our Financial Performance
We believe that the financial performance of our business and our continued success are primarily dependent upon the following:
|
· |
Client Penetration and Growth. We believe that we have opportunities to continue to grow our revenue from our comprehensive suite of solutions due to the trends we see affecting the healthcare industry. We expect an increasing percentage of our recurring and new revenues to be the result of increased focus by healthcare providers on measuring and reporting on, and bearing financial risk for, clinical outcomes and the patient experience. Our future growth will depend on our ability to expand sales of our suite of solutions to our existing client base and identify and execute upon new opportunities and attract new clients. Our expansion activities consist of focusing on growing healthcare settings, including hospitals, medical practices and post‑acute care settings, and servicing new markets and increasing engagement of existing clients impacted by expanded regulatory requirements. We plan to continue to invest in the development of innovative and value‑added solutions and continue to market our proprietary platform. |
|
· |
Continued Change in the U.S. Healthcare Industry. Healthcare spending represents a significant and growing component of GDP of the United States and the average annual growth in healthcare spending is expected to exceed average annual GDP growth from 2013 to 2023. As healthcare costs rise and providers, patients and payment models focus on value‑based and patient‑centric care, the healthcare industry has increasingly focused attention on improving efficiency and transparency, standardizing care around best practices, and driving better clinical and operational outcomes. This has resulted in increasing demand for solutions designed to improve the efficiency and quality of care, safety and the patient experience. We believe this shift in the industry will continue to impact our business for the foreseeable future. |
|
· |
Selective Acquisitions. We expect to grow through selective acquisitions that complement and grow our existing suite of technologies, services and solutions and increase the number of clients we serve. Our acquisitions are integrated within our overall solutions suite and brand to strengthen our comprehensive offerings. As the U.S. healthcare industry continues to evolve, we expect that there will be attractive investment opportunities given the large number of complementary businesses in the industry. Any acquisition could have a material impact on our financial position and results of operations. |
44
|
· |
Macro‑Economic Conditions. Our clients are affected by macro‑economic trends such as general economic conditions, inflation and unemployment. Macro‑economic trends have various effects on our business, and on occasion have resulted in the slowing of the decision‑making processes by existing and prospective clients. In recent years, changes in macro‑economic trends have increased demand for our solutions as our clients strive to improve their clinical and operating performance, while reducing costs and moving to a value‑based care model. |
Initial Public Offering
On May 27, 2015, we completed our initial public offering (“IPO”) of 8,900,000 shares of common stock and, upon the underwriters’ exercise of their option to purchase additional shares, issued an additional 1,335,000 shares for a total of 10,235,000 shares issued at an offering price of $25.00 per share. Proceeds from the IPO were approximately $234.4 million, net of underwriting discounts, commissions and offering-related transaction costs incurred. Our common stock is currently traded on the New York Stock Exchange under the symbol “PGND”. In connection with the IPO: (i) PG Holdco, LLC, our former parent, was liquidated and its sole asset, the shares of our common stock, was distributed to the equity holders based on their relative rights under the limited liability company agreement, (ii) we recognized $70.4 million of equity-based compensation expense for the modification of certain units of PG Holdco, LLC, (iii) we paid a one-time transaction advisory fee of $8.5 million to our majority shareholder, and (iv) we recognized a loss on extinguishment of debt of $638,000 related to the write-off of deferred financing fees, loss on original issue discount and lender fees as a result of the partial repayment of our term loan facility with the net proceeds of the IPO.
Refinancings
We completed several refinancings during the years ended December 31, 2015, 2014 and 2013 to lower our interest expense, reduce principal balances, increase the borrowing capacity on our revolving credit facility and amend certain financial covenants. Prior to the 2015 Credit Agreement, the Company was party to a First Lien Credit Agreement and a Second Lien Credit Agreement. The First Lien Agreement initially consisted of a $30.0 million revolving credit facility and a $345.0 million term loan (the “First Lien Term Loan”). The Second Lien Agreement initially consisted of a $95.0 million term loan (the “Second Lien Term Loan”).
In May 2013, we refinanced a portion of our Second Lien Term Loan with borrowings of $50.0 million on our First Lien Term Loan. In May 2014, we borrowed an additional $35.0 million under the First Lien Term Loan and used such funds, together with $10.0 million of cash on hand, to repay in full all amounts outstanding under, and terminate, our Second Lien Term Loan. In May 2015, we repaid $223.0 million of principal on our First Lien Term Loan using the net proceeds from our IPO. On July 31, 2015, we entered into a new credit agreement (“2015 Credit Agreement”). The 2015 Credit Agreement consists of a five-year $185.0 million term loan (“Term Loan”) and a five-year $75.0 million revolving credit facility (“Revolving Credit Facility”), which replaced the prior $30.0 million revolving credit facility. The proceeds from the Term Loan were used to repay the remaining principal balance of $183.2 million on our First Lien Term Loan. See Note 8 – Revolving Credit Facility and Long-Term Debt in the Notes to Consolidated Financial Statements for additional details. These refinancings resulted in losses on the extinguishment of debt consisting of write-offs of unamortized deferred financing fees and losses on original issue discount in the applicable periods.
Acquisitions
We completed several acquisitions during the years ended December 31, 2015, 2014 and 2013 to expand capabilities and complement our suite of solutions. On September 1, 2015, we acquired all of the membership interests of Healthcare Performance Improvement, LLC (“HPI”), a leading patient safety and high reliability consulting and coaching firm, for a purchase price of $12.1 million, net of cash acquired. On April 24, 2014, we acquired all of the capital stock of Dynamic Clinical Systems, Inc. (“DCS”), which provides patient reported outcomes services and solutions for a purchase price of $3.3 million, net of cash acquired. We also purchased all of the assets of The National Database of Nursing Quality Indicators (“NDNQI”) on June 10, 2014, for a purchase price of $24.9 million. NDNQI is a leading quality improvement and nurse engagement tool. On December 30, 2013, we acquired all of the capital stock of On The Spot Systems, Inc. (“OTSS”) a point-of-care survey technology firm for a purchase price of $2.8 million. All of these acquisitions were financed with cash on hand.
The results of operations of the acquired businesses have been included in our consolidated financial statements from the applicable date of acquisition.
45
Results of Operations
The following table sets forth our results of operations and our results of operations as a percentage of revenue for the periods indicated (in thousands):
|
|
|
Year Ended December 31, |
|
|||||||||||||
|
|
|
|
|
|
% of |
|
|
|
|
% of |
|
|
|
% of |
|
|
|
|
|
2015 |
|
revenue |
|
2014 |
|
revenue |
|
2013 |
|
revenue |
|
|||
|
Revenue |
|
$ |
318,694 |
|
100.0 |
% |
$ |
281,612 |
|
100.0 |
% |
$ |
260,420 |
|
100.0 |
% |
|
Operating expenses: |
|
|
|
|
|
|
|
|
|
|
|
|
|
|
|
|
|
Cost of revenue |
|
|
149,235 |
|
46.8 |
|
|
121,807 |
|
43.3 |
|
|
113,675 |
|
43.7 |
|
|
General and administrative |
|
|
143,561 |
|
45.0 |
|
|
70,432 |
|
25.0 |
|
|
71,926 |
|
27.6 |
|
|
Depreciation and amortization |
|
|
41,224 |
|
12.9 |
|
|
35,102 |
|
12.5 |
|
|
32,468 |
|
12.5 |
|
|
Impairment charges |
|
|
— |
|
— |
|
|
— |
|
— |
|
|
2,579 |
|
1.0 |
|
|
Loss on disposal of property and equipment |
|
|
307 |
|
0.1 |
|
|
1,719 |
|
0.6 |
|
|
274 |
|
0.1 |
|
|
Total operating expenses |
|
|
334,327 |
|
104.9 |
|
|
229,060 |
|
81.3 |
|
|
220,922 |
|
84.8 |
|
|
Income (loss) from operations |
|
|
(15,633) |
|
(4.9) |
|
|
52,552 |
|
18.7 |
|
|
39,498 |
|
15.2 |
|
|
Other income (expense): |
|
|
|
|
|
|
|
|
|
|
|
|
|
|
|
|
|
Interest expense, net |
|
|
(11,163) |
|
(3.5) |
|
|
(19,832) |
|
(7.0) |
|
|
(24,644) |
|
(9.5) |
|
|
Extinguishment of debt |
|
|
(1,750) |
|
(0.5) |
|
|
(2,894) |
|
(1.0) |
|
|
(7,922) |
|
(3.0) |
|
|
Management fee of related party |
|
|
(553) |
|
(0.2) |
|
|
(1,047) |
|
(0.4) |
|
|
(907) |
|
(0.4) |
|
|
Total other expense, net |
|
|
(13,466) |
|
(4.2) |
|
|
(23,773) |
|
(8.4) |
|
|
(33,473) |
|
(12.9) |
|
|
Income (loss) before income taxes |
|
|
(29,099) |
|
(9.1) |
|
|
28,779 |
|
10.2 |
|
|
6,025 |
|
2.3 |
|
|
Provision for income taxes |
|
|
7,528 |
|
2.4 |
|
|
13,196 |
|
4.7 |
|
|
5,926 |
|
2.3 |
|
|
Net income (loss) |
|
$ |
(36,627) |
|
(11.5) |
% |
$ |
15,583 |
|
5.5 |
% |
$ |
99 |
|
— |
% |
|
|
|
|
|
|
|
|
|
|
|
|
|
|
|
|
|
|
|
Non-GAAP Financial Measures: |
|
|
|
|
|
|
|
|
|
|
|
|
|
|
|
|
|
Adjusted EBITDA (a) |
|
$ |
117,485 |
|
36.9 |
% |
$ |
102,559 |
|
36.4 |
% |
$ |
88,292 |
|
33.9 |
% |
|
(a) |
For an explanation of Adjusted EBITDA as a measure of the Company’s operating performance and a reconciliation to net income (loss), see “Non-GAAP Financial Measures”. |
Year Ended December 31, 2015 compared to Year Ended December 31, 2014
Revenue
Revenue increased $37.1 million, or 13.2%, from $281.6 million for the year ended December 31, 2014 to $318.7 million for the year ended December 31, 2015. Revenue growth consisted of 10.5% organic growth and 2.7% acquisition growth. The acquisitions of HPI, NDNQI and DCS contributed incremental revenue of $7.7 million in 2015. Organic growth was comprised of increased sales of patient experience solutions to new and existing clients and to a lesser extent sales of engagement and consulting solutions.
Operating Expenses
Cost of Revenue. Cost of revenue increased $27.4 million, or 22.5%, from $121.8 million for the year ended December 31, 2014 to $149.2 million for the year ended December 31, 2015. As a percentage of revenue, cost of revenue increased from 43.3% in 2014 to 46.8% in 2015.
Cost of revenue included equity-based compensation of $2.5 million for the year ended December 31, 2014 and $13.3 million for the year ended December 31, 2015. The increase in equity-based compensation is primarily due to $10.1 million of equity-based compensation from the equity-based compensation modification related to the IPO (see Note 11 – Equity-Based Compensation in the Notes to Consolidated Financial Statements for additional details). Cost of revenue also included $610,000 of expenses associated with the discontinuance of certain clinical solutions and software applications in 2014, and $1.3 million of severance in 2015. Excluding these amounts, cost of revenue increased $15.9 million and remained relatively unchanged as a percentage of revenue at 42.1% in 2014 and 42.2% in 2015.
46
General and Administrative Expense. General and administrative expense increased $73.2 million, or 103.8%, from $70.4 million for the year ended December 31, 2014 to $143.6 million for the year ended December 31, 2015. As a percentage of revenue, general and administrative expense increased from 25.0% in 2014 to 45.0% in 2015.
General and administrative expense included equity-based compensation expense of $5.5 million for the year ended December 31, 2014 and $73.4 million for the year ended December 31, 2015. The increase in equity-based compensation is primarily due to $60.3 million of equity-based compensation from the equity-based compensation modification related to the IPO (see Note 11 – Equity-Based Compensation in the Notes to Consolidated Financial Statements for additional details). General and administrative expense also included $462,000 and $945,000 of expenses associated with completed and potential acquisitions in 2014 and 2015, respectively, $1.1 million and $789,000 of severance in 2014 and 2015, respectively, and $2.1 million and $1.8 million of expenses associated with preparations for our IPO and capital structure and strategic corporate planning and in 2014 and 2015, respectively. Excluding these amounts, general and administrative expenses increased $5.3 million and decreased as a percentage of revenue from 21.8% in 2014 to 20.9% in 2015. The decrease was primarily the result of the leveraging of general and administrative resources as a result of 10.5% organic growth.
Depreciation and Amortization Expense. Depreciation and amortization expense increased $6.1 million, or 17.4%, from $35.1 million for the year ended December 31, 2014 to $41.2 million for the year ended December 31, 2015. Amortization expense associated with acquired intangible assets from business combinations was $16.0 million in 2014 and $16.6 million in 2015. The increase in depreciation was largely the result of depreciation of previously capitalized software development costs and assets acquired under capital leases.
Loss on Disposal of Property and Equipment. We recorded a net loss on disposal of property and equipment of $1.7 million for the year ended December 31, 2014 and $307,000 for the year ended December 31, 2015. The net loss in 2014 was the result of the consolidation of office locations and the write-off of certain software development projects. The net loss in 2015 was primarily the result of write-offs of certain software development projects.
Other Income (Expense)
Interest expense, net. Interest expense, net decreased $8.6 million, or 43.7%, from $19.8 million for the year ended December 31, 2014 to $11.2 million for the year ended December 31, 2015. The $8.6 million decrease was primarily due to lower average borrowings in 2015 as a result of principal repayments from the proceeds of our IPO, which resulted in interest savings of approximately $5.5 million and lower average interest rates resulting from our debt refinancings.
Extinguishment of debt. During the year ended December 31, 2014, we repaid the remaining balance of our Second Lien Term Loan. The transaction resulted in a loss on extinguishment of debt of $2.9 million consisting of the write off of unamortized deferred financing fees of $1.5 million, payments of fees to lenders of $497,000 and loss on original issue discount of $921,000. During the year ended December 31, 2015, we prepaid $223.0 million of the principal balance on our First Lien Term Loan with proceeds from the IPO and then repaid the remaining principal balance of $183.2 million with proceeds from the new Term Loan under the 2015 Credit Agreement. The 2015 transactions resulted in a loss on extinguishment of debt of $1.8 million consisting of the write off of unamortized deferred financing fees of $1.5 million and loss on original issue discount of $265,000.
Management fee of related party. We paid a management fee to our majority shareholder of $1.0 million and $553,000 for the years ended December 31, 2014 and 2015, respectively. The management fee was no longer required after the effective date of the IPO.
Provision for Income Taxes
Provision for income taxes decreased $5.7 million, or 43.0%, from $13.2 million for the year ended December 31, 2014 to $7.5 million for the year ended December 31, 2015. The provision for income taxes for the year ended December 31, 2015 and 2014 represents federal and state income tax expense for the periods.
47
For the year ended December 31, 2015, our effective income tax rate was (25.9)% as compared to an effective income tax rate of 45.9% for the year ended December 31, 2014. Our federal statutory income tax rate and state statutory rate, net of federal benefit, is approximately 42%. The 2015 effective rate differs from the statutory tax rate and we have incurred tax expense in spite of the pre-tax loss primarily due to the nondeductible permanent differences related to equity-based compensation expense incurred in connection with the modification of equity awards as a result of our IPO (see Note 11 – Equity-Based Compensation in the Notes to Consolidated Financial Statements for additional details).
Year Ended December 31, 2014 compared to Year Ended December 31, 2013
Revenue
Revenue increased $21.2 million, or 8.1%, from $260.4 million for the year ended December 31, 2013 to $281.6 million for the year ended December 31, 2014. The increase was primarily attributable to the expansion of our patient experience solutions sold to existing clients, revenue from new clients and $8.3 million of revenue from businesses acquired in 2014 and December 2013. During the year ended December 31, 2014, NDNQI, DCS and OTSS contributed $6.5 million, $1.1 million and $0.7 million of revenue, respectively. This increase was partially offset by a reduction in revenue of $3.8 million associated with the discontinuation of certain clinical solutions in the fourth quarter of 2013.
Operating Expenses
Cost of Revenue. Cost of revenue increased $8.1 million, or 7.2%, from $113.7 million for the year ended December 31, 2013 to $121.8 million for the year ended December 31, 2014. As a percentage of revenue, cost of revenue decreased from 43.7% for the year ended December 31, 2013 to 43.3% for the year ended December 31, 2014.
Cost of revenue included equity-based compensation of $2.7 million for the year ended December 31, 2013 and $2.5 million for the year ended December 31, 2014. Cost of revenue also included $456,000 of severance in 2014 and $610,000 of expenses associated with the discontinuance of certain clinical solutions and software applications in 2014. Excluding these amounts, cost of revenue increased $8.2 million and decreased as a percentage of revenue from 42.4% in 2013 to 42.1% in 2014.
General and Administrative Expense. General and administrative expense decreased $1.5 million, or 2.1%, from $71.9 million for the year ended December 31, 2013 to $70.4 million for the year ended December 31, 2014. As a percentage of revenue, general and administrative expense decreased from 27.6% for the year ended December 31, 2013 to 25.0% for the year ended December 31, 2014.
General and administrative expense included equity-based compensation of $7.1 million for the year ended December 31, 2013 and $5.5 million for the year ended December 31, 2014. General and administrative expense also included $902,000 and $462,000 of expenses associated with completed and potential acquisitions in 2013 and 2014, respectively, $169,000 and $1.1 million of severance in 2013 and 2014, respectively, and $2.2 million and $2.1 million of expenses associated with capital structure and strategic corporate planning (including preparations for our IPO in 2014) in 2013 and 2014, respectively. Excluding these amounts, general and administrative expenses decreased $307,000 and decreased as a percentage of revenue from 23.7% in 2013 to 21.8% in 2014. The decrease was primarily the result of leveraging of general and administrative resources as a result of 5.0% organic growth.
48
Depreciation and Amortization Expense. Depreciation and amortization expense increased $2.6 million, or 8.1%, from $32.5 million for the year ended December 31, 2013 to $35.1 million for the year ended December 31, 2014. The $2.6 million increase was due to an increase in depreciation expense of $1.9 million driven by higher investments in computer software development and infrastructure due to our continued investment in this area in 2014, and an increase in amortization expense of $0.7 million primarily related to the amortization of intangible assets of recently acquired businesses.
Impairment Charges. In 2013, we recorded impairment charges totaling $2.6 million on property and equipment and intangible assets related to the discontinuation of certain clinical solutions during the year ended December 31, 2013. We did not record any impairment charges in 2014.
Loss on Disposal of Property and Equipment. Loss on disposal of property and equipment increased $1.4 million from $0.3 million for the year ended December 31, 2013 to $1.7 million for the year ended December 31, 2014. The losses in both periods were primarily the result of write‑offs of equipment and software no longer in use.
Other Income (Expense)
Interest expense, net. Interest expense, net decreased $4.8 million, or 19.5%, from $24.6 million for the year ended December 31, 2013 to $19.8 million for the year ended December 31, 2014. The decrease was primarily due to the reduction of our weighted average interest rate as a result of the extinguishment of our Second Lien Term Loan in May 2014.
Extinguishment of debt. On May 9, 2014, we amended our prior senior secured credit facilities to, among other things, provide for an incremental increase to the First Lien Term Loan in an amount of $35.0 million. The net proceeds from the additional borrowing and $10.0 million of cash on hand were used to pay off the remaining balance of our Second Lien Term Loan. The transaction resulted in a loss on extinguishment of debt of $2.9 million consisting of the write‑off of unamortized deferred financing fees of $1.5 million, payments of fees to lenders of $0.5 million and loss on original issue discount of $0.9 million.
On May 9, 2013, we amended our prior senior secured credit facilities to, among other things, provide for an incremental increase to the First Lien Term Loan in an amount of $50.0 million, lower interest rates, and adjust certain financial covenants. The net proceeds from the additional borrowings were used to pay down a portion of the principal balance of the Second Lien Term Loan. The transaction resulted in a loss on extinguishment of debt of $7.9 million consisting of the write‑off of unamortized deferred financing fees of $4.1 million, payments of fees to lenders of $1.5 million and loss on original issue discount of $2.3 million.
Management fee of related party. Our annual management fee was $1.0 million for each of the years ended December 31, 2014 and 2013.
Provision for Income Taxes
Provision for income taxes increased $7.3 million, or 122.7%, from $5.9 million for the year ended December 31, 2013 to $13.2 million for the year ended December 31, 2014. The provision for income taxes for the years ended 2014 and 2013 primarily represents federal and state income tax expense for the periods.
For the year ended December 31, 2014, our effective tax rate was 45.9%, as compared to an effective income tax rate of 98.3% for the year ended December 31, 2013. These rates differ from the federal statutory income tax rate of 35% primarily due to nondeductible permanent differences such as equity‑based compensation and meals and entertainment expenses and, in 2013, the impact on deferred tax liabilities from an increase in projected state tax rates.
49
Non-GAAP Financial Measures
We define Adjusted EBITDA as net income (loss) before interest expense, net, income taxes and depreciation and amortization, with further adjustments to add back (i) items that terminated in connection with the IPO, (ii) non-cash charges, (iii) items that are not indicative of the underlying operating performance of the business and (iv) items that are solely related to changes in our capital structure, and therefore are not indicative of the underlying operating performance of the business.
Management uses Adjusted EBITDA (i) to compare our operating performance on a consistent basis, (ii) to calculate incentive compensation for our employees, (iii) for planning purposes, including the preparation of our internal annual operating budget, (iv) to evaluate the performance and effectiveness of our operational strategies and (v) to assess compliance with various metrics associated with the agreements governing our indebtedness. We also believe that Adjusted EBITDA is useful to investors in assessing our financial performance because this measure is similar to the metrics used by investors and other interested parties when comparing companies in our industry that have different capital structures, debt levels and/or income tax rates. Accordingly, we believe that Adjusted EBITDA provides useful information to investors and others in understanding and evaluating our operating performance in the same manner as our management.
Adjusted EBITDA is not determined in accordance with U.S. generally accepted accounting principles, or GAAP, and should not be considered in isolation or as an alternative to net income, income from operations, net cash provided by operating, investing or financing activities or other financial statement data presented as indicators of financial performance or liquidity, each as presented in accordance with GAAP. The table below presents information for the periods indicated about our Adjusted EBITDA. A reconciliation of Adjusted EBITDA to the most directly comparable GAAP financial measures is provided in the table below (in thousands).
|
|
|
Year Ended December 31, |
|
|||||||
|
|
|
2015 |
|
2014 |
|
2013 |
|
|||
|
Net income (loss) |
|
$ |
(36,627) |
|
$ |
15,583 |
|
$ |
99 |
|
|
Interest expense |
|
|
11,163 |
|
|
19,832 |
|
|
24,644 |
|
|
Income tax expense |
|
|
7,528 |
|
|
13,196 |
|
|
5,926 |
|
|
Depreciation and amortization |
|
|
41,224 |
|
|
35,102 |
|
|
32,468 |
|
|
EBITDA |
|
$ |
23,288 |
|
$ |
83,713 |
|
$ |
63,137 |
|
|
Equity-based compensation(a) |
|
|
86,745 |
|
|
8,034 |
|
|
9,787 |
|
|
Extinguishment of debt(b) |
|
|
1,750 |
|
|
2,894 |
|
|
7,922 |
|
|
Non-cash impairment charges(c) |
|
|
— |
|
|
— |
|
|
2,579 |
|
|
Management fee to related party(d) |
|
|
553 |
|
|
1,047 |
|
|
907 |
|
|
Acquisition expenses(e) |
|
|
945 |
|
|
462 |
|
|
902 |
|
|
Severance(f) |
|
|
2,095 |
|
|
1,084 |
|
|
625 |
|
|
Loss on disposal of property and equipment |
|
|
307 |
|
|
1,719 |
|
|
274 |
|
|
Other non-comparable items(g) |
|
|
1,802 |
|
|
3,606 |
|
|
2,159 |
|
|
Adjusted EBITDA |
|
$ |
117,485 |
|
$ |
102,559 |
|
$ |
88,292 |
|
|
(a) |
Equity-based compensation expense associated with (i) the modification of existing equity awards and forgiveness of loans associated with certain equity awards in connection with our IPO and the liquidating distribution of PG Holdco, LLC, and (ii) equity awards at the time of our IPO and subsequent equity awards granted to attract and retain employees. See Note 11 – Equity-Based Compensation in the Notes to Consolidated Financial Statements for classification of equity-based compensation on the Consolidated Statements of Operations for the periods indicated. |
|
(b) |
Write‑off of unamortized deferred financing fees, loss on original issuance discount and lender fees in connection with debt refinancings. See “Refinancings.” |
|
(c) |
Non-cash property and equipment and intangible impairment charges related to the discontinuation of certain clinical solutions in 2013. |
50
|
(d) |
Fees paid to our majority owner under a management agreement prior to our IPO. The management agreement was terminated upon the closing of the IPO. See Note 16 – Related Party Transactions in the Notes to Consolidated Financial Statements for additional details. |
|
(e) |
Transaction costs incurred in connection with completed and potential acquisitions. See “Acquisitions.” |
|
(f) |
Expense associated with executive separation agreements and targeted employee headcount reductions. |
|
(g) |
Other non‑comparable items include costs incurred in connection with our IPO, professional fees incurred in connection with capital structure and strategic corporate planning and revenue credits and expenses related to client retention due to the discontinuation of certain clinical solutions and software applications. We believe that these expenses are not comparable as they relate to individual projects and initiatives. As a result, we believe they should be excluded from Adjusted EBITDA in order to enable investors and other interested parties to more effectively assess our period‑over‑period and ongoing operating performance. |
Liquidity and Capital Resources
Overview
Our principal uses of cash are to meet working capital requirements, fund debt obligations, finance capital expenditures and fund strategic acquisitions. In addition, we expect to use cash to support our growth strategy. Our principal sources of funds are cash flows from operating activities and available borrowings under our Revolving Credit Facility.
As of December 31, 2015, we had cash of $35.2 million and $74.9 million of available borrowings under our Revolving Credit Facility (after giving effect to a $65,000 letter of credit outstanding under our Revolving Credit Facility). As of December 31, 2015, we had $189.3 million of outstanding indebtedness (including capital leases).
We believe that our cash flows from operations, cash on hand and available borrowings under our Revolving Credit Facility will be sufficient to meet our liquidity needs during the next twelve months and beyond. We anticipate that to the extent that we require additional liquidity, it will be funded through the incurrence of indebtedness, including borrowings under our Revolving Credit Facility, equity financings or a combination thereof. It is not guaranteed that we will be able to obtain this additional liquidity on reasonable terms, or at all. Our liquidity and our ability to meet our obligations and fund our capital requirements are also dependent on our future financial performance, which is subject to general economic, financial and other factors that are beyond our control. Accordingly, there can be no assurance that our business will generate sufficient cash flow from operations or that future borrowings will be available under our credit facilities or otherwise to meet our liquidity needs. If we decide to pursue one or more significant acquisitions, we may incur additional debt or sell additional equity to finance such acquisitions.
51
Cash Flows
The following table presents a summary of our cash flow for the periods indicated (in thousands):
|
|
|
|
|
|
|
|
|
|
|
|
|
|
|
Year ended December 31, |
|
|||||||
|
|
|
2015 |
|
2014 |
|
2013 |
|
|||
|
Net cash provided by operating activities |
|
$ |
88,641 |
|
$ |
54,768 |
|
$ |
53,911 |
|
|
Net cash used in investing activities |
|
|
(38,343) |
|
|
(47,591) |
|
|
(20,043) |
|
|
Net cash used in financing activities |
|
|
(22,025) |
|
|
(32,850) |
|
|
(9,078) |
|
|
Net increase (decrease) in cash |
|
$ |
28,273 |
|
$ |
(25,673) |
|
$ |
24,790 |
|
Year Ended December 31, 2015 compared to Year Ended December 31, 2014
Operating Activities
Cash provided by operating activities consisted of net income adjusted for certain non‑cash items, including depreciation and amortization, equity‑based compensation, extinguishment of debt, and deferred income taxes, as well as the effect of changes in working capital and other activities.
Net cash provided by operating activities for the year ended December 31, 2015 was $88.6 million compared to $54.8 million for the year ended December 31, 2014, an increase of $33.8 million, or 61.8%. In 2015, cash provided by operations primarily resulted from net earnings after adding back non-cash items offset by an increase in net working capital of $4.7 million. In 2014, cash provided by operations primarily resulted from net earnings after adding back non-cash items offset by an increase in net working capital of $4.9 million. The increase in cash provided by operating activities in 2015 as compared to 2014 is due to an increase in profitability after adjusting for non-cash expenses and a decrease in cash interest expense as a result of repayment of principal using proceeds from our IPO and refinancing our credit facilities at lower interest rates.
Investing Activities
Our primary investing activities relate to acquisitions and purchases of property and equipment, which includes investments in capitalized computer software development costs, facilities and equipment.
Net cash used in investing activities for the year ended December 31, 2015 was $38.3 million compared to $47.6 million for the year ended December 31, 2014, a decrease of $9.3 million, or 19.4%. Cash paid for acquisitions, net of cash acquired was $12.1 million in 2015 and included the acquisition of HPI and $28.2 million in 2014 and included the acquisitions of NDNQI and DCS. In 2015, purchases of property and equipment were $26.2 million and included $25.4 million of capitalized software development costs and $820,000 of equipment and leasehold improvements. In 2014, purchases of property and equipment were $19.4 million and included $14.9 million of capitalized software development costs and $2.6 million of equipment and facilities. Capitalized software development costs increased in 2015 from greater investments in our digital platform.
Financing Activities
Our primary financing activities consisted of borrowings under our credit facilities, payments on our long‑term debt and capital leases, repurchases of equity interests and proceeds from sales of equity units by our parent to employees, which were subsequently contributed to our equity. Additionally, financing activities include proceeds from our IPO, distributions related to our IPO and withholding of shares to satisfy employee tax withholding related to vested restricted stock units.
52
Net cash used in financing activities for the year ended December 31, 2015 was $22.0 million compared to $32.9 million for the year ended December 31, 2014, a decrease of $10.9 million, or 33.0%. In 2015, we used cash generated from operations after investing activities of $50.3 million along with $234.4 million raised from our IPO in May 2015 primarily to reduce our borrowings and to fund minimum employee tax withholdings for accelerated vesting of employee equity incentives as a result of our IPO, a final IPO-related distribution payment to our majority shareholder and payments on capital lease obligations. In 2015, we also incurred fees and payments related to entering into a new secured credit facility and used borrowings under this credit facility to retire our previous credit facility. In 2014, we used borrowings and our cash balances to fund operations after investing activities of $7.2 million, payments on indebtedness of $67.7 million and other financing activities related primarily to equity-related expenses and payments on capital leases.
Year Ended December 31, 2014 compared to Year Ended December 31, 2013
Operating Activities
Net cash provided by operating activities for the year ended December 31, 2014 was $54.8 million compared to $53.9 million for the year ended December 31, 2013, an increase of $0.9 million, or 1.6%. In 2014, cash provided by operations primarily resulted from net earnings after adding back non-cash items offset by an increase in net working capital of $4.9 million. In 2013, cash provided by operations primarily resulted from net earnings after adding back non-cash items offset by an increase in net working capital of $5.6 million. The increase in cash provided by operating activities in 2014 as compared to 2013 is due to a decrease in cash interest expense as a result of repayment of our Second Lien Term Loan in May 2014 and an increase in profitability after adjusting for non-cash expenses.
Investing Activities
Net cash used in investing activities was $47.6 million for the year ended December 31, 2014 compared to $20.0 million for the year ended December 31, 2013, an increase of $27.6 million, or 138.0%. This increase was primarily due to the acquisitions of NDNQI for $24.9 million and DCS for $3.3 million in the second quarter of 2014. Additionally, purchases of property and equipment of $19.4 million (including capitalized computer software development costs of $14.9 million) for 2014 exceeded purchases of $17.2 million (including capitalized computer software development costs of $16.5 million) for 2013, as we continued to invest in infrastructure, facilities, and software development.
Financing Activities
Net cash used in financing activities was $32.9 million for the year ended December 31, 2014 compared to $9.1 million for the year ended December 31, 2013, an increase of $23.8 million. This increase was mainly due to payments on long-term debt of $67.7 million in 2014, primarily in connection with the refinancing of our Second Lien Term Loan Facility, partially offset by the net proceeds from the incurrence of long-term debt of $41.8 million. Additionally, repurchases of equity interests were $3.7 million for 2014, compared to $2.3 million for 2013.
Credit Facilities
See Note 8 – Revolving Credit Facility and Long-Term Debt in the Notes to Consolidated Financial Statements for a description of our credit facilities.
53
Contractual Obligations and Commitments
Our contractual obligations and commitments as of December 31, 2015 are summarized in the table below (in thousands).
|
|
|
Payments Due by Period |
|
|||||||||||||
|
|
|
Total |
|
Less than 1 year |
|
1-3 years |
|
3-5 years |
|
More than 5 years |
|
|||||
|
Long-term debt(a) |
|
$ |
195,961 |
|
$ |
12,448 |
|
$ |
24,384 |
|
$ |
159,129 |
|
$ |
— |
|
|
Capital lease obligations |
|
|
9,531 |
|
|
5,174 |
|
|
3,840 |
|
|
517 |
|
|
— |
|
|
Operating lease obligations(b) |
|
|
8,793 |
|
|
3,214 |
|
|
3,755 |
|
|
1,783 |
|
|
41 |
|
|
Total |
|
$ |
214,285 |
|
$ |
20,836 |
|
$ |
31,979 |
|
$ |
161,429 |
|
$ |
41 |
|
|
(a) |
Represents the principal amount of our long‑term debt, including current portion, and the expected cash payments for interest based on the interest rates in place and amounts outstanding as of December 31, 2015. |
|
(b) |
For a more detailed description of our operating leases, see Note 9 – Leases in the Notes to Consolidated Financial Statements. |
Off‑Balance Sheet Arrangements
As of December 31, 2015, we do not have any off‑balance sheet transactions or interests.
Application of Critical Accounting Policies and Estimates
Management’s Discussion and Analysis of Financial Condition and Results of Operations is based upon our Consolidated Financial Statements, which have been prepared using accounting principles generally accepted in the United States of America. Our significant accounting policies are discussed in Note 2 – Summary of Significant Accounting Policies in the Notes to Consolidated Financial Statements included in Item 8 of this Report. The preparation of these financial statements requires management to make estimates and assumptions that are believed to be reasonable under the circumstances, the results of which form the basis for making judgments about the carrying values of assets and liabilities that are not readily apparent from other sources. Actual results may differ from these estimates under different assumptions or conditions. If actual amounts are ultimately different from previous estimates, the revisions are included in our results of operations for the period in which the actual amounts become known.
An accounting policy is deemed to be critical if it requires an accounting estimate to be made based on assumptions about matters that are highly uncertain at the time the estimate is made, and if different estimates that reasonably could have been used, or if changes in the accounting estimates that are reasonably likely to occur periodically, could materially impact the financial statements. Management believes its critical accounting policies that reflect its more significant estimates and assumptions relate to revenue recognition, property and equipment, goodwill and intangible assets, and equity-based compensation.
Revenue Recognition
Revenue relates to services provided typically under annually renewable contracts, primarily summarizing and benchmarking hospital patient experience surveys and quality improvement services. For annual service contracts, revenue is recognized on a ratable basis over the life of the contract. The contracts are generally cancelable on short or no notice by the customer without penalty. The Company offers a variety of billing arrangements to its customers. Any amounts billed in excess of the revenue recognized result in deferred revenue. The Company recognizes revenue for services that have been earned but not billed. These unbilled amounts are recorded in other receivables on the consolidated balance sheets.
54
Business Combinations
The Company accounts for acquisitions of businesses under the purchase method of accounting and allocates the purchase price to the tangible assets, specifically identifiable intangible assets and liabilities assumed based upon their respective fair values. The excess of the purchase price over these estimated fair values is allocated to goodwill. The operating results of the businesses acquired are included in the consolidated statements of operations from the date of acquisition.
Equity‑Based Compensation
Prior to the IPO, our former parent, PG Holdco, LLC (the “Parent”) adopted an equity‑based compensation plan, or the Plan, which authorized the granting of various equity awards of preferred units, Class A common units, Class A‑1 common units, Class B common units, and Class C common units of the Parent to the Company’s employees and directors. The fair value of the awards of the Parent was reflected as expense on the accounts of the Company because the recipients were employees of the Company. On an annual basis, the Company determined the fair value of each class of its Parent’s equity units using an enterprise value allocation methodology. In order to determine the enterprise value, the Company used a variety of widely accepted valuation techniques which considered a number of factors such as its financial performance, the values of comparable companies and the lack of marketability of the Parent’s equity instruments. Significant assumptions included the expected term in which the units would be realized; a risk‑free interest rate equal to the U.S. federal treasury bond rate consistent with the term assumption; expected dividend yield, for which there was none; and expected volatility based on the historical data of equity instruments of comparable companies. The Company classified immature awards as liabilities due to the Parent’s right to repurchase the awards from the employee and the Parent’s history of exercising such rights. The Company funded the Parent’s repurchase obligations as the Parent was dependent upon the Company to meet its obligations. The Parent’s repurchase right permitted an employee to avoid the risks and rewards normally associated with equity ownership. The Company recorded compensation expense as units vested based upon the fair value of the respective award and adjusted the accumulated immature awards to fair value in cost of revenue and general and administrative expenses in the consolidated statement of operations.
The Company accounts for equity-based compensation, primarily consisting of restricted stock, based on the fair value of the award at grant date, which is typically the closing stock price, and recognizes compensation expense over the requisite service period.
Goodwill and Intangible Assets
Goodwill represents the excess of costs over fair value of net assets of businesses acquired. Goodwill and intangible assets acquired in connection with business combinations and determined to have indefinite lives are not amortized, but are instead tested for impairment at least annually.
The Company evaluates goodwill first using a qualitative assessment to determine whether it is more likely than not that the fair value of its reporting unit is less than its carrying amount. If the qualitative assessment indicates that the fair value of the reporting unit may be less than its carrying amount, the Company evaluates goodwill using a two‑step impairment test; otherwise, the Company concludes that there is no impairment and does not perform the two‑step impairment test. If the qualitative assessment concludes that the two‑step impairment test is necessary, the Company first compares the book value of the reporting unit, including goodwill, with its fair value. The fair value is estimated based on a market approach and a discounted cash flow analysis, also known as the income approach, and is reconciled back to the estimated equity value for the Company to ensure that the implied control premium is reasonable. If the book value of a reporting unit exceeds its fair value, the Company performs the second step to estimate an implied fair value of the reporting unit’s goodwill by allocating the fair value of the reporting unit to all of the assets and liabilities other than goodwill (including any unrecognized intangible assets). The difference between the total fair value of the reporting unit and the fair value of all the assets and liabilities other than goodwill is the implied fair value of that goodwill. The amount of impairment loss is equal to the excess of the book value of the goodwill over the implied fair value of that goodwill.
55
The Company evaluates indefinite‑lived intangible assets using a qualitative assessment to determine whether it is more likely than not that the fair value of the indefinite‑lived intangible asset is less than its carrying amount. If the qualitative assessment indicates that the fair value may be less than its carrying amount, the fair value of the intangible asset is estimated and compared to its carrying value to determine if impairment exists. Otherwise, the Company concludes that there is no impairment and does not perform the quantitative test. When the qualitative assessment is not utilized and a quantitative test is performed, the Company estimates the fair value of these intangible assets using the relief‑from‑royalty method, which requires assumptions related to royalty rates that the owner would otherwise be willing to pay to use the asset, as well as projected revenues from the Company’s long‑range plan. Intangible assets with estimable useful lives are amortized over their respective estimated useful lives and reviewed for impairment when impairment indicators are present.
Property and Equipment
Property and equipment consists of leasehold improvements, furniture, fixtures, equipment and capitalized internal software development costs. Property and equipment is stated at cost, less accumulated depreciation and amortization. Plant and equipment under capital leases are stated at the present value of their minimum lease payments.
Computer software development costs that are incurred in the preliminary project stage are expensed as incurred. During the development stage, direct consulting costs and payroll and payroll related costs for employees that are directly associated with each project are capitalized and amortized over the estimated useful life of the software once placed into operation. Replacements and major improvements are capitalized, while maintenance and repairs are charged to expense as incurred.
Depreciation is computed on a straight‑line basis over the estimated useful lives of the respective assets. Amortization of leasehold improvements is computed on a straight‑line basis over the shorter of the lease term or estimated useful life of the asset and is included in depreciation expense. The estimated useful lives of property and equipment are as follows:
|
Computer equipment and software |
3 years |
|
Furniture and fixtures |
5 ‑ 7 years |
|
Leasehold improvements |
Shorter of lease term or useful life |
|
Office equipment |
3 ‑ 5 years |
56
Quarterly Results of Operations
The following table sets forth our unaudited consolidated statement of operations data for each of the eight quarters in the two‑year period ended December 31, 2015. The unaudited quarterly statement of operations data set forth below have been prepared on a basis consistent with our audited annual consolidated financial statements and include, in our opinion, all normal recurring adjustments necessary for a fair statement of the financial information contained in those statements. Our historical results are not necessarily indicative of the results that may be expected in the future. The following quarterly financial data should be read in conjunction with our audited consolidated financial statements and the related notes included elsewhere in this annual report.
|
|
|
Three Months Ended |
|
||||||||||||||||||||||
|
|
|
March 31, |
|
June 30, |
|
September 30, |
|
December 31, |
|
March 31, |
|
June 30, |
|
September 30, |
|
December 31, |
|
||||||||
|
|
|
2014 |
|
2014 |
|
2014 |
|
2014 |
|
2015 |
|
2015 |
|
2015 |
|
2015 |
|
||||||||
|
|
|
|
(in thousands) |
|
|||||||||||||||||||||
|
Statement of Operations Data: |
|
|
|
|
|
|
|
|
|
|
|
|
|
|
|
|
|
|
|
|
|
|
|
|
|
|
Revenue |
|
$ |
65,404 |
|
$ |
68,365 |
|
$ |
71,713 |
|
$ |
76,130 |
|
$ |
74,891 |
|
$ |
77,458 |
|
$ |
80,730 |
|
$ |
85,615 |
|
|
Total operating expenses |
|
|
53,531 |
|
|
55,718 |
|
|
57,819 |
|
|
61,992 |
|
|
59,541 |
|
|
132,466 |
|
|
68,021 |
|
|
74,299 |
|
|
Income from operations |
|
|
11,873 |
|
|
12,647 |
|
|
13,894 |
|
|
14,138 |
|
|
15,350 |
|
|
(55,008) |
|
|
12,709 |
|
|
11,316 |
|
|
Income (loss) before income taxes |
|
|
6,179 |
|
|
4,565 |
|
|
8,950 |
|
|
9,085 |
|
|
10,485 |
|
|
(59,688) |
|
|
10,030 |
|
|
10,074 |
|
|
Provision for (benefit from) income taxes |
|
|
2,883 |
|
|
2,128 |
|
|
4,174 |
|
|
4,011 |
|
|
4,511 |
|
|
(5,871) |
|
|
2,614 |
|
|
6,274 |
|
|
Net income (loss) |
|
$ |
3,296 |
|
$ |
2,437 |
|
$ |
4,776 |
|
$ |
5,074 |
|
$ |
5,974 |
|
$ |
(53,817) |
|
$ |
7,416 |
|
$ |
3,800 |
|
|
Earnings (net loss) per share: |
|
|
|
|
|
|
|
|
|
|
|
|
|
|
|
|
|
|
|
|
|
|
|
|
|
|
Basic |
|
$ |
0.08 |
|
$ |
0.06 |
|
$ |
0.11 |
|
$ |
0.12 |
|
$ |
0.14 |
|
$ |
(1.15) |
|
$ |
0.14 |
|
$ |
0.07 |
|
|
Diluted |
|
$ |
0.08 |
|
$ |
0.06 |
|
$ |
0.11 |
|
$ |
0.12 |
|
$ |
0.14 |
|
$ |
(1.15) |
|
$ |
0.14 |
|
$ |
0.07 |
|
Emerging Growth Company
We qualify as an “emerging growth company” pursuant to the provisions of the JOBS Act. For as long as we are an emerging growth company, we may take advantage of certain exemptions from various reporting requirements that are applicable to other public companies that are not emerging growth companies, including, but not limited to, not being required to comply with the auditor attestation requirements of Section 404 of the Sarbanes-Oxley Act and reduced disclosure obligations regarding executive compensation in our annual reports and proxy statements.
In addition, the JOBS Act provides that an emerging growth company can take advantage of an extended transition period for complying with new or revised accounting standards. We have irrevocably elected not to avail ourselves of this exemption and, therefore, we will be subject to the same new or revised accounting standards as other public companies that are not emerging growth companies.
Item 7A. Quantitative and Qualitative Disclosures about Market Risk
Interest Rate Risk
We are subject to interest rate risk in connection with our long‑term indebtedness. Our primary interest rate exposure relates to loans outstanding under our Term Loan and Revolving Credit Facility. All outstanding indebtedness under the Term Loan and Revolving Credit Facility bears interest at a variable rate. Each quarter point change in interest rates on such indebtedness under our Term Loan would result in a change of $457,000 to our interest expense on an annual basis, based on our outstanding balance of $182.7 million (exclusive of deferred financing fees) at December 31, 2015. There were no borrowings under the Revolving Credit Facility at December 31, 2015. Assuming the $74.9 million of current borrowing capacity were drawn under the Revolving Credit Facility, a hypothetical quarter point change in interest rates on such variable rate debt would change our annual interest expense by $187,000.
57
Item 8. Financial Statements and Supplementary Data
INDEX TO CONSOLIDATED FINANCIAL STATEMENTS
|
Consolidated Financial Statements |
|
|
|
|
59 | |
|
|
60 | |
|
|
61 | |
|
|
62 | |
|
|
63 | |
|
|
64 |
58
REPORT OF INDEPENDENT REGISTERED PUBLIC ACCOUNTING FIRM
The Board of Directors and Shareholders of Press Ganey Holdings, Inc.
We have audited the accompanying consolidated balance sheets of Press Ganey Holdings, Inc. as of December 31, 2015 and 2014, and the related consolidated statements of operations, shareholder’s equity and cash flows for each of the three years in the period ended December 31, 2015. Our audits also included the financial statement schedule listed in the Index at Item 15(a)2. These financial statements and schedule are the responsibility of the Company’s management. Our responsibility is to express an opinion on these financial statements and schedule based on our audits.
We conducted our audits in accordance with the standards of the Public Company Accounting Oversight Board (United States). Those standards require that we plan and perform the audit to obtain reasonable assurance about whether the financial statements are free of material misstatement. We were not engaged to perform an audit of the Company’s internal control over financial reporting. Our audits included consideration of internal control over financial reporting as a basis for designing audit procedures that are appropriate in the circumstances, but not for the purpose of expressing an opinion on the effectiveness of the Company’s internal control over financial reporting. Accordingly, we express no such opinion. An audit also includes examining, on a test basis, evidence supporting the amounts and disclosures in the financial statements, assessing the accounting principles used and significant estimates made by management, and evaluating the overall financial statement presentation. We believe that our audits provide a reasonable basis for our opinion.
In our opinion, the financial statements referred to above present fairly, in all material respects, the consolidated financial position of Press Ganey Holdings, Inc. at December 31, 2015 and 2014, and the consolidated results of its operations and its cash flows for each of the three years in the period ended December 31, 2015, in conformity with U.S. generally accepted accounting principles. Also, in our opinion, the related financial statement schedule, when considered in relation to the basic financial statements taken as a whole, present fairly in all material respects the information set forth therein.
/s/ Ernst & Young LLP
Chicago, Illinois
March 1, 2016
59
Press Ganey Holdings, Inc.
(Thousands of dollars, except share and per share amounts)
|
|
|
December 31, |
|
||||
|
|
|
2015 |
|
2014 |
|
||
|
ASSETS |
|
|
|
|
|
|
|
|
Current assets: |
|
|
|
|
|
|
|
|
Cash |
|
$ |
35,235 |
|
$ |
6,962 |
|
|
Accounts receivable, net of allowances of $774 and $531 at December 31, 2015 and December 31, 2014, respectively |
|
|
53,568 |
|
|
44,444 |
|
|
Other receivables |
|
|
2,993 |
|
|
1,782 |
|
|
Prepaid expenses and other assets |
|
|
4,603 |
|
|
2,741 |
|
|
Income taxes receivable |
|
|
4,603 |
|
|
2,916 |
|
|
Total current assets |
|
|
101,002 |
|
|
58,845 |
|
|
Property and equipment, net |
|
|
60,262 |
|
|
59,610 |
|
|
Deferred financing fees, net |
|
|
897 |
|
|
810 |
|
|
Intangible assets, net |
|
|
362,465 |
|
|
375,391 |
|
|
Goodwill |
|
|
411,203 |
|
|
402,934 |
|
|
Total assets |
|
$ |
935,829 |
|
$ |
897,590 |
|
|
LIABILITIES AND SHAREHOLDERS' EQUITY |
|
|
|
|
|
|
|
|
Current liabilities: |
|
|
|
|
|
|
|
|
Current portion of long-term debt |
|
$ |
9,250 |
|
$ |
4,279 |
|
|
Current portion of capital lease obligations |
|
|
4,626 |
|
|
4,373 |
|
|
Accounts payable |
|
|
9,420 |
|
|
13,232 |
|
|
Accrued payroll and related liabilities |
|
|
15,830 |
|
|
11,704 |
|
|
Accrued expenses and other liabilities |
|
|
1,969 |
|
|
1,581 |
|
|
Deferred revenue |
|
|
31,555 |
|
|
26,208 |
|
|
Total current liabilities |
|
|
72,650 |
|
|
61,377 |
|
|
Long-term debt, less current portion |
|
|
171,226 |
|
|
402,888 |
|
|
Capital lease obligations, less current portion |
|
|
4,165 |
|
|
6,779 |
|
|
Equity-based compensation liability |
|
|
— |
|
|
19,423 |
|
|
Deferred income taxes |
|
|
125,179 |
|
|
126,479 |
|
|
Total liabilities |
|
|
373,220 |
|
|
616,946 |
|
|
Commitments and contingencies |
|
|
— |
|
|
— |
|
|
SHAREHOLDERS' EQUITY |
|
|
|
|
|
|
|
|
Common stock, $0.01 par value; 350,000,000 and 44,800,000 shares authorized, and 52,770,722 and 43,313,200 shares issued and outstanding as of December 31, 2015 and December 31, 2014, respectively |
|
|
528 |
|
|
433 |
|
|
Additional paid-in capital |
|
|
598,575 |
|
|
270,847 |
|
|
Retained earnings (accumulated deficit) |
|
|
(36,494) |
|
|
9,364 |
|
|
Total shareholders' equity |
|
|
562,609 |
|
|
280,644 |
|
|
Total liabilities and shareholders' equity |
|
$ |
935,829 |
|
$ |
897,590 |
|
The accompanying notes to consolidated financial statements are an integral part of these statements.
60
Press Ganey Holdings, Inc.
Consolidated Statements of Operations
(Thousands of dollars, except share and per share amounts)
|
|
|
Year Ended December 31, |
|
|||||||
|
|
|
2015 |
|
2014 |
|
2013 |
|
|||
|
Revenue |
|
$ |
318,694 |
|
$ |
281,612 |
|
$ |
260,420 |
|
|
Operating expenses: |
|
|
|
|
|
|
|
|
|
|
|
Cost of revenue |
|
|
149,235 |
|
|
121,807 |
|
|
113,675 |
|
|
General and administrative |
|
|
143,561 |
|
|
70,432 |
|
|
71,926 |
|
|
Depreciation and amortization |
|
|
41,224 |
|
|
35,102 |
|
|
32,468 |
|
|
Impairment charges |
|
|
— |
|
|
— |
|
|
2,579 |
|
|
Loss on disposal of property and equipment |
|
|
307 |
|
|
1,719 |
|
|
274 |
|
|
Total operating expenses |
|
|
334,327 |
|
|
229,060 |
|
|
220,922 |
|
|
Income (loss) from operations |
|
|
(15,633) |
|
|
52,552 |
|
|
39,498 |
|
|
Other income (expense): |
|
|
|
|
|
|
|
|
|
|
|
Interest expense, net |
|
|
(11,163) |
|
|
(19,832) |
|
|
(24,644) |
|
|
Extinguishment of debt |
|
|
(1,750) |
|
|
(2,894) |
|
|
(7,922) |
|
|
Management fee of related party |
|
|
(553) |
|
|
(1,047) |
|
|
(907) |
|
|
Total other income (expense), net |
|
|
(13,466) |
|
|
(23,773) |
|
|
(33,473) |
|
|
Income (loss) before income taxes |
|
|
(29,099) |
|
|
28,779 |
|
|
6,025 |
|
|
Provision for income taxes |
|
|
7,528 |
|
|
13,196 |
|
|
5,926 |
|
|
Net income (loss) |
|
$ |
(36,627) |
|
$ |
15,583 |
|
$ |
99 |
|
|
Earnings (net loss) per share: |
|
|
|
|
|
|
|
|
|
|
|
Basic |
|
$ |
(0.75) |
|
$ |
0.36 |
|
$ |
0.00 |
|
|
Diluted |
|
$ |
(0.75) |
|
$ |
0.36 |
|
$ |
0.00 |
|
|
Weighted average shares of common stock outstanding: |
|
|
|
|
|
|
|
|
|
|
|
Basic |
|
|
48,891,327 |
|
|
43,313,200 |
|
|
43,313,200 |
|
|
Diluted |
|
|
48,891,327 |
|
|
43,313,200 |
|
|
43,313,200 |
|
The accompanying notes to consolidated financial statements are an integral part of these statements.
61
Press Ganey Holdings, Inc.
Consolidated Statement of Shareholders’ Equity
(Thousands of dollars, except share amounts)
|
|
|
|
|
|
|
|
|
|
|
Retained |
|
|
|
|
|
|
|
|
|
|
|
|
|
Additional |
|
Earnings |
|
Total |
|
|||
|
|
|
Common Stock |
|
Paid-in |
|
(Accumulated |
|
Shareholders' |
|
||||||
|
|
|
Shares |
|
Amount |
|
Capital |
|
Deficit) |
|
Equity |
|
||||
|
Balance at January 1, 2013 |
|
43,313,200 |
|
$ |
433 |
|
$ |
264,891 |
|
$ |
(296) |
|
$ |
265,028 |
|
|
Sale of equity interests |
|
— |
|
|
— |
|
|
1,189 |
|
|
— |
|
|
1,189 |
|
|
Purchases of equity interests |
|
— |
|
|
— |
|
|
— |
|
|
(2,314) |
|
|
(2,314) |
|
|
Equity-based compensation |
|
— |
|
|
— |
|
|
2,205 |
|
|
— |
|
|
2,205 |
|
|
Net income |
|
— |
|
|
— |
|
|
— |
|
|
99 |
|
|
99 |
|
|
Balance at December 31, 2013 |
|
43,313,200 |
|
|
433 |
|
|
268,285 |
|
|
(2,511) |
|
|
266,207 |
|
|
Sale of equity interests |
|
— |
|
|
— |
|
|
500 |
|
|
— |
|
|
500 |
|
|
Purchases of equity interests |
|
— |
|
|
— |
|
|
— |
|
|
(3,708) |
|
|
(3,708) |
|
|
Equity-based compensation |
|
— |
|
|
— |
|
|
2,062 |
|
|
— |
|
|
2,062 |
|
|
Net income |
|
— |
|
|
— |
|
|
— |
|
|
15,583 |
|
|
15,583 |
|
|
Balance at December 31, 2014 |
|
43,313,200 |
|
|
433 |
|
|
270,847 |
|
|
9,364 |
|
|
280,644 |
|
|
Sales of equity interests |
|
— |
|
|
— |
|
|
100 |
|
|
— |
|
|
100 |
|
|
Purchase of equity interests |
|
— |
|
|
— |
|
|
— |
|
|
(731) |
|
|
(731) |
|
|
Equity-based compensation |
|
— |
|
|
— |
|
|
85,014 |
|
|
— |
|
|
85,014 |
|
|
Impact of liquidation of PG Holdco, LLC |
|
(1,028,122) |
|
|
(10) |
|
|
10 |
|
|
— |
|
|
— |
|
|
Conversion of equity-based compensation liability |
|
— |
|
|
— |
|
|
21,008 |
|
|
— |
|
|
21,008 |
|
|
Vesting of restricted stock |
|
328,429 |
|
|
3 |
|
|
(3) |
|
|
— |
|
|
— |
|
|
Cancellation of shares |
|
(7,365) |
|
|
— |
|
|
— |
|
|
— |
|
|
— |
|
|
Taxes paid for net settlements of restricted stock vesting |
|
(70,420) |
|
|
— |
|
|
(12,736) |
|
|
— |
|
|
(12,736) |
|
|
Distribution payments |
|
— |
|
|
— |
|
|
— |
|
|
(8,500) |
|
|
(8,500) |
|
|
Initial public offering of common stock, net of issuance costs |
|
10,235,000 |
|
|
102 |
|
|
234,335 |
|
|
— |
|
|
234,437 |
|
|
Net loss |
|
— |
|
|
— |
|
|
— |
|
|
(36,627) |
|
|
(36,627) |
|
|
Balance at December 31, 2015 |
|
52,770,722 |
|
$ |
528 |
|
$ |
598,575 |
|
$ |
(36,494) |
|
$ |
562,609 |
|
The accompanying notes to consolidated financial statements are an integral part of these statements.
62
Press Ganey Holdings, Inc.
Consolidated Statements of Cash Flows
(Thousands of dollars)
|
|
|
December 31, |
|
|||||||
|
|
|
2015 |
|
2014 |
|
2013 |
|
|||
|
Operating activities |
|
|
|
|
|
|
|
|
|
|
|
Net income (loss) |
|
$ |
(36,627) |
|
$ |
15,583 |
|
$ |
99 |
|
|
Adjustments to reconcile net income (loss) to net cash provided by operating activities: |
|
|
|
|
|
|
|
|
|
|
|
Depreciation and amortization |
|
|
41,224 |
|
|
35,102 |
|
|
32,468 |
|
|
Amortization of deferred financing fees and debt discount |
|
|
682 |
|
|
879 |
|
|
1,531 |
|
|
Equity-based compensation |
|
|
86,745 |
|
|
8,034 |
|
|
9,787 |
|
|
Extinguishment of debt |
|
|
1,750 |
|
|
2,894 |
|
|
7,922 |
|
|
Provision for doubtful accounts |
|
|
521 |
|
|
289 |
|
|
400 |
|
|
Impairment charges |
|
|
— |
|
|
— |
|
|
2,579 |
|
|
Loss on disposal of property and equipment |
|
|
307 |
|
|
1,719 |
|
|
274 |
|
|
Deferred income taxes |
|
|
(1,300) |
|
|
(4,807) |
|
|
4,453 |
|
|
Changes in assets and liabilities: |
|
|
|
|
|
|
|
|
|
|
|
Accounts receivable |
|
|
(8,317) |
|
|
(2,420) |
|
|
(3,380) |
|
|
Other receivables |
|
|
(329) |
|
|
(623) |
|
|
(596) |
|
|
Prepaid expenses and other assets |
|
|
(1,859) |
|
|
1,319 |
|
|
(406) |
|
|
Accounts payable |
|
|
(225) |
|
|
(3) |
|
|
(2,785) |
|
|
Accrued payroll and related liabilities |
|
|
3,774 |
|
|
678 |
|
|
3,770 |
|
|
Accrued expenses and other liabilities |
|
|
388 |
|
|
342 |
|
|
121 |
|
|
Deferred revenue |
|
|
3,594 |
|
|
(5,183) |
|
|
(1,782) |
|
|
Income taxes receivable |
|
|
(1,687) |
|
|
965 |
|
|
(544) |
|
|
Net cash provided by operating activities |
|
|
88,641 |
|
|
54,768 |
|
|
53,911 |
|
|
Investing activities |
|
|
|
|
|
|
|
|
|
|
|
Acquisitions of businesses, net of cash acquired |
|
|
(12,146) |
|
|
(28,177) |
|
|
(2,813) |
|
|
Purchases of property and equipment |
|
|
(26,197) |
|
|
(19,414) |
|
|
(17,230) |
|
|
Net cash used in investing activities |
|
|
(38,343) |
|
|
(47,591) |
|
|
(20,043) |
|
|
Financing activities |
|
|
|
|
|
|
|
|
|
|
|
Proceeds from the issuance of long-term debt |
|
|
185,000 |
|
|
41,825 |
|
|
50,000 |
|
|
Payments on long-term debt |
|
|
(410,769) |
|
|
(67,662) |
|
|
(55,337) |
|
|
Deferred financing payments |
|
|
(3,441) |
|
|
(508) |
|
|
(851) |
|
|
Payments on capital lease obligations |
|
|
(5,385) |
|
|
(3,297) |
|
|
(1,641) |
|
|
Contingent purchase consideration |
|
|
— |
|
|
— |
|
|
(124) |
|
|
Proceeds from sale of equity interests |
|
|
100 |
|
|
500 |
|
|
1,189 |
|
|
Purchases of equity interests |
|
|
(731) |
|
|
(3,708) |
|
|
(2,314) |
|
|
Taxes paid for net settlements of restricted stock vesting |
|
|
(12,736) |
|
|
— |
|
|
— |
|
|
Distribution payments |
|
|
(8,500) |
|
|
— |
|
|
— |
|
|
Proceeds from the issuance of common stock in initial public offering, net of fees |
|
|
234,437 |
|
|
— |
|
|
— |
|
|
Net cash used in financing activities |
|
|
(22,025) |
|
|
(32,850) |
|
|
(9,078) |
|
|
Net increase (decrease) in cash |
|
|
28,273 |
|
|
(25,673) |
|
|
24,790 |
|
|
Cash at beginning of period |
|
|
6,962 |
|
|
32,635 |
|
|
7,845 |
|
|
Cash at end of period |
|
$ |
35,235 |
|
$ |
6,962 |
|
$ |
32,635 |
|
|
Supplemental disclosure of cash flow information |
|
|
|
|
|
|
|
|
|
|
|
Cash paid during the period for interest |
|
$ |
10,500 |
|
$ |
18,888 |
|
$ |
22,858 |
|
|
Cash paid during the period for income taxes |
|
|
10,329 |
|
|
16,933 |
|
|
2,195 |
|
|
Disposal of property and equipment acquired through capital leases |
|
|
333 |
|
|
— |
|
|
— |
|
|
Property and equipment acquired through capital leases |
|
|
3,357 |
|
|
10,117 |
|
|
1,680 |
|
|
Purchase of property and equipment in accounts payable |
|
|
2,782 |
|
|
6,459 |
|
|
911 |
|
The accompanying notes to consolidated financial statements are an integral part of these statements.
63
Press Ganey Holdings, Inc.
Notes to Consolidated Financial Statements
(All tables in thousands, except per share amounts)
1. Basis of Presentation
Press Ganey Holdings, Inc. (the “Company”) is a leading provider of patient experience and caregiver measurement, performance analytics and strategic advisory solutions for healthcare organizations across the continuum of care. The consolidated financial statements include the financial statements of Press Ganey Holdings, Inc. and its wholly owned subsidiary, Press Ganey Associates (“Associates”), and Associates’ wholly owned subsidiaries, PatientImpact LLC; Data Advantage LLC; Center for Performance Services, Inc.; Morehead Associates, Inc.; On The Spot Systems, Inc.; Dynamic Clinical Systems, Inc.; and Healthcare Performance Improvement, LLC. All significant intercompany balances and transactions have been eliminated in consolidation. Prior to the initial public offering (discussed below), the Company was a wholly owned subsidiary of PG Holdco, LLC (the “Parent”).
Effective May 8, 2015, the name of the Company was changed from PGA Holdings, Inc. to Press Ganey Holdings, Inc.
Initial Public Offering
In May 2015, the Company completed its initial public offering (the “IPO”) of 8,900,000 shares of common stock and, upon the underwriters’ exercise of their option to purchase additional shares, issued an additional 1,335,000 shares for a total of 10,235,000 shares issued at an offering price of $25.00 per share. Proceeds from the IPO were approximately $234.4 million, net of underwriting discounts and commissions and offering-related transaction costs incurred. In connection with the IPO: (i) the Parent was liquidated and its sole asset, the shares of the Company’s common stock, was distributed to the equity holders based on their relative rights under the limited liability company agreement, (ii) the Company recognized $70.4 million of equity-based compensation expense for the modification of certain units of the Parent, (iii) the Company paid a one-time transaction advisory fee of $8.5 million to Vestar Capital Partners, LLC (“Vestar”), and (iv) the Company recognized a loss on extinguishment of debt of $638,000 related to the write-off of deferred financing fees, loss on original issue discount and lender fees as a result of the partial repayment of its term loan facility with the net proceeds of the IPO.
Stock Split
On May 8, 2015, the Company’s common stock was split at a 2,800-for-one ratio. The authorized shares were increased to 350.0 million. Accordingly, all references to numbers of common shares and per-share data in the accompanying consolidated financial statements have been adjusted to reflect the stock split on a retroactive basis.
Preferred Stock
On May 27, 2015, the Company amended and restated its certificate of incorporation to, among other things, authorize 50.0 million shares of preferred stock with a par value of $0.01.
Use of Estimates
The preparation of the consolidated financial statements in accordance with U.S. generally accepted accounting principles requires management to make certain estimates and judgments that affect the reported amounts of assets, liabilities, revenues, and expenses. Actual results could materially differ from those estimates.
64
2. Summary of Significant Accounting Policies
Cash
The Company places its cash with institutions with high credit quality. However, at certain times, such cash may be in excess of Federal Deposit Insurance Corporation and Securities Investor Protection Corporation insurance limits.
Accounts Receivable
Accounts receivable are carried at sales value less an allowance for doubtful accounts. The allowance for doubtful accounts is the Company’s best estimate of the amount of probable credit losses in the Company’s existing accounts receivable. The Company periodically evaluates accounts receivable and establishes an allowance for doubtful accounts based on a combination of specific customer circumstances, credit conditions and the history of write‑ offs and collections. The Company evaluates items on an individual basis when determining accounts receivable write‑offs. In general, the Company’s policy is to not charge interest on trade receivables after the invoice becomes past due. A receivable is considered past due if payment has not been received within agreed upon invoice terms. Account balances are charged off against the allowance after all normal means of collection have been exhausted and the potential for recovery is considered remote. The Company does not have any off‑balance‑sheet credit exposure related to its customers, and collateral is generally not required.
Property and Equipment
Property and equipment consists of leasehold improvements, furniture, fixtures, equipment and capitalized internal software development costs. Property and equipment is stated at cost, less accumulated depreciation and amortization. Plant and equipment under capital leases are stated at the present value of their minimum lease payments.
Computer software development costs that are incurred in the preliminary project stage are expensed as incurred. During the development stage, direct consulting costs and payroll and payroll related costs for employees that are directly associated with each project are capitalized and amortized over the estimated useful life of the software once placed into operation. Replacements and major improvements are capitalized, while maintenance and repairs are charged to expense as incurred.
Depreciation is computed on a straight‑line basis over the estimated useful lives of the respective assets. Amortization of leasehold improvements is computed on a straight‑line basis over the shorter of the lease term or estimated useful life of the asset and is included in depreciation expense. The estimated useful lives of property and equipment are as follows:
|
Computer equipment and software |
|
|
|
3 |
years |
|
Furniture and fixtures |
|
5 |
- |
7 |
years |
|
Leasehold improvements |
|
Shorter of lease term or useful life |
|||
|
Office equipment |
|
3 |
- |
5 |
years |
Operating Leases
The Company leases its office space and various office equipment under operating lease agreements. In general, the leases contain renewal options and require the Company to pay executory costs (real estate taxes, insurance, and repairs). Some of the leases contain future rent increases, free rent periods, or periods in which rent payments are reduced. The total amount of rental payments due over the lease term is charged to rent expense on a straight‑line basis over the term of the lease. The difference between rent expense recorded and the amount paid is credited or charged to accrued expenses and other liabilities in the consolidated balance sheet.
65
Fair Value of Financial Instruments
The Company measures and reports its financial assets and liabilities on the basis of fair value. Fair value is defined as the price that would be received to sell an asset or paid to transfer a liability (an exit price) in the principal or most advantageous market for the asset or liability in an orderly transaction between market participants on the measurement date.
Deferred Financing Fees
Costs incurred related to obtaining financing arrangements are capitalized and amortized over the term of the financing arrangement as a component of interest expense using the effective interest method. Deferred financing fees related to term loan borrowings are presented in the consolidated balance sheet as a direct deduction from the carrying amount of the debt liability and deferred financing fees related to the Company’s revolving credit facility are presented as an asset. Write‑offs of unamortized deferred financing fees associated with debt amendments and refinancings are included as extinguishment of debt in the consolidated statements of operations. The Company recognized interest expense for the amortization of financing costs of $635,000, $728,000, and $1.1 million for the years ended December 31, 2015, 2014, and 2013, respectively.
Business Combinations
The Company accounts for acquisitions of businesses under the purchase method of accounting and allocates the purchase price to the tangible assets, specifically identifiable intangible assets and liabilities assumed based upon their respective fair values. The excess of the purchase price over these estimated fair values is allocated to goodwill. The operating results of the businesses acquired are included in the consolidated statements of operations from the date of acquisition.
Goodwill and Intangible Assets
Goodwill represents the excess of costs over fair value of net assets of businesses acquired. Goodwill and intangible assets acquired in connection with business combinations and determined to have indefinite lives are not amortized, but are instead tested for impairment at least annually.
The Company evaluates goodwill first using a qualitative assessment to determine whether it is more likely than not that the fair value of its reporting unit is less than its carrying amount. If the qualitative assessment indicates that the fair value of the reporting unit may be less than its carrying amount, the Company evaluates goodwill using a two‑step impairment test; otherwise, the Company concludes that there is no impairment and does not perform the two‑step impairment test. If the qualitative assessment concludes that the two‑step impairment test is necessary, the Company first compares the book value of the reporting unit, including goodwill, with its fair value. The fair value is estimated based on a market approach and a discounted cash flow analysis, also known as the income approach, and is reconciled back to the estimated equity value for the Company to ensure that the implied control premium is reasonable. If the book value of a reporting unit exceeds its fair value, the Company performs the second step to estimate an implied fair value of the reporting unit’s goodwill by allocating the fair value of the reporting unit to all of the assets and liabilities other than goodwill (including any unrecognized intangible assets). The difference between the total fair value of the reporting unit and the fair value of all the assets and liabilities other than goodwill is the implied fair value of that goodwill. The amount of impairment loss is equal to the excess of the book value of the goodwill over the implied fair value of that goodwill.
66
The Company evaluates indefinite‑lived intangible assets using a qualitative assessment to determine whether it is more likely than not that the fair value of the indefinite‑lived intangible asset is less than its carrying amount. If the qualitative assessment indicates that the fair value may be less than its carrying amount, the fair value of the intangible asset is estimated and compared to its carrying value to determine if impairment exists. Otherwise, the Company concludes that there is no impairment and does not perform the quantitative test. When the qualitative assessment is not utilized and a quantitative test is performed, the Company estimates the fair value of these intangible assets using the relief‑from‑royalty method, which requires assumptions related to royalty rates that the owner would otherwise be willing to pay to use the asset, as well as projected revenues from the Company’s long-range plan. Intangible assets with estimable useful lives are amortized over their respective estimated useful lives and reviewed for impairment when impairment indicators are present.
Long‑Lived Assets
Long‑lived assets, such as property, plant, and equipment, and purchased intangibles subject to amortization, are reviewed for impairment whenever events or changes in circumstances indicate that the carrying amount of an asset may not be recoverable. Recoverability of assets to be held and used is measured by a comparison of the carrying amount of an asset to estimated undiscounted future cash flows expected to be generated by the asset. If the carrying amount of an asset exceeds its estimated future cash flows, an impairment charge is recognized in the amount by which the carrying amount of the asset exceeds the fair value of the asset.
Revenue Recognition
Revenue relates to services provided typically under annually renewable contracts, primarily summarizing and benchmarking hospital patient experience surveys and quality improvement services. For annual service contracts, revenue is recognized on a ratable basis over the life of the contract. The contracts are generally cancelable on short or no notice by the customer without penalty. The Company offers a variety of billing arrangements to its customers. Any amounts billed in excess of the revenue recognized result in deferred revenue. The Company recognizes revenue for services that have been earned but not billed. These unbilled amounts are recorded in other receivables on the consolidated balance sheets.
Sales and Marketing
Sales and marketing expenses consist primarily of employee‑related expenses including salaries, benefits, commissions, employment taxes, severance and equity‑based compensation costs for employees engaged in sales, sales support, business development and marketing. Sales and marketing expenses also include operating expenses for marketing programs, trade shows and public relations costs. Sales and marketing expenses are expensed as incurred and are included in general and administrative expenses.
67
Equity‑Based Compensation
Prior to the IPO, the Parent adopted an equity‑based compensation plan, or the Plan, which authorized the granting of various equity awards of preferred units, Class A common units, Class A‑1 common units, Class B common units, and Class C common units of the Parent to the Company’s employees and directors. The fair value of the awards of the Parent was reflected as expense on the accounts of the Company because the recipients were employees of the Company. On an annual basis, the Company determined the fair value of each class of its Parent’s equity units using an enterprise value allocation methodology. In order to determine the enterprise value, the Company used a variety of widely accepted valuation techniques which considered a number of factors such as its financial performance, the values of comparable companies and the lack of marketability of the Parent’s equity instruments. Significant assumptions included the expected term in which the units would be realized; a risk‑free interest rate equal to the U.S. federal treasury bond rate consistent with the term assumption; expected dividend yield, for which there was none; and expected volatility based on the historical data of equity instruments of comparable companies. The Company classified immature awards as liabilities due to the Parent’s right to repurchase the awards from the employee and the Parent’s history of exercising such rights. The Company funded the Parent’s repurchase obligations as the Parent was dependent upon the Company to meet its obligations. The Parent’s repurchase right permitted an employee to avoid the risks and rewards normally associated with equity ownership. The Company recorded compensation expense as units vested based upon the fair value of the respective award and adjusted the accumulated immature awards to fair value in cost of revenue and general and administrative expenses in the consolidated statement of operations.
The Company accounts for equity-based compensation, primarily consisting of restricted stock, based on the fair value of the award at grant date, which is typically the closing stock price, and recognizes compensation expense over the requisite service period.
Income Taxes
The Company accounts for income taxes using the asset and liability approach. Under this method, deferred tax assets and liabilities are recognized for the future tax consequences attributable to differences between the financial statement carrying amounts of existing assets and liabilities and their respective tax bases and operating loss and tax credit carryforwards. Deferred tax assets and liabilities are measured using enacted tax rates expected to apply to taxable income in the years in which these temporary differences are expected to be recovered or settled. The effect on deferred tax assets and liabilities of a change in tax rates is recognized in income in the period that includes the enactment date. The Company expenses any penalties or interest associated with tax obligations as general and administrative expense.
Reclassifications
Certain amounts in the prior periods have been reclassified to conform to the current period financial statement presentation. These reclassifications have no effect on previously reported net income, assets or earnings per share.
Recent Accounting Pronouncements
In May 2014, the Financial Accounting Standards Board (the “FASB”) issued ASU 2014‑09, “Revenue from Contracts with Customers (Topic 606)”. This ASU requires an entity to recognize the amount of revenue to which it expects to be entitled for the transfer of promised goods or services to customers. The ASU will replace most existing revenue recognition guidance in U.S. GAAP when it becomes effective. In August 2015, the FASB deferred the effective date by one year to annual and interim reporting periods beginning after December 15, 2017. The FASB is permitting early adoption of the standard, but not until annual and interim reporting periods beginning after December 15, 2016, the original effective date. An entity may choose to adopt this ASU either retrospectively or through a cumulative effect adjustment as of the start of the first period for which it applies the standard. The Company is currently in the process of evaluating the impact that this new guidance will have on its consolidated financial statements and its method of adoption.
68
In April 2015, the FASB issued ASU 2015-05, “Customer’s Accounting for Fees Paid in a Cloud Computing Arrangement”. This ASU provides guidance to customers about whether a cloud computing arrangement includes a software license. If a cloud computing arrangement includes a software license, then the customer should account for the software license element of the arrangement consistent with the acquisition of other software licenses. If a cloud computing arrangement does not include a software license, the customer should account for the arrangement as a service contract. In addition, this update changes the accounting for software licenses to be consistent with other licenses of intangible assets. This standard is effective for annual and interim periods beginning after December 15, 2015, with early adoption permitted. An entity may choose to adopt this ASU either retrospectively or prospectively to all arrangements entered into or materially modified after the effective date. The Company will adopt this standard in the first quarter of 2016 on a prospective basis. The Company does not expect the adoption of this standard to have a material impact on its consolidated financial statements.
In April 2015, the FASB issued ASU 2015‑03, “Simplifying the Presentation of Debt Issuance Costs”. This ASU requires that debt issuance costs related to a recognized debt liability be presented in the balance sheet as a direct deduction from the carrying amount of that debt liability, consistent with debt discounts. This standard is effective for annual and interim periods beginning after December 15, 2015, with early adoption permitted. The Company adopted ASU 2015-03 during the year ended December 31, 2015 and prior period amounts have been reclassified to conform to the current period presentation. As of December 31, 2014, debt issuance costs of $977,000 were reclassified from deferred financing fees, net to long-term debt, less current portion in the consolidated balance sheet. The adoption of ASU 2015-03 did not impact the Company’s consolidated financial position, results of operations or cash flows.
In August 2015, the FASB issued ASU 2015-15, “Presentation and Subsequent Measurement of Debt Issuance Costs Associated with Line-of-Credit Arrangements”. This ASU added an SEC paragraph addressing the presentation of debt issuance costs related to line-of-credit arrangements since ASU 2015-03 does not address presentation or subsequent measurement of debt issuance costs related to line-of-credit arrangements. Given the absence of authoritative guidance within ASU 2015-03 for debt issuance costs related to line-of-credit arrangements, the SEC staff does not object to an entity deferring and presenting debt issuance costs as an asset and subsequently amortizing the deferred debt issuance costs ratably over the term of the line-of-credit arrangement, regardless of whether there are any outstanding borrowings on the line-of-credit arrangement. The Company adopted ASU 2015-15 during the year ended December 31, 2015. There were no adjustments to the presentation of debt issuance costs relating to the line-of-credit arrangement and no impact on the Company’s financial position, results of operations or cash flows upon adoption of the new standard.
In September 2015, the FASB issued ASU 2015-16, “Simplifying the Accounting for Measurement-Period Adjustments”. This ASU requires that an acquirer recognize adjustments to provisional amounts that are identified during the measurement period in the reporting period in which the adjustment amounts are determined. The amendments in this ASU require that the acquirer record, in the same period’s financial statements, the effect on earnings of changes in depreciation, amortization, or other income effects, if any, as a result of the change to the provisional amounts, calculated as if the accounting had been completed at the acquisition date. This standard is effective for annual and interim periods beginning after December 15, 2015, with early adoption permitted. The Company will adopt this standard in the first quarter of 2016 on a prospective basis. The Company does not expect the adoption of this standard to have a material impact on its consolidated financial statements.
In November 2015, the FASB issued ASU 2015-17, “Balance Sheet Classification of Deferred Taxes”. This ASU requires that deferred tax liabilities and assets be classified as noncurrent in a classified balance sheet. This standard is effective for annual periods beginning after December 15, 2016, and interim periods within those annual periods, with early adoption permitted. The Company adopted ASU 2015-17 during the year ended December 31, 2015 and prior period amounts were reclassified to conform to the current period presentation. As of December 31, 2014 and 2013, deferred income tax liabilities of $712,000 and $1.6 million, respectively, were reclassified from current to noncurrent on the consolidated balance sheet. The adoption of ASU 2015-17 did not impact the Company’s consolidated financial position, results of operations or cash flows.
69
In February 2016, the FASB issued ASU 2016-02, “Leases”. This ASU requires that a lessee record an operating lease in the balance sheet with a liability to make lease payments and a right-of-use asset representing its right to use the underlying asset for the lease term. This standard is effective for annual and interim periods beginning after December 15, 2018, with early adoption permitted. Adoption of this standard will be on a modified retrospective approach, which includes a number of optional practical expedients that the Company may elect to apply. The Company is currently in the process of evaluating the impact that this new guidance will have on its consolidated financial statements and its method of adoption.
3. Property and Equipment
Property and equipment, net consist of the following:
|
|
|
2015 |
|
2014 |
|
||
|
Furniture, fixtures, and leasehold improvements |
|
$ |
9,431 |
|
$ |
6,249 |
|
|
Office equipment |
|
|
19,619 |
|
|
15,214 |
|
|
Office equipment held under capital lease |
|
|
20,916 |
|
|
18,531 |
|
|
Computer equipment and software |
|
|
74,844 |
|
|
57,389 |
|
|
Construction in progress |
|
|
14,585 |
|
|
21,628 |
|
|
|
|
|
139,395 |
|
|
119,011 |
|
|
Accumulated amortization of office equipment held under capital leases |
|
|
(10,143) |
|
|
(6,244) |
|
|
Accumulated depreciation |
|
|
(68,990) |
|
|
(53,157) |
|
|
|
|
$ |
60,262 |
|
$ |
59,610 |
|
Depreciation and amortization of property and equipment (including amortization of office equipment under capital leases) was $24.6 million, $19.1 million, and $17.2 million for the years ended December 31, 2015, 2014, and 2013, respectively.
4. Fair Value Measurements
The Company measures and reports its financial assets and liabilities on the basis of fair value. Fair value is defined as the price that would be received to sell an asset or paid to transfer a liability (an exit price) in the principal or most advantageous market for the asset or liability in an orderly transaction between market participants on the measurement date.
A three‑level hierarchy for disclosure has been established to show the extent and level of judgment used to estimate fair value measurements, as follows:
Level 1: Quoted market prices in active markets for identical assets or liabilities.
Level 2: Significant other observable inputs (quoted prices in active markets for similar assets or liabilities, quoted prices for identical or similar assets or liabilities in markets that are not active, or inputs other than quoted prices that are observable for the asset or liability).
Level 3: Significant unobservable inputs for the asset or liability. These values are generally determined using pricing models which utilize management estimates of market participant assumptions.
Valuation techniques for assets and liabilities measured using Level 3 inputs may include methodologies such as the market approach, the income approach or the cost approach, and may use unobservable inputs such as projections, estimates and management’s interpretation of current market data. These unobservable inputs are only utilized to the extent that observable inputs are not available or cost‑effective to obtain. The Company had no Level 3 assets or liabilities at December 31, 2015 and 2014.
70
Financial Instruments
The recorded values of accounts receivable, accounts payable, and other liabilities approximate fair value because of the short maturity of these financial instruments. The recorded values of the variable rate Term Loan and First Lien Term Loan approximate fair value because the interest rates fluctuate with market rates.
5. Business Combinations
Healthcare Performance Improvement, LLC
On September 1, 2015, the Company acquired all of the membership interests of Healthcare Performance Improvement, LLC (“HPI”). HPI provides patient safety and high reliability consulting and coaching services. The acquisition brings the critical dimension of safety to the Company’s ability to help its clients reduce patient suffering. The purchase price for HPI’s membership interests was $13.0 million before post-closing adjustments for working capital. Based on estimated working capital, the amount paid at closing on September 1, 2015 was $11.7 million, net of cash acquired. Closing adjustments for working capital were agreed upon, resulting in additional cash payment of $426,000 in the fourth quarter of 2015, bringing the final purchase price to $12.1 million, net of cash acquired.
The acquisition was accounted for under the purchase method of accounting and the total purchase price was allocated to the net tangible and identifiable intangible assets based on their estimated fair values (based on Level 3 measurements) as of September 1, 2015. The excess purchase price over the net tangible and intangible assets was recorded to goodwill. The goodwill balance is primarily attributed to assembled workforce and is expected to be deductible for tax purposes.
The following table summarizes the allocation of the fair value of the acquisition which was finalized during the year ended December 31, 2015:
|
Current assets |
|
$ |
2,213 |
|
|
Property and equipment |
|
|
23 |
|
|
Goodwill |
|
|
8,269 |
|
|
Intangible assets: |
|
|
|
|
|
Trade name |
|
|
280 |
|
|
Customer relationships |
|
|
2,320 |
|
|
Other |
|
|
1,090 |
|
|
Total assets acquired |
|
|
14,195 |
|
|
Liabilities assumed: |
|
|
|
|
|
Deferred revenue |
|
|
1,753 |
|
|
Other current liabilities |
|
|
296 |
|
|
Net assets acquired |
|
$ |
12,146 |
|
Transaction expenses of $346,000 relating to the purchase are included in general and administrative expenses for the year ended December 31, 2015.
National Database of Nursing Quality Indicators
On June 10, 2014, the Company acquired all of the assets of The National Database of Nursing Quality Indicators (NDNQI) from the American Nurses Association, Inc. in exchange for cash of $24.9 million. NDNQI is the leading quality improvement and nurse engagement tool developed by the American Nurses Association and managed by The University of Kansas School of Nursing. The acquisition strengthens the Company’s ability to empower nurses and nursing leaders in their mission to reduce patient suffering and improve the patient experience.
71
The acquisition was accounted for under the purchase method of accounting and the total purchase price was allocated to the net tangible and identifiable intangible assets based on their fair values (based on Level 3 measurements) as of June 10, 2014. The excess purchase price over the net tangible and identifiable intangible assets was recorded to goodwill. The goodwill balance is primarily attributed to expanded market opportunities and is expected to be deductible for tax purposes. The assumed liabilities include deferred revenue, which was adjusted down from a book value at the acquisition date of $6.5 million to an estimated fair value of $6.2 million. The $300,000 write‑down of deferred revenue resulted in lower revenues than would have otherwise been recognized for such services.
The following table summarizes the allocation of the fair value of the acquisition:
|
|
|
|
|
|
|
Current assets |
|
$ |
478 |
|
|
Software |
|
|
1,186 |
|
|
Goodwill |
|
|
14,647 |
|
|
Intangibles: |
|
|
|
|
|
Trade name |
|
|
300 |
|
|
Customer relationships |
|
|
2,800 |
|
|
Proprietary technology |
|
|
11,800 |
|
|
Total assets acquired |
|
|
31,211 |
|
|
Liabilities assumed: |
|
|
|
|
|
Deferred revenue |
|
|
6,180 |
|
|
Other current liabilities |
|
|
181 |
|
|
Net assets acquired |
|
$ |
24,850 |
|
Transaction expenses of $246,000 relating to the purchase are included in general and administrative expenses in 2014.
Dynamic Clinical Systems, Inc.
On April 24, 2014, the Company acquired all of Dynamic Clinical Systems, Inc.’s capital stock in exchange for cash of $3.3 million. Dynamic Clinical Systems, Inc. provides patient‑reported outcomes services and solutions. The acquisition provides the Company with an expanded portfolio for healthcare organizations with the ability to collect, measure and analyze patient‑reported data.
The acquisition was accounted for under the purchase method of accounting and the total purchase price was allocated to the net tangible and identifiable intangible assets based on their estimated fair values (based on Level 3 measurements) as of April 24, 2014. The excess purchase price over the net tangible and identifiable intangible assets was recorded to goodwill. The goodwill balance is primarily attributed to assembled workforce and is expected to be deductible for tax purposes. This acquisition has an earnout feature for which no value has been recorded due to the remote probability of the performance targets being achieved.
72
The following table summarizes the allocation of the fair value of the acquisition:
|
|
|
|
|
|
|
Current assets |
|
$ |
186 |
|
|
Goodwill |
|
|
2,162 |
|
|
Intangibles: |
|
|
|
|
|
Trade name |
|
|
100 |
|
|
Customer relationships |
|
|
1,200 |
|
|
Proprietary technology |
|
|
380 |
|
|
Other |
|
|
160 |
|
|
Total assets acquired |
|
|
4,188 |
|
|
Liabilities assumed: |
|
|
|
|
|
Deferred revenue |
|
|
210 |
|
|
Other current liabilities |
|
|
302 |
|
|
Deferred income tax liability |
|
|
358 |
|
|
Net assets acquired |
|
$ |
3,318 |
|
Transaction expenses of $118,000 relating to the purchase are included in general and administrative expenses in 2014.
On The Spot Systems, Inc.
On December 30, 2013, the Company acquired all of On The Spot Systems, Inc. (OTSS)’s capital stock in exchange for cash of $2.8 million. OTSS is a point‑of‑care survey technology firm that enables organizations to capture real‑time patient feedback. The acquisition expands the Company’s portfolio of products by adding point‑of‑care surveying to existing modes of mail, phones, and eSurvey.
The acquisition was accounted for under the purchase method of accounting and the total purchase price was allocated to the net tangible and identifiable intangible assets based on their fair values (based on Level 3 measurements) as of December 30, 2013. The excess purchase price over the net tangible and identifiable intangible assets was recorded to goodwill. The goodwill balance is primarily attributed to assembled workforce and expanded market opportunities. Goodwill is not expected to be deductible for tax purposes.
The following table summarizes the allocation of the fair value of the acquisition:
|
|
|
|
|
|
|
Current assets |
|
$ |
39 |
|
|
Deferred income tax asset |
|
|
34 |
|
|
Goodwill |
|
|
1,763 |
|
|
Proprietary technology intangible asset |
|
|
1,000 |
|
|
Total assets acquired |
|
|
2,836 |
|
|
Liabilities assumed: |
|
|
|
|
|
Deferred revenue |
|
|
13 |
|
|
Other current liabilities |
|
|
10 |
|
|
Net assets acquired |
|
$ |
2,813 |
|
Transaction expenses of $37,000 and $55,000 relating to the purchase are included in general and administrative expenses in 2014 and 2013, respectively.
For the acquisitions noted above, the Company used the purchase method of accounting and the results of operations of these entities have been included in the consolidated financial statements since their respective acquisition dates. Additionally, none of these acquisitions are considered material to the Company and, therefore, pro‑forma information has not been presented.
73
6. Goodwill and Intangible Assets
Goodwill
The Company performed its annual goodwill impairment assessment as of October 1, 2015 and 2014, and determined there was no impairment of goodwill. Changes in the carrying amount of goodwill for the years ended December 31, 2015, 2014 and 2013 were as follows:
|
Balance as of January 1, 2013 |
|
$ |
384,341 |
|
|
OTSS acquisition |
|
|
1,388 |
|
|
Morehead adjustments |
|
|
21 |
|
|
Balance as of December 31, 2013 |
|
$ |
385,750 |
|
|
OTSS adjustments |
|
|
375 |
|
|
DCS acquisition |
|
|
2,162 |
|
|
NDNQI acquisition |
|
|
14,647 |
|
|
Balance as of December 31, 2014 |
|
$ |
402,934 |
|
|
HPI acquisition |
|
|
8,269 |
|
|
Balance as of December 31, 2015 |
|
$ |
411,203 |
|
Intangible Assets
The Company performed its annual indefinite-life intangible asset impairment assessment as of October 1, 2015 and 2014, and determined there was no impairment of the indefinite-life intangible asset. The following table summarizes the Company’s intangible assets at December 31, 2015 and 2014:
|
|
|
|
|
December 31, 2015 |
|
December 31, 2014 |
|
||||||||||||||
|
|
|
Weighted |
|
|
|
|
|
|
|
|
|
|
|
|
|
|
|
|
|
|
|
|
|
|
Average |
|
Gross |
|
|
|
|
Net |
|
Gross |
|
|
|
|
Net |
|
||||
|
|
|
Remaining |
|
Carrying |
|
Accumulated |
|
Carrying |
|
Carrying |
|
Accumulated |
|
Carrying |
|
||||||
|
|
|
Useful Life |
|
Amount |
|
Amortization |
|
Amount |
|
Amount |
|
Amortization |
|
Amount |
|
||||||
|
Trade name (indefinite life) |
|
— |
|
$ |
200,000 |
|
$ |
— |
|
$ |
200,000 |
|
$ |
200,000 |
|
$ |
— |
|
$ |
200,000 |
|
|
Trade names (finite life) |
|
4.2 |
|
|
2,410 |
|
|
(1,509) |
|
|
901 |
|
|
2,130 |
|
|
(1,167) |
|
|
963 |
|
|
Customer relationships |
|
12.3 |
|
|
237,620 |
|
|
(94,851) |
|
|
142,769 |
|
|
235,300 |
|
|
(82,010) |
|
|
153,290 |
|
|
Proprietary technology |
|
9.0 |
|
|
32,240 |
|
|
(14,849) |
|
|
17,391 |
|
|
32,240 |
|
|
(11,645) |
|
|
20,595 |
|
|
Other |
|
7.9 |
|
|
3,180 |
|
|
(1,776) |
|
|
1,404 |
|
|
2,090 |
|
|
(1,547) |
|
|
543 |
|
|
|
|
|
|
$ |
475,450 |
|
$ |
(112,985) |
|
$ |
362,465 |
|
$ |
471,760 |
|
$ |
(96,369) |
|
$ |
375,391 |
|
Amortization expense was $16.6 million, $16.0 million, and $15.3 million, for the years ended December 31, 2015, 2014, and 2013, respectively. The Company cannot reliably determine the pattern for which it consumes the benefit of its customer relationship intangible assets. As such, the Company amortizes its customer relationship intangible assets using the straight‑line method over the estimated lives based upon the Company’s historical customer retention and recurring revenue base.
74
The estimated remaining amortization expense related to intangible assets with finite lives for each of the five succeeding years and thereafter is as follows at December 31, 2015:
|
2016 |
|
$ |
16,470 |
|
|
2017 |
|
|
15,527 |
|
|
2018 |
|
|
13,939 |
|
|
2019 |
|
|
13,393 |
|
|
2020 |
|
|
12,965 |
|
|
Thereafter |
|
|
90,171 |
|
|
|
|
$ |
162,465 |
|
7. Impairment Charges
In 2013, during the strategic review of its product offerings, the Company decided to discontinue three products. In connection with discontinuing these products, the Company considered the recoverability of the carrying value of certain fixed assets (primarily software) and certain intangible assets held for use (primarily customer relationships), which resulted in an impairment charge of $2.6 million. These losses reflect the amounts by which the carrying values of these assets exceed their estimated fair values determined by their estimated future discounted cash flows and are recorded as impairment charges on the consolidated statement of operations.
There were no impairment charges related to long‑lived assets during 2015 and 2014.
8. Revolving Credit Facility and Long‑Term Debt
As of December 31, 2015 and 2014, the Company’s long‑term debt consisted of the following:
|
|
|
|
|
|
|
|
|
|
|
|
2015 |
|
2014 |
|
||
|
Term Loan |
|
$ |
182,688 |
|
$ |
— |
|
|
First Lien Term Loan |
|
|
— |
|
|
408,456 |
|
|
Unamortized deferred financing fees |
|
|
(2,212) |
|
|
(977) |
|
|
Unamortized original issue discount |
|
|
— |
|
|
(312) |
|
|
|
|
|
180,476 |
|
|
407,167 |
|
|
Less current portion |
|
|
(9,250) |
|
|
(4,279) |
|
|
Long-term debt |
|
$ |
171,226 |
|
$ |
402,888 |
|
Unamortized deferred financing fees related to the Company’s Revolving Credit Facility (as defined below) and prior revolving credit facility were $897,000 and $810,000 at December 31, 2015 and 2014, respectively, and are classified as deferred financing fees, net in the consolidated balance sheets.
The aggregate maturities of long‑term debt for years subsequent to December 31, 2015, are as follows:
|
Year ending December 31: |
|
|
|
|
|
2016 |
|
$ |
9,250 |
|
|
2017 |
|
|
9,250 |
|
|
2018 |
|
|
9,250 |
|
|
2019 |
|
|
9,250 |
|
|
2020 |
|
|
145,688 |
|
|
Total debt |
|
$ |
182,688 |
|
75
2015 Credit Agreement
On July 31, 2015, the Company entered into a new credit agreement (“2015 Credit Agreement”). The 2015 Credit Agreement consists of a five-year $185.0 million term loan (“Term Loan”) and a five-year $75.0 million revolving credit facility (“Revolving Credit Facility”). The Company used the proceeds from the Term Loan to repay the outstanding First Lien Term Loan (as defined below) balance of $183.2 million, which resulted in a loss on extinguishment of debt of $1.1 million, consisting of the write off of unamortized deferred financing fees of $995,000 and a loss on original issue discount of $117,000. In connection with the refinancing, the Company capitalized $3.4 million of deferred financing fees.
At the discretion of the Company, interest accrues on outstanding borrowings under the 2015 Credit Agreement at either the London Interbank Offered Rate (“LIBOR”) plus an applicable margin, currently 1.50%, or the adjusted base rate (“ABR”) plus an applicable margin, currently 0.50%. The applicable margins for both the LIBOR and ABR are variable based upon stipulated ranges of the secured net leverage ratio, as defined in the 2015 Credit Agreement. The Company is required to repay the outstanding principal amount of the Term Loan in equal quarterly amounts of $2.3 million, which commenced on December 31, 2015. The remaining Term Loan balance and any outstanding balances on the Revolving Credit Facility will be due upon maturity on July 31, 2020. The Term Loan and Revolving Credit Facility are secured by substantially all of the assets of the Company.
There were no borrowings outstanding on the Revolving Credit Facility at December 31, 2015; however, the Company had a letter of credit outstanding of approximately $65,000 at December 31, 2015, which reduced the borrowing capacity of the Revolving Credit Facility to $74.9 million. The Company is charged a loan commitment fee, currently 0.375%, for unused amounts on the Revolving Credit Facility.
The 2015 Credit Agreement contains certain restrictive and financial covenants which the Company must comply with on a quarterly basis, including a maximum secured net leverage ratio of no more than 3.75, as defined in the agreement. The Company is also limited in its ability to incur additional indebtedness or liens; pay dividends or make certain other restricted payments, enter into certain transactions with affiliates, merge or consolidate with another entity; or sell, assign, transfer, convey, or otherwise dispose of all or substantially all of its assets. The Company was in compliance with these restrictive and financial covenants as of December 31, 2015, with a secured net leverage ratio of 1.3 as calculated per the covenant definition in the agreement.
First and Second Lien Credit Agreements
Prior to the 2015 Credit Agreement, the Company was party to a First Lien Credit Agreement (the “First Lien Agreement”) and a Second Lien Credit Agreement (the “Second Lien Agreement”). The First Lien Agreement initially consisted of a $30 million revolving credit facility and a $345 million term loan (the “First Lien Term Loan”), which was issued at an original issue discount of $3.5 million. The Second Lien Agreement initially consisted of a $95 million term loan (the “Second Lien Term Loan”), which was issued at an original issue discount of $950,000.
On May 9, 2013, the Company amended the First Lien Agreement to borrow an additional $50 million in the form of an incremental increase to the First Lien Term Loan, lower interest rates, and adjust certain financial covenants. Proceeds from the additional borrowings were used to pay down the principal balance of the Second Lien Term Loan. The transaction resulted in a loss on extinguishment of debt of $7.9 million, consisting of the write off of unamortized deferred financing fees of $4.1 million, payments of fees to lenders of $1.5 million and loss on original issuance discount of $2.3 million, which are recorded as extinguishment of debt in other expense, net, in the consolidated statement of operations for the year ended December 31, 2013. In connection with the amendment, the Company capitalized $365,000 of deferred financing fees. The Company also amended the First Lien Agreement on June 17, 2013, to allow for certain corporate structure changes. In connection with the amendment, the Company capitalized $486,000 of deferred financing fees.
76
On May 9, 2014, the Company amended the First Lien Agreement to borrow an additional $35 million in the form of an incremental increase to the First Lien Term Loan. Proceeds from the additional borrowings and $10 million of cash were used to pay off the remaining balance of the Second Lien Term Loan. The transactions resulted in a loss on extinguishment of debt of $2.9 million, consisting of the write off of unamortized deferred financing fees of $1.5 million, payments of fees to lenders of $497,000 and loss on original issue discount of $921,000, which are recorded as extinguishment of debt in other expense, net, in the consolidated statement of operations for the year ended December 31, 2014. In connection with the amendment, the Company capitalized $508,000 of deferred financing fees.
During the second quarter of 2015, the Company used proceeds from the IPO to pay down $223.0 million of the principal balance of the First Lien Term Loan. The transactions resulted in a loss on extinguishment of debt of $638,000, consisting of the write off of unamortized deferred financing fees of $489,000 and loss on original issue discount of $149,000, which are recorded as extinguishment of debt in other expense, net, in the consolidated statement of operations for the year ended December 31, 2015.
At the discretion of the Company, interest accrued on borrowings on the First Lien Term Loan and revolving credit facility at either LIBOR plus an applicable margin or the ABR plus an applicable margin, each as defined in the First Lien Agreement. LIBOR had a floor of 1.00% plus an applicable margin for outstanding borrowings under the First Lien Term Loan. The Company was required to make quarterly principal payments of $863,000 from June 2012 through March 31, 2013, payments of $979,000 from June 30, 2013 through March 31, 2014, and payments of $1.1 million from June 30, 2014 through April 20, 2018, when the First Lien Agreement was to mature, and to make interest payments. There were no borrowings outstanding under the revolving credit facility at December 31, 2014. The Company was charged a loan commitment fee of 0.50% for unused amounts on the revolving credit facility.
The First Lien Agreement contained certain restrictive and financial covenants which the Company was required to comply with on a quarterly basis, including a maximum net leverage ratio and a minimum interest coverage ratio, as defined in the agreement. The Company was in compliance with these restrictive and financial covenants as of December 31, 2014.
9. Leases
The Company leases certain office furniture, computer equipment, and office space under operating and capital leases. Generally, the leases contain renewal terms at the option of the Company at rates reflecting market rates at the time of renewal. Minimum annual lease payments under noncancelable lease arrangements at December 31, 2015, are as follows:
|
|
|
|
|
|
|
|
|
|
|
|
Capital |
|
Operating |
|
||
|
|
|
Leases |
|
Leases |
|
||
|
Year ending December 31: |
|
|
|
|
|
|
|
|
2016 |
|
$ |
5,174 |
|
$ |
3,214 |
|
|
2017 |
|
|
3,051 |
|
|
2,445 |
|
|
2018 |
|
|
789 |
|
|
1,310 |
|
|
2019 |
|
|
477 |
|
|
1,129 |
|
|
2020 |
|
|
40 |
|
|
654 |
|
|
Thereafter |
|
|
— |
|
|
41 |
|
|
Total minimum lease payments |
|
$ |
9,531 |
|
$ |
8,793 |
|
|
Less amount representing interest |
|
|
740 |
|
|
|
|
|
Present value of future minimum lease payments |
|
|
8,791 |
|
|
|
|
|
Less current installments of obligations under capital leases |
|
|
4,626 |
|
|
|
|
|
Long-term capital lease obligations |
|
$ |
4,165 |
|
|
|
|
Total rent expense charged to operations under terms of these operating leases was $3.2 million, $3.4 million, and $3.3 million for the years ended December 31, 2015, 2014, and 2013, respectively.
77
Amortization of the capital leases of $4.6 million, $2.3 million, and $1.9 million for the years ended December 31, 2015, 2014, and 2013, respectively, is included in depreciation and amortization expense on the consolidated statements of operations.
10. Defined Contribution Retirement Plan
The Company has a qualified defined contribution retirement plan that covers substantially all of its employees. Expense for the Company’s matching contributions, which in part are based on amounts of compensation contributed by plan participants, was $2.6 million, $2.2 million, and $2.3 million for the years ended December 31, 2015, 2014, and 2013, respectively.
11. Equity-Based Compensation
The Company measures its equity-based compensation costs based on the grant date fair value of the awards and recognizes these costs in the consolidated financial statements over the requisite service or performance vesting period.
Total equity-based compensation expense recorded in the consolidated statements of operations for the periods indicated is as follows:
|
|
|
|
|
|
|
|
|
|
|
|
|
|
|
December 31, |
|
|||||||
|
|
|
2015 |
|
2014 |
|
2013 |
|
|||
|
Cost of revenue |
|
$ |
13,342 |
|
$ |
2,506 |
|
$ |
2,704 |
|
|
General and administrative |
|
|
73,403 |
|
|
5,528 |
|
|
7,083 |
|
|
Total equity-based compensation expense |
|
$ |
86,745 |
|
$ |
8,034 |
|
$ |
9,787 |
|
Parent Equity-Based Compensation Plan
The Company’s former parent company, PG Holdco, LLC, had adopted an equity-based compensation plan (the “Parent Plan”), which authorized the granting of various equity awards of the Parent’s Preferred units, Class A common units, Class B common units, and Class C common units to employees and directors of the Company. The awards of the Parent were recorded as compensation expense in the accounts of the Company because the recipients are employees and directors of the Company.
In connection with the closing of the IPO, the Parent was liquidated and its sole asset, shares of the Company’s common stock, were distributed to its equity holders based on their relative rights under its limited liability agreement. The equity holders of the Parent received the number of shares of the Company’s common stock in the liquidation of the Parent that they would have held in the Company’s common stock directly immediately before the distribution, with no issuance of additional shares by the Company. Vested units of the Parent converted to shares of the Company’s common stock in the distribution. Unvested common units of the Parent that were subject to time-vesting conditions were converted to 1,028,122 unvested restricted shares of the Company’s common stock in the distribution and will continue to vest based on the amended vesting schedule of the respective unit class.
The liquidation and distribution of the Parent resulted in $70.4 million of equity-based compensation expense for the year ended December 31, 2015 due to the following outstanding award modifications:
|
· |
Performance-based Class A and Class C common units of the Parent – vesting of $40.4 million triggered by achievement of performance threshold as a result of the IPO; |
|
· |
Class A common units of the Parent – modification of $19.4 million due to change from cliff-vesting awards to quarterly-vesting awards with resulting change from liability treatment to equity treatment; |
|
· |
Preferred, Class A and Class B common units purchased with loans – modification of $9.1 million due to repayment of the loan, which was a cancellation of option treatment and replacement with new awards with resulting change from liability treatment to equity treatment; and |
78
|
· |
Loan forgiveness – modification of $1.5 million due to forgiveness of loans used to purchase units with resulting change from liability treatment to equity treatment. |
The total liability outstanding associated with the Parent Plan equity-based compensation awards not classified in equity but as liabilities was $0 and $19.4 million at December 31, 2015 and 2014, respectively.
2015 Incentive Award Plan
The Company’s 2015 Incentive Award Plan (the “2015 Plan”) provides for the grant of stock options, restricted stock, dividend equivalents, stock payments, restricted stock units, stock appreciation rights, and other stock or cash based awards. The 2015 Plan authorized 7,120,000 shares of common stock for issuance pursuant to awards under the plan.
Restricted Stock
On May 21, 2015, the Company granted shares of restricted stock with vesting terms summarized as follows:
|
4-year service vesting (20% for years 1-2, 30% for years 3-4) |
|
807,000 |
|
|
3-year performance vesting (cliff) |
|
807,000 |
|
|
2-year service vesting (quarterly) |
|
120,000 |
|
|
1-year service vesting |
|
20,000 |
|
|
|
|
1,754,000 |
|
During the year ended December 31, 2015, the Company granted the following restricted stock with various performance and time vesting conditions:
|
|
|
|
|
|
|
|
|
|
|
|
|
Weighted |
|
|
|
|
|
|
|
Average |
|
|
|
|
|
|
|
Fair Value |
|
|
|
|
|
|
|
at Grant |
|
|
|
|
|
Shares |
|
Date |
|
|
|
Nonvested at January 1, 2015 |
|
— |
|
$ |
— |
|
|
Converted from liquidation of Parent |
|
1,028,122 |
|
|
25.00 |
|
|
Granted |
|
1,820,114 |
|
|
25.19 |
|
|
Vested |
|
(328,429) |
|
|
25.00 |
|
|
Forfeited |
|
(264,126) |
|
|
25.00 |
|
|
Nonvested at December 31, 2015 |
|
2,255,681 |
|
$ |
25.15 |
|
As of December 31, 2015, $46.4 million of total unrecognized compensation costs related to outstanding nonvested restricted stock was expected to be recognized over a weighted average period of 2.7 years.
Stock Options
The Company granted options to purchase 36,304 shares of the Company’s common stock during the year ended December 31, 2015. Options to purchase shares of common stock were granted with exercise prices equal to the fair value of the common stock on the date of grant. The fair value of the stock options granted was estimated using a Black-Scholes valuation model. The weighted average fair value of the options granted during the year ended December 31, 2015 is estimated at $12.79 per share on the date of grant using the following weighted average assumptions: risk-free interest rate of 1.5%; an expected term of approximately 5 years; expected volatility of 35.15%; and dividend yield of 0.0% over the expected life of the option. The risk-free interest rate assumptions were based on the U.S. Treasury yield curve in effect at the time of grant. The weighted average volatility was developed using the historical volatility of several peer companies to Press Ganey Holdings, Inc. for periods equal to the expected life of the options at the date of grant. The expected life of options is the average number of years the Company estimates that options will be outstanding.
79
12. Earnings Per Share
Basic earnings (net loss) per share is computed by dividing net income (loss) by the weighted average number of common shares outstanding during the period. Diluted earnings (net loss) per share is computed by dividing net income (loss) by the weighted average number of common shares and common equivalent shares outstanding during the period. The weighted average number of common equivalent shares outstanding has been determined in accordance with the treasury stock method. Common equivalent shares consist of common stock issuable on the exercise of outstanding options and vesting of restricted stock units when dilutive.
The following table sets forth the computation of basic and diluted earnings (net loss) per share:
|
|
|
|
|
|
|
|
|
|
|
|
|
|
|
Year Ended December 31, |
|
|||||||
|
|
|
2015 |
|
2014 |
|
|
2013 |
|
||
|
Net income (loss) |
|
$ |
(36,627) |
|
$ |
15,583 |
|
$ |
99 |
|
|
|
|
|
|
|
|
|
|
|
|
|
|
Weighted average shares outstanding, basic |
|
|
48,891,327 |
|
|
43,313,200 |
|
|
43,313,200 |
|
|
Weighted average common equivalent shares |
|
|
— |
|
|
— |
|
|
— |
|
|
Weighted average shares outstanding, diluted |
|
|
48,891,327 |
|
|
43,313,200 |
|
|
43,313,200 |
|
|
Net earnings (loss) per share, basic and diluted |
|
$ |
(0.75) |
|
$ |
0.36 |
|
$ |
0.00 |
|
|
Equity instruments excluded from diluted net earnings (loss) per share calculation as the effect would have been anti-dilutive: |
|
|
|
|
|
|
|
|
|
|
|
Stock options |
|
|
36,304 |
|
|
— |
|
|
— |
|
|
Restricted stock |
|
|
183,974 |
|
|
— |
|
|
— |
|
13. Income Taxes
Income tax expense (benefit) for the years ended December 31 consists of the following:
|
|
|
|
|
|
|
|
|
|
|
|
|
|
|
Current |
|
Deferred |
|
Total |
|
|||
|
2015 |
|
|
|
|
|
|
|
|
|
|
|
U.S. federal |
|
$ |
5,659 |
|
$ |
(3,808) |
|
$ |
1,851 |
|
|
State and local |
|
|
3,169 |
|
|
2,508 |
|
|
5,677 |
|
|
|
|
$ |
8,828 |
|
$ |
(1,300) |
|
$ |
7,528 |
|
|
|
|
|
|
|
|
|
|
|
|
|
|
|
|
Current |
|
Deferred |
|
Total |
|
|||
|
2014 |
|
|
|
|
|
|
|
|
|
|
|
U.S. federal |
|
$ |
13,553 |
|
$ |
(2,416) |
|
$ |
11,137 |
|
|
State and local |
|
|
4,450 |
|
|
(2,391) |
|
|
2,059 |
|
|
|
|
$ |
18,003 |
|
$ |
(4,807) |
|
$ |
13,196 |
|
|
|
|
|
|
|
|
|
|
|
|
|
|
|
|
Current |
|
Deferred |
|
Total |
|
|||
|
2013 |
|
|
|
|
|
|
|
|
|
|
|
U.S. federal |
|
$ |
717 |
|
$ |
3,478 |
|
$ |
4,195 |
|
|
State and local |
|
|
756 |
|
|
975 |
|
|
1,731 |
|
|
|
|
$ |
1,473 |
|
$ |
4,453 |
|
$ |
5,926 |
|
80
Income tax expense differed from the amounts computed by applying the U.S. federal income tax rate of 35% to pretax income as a result of the following:
|
|
|
|
|
|
|
|
|
|
|
|
|
|
|
December 31, |
|
|||||||
|
|
|
2015 |
2014 |
2013 |
|
|||||
|
Tax at federal statutory rate |
|
$ |
(10,185) |
|
$ |
10,073 |
|
$ |
2,109 |
|
|
State and local income taxes, net of federal income tax benefit |
|
|
1,335 |
|
|
2,144 |
|
|
830 |
|
|
Effect of state rate changes |
|
|
1,263 |
|
|
(89) |
|
|
1,036 |
|
|
Nondeductible equity-based compensation |
|
|
1,316 |
|
|
728 |
|
|
1,725 |
|
|
Nondeductible equity-based compensation plan modification |
|
|
13,115 |
|
|
— |
|
|
— |
|
|
Nondeductible expenses, tax reserve adjustments, and other, net |
|
|
684 |
|
|
340 |
|
|
226 |
|
|
|
|
$ |
7,528 |
|
$ |
13,196 |
|
$ |
5,926 |
|
The tax effects of temporary differences that give rise to significant portions of the deferred tax assets and deferred tax liabilities at December 31 are presented below:
|
|
|
|
|
|
|
|
|
|
|
|
2015 |
|
2014 |
|
||
|
Deferred tax assets: |
|
|
|
|
|
|
|
|
Accounts receivable |
|
$ |
319 |
|
$ |
257 |
|
|
Accrued liabilities |
|
|
806 |
|
|
188 |
|
|
Net operating loss carryforward |
|
|
320 |
|
|
610 |
|
|
Equity-based compensation expense |
|
|
9,054 |
|
|
4,002 |
|
|
Total gross deferred tax assets |
|
|
10,499 |
|
|
5,057 |
|
|
Deferred tax liabilities: |
|
|
|
|
|
|
|
|
Prepaid expenses |
|
|
1,764 |
|
|
1,158 |
|
|
Capital lease |
|
|
877 |
|
|
523 |
|
|
Property and equipment |
|
|
6,031 |
|
|
4,113 |
|
|
Intangible assets and goodwill |
|
|
127,006 |
|
|
125,742 |
|
|
Total gross deferred tax liabilities |
|
|
135,678 |
|
|
131,536 |
|
|
Net deferred tax liabilities |
|
$ |
125,179 |
|
$ |
126,479 |
|
In assessing the reliability of deferred tax assets, management considers whether it is more likely than not that some portion or all of the deferred tax assets will not be realized. The ultimate realization of deferred tax assets is dependent upon the generation of future taxable income during the periods in which those temporary differences become deductible. Management considers the scheduled reversal of deferred tax liabilities, projected future taxable income, and tax planning strategies in making this assessment. Based upon the planned reversal of deferred tax liabilities and the level of historical taxable income and projections for future taxable income over the periods in which the deferred tax assets are deductible, management believes, as of December 31, 2015, it is more likely than not that the Company will realize the benefits of these deductible differences.
At December 31, 2015, the Company has available unused net operating loss carryforwards of approximately $900,000 that may be applied against future taxable income and expire in years ending December 31, 2025 through 2033. The Company has not recorded a valuation allowance as sufficient positive evidence exists to support the Company’s conclusion that it will generate enough taxable income to utilize the net operating loss carryforwards prior to their expiration.
At December 31, 2015 and 2014, no liability has been recorded for uncertain tax positions.
81
It is reasonably possible that the amount of unrecognized tax benefits may significantly change in the next 12 months due to audit activity, tax payments, or final decisions in matters that are the subject of controversy in various taxing jurisdictions in which the Company operates. The Company is not able to reasonably estimate the amount or the future periods in which changes in unrecognized tax benefits will be required.
The Company files income tax returns in the U.S. and various state and local jurisdictions and is therefore subject to periodic audits by these tax authorities. The Company is subject to examination by the Internal Revenue Service for 2012 and later years.
14. Segment and Geographic Information
An operating segment is a component of an enterprise that engages in business activities and has discrete financial information that is regularly reviewed by the enterprise’s chief operating decision maker to assess performance of the individual component and make decisions about allocating resources to the component. The Company produces one set of financial information at the enterprise level that is regularly reviewed by the Company’s chief operating decision maker. Discrete financial information is not produced or reviewed by the Company’s chief operating decision maker at a level lower than the enterprise level. As such, the Company has one operating segment as of December 31, 2015 and 2014.
The Company’s identifiable assets are located in the United States and over 99% of the Company’s revenues are located in the United States. The Company’s revenues are generated primarily from performance improvement services provided to clients in the healthcare industry.
15. Commitments and Contingencies
Litigation
The Company is involved in various legal actions in the ordinary course of its operations. Management believes that any liability resulting from these matters will not have a material impact on the consolidated financial position or results of operations of the Company.
16. Related Party Transactions
The Company was charged an annual management fee that was payable quarterly to its majority shareholder, Vestar. The annual management fee is no longer charged after the effective date of the IPO. The Company incurred management fees of $553,000, $1.0 million, and $907,000 for the years ended December 31, 2015, 2014 and 2013, respectively.
In connection with the IPO, the Company paid a one-time transaction advisory fee to Vestar of $8.5 million. This fee was reflected as a distribution payment on the consolidated statement of cash flows for the year ended December 31, 2015, and reduced retained earnings on the consolidated balance sheet as of December 31, 2015.
17. Subsequent Events
The Company evaluated subsequent events after December 31, 2015 through the date of issuance. The Company concluded that no material events or transactions occurred subsequent to December 31, 2015, that provide additional evidence about conditions that existed at December 31, 2015, or after, that require adjustment to or disclosure in the consolidated financial statements.
82
Item 9. Changes in and Disagreements with Accountants on Accounting and Financial Disclosure
Not applicable.
Item 9A. Controls and Procedures
Disclosure Controls and Procedures
Under the direction of our Chief Executive Officer and Chief Financial Officer, we evaluated our disclosure controls and procedures and internal control over financial reporting and our Chief Executive Officer and Chief Financial Officer concluded that our disclosure controls and procedures were effective as of the end of the period covered by this report.
Changes in Internal Control over Financial Reporting
There have been no changes in our internal control over financial reporting during the quarter ended December 31, 2015 that have materially affected, or are reasonably likely to materially affect, our internal control over financial reporting.
Management’s Annual Report on Internal Control over Financial Reporting
This annual report does not include a report of management’s assessment regarding internal control over financial reporting or an attestation report of our independent registered public accounting firm due to a transition period established by rules of the Securities and Exchange Commission for newly public companies.
None.
Certain information required by Part III is omitted from this annual report and is incorporated herein by reference to the Registrant’s definitive proxy statement to be filed with the SEC in connection with its 2016 Annual Meeting of Stockholders scheduled to be held on June 21, 2016.
Item 10. Directors, Executive Officers, and Corporate Governance
Code of Business Conduct and Ethics
We have adopted a code of business conduct and ethics that applies to all of our employees, officers and directors, including those officers responsible for financial reporting. Our code of business conduct and ethics is available on our website at www.pressganey.com. We intend to disclose any amendments to the code, or any waivers of its requirements, on our website. The information on or accessible through our website does not constitute part of, and is not incorporated by reference into, this annual report.
Information relating to our executive officers is included under the caption “Executive Officers of the Registrant” in Part I of this Report.
The information set forth under the captions “Elections of Directors” and “Section 16(a) Beneficial Ownership Reporting Compliance” in our proxy statement to be filed with the SEC in connection with our 2016 Annual Meeting of Stockholders is incorporated in this annual report by reference.
83
Item 11. Executive Compensation
The information set forth under the caption “Executive Compensation” in our proxy statement in connection with our 2016 Annual Meeting of Stockholders is incorporated in this annual report by reference.
Item 12. Security Ownership of Certain Beneficial Owners and Management and Related Stockholder Matters
The information set forth under the caption “Security Ownership of Management and Certain Beneficial Owners” in our proxy statement in connection with our 2016 Annual Meeting of Stockholders is incorporated in this annual report by reference.
Item 13. Certain Relationships and Related Transactions, and Director Independence
The information set forth under the captions “Certain Relationships and Related Transactions,” “Election of Directors” and “Compensation Committee Interlocks” in our proxy statement in connection with our 2016 Annual Meeting of Stockholders is incorporated in this annual report by reference.
Item 14. Principal Accountant Fees and Services
The information set forth under the captions “Ratification of Independent Public Accountant – Independent Accountant Fees” and “Audit Committee Report” in our proxy statement in connection with our 2016 Annual Meeting of Stockholders is incorporated in this annual report by reference.
84
PART IV
Item 15. Exhibits and Financial Statement Schedules
|
(a) |
The following documents are filed as part of this report: |
|
1. |
Consolidated Financial Statements (see Item 8) |
|
2. |
Financial Statement Schedules |
Schedule II: Valuation and Qualifying Accounts
The table below details the activity of the allowance for doubtful accounts for the three years ended December 31, 2015 (in thousands):
|
|
|
Balance at |
|
Additions |
|
|
|
|
Balance at |
|
|||
|
|
|
Beginning |
|
Charged to |
|
|
|
|
End of |
|
|||
|
|
|
of Year |
|
Expense |
|
Deductions |
|
Year |
|
||||
|
Year Ended December 31, 2015 |
|
$ |
531 |
|
$ |
520 |
|
$ |
(277) |
|
$ |
774 |
|
|
Year Ended December 31, 2014 |
|
$ |
596 |
|
$ |
290 |
|
$ |
(355) |
|
$ |
531 |
|
|
Year Ended December 31, 2013 |
|
$ |
623 |
|
$ |
400 |
|
$ |
(427) |
|
$ |
596 |
|
All other schedules have been omitted because they are not required, not applicable, or the required information is otherwise included.
|
3. |
Exhibits: |
|
|
|
|
|
|
Exhibit |
|
Description of Exhibit |
|
|
|
3.1 |
|
Amended and Restated Certificate of Incorporation of Press Ganey Holdings, Inc. (Incorporated by reference to Exhibit 3.1 to the Company’s Current Report on Form 8-K filed with the SEC on May 27, 2015) |
|
|
3.2 |
|
Amended and Restated Bylaws of Press Ganey Holdings, Inc. (Incorporated by reference to Exhibit 3.2 to the Company’s Current Report on Form 8-K filed with the SEC on May 27, 2015) |
|
|
4.1 |
|
Specimen Stock Certificate evidencing the shares of common stock (Incorporated by reference to Exhibit 4.1 to Amendment No. 2 to the Company’s Registration Statement on Form S-1 (File No. 333-203248), filed with the SEC on May 11, 2015) |
|
|
10.1 |
|
Credit Agreement dated July 31, 2015, by and among Press Ganey Holdings, Inc., Barclays Bank PLC, as administrative agent and collateral agent, and the other lenders party thereto (Incorporated by reference to Exhibit 10.1 to the Company’s Current Report on Form 8-K filed with the SEC on August 3, 2015) |
|
|
10.2 |
|
Form of Indemnification Agreement (Incorporated by reference to Exhibit 10.5 to Amendment No. 2 to the Company’s Registration Statement on Form S-1 (File No. 333-203248), filed with the SEC on May 11, 2015) |
|
|
10.3 |
|
Press Ganey Holdings, Inc. 2015 Incentive Award Plan (Incorporated by reference to Exhibit 10.9.1 to Amendment No. 2 to the Company’s Registration Statement on Form S-1 (File 333-203248), filed with the SEC on May 11, 2015) |
|
|
10.4 |
|
Form of Option Agreement under the 2015 Incentive Award Plan (Incorporated by reference to Exhibit 10.9.2 to Amendment No. 2 to the Company’s Registration Statement on Form S-1 (File 333-203248), filed with the SEC on May 11, 2015) |
|
|
10.5 |
|
Form of Restricted Stock Agreement under the 2015 Incentive Award Plan (Incorporated by reference to Exhibit 10.9.3 to Amendment No. 2 to the Company’s Registration Statement on Form S-1 (File 333-203248), filed with the SEC on May 11, 2015) |
85
|
|
|
|
|
|
Exhibit
|
|
Description of Exhibit |
|
|
|
10.6 |
|
Form of Restricted Stock Unit Agreement under the 2015 Incentive Award Plan (Incorporated by reference to Exhibit 10.9.4 to Amendment No. 2 to the Company’s Registration Statement on Form S-1 (File 333-203248), filed with the SEC on May 11, 2015) |
|
|
10.7 |
|
Press Ganey Holdings, Inc. Non-Employee Director Compensation Program (Incorporated by reference to Exhibit 10.13 to Amendment No. 2 to the Company’s Registration Statement on Form S-1 (File 333-203248), filed with the SEC on May 11, 2015) |
|
|
10.8 |
|
Amended and Restated Employment Agreement, dated April 10, 2015, by and among PGA Holdings, Inc., Press Ganey Associates, Inc. and Patrick T. Ryan (Incorporated by reference to Exhibit 10.10.1 to Amendment No. 2 to the Company’s Registration Statement on Form S-1 (File 333-203248), filed with the SEC on May 11, 2015) |
|
|
10.9 |
|
Amended and Restated Employment Agreement, dated April 10, 2015, by and between Press Ganey Associates, Inc. and Joseph Greskoviak (Incorporated by reference to Exhibit 10.10.2 to Amendment No. 1 to the Company’s Registration Statement on Form S-1 (File 333-203248), filed with the SEC on May 4, 2015) |
|
|
10.10 |
|
Employment Agreement, effective May 21, 2012, by and between Press Ganey Associates, Inc. and Patricia Cmielewski (Incorporated by reference to Exhibit 10.10.6 to the Company’s Registration Statement on Form S-1 (File 333-203248), filed with the SEC on April 6, 2015) |
|
|
10.11 |
|
Amended and Restated Employment Agreement, effective April 10, 2015, by and between Press Ganey Associates, Inc. and Devin Anderson (Incorporated by reference to Exhibit 10.10.7 to Amendment No. 1 to the Company’s Registration Statement on Form S-1 (File 333-203248), filed with the SEC on May 4, 2015) |
|
|
10.12 |
|
Letter Agreement dated August 21, 2015, by and between Press Ganey Holdings, Inc. and Matthew W. Hallgren (Incorporated by reference to Exhibit 10.2 to the Company’s Quarterly Report on Form 10-Q for the quarterly period ended September 30, 2015, filed with the SEC on November 6, 2015) |
|
|
10.13 |
|
Employment Agreement effective August 31, 2015, by and between Press Ganey Holdings, Inc. and Breht T. Feigh (Incorporated by reference to Exhibit 10.3 to the Company’s Quarterly Report on Form 10-Q for the quarterly period ended September 30, 2015, filed with the SEC on November 6, 2015) |
|
|
21.1 |
* |
List of Subsidiaries of Press Ganey Holdings, Inc. |
|
|
23.1 |
* |
Consent of Independent Registered Public Accounting Firm |
|
|
31.1 |
* |
Certification of Chief Executive Officer pursuant to Section 302 of the Sarbanes-Oxley Act of 2002 |
|
|
31.2 |
* |
Certification of Chief Financial Officer pursuant to Section 302 of the Sarbanes-Oxley Act of 2002 |
|
|
32.1 |
** |
Certifications of Chief Executive Officer and Chief Financial Officer pursuant to 18 U.S.C. Section 1350, as adopted pursuant to Section 906 of the Sarbanes-Oxley Act of 2002 |
|
|
101.INS |
* |
XBRL Instance Document |
|
|
101.SCH |
* |
XBRL Taxonomy Extension Schema Document |
|
|
101.CAL |
* |
XBRL Taxonomy Extension Calculation Linkbase Document |
|
|
101.DEF |
* |
XBRL Taxonomy Extension Definition Linkbase Document |
|
|
101.LAB |
* |
XBRL Taxonomy Extension Label Linkbase Document |
|
|
101.PRE |
* |
XBRL Taxonomy Extension Presentation Linkbase Document |
*Filed herewith.
**Furnished herewith.
86
Pursuant to the requirements of Section 13 or 15(d) of the Securities Exchange Act of 1934, the registrant has duly caused this report to be signed on its behalf by the undersigned thereunto duly authorized.
|
|
|
|
PRESS GANEY HOLDINGS, INC. |
|
|
|
|
|
|
|
|
|
|
|
Date: March 1, 2016 |
|
By: |
/S/ PATRICK T. RYAN |
|
|
|
Name: |
Patrick T. Ryan |
|
|
|
Title: |
Chief Executive Officer |
|
|
|
|
|
Pursuant to the requirements of the Securities Exchange Act of 1934, this report has been signed below by the following persons on behalf of the registrant and in the capacities and on the dates indicated.
|
Signature |
Title |
Date |
|
|
|
|
|
/s/ Patrick T. Ryan |
Chief Executive Officer (principal executive officer) and Director |
March 1, 2016 |
|
Patrick T. Ryan |
|
|
|
|
|
|
|
/s/ Breht T. Feigh |
Chief Financial Officer (principal financial officer and principal accounting officer) |
March 1, 2016 |
|
Breht T. Feigh |
|
|
|
|
|
|
|
/s/ Norman W. Alpert |
Chairman of the Board of Directors |
March 1, 2016 |
|
Norman W. Alpert |
|
|
|
|
|
|
|
/s/ Andrew J. Cavanna |
Director |
March 1, 2016 |
|
Andrew J. Cavanna |
|
|
|
|
|
|
|
/s/ Leslie V. Norwalk |
Director |
March 1, 2016 |
|
Leslie V. Norwalk |
|
|
|
|
|
|
|
/s/ Gregory S. Roth |
Director |
March 1, 2016 |
|
Gregory S. Roth |
|
|
|
|
|
|
|
/s/ Dr. Ralph Snyderman |
Director |
March 1, 2016 |
|
Dr. Ralph Snyderman |
|
|
|
|
|
|
|
/s/ Ellen M. Zane |
Director |
March 1, 2016 |
|
Ellen M. Zane |
|
|
87