Attached files
| file | filename |
|---|---|
| 8-K - FORM 8-K - ONCOR ELECTRIC DELIVERY CO LLC | d141647d8k.htm |
| Exhibit 99.1
|

Exhibit 99.1
ONCOR
Fourth Quarter and Year End 2015 Investor Call
March 1, 2016
Oncor Electric Delivery
|
|
Forward Looking Statements
This presentation contains forward-looking statements, which are subject to various risks and uncertainties. Discussion of risks and uncertainties that could cause actual results to differ materially from management’s current projections, forecasts, estimates and expectations is contained in filings made by Oncor Electric Delivery Company LLC (Oncor) with the Securities and Exchange Commission (SEC). Specifically, Oncor makes reference to the section entitled “Risk Factors” in its annual and quarterly reports. In addition to the risks and uncertainties set forth in Oncor’s SEC filings, the forward-looking statements in this presentation could be affected by, among other things: prevailing governmental policies and regulatory actions; legal and administrative proceedings and settlements, including the exercise of equitable powers by courts; any impacts on Oncor as a result of the bankruptcy proceedings involving Energy Future Holdings Corp. (EFH) and certain of its subsidiaries and the consummation of the transactions and change in indirect ownership of Oncor proposed in such proceedings; weather conditions and other natural phenomena; acts of sabotage, wars or terrorist or cyber security threats or activities; economic conditions, including the impact of a recessionary environment; unanticipated population growth or decline, or changes in market demand and demographic patterns; changes in business strategy, development plans or vendor relationships; unanticipated changes in interest rates or rates of inflation; unanticipated changes in operating expenses, liquidity needs and capital expenditures; inability of various counterparties to meet their financial obligations to Oncor, including failure of counterparties to perform under agreements; general industry trends; hazards customary to the industry and the possibility that Oncor may not have adequate insurance to cover losses resulting from such hazards; changes in technology used by and services offered by Oncor; significant changes in Oncor’s relationship with its employees; changes in assumptions used to estimate costs of providing employee benefits, including pension and other post-retirement employee benefits, and future funding requirements related thereto; significant changes in critical accounting policies material to Oncor; commercial bank and financial market conditions, access to capital, the cost of such capital, and the results of financing and refinancing efforts, including availability of funds in the capital markets and the potential impact of disruptions in US credit markets; circumstances which may contribute to future impairment of goodwill, intangible or other long-lived assets; financial restrictions under Oncor’s revolving credit facility and indentures governing its debt instruments; Oncor’s ability to generate sufficient cash flow to make interest payments on its debt instruments; actions by credit rating agencies; and Oncor’s ability to effectively execute its operational strategy. Any forward-looking statement speaks only as of the date on which it is made, and Oncor undertakes no obligation to update any forward-looking statement to reflect events or circumstances after the date on which it is made or to reflect the occurrence of unanticipated events.
Regulation G
This presentation includes certain non-GAAP financial measures. Reconciliations of these measures to the most directly comparable GAAP measures are included in this presentation, which is available on Oncor’s website, www.oncor.com, in the Investor section, and also filed with the SEC.
Oncor Electric Delivery 1
|
|
4th Quarter and Year End 2015 Investor Call Agenda
Financial Overview David Davis
Chief Financial Officer
Operational Review Bob Shapard Chief Executive
Q&A
Oncor Electric Delivery 2
|
|
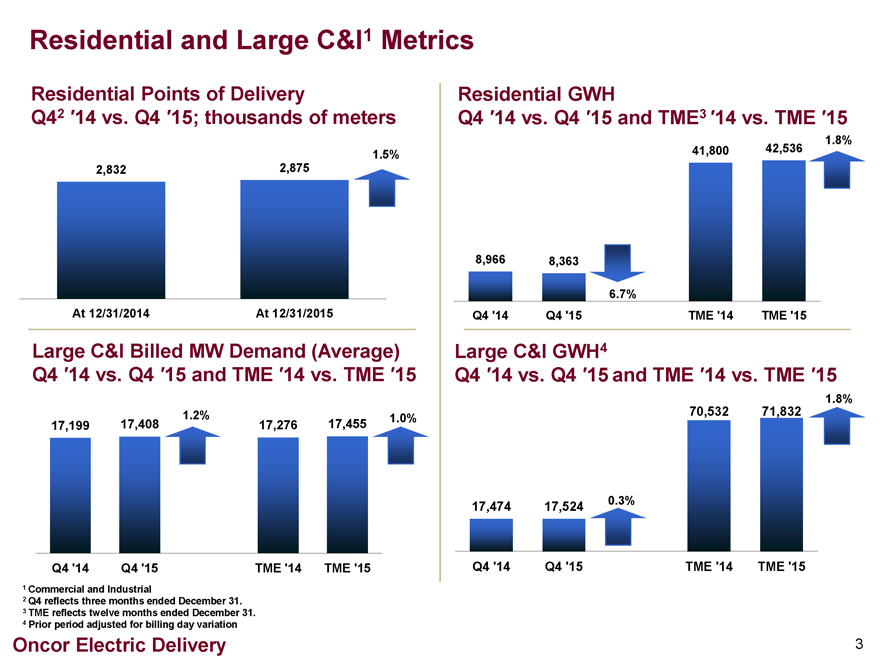
Residential and Large C&I1 Metrics
Residential Points of Delivery Residential GWH
Q42 ?14 vs. Q4 ?15; thousands of meters Q4 ?14 vs. Q4 ?15 and TME3 ?14 vs. TME ?15
1.8% 41,800 42,536
1.5% 2,832 2,875
8,966 8,363
6.7%
At 12/31/2014 At 12/31/2015 Q4 ‘14 Q4 ‘15 TME ‘14 TME ‘15
Large C&I Billed MW Demand (Average) Large C&I GWH4
Q4 ?14 vs. Q4 ?15 and TME ?14 vs. TME ?15 Q4 ?14 vs. Q4 ?15 and TME ?14 vs. TME ?15
1.8%
1.2% 70,532 71,832
1.0%
17,199 17,408 17,276 17,455
0.3%
17,474 17,524
Q4 ‘14 Q4 ‘15 TME ‘14 TME ‘15 Q4 ‘14 Q4 ‘15 TME ‘14 TME ‘15
1 Commercial and Industrial
2 Q4 reflects three months ended December 31.
3 TME reflects twelve months ended December 31.
4 Prior period adjusted for billing day variation
Oncor Electric Delivery 3
|
|
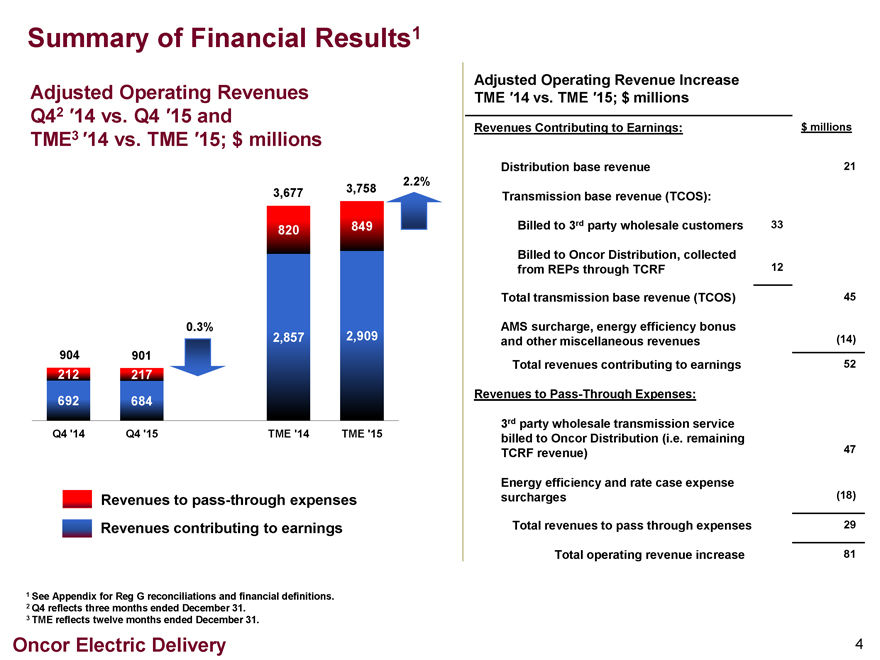
Summary of Financial Results1
Adjusted Operating Revenues Q42 14 vs. Q4 15 and TME3 14 vs. TME 15; $ millions
2.2% 3,677 3,758
820 849
0.3%
2,857 2,909
904 901
212 217
692 684
Q4 ‘14 Q4 ‘15 TME ‘14 TME ‘15
Revenues to pass-through expenses Revenues contributing to earnings
1 See Appendix for Reg G reconciliations and financial definitions.
2 Q4 reflects three months ended December 31.
3 TME reflects twelve months ended December 31.
Adjusted Operating Revenue Increase
TME 14 vs. TME 15; $ millions
Revenues Contributing to Earnings: $ millions
Distribution base revenue 21 Transmission base revenue (TCOS): Billed to 3rd party wholesale customers 33
Billed to Oncor Distribution, collected from REPs through TCRF 12
Total transmission base revenue (TCOS) 45
AMS surcharge, energy efficiency bonus and other miscellaneous revenues (14) Total revenues contributing to earnings 52
Revenues to Pass-Through Expenses:
3rd party wholesale transmission service billed to Oncor Distribution (i.e. remaining TCRF revenue) 47
Energy efficiency and rate case expense surcharges (18)
Total revenues to pass through expenses 29
Total operating revenue increase 81
Oncor Electric Delivery 4
|
|
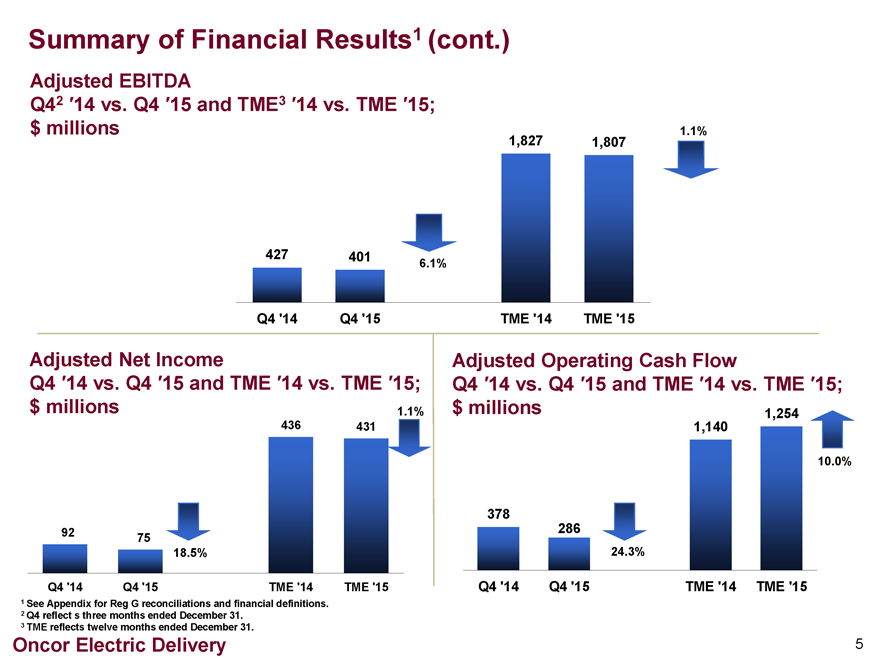
Summary of Financial Results1 (cont.)
Adjusted EBITDA
Q42 14 vs. Q4 15 and TME3 14 vs. TME 15; $ millions 1.1%
1,827 1,807
427 401
6.1%
Q4 ‘14 Q4 ‘15 TME ‘14 TME ‘15
Adjusted Net Income Adjusted Operating Cash Flow
Q4 14 vs. Q4 15 and TME 14 vs. TME 15; Q4 14 vs. Q4 15 and TME 14 vs. TME 15; $ millions 1.1% $ millions 1,254
436 431 1,140
10.0%
378
92 286
75
18.5% 24.3%
Q4 ‘14 Q4 ‘15 TME ‘14 TME ‘15 Q4 ‘14 Q4 ‘15 TME ‘14 TME ‘15
1 See Appendix for Reg G reconciliations and financial definitions.
2 Q4 reflect s three months ended December 31.
3 TME reflects twelve months ended December 31.
Oncor Electric Delivery 5
|
|
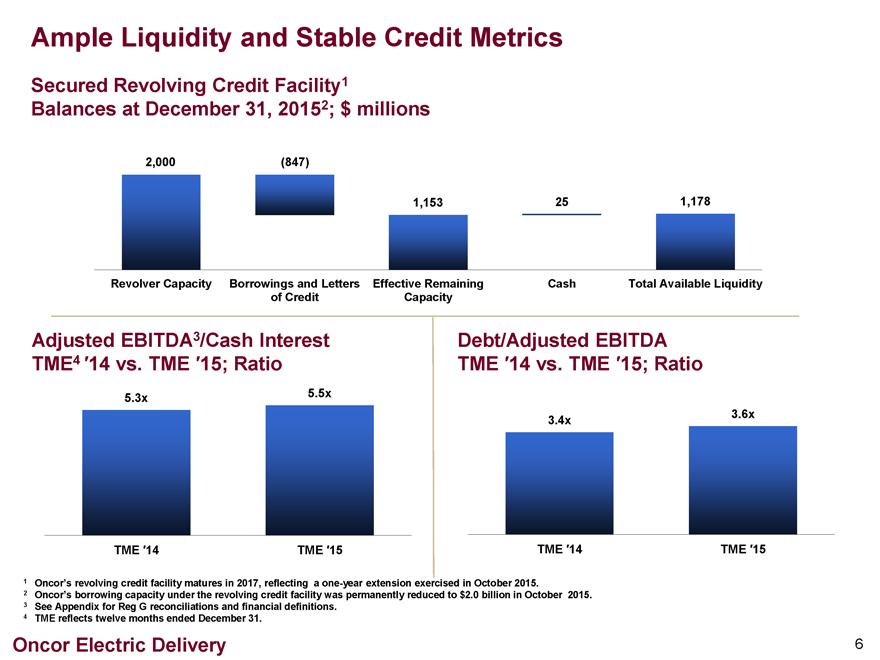
Ample Liquidity and Stable Credit Metrics
Secured Revolving Credit Facility1
Balances at December 31, 20152; $ millions
2,000 (847)
1,153 25 1,178
Revolver Capacity Borrowings and Letters Effective Remaining Cash Total Available Liquidity of Credit Capacity
Adjusted EBITDA3/Cash Interest Debt/Adjusted EBITDA
TME4 14 vs. TME 15; Ratio TME 14 vs. TME 15; Ratio
5.3x 5.5x
3.6x 3.4x
TME 14 TME 15 TME 14 TME 15
1 Oncor’s revolving credit facility matures in 2017, reflecting a one-year extension exercised in October 2015.
2 Oncor’s borrowing capacity under the revolving credit facility was permanently reduced to $2.0 billion in October 2015.
3 See Appendix for Reg G reconciliations and financial definitions.
4 TME reflects twelve months ended December 31.
Oncor Electric Delivery 6
|
|
4th Quarter and Year End 2015 Investor Call Agenda
Financial Overview David Davis
Chief Financial Officer
Operational Review Bob Shapard Chief Executive
Q&A
Oncor Electric Delivery 7
|
|
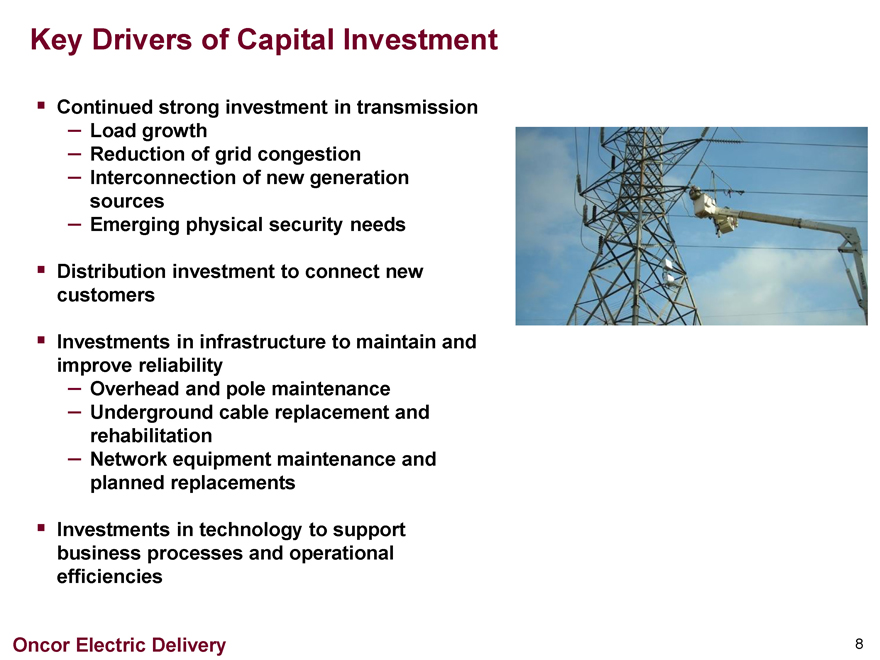
Key Drivers of Capital Investment
Continued strong investment in transmission
– Load growth
– Reduction of grid congestion
– Interconnection of new generation sources
– Emerging physical security needs
Distribution investment to connect new customers
Investments in infrastructure to maintain and improve reliability
– Overhead and pole maintenance
– Underground cable replacement and rehabilitation
– Network equipment maintenance and planned replacements
Investments in technology to support business processes and operational efficiencies
Oncor Electric Delivery 8
|
|
Appendix—
Regulation G Reconciliations and Financial Definitions
Oncor Electric Delivery 9
|
|
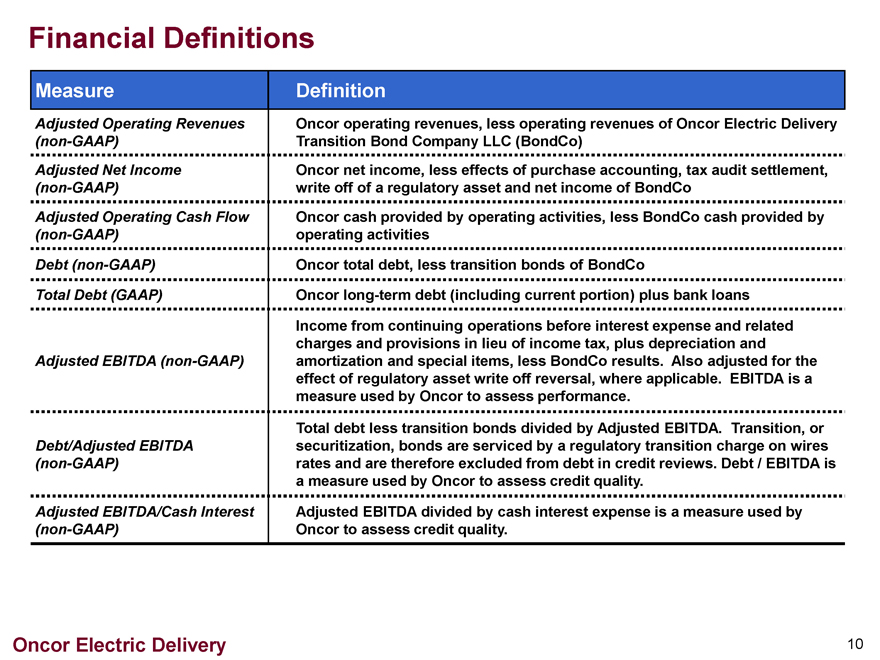
Financial Definitions
Measure Definition
Adjusted Operating Revenues Oncor operating revenues, less operating revenues of Oncor Electric Delivery (non-GAAP) Transition Bond Company LLC (BondCo)
Adjusted Net Income Oncor net income, less effects of purchase accounting, tax audit settlement, (non-GAAP) write off of a regulatory asset and net income of BondCo
Adjusted Operating Cash Flow Oncor cash provided by operating activities, less BondCo cash provided by (non-GAAP) operating activities
Debt (non-GAAP) Oncor total debt, less transition bonds of BondCo
Total Debt (GAAP) Oncor long-term debt (including current portion) plus bank loans
Income from continuing operations before interest expense and related charges and provisions in lieu of income tax, plus depreciation and Adjusted EBITDA (non-GAAP) amortization and special items, less BondCo results. Also adjusted for the effect of regulatory asset write off reversal, where applicable. EBITDA is a measure used by Oncor to assess performance.
Total debt less transition bonds divided by Adjusted EBITDA. Transition, or Debt/Adjusted EBITDA securitization, bonds are serviced by a regulatory transition charge on wires (non-GAAP) rates and are therefore excluded from debt in credit reviews. Debt / EBITDA is a measure used by Oncor to assess credit quality.
Adjusted EBITDA/Cash Interest Adjusted EBITDA divided by cash interest expense is a measure used by (non-GAAP) Oncor to assess credit quality.
Oncor Electric Delivery 10
|
|
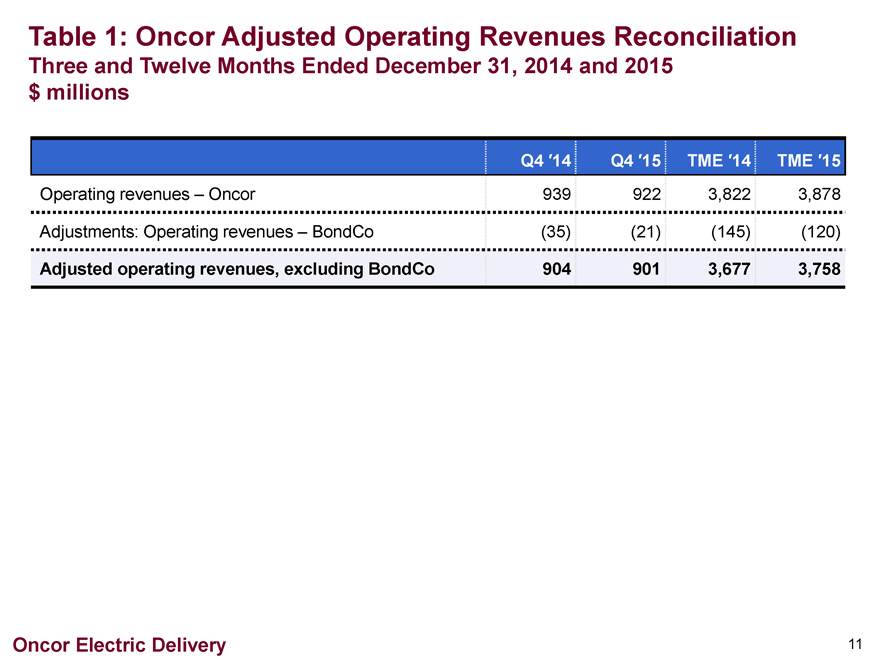
Table 1: Oncor Adjusted Operating Revenues Reconciliation
Three and Twelve Months Ended December 31, 2014 and 2015 $ millions
Q4 14 Q4 15 TME 14 TME 15
Operating revenues – Oncor 939 922 3,822 3,878
Adjustments: Operating revenues – BondCo (35) (21) (145) (120)
Adjusted operating revenues, excluding BondCo 904 901 3,677 3,758
Oncor Electric Delivery 11
|
|
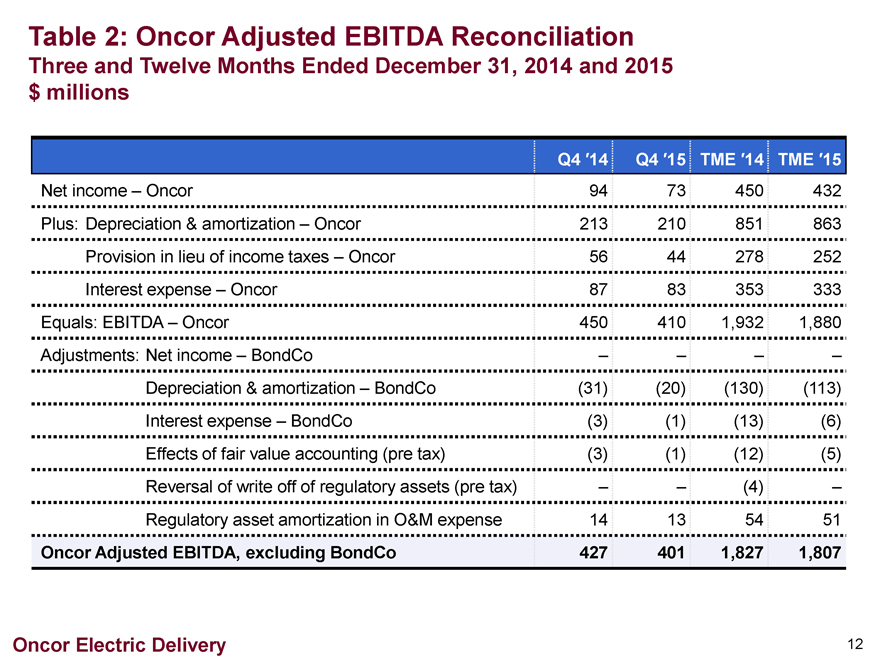
Table 2: Oncor Adjusted EBITDA Reconciliation
Three and Twelve Months Ended December 31, 2014 and 2015 $ millions
Q4 14 Q4 15 TME 14 TME 15
Net income – Oncor 94 73 450 432 Plus: Depreciation & amortization – Oncor 213 210 851 863 Provision in lieu of income taxes – Oncor 56 44 278 252 Interest expense – Oncor 87 83 353 333 Equals: EBITDA – Oncor 450 410 1,932 1,880 Adjustments: Net income – BondCo Depreciation & amortization – BondCo (31) (20) (130) (113) Interest expense – BondCo (3) (1) (13) (6) Effects of fair value accounting (pre tax) (3) (1) (12) (5) Reversal of write off of regulatory assets (pre tax) (4) Regulatory asset amortization in O&M expense 14 13 54 51
Oncor Adjusted EBITDA, excluding BondCo 427 401 1,827 1,807
Oncor Electric Delivery 12
|
|
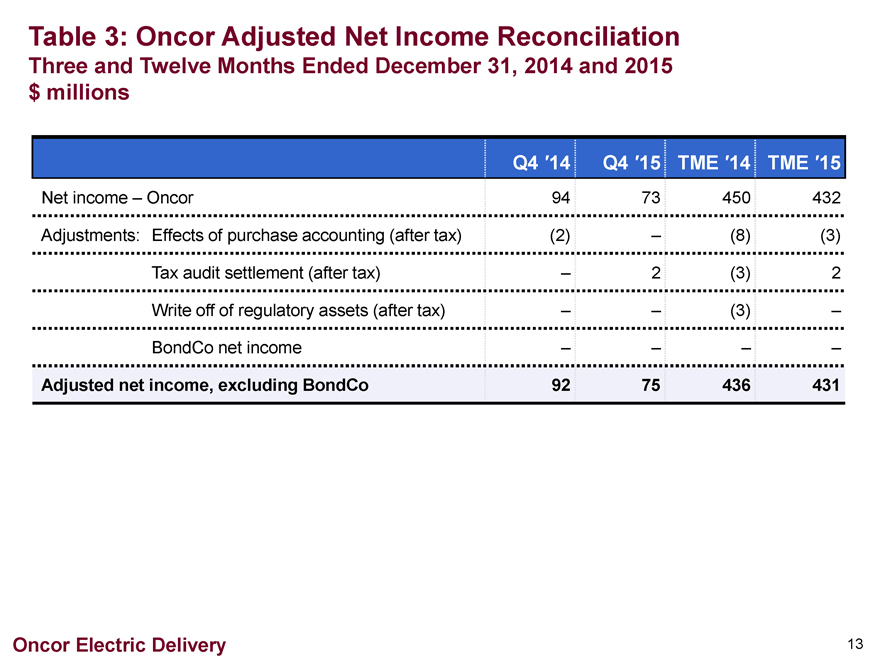
Table 3: Oncor Adjusted Net Income Reconciliation
Three and Twelve Months Ended December 31, 2014 and 2015 $ millions
Q4 14 Q4 15 TME 14 TME 15
Net income – Oncor 94 73 450 432 Adjustments: Effects of purchase accounting (after tax) (2) (8) (3) Tax audit settlement (after tax) 2 (3) 2 Write off of regulatory assets (after tax) (3) BondCo net income
Adjusted net income, excluding BondCo 92 75 436 431
Oncor Electric Delivery 13
|
|
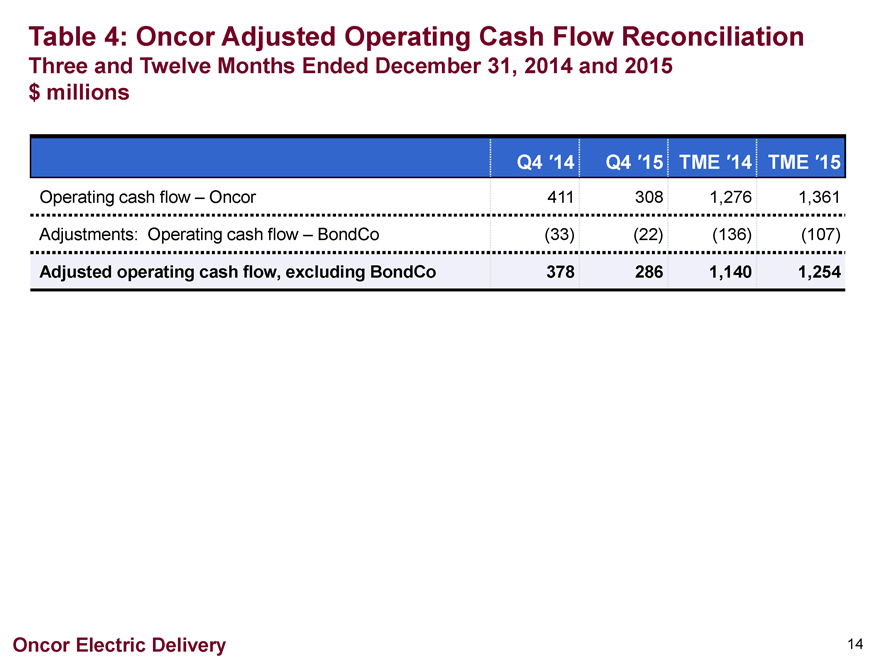
Table 4: Oncor Adjusted Operating Cash Flow Reconciliation
Three and Twelve Months Ended December 31, 2014 and 2015 $ millions
Q4 14 Q4 15 TME 14 TME 15
Operating cash flow – Oncor 411 308 1,276 1,361
Adjustments: Operating cash flow – BondCo (33) (22) (136) (107)
Adjusted operating cash flow, excluding BondCo 378 286 1,140 1,254
Oncor Electric Delivery 14
|
|
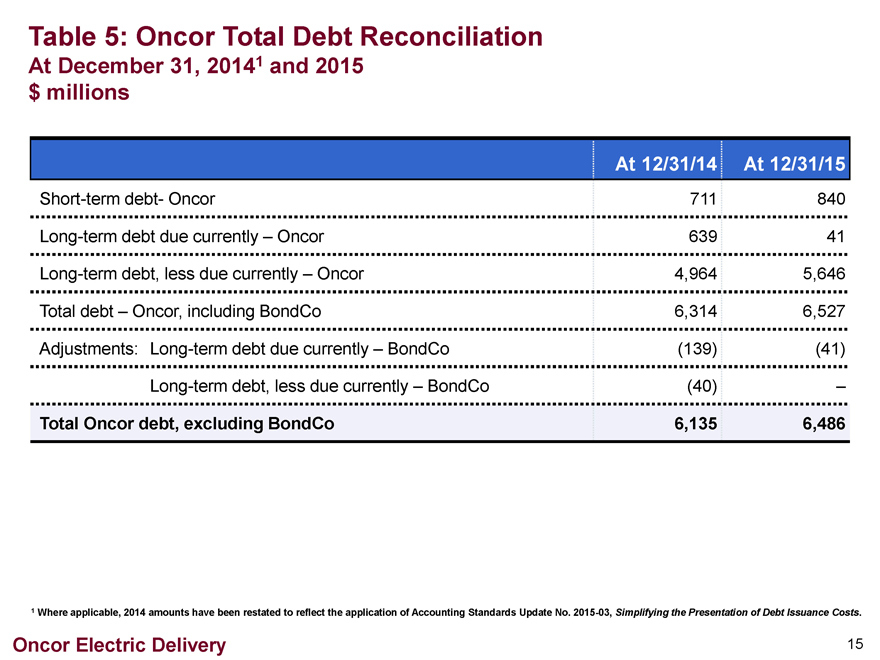
Table 5: Oncor Total Debt Reconciliation
At December 31, 20141 and 2015 $ millions
At 12/31/14 At 12/31/15
Short-term debt- Oncor 711 840 Long-term debt due currently – Oncor 639 41 Long-term debt, less due currently – Oncor 4,964 5,646 Total debt – Oncor, including BondCo 6,314 6,527 Adjustments: Long-term debt due currently – BondCo (139) (41) Long-term debt, less due currently – BondCo (40)
Total Oncor debt, excluding BondCo 6,135 6,486
1 Where applicable, 2014 amounts have been restated to reflect the application of Accounting Standards Update No. 2015-03, Simplifying the Presentation of Debt Issuance Costs.
Oncor Electric Delivery 15
|
|
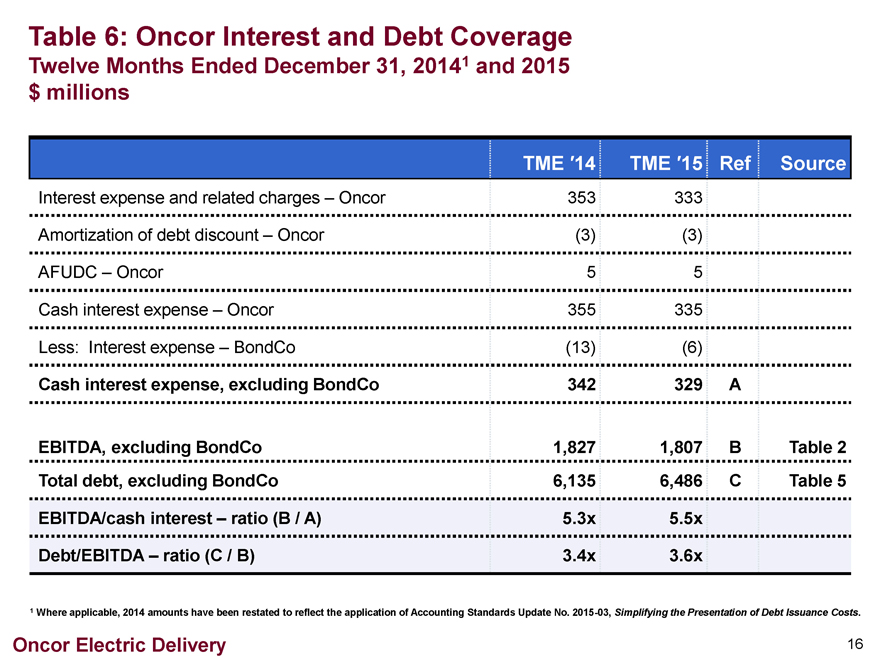
Table 6: Oncor Interest and Debt Coverage
Twelve Months Ended December 31, 20141 and 2015 $ millions
TME 14 TME 15 Ref Source
Interest expense and related charges – Oncor 353 333 Amortization of debt discount – Oncor (3) (3) AFUDC – Oncor 5 5 Cash interest expense – Oncor 355 335 Less: Interest expense – BondCo (13) (6)
Cash interest expense, excluding BondCo 342 329 A
EBITDA, excluding BondCo 1,827 1,807 B Table 2 Total debt, excluding BondCo 6,135 6,486 C Table 5
EBITDA/cash interest – ratio (B / A) 5.3x 5.5x
Debt/EBITDA – ratio (C / B) 3.4x 3.6x
1 Where applicable, 2014 amounts have been restated to reflect the application of Accounting Standards Update No. 2015-03, Simplifying the Presentation of Debt Issuance Costs.
Oncor Electric Delivery 16