Attached files
| file | filename |
|---|---|
| 8-K - FORM 8-K - Global Net Lease, Inc. | v433050_8k.htm |
| EX-99.2 - EXHIBIT 99.2 - Global Net Lease, Inc. | v433050_ex99-2.htm |
| EX-99.1 - EXHIBIT 99.1 - Global Net Lease, Inc. | v433050_ex99-1.htm |
Exhibit 99.3

February 2016 Investor Presentation

Strategic Positioning 2 Executive Summary Financial Highlights Portfolio Overview Investment Strategy Management Team Conclusion Pure - Play Real Estate Superior Portfolio Metrics Experienced International Management Differentiated Story Focused Management Diversified Portfolio

Diversified by asset type, geography, tenant and tenant industry Focus on single tenant, net lease, income producing, mission critical assets in the U.S., U.K., Germany, the Netherlands and Finland 72.6% of NOI derived from investment grade rated or implied investment grade rated tenants (1) 11.3 year weighted average remaining portfolio lease term (2) provides reliable cash flows with contractual and indexed rent growth (3) GNL is positioned to take advantage of broad net lease opportunities in both Western Europe and the U.S. Target markets nearly 3x the size of U.S. market with fewer competitors focused on owner - occupied real estate in Europe Proven track record across multiple economic cycles Externally advised by GNL Advisors (an AR - Global affiliate) and Moor Park, providing a highly scalable acquisition and asset management platform with visible acquisition pipeline from proven, country focused proprietary origination network Strong and flexible capital structure Foreign exchange fluctuations hedged through asset / liability matching and quarterly rolling forward swaps on net income Investment Highlights High - Quality, Diversified Net Lease Portfolio Strong, Creditworthy Tenant Base with Attractive Lease Terms Global Investment Strategy Experienced Management Team Flexible Balance Sheet 3 ___________________________ Source: All portfolio and financial information derived from unaudited company internal records as of December 31, 2015. Information shown based on U.S. Dollar equivalent amounts using exchange rates as of December 31, 2015. 1. Based on NOI. Actual ratings reflect the tenant rating. Implied Ratings are determined using a proprietary Moody’s analytical to ol, which compares the risk metrics of the non - rated company to those of a company with an Actual Rating. A tenant with a parent that has an investment grade rating is included in implied investment grade. Ratings in formation is as of the date the property was underwritten by the company. 2. Based on Square Feet. As of Feb 2016 3. Refers to leases with fixed percent or actual increases, or country CPI - indexed increases. Executive Summary Financial Highlights Portfolio Overview Investment Strategy Management Team Conclusion

Cash NOI $45,366 $172,544 AFFO 30,187 122,428 Dividend Yield – annualized (1) 8.9% Net Debt / Enterprise Value (2) 46.8% USD / Euro / GBP 23% / 40% / 37% Weighted Average Interest Rate Cost 2.5% Fixed / Floating Rate Debt 63% / 37% Interest Coverage (3) 5.5x Weighted Average Debt Maturity (4) 2.0 years Fiscal Year 2015 Key Highlights (in 000’s) 4 Source: All portfolio and financial information derived from unaudited company internal records as of December 31, 2015. Information shown based on U.S. Dollar equivalent amounts using exchange rates as of December 31, 2015. 1. Based on December 31, 2015 share price of $7.95. 2. Based on enterprise value of $ 2.5 billion calculated using the December 31, 2015 closing share price of $7.95 and total combined net debt of $1.2 billion, including $ 531.7 million of mortgage debt. 3. Based on annualized adjusted EBITDA for Q4 2015 of $42.2m 4. Credit facility has an initial maturity date of July 25, 2016 with two, one - year extensions subject to certain conditions. Weigh ted average debt maturity assumes that the extensions are exercised Financial Leverage Executive Summary Financial Highlights Portfolio Overview Investment Strategy Management Team Conclusion Q4 2015 FY 2015

Best in Class Portfolio 100% 100% 100% 100% 100% 100% 93% 64% 60% 36% 40% 0% 20% 40% 60% 80% 100% LXP NNN O SIR SRC STOR GPT WPC GNL U.S. Europe Geographic Breakdown 7.5 9.0 9.1 10.0 10.7 11.0 11.3 11.4 14.0 0.0 2.0 4.0 6.0 8.0 10.0 12.0 14.0 16.0 GPT WPC LXP O SRC SIR GNL NNN STOR Average Remaining Lease Term (Years) 96.5% 96.8% 97.8% 98.0% 98.4% 98.8% 98.8% 99.8% 100.0% 90% 92% 94% 96% 98% 100% LXP SRC SIR NNN O WPC GPT STOR GNL Occupancy 27.0% 23.2% 34.5% 39.1% 41.6% 46.0% 46.0% 0.0% 10.0% 20.0% 30.0% 40.0% 50.0% 60.0% 70.0% STOR SRC NNN WPC LXP SIR GNL GPT O N/A % Investment Grade Comps Average: 10.4 years Comps Average: 35.9% Comps Average: 98.3% ___________________________ Source: Company filings as of 12/31/2015. Note: GNL represents Global Net Lease, GPT represents Gramercy Property Trust, (which acquired CSG in 2015) LXP represents Le xin gton Realty Trust, NNN represents National Retail Properties, O represents Realty Income, SIR represents Select Income REIT, SRC represents Spirit Realty Capital, STOR represents Store Capital, and WPC repre sen ts W.P. Carey. All information based on annualized rent. 1. WPC’s international exposure includes JV’s and properties from through CSG acquisition 2. LXP excludes ground leases. Lease maturity ~12.4 years including ground leases. Term remaining Figures estimated as of 2/16 3. STOR includes eight ground leases with an average lease term of 75 years. (1) (2) (3) N/A Executive Summary Financial Highlights Portfolio Overview Investment Strategy Management Team Conclusion 5 73% incl. Implied IG Tenants
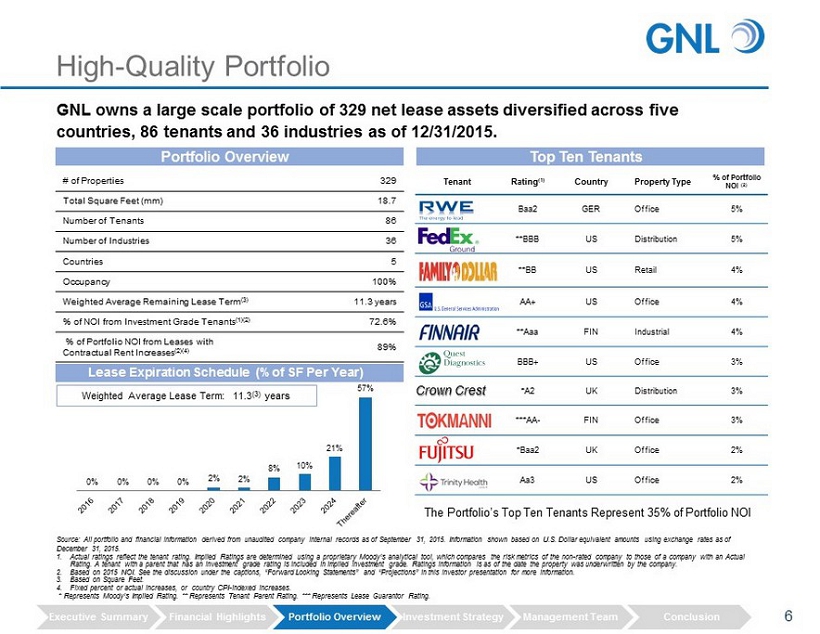
Tenant Rating (1) Country Property Type % of Portfolio NOI (2) Baa2 GER Office 5% **BBB US Distribution 5% **BB US Retail 4% AA+ US Office 4% **Aaa FIN Industrial 4% BBB+ US Office 3% Crown Crest *A2 UK Distribution 3% ***AA - FIN Office 3% *Baa2 UK Office 2% Aa3 US Office 2% High - Quality Portfolio Portfolio Overview Source: All portfolio and financial information derived from unaudited company internal records as of September 31, 2015. Information shown based on U.S. Dollar equivalent amounts using exchange rates as of December 31, 2015. 1. Actual ratings reflect the tenant rating. Implied Ratings are determined using a proprietary Moody’s analytical tool, which c omp ares the risk metrics of the non - rated company to those of a company with an Actual Rating. A tenant with a parent that has an investment grade rating is included in implied investment grade. Ratings informati on is as of the date the property was underwritten by the company. 2. Based on 2015 NOI. See the discussion under the captions, “Forward Looking Statements” and “Projections” in this investor pre sen tation for more information. 3. Based on Square Feet. 4. Fixed percent or actual increases, or country CPI - indexed increases. * Represents Moody’s Implied Rating. ** Represents Tenant Parent Rating. *** Represents Lease Guarantor Rating. GNL owns a large scale portfolio of 329 net lease assets diversified across five countries, 86 tenants and 36 industries as of 12/31/2015. Lease Expiration Schedule (% of SF Per Year) Weighted A verage Lease Term: 11.3 (3) years 6 Top Ten Tenants # of Properties 329 Total Square Feet (mm) 18.7 Number of Tenants 86 Number of Industries 36 Countries 5 Occupancy 100% Weighted Average Remaining Lease Term (3) 11.3 years % of NOI from Investment Grade Tenants (1)(2) 72.6% % of Portfolio NOI from Leases with Contractual Rent Increases (2)(4) 89% The Portfolio’s Top Ten Tenants Represent 35% of P ortfolio NOI 0% 0% 0% 0% 2% 2% 8% 10% 21% 57% Executive Summary Financial Highlights Portfolio Overview Investment Strategy Management Team Conclusion
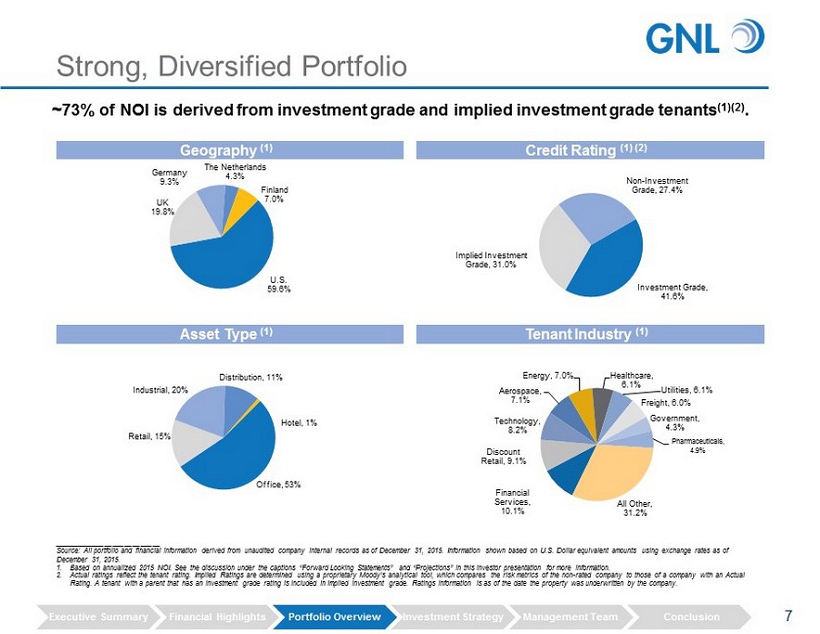
Strong, Diversified Portfolio ___________________________ Source: All portfolio and financial information derived from unaudited company internal records as of December 31, 2015. Information shown based on U.S. Dollar equivalent amounts using exchange rates as of December 31, 2015. 1. Based on annualized 2015 NOI. See the discussion under the captions “Forward Looking Statements” and “Projections” in this in ves tor presentation for more information. 2. Actual ratings reflect the tenant rating. Implied Ratings are determined using a proprietary Moody’s analytical tool, which compares the ris k m etrics of the non - rated company to those of a company with an Actual Rating. A tenant with a parent that has an investment grade rating is included in implied investment grade. Ratings informati on is as of the date the property was underwritten by the company. Investment Grade , 41.6% Implied Investment Grade , 31.0% Non - Investment Grade , 27.4% Credit Rating (1) (2) Tenant Industry (1) ~73% of NOI is derived from investment grade and implied investment grade tenants (1)(2) . 7 U.S. 59.6% UK 19.8% Germany 9.3% The Netherlands 4.3% Finland 7.0% Geography (1) Office , 53% Retail , 15% Industrial , 20% Distribution , 11% Hotel , 1% Asset Type (1) Executive Summary Financial Highlights Portfolio Overview Investment Strategy Management Team Conclusion Financial Services , 10.1% Discount Retail , 9.1% Technology , 8.2% Aerospace , 7.1% Energy , 7.0% Healthcare , 6.1% Utilities , 6.1% Freight , 6.0% Government , 4.3% Pharmaceuticals , 4.9% All Other , 31.2%

Significant Global Opportunity GNL is well - positioned to capitalize on incremental investment opportunities in the U.S. and Western Europe. Sovereign Debt Ratings (S&P) U.S. AA+ UK AAA Germany AAA Netherlands AA+ Finland AA+ Belgium AA France AA Ireland A+ Poland A Spain BBB+ Italy BBB - Portugal BB+ ___________________________ 1. Standard’s & Poor’s Rating Agency as of 12/31/2015. 2. CBRE for the year ending 12/31/2013. Focus on the U.S. and countries in Western Europe with strong debt ratings Owner - Occupied Real Estate (2) $6.9 Trillion Global Net Lease Opportunity $6.9 trillion of owner - occupied real estate in the U.S. and Europe creates large scale net lease opportunities for GNL. Target market opportunity in the U.S. and Europe is nearly 3x larger than the U.S. market alone. Scarcity of dedicated net lease investors in Europe creates less competitive acquisition environment and opportunity to acquire high - quality assets at attractive yields. Market Focus (1) U.S. 36% Europe 64% 8 $2.4tn $4.5tn No publicly traded pan European net lease REITs Over $100B of public Net Lease REITs focused on the U.S. Executive Summary Financial Highlights Portfolio Overview Investment Strategy Management Team Conclusion

Focused Investment Strategy Creates Value U.S ., UK , Germany, Finland , Belgium, Netherlands, Luxembourg and France Tenant Credit Quality Geography Real Estate / Market Fundamentals Asset Type Investment Strategy – Key Criteria Competitive advantage analysis Business model evaluation Tenant credit review Real Estate financial analysis Review & benchmark underlying asset level trading performance Key due diligence metrics – valuation, technical, insurance, legal, tax, accounting Disciplined Acquisition Process Total Net Lease Deals Evaluated (1) : ~ $19.7 billion Total Net Lease Acquisitions (1) : ~ $2.6 billion Total Net Lease LOIs Submitted (1) : ~$6.8 billion 9 Structure & Pricing Single tenant, net lease, income producing, commercial properties Corporate headquarters or other mission critical assets Long - term leases tied to inflation indices for annual increases Maximize differential between cap rates and cost of funding Well - defined investment strategy and rigorous underwriting process used to assemble high - quality, long duration, diversified, net lease property portfolio in the U.S. and Europe. 1. Figures represent Global Net Lease’s total evaluations. Executive Summary Financial Highlights Portfolio Overview Investment Strategy Management Team Conclusion
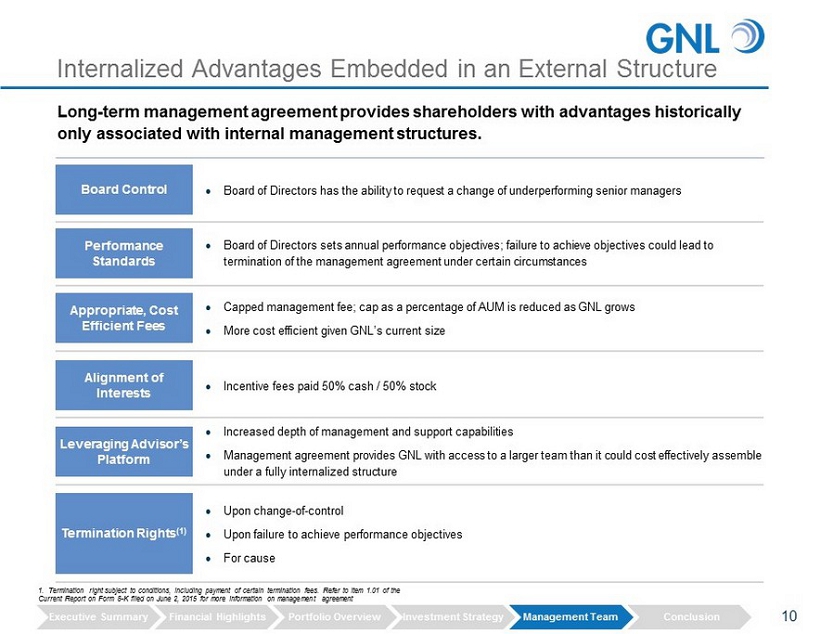
Internalized Advantages Embedded in an External Structure 10 Appropriate, Cost Efficient Fees Capped management fee; cap as a percentage of AUM is reduced as GNL grows More cost efficient given GNL’s current size Long - term management agreement provides shareholders with advantages historically only associated with internal management structures. Performance Standards Board Control Board of Directors has the ability to request a change of underperforming senior managers Board of Directors sets annual performance objectives; failure to achieve objectives could lead to termination of the management agreement under certain circumstances Termination Rights (1) Upon change - of - control Upon failure to achieve performance objectives For cause Alignment of Interests Incentive fees paid 50% cash / 50% stock Leveraging Advisor’s Platform Increased depth of management and support capabilities Management agreement provides GNL with access to a larger team than it could cost effectively assemble under a fully internalized structure Executive Summary Financial Highlights Portfolio Overview Investment Strategy Management Team Conclusion 1. Termination right subject to conditions, including payment of certain termination fees. Refer to item 1.01 of the Current Report on Form 8 - K filed on June 2, 2015 for more information on management agreement

Benefits of External Management 11 Performance Standards The new external management contract enhances performance - based compensation Performance Alignment Reduced Fees The new management contract is projected to create meaningful savings as compared to the previous advisory agreement for shareholders over the 20 - year term Eliminates acquisition and financing fees Management fees compare favorably to peer group Sliding cap of total and base management fees delivers economies and efficiencies of scale to the Company Provides immediate savings through lower fees to GNL shareholders Incentive fees structured to reward actual operational outperformance through the Company delivering increased value to shareholders The incentive fee hurdles grow 1.0% - 3.0% per annum, at the Boards discretion Termination under a Change of Control Schedule of fees lower than many externally managed peers Termination fees comparable to typical change of control costs Term Stability The duration of the contract allows the Advisor to invest in long - term, value - adding management infrastructure and compensation arrangements with its employees Board Control The Board of Directors has the right to request a change of underperforming senior managers Executive Summary Financial Highlights Portfolio Overview Investment Strategy Management Team Conclusion Established annually by the Board

Oversight Through Strong Governance 12 Executive Summary Financial Highlights Portfolio Overview Investment Strategy Management Team Conclusion The Board of Directors is comprised of a majority independent directors The Audit Committee and Conflict Committee are comprised solely of independent directors and provide additional oversight PwC is GNL’s external auditor, reporting directly to the Audit Committee Deloitte serves as the company’s internal auditors, reporting directly to the Audit Committee The company is supported by a dedicated financial accounting and reporting team, and maintains its own financial reporting processes, controls and procedures In - place allocation policy reduces asset allocation conflicts Focus on alignment of management and shareholder interests Corporate Governance
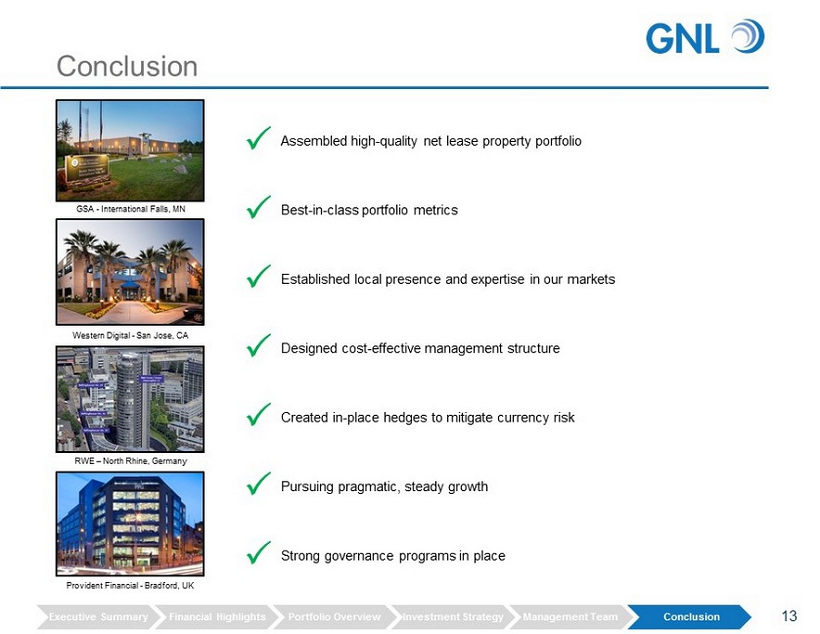
Assembled high - quality net lease property portfolio Best - in - class portfolio metrics Established local presence and expertise in our markets Designed cost - effective management structure Created in - place hedges to mitigate currency risk Pursuing pragmatic, steady growth Strong governance programs in place Conclusion RWE – North Rhine, Germany Western Digital - San Jose, CA GSA - International Falls, MN Provident Financial - Bradford, UK 13 Executive Summary Financial Highlights Portfolio Overview Investment Strategy Management Team Conclusion

The Platform

Shameel Kahn CEO Gary Wilder Executive Chairman Jagdeep Kapoor CIO Moor Park Investment Committee Germany United Kingdom Nordics Benelux France Michael Glaser Illias Harcha Javier paz Valibuena Lars Von der Berg Greg Smith Veronia Baldi Diego Voss Mike Pille Jamal Dutheil Rodolphe De Clermont - Tonnerre Brian Mansouri Vice President Kyle Gray Analyst Audrey Ellis Vice President Lucas O’Connor Analyst U.S. Team GNL Board of Directors Synergistic Value: Advisory Services Group Operations Investor Relations Accounting Legal Due Diligence IT Marketing Human Resources Financing Asset Management William Kahane Director Edward Rendell Independent Director Sue Perrotty Non - Exec. Chairman Independent Director GNL Management Team / Investment Committee Scott Bowman President & CEO Tim Salvemini CFO Broad, Multi - Disciplinary Acquisition Footprint Abby Wenzel Independent Director 15
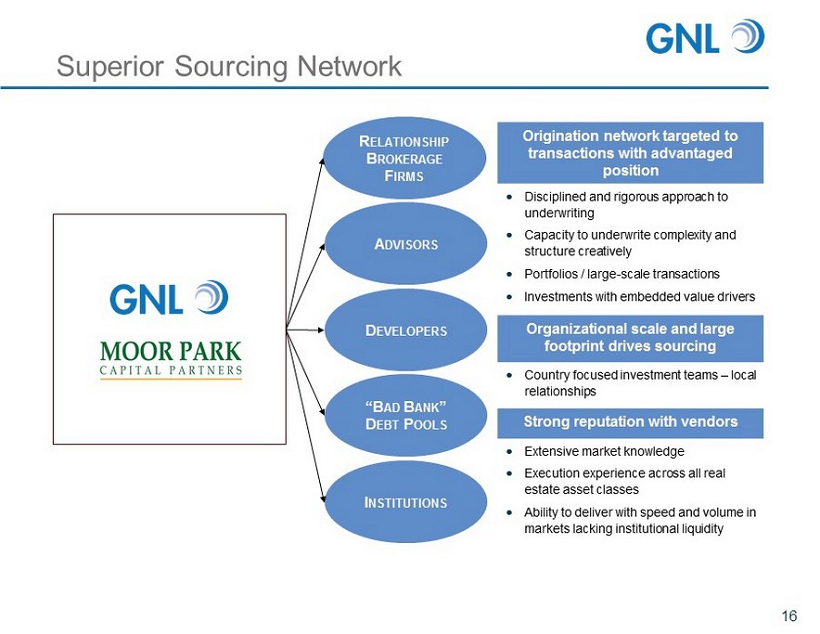
I NSTITUTIONS A DVISORS D EVELOPERS R ELATIONSHIP B ROKERAGE F IRMS “B AD B ANK ” D EBT P OOLS Origination network targeted to transactions with advantaged position Disciplined and rigorous approach to underwriting Capacity to underwrite complexity and structure creatively Portfolios / large - scale transactions Investments with embedded value drivers Organizational scale and large footprint drives sourcing Country focused investment teams – local relationships Strong reputation with vendors Extensive market knowledge Execution experience across all real estate asset classes Ability to deliver with speed and volume in markets lacking institutional liquidity Superior Sourcing Network 16

Vigorous Asset Management Creates Value 11 full - time asset management personnel in the U.S. and Europe Combined executive leadership with local practitioners to provide superior asset management expertise across the U.S. and Europe. 17 Checks Compliance / Negotiation Management Credit Tenant credit reviewed annually Building Systems HVAC, life safety, telephone, data, plumbing, electrical and mechanical systems are inspected bi - annually Building Structure Exterior walls, roof, elevator shafts, footings foundations, load - bearing walls, structural floors, columns and beams are inspected bi - annually Construction Improvement oversight, property expansion oversight (oversee work, negotiate TI allowance) Walkthroughs Perform an annual walkthrough of the property to evaluate condition and capital budgeting Service Agreements Property Managers are responsible for managing contracts with vendors Contracts are reviewed annually to ensure pricing is at market and service is satisfactory Mortgage Debt Ensure compliance with all mortgage documents including deferred maintenance, inspections and reporting Property Management Subs Provide consistent oversight on all property management companies hired. Ensure property management provided is compliant with policies and procedures

Legal Notices

Forward Looking Statements Certain statements made in this presentation are forward - looking statements . These forward - looking statements include statements regarding our intent, belief or current expectations and are based on various assumptions . These statements involve substantial risks and uncertainties . Actual results or events could differ materially from the plans, intentions and expectations disclosed in the forward - looking statements that we make . Forward - looking statements may include, but are not limited to, statements regarding stockholder liquidity and investment value and returns . The words "anticipates," "believes," "expects," "estimates," "projects," "plans," "intends," "may," "will," "would" and similar expressions are intended to identify forward - looking statements, although not all forward - looking statements contain these identifying words . Actual results may differ materially from those contemplated by the forward - looking statement . Further, forward - looking statements speak only as of the date they are made, and we undertake no obligation to update or reverse any forward - looking statement to reflect changed assumptions, the occurrence of unanticipated events on changes to future operating results, unless required to do so by law . Factors that might cause such differences include, but are not limited to : our ability to complete the listing of our shares of common stock on the New York Stock Exchange (“NYSE”) ; our ability to complete the tender offer ; the price at which our shares of common stock may trade on the NYSE, which may be higher or lower than the purchase price in the tender offer ; the number of shares acquired in the tender offer ; the cost of any indebtedness incurred to fund this offer ; the impact of current and future regulation ; the effects of competition ; the ability of our advisor to attract, develop and retain executives and other qualified employees ; changes in general economic or market conditions ; and other factors, many of which are beyond our control . 19

Risk Factors Our executive officers, our Advisor and its affiliates face conflicts of interest, including significant conflicts created by our Advisor's compensation arrangements with us and other investment programs advised by American Realty Capital affiliates and conflicts in allocating tim e among these investment programs and us. We may be unable to pay or maintain cash distributions or increase distributions over time. We depend on tenants for our rental revenue and, accordingly, our rental revenue is dependent upon the success and economic viab ili ty of our tenants. Increases in interest rates could increase the amount of our debt payments and limit our ability to pay distributions to our stockholde rs. Distributions may reduce the amount of capital we ultimately invest in properties We are subject to risks associated with our international investments, including risks associated with compliance with and chang es in foreign laws, fluctuations in foreign currency exchange rates and inflation. We are subject to risks associated with any dislocations or liquidity disruptions that may exist or occur in the credit markets of the United States of America and Europe from time to time. We may fail to continue to qualify to be treated as a real estate investment trust ("REIT") for U.S. federal income tax purposes, which would result in higher taxes, may adversely affect operations and we may be unable to raise additional equity or debt financing on attractive terms or at all. We may be exposed to risks due to a lack of tenant diversity, investment types and geographic diversity. We may be exposed to changes in general economic, business and political conditions, including the possibility of intensified in ter national hostilities, acts of terrorism, and changes in conditions of United States or international lending, capital and financing markets. Risks associated with our international investments, including risks associated with compliance with and changes in foreign laws, f luc tuations in foreign currency exchange rates and inflation . The following are some of the risks and uncertainties, although not all risks and uncertainties, that could cause our actual res ults to differ materially from those presented in our forward - looking statements: 20

Projections This presentation includes estimated projections of future operating results . These projections were not prepared in accordance with published guidelines of the SEC or the guidelines established by the American Institute of Certified Public Accountants for preparation and presentation of financial projections . This information is not fact and should not be relied upon as being necessarily indicative of future results ; the projections were prepared in good faith by management and are based on numerous assumptions that may prove to be wrong . Important factors that may affect actual results and cause the projections to not be achieved include, but are not limited to, risks and uncertainties relating to the company and other factors described in the “Risk Factors” section of the Company’s Annual Report on Form 10 - K filed with the SEC on April 3 , 2015 , the Quarterly Reports on Form 10 - Q filed for the quarters ended March 31 , 2015 , June 30 , 2015 and November 30 , 2015 , filed on May 18 , 2015 , August 10 , 2015 and November 10 , 2015 and in future filings with the SEC . ” The projections also reflect assumptions as to certain business decisions that are subject to change . As a result, actual results may differ materially from those contained in the estimates . Accordingly, there can be no assurance that the estimates will be realized . This presentation also contains estimates and information concerning our industry, including market position, market size, and growth rates of the markets in which we participate, that are based on industry publications and reports . This information involves a number of assumptions and limitations, and you are cautioned not to give undue weight to these estimates . We have not independently verified the accuracy or completeness of the data contained in these industry publications and reports . The industry in which we operate is subject to a high degree of uncertainty and risk due to variety of factors, including those described in the “ Risk Factors” section of the Company’s Annual Report on Form 10 - K filed with the SEC on April 3 , 2015 , the Quarterly Reports on Form 10 - Q filed for the quarters ended March 31 , 2015 , June 30 , 2015 and November 30 , 2015 , filed on May 18 , 2015 , August 10 , 2015 and November 10 , 2015 and in future filings with the SEC . These and other factors could cause results to differ materially from those expressed in these publications and reports . 21
Definitions 22 Funds from operations (“FFO”) Due to certain unique operating characteristics of real estate companies, as discussed below, the National Association of Real Estate Investment Trusts ("NAREIT"), an industry trade group, has promulgated a measure known as funds from operations ("FFO"), which we believe to be an appropriate supplemental measure to reflect the operating performance of a REIT . The use of FFO is recommended by the REIT industry as a supplemental performance measure . FFO is not equivalent to net income or loss as determined under accounting principles generally accepted in the United States ("GAAP ") . We define FFO, a non - GAAP measure, consistent with the standards established by the White Paper on FFO approved by the Board of Governors of NAREIT, as revised in February 2004 (the "White Paper") . The White Paper defines FFO as net income or loss computed in accordance with GAAP, excluding gains or losses from sales of property but including asset impairment writedowns, plus depreciation and amortization, and after adjustments for unconsolidated partnerships and joint ventures . Adjustments for unconsolidated partnerships and joint ventures are calculated to reflect FFO . Our FFO calculation complies with NAREIT's definition . The historical accounting convention used for real estate assets requires straight - line depreciation of buildings and improvements, and straight - line amortization of intangibles, which implies that the value of a real estate asset diminishes predictably over time, especially if not adequately maintained or repaired and renovated as required by relevant circumstances or as requested or required by lessees for operational purposes in order to maintain the value disclosed . We believe that, because real estate values historically rise and fall with market conditions, including inflation, interest rates, the business cycle, unemployment and consumer spending, presentations of operating results for a REIT using historical accounting for depreciation and certain other items may be less informative . Historical accounting for real estate involves the use of GAAP . Any other method of accounting for real estate such as the fair value method cannot be construed to be any more accurate or relevant than the comparable methodologies of real estate valuation found in GAAP . Nevertheless, we believe that the use of FFO, which excludes the impact of real estate related depreciation and amortization, among other things, provides a more complete understanding of our performance to investors and to management, and when compared year over year, reflects the impact on our operations from trends in occupancy rates, rental rates, operating costs, general and administrative expenses, and interest costs, which may not be immediately apparent from net income . However, FFO, core funds from operations ("Core FFO") and adjusted funds from operations (“AFFO”), as described below, should not be construed to be more relevant or accurate than the current GAAP methodology in calculating net income or in its applicability in evaluating our operating performance . The method utilized to evaluate the value and performance of real estate under GAAP should be construed as a more relevant measure of operational performance and considered more prominently than the non - GAAP FFO, Core FFO and AFFO measures and the adjustments to GAAP in calculating FFO, Core FFO and AFFO . Other REITs may not define FFO in accordance with the current NAREIT definition (as we do) or may interpret the current NAREIT definition differently than we do and/or calculate Core FFO and/or AFFO differently than we do . Consequently, our presentation of FFO, Core FFO and AFFO may not be comparable to other similarly titled measures presented by other REITs .

Definitions (cont’d) 23 Funds from operations (“FFO”) (Cont’d) We consider FFO, Core FFO and AFFO useful indicators of our performance . Because FFO calculations exclude such factors as depreciation and amortization of real estate assets and gains or losses from sales of operating real estate assets (which can vary among owners of identical assets in similar conditions based on historical cost accounting and useful - life estimates), FFO facilitates comparisons of operating performance between periods and between other REITs in our peer group . Changes in the accounting and reporting promulgations under GAAP (for acquisition fees and expenses from a capitalization/depreciation model to an expensed - as - incurred model) that were put into effect in 2009 and other changes to GAAP accounting for real estate subsequent to the establishment of NAREIT's definition of FFO have prompted an increase in cash - settled expenses, specifically acquisition fees and expenses for all industries as items that are expensed under GAAP, that are typically accounted for as operating expenses . Core adjusted funds from operations (“Core AFFO”) Core FFO is FFO, excluding acquisition and transaction related costs as well as certain other costs that are considered to be non - core, such as charges relating to the Listing Note and listing related fees . The purchase of properties, and the corresponding expenses associated with that process, is a key operational feature of our business plan to generate operational income and cash flows in order to make dividend payments to stockholders . In evaluating investments in real estate, we differentiate the costs to acquire the investment from the operations derived from the investment . By excluding expensed acquisition and transaction related costs as well as non - core costs, we believe Core FFO provides useful supplemental information that is comparable for each type of real estate investment and is consistent with management's analysis of the investing and operating performance of our properties .
Definitions (cont’d) Adjusted funds from operations (“AFFO”) We exclude certain income or expense items from AFFO that we consider more reflective of investing activities, other non - cash income and expense items and the income and expense effects of other activities that are not a fundamental attribute of our business plan . These items include unrealized gains and losses, which may not ultimately be realized, such as gains or losses on contingent valuation rights, gains and losses on investments and early extinguishment of debt . We also exclude dividends on Class B Units as the related shares are assumed to have converted to common stock in our calculation of fully diluted weighted average shares of common stock . In addition, by excluding non - cash income and expense items such as amortization of above - market and below - market leases intangibles, amortization of deferred financing costs, straight - line rent and equity - based compensation from AFFO, we believe we provide useful information regarding income and expense items which have no cash impact and do not provide liquidity to the company or require capital resources of the company . By providing AFFO, we believe we are presenting useful information that assists investors and analysts to better assess the sustainability of our ongoing operating performance without the impacts of transactions that are not related to the ongoing profitability of our portfolio of properties . We also believe that AFFO is a recognized measure of sustainable operating performance by the REIT industry . Further, we believe AFFO is useful in comparing the sustainability of our operating performance with the sustainability of the operating performance of other real estate companies that are not making a significant number of acquisitions . Investors are cautioned that AFFO should only be used to assess the sustainability of our operating performance excluding these activities, as it excludes certain costs that have a negative effect on our operating performance during the periods in which these costs are incurred . In calculating AFFO, we exclude certain expenses, which under GAAP are characterized as operating expenses in determining operating net income . These expenses are paid in cash by us, and therefore such funds will not be available to distribute to investors . All paid and accrued merger, acquisition and transaction related fees and certain other expenses negatively impact our operating performance during the period in which expenses are incurred or properties are acquired will also have negative effects on returns to investors, the ability to fund dividends or distributions in the future, and cash flows generated by us, unless earnings from operations or net sales proceeds from the disposition of other properties are generated to cover the purchase price of the property and certain other expenses . AFFO that excludes such costs and expenses would only be comparable to companies that did not have such activities . Further, under GAAP, certain contemplated non - cash fair value and other non - cash adjustments are considered operating non - cash adjustments to net income in determining cash flow from operating activities . In addition, we view fair value adjustments as items which are unrealized and may not ultimately be realized . We view both gains and losses from fair value adjustments as items which are not reflective of ongoing operations and are therefore typically adjusted for when assessing operating performance . Excluding income and expense items detailed above from our calculation of AFFO provides information consistent with management's analysis of the operating performance of the properties . Additionally, fair value adjustments, which are based on the impact of current market fluctuations and underlying assessments of general market conditions, but can also result from operational factors such as rental and occupancy rates, may not be directly related or attributable to our current operating performance . By excluding such changes that may reflect anticipated and unrealized gains or losses, we believe AFFO provides useful supplemental information . 24

Definitions (cont’d) 25 Adjusted Earnings before Interest, Taxes, Depreciation and Amortization, Net Operating Income, Cash Net Operating Income and Adjusted Cash Net Operating Income . We believe that earnings before interest, taxes, depreciation and amortization adjusted for acquisition and transaction - related expenses, other non - cash items and including our pro - rata share from unconsolidated joint ventures ("Adjusted EBITDA") is an appropriate measure of our ability to incur and service debt . Adjusted EBITDA should not be considered as an alternative to cash flows from operating activities, as a measure of our liquidity or as an alternative to net income as an indicator of our operating activities . Other REITs may calculate Adjusted EBITDA differently and our calculation should not be compared to that of other REITs . Net operating income ("NOI") is a non - GAAP financial measure equal to net income (loss), the most directly comparable GAAP financial measure, less discontinued operations, interest, other income and income from preferred equity investments and investment securities, plus corporate general and administrative expense, acquisition and transaction - related expenses, depreciation and amortization, other non - cash expenses and interest expense . NOI is adjusted to include our pro rata share of NOI from unconsolidated joint ventures . We use NOI internally as a performance measure and believe NOI provides useful information to investors regarding our financial condition and results of operations because it reflects only those income and expense items that are incurred at the property level . Therefore, we believe NOI is a useful measure for evaluating the operating performance of our real estate assets and to make decisions about resource allocations . Further, we believe NOI is useful to investors as a performance measure because, when compared across periods, NOI reflects the impact on operations from trends in occupancy rates, rental rates, operating costs and acquisition activity on an unlevered basis, providing perspective not immediately apparent from net income . NOI excludes certain components from net income in order to provide results that are more closely related to a property's results of operations . For example, interest expense is not necessarily linked to the operating performance of a real estate asset and is often incurred at the corporate level as opposed to the property level . In addition, depreciation and amortization, because of historical cost accounting and useful life estimates, may distort operating performance at the property level . NOI presented by us may not be comparable to NOI reported by other REITs that define NOI differently . We believe that in order to facilitate a clear understanding of our operating results, NOI should be examined in conjunction with net income (loss) as presented in our consolidated financial statements . NOI should not be considered as an alternative to net income (loss) as an indication of our performance or to cash flows as a measure of our liquidity . Cash NOI is NOI presented on a cash basis, which is NOI after eliminating the effects of straight - lining of rent and the amortization of above and below market leases .