Attached files
| file | filename |
|---|---|
| EX-23.1 - EXHIBIT 23.1 - Care.com Inc | a2015q4exhibit231.htm |
| EX-21.1 - EXHIBIT 21.1 - Care.com Inc | a2015q4exhibit211.htm |
| EX-31.1 - EXHIBIT 31.1 - Care.com Inc | a2015q4exhibit311.htm |
| EX-32.1 - EXHIBIT 32.1 - Care.com Inc | a2015q4exhibit321.htm |
| EX-31.2 - EXHIBIT 31.2 - Care.com Inc | a2015q4exhibit312.htm |
UNITED STATES
SECURITIES AND EXCHANGE COMMISSION
Washington, D.C. 20549
Form 10-K |
[x] | ANNUAL REPORT PURSUANT TO SECTION 13 OR 15(d) OF THE SECURITIES EXCHANGE ACT OF 1934 |
For the fiscal year ended December 26, 2015
OR
[ ] | TRANSITION REPORT PURSUANT TO SECTION 13 OR 15(d) OF THE SECURITIES EXCHANGE ACT OF 1934 |
For the transition period from _______ to _______
Commission File Number: 000-24821
Care.com, Inc. | ||
(Exact name of registrant as specified in its charter) | ||
Delaware | 20-578-5879 |
(State or other jurisdiction of incorporation or organization) | (I.R.S. Employer Identification Number) |
77 Fourth Avenue, Fifth Floor Waltham, MA | 02451 |
(Address of principal executive offices) | (Zip Code) |
(781) 642-5900
(Registrant’s telephone number, including area code)
Securities registered pursuant to Section 12(b) of the Act:
Title of each class | Name of exchange on which registered | |
Common Stock, par value $0.001 | The New York Stock Exchange | |
Securities registered pursuant to Section 12(g) of the Act: | ||
None | ||
Indicate by check mark if the registrant is a well-known seasoned issuer, as defined in Rule 405 of the Securities Act. Yes [ ] No [x]
Indicate by check mark if the registrant is not required to file reports pursuant to Section 13 or Section 15(d) of the Act. Yes [ ] No [x]
Indicate by check mark whether the Registrant (1) has filed all reports required to be filed by Section 13 or 15(d) of the Securities Act of 1934 during the preceding 12 months (or for such shorter period that the registrant was required to file such reports), and (2) has been subject to such filing requirements for the past 90 days. Yes [x] No [ ]
Indicate by check mark whether the Registrant has submitted electronically and posted on its corporate Web site, if any, every Interactive Data File required to be submitted and posted pursuant to Rule 405 of Regulation S-T (§232.405 of this chapter) during the preceding 12 months (or for such shorter period that the registrant was required to submit and post such files). Yes [x ] No [ ]
Indicate by check mark if disclosure of delinquent filers pursuant to Item 405 of Regulation S-K is not contained herein, and will not be contained to the best of registrant’s knowledge, in definitive proxy or information statements incorporated by reference in Part III of this Form 10-K or any amendment to this Form 10-K. [ ]
Indicate by check mark whether the registrant is a large accelerated filer, an accelerated filer, a non-accelerated filer, or a smaller reporting company. See the definitions of “large accelerated filer,” “accelerated filer” and “smaller reporting company” in Rule 12b-2 of the Exchange Act.
Large accelerated filer | [ ] | Accelerated filer | [ ] | |
Non-accelerated filer | [x] | (Do not check if a smaller reporting company) | Smaller reporting company | [ ] |
Indicate by check mark whether the registrant is a shell company (as defined in Rule 12b-2 of the Exchange Act). Yes [ ] No [x]
As of February 26, 2016, there were 32,449,235 shares of the registrant's common stock, $0.001 par value, outstanding.
Portions of the Registrant’s proxy statement for its 2016 Annual Meeting of Stockholders are incorporated by reference into Part III herein. Such proxy statement will be filed with the Securities and Exchange Commission no later than 120 days after the end of the Registrant’s fiscal year ended December 26, 2015. | ||
CARE.COM, INC.
FORM 10-K
TABLE OF CONTENTS
PART I | Page | |
Item 1. | Business | |
Item 1A. | Risk Factors | |
Item 1B. | Unresolved Staff Comments | |
Item 2. | Properties | |
Item 3. | Legal Proceedings | |
Item 4. | Mine Safety Disclosures | |
PART II | ||
Item 5. | Market for Registrant’s Common Equity, Related Stockholder Matters and Issuer Purchases of Equity Securities | |
Item 6. | Selected Financial Data | |
Item 7. | Management’s Discussion and Analysis of Financial Condition and Results of Operations | |
Item 7A. | Quantitative and Qualitative Disclosures About Market Risk | |
Item 8. | Financial Statements and Supplementary Data | |
Consolidated Balance Sheets as of December 26, 2015 and December 27, 2014 | ||
Consolidated Statements of Operations for the years ended December 26, 2015, December 27, 2014, and December 28, 2013 | ||
Consolidated Statements of Comprehensive Loss for the years ended December 26, 2015, December 27, 2014, and December 28, 2013 | ||
Consolidated Statements of Stockholders’ (Deficit) Equity for the years ended December 26, 2015, December 27, 2014, and December 28, 2013 | ||
Consolidated Statements of Cash Flows for the years ended December 26, 2015, December 27, 2014, and December 28, 2013 | ||
Notes to Consolidated Financial Statements | ||
Item 9. | Changes in and Disagreements with Accountants on Accounting and Financial Disclosure | |
Item 9A. | Controls and Procedures | |
Item 9B. | Other Information | |
PART III | ||
Item 10. | Directors, Executive Officers and Corporate Governance | |
Item 11. | Executive Compensation | |
Item 12. | Security Ownership of Certain Beneficial Owners and Management and Related Stockholder Matters | |
Item 13. | Certain Relationships and Related Transactions and Director Independence | |
Item 14. | Principal Accounting Fees and Services | |
PART IV | ||
Item 15. | Exhibits, Financial Statement Schedules | |
PART I
ITEM 1. BUSINESS
This summary highlights information contained elsewhere in this Annual Report on Form 10-K and does not contain all of the information you should consider in making your investment decision. Before deciding to invest in shares of our common stock, you should read this summary together with the more detailed information, including our consolidated financial statements and the related notes, included in Item 8 of this Annual Report on Form 10-K. You should carefully consider, among other things, the matters discussed in "Risk Factors," our consolidated financial statements and related notes, and "Management's Discussion and Analysis of Financial Condition and Results of Operations," in each case included in Item 1A of this Annual Report on Form 10-K.
Our Mission
Our mission is to improve the lives of families and caregivers by helping them connect in a reliable and easy way. Our solutions help families make informed decisions in one of the most important and highly considered aspects of their family life-finding and managing quality care for their family: their children, parents, pets and other loved ones. In providing families a comprehensive marketplace for care, we are building the largest destination for quality caregivers to find fulfilling employment and career opportunities globally. We strive to help our family and caregiver members pursue their passions and fulfill the basic human need of caring for each other.
Our Company
We are the world’s largest online marketplace for finding and managing family care. As of the date of the filing of this Annual Report on Form 10-K, we had 18.4 million members, including 10.3 million families and 8.1 million caregivers, spanning 16 countries. We help families address their particular lifecycle of care needs, which includes child care, senior care, special needs care and other non-medical family care needs such as pet care, tutoring and housekeeping. In the process, we also help caregivers find rewarding full-time and part-time employment opportunities. In 2015, 59% of all job postings were for part-time care services, with the remaining 41% seeking full-time care. Examples of the various types of care services families find in our marketplace, depending on their diverse and evolving needs, include:
•An experienced nanny to care for a new-born child and help with laundry;
•A daycare professional seeking to earn additional income by babysitting on occasional ‘‘date nights’’;
• | A college student helping to pay tuition by watching a 7 and 10-year old and assisting with after-school pick-ups, driving to activities, homework and meal preparation; |
• | A retired nurse to drive an aging parent to routine medical appointments and assist with personal hygiene; and |
• | A pet lover to take the family dog for her daily walk and care for her during family vacations. |
We believe the scale and breadth of our services, combined with our commitment to delivering the best possible member experience for families and caregivers, have made us the most trusted and leading brand for finding and managing family care.
Our consumer matching solutions allow families to search for, qualify, vet, connect with and ultimately select caregivers in a low-cost, reliable and easy way. We also provide caregivers with solutions to create personal profiles, describe their unique skills and experience, and otherwise differentiate and market themselves in a highly fragmented marketplace.
In addition to our consumer matching solutions, we offer our members innovative products and services to facilitate their interaction with caregivers. We provide solutions intended to improve both the ease and reliability of the care relationship in the home. One product area we are particularly focused on is our consumer payments solutions. Through Care.com HomePay, families can subscribe to payroll and tax preparation services for domestic employees. This offering deepens our relationship with our members and enhances the lifetime value associated with our members.
We also serve employers by providing access to certain of our products and services to employer-sponsored families. In addition, we serve care-related businesses—such as day care centers, nanny agencies and home care agencies—who wish to market their services to our care-seeking families and recruit our caregiver members. These businesses improve our member experience by providing additional caregiving choices for families and employment opportunities for caregivers.
Our primary target market is women, who typically take the responsibility of making care decisions for their families-either as mothers or adult daughters-and are a majority of our caregivers. Women represent 94% of our caregivers and 82% of our care-seeking members. As a result of the shared characteristics of both sides of our marketplace, we are able to leverage our marketing investments targeted at families to also attract caregivers.
We have experienced steady growth in revenue and members. Our members increased to 18.4 million as of December 26, 2015 from 13.8 million as of December 27, 2014, representing a 33% annual growth rate. Our revenue has increased to $138.7
2
million in fiscal 2015 from $110.7 million in fiscal 2014, representing a 25% annual growth rate, primarily driven by our consumer matching solutions and consumer payment solutions, which we refer to as our U.S. Consumer Business. We experienced net losses from continuing operations of $17.9 million and $37.6 million in fiscal 2015 and fiscal 2014, respectively. Net losses from discontinued operations were $17.1 million and $42.7 million in fiscal 2015 and fiscal 2014, respectively. Adjusted EBITDA, a non-GAAP financial measure that we define as net loss from continuing operations, plus: federal, state and franchise taxes, other expense, net, depreciation and amortization, stock-based compensation, accretion of contingent consideration, merger and acquisition related costs and other unusual or non-cash significant adjustments decreased to a loss of $5.0 million from a loss of $21.1 million as of December 26, 2015 and December 27, 2014, respectively. See “Item 7, Management’s Discussion and Analysis of Financial Condition and Results of Operations - Other Financial and Operational Data” for a reconciliation of net loss to Adjusted EBITDA, a discussion of management’s use of this non-GAAP measure and the limitations of its use.
Our Market Opportunity
The market for care is large and highly fragmented. According to IBIS research, in 2014, an aggregate of $280 billion was spent in the United States on care, including day care, in-home care providers, housekeepers, nursing care facilities, tutoring and pet care. We believe that our target market includes all households with income greater than $50,000 and 15% of households with income less than $50,000, in each case with either a child under the age of 18 or a senior over the age of 65. According to the U.S. Census Bureau, there were 44 million such households in the United States in 2015. The needs of families seeking care are diverse, taking many different forms depending on the circumstances and life stage of the family. These needs include childcare, such as nannies and babysitters, in-home senior care, such as assistance with personal hygiene, meal preparation and transportation, and other family care needs, such as pet care, tutoring and housekeeping.
We believe that the following key trends contribute to the large and growing total addressable market for online care marketplaces:
• | Significant percentage of dual-income and single-parent households with children; |
•Aging population with a high preference for in-home care;
•The growth in employer sponsored care services; and
• | Consumers increasingly using the internet and mobile devices for important and highly personal decisions and transactions. |
Despite the size and growth of the care market, there has historically been no proven, efficient and cost-effective way for families to connect with quality caregivers and for caregivers or care-related businesses to target a large number of families.
Our Solutions
Our platform features a portfolio of family care-related products and services for our members, including consumer matching services and consumer payments services. This breadth of offerings enables us to provide synergistic care-related solutions to our members, which we believe results in greater frequency of member engagement and higher lifetime value.
Our platform also enables caregivers to find jobs and manage their careers, employers to offer their employees valuable family care-related benefits that promote increased productivity, loyalty and reduced family care-related absences, and businesses to recruit employees and advertise their business profiles.
Efficient, Reliable and Affordable Way for Families and Caregivers to Connect and Manage Their Care and Career Needs
Our comprehensive and differentiated platform provides significant benefits to families seeking caregivers and caregivers seeking quality jobs, including:
• | Comprehensive solutions. We are the largest online marketplace for finding and managing family care. Through our platform, families have access to a broad range of solutions to address their diverse and evolving care needs, including childcare, tutoring, senior care options and housekeeping. In addition, families can use our solutions for back-up care when primary care arrangements fall through. Similarly, caregivers can apply to jobs in any category of care posted by families or by care-related businesses. |
• | Efficient and reliable way for families to find quality caregivers. Our members have access to easy-to-use job posting tools, powerful search features and detailed caregiver profiles that are designed to allow them to efficiently navigate our vast database of individual caregivers and assess which caregivers best suit their needs. We also provide families with a comprehensive suite of tools and resources to help them make more informed decisions throughout the search and hiring process, including reviews, references, social connections, rate calculators, articles, an online safety center and access to a range of background checking services. |
• | Efficient way for caregivers to target large, qualified audiences and professionalize their careers. Caregivers can easily create detailed profiles that include work history, education, credentials, references, social connections, third-party |
3
background check results and information about the specific care services they provide. In addition, we provide caregivers with services, educational resources and content to professionalize and manage their careers, as well as the opportunity to establish their professional reputation and enhance their profile through the reviews and ratings they receive from families.
• | Cost-effective alternative. Families are provided access to search, post a job and preview detailed caregiver profiles. After an initial review of profiles, families have the option of selecting from a variety of affordable subscription plans to contact caregivers and access background checks. These subscriptions allow families to contact caregivers through our platform during the term of the subscription, including nannies, babysitters, pet sitters and tutors. Our caregiver members can apply to jobs through our platform and target families and care-related businesses at no cost. Caregivers have the option to pay for additional features such as priority notification of newly posted jobs. We are exploring additional pricing and packaging offerings for families and caregivers that are designed to better meet the needs of the various segments that use Care.com and further monetize our services. |
• | Secure access anytime, anywhere. We provide a cross-platform suite of communication tools to enable easy and efficient communication between families and caregivers. These easy-to-use tools are built around a monitored messaging system that members access through the Care.com website and mobile apps. Families may communicate with caregivers individually or send a broadcast message to a list of ‘‘favorite’’ caregivers. When members receive new messages they can be notified by email, SMS text messages and alert notifications on their mobile devices. For greater security, members can respond to email notifications through our monitored messaging system without exposing their email address to other members. Our services are available across multiple platforms and mobile devices to ensure that our members access Care.com easily and conveniently wherever they go. We provide our services through mobile apps on iOS and Android devices. We also make our website experience available on personal computers and mobile web browsers. Across these platforms, members are able to access our features for finding care and jobs and for paying caregivers. |
Easy-to-Use Payment Offerings
We provide Care.com HomePay, a suite of payroll and tax services for families that employ household workers. Unlike most other payroll and tax companies, Care.com HomePay caters only to households, whose needs are typically very different than those of businesses. As a result, our entire service is designed to meet the unique needs of family employers and has natural synergies with our consumer matching services. Care.com HomePay is not only designed to facilitate the management of a family’s financial relationship with a caregiver, but also to enable a caregiver to establish the compliance framework to qualify for important household employee benefits. We also provide a convenience payments service that enables families to make electronic payments to caregivers from a computer or mobile device.
Comprehensive Care Solution for Employers
We provide a comprehensive suite of care services for employers to offer to their employees, including our consumer matching solutions, payment offerings, back-up care services and care concierge services. In addition to helping employees better manage the balance between work and home life, these services are designed to benefit employers by promoting increased productivity, engagement, loyalty and reduced care-related absences.
Efficient Marketing and Recruiting Channel for Care-Related Businesses
We provide a highly targeted suite of marketing and recruiting solutions for care-related businesses. These solutions enable care-related businesses to advertise their business profiles to millions of families seeking care and to post care jobs and search our database of caregivers seeking employment.
Our Competitive Strengths
We believe the following strengths differentiate us from our competitors and contribute to our success:
Largest Global Marketplace Focused on Care
We are the world’s largest online marketplace for finding and managing family care with 18.4 million members, including 10.3 million families and 8.1 million caregivers, spanning 16 countries. Since the launch of our marketplace in 2007, we estimate, based on internal member surveys, that over one million families have found caregivers and over one million caregivers have found care jobs through our service in the areas of childcare, senior care, special needs care, tutoring, pet care and housekeeping.
High Quality Match Rate
Based on our high match rate of paying families with caregivers, we believe our breadth of selection and our matching algorithms enhance the effectiveness of our marketplace and the value we offer to both families and caregivers. In the United
4
States, our member surveys indicate that approximately four out of five families that subscribe to our consumer matching solutions successfully find a caregiver. Furthermore, our surveys indicate that families who hire caregivers using our consumer matching solutions have a high degree of satisfaction with the caregivers they find.
Powerful Network Effects
We benefit from significant network effects as the market leader in the highly fragmented and growing market for finding family care online. As more families use our services, we attract more caregivers seeking a large pool of families in need of caregiver services. Similarly, the increasing number of caregivers using our services has attracted more families. This cycle has driven more and more people to use our services and has resulted in a significant percentage of our new members coming from unpaid sources.
Growing and Engaged Membership
Over the last seven years, we have expanded from 500,000 members to 18.4 million members. As we grow our membership, improve the member experience and offer additional products and features, more members are using our services for longer periods of time and coming back sooner after their initial use. This highly engaged membership helps improve the effectiveness of our services and increases the lifetime value of our members.
Our Platform
Our platform features a portfolio of family care-related products and services for our members, including consumer matching services and consumer payments services. This breadth of offerings enables us to provide synergistic care-related solutions to our members, which we believe results in greater frequency of member engagement and higher lifetime value.
Our platform also enables caregivers to find jobs and manage their careers, businesses to recruit employees and advertise their business profiles, and employers to offer their employees valuable family care-related benefits that promote increased productivity, loyalty and reduced family care-related absences.
Trusted and Recognized Brand
We have invested in building a differentiated member experience for finding and managing care. This investment includes the ongoing prioritization of features and processes that we believe contribute to the quality of our marketplace. Examples of these investments include the manual review of all job and profile postings for suspicious or inappropriate content, tools for members to review and report other members, a monitored messaging system that allows members to communicate without sharing their personal email, the proactive screening of certain member information against various databases and other sources for criminal or other inappropriate activity, the use of technology to help identify and prevent inappropriate activity through our platform and a safety center that provides resources and information designed to help families and caregivers make more informed hiring and job selection decisions
We believe these product investments, combined with our investments in national brand advertising and our domain name itself, have established the Care.com brand as a leading and trusted brand for finding care.
Our Growth Strategy
Attract More Members to Our Platform
In order to grow our membership, we intend to increase the visibility of our services, platform and brand awareness among families and caregivers through our investments in various marketing channels, such as television, online advertising, direct marketing and community groups and forums. These investments also include initiatives such as search engine optimization and content development, which are designed to increase the visibility of our services in organic search result listings. In addition to direct marketing channels, we are also investing in efficient channel relationships for membership growth.
Increase Revenue
As we improve our user experience and expand our product and service offerings, we have seen an increase in revenue from our member base. We intend to further increase revenue from our member base by introducing new products and pricing packages, as well as by optimizing the monetization of our services on mobile devices. We also expect to increase the cross-selling of our existing products, such as Care.com HomePay, within our membership base and via the employer channel. In addition, we intend to continue to engage our non-paying members with content and resources by further developing our online community, so that they stay involved even when they are not actively looking for care and we remain top of mind when they are. We believe increasing engagement among our members will drive higher conversion of members to paying members, and longer average length of paid time.
Expand and Increase Adoption of Our Payment and Care@Work Offerings
5
We believe there is significant opportunity for us to grow our consumer payments solutions. Since our acquisition of Breedlove & Associates, L.L.C., or Breedlove (now re-branded as Care.com HomePay), in 2012, an increasing number of Care.com members are using our household employer payroll and tax product. We expect this trend to continue by, among other things, further integrating our consumer matching and payment solutions.
We also believe there is significant opportunity for us to continue to grow our Care@Work offering (previously called Workplace Solutions). We intend to do this by continuing to promote a comprehensive suite of services to the growing number of employers who are providing family care-related benefits to their employees.
Grow Our International Business
We believe the global secular trends of an increasing number of dual-income households with children, and an aging population, provide significant growth opportunities outside the United States. The majority of our international business today occurs in Western Europe, the market served by our Berlin-based subsidiary Care.com Europe GmbH (formerly Besser Betreut GmbH or Betreut) or Care.com Europe. We are currently operating in 16 countries and in seven languages. We intend to grow our international business by leveraging our learnings from our U.S. consumer matching solutions, such as investing in organic marketing and other efficient marketing channels, and by improving monetization through the introduction of new pricing and packaging options.
Selectively Pursue Acquisitions and Strategic Relationships
We will continue to explore opportunities to acquire companies that complement our existing business, enhance the user experience of our services, represent a strong cultural fit and are consistent with our overall growth strategy. In addition, we may enter into various strategic relationships to provide a more comprehensive offering to our members.
Our Products and Services
Our consumer products and services are designed to make it easier for families to find and manage quality caregivers and for caregivers to find satisfying jobs and manage their careers. We also offer products and services that allow families to share experiences and request advice. Additionally, we offer services to employers and care-related businesses that are designed to benefit those organizations as well as our family and caregiver members.
U.S. Consumer Business
Consumer Matching Solutions
Matching the right caregiver with the right family can create tremendous value for our members. Our innovative consumer matching solutions and large member base facilitate quality matches for the diverse and evolving needs of our members. Some of the features and tools we offer to families and caregivers are offered at no cost, others are bundled into one or more subscription packages. In addition, some features and tools are offered on an à la carte basis. Most of our tools and features are accessible on both mobile devices and personal computers.
Tools and Features for Families
• | Job Posting. Families quickly and easily post a detailed job description specifying their care need (e.g., nanny, babysitter, senior care support, tutor, housekeeper, pet sitter, etc.), the frequency, hourly rate, responsibilities and other requirements for the job and any other relevant information they choose to provide. |
• | Search. Families search for potential caregivers based on specific search criteria such as type of care provided, location, hourly rate, whether the caregiver has their own transportation or smokes, comfort with pets and willingness to accept non-cash payments and/or have taxes withheld. The initial search results are based on an algorithm we designed to highlight the most relevant caregivers, but a family can also sort the search results by additional criteria, such as distance from the family, experience, availability, membership length or age. |
• | Detailed Caregiver Profiles. Families review detailed information about the caregivers who apply to their jobs or appear in their search results. This detailed information includes a bio, work history and references, the type of care they provide, any additional services they provide (such as laundry, grocery shopping and errands), their experience, certifications and qualifications (such as college degree and CPR certification or other languages spoken), their availability and hourly rate, the types of payments they accept, whether they are willing to have taxes withheld, caregiver reviews from other members, a caregiver’s verifications, any social connections the caregiver has to other members, and any other relevant information the caregiver chooses to provide. Caregivers also have the option of including a photo or a video with their profile. |
• | Messaging. Members may use our messaging system to contact caregivers who have applied to their jobs or appeared in their search results. Because this messaging system is internal to Care.com, members do not have to |
6
disclose personal contact or other information to communicate through this system. When a family sends a message to a caregiver through our messaging system, we also send an email to the caregiver’s personal email and an alert to their mobile device (if they have installed our mobile app) to notify them that a family has sent them a message. In addition, we have added an integrated video calling feature in our iOS and Android apps.
• | Background Check Services. We currently offer multiple levels of background checks from consumer credit reporting agencies that families may request on caregivers they are interested in hiring. Caregivers must accept the background checks request from a family before the background check is performed. |
Tools and Features for Caregivers
• | Profile. Caregivers create and post detailed profiles that include their bio, work history and references, the type of care they provide, any additional services they provide (such as laundry, grocery shopping and errands), their experience, certifications and qualifications (such as college degree and CPR certification or other languages spoken), their availability and hourly rate, the types of payments they accept, whether they are willing to have taxes withheld and any other relevant information they choose to provide. To build their credibility with families, caregivers may elect to verify their phone number and email addresses with us and connect to other members. Caregivers also have the option of including a photo or a video with their profile. |
• | Search. Caregivers search for specific jobs posted by families, as well as for families based on specific search criteria such as type of care needed, location, hourly rate and number and age of children. |
• | Apply. Caregivers can review and apply to jobs that interest them. When a caregiver applies to a job, the family is notified of the new applicant by email, SMS text message or a mobile alert. |
• | Messaging. Caregivers can respond to messages from families using our internal messaging system. Based on the caregiver’s subscription package, the caregiver may also initiate contact with a family. |
• | Background Check Services. Caregivers may elect to have a background check run on themselves. We currently offer multiple levels of background checks from consumer credit reporting agencies that caregivers may request on themselves. Based on the caregiver’s subscription package, these checks may be included or offered on an à la carte basis. |
Additional Tools and Features for Families and Caregivers
• | Mobile Apps. Families and caregivers can download our free mobile apps for iOS and Android. These apps provide families and caregivers the same job posting, profile creation, search and messaging features described above. |
• | Safety Center. Our service features a safety center that provides resources and information designed to help families and caregivers make safer and more informed hiring and job selection decisions, including recommendations to families for screening, interviewing and ongoing monitoring of caregivers and recommendations to caregivers for avoiding scams. Members may also contact our member care department directly by phone or email if they have concerns about other members. We also offer an online tool that allows families and caregivers to report other members. |
• | Email Notifications. Families receive weekly emails highlighting new caregivers near them, and caregivers receive daily emails notifying them of new jobs in their area. We send families and caregivers additional email communications to help them maximize their use of our consumer matching solutions and to inform them of additional products or services that may be appropriate for them. |
Consumer Payments Solutions
Our consumer payments solutions provide families several options to manage their financial relationship with their caregiver. These products also help caregivers professionalize and manage their careers.
• | Household Employer Payroll and Tax Services. Care.com HomePay is our payroll and tax product for families that employ nannies, housekeepers or other domestic employees. Care.com HomePay is a technology-based, turnkey service that includes automated payroll processing and household employer-related tax filings at the federal, state and local levels. In addition, caregivers who are paid through Care.com HomePay may qualify for important benefits such as unemployment insurance and social security. For household employers who only require an automated payroll processing solution, we offer this service separately. In the future, we intend to offer additional payroll and tax services at tiered feature and pricing levels to address a range of market needs. These products are available to anyone, not just paying members of our consumer matching solutions. |
• | Convenience Payments. This offering enables families to make electronic payments to their caregivers using our website or mobile apps. This solution is particularly applicable for families who pay their caregivers at irregular |
7
intervals, such as ‘‘date night’’ babysitters, after-school caregivers or tutors, or in varying amounts each time services are performed.
Community Platform and Tools
We operate a public groups platform used to host and manage parenting groups and forums, including some of the largest such groups in the United States. Parents regularly engage in these groups to request parenting advice and share their experiences with other group members.
Solutions for Employers
We provide a comprehensive suite of services that employers can offer their employees as an employee benefit. Currently, employers can choose a number of services, including:
• | Our consumer matching solutions; |
• | Our consumer payment solutions; |
• | Back-up care services for employees needing alternative care arrangements for their child or senior due to events such as school closure or the illness of their child or regular caregiver; and |
• | Care concierge services, which include senior care planning services to assist employees struggling to understand their options for an aging family member as well as hands-on assistance with the caregiver search process. |
Employers generally pay for these services on a per employee basis and have access to features that allow them to manage employee access and track aggregate usage. Depending on the service and the employer’s preference, the employer may subsidize all, a portion or none of the service cost for the employee.
Solutions for Care-Related Businesses
We offer care-related businesses a recruiting solution to help them more effectively recruit caregivers and a marketing solution to help them target families at scale. These solutions also provide additional caregiving choices for families and employment opportunities for caregivers.
• | Recruiting Solutions. Through this offering, businesses can either post jobs or search for candidates directly from our base of caregivers. Businesses pay us either a per job listing fee for each job posted each month or obtain a subscription fee that ranges in duration from monthly to annual. |
• | Marketing Solutions. Through this offering, businesses can list their services on our website, receive referrals and apply to jobs posted by families. Businesses typically pay us either a referral fee for each lead generated through our site or a subscription that ranges in duration from 3-month to annual. |
Consumer Social Commerce Solutions
Through our discontinued social commerce service, Citrus Lane, we offered curated products designed for families, on a subscription or à la carte basis in the United States. The products offered by Citrus Lane were designed to provide enrichment and education for children ages 0 to 5. We made the decision to exit this business in the second half of fiscal 2015.
Our Technology
Our technology platform is designed to provide an efficient marketplace experience across our website and mobile apps. Our solution is based on stable and mature technology frameworks that allow us to rapidly scale as our business grows.
Key elements of our technology solution include:
• | Powerful Search and Ranking. Our search technology has been designed to handle rapid and continuous growth in search queries and members. Our technology enables families and caregivers to run faceted and free-form search queries and receive results ranked by relevance using our sorting algorithm. Members can run searches based on a variety of parameters, including location, type of care, hours of availability and hourly rate. |
• | Targeting. We employ statistical models and algorithms to ensure that we are managing the efficiency of our marketplace and optimizing the experience for both families and caregivers. These models are used to improve our customer acquisition efforts as well as our product experience and leverage our rich and growing data set. For example, we prioritize the order in which caregivers are presented to a family to give more prominence to caregivers we believe are more appropriate for the family based on their profile or job postings. Similarly, we present caregivers with job opportunities that we feel are best suited to their qualifications and interests. We also employ targeting technology to personalize the content that we display for members as they use our website and mobile apps. We refine the techniques we use for targeting on an ongoing basis. |
8
• | Mobile Solutions. We offer mobile apps designed specifically for the iOS and Android operating systems. In addition, we also provide a mobile optimized website. These mobile solutions are built on an interface layer that exposes the core features of our service. We use the same interface layer across all of our mobile solutions and believe this architecture will allow us to easily expand our services to new devices and mobile platforms in the future. |
• | Testing and Optimization. We have developed a solution for testing and optimizing the user experience and member engagement on our websites and in our email communications. This solution allows us to run multiple variations of a service feature or email tactic simultaneously and is supported by robust data collection and reporting. Based on our analysis of the user response to a given test, we are able to dynamically send more users to the experience that produces a better result. |
• | Infrastructure Management. We have developed a proprietary suite of tools for managing, administering and monitoring our production website and mobile app platforms. These tools are used to streamline the deployment of releases and to help ensure high availability of our consumer-facing service. |
Our Customers
Our customers are our family and caregiver members, including member who utilize our HomePay services, employers who offer our services as an employee benefit and care-related businesses who subscribe to our marketing and/or our recruiting solutions offerings.
The typical care seeker for our U.S. Consumer Business is female (82%), has an average household income of $75,000, and has at least one child under 18 in the house (73%). Our typical caregiver is also female (94%) and well educated (61% indicating they have at least some college education). Currently, we have 18.4 million members of which 56% represents families and 44% represents caregivers. We have families in approximately 93% of U.S. zip codes and caregivers in approximately 90% of U.S. zip codes. Our members are in every state, and the geographic distribution of our members by state is roughly equal to the overall population distribution by state.
In addition, we have a diverse range of employers who offer our services as a benefit to their employees, including technology companies, educational institutions, professional services firms and Fortune 500 companies. As of December 26, 2015, these employers employed over 800,000 employees who have full access to some or all of our services.
Additionally, we have a diverse set of local, regional and national child care, senior care and other care-related businesses that use our services to help either find people who need the care they provide or find caregivers to work at their organization.
Our Competition
With respect to our consumer matching solutions, we compete for members with traditional offline consumer resources, online job boards and other online care marketplaces. We also compete for a share of the overall recruiting and advertising budgets of care-related businesses with traditional, offline media companies and other Internet marketing providers. The principal competitive factors in this market include:
•network size and quality of caregivers and families;
•product reliability, features, effectiveness and efficiency;
•the quality and completeness of family job postings and caregiver profiles;
•product line breadth and applicability;
•affordability and value of the products provided;
•reliability of safety and security measures;
•the performance and reliability of a mobile solution;
•international footprint; and
•brand awareness and reputation.
Our principal competitors in this market are other online care marketplaces, such as Sittercity and UrbanSitter, and online classifieds, such as Craigslist. Our principal competitor in our employer channel is Bright Horizons. In the consumer payments market, Care.com HomePay competes with similar products offered by 4nannytaxes.com and GTM Payroll Services. We believe we generally compete favorably with our competitors on the basis of our scale, trusted brand and member experience.
Marketing and Sales
9
Our marketing strategy is focused on attracting families and caregivers to our marketplace. Our marketing efforts are designed to increase brand awareness, maximize reach and penetration and grow our member base. Marketing activities include demand generation, advertising, conferences, press relations and customer awareness.
Our target market is primarily women on both sides of the marketplace. Women are typically the primary care decision makers for their family-either as mothers or adult daughters-and represent 94% of our caregivers and 82% of our families. As a result of the shared characteristics of both sides of our marketplace, we are able to leverage our marketing investments targeted at families to also attract caregivers, resulting in lower acquisition costs for caregivers.
We acquire consumers through a diverse mix of free and paid acquisition channels. As a result of our strong focus on our member experience and engagement to ensure a successful match for families and caregivers, the majority of our new subscribers come from unpaid channels, including word-of-mouth referrals, SEO, online communities and forums and repeat users.
Our paid direct marketing efforts for both families and caregivers comprise both offline channels such as network cable TV, local radio and direct mail and online channels such as SEM, paid social display ads, affiliates and select paid job board sites. Our marketing spend is weighted towards our high seasons based on the timing of demand from families seeking care.
Our sales organization is responsible for attracting and retaining employers and care-related businesses to grow adoption of our services and offerings to those organizations. We expect to continue to grow our sales headcount to grow these channels.
Government Regulation
We are subject to numerous U.S. federal and state, and foreign laws and regulations that affect consumer-based businesses and companies that conduct business on the Internet. Many of these laws and regulations are still evolving and being tested in courts, and could be interpreted in ways that could harm our business. These may involve user privacy, information security and data protection, obtaining and use of consumer background information, intellectual property, electronic contracts and other communications, consumer protection, marketing and advertising, telecommunications, product liability, taxation, securities law compliance, and online payment services, among other things.
For example, in the area of information security and data protection, many states have passed laws requiring notification to users when there is a security breach for personal data, such as the Massachusetts Data Breach Notification Law, or requiring the adoption of minimum information security standards that are often vaguely defined and difficult to practically implement. The costs of compliance with these laws may increase in the future as a result of changes in interpretation. In addition, our operations subject us to certain payment card association operating rules, certification requirements and rules, including the Payment Card Industry Data Security Standard, or PCI DSS, a security standard with which companies that collect, store or transmit certain data regarding credit and debit cards, credit and debit card holders, and credit and debit card transactions are required to comply. Our failure to comply fully with the PCI DSS may violate payment card association operating rules, federal and state laws and regulations, and the terms of our contracts with payment processors and merchant banks.
In addition, in the United States we acquire consumer background information about our members from consumer credit reporting agencies, which subjects us to the Fair Credit Reporting Act, or the FCRA. Among other things, the FCRA limits the distribution and use of consumer reports and establishes consumer rights to access and dispute their own credit files, among other rights and obligations. Violation of the FCRA can result in civil and criminal penalties. Many states have enacted laws with requirements similar to the FCRA. Some of these laws impose additional, or more stringent, requirements than the FCRA.
Because our services are accessible worldwide, we are also subject to a number of laws and regulations in foreign jurisdictions. Moreover, in some cases, a foreign jurisdiction may claim that we are required to comply with its laws even if we have no local entity, employees or infrastructure in that jurisdiction.
U.S. federal and state and foreign laws and regulations are constantly evolving and can be subject to significant change. In addition, the application, interpretation, and enforcement of these laws and regulations are often uncertain, particularly in the new and rapidly-evolving industry in which we operate. If we are not in compliance with existing or new laws or regulations that are applicable to our business or if new or existing laws or regulations are interpreted and applied inconsistently with our current policies and practices, our business could be harmed, and we may be forced to modify our policies and practices.
Intellectual Property
Our success depends in part upon our ability to protect our core technology and intellectual property. To accomplish this, we rely on a combination of intellectual property rights, including trade secrets, copyrights and trademarks, as well as contractual restrictions. We enter into confidentiality and assignment of invention agreements with our employees and certain consultants and confidentiality agreements with other third parties. We do not have any patents or pending patent applications.
We pursue the registration of our domain names, trademarks and service marks in the United States and in certain locations outside the United States when we deem such registration to be beneficial and appropriate.
10
The efforts we have taken to protect our proprietary rights may not be sufficient or effective. Any significant impairment of our intellectual property rights could harm our business or our ability to compete. In addition, Internet, technology and social media companies are frequently subject to litigation based on allegations of infringement, misappropriation or other violations of intellectual property rights. We have received in the past and may in the future receive notices asserting that we have infringed, misappropriated or otherwise violated a third party’s intellectual property rights, and as we face increasing competition, the possibility of intellectual property rights claims against us grows.
Employees
We believe we have assembled an extremely talented group of employees and strive to hire the best employees. As of December 26, 2015, we had 429 full-time employees and 244 part-time employees, not including approximately 126 part-time caregiver employees of our subsidiary Care Concierge, Inc. (“Care Concierge”), who provide back-up care from time to time. None of our employees is represented by a labor organization or is a party to any collective bargaining arrangement. We have never had a work stoppage, and we consider our relationship with our employees to be good.
Operating Segments and Geographic Areas
We manage our business on the basis of one operating segment. The majority of our revenue in the year-ended December 26, 2015 was from paying members in the United States.
Additional information required by this item can be found in “Item 8. Financial Statements and Supplementary Data - Note 11. Segment and Geographical Information” of this Annual Report on Form 10-K, and is incorporated by reference herein.
Available Information
We were incorporated in Delaware on October 27, 2006. Our principal executive offices are located at 77 Fourth Avenue, 5th Floor, Waltham, MA 02451, and our telephone number is (781) 642-5900.
Our website is located at www.care.com and our “Investor Relations” website is located at investors.care.com.
We file reports with the Securities and Exchange Commission, or SEC, including annual reports on Form 10-K, quarterly reports on Form 10-Q, current reports on Form 8-K and any other filings required by the SEC. We make available on our “Investor Relations” website, free of charge, our annual report on Form 10-K, quarterly reports on Form 10-Q, current reports on Form 8-K, and all amendments to those reports as soon as reasonably practicable after such material is electronically filed with or furnished to the SEC. References to our website and our “Investor Relations” website in this report are intended to be inactive textual references only, and none of the information contained on our website or our “Investor Relations” website is part of this report or incorporated in this report by reference.
The public may read and copy any materials we file with the SEC at the SEC’s Public Reference Room at 100 F Street, NE, Washington, DC 20549. The public may obtain information on the operation of the Public Reference Room by calling the SEC at 1-800-SEC-0330. The SEC maintains an Internet site (http://www.sec.gov) that contains reports, proxy and information statements, and other information regarding issuers that file electronically with the SEC.
11
ITEM 1A. RISK FACTORS
Our business is subject to numerous risks. We caution you that the following important factors, among others, could cause our actual results to differ materially from those expressed in forward-looking statements made by us or on our behalf in filings with the SEC, press releases, communications with investors and oral statements. Any or all of our forward-looking statements in this Annual Report on Form 10-K and in any other public statements we make may turn out to be wrong. They can be affected by inaccurate assumptions we might make or by known or unknown risks and uncertainties. Many factors mentioned in the discussion below will be important in determining future results. Consequently, no forward-looking statement can be guaranteed. Actual future results may differ materially from those anticipated in forward-looking statements. We undertake no obligation to update any forward-looking statements, whether as a result of new information, future events or otherwise. You are advised, however, to consult any further disclosure we make in our reports filed with the SEC.
Risks Related to Our Business
We may not maintain our current rate of revenue growth.
Our revenues have grown steadily, increasing to $138.7 million in fiscal 2015 from $110.7 million in fiscal 2014, representing an annual growth rate of 25%. Our continued revenue growth and the rate of our revenue growth depend largely on our ability to effectively and efficiently grow our membership, increase the number of members who pay for our products and services, increase the average revenue from our paying members and lengthen the time period existing and new members continue to pay for our products and services. We cannot assure you that we will be successful in continuing to expand our paying member base at the same rates, or at all. In addition, our revenue growth rate may decline if we are not able to grow our paid memberships while managing our acquisition costs within our targeted return on investment range or if we are unsuccessful in cross-selling new and existing products and services to our members, such as our consumer payments solutions, or in continuing to develop new products, services and solutions that members consider valuable, such as our mobile solutions.
You should not rely on our historical rate of revenue growth as an indication of our future performance. If our growth rates were to decline significantly or become negative, it could adversely affect our financial condition and results of operations.
We have a history of cumulative losses and expect to have operating losses as we continue to grow our business.
During fiscal 2015, we experienced net losses of $35.0 million, which includes $17.1 million attributed to the discontinued operations of our Citrus Lane business, and in fiscal 2014, we experienced net losses of $80.3 million, which includes $42.7 million attributed to the discontinued operations of our Citrus Lane business. We expect our operating expenses to increase over the next several years, which may lead to continued losses. We may not achieve profitability in the immediate future, if ever. In particular, we intend to continue to invest substantial resources in marketing to acquire new, paying members. We also intend to hire additional personnel in product, operations, sales and other areas of our business and to introduce new products, services and features, each of which will increase our expenses with no assurance that we will generate sufficient revenue to reduce our losses or achieve profitability.
We operate in an evolving industry, which makes it difficult to evaluate our future prospects and may increase the risk that we will not be successful.
The market for accessing family care online is rapidly evolving and has not yet reached widespread adoption, making it difficult for us to predict our future operating results. In addition, much of our growth has occurred over the last three years, which makes it difficult for us to predict the expected length of paid memberships, revenue per member, member acquisition costs and other key performance indicators for our business. You should consider our business and prospects in light of the risks and difficulties we may encounter in this rapidly evolving market. These risks and difficulties include those described in this Annual Report on Form 10-K and our ability to, among other things:
•attract and retain members and maintain an appropriate family to caregiver ratio of active members;
•encourage paying members to stay longer and return as paying members sooner after their paid membership lapses;
• | cross-sell our products and services to our new and existing members; |
• | continue to develop and diversify our product offerings for members; |
• | anticipate and react to changes in technology such as the shift from personal computers to mobile devices |
•sell our services to employers and care-related businesses;
•provide our members with superior user experiences;
•motivate members to contribute additional, timely and accurate content to our marketplace;
•anticipate and react to challenges from existing and new competitors;
12
•maintain the strength and increase awareness of our brand;
•integrate and grow the businesses we acquire as anticipated; and
•manage and grow our international operations in existing markets.
Failure to adequately address these risks and difficulties could harm our business, impact our ability to reduce our operating losses and achieve profitability, and/or cause our operating losses to grow. In addition, if the demand for online care does not develop as we expect, or if we fail to address the needs of this demand, our business will be harmed.
If the revenue generated by paying members differs significantly from our expectations, or if our membership acquisition costs differ significantly from our expectations, we may not be able to recover our membership acquisition costs or generate profits from these investments.
We had $73.5 million in sales and marketing expenses in fiscal 2015 and $73.8 million in sales and marketing expenses in fiscal 2014. We expect to continue to make significant investments to acquire additional members, including advertising through television, online, social media and other advertising campaigns. Our decisions regarding these investments are based on our anticipated marketing cost to acquire each additional paying member and our analysis of the revenue we believe we can generate per paying member over the expected lifetime of such membership.
In addition, most of our paid memberships are currently monthly memberships, and the average total paid membership length for our consumer matching solutions is approximately eight months. As a result, we must regularly replace paying members who allow their membership to lapse with new paying members either by converting existing non-paying members or by attracting new members to our service. Our anticipated member acquisition costs and our analysis of the revenue that we expect new paying members to generate over the life of the membership depends upon several estimates and assumptions, including paid memberships lengths and increasing renewal rates, including conversion rates of existing members to paying members, future membership fees and our success in cross-selling existing and new products and services to members.
If our estimates and assumptions regarding either our cost to acquire paying memberships or the revenue we can generate from those memberships over their lifetime prove incorrect, we may be unable to recover our member acquisition costs and our operating losses may increase. Similarly, if our member acquisition costs increase, the return on our investment may be lower than we anticipate irrespective of the revenue generated by new members. If we cannot generate profits from this investment, we may need to alter our growth strategy, and our growth rate and results of operations may be adversely affected.
Many individuals use mobile devices to access online services. If users of these devices do not widely adopt solutions we develop for these devices or if we are unable to effectively operate on mobile devices, our business could be adversely affected.
The number of people who access online services through mobile devices, such as smart phones, handheld tablets and mobile telephones, as opposed to personal computers, has increased dramatically in the past few years and is projected to continue to increase. In fiscal 2015, we had an average of over 7.5 million unique visitors to our platform each month, 66% of whom visited our site from mobile devices. In fiscal 2016, we expect the percentage of visitors from mobile devices to increase. If the mobile solutions we have developed and develop in the future do not meet the needs of prospective members or current members, they may not register for our services, they may not become paying members of our services and/or they may reduce their usage of our services and our business could suffer. Additionally, we are dependent on the interoperability of Care.com with popular mobile operating systems that we do not control, such as Android and iOS, and any changes in such systems and terms of service that degrade our solutions’ functionality, give preferential treatment to competitive products or prevent our ability to promote our services could adversely affect traffic and monetization on mobile devices.
Growth in access to our services through mobile devices as a substitute for access on personal computers may negatively affect our revenue and operating results.
Our members are increasingly accessing our platforms on mobile devices. While many of our members who use our online services on mobile devices also access our platforms through personal computers, we have seen substantial growth in mobile usage and mobile only usage. We are devoting valuable resources to solutions related to monetization of mobile usage, and cannot assure you that these solutions will be successful. If our members increasingly use mobile devices as a substitute for access to our online services as opposed to personal computers, and if we are unable to successfully implement monetization strategies for our solutions on mobile devices, or these strategies are not as successful as our offerings for personal computers, or if the expenses we incur in this effort are greater than we anticipated, our financial performance and ability to grow revenue would be negatively affected.
If we are unable to introduce new and diversified products, services or features that families and caregivers find valuable, we may not be able to attract and retain families and caregivers on our online marketplace or expand our paying member base. Our efforts to develop new and diversified products and services could require us to incur significant costs.
13
In order to continue to attract and retain families and caregivers on our online marketplace and expand our paying member base, we will need to continue to invest in the development of new and diversified products, services and features that add value for families and caregivers. The success of new and diversified products, services and features depends on several factors, including the timely completion, introduction and market acceptance of the product, service or feature. If families and caregivers do not recognize the value of our new or diversified products, services or features, they may choose not to use our online marketplace or pay for our services.
Attempting to develop and deliver new or diversified products, services or features involves inherent hazards and difficulties, and is costly. We cannot guarantee that we will be able to successfully manage these product developments or that they will work as intended or provide value to families and caregivers. In addition, some new or diversified products, services or features may be difficult for us to market and may also involve unfavorable pricing. Even if we succeed, we cannot guarantee that our members will respond favorably.
Our business depends on the strength of our brand. If the services we provide fail to meet our members’ expectations, or if inappropriate actions by certain of our members is attributed to us, our brand may be damaged, and we may be unable to maintain or expand our base of members and paying members.
The strength of our brand is essential to our business. Member awareness, and the perceived value, of our brand depends largely on the success of our marketing efforts and the ability of our members to have a consistent, high-quality experience with our service. As a result, we must ensure that our new and existing members are satisfied with our products and services. Complaints, negative views, or negative publicity regarding our products or services, irrespective of their validity, could diminish members’ confidence in and the use of our platform and adversely impact our brand. For example, like many subscription businesses, some members make negative comments about the auto-renew nature of our paid subscriptions in online forums and other public venues. In addition, news reports have been published in the past raising concerns about the background check services offered through our platform.
In addition, our member experience extends beyond the products and services that we offer through our website and to the point of service. As a result, inappropriate, illegal or otherwise harmful acts by caregivers or families, even if only by one or a small number of our members and even if such acts are outside of our control, could result in negative publicity or legal action that could have a significant negative impact on our brand. For example, in recent years there has been an increase in fraud perpetrated against caregivers who seek employment opportunities on sites such as ours, and Care.com has been featured in news reports regarding these scams. There also have been news reports of alleged criminal conduct by caregivers against families they met through our site, including conduct resulting in death, and in some cases lawsuits have been filed against Care.com relating to such conduct. If a decision were rendered against us in a lawsuit of this type, we may incur further negative publicity, incremental costs and this could have an adverse effect on our financial statements. If our efforts to promote and maintain our brand are not successful or if our member experience is not otherwise positive, our operating results and our ability to attract and retain members may be adversely affected.
Furthermore, an adverse, public event resulting from the actions of a caregiver on a competitor’s platform could adversely affect us even if the caregiver has no relationship with our platform and reduce consumer confidence in seeking caregivers through an online platform.
We depend on highly skilled personnel to grow and operate our business and if we are unable to hire, retain and motivate our personnel, we may not be able to grow effectively.
Our future success will depend upon our continued ability to identify, hire, develop, motivate and retain highly-skilled personnel. Our ability to execute efficiently depends upon contributions from all of our employees, in particular our senior management team and employees from key business areas such as product, engineering and analytics. Key institutional knowledge remains with a small group of long-term employees and directors whom we may not be able to retain. We do not have employment agreements other than offer letters with any key employee, including our chief executive officer, and we do not maintain key person life insurance for any employee other than our chief executive officer. In addition, from time to time, there may be changes in our senior management team that may be disruptive to our business. If our senior management team, including any new hires that we may make, fails to work together effectively and to execute our plans and strategies on a timely basis, our business could be harmed. Our growth strategy also depends on our ability to expand and retain our talent pool. Identifying, recruiting, training and integrating qualified individuals require significant time, expense and attention. In addition to hiring new employees, we must continue to focus on retaining our best talent. Competition for these resources, particularly in Boston, New York, Austin and the San Francisco Bay area, four areas where we have offices, is intense. If we are not able to effectively increase and retain our talent, our ability to achieve our strategic objectives will be adversely impacted, and our business will be harmed.
We believe that our culture has the potential to be a key contributor to our success. As we grow, if we do not continue to develop our corporate culture it could harm our ability to foster the innovation, creativity and teamwork we believe we need to support our growth.
14
Finally, we utilize off-shore resources through third parties over whom we have limited control to assist us in developing certain products and features. If any of these third parties terminates their relationship with us or fails to provide adequate services, it could cause delays in our release of new product offerings and/or features and harm our business.
If we fail to manage our growth effectively, our business, operating and financial results may suffer.
We have recently experienced, and expect to continue to experience, significant growth, which has placed, and will continue to place, significant demands on our management and our operational and financial infrastructure. We expect that our growth strategy will require us to commit substantial financial, operational and technical resources. It is important that we appropriately prioritize our efforts and allocate our limited resources effectively. Continued growth also could strain our ability to maintain reliable service levels for our members, to enhance our product offerings, to develop and improve our operational, financial and management controls, to continue to strengthen our reporting systems and procedures and to recruit, train and retain highly skilled personnel. As our operations grow in size, scope and complexity, we will need to scale our systems and infrastructure accordingly and may determine we need to open additional offices, add more network capacity and make other capital investments, which will require significant expenditures and allocation of valuable management resources. If we fail to maintain the necessary level of discipline and efficiency, or if we fail to appropriately prioritize our efforts and allocate limited resources effectively in our organization as it grows, our business, operating results and financial condition may suffer.
If evolving consumer behavior in the era of mobile devices and messaging/social networking apps hinders our ability to effectively market to and communicate with members and potential members, our business, financial condition and results of operations could be adversely affected.
Evolving consumer behavior can affect the availability of profitable marketing opportunities. For example, as traditional television viewership declines and as consumers spend more time on mobile devices rather than desktop computers, the reach of many of our traditional advertising channels may contract. To continue to reach potential members and grow our businesses, we must identify and devote more of our overall marketing expenditures to newer advertising channels, such as mobile and online video platforms as well as targeted campaigns in which we communicate directly with potential, former and current members via new virtual means. Generally, the opportunities in and sophistication of newer advertising channels are relatively undeveloped and unproven, and there can be no assurance that we will be able to continue to appropriately manage and fine-tune our marketing efforts in response to these and other trends in the advertising industry. Any failure to do so could adversely affect our business, financial condition and results of operations.
In addition, as consumers communicate less via email and more via text messaging and other virtual means, the reach of our email campaigns may be adversely impacted. One of our primary means of communicating with our members and keeping them engaged with our products is via email. Our ability to communicate via email enables us to keep our members updated on activity with respect to their job postings or profile, inform them of new members they may be interested in connecting with, introduce them to new products or services they may be interested in utilizing, and present discount and free trial offers, among other things. Any erosion in our ability to communicate successfully with our members via email could have an adverse impact on member experience and the rate at which non-paying members become paid members.
If we fail to expand and increase adoption of our consumer payments solutions, our future growth could suffer.
As part of our growth strategy, we intend to grow our consumer payments solutions. Although an increasing number of our members are using Care.com HomePay, a household employer payroll and tax product, our growth could be adversely affected if this trend does not continue. We also intend to develop other payment and financial solutions to offer to our members as we expand our offerings and services. When we develop a new product, we typically incur expenses and expend resources upfront to market, promote and sell the new offering. Therefore, these new products must achieve high levels of market acceptance in order to justify the amount of our investment in developing and bringing them to market. If we fail to increase adoption of Care.com HomePay, or any other payments solutions we may offer do not achieve adequate acceptance in the market, our competitive position will be impaired, and our growth could be adversely impacted.
We expect our revenue and operating results to fluctuate on a quarterly and annual basis, which may result in a decline in our stock price.
Our revenue and operating results have historically fluctuated from quarter-to-quarter and year-to-year and we expect these fluctuations to continue in the future. These future fluctuations may be significant and unpredictable and may fail to match our projections or the expectations of securities analysts due to a variety of factors, many of which are outside of our control. Any of these events could cause the market price of our stock to fluctuate.
In addition, we generally experience some seasonality fluctuations in our financial results due to heightened demand for caregivers from families at the beginning of the school year and at the beginning of the calendar year. Accordingly, purchases of subscriptions for our consumer matching solutions generally increase in the first and third quarters compared to the second and fourth quarters. Although historically our revenue has increased in each quarter as we have added members, in the future this
15
seasonality may cause fluctuations in our financial results. In addition, other seasonality trends may develop, and the existing seasonality and consumer behavior that we experience may change.
We have based our current and projected future expense levels on our operating plans and sales forecasts, and our operating costs are relatively fixed in the short term. As a result, we may not be able to reduce our costs sufficiently to compensate for an unexpected shortfall in revenue, and even a small shortfall in revenue could disproportionately and adversely affect our financial results for a given quarter.
In addition to the other risk factors listed in this section, our operating results may be affected by a number of factors, including:
•fluctuations in demand for our products and services;
•fluctuations in sales cycles for our products and services;
•general economic conditions in our domestic and international markets and fluctuations in exchange rates;
•our ability to develop and introduce new products and product enhancements that are attractive to our members;
• | the mix of monthly memberships and annual memberships, as the amount of revenue recognized per month on an annual membership is less than a monthly membership; |
•member acceptance of new product introductions;
•the timing and success of changes in our pricing strategies;
•our ability to sell our services to employers and care-related businesses;
• | costs related to acquisitions of other businesses and our ability to successfully integrate, manage and grow those businesses; |
• | any significant changes in the competitive dynamics of our markets, including new entrants or substantial discounting of products; |
• | any decision to increase or decrease operating expenses in response to changes in the marketplace or perceived marketplace opportunities; |
•our ability to derive benefits from our investments in sales, marketing, engineering or other activities;
•volatility in our stock price, which may lead to higher stock compensation expenses; and
• | unpredictable fluctuations in our effective tax rate due to disqualifying dispositions of stock from our stock incentive plan, changes in the valuation of our deferred tax assets or liabilities, changes in actual results versus our estimates or changes in tax laws, regulations, accounting principles or interpretations thereof. |
If the businesses we have acquired or invested in do not perform as expected or we are unable to effectively integrate acquired businesses, our operating results and prospects could be harmed.
We have acquired seven businesses since our inception. The benefits that we expect to achieve as a result of our acquisitions or investments depend in part on our ability to realize anticipated growth opportunities and cost savings synergies. Our success in realizing these opportunities and synergies and the timing of this realization depend among other things on the successful integration of the acquired companies’ businesses and operations with our businesses and operations and the adoption of our respective best practices. Even if we are able to integrate these businesses and operations successfully and implement those strategic initiatives, it may not result in the realization of the full benefits of the growth opportunities and synergies we currently expect to achieve, within the anticipated time frame or at all. If a company we purchase does not perform as we expected, our investment could become impaired or we could discontinue the operations and our financial results could be negatively impacted, as was the case with our Citrus Lane acquisition. For example, in the fourth quarter of 2014, we recorded a pre-tax goodwill and intangible asset impairment charge of $36.2 million related to the Citrus Lane business. This charge was the result of our determination to lower our member acquisition, revenue and profitability projections from those expected at the time of the acquisition. In the second half of 2015, we recorded a pre-tax goodwill and intangible asset impairment charge of $9.7 million related to the Citrus Lane business as a result of our decision to exit the business in an effort to reduce costs and focus resources on our higher growth potential businesses.
Our mergers and acquisitions involve numerous risks, including the following:
• | difficulties in integrating and managing the combined operations, technologies, technology platforms and products of the acquired companies and realizing the anticipated economic, operational and other benefits in a timely manner, which could result in substantial costs and delays or other operational, technical or financial problems; |
16
• | legal or regulatory challenges or litigation post-acquisition, which could result in significant costs or require changes to the businesses or unwinding of the transaction; |
• | failure of the acquired company to achieve anticipated revenue, earnings or cash flow; |
• | diversion of management’s attention or other resources from our existing business; |
• | our inability to maintain the key customers and business relationships and the reputations of acquired businesses; |
• | uncertainty of entry into markets in which we have limited or no prior experience or in which competitors have stronger market positions; |
• | our dependence on unfamiliar affiliates and partners of acquired businesses; |
• | unanticipated costs associated with pursuing acquisitions; |
• | responsibility for the liabilities of acquired businesses, whether such liabilities were disclosed to us or not prior to our acquisition and whether such liabilities meet or exceed our estimates, including, without limitation liabilities arising out of the acquired business’s failure to maintain effective data protection and privacy controls and comply with applicable regulations; |
• | difficulties in assigning or transferring intellectual property licensed by acquired companies from third parties to us or our subsidiaries; |
• | potential loss of key employees of the acquired companies; |
• | challenges in integrating and auditing the financial statements of acquired companies that have not historically prepared financial statements in accordance with U.S. generally accepted accounting principles; |
• | difficulties in integrating acquired companies’ systems controls, policies and procedures to comply with the internal control over financial reporting requirements of the Sarbanes-Oxley Act of 2002; and |
• | potential accounting charges to the extent intangibles recorded in connection with an acquisition, such as goodwill, trademarks, customer relationships or intellectual property, are later determined to be impaired and written down in value. |
Moreover, we rely heavily on the representations and warranties provided to us by the sellers of acquired companies, including as they relate to the financial condition of the company, creation, ownership and rights in intellectual property, and compliance with laws and contractual requirements. If any of these representations and warranties are inaccurate or breached, such inaccuracy or breach could result in costly litigation and assessment of liability for which there may not be adequate recourse against such sellers, in part due to contractual time limitations and limitations of liability.
We may continue to make acquisitions, which could require significant management attention, disrupt our business, result in dilution to our stockholders, and adversely affect our financial results.
As part of our business strategy, we have made, and may in the future make, acquisitions to add specialized employees, complementary companies, products or technologies. The identification of suitable acquisition candidates can be difficult, time-consuming and costly, and we may not be able to successfully complete identified acquisitions. Acquisitions may also involve the entry into geographic or business markets in which we have little or no prior experience. Moreover, the anticipated benefits of any acquisition, investment or business relationship may not be realized or we may be exposed to unknown liabilities. For any such transaction, we may:
•issue additional equity securities that would dilute our stockholders;
•use cash that we may need in the future to operate our business;
•incur debt on terms unfavorable to us or that we are unable to repay;
•incur large charges or expenses or assume substantial liabilities;
•become subject to new laws and regulations about which we have limited prior experience or knowledge;
•encounter difficulties retaining key employees of the acquired companies; and
•become subject to adverse tax consequences, substantial depreciation or deferred compensation charges.
Any of these risks could harm our business and operating results. In addition, for legal, technical or business reasons, we may not be able to successfully assimilate and integrate the business, technologies, solutions, personnel or operations of any company we acquire as quickly or fully as we would like. The integration of any acquired company may require, among other
17
things, coordination of administrative, sales and marketing, accounting and finance functions, harmonization of legal terms and privacy policies and expansion of information and management systems.
Acquisitions can also lead to large non-cash charges that can have an adverse effect on our results of operations as a result of write-offs for items such as future impairments of intangible assets or goodwill.
We have recorded significant goodwill impairment charges from our discontinued operations and may be required to record additional charges to future earnings if our goodwill or intangible assets become impaired.
We are required under generally accepted accounting principles to review our intangible assets for impairment when events or changes in circumstances indicate the carrying value may not be recoverable. Goodwill is required to be tested for impairment at least annually. Factors that may be considered a change in circumstances indicating that the carrying value of our intangible assets may not be recoverable include a decline in stock price and market capitalization, slower growth rates in our industry or our own operations, and/or other materially adverse events that have implications on the profitability of our business. In the fourth quarter of 2014, we recorded a pre-tax goodwill intangible asset impairment charges of $33.8 million and $2.4 million, respectively, related to our Citrus Lane business. As a result of our decision to exit the Citrus Lane, business, we recorded a pre-tax goodwill and intangible asset impairment charges of $8.0 million and $1.7 million, respectively related to our Citrus Lane business in the second half of fiscal 2015. We will need to continue to evaluate the carrying value of our goodwill and may be required to record additional charges to earnings during the period in which any impairment of our goodwill or other intangible assets is determined which could adversely impact our results of operations. As of December 26, 2015, our goodwill balance was $58.6 million and our intangible asset balance was $3.4 million, which represented 41% and 2% of total consolidated assets, respectively.
We use, store and, in some instances, share information collected from or about our members and site visitors and their devices, which may subject us to governmental and industry regulation and other legal obligations related to privacy, and our actual or perceived failure to comply with such obligations could harm our business.
We receive, store and process information from and about our members and website visitors and their devices, as well as information about Care.com HomePay and back-up care users, including name, contact information, and in some cases sensitive personal information, such as credit card numbers, tax return information, bank account numbers, social security numbers and other personal information such as criminal background information. In addition, our service enables our members to direct us to share information, including personal and background information, with other members and with third parties.
Diverse legal and industry requirements in the regions where our members and site visitors reside may apply to our collection, use, storage and sharing information about such individuals, including to the extent that our members choose to share data about themselves or family members in connection with potential employment in the home setting. The scope of these privacy and data protection obligations are changing in substantial and unpredictable ways, subject to differing interpretations, and may be inconsistent between different regions or conflict with other rules. For example, the EU-US Safe Harbor program (“Safe Harbor”), which provided a valid legal basis for transfers of personal data from Europe to the United States, was recently held to be invalid, which has a significant impact on the transfer of data from the European Union to US companies, including us. While we have other legally recognized mechanisms in place that we believe allow for the transfer of EU member and customer and employee information to the United States, it is possible that these mechanisms may also be challenged or evolve to include new legal requirements that could have an impact on how we move data from the European Union to Care.com entities outside the European Union. Recently, the United States and the European Union agreed in principle upon a Privacy Shield program (“Privacy Shield”) as a potential replacement for the Safe Harbor, but it has not yet been finalized, published or interpreted. The Privacy Shield may add significant requirements that could impact our business and result in substantial expense to implement, and it is unclear that it will be appropriate for us. In response to these regulatory changes, we may have to require some of our vendors who process personal data to take on additional privacy and security obligations, and some may refuse, causing us to incur potential disruption and expense related to our business processes. If our policies and practices, or those of our vendors, are, or are perceived to be, insufficient or if our members and customers have concerns regarding the transfer of data from the European Union to the United States, we could be subject to enforcement actions or investigations by individual EU Data Protection Authorities or lawsuits by private parties, member engagement could decline and our business could be negatively impacted.
Some industry requirements subject us to payment card association operating rules, certification requirements and rules, including the Payment Card Industry Data Security Standard, or PCI DSS, a security standard with which companies that collect, store or transmit certain data regarding credit and debit cards, credit and debit card holders, and credit and debit card transactions are required to comply. Our failure to comply fully with the PCI DSS may violate payment card association operating rules, federal and state laws and regulations, and the terms of our contracts with payment processors and merchant banks. Such failure to comply fully may also subject us to fines, penalties, damages and civil liability, and may result in the loss of our ability to accept credit and debit card payments. In addition, there is no guarantee that PCI DSS compliance will
18
prevent illegal or improper use of our services or the theft, loss or misuse of data pertaining to credit and debit cards, credit and debit card holders and credit and debit card transactions.
We strive to comply with all applicable laws, policies, legal obligations and industry requirements relating to privacy and data protection, to the extent reasonably possible. However, it is possible that these obligations may be interpreted and applied in a manner that is inconsistent from one jurisdiction to another and may conflict with other rules or our practices. Any failure or perceived failure by us to comply with our posted privacy policies, our privacy-related obligations to users or other third parties, or any other privacy-related legal obligations, may result in governmental enforcement actions, litigation or public statements against us by consumer advocacy groups or others and could cause our members and customers to lose trust in us, which could have an adverse effect on our business. Additionally, if third parties we work with, such as customers, vendors or developers, violate applicable laws, their contractual obligations to us or our policies, such violations may also put our members’ information at risk and could in turn have an adverse effect on our business.
Complying with existing and proposed laws, regulations and industry standards applicable to the collection, use, storage and sharing of data about our members and site visitors can be costly and can delay or impede the development of new products, result in negative publicity and reputational harm, increase our operating costs, require significant management time and attention, increase our risk of non-compliance and subject us to claims or other remedies, including fines or demands that we modify or cease existing business practices.
Our international operations are subject to increased challenges and risks.
While we intend to focus most of our international efforts on growing our existing international markets, we also may expand our international operations in the future. We have a limited operating history as a company outside the United States, and our ability to manage our business and conduct our operations internationally requires considerable management attention and resources and is subject to the particular challenges of supporting a rapidly growing business in an environment of multiple languages, cultures, customs, legal systems, regulatory systems and commercial infrastructures. This international expansion has required us, and will continue to require us, to invest significant funds and other resources. International expansion also subjects us to risks that we have not previously faced, including risks associated with:
•recruiting and retaining talented and capable employees in foreign countries;
• | providing products and services across a significant distance, in different languages and among different cultures, including potentially modifying our solutions and features to ensure that they are culturally relevant in different countries; |
• | compliance with applicable foreign laws and regulations, which, in certain areas such as privacy and data protection, may be more restrictive than U.S. laws and regulations; |
• | compliance with anti-bribery laws, including without limitation compliance with the Foreign Corrupt Practices Act and the United Kingdom Bribery Act; |
•currency exchange rate fluctuations; and
•higher costs of doing business internationally.
If our revenue from our international operations does not exceed the expense of establishing and maintaining these operations, our business and operating results will suffer.
We depend on search engines and job board sites to attract a significant percentage of our members, and if those businesses change their ranking or listings practices, algorithms or increase their pricing, it could impact our ability to attract new members.
Many of our members locate our services through search engines, such as Google and Bing. Search engines typically provide two types of search results, algorithmic and purchased listings, and we rely on both types. Algorithmic listings cannot be purchased and are determined and displayed by a set of formulas designed by the search engine. Search engines revise their algorithms from time to time in an attempt to optimize search result listings. If the search engines on which we rely for algorithmic listings modify their algorithms in a manner that reduces the prominence of our listing, fewer potential members may find and click through to our services. Additionally, our competitors’ search engine optimization efforts may result in their services receiving greater prominence in search result listings than ours, which could also reduce the number of potential members that visit our services. We have experienced fluctuations in the prominence of our search result listings in the past and we anticipate fluctuations in the future. In addition, costs for purchased listings on search engines have increased in the past and may continue to increase in the future. Price increases could reduce the number of potential members that visit our services and increase our costs. Any reduction in the number of users directed to our services from search engines would harm our business and operating results.
19
Job board sites are also an important source of our caregiver acquisition efforts. We derive much of that volume from organic search listings within those job boards. Should those job board aggregators deny our listings within their organic search listings, we would have to find alternative paid sources to acquire caregivers, which would increase our acquisition costs.
Data security and integrity are critically important to our business, and breaches of security, unauthorized disclosure of information about our members, denial of service attacks or the perception that member information is not secure could result in a material loss of business, substantial legal liability or significant harm to our reputation.
We collect, process and store a large amount of consumer information, including financial information and sensitive personal information. This data is often accessed through transmissions over public and private networks, including the Internet. Despite our physical security measures, implementation of technical controls and contractual precautions designed to identify, detect and prevent the unauthorized access, alteration, use or disclosure of our data, there is no guarantee that these measures or any other measures can provide absolute security. Systems that access or control access to our services and databases may be compromised, as a result of criminal activity, including cyber-attacks and other intentional business disruptions, negligence or otherwise. Threats may derive from human error, fraud or malice on the part of employees or third parties, or may result from accidental technological failure. Several recent, highly publicized data security breaches and denial of service attacks at other companies have heightened consumer awareness of this issue and may embolden individuals or groups to target our systems. Unauthorized disclosure or use, or loss or corruption, of our data or inability of our members to access our systems could disrupt our operations, subject us to substantial legal liability, result in a material loss of business, and significantly harm our reputation.
We are subject to diverse laws and regulations in the United States and foreign countries mandating notification to affected individuals in the event that personal data (as defined in the various governing laws) is accessed or acquired by unauthorized persons. In the United States, federal and state laws provide for more than 40 diverse notification regimes, all of which we are subject to. Germany also has breach notification laws, and the new laws being debated in Europe propose introducing a general mandatory breach notification requirement with which we would have to comply. Complying with such numerous and complex regulations in the event of unauthorized access would be expensive and difficult, and failure to comply with these regulations could subject us to regulatory scrutiny and additional liability.
The number of our registered members is significantly higher than the number of our paying members and substantially all of our revenue is derived from our paying members.
The number of registered members in our marketplace is significantly higher than the number of paying members because some members choose to register, but not become paying members, and others become paying members, but choose not to renew their paid memberships. If we are not able to attract new registered members, convert registered members to paying members or retain our paying members for a longer period of time our business may not grow as fast as we expect, which will harm our operating and financial results and may cause our stock price to decline. Therefore, we must provide features and products that demonstrate the value of our marketplace to our members and motivate them to become paying members. If we fail to successfully motivate our members to do so, our business and operating results could be adversely affected.
Our business may be harmed if users view our marketplace as primarily limited to finding full-time caregivers for children.
Our membership growth and engagement rates could be adversely affected if consumers perceive the utility of our marketplace to be limited to finding full-time caregivers for children. Despite the breadth of care needs that can be met through our platform, including after school care, occasional babysitting, senior care, pet care, tutoring and housekeeping, 30% of job postings in fiscal 2015 were for full-time child caregivers. In addition, our convenience payments product, which may be useful to families who employ any type of caregiver part-time or full-time, child care or senior care, is still in the early stages of adoption among our membership base and we cannot be certain what the rate of adoption will be or if enough of our users will find it sufficiently useful for us to continue to support. If families and caregivers fail to utilize the breadth of the family care and other services available through our marketplace, our membership growth and engagement rates could be negatively impacted, and our business will be harmed.
We may not timely and effectively scale and adapt our existing technology and network infrastructure to ensure that our platform is accessible, and our business is subject to risks of events outside of our control.
Our members access information through our websites and mobile apps. Our reputation and ability to acquire, retain and serve our members depend upon the reliable performance of our websites and mobile apps and the underlying network infrastructure. We have previously experienced, and may experience in the future, service disruptions, outages and other performance problems due to a variety of factors, including infrastructure changes, human or software errors, computer viruses or physical or electronic break-ins, denial of service attacks, capacity constraints and fraud or security violations. In some instances, we may not be able to identify the cause or causes of these performance problems within an acceptable period of time. It may become increasingly difficult to maintain and improve the availability of our platform, especially during peak usage times and as our solutions become more complex and if our user traffic increases. If our platform is unavailable when
20
users attempt to access it or it does not load as quickly as they expect, users may use other services and may not return to our platform as often in the future, or at all. This would negatively impact our ability to attract users and increase engagement on our website and mobile apps. We expect to continue to make significant investments to maintain and improve the availability of our platform and to enable rapid releases of new features and products. To the extent that we do not effectively address capacity constraints, upgrade our systems as needed and continually develop our infrastructure to accommodate actual and anticipated changes in our business and in our technology, our business and operating results may be harmed.
Substantially all of our communications, network and computer hardware used to operate our online services and mobile applications are located in facilities that we do not own or control. Our systems and operations are also vulnerable to damage or interruption from tornadoes, floods, fires, power losses, telecommunications failures or acts of war. For example, a significant natural disaster, such as a major snowstorm or flood, could have a material adverse impact on our business, operating results and financial condition, and our insurance coverage may be insufficient to compensate us for such losses that may occur. In addition, acts of terrorism could cause disruptions in our business or the economy as a whole.
We have implemented disaster recovery procedures that allow us to move our services to a back-up operating infrastructure in the event of a catastrophe or other event outside of our control. However, these procedures do not yet provide a real time solution. Therefore, if our primary operating infrastructure becomes due to a catastrophe or other events outside of our control, there will be a period of time that our platform will remain unavailable while the transition to a back-up operating infrastructure takes place.
Interruptions or delays in service arising from our third-party vendors could impair the delivery of our service and harm our business.
We rely upon third-party vendors to provide certain services upon which we rely, including data center, communications and networking infrastructure services, credit card and payment processing services, background checking services, email management and delivery services, customer relationship management services and other services critical to our business. The operation of our product and service offerings could be impaired if the availability of these services is interrupted or limited in any way. We have contractual relationships with these parties but do not have physical control over their daily operations, which increases our vulnerability to problems with the services they provide. If any of these third-party service providers terminates their relationship with us, or does not provide an adequate level of service to our members, it would be disruptive to our business as we seek to replace the service provider or remedy the inadequate level of service.
In addition, these service providers are vulnerable to damage or interruption from tornadoes, floods, fires, power loss, telecommunications failures and similar events. They also are subject to break-ins, sabotage, acts of vandalism, the failure of physical, administrative, and technical security measures, terrorist acts, human error, financial insolvency and other unanticipated problems or events. The occurrence of any of these events could result in interruptions in our service and unauthorized access to, or alteration of, the content and data contained on our systems and the content and data that these third-party vendors store and deliver on our behalf.
We have experienced, and expect to continue to experience, interruptions and delays in service and availability for such elements. Any errors, failures, interruptions or delays experienced in connection with these third-party technologies and information services could negatively impact our relationship with our members, our brand and reputation and our ability to attract, retain and serve our members.
If we or our service providers fail to process payment transactions effectively and accurately or fail to protect against potential fraudulent activities relating to payment transactions, we may incur expenses and suffer reputational harm.
We offer Care.com HomePay, our household employer payroll and tax services through our subsidiary Breedlove. We also offer an electronic payments solution through a third-party payments processor that allows families to make electronic payments to their caregivers through our website and mobile apps. It is possible that we or our service provider may make errors in processing payments or that funds may be misappropriated due to fraud. We may also make errors in calculating and remitting taxes to the Internal Revenue Service and state tax authorities. In addition, the online tax preparation, payroll administration and online payments industries have increasingly been subject to fraudulent activities by third parties. In addition to any direct damages and potential fines we may incur as a result of payment processing errors or fraud relating to our payments products, negative publicity or a loss of confidence regarding these services could harm our business and damage our brand.
We may not be able to compete successfully against current and future competitors.
We are and will continue to be faced with many competitive challenges, any of which could adversely affect our prospects, results of operations and financial condition.
21
With respect to our consumer matching solutions, we compete for families, caregivers, employers and care-related businesses with traditional offline consumer resources, online job boards and other, online care marketplaces. We also compete for a share of care-related businesses’ overall recruiting and advertising budgets with traditional, offline media companies and other Internet marketing providers. Our principal competitors are Craigslist, a ‘‘free to consumer’’ website, and Sittercity, Inc., an online care specific marketplace. Our principal competitor in our employer channel is Bright Horizons. In the consumer payments market, Care.com HomePay competes with similar products offered by 4nannytaxes.com and GTM Payroll Services. In addition, we may in the future be subject to competition from companies that operate other online marketplaces and that decide to expand into the online care market or other established companies that decide to expand into the consumer payments market. These potential competitors may be larger and have more resources than we do, may enjoy substantial competitive advantages, such as greater name recognition, longer operating histories and larger marketing budgets, as well as substantially greater financial, technical and other resources. As a result, these potential competitors may be able to respond more quickly and effectively than we can to new or changing opportunities or technologies.
To compete effectively for members, we must continue to invest significant resources in marketing and in the development of our products and services to enhance their value. To compete effectively for revenue from employers and care-related businesses, we must continue to invest in marketing and in growing our membership. Failure to compete effectively against our current or future competitors could result in loss of current or potential members, which could adversely affect our margins, and prevent us from achieving or maintaining profitability. We cannot assure you that we will be able to compete effectively for members in the future against existing or new competitors, and the failure to do so could result in loss of existing or potential members, reduced membership revenue, increased marketing or selling expenses or diminished brand strength, any of which could harm our business.
We are subject to litigation which could have an adverse effect on our financial condition.
We are, and from time to time may become, subject to litigation and various legal proceedings and/or investigations, including litigation, proceedings and/or investigations related to privacy, advertising, other consumer protection laws, contracts, intellectual property or other matters and that involve claims for substantial amounts of money or for other relief or that might necessitate changes to our business or operations. We evaluate these litigation claims and legal proceedings to assess the likelihood of unfavorable outcomes and to estimate, if possible, the amount of potential losses. Based on these assessments and estimates, we may establish reserves and/or disclose the relevant litigation claims or legal proceedings, as and when required or appropriate. These assessments and estimates are based on information available to management at the time of such assessment or estimation and involve a significant amount of judgment. As a result, actual outcomes or losses could differ materially from those envisioned by our current assessments and estimates. Our failure to successfully defend or settle any of these litigations or legal proceedings could result in liability that, to the extent not covered by our insurance, could have an adverse effect on our business, financial condition and results of operations.
We may incur liability or other expenses if caregivers or other users of our services engage in inappropriate, harmful or illegal conduct, or if we do not notify our members of alleged inappropriate or illegal conduct.
Families and caregivers have sought, and may seek in the future, damages from us if a caregiver or family does not meet their expectations or causes them harm. Currently, Care.com is a party to several lawsuits brought by families relating to alleged criminal acts by caregivers they found through the Care.com site, including acts resulting in death. These types of claims also may be brought under foreign laws. If a decision were rendered against us in a claim of this type, we may incur significant liability and/or negative publicity. Even if these claims do not result in liability to us, they may result in significant investigation or defense costs, as well as negative publicity. In addition, because there is a particularly low tolerance for failure when seeking care for a loved one, any such claims, events or publicity could have a significant adverse effect on our reputation and brand. Any of these results, particularly damages to our brand and reputation, could adversely affect our financial condition, business and operating results.
Our subsidiary Care Concierge provides back-up child and adult care to families by directly assigning caregivers, some of whom are Care Concierge employees, to families in need of temporary care. The caregivers and families involved in these transactions are not required to be members of our consumer matching solutions. To the extent that a caregiver provided through our back-up services does not meet the expectations of a family or causes harm, we may be subject to claims from that family or from the employer that subscribed to this service and offered it as an employee benefit to the family.
From time to time, we become aware of information relating to our members through complaints from other members, publicly available sources or otherwise, which results in our removal of the member from our marketplace. Because of the complex legal and regulatory environment in which our business operates, we generally do not advise other members when we decide to remove a particular member and, when we do advise members that we have removed a member, we generally do not tell them the reason for removal. As a result, a member who hires a caregiver through our platform may not be aware that the caregiver has subsequently been removed from our marketplace or the reason the caregiver was removed, and may seek to make a legal claim against us for failure to notify them of the removal or the reason for the removal. Any such claims, whether
22
or not meritorious, or any claim by a caregiver that he or she should not have been so removed, may be a distraction to management, result in our incurring costs to defend the claim or otherwise harm our business and reputation.
Adverse economic conditions may adversely impact our business.
Our business depends on the overall demand for care. Our prospective members’ employment and income impact their demand for care. Increased unemployment or a reduction in labor force participation could reduce the number of dual-income families-a key component of our target market-and therefore the number of families seeking care. In addition, if consumer spending is reduced due to a weak economy, families may decrease spending on care services they believe to be non-essential, such as housekeeping and tutoring, or reduce or eliminate certain activities that typically require the services of our caregivers, such as date nights that require babysitters and vacations that may require pet sitters. As a result, weakened macroeconomic conditions could decrease the traffic on our platform, reduce sales of our products and services and delay adoption of new offerings.
If we require additional funds from outside sources in the future, those funds may not be available on acceptable terms, or at all.
We may require additional funds from outside sources in the future, and we may not be able to obtain those funds on acceptable terms, or at all. If we raise additional funds by issuing equity securities, our stockholders may experience dilution. Debt financing, if available, may involve covenants restricting our operations or our ability to incur additional debt. Any debt or additional equity financing that we raise may contain terms that are not favorable to us or our stockholders.
If we do not have, or are not able to obtain, sufficient outside funds, we may have to delay development of new product offerings. If we are unable to raise adequate funds, we may have to liquidate some or all of our assets, or delay, reduce the scope of or eliminate some or all of our development programs. We also may have to reduce marketing or other resources devoted to our products or cease operations. Any of these actions could harm our operating results.
Our business is subject to a variety of U.S. and foreign laws, some of which are unsettled and still developing and which could subject us to claims or otherwise harm our business.
We are subject to numerous U.S. federal and state, and foreign laws and regulations that affect consumer-based businesses and companies that conduct business on the Internet. The regulatory environment for many of these laws is very unsettled in the United States and internationally, especially as it applies to the products and services we offer and to the operation of our business generally. These may involve user privacy, information security and data protection, use of consumer background information, intellectual property, electronic contracts and other communications, consumer protection, telecommunications, product liability, taxation, securities law compliance, and online payment services.
For example, our operations are subject to numerous laws that regulate privacy, information security and data protection, and the use of consumer background information. Certain of these laws provide for civil and criminal penalties for the unauthorized release of, or access to, this protected information or for not adopting processes or procedures for handling reported inaccuracies in this protected information. For example, in the United States we acquire information about our members from consumer credit reporting agencies and other third-party sellers of public data about unique individuals. We use this information in an effort to verify the accuracy of the information members provide about themselves and to further our business objective to maintain a trusted online community for our members. We also facilitate the sharing of third-party consumer reports and criminal background checks between members at the direction of the individual who is the subject of the report. The Fair Credit Reporting Act, or the FCRA, applies to consumer credit reporting agencies as well as data furnishers and users of consumer reports, as those terms are defined in the FCRA. The FCRA promotes the accuracy, fairness and privacy of information in the files of consumer reporting agencies that engage in the practice of assembling or evaluating information relating to consumers for certain specified purposes, including for employment. The FCRA limits the distribution and use of consumer reports and establishes consumer rights to access and dispute their own credit files, among other rights and obligations. Members who access consumer reports about job applicants via our service expressly agree to follow the FCRA requirements for employers. Violation of the FCRA can result in civil and criminal penalties. The U.S. Federal Trade Commission, the Consumer Financial Protection Bureau, and the State Attorneys’ General, acting alone or in cooperation with one another, actively enforce the FCRA as do private litigants. Many states have enacted laws with requirements similar to the FCRA. Some of these laws impose additional, or more stringent, requirements than the FCRA.
In addition, the payment processing and tax preparation industries are receiving heightened attention from federal and state governments. New legislation, regulation, public policy considerations, litigation by the government or private entities or new interpretations of existing laws may subject us to additional legal or regulatory oversight or obligations, restrict the types of products and services that we can offer or the prices we can charge, or otherwise cause us to change the way we operate our payment processing and tax preparation businesses or offer our payment processing and tax products and services. This in turn may increase our cost of doing business and limit our revenue opportunities. In addition, if our practices are not consistent with current or new interpretations of existing laws, we may become subject to lawsuits, penalties and other liabilities.
23
If we are not able to comply with existing or new laws or regulations or if we become liable under these laws or regulations, we could be directly harmed, and we may be forced to implement new measures to reduce our exposure to this liability. This may require us to expend substantial resources or to discontinue certain solutions, which would negatively affect our business, financial condition and results of operations. In addition, the increased attention focused upon liability issues as a result of lawsuits and legislative proposals could harm our reputation or otherwise impact the growth of our business. Any costs incurred as a result of this potential liability could harm our business and operating results.
As we develop and sell new products, services and features, we may be subject to additional and unexpected regulations, which could increase our costs or otherwise harm our business.
As we develop and sell new products, services and features to our members, we may become subject to additional laws and regulations, which could create unexpected liabilities for us, cause us to incur additional costs or restrict our operations. For example, we offer our convenience payments product to our members through a third party. If, in the future, we provide this product directly to our members, we would be subject to complex financial regulations. We may also become subject to financial regulations as we develop additional payment and financial solutions for our members. In addition, if we expand our offerings to include more personalized services, we may become subject to various laws and regulations relating to the protection of children, seniors and/or prospective employees.
Our failure to accurately anticipate the application of laws and regulations that governmental organizations or others may claim are applicable to new products and services we may offer, or other failure to comply, could create liability for us, result in adverse publicity or cause us to alter our business practices, which could cause our revenue to decrease, our costs to increase or our business otherwise to be harmed.
We could face liability or other expenses for information on or accessible through our online marketplace.
A significant portion of the information available through our online marketplace, including job postings, caregiver profiles and photographs, is submitted by families, caregivers and third parties. We also allow care-related businesses and other third parties to advertise their products and services on our websites and include links to third-party websites. We could be exposed to liability with respect to this information. Members could assert that information concerning them on our website contains errors or omissions and/or seek damages from us for losses incurred if they rely upon incorrect information provided by our members, care-related businesses or others. We could also be subject to claims that the persons posting information on our websites do not have the right to post such information or are infringing the rights of third parties, such as copyrights in photographs and privacy and publicity rights. Among other things, we might be subject to claims that by directly or indirectly providing links to websites operated by third parties, we are liable for wrongful actions by the third parties operating those websites. These claims also may be brought under foreign laws that often do not provide the same protections for online services companies as in the United States. We could incur significant costs in investigating and defending against these claims even if they do not result in liability to us.
We also allow families to submit reviews of caregivers. Our terms of use prohibit members from providing inaccurate, misleading, defamatory or false information to us or to any other user of our website and that all opinions expressed must be genuinely held. However, we do not have a regular practice of verifying the accuracy of all member content. There is a risk that a review or other content posted by a member may be considered defamatory or otherwise offensive, objectionable or illegal under applicable law. Therefore, there is a risk that publication on our website of our ratings and reviews may result in a suit against us for defamation, civil rights infringement, negligence, copyright or trademark infringement, invasion of privacy, personal injury, discrimination, or other legal claims. Even if these claims do not result in liability to us, they may result in costly and time-consuming litigation and/or injury to our reputation.
If we are unable to protect our intellectual property rights, our competitive position could be harmed or we could be required to incur significant expenses to enforce our rights.
We rely on a combination of intellectual property rights, including trade secrets, copyrights and trademarks, as well as contractual restrictions, to safeguard our intellectual property. We do not have any patents or pending patent applications. Despite our efforts to protect our proprietary rights, unauthorized parties may attempt to copy our digital content, aspects of our solutions for members, our technology, software, branding and functionality, or obtain and use information that we consider proprietary. Moreover, policing our proprietary rights is difficult and may not always be effective. As we expand internationally, we may need to enforce our rights under the laws of countries that do not protect proprietary rights to as great an extent as do the laws of the United States.
Our digital content is not protected by any registered copyrights or other registered intellectual property. Rather, our digital content is protected by statutory and common law rights, user agreements that limit access to and use of our data and by technological measures. Compliance with use restrictions is difficult to monitor, and our proprietary rights in our digital content databases may be more difficult to enforce than other forms of intellectual property rights.
24
We hold several registered trademarks in the United States, including ‘‘Care.com’’, which is registered on the supplemental register. We also hold registered trademarks in the EU, Germany and Canada. Some of our trade names may not be eligible to receive trademark protection. Trademark protection may also not be available, or sought by us, in every country in which our service may become available. Competitors may adopt service names similar to ours, or purchase our trademarks and confusingly similar terms as keywords in Internet search engine advertising programs, thereby impeding our ability to build brand identity and possibly confusing consumers and caregivers.
We currently hold the ‘‘Care.com’’, ‘‘Betreut.de’’, and ‘‘Breedlove.com’’ Internet domain names and various other domain names. Domain names generally are regulated by Internet regulatory bodies. If we lose the ability to use a domain name in the United States or any other country, we would be forced to incur significant additional expense to market our solutions, including the development of a new brand and the creation of new promotional materials, which could substantially harm our business and operating results. The regulation of domain names in the United States and in foreign countries is subject to change. Regulatory bodies could establish additional top-level domains, appoint additional domain name registrars or modify the requirements for holding domain names. As a result, we may not be able to acquire or maintain the domain names that utilize the ‘‘Care’’ name or other names we utilize in all of the countries in which we currently intend to conduct business.
In order to protect our trade secrets and other confidential information, we rely in part on confidentiality agreements with our personnel, consultants and third parties with whom we have relationships. These agreements may not effectively prevent disclosure of trade secrets and other confidential information, and may not provide an adequate remedy in the event of misappropriation of trade secrets or any unauthorized disclosure of trade secrets and other confidential information. In addition, others may independently discover trade secrets and confidential information and, in such cases, we could not assert any trade secret rights against such parties. Costly and time-consuming litigation could be necessary to enforce and determine the scope of our trade secret rights and related confidentiality and nondisclosure provisions, and failure to obtain or maintain trade secret protection, or our competitors being able to obtain our trade secrets or to independently develop technology similar to ours or competing technologies, could adversely affect our competitive business position.
Assertions by third parties of infringement or other violation by us of their intellectual property rights could result in significant costs and substantially harm our business and operating results.
Internet, technology and social media companies are frequently subject to litigation based on allegations of infringement, misappropriation or other violations of intellectual property rights. Some own large numbers of patents, copyrights, trademarks and trade secrets, which they may use to assert claims against us. We have received in the past and may in the future receive notices asserting that we have infringed, misappropriated or otherwise violated a third party’s intellectual property rights, and as we face increasing competition, the possibility of intellectual property rights claims against us grows. We cannot assure you that we are not infringing or violating any third-party intellectual property rights.
We cannot predict whether assertions of third-party intellectual property rights or any infringement or misappropriation claims arising from such assertions will substantially harm our business and operating results. If we are forced to defend against any infringement or misappropriation claims, whether they are with or without merit, are settled out of court or are determined in our favor, we may be required to expend significant time and financial resources on the defense of such claims. Furthermore, an adverse outcome of a dispute may require us to: pay damages, potentially including treble damages and attorneys’ fees, if we are found to have willfully infringed a party’s patent or copyright rights; cease making, licensing or using solutions that are alleged to infringe or misappropriate the intellectual property of others; expend additional development resources to redesign our solutions; enter into potentially unfavorable royalty or license agreements in order to obtain the right to use necessary technologies, content or materials; and to indemnify our partners and other third parties. Royalty or licensing agreements, if required or desirable, may be unavailable on terms acceptable to us, or at all, and may require significant royalty payments and other expenditures. Any of these events could seriously harm our business, operating results and financial condition. In addition, any lawsuits regarding intellectual property rights, regardless of their success, could be expensive to resolve and would divert the time and attention of our management and technical personnel.
If we fail to maintain proper and effective internal controls, our ability to produce accurate financial statements on a timely basis could be impaired, which would adversely affect our business and our stock price.
Ensuring that we have adequate internal financial and accounting controls and procedures in place to produce accurate financial statements on a timely basis is a costly and time-consuming effort that needs to be reevaluated frequently. We have in the past discovered, and may in the future discover, areas of our internal financial and accounting controls and procedures that need improvement.
Our management is responsible for establishing and maintaining adequate internal control over financial reporting to provide reasonable assurance regarding the reliability of our financial reporting and the preparation of financial statements for external purposes in accordance with U.S. generally accepted accounting principles. Our management does not expect that our internal control over financial reporting will prevent or detect all errors and all fraud. A control system, no matter how well designed and operated, can provide only reasonable, not absolute, assurance that the control system’s objectives will be met.
25
Due to the inherent limitations in all control systems, no evaluation of controls can provide absolute assurance that misstatements due to error or fraud will not occur or that all control issues and instances of fraud, if any, within our company will be detected.
Our revenue may be negatively affected if we are required to charge sales tax or other transaction taxes on all or a portion of our past and future sales in jurisdictions where we are currently not collecting and reporting tax.
We currently only charge and collect sales or other transaction taxes in certain of the jurisdictions where our members reside. A successful assertion by any state, local jurisdiction or country in which we do not charge and collect such taxes that we should be collecting sales or other transaction taxes on the sale of our products or services, or the imposition of new laws requiring the collection of sales or other transaction taxes on the sale of our products or services, could result in substantial tax liabilities related to past sales, create increased administrative burdens or costs, reduce demand for our products or services, decrease our ability to compete if competitors lower their fees to offset the tax but we do not or otherwise substantially harm our business and results of operations.
Changes in our (benefit from) provision for income taxes or adverse outcomes resulting from examination of our income tax returns could adversely affect our results.
Our (benefit from) provision for income taxes is subject to volatility and could be adversely affected by the following:
•changes in the valuation of our deferred tax assets;
•foreign or domestic income tax assessments and any related tax interest or penalties;
•expiration of, or lapses in, the research and development tax credit laws;
•tax effects of nondeductible compensation;
•adjustments to the pricing of intercompany transactions and transfers of intellectual property or other assets;
•changes in accounting principles; or
• | changes in tax laws and regulations, including changes in taxation of the services provided by our foreign subsidiaries. |
Significant judgment is required to determine the recognition and measurement attributes prescribed in the accounting guidance for uncertainty in income taxes. The accounting guidance for uncertainty in income taxes applies to all income tax positions, including the potential recovery of previously paid taxes, that if settled unfavorably could adversely impact our provision for income taxes or additional paid-in capital. In addition, we are subject to the examination of our income tax returns by the U.S. Internal Revenue Service and other tax authorities. We regularly assess the likelihood of adverse outcomes resulting from these examinations to determine the adequacy of our provision for income taxes. The outcomes from these examinations might have a material and adverse effect on our operating results and financial condition.
Our ability to use our net operating loss carryforwards and certain other tax attributes may be limited.
As of December 26, 2015, we had federal net operating loss carryforwards of $111.3 million and state net operating loss carryforwards of $91.9 million. Under Sections 382 and 383 of the Internal Revenue Code of 1986, as amended, or the Code, if a corporation undergoes an ‘‘ownership change,’’ the corporation’s ability to use its pre-change net operating loss carryforwards and other pre-change tax attributes, such as research tax credits, to offset its post-change income and taxes may be limited. In general, an ‘‘ownership change’’ generally occurs if there is a cumulative change in our ownership by ‘‘5-percent shareholders’’ that exceeds 50 percentage points over a rolling three-year period. Similar rules may apply under state tax laws. We may have experienced an ownership change in the past and may experience ownership changes in the future as a result of future transactions in our stock, some of which may be outside our control. As a result, if we earn net taxable income, our ability to use our pre-change net operating loss carryforwards, or other pre-change tax attributes, to offset U.S. federal and state taxable income and taxes may be subject to significant limitations.
Our international operations subject us to potentially adverse tax consequences.
We generally conduct our international operations through wholly owned subsidiaries and report our taxable income in various jurisdictions worldwide based upon our business operations in those jurisdictions. Our intercompany relationships are subject to transfer pricing regulations administered by taxing authorities in various jurisdictions. The relevant taxing authorities may disagree with our determinations as to the income and expenses attributable to specific jurisdictions. If such a disagreement were to occur, and our position were not sustained, we could be required to pay additional taxes, interest and penalties, which could result in one-time tax charges, higher effective tax rates, reduced cash flows and lower overall profitability of our operations.
26
We may not be able to successfully prevent others, including copycat websites and mobile apps, from misappropriating our content in the future.
From time to time, third parties have attempted to misappropriate our content through website scraping, search robots or other means. We have deployed several technologies designed to detect and prevent such efforts. However, we may not be able to successfully detect and prevent all such efforts in a timely manner or assure that no misuse of our content occurs.
In addition, third parties operating ‘‘copycat’’ websites have attempted to imitate our brand or the functionality of our service. When we have become aware of such efforts by other companies, we have employed technological or legal measures in an attempt to halt their operations. However, we may not be able to detect all such efforts in a timely manner, or at all, and even if we could, the technological and legal measures available to us may be insufficient to stop their operations. In some cases, particularly in the case of companies operating outside of the United States, our available remedies may not be adequate to protect us against the damage to our business caused by such websites or mobile apps. Regardless of whether we can successfully enforce our rights against the operation of these third parties, any measures that we may take could require us to expend significant financial or other resources and have a significantly adverse effect on our brand.
Some of our solutions contain open-source software, which may pose particular risks to our proprietary software and solutions.
We use open-source software in our solutions and will use open source software in the future. From time to time, we may face claims from third parties claiming ownership of, or demanding release of, the open source software and/or derivative works that we developed using such software (which could include our proprietary source code), or otherwise seeking to enforce the terms of the applicable open source license. These claims could result in litigation and could require us to purchase a costly license or cease offering the implicated solutions unless and until we can re-engineer them to avoid infringement. This re-engineering process could require significant additional research and development resources. In addition to risks related to license requirements, use of certain open source software can lead to greater risks than use of third-party commercial software, as open source licensors generally do not provide warranties or controls on the origin of software. Any of these risks could be difficult to eliminate or manage and, if not addressed, could have a negative effect on our business and operating results.
We are an ‘‘emerging growth company,’’ and the reduced disclosure requirements applicable to emerging growth companies may make our common stock less attractive to investors.
We are an ‘‘emerging growth company,’’ as defined in the Jumpstart Our Business Startups Act of 2012, or the JOBS Act, and will remain an emerging growth company until the earlier of (1) the last day of the fiscal year (a) following the fifth anniversary of the completion of our initial public offering, (b) in which we have total annual gross revenue of at least $1.0 billion, or (c) in which we become a large accelerated filer and (2) the date on which we have issued more than $1.0 billion in non-convertible debt during the prior three-year period. For so long as we remain an emerging growth company, we are permitted and intend to rely on exemptions from certain disclosure requirements that are applicable to other public companies that are not emerging growth companies. These exemptions include not being required to comply with the auditor attestation requirements of Section 404 of the Sarbanes-Oxley Act of 2002, or Section 404, not being required to comply with any requirement that may be adopted by the Public Company Accounting Oversight Board regarding mandatory audit firm rotation or a supplement to the auditor’s report providing additional information about the audit and the financial statements, reduced disclosure obligations regarding executive compensation and exemptions from the requirements of holding a non-binding advisory vote on executive compensation and shareholder approval of any golden parachute payments not previously approved. In this Annual Report on Form 10-K, we have not included all of the executive compensation-related information that would be required if we were not an emerging growth company. We cannot predict whether investors will find our common stock less attractive if we rely on these exemptions. If some investors find our common stock less attractive as a result, there may be a less active trading market for our common stock and our stock price may be more volatile.
In addition, the JOBS Act provides that an emerging growth company can take advantage of an extended transition period for complying with new or revised accounting standards. This allows an emerging growth company to delay the adoption of certain accounting standards until those standards would otherwise apply to private companies. We irrevocably elected not to avail ourselves of this exemption from new or revised accounting standards and, therefore, we are subject to the same new or revised accounting standards as other public companies that are not emerging growth companies. We have and will continue to incur increased costs as a result of operating as a public company, and our management has and will continue to be required to devote substantial time to new compliance initiatives and corporate governance practices.
As a public company, and particularly after we are no longer an ‘‘emerging growth company,’’ we have and will continue to incur significant legal, accounting and other expenses that we did not incur as a private company. The Sarbanes-Oxley Act of 2002, the Dodd-Frank Wall Street Reform and Consumer Protection Act, the listing requirements of The New York Stock Exchange and other applicable securities rules and regulations impose various requirements on public companies, including establishment and maintenance of effective disclosure and financial controls and corporate governance practices. Our
27
management and other personnel have devoted and will continue to need to devote a substantial amount of time to these compliance initiatives. Moreover, these rules and regulations have increased and will continue to increase our legal and financial compliance costs and make some activities more time-consuming and costly.
We are continually evaluating these rules and regulations and cannot predict or estimate the amount of additional costs we may incur or the timing of such costs. These rules and regulations are often subject to varying interpretations, in many cases due to their lack of specificity, and, as a result, their application in practice may evolve over time as new guidance is provided by regulatory and governing bodies. This could result in continuing uncertainty regarding compliance matters and higher costs necessitated by ongoing revisions to disclosure and governance practices.
Risks Related to Ownership of Our Common Stock
Our stock price may be volatile, and the value of an investment in our common stock may decline.
Shares of our common stock were sold in our initial public offering in January 2014 at a price of $17.00 per share and, from the date our common stock first traded on the New York Stock Exchange through February 26, 2016 our common stock has subsequently traded as high as $29.25 and as low as $4.89. The market price of our common stock could be subject to significant fluctuations in response to various factors, some of which are beyond our control. In addition to the factors discussed in this ‘‘Risk Factors’’ section and elsewhere in this Annual Report on Form 10-K, these factors include:
•our operating performance and the operating performance of similar companies;
•the overall performance of the equity markets;
•the number of shares of our common stock publicly owned and available for trading;
•threatened or actual litigation;
•changes in laws or regulations relating to our solutions;
•any major change in our board of directors or management;
• | publication of research reports about us or our industry or changes in recommendations or withdrawal of research coverage by securities analysts; |
•large volumes of sales of shares of our common stock by existing stockholders; and
•general political and economic conditions.
In addition, the stock market in general, and the market for technology companies in particular, has experienced extreme price and volume fluctuations that have often been unrelated or disproportionate to the operating performance of listed companies. Broad market and industry factors may seriously affect the market price of companies’ stock, including ours, regardless of actual operating performance. Securities class action litigation has often been instituted against companies following periods of volatility in the overall market and in the market price of a company’s securities. This litigation, if instituted against us, could result in very substantial costs, divert our management’s attention and resources and harm our business, operating results and financial condition.
If securities or industry analysts publish inaccurate or unfavorable research about our business, cease coverage of our company or make projections that exceed our actual results, our stock price and trading volume could decline.
The trading market for our common stock is and will be influenced by the research and reports that securities or industry analysts publish about us or our business. If one or more of the analysts who cover us downgrades our stock or publishes inaccurate or unfavorable research about our business, our stock price would likely decline. If one or more of these analysts ceases coverage of our company or fails to publish reports on us regularly, demand for our stock could decrease, which might cause our stock price and trading volume to decline.
Furthermore, such analysts publish their own projections regarding our actual results. These projections may vary widely from one another and may not accurately predict the results we actually achieve. Our stock price may decline if we fail to meet securities and industry analysts’ projections.
Our management has broad discretion over our existing cash resources and might not use such funds in ways that increase the value of your investment.
Our management generally has broad discretion over the use of our cash resources, and you will be relying on the judgment of our management regarding the application of these resources. Our management might not apply these resources in ways that increase the value of your investment.
28
Concentration of ownership among our officers, directors, large stockholders and their affiliates may prevent new investors, from influencing corporate decisions.
Our officers, directors and their affiliated funds and certain of our pre-IPO stockholders beneficially own or control, directly or indirectly, a majority of the outstanding shares of our common stock. As a result, if some of these persons or entities act together, they will have significant influence over the outcome of matters submitted to our stockholders for approval, including the election of directors and approval of significant corporate transactions, such as a merger or other sale of our company or its assets. This concentration of ownership could limit the ability of other stockholders to influence corporate matters and may have the effect of delaying or preventing an acquisition or cause the market price of our stock to decline. Some of these persons or entities may have interests different from yours. For example, because some of these stockholders purchased their shares at prices substantially below the price at which shares are currently being sold to the public and have held their shares for a relatively longer period, they may be more interested in selling the company to an acquirer than other investors or may want us to pursue strategies that are different from the wishes of other investors.
We do not intend to pay dividends for the foreseeable future.
We never have declared or paid any cash dividends on our capital stock and do not intend to pay any cash dividends in the foreseeable future. We anticipate that we will retain any future earnings for use in the development of our business and for general corporate purposes. Any determination to pay dividends in the future will be at the discretion of our board of directors. Accordingly, investors must rely on sales of their shares of our common stock after price appreciation, which may never occur, as the only way to realize any future gains on their investments.
Anti-takeover provisions contained in our certificate of incorporation and by-laws, as well as provisions of Delaware law, could impair a takeover attempt.
Our certificate of incorporation, by-laws and Delaware law contain provisions that could have the effect of rendering more difficult or discouraging an acquisition deemed undesirable by our board of directors. Our corporate governance documents include provisions:
• | authorizing blank check preferred stock, which could be issued with voting, liquidation, dividend and other rights superior to our common stock; |
• | limiting the liability of, and providing indemnification to, our directors and officers; |
• | limiting the ability of our stockholders to call and bring business before special meetings and to take action by written consent in lieu of a meeting; |
• | requiring advance notice of stockholder proposals for business to be conducted at meetings of our stockholders and for nominations of candidates for election to our board of directors; |
• | controlling the procedures for the conduct and scheduling of board of directors and stockholder meetings; |
• | providing our board of directors with the express power to postpone previously scheduled annual meetings and to cancel previously scheduled special meetings; |
• | establishing a classified board of directors so that not all members of our board are elected at one time; |
• | limiting the determination of the number of directors on our board of directors and the filling of vacancies or newly created seats on the board to our board of directors then in office; and |
• | providing that directors may be removed by stockholders only for cause. |
These provisions, alone or together, could delay hostile takeovers and changes in control of our company or changes in our management.
ITEM 1B. UNRESOLVED STAFF COMMENTS
None.
ITEM 2. PROPERTIES
We lease approximately 108,700 square feet of space in our headquarters in Waltham, Massachusetts under leases that expire in January 2025. We also lease approximately 20,000 square feet of space in Austin, Texas, approximately 19,000 square feet of space in Berlin, Germany and have insignificant rental spaces in various other locations in the United States and Europe.
29
We believe our current and planned office facilities are generally suitable to meet our needs for the foreseeable future. However, we will seek additional space as needed to satisfy our growth.
ITEM 3. LEGAL PROCEEDINGS
From time to time we are involved in legal proceedings arising in the ordinary course of our business. Although the results of litigation and claims cannot be predicted with certainty, we currently believe that there is no litigation pending that is likely to have a material adverse effect on our business. Regardless of the outcome, legal proceedings can have an adverse impact on us because of defense and settlement costs, diversion of management resources and other factors.
Information pertaining to legal proceedings can be found in Note 7, Commitments and Contingencies of our consolidated financial statements included in Item 8 of this Annual Report on Form 10-K, and is incorporated by reference herein.
ITEM 4. MINE SAFETY DISCLOSURES
Not applicable.
PART II
ITEM 5. | MARKET FOR REGISTRANT'S COMMON EQUITY, RELATED STOCKHOLDER MATTERS AND ISSUER PURCHASES OF EQUITY SECURITIES |
Market Information
Our common stock began trading on the New York Stock Exchange under the symbol “CRCM” on January 24, 2014. The closing price on February 26, 2016 was $6.09. The following table sets forth the high and low sales prices per share for our Common Stock on the New York Stock Exchange for the indicated periods.
Fiscal 2015 | Fiscal 2014 | ||||||||||||||
High | Low | High | Low | ||||||||||||
First Quarter | $ | 8.50 | $ | 6.50 | $ | 29.25 | $ | 15.02 | |||||||
Second Quarter | $ | 8.00 | $ | 5.66 | $ | 18.37 | $ | 9.57 | |||||||
Third Quarter | $ | 6.79 | $ | 4.89 | $ | 13.12 | $ | 8.00 | |||||||
Fourth Quarter | $ | 7.49 | $ | 5.00 | $ | 9.46 | $ | 7.29 | |||||||
Holders
As of February 26, 2016 there were 63 holders of record of shares of our common stock. Because many of our shares of common stock are held by brokers and other institutions on behalf of stockholders, we are unable to estimate the total number of stockholders represented by these record holders.
Dividend Policy
There were no cash dividends paid on any of our classes of equity during the past two fiscal years. Our board of directors does not currently intend to pay regular dividends on our common stock. We anticipate that we will retain any future earnings for use in the development of our business and for general corporate purposes. Any determination to pay dividends in the future will be at the discretion of our board of directors.
Use of Proceeds from our Initial Public Offering
On January 29, 2014, we closed our initial public offering of our common stock, or IPO, in which we sold 6,152,500 shares of common stock at a price to the public of $17.00 per share. The aggregate offering price for shares sold in the offering was approximately $104.6 million. The offer and sale of all of the shares in the IPO were registered under the Securities Act pursuant to a registration statement on Form S-1 (File No. 333-192791), which was declared effective by the SEC on January 23, 2014. The offering commenced as of January 23, 2014 and did not terminate before all of the securities registered in the registration statement were sold.
30
Morgan Stanley & Co. LLC, Merrill Lynch, Pierce, Fenner and Smith Incorporated and J.P. Morgan Securities LLC acted as the underwriters. We raised approximately $94.8 million in net proceeds after deducting underwriting discounts and commissions of approximately $7.3 million and other offering expenses of approximately $2.4 million. No payments were made by us to directors, officers or persons owning ten percent or more of our common stock or to their associates, or to our affiliates, other than payments in the ordinary course of business to officers for salaries. The proceeds from the IPO have been used for working capital, sales and marketing activities, acquisitions, as well as other general corporate purposes.
Performance Graph
The following performance graph and related information shall not be deemed “soliciting material” or to be “filed” with the Securities Exchange Commission nor shall any such information be incorporated by reference into any future filing under the Securities Act of 1933 or the Exchange Act of 1934, each as amended, except to the extent that we specifically incorporate it by reference into such filing.
The following graph compares the cumulative total return of our common stock during the period commencing January 24, 2014 (the date our common stock began trading on the NYSE) to December 26, 2015, with the Russell 2000 Index and the NASDAQ Internet Index. The graph depicts the results of investing $100 in our common stock, the Russell 2000 Index and the NASDAQ Internet Index at closing prices on January 24, 2014 and assumes, with respect to the Russell 2000 Index and the NASDAQ Internet Index, that all dividends were reinvested. We did not declare or pay any cash dividends on our stock. Such returns are based on historical results and are not intended to suggest future performance.
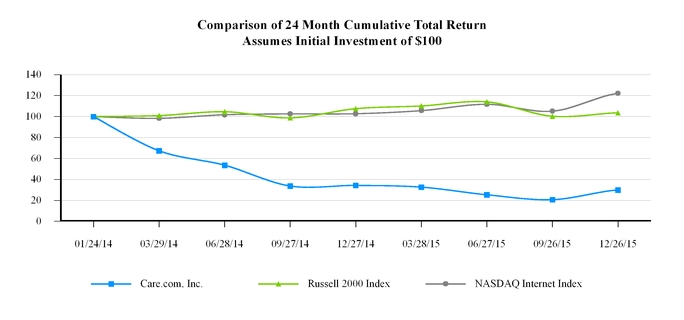
ITEM 6. SELECTED CONSOLIDATED FINANCIAL DATA
The following selected historical consolidated financial data below should be read in conjunction with Item 7, ‘‘Management’s Discussion and Analysis of Financial Condition and Results of Operations,’’ our consolidated financial statements, the related notes appearing in Item 8 “Consolidated Financial Statements and Supporting Data” of this Annual Report on Form 10-K to fully understand factors that may affect the comparability of the information presented below. The selected consolidated financial data in this section are not intended to replace the consolidated financial statements and are qualified in their entirety by the consolidated financial statements and related notes included in this Annual Report on Form 10-K.
The consolidated statements of operations for the fiscal years ended and as of December 26, 2015, December 27, 2014, and December 28, 2013 and the consolidated balance sheets as of December 26, 2015 and December 27, 2014, are derived from our audited consolidated financial statements appearing in Item 8 “Consolidated Financial Statements and Supplementary Data” of this Annual Report on Form 10-K. The selected statement of operations data for fiscal 2012 and 2011, and selected balance sheet data for fiscal 2013 and 2012, are derived from our audited consolidated financial statements not included in this report. In addition, during the fourth quarter of fiscal 2015 we substantially completed our plan to exit the Citrus Lane business. As
31
such, all assets, liabilities, and results of operations have been reclassified to discontinued operations for all periods presented. See Note 4, “Discontinued Operations” in the Notes to Consolidated Financial Statements for more information.
Our historical results are not necessarily indicative of the results to be expected in the future (in thousands, except per share data and revenue per paying family and caregiver):
Fiscal Year Ended | |||||||||||||||||||
December 26, 2015 | December 27, 2014(1) | December 28, 2013 | December 31, 2012(2) | December 31, 2011 | |||||||||||||||
Revenue | $ | 138,681 | $ | 110,712 | $ | 81,487 | $ | 48,493 | $ | 26,006 | |||||||||
Cost of revenue | 26,117 | 23,464 | 18,844 | 10,210 | 6,225 | ||||||||||||||
Operating expenses: | |||||||||||||||||||
Selling and marketing | 73,521 | 73,799 | 55,250 | 35,916 | 22,480 | ||||||||||||||
Research and development | 19,801 | 16,216 | 11,816 | 7,662 | 4,639 | ||||||||||||||
General and administrative | 30,158 | 27,325 | 18,841 | 13,671 | 4,621 | ||||||||||||||
Depreciation and amortization | 4,503 | 4,363 | 4,387 | 1,724 | 173 | ||||||||||||||
Total operating expenses | 127,983 | 121,703 | 90,294 | 58,973 | 31,913 | ||||||||||||||
Operating loss | (15,419 | ) | (34,455 | ) | (27,651 | ) | (20,690 | ) | (12,132 | ) | |||||||||
Other expense, net | (1,239 | ) | (3,856 | ) | (291 | ) | (47 | ) | (20 | ) | |||||||||
Loss from continuing operations before income taxes | (16,658 | ) | (38,311 | ) | (27,942 | ) | (20,737 | ) | (12,152 | ) | |||||||||
Provision for (Benefit from) income taxes | 1,221 | (752 | ) | 354 | (317 | ) | — | ||||||||||||
Loss from continuing operations | (17,879 | ) | (37,559 | ) | (28,296 | ) | (20,420 | ) | (12,152 | ) | |||||||||
Loss from discontinued operations, net of tax | (17,116 | ) | (42,733 | ) | — | — | — | ||||||||||||
Net loss | (34,995 | ) | (80,292 | ) | (28,296 | ) | (20,420 | ) | (12,152 | ) | |||||||||
Accretion of preferred stock | — | (4 | ) | (57 | ) | (48 | ) | (41 | ) | ||||||||||
Net loss attributable to common stockholders | $ | (34,995 | ) | $ | (80,296 | ) | $ | (28,353 | ) | $ | (20,468 | ) | $ | (12,193 | ) | ||||
Net loss per share attributable to common stockholders (Basic and Diluted): | |||||||||||||||||||
Loss from continuing operations | $ | (0.56 | ) | $ | (1.30 | ) | $ | (9.45 | ) | $ | (7.97 | ) | $ | (5.57 | ) | ||||
Loss from discontinued operations | (0.53 | ) | $ | (1.47 | ) | $ | — | — | — | ||||||||||
Net loss per share | $ | (1.09 | ) | $ | (2.77 | ) | $ | (9.45 | ) | $ | (7.97 | ) | $ | (5.57 | ) | ||||
Weighted-average shares used to compute net loss per share attributable to common stockholders: | |||||||||||||||||||
Basic and diluted | 32,001 | 28,941 | 3,000 | 2,568 | 2,188 | ||||||||||||||
32
Fiscal Year Ended | |||||||||||||||||||
December 26, 2015 | December 27, 2014(1) | December 28, 2013 | December 31, 2012(2) | December 31, 2011 | |||||||||||||||
Other Financial and Operational Data: | |||||||||||||||||||
Adjusted EBITDA (4) | $ | (5,032 | ) | $ | (21,106 | ) | $ | (17,199 | ) | $ | (15,511 | ) | $ | (11,431 | ) | ||||
Total members | 18,377 | 13,788 | 9,744 | 6,678 | 3,635 | ||||||||||||||
Total families | 10,265 | 7,612 | 5,281 | 3,509 | 1,706 | ||||||||||||||
Total caregivers | 8,112 | 6,176 | 4,463 | 3,169 | 1,929 | ||||||||||||||
(1) The results of operations for Citrus Lane, Inc. have been included in our consolidated financial statements since the date of acquisition on July 17, 2014 and are presented within discontinued operations. | |||||||||||||||||||
(2) The results of operations for Care.com Europe have been included in our consolidated financial statements since the date of acquisition on July 5, 2012. The results of operations for Breedlove & Associates, L.L.C., or Breedlove, have been included in our consolidated financial statements since the date of acquisition on August 3, 2012. The results of operations for Care Concierge, Inc. have been included in our consolidated financial statements since the date of acquisition on December 31, 2012. | |||||||||||||||||||
(3) Stock-based compensation included in the statements of operations data above was as follows (in thousands): | |||||||||||||||||||
Fiscal Year Ended | |||||||||||||||||||
December 26, 2015 | December 27, 2014 | December 28, 2013 | December 31, 2012 | December 31, 2011 | |||||||||||||||
Cost of revenue | $ | 236 | $ | 156 | $ | 161 | $ | 159 | $ | 20 | |||||||||
Selling and marketing | 813 | 582 | 348 | 369 | 264 | ||||||||||||||
Research and development | 760 | 437 | 356 | 213 | 70 | ||||||||||||||
General and administrative | 3,116 | 2,704 | 997 | 1,211 | 174 | ||||||||||||||
Loss from discontinued operations | 589 | 1,926 | — | — | — | ||||||||||||||
Total | $ | 5,514 | $ | 5,805 | $ | 1,862 | $ | 1,952 | $ | 528 | |||||||||
(4) Adjusted EBITDA is a non-GAAP measure. We define adjusted EBITDA as net loss from continuing operations, plus: federal, state and franchise taxes, other expense, net, depreciation and amortization, stock-based compensation, accretion of contingent consideration, merger and acquisition related costs and other unusual or non-cash significant adjustments. Please see ‘‘Adjusted EBITDA’’ below for more information and for a reconciliation of adjusted EBITDA to net loss from continuing operations, the most directly comparable financial measure calculated and presented in accordance with U.S. generally accepted accounting principles, or GAAP. | |||||||||||||||||||
As of | |||||||||||||||||||
December 26, 2015 | December 27, 2014 | December 28, 2013 | December 31, 2012 | December 31, 2011 | |||||||||||||||
Consolidated Balance Sheet Data: | |||||||||||||||||||
Cash and cash equivalents | $ | 61,240 | $ | 71,881 | $ | 29,959 | $ | 44,776 | $ | 35,663 | |||||||||
Working capital | 24,060 | 43,834 | 13,201 | 39,688 | 31,445 | ||||||||||||||
Total assets | 142,478 | 173,104 | 113,829 | 129,402 | 37,444 | ||||||||||||||
Total deferred revenue | 13,435 | 11,472 | 8,304 | 5,102 | 2,408 | ||||||||||||||
Total non-current liabilities | 7,306 | 12,828 | 7,063 | 11,020 | 414 | ||||||||||||||
Redeemable convertible preferred stock | — | — | 152,251 | 152,194 | 61,078 | ||||||||||||||
Total stockholders' equity (deficit) | 88,252 | 118,050 | (68,306 | ) | (43,442 | ) | (29,238 | ) | |||||||||||
Adjusted EBITDA
To provide investors with additional information regarding our financial results, we have disclosed in the table above and within this Annual Report on Form 10-K adjusted EBITDA, a non-GAAP financial measure. The table below represents a reconciliation of adjusted EBITDA to net loss, the most directly comparable GAAP financial measure.
33
We have included adjusted EBITDA in this Annual Report on Form 10-K because it is a key measure used by our management and board of directors to understand and evaluate our consolidated operating performance and trends, to prepare and approve our annual budget and to develop short- and long-term operational plans. In particular, the exclusion of certain expenses in calculating adjusted EBITDA can provide a useful measure for period-to-period comparisons of our business.
Accordingly, we believe that adjusted EBITDA provides useful information to investors and others in understanding and evaluating our operating results in the same manner as our management and board of directors.
Our use of adjusted EBITDA has limitations as an analytical tool, and you should not consider it in isolation or as a substitute for analysis of our results as reported under GAAP. Some of these limitations are:
• although depreciation and amortization are non-cash charges, the assets being depreciated and amortized may have to be replaced in the future, and adjusted EBITDA does not reflect cash capital expenditure requirements for such replacements or for new capital expenditure requirements;
• adjusted EBITDA does not reflect discontinued operations;
• adjusted EBITDA does not reflect changes in, or cash requirements for, our working capital needs;
• adjusted EBITDA does not consider the potentially dilutive impact of equity-based compensation;
• adjusted EBITDA does not reflect tax payments that may represent a reduction in cash available to us; and
• other companies, including companies in our industry, may calculate adjusted EBITDA differently, which reduces its usefulness as a comparative measure.
Because of these limitations, you should consider adjusted EBITDA alongside other financial performance measures, including various cash flow metrics, net loss, and our other GAAP results. The following table presents a reconciliation of adjusted EBITDA for each of the periods indicated (in thousands):
Fiscal Year Ended | |||||||||||
December 26, 2015 | December 27, 2014 | December 28, 2013 | |||||||||
Net loss from continuing operations | $ | (17,879 | ) | $ | (37,559 | ) | $ | (28,296 | ) | ||
Federal, state and franchise taxes | 1,411 | (468 | ) | 376 | |||||||
Other expense, net | 1,239 | 3,856 | 291 | ||||||||
Depreciation and amortization | 5,218 | 5,128 | 6,702 | ||||||||
EBITDA | (10,011 | ) | (29,043 | ) | (20,927 | ) | |||||
Stock-based compensation | 4,926 | 3,879 | 1,862 | ||||||||
Accretion of contingent consideration | — | 302 | 561 | ||||||||
Non-cash rent expense | — | 948 | — | ||||||||
Merger and acquisition related costs | 53 | 2,644 | — | ||||||||
IPO related costs | — | 164 | 1,305 | ||||||||
Adjusted EBITDA | $ | (5,032 | ) | $ | (21,106 | ) | $ | (17,199 | ) | ||
34
ITEM 7. | MANAGEMENT’S DISCUSSION AND ANALYSIS OF FINANCIAL CONDITION AND RESULTS OF OPERATIONS |
You should read the following discussion and analysis of our financial condition and results of operations together with our consolidated financial statements and the related notes thereto included in Item 8 “Financial Statements and Supplementary Data” of this Annual Report on Form 10-K. In addition to historical information, this discussion contains forward-looking statements that involve risks and uncertainties. You should read Item 1A “Risk Factors” of this report for a discussion of important factors that could cause actual results to differ materially from our expectations.
Overview
We are the world’s largest online marketplace for finding and managing family care. We have 18.4 million members, including 10.3 million families and 8.1 million caregivers, spanning 16 countries. We help families address their particular lifecycle of care needs, which includes child care, senior care, special needs care and other non-medical family care needs such as pet care, tutoring and housekeeping. In the process, we also help caregivers find rewarding full-time and part-time employment opportunities.
Our consumer matching solutions allow families to search for, qualify, vet, connect with and ultimately select caregivers in a low-cost, reliable and easy way. We also provide caregivers with solutions to create personal profiles, describe their unique skills and experience, and otherwise differentiate and market themselves in a highly fragmented marketplace.
In addition to our consumer matching solutions, we offer our members innovative products and services to facilitate their interaction with caregivers. We provide solutions intended to improve both the ease and reliability of the care relationship in the home. One product area we are particularly focused on is payments solutions. Through Care.com HomePay, families can subscribe to payroll and tax preparation services for domestic employees. This offering deepens our relationship with our members and could enhance the lifetime value associated with each member.
We also serve employers by providing access to certain of our products and services to employer-sponsored families. In addition, we serve care-related businesses—such as day care centers, nanny agencies and home care agencies—who wish to market their services to our care-seeking families and recruit our caregiver members. These businesses improve our member experience by providing additional caregiving choices for families and employment opportunities for caregivers.
In July 2014, we completed our Citrus Lane acquisition, adding social commerce capabilities to our platform, including the sales of curated products designed for families. Citrus Lane generates revenue through the sale of subscriptions and other products to customers in the United States. During the second half of fiscal 2015, we made the decision to exit the Citrus Lane business. As a result, all operations have been presented in discontinued operations.
We have experienced steady growth in revenue and members. Our members increased to 18.4 million as of December 26, 2015 from 13.8 million as of December 27, 2014, representing a 33% annual growth rate. Our revenue has increased to $138.7 million for the fiscal year ended December 26, 2015 from $110.7 million for the fiscal year ended December 27, 2014. We experienced net losses from continuing operations of $17.9 million and $37.6 million in fiscal 2015 and fiscal 2014, respectively, and net losses from discontinued operations of $17.1 million and $42.7 million in fiscal 2015 and fiscal 2014, respectively.
In January 2014, we sold 6.2 million shares of our common stock at a price of $17.00 per share resulting in net proceeds of $94.8 million.
35
Key Business Metrics
In addition to traditional financial and operational metrics, we use the following business metrics to monitor and evaluate results (in thousands, except monthly average revenue per paying member - U.S. Consumer Business):
Fiscal Year Ended | |||||||||||
December 26, 2015 | December 27, 2014 | December 28, 2013 | |||||||||
Total members | 18,377 | 13,788 | 9,744 | ||||||||
Total families | 10,265 | 7,612 | 5,281 | ||||||||
Total caregivers | 8,112 | 6,176 | 4,463 | ||||||||
* Paying members - U.S. Consumer Business | 266 | 222 | 174 | ||||||||
* Monthly average revenue per member - U.S. Consumer Business | $ | 39 | $ | 39 | $ | 38 | |||||
_________________________________
* We have changed the business metrics we use to monitor and evaluate our results. We believe that these metrics better reflect the underlying trends in our U.S. Consumer Business.
Total Members. We define total members as the number of paying and non-paying families, including those who have registered through employer programs, and caregivers who have registered through our websites and mobile apps since the launch of our marketplace in 2007, as well as subscribers of our Care.com HomePay. Our total members increased 33% and 42% during the fiscal years ended December 26, 2015 and December 27, 2014, respectively, compared to the corresponding period in the prior fiscal year.
Total Families. We define total families as the number of paying and non-paying families who have registered through our websites and mobile apps, including those who have registered through employer programs, since the launch of our marketplace in 2007, as well as subscribers of our Care.com HomePay. Our total families increased 35% and 44% during the fiscal years ended December 26, 2015 and December 27, 2014, respectively, compared to the corresponding period in the prior fiscal year.
Total Caregivers. We define total caregivers as the number of paying and non-paying caregivers who have registered through our websites and mobile apps since the launch of our marketplace in 2007. Our total caregivers increased 31% and 38% during the fiscal years ended December 26, 2015 and December 27, 2014, respectively, compared to the corresponding period in the prior fiscal year.
Paying Members - U.S. Consumer Business. We define paying members - U.S. Consumer Business as the number of families located in the United States who have registered through our U.S.-based websites and mobile apps and who are paying subscribers of our U.S.-based matching services or our Care.com HomePay services as of the end of the fiscal period. The number of paying members in our U.S. Consumer Business increased 20% and 28% as fiscal year ends December 26, 2015 and December 27, 2014, respectively, compared to the corresponding period in the prior fiscal year.
Monthly Average Revenue per Member - U.S. Consumer Business. We define monthly average revenue per member, or ARPM, for our U.S. Consumer Business as total U.S. Consumer Business revenue, including revenue from subscriptions and products, divided by the average number of paying subscribers of our U.S.-based matching services and Care.com HomePay services in a given fiscal period, expressed on a monthly basis. Our U.S. Consumer Business ARPM increased 1% and 3% during the fiscal years ended December 26, 2015 and December 27, 2014, respectively, compared to the corresponding period in the prior fiscal year.
Factors and Trends of Our Business
We believe that our performance and future success depend upon a number of factors, including our ability to continue to expand our member base, convert basic members to paying members, introduce innovative new products and enhance existing offerings and our infrastructure. Each of these areas presents significant opportunities for us, but also poses significant risks and challenges that we must successfully address. See the section titled ‘‘Risk Factors’’ for a further discussion on these and other risks to our business.
Lifetime Revenue. Our revenue is impacted by a number of factors, including the pricing and mix of our monthly, quarterly and annual subscriptions, our ability to cross-sell our suite of products and services and the total length of time a member subscribes to the various solutions we offer, which we refer to as length of paid time. This includes both initial and reuse subscription periods, which we define as the duration of subscriptions by the same member, which may not necessarily occur consecutively with the member’s initial subscription. Based on historical data, we estimate that the average total length of paid
36
time for a U.S. Consumer Business member is 12.2 months, measured over a four year period. During fiscal 2015, our U.S. Consumer Business ARPM was $39.
Customer Acquisition Costs. We expect to continue to make significant investments to grow our member and enterprise customer bases. Our average cost of acquisition per member and the number of new members we generate depends on a number of factors, including the effectiveness of our marketing campaigns, changes in cost of media, the mix of our media expenditures between television and search advertising, the competitive environment in our markets and publicity about our company. In addition, an increasing percentage of our paying members has come from word-of-mouth referrals, search engine optimization and reuse, reducing our overall per-member customer acquisition cost. Currently, a majority of our marketing expenditures is spent on attracting paying members for our U.S. Consumer Business, and in fiscal 2015, we spent an average of $125 per new subscription. These expenditures included television advertising, search advertising and all other direct marketing expenses.
Impact of Seasonal Demands. We generally experience some seasonality fluctuations in our financial results due to a heightened demand for caregivers at the beginning of a school year and at the beginning of a calendar year. Accordingly, purchases of subscriptions for our consumer matching solutions generally increase in the first and third quarters compared to the second and fourth quarters. Revenue recognition associated with these subscriptions is recognized on a ratable basis over the subscription term, which could result in cash collection and revenue recognition occurring in different fiscal quarters.
Acquisitions. As part of our ongoing growth strategy, we have completed a number of acquisitions since July 2012. Our growth since this time has been significantly affected by these acquisitions. In general, we pursue acquisitions for several reasons, such as acquiring additional products which enhance the user experience of our services and complement our existing business. Our balance sheet includes goodwill of $58.6 million and intangible assets of $3.4 million related to various prior acquisitions. We perform our annual goodwill impairment test annually as of the first day of our fiscal fourth quarter, or more frequently if certain events or circumstances warrant. Events or changes in circumstances that might indicate potential impairment in goodwill include the specific factors described in the Risk Factors section of this Annual Report on Form 10-K, including a decline in stock price and market capitalization, slower growth rates in our industry or our own operations, and/or other materially adverse events that have implications on the profitability of our business.
During fiscal 2014 in connection with our annual impairment analysis we recorded $36.2 million of impairment charges related to goodwill and intangible assets from our acquisition of Citrus Lane. Additionally, during the second half of fiscal 2015, we determined that we should consider the advisability of a sale or wind-down of the Citrus Lane business. As a result of this determination, we concluded that indicators of impairment existed in the Citrus Lane business and performed an analysis of whether any material impairment charges would be required. As a result of this analysis we recorded $9.7 million of impairment charges related to goodwill and intangible assets. Both of these charges are included within discontinued operations on our Consolidated Statements of Operations. Management continues to evaluate and monitor all key factors impacting the carrying value of our recorded goodwill, as well as other long lived assets. Adverse changes in our expected operating results, market capitalization, business climate, or other negative events could result in a material non-cash impairment charge in the future.
Financial Operations Overview
Revenue
We generate revenue primarily through (a) subscription fees to our suite of products and services, which enable families to manage their diverse and evolving care needs and caregivers to describe their unique skills and experience, and otherwise differentiate and market themselves in a highly fragmented marketplace; and (b) annual contracts with corporate employers - providing access to our suite of products and services as an employee benefit and through contractual obligations with businesses to recruit employees and advertise their business profiles. Substantially all of our revenue earned is recognized on a ratable basis over the period the service is provided, with the exception of revenue from background checks, which is recognized when the services are delivered to the end customer.
The following are our sources of revenue:
U.S. Consumer Business
Our U.S. Consumer Business consists of our U.S. matching solutions and our payments solutions.
37
Our U.S. matching solutions provide families access to job posting features, search features, caregiver profiles and content and are offered directly to consumers. Access to this platform is free of charge for basic members. Paying family members pay a monthly, quarterly or annual subscription fee to connect directly with caregivers and to utilize enhanced tools such as third-party background checks. Paying caregiver members pay a subscription fee for priority notification of jobs, messaging services and to perform third-party background checks on themselves. Subscription payments are received from all paying members at the time of sign-up and are recognized on a daily basis over the subscription term as the services are delivered once the revenue recognition criteria are met (see ‘‘Critical Accounting Policies and Estimates’’ for a description of the revenue recognition criteria).
Our payments solutions provide families several options to manage their financial relationship with their caregiver through the use of household employer payroll and tax services. Revenue related to Care.com HomePay, our household payroll and tax service, is primarily generated through quarterly subscriptions and recognized on a daily ratable basis over the period the services are provided.
Other Revenue
Other revenue includes revenue generated from international markets. This revenue is typically recognized on a daily basis over the term of a member’s subscription. Other revenue also includes revenue generated through contracts that provide corporate employers access to certain of our products and services. This product offering is typically sold through the use of an annual contract with an automatic renewal clause. Revenue related to this offering is recognized on a daily basis over the subscription term. Additionally, we generate revenue through our marketing solutions offering, which is designed to provide care-related businesses an efficient and cost-effective way to target qualified families seeking care services, and through our recruiting solutions offering, which allows care-related businesses to recruit caregivers for full-time and part-time employment. Revenue related to these product offerings is typically recognized in the period earned.
Cost of Revenue and Operating Expenses
Cost of Revenue. Our cost of revenue primarily consists of expenses that are directly related, or closely correlated, to revenue generation, including matching and payments member variable servicing costs such as personnel costs for customer support, transaction fees related to credit card payments and the cost of background checks run on both families and caregivers. Additionally, cost of revenue includes website hosting fees and amortization expense related to caregiver relationships, proprietary software acquired as part of acquisitions and website intangible assets. We currently expect cost of revenue to increase on an absolute basis in the near term as we continue to expand our related customer base.
Selling and Marketing. Our selling and marketing expenses primarily consist of customer acquisition marketing, including television advertising, branding, other advertising and public relations costs, as well as allocated facilities and other supporting overhead costs. In addition, sales and marketing expenses include salaries, benefits, stock-based compensation, travel expense and incentive compensation for our sales and marketing employees. We plan to continue to invest in sales and marketing to grow our current customer base, continue building brand awareness, and expand our global footprint. In the near term, we expect sales and marketing expenses to increase on an absolute basis and to be our largest expense on an absolute basis but decline as a percentage of revenue.
Research and Development. Our research and development expenses primarily consist of salaries, benefits and stock-based compensation for our engineers, product managers and developers. In addition, product development expenses include third-party resources, as well as allocated facilities and other supporting overhead costs. We believe that continued investment in features, software development tools and code modification is important to attaining our strategic objectives and, as a result, we expect product development expense to increase on an absolute basis in the near term.
General and Administrative. Our general and administrative expenses primarily consist of salaries, benefits and stock-based compensation for our executive, finance, legal, information technology, human resources and other administrative employees. In addition, general and administrative expenses include: third-party resources; legal and accounting services; acquisition-related costs; and facilities. We expect that our general and administrative expenses will increase on an absolute basis in the near term as we continue to expand our business to support our operations as a publicly traded company, including expenses related to audit, legal, regulatory and tax-related services associated with maintaining compliance with exchange listing and Securities and Exchange Commission requirements, director and officer insurance premiums and investor relations costs.
Depreciation and Amortization. Depreciation and amortization expenses primarily consist of depreciation of computer equipment, software and leasehold improvements and amortization of acquired intangibles. We expect that depreciation and amortization expenses will increase on an absolute basis as we continue to expand our technology infrastructure.
38
Other Expense, Net. Other expense, net consists primarily of the interest income earned on our cash and cash equivalents, restricted cash and investments, net of changes in the fair value of redeemable convertible preferred stock warrants, changes in the fair value of contingent consideration payable in preferred stock and foreign exchange gains and losses.
Provision for (Benefit From) Income Taxes. Provision for (Benefit from) income taxes consists of federal and state income taxes in the United States and income taxes in certain foreign jurisdictions.
Discontinued Operations
We report the results of operations of a component of our company that either has been exited, disposed of, or held for sale in discontinued operations. We present such events as discontinued operations so long as the financial results can be clearly identified, the future operations and cash flows are completely eliminated from ongoing operations, and so long as we do not have any significant continuing involvement in the operations of the component after the disposal or termination transaction.
Results of Operations
The following table sets forth our consolidated results of operations for the periods presented. The period-to-period comparison of financial results is not necessarily indicative of future results (in thousands, except per share data):
Fiscal Year Ended | |||||||||||
December 26, 2015 | December 27, 2014 | December 28, 2013 | |||||||||
Revenue | $ | 138,681 | $ | 110,712 | $ | 81,487 | |||||
Cost of revenue | 26,117 | 23,464 | 18,844 | ||||||||
Operating expenses: | |||||||||||
Selling and marketing | 73,521 | 73,799 | 55,250 | ||||||||
Research and development | 19,801 | 16,216 | 11,816 | ||||||||
General and administrative | 30,158 | 27,325 | 18,841 | ||||||||
Depreciation and amortization | 4,503 | 4,363 | 4,387 | ||||||||
Total operating expenses | 127,983 | 121,703 | 90,294 | ||||||||
Operating loss | (15,419 | ) | (34,455 | ) | (27,651 | ) | |||||
Other expense, net | (1,239 | ) | (3,856 | ) | (291 | ) | |||||
Loss from continuing operations before income taxes | (16,658 | ) | (38,311 | ) | (27,942 | ) | |||||
Provision for (benefit from) income taxes | 1,221 | (752 | ) | 354 | |||||||
Loss from continuing operations | (17,879 | ) | (37,559 | ) | (28,296 | ) | |||||
Loss from discontinued operations, net of tax | (17,116 | ) | (42,733 | ) | — | ||||||
Net loss | (34,995 | ) | (80,292 | ) | (28,296 | ) | |||||
Accretion of preferred stock | — | (4 | ) | (57 | ) | ||||||
Net loss attributable to common stockholders | $ | (34,995 | ) | $ | (80,296 | ) | $ | (28,353 | ) | ||
Net loss per share attributable to common stockholders (Basic and Diluted): | |||||||||||
Loss from continuing operations | $ | (0.56 | ) | $ | (1.30 | ) | $ | (9.45 | ) | ||
Loss from discontinued operations | (0.53 | ) | (1.47 | ) | — | ||||||
Net loss per share | $ | (1.09 | ) | $ | (2.77 | ) | $ | (9.45 | ) | ||
Weighted-average shares used to compute net loss per share attributable to common stockholders: | |||||||||||
Basic and diluted | 32,001 | 28,941 | 3,000 | ||||||||
Stock-based compensation included in the results of operations data above was as follows (in thousands):
39
Fiscal Year Ended | |||||||||||
December 26, 2015 | December 27, 2014 | December 28, 2013 | |||||||||
Cost of revenue | $ | 236 | $ | 156 | $ | 161 | |||||
Selling and marketing | 813 | 582 | 348 | ||||||||
Research and development | 760 | 437 | 356 | ||||||||
General and administrative | 3,116 | 2,704 | 997 | ||||||||
Loss from discontinued operations | 589 | 1,926 | — | ||||||||
The following tables set forth our consolidated results of operations for the periods presented as a percentage of revenue for those periods (certain items may not foot due to rounding).
Fiscal Year Ended | ||||||||
December 26, 2015 | December 27, 2014 | December 28, 2013 | ||||||
Revenue | 100 | % | 100 | % | 100 | % | ||
Cost of revenue | 19 | % | 21 | % | 23 | % | ||
Operating expenses: | ||||||||
Selling and marketing | 53 | % | 67 | % | 68 | % | ||
Research and development | 14 | % | 15 | % | 15 | % | ||
General and administrative | 22 | % | 25 | % | 23 | % | ||
Depreciation and amortization | 3 | % | 4 | % | 5 | % | ||
Total operating expenses | 92 | % | 110 | % | 111 | % | ||
Operating loss | (11 | )% | (31 | )% | (34 | )% | ||
Other expense, net | (1 | )% | (3 | )% | — | % | ||
Loss from continuing operations before income taxes | (12 | )% | (35 | )% | (34 | )% | ||
Provision for (Benefit from) income taxes | 1 | % | (1 | )% | — | % | ||
Loss from continuing operations | (13 | )% | (34 | )% | (35 | )% | ||
Loss from discontinued operations, net of tax | (12 | )% | (39 | )% | — | % | ||
Net loss | (25 | )% | (73 | )% | (35 | )% | ||
Revenue
Fiscal Year Ended | Fiscal 2015 Compared to Fiscal 2014 | Fiscal 2014 Compared to Fiscal 2013 | |||||||||||||||||||||||
December 26, 2015 | December 27, 2014 | December 28, 2013 | $ Change | % Change | $ Change | % Change | |||||||||||||||||||
(in thousands, except percentages) | |||||||||||||||||||||||||
Revenue | $ | 138,681 | $ | 110,712 | $ | 81,487 | $ | 27,969 | 25 | % | $ | 29,225 | 36 | % | |||||||||||
Fiscal 2015 Compared to Fiscal 2014
The change was primarily attributed to an $18.2 million increase in our consumer matching business, principally related to a higher number of paying members, and higher average revenue per paying member. Additionally, there was an increase in consumer payment solutions, background checks, and Care@Work of $3.8 million, $3.2 million, and $1.9 million respectively.
Fiscal 2014 Compared to Fiscal 2013
40
The change was primarily attributed to a $19.0 million increase in our consumer matching business, principally related to a higher number of paying members, and higher average revenue per paying member driven by a longer average length of paying subscriptions and growth in non-subscription products. Furthermore, there was an increase in consumer payment solutions and background checks revenue of $3.7 million and $2.1 million, respectively.
Cost of Revenue
Fiscal Year Ended | Fiscal 2015 Compared to Fiscal 2014 | Fiscal 2014 Compared to Fiscal 2013 | |||||||||||||||||||||||
December 26, 2015 | December 27, 2014 | December 28, 2013 | $ Change | % Change | $ Change | % Change | |||||||||||||||||||
(in thousands, except percentages) | |||||||||||||||||||||||||
Cost of revenue | $ | 26,117 | $ | 23,464 | $ | 18,844 | $ | 2,653 | 11 | % | $ | 4,620 | 25 | % | |||||||||||
Percentage of revenue | 19 | % | 21 | % | 23 | % | |||||||||||||||||||
Fiscal 2015 Compared to Fiscal 2014
The change was primarily related to higher member servicing costs and background check screening fees of $1.9 million, increased compensation and related costs of $0.4 million, and to a lesser extent, increased hosting and credit card fees of $0.2 million and $0.2 million, respectively. The increase in credit card fees was in line with our overall increase in subscription revenue.
Fiscal 2014 Compared to Fiscal 2013
The change was primarily related to higher compensation and related expenses of $1.3 million due to expanded headcount to meet the demand associated with our larger network of members and expanded product offerings. We also incurred higher costs related to increased expenditures for hosting costs, background checks and credit card processing fees of $0.9 million, $0.7 million and $0.7 million, respectively, partially offset by lower costs related to the amortization of technology intangible assets with useful lives that ended during fiscal 2013.
Selling and Marketing
Fiscal Year Ended | Fiscal 2015 Compared to Fiscal 2014 | Fiscal 2014 Compared to Fiscal 2013 | |||||||||||||||||||||||
December 26, 2015 | December 27, 2014 | December 28, 2013 | $ Change | % Change | $ Change | % Change | |||||||||||||||||||
(in thousands, except percentages) | |||||||||||||||||||||||||
Selling and marketing | $ | 73,521 | $ | 73,799 | $ | 55,250 | $ | (278 | ) | — | % | $ | 18,549 | 34 | % | ||||||||||
Percentage of revenue | 53 | % | 67 | % | 68 | % | |||||||||||||||||||
Fiscal 2015 Compared to Fiscal 2014
The change principally related to a decrease in spending on customer acquisition marketing of $4.0 million, partially offset by higher compensation and related costs of $2.9 million.
Fiscal 2014 Compared to Fiscal 2013
The change principally related to higher spending on customer acquisition marketing of $14.7 million, of which $7.1 million was related to increased television advertising, on our consumer matching and payments businesses. Additionally, there was an increase of $2.5 million in compensation and related expenses. Furthermore, there was a $1.0 million increase primarily related to caregiver acquisition costs.
41
Research and Development
Fiscal Year Ended | Fiscal 2015 Compared to Fiscal 2014 | Fiscal 2014 Compared to Fiscal 2013 | |||||||||||||||||||||||
December 26, 2015 | December 27, 2014 | December 28, 2013 | $ Change | % Change | $ Change | % Change | |||||||||||||||||||
(in thousands, except percentages) | |||||||||||||||||||||||||
Research and development | $ | 19,801 | $ | 16,216 | $ | 11,816 | $ | 3,585 | 22 | % | $ | 4,400 | 37 | % | |||||||||||
Percentage of revenue | 14 | % | 15 | % | 15 | % | |||||||||||||||||||
Fiscal 2015 Compared to Fiscal 2014
The change was primarily related to higher compensation and related expenses of $2.8 million, as well as increased spending related to third-party resources of $0.5 million. The increase in both headcount and third-party resources was the result of our focus on developing new features and products, including work on our mobile applications, to encourage member growth and engagement.
Fiscal 2014 Compared to Fiscal 2013
The change was primarily related to higher compensation and related expenses of $2.7 million, largely due to an increase in headcount. Additionally, there was increased spending related to third-party resources of $1.2 million. The increase in both headcount and third-party resources was the result of our focus on developing new features and products, including work on our mobile applications and our international platform, to encourage member growth and engagement.
General and Administrative
Fiscal Year Ended | Fiscal 2015 Compared to Fiscal 2014 | Fiscal 2014 Compared to Fiscal 2013 | |||||||||||||||||||||||
December 26, 2015 | December 27, 2014 | December 28, 2013 | $ Change | % Change | $ Change | % Change | |||||||||||||||||||
(in thousands, except percentages) | |||||||||||||||||||||||||
General and administrative | $ | 30,158 | $ | 27,325 | $ | 18,841 | $ | 2,833 | 10 | % | $ | 8,484 | 45 | % | |||||||||||
Percentage of revenue | 22 | % | 25 | % | 23 | % | |||||||||||||||||||
Fiscal 2015 Compared to Fiscal 2014
The change was primarily related to higher compensation related expenses of $3.1 million primarily due to incentive compensation, an increase in occupancy costs of $1.1 million, and to a lesser extent, an increase in bad debt expenses of $0.6 million. These were partially offset by reductions in third-party resources, employee training, and hosted applications of $1.7 million, $0.3 million, and $0.3 million, respectively.
Fiscal 2014 Compared to Fiscal 2013
The change was primarily related to higher compensation related expenses of $2.7 million as a result of increased headcount. Additionally, there was increased spending on third-party resources of $2.3 million, $1.4 million in software subscriptions as we transition to a more robust ERP system to sustain growth, as well as recruiting and legal fees of $1.2 million and $0.9 million, respectively. Furthermore, insurance increased by $0.8 million as a result of additional required coverage to meet our obligations as a public company.
42
Depreciation and Amortization
Fiscal Year Ended | Fiscal 2015 Compared to Fiscal 2014 | Fiscal 2014 Compared to Fiscal 2013 | |||||||||||||||||||||||
December 26, 2015 | December 27, 2014 | December 28, 2013 | $ Change | % Change | $ Change | % Change | |||||||||||||||||||
(in thousands, except percentages) | |||||||||||||||||||||||||
Depreciation and amortization | $ | 4,503 | $ | 4,363 | $ | 4,387 | $ | 140 | 3 | % | $ | (24 | ) | (1 | )% | ||||||||||
Percentage of revenue | 3 | % | 4 | % | 5 | % | |||||||||||||||||||
Fiscal 2015 Compared to Fiscal 2014
The change was primarily attributed with the move to our new office space. Over the next five years, we expect to incur total annual amortization expense associated with previous acquisitions of $2.9 million.
Fiscal 2014 Compared to Fiscal 2013
Depreciation and amortization expense was relatively consistent over the applicable measurement periods.
Other Expense, net
Fiscal Year Ended | Fiscal 2015 Compared to Fiscal 2014 | Fiscal 2014 Compared to Fiscal 2013 | |||||||||||||||||||||||
December 26, 2015 | December 27, 2014 | December 28, 2013 | $ Change | % Change | $ Change | % Change | |||||||||||||||||||
(in thousands, except percentages) | |||||||||||||||||||||||||
Other expense, net | $ | (1,239 | ) | $ | (3,856 | ) | $ | (291 | ) | $ | 2,617 | (68 | )% | $ | (3,565 | ) | 1,225 | % | |||||||
Percentage of revenue | (1 | )% | (3 | )% | — | % | |||||||||||||||||||
Fiscal 2015 Compared to Fiscal 2014
The change was primarily driven by the mark-to-market adjustment of $2.9 million related to the change in the fair value of the redeemable convertible preferred stock associated with contingent acquisition consideration and the preferred stock warrants that occurred during the first quarter of fiscal 2014 as a result of the IPO. No such item was recorded in the current period. This was partially offset by $0.3 million from the movement of foreign exchange rates, primarily due to the strengthening of the US dollar against the Euro.
Fiscal 2014 Compared to Fiscal 2013
The change was primarily driven by the mark-to-market adjustment of $2.9 million related to the change in the fair value of redeemable convertible preferred stock associated with contingent acquisition consideration and the preferred stock warrants, as well as changes in foreign currency related to transactions for international entities in denominations other than the functional currency.
Provision for (Benefit From) Income Taxes
Fiscal Year Ended | Fiscal 2015 Compared to Fiscal 2014 | Fiscal 2014 Compared to Fiscal 2013 | ||||||||||||||||||||||
December 26, 2015 | December 27, 2014 | December 28, 2013 | $ Change | % Change | $ Change | % Change | ||||||||||||||||||
(in thousands, except percentages) | ||||||||||||||||||||||||
Provision for (benefit from) income taxes | $ | 1,221 | $ | (752 | ) | $ | 354 | $ | 1,973 | (262 | )% | $ | (1,106 | ) | (312)% | |||||||||
Percentage of revenue | 1 | % | (1 | )% | — | % | ||||||||||||||||||
Fiscal 2015 Compared to Fiscal 2014
Our effective tax rate for the year ended December 26, 2015 was a provision of 7% on a pre-tax loss. The current year tax expense was primarily related to the amortization of certain goodwill for tax purposes for which there is no corresponding book
43
deduction and certain state taxes based on operating income that are payable without regard to our tax loss carry forwards. The tax benefit recorded during fiscal 2014 was a result of a non-recurring benefit from the release of a portion of the valuation allowance due to taxable temporary differences available as a source of income to realize certain pre-existing deferred tax assets as a result of the purchase accounting, partially offset by the amortization of goodwill for tax purposes for which there is no corresponding book deduction, partially offset by the income tax expense related to the amortization of Breedlove goodwill for tax purposes for which there is no corresponding book deduction and certain state taxes based on operating income that are payable without regard to our tax loss carry forwards.
Fiscal 2014 Compared to Fiscal 2013
Our effective tax rate for the year ended December 27, 2014 was a benefit of 2% on a pre-tax loss. The increase was a result of a non-recurring benefit from the release of a portion of the valuation allowance due to taxable temporary differences available as a source of income to realize certain pre-existing deferred tax assets, partially offset by the amortization of goodwill for tax purposes for which there is no corresponding book deduction. Our effective tax rate for the year ended December 28, 2013 was a provision of 1% on a pre-tax loss for the year ended December 28, 2013. Our provision for income taxes in 2013 was primarily comprised of amortization of tax deductible goodwill, which generates a deferred tax liability that cannot be offset by net operating losses or other deferred tax assets since its reversal is considered indefinite in nature and certain state taxes for jurisdictions where taxes are based on a measure other than net pre-tax profit; and partially offset by utilization of foreign net operating losses in jurisdictions with deferred tax liabilities.
Loss from Discontinued Operations, Net of Taxes
Fiscal Year Ended | Fiscal 2015 Compared to Fiscal 2014 | Fiscal 2014 Compared to Fiscal 2013 | |||||||||||||||||||||||
December 26, 2015 | December 27, 2014 | December 28, 2013 | $ Change | % Change | $ Change | % Change | |||||||||||||||||||
(in thousands, except percentages) | |||||||||||||||||||||||||
Loss from discontinued operations, net of tax | $ | (17,116 | ) | $ | (42,733 | ) | $ | — | $ | 25,617 | (60 | )% | $ | (42,733 | ) | 100 | % | ||||||||
Percentage of revenue | (12 | )% | (39 | )% | — | % | |||||||||||||||||||
Fiscal 2015 Compared to Fiscal 2014
The decrease was primarily driven by the impairment charges recognized in fiscal 2014 totaling $36.2 million, as compared to fiscal 2015 impairment charges of $9.7 million, offset by one-time disposal costs of $2.1 million in fiscal 2015.
Fiscal 2014 Compared to Fiscal 2013
The change was driven by the decision to exit the Citrus Lane business.
Liquidity and Capital Resources
The following table summarizes our cash flow activities for the periods indicated (in thousands):
Fiscal Year Ended | |||||||||||
December 26, 2015 | December 27, 2014 | December 28, 2013 | |||||||||
Cash flow provided by (used in): | |||||||||||
Operating activities - Continuing operations | 160 | (20,177 | ) | (12,661 | ) | ||||||
Operating activities - Discontinued operations | (5,124 | ) | (4,107 | ) | — | ||||||
Investing activities - Continuing operations | (4,323 | ) | (6,425 | ) | (1,818 | ) | |||||
Investing activities - Discontinued operations | (2 | ) | (22,844 | ) | — | ||||||
Financing activities | (1,063 | ) | 94,585 | (253 | ) | ||||||
Effect of exchange rates on cash balances | (289 | ) | 890 | (85 | ) | ||||||
(Decrease) increase in cash and cash equivalents | $ | (10,641 | ) | $ | 41,922 | $ | (14,817 | ) | |||
As of December 26, 2015, we had cash and cash equivalents of $61.2 million. Cash equivalents consists of money market funds. Cash held internationally as of December 26, 2015 was $2.3 million. We did not have any short-term or long-term investments. Additionally, we do not have any outstanding bank loans or credit facilities in place. To date, we have been able
44
to finance our operations through proceeds from the public and private sales of equity, including our IPO in January 2014, and to a lesser extent from the exercise of employee stock options. We believe that our existing cash and cash equivalents balance will be sufficient to meet our working capital expenditure requirements for at least the next 12 months. From time to time, we may explore additional financing sources to develop or enhance our services, to fund expansion, to respond to competitive pressures, to acquire or to invest in complementary products, businesses or technologies, or to lower our cost of capital, which could include equity, equity-linked and debt financing. We cannot assure you that any additional financing will be available to us on acceptable terms, if at all.
Operating Activities
Our primary source of cash from operations was from ongoing subscription fees to our consumer matching solutions. We believe that cash inflows from these fees will grow from our continued penetration into the market for care.
Fiscal 2015
Cash from continuing operating activities provided $0.2 million during fiscal 2015. This amount resulted from a net loss from continuing operations of $17.9 million, adjusted for non-cash items of $12.4 million, and a net $5.6 million source of cash due to changes in working capital.
Non-cash expenses within net loss from continuing operations consisted primarily of $5.2 million for depreciation and amortization, $4.9 million of stock-based compensation expense, $1.3 million of foreign currency remeasurement and $1.1 million in changes in deferred tax liabilities.
An increase in both operating liabilities and assets was a net source of $5.6 million of cash within operating activities. The increase in working capital was primarily due to increases in deferred revenue, accrued expenses and other current liabilities, and other non-current liabilities of $2.3 million, $1.9 million and $0.9 million, respectively, combined with a decrease in prepaid expenses and other current assets of $2.1 million. These were partially offset by a decrease in accounts payable of $0.6 million and increases in accounts receivable and unbilled accounts receivable of $0.6 million and $0.3 million, respectively.
Cash used in discontinued operations totaled $5.1 million. This amount resulted from a net loss from discontinued operations of $17.1 million, partially offset by a net $12.0 million source of cash from changes in working capital and non-cash related adjustments, including charges related to the impairment of goodwill and intangible assets of $9.7 million, and contingent consideration accretion expense of $0.9 million.
Fiscal 2014
Cash from continuing operating activities used $20.2 million during fiscal 2014. This amount resulted from a net loss from continuing operations of $37.6 million, adjusted for non-cash items of $11.2 million, and a net $6.2 million source of cash due to increases in operating liabilities, partially offset by increases in operating assets.
Non-cash expenses within net loss consisted primarily of $5.1 million for depreciation and amortization, $3.9 million of stock-based compensation expense, $2.3 million increase in in the fair value of contingent consideration payable in preferred stock, $0.3 million from the accretion of contingent consideration liabilities payable in cash and $0.6 million in the fair value of stock warrants, partially offset by $0.9 million in deferred taxes.
An increase in both operating liabilities and assets contributed $6.2 million to net cash used in operating activities. The cash generated from this change consisted of an increase in deferred revenue of $3.2 million, an increase in accrued expenses and other current liabilities of $2.1 million, an increase in accounts payable of $1.8 million, partially offset by an increase in unbilled accounts receivable of $1.1 million and an increase in accounts receivable of $0.9 million.
Cash used in discontinued operations totaled $4.1 million. This amount resulted from a net loss from discontinued operations of $42.7 million, offset by a net $38.6 million source of cash from changes in working capital and non-cash related adjustments, including charges related to the impairment of goodwill and intangible assets of $36.2 million.
Fiscal 2013
Cash from operating activities used $12.7 million during fiscal 2013. This amount resulted from a net loss of $28.3 million, adjusted for non-cash items of $10.3 million, and a net $5.3 million source of cash due to increases in operating liabilities, partially offset by decreases in operating assets.
Non-cash expenses within net loss consisted primarily of $6.7 million for depreciation and amortization expense, $1.9 million of stock-based compensation expense, $1.3 million of contingent acquisition expense and $0.3 million for deferred income taxes.
An increase in operating liabilities and a decrease in operating assets contributed $5.3 million to net cash used in operating activities. The cash generated from this change consisted of an increase in accrued expenses and other current liabilities of $2.9
45
million, increase in deferred revenue of $2.8 million and an increase in accounts payable of $0.7 million, partially offset by an increase in unbilled accounts receivable of $0.5 million and an increase in prepaid expenses and other assets of $0.5 million.
Investing Activities
Fiscal 2015
During fiscal 2015, we used $4.3 million of cash for investing activities, primarily related to property and equipment purchases related to our new corporate headquarters. We are not currently a party to any material purchase contracts related to future purchases of property and equipment.
Fiscal 2014
During fiscal 2014, we used $6.4 million of cash for investing activities, primarily as a result of $3.0 million related to property and equipment purchases. Additionally, there was a $2.8 million outflow related to the security deposit on our new corporate headquarters as discussed in our “Contractual Obligations” below, and $0.6 million used in the acquisition of Consmr.
Cash used in discontinued operations totaled $22.8 million and was solely related to the acquisition of Citrus Lane.
Fiscal 2013
During fiscal 2013, we used $1.8 million of cash for investing activities. The cash used consisted of $1.4 million, principally related to furniture and fixtures expenditure and $0.4 million used in the acquisition of the assets of the BigTent public groups platform.
Financing Activities
Fiscal 2015
During fiscal 2015, we used $1.1 million of cash related to financing activities. Of this amount, $1.8 million related to payments of contingent consideration previously established in purchase accounting for our HomePay and Care Concierge acquisitions, partially offset by $0.8 million in proceeds from the exercise of common stock options.
Fiscal 2014
During fiscal 2014, we generated $94.6 million of cash related to financing activities. $96.0 million was generated as net proceeds from the issuance of common stock upon the closing of our initial public offering and $0.8 million was generated from the exercise of employee stock options, partially offset by $2.2 million used for payments of contingent consideration previously established in purchase accounting.
Fiscal 2013
During fiscal 2013, we used $0.3 million of cash for financing activities. $1.1 million was used for payments of deferred offering costs, partially offset by $0.8 million cash generated from the exercise of employee stock options.
Off-Balance Sheet Arrangements
We did not have any off-balance sheet arrangements, as defined in Item 303(a)(4)(ii) of Regulation S-K of the Securities and Exchange Commission, in fiscal 2015, 2014 or 2013.
Contractual Obligations
Our contractual obligations relate primarily to non-cancelable operating leases and commitments to make future milestone payments as part of the Citrus Lane acquisitions. For additional information, see Note 3, Business Acquisitions, to our consolidated financial statements included in Item 8 of this Annual Report on Form 10-K.
The following table describes our contractual obligations as of December 26, 2015 (in thousands):
Payments Due by Period | |||||||||||||||||||
Total | Less Than 1 Year | 1-3 Years | 4-5 Years | Thereafter | |||||||||||||||
Operating lease obligations | $ | 43,050 | $ | 4,295 | $ | 8,954 | $ | 9,792 | $ | 20,009 | |||||||||
Contingent obligations | 16,041 | 16,041 | — | — | — | ||||||||||||||
Total contingent obligations | $ | 59,091 | $ | 20,336 | $ | 8,954 | $ | 9,792 | $ | 20,009 | |||||||||
46
In July 2014, we entered into a lease agreement pursuant to which we agreed to lease office space to be used for our new headquarters, or the Prime Lease. The Prime Lease is initially for 36,174 square feet of office space, comprising of the entire sixth floor of the building located at 77 Fourth Avenue, Waltham, Massachusetts, or the Building. The leased premises under the Prime Lease will increase by an additional 36,395 square feet, comprising of the entire fourth floor of the Building, on March 1, 2019 and by an additional 36,174 square feet, comprising of the entire fifth floor of the Building, on April 1, 2019. The term of the Prime Lease commenced on August 4, 2014 and expires 120 months from the date base rent payments first become due, which date is the earlier of January 1, 2015 and the date we commence operations in the space. The total cash obligation for the base rent over the term of the Prime Lease is $34.5 million.
Also in July 2014, we entered into two sublease agreements pursuant to which we agreed to lease the entire fourth and fifth floors of the Building. The term of the fourth floor sublease commenced August 4, 2014 and expires on February 15, 2019, after which the space will be leased by us pursuant to the Prime Lease. The total cash obligation for the base rent over the term of this sublease is $4.3 million. The term of the fifth floor sublease commenced on August 4, 2014 and expires on March 30, 2019, after which the space will be leased by us pursuant to the Prime Lease. The total cash obligation for the base rent over the term of this sublease is $4.1 million. We have the right to extend the term of the lease agreement for one ten-year period.
In addition to the base rent, we will also be required to pay our pro rata share of any building operating expenses and real estate taxes in excess of the amounts allocable to the leased space as of the applicable base years referenced in the Prime Lease and subleases.
In connection with the execution of the Prime Lease, we entered into an amendment to our lease agreement for our previous headquarters pursuant to which that agreement will terminate without penalty on the earlier of (i) ten days after the date we commenced operations under the Prime Lease and (ii) December 31, 2014.
The Jumpstart Our Business Startups Act
On April 5, 2012, the Jumpstart Our Business Startups Act of 2012, or the JOBS Act, was signed into law. The JOBS Act contains provisions that, among other things, reduce certain reporting requirements for an ‘‘emerging growth company.’’ As an ‘‘emerging growth company,’’ we are electing to not take advantage of the extended transition period afforded by the JOBS Act for the implementation of new or revised accounting standards and, as a result, we will comply with new or revised accounting standards on the relevant dates on which adoption of such standards is required for non-emerging growth companies. Section 107 of the JOBS Act provides that our decision to not take advantage of the extended transition period for complying with new or revised accounting standards is irrevocable.
Subject to certain conditions set forth in the JOBS Act, if as an ‘‘emerging growth company’’ we choose to rely on such exemptions, we may not be required to, among other things, (i) provide an auditor’s attestation report on our system of internal control over financial reporting pursuant to Section 404 of the Sarbanes-Oxley Act, (ii) provide all of the compensation disclosure that may be required of non-emerging growth public companies under the Dodd-Frank Wall Street Reform and Consumer Protection Act, (iii) comply with any requirement that may be adopted by the Public Company Accounting Oversight Board regarding mandatory audit firm rotation or a supplement to the auditor’s report providing additional information about the audit and the financial statements (auditor discussion and analysis), or (iv) disclose certain executive compensation-related items such as the correlation between executive compensation and performance and comparisons of our chief executive officer’s compensation to median employee compensation. These exemptions will apply for a period of five years following the completion of our IPO or until we no longer meet the requirements of being an ‘‘emerging growth company,’’ whichever is earlier.
Critical Accounting Policies and Estimates
Our consolidated financial statements are prepared in accordance with U.S. GAAP. The preparation of our consolidated financial statements requires management to make estimates and judgments that affect the reported amounts of assets, liabilities, revenue, expenses and related disclosures. We base our estimates on historical experience and various other assumptions that we believe to be reasonable under the circumstances, the results of which form the basis for making judgments about the carrying values of assets and liabilities that are not readily apparent from other sources. Actual results may differ from these estimates under different assumptions or conditions. We believe that the assumptions and estimates associated with the following critical accounting policies have the greatest potential impact on our consolidated financial statements:
• Revenue recognition;
• Business combinations;
• Goodwill;
47
• Amortization and impairment of intangible assets;
• Income taxes; and
• Stock-based compensation.
For further information on our significant accounting policies, see Note 2, “Summary of Significant Accounting Policies,” in the accompanying notes to the consolidated financial statements.
Revenue Recognition
In general, we recognize revenue when (i) persuasive evidence of an arrangement exists, (ii) delivery has occurred or services have been rendered to the customer, (iii) the fee is fixed or determinable, and (iv) collectability is reasonably assured. We derive our revenue primarily from on-going subscription fees. Revenue from subscription fees is recognized on a daily basis over the subscription term or on a pro-rata basis as the services are delivered. Revenue from background checks, lead generation and advertising is recognized in the period earned. Other service revenues are recognized as the services are performed. Taxes that are collected from customers and remitted to government authorities are presented on a net basis and are excluded from revenue. As it relates to our Citrus Lane business, which is presented within discontinued operations, for product sales, these criteria are deemed to have been met when the items are delivered to the end customer. Shipping and handling charges are included in revenue on a gross basis.
Certain of our arrangements provide companies the opportunity to purchase Care.com services on behalf of their employees. These arrangements typically include a subscription to our consumer matching solutions for their employees. These arrangements are accounted for as multiple element arrangements. We have concluded that each element in the arrangement has stand-alone value as the individual services can be sold separately. In addition, there is no right of refund once a service has been delivered. Therefore, we have concluded each element of the arrangement is a separate unit of accounting. In accordance with authoritative guidance on revenue recognition, we allocate consideration at the inception of an arrangement to each unit of accounting based on the relative selling price method in accordance with the selling price hierarchy. The objective of the hierarchy is to determine the price at which we would transact a sale if the service were sold on a stand-alone basis, and requires the use of: (1) vendor-specific objective evidence, or VSOE, if available; (2) third-party evidence, or TPE, if VSOE is not available; and (3) best estimate of selling price, or BESP, if neither VSOE nor TPE is available. Since VSOE or TPE are not typically available, BESP is generally used to allocate the selling price to each unit of accounting. We determine BESP for units of account by considering multiple factors including, but not limited to, prices we charge for similar offerings, sales volumes, geographies and other factors contemplated in negotiating multiple element transactions.
Business Combinations
We determine and allocate the purchase price of an acquired company to the tangible and intangible assets acquired and liabilities assumed based on their fair values as of the business combination date, including identifiable intangible assets, which either arise from a contractual or legal right or are separable from goodwill. We base the fair value of identifiable intangible assets acquired in a business combination on detailed valuations that use information and assumptions provided by management, which consider management’s best estimates of inputs and assumptions that a market participant would use. We allocate any excess purchase price over the fair value of the net tangible and identifiable intangible assets acquired to goodwill. The use of alternative valuation assumptions, including estimated revenue projections, growth rates, cash flows, discount rates, estimated useful lives and probabilities surrounding the achievement of revenue-based milestones, could result in different purchase price allocations and amortization expense in current and future periods. Transaction costs associated with these acquisitions are expensed as incurred through general and administrative costs.
In those circumstances where an acquisition involves a contingent consideration arrangement, we recognize a liability equal to the fair value of the contingent payments we expect to make as of the acquisition date. We re-measure this liability at each reporting period and record changes in the fair value as a component of operating expenses. Increases or decreases in the fair value of the contingent consideration liability can result from changes in discount periods and rates, as well as changes in the timing and amount of revenue estimates or in the timing or likelihood of achieving revenue-based milestones.
Results of operations and cash flows of acquired companies are included in our operating results from the date of acquisition.
Goodwill
Goodwill is recorded as the difference, if any, between the aggregate consideration paid for an acquisition and the fair value of the net tangible and intangible assets acquired. We evaluate goodwill and indefinite lived intangible assets for impairment at the reporting unit level (operating segment or one level below an operating segment) annually or more frequently if we believe indicators of impairment exist. In accordance with the guidance, we are permitted to first assess qualitative factors to determine whether it is more likely than not that the fair value of a reporting unit is less than its carrying amount. If
48
we conclude that it is more likely than not that the fair value of a reporting unit is less than its carrying amount, then a two-step goodwill impairment test is performed.
In performing the test, we utilize the two-step approach prescribed under Accounting Standards Codification, or ASC, 350, Intangibles - Goodwill and Other. The first step requires a comparison of the reporting unit against its aggregate carrying value, including goodwill. If the carrying amount exceeds the reporting unit’s carrying value to its fair value. We consider a number of factors to determine the fair value of a reporting unit, including an independent valuation to conduct this test. The valuation is based upon expected future discounted operating cash flows of the reporting unit. We base the discount rate on the weighted average cost of capital, or WACC, of market participants. If the carrying value of a reporting unit exceeds its estimated fair value, we will perform the second step of the goodwill impairment test to measure the amount of impairment loss, if any. The second step of the goodwill impairment test compares the implied fair value of a reporting unit’s goodwill to its carrying value. The second step requires us to perform a hypothetical purchase allocation as of the measurement date and estimate the fair value of net tangible and intangible assets. The fair value of intangible assets is determined as described below and is subject to significant judgment.
Since the fair value of our reporting units was determined by use of discounted cash flows, or DCF, and the key assumptions that drive the fair value in this model are the WACC, terminal values, growth rates, and the amount and timing of expected future cash flows, significant judgment is applied in determining fair value. If the current economic environment were to deteriorate, this would likely result in a higher WACC because market participants would require a higher rate of return. In the DCF as the WACC increases, the fair value decreases. The other significant factor in the DCF is our projected financial information (i.e., amount and timing of expected future cash flows and growth rates) and if these assumptions were to be adversely impacted, this could result in a reduction of the fair value of this reporting unit.
We conducted our fiscal 2015 annual impairment test as of September 27, 2015 (the first day of our fourth fiscal quarter). We utilized DCF and market approaches to estimate the fair value of our reporting units as of September 27, 2015 and ultimately used the fair value determined by the DCF in making our impairment test conclusions. We believe we used reasonable estimates and assumptions about future revenue, cost projections, cash flows, market multiples and discount rates as of the measurement date. As a result of completing Step 1, all of the reporting units had fair values exceeding their carrying values, and as such, Step 2 of impairment test was not required for those reporting units.
During the second half of fiscal 2015 we made the decision to exit the Citrus Lane business through either a sale or wind-down. As a result of this decision, we determined that indicators of impairment existed in our Citrus Lane business. The fair value of the business was deemed to be below its carrying value and Step 2 of the goodwill impairment test was performed. Step 2 of the goodwill impairment test requires the completion of a hypothetical purchase price allocation to determine the fair value of the implied goodwill. As a result of this analysis and our decision during the second half of 2015 to exit the business, we recorded a goodwill impairment loss of $8.0 million within discontinued operations.
During the fourth quarter of fiscal 2014, primarily as a result of unexpected changes, both internal and external, we determined that indicators of impairment existed within our Citrus Lane business. The fair value of the business was deemed to be below its carrying value and Step 2 of the goodwill impairment test was performed. Step 2 of the goodwill impairment test requires the completion of a hypothetical purchase price allocation to determine the fair value of the implied goodwill. Upon completion of the Step 2 analysis, we determined that the Citrus Lane goodwill was impaired and recorded a $33.8 million impairment expense. Due to the subsequent decision to exit the Citrus Lane business, this has been recorded as a component of discontinued operations.
Amortization and Impairment of Intangible Assets
We amortize our intangible assets that have finite lives over their estimated useful lives. We use a straight-line method of amortization, unless a method that better reflects the pattern in which the economic benefits of the intangible asset are consumed or otherwise used up can be reliably determined. Amortization is recorded over the estimated useful lives ranging from one to ten years. We review our intangible assets subject to amortization to determine if any adverse conditions exist, or a change in circumstances has occurred that would indicate impairment or a change in the remaining useful life. If the carrying value of an asset exceeds its undiscounted cash flows, we will write-down the carrying value of the intangible asset, or asset group, to its fair value in the period identified. In assessing fair value, we must make assumptions regarding estimated future cash flows and discount rates. If these estimates or related assumptions change in the future, we may be required to record impairment charges. We generally calculate fair value as the present value of estimated future cash flows to be generated by the asset using a risk-adjusted discount rate. If the estimate of an intangible asset’s remaining useful life is changed, we will amortize the remaining carrying value of the intangible asset prospectively over the revised remaining useful life.
During the second half of fiscal 2015 we made the decision to exit the Citrus Lane business through either a sale or wind-down. As a result of this decision, we determined that indicators of impairment existed in our Citrus Lane business. We completed Step 1 of our goodwill impairment analysis with the assistance of an independent valuation firm and determined that the fair value of this reporting unit was lower than its carrying value. This required us to proceed to Step 2 of our impairment
49
analysis. As a result of this analysis and our decision during the second half of 2015 to exit the business, we recorded an intangible asset impairment of $1.7 million within discontinued operations.
During the fourth quarter of fiscal 2014, in connection with our goodwill impairment analysis, we performed a Step 2 test of recoverability of finite lived intangibles in accordance with ASC 360, indicating that our undiscounted future cash flows would not recover the carrying value of the Citrus Lane proprietary software and trade name intangible assets. We then performed a Step 3 impairment analysis of finite lived intangible assets under ASC 360 and determined that the carrying value of the Citrus Lane proprietary software and trade name exceeded the fair value of those assets as of the end of the fourth quarter and recognized an intangible asset impairment of $2.4 million. This was recorded as a component of discontinued operations.
During the third quarter of fiscal 2013, we made the decision to migrate the trade name of Parents in a Pinch, Inc., or PIAP, a Boston-based provider of in-home backup childcare and adult care services for working families that we acquired in December 2012, to Care Concierge. As a result of this decision we tested the associated asset group for recoverability and concluded that an indicator of impairment did not exist. However, in connection with the decision to migrate to the new trade name, we concluded the useful life of the PIAP trade name should be reassessed. We revised the useful life to be four months to coincide with our migration plan.
Income Taxes
We account for income taxes in accordance with ASC 740, Income Taxes. ASC 740 is an asset and liability approach that requires recognition of deferred tax assets and liabilities for the expected future tax consequences attributable to differences between the carrying amounts of assets and liabilities for financial reporting purposes and their respective tax basis, and for operating loss and tax credit carryforwards. ASC 740 requires a valuation allowance against net deferred tax assets if, based upon the available evidence, it is more likely than not that some or all of the deferred tax assets will not be realized.
We recognize the tax benefit from an uncertain tax position only if it is more likely than not the tax position will be sustained on examination by the tax authorities, based on the technical merits of the position. The tax benefits recognized in the consolidated financial statements from such position are then measured based on the largest benefit that has a greater than 50% likelihood of being realized upon settlement.
Stock-Based Compensation
We account for all stock-based awards to employees and members of our board of directors, to the extent such awards were issued in connection with their services as directors, in accordance with ASC 718, Compensation-Stock Compensation. ASC 718 requires that all share-based payments, including grants of stock options, be recognized in the statement of operations as an operating expense based on their fair value. In accordance with ASC 718, we recognize the compensation cost of share-based awards on a straight-line basis over the vesting period of the award.
We use the Black-Scholes-Merton option-pricing model to determine the fair value for option awards. In valuing our option awards, we make assumptions about risk-free interest rates, dividend yields, volatility, and weighted-average expected lives, including estimated forfeiture rates. Risk-free interest rates are derived from U.S. Treasury securities as of the option award grant date. Expected dividend yield is based on our historical dividend payments, which have been zero to date. The expected volatility for our common stock is estimated by taking the average historic price volatility for a group of similarly situated publicly traded companies based on daily price observations over a period equivalent to the expected term of the stock option grants. These publicly traded companies were selected based on comparable characteristics to us and consist of several companies in the technology industry that are similar in enterprise value, stage of life cycle, risk profile, financial leverage and with historical share price information sufficient to meet the expected life of our stock-based awards. We estimate the weighted-average expected life of the option awards as the average of the option vesting schedule and the term of the award, since we do not have sufficient historical exercise data to provide a reasonable basis upon which to estimate expected term due to the limited period of time that share-based awards have been exercisable. The term of the award is estimated using the simplified method, as awards are plain vanilla option awards. Forfeiture rates are estimated using historical actual forfeiture trends as well as our judgment of future forfeitures. These rates are evaluated at least quarterly and any change in compensation expense is recognized in the period of the change. The estimation of option awards that will ultimately vest requires judgment, and to the extent actual results or updated estimates differ from our current estimates, such amounts will be recorded as a cumulative adjustment in the period the estimates are revised. Actual results, and future changes in estimates, may differ substantially from management’s current estimates.
Stock-based awards issued to non-employees, are accounted for using the fair value method in accordance with ASC 505-50, Equity-Based Payments to Non-Employees. These stock options are typically granted in exchange for consulting services to be rendered, and vest over periods of up to four years. In accordance with authoritative guidance, the fair value of non-employee stock-based awards is estimated on the date of grant, and subsequently revalued at each reporting period over their vesting period using the Black-Scholes option-pricing model.
50
Recently Issued and Adopted Accounting Pronouncements
In November 2015, the Financial Accounting Standards Board, or the FASB, issued Accounting Standards Update, or ASU, No. 2015-17, Balance Sheet Classification of Deferred Taxes. ASU 2015-17 simplifies the presentation of deferred income taxes by eliminating the requirement for entities to separate deferred income tax liabilities and assets into current and non-current amounts in the balance sheet. Rather, it requires that deferred tax assets and liabilities are classified as non-current in the balance sheet. We adopted this standard prospectively for the year ended December 26, 2015.
In April 2015, the FASB issued ASU No. 2015-05, Customer’s Accounting for Fees Paid in a Cloud Computing Arrangement, which amends ASC 350. The amendments provide guidance as to whether a cloud computing arrangement (e.g., software as a service, platform as a service, infrastructure as a service, and other similar arrangements) includes a software license, and based on that determination, how to account for such arrangements. ASU 2015-05 is effective for fiscal years, and interim periods therein, beginning after December 15, 2015 and may be applied on either a prospective or retrospective basis. Early adoption is not permitted. We are currently evaluating the impact the adoption of ASU 2015-05 will have on our financial statements.
In February 2015, the FASB issued ASU No. 2015-02, Consolidation (Topic 810)-Amendments to the Consolidation Analysis, which amends the criteria for determining which entities are considered variable interest entities, or VIEs, amends the criteria for determining if a service provider possesses a variable interest in a VIE and ends the deferral granted to investment companies for application of the VIE consolidation model. ASU 2015-02 is effective for annual periods, and interim periods therein, beginning after December 15, 2015. We are currently evaluating the impact the adoption of Topic 810 will have on our financial statements.
In August 2014, the FASB issued ASU No. 2014-15, Disclosure of Uncertainties about an Entity's Ability to Continue as a Going Concern. ASU 2014-15 requires management to evaluate, at each annual or interim reporting period, whether there are conditions or events that exist that raise substantial doubt about an entity's ability to continue as a going concern within one year after the date the financial statements are issued and provide related disclosures. ASU 2014-15 is effective for annual periods ending after December 15, 2016 and earlier application is permitted. We are currently evaluating the impact of the adoption of ASU 2014-15, but the adoption is not expected to have a material effect on our consolidated financial statements or disclosures.
In May 2014, the FASB issued ASU No. 2014-09, Revenue from Contracts with Customers , which requires an entity to recognize the amount of revenue to which it expects to be entitled for the transfer of promised goods or services to customers. ASU 2014-09 will replace most existing revenue recognition guidance in U.S. GAAP when it becomes effective. In August 2015, the FASB issued ASU No. 2015-14, Revenue from Contracts with Customers (Topic 606): Deferral of the Effective Date, which deferred the effective date of ASU 2014-09 by one year to December 15, 2017 for interim and annual reporting periods beginning after that date. Early adoption is permitted but not before the original effective date of December 15, 2016. We are evaluating the effect that ASU 2014-09 will have on our consolidated financial statements and related disclosures. The standard permits the use of either the retrospective or cumulative effect transition method. We have not yet selected a transition method nor have we determined the effect of the standard on our ongoing financial reporting.
51
ITEM 7A. QUANTITATIVE AND QUALITATIVE DISCLOSURES ABOUT MARKET RISK
We have operations both within the United States and internationally, and we are exposed to market risks in the ordinary course of our business.
Foreign Currency Exchange Risk
We have foreign currency risks related to our revenue and operating expenses denominated in currencies other than the U.S. dollar, principally the Euro, the British pound sterling, the Canadian dollar and the Swiss franc. The volatility of exchange rates depends on many factors that we cannot forecast with reliable accuracy. We have experienced and will continue to experience fluctuations in our net loss as a result of transaction gains (losses) related to revaluing certain cash balances, trade accounts receivable balances and accounts payable balances that are denominated in currencies other than the U.S. dollar. In the event our foreign currency denominated cash, accounts receivable, accounts payable, sales or expenses increase, our operating results may be more greatly affected by fluctuations in the exchange rates of the currencies in which we do business. A hypothetical change of 10% in appreciation or depreciation in foreign currency exchange rates from the quoted foreign currency exchange rates at December 26, 2015 would not have a material impact on our revenue, operating results or cash flows in the coming year.
At this time we do not, but we may in the future, enter into derivatives or other financial instruments in an attempt to hedge our foreign currency exchange risk. It is difficult to predict the impact hedging activities would have on our results of operations.
Interest Risk
We did not have any long-term borrowings as of December 26, 2015 or December 27, 2014. Under our current investment policy, we invest our excess cash in money market funds. Our current investment policy seeks first to preserve principal, second to provide liquidity for our operating and capital needs and third to maximize yield without putting our principal at risk. Our investments are exposed to market risk due to the fluctuation of prevailing interest rates that may reduce the yield on our investments or their fair value. As our investment portfolio is short-term in nature, we do not believe an immediate 10% increase in interest rates would have a material effect on the fair market value of our portfolio, and therefore we do not expect our results of operations or cash flows to be materially affected to any degree by a sudden change in market interest rates.
Inflation Risk
We do not believe that inflation has had a material effect on our business, financial condition or results of operations. If our costs were to become subject to significant inflationary pressures, we may not be able to fully offset such higher costs through price increases. Our inability or failure to do so could harm our business, financial condition and results of operations.
52
ITEM 8. FINANCIAL STATEMENTS AND SUPPLEMENTARY DATA
CARE.COM, INC.
INDEX TO CONSOLIDATED FINANCIAL STATEMENTS
Page | |
53
REPORT OF INDEPENDENT REGISTERED PUBLIC ACCOUNTING FIRM
The Board of Directors and Stockholders of Care.com, Inc.
We have audited the accompanying consolidated balance sheets of Care.com, Inc. as of December 26, 2015 and December 27, 2014, and the related consolidated statements of operations, comprehensive loss, redeemable convertible preferred stock and stockholders’ (deficit) equity, and cash flows for each of the three years in the period ended December 26, 2015. These financial statements are the responsibility of the Company's management. Our responsibility is to express an opinion on these financial statements based on our audits.
We conducted our audits in accordance with the standards of the Public Company Accounting Oversight Board (United States). Those standards require that we plan and perform the audit to obtain reasonable assurance about whether the financial statements are free of material misstatement. We were not engaged to perform an audit of the Company’s internal control over financial reporting. Our audits included consideration of internal control over financial reporting as a basis for designing audit procedures that are appropriate in the circumstances, but not for the purpose of expressing an opinion on the effectiveness of the Company’s internal control over financial reporting. Accordingly, we express no such opinion. An audit also includes examining, on a test basis, evidence supporting the amounts and disclosures in the financial statements, assessing the accounting principles used and significant estimates made by management, and evaluating the overall financial statement presentation. We believe that our audits provide a reasonable basis for our opinion.
In our opinion, the financial statements referred to above present fairly, in all material respects, the consolidated financial position of Care.com, Inc. at December 26, 2015 and December 27, 2014, and the consolidated results of its operations and its cash flows for each of the three years in the period ended December 26, 2015, in conformity with U.S. generally accepted accounting principles.
/s/ Ernst & Young LLP
Boston, Massachusetts
March 1, 2016
54
CARE.COM, INC.
CONSOLIDATED BALANCE SHEETS
(in thousands, except par value)
December 26, 2015 | December 27, 2014 | ||||||
Assets | |||||||
Current assets: | |||||||
Cash and cash equivalents | $ | 61,240 | $ | 71,881 | |||
Accounts receivable (net of allowance of $125.0 for 2015) | 3,107 | 2,530 | |||||
Unbilled accounts receivable | 3,595 | 3,541 | |||||
Prepaid expenses and other current assets | 2,599 | 4,936 | |||||
Current assets of discontinued operations | 439 | 3,172 | |||||
Total current assets | 70,980 | 86,060 | |||||
Property and equipment, net | 6,371 | 6,290 | |||||
Intangible assets, net | 3,389 | 7,065 | |||||
Goodwill | 58,631 | 60,635 | |||||
Other non-current assets | 3,098 | 3,072 | |||||
Non-current assets of discontinued operations | 9 | 9,982 | |||||
Total assets | $ | 142,478 | $ | 173,104 | |||
Liabilities and stockholders' equity | |||||||
Current liabilities: | |||||||
Accounts payable | $ | 3,189 | $ | 4,323 | |||
Accrued expenses and other current liabilities | 12,413 | 11,667 | |||||
Current contingent acquisition consideration | — | 2,845 | |||||
Deferred revenue | 13,435 | 11,472 | |||||
Current liabilities of discontinued operations | 17,883 | 11,919 | |||||
Total current liabilities | 46,920 | 42,226 | |||||
Deferred tax liability | 3,166 | 2,119 | |||||
Other non-current liabilities | 4,140 | 3,442 | |||||
Non-current liabilities of discontinued operations | — | 7,267 | |||||
Total liabilities | 54,226 | 55,054 | |||||
Commitments and Contingencies (see note 7) | — | — | |||||
Stockholders' equity | |||||||
Preferred Stock, $0.001 par value; 5,000 shares authorized, no shares issued | |||||||
Common stock, $0.001 par value; 300,000 shares authorized; 32,276 and 31,615 shares issued and outstanding, respectively | 32 | 32 | |||||
Additional paid-in capital | 283,669 | 277,583 | |||||
Accumulated deficit | (194,854 | ) | (159,859 | ) | |||
Accumulated other comprehensive (loss) income | (595 | ) | 294 | ||||
Total stockholders' equity | 88,252 | 118,050 | |||||
Total liabilities and stockholders' equity | $ | 142,478 | $ | 173,104 | |||
See accompanying notes to the consolidated financial statements
55
CARE.COM, INC.
CONSOLIDATED STATEMENTS OF OPERATIONS
(in thousands, except per share data)
Fiscal Year Ended | |||||||||||
December 26, 2015 | December 27, 2014 | December 28, 2013 | |||||||||
Revenue | $ | 138,681 | $ | 110,712 | $ | 81,487 | |||||
Cost of revenue | 26,117 | 23,464 | 18,844 | ||||||||
Operating expenses: | |||||||||||
Selling and marketing | 73,521 | 73,799 | 55,250 | ||||||||
Research and development | 19,801 | 16,216 | 11,816 | ||||||||
General and administrative | 30,158 | 27,325 | 18,841 | ||||||||
Depreciation and amortization | 4,503 | 4,363 | 4,387 | ||||||||
Total operating expenses | 127,983 | 121,703 | 90,294 | ||||||||
Operating loss | (15,419 | ) | (34,455 | ) | (27,651 | ) | |||||
Other expense, net | (1,239 | ) | (3,856 | ) | (291 | ) | |||||
Loss from continuing operations before income taxes | (16,658 | ) | (38,311 | ) | (27,942 | ) | |||||
Provision for (benefit from) income taxes | 1,221 | (752 | ) | 354 | |||||||
Loss from continuing operations | (17,879 | ) | (37,559 | ) | (28,296 | ) | |||||
Loss from discontinued operations, net of tax (see note 4) | (17,116 | ) | (42,733 | ) | — | ||||||
Net loss | (34,995 | ) | (80,292 | ) | (28,296 | ) | |||||
Accretion of preferred stock | — | (4 | ) | (57 | ) | ||||||
Net loss attributable to common stockholders | $ | (34,995 | ) | $ | (80,296 | ) | $ | (28,353 | ) | ||
Net loss per share attributable to common stockholders (Basic and Diluted): | |||||||||||
Loss from continuing operations | $ | (0.56 | ) | $ | (1.30 | ) | $ | (9.45 | ) | ||
Loss from discontinued operations | (0.53 | ) | (1.47 | ) | — | ||||||
Net loss per share | $ | (1.09 | ) | $ | (2.77 | ) | $ | (9.45 | ) | ||
Weighted-average shares used to compute net loss per share attributable to common stockholders: | |||||||||||
Basic and diluted | 32,001 | 28,941 | 3,000 | ||||||||
See accompanying notes to the consolidated financial statements
56
CARE.COM, INC.
CONSOLIDATED STATEMENTS OF COMPREHENSIVE LOSS
(in thousands)
Fiscal Year Ended | |||||||||||
December 26, 2015 | December 27, 2014 | December 28, 2013 | |||||||||
Net loss | $ | (34,995 | ) | $ | (80,292 | ) | $ | (28,296 | ) | ||
Other comprehensive (loss) income: | |||||||||||
Foreign currency translation adjustments | (889 | ) | (1,649 | ) | 806 | ||||||
Comprehensive loss | $ | (35,884 | ) | $ | (81,941 | ) | $ | (27,490 | ) | ||
See accompanying notes to the consolidated financial statements
57
CARE.COM, INC.
CONSOLIDATED STATEMENTS OF REDEEMABLE CONVERTIBLE PREFERRED STOCK AND STOCKHOLDERS’ (DEFICIT) EQUITY
(In thousands, except per share data)
Redeemable Convertible Preferred Stock | Stockholders' (Deficit) Equity | ||||||||||||||||||||||||||||
Common Stock | Additional Paid-In Capital | Accumulated Other Comprehensive Income (Loss) | Total Stockholders' (Deficit) Equity | ||||||||||||||||||||||||||
Number of Shares | Amount | Number of Shares | $0.001 Par Value | Accumulated Deficit | |||||||||||||||||||||||||
Balance at December 31, 2012 | 21,299 | $ | 152,194 | 2,882 | $ | 3 | $ | 6,628 | $ | (51,210 | ) | $ | 1,137 | $ | (43,442 | ) | |||||||||||||
Exercises of stock options | — | — | 315 | — | 821 | — | — | 821 | |||||||||||||||||||||
Accretion of issuance costs | — | 57 | — | — | — | (57 | ) | — | (57 | ) | |||||||||||||||||||
Stock-based compensation | — | — | — | — | 1,862 | — | — | 1,862 | |||||||||||||||||||||
Foreign currency translation adjustment | — | — | — | — | — | — | 806 | 806 | |||||||||||||||||||||
Net loss | — | — | — | — | — | (28,296 | ) | — | (28,296 | ) | |||||||||||||||||||
Balance at December 28, 2013 | 21,299 | 152,251 | 3,197 | 3 | 9,311 | (79,563 | ) | 1,943 | (68,306 | ) | |||||||||||||||||||
Exercises of stock options | — | — | 220 | — | 994 | — | — | 994 | |||||||||||||||||||||
Exercises of warrants | — | — | 76 | — | 968 | — | — | 968 | |||||||||||||||||||||
Accretion of issuance costs | — | — | — | — | — | (4 | ) | — | (4 | ) | |||||||||||||||||||
Contingent consideration payable in shares | — | — | — | — | 4,878 | — | — | 4,878 | |||||||||||||||||||||
Stock-based compensation | — | — | — | — | 4,357 | — | — | 4,357 | |||||||||||||||||||||
Foreign currency translation adjustment | — | — | — | — | — | — | (1,649 | ) | (1,649 | ) | |||||||||||||||||||
Contingent consideration paid in preferred stock | 192 | 2,626 | — | — | — | — | — | — | |||||||||||||||||||||
Conversion of preferred stock to common stock upon initial public offering | (21,491 | ) | (154,877 | ) | 21,491 | 22 | 154,855 | — | — | 154,877 | |||||||||||||||||||
Issuance of common stock in connection with initial public offering, net of offering costs | — | — | 6,153 | 6 | 94,804 | — | — | 94,810 | |||||||||||||||||||||
Issuance of common stock in connection with acquisitions | — | — | 478 | 1 | 5,968 | — | — | 5,969 | |||||||||||||||||||||
Acceleration of Citrus Lane restricted stock awards(1) | — | — | — | — | 1,448 | — | — | 1,448 | |||||||||||||||||||||
Net loss | — | — | — | — | — | (80,292 | ) | — | (80,292 | ) | |||||||||||||||||||
Balance at December 27, 2014 | — | — | 31,615 | 32 | 277,583 | (159,859 | ) | 294 | 118,050 | ||||||||||||||||||||
Exercises of stock options | — | — | 256 | — | 575 | — | — | 575 | |||||||||||||||||||||
Issuance of restricted stock units | — | — | 214 | — | — | — | — | — | |||||||||||||||||||||
Stock-based compensation | — | — | — | — | 5,511 | — | — | 5,511 | |||||||||||||||||||||
Foreign currency translation adjustment | — | — | — | — | — | — | (889 | ) | (889 | ) | |||||||||||||||||||
Issuance of common stock in connection with acquisitions | — | — | 191 | — | — | — | — | — | |||||||||||||||||||||
Net loss | — | — | — | (34,995 | ) | — | (34,995 | ) | |||||||||||||||||||||
Balance at December 26, 2015 | — | $ | — | 32,276 | $ | 32 | $ | 283,669 | $ | (194,854 | ) | $ | (595 | ) | $ | 88,252 | |||||||||||||
(1) Related expense was recognized in discontinued operations
See accompanying notes to the consolidated financial statements
58
CARE.COM, INC.
CONSOLIDATED STATEMENTS OF CASH FLOWS
(in thousands)
Fiscal Year Ended | |||||||||||
December 26, 2015 | December 27, 2014 | December 28, 2013 | |||||||||
Cash flows from operating activities | |||||||||||
Net loss | $ | (34,995 | ) | $ | (80,292 | ) | $ | (28,296 | ) | ||
Loss from discontinued operations, net of tax | (17,116 | ) | (42,733 | ) | — | ||||||
Loss from continuing operations | (17,879 | ) | (37,559 | ) | (28,296 | ) | |||||
Adjustments to reconcile net loss to net provided by (cash used) in operating activities: | |||||||||||
Stock-based compensation | 4,926 | 3,879 | 1,862 | ||||||||
Depreciation and amortization | 5,218 | 5,128 | 6,702 | ||||||||
Deferred taxes | 1,094 | (893 | ) | 284 | |||||||
Contingent consideration expense | — | 302 | 1,342 | ||||||||
Change in fair value of contingent consideration payable in preferred stock | — | 2,258 | — | ||||||||
Change in fair value of stock warrants | — | 606 | 115 | ||||||||
Foreign currency remeasurement loss | 1,275 | — | — | ||||||||
Other non-operating expenses | (98 | ) | (89 | ) | — | ||||||
Changes in operating assets and liabilities, net of effects from acquisitions: | |||||||||||
Accounts receivable | (604 | ) | (946 | ) | (46 | ) | |||||
Unbilled accounts receivable | (291 | ) | (1,066 | ) | (458 | ) | |||||
Prepaid expenses and other current assets | 2,076 | (116 | ) | (439 | ) | ||||||
Other non-current assets | (22 | ) | 353 | (109 | ) | ||||||
Accounts payable | (588 | ) | 1,757 | 706 | |||||||
Accrued expenses and other current liabilities | 1,864 | 2,087 | 2,870 | ||||||||
Deferred revenue | 2,280 | 3,242 | 2,821 | ||||||||
Other non-current liabilities | 909 | 880 | (15 | ) | |||||||
Net cash provided by (used in) operating activities by continuing operations | 160 | (20,177 | ) | (12,661 | ) | ||||||
Net cash used in operating activities by discontinued operations | (5,124 | ) | (4,107 | ) | — | ||||||
Net cash used in operating activities | (4,964 | ) | (24,284 | ) | (12,661 | ) | |||||
Cash flows from investing activities | |||||||||||
Purchases of property and equipment | (4,396 | ) | (3,038 | ) | (1,420 | ) | |||||
Payments for acquisitions, net of cash acquired | — | (489 | ) | (398 | ) | ||||||
Changes in restricted cash balance | 73 | (73 | ) | — | |||||||
Payments for security deposits | — | (2,825 | ) | — | |||||||
Net cash used in investing activities by continuing operations | (4,323 | ) | (6,425 | ) | (1,818 | ) | |||||
Net cash used in investing activities by discontinued operations | (2 | ) | (22,844 | ) | — | ||||||
Net cash used in investing activities | (4,325 | ) | (29,269 | ) | (1,818 | ) | |||||
See accompanying notes to the consolidated financial statements
59
Cash flows from financing activities | |||||||||||
Proceeds from initial public offering net of offering costs | — | 96,007 | — | ||||||||
Proceeds from exercise of common stock options | 777 | 787 | 821 | ||||||||
Payments for deferred offering costs | — | — | (1,074 | ) | |||||||
Payments of contingent consideration previously established in purchase accounting | (1,840 | ) | (2,209 | ) | — | ||||||
Net cash (used in) provided by financing activities | (1,063 | ) | 94,585 | (253 | ) | ||||||
Effect of exchange rate changes on cash and cash equivalents | (289 | ) | 890 | (85 | ) | ||||||
Net (decrease) increase in cash and cash equivalents | (10,641 | ) | 41,922 | (14,817 | ) | ||||||
Cash and cash equivalents, beginning of the period | 71,881 | 29,959 | 44,776 | ||||||||
Cash and cash equivalents, end of the period | $ | 61,240 | $ | 71,881 | $ | 29,959 | |||||
Supplemental disclosure of cash flow activities | |||||||||||
Cash paid for taxes | $ | 171 | $ | 94 | $ | 26 | |||||
Supplemental disclosure of non-cash investing and financing activities | |||||||||||
Unpaid purchases of property and equipment | $ | 43 | $ | 2,575 | $ | — | |||||
Issuance of preferred and common stock in connection with acquisitions | $ | — | $ | 5,969 | $ | — | |||||
Accretion of preferred stock to redemption value | $ | — | $ | 4 | $ | 57 | |||||
Conversion of preferred stock to common stock | $ | — | $ | 154,855 | $ | — | |||||
Reclassification of warrant liability to additional paid-in capital | $ | — | $ | 968 | $ | — | |||||
Reclassification of contingent consideration payable in common shares | $ | — | $ | 4,878 | $ | — | |||||
Unpaid deferred offering costs | $ | — | $ | — | $ | 479 | |||||
See accompanying notes to the consolidated financial statements
60
CARE.COM, INC.
NOTES TO CONDENSED CONSOLIDATED FINANCIAL STATEMENTS
YEARS ENDED DECEMBER 26, 2015, DECEMBER 27, 2014 AND DECEMBER 28, 2013
1. Organization and Description of Business
Care.com, Inc. (the “Company”, “we”, “us”, and “our”), a Delaware corporation, was incorporated on October 27, 2006. We are the world’s largest online marketplace for finding and managing family care. Our consumer matching solutions enable families to connect to caregivers and caregiving services in a reliable and easy way and our payment solutions enable families to pay caregivers electronically online or via their mobile device and to manage their household payroll and tax matters with Care.com HomePay. In addition, we serve employers by providing access to our platform to employer-sponsored families and care-related businesses-such as day care centers, nanny agencies and home care agencies-who wish to market their services to our care-seeking families and recruit our caregiver members.
Certain Significant Risks and Uncertainties
We operate in a dynamic industry and, accordingly, our business is affected by a variety of factors. For example, we believe that negative changes in any of the following areas could have a significant negative effect on our future financial position, results of operations or cash flows: rates of revenue growth; member engagement and usage of our existing and new products; protection of our brand; retention of qualified employees and key personnel; management of our growth; scaling and adaptation of existing technology and network infrastructure; competition in our market; performance of acquisitions and investments; protection of our intellectual property; protection of customers’ information and privacy concerns; security measures related to our website; and access to capital at acceptable terms, among other things.
2. Summary of Significant Accounting Policies
Principles of Consolidation
The accompanying consolidated financial statements include the accounts of the Company and our wholly owned subsidiaries, after elimination of all intercompany balances and transactions. We have prepared the accompanying financial statements in conformity with generally accepted accounting principles in the United States of America (“U.S. GAAP”).
Fiscal Year-End
For periods prior to fiscal 2013, we operated and reported on a calendar basis fiscal year. Beginning in the third quarter of fiscal 2013, we operate and report using a 52 or 53 week fiscal year ending on the Saturday in December closest and prior to December 31. Accordingly, our fiscal quarters end on the Saturday that falls closest to the last day of the third month of each quarter.
Discontinued Operations
To be reported within discontinued operations, we must dispose of a component or a group of components that represents a strategic shift which will have a major effect on our operations and financial results. We aggregate the results of operations for discontinued operations within a single line item on the income statement. General corporate overhead is not allocated to discontinued operations. We disclose any gain or loss that is recognized upon the disposition of a discontinued operation.
During the fourth quarter of fiscal 2015, we made the decision to shut down the business and had substantially completed our plans for ceasing the operation of the business. The represented a strategic shift that will have a major effect on our operations and financial results. As such, financial results of Citrus Lane have been presented as net loss from discontinued operations on the consolidated statements of operations for the years ended December 26, 2015 and December 27, 2014. Assets and liabilities of Citrus Lane to be disposed of are presented as assets from discontinued operations and liabilities from discontinued operations on the consolidated balance sheet as of December 26, 2015 and December 27, 2014 (see Note 4, “Discontinued Operations”).
61
CARE.COM, INC.
NOTES TO CONDENSED CONSOLIDATED FINANCIAL STATEMENTS
YEARS ENDED DECEMBER 26, 2015, DECEMBER 27, 2014 AND DECEMBER 28, 2013
Use of Estimates
The preparation of our consolidated financial statements in conformity with U.S. GAAP requires management to make estimates and assumptions that affect the reported amounts of assets and liabilities and disclosure of contingent assets and liabilities at the date of the consolidated financial statements and the reported amounts of income and expenses during the reporting period. On an ongoing basis, we evaluate our estimates, including those related to accounts receivable and revenue allowances, intangible asset valuations, expected future cash flows used to evaluate the recoverability of long-lived assets, the useful lives of long-lived assets including property and equipment and intangible assets, valuation of common and preferred stock and warrants to purchase preferred stock, fair value of stock-based awards, goodwill, income taxes, contingent consideration, and contingencies. We base our estimates of the carrying value of certain assets and liabilities on historical experience and on various other assumptions that are believed to be reasonable under the circumstances, when these carrying values are not readily available from other sources. These estimates are based on information available as of the date of the consolidated financial statements; therefore, actual results could differ from the estimates.
Revenue Recognition
In general, we recognize revenue when (i) persuasive evidence of an arrangement exists, (ii) delivery has occurred or services have been rendered to the customer, (iii) the fee is fixed or determinable, and (iv) collectability is reasonably assured. We derive our revenue primarily from on-going subscription fees. Revenue from subscription fees is recognized on a daily basis over the subscription term or on a pro-rata basis as the services are delivered. Revenue from background checks, lead generation and advertising is recognized in the period earned. Other service revenues are recognized as the services are performed. Taxes that are collected from customers and remitted to government authorities are presented on a net basis and are excluded from revenue. As it relates to our Citrus Lane business which is presented within discontinued operations, for product sales, these criteria are deemed to have been met when the items are delivered to the end customer. Shipping and handling charges are included in revenue on a gross basis.
Certain of our arrangements provide companies the opportunity to purchase Care.com services on behalf of their employees. These arrangements typically include a subscription to our consumer matching solutions for their employees. These arrangements are accounted for as multiple element arrangements. We have concluded that each element in the arrangement has stand-alone value as the individual services can be sold separately. In addition, there is no right of refund once a service has been delivered. Therefore, we have concluded each element of the arrangement is a separate unit of accounting. In accordance with the authoritative guidance on revenue recognition, we allocate consideration at the inception of an arrangement to each unit of accounting based on the relative selling price method in accordance with the selling price hierarchy. The objective of the hierarchy is to determine the price at which we would transact a sale if the service were sold on a stand-alone basis, and requires the use of: (1) vendor-specific objective evidence (‘‘VSOE’’), if available; (2) third-party evidence (‘‘TPE’’), if VSOE is not available; and (3) best estimate of selling price (‘‘BESP’’), if neither VSOE nor TPE is available. Since VSOE or TPE are not typically available, BESP is generally used to allocate the selling price to each unit of accounting. We determine BESP for units of account by considering multiple factors including, but not limited to, prices we charge for similar offerings, sales volumes, geographies and other factors contemplated in negotiating multiple element transactions.
Deferred Revenue
Deferred revenue primarily consists of payments received in advance of revenue recognition of the services described above, and is recognized as the revenue recognition criteria are met. Our customers pay for most services in advance on a monthly, quarterly or annual basis. Amounts expected to be recognized within the twelve months following the balance sheet date are classified within current liabilities in the accompanying consolidated balance sheets.
Unbilled Receivables
Unbilled receivables consist of amounts earned upon satisfying the revenue recognition criteria in advance of billing. Subscribers to our Care.com HomePay solution are billed quarterly in arrears at the beginning of the subsequent calendar quarter to which the services related.
Cost of Revenue
Cost of revenue primarily consists of expenses that are directly related, or closely correlated, to revenue generation, including matching and payments member variable servicing costs such as personnel costs for customer support, transaction fees related to credit card payments and the cost of background checks run on both families and caregivers. Additionally, cost of revenue includes website hosting fees and amortization expense related to caregiver relationships, proprietary software acquired as part of acquisitions and website intangible assets. As it relates to our Citrus Lane business, which is presented within discontinued
62
CARE.COM, INC.
NOTES TO CONDENSED CONSOLIDATED FINANCIAL STATEMENTS
YEARS ENDED DECEMBER 26, 2015, DECEMBER 27, 2014 AND DECEMBER 28, 2013
operations, we have product fulfillment costs, largely consisting of product, shipping and costs associated with our third-party fulfillment providers.
Concentrations of Credit Risk
Financial instruments, which potentially subject us to concentrations of credit risk, consist primarily of cash and cash equivalents and accounts receivable. We place our cash and cash equivalents with major financial institutions throughout the world that management assesses to be of high-credit quality in order to limit exposure of each investment. As of December 26, 2015 and December 27, 2014, substantially all of our cash had been invested in money market funds.
Credit risk with respect to accounts receivable is dispersed due to the large number of customers. During the year ended December 26, 2015, one customer accounted for more than 13% of total accounts receivable and no customer accounted for more than 10% of revenue. During the year ended December 27, 2014, one customer accounted for 15% of total accounts receivable and no customer accounted for more than 10% of total revenue. In addition, our credit risk is mitigated by a relatively short collection period. Collateral is not required for accounts receivable. We record our accounts receivable in our consolidated balance sheets at net realizable value. We perform on-going credit evaluations of our customers and maintain allowances for potential credit losses, based on management’s best estimates. Amounts determined to be uncollectible are written off against this reserve. Our allowance for doubtful accounts totaled $0.1 million and $0.0 million as of December 26, 2015 and December 27, 2014, respectively.
Foreign Currency Translation
We determine the functional currency for our foreign subsidiaries by reviewing the currencies in which their respective operating activities occur. Financial information is translated from the functional currency to the U.S. dollar, the reporting currency, for inclusion in our consolidated financial statements. Income, expenses, and cash flows are translated at average exchange rates prevailing during each month of the fiscal year, and assets and liabilities are translated at fiscal period end exchange rates. Foreign exchange transaction gains and losses are included in other expense, net in the accompanying consolidated statements of operations. The effects of foreign currency translation adjustments are included as a component of accumulated other comprehensive income in the accompanying consolidated balance sheets. For the years ended December 26, 2015, December 27, 2014 and December 28, 2013, we recorded foreign currency transaction losses of approximately $1.3 million, $1.0 million and $0.1 million, respectively, included in other expense, net in the accompanying consolidated statements of operations.
Cash Equivalents
We consider highly liquid investments purchased with an original maturity of 90 days or less at the time of purchase to be cash equivalents. As of December 26, 2015 and December 27, 2014, cash equivalents consisted of money market funds.
Recurring Fair Value Measurement
Accounting Standards Codification (“ASC”) 820, Fair Value Measurements and Disclosures, establishes a three-level valuation hierarchy for disclosure of fair value measurements. The categorization within the valuation hierarchy is based upon the lowest level of input that is significant to the measurement of fair value. The three levels of the hierarchy are defined as follows:
• | Level 1 inputs - Unadjusted quoted prices in active markets for identical assets or liabilities that the reporting entity has the ability to access at the measurement date. |
• | Level 2 inputs - Inputs other than quoted prices included in Level 1 that are observable for the asset or liability, either directly or indirectly. These might include quoted prices for similar assets or liabilities in active markets, quoted prices for identical or similar assets or liabilities in markets that are not active, inputs other than quoted prices that are observable for the asset or liability (such as interest rates, volatilities, prepayment speeds, credit risks, etc.), or inputs that are derived principally from or corroborated by market data by correlation or other means. |
• | Level 3 inputs - Unobservable inputs for determining the fair values of assets or liabilities that reflect an entity’s own assumptions about the assumptions that market participants would use in pricing the assets or liabilities. |
Recurring Fair Value Measurements
Assets
Cash equivalents - Cash equivalents include money market mutual funds with original maturities of three months or less. The fair value measurement of these assets is based on quoted market prices in active markets for identical assets and, therefore, these assets are recorded at fair value on a recurring basis and classified as Level 1 in the fair value hierarchy.
63
CARE.COM, INC.
NOTES TO CONDENSED CONSOLIDATED FINANCIAL STATEMENTS
YEARS ENDED DECEMBER 26, 2015, DECEMBER 27, 2014 AND DECEMBER 28, 2013
Liabilities
Contingent Acquisition Consideration - Contingent acquisition consideration includes the fair value of contingent consideration paid by us in connection with corporate acquisitions based on the likelihood of issuing preferred and common stock and paying cash related to certain revenue and other milestones. We recorded our estimate of the fair value of this contingent consideration based on the evaluation of the likelihood of the achievement of the contractual conditions that would result in the payment of the contingent consideration and weighted probability assumptions of these outcomes. The fair value of the liability was estimated using a discounted cash flow technique with significant inputs that are not observable in the market and thus represents a Level 3 fair value measurement as defined in ASC 820.
For contingent consideration payable in preferred stock, we used a valuation of the company based on both an income and market approach to determine the fair value of the preferred stock as of the acquisition date and on an-ongoing basis. Upon the closing of our initial public offering (“IPO”) in January 2014, the contingent consideration payable in preferred stock was automatically converted to the right to receive common stock at the then-applicable conversion rate. Contingent consideration payable in preferred stock was written up to fair value as of the closing date of the IPO and was reclassified to permanent equity.
The cash portion of the contingent consideration liability has been discounted to reflect the time value of money, and therefore, as the milestone date approaches, the fair value of this liability will increase. This increase in fair value was recorded in general and administrative expenses in the accompanying consolidated statements of operations. The preferred stock portion of the contingent consideration represented a liability in accordance with ASC 480-10, Distinguishing Liabilities from Equity, and was marked-to-market each reporting period with changes in market value recognized in other expense, net in the accompanying consolidated statements of operations.
During the year ended December 28, 2013 we reassessed the probability of achievement on the Care Concierge, Inc. contingent acquisition cash payment based on the achievement of certain revenue milestones and the probability of reaching both the 2013 and 2014 milestones, which resulted in $0.6 million of incremental expense. During the year ended December 27, 2014, in connection with our acquisition of Citrus Lane, we recognized acquisition consideration payable in cash and shares totaling $17.5 million. The probability of achievement of this earn-out was assessed at 100%. Current contingent consideration liabilities from the acquisition of Citrus Lane of $16.0 million and $7.8 million were included in current liabilities from discontinued operations as of December 26, 2015 and December 27, 2014, respectively. Non-current contingent consideration liabilities from the acquisition of Citrus Lane of $7.3 were included in non-current liabilities from discontinued operations as of December 27, 2014.
The significant inputs in the Level 3 measurement not supported by market activity included our probability assessments of expected future cash flows related to our acquisition of Breedlove & Associates, LLC, Care Concierge, Inc. and Citrus Lane during the applicable earn-out period, appropriately discounted considering the uncertainties associated with the applicable obligation, and calculated in accordance with the terms of the applicable transaction agreement. As such, the cash portion of the contingent consideration liability has been discounted to reflect the time value of money, and therefore, as the milestone date approaches, the fair value of this liability will increase.
Preferred Stock Warrants - Preferred stock warrants consist of warrants issued in connection with debt financings. The fair value of the warrants was determined using the Black-Scholes option-pricing model. In conjunction with the closing of the IPO, the warrant exercisable for shares of our Series A-1 Preferred Stock was automatically converted into a warrant exercisable for shares of our common stock, resulting in the reclassification of the related convertible preferred stock warrant liability to additional paid-in capital as the warrant met the criteria for equity classification upon its conversion to a warrant for the purchase of common stock. The warrant liability was re-measured to fair value prior to reclassification to additional paid-in capital. As of December 26, 2015, we had no outstanding warrant liability.
64
CARE.COM, INC.
NOTES TO CONDENSED CONSOLIDATED FINANCIAL STATEMENTS
YEARS ENDED DECEMBER 26, 2015, DECEMBER 27, 2014 AND DECEMBER 28, 2013
The following table presents information about our assets and liabilities, including those from our discontinued operations, measured at fair value on a recurring basis as of December 26, 2015 and December 27, 2014 and indicates the fair value hierarchy of the valuation techniques we utilized to determine such fair value (in thousands):
December 26, 2015 | December 27, 2014 | ||||||||||||||||||||||||||||||
Fair Value Measurements Using Input Types | Fair Value Measurements Using Input Types | ||||||||||||||||||||||||||||||
Level 1 | Level 2 | Level 3 | Total | Level 1 | Level 2 | Level 3 | Total | ||||||||||||||||||||||||
Assets: | |||||||||||||||||||||||||||||||
Money market mutual funds | $ | 25,420 | $ | — | $ | — | $ | 25,420 | $ | 15,656 | $ | — | $ | — | $ | 15,656 | |||||||||||||||
Total assets | $ | 25,420 | $ | — | $ | — | $ | 25,420 | $ | 15,656 | $ | — | $ | — | $ | 15,656 | |||||||||||||||
Liabilities: | |||||||||||||||||||||||||||||||
Contingent acquisition consideration (included in current liabilities of discontinued operations) | $ | 8,163 | $ | — | $ | 7,878 | $ | 16,041 | $ | — | $ | — | $ | 17,952 | $ | 17,952 | |||||||||||||||
Total liabilities | $ | 8,163 | $ | — | $ | 7,878 | $ | 16,041 | $ | — | $ | — | $ | 17,952 | $ | 17,952 | |||||||||||||||
The following table sets forth a summary of changes in the fair value of our contingent acquisition consideration and preferred stock warrants which represent recurring measurements that are classified within Level 3 of the fair value hierarchy wherein fair value is estimated using significant unobservable inputs (in thousands):
Fiscal Year Ended | |||||||||||
December 26, 2015 | December 27, 2014 | ||||||||||
Contingent Acquisition Consideration | Contingent Acquisition Consideration | Preferred Stock Warrants | |||||||||
Beginning balance | $ | 17,952 | $ | 10,630 | $ | 362 | |||||
Contingent consideration liability recorded in connection with Citrus Lane acquisition | — | 14,510 | — | ||||||||
Increase in fair value included in earnings | 934 | 3,158 | 606 | ||||||||
Reclassification to permanent equity | — | (4,878 | ) | (968 | ) | ||||||
Contingent acquisition consideration payments | (2,845 | ) | (5,468 | ) | — | ||||||
Transfers out of Level 3(1) | (8,163 | ) | — | — | |||||||
Ending balance | $ | 7,878 | $ | 17,952 | $ | — | |||||
(1) Transfers out of Level 3 represent contingent payments for which the measurement period had ended and the remaining liability is known as of December 26, 2015.
Non-Recurring Fair Value Measurements
We remeasure the fair value of certain assets and liabilities upon the occurrence of certain events. Such assets are comprised of long-lived assets, including property and equipment, intangible assets and goodwill. No remeasurement of long-lived assets occurred as of December 26, 2015 or December 27, 2014, aside from those detailed below pertaining to goodwill and intangible assets. Other financial instruments not measured or recorded at fair value in the accompanying consolidated balance sheets principally consist of accounts receivable, accounts payable, and accrued liabilities. The estimated fair values of these instruments approximate their carrying values due to their short-term nature.
Business Combinations
65
CARE.COM, INC.
NOTES TO CONDENSED CONSOLIDATED FINANCIAL STATEMENTS
YEARS ENDED DECEMBER 26, 2015, DECEMBER 27, 2014 AND DECEMBER 28, 2013
We determine and allocate the purchase price of an acquired company to the tangible and intangible assets acquired and liabilities assumed based on their fair values as of the business combination date, including identifiable intangible assets, which either arise from a contractual or legal right or are separable from goodwill. We base the fair value of identifiable intangible assets acquired in a business combination on detailed valuations that use information and assumptions provided by management, which consider management’s best estimates of inputs and assumptions that a market participant would use. We allocate any excess purchase price over the fair value of the net tangible and identifiable intangible assets acquired to goodwill. The use of alternative valuation assumptions, including estimated revenue projections, growth rates, cash flows, discount rates, estimated useful lives and probabilities surrounding the achievement of revenue-based milestones, could result in different purchase price allocations and amortization expense in current and future periods. Transaction costs associated with these acquisitions are expensed as incurred through general and administrative costs.
In those circumstances where an acquisition involves a contingent consideration arrangement, we recognize a liability equal to the fair value of the contingent payments we expect to make as of the acquisition date. We re-measure this liability at each reporting period and record changes in the fair value as a component of operating expenses. Increases or decreases in the fair value of the contingent consideration liability can result from changes in discount periods and rates, as well as changes in the timing and amount of revenue estimates or in the timing or likelihood of achieving revenue-based milestones.
Results of operations and cash flows of acquired companies are included in our operating results from the date of acquisition.
Equity Method Investment
During fiscal 2012, we made a 50% investment in Care International Exchange, Inc. (the “Venture”), a venture formed with Magsaysay People Resources Corporation (‘‘Magsaysay’’). The purpose of the Venture is to conduct activities related to a live-in care program with the goal of generating revenue from the placement of foreign-born providers with families, institutions or individuals seeking live-in home care throughout Canada. Our initial investment in the Venture was $50,000. We account for our investment in the Venture using the equity method of accounting based on our voting interest as we have significant influence over the Venture. Accordingly, our share of the income or loss of the Venture is recorded in other income or expense in the accompanying consolidated statements of operations. To date, the operations of the Venture have not been significant.
Goodwill
Goodwill is recorded as the difference, if any, between the aggregate consideration paid for an acquisition and the fair value of the net tangible and intangible assets acquired. We evaluate goodwill for impairment at the reporting unit level (operating segment or one level below an operating segment) annually or more frequently if we believe indicators of impairment exist. In accordance with the guidance, we are permitted to first assess qualitative factors to determine whether it is more likely than not that the fair value of a reporting unit is less than its carrying amount. If we conclude that it is more likely than not that the fair value of a reporting unit is less than its carrying amount, then a two-step goodwill impairment test is performed.
In performing the test, we utilize the two-step approach prescribed under Accounting Standards Codification, or ASC, 350, Intangibles - Goodwill and Other. The first step requires a comparison of the reporting unit against its aggregate carrying value, including goodwill. If the carrying amount exceeds the reporting unit’s carrying value to its fair value. We consider a number of factors to determine the fair value of a reporting unit, including an independent valuation to conduct this test. The valuation is based upon expected future discounted operating cash flows of the reporting unit. We base the discount rate on the weighted average cost of capital, or WACC, of market participants. If the carrying value of a reporting unit exceeds its estimated fair value, we will perform the second step of the goodwill impairment test to measure the amount of impairment loss, if any. The second step of the goodwill impairment test compares the implied fair value of a reporting unit’s goodwill to its carrying value. The second step requires us to perform a hypothetical purchase allocation as of the measurement date and estimate the fair value of net tangible and intangible assets. The fair value of intangible assets is determined as described below and is subject to significant judgment.
Since the fair value of our reporting units was determined by use of the discounted cash flows, or DCF, and the key assumptions that drive the fair value in this model are the WACC, terminal values, growth rates, and the amount and timing of expected future cash flows, significant judgment is applied in determining fair value. If the current economic environment were to deteriorate, this would likely result in a higher WACC because market participants would require a higher rate of return. In the DCF as the WACC increases, the fair value decreases. The other significant factor in the DCF is our projected financial information (i.e., amount and timing of expected future cash flows and growth rates) and if these assumptions were to be adversely impacted, this could result in a reduction of the fair value of this reporting unit.
66
CARE.COM, INC.
NOTES TO CONDENSED CONSOLIDATED FINANCIAL STATEMENTS
YEARS ENDED DECEMBER 26, 2015, DECEMBER 27, 2014 AND DECEMBER 28, 2013
We conducted our fiscal 2015 annual impairment test as of September 27, 2015 (the first day of our fourth fiscal quarter). We utilized DCF and market approaches to estimate the fair value of our reporting units as of September 27, 2015 and ultimately used the fair value determined by the DCF in making our impairment test conclusions. We believe we used reasonable estimates and assumptions about future revenue, cost projections, cash flows, market multiples and discount rates as of the measurement date. As a result of completing Step 1, all of the reporting units had fair values exceeding their carrying values, and as such, Step 2 of impairment test was not required for those reporting units.
Additionally, during the third quarter of fiscal 2015, we determined that we should consider the advisability of a sale or wind down of the Citrus Lane business. As a result of this determination, we concluded that indicators of impairment existed in the Citrus Lane business and began an analysis of whether any material impairment charges would be required. We completed step one of our goodwill impairment testing with the assistance of an independent valuation firm and determined that the fair value of this business was lower than its carrying value. As a result of this analysis and our decision during the fourth quarter of 2015 to exit the business, we recorded a goodwill impairment loss of $8.0 million within loss from discontinued operations.
We conducted our fiscal 2014 annual impairment test as of September 28, 2014 (the first day of our fourth fiscal quarter). We utilized DCF and market approaches to estimate the fair value of our reporting units as of September 28, 2014 and ultimately used the fair value determined by the DCF in making our impairment test conclusions. We believe we used reasonable estimates and assumptions about future revenue, cost projections, cash flows, market multiples and discount rates as of the measurement date. Because Citrus Lane was recently acquired and was operating reasonably close to expectations, we performed a qualitative screen for impairment of that reporting unit as is allowed under ASC 350. As a result of completing Step 1, all of the reporting units had fair values exceeding their carrying values, and as such, Step 2 of impairment test was not required for those reporting units.
During the fourth quarter of fiscal 2014, primarily as a result of unexpected changes, both internal and external, we determined that indicators of impairment existed at our Citrus Lane Reporting Unit. The fair value of reporting unit was deemed to be below its carrying value and Step 2 of the goodwill impairment test was performed. Step 2 of the goodwill impairment test requires the completion of a hypothetical purchase price allocation to determine the fair value of the implied goodwill. Upon completion of the Step 2 analysis, we determined that the Citrus Lane goodwill was impaired and recorded a goodwill impairment loss of $33.8 million within loss from discontinued operations.
Amortization and Impairment of Intangible Assets
We amortize our intangible assets that have finite lives over their estimated useful lives. We use a straight-line method of amortization, unless a method that better reflects the pattern in which the economic benefits of the intangible asset are consumed or otherwise used up can be reliably determined. Amortization is recorded over the estimated useful lives ranging from one to ten years. We review our intangible assets subject to amortization to determine if any adverse conditions exist, or a change in circumstances has occurred that would indicate impairment or a change in the remaining useful life. If the carrying value of an asset exceeds its undiscounted cash flows, we will write-down the carrying value of the intangible asset, or asset group, to its fair value in the period identified. In assessing fair value, we must make assumptions regarding estimated future cash flows and discount rates. If these estimates or related assumptions change in the future, we may be required to record impairment charges. We generally calculate fair value as the present value of estimated future cash flows to be generated by the asset using a risk-adjusted discount rate. If the estimate of an intangible asset’s remaining useful life is changed, we will amortize the remaining carrying value of the intangible asset prospectively over the revised remaining useful life.
During the third quarter of fiscal 2015, we determined that we should consider the advisability of a sale or wind down of the Citrus Lane business. As a result of this determination, we concluded that indicators of impairment existed in the Citrus Lane business and began an analysis of whether any material impairment charges would be required. We completed step one of our goodwill impairment testing with the assistance of an independent valuation firm and determined that the fair value of this business was lower than its carrying value. As a result of this analysis and our decision during the fourth quarter of 2015 to exit the business, we recorded an intangible asset impairment of $1.7 million within loss from discontinued operations.
During the fourth quarter of fiscal 2014, in connection with our goodwill impairment analysis, we performed a Step 2 test of recoverability of finite lived intangibles in accordance with ASC 360, indicating that our undiscounted future cash flows would not recover the carrying value of the Citrus Lane proprietary software and trade name intangible assets. We then performed a Step 3 impairment analysis of finite lived intangible assets under ASC 360 and determined that the carrying value of the Citrus Lane proprietary software and trade name exceeded the fair value of those assets as of the end of the fourth quarter and recognized an intangible asset impairment of $2.4 million within loss from discontinued operations.
Software Development Costs
67
CARE.COM, INC.
NOTES TO CONDENSED CONSOLIDATED FINANCIAL STATEMENTS
YEARS ENDED DECEMBER 26, 2015, DECEMBER 27, 2014 AND DECEMBER 28, 2013
Internal and external software development costs associated with the development of software for internal use are expensed to research and development during the preliminary project stage and capitalized during the application development stage. Costs incurred during application development stage and capitalized totaled $0.4 million and $0.9 million for the fiscal years ended December 26, 2015, and December 27, 2014, respectively. During fiscal year ended December 28, 2013, we believe the substantial majority of our development efforts were either in the preliminary stage of development or were for maintenance of, and minor upgrades and enhancements to internal-use software and, accordingly, application development costs were insignificant.
Property and Equipment
Property and equipment are stated at cost, and are depreciated using the straight-line method over the estimated useful life of the assets or, where applicable and if shorter, over the lease term. The following table presents the detail of property and equipment, net for the periods presented (in thousands):
December 26, 2015 | December 27, 2014 | ||||||
Computer equipment | $ | 2,236 | $ | 2,438 | |||
Furniture and fixtures | 1,611 | 1,707 | |||||
Software | 1,374 | 1,066 | |||||
Leasehold improvements | 3,847 | 3,133 | |||||
Total | 9,068 | 8,344 | |||||
Less accumulated depreciation | (2,697 | ) | (2,054 | ) | |||
Property and equipment, net | $ | 6,371 | $ | 6,290 | |||
Property and equipment are depreciated over the following estimated useful lives:
Estimated Useful Life | |
Computer equipment | 3 - 5 years |
Leasehold improvements | Lesser of asset life or lease term |
Furniture and fixtures | 3 - 5 years |
Software | 3 - 6 years |
Depreciation expense for the years ended December 26, 2015, December 27, 2014 and December 28, 2013 was $1.6 million, $0.9 million and $0.7 million, respectively.
Expenditures for maintenance and repairs are charged to expense as incurred, whereas major betterments are capitalized as additions to property and equipment.
In accordance with ASC 360-10-35-15, Property, Plant and Equipment—Impairment or Disposal of Long-Lived Assets, we review the carrying value of long-lived assets whenever events or changes in circumstances indicate that the carrying amount of the asset may not be recoverable. Recoverability of assets to be held and used is measured by a comparison of the carrying amount of an asset to estimated undiscounted future cash flows expected to be generated by the asset. If the carrying amount of an asset exceeds its estimated future cash flows, then an impairment charge is recognized for the amount by which the carrying amount of the asset exceeds the fair value of the asset. Assets to be disposed of would be separately presented in the balance sheet and reported at the lower of the carrying amount or the fair value less costs to sell, and are not depreciated. Assets and liabilities that are part of a disposal group and classified as held for sale would be presented separately in the appropriate asset and liability sections of the balance sheet. During the year ended December 26, 2015, we recorded an impairment charge associated with certain capitalized software development costs of $0.1 million. We have not recognized any impairment losses during the years ended December 27, 2014 and December 28, 2013 with respect to property, plant and equipment.
Income Taxes
We account for income taxes in accordance with ASC 740, Income Taxes. ASC 740 is an asset and liability approach that requires recognition of deferred tax assets and liabilities for the expected future tax consequences attributable to differences between the carrying amounts of assets and liabilities for financial reporting purposes and their respective tax basis, and for
68
CARE.COM, INC.
NOTES TO CONDENSED CONSOLIDATED FINANCIAL STATEMENTS
YEARS ENDED DECEMBER 26, 2015, DECEMBER 27, 2014 AND DECEMBER 28, 2013
operating loss and tax credit carryforwards. ASC 740 requires a valuation allowance against net deferred tax assets if, based upon the available evidence, it is more likely than not that some or all of the deferred tax assets will not be realized.
We recognize the tax benefit from an uncertain tax position only if it is more likely than not the tax position will be sustained on examination by the tax authorities, based on the technical merits of the position. The tax benefits recognized in the consolidated financial statements from such position are then measured based on the largest benefit that has a greater than 50% likelihood of being realized upon settlement. At December 26, 2015 and December 27, 2014, we did not have any uncertain tax positions.
Presentation of Taxes in the Consolidated Statements of Operations
We present taxes that are collected from customers and remitted to government authorities on a net basis in the consolidated statements of operations.
Stock-Based Compensation
We account for all stock-based awards to employees and members of our board of directors, to the extent such awards were issued in connection with their services as directors, in accordance with ASC 718, Compensation-Stock Compensation. ASC 718 requires that all share-based payments, including grants of stock options, be recognized in the statement of operations as an operating expense based on their fair value. For stock options issued under the Company’s stock-based compensation plans, the fair value of each option grant is estimated on the date of grant, and an estimated forfeiture rate is used when calculating stock-based compensation expense for the period. For restricted stock units issued under the Company’s stock-based compensation plans, the fair value of each grant is calculated based on the Company’s stock price on the date of grant. In accordance with ASC 718, we recognize the compensation cost of share-based awards on a straight-line basis over the vesting period of the award.
We use the Black-Scholes-Merton option-pricing model to determine the fair value for option awards. In valuing our option awards, we make assumptions about risk-free interest rates, dividend yields, volatility, and weighted-average expected lives, including estimated forfeiture rates. Risk-free interest rates are derived from U.S. Treasury securities as of the option award grant date. Expected dividend yield is based on our historical dividend payments, which have been zero to date. The expected volatility for our common stock is estimated taking the average historic price volatility for a group of similarly situated publicly traded companies based on daily price observations over a period equivalent to the expected term of the stock option grants. These publicly traded companies were selected based on comparable characteristics to us and consist of several companies in the technology industry that are similar in enterprise value, stage of life cycle, risk profile, financial leverage and with historical share price information sufficient to meet the expected life of our stock-based awards. We estimate the weighted-average expected life of the option awards as the average of the option vesting schedule and the term of the award, since we do not have sufficient historical exercise data to provide a reasonable basis upon which to estimate expected term due to the limited period of time share-based awards have been exercisable. The term of the award is estimated using the simplified method, as awards are plain vanilla option awards. Forfeiture rates are estimated using historical actual forfeiture trends as well as our judgment of future forfeitures. These rates are evaluated at least quarterly and any change in compensation expense is recognized in the period of the change. The estimation of option awards that will ultimately vest requires judgment, and to the extent actual results or updated estimates differ from our current estimates, such amounts will be recorded as a cumulative adjustment in the period the estimates are revised. Actual results, and future changes in estimates, may differ substantially from management’s current estimates.
Stock-based awards issued to non-employees, are accounted for using the fair value method in accordance with ASC 505-50, Equity-Based Payments to Non-Employees. These stock options are typically granted in exchange for consulting services to be rendered, and vest over periods of up to four years. In accordance with authoritative guidance, the fair value of non-employee stock-based awards is estimated on the date of grant, and subsequently revalued at each reporting period over their vesting period using the Black-Scholes option-pricing model.
Advertising Costs
We expense advertising costs as incurred when the advertisement is run. We incurred advertising expenses from continuing operations of $54.5 million, $57.8 million, and $42.1 million for the years ended December 26, 2015, December 27, 2014 and December 28, 2013, respectively.
Accumulated Other Comprehensive Income
As of December 26, 2015 and December 27, 2014, accumulated other comprehensive income was comprised solely of cumulative foreign currency translation adjustments.
69
CARE.COM, INC.
NOTES TO CONDENSED CONSOLIDATED FINANCIAL STATEMENTS
YEARS ENDED DECEMBER 26, 2015, DECEMBER 27, 2014 AND DECEMBER 28, 2013
Recently Issued and Adopted Accounting Pronouncements
In November 2015, the Financial Accounting Standards Board (“FASB”) issued Accounting Standards Update (“ASU”) No. 2015-17, Balance Sheet Classification of Deferred Taxes. ASU 2015-17 simplifies the presentation of deferred income taxes by eliminating the requirement for entities to separate deferred income tax liabilities and assets into current and non-current amounts in the balance sheet. Rather, it requires that deferred tax assets and liabilities are classified as non-current in the balance sheet. We adopted this standard prospectively for the year-ended December 26, 2015.
In April 2015, the FASB issued ASU No. 2015-05, Customer’s Accounting for Fees Paid in a Cloud Computing Arrangement, which amends ASC 350. The amendments provide guidance as to whether a cloud computing arrangement (e.g., software as a service, platform as a service, infrastructure as a service, and other similar arrangements) includes a software license, and based on that determination, how to account for such arrangements. ASU 2015-05 is effective for fiscal years, and interim periods therein, beginning after December 15, 2015 and may be applied on either a prospective or retrospective basis. Early adoption is not permitted. We are currently evaluating the impact the adoption of ASU 2015-05 will have on our financial statements.
In February 2015, the FASB issued ASU No. 2015-02, Consolidation (Topic 810)-Amendments to the Consolidation Analysis, which amends the criteria for determining which entities are considered variable interest entities, or VIEs, amends the criteria for determining if a service provider possesses a variable interest in a VIE and ends the deferral granted to investment companies for application of the VIE consolidation model. ASU 2015-02 is effective for annual periods, and interim periods therein, beginning after December 15, 2015. We are currently evaluating the impact the adoption of Topic 810 will have on our financial statements.
In August 2014, the FASB issued ASU No. 2014-15, Disclosure of Uncertainties about an Entity's Ability to Continue as a Going Concern. ASU 2014-15 requires management to evaluate, at each annual or interim reporting period, whether there are conditions or events that exist that raise substantial doubt about an entity's ability to continue as a going concern within one year after the date the financial statements are issued and provide related disclosures. ASU 2014-15 is effective for annual periods ending after December 15, 2016 and earlier application is permitted. We are currently evaluating the impact of the adoption of ASU 2014-15, but the adoption is not expected to have a material effect on our consolidated financial statements or disclosures.
In May 2014, the FASB issued ASU No. 2014-09, Revenue from Contracts with Customers, which requires an entity to recognize the amount of revenue to which it expects to be entitled for the transfer of promised goods or services to customers. ASU 2014-09 will replace most existing revenue recognition guidance in U.S. GAAP when it becomes effective. In August 2015, the FASB issued ASU No. 2015-14, Revenue from Contracts with Customers (Topic 606): Deferral of the Effective Date, which deferred the effective date of ASU 2014-09 by one year to December 15, 2017 for interim and annual reporting periods beginning after that date. Early adoption is permitted but not before the original effective date of December 15, 2016. We are evaluating the effect that ASU 2014-09 will have on our consolidated financial statements and related disclosures. The standard permits the use of either the retrospective or cumulative effect transition method. We have not yet selected a transition method nor have we determined the effect of the standard on our ongoing financial reporting.
3. Business Acquisitions
Citrus Lane
On July 17, 2014, we acquired Citrus Lane, a social commerce service selling curated products designed for families for a total consideration of $22.9 million in cash and 0.4 million shares of common stock (valued at $3.8 million). In addition, up to $16.4 million in cash (valued at $14.5 million) and up to an additional 0.1 million shares of common stock (valued at $1.1 million) were payable in the event Citrus Lane achieves certain milestones in 2015 and 2016.
As part of the transaction, we also exchanged both vested and unvested options to purchase Citrus Lane common stock for options to purchase Care.com common stock at an exchange ratio implied by the value of the merger consideration received by the holders of outstanding Citrus Lane shares (valued at $1.0 million). In connection with this acquisition, we incurred approximately $1.8 million in direct acquisition costs which were expensed as incurred and are included in general and administrative expense in our consolidated statements of operations. Of the initial consideration value, $5.0 million was placed in an escrow account to secure indemnification obligations contained in the purchase agreement.
70
CARE.COM, INC.
NOTES TO CONDENSED CONSOLIDATED FINANCIAL STATEMENTS
YEARS ENDED DECEMBER 26, 2015, DECEMBER 27, 2014 AND DECEMBER 28, 2013
We recorded our estimate of the fair value of this contingent consideration based on the evaluation of the likelihood of the achievement of the contractual conditions that would result in the payment of the contingent consideration and weighted probability assumptions of these outcomes. The fair value of the liability was estimated using a discounted cash flow technique with significant inputs that are not observable in the market and thus represents a Level 3 fair value measurement as defined in ASC 820, Fair Value Measurements and Disclosures. The significant inputs in the Level 3 measurement not supported by market activity included our probability assessments of expected future cash flows related to our acquisition of Citrus Lane during the earn-out period, appropriately discounted considering the uncertainties associated with the obligation, and calculated in accordance with the terms of the merger agreement. There were no changes in the probability of the earn-out payment through December 26, 2015. The cash portion of the contingent consideration liability has been discounted to reflect the time value of money, and therefore, as the milestone dates approach, the fair value of this liability will increase. This increase in fair value was recorded in net loss from discontinued operations in the accompanying consolidated statements of operations. The results of operations for Citrus Lane have been included discontinued operations in our consolidated financial statements since the date of acquisition.
Identifiable Intangible Assets
As part of the preliminary purchase price allocation, we determined that Citrus Lane's primary separately identifiable intangible assets were its proprietary software and trade name. We used a hybrid approach to value the proprietary software. This approach incorporates elements of the income and cost approaches, specifically the lost profits and replacement cost methods. We used a relief from royalty method to value the trade name. This method assumes that a willing buyer would pay a royalty for the use of an asset, rather than incurring the costs associated with internally developing an asset of identical utility. The fair value is calculated by taking the present value of avoided after-tax cash flows discounted back to a present value. The baseline data for this analysis was the cash flow estimates used to price the transaction. Cash flows were forecasted for each intangible asset then discounted based on an appropriate discount rate. The 22.5% discount rate applied was benchmarked with reference to the implied rate of return from the transaction model, as well as an estimate of a market participant's weighted-average cost of capital based on the capital asset pricing model.
In estimating the useful life of the acquired assets, we considered ASC 350-30-35, Intangibles-Goodwill and Other, and reviewed the following: the expected use by the combined company of the assets acquired, the expected useful life of another asset (or group of assets) related to the acquired assets, legal, regulatory or other contractual provisions that may limit the useful life of an acquired asset or may enable the extension of the useful life of an acquired asset without substantial cost, the effects of obsolescence, demand, competition and other economic factors, and the level of maintenance expenditures required to obtain the expected future cash flows from the asset.
We amortize these intangible assets over their estimated useful lives using a method that is based on estimated future cash flows, as we believe this will approximate the pattern in which the economic benefits of the assets will be utilized, or where we have concluded that the cash flows were not reliably determinable, on a straight-line basis.
71
CARE.COM, INC.
NOTES TO CONDENSED CONSOLIDATED FINANCIAL STATEMENTS
YEARS ENDED DECEMBER 26, 2015, DECEMBER 27, 2014 AND DECEMBER 28, 2013
Allocation of Purchase Price
The acquisition was accounted for as a business combination under FASB ASC Topic 805, Business Combinations (“ASC 805”). The purchase price was assigned to the assets acquired and liabilities assumed based on their estimated fair values. A summary of the purchase price allocation for the acquisition of Citrus Lane is as follows (in thousands):
Total purchase consideration | |||
Cash | $ | 22,881 | |
Fair value of common stock | 3,844 | ||
Fair value of contingent acquisition consideration | 15,600 | ||
Fair value of stock options exchanged | 1,026 | ||
Total purchase price | $ | 43,351 | |
Allocation of purchase consideration | |||
Tangible assets | $ | 2,843 | |
Liabilities assumed | (4,098 | ) | |
Identifiable intangible assets | 4,600 | ||
Deferred tax liabilities | (1,855 | ) | |
Goodwill | 41,861 | ||
Total purchase price | $ | 43,351 | |
The fair value of the stock options exchanged and recorded as purchase price represents the fair value of the Citrus Lane options converted into options to purchase our common stock attributable to pre-combination services pursuant to ASC 805, Business Combinations. The remainder of the fair value of these options of $1.4 million is being recognized as stock-based compensation expense in net loss from discontinued operations over the remaining vesting period, which is approximately 2.6 years. We estimated fair value of the stock options using a binomial valuation model with the following weighted-average assumptions: risk free rate of 1.8%, expected volatility of 49.4%, expected life of 5.4 years and dividend of 0.0%. The weighted-average fair value of stock options granted was $9.34 per share. We also recorded stock-based compensation expense of approximately $1.4 million related to the acceleration of vesting of certain equity awards assumed as part of the Citrus Lane acquisition within net loss from discontinued operations.
The estimated fair values for specifically identifiable intangible assets acquired were as follows (in thousands):
Weighted-average amortization period (in years) | |||||
Proprietary software | $ | 3,000 | 7 | ||
Trade-names | 1,600 | 10 | |||
Total purchase price | $ | 4,600 | |||
72
CARE.COM, INC.
NOTES TO CONDENSED CONSOLIDATED FINANCIAL STATEMENTS
YEARS ENDED DECEMBER 26, 2015, DECEMBER 27, 2014 AND DECEMBER 28, 2013
The sellers are also entitled to additional contingent consideration (“Earn-Out”) based upon the performance of the business acquired during a two year period spanning from July 17, 2014 through July 17, 2016. This consideration is based on the ability to introduce new product offerings or product options to Citrus Lane customers. In the event the Earn-Out targets are achieved, we are required to make payments of $8.2 million in each of the periods ended September 26, 2015 and September 24, 2016, respectively. The estimated fair value of the contingent consideration was determined to be $15.2 million at the acquisition date and was initially recorded in current and non-current contingent acquisition consideration on our consolidated balance sheet. There is also a component of the contingent consideration payable in common stock, which is based on a fixed number of shares on each of the periods ended September 26, 2015 and September 24, 2016, and has been recorded as permanent equity in purchase accounting using the acquisition date stock price part of our purchase accounting. We determined the future estimated fair value for the contingent consideration by applying a present value calculation of probable earn-out payments using an appropriate discount rate for us. We recorded charges of $0.6 million due to the accretion of changes in the valuation of contingent consideration, reported loss from discontinued operations. In addition, certain former employees of Citrus Lane may receive two annual contingent payments (subject to adjustment) not to exceed $1.4 million (the “Employee Bonus Pool”). A portion of the Employee Bonus Pool, $0.3 million, is based on the achievement of the Earn-Out targets noted earlier as well as the individual remaining employed by Care.com. The remaining $1.1 million is based solely on the individuals remaining employed by Care.com. Each annual payment is payable after the first and second anniversaries, from the date of acquisition, provided the individuals remain employed by Care.com on such dates. In case of separation, the Employee Bonus Pool attributable to the terminated employee is reallocated to the remaining employees. As a result of our decision to discontinue the Citrus Lane business, these benefits were no longer payable, and as such we reversed any unpaid bonuses previously accrued in the fourth quarter of fiscal 2015, which result in a gain of $0.7 million.
The excess of the purchase price over the estimated fair value of the net tangible assets and intangible assets acquired was recorded as goodwill. The factors contributing to the recognition of the amount of goodwill are based on several strategic and synergistic benefits that are expected to be realized from the Citrus Lane acquisition. None of the goodwill is expected to be deductible for income tax purposes. Refer to Note 2 - Significant Accounting Policies.
Pro forma Information
The following unaudited pro forma financial information presents the combined results of operations of Care.com and Citrus Lane as if the acquisition had occurred on January 1, 2013, after giving effect to certain pro forma adjustments. The pro forma adjustments reflected herein include only those adjustments that are directly attributable to the Citrus Lane acquisition, factually supportable, and expected to have a continuing impact on us. Actual 2014 impairment charges were excluded from the pro forma results below. The pro forma financial information does not reflect any adjustments for anticipated synergies resulting from the acquisition and is not necessarily indicative of the operating results that would have actually occurred had the transaction been consummated on January 1, 2013.
Pro Forma | |||||||||||
Fiscal Year Ended | |||||||||||
December 26, 2015 | December 27, 2014 | December 28, 2013 | |||||||||
Revenue | $ | 138.7 | $ | 110.7 | $ | 87.2 | |||||
Net loss | $ | (26.3 | ) | $ | (45.8 | ) | $ | (35 | ) | ||
Consmr
On March 3, 2014, we entered into an agreement with Consmr, Inc. (“Consmr”), the developer of a mobile application for ratings and reviews of consumer products, pursuant to which we acquired the right to hire all employees of Consmr for total consideration of $0.6 million. Approximately $0.1 million of the purchase price was held back and is payable in one year subject to the continuing employment of the employees. Such amount is being recognized as compensation expense over the required employment period. The transaction is presented as an acquisition of a business and the consideration transferred, except for the amount held back, was recorded as goodwill.
As a result of this transaction, on March 4, 2014 all former employees of Consmr became employees of Care.com. Pro forma information related to Consmr is not presented as the impact of the acquisition on our consolidated results of operations is not significant.
73
CARE.COM, INC.
NOTES TO CONDENSED CONSOLIDATED FINANCIAL STATEMENTS
YEARS ENDED DECEMBER 26, 2015, DECEMBER 27, 2014 AND DECEMBER 28, 2013
4. Discontinued Operations
During the third quarter of fiscal 2015 we made the decision to exit the Citrus Lane business through either a sale or wind-down as it was no longer a strategic priority. In the fourth quarter of fiscal 2015, we made the decision to shut down the business and had substantially completed our plans for exiting the business. As such, financial results of Citrus Lane have been presented as loss from discontinued operations, net of tax on the consolidated statements of operations for the fiscal years ended December 26, 2015 and December 27, 2014. Assets and liabilities of Citrus Lane to be disposed of are presented as assets from discontinued operations and liabilities from discontinued operations on the consolidated balance sheet as of December 26, 2015 and December 27, 2014.
The following table presents financial results of the Citrus Lane business included in loss from discontinued operations, net of tax for the fiscal years ended December 26, 2015 and December 27, 2014 (in thousands):
Fiscal Year Ended | |||||||
December 26, 2015 | December 27, 2014 | ||||||
Revenue | $ | 11,530 | $ | 6,001 | |||
Cost of revenue | 11,849 | 6,882 | |||||
Operating expenses: | |||||||
Selling and marketing | 2,229 | 2,017 | |||||
Research and development | 904 | 768 | |||||
General and administrative | 2,698 | 2,764 | |||||
Impairment of goodwill and intangible assets | 8,766 | 36,227 | |||||
Depreciation and amortization | 99 | 76 | |||||
Operating loss | (15,015 | ) | (42,733 | ) | |||
Other expense, net | (30 | ) | — | ||||
Loss from discontinued operations before income taxes | (15,045 | ) | (42,733 | ) | |||
Loss on disposal of assets before income taxes | (2,071 | ) | — | ||||
Provision for income tax | — | — | |||||
Loss from discontinued operations | $ | (17,116 | ) | $ | (42,733 | ) | |
For further details on the impairment of goodwill and intangible assets please refer to Note 2 of these Notes to Consolidated Financial Statements.
The major components of current assets and current liabilities of the Citrus Lane business were as follows (in thousands):
74
CARE.COM, INC.
NOTES TO CONDENSED CONSOLIDATED FINANCIAL STATEMENTS
YEARS ENDED DECEMBER 26, 2015, DECEMBER 27, 2014 AND DECEMBER 28, 2013
December 26, 2015 | December 27, 2014 | ||||||
Assets | |||||||
Accounts receivable | $ | 92 | $ | 62 | |||
Prepaid expenses and other current assets | 28 | 484 | |||||
Inventory | 319 | 2,626 | |||||
Total current assets | 439 | 3,172 | |||||
Property and equipment, net | 9 | 32 | |||||
Intangible assets, net | — | 1,900 | |||||
Goodwill | — | 8,050 | |||||
Total assets | $ | 448 | $ | 13,154 | |||
Liabilities | |||||||
Accounts payable | $ | 435 | $ | 1,139 | |||
Accrued expenses and other liabilities | 1,325 | 1,066 | |||||
Deferred revenue | 82 | 1,874 | |||||
Current contingent acquisition consideration | 16,041 | 7,840 | |||||
Total current liabilities | 17,883 | 11,919 | |||||
Total non-current liabilities of discontinued operations | — | 7,267 | |||||
Total liabilities | $ | 17,883 | $ | 19,186 | |||
5. Goodwill and Intangible Assets
The following table presents the change in goodwill for our single reporting unit during the periods presented (in thousands):
Balance as of December 27, 2014 | $ | 60,635 | |
Effect of currency translation | (2,004 | ) | |
Balance as of December 26, 2015 | $ | 58,631 | |
75
CARE.COM, INC.
NOTES TO CONDENSED CONSOLIDATED FINANCIAL STATEMENTS
YEARS ENDED DECEMBER 26, 2015, DECEMBER 27, 2014 AND DECEMBER 28, 2013
The following table presents the detail of intangible assets for the periods presented (dollars in thousands):
Gross Carrying Value | Accumulated Amortization | Net Carrying Value | Weighted-Average Remaining Life (Years) | ||||||||||
December 26, 2015 | |||||||||||||
Indefinite lived intangibles | $ | 242 | $ | — | $ | 242 | N/A | ||||||
Trademarks and trade names | 4,417 | (4,133 | ) | 284 | 3.5 | ||||||||
Proprietary software | 4,751 | (3,802 | ) | 949 | 1.6 | ||||||||
Website | 50 | (44 | ) | 6 | 0.6 | ||||||||
Training materials | 30 | (30 | ) | — | 0.0 | ||||||||
Non-compete agreements | 130 | (111 | ) | 19 | 1.6 | ||||||||
Leasehold interests | 170 | (86 | ) | 84 | 3.4 | ||||||||
Caregiver relationships | 285 | (285 | ) | — | 0.0 | ||||||||
Customer relationships | 8,782 | (6,977 | ) | 1,805 | 3.1 | ||||||||
Total | $ | 18,857 | $ | (15,468 | ) | $ | 3,389 | ||||||
December 27, 2014 | |||||||||||||
Indefinite lived intangibles | $ | 242 | $ | — | $ | 242 | N/A | ||||||
Trademarks and trade names | 4,481 | (3,377 | ) | 1,104 | 2.0 | ||||||||
Proprietary software | 4,942 | (3,351 | ) | 1,591 | 2.5 | ||||||||
Website | 50 | (34 | ) | 16 | 1.6 | ||||||||
Training materials | 30 | (20 | ) | 10 | 1.0 | ||||||||
Non-compete agreements | 137 | (94 | ) | 43 | 2.0 | ||||||||
Leasehold interests | 170 | (61 | ) | 109 | 4.4 | ||||||||
Caregiver relationships | 312 | (252 | ) | 60 | 0.7 | ||||||||
Customer relationships | 8,857 | (4,967 | ) | 3,890 | 2.9 | ||||||||
Total | $ | 19,221 | $ | (12,156 | ) | $ | 7,065 | ||||||
Amortization expense was $3.6 million and $4.2 million for the fiscal years ended December 26, 2015 and December 27, 2014, respectively. Of these amounts $2.9 million and $3.4 million was classified as a component of depreciation and amortization, and $0.7 million and $0.8 million was classified as a component of cost of revenue in the consolidated statements of operations for the fiscal years ended December 26, 2015 and December 27, 2014, respectively.
As of December 26, 2015, the estimated future amortization expense related to current intangible assets for future fiscal years was as follows (in thousands):
2016 | $ | 1,951 | |
2017 | 547 | ||
2018 | 202 | ||
2019 | 145 | ||
2020 | 96 | ||
Thereafter | 206 | ||
Total | $ | 3,147 | |
6. Accrued Expenses and Other Current Liabilities
The following table presents the detail of accrued expenses and other current liabilities for the periods presented (in thousands):
76
CARE.COM, INC.
NOTES TO CONDENSED CONSOLIDATED FINANCIAL STATEMENTS
YEARS ENDED DECEMBER 26, 2015, DECEMBER 27, 2014 AND DECEMBER 28, 2013
December 26, 2015 | December 27, 2014 | ||||||
Payroll and compensation | $ | 5,167 | $ | 1,830 | |||
Tax-related expense | 801 | 804 | |||||
Marketing expenses | 3,451 | 3,385 | |||||
Other accrued expenses | 2,994 | 5,648 | |||||
Total accrued expenses and other current liabilities | $ | 12,413 | $ | 11,667 | |||
7. Commitments and Contingencies
Leases
We have entered into various operating lease agreements, primarily covering certain of our offices throughout the world, with original lease periods expiring between 2015 and 2025. Facilities rent expense under these operating leases was $5.2 million and $3.7 million for the years ended December 26, 2015 and December 27, 2014, respectively. We are responsible for paying our share of the actual operating expenses and real estate taxes under certain of these lease agreements.
Certain of these arrangements have renewal or expansion options, as well as adjustments for market provisions, such as free or escalating base monthly rental payments. We recognize rent expense under such arrangements on a straight-line basis over the initial term of the lease. The difference between the straight-line expense and the cash paid for rent has been recorded as deferred rent in the consolidated balance sheets.
At December 26, 2015, minimum future lease commitments under all non-cancelable operating leases (including rent escalation clauses) were as follows (in millions):
Payments Due by Period | |||||||||||||||||||
Total | Less than 1 Year | 1-3 Years | 4-5 Years | Thereafter | |||||||||||||||
Operating lease obligations | $ | 43.1 | $ | 4.3 | $ | 9.0 | $ | 9.8 | $ | 20.0 | |||||||||
In July 2014, we entered into a lease agreement pursuant to which we agreed to lease office space to be used for our new headquarters (the “Prime Lease”). The Prime Lease is initially for 36,174 square feet of office space, comprising of the entire sixth floor of the building located at 77 Fourth Avenue, Waltham, Massachusetts, or the Building. The leased premises under the Prime Lease will increase by an additional 36,395 square feet, comprising of the entire fourth floor of the Building, on March 1, 2019 and by an additional 36,174 square feet, comprising of the entire fifth floor of the Building, on April 1, 2019. The term of the Prime Lease commences on August 4, 2014 and expires 120 months from the date base rent payments first become due, which date is the earlier of January 1, 2015 and the date we commence operations in the space. We recorded deferred rent on the consolidated balance sheet. We recognize rent expense on a straight-line basis over the expected lease term. The total cash obligation for the base rent over the term of the Prime Lease will be $34.5 million, and is included in the table above.
Also in July 2014, we entered into two sublease agreements pursuant to which we agreed to lease the entire fourth and fifth floors of the Building. The term of the fourth floor sublease commenced on December 22, 2014 and expires on February 15, 2019, after which the space will be leased by us pursuant to the Prime Lease. The total cash obligation for the base rent over the term of this sublease will be $4.3 million, and is included in the table above. The term of the fifth floor sublease commence on January 1, 2015 and expires on March 30, 2019, after which the space will be leased by us pursuant to the Prime Lease. The lease commencement date for accounting purposes was determined to be August 4, 2014, which represents the date we received access to the fourth and fifth floors. The total cash obligation for the base rent over the term of this sublease will be $4.1 million, and is included in the table above. We have the right to extend the term of the lease agreement for one 10-year period.
We received $2.3 million as tenant improvements allowance under the terms of our new operating lease, which we recorded as deferred rent are amortizing on a straight-line basis over the term of the lease as an offset to rent expense.
In connection with the Prime Leases, we paid $2.8 million in security deposits recorded within other non-current assets on our consolidated balance sheet as of December 26, 2015.
77
CARE.COM, INC.
NOTES TO CONDENSED CONSOLIDATED FINANCIAL STATEMENTS
YEARS ENDED DECEMBER 26, 2015, DECEMBER 27, 2014 AND DECEMBER 28, 2013
In connection with the execution of the Prime Lease, we entered into an amendment to our lease agreement for our current headquarters pursuant to which that agreement will terminate without penalty on the earlier of (i) ten days after the date we commenced operations under the Prime Lease and (ii) December 31, 2014.
We recognized total rent expense related to the current and new headquarters of approximately $4.2 million, $2.7 million and $1.6 million for the years ended December 26, 2015, December 27, 2014 and December 28, 2013, respectively.
Legal matters
From time to time, we have or may become party to litigation incident to the ordinary course of business. We assess the likelihood of any adverse judgments or outcomes with respect to these matters and determine loss contingency assessments on a gross basis after assessing the probability of incurrence of a loss and whether a loss is reasonably estimable. In addition, we consider other relevant factors that could impact our ability to reasonably estimate a loss. A determination of the amount of reserves required, if any, for these contingencies is made after analyzing each matter. Our reserve may change in the future due to new developments or changes in strategy in handling these matters. Although the results of litigation and claims cannot be predicted with certainty, we currently believe that the final outcome of all pending matters will not have a material adverse effect on our business, consolidated financial position, results of operations, or cash flows. Regardless of the outcome, litigation can adversely impact us due to defense and settlement costs, diversion of management resources, and other factors.
8. Stockholders’ Equity (Deficit)
Initial Public Offering (IPO)
On January 29, 2014, we closed our IPO in which we sold and issued 6,152,500 shares of common stock, including 802,500 shares of common stock pursuant to the exercise of the underwriters’ option to purchase additional shares, which were sold to the public at a price of $17.00 per share. We received net proceeds of approximately $94.8 million from the IPO, including the exercise of the underwriters’ over-allotment option, net of underwriters’ discounts and commissions, and after deducting offering expenses of approximately $2.4 million.
Upon the closing of the IPO, all shares of our outstanding redeemable convertible preferred stock automatically converted into 21,490,656 shares of common stock and our outstanding warrant to purchase redeemable convertible preferred stock automatically converted into a warrant to purchase 40,697 shares of common stock at $1.72 per share.
Stock-Based Compensation
Stock Option Plans
On November 15, 2006, we adopted our 2006 Stock Incentive Plan (‘‘the 2006 Plan’’), which provides for the issuance of incentive and non-qualified stock options, restricted stock and other stock-based awards to employees and non-employees of the Company. We reserved 4,567,500 shares of common stock for issuance under the 2006 Plan. Options generally vest over four years, with 25% vesting upon the one year anniversary of the date of hire, and the remaining 75% vesting quarterly over the next 3 years. Options granted to consultants or other non-employees generally vest over the expected service period to the Company. The options expire ten years from the date of grant. We issue new shares to satisfy stock option exercises. Only stock options have been issued under the 2006 Plan. No grants have been made under the 2006 Plan since our IPO, and no further awards will be granted under the 2006 Plan. However, the 2006 Plan will continue to govern outstanding awards granted under the 2006 Plan.
During 2010, we granted our Chief Executive Officer (“CEO”) a performance-based option to purchase 150,000 shares, which vests in tranches if defined corporate goals are achieved during fiscal years 2011 through 2014. We recorded a share-based compensation expense related to this award of $0.2 million during the year ended December 28, 2013. No stock-based compensation expense related to this award was recorded in the year ended December 27, 2014, as the performance metrics were not achieved.
On January 23, 2014, we adopted our 2014 Incentive Award Plan (‘‘the 2014 Plan’’), which provides for the issuance of incentive and non-qualified stock options, restricted stock, restricted stock units (“RSUs”) and other stock-based awards to employees, directors and non-employees of the Company and our subsidiaries. We initially reserved 4,112,048 shares of common stock for issuance under the 2014 Plan. The number of shares initially available for issuance will be increased by (i) the number of shares represented by awards outstanding under the 2006 Plan that are forfeited, lapse unexercised or are settled in cash and which following the effective date of the 2014 Plan are not issued under the 2006 Plan and (ii) an annual increase on January 1 of each calendar year beginning in 2015 and ending in 2019, equal to the lesser of (A) 4% of the shares of common stock outstanding (on an as-converted basis) on the final day of the immediately preceding calendar year and (B) an
78
CARE.COM, INC.
NOTES TO CONDENSED CONSOLIDATED FINANCIAL STATEMENTS
YEARS ENDED DECEMBER 26, 2015, DECEMBER 27, 2014 AND DECEMBER 28, 2013
amount as determined by our board of directors. No more than 5,002,935 shares of common stock may be issued upon the exercise of incentive stock options. Options generally vest over four years, with 25% vesting upon the one-year anniversary of the date of hire, and the remaining 75% vesting quarterly over the next 3 years. Options granted to consultants or other non-employees generally vest over the expected service period to the Company. The options expire ten years from the date of grant. To date stock options and RSUs have been issued under the 2014 Plan.
We assumed certain other plans in connection with the Citrus Lane acquisition and no shares are available for future grant under these plans.
Stock-Based Compensation
The following table summarizes stock-based compensation in our accompanying condensed consolidated statements of operations (in thousands):
Fiscal Year Ended | |||||||||||
December 26, 2015 | December 27, 2014 | December 28, 2013 | |||||||||
Cost of revenue | $ | 236 | $ | 156 | $ | 161 | |||||
Selling and marketing | 813 | 582 | 348 | ||||||||
Research and development | 760 | 437 | 356 | ||||||||
General and administrative | 3,116 | 2,704 | 997 | ||||||||
Loss from discontinued operations | 589 | 1,926 | — | ||||||||
Total stock-based compensation | $ | 5,514 | $ | 5,805 | $ | 1,862 | |||||
Included in loss from discontinued operations for the fiscal year ended December 27, 2014 is approximately $1.4 million related to the acceleration of vesting of certain equity awards assumed as part of the Citrus Lane acquisition.
Pursuant to the 2014 Plan, during fiscal 2015 we granted 1.7 million time-based RSUs to certain employees and directors and 0.3 million performance based RSUs to certain members of senior management. Each recipient of performance based RSUs is eligible to receive up to 100% of the shares granted on the achievement of certain financial targets for fiscal 2015 and which will vest over a four-year period retroactive to either March or April 2015. As we did not meet the performance targets, no expense has been recognized on these awards and they were canceled as of December 26, 2015.
RSUs are not included in issued and outstanding common stock until the shares are vested and released. The fair value of the RSUs is measured based on the market price of the underlying common stock as of the date of grant, reduced by the purchase price of $0.001 per share. The weighted average grant-date fair value per share and the total fair value of vested shares from the RSU grants was $7.78 and $1.7 million, respectively, for the year ended December 26, 2015. No RSUs were granted during the years ended December 27, 2014 and December 28, 2013.
During the year ended December 26, 2015, no stock options were granted. During the years ended December 27, 2014 and December 28, 2013, we granted 1.6 million and 1.3 million stock options, respectively with weighted-average exercise price per share of $11.15 and $6.05, respectively.
The following table presents the assumptions used to estimate the fair value of options granted during the periods presented:
Fiscal Year Ended | |||||
December 26, 2015 | December 27, 2014 | December 28, 2013 | |||
Risk-free interest rate | N/A | 1.81 - 1.95 % | 1.23 - 2.00% | ||
Expected term (years) | N/A | 6.25 | 6.25 | ||
Volatility | N/A | 47.1 - 56.3 % | 44.6% | ||
Expected dividend yield | N/A | — | — | ||
79
CARE.COM, INC.
NOTES TO CONDENSED CONSOLIDATED FINANCIAL STATEMENTS
YEARS ENDED DECEMBER 26, 2015, DECEMBER 27, 2014 AND DECEMBER 28, 2013
A summary of stock option activity for the year ended December 26, 2015 was as follows (in thousands for shares and intrinsic value):
Stock Options | Restricted Stock Units | ||||||||||||||||||
Shares | Weighted-Average Remaining Contractual Term (Years) | Weighted-Average Exercise Price | Aggregate Intrinsic Value | Shares | Weighted-Average Grant Date Fair Value | ||||||||||||||
Outstanding as of December 27, 2014 | 4,270 | 7.17 | $ | 6.47 | $ | 14,373 | — | $ | — | ||||||||||
Granted (1) | — | — | 1,947 | 7.49 | |||||||||||||||
Settled (RSUs) | — | — | (214 | ) | 7.78 | ||||||||||||||
Exercised | (257 | ) | 2.22 | — | — | ||||||||||||||
Canceled and forfeited | (531 | ) | 8.2 | (427 | ) | 7.6 | |||||||||||||
Outstanding as of December 26, 2015 | 3,482 | 5.93 | $ | 6.52 | $ | 8,891 | 1,306 | $ | 7.42 | ||||||||||
Vested and exercisable as of December 26, 2015 | 2,769 | 5.49 | 5.29 | 8,421 | — | — | |||||||||||||
Vested and expected to vest as of December 26, 2015 | 3,404 | 5.88 | $ | 6.37 | $ | 8,860 | 1,056 | 7.42 | |||||||||||
____________________________
(1) For RSUs, includes both time-based and performance-based restricted stock units
(2) Options and RSUs expected to vest reflect an estimated forfeiture rate
Aggregate intrinsic value represents the difference between the closing stock price of our common stock and the exercise price of outstanding, in-the-money options. Our closing stock price as reported on the New York Stock Exchange as of December 26, 2015 was $7.27. The total intrinsic value of options exercised and RSUs vested was approximately $2.9 million, for the year ended December 26, 2015. The aggregate fair value of the options that vested during the year ended December 26, 2015 was $3.7 million.
As of December 26, 2015, total unrecognized compensation cost, adjusted for estimated forfeitures, related to non-vested stock options and RSUs was approximately $3.3 million and $7.3 million, respectively, which is expected to be recognized over a weighted-average period of 1.6 years and 3.3 years, respectively, to the extent they are probable of vesting. As of December 26, 2015, we had 3,337,574 shares available for grant under the 2014 Plan.
Common Stock
As of December 26, 2015, we had reserved the following shares of common stock for future issuance in connection with the following:
December 26, 2015 | ||
Contingent consideration payable in common stock | 106,000 | |
Options issued and outstanding | 3,481,750 | |
Restricted stock units issued and outstanding | 1,305,628 | |
Common stock available for stock-based award grants under incentive award plans | 3,337,574 | |
Total | 8,230,952 | |
80
CARE.COM, INC.
NOTES TO CONDENSED CONSOLIDATED FINANCIAL STATEMENTS
YEARS ENDED DECEMBER 26, 2015, DECEMBER 27, 2014 AND DECEMBER 28, 2013
Preferred Stock Warrants
In connection with a debt financing in 2007, we issued Lighthouse Capital Partners a warrant to purchase 40,697 shares of our Series A-1 convertible preferred stock at an exercise price of $1.72 per share, expiring October 2014, which were fully exercisable upon issuance. In conjunction with the closing of our IPO in January 2014, the warrant was automatically converted into a warrant exercisable for 40,697 shares of common stock at a purchase price of $1.72 per share, which resulted in the reclassification of the related convertible preferred stock warrant liability to additional paid-in capital as the warrant met the criteria for equity classification upon conversion to a warrant to purchase common stock. In accordance with ASC 480-10, Distinguishing Liabilities from Equity, the freestanding warrant for our preferred stock was recognized as a liability and recorded at fair value in all periods prior to its conversion into a warrant to purchase common stock. The warrant liability was re-measured to fair value prior to reclassification to additional paid-in capital. The warrant was exercised during the year ended December 27, 2014 using a net exercise method which resulted in the issuance of 38,142 shares of common stock. There were no proceeds received by us related to this transaction.
Common Stock Warrants
In connection with a 2010 Loan and Security Agreement, we issued a warrant to purchase a maximum of 40,000 shares of our common stock at an exercise price of $1.65 per share. The warrant was exercised during the year ended December 27, 2014 using a net exercise method which resulted in the issuance of 37,591 shares of common stock. There were no proceeds received by us related to this transaction.
9. Net Loss Per Share
Basic net loss per share is computed by dividing net loss attributable to common shareholders by the weighted-average number of common shares outstanding during the period. The holders of our Series A, A-1, B, C, D, D-1 and E redeemable convertible preferred stock did not have contractual obligations to share in or fund our losses. Diluted net loss per share attributable to common shareholders is computed by dividing net loss by the weighted-average number of common shares outstanding during the period and potentially dilutive common stock equivalents, except in cases where the effect of common stock equivalent would be anti-dilutive. Potential common stock equivalents consist of common stock issuable upon exercise of stock options and in 2013 also included common stock issuable upon conversion of our redeemable convertible preferred stock and warrants to purchase our redeemable convertible preferred stock.
The following table presents the calculation of basic and diluted net loss per share (in thousands, except per share data):
Fiscal Year Ended | |||||||||||
December 26, 2015 | December 27, 2014 | December 28, 2013 | |||||||||
Loss from continuing operations | $ | (17,879 | ) | $ | (37,559 | ) | $ | (28,296 | ) | ||
Loss from discontinued operations, net of tax (see note 4) | (17,116 | ) | (42,733 | ) | — | ||||||
Net loss | (34,995 | ) | (80,292 | ) | (28,296 | ) | |||||
Accretion of preferred stock | — | (4 | ) | (57 | ) | ||||||
Net loss attributable to common stockholders | $ | (34,995 | ) | $ | (80,296 | ) | $ | (28,353 | ) | ||
Net loss per share attributable to common stockholders (Basic and Diluted): | |||||||||||
Loss from continuing operations | $ | (0.56 | ) | $ | (1.30 | ) | $ | (9.45 | ) | ||
Loss from discontinued operations | (0.53 | ) | (1.47 | ) | — | ||||||
Net loss per share | $ | (1.09 | ) | $ | (2.77 | ) | $ | (9.45 | ) | ||
Weighted-average shares used to compute net loss per share attributable to common stockholders: | |||||||||||
Basic and diluted | 32,001 | 28,941 | 3,000 | ||||||||
The following equity shares were excluded from the calculation of diluted net loss per share attributable to common stockholders because their effect would have been anti-dilutive for the periods presented (in thousands):
81
CARE.COM, INC.
NOTES TO CONDENSED CONSOLIDATED FINANCIAL STATEMENTS
YEARS ENDED DECEMBER 26, 2015, DECEMBER 27, 2014 AND DECEMBER 28, 2013
Fiscal Year Ended | ||||||||
December 26, 2015 | December 27, 2014 | December 28, 2013 | ||||||
Redeemable convertible preferred stock | — | — | 21,299 | |||||
Stock options | 3,482 | 4,270 | 3,439 | |||||
Restricted stock units | 1,306 | — | — | |||||
Preferred stock warrants | — | — | 41 | |||||
Common stock warrants | — | — | 40 | |||||
10. Income Taxes
The following table presents domestic and foreign components of loss from continuing operations before income taxes for the periods presented (in thousands):
Fiscal Year Ended | |||||||||||
December 26, 2015 | December 27, 2014 | December 28, 2013 | |||||||||
United States | $ | (13,318 | ) | $ | (32,730 | ) | $ | (22,182 | ) | ||
Foreign | (3,340 | ) | (5,581 | ) | (5,760 | ) | |||||
Loss from continuing operations before income taxes | $ | (16,658 | ) | $ | (38,311 | ) | $ | (27,942 | ) | ||
The following table presents the components of the provision for (benefit from) income taxes for the periods presented (in thousands):
Fiscal Year Ended | |||||||||||
December 26, 2015 | December 27, 2014 | December 28, 2013 | |||||||||
Current: | |||||||||||
Federal | $ | — | $ | — | $ | — | |||||
State | 94 | 108 | 70 | ||||||||
Foreign | 33 | 33 | — | ||||||||
Total current provision for income taxes | 127 | 141 | 70 | ||||||||
Deferred: | |||||||||||
Federal | 883 | (757 | ) | 626 | |||||||
State | 211 | (136 | ) | 49 | |||||||
Foreign | — | — | (391 | ) | |||||||
Total deferred tax provision (benefit) | 1,094 | (893 | ) | 284 | |||||||
Total provision for (benefit from) income taxes | $ | 1,221 | $ | (752 | ) | $ | 354 | ||||
See Note 4 - Discontinued Operations for the losses from discontinued operations before income taxes and related income taxes reported for the year ended December 26, 2015 and December 27, 2014, respectively. All pre-tax loss presented in discontinued operations were related to U.S. operations.
82
The following table presents a reconciliation of the statutory federal rate, and our effective tax rate on losses from continuing operations, for the periods presented:
Fiscal Year Ended | ||||||||
December 26, 2015 | December 27, 2014 | December 28, 2013 | ||||||
U.S. federal taxes at statutory rate | 34 | % | 34 | % | 34 | % | ||
State income taxes, net of federal benefit | (1 | ) | — | 2 | ||||
Permanent differences | (3 | ) | (3 | ) | (3 | ) | ||
Foreign rate differential | (1 | ) | (1 | ) | (1 | ) | ||
Change in valuation allowance - U.S. | (31 | ) | (24 | ) | (28 | ) | ||
Change in valuation allowance - foreign | (5 | ) | (4 | ) | (5 | ) | ||
Total | (7 | )% | 2 | % | (1 | )% | ||
During fiscal 2015 we recorded an income tax expense of $1.2 million, primarily related to amortization of certain goodwill for tax purposes for which there is no corresponding book deduction and certain state taxes based on operating income that are payable without regard to our tax loss carry forwards.
During fiscal 2014 we recorded an income tax benefit of $(0.8) million, primarily related to the reversal of our valuation allowance against the deferred tax liabilities recorded in purchase accounting, partially offset by the income tax expense related to the amortization of goodwill for tax purposes for which there is no corresponding book deduction and certain state taxes based on operating income that are payable without regard to our tax loss carry forwards.
During fiscal 2013 we recorded income tax expense of $0.4 million, primarily related to the amortization of goodwill for tax purposes for which there is no corresponding book deduction and certain state taxes based on operating income that are payable without regard to our tax loss carryforwards, partially offset by foreign deferred tax benefits, related to the expected future realization of German deferred tax assets expected to offset future reversal of deferred tax liabilities of definite lived intangibles established in purchase accounting.
Deferred income taxes reflect the net tax effects of temporary differences between the carrying amounts of assets and liabilities for financial reporting purposes and the amounts used for income tax purposes. In November 2015, the Financial Accounting Standards Board (“FASB”) issued Accounting Standards Update (ASU) No. 2015-17, Balance Sheet Classification of Deferred Taxes. ASU 2015-17 simplifies the presentation of deferred income taxes by eliminating the requirement for entities to separate deferred income tax liabilities and assets into current and non-current amounts in the balance sheet. Rather, it requires that deferred tax assets and liabilities are classified as non-current in the balance sheet. The Company adopted this standard prospectively for the year-ended December 26, 2015 and prior periods were not retrospectively adjusted. The following table presents the significant components of our deferred tax assets and liabilities, including those related to discontinued operations for the periods presented (in thousands):
83
Fiscal Year Ended | |||||||
December 26, 2015 | December 27, 2014 | ||||||
Deferred tax assets | |||||||
Net operating loss carryforwards | $ | 45,881 | $ | 40,790 | |||
Accrued expenses | 3,045 | 1,696 | |||||
Stock-based compensation | 1,922 | 1,618 | |||||
U.S. definite lived intangibles | 5,058 | 3,538 | |||||
Other temporary differences | 1,217 | 33 | |||||
Total deferred tax assets | 57,123 | 47,675 | |||||
Valuation allowance | (56,304 | ) | (46,619 | ) | |||
Net deferred tax assets | 819 | 1,056 | |||||
Deferred tax liabilities | |||||||
Foreign intangibles | (111 | ) | (224 | ) | |||
U.S. goodwill | (3,166 | ) | (2,072 | ) | |||
Fixed assets | (708 | ) | (832 | ) | |||
Total deferred tax liabilities | (3,985 | ) | (3,128 | ) | |||
Net deferred tax liabilities | $ | (3,166 | ) | $ | (2,072 | ) | |
As of December 26, 2015, we had federal net operating loss carryforwards of $111.3 million and state net operating loss carryforwards of $91.9 million, which may be available to reduce future taxable income. The net operating loss (‘‘NOL’’) will expire at various dates through 2035. Included in the federal and state net operating losses are deductions attributable to excess tax benefits from the exercises of stock compensation of $0.8 million and $0.7 million, respectively. The tax benefits attributable to these deductions are credited directly to additional paid-in capital upon utilization of these deferred tax assets to reduce taxes payable. As of December 26, 2015, we had foreign net operating losses primarily related to our German operations of $8.1 million, our U.K. operations of $3.7 million, and our Australia operations of $0.3 million that have an unlimited carryforward period under German, U.K. and Australia tax law. We also had foreign net operating losses in our Canadian operation of $0.9 million that have a twenty year carryforward.
The NOLs are subject to review and possible adjustment by the Internal Revenue Service and state tax authorities. NOL carryforwards may become subject to an annual limitation in the event of certain cumulative changes in the ownership interest of significant shareholders over a three-year period in excess of 50%, as defined under Sections 382 and 383 of the Internal Revenue Code, respectively, as well as similar state provisions. This could limit the amount of tax attributes that can be utilized annually to offset future taxable income or tax liabilities. The amount of the annual limitation is determined based on the value of the company immediately prior to the ownership change. Subsequent ownership changes may further affect the limitation in future years. We have not, as yet, conducted a study to determine if any such changes have occurred that could limit our ability to use the net operating losses and tax credit carryforwards. We will complete a full analysis of the tax attribute carryforwards prior to any utilization.
ASC 740 requires a valuation allowance to reduce the deferred tax assets if, based on the weight of available evidence, it is more likely than not that some portion or all of the deferred tax assets will not be realized. After consideration of all the evidence, both positive and negative, we have recorded a valuation allowance of $56.3 million and $46.6 million at December 26, 2015 and December 27, 2014, respectively, because our management has determined that is it more likely than not that these assets will not be fully realized. The increase of $9.7 million in the overall valuation allowance relates primarily to U.S. and certain foreign operating losses for which we currently provide no tax benefit.
As of December 26, 2015 and December 27, 2014, the Company had no recorded liabilities for uncertain tax positions. Interest and penalty charges, if any, related to uncertain tax positions would be classified as income tax expense in the accompanying consolidated statements of operations. As of December 26, 2015, December 27, 2014 and December 28, 2013 we had no accrued interest or penalties related to uncertain tax positions.
We file U.S. federal income tax returns and returns in various state, local, and foreign jurisdictions. Since we are in a loss carryforward position, the statute of limitations generally remains open for all tax years. Currently, we are not under examination relating to tax returns that have been previously filed.
84
Our current intentions are to indefinitely reinvest the earnings of our foreign subsidiaries, if any, or to repatriate only when tax-effective. Accordingly, we have not provided for U.S. taxes on the unremitted earnings of our international subsidiaries, which are not significant as of December 26, 2015. In addition, we not believe it is practicable to estimate the amount of income taxes payable on the earnings that are indefinitely reinvested in foreign operations.
11. Segment and Geographical Information
We consider operating segments to be components of the Company in which separate financial information is available that is evaluated regularly by our chief operating decision maker in deciding how to allocate resources and in assessing performance. Our chief operating decision maker is the CEO. The CEO reviews financial information presented on a consolidated basis for purposes of allocating resources and evaluating financial performance. Prior to our decision to exit the Citrus Lane business in fiscal 2015, we had determined that we had two operating and reporting segments, CRCM Businesses, Excluding Citrus Lane and Citrus Lane. Subsequent to our decision to exit the Citrus Lane business, we have concluded that we have a single operating and reportable segment comprised of the following product lines (dollars in thousands):
Fiscal Year Ended | |||||||||||
December 26, 2015 | December 27, 2014 | December 28, 2013 | |||||||||
U.S. Consumer Business | $ | 115,020 | $ | 96,524 | $ | 72,415 | |||||
Other | 23,661 | 14,188 | 9,072 | ||||||||
Total revenue | $ | 138,681 | $ | 110,712 | $ | 81,487 | |||||
No country outside of the United States provided greater than 10% of our total revenue. Revenue is classified by the major geographic areas in which our customers are located. The following table summarizes total revenue generated by our geographic locations (dollars in thousands):
Fiscal Year Ended | |||||||||||
December 26, 2015 | December 27, 2014 | December 28, 2013 | |||||||||
United States | $ | 129,085 | $ | 102,047 | $ | 74,800 | |||||
International | 9,596 | 8,665 | 6,687 | ||||||||
Total revenue | $ | 138,681 | $ | 110,712 | $ | 81,487 | |||||
Fiscal Year Ended | ||||||||
December 26, 2015 | December 27, 2014 | December 28, 2013 | ||||||
United States | 93 | % | 92 | % | 92 | % | ||
International | 7 | % | 8 | % | 8 | % | ||
Total revenue | 100 | % | 100 | % | 100 | % | ||
Our long-lived assets are primarily located in the United States and not allocated to any specific region. Therefore, geographic information is presented only for total revenue.
12. Related Party Transactions
We entered into a master services agreement in February 2011 with the United Services Automobile Association, who later in 2011 participated as the lead investor in the Series D redeemable convertible preferred stock financing. We did not recognize any significant revenue under the master service agreement in the year ended December 28, 2013. The terms of this agreement were superseded in their entirety by the terms of the alliance agreement referenced in the next paragraph. Therefore, we did not recognize any revenue under this agreement in the years ended December 26, 2015 or December 27, 2014.
85
CARE.COM, INC.
NOTES TO CONDENSED CONSOLIDATED FINANCIAL STATEMENTS
YEARS ENDED DECEMBER 26, 2015, DECEMBER 27, 2014 AND DECEMBER 28, 2013
In December 2013, we entered into an alliance agreement with USAA Alliance Services, LLC, or USAA Alliance, an affiliate of USAA, pursuant to which USAA Alliance agreed to promote our services to USAA members and we agreed to offer our services to their members at specified discounts, which vary based on the nature of the services purchased. Under the terms of the alliance agreement, we agreed to pay USAA Alliance specified commissions in connection with the services that are purchased by USAA members under the alliance agreement. Commissions vary based on the nature of the services purchased. Under the alliance agreement, we made payments totaling less than $100,000 in both fiscal 2015 and fiscal 2014. The alliance agreement was terminated during the fourth quarter of fiscal 2015.
13. Employee Benefit Plans
We have established a 401(k) tax-deferred savings plan covering all employees who satisfy certain eligibility requirements. The 401(k) plan allows each participant to defer a percentage of their eligible compensation subject to applicable annual limits pursuant to the limits established by the Internal Revenue Service. We may, at our discretion, make contributions in the form of matching contributions or profit sharing contributions. During the year ended December 26, 2015, we contributed a 401(k) match of $0.2 million.
14. Other Expense, Net
Other expense, net consisted of the following (in thousands):
Fiscal Year Ended | |||||||||||
December 26, 2015 | December 27, 2014 | December 28, 2013 | |||||||||
Interest income | 72 | 86 | 47 | ||||||||
Interest expense | (3 | ) | (43 | ) | (17 | ) | |||||
Other expense, net | (1,308 | ) | (3,899 | ) | (321 | ) | |||||
Total other expense, net | $ | (1,239 | ) | $ | (3,856 | ) | $ | (291 | ) | ||
15. Subsequent Events
We consider events or transactions that occur after the balance sheet date but prior to the issuance of the financial statements to provide additional evidence for certain estimates or to identify matters that require additional disclosure. Subsequent events have been evaluated as required. In February 2016, we entered into a settlement agreement with the previous shareholders of Citrus Lane. The settlement agreement relates to our acquisition of Citrus Lane and the merger agreement pursuant to which the acquisition was consummated. Under the terms of the settlement agreement, we have agreed to pay the previous shareholders of Citrus Lane $15.6 million of the $16.4 million of contingent consideration that was otherwise payable to them in the event Citrus Lane achieved certain milestones in 2015 and 2016. In exchange, the former shareholders have agreed to forfeit the $5.0 million in original cash consideration that was being held in an escrow account, as well as the 0.5 million shares of common stock (valued at $5.5 million as of the original closing date) offered as part of the deal consideration.
16. Quarterly Financial Information (Unaudited)
The table below sets forth unaudited selected quarterly financial data for each of the last two fiscal years (dollars in thousands, except per share data).
86
CARE.COM, INC.
NOTES TO CONDENSED CONSOLIDATED FINANCIAL STATEMENTS
YEARS ENDED DECEMBER 26, 2015, DECEMBER 27, 2014 AND DECEMBER 28, 2013
For the Quarter Ended | |||||||||||||||
December 26, 2015 | September 26, 2015 | June 27, 2015 | March 28, 2015 | ||||||||||||
Total revenue | $ | 37,550 | $ | 36,179 | $ | 32,903 | $ | 32,049 | |||||||
Cost of revenue | 6,321 | 6,894 | 6,630 | 6,272 | |||||||||||
Income (Loss) from continuing operations | 3,683 | (6,364 | ) | (5,404 | ) | (9,794 | ) | ||||||||
Loss from discontinued operations, net of tax | (2,084 | ) | (10,985 | ) | (1,831 | ) | (2,216 | ) | |||||||
Net income (loss) | 1,599 | (17,349 | ) | (7,235 | ) | (12,010 | ) | ||||||||
Net loss per share (Basic): | |||||||||||||||
Income (Loss) from continuing operations | $ | 0.11 | $ | (0.20 | ) | $ | (0.17 | ) | $ | (0.31 | ) | ||||
Loss from discontinued operations | (0.06 | ) | (0.34 | ) | (0.06 | ) | (0.07 | ) | |||||||
Net income (loss) per share | $ | 0.05 | $ | (0.54 | ) | $ | (0.23 | ) | $ | (0.38 | ) | ||||
Net loss per share (Diluted): | |||||||||||||||
Income (Loss) from continuing operations | $ | 0.11 | $ | (0.20 | ) | $ | (0.17 | ) | $ | (0.31 | ) | ||||
Loss from discontinued operations | (0.06 | ) | (0.34 | ) | (0.06 | ) | (0.07 | ) | |||||||
Net income (loss) per share* | $ | 0.05 | $ | (0.54 | ) | $ | (0.23 | ) | $ | (0.38 | ) | ||||
* Note the diluted share total used in the calculation of net income (loss) per share in Q4 FY’15 was 33,094 | |||||||||||||||
For the Quarter Ended | |||||||||||||||
December 27, 2014 | September 27, 2014 | June 28, 2014 | March 29, 2014 | ||||||||||||
Total revenue | $ | 30,001 | $ | 29,604 | $ | 25,836 | $ | 25,271 | |||||||
Cost of revenue | 5,869 | 6,111 | 5,713 | 5,771 | |||||||||||
Loss from continuing operations | (1,530 | ) | (10,610 | ) | (9,875 | ) | (15,544 | ) | |||||||
Loss from discontinued operations, net of tax | (38,890 | ) | (3,843 | ) | — | — | |||||||||
Net loss | (40,420 | ) | (14,453 | ) | (9,875 | ) | (15,544 | ) | |||||||
Net loss attributable to common stockholders | (40,420 | ) | (14,453 | ) | (9,875 | ) | (15,548 | ) | |||||||
Net loss per share attributable to common stockholders (Basic and Diluted): | |||||||||||||||
Loss from continuing operations | $ | (0.05 | ) | $ | (0.34 | ) | $ | (0.32 | ) | $ | (0.71 | ) | |||
Loss from discontinued operations | (1.23 | ) | (0.12 | ) | — | — | |||||||||
Net loss per share | $ | (1.28 | ) | $ | (0.46 | ) | $ | (0.32 | ) | $ | (0.71 | ) | |||
Information in any one quarterly period should not be considered indicative of annual results due to the effects of seasonality on our business.
87
ITEM 9. | CHANGES IN AND DISAGREEMENTS WITH ACCOUNTANTS ON ACCOUNTING AND FINANCIAL DISCLOSURE |
None.
ITEM 9A. CONTROLS AND PROCEDURES
Evaluation of Disclosure Controls and Procedures
The term “disclosure controls and procedures,” as defined in Rules 13a-15(e) and 15d-15(e) under the Securities Exchange Act of 1934, as amended, or the Exchange Act, refers to controls and procedures that are designed to ensure that information required to be disclosed by a company in the reports that it files or submits under the Exchange Act is recorded, processed, summarized and reported, within the time periods specified in the Securities and Exchange Commission’s rules and forms. Disclosure controls and procedures include, without limitation, controls and procedures designed to ensure that information required to be disclosed by a company in the reports that it files or submits under the Exchange Act is accumulated and communicated to the company’s management, including its principal executive and principal financial officers, or persons performing similar functions, as appropriate to allow timely decisions regarding required disclosure. Our management recognizes that any controls and procedures, no matter how well designed and operated, can provide only reasonable assurance of achieving their objectives and our management necessarily applies its judgment in evaluating the cost-benefit relationship of possible controls and procedures. Our disclosure controls and procedures are designed to provide reasonable assurance of achieving their control objectives.
Our management, with the participation of our principal executive officer and principal financial officer, has evaluated the effectiveness of our disclosure controls and procedures as of December 26, 2015, the end of the period covered by this Annual Report on Form 10-K. Based upon such evaluation, our Chief Executive Officer and Chief Financial Officer have concluded that our disclosure controls and procedures were effective as of such date.
Management’s Annual Report on Internal Control over Financial Reporting
Our management is responsible for establishing and maintaining adequate internal control over financial reporting. Internal control over financial reporting is defined in Rules 13a-15(f) and 15d-15(f) under the Exchange Act as a process designed by, or under the supervision of, a company’s principal executive officer and principal financial officer, or persons performing similar functions, and effected by a company’s board of directors, management, and other personnel, to provide reasonable assurance regarding the reliability of financial reporting and the preparation of financial statements for external purposes in accordance with generally accepted accounting principles and includes those policies and procedures that:
• | pertain to the maintenance of records that in reasonable detail accurately and fairly reflect the transactions and dispositions of a company’s assets; |
• | provide reasonable assurance that transactions are recorded as necessary to permit preparation of financial statements in accordance with generally accepted accounting principles, and that a company’s receipts and expenditures are being made only in accordance with authorizations of the company’s management and directors; and |
• | provide reasonable assurance regarding prevention or timely detection of unauthorized acquisition, use or disposition of our assets that could have a material effect on the financial statements. |
Because of its inherent limitations, internal control over financial reporting may not prevent or detect misstatements. Projections of any evaluation of effectiveness to future periods are subject to the risk that controls may become inadequate because of changes in conditions, or that the degree of compliance with the policies or procedures may deteriorate.
Under the supervision of and with the participation of our principal executive officer and principal financial officer, our management assessed the effectiveness of our internal control over financial reporting as of December 26, 2015 based on the criteria set forth by the Committee of Sponsoring Organizations of the Treadway Commission (COSO) in Internal Control-Integrated Framework (2013 framework). Based on this assessment, management concluded that our internal control over financial reporting was effective as of December 26, 2015.
Changes in Internal Control over Financial Reporting
There were no changes in our internal control over financial reporting (as defined in Rule 13a-15(f) under the Exchange Act) during the year ended December 26, 2015 that have materially affected, or are reasonably likely to materially affect, our internal control over financial reporting.
ITEM 9B. OTHER INFORMATION
None.
88
PART III.
ITEM 10. DIRECTORS, EXECUTIVE OFFICERS AND CORPORATE GOVERNANCE
We have adopted a code of business conduct and ethics for directors, officers (including our Chief Executive Officer and Chief Financial Officer) and employees, known as the Code of Business Conduct and Ethics. The Code of Business Conduct and Ethics is available on our “Investor Relations” website at investors.care.com in the Corporate Governance section. Stockholders may request a free copy of the Code of Business Conduct and Ethics by sending an email request to investors@care.com.
The other information required by this item will be contained in our definitive proxy statement to be filed with the Securities and Exchange Commission in connection with our 2016 annual meeting of stockholders, which is expected to be filed not later than 120 days after the end of our fiscal year ended December 26, 2015, and is incorporated in this report by reference.
ITEM 11. EXECUTIVE AND DIRECTOR COMPENSATION
The information required under this Item 11 will be contained in our definitive proxy statement for our 2016 annual meeting of stockholders, and is incorporated herein by reference.
ITEM 12. | SECURITY OWNERSHIP OF CERTAIN BENEFICIAL OWNERS AND MANAGEMENT AND RELATED STOCKHOLDER MATTERS |
The information required under this Item 12 will be contained in our definitive proxy statement for our 2016 annual meeting of stockholders, and is incorporated herein by reference.
ITEM 13. CERTAIN RELATIONSHIPS AND RELATED PERSON TRANSACTIONS
The information required under this Item 13 will be contained in our definitive proxy statement for our 2016 annual meeting of stockholders, and is incorporated herein by reference.
ITEM 14. PRINCIPAL ACCOUNTING FEES AND SERVICES
The information required under this Item 14 will be contained in our definitive proxy statement for our 2016 annual meeting of stockholders, and is incorporated herein by reference.
PART IV.
ITEM 15. EXHIBITS AND FINANCIAL STATEMENT SCHEDULES
(a) The following documents are filed as part of this report:
1. Consolidated Financial Statements
See Index to Consolidated Financial Statements at Item 8 herein.
2. Exhibits
See the Exhibit Index immediately following the signature page of this Annual Report on Form 10-K.
89
SIGNATURES
Pursuant to the requirements of Section 13 or 15(d) of the Securities Exchange Act of 1934, the registrant has duly caused this report to be signed on its behalf by the undersigned, thereunto duly authorized.
CARE.COM, INC. | |||
Dated: March 1, 2016 | By: /s/ SHEILA LIRIO MARCELO | ||
Sheila Lirio Marcelo | |||
President and Chief Executive Officer (Principal Executive Officer) | |||
90
Pursuant to the requirements of the Securities Exchange Act of 1934, this annual report has been signed by the following persons on behalf of the registrant in the capacities indicated.
Dated: March 1, 2016 | By: /s/ SHEILA LIRIO MARCELO | ||
Sheila Lirio Marcelo | |||
President and Chief Executive Officer | |||
(Principal Executive Officer) | |||
Dated: March 1, 2016 | By: /s/ MICHAEL ECHENBERG | ||
Michael Echenberg | |||
Executive Vice President and Chief Financial Officer | |||
(Principal Financial and Accounting Officer) | |||
Dated: March 1, 2016 | By: /s/ TONY FLORENCE | ||
Tony Florence | |||
Director | |||
Dated: March 1, 2016 | By: /s/ LAURA LANG | ||
Laura Lang | |||
Director | |||
Dated: March 1, 2016 | By: /s/ J. SANFORD MILLER | ||
J. Sanford Miller | |||
Director | |||
Dated: March 1, 2016 | By: /s/ I. DUNCAN ROBERTSON | ||
I. Duncan Robertson | |||
Director | |||
Dated: March 1, 2016 | By: /s/ BRIAN SWETTE | ||
Brian Swette | |||
Director | |||
91
EXHIBIT INDEX
Incorporated by Reference | ||||||||||
Exhibit Number | Exhibit Description | Filed with this Form 10-K | Form | Filing Date with SEC | Exhibit Number | |||||
2.2 (1) | Agreement and Plan of Merger by and among Care.com, Inc., Citrus Lane, Inc., Mango Merger Sub, Inc. and Fortis Advisors LLC, dated as of July 14, 2014 | 8-K | 7/17/2014 | 2.1 | ||||||
3.1 | Restated Certificate of Incorporation of Care.com, Inc. | 8-K | 1/29/2014 | 3.2 | ||||||
3.2 | Amended and Restated Bylaws of Care.com, Inc. | 8-K | 1/29/2014 | 3.4 | ||||||
4.1 | Specimen stock certificate evidencing the shares of common stock of the Registrant | S-1/A | 1/10/2014 | 4.2 | ||||||
10.1 # | The Registrant's 2006 Stock Incentive Plan | S-1 | 12/12/2013 | 10.1 | ||||||
10.2 # | Form of Incentive Stock Option Agreement for grants to executive officers under the Registrant's 2006 Stock Incentive Plan | S-1 | 12/12/2013 | 10.2 | ||||||
10.3 # | Form of Nonstatutory Stock Option Agreement for grants to directors under the Registrant's 2006 Stock Incentive Plan | S-1 | 12/12/2013 | 10.3 | ||||||
10.4 # | The Registrant's 2014 Incentive Award Plan | S-1/A | 1/3/2014 | 10.4 | ||||||
10.5 # | Form of Stock Option Grant Notice and Stock Option Agreement under the Registrant's 2014 Incentive Award Plan | S-1/A | 1/3/2014 | 10.5 | ||||||
10.6 # | Form of Restricted Stock Grant Notice and Restricted Stock Agreement under the Registrant's 2014 Incentive Award Plan | S-1/A | 1/3/2014 | 10.6 | ||||||
10.7 # | Form of Restricted Stock Unit Grant Notice and Restricted Stock Unit Agreement under the Registrant's 2014 Incentive Award Plan | S-1/A | 1/3/2014 | 10.7 | ||||||
10.8 # | Letter agreement dated November 15, 2006 between the Registrant and Sheila Lirio Marcelo | S-1 | 12/12/2013 | 10.8 | ||||||
10.9 # | Letter agreement dated December 9, 2010 between the Registrant and Sheila Lirio Marcelo | S-1 | 12/12/2013 | 10.9 | ||||||
10.10 # | Form of Indemnification Agreement for Directors and Officers | S-1 | 12/12/2013 | 10.10 | ||||||
10.11 | Lease Agreement dated July 28, 2014 by and between BP Fourth Avenue, LLC and Care.com, Inc. | 8-K | 8/4/2014 | 10.11 | ||||||
10.12 | Sublease Agreement dated as of July 28, 2014 by and between Oracle America, Inc. and Care.com, Inc. | 8-K | 8/4/2014 | 10.12 | ||||||
10.13 | Agreement of Sublease dated as of July 28, 2014 between PriceWaterhouseCoopers PRTM Management Consultants, LLC and Care.com, Inc. | 8-K | 8/4/2014 | 10.13 | ||||||
10.14 | Third Amendment to Lease Agreement dated as of July 28, 2014 by and between Stony Brook Associates LLC and Care.com, Inc. | 8-K | 8/4/2014 | 10.14 | ||||||
10.15 | Offer letter between the Company and Michael Echenberg, dated March 4, 2015 | 8-K | 3/19/2015 | 99.2 | ||||||
21.1 | Subsidiaries of the Registrant | X | ||||||||
23.1 | Consent of Ernst & Young | X | ||||||||
31.1 | Certification of Principal Executive Officer Required Under Rule 13a-14(a) and 15d-14(a) of the Securities Exchange Act of 1934, as amended. | X | ||||||||
92
31.2 | Certification of Principal Financial Officer Required Under Rule 13a-14(a) and 15d-14(a) of the Securities Exchange Act of 1934, as amended. | X | ||||||||
32.1 | Certification of Principal Executive Officer and Principal Financial Officer Required Under Rule 13a-14(b) of the Securities Exchange Act of 1934, as amended, and 18 U.S.C. §1350. | X | ||||||||
101.INS | XBRL Instance Document | X | ||||||||
101.SCH | XBRL Taxonomy Schema Linkbase Document | X | ||||||||
101.CAL | XBRL Taxonomy Calculation Linkbase Document | X | ||||||||
101.DEF | XBRL Taxonomy Definition Linkbase Document | X | ||||||||
101.LAB | XBRL Taxonomy Labels Linkbase Document | X | ||||||||
101.PRE | XBRL Taxonomy Presentation Linkbase Document | X | ||||||||
(1) | The registrant hereby agrees to furnish supplementary a copy of any schedules and/or exhibits to this agreement, omitted from this report pursuant to Item 601(b)(2) of Regulation S-K, to the Securities and Exchange Commission upon its request. |
# | Indicates management contract or compensatory plan. |
93