Attached files
| file | filename |
|---|---|
| 8-K - 8-K - CINCINNATI BELL INC | a8-kmorganstanleypresentat.htm |

Contains Cincinnati BellSM confidential information. Not for external use or disclosure without permission. I. Review of Cincinnati Bell (“CBB”) Today Morgan Stanley Technology, Media & Telecom Conference March 1, 2016

Safe Harbor This presentation and the documents incorporated by reference herein contain forward-looking statements regarding future events and our future results that are subject to the “safe harbor” provisions of the Private Securities Litigation Reform Act of 1995. All statements, other than statements of historical facts, are statements that could be deemed forward-looking statements. These statements are based on current expectations, estimates, forecasts, and projections about the industries in which we operate and the beliefs and assumptions of our management. Words such as “expects,” “anticipates,” “predicts,” “projects,” “intends,” “plans,” “believes,” “seeks,” “estimates,” “continues,” “endeavors,” “strives,” “may,” variations of such words and similar expressions are intended to identify such forward-looking statements. In addition, any statements that refer to projections of our future financial performance, our anticipated growth and trends in our businesses, and other characterizations of future events or circumstances are forward-looking statements. Readers are cautioned these forward-looking statements are based on current expectations and assumptions that are subject to risks and uncertainties, which could cause our actual results to differ materially and adversely from those reflected in the forward-looking statements. Factors that could cause or contribute to such differences include, but are not limited to, those discussed in this release and those discussed in other documents we file with the Securities and Exchange Commission (SEC). More information on potential risks and uncertainties is available in our recent filings with the SEC, including Cincinnati Bell’s Form 10-K report, Form 10-Q reports and Form 8-K reports. Actual results may differ materially and adversely from those expressed in any forward- looking statements. We undertake no obligation to revise or update any forward-looking statements for any reason. 2
Non GAAP Financial Measures This presentation contains information about adjusted earnings before interest, taxes, depreciation and amortization (Adjusted EBITDA), Adjusted EBITDA margin, net debt and free cash flow. These are non-GAAP financial measures used by Cincinnati Bell management when evaluating results of operations and cash flow. Management believes these measures also provide users of the financial statements with additional and useful comparisons of current results of operations and cash flows with past and future periods. Non-GAAP financial measures should not be construed as being more important than comparable GAAP measures. Detailed reconciliations of Adjusted EBITDA, net debt and free cash flow (including the Company’s definition of these terms) to comparable GAAP financial measures can be found in the earnings release on our website at www.cincinnatibell.com within the Investor Relations section. 3
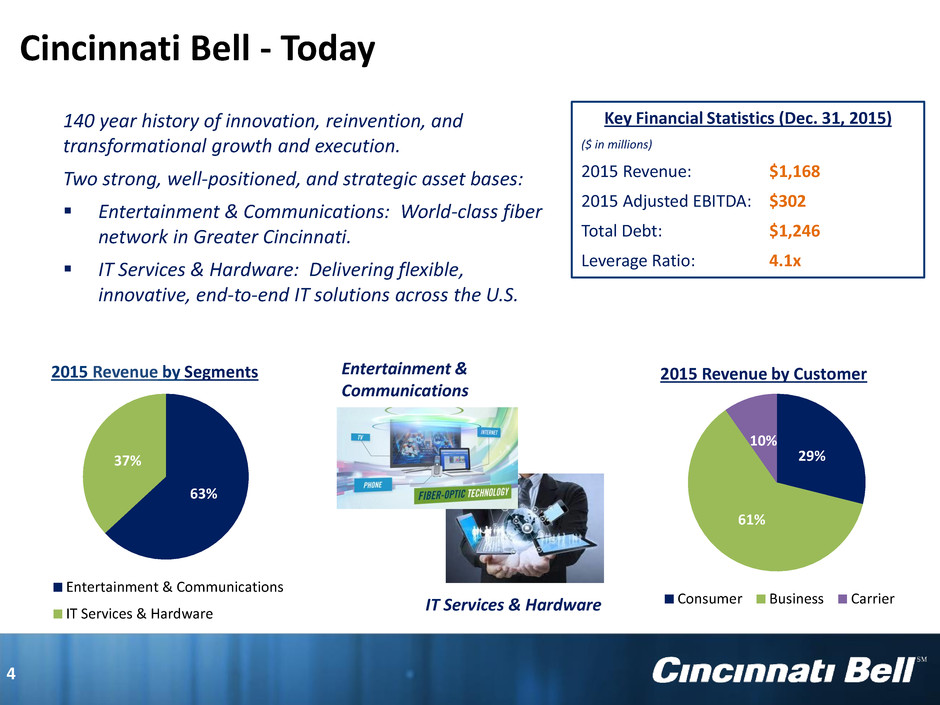
140 year history of innovation, reinvention, and transformational growth and execution. Two strong, well-positioned, and strategic asset bases: Entertainment & Communications: World-class fiber network in Greater Cincinnati. IT Services & Hardware: Delivering flexible, innovative, end-to-end IT solutions across the U.S. Entertainment & Communications IT Services & Hardware Key Financial Statistics (Dec. 31, 2015) ($ in millions) 2015 Revenue: $1,168 2015 Adjusted EBITDA: $302 Total Debt: $1,246 Leverage Ratio: 4.1x 2015 Revenue by Segments 2015 Revenue by Customer Cincinnati Bell - Today 4 63% 37% Entertainment & Communications IT Services & Hardware 29% 61% 10% Consumer Business Carrier

Assets Fioptics network covering ~ 53% of Cincinnati Growing revenue from strategic services “Success based” capital investments with attractive returns Regional fiber-based network connecting Cincinnati, Chicago, Indianapolis, Columbus, and Louisville Legacy telecommunications network connects nearly every premises in Greater Cincinnati, including areas in northern Kentucky and southeast Indiana. Strategy Hometown provider with the fastest network and regional reach Gain market share from cable competition through superior assets, brand equity and customer relationships “Success based” investments for growth in business market (Ethernet and VoIP) Migrate customers from legacy to strategic services to lock in long-term revenue Entertainment & Communications 5

Cincinnati is where we work, live and play. As the hometown provider – we offer our customers access to the fastest internet in town and a premier video package. Strategy Disciplined, “success-based” approach to accelerating deployment of Fioptics Re-platform Cincinnati Bell with a future proof asset to meet consumer needs Positioned to win higher share of Internet market where satellite wins the video (ongoing relationship with DirecTV) Revenue ($ in millions) 6 Entertainment and Communications $102 $144 $191 $191 $167 $142 $6 $11 $8 2013 2014 2015 Strategic Legacy Integration $299 $322 $341 Fioptics Results and Metrics Fioptics revenues totaled $191 million, up 34% compared to 2014 Fioptics subscribers increased on average 30% in 2015 compared to the prior year ‒ 114,400 video subscribers; up 23,000 compared to a year ago ‒ 153,700 internet subs; 40,000 subs added during 2015 Fioptics penetration: Video (26%) and Internet (36%) Consumer Market

We have 4 times more fiber assets than our nearest competitor and a deep understanding of the local market. We continue to be the premier telecommunications provider to businesses in our region. Strategy Continue “success based” investment in additional fiber to high-priority business premises – 7,500 buildings currently qualified for or lit with fiber services – including 630 multi-dwelling units Continue customers migrations from legacy to strategic products and networks – Increasing VoIP sales create predictable revenue streams with long-term contracts Continue to grow regional markets outside of Cincinnati – Leverage ongoing relationships and existing regional offices: Louisville, Columbus, and Indianapolis – Leverage 10 gig fiber connections to each of these markets Revenue ($ in millions) Entertainment and Communications 7 Business Market $113 $125 $137 $178 $163 $148 $7 $5 $3 2013 2014 2015 Strategic - E&C Legacy Integration $298 $293 $288

Strategy Continue transition from legacy TDM-based services to Ethernet and fiber-based services Leverage existing relationships and reputation to expand services to wireless carriers: – Service penetration of more than 70% of 1,100 macro cell sites in our footprint – Market share leader in small-cell deployments in footprint Our superior fiber, real estate, and pole assets, along with strong relationships with key partners, enable us to be the provider of choice for wholesale services. Revenue ($ in millions) 8 Entertainment and Communications $30 $35 $36 $82 $77 $76 $16 $14 $3 2013 2014 2015 Strategic Legacy Intercompany Backhaul $126 $115 $128 Carrier Market
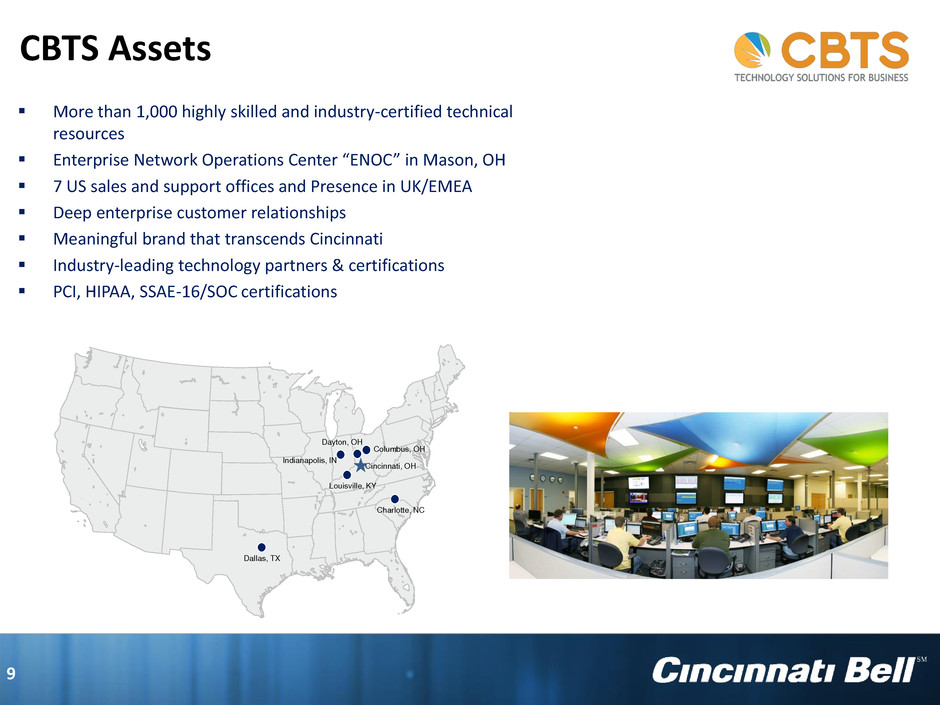
More than 1,000 highly skilled and industry-certified technical resources Enterprise Network Operations Center “ENOC” in Mason, OH 7 US sales and support offices and Presence in UK/EMEA Deep enterprise customer relationships Meaningful brand that transcends Cincinnati Industry-leading technology partners & certifications PCI, HIPAA, SSAE-16/SOC certifications Cincinnati, OH Columbus, OH Indianapolis, IN Dallas, TX Charlotte, NC Dayton, OH Louisville, KY CBTS Assets 9

Win with flexibility, customer focus & innovation Core solutions in growing markets – Professional Services – Unified Communications – Management and Monitoring – Cloud Services Technology consulting, staffing and procurement services create opportunities for further organic growth Recurring Revenue by Product [1] CBTS Strategy 10 51% 19% 15% 15% Professional Services Unified Communications Management & Monitoring Cloud Services [1] Excludes Telecom and IT Hardware sales
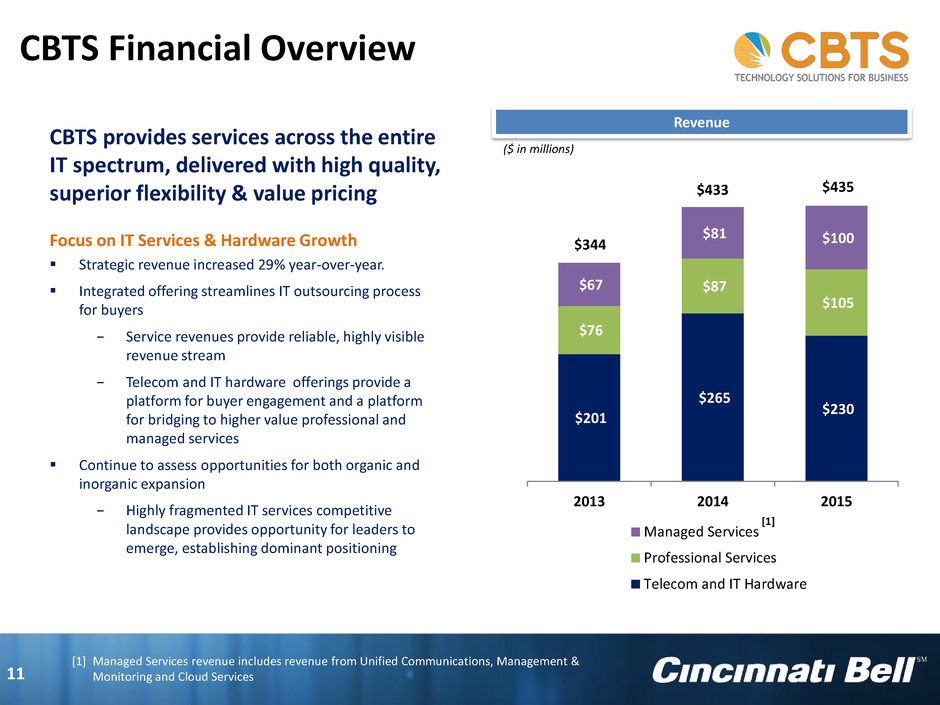
$201 $265 $230 $76 $87 $105 $67 $81 $100 2013 2014 2015 Managed Services Professional Services Telecom and IT Hardware CBTS provides services across the entire IT spectrum, delivered with high quality, superior flexibility & value pricing Focus on IT Services & Hardware Growth Strategic revenue increased 29% year-over-year. Integrated offering streamlines IT outsourcing process for buyers − Service revenues provide reliable, highly visible revenue stream − Telecom and IT hardware offerings provide a platform for buyer engagement and a platform for bridging to higher value professional and managed services Continue to assess opportunities for both organic and inorganic expansion − Highly fragmented IT services competitive landscape provides opportunity for leaders to emerge, establishing dominant positioning ($ in millions) Revenue 11 CBTS Financial Overview $344 $433 $435 [1] Managed Services revenue includes revenue from Unified Communications, Management & Monitoring and Cloud Services [1]

Impressive Financial Results Strategic revenues increased more than 20% from a year ago Fioptics revenue totaled $191 million, up 34% compared to 2014 Adjusted EBITDA totaled $302 million - high-end of 2015 guidance 2015 Highlights 12 Monetization of CyrusOne Investment Proceeds from monetization of CyrusOne investment totaled $644 million in 2015 Proceeds used to repay more than $500 million in debt Remaining 9.5% ownership valued at approximately $250 million

2013 2014 2015 Revenue: Consumer $299 $322 $341 Business 298 293 288 Carrier 128 126 115 Total Entertainment & Communications $725 $741 $744 IT Services & Hardware 344 433 435 Data Center Colocation [1] 15 - - Corporate Elims (11) (12) (11) Total Revenue $1,073 $1,162 $1,168 Adjusted EBITDA: Entertainment & Communications $327 $314 $283 IT Services & Hardware 20 32 37 Data Center Colocation [1] 8 - - Corporate (8) (16) (18) Total Adjusted EBITDA $347 $330 $302 Adjusted EBITDA Margins: Entertainment & Communications 45% 42% 38% IT Services & Hardware 6% 7% 8% Data Center Colocation [1] 54% N/A N/A Adjusted EBITDA Margin 32% 28% 26% Annual Comparison 13 Historical Financials by Segment ($ in millions) Effective January 24, 2013, the date of the CyrusOne IPO, we no longer include CyrusOne’s operating results in our consolidated financial statements. [1] Entertainment & Communications Adjusted EBITDA has declined due primarily to the following: – Costs absorbed from shutting down wireless operations – Costs associated with accelerating investment in Fioptics – Declines in legacy revenue IT Services & Hardware Adjusted EBITDA is increasing as a result of growth in strategic services Yearly fluctuations in Corporate Adjusted EBITDA are primarily the result of changes in our stock price and the impact on stock compensation expense
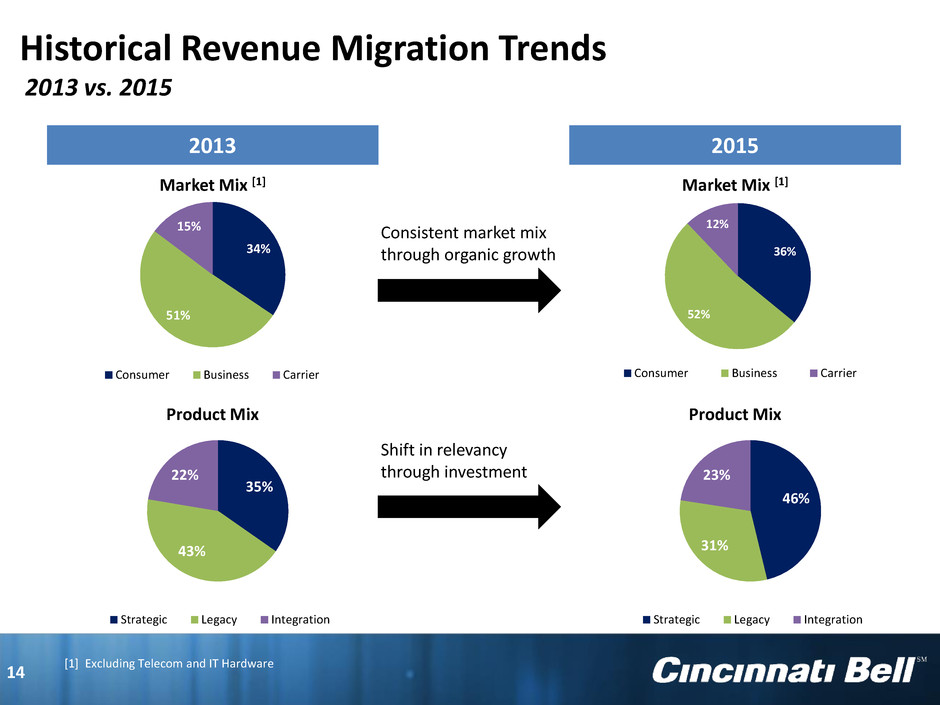
36% 52% 12% Consumer Business Carrier 34% 51% 15% Consumer Business Carrier 2013 vs. 2015 2013 Market Mix [1] Consistent market mix through organic growth Shift in relevancy through investment 2015 Market Mix [1] Product Mix Product Mix 14 Historical Revenue Migration Trends 35% 43% 22% Strategic Legacy Integration 46% 31% 23% Strategic Legacy Integration [1] Excluding Telecom and IT Hardware

($ in millions) Invested $180 million in Fioptics in 2015: Construction costs totaled $87 million, passed 97,000 customer locations Available to approximately 53% of Greater Cincinnati Plan to pass 70,000 homes with Fioptics is 2016: Construction costs estimated to be approximately $80 million Goal is to pass 95% of new addresses directly with a fiber-to-the-home product Extends coverage to more than 60% of Greater Cincinnati Other strategic represents success-based capital for fiber builds for business and new IT services projects __ __ __ __ 15 __ Capital Expenditures 2015 Low High Construction $87 $80 $80 Installation 50 50 50 Value Added 43 30 30 Total Fioptics $180 $160 $160 Other Strategic 56 65 75 Total Strategic Investment 236 225 235 Total Maintenance 48 40 40 $284 $265 $275 2016 Estimated Range

Net debt has decreased by more than $1.0 billion since 2013 Annual interest payments reduced by more than $70 million compared to 2013 Leverage adjusted for our remaining 9.5% investment in CyrusOne is well within a reasonable range Net Debt $’s in millions Leverage Ratio [1] [1] 2015 leverage calculated based on 2016 Adjusted EBITDA guidance 2013 2014 2015 $2,261 $1,726 $1,238 4.1x 3.3x 2013 2014 2015 Leverage Leverage Adj. for CONE Investment Strengthening our Financial Position 16
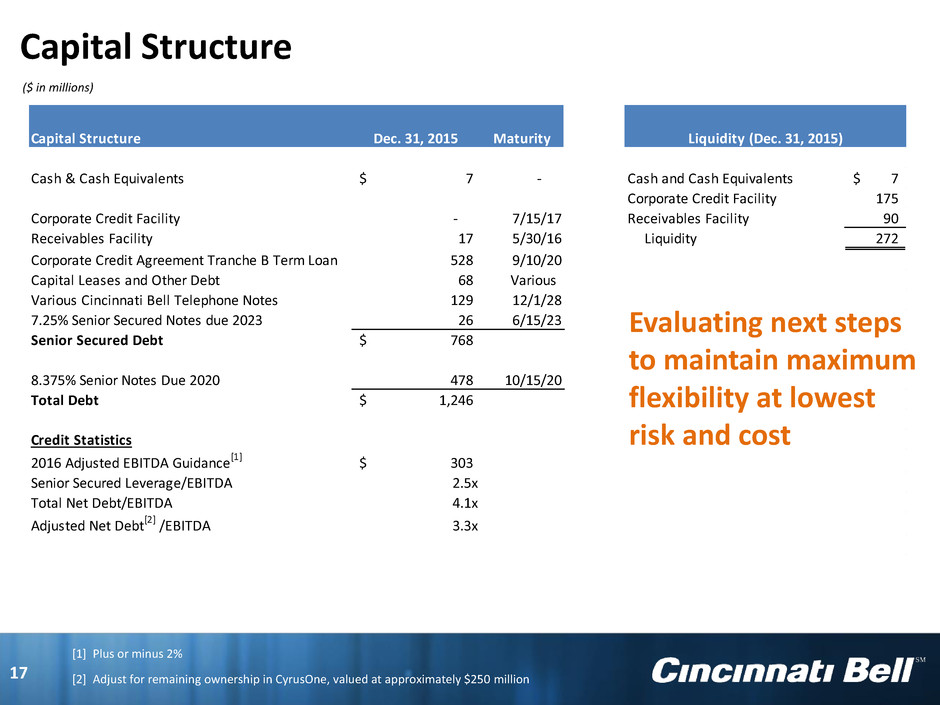
Capital Structure Dec. 31, 2015 Maturity Cash & Cash Equivalents 7$ - Cash and Cash Equivalents 7$ Corporate Credit Facility 175 Corporate Credit Facility - 7/15/17 Receivables Facility 90 Receivables Facility 17 5/30/16 Liquidity 272 Corporate Credit Agreement Tranche B Term Loan 528 9/10/20 Capital Leases and Other Debt 68 Various Various Cincinnati Bell Telephone Notes 129 12/1/28 7.25% Senior Secured Notes due 2023 26 6/15/23 Senior Secured Debt 768$ 8.375% Senior Notes Due 2020 478 10/15/20 Total Debt 1,246$ Credit Statistics 2016 Adjusted EBITDA Guidance[1] 303$ Senior Secured Leverage/EBITDA 2.5x Total Net Debt/EBITDA 4.1x Adjusted Net Debt[2] /EBITDA 3.3x Liquidity (Dec. 31, 2015) 17 Capital Structure Evaluating next steps to maintain maximum flexibility at lowest risk and cost ($ in millions) [1] Plus or minus 2% [2] Adjust for remaining ownership in CyrusOne, valued at approximately $250 million

2016 Guidance * Plus or minus 2 percent 18 2016 Guidance Revenue $1.2 billion Adjusted EBITDA $303 million*
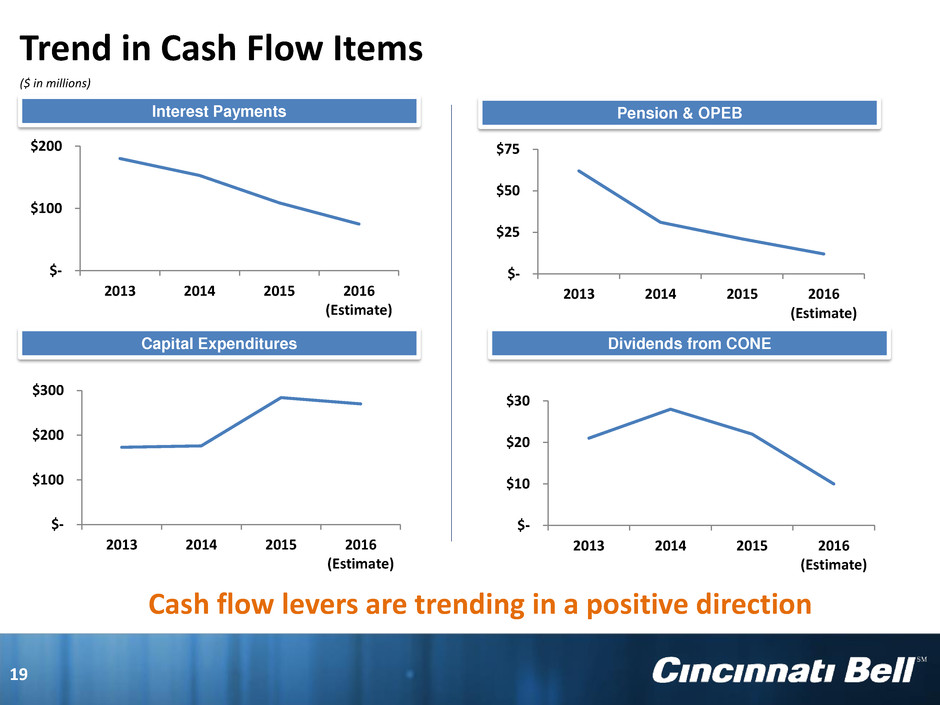
Interest Payments ($ in millions) Pension & OPEB Capital Expenditures Dividends from CONE Cash flow levers are trending in a positive direction Trend in Cash Flow Items $- $100 $200 2013 2014 2015 2016 (Estimate) $- $25 $50 $75 2013 2014 2015 2016 (Estimate) $- $100 $200 $300 2013 2014 2015 2016 (Estimate) $- $10 $20 $30 2013 2014 2015 2016 (Estimate) 19

Revenue Classifications - Entertainment and Communications 20 Strategic Legacy Integration Data Fioptics Internet DSL (1) (> 10 meg) Ethernet Private Line MPLS (2) SONET (3) Dedicated Internet Access Wavelength Audio Conferencing DSL (< 10 meg) DS0 (5), DS1, DS3 TDM (6) Voice Fioptics Voice VoIP (4) Traditional Voice Long Distance Switched Access Digital Trunking Video Fioptics Video Services and Other Wiring Projects Advertising Directory Assistance Maintenance Information Services Wireless Handsets and Accessories (1) Digital Subscriber Line (2) Multi-Protocol Label Switching (3) Synchronous Optical Network (4) Voice of Internet Protocol (5) Digital Signal (6) Time Division Multiplexing

Revenue Classifications - IT Services and Hardware 21 Strategic Integration Professional Services Consulting Staff Augmentation Installation Unified Communications Voice Monitoring Managed IP Telephony Solutions Maintenance Cloud Services Virtual Data Centers Storage Backup Monitoring and Management Network Monitoring/Management Security Telecom & IT Hardware Hardware Software Licenses
