Attached files
| file | filename |
|---|---|
| EX-12 - EX-12 - UNITED BANKSHARES INC/WV | d221835dex12.htm |
| EX-21 - EX-21 - UNITED BANKSHARES INC/WV | d221835dex21.htm |
| EX-31.2 - EX-31.2 - UNITED BANKSHARES INC/WV | d221835dex312.htm |
| EX-23 - EX-23 - UNITED BANKSHARES INC/WV | d221835dex23.htm |
| EX-32.1 - EX-32.1 - UNITED BANKSHARES INC/WV | d221835dex321.htm |
| EX-31.1 - EX-31.1 - UNITED BANKSHARES INC/WV | d221835dex311.htm |
| EX-32.2 - EX-32.2 - UNITED BANKSHARES INC/WV | d221835dex322.htm |
Table of Contents
FORM 10-K
UNITED STATES
SECURITIES AND EXCHANGE COMMISSION
Washington, D.C. 20549
[ X ] ANNUAL REPORT PURSUANT TO SECTION 13 OR 15(d) OF THE SECURITIES
EXCHANGE ACT OF 1934
For the Fiscal Year Ended December 31, 2015
OR
[ ] TRANSITION REPORT PURSUANT TO SECTION 13 OR 15(d) OF THE SECURITIES
EXCHANGE ACT OF 1934
For the transition period from to
Commission File Number: 0-13322
United Bankshares, Inc.
(Exact name of registrant as specified in its charter)
| West Virginia | 55-0641179 | |
| (State or other jurisdiction of incorporation or organization) |
(I.R.S. Employer Identification No.) | |
| 300 United Center 500 Virginia Street, East Charleston, West Virginia |
25301 | |
| (Address of principal executive offices) |
(Zip Code) | |
Registrant’s telephone number, including area code: (304) 424-8716
Securities registered pursuant to section 12(b) of the Act:
| Common Stock, $2.50 Par Value | NASDAQ Global Select Market | |
| (Title of class) | (Name of exchange on which registered) |
Securities registered pursuant to 12(g) of the Act: None
Indicate by check mark if the registrant is a well-known seasoned issuer, as defined in Rule 405 of the Securities Act. Yes [ X ] No [ ]
Indicate by check mark if the registrant is not required to file reports pursuant to Section 13 or Section 15(d) of the Act. Yes [ ] No [ X ]
Indicate by check mark whether the registrant (1) has filed all reports required to be filed by Section 13 or 15(d) of the Securities Exchange Act of 1934 during the preceding 12 months (or for such shorter period that the registrant was required to file such reports), and (2) has been subject to such filing requirements for the past 90 days. Yes [ X ] No [ ]
Table of Contents
UNITED BANKSHARES, INC.
FORM 10-K
(Continued)
Indicate by check mark whether the registrant has submitted electronically and posted on its corporate Web site, if any, every Interactive Data File required to be submitted and posted pursuant to Rule 405 of Regulation S-T (§232.405 of this chapter) during the preceding 12 months (or for such shorter period that the registrant was required to submit and post such files). Yes [ X ] No [ ]
Indicate by check mark if disclosure of delinquent filers pursuant to Item 405 of Regulation S-K is not contained herein, and will not be contained, to the best of the registrant’s knowledge, in definitive proxy or information statements incorporated by reference in Part III of this Form 10-K or any amendment to this Form 10-K. [ ]
Indicate by check mark whether the registrant is a large accelerated filer, an accelerated filer, a non-accelerated filer, or a smaller reporting company. See definitions of “large accelerated filer,” “accelerated filer,” and “smaller reporting company” in Rule 12b-2 of the Exchange Act:
| Large accelerated filer [ X ] | Accelerated filer [ ] | |
| Non-accelerated filer [ ] |
Smaller reporting company [ ] | |
| (Do not check if a smaller reporting company) |
Indicate by check mark whether the registrant is a shell company (as defined in Rule 12b-2 of the Act). Yes [ ] No [ X ]
The aggregate market value of United Bankshares, Inc. common stock, representing all of its voting stock that was held by non-affiliates on June 30, 2015, was approximately $2,599,611,186.
As of January 31, 2016, United Bankshares, Inc. had 69,631,392 shares of common stock outstanding with a par value of $2.50.
Documents Incorporated By Reference
Definitive Proxy Statement dated April 4, 2016 for the 2016 Annual Shareholders’ Meeting to be held on May 18, 2016, portions of which are incorporated by reference in Part III of this Form 10-K.
2
Table of Contents
UNITED BANKSHARES, INC.
FORM 10-K
(Continued)
As of the date of filing this Annual report, neither the annual shareholders’ report for the year ended December 31, 2015, nor the proxy statement for the annual United shareholders’ meeting has been mailed to shareholders.
| Page | ||||||
| Part I | ||||||
| Item 1. |
4 | |||||
| Item 1A. |
16 | |||||
| Item 1B. |
27 | |||||
| Item 2. |
27 | |||||
| Item 3. |
28 | |||||
| Item 4. |
28 | |||||
| Part II | ||||||
| Item 5. |
29 | |||||
| Item 6. |
33 | |||||
| Item 7. |
MANAGEMENT’S DISCUSSION AND ANALYSIS OF FINANCIAL CONDITION AND RESULTS OF OPERATIONS |
34 | ||||
| Item 7A. |
64 | |||||
| Item 8. |
69 | |||||
| Item 9. |
CHANGES IN AND DISAGREEMENTS WITH ACCOUNTANTS ON ACCOUNTING AND FINANCIAL DISCLOSURES |
130 | ||||
| Item 9A. |
130 | |||||
| Item 9B. |
131 | |||||
| Part III | ||||||
| Item 10. |
132 | |||||
| Item 11. |
132 | |||||
| Item 12. |
SECURITY OWNERSHIP OF CERTAIN BENEFICIAL OWNERS AND MANAGEMENT AND RELATED STOCKHOLDER MATTERS |
132 | ||||
| Item 13. |
CERTAIN RELATIONSHIPS AND RELATED TRANSACTIONS, AND DIRECTOR INDEPENDENCE |
132 | ||||
| Item 14. |
133 | |||||
| Part VI | ||||||
| Item 15. |
134 | |||||
3
Table of Contents
UNITED BANKSHARES, INC.
FORM 10-K, PART I
| Item 1. | BUSINESS |
Organizational History and Subsidiaries
United Bankshares, Inc. (United) is a West Virginia corporation registered as a bank holding company pursuant to the Bank Holding Company Act of 1956, as amended. United was incorporated on March 26, 1982, organized on September 9, 1982, and began conducting business on May 1, 1984 with the acquisition of three wholly-owned subsidiaries. Since its formation in 1982, United has acquired twenty-nine banking institutions including its recent acquisition of Virginia Commerce Bancorp, Inc. which consummated after the close of business on January 31, 2014. As of December 31, 2015, United has two banking subsidiaries (the Banking Subsidiaries) “doing business” under the name of United Bank, one operating under the laws of West Virginia referred to as United Bank (WV) and the other operating under the laws of Virginia referred to as United Bank (VA). United’s Banking Subsidiaries offer a full range of commercial and retail banking services and products. United also owns nonbank subsidiaries which engage in other community banking services such as asset management, real property title insurance, financial planning, and brokerage services.
Employees
As of December 31, 2015, United and its subsidiaries had approximately 1,701 full-time equivalent employees and officers. None of these employees are represented by a collective bargaining unit and management considers employee relations to be excellent.
Web Site Address
United’s web site address is “www.ubsi-inc.com”. United makes available free of charge on its web site the annual report on Form 10-K, quarterly reports on Form 10-Q, current reports on Form 8-K, and amendments thereto, as soon as reasonably practicable after United files such reports with the Securities and Exchange Commission (SEC). The reference to United’s web site does not constitute incorporation by reference of the information contained in the web site and should not be considered part of this document. These reports are also available at the SEC’s Public Reference Room at 100 F Street, N.E., Washington, D.C. 20549. The public may obtain information on the operation of the public reference room by calling the SEC at 1-800-SEC-0330. The SEC also maintains a website at www.sec.gov that contains reports, proxy and information statements and other information regarding issuers that file electronically with the SEC.
Business of United
As a bank holding company registered under the Bank Holding Company Act of 1956, as amended, United’s present business is community banking. As of December 31, 2015, United’s consolidated assets approximated $12.6 billion and total shareholders’ equity approximated $1.7 billion.
United is permitted to acquire other banks and bank holding companies, as well as thrift institutions. United is also permitted to engage in certain non-banking activities which are closely related to banking under the provisions of the Bank Holding Company Act and the Federal Reserve Board’s Regulation Y. Management continues to consider such opportunities as they arise, and in this regard, management from time to time makes inquiries, proposals, or expressions of interest as to potential opportunities, although no agreements or understandings to acquire other banks or bank holding companies or nonbanking subsidiaries or to engage in other nonbanking activities, other than those identified herein, presently exist. See Note B—Notes to Consolidated Financial Statements for a discussion of United’s announced merger with Bank of Georgetown and its completed merger with Virginia Commerce Bancorp, Inc.
4
Table of Contents
Business of Banking Subsidiaries
United, through its subsidiaries, engages primarily in community banking and offers most banking products and services permitted by law and regulation. Included among the banking services offered are the acceptance of deposits in checking, savings, time and money market accounts; the making and servicing of personal, commercial, floor plan and student loans; and the making of construction and real estate loans. Also offered are individual retirement accounts, safe deposit boxes, wire transfers and other standard banking products and services. As part of their lending function, the Banking Subsidiaries offer credit card services.
United Bank (WV) and United Bank (VA) each maintain a trust department which acts as trustee under wills, trusts and pension and profit sharing plans, as executor and administrator of estates, and as guardian for estates of minors and incompetents, and in addition performs a variety of investment and security services. Trust services are available to customers of affiliate banks. United Bank (WV) provides services to its correspondent banks such as check clearing, safekeeping and the buying and selling of federal funds.
United Brokerage Services, Inc., a wholly-owned subsidiary of United Bank (WV), is a fully-disclosed broker/dealer and a registered Investment Advisor with the National Association of Securities Dealers, Inc., the Securities and Exchange Commission, and a member of the Securities Investor Protection Corporation. United Brokerage Services, Inc. offers a wide range of investment products as well as comprehensive financial planning and asset management services to the general public.
United Bank (WV) and United Bank (VA) are members of a network of automated teller machines known as the New York Currency Exchange (NYCE) ATM network. The NYCE is an interbank network connecting the ATMs of various financial institutions in the United States and Canada.
United through its Banking Subsidiaries offers an Internet banking service, Smart Touch Online Banking, which allows customers to perform various transactions using a computer or tablet from any location or from a mobile device such as a smart phone or other cellular device as long as they have access to the Internet, applicable software and a secure browser. Specifically, customers can check personal account balances, receive information about transactions within their accounts, make transfers between accounts, stop payment on a check, and reorder checks. Customers may also pay bills online and can make payments to virtually any business or individual. Customers can set up recurring fixed payments, one-time future payments or a one-time immediate payment. Customers can also set up their own merchants, view and modify that merchant list, view pending transactions and view their bill payment history with approximately three (3) months of history.
United also offers an automated telephone banking system, Telebanc, which allows customers to access their personal account(s) or business account(s) information from a touch-tone telephone.
Lending Activities
United’s loan portfolio, net of unearned income, increased $279.4 million or 3.07% in 2015. The loan portfolio is comprised of commercial, real estate and consumer loans including credit card and home equity loans. Commercial, financial and agricultural loans increased $72.3 million or 1.35% as commercial real estate loans increased $47.6 million or 1.26% and commercial loans (not secured by real estate) increased $24.8 million or 1.57%. In addition, consumer loans increased $62.0 million or 16.80% while construction and land development loans increased $139.8 million or 12.34%. Residential real estate loans were relatively flat.
Commercial Loans
The commercial loan portfolio consists of loans to corporate borrowers primarily in small to mid-size industrial and commercial companies, as well as automobile dealers, service, retail and wholesale merchants. Collateral securing these loans includes equipment, machinery, inventory, receivables, vehicles and commercial real estate. Commercial loans are considered to contain a higher level of risk than other loan types although care is taken to minimize these risks. Numerous risk factors impact this portfolio including industry specific risks such as economy, new technology, labor rates and cyclicality, as well as customer specific factors, such as cash flow,
5
Table of Contents
financial structure, operating controls and asset quality. United diversifies risk within this portfolio by closely monitoring industry concentrations and portfolios to ensure that it does not exceed established lending guidelines. Diversification is intended to limit the risk of loss from any single unexpected economic event or trend. Underwriting standards require a comprehensive credit analysis and independent evaluation of virtually all larger balance commercial loans by the loan committee prior to approval.
Real Estate Loans
Commercial real estate loans consist of commercial mortgages, which generally are secured by nonresidential and multi-family residential properties. Also included in this portfolio are loans that are secured by owner-occupied real estate, but made for purposes other than the construction or purchase of real estate. Commercial real estate loans are to many of the same customers and carry similar industry risks as the commercial loan portfolio. Real estate mortgage loans to consumers are secured primarily by a first lien deed of trust. These loans are traditional one-to-four family residential mortgages. The loans generally do not exceed an 80% loan to value ratio at the loan origination date and most are at a variable rate of interest. These loans are considered to be of normal risk. Also included in the category of real estate mortgage loans are home equity loans.
As of December 31, 2015, approximately $391.9 million or 4.18% of United’s loan portfolio were real estate loans that met the regulatory definition of a high loan-to-value loan. A high loan-to-value real estate loan is defined as any loan, line of credit, or combination of credits secured by liens on or interests in real estate that equals or exceeds a certain percentage established by United’s primary regulator of the real estate’s appraised value, unless the loan has other appropriate credit support. The certain percentage varies depending on the loan type and collateral. Appropriate credit support may include mortgage insurance, readily marketable collateral, or other acceptable collateral that reduces the loan-to-value ratio below the certain percentage.
Consumer Loans
Consumer loans are secured by automobiles, boats, recreational vehicles, and other personal property. Personal loans, student loans and unsecured credit card receivables are also included as consumer loans. United monitors the risk associated with these types of loans by monitoring such factors as portfolio growth, lending policies and economic conditions. Underwriting standards are continually evaluated and modified based upon these factors.
Underwriting Standards
United’s loan underwriting guidelines and standards are updated periodically and are presented for approval by the respective Boards of Directors of each of its subsidiary banks. The purpose of the standards and guidelines is to grant loans on a sound and collectible basis; to invest available funds in a safe, profitable manner; to serve the legitimate credit needs of the communities of United’s primary market area; and to ensure that all loan applicants receive fair and equal treatment in the lending process. It is the intent of the underwriting guidelines and standards to: minimize loan losses by carefully investigating the credit history of each applicant, verify the source of repayment and the ability of the applicant to repay, collateralize those loans in which collateral is deemed to be required, exercise care in the documentation of the application, review, approval, and origination process, and administer a comprehensive loan collection program.
United’s underwriting standards and practices are designed to originate both fixed and variable rate loan products in a manner which is consistent with the prudent banking practices applicable to these exposures. Typically, both fixed and variable rate loan underwriting practices incorporate conservative methodology, including the use of stress testing for commercial loans, and other product appropriate measures designed to provide an adequate margin of safety for the full collection of both principal and interest within contractual terms. Consumer real estate secured loans are underwritten to the initial rate, and to a higher assumed rate commensurate with normal market conditions. Therefore, it is the intent of United’s underwriting standards to insure that adequate primary repayment capacity exists to address both future increases in interest rates, and fluctuations in the underlying cash flows available for repayment. Historically, and at December 31, 2015, United has not offered “teaser rate” loans, and had no loan portfolio products which were specifically designed for “sub-prime” borrowers. Management defines “sub-prime” borrowers as consumer borrowers with a credit score of less than 660.
6
Table of Contents
The above guidelines are adhered to and subject to the experience, background and personal judgment of the loan officer assigned to the loan application. A loan officer may grant, with justification, a loan with variances from the underwriting guidelines and standards. However, the loan officer may not exceed his or her respective lending authority without obtaining the prior, proper approval as outlined in United’s loan policy from a superior, a regional supervisor or market president (dual approval per policy) or the Loan Committee, whichever is deemed appropriate for the nature of the variance.
Loan Concentrations
United has commercial loans, including real estate and owner-occupied, income-producing real estate and land development loans, of approximately $6.6 billion as of December 31, 2015. These loans are primarily secured by real estate located in West Virginia, southeastern Ohio, southwestern Pennsylvania, Virginia, Maryland and the District of Columbia. United categorizes these commercial loans by industry according to the North American Industry Classification System (NAICS) to monitor the portfolio for possible concentrations in one or more industries. As of the most recent fiscal year-end, United has one such industry classification that exceeded 10% of total loans. As of December 31, 2015, approximately $3.6 billion or 38.8% of United’s total loan portfolio were for the purpose of renting or leasing real estate. The loans were originated by United’s subsidiary banks using underwriting standards as set forth by management. United’s loan administration policies are focused on the risk characteristics of the loan portfolio, including commercial real estate loans, in terms of loan approval and credit quality. It is the opinion of management that these loans do not pose any unusual risks and that adequate consideration has been given to the above loans in establishing the allowance for loan losses.
United does not have a loan classification concentration in the mining, quarrying and oil and gas extraction industry. As of December 31, 2015, approximately $75.5 million or 0.8% of United’s total loan portfolio were for the purpose of mining, quarrying and oil and gas extraction.
Secondary Markets
United generally originates loans within the primary market area of its banking subsidiaries. United may from time to time make loans to borrowers and/or on properties outside of its primary market area as an accommodation to its existing customers. As of December 31, 2015, the balance of mortgage loans being serviced by United for others was insignificant.
United engages in the origination and acquisition of residential real estate loans for resale. These loans are for single-family, owner-occupied residences with either adjustable or fixed rate terms, with a variety of maturities tailored to effectively serve its markets. Mortgage loan originations are generally intended to be sold in the secondary market on a best efforts basis.
During 2015, United originated $145.8 million of real estate loans for sale in the secondary market and sold $143.8 million of loans designated as held for sale in the secondary market. Net gains on the sales of these loans during 2015 were $2.5 million.
The principal sources of revenue from United’s mortgage banking business are: (i) loan origination fees; (ii) gains or losses from the sale of loans; and (iii) interest earned on mortgage loans during the period that they are held by United pending sale, if any.
7
Table of Contents
Investment Activities
United’s investment policy stresses the management of the investment securities portfolio, which includes both securities held to maturity and securities available for sale, to maximize return over the long-term in a manner that is consistent with good banking practices and relative safety of principal. United currently does not engage in trading account activity. The Asset/Liability Management Committee of United is responsible for the coordination and evaluation of the investment portfolio.
Sources of funds for investment activities include “core deposits”. Core deposits include certain demand deposits, statement and special savings and NOW accounts. These deposits are relatively stable and they are the lowest cost source of funds available to United. Short-term borrowings have also been a significant source of funds. These include federal funds purchased, securities sold under agreements to repurchase and FHLB borrowings. Repurchase agreements represent funds that are generally obtained as the result of a competitive bidding process.
United’s investment portfolio is comprised of a significant amount of U.S. Treasury securities and obligations of U.S. Agencies and Corporations as well as mortgage-backed securities. Obligations of States and Political Subdivisions are comprised of primarily “investment grade” rated municipal securities. Interest and dividends on securities for the years of 2015, 2014, and 2013 were $34.3 million, $33.9 million, and $19.5 million, respectively. For the years of 2015, 2014 and 2013, United realized net gains on sales of securities of $202 thousand, $3.4 million and $1.5 million, respectively. In the year 2015, United recognized other-than-temporary impairment (OTTI) charges of $47 thousand, consisting of OTTI on an equity security and a pooled trust preferred collateralized debt obligation (TRUP CDO). In the year 2014, United recognized other-than-temporary impairment (OTTI) charges of $6.5 million, all consisting of OTTI on pooled trust preferred collateralized debt obligations (TRUP CDOs). In the year 2013, United recognized other-than-temporary impairment (OTTI) charges of $7.3 million consisting primarily of $7.2 million on pooled trust preferred collateralized debt obligations (TRUP CDOs) and $137 thousand on equity securities.
Competition
United faces a high degree of competition in all of the markets it serves. United considers all of West Virginia to be included in its market area. This area includes the five largest West Virginia Metropolitan Statistical Areas (MSA): the Parkersburg MSA, the Charleston MSA, the Huntington MSA, the Morgantown MSA and the Wheeling MSA. United serves the Ohio counties of Lawrence, Belmont, Jefferson and Washington and Fayette county in Pennsylvania primarily because of their close proximity to the Ohio and Pennsylvania borders and United banking offices located in those counties or in nearby West Virginia. United’s Virginia markets include the Maryland, northern Virginia and Washington, D.C. MSA, the Winchester MSA, the Harrisonburg MSA, and the Charlottesville MSA. United considers all of the above locations to be the primary market area for the business of its banking subsidiaries.
With prior regulatory approval, West Virginia and Virginia banks are permitted unlimited branch banking throughout each state. In addition, interstate acquisitions of and by West Virginia and Virginia banks and bank holding companies are permissible on a reciprocal basis, as well as reciprocal interstate acquisitions by thrift institutions. These conditions serve to intensify competition within United’s market.
As of December 31, 2015, there were 65 bank holding companies operating in the State of West Virginia registered with the Federal Reserve System and the West Virginia Board of Banking and Financial Institutions and 102 bank holding companies operating in the Commonwealth of Virginia registered with the Federal Reserve System and the Virginia Corporation Commission. These holding companies are headquartered in various states and control banks throughout West Virginia and Virginia, which compete for business as well as for the acquisition of additional banks.
Economic Characteristics of Primary Market Area
As of December 2015, West Virginia’s seasonally adjusted unemployment rate was 6.3% according to information from West Virginia’s Bureau of Employment Programs. The national unemployment rate was 5.0%. The number of unemployed state residents fell 1,800 to 49,300 for the month of December as compared to the month of November. Total unemployment was up 3,600 over the year of 2014. The state unemployment rate of
8
Table of Contents
6.3% for December 2015 was a decrease from a rate of 6.5% for the month of November 2015 and up from the rate of 5.9% for the month of December 2014. Total nonfarm payroll employment increased 700 in December, with an increase of 2,300 in the goods-producing sector offset by a decrease of 1,600 in the service-providing sector. West Virginia’s not seasonally adjusted unemployment rate was 5.9% in December 2015. West Virginia’s economy has struggled over the past year, primarily driven by the state’s energy sector, where losses in coal jobs have been coupled with a recent slowdown in the natural gas industry. According to the latest forecast from the West Virginia University College of Business and Economics, employment in West Virginia is estimated to increase 0.5% per year on average through 2020, compared to an expectation of 1.2% nationally. The state’s seasonally adjusted unemployment rate is expected to remain at or above 6.5% through early-2016, but will fall over much of the outlook period, declining to the upper-5% range by 2019. Per capita personal income is expected to grow at an annual average rate of 1.8% over the next five years, below the national rate of 2.3%. West Virginia’s population has declined over the past two years and is projected to lose around 23,000 residents over the next 20 years. While the state overall is expected to lose population in coming years, 18 counties are expected to add residents. Population gains will be heavily concentrated in North-Central West Virginia and the Eastern Panhandle.
United’s Virginia subsidiary banking offices are located in markets that historically have reflected low unemployment rate levels. According to information available from the Virginia Employment Commission, Virginia’s seasonally adjusted unemployment rate did increase 0.1% for the month of December 2015 to 4.2% as compared to 4.1% for November of 2015. December’s slight increase followed five consecutive months of decline. Over the year of 2015, the seasonally adjusted unemployment rate was down 0.6% from December 2014. Virginia’s seasonally adjusted unemployment rate continues to be below the national rate of 5.0%. Seasonally adjusted nonfarm employment was up 6,800 jobs between November 2015 and December 2015 to 3,856,100. The December gain was the fourth consecutive monthly job gain. From November 2015 to December 2015, seasonally adjusted employment increased in six major industry divisions, decreased in four and remained unchanged in one. In Virginia’s official forecast, economic growth in the state is projected to moderately accelerate in 2016 relative to 2015. The forecast is for Virginia to grow slower than the nation in terms of employment and personal income. Personal income growth is expected to be 3.7% in 2016 with increases to 3.8% in 2017 and 4.2% by 2018. Total nonagricultural employment is expected to increase 1.5% in 2016. Employment in the professional and business sector is forecast to increase by 2.7% in 2016. Construction employment is expected to grow by 3% in 2016. Employment in trade, transportation and utilities is expected to increase by 0.9% in 2016. Overall, employment is expected to increase 1.3% in 2017.
Regulation and Supervision
United, as a bank holding company, is subject to the restrictions of the Bank Holding Company Act of 1956, as amended, and is registered pursuant to its provisions. As such, United is subject to the reporting requirements of and examination by the Board of Governors of the Federal Reserve System (Board of Governors).
The Bank Holding Company Act prohibits the acquisition by a bank holding company of direct or indirect ownership of more than five percent of the voting shares of any bank within the United States without prior approval of the Board of Governors. With certain exceptions, a bank holding company also is prohibited from acquiring direct or indirect ownership or control of more than five percent of the voting shares of any company which is not a bank, and from engaging directly or indirectly in business unrelated to the business of banking, or managing or controlling banks.
The Board of Governors, in its Regulation Y, permits bank holding companies to engage in preapproved non-banking activities closely related to banking or managing or controlling banks. Approval of the Board of Governors is necessary to engage in certain other non-banking activities which are not preapproved or to make acquisitions of corporations engaging in these activities. In addition, on a case-by-case basis, the Board of Governors may approve other non-banking activities.
As a bank holding company doing business in West Virginia, United is also subject to regulation and examination by the West Virginia Board of Banking and Financial Institutions (the West Virginia Banking Board) and must submit annual reports to the West Virginia Banking Board. Further, any acquisition application that United must submit to the Board of Governors must also be submitted to the West Virginia Banking Board for approval.
9
Table of Contents
The Board of Governors has broad authority to prohibit activities of bank holding companies and their non-banking subsidiaries that represent unsafe and unsound banking practices or which constitute violations of laws or regulations. The Board of Governors also can assess civil money penalties for certain activities conducted on a knowing and reckless basis, if those activities caused a substantial loss to a depository institution. The penalties can be as high as $1 million for each day the activity continues.
United Bank (WV) and United Bank (VA), as state member banks, are subject to supervision, examination and regulation by the Federal Reserve System, and as such, are subject to applicable provisions of the Federal Reserve Act and regulations issued thereunder. United Bank (WV) is subject to West Virginia banking statutes and regulations, and is primarily regulated by the West Virginia Division of Financial Institutions. United Bank (VA) is subject to the Virginia banking statutes and regulations, and is primarily regulated by the Virginia Bureau of Financial Institution. As members of the Federal Deposit Insurance Corporation (“FDIC”), United’s Banking Subsidiaries’ deposits are insured as required by federal law. Bank regulatory authorities regularly examine revenues, loans, investments, management practices, and other aspects of United’s Banking Subsidiaries. These examinations are conducted primarily to protect depositors and not shareholders. In addition to these regular examinations, United’s Banking Subsidiaries must furnish to regulatory authorities quarterly reports containing full and accurate statements of its affairs.
United is also under the jurisdiction of the SEC and certain state securities commissions in regard to the offering and sale of its securities. Generally, United must file under the Securities Exchange Act of 1933, as amended, to issue additional shares of its common stock. United is also registered under and is subject to the regulatory and disclosure requirements of the Securities Exchange Act of 1934, as amended, as administered by the SEC. United is listed on the NASDAQ Global Select Market under the quotation symbol “UBSI,” and is subject to the rules of the NASDAQ for listed companies.
SEC regulations require us to disclose certain types of business and financial data on a regular basis to the SEC and to our shareholders. We are required to file annual, quarterly and current reports with the SEC. We prepare and file an annual report on Form 10-K with the SEC that contains detailed financial and operating information, as well as a management response to specific questions about the our operations. SEC regulations require that our annual reports to shareholders contain certified financial statements and other specific items such as management’s discussion and analysis of our financial condition and results of operations. We must also file quarterly reports with the SEC on Form 10-Q that contain detailed financial and operating information for the prior quarter and we must file current reports on Form 8-K to provide the pubic with information on recent material events.
In addition to periodic reporting to the SEC, we are subject to proxy rules and tender offer rules issued by the SEC. Our officers, directors and principal shareholders (holding 10% or more of our stock) must also submit reports to the SEC regarding their holdings of our stock and any changes to such holdings, and they are subject to short-swing profit liability.
Dodd-Frank Wall Street Reform and Consumer Protection Act of 2010
On July 21, 2010, President Obama signed the Dodd-Frank Wall Street Reform and Consumer Protection Act (the Dodd-Frank Act), into law. The Dodd-Frank Act significantly changes regulation of financial institutions and the financial services industry. The Dodd-Frank Act includes, among other things, provisions creating a Financial Services Oversight Council to identify emerging systemic risks and improve interagency cooperation; centralizing the responsibility for consumer financial protection by creating a new agency, the Consumer Financial Protection Bureau, which is responsible for implementing, examining and enforcing compliance with federal consumer financial laws; permanently raising the current standard maximum deposit insurance amount to $250,000; establishing strengthened capital standards for banks, and disallowing trust preferred securities as
10
Table of Contents
qualifying for Tier 1 capital (subject to certain grandfather provisions for existing trust preferred securities); establishing new minimum mortgage underwriting standards; granting the Federal Reserve Board the power to regulate debit card interchange fees; and implementing corporate governance changes.
On December 10, 2013, the banking agencies issued a final rule implementing Section 619 of the Dodd-Frank Act, commonly referred to as the “Volcker Rule”. The Federal Reserve issued an order on December 18, 2014 extending the period which banking entities have to divest disallowed securities under the Volker Rule to July 21, 2016. The Federal Reserve also announced its intention to grant an additional one year extension of the conformance period until July 21, 2017. On January 14, 2014, the banking agencies approved an interim final rule to permit banking entities to retain interests in certain collateralized debt obligations backed primarily by trust preferred securities (Trup Cdos) from the prohibitions under the Volcker Rule. During the third quarter of 2014 United sold four Trup Cdos for a net gain of $1.3 million in response to the Volcker Rule. Under the Volcker Rule, these four securities were identified by United as covered funds and were required to be divested of before July 21, 2017. United believes the remaining Trup Cdo portfolio is excluded from the scope of the Volcker Rule.
Deposit Insurance
The deposits of United’s Banking Subsidiaries are insured by the FDIC to the extent provided by law. Accordingly, these Banking Subsidiaries are also subject to regulation by the FDIC. The Banking Subsidiaries are subject to deposit insurance assessments to maintain the Deposit Insurance Fund (DIF) of the FDIC. The FDIC utilizes a risk-based assessment system that imposes insurance premiums based upon a risk matrix that takes into account a bank’s capital level and supervisory rating (CAMELS rating) and certain financial measures to assess an institution’s ability to withstand asset-related stress and funding-related stress. The risk matrix utilizes four risk categories which are distinguished by capital levels and supervisory ratings.
In October 2010, the FDIC adopted a new DIF restoration plan to ensure that the fund reserve ratio reaches 1.35% by September 30, 2020, as required by the Dodd-Frank Act. Under the new restoration plan, the FDIC will update its loss and income projections at least semi-annually for the fund and, if needed, will increase or decrease assessment rates, following notice-and-comment rulemaking if required.
In April 2011, the FDIC implemented rulemaking under the Dodd-Frank Act to reform the deposit insurance assessment system. The final rule redefined the assessment base used for calculating deposit insurance assessments. Specifically, the rule bases assessments on an institution’s total assets less tangible capital, as opposed to total deposits. Since the new base is larger than the prior base, the FDIC also proposed lowering assessment rates so that the rules would not significantly alter the total amount of revenue collected from the industry. The new assessment scale ranges from 2.5 basis points for the least risky institutions to 45 basis points for the riskiest.
United’s FDIC insurance expense totaled $8.4 million, $7.6 million and $6.2 million in 2015, 2014 and 2013, respectively.
Capital Requirements
As a bank holding company, United is subject to consolidated regulatory capital requirements administered by the Federal Reserve Board. United’s Banking Subsidiaries are also subject to the capital requirements administered by the Federal Reserve Board. On July 2, 2013, the Federal Reserve, United’s and its banking subsidiaries’ primary federal regulator, published final rules (the Basel III Capital Rules) establishing a new comprehensive capital framework for U.S. banking organizations. The rules implement the Basel Committee’s December 2010 framework known as “Basel III” for strengthening international capital standards as well as certain provisions of the Dodd-Frank Act. The Basel III Capital Rules substantially revise the risk-based capital requirements applicable to bank holding companies and depository institutions, including United and its banking subsidiaries, compared to the current U.S. risk-based capital rules. The Basel III Capital Rules define the components of capital and address other issues affecting the numerator in banking institutions’ regulatory capital ratios. The Basel III Capital Rules also address risk weights and other issues affecting the denominator in banking institutions’ regulatory capital ratios and replace the existing risk-weighting approach, which was derived from
11
Table of Contents
Basel I capital accords of the Basel Committee, with a more risk-sensitive approach based, in part, on the standardized approach in the Basel Committee’s 2004 “Basel II” capital accords. The Basel III Capital Rules also implement the requirements of Section 939A of the Dodd-Frank Act to remove references to credit ratings from the federal banking agencies’ rules. The Basel III Capital Rules were effective for United and its banking subsidiaries on January 1, 2015 (subject to a phase-in period).
The Basel III Capital Rules, among other things, (i) introduce a new capital measure called “Common Equity Tier 1” (CET1), (ii) specify that Tier 1 capital consist of CET1 and “Additional Tier 1 capital” instruments meeting specified requirements, (iii) define CET1 narrowly by requiring that most deductions/adjustments to regulatory capital measures be made to CET1 and not to the other components of capital and (iv) expand the scope of the deductions/adjustments from capital as compared to existing regulations.
When fully phased in on January 1, 2019, the Basel III Capital Rules will require United and its banking subsidiaries to maintain (i) a minimum ratio of CET1 to risk-weighted assets of at least 4.5%, plus a 2.5% “capital conservation buffer” (which is added to the 4.5% CET1 ratio as that buffer is phased in, effectively resulting in a minimum ratio of CET1 to risk-weighted assets of at least 7% upon full implementation), (ii) a minimum ratio of Tier 1 capital to risk-weighted assets of at least 6.0%, plus the capital conservation buffer (which is added to the 6.0% Tier 1 capital ratio as that buffer is phased in, effectively resulting in a minimum Tier 1 capital ratio of 8.5% upon full implementation), (iii) a minimum ratio of Total capital (that is, Tier 1 plus Tier 2) to risk-weighted assets of at least 8.0%, plus the capital conservation buffer (which is added to the 8.0% total capital ratio as that buffer is phased in, effectively resulting in a minimum total capital ratio of 10.5% upon full implementation) and (iv) a minimum leverage ratio of 4%, calculated as the ratio of Tier 1 capital to average assets (as compared to a current minimum leverage ratio of 3% for banking organizations that either have the highest supervisory rating or have implemented the appropriate federal regulatory authority’s risk-adjusted measure for market risk).
The Basel III Capital Rules also provide for a “countercyclical capital buffer” that is applicable to only certain covered institutions and is not expected to have any current applicability to United and its banking subsidiaries.
The capital conservation buffer is designed to absorb losses during periods of economic stress. Banking institutions with a ratio of CET1 to risk-weighted assets above the minimum but below the capital conservation buffer (or below the combined capital conservation buffer and countercyclical capital buffer, when the latter is applied) will face constraints on dividends, equity repurchases and compensation based on the amount of the shortfall.
Under the Basel III Capital Rules, the initial minimum capital ratios as of January 1, 2015 are as follows:
| • | 4.5% CET1 to risk-weighted assets. |
| • | 6.0% Tier 1 capital to risk-weighted assets. |
| • | 8.0% Total capital to risk-weighted assets. |
The Basel III Capital Rules provide for a number of deductions from and adjustments to CET1. These include, for example, the requirement that mortgage servicing rights, deferred tax assets dependent upon future taxable income and significant investments in non-consolidated financial entities be deducted from CET1 to the extent that any one such category exceeds 10% of CET1 or all such categories in the aggregate exceed 15% of CET1. Under current capital standards, the effects of accumulated other comprehensive income items included in capital are excluded for the purposes of determining regulatory capital ratios. Under the Basel III Capital Rules, the effects of certain accumulated other comprehensive items are not excluded; however, non-advanced approaches banking organizations, including United and its banking subsidiaries, may make a one-time permanent election to continue to exclude these items. United and its banking subsidiaries expect to make this election in order to avoid significant variations in the level of capital depending upon the impact of interest rate fluctuations on the fair value
12
Table of Contents
of United’s securities portfolio. The Basel III Capital Rules also preclude certain hybrid securities, such as trust preferred securities, as Tier 1 capital of bank holding companies, subject to phase-out. However, the Basel III Capital Rules grandfathers non-qualifying capital instruments in the Tier 1 capital of bank holding companies with total consolidated assets of less than $15 billion as of December 31, 2009 (subject to limits). Non-qualifying capital instruments under the final rule include trust preferred securities and cumulative perpetual preferred stock issued before May 19, 2010 that bank holding companies included in Tier 1 capital under the limitations for restricted capital elements in the general risk-based capital rules. As a result, beginning in 2015, United’s and its banking subsidiaries’ trust preferred securities will be subject to a limit of 25 percent of Tier 1 capital elements excluding any non-qualifying capital instruments and after all regulatory capital deductions and adjustments applied to Tier 1 capital, which is substantially similar to the limit in the general risk-based capital rules. Trust preferred securities no longer included in United’s and its banking subsidiaries’ Tier 1 capital may be included as a component of Tier 2 capital on a permanent basis without phase-out.
Implementation of the deductions and other adjustments to CET1 began on January 1, 2015 and will be phased-in over a 4-year period (beginning at 40% on January 1, 2015 and an additional 20% per year thereafter). The implementation of the capital conservation buffer will begin on January 1, 2016 at the 0.625% level and be phased in over a four-year period (increasing by that amount on each subsequent January 1, until it reaches 2.5% on January 1, 2019).
The Basel III Capital Rules prescribe a standardized approach for risk weightings that expand the risk-weighting categories from the current four Basel I-derived categories (0%, 20%, 50% and 100%) to a much larger and more risk-sensitive number of categories, depending on the nature of the assets, generally ranging from 0% for U.S. government and agency securities, to 600% for certain equity exposures, and resulting in higher risk weights for a variety of asset categories. Specific changes to current rules impacting United’s determination of risk-weighted assets include, among other things:
| • | Applying a 150% risk weight instead of a 100% risk weight for certain high volatility commercial real estate acquisition, development and construction loans. |
| • | Assigning a 150% risk weight to exposures (other than residential mortgage exposures) that are 90 days past due. |
| • | Providing for a 20% credit conversion factor for the unused portion of a commitment with an original maturity of one year or less that is not unconditionally cancellable (currently set at 0%). |
| • | Providing for a risk weight, generally not less than 20% with certain exceptions, for securities lending transactions based on the risk weight category of the underlying collateral securing the transaction. |
| • | Providing for a 100% risk weight for claims on securities firms. |
| • | Eliminating the current 50% cap on the risk weight for OTC derivatives. |
In addition, the Basel III Capital Rules also provide more advantageous risk weights for derivatives and repurchase-style transactions cleared through a qualifying central counterparty and increases the scope of eligible guarantors and eligible collateral for purposes of credit risk mitigation.
The Basel III liquidity framework also requires banks and bank holding companies to measure their liquidity against specific liquidity tests. One test, referred to as the “Liquidity Coverage Ratio” (“LCR”), is designed to ensure that the banking entity maintains an adequate level of unencumbered high-quality liquid assets equal to the entity’s expected net cash outflow for a 30-day time horizon (or, if greater, 25% of its expected total cash outflow) under an acute liquidity stress scenario. The other test, referred to as the “Net Stable Funding Ratio” (“NSFR”), is designed to promote more medium- and long-term funding of the assets and activities of banking entities over a one-year time horizon. These requirements will incent banking entities to increase their holdings of
13
Table of Contents
U.S. Treasury securities and other sovereign debt as a component of assets and increase long-term debt as a funding source. On September 3, 2014, the federal banking agencies finalized rules implementing the LCR for advanced approaches banking organizations and a modified version of the LCR for bank holding companies with at least $50 billion in total consolidated assets that are not advanced approaches banking organizations, neither of which would apply to United or its banking subsidiaries. The federal banking agencies have not yet proposed rules to implement the NSFR.
As of December 31, 2015, United and its banking subsidiaries meet all capital adequacy requirements under the Basel III Capital Rules on a fully phased-in basis if such requirements were currently effective.
The Basel III Capital Rules adopted in July of 2013 do not address the proposed Liquidity Coverage Ratio Test and Net Stable Funding Ratio Test called for by the proposed Basel III framework.
Failure to meet statutorily mandated capital guidelines or more restrictive ratios separately established for a financial institution could subject United to a variety of enforcement remedies, including issuance of a capital directive, the termination of deposit insurance by the FDIC, a prohibition on accepting or renewing brokered deposits, limitations on the rates of interest that the institution may pay on its deposits and other restrictions on its business. As described below, significant additional restrictions can be imposed on United if it would fail to meet applicable capital requirements.
Prompt Corrective Action
The Federal Deposit Insurance Corporation Improvement Act of 1991 (“FDICIA”) establishes a new regulatory scheme, which ties the level of supervisory intervention by bank regulatory authorities primarily to a depository institution’s capital category. Among other things, FDICIA authorizes regulatory authorities to take “prompt corrective action” with respect to depository institutions that do not meet minimum capital requirements. FDICIA establishes five capital tiers: well capitalized, adequately capitalized, undercapitalized, significantly undercapitalized and critically undercapitalized.
Effective January 1, 2015, under the Basel III Capital Rules, the current prompt corrective action requirements for an institution to be “well-capitalized” is a total risk-based capital ratio of 10% or greater, a Tier 1 risk-based capital ratio of 8% or greater, a CET1 ratio of 6.5% or greater and a Tier 1 leverage ratio of 5 percent or greater.
United’s Banking Subsidiaries were “well capitalized” institutions as of December 31, 2015. Well-capitalized institutions are permitted to engage in a wider range of banking activities, including among other things, the accepting of “brokered deposits,” and the offering of interest rates on deposits higher than the prevailing rate in their respective markets.
Community Reinvestment Act
The Community Reinvestment Act of 1977 (“CRA”) requires depository institutions to assist in meeting the credit needs of their market areas consistent with safe and sound banking practice. Under the CRA, each depository institution is required to help meet the credit needs of its market areas by, among other things, providing credit to low- and moderate-income individuals and communities. Depository institutions are periodically examined for compliance with the CRA and are assigned ratings. Banking regulators take into account CRA ratings when considering approval of a proposed transaction. Each of United’s Banking Subsidiaries received a rating of “satisfactory” in their most recent CRA examination.
14
Table of Contents
Cybersecurity
In March 2015, federal regulators issued two related statements regarding cybersecurity. One statement indicates that financial institutions should design multiple layers of security controls to establish lines of defense and to ensure that their risk management processes also address the risk posed by compromised customer credentials, including security measures to reliably authenticate customers accessing internet-based services of the financial institution. The other statement indicates that a financial institution’s management is expected to maintain sufficient business continuity planning processes to ensure the rapid recovery, resumption and maintenance of the institution’s operations after a cyber-attack involving destructive malware. A financial institution is also expected to develop appropriate processes to enable recovery of data and business operations and address rebuilding network capabilities and restoring data if the institution or its critical service providers fall victim to this type of cyber-attack. If United fails to observe the regulatory guidance, United could be subject to various regulatory sanctions, including financial penalties.
In the ordinary course of business, United relies on electronic communications and information systems to conduct its operations and to store sensitive data. United employs an in-depth, layered, defensive approach that leverages people, processes and technology to manage and maintain cybersecurity controls. United employs a variety of preventative and detective tools to monitor, block, and provide alerts regarding suspicious activity, as well as to report on any suspected advanced persistent threats. Notwithstanding the strength of its defensive measures, the threat from cyber-attacks is severe, attacks are sophisticated and increasing in volume, and attackers respond rapidly to changes in defensive measures. While to date, United and its Banking Subsidiaries have not experienced a significant compromise, significant data loss or any material financial losses related to cybersecurity attacks, United’s systems and those of its customers and third-party service providers are under constant threat and it is possible that United could experience a significant event in the future. Risks and exposures related to cybersecurity attacks are expected to remain high for the foreseeable future due to the rapidly evolving nature and sophistication of these threats, as well as due to the expanding use of Internet banking, mobile banking and other technology-based products and services by United and its customers. See Item 1A. Risk Factors for a further discussion of risk related to cybersecurity.
Deposit Acquisition Limitation
Under West Virginia banking law, an acquisition or merger is not permitted if the resulting depository institution or its holding company, including its affiliated depository institutions, would assume additional deposits to cause it to control deposits in the State of West Virginia in excess of twenty five percent (25%) of such total amount of all deposits held by insured depository institutions in West Virginia. This limitation may be waived by the Commissioner of Banking by showing good cause.
Consumer Laws and Regulations
In addition to the banking laws and regulations discussed above, bank subsidiaries are also subject to certain consumer laws and regulations that are designed to protect consumers in transactions with banks. Among the more prominent of such laws and regulations are the Truth in Lending Act, the Truth in Savings Act, the Electronic Funds Transfer Act, the Expedited Funds Availability Act, the Equal Credit Opportunity Act, the Fair Credit Reporting Act, and the Fair Housing Act. These laws and regulations mandate certain disclosure requirements and regulate the manner in which financial institutions must deal with customers when taking deposits or making loans to such customers. Bank subsidiaries must comply with the applicable provisions of these consumer protection laws and regulations as part of their ongoing customer relations.
As discussed above, the Dodd-Frank Act centralized responsibility for consumer financial protection by creating the CFPB, and giving it responsibility for implementing, examining and enforcing compliance with federal consumer protection laws. The CFPB has broad rulemaking, supervisory and enforcement authority over consumer financial products and services, including deposit products, residential mortgages, home-equity loans, and credit cards. The CFPB’s functions include investigating consumer complaints, rulemaking, supervising and examining banks’ consumer transactions, and enforcing rules related to consumer financial products and services. Banks with less than $10 billion in assets, such as United’s Banking Subsidiaries, will be subject to these federal consumer financial laws, but will continue to be examined for compliance by the Federal Reserve, its primary federal banking regulator.
15
Table of Contents
Incentive Compensation
The Federal Reserve Board reviews, as part of its regular, risk-focused examination process, the incentive compensation arrangements of banking organizations, such as United, that are not “large, complex banking organizations.” These reviews are tailored to each organization based on the scope and complexity of the organization’s activities and the prevalence of incentive compensation arrangements. The findings of this supervisory initiative will be included in reports of examination. Deficiencies will be incorporated into the organization’s supervisory ratings, which can affect the organization’s ability to make acquisitions and take other actions. Enforcement actions may be taken against a banking organization if its incentive compensation arrangements, or related risk-management control or governance processes, pose a risk to the organization’s safety and soundness and the organization is not taking prompt and effective measures to correct the deficiencies.
In June 2010, the Federal Reserve Board, OCC and FDIC issued comprehensive final guidance on incentive compensation policies intended to ensure that the incentive compensation policies of banking organizations do not undermine the safety and soundness of such organizations by encouraging excessive risk-taking. The guidance, which covers all employees that have the ability to materially affect the risk profile of an organization, either individually or as part of a group, is based upon the key principles that a banking organization’s incentive compensation arrangements should (i) provide incentives that do not encourage risk-taking beyond the organization’s ability to effectively identify and manage risks, (ii) be compatible with effective internal controls and risk management, and (iii) be supported by strong corporate governance, including active and effective oversight by the organization’s board of directors.
In April 2011, the Federal Reserve Board, other federal banking agencies and the SEC jointly published proposed rulemaking designed to implement provisions of the Dodd-Frank Act prohibiting incentive compensation arrangements that would encourage inappropriate risk taking at a covered institution, which includes a bank or bank holding company with $1 billion or more of assets, such as United. The proposed rule (i) prohibits incentive-based compensation arrangements that encourage executive officers, employees, directors or principal shareholders to expose the institution to inappropriate risks by providing excessive compensation (based on the standards for excessive compensation adopted pursuant to the FDIA) and (ii) prohibits incentive-based compensation arrangements for executive officers, employees, directors or principal shareholders that could lead to a material financial loss for the institution. The proposed rule requires covered institutions to establish policies and procedures for monitoring and evaluating their compensation practices. The comment period ended in May 2011. Although final rules have not been adopted as of February 2016, officials from the Federal Reserve have recently indicated that the U.S. banking regulators are in the process of preparing for public comment a new rule on incentive compensation. If these or other regulations are adopted in a form similar to that initially proposed, they will impose limitations on the manner in which we may structure compensation for our executives.
The scope and content of the U.S. banking regulators’ policies on incentive compensation are continuing to develop. It cannot be determined at this time whether or when a final rule will be adopted and whether compliance with such a final rule will adversely affect the ability of United and its Banking Subsidiaries to hire, retain and motivate their key employees.
| Item 1A. | RISK FACTORS |
United is subject to risks inherent to the Company’s business. The material risks and uncertainties that management believes affect the Company are described below. Before making an investment decision, you should carefully consider the risks and uncertainties described below together with all of the other information included or incorporated by reference in this report. The risks and uncertainties described below are not the only ones facing the Company. Additional risks and uncertainties that management is not aware of or focused on or that management currently deems immaterial may also impair United’s business operations. This report is qualified in its entirety by these risk factors.
16
Table of Contents
RISKS RELATING TO UNITED’S BUSINESS
Changes in economic and political conditions could adversely affect our earnings, as our borrowers’ ability to repay loans and the value of the collateral securing our loans decline.
United’s success depends, to a certain extent, upon local and national economic and political conditions, as well as governmental monetary policies. Conditions such as an economic recession, rising unemployment, changes in interest rates, money supply and other factors beyond its control may adversely affect United’s and its Banking Subsidiaries’ asset quality, deposit levels and loan demand and, therefore, its earnings. Because United has a significant amount of real estate loans, decreases in real estate values could adversely affect the value of property used as collateral. Adverse changes in the economy may also have a negative effect on the ability of our borrowers to make timely repayments of their loans, which could have an adverse impact on our earnings. Consequently, declines in the economy in our market area could have a material adverse effect on our financial condition and results of operations.
The value of certain investment securities is volatile and future declines or other-than-temporary impairments could have a materially adverse effect on future earnings and regulatory capital.
Continued volatility in the fair value for certain investment securities, whether caused by changes in market conditions, interest rates, credit risk of the issuer, the expected yield of the security, or actual defaults in the portfolio could result in significant fluctuations in the value of the securities as well as any regulatory rulemaking such as the Volcker Rule which could exclude or limit the holdings of certain investment securities. This could have a material adverse impact on United’s accumulated other comprehensive income and shareholders’ equity depending on the direction of the fluctuations. Furthermore, future downgrades, defaults or prepayments, including the liquidation of the underlying collateral in certain securities, could result in future classifications as other-than-temporarily impaired. This could have a material impact on United’s future earnings, although the impact on shareholders’ equity will be offset by any amount already included in other comprehensive income for securities that were temporarily impaired.
There are no assurances as to adequacy of the allowance for loan losses.
United believes that its allowance for loan losses is maintained at a level appropriate to absorb any probable losses in its loan portfolio given the current information known to management.
Management establishes the allowance based upon many factors, including, but not limited to:
| • | historical loan loss experience; |
| • | industry diversification of the commercial loan portfolio; |
| • | the effect of changes in the local real estate market on collateral values; |
| • | the amount of nonperforming loans and related collateral security; |
| • | current economic conditions that may affect the borrower’s ability to pay and value of collateral; |
| • | volume, growth and composition of the loan portfolio; and |
| • | other factors management believes are relevant. |
These determinations are based upon estimates that are inherently subjective, and their accuracy depends on the outcome of future events, so ultimate losses may differ from current estimates. Changes in economic, operating and other conditions, including changes in interest rates, that are generally beyond United’s control, can affect United’s loan losses. Continuing deterioration in economic conditions affecting borrowers, new information regarding existing loans, identification of additional problem loans and other factors, both within and outside of United’s control, may require an increase in the allowance for credit losses. United can provide no assurance that its allowance is sufficient to cover actual loan losses should such losses differ substantially from our current estimates.
17
Table of Contents
In addition, federal and state regulators, as an integral part of their respective supervisory functions, periodically review United’s allowance for loan losses, and may require an increase in the provision for loan losses or the recognition of further loan charge-offs, based on judgments different than those of management. Furthermore, if charge-offs in future periods exceed the allowance for loan losses, United will need additional provisions to increase the allowance for loan losses. Any increases in the allowance for loan losses will result in a decrease in net income and, possibly, capital, and may have a material adverse effect on United’s business, financial condition and results of operations.
Changes in interest rates may adversely affect United’s business.
United’s earnings, like most financial institutions, are significantly dependent on its net interest income. Net interest income is the difference between the interest income United earns on loans and other assets which earn interest and the interest expense incurred to fund those assets, such as on savings deposits and borrowed money. Therefore, changes in general market interest rates, such as a change in the monetary policy of the Board of Governors of the Federal Reserve System or otherwise beyond those which are contemplated by United’s interest rate risk model and policy, could have an effect on net interest income. For more information concerning United’s interest rate risk model and policy, see the discussion under the caption “Quantitative and Qualitative Disclosures About Market Risk” under Item 7A.
United is subject to credit risk.
There are risks inherent in making any loan, including risks with respect to the period of time over which the loan may be repaid, risks resulting from changes in economic and industry conditions, risks inherent in dealing with individual borrowers and risks resulting from uncertainties as to the future value of collateral. United seeks to mitigate the risk inherent in its loan portfolio by adhering to prudent loan approval practices. Although United believes that its loan approval criteria are appropriate for the various kinds of loans the Company makes, United may incur losses on loans that meet our loan approval criteria. Due to recent economic conditions affecting the real estate market, many lending institutions, including United, have experienced substantial declines in the performance of their loans, including construction, land development and land loans. The value of real estate collateral supporting many construction and land development loans, land loans, commercial and multi-family loans have declined and may continue to decline. United cannot assure that the economic conditions affecting customers and the quality of the loan portfolio will improve and thus, United’s financial condition and results of operations could continue to be adversely affected.
Loss of United’s Chief Executive Officer or other executive officers could adversely affect its business.
United’s success is dependent upon the continued service and skills of its executive officers and senior management. If United loses the services of these key personnel, it could have a negative impact on United’s business because of their skills, years of industry experience and the difficulty of promptly finding qualified replacement personnel. The services of Richard M. Adams, United’s Chief Executive Officer, would be particularly difficult to replace. United and Mr. Adams are parties to an Employment Agreement providing for his continued employment by United through March 31, 2019.
United operates in a highly competitive market.
United faces a high degree of competition in all of the markets it serves. United considers all of West Virginia to be included in its market area. This area includes the five largest West Virginia Metropolitan Statistical Areas (MSA): the Parkersburg MSA, the Charleston MSA, the Huntington MSA, the Morgantown MSA and the Wheeling MSA. United serves the Ohio counties of Lawrence, Belmont, Jefferson and Washington and Fayette county in Pennsylvania primarily because of their close proximity to the Ohio and Pennsylvania borders and United
18
Table of Contents
banking offices located in those counties or in nearby West Virginia. United’s Virginia markets include the Maryland, northern Virginia and Washington, D.C. MSA, the Winchester MSA, the Harrisonburg MSA, and the Charlottesville MSA. United considers all of the above locations to be the primary market area for the business of its banking subsidiaries.
There is a risk that aggressive competition could result in United controlling a smaller share of these markets. A decline in market share could lead to a decline in net income which would have a negative impact on stockholder value.
United may be adversely affected by the soundness of other financial institutions.
Financial services institutions are interrelated as a result of trading, clearing, counterparty, or other relationships. United has exposure to many different industries and counterparties, and routinely executes transactions with counterparties in the financial services industry, including brokers and dealers, commercial banks, investment banks, mutual and hedge funds, or other institutional clients. Recent defaults by financial services institutions, and even rumors or questions about a financial institution or the financial services industry in general, have led to marketwide liquidity problems and could lead to losses or defaults by United or other institutions. Any such losses could adversely affect United’s financial condition or results of operations.
United is subject to extensive government regulation and supervision.
United is subject to extensive federal and state regulation, supervision and examination. Banking regulations are primarily intended to protect depositors’ funds, federal deposit insurance funds and the banking system as a whole, not shareholders. These regulations affect United’s lending practices, capital structure, investment practices, dividend policy, operations and growth, among other things. These regulations also impose obligations to maintain appropriate policies, procedures and controls, among other things, to detect, prevent and report money laundering and terrorist financing and to verify the identities of United’s customers. Congress and federal regulatory agencies continually review banking laws, regulations and policies for possible changes. The Dodd-Frank Act, enacted in July 2010, instituted major changes to the banking and financial institutions regulatory regimes. Other changes to statutes, regulations or regulatory policies, including changes in interpretation or implementation of statutes, regulations or policies, could affect United in substantial and unpredictable ways. Such changes could subject the Company to additional costs, limit the types of financial services and products United may offer and/or increase the ability of nonbanks to offer competing financial services and products, among other things. United expends substantial effort and incurs costs to improve its systems, audit capabilities, staffing and training in order to satisfy regulatory requirements, but the regulatory authorities may determine that such efforts are insufficient. Failure to comply with relevant laws, regulations or policies could result in sanctions by regulatory agencies, civil money penalties and/or reputation damage, which could have a material adverse effect on United’s business, financial condition and results of operations. While the Company has policies and procedures designed to prevent any such violations, there can be no assurance that such violations will not occur.
In the normal course of business, United and its subsidiaries are routinely subject to examinations and challenges from federal and state tax authorities regarding the amount of taxes due in connection with investments that the Company has made and the businesses in which United has engaged. Recently, federal and state taxing authorities have become increasingly aggressive in challenging tax positions taken by financial institutions. These tax positions may relate to tax compliance, sales and use, franchise, gross receipts, payroll, property and income tax issues, including tax base, apportionment and tax credit planning. The challenges made by tax authorities may result in adjustments to the timing or amount of taxable income or deductions or the allocation of income among tax jurisdictions. If any such challenges are made and are not resolved in the Company’s favor, they could have a material adverse effect on United’s financial condition and results of operations.
The Consumer Financial Protection Bureau (CFPB) may reshape the consumer financial laws through rulemaking and enforcement of the prohibitions against unfair, deceptive and abusive business practices. Compliance with any such change may impact the business operations of depository institutions offering consumer financial products or services, including United’s Banking Subsidiaries.
19
Table of Contents
The CFPB has broad rulemaking authority to administer and carry out the provisions of the Dodd-Frank Act with respect to financial institutions that offer covered financial products and services to consumers. The CFPB has also been directed to write rules identifying practices or acts that are unfair, deceptive or abusive in connection with any transaction with a consumer for a consumer financial product or service, or the offering of a consumer financial product or service. The concept of what may be considered to be an “abusive” practice is relatively new under the law. Moreover, United’s Banking Subsidiaries will be supervised and examined by the CFPB for compliance with the CFPB’s regulations and policies. The costs and limitations related to this additional regulatory reporting regimen have yet to be fully determined, although they may be material and the limitations and restrictions that will be placed upon United’s Banking Subsidiaries with respect to its consumer product offering and services may produce significant, material effects on United’s Banking Subsidiaries’ (and United’s) profitability.
United may elect or be compelled to seek additional capital in the future, but capital may not be available when it is needed.
United is required by federal and state regulatory authorities to maintain adequate levels of capital to support the Company’s operations. In addition, United may elect to raise additional capital to support the Company’s business or to finance acquisitions, if any, or United may otherwise elect to raise additional capital. In that regard, a number of financial institutions have recently raised considerable amounts of capital as a result of deterioration in their results of operations and financial condition arising from the turmoil in the mortgage loan market, deteriorating economic conditions, declines in real estate values and other factors, which may diminish United’s ability to raise additional capital.
United’s ability to raise additional capital, if needed, will depend on conditions in the capital markets, economic conditions and a number of other factors, many of which are outside the Company’s control, and on United’s financial performance. Accordingly, United cannot be assured of its ability to raise additional capital if needed or on terms acceptable to the Company. If United cannot raise additional capital when needed, it may have a material adverse effect on the Company’s financial condition, results of operations and prospects.
United’s information systems may experience an interruption or breach in security.
United relies heavily on communications and information systems to conduct its business. In addition, as part of its business, United collects, processes and retains sensitive and confidential client and customer information. United’s facilities and systems, and those of our third party service providers, may be vulnerable to security breaches, acts of vandalism, computer viruses, misplaced or lost data, programming and/or human errors, or other similar events. Any failure, interruption or breach in security of these systems could result in failures or disruptions in the Company’s customer relationship management, general ledger, deposit, loan and other systems. While United has policies and procedures designed to prevent or limit the effect of the failure, interruption or security breach of its information systems, there can be no assurance that any such failures, interruptions or security breaches will not occur or, if they do occur, that they will be adequately addressed. The occurrence of any failures, interruptions or security breaches of the Company’s information systems could damage United’s reputation, result in a loss of customer business, subject United to additional regulatory scrutiny, or expose the Company to civil litigation and possible financial liability, any of which could have a material adverse effect on United’s financial condition and results of operations.
United is subject to higher regulatory capital requirements and failure to comply with these standards may impact dividend payments, equity repurchases and executive compensation.
On July 2, 2013, the Federal Reserve published final rules that substantially amend the regulatory risk-based capital rules applicable to United, United Bank (West Virginia) and United Bank (Virginia). The rules implement the “Basel III” regulatory capital reforms and changes required by the Dodd-Frank Act, or the Basel III Capital Rules. The new rules were effective for United and its banking subsidiaries on January 1, 2015 (subject to a phase-in period for certain of the new rules).
20
Table of Contents
The Basel III Capital Rules, among other things, (i) introduce a new capital measure called “Common Equity Tier 1”, or CET1, (ii) specify that Tier 1 capital consists of CET1 and “Additional Tier 1 Capital” instruments meeting specified requirements, (iii) define CET1 narrowly by requiring that most deductions/ adjustments to regulatory capital measures be made to CET1 and not to the other components of capital and (iv) expand the scope of the deductions/adjustments from capital as compared to existing regulations, and particularly as applied to CET1.
Under the Basel III Capital Rules, the initial minimum capital and leverage ratios as of January 1, 2015 are as follows:
| • | 4.5% CET1 to risk-weighted assets. |
| • | 6.0% Tier 1 capital to risk-weighted assets. |
| • | 8.0% Total capital to risk-weighted assets. |
| • | 4.0% Tier 1 capital to average assets. |
In addition to raising minimum capital and leverage ratios, the Basel III Capital Rules also establish a capital conservation buffer that is designed to absorb losses during periods of economic stress. The capital conservation buffer will be phased in from January 1, 2016 to January 1, 2019 in equal annual installments, and when fully implemented the capital conservation buffer will effectively add 2.5% to each of the minimum capital ratios. Banking institutions with a ratio of CET1 to risk-weighted assets above the minimum but below the capital conservation buffer will face constraints on dividends, equity repurchases and compensation based on the amount of the shortfall.
With respect to United’s banking subsidiaries, the Basel III Capital Rules also revise the “prompt corrective action” regulations pursuant to Section 38 of the Federal Deposit Insurance Act, by (i) introducing a CET1 ratio requirement at each level (other than critically undercapitalized), with the required CET1 ratio being 6.5% for well-capitalized status; (ii) increasing the minimum Tier 1 capital ratio requirement for each category, with the minimum Tier 1 capital ratio for well-capitalized status being 8% (as compared to the current 6%); and (iii) eliminating the current provision that provides that a bank with a composite supervisory rating of 1 may have a 3% leverage ratio and still be adequately capitalized. The Basel III Capital Rules do not change the total risk-based capital requirement for any “prompt corrective action” category.
The Basel III Capital Rules prescribe a standardized approach for risk weightings that expand the risk-weighting categories from the current four Basel I-derived categories (0%, 20%, 50% and 100%) to a much larger and more risk-sensitive number of categories, depending on the nature of the assets, generally ranging from 0% for U.S. government and agency securities, to 600% for certain equity exposures, and resulting in higher risk weights for a variety of asset categories. In particular, the Basel III Capital Rules increase risk weights that apply to past-due exposures and high volatility commercial real estate loans.
The Basel III changes have resulted in generally higher minimum capital ratios that require United and its subsidiaries to maintain capital buffers above minimum requirements to avoid restrictions on capital distributions and executive bonus payments. In addition, the application of more stringent capital requirements for United, United Bank (West Virginia) and United Bank (Virginia) could, among other things, result in lower returns on invested capital, require the raising of additional capital and result in additional regulatory actions if United were to be unable to comply with such requirements. Implementation of changes to asset risk weightings for risk based capital calculations, items included or deducted in calculating regulatory capital and/or additional capital conservation buffers could result in management modifying its business strategy and could limit United’s ability to make distributions, including paying dividends.
21
Table of Contents
In addition, in the current economic and regulatory environment, regulators of banks and bank holding companies have become more likely to impose capital requirements on bank holding companies and banks that are more stringent than those required by applicable existing regulations.
Failure to maintain effective internal controls over financial reporting in the future could impair United’s ability to accurately and timely report its financial results or prevent fraud, resulting in loss of investor confidence and adversely affecting United’s business and stock price.
Effective internal controls over financial reporting are necessary to provide reliable financial reports and prevent fraud. Management believes that United’s internal controls over financial reporting are currently effective. Management will continually review and analyze the Company’s internal controls over financial reporting for Sarbanes-Oxley Section 404 compliance. Any failure to maintain, in the future, an effective internal control environment could impact United’s ability to report its financial results on an accurate and timely basis, which could result in regulatory actions, loss of investor confidence, and adversely impact United’s business and stock price.
United could face unanticipated environmental liabilities or costs related to real property owned or acquired through foreclosure. Compliance with federal, state and local environmental laws and regulations, including those related to investigation and clean-up of contaminated sites, could have a negative effect on expenses and results of operations.
A significant portion of United’s loan portfolio is secured by real property. During the ordinary course of business, United may foreclose on and take title to properties securing certain loans. In doing so, there is a risk that hazardous or toxic substances could be found on these properties. If hazardous or toxic substances are found, United may be liable for remediation costs, as well as for personal injury and property damage. Environmental laws may require United to incur substantial expenses and may materially reduce the affected property’s value or limit United’s ability to use or sell the affected property. In addition, future laws or more stringent interpretations or enforcement policies with respect to existing laws may increase exposure to environmental liability. Although United has policies and procedures to perform an environmental review before initiating any foreclosure action on real property, these reviews may not be sufficient to detect all potential environmental hazards. The remediation costs and any other financial liabilities associated with an environmental hazard could have a material adverse effect on results of operations.
United’s earnings are significantly affected by the fiscal and monetary policies of the federal government and its agencies.
The policies of the Federal Reserve impact United significantly. The Federal Reserve regulates the supply of money and credit in the United States. Its policies directly and indirectly influence the rate of interest earned on loans and paid on borrowings and interest-bearing deposits and can also affect the value of financial instruments we hold. Those policies determine to a significant extent our cost of funds for lending and investing. Changes in those policies are beyond our control and are difficult to predict. Federal Reserve policies can also affect our borrowers, potentially increasing the risk that they may fail to repay their loans. For example, a tightening of the money supply by the Federal Reserve could reduce the demand for a borrower’s products and services. This could adversely affect the borrower’s earnings and ability to repay its loan, which could have a material adverse effect on our financial condition and results of operations.
New accounting or tax pronouncements or interpretations may be issued by the accounting profession, regulators or other government bodies which could change existing accounting methods. Changes in accounting methods could negatively impact United’s results of operations and financial condition.
Current accounting and tax rules, standards, policies and interpretations influence the methods by which financial institutions conduct business, implement strategic initiatives and tax compliance, and govern financial reporting and disclosures. These laws, regulations, rules, standards, policies, and interpretations are constantly
22
Table of Contents
evolving and may change significantly over time. Events that may not have a direct impact on United, such as the bankruptcy of major U.S. companies, have resulted in legislators, regulators and authoritative bodies, such as the Financial Accounting Standards Board, the SEC, the Public Company Accounting Oversight Board, and various taxing authorities, responding by adopting and/or proposing substantive revision to laws, regulations, rules, standards, policies, and interpretations. New accounting pronouncements and varying interpretations of accounting pronouncements have occurred and may occur in the future. A change in accounting standards may adversely affect reported financial condition and results of operations.
Unauthorized disclosure of sensitive or confidential client or customer information, whether through a cyber-attack, other breach of our computer systems or otherwise, could severely harm our business.
In the normal course of our business, we collect, process and retain sensitive and confidential client and customer information on our behalf and on behalf of other third parties. Despite the security measures we have in place, our facilities and systems may be vulnerable to cyber-attacks, security breaches, acts of vandalism, computer viruses, misplaced or lost data, programming and / or human errors, or other similar events.
Information security risks for financial institutions like us have increased recently in part because of new technologies, the use of the internet and telecommunications technologies (including mobile devices) to conduct financial and other business transactions and the increased sophistication and activities of organized crime, perpetrators of fraud, hackers, terrorists and others. In addition to cyber-attacks or other security breaches involving the theft of sensitive and confidential information, hackers have engaged in attacks against large financial institutions, particularly denial of service attacks, designed to disrupt key business services such as customer-facing web sites. We are not able to anticipate or implement effective preventive measures against all security breaches of these types. Although we employ detection and response mechanisms designed to contain and mitigate security incidents, early detection may be thwarted by persistent sophisticated attacks and malware designed to avoid detection.
We also face risks related to cyber-attacks and other security breaches in connection with card transactions that typically involve the transmission of sensitive information regarding our customers through various third parties. Some of these parties have in the past been the target of security breaches and cyber-attacks, and because the transactions involve third parties and environments that we do not control or secure, future security breaches or cyber-attacks affecting any of these third parties could impact us through no fault of our own, and in some cases we may have exposure and suffer losses for breaches or attacks relating to them. We also rely on numerous other third party service providers to conduct other aspects of our business operations and face similar risks relating to them. While we conduct security assessments on our higher risk third parties, we cannot be sure that their information security protocols are sufficient to withstand a cyber-attack or other security breach.
Any cyber-attack or other security breach involving the misappropriation, loss or other unauthorized disclosure of confidential customer information could severely damage our reputation, erode confidence in the security of our systems, products and services, expose us to the risk of litigation and liability, disrupt our operations and have a material adverse effect on our business.
United’s business continuity plans or data security systems could prove to be inadequate, resulting in a material interruption in, or disruption to, its business and a negative impact on results of operations.
United relies heavily on communications and information systems to conduct its business. Any failure, interruption or breach in security of these systems, whether due to severe weather, natural disasters, cyber-attack, acts of war or terrorism, criminal activity or other factors, could result in failures or disruptions in general ledger, deposit, loan, customer relationship management and other systems. While United has disaster recovery and other policies and procedures designed to prevent or limit the effect of the failure, interruption or security breach of its information systems, there can be no assurance that any such failures, interruptions or security breaches will not occur or, if they do occur, that they will be adequately addressed. The occurrence of any failures, interruptions or security breaches of United’s information systems could damage its reputation, result in a loss of customer business, subject it to additional regulatory scrutiny or expose it to civil litigation and possible financial liability, any of which could have a material adverse effect on results of operations.
23
Table of Contents
The negative economic effects caused by terrorist attacks, including cyber-attacks, potential attacks and other destabilizing events would likely contribute to the deterioration of the quality of United’s loan portfolio and could reduce its customer base, level of deposits, and demand for its financial products such as loans.
High inflation, natural disasters, acts of terrorism, including cyber-attacks, an escalation of hostilities or other international or domestic occurrences, and other factors could have a negative impact on the economy of the Mid-Atlantic regions in which United operates. An additional economic downturn in its markets would likely contribute to the deterioration of the quality of United’s loan portfolio by impacting the ability of its customers to repay loans, the value of the collateral securing loans, and may reduce the level of deposits in its bank and the stability of its deposit funding sources. An additional economic downturn could also have a significant impact on the demand for United’s products and services. The cumulative effect of these matters on United’s results of operations and financial condition would likely be adverse and material.
United’s vendors could fail to fulfill their contractual obligations, resulting in a material interruption in, or disruption to, its business and a negative impact on results of operations.
United is dependent upon third parties for certain information system, data management and processing services and to provide key components of its business infrastructure. United has entered into subcontracts for the supply of current and future services, such as data processing, mortgage loan processing and servicing, and certain property management functions. These services must be available on a continuous and timely basis and be in compliance with any regulatory requirements. Failure to do so could substantially harm United’s business.
United often purchases services from vendors under agreements that typically can be terminated on a periodic basis. There can be no assurance, however, that vendors will be able to meet their obligations under these agreements or that United will be able to compel them to do so. Risks of relying on vendors include the following:
| • | If an existing agreement expires or a certain service is discontinued by a vendor, then United may not be able to continue to offer its customers the same breadth of products and its operating results would likely suffer unless it is able to find an alternate supply of a similar service. |
| • | Agreements United may negotiate in the future may commit it to certain minimum spending obligations. It is possible United will not be able to create the market demand to meet such obligations. |
| • | If market demand for United’s products increases suddenly, its current vendors might not be able to fulfill United’s commercial needs, which would require it to seek new arrangements or new sources of supply, and may result in substantial delays in meeting market demand. |
| • | United may not be able to control or adequately monitor the quality of services it receives from its vendors. Poor quality services could damage United’s reputation with its customers. |
In addition, these third party service providers are sources of operational and informational security risk to United, including risks associated with operational errors, information system interruptions or breaches, and unauthorized disclosures of sensitive or confidential client or customer information. If third party service providers encounter any of these issues, or if United has difficulty communicating with them, United could be exposed to disruption of operations, loss of service or connectivity to customers, reputational damage, and litigation risk that could have a material adverse effect on our results of operations or our business.
Potential problems with vendors such as those discussed above could have a significant adverse effect on United’s business, lead to higher costs and damage its reputation with its customers and, in turn, have a material adverse effect on its financial condition and results of operations.
24
Table of Contents
Regulatory approvals may not be received, may take longer than expected or impose conditions that are not presently anticipated.
On November 9, 2015, United and Bank of Georgetown announced a strategic business combination in which Georgetown will merge with and into United Bank, an indirect wholly-owned subsidiary of United. Before the merger with the Bank of Georgetown may be completed, United must obtain various approvals or consents from the Federal Reserve and various bank regulatory and other authorities. These regulators may impose conditions on the completion of the merger or require changes to the terms of the merger. Although United and Bank of Georgetown do not currently expect that any such conditions or changes would be imposed, there can be no assurance that they will not be, and such conditions or changes could have the effect of delaying completion of the merger or imposing additional costs on or limiting the revenues of United following the merger. There can be no assurance as to whether the regulatory approvals will be received, the timing of those approvals, or whether any conditions will be imposed. The merger agreement contains a condition to the obligation of each of United and Bank of Georgetown to close the merger that the required regulatory approvals not contain any conditions, restrictions or requirements applicable either before or after the effective time of the merger that the United board of directors reasonably determines in good faith would have a material adverse effect on United and its Banking Subsidiaries taken as a whole taking into account the consummation of the merger in making such determination.
The integration of the operations of United and Bank of Georgetown may be more difficult, costly or time-consuming than anticipated.
The success of the merger will depend, in part, on United’s ability to realize the anticipated benefits and cost savings from successfully combining the businesses of United and Bank Georgetown and to combine the businesses of United and Bank of Georgetown in a manner that permits growth opportunities and cost savings to be realized without materially disrupting the existing customer relationships of Bank of Georgetown or decreasing revenues due to loss of customers. If United is not able to achieve these objectives, the anticipated benefits and cost savings of the merger may not be realized fully or at all or may take longer to realize than expected.
It is possible that the integration process could result in the loss of key employees, the disruption of each company’s ongoing businesses or inconsistencies in standards, controls, procedures and policies that adversely affect the combined company’s ability to maintain relationships with clients, customers, depositors and employees or to achieve the anticipated benefits of the merger. The loss of key employees could adversely affect United’s ability to successfully conduct its business in the markets in which Bank of Georgetown now operates, which could have an adverse effect on United’s financial results and the value of its common stock. If United experiences difficulties with the integration process, the anticipated benefits of the merger may not be realized fully or at all, or may take longer to realize than expected. As with any merger of financial institutions, there also may be business disruptions that cause Bank of Georgetown to lose customers or cause customers to remove their accounts from Bank of Georgetown and move their business to competing financial institutions. Integration efforts between the two companies will also divert management attention and resources. These integration matters could have an adverse effect on each of Bank Georgetown and United during this transition period and for an undetermined period after consummation of the merger.
The success of the merger with Bank of Georgetown will also depend on United’s ability to:
| • | Retain and attract qualified personnel to, United and Georgetown; |
| • | Maintain existing relationships with depositors of Bank of Georgetown to minimize withdrawals of deposits prior to and subsequent to the merger; |
| • | Maintain and enhance existing relationships with borrowers to limit unanticipated losses from loans of Bank of Georgetown; |
| • | Control the incremental non-interest expense from United to maintain overall operating efficiencies; and |
| • | Compete effectively in the communities served by United and Bank of Georgetown and in nearby communities. |
25
Table of Contents
United may fail to realize the cost savings estimated for the merger.
Although United estimates that it will realize cost savings of approximately $18 million annually (excluding one-time costs and expenses associated with the merger with Bank of Georgetown) from the merger when fully phased in, it is possible that the estimates of the potential cost savings could turn out to be incorrect. For example, the combined purchasing power may not be as strong as expected, and therefore the cost savings could be reduced. In addition, future business developments may require United to continue to operate or maintain some facilities or support functions that are currently expected to be combined or reduced. The cost savings estimates also depend on United’s ability to combine the businesses of United and Bank of Georgetown in a manner that permits those costs savings to be realized. If the estimates turn out to be incorrect or United is not able to combine the two companies successfully, the anticipated cost savings may not be fully realized or realized at all, or may take longer to realize than expected.
United’s potential inability to integrate companies it may acquire in the future could have a negative effect on its expenses and results of operations.
In addition to the Bank of Georgetown merger, United may engage in a strategic acquisition when it believes there is an opportunity to strengthen and expand its business. To fully benefit from such acquisition, however, United must integrate the administrative, financial, sales, lending, collections and marketing functions of the acquired company. If United is unable to successfully integrate an acquired company, it may not realize the benefits of the acquisition, and its financial results may be negatively affected. A completed acquisition may adversely affect United’s financial condition and results of operations, including its capital requirements and the accounting treatment of the acquisition. Completed acquisitions may also lead to significant unexpected liabilities after the consummation of these acquisitions.
RISKS ASSOCIATED WITH UNITED’S COMMON STOCK
United’s stock price can be volatile.
Stock price volatility may make it more difficult for United shareholders to resell their common stock when they want and at prices they find attractive. United’s stock price can fluctuate significantly in response to a variety of factors, including, among other things:
| • | Actual or anticipated negative variations in quarterly results of operations; |
| • | Negative recommendations by securities analysts; |
| • | Poor operating and stock price performance of other companies that investors deem comparable to United; |
| • | News reports relating to negative trends, concerns and other issues in the financial services industry or the economy in general; |
| • | Negative perceptions in the marketplace regarding United and/or its competitors; |
| • | New technology used, or services offered, by competitors; |
| • | Adverse changes in interest rates or a lending environment with prolonged low interest rates; |
| • | Adverse changes in the real estate market; |
| • | Negative economic news; |
| • | Failure to integrate acquisitions or realize anticipated benefits from acquisitions; |
| • | Adverse changes in government regulations; and |
| • | Geopolitical conditions such as acts or threats of terrorism or military conflicts. |
General market fluctuations, industry factors and general economic and political conditions and events, such as economic slowdowns or recessions, interest rate changes or credit loss trends, could also cause United’s stock price to decrease regardless of operating results.
26
Table of Contents
Dividend payments by United’s subsidiaries to United and by United to its shareholders can be restricted.
The declaration and payment of future cash dividends will depend on, among other things, United’s earnings, the general economic and regulatory climate, United’s liquidity and capital requirements, and other factors deemed relevant by United’s board of directors. Federal Reserve Board policy limits the payment of cash dividends by bank holding companies, without regulatory approval, and requires that a holding company serve as a source of strength to its banking subsidiaries.
United’s principal source of funds to pay dividends on its common stock is cash dividends from its subsidiaries. The payment of these dividends by its subsidiaries is also restricted by federal and state banking laws and regulations. As of December 31, 2015, an aggregate of approximately $69.7 million and $55.6 million was available for dividend payments from United Bank (WV) and United Bank (VA), respectively, to United without regulatory approval.
An investment in United common stock is not an insured deposit.
United common stock is not a bank deposit and, therefore, is not insured against loss by the Federal Deposit Insurance Corporation, any other deposit insurance fund or by any other public or private entity. Investment in United common stock is inherently risky for the reasons described in this section and elsewhere in this prospectus and joint proxy statement and is subject to the same market forces that affect the price of common stock in any company. As a result, someone who acquires United common stock, could lose some or all of their investment.
Certain banking laws may have an anti-takeover effect.
Provisions of federal banking laws, including regulatory approval requirements, could make it more difficult to be acquired by a third party, even if perceived to be beneficial to United’s shareholders. These provisions effectively inhibit a non-negotiated merger or other business combination, which could adversely affect the market price of United’s common stock.
| Item 1B. | UNRESOLVED STAFF COMMENTS |
None
| Item 2. | PROPERTIES |
Offices
United is headquartered in the United Center at 500 Virginia Street, East, Charleston, West Virginia. United’s executive offices are located in Parkersburg, West Virginia at Fifth and Avery Streets. United operates one hundred and twenty-nine (129) full service offices—fifty-six (56) offices located throughout West Virginia, sixty-eight (68) offices in the Shenandoah Valley region of Virginia and the Northern Virginia, Maryland and Washington, D.C. metropolitan area, four (4) in southwestern Pennsylvania and one (1) in southeastern Ohio. United owns all of its West Virginia facilities except for three in the Wheeling area, two in the Charleston area, two in the Beckley area, and one each in Morgantown, Parkersburg, Charles Town, and Clarksburg, all of which are leased under operating leases. United owns most of its facilities in the Shenandoah Valley region of Virginia except for ten offices, two in Winchester, one each in Charlottesville, Front Royal, Harrisonburg, Stanardsville, Staunton, Waynesboro, Weyers Cave and Woodstock, all of which are leased under operating leases. United leases all of its facilities under operating lease agreements in the Northern Virginia, Maryland and Washington, D.C. areas except for five offices, two in Arlington, one each in Alexandria, Fairfax and Vienna, Virginia, which are owned facilities. United owns all of its Pennsylvania facilities. In Ohio, United owns its one facility in Bellaire. United leases operations centers in the Charleston and Morgantown, West Virginia and Chantilly, Virginia areas.
27
Table of Contents
United and its subsidiaries are currently involved in various legal proceedings in the normal course of business. Management is vigorously pursuing all its legal and factual defenses and, after consultation with legal counsel, believes that all such litigation will be resolved with no material effect on United’s financial position.
Item 4. MINE SAFETY DISCLOSURES
Not applicable.
28
Table of Contents
UNITED BANKSHARES, INC.
FORM 10-K, PART II
| Item 5. | MARKET FOR REGISTRANT’S COMMON EQUITY, RELATED STOCKHOLDER MATTERS AND ISSUER PURCHASES OF EQUITY SECURITIES |
Stock
As of January 31, 2016, 100,000,000 shares of common stock, par value $2.50 per share, were authorized for United, of which 69,655,617 were issued, including 24,225 shares held as treasury shares. The outstanding shares are held by approximately 6,668 shareholders of record, as well as 42,191 shareholders in street name as of January 31, 2016. The unissued portion of United’ s authorized common stock (subject to registration approval by the SEC) and the treasury shares are available for issuance as the Board of Directors determines advisable. United offers its shareholders the opportunity to invest dividends in shares of United stock through its dividend reinvestment plan. United has also established stock option plans and a stock bonus plan as incentive for certain eligible officers. In addition to the above incentive plans, United is occasionally involved in certain mergers in which additional shares could be issued and recognizes that additional shares could be issued for other appropriate purposes.
In May of 2006, United’s Board of Directors approved a stock repurchase plan, whereby United could buy up to 1,700,000 shares of its common stock in the open market. During 2015 and 2014, no shares were repurchased under the plan.
The Board of Directors believes that the availability of authorized but unissued common stock of United is of considerable value if opportunities should arise for the acquisition of other businesses through the issuance of United’s stock. Shareholders do not have preemptive rights, which allow United to issue additional authorized shares without first offering them to current shareholders.
Currently, United has only one voting class of stock issued and outstanding and all voting rights are vested in the holders of United’s common stock. On all matters subject to a vote of shareholders, the shareholders of United will be entitled to one vote for each share of common stock owned. Shareholders of United have cumulative voting rights with regard to election of directors.
On December 23, 2008, the shareholders of United authorized the issuance of preferred stock up to 50,000,000 shares with a par value of $1.00 per share. The authorized preferred stock may be issued by the Company’s Board of Directors in one or more series, from time to time, with each such series to consist of such number of shares and to have such voting powers, full or limited, or no voting powers, and such designations, preferences and relative, participating, optional or other special rights, and the qualifications, limitations or restrictions thereof, as shall be stated in the resolution or resolutions providing for the issuance of such series adopted by the Board of Directors. Currently, no shares of preferred stock have been issued.
The authorization of preferred stock will not have an immediate effect on the holders of the Company’s common stock. The actual effect of the issuance of any shares of preferred stock upon the rights of the holders of common stock cannot be stated until the Board of Directors determines the specific rights of any shares of preferred stock. However, the effects might include, among other things, restricting dividends on common stock, diluting the voting power of common stock, reducing the market price of common stock or impairing the liquidation rights of the common stock without further action by the shareholders. Holders of the common stock will not have preemptive rights with respect to the preferred stock.
There are no preemptive or conversion rights or, redemption or sinking fund provisions with respect to United’s stock. All of the issued and outstanding shares of United’s stock are fully paid and non-assessable.
29
Table of Contents
Dividends
The shareholders of United are entitled to receive dividends when and as declared by its Board of Directors. Dividends have been paid quarterly. Dividends were $1.29 per share in 2015, $1.28 per share in 2014 and $1.25 per share in 2013. See “Market and Stock Prices of United” for quarterly dividend information.
The payment of dividends is subject to the restrictions set forth in the West Virginia Corporation Act and the limitations imposed by the Federal Reserve Board. Payment of dividends by United is dependent upon receipt of dividends from its Banking Subsidiaries. Payment of dividends by United’s state member Banking Subsidiaries is regulated by the Federal Reserve System and generally, the prior approval of the Federal Reserve Board (FRB) is required if the total dividends declared by a state member bank in any calendar year exceeds its net profits, as defined, for that year combined with its retained net profits for the preceding two years. Additionally, prior approval of the FRB is required when a state member bank has deficit retained earnings but has sufficient current year’s net income, as defined, plus the retained net profits of the two preceding years. The FRB may prohibit dividends if it deems the payment to be an unsafe or unsound banking practice. The FRB has issued guidelines for dividend payments by state member banks emphasizing that proper dividend size depends on the bank’s earnings and capital. See Note T, Notes to Consolidated Financial Statements.
Market and Stock Prices of United
United Bankshares, Inc. stock is traded over the counter on the National Association of Securities Dealers Automated Quotations System, Global Select Market (NASDAQ) under the trading symbol UBSI. The closing sale price reported for United’s common stock on February 22, 2016, the last practicable date, was $35.11.
The high and low prices listed below are based upon information available to United’s management from NASDAQ listings. No attempt has been made by United’s management to ascertain the prices for every sale of its stock during the periods indicated. However, based on the information available, United’s management believes that the prices fairly represent the amounts at which United’s stock was traded during the periods reflected.
The following table presents the dividends and high and low prices of United’s common stock during the periods set forth below:
| 2016 |
Dividends | High | Low | |||||||||
| First Quarter through February 22, 2016 |
$ | — | (1) | $ | 36.80 | $ | 32.22 | |||||
| 2015 |
||||||||||||
| Fourth Quarter |
$ | 0.33 | $ | 43.13 | $ | 35.78 | ||||||
| Third Quarter |
$ | 0.32 | $ | 43.43 | $ | 35.60 | ||||||
| Second Quarter |
$ | 0.32 | $ | 40.70 | $ | 36.58 | ||||||
| First Quarter |
$ | 0.32 | $ | 38.88 | $ | 33.25 | ||||||
| 2014 |
||||||||||||
| Fourth Quarter |
$ | 0.32 | $ | 38.00 | $ | 30.39 | ||||||
| Third Quarter |
$ | 0.32 | $ | 33.60 | $ | 30.89 | ||||||
| Second Quarter |
$ | 0.32 | $ | 32.50 | $ | 28.19 | ||||||
| First Quarter |
$ | 0.32 | $ | 32.08 | $ | 28.23 | ||||||
| (1) | On February 29, 2016, United declared a dividend of $0.33 per share, payable April 1, 2016, to shareholders of record as of March 11, 2016. |
30
Table of Contents
Stock Performance Graph
The following Stock Performance Graph and related information shall not be deemed “soliciting material” or to be “filed” with the Securities and Exchange Commission, nor shall such information be incorporated by reference into any future filing under the Securities Act of 1933 or Securities Exchange Act of 1934, each as amended, except to the extent that United specifically incorporates it by reference into such filing.
The following graph compares United’s cumulative total shareholder return (assuming reinvestment of dividends) on its common stock for the five-year period ending December 31, 2015, with the cumulative total return (assuming reinvestment of dividends) of the Standard and Poor’s Midcap 400 Index and with the NASDAQ Bank Index. The cumulative total shareholder return assumes a $100 investment on December 31, 2010 in the common stock of United and each index and the cumulative return is measured as of each subsequent fiscal year-end. There is no assurance that United’s common stock performance will continue in the future with the same or similar trends as depicted in the graph.
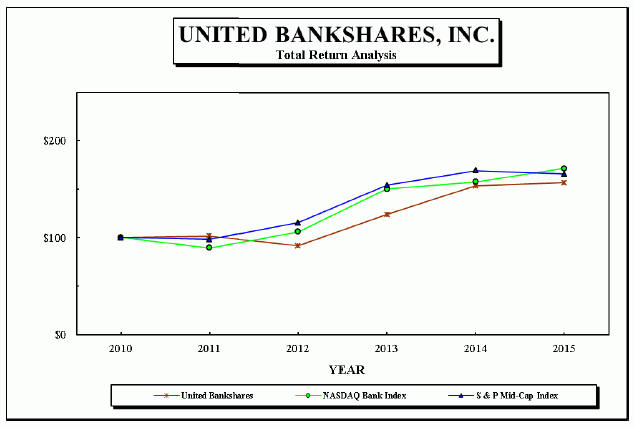
| Period Ending | ||||||||||||||||||||||||
| 12/31/10 | 12/31/11 | 12/31/12 | 12/31/13 | 12/31/14 | 12/31/15 | |||||||||||||||||||
| United Bankshares, Inc. |
100.00 | 101.69 | 91.83 | 123.99 | 153.52 | 156.83 | ||||||||||||||||||
| NASDAQ Bank Index |
100.00 | 89.54 | 106.20 | 150.41 | 157.75 | 171.67 | ||||||||||||||||||
| S&P Mid-Cap Index |
100.00 | 98.28 | 115.76 | 154.43 | 169.43 | 165.78 | ||||||||||||||||||
31
Table of Contents
Issuer Repurchases
The table below includes certain information regarding United’s purchase of its common shares during the three months ended December 31, 2015:
| Period |
Total (1) (2) |
Average Price Paid per Share |
Total Number of Shares Purchased as Part of Publicly Announced Plans (3) |
Maximum Number of Shares that May Yet be Purchased Under the Plans (3) |
||||||||||||
| 10/01 – 10/31/2015 |
0 | $ | 00.00 | 0 | 322,200 | |||||||||||
| 11/01 – 11/30/2015 |
5 | $ | 37.89 | 0 | 322,200 | |||||||||||
| 12/01 – 12/31/2015 |
0 | $ | 00.00 | 0 | 322,200 | |||||||||||
|
|
|
|||||||||||||||
| Total |
5 | $ | 37.89 | |||||||||||||
|
|
|
|||||||||||||||
| (1) | Includes shares exchanged in connection with the exercise of stock options under United’s stock option plans. Shares are purchased pursuant to the terms of the applicable stock option plan and not pursuant to a publicly announced stock repurchase plan. For the quarter ended December 31, 2015, no shares were exchanged by participants in United’s stock option plans. |
| (2) | Includes shares purchased in open market transactions by United for a rabbi trust to provide payment of benefits under a deferred compensation plan for certain key officers of United and its subsidiaries. For the quarter ended December 31, 2015, the following shares were purchased for the deferred compensation plan: November 2015 –5 shares at an average price of $37.89. |
| (3) | In May of 2006, United’s Board of Directors approved a repurchase plan to repurchase up to 1,700,000 shares of United’s common stock on the open market (the 2006 Plan). The timing, price and quantity of purchases under the plans are at the discretion of management and the plan may be discontinued, suspended or restarted at any time depending on the facts and circumstances. |
32
Table of Contents
| Item 6. | SELECTED FINANCIAL DATA |
The following consolidated selected financial data is derived from United’s audited financial statements as of and for the five years ended December 31, 2015. The selected financial data should be read in conjunction with Management’s Discussion and Analysis of Financial Condition and Results of Operations and the Consolidated Financial Statements and related notes contained elsewhere in this report.
| Five Year Summary | ||||||||||||||||||||
| (Dollars in thousands, except per share data) | 2015 | 2014 | 2013 | 2012 | 2011 | |||||||||||||||
| Summary of Operations: |
||||||||||||||||||||
| Total interest income |
$ | 423,630 | $ | 418,542 | $ | 306,154 | $ | 323,897 | $ | 316,522 | ||||||||||
| Total interest expense |
39,506 | 42,834 | 36,313 | 46,190 | 55,794 | |||||||||||||||
| Net interest income |
384,124 | 375,708 | 269,841 | 277,707 | 260,728 | |||||||||||||||
| Provision for loan losses |
22,574 | 21,937 | 19,267 | 17,862 | 17,141 | |||||||||||||||
| Other income |
73,626 | 80,962 | 66,506 | 64,842 | 49,055 | |||||||||||||||
| Other expense |
231,687 | 239,847 | 192,036 | 203,206 | 182,266 | |||||||||||||||
| Income taxes |
65,530 | 64,998 | 39,416 | 38,874 | 34,766 | |||||||||||||||
| Net income |
137,959 | 129,888 | 85,628 | 82,607 | 75,610 | |||||||||||||||
| Cash dividends |
89,667 | 88,522 | 62,981 | 62,351 | 56,827 | |||||||||||||||
| Per common share: |
||||||||||||||||||||
| Net income: |
||||||||||||||||||||
| Basic |
1.99 | 1.93 | 1.70 | 1.64 | 1.62 | |||||||||||||||
| Diluted |
1.98 | 1.92 | 1.70 | 1.64 | 1.61 | |||||||||||||||
| Cash dividends |
1.29 | 1.28 | 1.25 | 1.24 | 1.21 | |||||||||||||||
| Book value per share |
24.61 | 23.90 | 20.66 | 19.74 | 19.29 | |||||||||||||||
| Selected Ratios: |
||||||||||||||||||||
| Return on average shareholders’ equity |
8.10% | 8.13% | 8.43% | 8.35% | 8.50% | |||||||||||||||
| Return on average assets |
1.12% | 1.11% | 1.02% | 0.98% | 0.97% | |||||||||||||||
| Dividend payout ratio |
65.00% | 68.15% | 73.55% | 75.48% | 75.16% | |||||||||||||||
| Selected Balance Sheet Data: |
||||||||||||||||||||
| Average assets |
$ | 12,265,115 | $ | 11,652,776 | $ | 8,419,456 | $ | 8,399,513 | $ | 7,780,836 | ||||||||||
| Investment securities |
1,204,182 | 1,316,040 | 889,342 | 729,402 | 824,219 | |||||||||||||||
| Loans held for sale |
10,681 | 8,680 | 4,236 | 17,762 | 3,902 | |||||||||||||||
| Total loans |
9,384,080 | 9,104,652 | 6,704,583 | 6,511,416 | 6,230,777 | |||||||||||||||
| Total assets |
12,577,944 | 12,328,811 | 8,735,324 | 8,420,013 | 8,451,470 | |||||||||||||||
| Total deposits |
9,341,527 | 9,045,485 | 6,621,571 | 6,752,986 | 6,819,010 | |||||||||||||||
| Long-term borrowings |
1,015,249 | 1,105,314 | 575,697 | 284,926 | 345,366 | |||||||||||||||
| Total liabilities |
10,865,309 | 10,672,651 | 7,693,592 | 7,427,762 | 7,482,626 | |||||||||||||||
| Shareholders’ equity |
1,712,635 | 1,656,160 | 1,041,732 | 992,251 | 968,844 | |||||||||||||||
33
Table of Contents
| Item 7. | MANAGEMENT’S DISCUSSION AND ANALYSIS OF FINANCIAL CONDITION AND RESULTS OF OPERATIONS |
FORWARD-LOOKING STATEMENTS
Congress passed the Private Securities Litigation Act of 1995 to encourage corporations to provide investors with information about the company’s anticipated future financial performance, goals, and strategies. The act provides a safe haven for such disclosure; in other words, protection from unwarranted litigation if actual results are not the same as management expectations.
United desires to provide its shareholders with sound information about past performance and future trends. Consequently, any forward-looking statements contained in this report, in a report incorporated by reference to this report, or made by management of United in this report, in any other reports and filings, in press releases and in oral statements, involve numerous assumptions, risks and uncertainties. Actual results could differ materially from those contained in or implied by United’s statements for a variety of factors including, but not limited to: changes in economic conditions; business conditions in the banking industry; movements in interest rates; competitive pressures on product pricing and services; success and timing of business strategies; the nature and extent of governmental actions and reforms; and rapidly changing technology and evolving banking industry standards.
RECENT DEVELOPMENTS
On July 1, 2015, the Durbin Amendment became effective for United. The Durbin Amendment, passed as part of the Dodd-Frank financial reform legislation, limits fees for debit card processing paid by merchants to banking companies with assets in excess of $10 billion. The Durbin Amendment significantly affected United’s fees from deposit services for the year of 2015 as discussed in the “Other Income” section of this Management’s Discussion and Analysis of Financial Condition and Results of Operations (MD&A).
On January 1, 2015, the Basel III Capital Rules became effective for United and its banking subsidiaries (subject to a phase-in period). The Basel III Capital Rules establishes a new comprehensive capital framework for U.S. banking organizations. The rules implement the Basel Committee’s December 2010 framework known as “Basel III” for strengthening international capital standards as well as certain provisions of the Dodd-Frank Act. The Basel III Capital Rules substantially revise the risk-based capital requirements applicable to bank holding companies and depository institutions, including United and its banking subsidiaries, compared to the current U.S. risk-based capital rules. The Basel III Capital Rules define the components of capital and address other issues affecting the numerator in banking institutions’ regulatory capital ratios. The Basel III Capital Rules also address risk weights and other issues affecting the denominator in banking institutions’ regulatory capital ratios and replace the existing risk-weighting approach, which was derived from Basel I capital accords of the Basel Committee, with a more risk-sensitive approach based, in part, on the standardized approach in the Basel Committee’s 2004 “Basel II” capital accords. The Basel III Capital Rules also implement the requirements of Section 939A of the Dodd-Frank Act to remove references to credit ratings from the federal banking agencies’ rules.
INTRODUCTION
The following discussion and analysis presents the significant changes in financial condition and the results of operations of United and its subsidiaries for the periods indicated below. This discussion and the consolidated financial statements and the notes to Consolidated Financial Statements include the accounts of United Bankshares, Inc. and its wholly-owned subsidiaries, unless otherwise indicated. Management has evaluated all significant events and transactions that occurred after December 31, 2014, but prior to the date these financial statements were issued, for potential recognition or disclosure required in these financial statements.
In addition, after the close of business on January 31, 2014, United acquired 100% of the outstanding common stock of Virginia Commerce Bancorp, Inc. (Virginia Commerce), a Virginia corporation headquartered in Arlington, Virginia. The results of operations of Virginia Commerce are included in the consolidated results of operations from the
34
Table of Contents
date of acquisition. The acquisition of Virginia Commerce enhances United’s existing footprint in the Washington, D.C. MSA. Virginia Commerce was merged with and into George Mason Bankshares, Inc., a wholly-owned subsidiary of United (the Merger) in a transaction accounted for under the acquisition method of accounting. At consummation, Virginia Commerce had assets of approximately $2.77 billion, loans of $2.10 billion, and deposits of $2.02 billion. In addition, on February 20, 2014, United sold a former branch building for approximately $11.1 million and recognized a before-tax gain of $8.98 million.
This discussion and analysis should be read in conjunction with the unaudited Consolidated Financial Statements and accompanying notes thereto, which are included elsewhere in this document.
USE OF NON-GAAP FINANCIAL MEASURES
This discussion and analysis contains certain financial measures that are not recognized under GAAP. Under SEC Regulation G, public companies making disclosures containing financial measures that are not in accordance with GAAP must also disclose, along with each “non-GAAP” financial measure, certain additional information, including a reconciliation of the non-GAAP financial measure to the closest comparable GAAP financial measure, as well as a statement of the company’s reasons for utilizing the non-GAAP financial measure.
Generally, United has presented these non-GAAP financial measures because it believes that these measures provide meaningful additional information to assist in the evaluation of United’s results of operations or financial position. Presentation of these non-GAAP financial measures is consistent with how United’s management evaluates its performance internally and these non-GAAP financial measures are frequently used by securities analysts, investors and other interested parties in the evaluation of companies in the banking industry. Specifically, this discussion contains certain references to financial measures identified as tax-equivalent net interest income, the allowance for loan losses as a percentage of non-acquired loans and noninterest income excluding a net gain on the sale of bank premises, noncash, other-than-temporary impairment charges on certain investment securities and net gains and losses from sales and calls of investment securities. Management believes these non-GAAP financial measures to be helpful in understanding United’s results of operations or financial position. However, this non-GAAP information should be considered supplemental in nature and not as a substitute for related financial information prepared in accordance with GAAP.
Where non-GAAP financial measures are used, the comparable GAAP financial measure, as well as reconciliation to that comparable GAAP financial measure, as well as a statement of the company’s reasons for utilizing the non-GAAP financial measure, can be found within this discussion and analysis. Investors should recognize that United’s presentation of these non-GAAP financial measures might not be comparable to similarly titled measures at other companies.
APPLICATION OF CRITICAL ACCOUNTING POLICIES
The accounting and reporting policies of United conform with U.S. generally accepted accounting principles. In preparing the consolidated financial statements, management is required to make estimates, assumptions and judgments that affect the amounts reported in the financial statements and accompanying notes. These estimates, assumptions and judgments, which are reviewed with the Audit Committee of the Board of Directors, are based on information available as of the date of the financial statements. Actual results could differ from these estimates. These policies, along with the disclosures presented in the financial statement notes and in this financial review, provide information on how significant assets and liabilities are valued in the financial statements and how those values are determined. Based on the valuation techniques used and the sensitivity of financial statement amounts to the methods, assumptions, and estimates underlying those amounts, management has identified the determination of the allowance for credit losses, the valuation of investment securities and the related other-than-temporary impairment analysis, and the calculation of the income tax provision to be the accounting areas that require the most subjective or complex judgments, and as such could be most subject to revision as new information becomes available. The most significant accounting policies followed by United are presented in Note A, Notes to Consolidated Financial Statements.
35
Table of Contents
Allowance for Loan Losses
The allowance for loan losses represents management’s estimate of the probable credit losses inherent in the lending portfolio. Determining the allowance for loan losses requires management to make estimates of losses that are highly uncertain and require a high degree of judgment. At December 31, 2015, the allowance for loan losses was $75.7 million and is subject to periodic adjustment based on management’s assessment of current probable losses in the loan portfolio. Such adjustment from period to period can have a significant impact on United’s consolidated financial statements. To illustrate the potential effect on the financial statements of our estimates of the allowance for loan losses, a 10% increase in the allowance for loan losses would have required $7.6 million in additional allowance (funded by additional provision for credit losses), which would have negatively impacted the year of 2015 net income by approximately $4.8 million, after-tax or $0.07 diluted per common share. Management’s evaluation of the adequacy of the allowance for loan losses and the appropriate provision for loan losses is based upon a quarterly evaluation of the loan portfolio. This evaluation is inherently subjective and requires significant estimates, including estimates related to the amounts and timing of future cash flows, value of collateral, losses on pools of homogeneous loans based on historical loss experience, and consideration of current economic trends, all of which are susceptible to constant and significant change. The allowance allocated to specific credits and loan pools grouped by similar risk characteristics is reviewed on a quarterly basis and adjusted as necessary based upon subsequent changes in circumstances. In determining the components of the allowance for loan losses, management considers the risk arising in part from, but not limited to, charge-off and delinquency trends, current economic and business conditions, lending policies and procedures, the size and risk characteristics of the loan portfolio, concentrations of credit, and other various factors. The methodology used to determine the allowance for loan losses is described in Note A, Notes to Consolidated Financial Statements. A discussion of the factors leading to changes in the amount of the allowance for loan losses is included in the Provision for Loan Losses section of this Management’s Discussion and Analysis of Financial Condition and Results of Operations (MD&A). For a discussion of concentrations of credit risk, see Item 1, under the caption of Loan Concentrations in this Form 10-K.
Investment Securities
Accounting estimates are used in the presentation of the investment portfolio and these estimates impact the presentation of United’s financial condition and results of operations. United classifies its investments in debt as either held to maturity or available for sale and its equity securities as available for sale. Securities held to maturity are accounted for using historical costs, adjusted for amortization of premiums and accretion of discounts. Securities available for sale are accounted for at fair value, with the net unrealized gains and losses, net of income tax effects, presented as a separate component of shareholders’ equity. When available, fair values of securities are based on quoted prices or prices obtained from third party vendors. Third party vendors compile prices from various sources and may determine the fair value of identical or similar securities by using pricing models that consider observable market data. Prices obtained from third party vendors that do not reflect forced liquidation or distressed sales are not adjusted by management. Where prices reflect forced liquidation or distressed sales, as is the case with United’s portfolio of trust preferred securities (Trup Cdos), management estimates fair value based on a discounted cash flow methodology using appropriately adjusted discount rates reflecting nonperformance and liquidity risks. Due to the subjective nature of this valuation process, it is possible that the actual fair values of these securities could differ from the estimated amounts, thereby affecting United’s financial position, results of operations and cash flows. The potential impact to United’s financial position, results of operations or cash flows for changes in the valuation process cannot be reasonably estimated.
If the estimated value of investments is less than the cost or amortized cost, the investment is considered impaired and management evaluates whether an event or change in circumstances has occurred that may have a significant adverse effect on the fair value of the investment. If such an event or change has occurred, management must exercise judgment to determine the nature of the potential impairment (i.e., temporary or other-than-temporary) in order to apply the appropriate accounting treatment. If United intends to sell, or is more likely than not they will be required to sell an impaired debt security before recovery of its amortized cost basis less any current period credit loss, other-than-temporary impairment is recognized in earnings. The amount recognized in earnings is equal to the entire difference between the security’s amortized cost basis and its fair value at the balance sheet date. If United does not intend to sell, and is not more likely than not they will be required to sell the impaired debt security prior to recovery of its amortized cost basis less any current-period credit loss, the other-than-temporary impairment is separated into the following: 1) the amount representing the credit loss, which is recognized in earnings, and 2) the amount related to all other factors, which is recognized in other comprehensive income. For additional information on management’s consideration of investment valuation and other-than-temporary impairment, see Note C and Note U, Notes to Consolidated Financial Statements.
36
Table of Contents
Accounting for Acquired Loans
Loans acquired are initially recorded at their acquisition date fair values. The fair value of the acquired loans are based on the present value of the expected cash flows, including principal, interest and prepayments. Periodic principal and interest cash flows are adjusted for expected losses and prepayments, then discounted to determine the present value and summed to arrive at the estimated fair value. Fair value estimates involve assumptions and judgments as to credit risk, interest rate risk, prepayment risk, liquidity risk, default rates, loss severity, payment speeds, collateral values and discount rate.
Acquired loans are divided into loans with evidence of credit quality deterioration, which are accounted for under ASC topic 310-30 (acquired impaired) and loans that do not meet this criteria, which are accounted for under ASC topic 310-20 (acquired performing). Acquired impaired loans have experienced a deterioration of credit quality from origination to acquisition for which it is probable that United will be unable to collect all contractually required payments receivable, including both principal and interest. In the assessment of credit quality, numerous assumptions, interpretations and judgments must be made, based on internal and third-party credit quality information and ultimately the determination as to the probability that all contractual cash flows will not be able to be collected. This is a point in time assessment and inherently subjective due to the nature of the available information and judgment involved.
Subsequent to the acquisition date, United continues to estimate the amount and timing of cash flows expected to be collected on acquired impaired loans. Increases in expected cash flows will generally result in a recovery of any previously recorded allowance for loan losses, to the extent applicable, and/or a reclassification from the nonaccretable difference to accretable yield, which will be recognized prospectively. The present value of any decreases in expected cash flows after the acquisition date will generally result in an impairment charge recorded as a provision for loan losses, resulting in an increase to the allowance for loan losses.
For acquired performing loans, the difference between the acquisition date fair value and the contractual amounts due at the acquisition date represents the fair value adjustment. Fair value adjustments may be discounts (or premiums) to a loan’s cost basis and are accreted (or amortized) to interest income over the loan’s remaining life using the level yield method. Subsequent to the acquisition date, the methods utilized to estimate the required allowance for loan losses for these loans is similar to originated loans.
See Note B and D, Notes to Consolidated Financial Statements for additional information regarding United’s acquired loans disclosures.
Income Taxes
United’s calculation of income tax provision is inherently complex due to the various different tax laws and jurisdictions in which we operate and requires management’s use of estimates and judgments in its determination. The current income tax liability also includes income tax expense related to our uncertain tax positions as required in ASC topic 740, “Income Taxes.” Changes to the estimated accrued taxes can occur due to changes in tax rates, implementation of new business strategies, resolution of issues with taxing authorities and recently enacted statutory, judicial and regulatory guidance. These changes can be material to the Company’s operating results for any particular reporting period. The analysis of the income tax provision requires the assessments of the relative risks and merits of the appropriate tax treatment of transactions, filing positions, filing methods and taxable income calculations after considering statutes, regulations, judicial precedent and other information. United strives to keep abreast of changes in the tax laws and the issuance of regulations which may impact tax reporting and provisions for income tax expense. United is also subject to audit by federal and state authorities. Because the application of tax laws is subject to varying interpretations, results of these audits may produce indicated liabilities which differ from United’s estimates and provisions. United continually evaluates its exposure to possible tax assessments arising from audits and records its estimate of probable exposure based on current facts and circumstances. The potential impact to United’s operating results for any of the changes cannot be reasonably estimated. See Note M, Notes to Consolidated Financial Statements for information regarding United’s ASC topic 740 disclosures.
37
Table of Contents
Use of Fair Value Measurements
United determines the fair value of its financial instruments based on the fair value hierarchy established in ASC topic 820, whereby the fair value of certain assets and liabilities is an exit price, representing the amount that would be received to sell an asset or paid to transfer a liability in an orderly transaction between market participants. ASC topic 820 establishes a three-level hierarchy for disclosure of assets and liabilities recorded at fair value. The classification of assets and liabilities within the hierarchy is based on whether the inputs in the methodology for determining fair value are observable or unobservable. Observable inputs reflect market-based information obtained from independent sources (Level 1 or Level 2), while unobservable inputs reflect management’s estimate of market data (Level 3). For assets and liabilities that are actively traded and have quoted prices or observable market data, a minimal amount of subjectivity concerning fair value is needed. Prices and values obtained from third party vendors that do not reflect forced liquidation or distressed sales are not adjusted by management. When quoted prices or observable market data are not available, management’s judgment is necessary to estimate fair value.
At December 31, 2015, approximately 9.31% of total assets, or $1.17 billion, consisted of financial instruments recorded at fair value. Of this total, approximately 93.61% or $1.10 billion of these financial instruments used valuation methodologies involving observable market data, collectively Level 1 and Level 2 measurements, to determine fair value. Approximately 6.39% or $74.87 million of these financial instruments were valued using unobservable market information or Level 3 measurements. Most of these financial instruments valued using unobservable market information were Trup Cdos classified as available-for-sale. At December 31, 2015, only $4.12 million or less than 1% of total liabilities were recorded at fair value. This entire amount was valued using methodologies involving observable market data. United does not believe that any changes in the unobservable inputs used to value the financial instruments mentioned above would have a material impact on United’s results of operations, liquidity, or capital resources. See Note U for additional information regarding ASC topic 820 and its impact on United’s financial statements.
Any material effect on the financial statements related to these critical accounting areas is further discussed in this Management’s Discussion and Analysis of Financial Condition and Results of Operations.
2015 COMPARED TO 2014
FINANCIAL CONDITION SUMMARY
United’s total assets as of December 31, 2015 were $12.58 billion which was an increase of $249.13 million or 2.02% from December 31, 2014. Cash and cash equivalents increased $104.27 million or 13.85%, loans held for sale increased $2.00 million or 23.05% and portfolio loans increased $279.43 million or 3.07%, while investment securities decreased $111.86 million or 8.50% and other assets decreased $24.01 million or 5.97%. Total liabilities increased $192.66 million or 1.81% from year-end 2014. This increase in total liabilities was due mainly to a $296.04 million or 3.27% increase in deposits while borrowings decreased $102.69 million or 6.66%. Shareholders’ equity increased $56.48 million or 3.41% from year-end 2014.
The following discussion explains in more detail the changes in financial condition by major category.
Cash and Cash Equivalents
Cash and cash equivalents at December 31, 2015 increased $104.27 million or 13.85% from year-end 2014. Of this total increase, interest-bearing deposits with other banks increased $143.29 million or 24.85% as United placed more cash in an interest-bearing account with the Federal Reserve. Partially offsetting this increase in interest-bearing deposits with other banks is a decrease of $39.02 million or 22.21% in cash and due from banks. Federal funds sold were flat. During the year of 2015, net cash of $178.29 million and $115.69 million was provided by operating activities and financing activities, respectively, while $189.71 million was used in investing activities. Further details related to changes in cash and cash equivalents are presented in the Consolidated Statements of Cash Flows.
38
Table of Contents
Securities
Total investment securities at December 31, 2015 decreased $111.86 million or 8.50% from year-end 2014. Securities available for sale decreased $114.05 million or 9.66%. This change in securities available for sale reflects $191.13 million in sales, maturities and calls of securities, $85.25 million in purchases, and a decrease of $6.81 million in market value. Securities held to maturity were flat, decreasing $211 thousand or less than 1% from year-end 2014 due to calls and maturities of securities. Other investment securities increased $2.41 million or 2.50% from year-end 2014 due to the purchase of Federal Reserve Bank (FRB) stock.
The following is a summary of available for sale securities at December 31:
| 2015 | 2014 | 2013 | ||||||||||
| (In thousands) | ||||||||||||
| U.S. Treasury and obligations of U.S. Government corporations and agencies |
$ | 71,993 | $ | 88,559 | $ | 172,324 | ||||||
| States and political subdivisions |
130,685 | 133,730 | 60,861 | |||||||||
| Mortgage-backed securities |
788,218 | 876,006 | 474,104 | |||||||||
| Asset-backed securities |
3,404 | 8,004 | 9,257 | |||||||||
| Marketable equity securities |
4,844 | 3,631 | 3,299 | |||||||||
| Trust preferred collateralized debt obligations |
49,386 | 51,328 | 73,862 | |||||||||
| Single issue trust preferred securities |
13,811 | 13,760 | 14,346 | |||||||||
| Corporate securities |
9,999 | 4,998 | 4,996 | |||||||||
|
|
|
|
|
|
|
|||||||
| TOTAL AVAILABLE FOR SALE SECURITIES, at amortized cost |
$ | 1,072,340 | $ | 1,180,016 | $ | 813,049 | ||||||
|
|
|
|
|
|
|
|||||||
| TOTAL AVAILABLE FOR SALE SECURITIES, at fair value |
$ | 1,066,334 | $ | 1,180,386 | $ | 775,284 | ||||||
|
|
|
|
|
|
|
|||||||
The following is a summary of held to maturity securities at December 31:
| 2015 | 2014 | 2013 | ||||||||||
| (In thousands) | ||||||||||||
| U.S. Treasury and obligations of U.S. Government corporations and agencies |
$ | 10,425 | $ | 10,599 | $ | 10,762 | ||||||
| States and political subdivisions |
9,321 | 9,369 | 10,367 | |||||||||
| Mortgage-backed securities |
35 | 41 | 50 | |||||||||
| Single issue trust preferred securities |
19,298 | 19,281 | 19,766 | |||||||||
| Other corporate securities |
20 | 20 | 20 | |||||||||
|
|
|
|
|
|
|
|||||||
| TOTAL HELD TO MATURITY SECURITIES, at amortized cost |
$ | 39,099 | $ | 39,310 | $ | 40,965 | ||||||
|
|
|
|
|
|
|
|||||||
| TOTAL HELD TO MATURITY SECURITIES, at fair value |
$ | 36,319 | $ | 36,784 | $ | 38,293 | ||||||
|
|
|
|
|
|
|
|||||||
At December 31, 2015, gross unrealized losses on available for sale securities were $20.39 million. Securities in an unrealized loss position at December 31, 2015 consisted primarily of Trup Cdos, single issue trust preferred securities and agency commercial mortgage-backed securities. The Trup Cdos and the single issue trust preferred securities relate mainly to underlying securities of financial institutions. The agency commercial mortgage-backed securities relate to income-producing multifamily properties and provide a guaranty of full and timely payments of principal and interest by the issuing agency.
As of December 31, 2015, United’s mortgage-backed securities had an amortized cost of $788.25 million, with an estimated fair value of $793.53 million. The portfolio consisted primarily of $473.14 million in agency residential mortgage-backed securities with a fair value of $478.02 million, $9.12 million in non-agency residential mortgage-backed securities with an estimated fair value of $9.57 million, and $305.99 million in commercial agency mortgage-backed securities with an estimated fair value of $305.94 million. As of December 31, 2015, United’s asset-backed securities had an amortized cost of $3.40 million, with an estimated fair value of $3.40 million.
As of December 31, 2015, United’s corporate securities had an amortized cost of $97.36 million, with an estimated fair value of $77.79 million. The portfolio consisted primarily of $49.39 million in Trup Cdos with a fair value of $34.69 million and $33.11 million in single issue trust preferred securities with an estimated fair value of $27.58 million. In addition to the trust preferred securities, the Company held positions in various other corporate securities, including marketable equity securities, with an amortized cost of $4.84 million and a fair value of $5.46 million, only one of which was individually significant.
39
Table of Contents
The Trup Cdos consisted of pools of trust preferred securities issued by trusts related primarily to financial institutions and to a lesser extent, insurance companies. The Company has no exposure to Real Estate Investment Trusts (REITs) in its investment portfolio. The Company owns both senior and mezzanine tranches in the Trup Cdos; however, the Company does not own any income notes. The senior and mezzanine tranches of Trup Cdos generally have some protection from defaults in the form of over-collateralization and excess spread revenues, along with waterfall structures that redirect cash flows in the event certain coverage test requirements have failed. Generally, senior tranches have the greatest protection, with mezzanine tranches subordinated to the senior tranches, and income notes subordinated to the mezzanine tranches. The fair value of senior tranches represents $5.85 million of the Company’s pooled securities, while mezzanine tranches represent $28.84 million. Of the $28.84 million in mezzanine tranches, $8.56 million are now in the Senior position as the Senior notes have been paid to a zero balance. As of December 31, 2015, Trup Cdos with a fair value of $3.75 million were investment grade, and the remaining $30.94 million were below investment grade. In terms of capital adequacy, the Company allocates additional risk-based capital to the below investment grade securities. As of December 31, 2015, United’s single issue trust preferred securities had a fair value of $27.58 million. Of the $27.58 million, $12.43 million or 45.06% were investment grade; $8.83 million or 32.02% were split rated; and $6.32 million or 22.92% were below investment grade. The two largest exposures accounted for 53.08% of the $27.58 million. These included Wells Fargo at $8.55 million and SunTrust Bank at $6.09 million. All single-issue trust preferred securities are currently receiving full scheduled principal and interest payments.
The following two tables provide a summary of Trup Cdos as of December 31, 2015:
| Description (1) |
Tranche |
Class |
Moodys |
S&P |
Fitch |
Amortized Cost Basis |
Fair Value |
Unrealized Loss (Gain) |
Cumulative Credit- Related OTTI |
|||||||||||||||||
| SECURITY 1 |
Senior | Sr | Ca | NR | WD | $ | 2,141 | $ | 2,100 | $ | 41 | $ | 1,219 | |||||||||||||
| SECURITY 2 |
Senior (org Mezz) | B | Ca | NR | WD | 6,428 | 3,396 | 3,032 | 7,398 | |||||||||||||||||
| SECURITY 4 |
Mezzanine | C | C | NR | C | 1,299 | 1,204 | 95 | 1,546 | |||||||||||||||||
| SECURITY 5 |
Mezzanine | C-2 | Caa3 | NR | C | 1,978 | 1,061 | 917 | 184 | |||||||||||||||||
| SECURITY 6 |
Mezzanine | C-1 | Ca | NR | C | 1,916 | 1,276 | 640 | 1,316 | |||||||||||||||||
| SECURITY 7 |
Mezzanine | B-1 | Caa1 | NR | C | 4,489 | 2,908 | 1,581 | 41 | |||||||||||||||||
| SECURITY 8 |
Mezzanine | B-1 | Ca | NR | C | 3,676 | 2,422 | 1,254 | 1,651 | |||||||||||||||||
| SECURITY 12 |
Senior (org Mezz) | Mez | Caa1 | NR | C | 1,256 | 1,736 | (480 | ) | 588 | ||||||||||||||||
| SECURITY 13 |
Senior (org Mezz) | Mez | Caa1 | NR | C | 858 | 1,013 | (155 | ) | 406 | ||||||||||||||||
| SECURITY 14 |
Mezzanine | B-1 | Caa1 | NR | CC | 3,300 | 2,100 | 1,200 | 422 | |||||||||||||||||
| SECURITY 15 |
Mezzanine | B | Caa3 | NR | C | 6,436 | 4,200 | 2,236 | 3,531 | |||||||||||||||||
| SECURITY 16 |
Mezzanine | B-2 | Ca | NR | C | 3,439 | 2,150 | 1,289 | 1,561 | |||||||||||||||||
| SECURITY 17 |
Mezzanine | B-1 | Caa2 | NR | C | 2,250 | 1,500 | 750 | 750 | |||||||||||||||||
| SECURITY 18 |
Senior | A-3 | Aaa | BBB- | AA | 4,573 | 3,750 | 823 | 0 | |||||||||||||||||
| SECURITY 19 |
Senior (org Mezz) | B | Ba1 | NR | BB | 2,847 | 2,420 | 427 | 0 | |||||||||||||||||
| SECURITY 22 |
Mezzanine | B-1 | B2 | NR | C | 2,500 | 1,450 | 1,050 | 0 | |||||||||||||||||
|
|
|
|
|
|
|
|
|
|||||||||||||||||||
| $ | 49,386 | $ | 34,686 | $ | 14,700 | $ | 20,613 | |||||||||||||||||||
|
|
|
|
|
|
|
|
|
|||||||||||||||||||
(1) Securities that are no longer owned by the Company have been removed from the tables.
40
Table of Contents
| Desc. |
# of
Issuers Currently Performing (1) |
Deferrals as % of Original Collateral |
Defaults as a % of Original Collateral |
Expected Deferrals and Defaults as a % of Remaining Performing Collateral (2) |
Projected Recovery/ Cure Rates on Deferring Collateral |
Excess Subordination as % of Performing Collateral |
Amortized Cost as a % of Par Value |
Discount as a % of Par Value (3) | ||||||||
| 1 |
6 | 8.5% | 13.3% | 8.3% | 25 - 85% | (91.2)% | 61.2% | 38.8% | ||||||||
| 2 |
5 | 0.7% | 11.9% | 6.4% | 90% | (125.8)% | 45.4% | 54.6% | ||||||||
| 4 |
38 | 18.9% | 12.1% | 6.8% | 0 - 90% | (7.2)% | 43.1% | 56.9% | ||||||||
| 5 |
41 | 4.4% | 13.8% | 6.7% | 60 - 90% | (3.3)% | 91.3% | 8.7% | ||||||||
| 6 |
42 | 6.9% | 19.0% | 7.2% | 0 - 90% | (19.4)% | 58.5% | 41.5% | ||||||||
| 7 |
20 | 0.0% | 18.1% | 6.5% | N/A | (11.2)% | 84.9% | 15.1% | ||||||||
| 8 |
25 | 1.5% | 22.4% | 6.5% | 75% | (26.9)% | 68.3% | 31.7% | ||||||||
| 12 |
5 | 0.0% | 14.5% | 5.3% | N/A | (3.8)% | 73.4% | 26.6% | ||||||||
| 13 |
5 | 0.0% | 14.5% | 5.3% | N/A | (3.8)% | 86.0% | 14.0% | ||||||||
| 14 |
44 | 8.3% | 9.6% | 6.6% | 0 - 90% | 6.1% | 88.0% | 12.0% | ||||||||
| 15 |
19 | 0.8% | 19.7% | 8.5% | 90% | (32.1)% | 64.4% | 35.6% | ||||||||
| 16 |
15 | 0.0% | 18.8% | 6.1% | N/A | (28.4)% | 68.8% | 31.2% | ||||||||
| 17 |
29 | 3.0% | 12.1% | 7.0% | 75% | (4.4)% | 75.0% | 25.0% | ||||||||
| 18 |
28 | 3.2% | 14.6% | 6.0% | 15% | 68.4% | 100.0% | 0.0% | ||||||||
| 19 |
5 | 0.0% | 4.6% | 5.6% | N/A | 35.5% | 100.0% | 0.0% | ||||||||
| 22 |
31 | 3.7% | 9.3% | 6.5% | 50% | 1.4% | 100.0% | 0.0% |
(1) “Performing” refers to all outstanding issuers less issuers that have either defaulted or are currently deferring their interest payment.
(2) “Expected Deferrals and Defaults” refers to projected future defaults on performing collateral and does not include the projected defaults on deferring collateral.
(3) The “Discount” in the table above represents the Par Value less the Amortized Cost. This metric generally approximates the level of OTTI that has been incurred on these securities.
The Company defines “Excess Subordination” as all outstanding collateral less the sum of (i) 100% of the defaulted collateral, (ii) the sum of the projected net loss amounts for each piece of the deferring but not defaulted collateral and (iii) the amount of each Trup Cdo’s debt that is either senior to or pari passu with our security’s priority level.
The calculation of excess subordination in the above table does not consider the OTTI the Company has recognized on these securities. While the ratio of excess subordination provides some insight on overall collateralization levels, the Company completes an expected cash flow analysis each quarter to determine whether an adverse change in future cash flows has occurred under ASC 320. The standard specifies that a cash flow projection should be present-valued at the security specific effective interest rate and the resulting present value compared to the amortized cost in order to quantify the credit component of impairment. The Company utilizes the cash flow models to determine the net realizable value and assess whether additional OTTI has occurred.
While the ratio of excess subordination provides some insight on overall collateralization levels, the Company does not utilize this ratio to calculate OTTI. The ratio of excess subordination represents only one component of the projected cash flow. The Company believes the excess subordination is limited as it does not consider the following:
| • | Waterfall structure and redirection of cash flows |
| • | Excess interest spread |
| • | Cash reserves |
41
Table of Contents
The collateral backing of a particular tranche can be increased by decreasing the more senior liabilities of the Trup Cdo tranche. This occurs when collateral deterioration due to defaults and deferrals triggers alternative waterfall provisions of the cash flow. The waterfall structure of the bond requires the excess spread to be rerouted away from the most junior classes of debt (which includes the income notes) in order to pay down the principal of the most senior liabilities. As these senior liabilities are paid down, the senior and mezzanine tranches become better secured (due to the rerouting away from the income notes). Therefore, variances will exist between the calculated excess subordination measure and the amount of OTTI recognized due to the impact of the specific structural features of each bond as it relates to the cash flow models.
The following is a summary of available for sale single-issue trust preferred securities as of December 31, 2015:
| Security |
Moodys | S&P | Fitch | Amortized Cost |
Fair Value |
Unrealized Loss/(Gain) |
||||||||||||
| (Dollars in thousands) | ||||||||||||||||||
| Emigrant |
NR | NR | B+ | $ | 5,683 | $ | 3,720 | $ | 1,963 | |||||||||
| Bank of America |
Ba1 | NR | BBB- | 4,629 | 4,225 | 404 | ||||||||||||
| M&T Bank |
NR | BBB- | BBB- | 2,999 | 3,246 | (247 | ) | |||||||||||
| Bank of America |
Ba1 | BB+ | BBB- | 500 | 502 | (2 | ) | |||||||||||
|
|
|
|
|
|
|
|||||||||||||
| $ | 13,811 | $ | 11,693 | $ | 2,118 | |||||||||||||
|
|
|
|
|
|
|
|||||||||||||
Additionally, the Company owns two single-issue trust preferred securities that are classified as held-to-maturity and include at least one rating below investment grade. These securities include SunTrust Bank ($7.41 million) and Royal Bank of Scotland ($974 thousand).
During 2015, United recognized net other-than-temporary impairment charges totaling $47 thousand on one Trup Cdo and one equity security, which are not expected to be sold. Other than these securities, management does not believe that any other individual security with an unrealized loss as of December 31, 2015 is other-than-temporarily impaired. United believes the decline in value resulted from changes in market interest rates, credit spreads and liquidity, not an adverse change in the expected contractual cash flows. Based on a review of each of the securities in the investment portfolio, management concluded that it was not probable that it would be unable to realize the cost basis investment and appropriate interest payments on such securities. United has the intent and the ability to hold these securities until such time as the value recovers or the securities mature. However, United acknowledges that any impaired securities may be sold in future periods in response to significant, unanticipated changes in asset/liability management decisions, unanticipated future market movements or business plan changes.
Further information regarding the amortized cost and estimated fair value of investment securities, including remaining maturities as well as a more detailed discussion of management’s other-than-temporary impairment analysis, is presented in Note C, Notes to Consolidated Financial Statements.
Loans
Loans held for sale increased $2.00 million or 23.05% as loan originations in the secondary market exceeded loan sales during the year of 2015. Portfolio loans, net of unearned income, increased $279.43 million or 3.07% from year-end 2014. Since year-end 2014, commercial, financial and agricultural loans increased $72.34 million or 1.35% as commercial real estate loans increased $47.56 million while commercial loans (not secured by real estate) increased $24.78 million. In addition, construction and land development loans increased $139.80 million or 12.34% and consumer loans increased $61.98 million or 16.80% while residential real estate loans were relatively flat.
42
Table of Contents
A summary of loans outstanding is as follows:
| December 31 | ||||||||||||||||||||
| 2015 | 2014 | 2013 | 2012 | 2011 | ||||||||||||||||
| Commercial, financial & agricultural |
$ | 5,426,335 | $ | 5,353,991 | $ | 3,911,103 | $ | 3,846,409 | $ | 3,508,966 | ||||||||||
| Residential real estate |
2,268,685 | 2,263,354 | 1,821,378 | 1,838,252 | 1,891,725 | |||||||||||||||
| Construction & land development |
1,273,054 | 1,133,251 | 670,364 | 550,677 | 549,877 | |||||||||||||||
| Consumer |
430,878 | 368,896 | 310,754 | 282,442 | 283,712 | |||||||||||||||
| Less: Unearned interest |
(14,872) | (14,840) | (9,016) | (6,364) | (3,503) | |||||||||||||||
|
|
|
|
|
|
|
|
|
|
|
|||||||||||
| Total loans |
9,384,080 | 9,104,652 | 6,704,583 | 6,511,416 | 6,230,777 | |||||||||||||||
| Allowance for loan losses |
(75,726) | (75,529) | (74,198) | (73,901) | (73,874) | |||||||||||||||
|
|
|
|
|
|
|
|
|
|
|
|||||||||||
| TOTAL LOANS, NET |
$ | 9,308,354 | $ | 9,029,123 | $ | 6,630,385 | $ | 6,437,515 | $ | 6,156,903 | ||||||||||
|
|
|
|
|
|
|
|
|
|
|
|||||||||||
| Loans held for sale |
$ | 10,681 | $ | 8,680 | $ | 4,236 | $ | 17,762 | $ | 3,902 | ||||||||||
|
|
|
|
|
|
|
|
|
|
|
|||||||||||
The following table shows the maturity of commercial, financial, and agricultural loans and real estate construction and land development loans as of December 31, 2015:
| Less Than | One To | Over | ||||||||||||||
| (In thousands) | One Year | Five Years | Five Years | Total | ||||||||||||
| Commercial, financial & agricultural |
$ | 1,015,245 | $ | 1,646,808 | $ | 2,764,282 | $ | 5,426,335 | ||||||||
| Construction & land development |
409,256 | 566,907 | 296,891 | 1,273,054 | ||||||||||||
|
|
|
|
|
|
|
|
|
|||||||||
| Total |
$ | 1,424,501 | $ | 2,213,715 | $ | 3,061,173 | $ | 6,699,389 | ||||||||
|
|
|
|
|
|
|
|
|
|||||||||
At December 31, 2015, commercial, financial and agricultural loans and real estate construction and land development loans by maturity are as follows:
| Less Than | One to | Over | ||||||||||||||
| (In thousands) | One Year | Five Years | Five Years | Total | ||||||||||||
| Outstanding with fixed interest rates |
$ | 459,325 | $ | 1,254,667 | $ | 1,183,253 | $ | 2,897,245 | ||||||||
| Outstanding with adjustable rates |
965,176 | 959,048 | 1,877,920 | 3,802,144 | ||||||||||||
|
|
|
|
|
|
|
|
|
|||||||||
| $ | 1,424,501 | $ | 2,213,715 | $ | 3,061,173 | $ | 6,699,389 | |||||||||
|
|
|
|
|
|
|
|
|
|||||||||
More information relating to loans is presented in Note D, Notes to Consolidated Financial Statements.
Other Assets
Other assets decreased $24.01 million or 5.97% from year-end 2014. Income tax receivable decreased $20.15 million as a result of timing differences, OREO decreased $6.55 million due to write-downs to fair value, and core deposit intangibles decreased $3.42 million due to amortization. Partially offsetting these decreases in other assets is a $3.51 million increase in the cash surrender value of bank-owned life insurance policies, mainly due to an increase in the cash surrender value, a $2.35 million increase in deferred tax assets and a $1.64 million increase in dealer reserve.
Deposits
Deposits represent United’s primary source of funding. Total deposits at December 31, 2015 increased $296.04 million or 3.27% from year-end 2014. In terms of composition, noninterest-bearing deposits increased $108.34 million or 4.18% while interest-bearing deposits increased $187.70 million or 2.91% from December 31, 2014. Organically, deposits grew $297.74 million from year-end 2014.
The increase in noninterest-bearing deposits was due mainly to increases in commercial noninterest-bearing deposits of $54.15 million or 2.77%, personal noninterest-bearing deposits of $39.07 million or 8.10%, and noninterest-bearing public funds’ deposits of $15.10 million or 20.52%.
43
Table of Contents
The increase in interest-bearing deposits was due mainly to interest-bearing money market accounts (MMDAs) increasing $302.90 million or 14.67% and regular savings accounts increasing $32.31 million or 4.90%. The $302.90 million increase in interest-bearing MMDAs was due to a $342.18 million increase in commercial MMDAs. Personal MMDAs and public funds MMDAs, on the other hand, decreased $33.83 million and $5.45 million, respectively. Regular savings accounts increased $32.31 million mainly due to a $29.77 million increase in personal savings accounts. Time deposits over $100,000 increased $25.08 million or 2.32%. The $25.08 million increase in time deposits over $100,000 is due to an increase of $103.24 million in public funds certificates of deposits (CDs) while fixed rate CDs over $100,000 decreased $70.84 million. Partially offsetting these increases in interest-bearing deposits were decreases in interest-bearing checking deposits of $11.83 million or less than 1% and time deposits under $100,000 of $160.75 million or 16.83% The $11.83 million decrease in interest-bearing checking deposits is the result of a decrease of $73.43 million in personal interest-bearing checking accounts while interest-bearing public funds’ checking accounts increased $68.47 million. The $160.75 million decrease in time deposits under $100,000 is the result of a $157.02 million decrease in fixed rate CDs.
The table below summarizes the changes by deposit category since year-end 2014:
| December 31 | December 31 | |||||||||||||||
| 2015 | 2014 | $ Change | % Change | |||||||||||||
| (Dollars In thousands) | ||||||||||||||||
| Demand deposits |
$ | 2,699,958 | $ | 2,591,619 | $ | 108,339 | 4.18% | |||||||||
| Interest-bearing checking |
1,683,316 | 1,695,146 | (11,830 | ) | (0.70%) | |||||||||||
| Regular savings |
692,079 | 659,773 | 32,306 | 4.90% | ||||||||||||
| Money market accounts |
2,368,063 | 2,065,162 | 302,901 | 14.67% | ||||||||||||
| Time deposits under $100,000 |
794,428 | 955,178 | (160,750 | ) | (16.83%) | |||||||||||
| Time deposits over $100,000 (1) |
1,103,683 | 1,078,607 | 25,076 | 2.32% | ||||||||||||
|
|
|
|
|
|
|
|
|
|||||||||
| Total deposits |
$ | 9,341,527 | $ | 9,045,485 | $ | 296,042 | 3.27% | |||||||||
|
|
|
|
|
|
|
|
|
|||||||||
| (1) | Includes time deposits of $250,000 or more of $386,484 and $272,059 at December 31, 2015 and 2014, respectively. |
At December 31, 2015, the scheduled maturities of time deposits are as follows:
| Year |
Amount | |||
| (In thousands) |
||||
| 2016 |
$ | 1,231,848 | ||
| 2017 |
401,950 | |||
| 2018 |
100,605 | |||
| 2019 |
77,873 | |||
| 2020 and thereafter |
85,835 | |||
|
|
|
|||
| TOTAL |
$ | 1,898,111 | ||
|
|
|
|||
Maturities of time certificates of deposit of $100,000 or more outstanding at December 31, 2015 are summarized as follows:
| Amount | ||||
| ( In thousands) | ||||
| 3 months or less |
$ | 380,682 | ||
| Over 3 through 6 months |
160,576 | |||
| Over 6 through 12 months |
219,179 | |||
| Over 12 months |
343,246 | |||
|
|
|
|||
| TOTAL |
$ | 1,103,683 | ||
|
|
|
|||
44
Table of Contents
The average daily amount of deposits and rates paid on such deposits is summarized for the years ended December 31:
| 2015 | 2014 | 2013 | ||||||||||||||||||||||||||||||||||
| Interest | Interest | Interest | ||||||||||||||||||||||||||||||||||
| Amount | Expense | Rate | Amount | Expense | Rate | Amount | Expense | Rate | ||||||||||||||||||||||||||||
| (Dollars in thousands) | ||||||||||||||||||||||||||||||||||||
| Demand deposits |
$ | 2,591,501 | $ | 0 | 0.00 | % | $ | 2,349,729 | $ | 0 | 0.00 | % | $ | 1,782,257 | $ | 0 | 0.00% | |||||||||||||||||||
| NOW and money market deposits |
3,996,323 | 12,617 | 0.32 | % | 3,382,418 | 10,093 | 0.30 | % | 2,403,748 | 7,380 | 0.31% | |||||||||||||||||||||||||
| Savings deposits |
703,150 | 955 | 0.14 | % | 667,307 | 875 | 0.13 | % | 565,359 | 631 | 0.11% | |||||||||||||||||||||||||
| Time deposits |
1,902,503 | 14,451 | 0.76 | % | 2,091,087 | 16,493 | 0.79 | % | 1,859,155 | 18,520 | 1.00% | |||||||||||||||||||||||||
|
|
|
|
|
|
|
|
|
|
|
|
|
|||||||||||||||||||||||||
| TOTAL |
$ | 9,193,477 | $ | 28,023 | 0.30 | % | $ | 8,490,541 | $ | 27,461 | 0.32 | % | $ | 6,610,519 | $ | 26,531 | 0.40% | |||||||||||||||||||
|
|
|
|
|
|
|
|
|
|
|
|
|
|||||||||||||||||||||||||
More information relating to deposits is presented in Note I, Notes to Consolidated Financial Statements.
Borrowings
Total borrowings at December 31, 2015 decreased $102.69 million or 6.66% during the year of 2015. Since year-end 2014, short-term borrowings decreased $12.62 million or 2.90% due to a $91.01 million decrease in short-term securities sold under agreements to repurchase and a $31.61 million decrease in federal funds purchased. Long-term borrowings decreased $90.07 million or 8.15% since year-end 2014 due to a net repayment of $89.46 million in long-term FHLB advances.
The table below summarizes the changes by borrowing category since year-end 2014:
| December 31 | Amount | Percentage | ||||||||||||||
| 2015 | 2014 | Change | Change | |||||||||||||
| (Dollars in thousands) |
||||||||||||||||
| Federal funds purchased |
$ | 22,230 | $ | 53,840 | $ | (31,610) | (58.71%) | |||||||||
| Short-term securities sold under agreements to repurchase |
290,798 | 381,812 | (91,014) | (23.84%) | ||||||||||||
| Long-term securities sold under agreements to repurchase |
50,863 | 52,343 | (1,480) | (2.83%) | ||||||||||||
| Short-term FHLB advances |
110,000 | 0 | 110,000 | 100.00% | ||||||||||||
| Long-term FHLB advances |
740,880 | 830,335 | (89,455) | (10.77%) | ||||||||||||
| Issuances of trust preferred capital securities |
223,506 | 222,636 | 870 | 0.39% | ||||||||||||
|
|
|
|
|
|
|
|
|
|||||||||
| Total borrowings |
$ | 1,438,277 | $ | 1,540,966 | $ | (102,689) | (6.66%) | |||||||||
|
|
|
|
|
|
|
|
|
|||||||||
For a further discussion of borrowings see Notes J and K, Notes to Consolidated Financial Statements.
Accrued Expenses and Other Liabilities
Accrued expenses and other liabilities at December 31, 2015 were flat, decreasing $113 thousand or less than 1% from year-end 2014. In particular, incentives payables decreased $1.78 million and other accrued expenses decreased $3.01 million. Both decreases were due to payments. Virtually offsetting these decreases in accrued expenses and other liabilities were increases of $1.84 million in deferred compensation, $1.80 million in the pension liability and $1.39 million in other employee withholdings.
Shareholders’ Equity
Shareholders’ equity at December 31, 2015 increased $56.48 million or 3.41% from December 31, 2014. Earnings net of dividends for the year of 2015 were $48.29 million. Surplus increased $10.04 million or 1.35% due to stock option exercises.
45
Table of Contents
Accumulated other comprehensive income decreased $2.45 million or 6.84%. United’s available for sale investment portfolio, net of deferred income taxes, decreased $4.34 million. The after-tax pension accounting adjustment at year-end 2015 resulted in a decline of $1.46 million. Partially offsetting these decreases to accumulated other comprehensive income was the after-tax accretion of pension costs of $3.07 million for the year of 2015.
EARNINGS SUMMARY
Net income for the year 2015 was $137.96 million or $1.98 per diluted share compared to $129.89 million or $1.92 per diluted share for the year of 2014. United’s return on average assets for the year of 2015 was 1.12% and return on average shareholders’ equity was 8.10% as compared to 1.11% and 8.13% for the year of 2014. United’s Federal Reserve peer group’s (bank holding companies with total assets over $10 billion) most recently reported average return on assets and average return on equity were 0.94% and 8.17%, respectively, for the first nine months of 2015. As previously mentioned, United completed its acquisition of Virginia Commerce after the close of business on January 31, 2014. The financial results of Virginia Commerce are included in United’s results from the acquisition date. Therefore, the year of 2015 was impacted for an additional month by increased levels of average balances, income, and expense as compared to the year of 2014 due to the acquisition.
The results for the year of 2015 included noncash, before-tax, other-than-temporary impairment charges of $47 thousand on certain investment securities. The results for year of 2014 included noncash, before-tax, other-than-temporary impairment charges of $6.48 million on certain investment securities.
The results for the year of 2014 also included a before-tax gain of $8.98 million from the sale of a former branch building during the first quarter of 2014, merger related expenses and charges of $5.29 million, and a penalty of $1.97 million to prepay a Federal Home Loan Bank (FHLB) advance with a high interest rate.
Net interest income for the year of 2015 was $384.12 million, an increase of $8.42 million or 2.24% from the prior year. The increase in net interest income occurred because total interest income increased $5.09 million while total interest expense decreased $3.33 million from the year of 2014.
The provision for credit losses was $22.57 million for the year 2015 as compared to $21.94 million for the year of 2014. Noninterest income was $73.63 million for the year of 2015, down $7.34 million or 9.06% when compared to the year of 2014. Included in noninterest income for the year of 2015 and 2014 were the previously mentioned noncash before-tax other-than-temporary impairment charges of $47 thousand and $6.48 million, respectively. Noninterest expense was $231.69 million, a decrease of $8.16 million or 3.40% for the year of 2015 when compared to 2014.
Income tax expense for the year of 2015 was $65.53 million as compared to $65.00 million for the year of 2014. United’s effective tax rate was approximately 32.2% and 33.4% for years ended December 31, 2015 and 2014, respectively, as compared to 31.5% for 2013.
The following discussion explains in more detail the results of operations by major category.
Net Interest Income
Net interest income represents the primary component of United’s earnings. It is the difference between interest income from earning assets and interest expense incurred to fund these assets. Net interest income is impacted by changes in the volume and mix of interest-earning assets and interest-bearing liabilities, as well as changes in market interest rates. Such changes, and their impact on net interest income in 2015 and 2014, are presented below.
Net interest income for the year of 2015 was $384.12 million, which was an increase of $8.42 million or 2.24% from the year of 2014. The $8.42 million increase in net interest income occurred because total interest income increased $5.09 million while total interest expense decreased $3.33 million from the year of 2014.
46
Table of Contents
Generally, interest income for the year of 2015 increased from prior year because of the earning assets added from the Virginia Commerce acquisition. Likewise, interest expense for the year of 2015 increased from prior year because of the interest-bearing liabilities added from Virginia Commerce. However, the additional interest expense was mitigated by the accretion of fair value premiums recorded on the interest-bearing deposits and long-term securities sold under agreements to repurchase acquired from Virginia Commerce. For the purpose of this remaining discussion, net interest income is presented on a tax-equivalent basis to provide a comparison among all types of interest earning assets. The tax-equivalent basis adjusts for the tax-favored status of income from certain loans and investments. Although this is a non-GAAP measure, United’s management believes this measure is more widely used within the financial services industry and provides better comparability of net interest income arising from taxable and tax-exempt sources. United uses this measure to monitor net interest income performance and to manage its balance sheet composition.
Tax-equivalent net interest income for the year of 2015 was $390.61 million, an increase of $8.59 million or 2.25% from the year of 2014. This increase in tax-equivalent net interest income was primarily attributable to an increase in average earning assets from the Virginia Commerce acquisition. Average earning assets increased $608.72 million or 5.91% from the year of 2014. Average net loans increased $405.71 million or 4.69% for the year of 2015 while average short-term investments increased $219.17 million or 57.52%. In addition, the average cost of funds declined 6 basis points from the year of 2014. In particular, the average cost of long-term borrowings declined 34 basis points due mainly to the repayment of certain higher-cost long-term Federal Home Loan Bank (FHLB) advances. Partially offsetting the increases to tax-equivalent net interest income for the year of 2015 was a decline of 18 basis points in the average yield on earning assets as compared to the year of 2014. The net interest margin of 3.58% for the year of 2015 was a decrease of 13 basis points from the net interest margin of 3.71% for the year of 2014.
United’s tax-equivalent net interest income also includes the impact of acquisition accounting fair value adjustments.
The following table provides the discount/premium and net accretion impact to tax-equivalent net interest income for the year ended December 31, 2015, 2014 and 2013.
| Year Ended | ||||||||||||
| December 31 | December 31 | December 31 | ||||||||||
| (Dollars in thousands) | 2015 | 2014 | 2013 | |||||||||
| Loan Accretion |
$ | 10,780 | $ | 10,261 | $ | 2,641 | ||||||
| Certificates of deposit |
1,698 | 4,310 | 169 | |||||||||
| Long-term borrowings |
611 | 143 | (113 | ) | ||||||||
|
|
|
|
|
|
|
|||||||
| Total |
$ | 13,089 | $ | 14,714 | $ | 2,697 | ||||||
|
|
|
|
|
|
|
|||||||
The following table reconciles the difference between net interest income and tax-equivalent net interest income for the year ended December 31, 2015, 2014 and 2013.
| Year Ended | ||||||||||||
| December 31 | December 31 | December 31 | ||||||||||
| (Dollars in thousands) | 2015 | 2014 | 2013 | |||||||||
| Net interest income (GAAP) |
$ | 384,124 | $ | 375,708 | $ | 269,841 | ||||||
| Tax-equivalent adjustment (non-GAAP) (1) |
6,486 | 6,316 | 5,999 | |||||||||
|
|
|
|
|
|
|
|||||||
| Tax-equivalent net interest income (non-GAAP) |
$ | 390,610 | $ | 382,024 | $ | 275,840 | ||||||
|
|
|
|
|
|
|
|||||||
| (1) | The tax-equivalent adjustment combines amounts of interest income on federally nontaxable loans and investment securities using the statutory federal income tax rate of 35%. All interest income on loans and investment securities was subject to state income taxes. |
47
Table of Contents
The following table shows the consolidated daily average balance of major categories of assets and liabilities for each of the three years ended December 31, 2015, 2014 and 2013 with the consolidated interest and rate earned or paid on such amount. The interest income and yields on federally nontaxable loans and investment securities are presented on a tax-equivalent basis using the statutory federal income tax rate of 35%. Interest income on all loans and investment securities was subject to state taxes.
| Year Ended December 31, 2015 |
Year Ended December 31, 2014 |
Year Ended December 31, 2013 |
||||||||||||||||||||||||||||||||||
| (Dollars in thousands) | Average Balance |
Interest (1) |
Avg. Rate (1) |
Average Balance |
Interest (1) |
Avg. Rate (1) |
Average Balance |
Interest (1) |
Avg. Rate (1) |
|||||||||||||||||||||||||||
| ASSETS |
||||||||||||||||||||||||||||||||||||
| Earning Assets: |
||||||||||||||||||||||||||||||||||||
| Federal funds sold, securities repurchased under agreements to resell & other short-term investments |
$ | 600,218 | $ | 1,645 | 0.27% | $ | 381,053 | $ | 954 | 0.25% | $ | 235,880 | $ | 613 | 0.26% | |||||||||||||||||||||
| Investment Securities: |
||||||||||||||||||||||||||||||||||||
| Taxable |
1,140,852 | 30,744 | 2.69% | 1,158,869 | 30,426 | 2.63% | 712,582 | 16,646 | 2.34% | |||||||||||||||||||||||||||
| Tax-exempt |
119,514 | 5,427 | 4.54% | 117,646 | 5,385 | 4.58% | 81,505 | 4,403 | 5.40% | |||||||||||||||||||||||||||
|
|
|
|
|
|
|
|||||||||||||||||||||||||||||||
| Total Securities |
1,260,366 | 36,171 | 2.87% | 1,276,515 | 35,811 | 2.81% | 794,087 | 21,049 | 2.65% | |||||||||||||||||||||||||||
| Loans, net of unearned Income (2) |
9,126,387 | 392,300 | 4.30% | 8,720,186 | 388,093 | 4.45% | 6,544,104 | 290,491 | 4.44% | |||||||||||||||||||||||||||
| Allowance for loan losses |
(75,451 | ) | (74,957 | ) | (74,661 | ) | ||||||||||||||||||||||||||||||
|
|
|
|
|
|
|
|||||||||||||||||||||||||||||||
| Net loans |
9,050,936 | 4.33% | 8,645,229 | 4.49% | 6,469,443 | 4.49% | ||||||||||||||||||||||||||||||
|
|
|
|
|
|
|
|||||||||||||||||||||||||||||||
| Total earning assets |
10,911,520 | $ | 430,116 | 3.94% | 10,302,797 | $ | 424,858 | 4.12% | 7,499,410 | $ | 312,153 | 4.16% | ||||||||||||||||||||||||
|
|
|
|
|
|
|
|||||||||||||||||||||||||||||||
| Other assets |
1,353,595 | 1,349,979 | 920,046 | |||||||||||||||||||||||||||||||||
|
|
|
|
|
|
|
|||||||||||||||||||||||||||||||
| TOTAL ASSETS |
$ | 12,265,115 | $ | 11,652,776 | $ | 8,419,456 | ||||||||||||||||||||||||||||||
|
|
|
|
|
|
|
|||||||||||||||||||||||||||||||
| LIABILITIES |
||||||||||||||||||||||||||||||||||||
| Interest-Bearing Funds: |
||||||||||||||||||||||||||||||||||||
| Interest-bearing deposits |
$ | 6,601,976 | $ | 28,023 | 0.42% | $ | 6,140,812 | $ | 27,461 | 0.45% | $ | 4,828,262 | $ | 26,531 | 0.55% | |||||||||||||||||||||
| Short-term borrowings |
323,279 | 834 | 0.26% | 509,724 | 1,134 | 0.22% | 360,621 | 895 | 0.25% | |||||||||||||||||||||||||||
| Long- term borrowings |
985,458 | 10,649 | 1.08% | 1,005,554 | 14,239 | 1.42% | 382,628 | 8,887 | 2.32% | |||||||||||||||||||||||||||
|
|
|
|
|
|
|
|||||||||||||||||||||||||||||||
| Total Interest-Bearing Funds |
7,910,713 | 39,506 | 0.50% | 7,656,090 | 42,834 | 0.56% | 5,571,511 | 36,313 | 0.65% | |||||||||||||||||||||||||||
|
|
|
|
|
|
|
|||||||||||||||||||||||||||||||
| Noninterest-bearing deposits |
2,591,501 | 2,349,729 | 1,782,257 | |||||||||||||||||||||||||||||||||
| Accrued expenses and other liabilities |
60,411 | 49,193 | 49,688 | |||||||||||||||||||||||||||||||||
|
|
|
|
|
|
|
|||||||||||||||||||||||||||||||
| TOTAL LIABILITIES |
10,562,625 | 10,055,012 | 7,403,456 | |||||||||||||||||||||||||||||||||
| SHAREHOLDERS’ EQUITY |
1,702,490 | 1,597,764 | 1,016,000 | |||||||||||||||||||||||||||||||||
|
|
|
|
|
|
|
|||||||||||||||||||||||||||||||
| TOTAL LIABILITIES AND SHAREHOLDERS’ EQUITY |
$ | 12,265,115 | $ | 11,652,776 | $ | 8,419,456 | ||||||||||||||||||||||||||||||
|
|
|
|
|
|
|
|||||||||||||||||||||||||||||||
| NET INTEREST INCOME |
$390,610 | $382,024 | $275,840 | |||||||||||||||||||||||||||||||||
|
|
|
|
|
|
|
|||||||||||||||||||||||||||||||
| INTEREST SPREAD |
3.44% | 3.56% | 3.51% | |||||||||||||||||||||||||||||||||
| NET INTEREST MARGIN |
3.58% | 3.71% | 3.68% | |||||||||||||||||||||||||||||||||
| (1) | The interest income and the yields on federally nontaxable loans and investment securities are presented on a tax-equivalent basis using the statutory federal income tax rate of 35%. |
| (2) | Nonaccruing loans are included in the daily average loan amounts outstanding. |
48
Table of Contents
The following table sets forth a summary for the periods indicated of the changes in consolidated interest earned and interest paid detailing the amounts attributable to (i) changes in volume (change in the average volume times the prior year’s average rate), (ii) changes in rate (change in the average rate times the prior year’s average volume), and (iii) changes in rate/volume (change in the average volume times the change in average rate).
| 2015 Compared to 2014 | 2014 Compared to 2013 | |||||||||||||||||||||||||||||||
| Increase (Decrease) Due to | Increase (Decrease) Due to | |||||||||||||||||||||||||||||||
| Rate/ | Rate/ | |||||||||||||||||||||||||||||||
| (In thousands) | Volume | Rate | Volume | Total | Volume | Rate | Volume | Total | ||||||||||||||||||||||||
| Interest income: |
||||||||||||||||||||||||||||||||
| Federal funds sold, securities purchased under agreements to resell and other short-term investments |
$ | 548 | $ | 76 | $ | 67 | $ | 691 | $ | 377 | $ | (24 | ) | $ | (12 | ) | $ | 341 | ||||||||||||||
| Investment securities: |
||||||||||||||||||||||||||||||||
| Taxable |
(474 | ) | 695 | 97 | 318 | 10,443 | 2,066 | 1,271 | 13,780 | |||||||||||||||||||||||
| Tax-exempt (1) |
86 | (47 | ) | 3 | 42 | 1,952 | (668 | ) | (302 | ) | 982 | |||||||||||||||||||||
| Loans (1),(2) |
18,216 | (13,832 | ) | (177 | ) | 4,207 | 97,693 | 0 | (91 | ) | 97,602 | |||||||||||||||||||||
|
|
|
|
|
|
|
|
|
|
|
|
|
|
|
|
|
|||||||||||||||||
| TOTAL INTEREST INCOME |
18,376 | (13,108 | ) | (10) | 5,258 | 110,465 | 1,374 | 866 | 112,705 | |||||||||||||||||||||||
|
|
|
|
|
|
|
|
|
|
|
|
|
|
|
|
|
|||||||||||||||||
| Interest expense: |
||||||||||||||||||||||||||||||||
| Interest-bearing deposits |
$ | 2,075 | $ | (1,842 | ) | $ | 329 | $ | 562 | $ | 7,219 | $ | (4,828 | ) | $ | (1,461 | ) | $ | 930 | |||||||||||||
| Short-term borrowings |
(410 | ) | 204 | (94 | ) | (300 | ) | 373 | (108 | ) | (26 | ) | 239 | |||||||||||||||||||
| Long-term borrowings |
(285 | ) | (3,419 | ) | 114 | (3,590 | ) | 14,452 | (3,444 | ) | (5,656) | 5,352 | ||||||||||||||||||||
|
|
|
|
|
|
|
|
|
|
|
|
|
|
|
|
|
|||||||||||||||||
| TOTAL INTEREST EXPENSE |
1,380 | (5,057 | ) | 349 | (3,328 | ) | 22,044 | (8,380 | ) | (7,143 | ) | 6,521 | ||||||||||||||||||||
|
|
|
|
|
|
|
|
|
|
|
|
|
|
|
|
|
|||||||||||||||||
| NET INTEREST INCOME |
$ | 16,996 | $ | (8,051 | ) | $ | (359 | ) | $ | 8,586 | $ | 88,421 | $ | 9,754 | $ | 8,009 | $ | 106,184 | ||||||||||||||
|
|
|
|
|
|
|
|
|
|
|
|
|
|
|
|
|
|||||||||||||||||
| (1) | Yields and interest income on federally tax-exempt loans and investment securities are computed on a fully tax-equivalent basis using the statutory federal income tax rate of 35%. |
| (2) | Nonaccruing loans are included in the daily average loan amounts outstanding. |
Provision for Loan Losses
At December 31, 2015, nonperforming loans were $126.71 million or 1.35% of loans, net of unearned income compared to nonperforming loans of $108.96 million or 1.20% of loans, net of unearned income at December 31, 2014. The components of nonperforming loans include: 1) nonaccrual loans, 2) loans which are contractually past due 90 days or more as to interest or principal, but have not been put on a nonaccrual basis and 3) loans whose terms have been restructured for economic or legal reasons due to financial difficulties of the borrowers.
Loans past due 90 days or more were $11.63 million at December 31, 2015 which was relatively flat from $11.67 million at year-end 2014. At December 31, 2015, nonaccrual loans were $91.19 million, an increase of $16.14 million or 21.50% from year-end 2014. The increase was due mainly to the transfer to nonaccrual of a $5.5 million residential real estate loan as well as several significant commercial relationships during 2015. Restructured loans were $23.89 million at December 31, 2015 which was an increase of $1.66 million or 7.44% from $22.23 million of restructured loans at year-end 2014. The increase was due mainly to the restructure of four troubled loans to customers during 2015 in the amount of $3.56 million partially offset by repayments. The loss potential on these loans has been properly evaluated and allocated within the company’s allowance for loan losses.
Nonperforming assets include nonperforming loans and real estate acquired in foreclosure or other settlement of loans (OREO). Total nonperforming assets of $158.94 million, including OREO of $32.23 million at December 31, 2015, represented 1.26% of total assets.
49
Table of Contents
Management is not aware of any other significant loans or securities, groups of loans or securities, or segments of the loan or investment portfolio not included below or disclosed elsewhere herein where there are serious doubts as to the ability of the borrowers or issuers to comply with the present repayment terms of the debt. The following table summarizes nonperforming assets for the indicated periods.
| December 31 | ||||||||||||||||||||
| 2015 | 2014 | 2013 | 2012 | 2011 | ||||||||||||||||
| (In thousands) | ||||||||||||||||||||
| Nonaccrual loans |
$ | 91,189 | $ | 75,051 | $ | 61,928 | $ | 71,559 | $ | 59,892 | ||||||||||
| Loans which are contractually past due 90 days or more as to interest or principal, and are still accruing interest |
11,628 | 11,675 | 11,044 | 18,068 | 16,179 | |||||||||||||||
| Restructured loans (1) |
23,890 | 22,234 | 8,157 | 3,175 | 3,592 | |||||||||||||||
|
|
|
|
|
|
|
|
|
|
|
|||||||||||
| Total nonperforming loans |
126,707 | 108,960 | 81,129 | 92,802 | 79,663 | |||||||||||||||
| Other real estate owned |
32,228 | 38,778 | 38,182 | 49,484 | 51,760 | |||||||||||||||
|
|
|
|
|
|
|
|
|
|
|
|||||||||||
| TOTAL NONPERFORMING ASSETS |
$ | 158,935 | $ | 147,738 | $ | 119,311 | $ | 142,286 | $ | 131,423 | ||||||||||
|
|
|
|
|
|
|
|
|
|
|
|||||||||||
| (1) | Restructured loans with an aggregate balance of $11.95 million, $4.19 million, and $861 thousand at December 31, 2015, 2014 and 2013, respectively, were on nonaccrual status, but are not included in the “Nonaccrual loans” category. |
Loans are designated as impaired when, in the opinion of management, the collection of principal and interest in accordance with the loan contract is doubtful. At December 31, 2015, impaired loans were $255.18 million, which was a decrease of $11.90 million or 4.46% from the $267.08 million in impaired loans at December 31, 2014. The decrease was due mainly to a decline in the balance of acquired impaired loans. For further details on impaired loans, see Note E, Notes to Consolidated Financial Statements.
United maintains an allowance for loan losses and a reserve for lending-related commitments. The combined allowance for loan losses and reserve for lending-related commitments are referred to as the allowance for credit losses. At December 31, 2015, the allowance for credit losses was $76.66 million as compared to $77.05 million at December 31, 2014.
At December 31, 2015, the allowance for loan losses was $75.73 million as compared to $75.53 million at December 31, 2014. As a percentage of loans, net of unearned income, the allowance for loan losses was 0.81% at December 31, 2015 and 0.83% at December 31, 2014. In accordance with accounting rules, United is unable to carry-over an acquired banking company’s previously established allowance for loan losses because acquired loans are recorded at fair value. Therefore, due to this acquisition accounting impact on the allowance for loans losses as well as loans, net of unearned income, management believes that excluding acquired loans in the calculation of the allowance for loan losses as a percentage of loans, net of unearned income separates the difference in the accounting rules for acquired loans and originated loans as well as provides for improved comparability to prior periods and to other financial institutions without acquired loans. The table below presents United’s allowance for loan losses as a percentage of non-acquired loans, net of unearned income for the years ended December 31, 2015 and 2014:
| (Dollars in thousands) | December 31, 2015 |
December 31, 2014 |
||||||
| Allowance for Loan Losses (GAAP) |
$ | 75,726 | $ | 75,529 | ||||
| Loans, net of unearned income (GAAP) |
9,384,080 | 9,104,652 | ||||||
| Less: Acquired Loans (non-GAAP) |
(1,791,023 | ) | (2,196,036 | ) | ||||
|
|
|
|
|
|||||
| Non-Acquired Loans, net of unearned income (non-GAAP) |
$ | 7,593,057 | $ | 6,908,616 | ||||
|
|
|
|
|
|||||
| Allowance for Loan Losses/ Non-acquired Loans, Net of Unearned Income (non-GAAP) |
1.00 | % | 1.09 | % | ||||
The ratio of the allowance for loan losses to nonperforming loans or coverage ratio was 59.76% and 69.32% at December 31, 2015 and December 31, 2014, respectively. The Company’s detailed methodology and analysis indicated a minimal increase in the allowance for loan losses primarily because of changes within historical loss rates.
For the years ended December 31, 2015 and 2014, the provision for loan losses was $22.57 million and $21.94 million, respectively. Net charge-offs were $22.38 million for the year of 2015 as compared to net charge-offs of $20.61 million for the year of 2014. These higher amounts of provision expense and net charge-offs for 2015 compared to 2014 were due to recognition of purchased loan impairments within the commercial portfolio. Annualized net charge-offs as a percentage of average loans were 0.25% for the year of 2015. This ratio compares favorably to United’s most recently reported Federal Reserve peer group banking companies’ (bank holding companies with total assets over $10 billion) net charge-offs to average loans percentage of 0.26% for the first nine months of 2015. The reserve for lending-related commitments at December 31, 2015 was $936 thousand, a decrease of $582 thousand or 38.34% from December 31, 2014. Changes to the reserve for lending-related commitments are recorded in other expense in the Consolidated Statements of Income.
50
Table of Contents
The following table summarizes United’s credit loss experience for each of the five years ended December 31:
| 2015 | 2014 | 2013 | 2012 | 2011 | ||||||||||||||||
| (Dollars in thousands) | ||||||||||||||||||||
| Balance of allowance for credit losses at beginning of year |
$ | 77,047 | $ | 76,341 | $ | 75,557 | $ | 75,727 | $ | 75,039 | ||||||||||
| Loans charged off: |
||||||||||||||||||||
| Commercial, financial & agricultural |
15,917 | 10,117 | 14,207 | 7,028 | 4,892 | |||||||||||||||
| Residential real estate |
6,411 | 5,027 | 4,111 | 8,882 | 7,069 | |||||||||||||||
| Construction & land development |
862 | 7,476 | 896 | 3,099 | 6,290 | |||||||||||||||
| Consumer |
2,309 | 2,621 | 1,792 | 1,546 | 1,354 | |||||||||||||||
|
|
|
|
|
|
|
|
|
|
|
|||||||||||
| TOTAL CHARGE-OFFS |
25,499 | 25,241 | 21,006 | 20,555 | 19,605 | |||||||||||||||
| Recoveries: |
||||||||||||||||||||
| Commercial, financial & agricultural |
1,617 | 2.934 | 847 | 1,544 | 2,565 | |||||||||||||||
| Residential real estate |
495 | 573 | 698 | 821 | 248 | |||||||||||||||
| Construction & land development |
511 | 685 | 73 | 54 | 136 | |||||||||||||||
| Consumer |
499 | 443 | 418 | 301 | 356 | |||||||||||||||
|
|
|
|
|
|
|
|
|
|
|
|||||||||||
| TOTAL RECOVERIES |
3,122 | 4,635 | 2,036 | 2,720 | 3,305 | |||||||||||||||
|
|
|
|
|
|
|
|
|
|
|
|||||||||||
| NET LOANS CHARGED OFF |
22,377 | 20,606 | 18,970 | 17,835 | 16,300 | |||||||||||||||
| Provision for credit losses |
21,992 | 21,312 | 19,754 | 17,665 | 16,988 | |||||||||||||||
|
|
|
|
|
|
|
|
|
|
|
|||||||||||
| BALANCE OF ALLOWANCE FOR CREDIT LOSSES AT END OF YEAR |
$ | 76,662 | $ | 77,047 | $ | 76,341 | $ | 75,557 | $ | 75,727 | ||||||||||
|
|
|
|
|
|
|
|
|
|
|
|||||||||||
| Loans outstanding at the end of period (gross) (1) |
$ | 9,398,952 | $ | 9,119,492 | $ | 6,713,599 | $ | 6,517,780 | $ | 6,234,280 | ||||||||||
| Average loans outstanding during period (net of unearned income) (1) |
$ | 9,117,844 | $ | 8,715,370 | $ | 6,537,360 | $ | 6,314,146 | $ | 5,718,639 | ||||||||||
| Net charge-offs as a percentage of average loans outstanding |
0.25 | % | 0.24 | % | 0.29 | % | 0.28 | % | 0.29 | % | ||||||||||
| Allowance for credit losses, as a percentage of nonperforming loans |
60.50 | % | 70.71 | % | 94.10 | % | 81.42 | % | 95.06 | % | ||||||||||
| (1) | Excludes loans held for sale. |
United evaluates the adequacy of the allowance for credit losses and its loan administration policies are focused upon the risk characteristics of the loan portfolio and lending-related commitments. United’s process for evaluating the allowance is a formal company-wide process that focuses on early identification of potential problem credits and procedural discipline in managing and accounting for those credits. This process determines the appropriate level of the allowance for credit losses, allocation among loan types and lending-related commitments, and the resulting provision for credit losses. The provision for credit losses includes the provision for loan losses and a provision for lending-related commitments included in other expenses.
Allocations are made for specific commercial loans based upon management’s estimate of the borrowers’ ability to repay and other factors impacting collectibility. Other commercial loans not specifically reviewed on an individual basis are evaluated based on historical loss percentages applied to loan pools that have been segregated by risk. Allocations for loans other than commercial loans are made based upon historical loss experience adjusted for current environmental conditions. The allowance for credit losses includes estimated probable inherent but unidentified losses within the portfolio due to uncertainties in economic conditions, delays in obtaining information, including unfavorable information about a borrower’s financial condition, the difficulty in identifying triggering events that correlate perfectly to subsequent loss rates, and risk factors that have not yet fully manifested themselves in loss allocation factors. In addition, a portion of the allowance accounts for the inherent imprecision in the allowance for credit losses analysis.
51
Table of Contents
The following table presents the allocation of United’s allowance for credit losses for each of the five years ended December 31:
| 2015 | 2014 | 2013 | 2012 | 2011 | ||||||||||||||||
| (In thousands) | ||||||||||||||||||||
| Commercial, financial & agricultural |
$ | 40,274 | $ | 39,139 | $ | 35,562 | $ | 37,264 | $ | 36,120 | ||||||||||
| Residential real estate |
15,148 | 13,835 | 16,694 | 14,895 | 13,880 | |||||||||||||||
| Construction & land development |
18,205 | 19,402 | 18,953 | 18,858 | 19,151 | |||||||||||||||
| Consumer |
1,995 | 3,083 | 2,945 | 2,620 | 2,151 | |||||||||||||||
| Allowance for estimated imprecision |
104 | 70 | 44 | 264 | 2,572 | |||||||||||||||
|
|
|
|
|
|
|
|
|
|
|
|||||||||||
| Allowance for loan losses |
$ | 75,726 | $ | 75,529 | $ | 74,198 | $ | 73,901 | $ | 73,874 | ||||||||||
| Reserve for lending-related commitments |
936 | 1,518 | 2,143 | 1,656 | 1,853 | |||||||||||||||
|
|
|
|
|
|
|
|
|
|
|
|||||||||||
| Allowance for credit losses |
$ | 76,662 | $ | 77,047 | $ | 76,341 | $ | 75,557 | $ | 75,727 | ||||||||||
|
|
|
|
|
|
|
|
|
|
|
|||||||||||
The following is a summary of loans outstanding as a percent of total loans at December 31:
| 2015 | 2014 | 2013 | 2012 | 2011 | ||||||||||||||||
| Commercial, financial & agricultural |
57.82% | 58.80% | 58.33% | 59.07% | 56.31% | |||||||||||||||
| Residential real estate |
24.18% | 24.86% | 27.17% | 28.23% | 30.36% | |||||||||||||||
| Construction & land development |
13.57% | 12.45% | 10.00% | 8.46% | 8.83% | |||||||||||||||
| Consumer |
4.43% | 3.89% | 4.50% | 4.24% | 4.50% | |||||||||||||||
|
|
|
|
|
|
|
|
|
|
|
|||||||||||
| Total |
100.00% | 100.00% | 100.00% | 100.00% | 100.00% | |||||||||||||||
|
|
|
|
|
|
|
|
|
|
|
|||||||||||
United’s formal company-wide review of the allowance for loan losses at December 31, 2015 produced increased allocations in two of the six loan categories. The other commercial loan pool allocation increased $4.40 million due to an increase in impairment recognition which was partially offset by improved historical loss rates. The residential real estate loan pool allocation increased $1.31 million due to recognition of losses during 2015 which caused an increase in historical loss rates applied to an increased amount of outstandings on which it is calculated. Offsetting these increases was a decrease in the allocation related to the real estate construction and development loan pool of $1.20 million due to a decrease in historical loss rates applied to the portfolio. The commercial real estate nonowner-occupied loan pool allocation decreased $2.86 million due to improvement in historical loss rates applied to pass-rated and classified loans. The commercial real estate owner-occupied loan pool allocation decreased $405 thousand due to an improvement in the pool’s historical loss rates and overall risk grading within the portfolio. The consumer loan pool experienced a decrease of $1.09 million due to a decrease in historical loss rates applied to the portfolio. In summary, the overall level of the allowance for loan losses was relatively stable in comparison to year-end 2014 as a result of offsetting factors within the portfolio as described above.
An allowance is established for probable credit losses on impaired loans via specific allocations. Nonperforming commercial loans and leases are regularly reviewed to identify impairment. A loan or lease is impaired when, based on current information and events, it is probable that the Company will not be able to collect all amounts contractually due. Measuring impairment of a loan requires judgment and estimates, and the eventual outcomes may differ from those estimates. Impairment is measured based upon the present value of expected future cash flows from the loan discounted at the loan’s effective rate, the loan’s observable market price or the fair value of collateral if the loan is collateral dependent. When the selected measure is less than the recorded investment in the loan, an impairment has occurred. The allowance for impaired loans was $27.79 million at December 31, 2015 and $14.95 million at December 31, 2014. In comparison to the prior year-end, this element of the allowance increased by $12.85 million primarily due to increased specific allocations for other commercial loans.
Management believes that the allowance for credit losses of $76.66 million at December 31, 2015 is adequate to provide for probable losses on existing loans and lending-related commitments based on information currently available. United’s loan administration policies are focused on the risk characteristics of the loan portfolio in terms of loan approval and credit quality. The commercial loan portfolio is monitored for possible concentrations of credit in one or more industries. Management has lending limits as a percentage of capital per type of credit concentration in an effort to ensure adequate diversification within the portfolio. Most of United’s commercial loans are secured by real estate located in West Virginia, southeastern Ohio, Pennsylvania, Virginia, Maryland and the District of Columbia. It is the opinion of management that these commercial loans do not pose any unusual risks and that adequate consideration has been given to these loans in establishing the allowance for credit losses.
52
Table of Contents
Management is not aware of any potential problem loans, trends or uncertainties, which it reasonably expects, will materially impact future operating results, liquidity, or capital resources which have not been disclosed. Additionally, management has disclosed all known material credits, which cause management to have serious doubts as to the ability of such borrowers to comply with the loan repayment schedules.
Other Income
Other income consists of all revenues, which are not included in interest and fee income related to earning assets. Noninterest income has been and will continue to be an important factor for improving United’s profitability. Recognizing the importance, management continues to evaluate areas where noninterest income can be enhanced.
Noninterest income for the year of 2015 was $73.63 million, which was a decrease of $7.33 million from the year of 2014 due mainly to the impact of the Durbin Amendment being effective for United on July 1, 2015. Included in noninterest income for the year of 2014 was the previously mentioned net gain of $8.98 million on the sale of bank premises. Noninterest income for the year of 2015 included noncash, before-tax, other-than-temporary impairment charges of $47 thousand on certain investment securities as compared to noncash, before-tax other-than-temporary impairment charges of $6.48 million on certain investment securities for the year of 2014. In addition, net gains on sales and calls of investment securities were $202 thousand and $3.37 million for the year of 2015 and 2014, respectively. Excluding the net gain on the sale of bank premises, the noncash, other-than-temporary impairment charges as well as the net gains from sales and calls of investment securities, noninterest income for the year of 2015 decreased $1.63 million or 2.17% from the year of 2014.
Although excluding the net gain on the sale of bank premises and the results of security transactions is a non-GAAP measure, United’s management believes noninterest income without the net gain on the sale of bank premises and noncash, before-tax, other-than-temporary impairment charges as well as net securities gains and losses on sales and calls is more indicative of United’s performance because it isolates income that is primarily customer relationship driven and is more indicative of normalized operations. In addition, these items can fluctuate greatly from quarter to quarter or could be infrequent and are thus difficult to predict.
The following table reconciles the difference between noninterest income and noninterest income excluding the net gain on the sale of bank premises in 2014 and the results of security transactions for the years ended December 31, 2015, 2014 and 2013.
| Year Ended | ||||||||||||
| (Dollars in thousands) | 2015 | 2014 | 2013 | |||||||||
| Total Non-Interest Income (GAAP) |
$ | 73,626 | $ | 80,962 | $ | 66,506 | ||||||
| Less: Net gain on the sale of bank premises (GAAP) |
0 | 8,976 | 0 | |||||||||
| Less: Net other-than-temporary impairment losses (GAAP) |
(47 | ) | (6,478 | ) | (7,332 | ) | ||||||
| Less: Net gains on sales/calls of investment securities (GAAP) |
202 | 3,366 | 1,523 | |||||||||
|
|
|
|
|
|
|
|||||||
| Non-Interest Income excluding the results of noncash, other than-temporary impairment charges and net gains and losses from sales and calls of investment securities (non-GAAP) |
$ | 73,471 | $ | 75,098 | $ | 72,315 | ||||||
|
|
|
|
|
|
|
|||||||
Revenue from trust income and brokerage commissions increased $944 thousand or 5.20% due mainly to increased brokerage volume and the value of assets under management. United continues its efforts to broaden the scope and activity of its trust and brokerage service areas, especially in the northern Virginia market, to provide additional sources of fee income that complement United’s traditional banking products and services. The northern Virginia market provides a relatively large number of potential customers with high per capita incomes.
Fees from deposit services were $37.96 million for the year of 2015, a decrease of $4.41 million or 10.41% from the year of 2014. These decreases were due to the impact of the Durbin Amendment which was effective for United on July 1, 2015. As previously mentioned, the Durbin Amendment limits fees for debit card processing paid by merchants to banking companies with assets in excess of $10 billion. Specifically, fees from debit card transactions declined $2.48 million for the year of 2015 as compared to the same time period last year. In addition, income from overdraft fees declined $1.51 million for the year of 2015.
53
Table of Contents
Income from bank owned life insurance policies increased $257 thousand or 4.85% in 2015 as compared to 2014 due to proceeds received from a death benefit in the fourth quarter of 2015.
Mortgage banking income for the year of 2015 increased $631 thousand or 33.64% due to increased production and sales of mortgage loans in the secondary market. Mortgage loan sales were $143.84 million in the year of 2015 as compared to $91.99 million in the year of 2014.
Fees from bankcard transactions increased $579 thousand or 13.76% as compared to the year of 2014 due to a higher volume of transactions.
Other Expense
Just as management continues to evaluate areas where noninterest income can be enhanced, it strives to improve the efficiency of its operations to reduce costs. Other expense includes all items of expense other than interest expense, the provision for credit losses and income tax expense. Noninterest expense for the year of 2015 was $231.69 million, a decrease of $8.16 million or 3.40% from the year of 2014. This decrease is primarily due to the previously mentioned merger related expenses and charges of $5.29 million and prepayment penalty of $1.97 million on a FHLB advance in the year of 2014.
Employee compensation for the year of 2015 decreased $2.70 million or 2.97% from the year of 2014. Included in employee compensation for the year of 2014 were merger severance charges of $3.64 million. In addition, expense for employee incentives declined $3.35 million.
Employee benefits expense increased $6.63 million or 32.40% due mainly an increase of $5.66 million in pension expense due to a change in the discount rate used in the valuation process. United uses certain valuation methodologies to measure the fair value of the assets within United’s pension plan which are presented in Note N, Notes to Consolidated Financial Statements. The funded status of United’s pension plan is based upon the fair value of the plan assets compared to the projected benefit obligation. The determination of the projected benefit obligation and the associated periodic benefit expense involves significant judgment and estimation of future employee compensation levels, the discount rate and the expected long-term rate of return on plan assets. If United assumes a 1% increase or decrease in the estimation of future employee compensation levels while keeping all other assumptions constant, the benefit cost associated with the pension plan would increase by approximately $832 thousand and decrease by approximately $757 thousand, respectively. If United assumes a 1% increase or decrease in the discount rate while keeping all other assumptions constant, the benefit cost associated with the pension plan would decrease by approximately $2.32 million and increase by approximately $2.78 million, respectively. If United assumes a 1% increase or decrease in the expected long-term rate of return on plan assets while keeping all other assumptions constant, the benefit cost associated with the pension plan would decrease by approximately $1.24 million and increase by approximately $1.24 million, respectively.
Other real estate owned (OREO) expense decreased $4.13 million or 53.32% for the year of 2015 as compared to the year of 2014 due to fewer reductions to fair value on properties.
Net occupancy expense decreased $1.50 million or 5.80% for the year of 2015 as compared to the year of 2014. The decline was due mainly to less real property taxes and maintenance expense due to fewer offices.
Federal Deposit Insurance Corporation (FDIC) insurance expense for the year of 2015 increased $802 thousand or 10.60% due to a higher assessment base as a result of the Virginia Commerce acquisition.
Equipment expense decreased $531 thousand or 5.55% due to declines in depreciation and maintenance expense.
Other expenses decreased $5.29 million or 8.81% for the year of 2015 as compared to the year of 2014 due to a decline in several general operating expenses such as advertising, loan collections, business & franchise taxes, core deposit amortization and consulting and legal. Partially offsetting this decline was a charge of $1.26 million related to historical tax credits included in noninterest expense for the year of 2015. Also included in noninterest expense for the year of 2014 was a donation of $800 thousand to an educational institution.
54
Table of Contents
Income Taxes
For the year ended December 31, 2015, income taxes were $65.53 million, compared to $65.00 million for 2014. United’s effective tax rate was approximately 32.2% and 33.4% for years ended December 31, 2015 and 2014, respectively, as compared to 31.5% for 2013. The lower effective tax rate in 2015 was due to the release of the income tax reserves in the third quarter due to the expiration of the statute of limitations for examinations of certain years and historical tax credits recognized in the first quarter. For further details related to income taxes, see Note M, Notes to Consolidated Financial Statements.
Quarterly Results
Net income for the first quarter of 2015 was $34.63 million or $0.50 per diluted share compared to $30.12 million or $0.48 per share for the first three months of 2014. Tax-equivalent net interest income for the first quarter of 2015 increased $9.41 million or 10.82% from the first quarter of 2014 primarily attributable to an increase in average earning assets from the Virginia Commerce acquisition. The provision for loan losses was $5.35 million for the first three months of 2015 as compared to $4.68 million for the first three months of 2014. Noninterest income was $18.19 million for the first three months of 2015, down $8.20 million or 31.06% when compared to the first three months of 2014. As previously mentioned, during the first quarter of 2014 United sold a former branch building which resulted in a before-tax gain of $8.98 million. The results for the first quarter of 2015 included noncash, before-tax, other-than-temporary impairment charges of $34 thousand on certain investment securities and a net gain on sales and calls of investment securities of $46 thousand. The results for the first quarter of 2014 also included noncash, before-tax, other-than-temporary impairment charges of $639 thousand on certain investment securities and a net gain on sales and calls of investment securities of $824 thousand. Noninterest expense decreased $3.37 million or 5.52% for the first three months of 2015 compared to the first quarter of 2014 due mainly to a decline in merger-related expenses. Income taxes decreased $556 thousand for the first three months of 2015 as compared to the first three months of 2014. The decrease were primarily due to historical tax credits recognized in the first quarter of 2015.
Net income for the second quarter of 2015 was $34.81 million or $0.50 per diluted share, as compared to $33.25 million or $0.48 per diluted share for the second quarter of 2014. Tax-equivalent net interest income for the second quarter of 2015 was $97.50 million, an increase of $1.96 million or 2.05% from the second quarter of 2014 due mainly to an increase in average earning assets. The provision for credit losses was $5.72 million for the second quarter of 2015 as compared to $6.20 million for the second quarter of 2014. For the second quarter of 2015, noninterest income was $19.50 million, which was an increase of $504 thousand or 2.65% from the second quarter of 2014. The results for the second quarter of 2014 included noncash, before-tax, other-than-temporary impairment charges of $421 thousand on certain investment securities. No noncash, before-tax, other-than-temporary impairment charges were recognized during the second quarter of 2015. For the second quarter of 2015, noninterest expense increased $627 thousand or 1.10% from the second quarter of 2014.
Net income for the third quarter of 2015 was $35.05 million or $0.50 per diluted share, as compared to $33.26 million or $0.48 per diluted share for the third quarter of 2014. Tax-equivalent net interest income for the third quarter of 2015 was relatively flat from the third quarter of 2014. The provision for loan losses was $5.18 million for the third quarter of 2015 as compared to $4.75 million for the third quarter of 2014, respectively. Noninterest income for the third quarter of 2015 increased $1.65 million or 10.18% from the third quarter of 2014. No noncash, before-tax, other-than-temporary impairment charges were recognized during the third quarter of 2015. Included in noninterest income for the third quarter of 2014 were noncash, before-tax, other-than-temporary impairment charges of $4.71 million on certain investment securities. For the third quarter of 2015, noninterest expense was flat from the third quarter of 2014.
55
Table of Contents
Fourth quarter of 2015 net income was $33.48 million or $0.48 per diluted share as compared to net income of $33.26 million or $0.48 per diluted share in the fourth quarter of 2014. Minimal noncash, before-tax, other-than-temporary impairment charges of $13 thousand were recognized during the fourth quarter of 2015. In comparison, the results for the fourth quarter of 2014 included noncash, before-tax, other-than-temporary impairment charges of $704 thousand on certain investment securities. Also included in the results for the fourth quarter of 2014 was a penalty of $1.97 million to prepay a FHLB advance with a high interest rate.
Tax-equivalent net interest income of $98.83 million for the fourth quarter of 2015 decreased $3.25 million or 3.19% from the fourth quarter of 2014. The fourth quarter of 2014 included interest income of $3.2 million on the repayment of a large acquired loan. Due in large part to this repayment coupled with payoffs of higher yielding loans with the re-investment of this cash inflow into new loans at lower interest rates, the average yield on earning assets for the fourth quarter of 2015 decreased 27 basis points from the fourth quarter of 2014. Partially offsetting the decreases to tax-equivalent net interest income for the fourth quarter of 2015 was an increase in average earning assets. Average earning assets for the fourth quarter of 2015 increased $281.60 million or 2.62% from the fourth quarter of 2014. In addition, the average cost of funds decreased 5 basis points as compared to the fourth quarter of 2014 due to the repayment of higher costing long-term Federal Home Loan Bank advances. The net interest margin of 3.56% for the fourth quarter of 2015 was a decrease of 21 basis points from the net interest margin of 3.77% for the fourth quarter of 2014.
For the fourth quarter of 2015, the provision for loan losses was $6.32 million while net charge-offs were $6.08 million. For the fourth quarter of 2014, the provision for loan losses was $6.31 million while net charge-offs were $6.50 million.
Noninterest income for the fourth quarter of 2015 was $18.13 million, a decrease of $1.29 million from the fourth quarter of 2014. A noncash, before-tax, other-than-temporary impairment charge of $13 thousand was recognized during the fourth quarter of 2015. Included in noninterest income for the fourth quarter of 2014 were noncash, before-tax, other-than-temporary impairment charges of $704 thousand on certain investment securities. In addition, net gains on sales and calls of investment securities were $42 thousand fourth quarter of 2015 as compared to $1.23 million for the fourth quarter of 2014. Excluding the noncash, other-than-temporary impairment charges as well as the net gains from sales and calls of investment securities, noninterest income for the fourth quarter of 2015 decreased $791 thousand or 4.19% from the fourth quarter of 2014. The decrease was due to lower fees from deposit services as a result of the Durbin Amendment being effective for United on July 1, 2015. Fees from deposit services for the fourth quarter of 2015 declined $2.08 million from the fourth quarter of 2014 due mainly to lower income on debit card transactions. Partially offsetting this decline were increases of $513 thousand in income from bank-owned life insurance policies due to a death benefit, $265 thousand in fees from bankcard services due to an increase in seasonal volume and $229 thousand in mortgage banking income due to increased loan sales in the secondary market.
Noninterest expense for the fourth quarter of 2015 was $58.62 million, a decrease of $5.41 million or 8.44% from the fourth quarter of 2014 due partially to the previously mentioned prepayment penalty of $1.97 million on an FHLB advance in the fourth quarter last year and a donation of $800 thousand to an educational institution. Otherwise, other real estate owned (OREO) expenses decreased $2.16 million due to fewer declines in the fair value of OREO properties, net occupancy expense decreased $871 thousand due to a decline in real property taxes as well as several decreases in other general operating expenses. None of these decreases in other general operating expenses was individually significant.
Additional quarterly financial data for 2015 and 2014 may be found in Note W, Notes to Consolidated Financial Statements.
The Effect of Inflation
United’s income statements generally reflect the effects of inflation. Since interest rates, loan demand and deposit levels are impacted by inflation, the resulting changes in the interest-sensitive assets and liabilities are included in net interest income. Similarly, operating expenses such as salaries, rents and maintenance include changing prices resulting from inflation. One item that would not reflect inflationary changes is depreciation expense. Subsequent to the acquisition of depreciable assets, inflation causes price levels to rise; therefore, historically presented dollar values do not reflect this inflationary condition. With inflation levels at relatively low levels and monetary and fiscal policies being implemented to keep the inflation rate increases within an acceptable range, management expects the impact of inflation would continue to be minimal in the near future.
56
Table of Contents
The Effect of Regulatory Policies and Economic Conditions
United’s business and earnings are affected by the monetary and fiscal policies of the United States government, its agencies and various other governmental regulatory authorities. The Federal Reserve Board regulates the supply of money in order to influence general economic conditions. Among the instruments of monetary policy available to the Federal Reserve Board are (i) conducting open market operations in United States government obligations, (ii) changing the discount rate on financial institution borrowings, (iii) imposing or changing reserve requirements against financial institution deposits, and (iv) restricting certain borrowings and imposing or changing reserve requirements against certain borrowings by financial institutions and their affiliates. These methods are used in varying degrees and combinations to affect directly the availability of bank loans and deposits, as well as the interest rates charged on loans and paid on deposits.
United’s business and earnings are also affected by general and local economic conditions. In 2014 and 2013, certain credit markets experienced difficult conditions and volatility. Downturns in the credit market can cause a decline in the value of certain loans and securities, a reduction in liquidity and a tightening of credit. A downturn in the credit market often signals a weakening economy that can cause job losses and thus distress on borrowers and their ability to repay loans. Uncertainties in credit markets and the economy present significant challenges for the financial services industry.
Regulatory policies and economic conditions have had a significant effect on the operating results of financial institutions in the past and are expected to continue to do so in the future; however, United cannot accurately predict the nature, timing or extent of any effect such policies or economic conditions may have on its future business and earnings.
Contractual Obligations, Commitments, Contingent Liabilities and Off-Balance Sheet Arrangements
United has various financial obligations, including contractual obligations and commitments, that may require future cash payments. The table below presents, by payment date, significant known contractual obligations to third parties as of December 31, 2015:
| Total Payments Due by Period | ||||||||||||||||||||
| (In thousands) | One Year |
One to | Three to Five |
Over Five | ||||||||||||||||
| Total | or Less | Three Years | Years | Years | ||||||||||||||||
| Deposits without a stated maturity (1) |
$ | 7,443,417 | $ | 7,443,417 | $ | 0 | $ | 0 | $ | 0 | ||||||||||
| Time deposits (2) (3) |
1,917,947 | 1,242,135 | 509,964 | 165,607 | 241 | |||||||||||||||
| Short-term borrowings (2) |
423,030 | 423,030 | 0 | 0 | 0 | |||||||||||||||
| Long-term borrowings (2) (3) |
1,143,875 | 715,273 | 68,781 | 47,693 | 312,129 | |||||||||||||||
| Operating leases |
52,600 | 10,549 | 18,312 | 11,364 | 12,376 | |||||||||||||||
| (1) | Excludes interest. |
| (2) | Includes interest on both fixed and variable rate obligations. The interest associated with variable rate obligations is based upon interest rates in effect at December 31, 2015. The interest to be paid on variable rate obligations is affected by changes in market interest rates, which materially affect the contractual obligation amounts to be paid. |
| (3) | Excludes carrying value adjustments such as unamortized premiums or discounts. |
As of December 31, 2015, United recorded a liability for uncertain tax positions, including interest and penalties, of $2.10 million. This liability represents an estimate of tax positions that United has taken in its tax returns which may ultimately not be sustained upon examination by tax authorities. Since the ultimate amount and timing of any future cash settlements cannot be predicted with reasonable certainty, this estimated liability is excluded from the contractual obligations table.
United also enters into derivative contracts, mainly to protect against adverse interest rate movements on the value of certain assets or liabilities, under which it is required to either pay cash to or receive cash from counterparties depending on changes in interest rates. Derivative contracts are carried at fair value and not notional value on the consolidated balance sheet. Because the derivative contracts recorded on the balance sheet at December 31, 2015 do not represent the amounts that may ultimately be paid under these contracts, they are excluded from the preceding table. Further discussion of derivative instruments is included in Note Q, Notes to Consolidated Financial Statements.
57
Table of Contents
United is a party to financial instruments with off-balance-sheet risk in the normal course of business to meet the financing needs of its customers. These financial instruments include loan commitments and standby letters of credit. United’s maximum exposure to credit loss in the event of nonperformance by the counterparty to the financial instrument for the loan commitments and standby letters of credit is the contractual or notional amount of those instruments. United uses the same policies in making commitments and conditional obligations as it does for on-balance sheet instruments. Since many of the commitments are expected to expire without being drawn upon, the total commitment amounts do not necessarily represent future cash requirements.
The following table details the amounts of significant commitments and letters of credit as of December 31, 2015:
| (In thousands) | Amount | |||
| Commitments to extend credit: |
||||
| Revolving open-end secured by 1-4 residential |
$ | 454,123 | ||
| Credit card and personal revolving lines |
155,455 | |||
| Commercial |
1,978,379 | |||
|
|
|
|||
| Total unused commitments |
$ | 2,587,957 | ||
|
|
|
|||
| Financial standby letters of credit |
$ | 67,247 | ||
| Performance standby letters of credit |
67,899 | |||
| Commercial letters of credit |
226 | |||
|
|
|
|||
| Total letters of credit |
$ | 135,372 | ||
|
|
|
|||
Commitments generally have fixed expiration dates or other termination clauses, generally within one year, and may require the payment of a fee. Further discussion of commitments is included in Note P, Notes to Consolidated Financial Statements.
Liquidity
In the opinion of management, United maintains liquidity that is sufficient to satisfy its depositors’ requirements and the credit needs of its customers. Like all banks, United depends upon its ability to renew maturing deposits and other liabilities on a daily basis and to acquire new funds in a variety of markets. A significant source of funds available to United is “core deposits.” Core deposits include certain demand deposits, statement and special savings and NOW accounts. These deposits are relatively stable and they are the lowest cost source of funds available to United. Short-term borrowings have also been a significant source of funds. These include federal funds purchased and securities sold under agreements to repurchase as well as advances from the FHLB. Repurchase agreements represent funds that are obtained as the result of a competitive bidding process.
Liquid assets are cash and those items readily convertible to cash. All banks must maintain sufficient balances of cash and near-cash items to meet the day-to-day demands of customers and United’s cash needs. Other than cash and due from banks, the available for sale securities portfolio and maturing loans are the primary sources of liquidity.
The goal of liquidity management is to ensure the ability to access funding that enables United to efficiently satisfy the cash flow requirements of depositors and borrowers and meet United’s cash needs. Liquidity is managed by monitoring funds availability from a number of primary sources. Substantial funding is available from cash and cash equivalents, unused short-term borrowings, and a geographically dispersed network of branches providing access to a diversified and substantial retail deposit market.
Short-term needs can be met through a wide array of outside sources such as correspondent and downstream correspondent federal funds and utilization of Federal Home Loan Bank advances.
58
Table of Contents
Other sources of liquidity available to United to provide long-term as well as short-term funding alternatives, in addition to FHLB advances, are long-term certificates of deposit, lines of credit, borrowings that are secured by bank premises or stock of United’s subsidiaries and issuances of trust preferred securities. In the normal course of business, United through its Asset Liability Committee evaluates these as well as other alternative funding strategies that may be utilized to meet short-term and long-term funding needs. See Notes J and K, Notes to Consolidated Financial Statements.
Cash flows provided by operations in 2015 were $178.29 million due mainly to net income of $137.96 million for the year of 2015. In 2014, cash flows of $144.79 million were provided by operations due mainly to net income of $129.89 million. In 2015, net cash of $189.71 million was used in investing activities which was primarily due to loan growth of $291.03 million partially offset by net proceeds of $106.07 million from sales over purchases of investment securities. In 2014, net cash of $204.80 million was used in investing activities which was primarily due to loan growth of $395.64 million. Partially offsetting this use of cash in 2014 was net cash of $97.30 million received in the Virginia Commerce acquisition and net proceeds of $90.53 million from the sales, calls, redemptions and maturities of investment securities over purchases. During the year of 2015, net cash of $115.69 million was provided by financing activities due primarily to growth in deposits of $297.74 million. Partially offsetting this increase were net repayments of $89.46 million for long-term FHLB and the payment of cash dividends in the amount of $88.86 million for the year of 2015. During the year of 2014, net cash of $396.46 million was provided by financing activities due primarily to proceeds of $790.00 million from FHLB long-term borrowings and growth in deposits of $403.26 million. Partially offsetting these sources of cash in financing activities was cash used to repay $215.00 million and $436.73 million of short term and long-term FHLB borrowings, respectively, the payment of $82.50 million for cash dividends and $28.68 million to redeem trust preferred securities. The net effect of the cash flow activities was an increase in cash and cash equivalents of $104.27 million for the year of 2015 as compared to an increase in cash and cash equivalents of $336.45 million for the year of 2014. See the Consolidated Statement of Cash Flows in the Consolidated Financial Statements.
United anticipates it can meet its obligations over the next 12 months and has no material commitments for capital expenditures. There are no known trends, demands, commitments, or events that will result in or that are reasonably likely to result in United’s liquidity increasing or decreasing in any material way. United also has lines of credit available. See Notes J and K, Notes to Consolidated Financial Statements for more detail regarding the amounts available to United under its lines of credit.
The Asset Liability Committee monitors liquidity to ascertain that a liquidity position within certain prescribed parameters is maintained. No changes are anticipated in the policies of United’s Asset and Liability Committee.
Capital Resources
United’s capital position is financially sound. United seeks to maintain a proper relationship between capital and total assets to support growth and sustain earnings. United has historically generated attractive returns on shareholders’ equity. On January 1, 2015, the new Basel III Capital Rules became effective for United and its banking subsidiaries. United continues to be well-capitalized based upon these new regulatory guidelines. United’s risk-based capital ratio is 12.59% at December 31, 2015 while its Common Equity Tier 1 capital, Tier 1 capital and leverage ratios are 9.67%, 11.87% and 10.70%, respectively. The new regulatory requirements for a well-capitalized financial institution are a risk-based capital ratio of 10.0%, a Common Equity Tier 1 capital ratio of 6.5%, a Tier 1 capital ratio of 8.0% and a leverage ratio of 5.0%. See Note T, Notes to Consolidated Financial Statements.
Total shareholders’ equity was $1.71 billion at December 31, 2015, increasing $56.48 million or 3.41% from December 31, 2014 primarily due to the retention of earnings. United’s equity to assets ratio was 13.62% at December 31, 2015 as compared to 13.43% at December 31, 2014. The primary capital ratio, capital and reserves to total assets and reserves, was 14.14% at December 31, 2015 as compared to 13.97% at December 31, 2014. United’s average equity to average asset ratio was 13.88% and 13.71% for the years ended December 31, 2015 and 2014, respectively. All these financial measurements reflect a financially sound position.
During the fourth quarter of 2015, United’s Board of Directors declared a cash dividend of $0.33 per share. Dividends per share of $1.29 for the year of 2015 represented an increase over the $1.28 per share paid for 2014. Total cash dividends declared to common shareholders were approximately $89.68 million for the year of 2015 as compared to $88.52 million for the year of 2014. The year 2015 was the forty-second consecutive year of dividend increases to United shareholders.
59
Table of Contents
The following table shows selected consolidated operating and capital ratios for each of the last three years ended December 31:
| 2015 | 2014 | 2013 | ||||||||||
| Return on average assets |
1.12% | 1.11% | 1.02% | |||||||||
| Return on average equity |
8.10% | 8.13% | 8.43% | |||||||||
| Dividend payout ratio |
65.00% | 68.15% | 73.55% | |||||||||
| Average equity to average assets ratio |
13.88% | 13.71% | 12.07% | |||||||||
2014 COMPARED TO 2013
FINANCIAL CONDITION SUMMARY
United’s total assets as of December 31, 2014 were $12.33 billion which was an increase of $3.59 billion or 41.14% from December 31, 2013, primarily the result of the acquisition of Virginia Commerce Bancorp, Inc. (Virginia Commerce) after the close of business on January 31, 2014. Portfolio loans increased $2.40 billion or 35.80%, cash and cash equivalents increased $336.45 million or 80.76%, investment securities increased $426.70 million or 47.98%, goodwill increased $334.25 million or 89.00%, other assets increased $79.62 million or 24.68%, bank premises and equipment increased $7.62 million or 10.91% and interest receivable increased $5.67 million or 21.26% due primarily to the Virginia Commerce merger.
Portfolio loans, net of unearned income, increased $2.40 billion or 35.80% from year-end 2013 mainly as a result of the Virginia Commerce acquisition which added $2.01 billion, including purchase accounting amounts, in portfolio loans. Since year-end 2013, commercial, financial and agricultural loans increased $1.44 billion or 36.89% as commercial real estate loans increased $1.20 billion and commercial loans (not secured by real estate) increased $239.08 million. In addition, residential real estate loans and construction and land development loans increased $441.98 million or 24.27% and $462.89 million or 69.05%, respectively, while other consumer loans increased $58.14 million or 18.71%. The increases were due primarily to the Virginia Commerce acquisition. Otherwise, portfolio loans, net of unearned income, grew organically $395.64 million from year-end 2013. Cash and cash equivalents increased $336.45 million or 80.76% from year-end 2013. Of this total increase, interest-bearing deposits with other banks increased $295.54 million or 105.14% as United placed excess cash in an interest-bearing account with the Federal Reserve. In addition, cash and due from banks increased $40.91 million or 30.34% and federal funds sold were flat.
Investment securities increased $426.70 million or 47.98% as Virginia Commerce added $476.54 million in investment securities, including purchase accounting amounts, upon consummation of the acquisition. Securities available for sale increased $405.10 million or 52.25%. This change in securities available for sale reflects $461.76 million acquired from Virginia Commerce, $531.13 million in sales, maturities and calls of securities, $445.48 million in purchases, and an increase of $29.72 million in market value. Securities held to maturity declined $1.66 million or 4.04% from year-end 2013 due to calls and maturities of securities. Other investment securities increased $23.25 million or 31.81% from year-end 2013. Virginia Commerce added $14.78 million in other investment securities. Otherwise, Federal Reserve Bank (FRB) stock increased $13.05 million and FHLB stock decreased $4.76 million.
Other assets increased $79.62 million or 24.68% from year-end 2013. The Virginia Commerce acquisition added $104.59 million in other assets plus an additional $17.14 million in core deposit intangibles. The cash surrender value of bank-owned life insurance policies increased $40.12 million. This increase was due mainly to $46.72 million of bank-owned life insurance policies acquired from Virginia Commerce partially offset by payments totaling $8.93 million for policies that were surrendered during the year of 2014. The remainder of the increase in other assets is the result of an increase of $16.55 million in deferred tax assets, an increase of $21.08 million in income taxes receivable, and an increase of $13.12 million in core deposit intangibles. Partially offsetting these increases in other assets is an $18.00 million decrease in United’s net pension asset due to a decrease in the discount rate used in the year-end valuation, resulting in pension liability of $9.85 million at year-end 2014.
60
Table of Contents
Total liabilities increased $2.98 billion or 38.72% from year-end 2013. This increase in total liabilities was due mainly to an increase of $2.42 billion or 36.61% and $534.52 million or 53.11% in deposits and borrowings, respectively, mainly due to the Virginia Commerce acquisition. Virginia Commerce added $2.02 billion in deposits, including purchase accounting amounts, and $468.15 million in borrowings, including purchase accounting amounts, upon consummation of the acquisition. In terms of composition, noninterest-bearing deposits increased $717.10 million or 38.26% while interest-bearing deposits increased $1.71 billion or 35.96% from December 31, 2013. Organically, deposits increased $403.26 million from year-end 2013. Since year-end 2013, short-term borrowings increased $4.90 million or 1.14% due to a $193.74 million increase in short-term securities sold under agreements to repurchase and a $26.16 million increase in federal funds purchased, which were partially offset by a $215.00 million decrease in short term FHLB advances. Long-term borrowings increased $529.62 million or 92.00% since year-end 2013 as long-term FHLB advances increased $453.27 million. In addition, United assumed $53.70 million in long-term securities sold under agreements to repurchase and $50.64 million of junior subordinated debt securities, respectively, including purchase accounting amounts, in the Virginia Commerce acquisition.
Shareholders’ equity at December 31, 2014 increased $641.43 million or 58.98% from December 31, 2013 mainly as a result of the Virginia Commerce acquisition and retention of earnings, net of dividends declared. The Virginia Commerce transaction added approximately $552 million as 18,330,347 shares were issued from United’s authorized but unissued shares for the merger at a cost of approximately $548 million. Earnings net of dividends for the year of 2014 were $41.37 million. Accumulated other comprehensive income increased $7.28 million or 16.92% due mainly to an increase of $19.32 million in the fair value of United’s available for sale investment portfolio, net of deferred income taxes. In addition, the after tax non-credit net reclass portion of OTTI losses was $5.47 million related predominantly to the Trup Cdo portfolio and the after-tax accretion of pension costs was $1.26 million for the year of 2014. Partially offsetting these increases to accumulated other comprehensive income is an after-tax pension accounting adjustment resulting in a decline of $18.77 million.
EARNINGS SUMMARY
Net income for the year 2014 was $129.89 million or $1.92 per diluted share compared to $85.63 million or $1.70 per diluted share for the year of 2013. As previously mentioned, United completed its acquisition of Virginia Commerce after the close of business on January 31, 2014. The financial results of Virginia Commerce are included in United’s results from the acquisition date.
The results for the year of 2014 included noncash, before-tax, other-than-temporary impairment charges of $6.48 million on certain investment securities. The results for year of 2013 included noncash, before-tax, other-than-temporary impairment charges of $7.33 million on certain investment securities. As previously reported, United sold a former branch building during the first quarter of 2014 which resulted in a before-tax gain of $8.98 million. Also included in the results for the year of 2014 was a penalty of $1.97 million to prepay a Federal Home Loan Bank (FHLB) advance with a high interest rate. In addition, the results for the year of 2014 included merger related expenses and charges of $5.29 million as compared to $2.01 million in the year of 2013.
Net interest income for the year of 2014 was $375.71 million, an increase of $105.87 million or 39.23% from the year of 2013. The provision for credit losses was $21.94 million for the year 2014 as compared to $19.27 million for the year of 2013.
Noninterest income was $80.96 million for the year of 2014, up $14.46 million or 21.74% when compared to the year of 2013. Included in noninterest income for the year of 2014 and 2013 were the previously mentioned noncash before-tax other-than-temporary impairment charges of $6.48 million and $7.33 million, respectively. Noninterest expense was $239.85 million, an increase of $47.81 million or 24.90% for the year of 2014 when compared to 2013.
Income tax expense for the year of 2014 was $65.00 million as compared to $39.42 million for the year of 2013. United’s effective tax rate was approximately 33.4% and 31.5% for years ended December 31, 2014 and 2013, respectively, as compared to 32.0% for 2012.
The following discussion explains in more detail the results of operations by major category.
61
Table of Contents
Net Interest Income
Net interest income for the year of 2014 was $375.71 million, which was an increase of $105.87 million or 39.23% from the year of 2013. The $105.87 million increase in net interest income occurred because total interest income increased $112.39 million while total interest expense increased $6.52 million from the year of 2013.
Generally, interest income for year of 2014 increased from the year of 2013 because of the earning assets added from the Virginia Commerce acquisition. Likewise, interest expense for the year of 2014 increased from the year of 2013 because of the interest-bearing liabilities added from Virginia Commerce. However, the increase in interest expense was partially mitigated by the accretion of fair value premiums recorded on the interest-bearing deposits and long-term securities sold under agreements to repurchase acquired from Virginia Commerce. For the purpose of this remaining discussion, net interest income is presented on a tax-equivalent basis to provide a comparison among all types of interest earning assets. The tax-equivalent basis adjusts for the tax-favored status of income from certain loans and investments. Although this is a non-GAAP measure, United’s management believes this measure is more widely used within the financial services industry and provides better comparability of net interest income arising from taxable and tax-exempt sources. United uses this measure to monitor net interest income performance and to manage its balance sheet composition.
Tax-equivalent net interest income for the year of 2014 was $382.02 million, an increase of $106.18 million or 38.49% from the year of 2013. This increase in tax-equivalent net interest income was primarily attributable to an increase in average earning assets from the Virginia Commerce acquisition. Average earning assets increased $2.80 billion or 37.38% from the year of 2013. Average net loans increased $2.18 billion or 33.63% for the year of 2014 while average short-term investments and investment securities increased $145.17 million or 61.55% and $482.43 million or 60.75%, respectively. In addition, the average cost of funds declined 9 basis points from the year of 2013. In particular, the average cost of long-term borrowings declined 90 basis points due mainly to the repayment of certain higher-cost long-term FHLB borrowings. Partially offsetting the increases to tax-equivalent net interest income for the year of 2014 was a decline of 4 basis points in the average yield on earning assets as compared to the year of 2013. The net interest margin for the year of 2014 was 3.71%, which was an increase of 3 basis points from a net interest margin of 3.68% for the year of 2013.
Provision for Loan Losses
For the years ended December 31, 2014 and 2013, the provision for loan losses was $21.94 million and $19.27 million, respectively. Net charge-offs were $20.61 million for the year of 2014 as compared to net charge-offs of $18.97 million for the year of 2013. Annualized net charge-offs as a percentage of average loans were 0.24% for the year of 2014. The reserve for lending-related commitments at December 31, 2014 was $1.52 million, a decrease of $625 thousand or 29.16% from December 31, 2013. Changes to the reserve for lending-related commitments are recorded in other expense in the Consolidated Statements of Income.
At December 31, 2014, the allowance for loan losses was $75.53 million as compared to $74.20 million at December 31, 2013. As a percentage of loans, net of unearned income, the allowance for loan losses was 0.83% at December 31, 2014 and 1.11% at December 31, 2013. For United, this ratio at December 31, 2014 decreased from the ratio at December 31, 2013 mainly because United was unable to carry-over Virginia Commerce’s previously established allowance for loan losses because acquired loans are recorded at fair value in accordance with accounting rules. The ratio of the allowance for loan losses to nonperforming loans or coverage ratio was 69.32% and 91.46% at December 31, 2014 and December 31, 2013, respectively. This ratio declined because nonperforming loans increased $27.83 million or 34.30% while the allowance for loan losses only increased $1.33 million or 1.79% from year-end 2013. Adjustments to risk grades within the allowance for loan loss analysis were based on delinquency and loss trends of such loans and resulted in increased allowance allocations of $1.30 million or 1.76%. This increase in allocations coincided with the increase of provision for losses. There was also a slight increase in the estimate for imprecision. The Company’s detailed methodology and analysis indicated a minimal increase in the allowance for loan losses primarily because of the offsetting factors of changes within historical loss rates and reduced loss allocations on impaired loans.
62
Table of Contents
Other Income
Noninterest income was $80.96 million for the year of 2014, up $14.46 million or 21.74% from the year of 2013. Included in noninterest income for the year of 2014 was the previously mentioned net gain of $8.98 million on the sale of bank premises as well as noncash, before-tax, other-than-temporary impairment charges of $6.48 million on certain investment securities. In addition, net gains on sales and calls of investment securities were $3.36 million for the year of 2014. Included in net losses on investment securities for the year of 2013 were noncash, before-tax other-than-temporary impairment charges of $7.33 million consisting primarily of $7.19 million on pooled trust preferred collateralized debt obligations (Trup Cdos) and $137 thousand on equity securities partially offset by a before-tax, net gain of $1.52 million on the sale of investment securities. Excluding the net gain on the sale of bank premises, the noncash, other-than-temporary impairment charges as well as net gains and losses from sales and calls of investment securities, noninterest income for the year of 2014 increased $2.78 million or 3.85% from the year of 2013.
Revenue from trust income and brokerage commissions increased $1.69 million or 10.30% due mainly to increased brokerage volume and the value of assets under management. United continues its efforts to broaden the scope and activity of its trust and brokerage service areas, especially in the northern Virginia market, to provide additional sources of fee income that complement United’s traditional banking products and services. The northern Virginia market provides a relatively large number of potential customers with high per capita incomes.
Fees from deposit services were $42.37 million for the year of 2014, an increase of $2.13 million or 5.29% from the year of 2013. In particular, debit card income and automated teller machine (ATM) fees increased $1.34 million and $616 thousand due to increased usage mainly from former Virginia Commerce customers. Partially offsetting these increases was a decrease in overdraft or insufficient funds (NSF) fees of $241 thousand.
Income from bank owned life insurance policies decreased $488 thousand or 8.43% in 2014 as compared to 2013 due to proceeds received from large death benefits in the first quarter of 2013.
Mortgage banking income decreased $695 thousand or 27.03% due to decreased mortgage loan production and sales in the secondary market during the year of 2014 as compared to 2013. Mortgage loan sales were $91.99 million in 2014 as compared to $148.79 million in 2013.
Fees from bankcard transactions increased $616 thousand or 17.15% as compared to the year of 2013 due to a higher volume of transactions.
Other Expense
Noninterest expense for the year of 2014 was $239.85 million, an increase of $47.81 million or 24.90% from the year of 2013. This increase is primarily due to the Virginia Commerce acquisition in the first quarter of 2014. Also included in other expense for the year of 2014 was the previously mentioned prepayment penalty of $1.97 million on a FHLB advance.
Employee compensation for the year of 2014 increased $22.75 million or 33.42% from the year of 2013 due mainly to the additional employees from the Virginia Commerce merger. Included in employee compensation were merger severance charges of $3.64 million. In addition, expense for stock options was $2.20 million for the year of 2014 as compared to $1.79 million for the year of 2013.
Employee benefits expense decreased $2.51 million or 10.94% due mainly a decrease of $5.72 million in pension expense due to a change in the discount rate used in the valuation process which more than offset the additional expense from the increased number of employees from the Virginia Commerce acquisition. Also, health insurance costs increased $1.44 million and Federal Insurance Contributions Act (FICA) expense increased $1.14 million.
Net occupancy expense increased $5.98 million or 30.16% for the year of 2014 as compared to the year of 2013. In particular, building rental expense increased $3.64 million, building maintenance increased $780 thousand and building depreciation increased $727 thousand. These increases were due mainly to the additional offices acquired from Virginia Commerce.
63
Table of Contents
Other real estate owned (OREO) expense increased $1.30 million or 20.17% for the year of 2014 as compared to the year of 2013 due to a decline in the fair value of OREO properties.
Equipment expense increased $1.82 million or 23.45% for the year of 2014 as compared to the year of 2013 due mainly to increases in equipment maintenance and depreciation as a result of the Virginia Commerce acquisition.
Data processing expense increased $3.06 million or 26.87% for the year of 2014 as compared to the year of 2013 due to additional processing as a result of the Virginia Commerce acquisition.
Federal Deposit Insurance Corporation (FDIC) insurance expense for the year of 2014 increased $1.38 million or 22.25% due to a higher assessment base as a result of the Virginia Commerce acquisition.
Other expenses increased $12.01 million or 24.99% for the year of 2014 as compared to the year of 2013. Generally, these increases were due mainly to an increase in general operating expenses as a result of the Virginia Commerce acquisition. In particular, business franchise taxes increased $2.70 million, ATM processing expenses increased $1.43 million, amortization on core deposit intangibles increased $2.05 million, advertising expenses increased $983 thousand and loan collection expenses increased $944 thousand. Also included in other expense for the year of 2014 was a donation of $800 thousand to an educational institution.
Income Taxes
For the year ended December 31, 2014, income taxes were $65.00 million, compared to $39.42 million for 2013. United’s effective tax rate was approximately 33.4% and 31.5% for years ended December 31, 2014 and 2013, respectively, as compared to 32.0% for 2012.
| Item 7A. | QUANTITATIVE AND QUALITATIVE DISCLOSURES ABOUT MARKET RISK |
The objective of United’s Asset/Liability Management function is to maintain consistent growth in net interest income within United’s policy guidelines. This objective is accomplished through the management of balance sheet liquidity and interest rate risk exposures due to changes in economic conditions, interest rate levels and customer preferences.
Interest Rate Risk
Management considers interest rate risk to be United’s most significant market risk. Interest rate risk is the exposure to adverse changes in United’s net interest income as a result of changes in interest rates. United’s earnings are largely dependent on the effective management of interest rate risk.
Management of interest rate risk focuses on maintaining consistent growth in net interest income within Board-approved policy limits. United’s Asset/Liability Management Committee (ALCO), which includes senior management representatives and reports to the Board of Directors, monitors and manages interest rate risk to maintain an acceptable level of change to net interest income as a result of changes in interest rates. Policy established for interest rate risk is stated in terms of the change in net interest income over a one-year and two-year horizon given an immediate and sustained increase or decrease in interest rates. The current limits approved by the Board of Directors are structured on a staged basis with each stage requiring specific actions.
United employs a variety of measurement techniques to identify and manage its exposure to changing interest rates. One such technique utilizes an earnings simulation model to analyze the sensitivity of net interest income to movements in interest rates. The model is based on actual cash flows and repricing characteristics for on and off-balance sheet instruments and incorporates market-based assumptions regarding the impact of changing interest rates on the prepayment rate of certain
64
Table of Contents
assets and liabilities. The model also includes executive management projections for activity levels in product lines offered by United. Assumptions based on the historical behavior of deposit rates and balances in relation to changes in interest rates are also incorporated into the model. Rate scenarios could involve parallel or nonparallel shifts in the yield curve, depending on historical, current, and expected conditions, as well as the need to capture any material effects of explicit or embedded options. These assumptions are inherently uncertain and, as a result, the model cannot precisely measure net interest income or precisely predict the impact of fluctuations in interest rates on net interest income. Actual results will differ from simulated results due to timing, magnitude and frequency of interest rate changes as well as changes in market conditions and management’s strategies.
Interest sensitive assets and liabilities are defined as those assets or liabilities that mature or are repriced within a designated time frame. The principal function of managing interest rate risk is to maintain an appropriate relationship between those assets and liabilities that are sensitive to changing market interest rates. The difference between rate sensitive assets and rate sensitive liabilities for specified periods of time is known as the “GAP.” Earnings-simulation analysis captures not only the potential of these interest sensitive assets and liabilities to mature or reprice, but also the probability that they will do so. Moreover, earnings-simulation analysis considers the relative sensitivities of these balance sheet items and projects their behavior over an extended period of time. United closely monitors the sensitivity of its assets and liabilities on an on-going basis and projects the effect of various interest rate changes on its net interest margin.
The following table shows United’s estimated consolidated earnings sensitivity profile as of December 31, 2015 and 2014:
| Change in Interest Rates |
Percentage Change in Net Interest Income | |||
| (basis points) |
December 31, 2015 |
December 31, 2014 | ||
| +200 |
(1.18%) | (1.55%) | ||
| +100 |
(0.85%) | (1.31%) | ||
| -100 |
2.62% | 2.90% | ||
| -200 |
—- | —- | ||
Given an immediate, sustained 100 basis point upward shock to the yield curve used in the simulation model, it is estimated that net interest income for United would decrease by 0.85% over one year as of December 31, 2015, as compared to a decrease of 1.31% as of December 31, 2014. A 200 basis point immediate, sustained upward shock in the yield curve would decrease net interest income by an estimated 1.18% over one year as of December 31, 2015, as compared to a decrease of 1.55% as of December 31, 2014. A 100 basis point immediate, sustained downward shock in the yield curve would increase net interest income by an estimated 2.62% over one year as of December 31, 2015 as compared to an increase of 2.90% over one year as of December 31, 2014. With the federal funds rate at 0.50% at December 31, 2015 and 0.25% at December 31, 2014, management believed a 200 basis point immediate, sustained decline in rates was highly unlikely.
This analysis does not include the potential increased refinancing activities, which should lessen the negative impact on net income from falling rates. While it is unlikely market rates would immediately move 100 or 200 basis points upward or downward on a sustained basis, this is another tool used by management and the Board of Directors to gauge interest rate risk. All of these estimated changes in net interest income are and were within the policy guidelines established by the Board of Directors.
To further aid in interest rate management, United’s subsidiary banks are members of the Federal Home Loan Bank (FHLB). The use of FHLB advances provides United with a low risk means of matching maturities of earning assets and interest-bearing funds to achieve a desired interest rate spread over the life of the earning assets. In addition, United uses credit with large regional banks and trust preferred securities to provide funding.
As part of its interest rate risk management strategy, United may use derivative instruments to protect against adverse price or interest rate movements on the value of certain assets or liabilities and on future cash flows. These derivatives commonly consist of interest rate swaps, caps, floors, collars, futures, forward contracts, written and purchased options. Interest rate swaps obligate two parties to exchange one or more payments generally calculated with reference to a fixed or variable rate of interest applied to the notional amount. United accounts for its derivative activities in accordance with the provisions of ASC topic 815, “Derivatives and Hedging.”
65
Table of Contents
Extension Risk
A key feature of most mortgage loans is the ability of the borrower to repay principal earlier than scheduled. This is called a prepayment. Prepayments arise primarily due to sale of the underlying property, refinancing, or foreclosure. In general, declining interest rates tend to increase prepayments, and rising interest rates tend to slow prepayments. Like other fixed-income securities, when interest rates rise, the value of mortgage- related securities generally declines. The rate of prepayments on underlying mortgages will affect the price and volatility of mortgage-related securities and may shorten or extend the effective maturity of the security beyond what was anticipated at the time of purchase. If interest rates rise, United’s holdings of mortgage-related securities may experience reduced returns if the borrowers of the underlying mortgages pay off their mortgages later than anticipated. This is generally referred to as extension risk.
At December 31, 2015, United’s mortgage related securities portfolio had an amortized cost of $788 million, of which approximately $433 million or 55% were fixed rate collateralized mortgage obligations (CMOs). These fixed rate CMOs consisted primarily of planned amortization class (PACs), sequential-pay and accretion directed (VADMs) bonds having an average life of approximately 4.5 years and a weighted average yield of 2.78%, under current projected prepayment assumptions. These securities are expected to have very little extension risk in a rising rate environment. Current models show that an immediate, sustained upward shock of 300 basis points, the average life of these securities would only extend to 5.4 years. The projected price decline of the fixed rate CMO portfolio in rates up 300 basis points would be 13%, or less than the price decline of a 5 year treasury note. By comparison, the price decline of a 30-year current coupon mortgage backed security (MBS) for an immediate, sustained upward shock of 300 basis points would be approximately 17.4%.
United had approximately $258 million in balloon and other securities with a projected yield of 1.99% and a projected average life of 4.4 years on December 31, 2015. This portfolio consisted primarily of Fannie Mae Delegated Underwriting and Servicing (DUS) mortgage backed securities (MBS) with a weighted average loan age (WALA) of 2.7 years and a weighted average maturity (WAM) of 4.7 years.
United had approximately $21 million in 15-year mortgage backed securities with a projected yield of 3.32% and a projected average life of 2.9 years as of December 31, 2015. This portfolio consisted of seasoned 15-year mortgage paper with a weighted average loan age (WALA) of 7 years and a weighted average maturity (WAM) of 7.6 years.
United had approximately $38 million in 20-year mortgage backed securities with a projected yield of 3.00% and a projected average life of 5.7 years on December 31, 2015. This portfolio consisted of seasoned 20-year mortgage paper with a weighted average loan age (WALA) of 3.7 years and a weighted average maturity (WAM) of 15.9 years.
United had approximately $20 million in 30-year mortgage backed securities with a projected yield of 4.05% and a projected average life of 8.2 years on December 31, 2015. This portfolio consisted of seasoned 30-year mortgage paper with a weighted average loan age (WALA) of 5.3 years and a weighted average maturity (WAM) of 29.3 years.
The remaining 2% of the mortgage related securities portfolio at December 31, 2015, included adjustable rate securities (ARMs), 10-year mortgage backed pass-through securities and other fixed rate mortgage backed securities.
66
Table of Contents
MANAGEMENT’S REPORT ON INTERNAL CONTROL OVER FINANCIAL REPORTING
Management of United Bankshares, Inc. (the Company) is responsible for establishing and maintaining effective internal control over financial reporting as defined in Rules 13a-15(f) under the Securities Exchange Act of 1934. The Company’s internal control over financial reporting is designed to provide reasonable assurance to the Company’s management and board of directors regarding the preparation and fair presentation of published financial statements.
Because of its inherent limitations, internal control over financial reporting may not prevent or detect misstatements. Therefore, even those systems determined to be effective can provide only reasonable assurance with respect to financial statement preparation and presentation.
Management assessed the effectiveness of the Company’s internal control over financial reporting as of December 31, 2015. In making this assessment, management used the criteria set forth by the Committee of Sponsoring Organizations of the Treadway Commission (COSO) in Internal Control – Integrated Framework (2013 framework). Based on our assessment, we believe that, as of December 31, 2015, the Company’s internal control over financial reporting is effective based on those criteria.
Ernst & Young LLP, the independent registered public accounting firm who audited the Company’s consolidated financial statements has also issued an attestation report on the effectiveness of the Company’s internal control over financial reporting as of December 31, 2015. Ernst & Young’s report on the effectiveness of the Company’s internal control over financial reporting appears on the following page.
| /s/ Richard M. Adams | /s/ W. Mark Tatterson | |||
| Richard M. Adams, Chairman of the Board and Chief Executive Officer | W. Mark Tatterson, Executive Vice President and Chief Financial Officer |
February 29, 2016
67
Table of Contents
REPORT OF INDEPENDENT REGISTERED PUBLIC ACCOUNTING FIRM
To the Audit Committee of the Board of Directors and the
Shareholders of United Bankshares, Inc.
We have audited United Bankshares, Inc. and subsidiaries’ internal control over financial reporting as of December 31, 2015, based on criteria established in Internal Control—Integrated Framework issued by the Committee of Sponsoring Organizations of the Treadway Commission (2013 framework)(the COSO criteria). United Bankshares, Inc. and subsidiaries’ management is responsible for maintaining effective internal control over financial reporting and for its assessment of the effectiveness of internal control over financial reporting included in the accompanying Management’s Report on Internal Control Over Financial Reporting. Our responsibility is to express an opinion on the company’s internal control over financial reporting based on our audit.
We conducted our audit in accordance with the standards of the Public Company Accounting Oversight Board (United States). Those standards require that we plan and perform the audit to obtain reasonable assurance about whether effective internal control over financial reporting was maintained in all material respects. Our audit included obtaining an understanding of internal control over financial reporting, assessing the risk that a material weakness exists, testing and evaluating the design and operating effectiveness of internal control based on the assessed risk and performing such other procedures as we considered necessary in the circumstances. We believe that our audit provides a reasonable basis for our opinion.
A company’s internal control over financial reporting is a process designed to provide reasonable assurance regarding the reliability of financial reporting and the preparation of financial statements for external purposes in accordance with generally accepted accounting principles. A company’s internal control over financial reporting includes those policies and procedures that (1) pertain to the maintenance of records that, in reasonable detail, accurately and fairly reflect the transactions and dispositions of the assets of the company; (2) provide reasonable assurance that transactions are recorded as necessary to permit preparation of financial statements in accordance with generally accepted accounting principles, and that receipts and expenditures of the company are being made only in accordance with authorizations of management and directors of the company; and (3) provide reasonable assurance regarding prevention or timely detection of unauthorized acquisition, use or disposition of the company’s assets that could have a material effect on the financial statements.
Because of its inherent limitations, internal control over financial reporting may not prevent or detect misstatements. Also, projections of any evaluation of effectiveness to future periods are subject to the risk that controls may become inadequate because of changes in conditions, or that the degree of compliance with the policies or procedures may deteriorate.
In our opinion, United Bankshares, Inc. and subsidiaries maintained, in all material respects, effective internal control over financial reporting as of December 31, 2015, based on the COSO criteria.
We also have audited, in accordance with the standards of the Public Company Accounting Oversight Board (United States), the consolidated balance sheets of United Bankshares, Inc. and subsidiaries as of December 31, 2015 and 2014, and the related consolidated statements of income, comprehensive income, changes in shareholders’ equity, and cash flows for each of the three years in the period ended December 31, 2015 and our report dated February 29, 2016 expressed an unqualified opinion thereon.
| /s/ Ernst & Young LLP |
| Charleston, West Virginia |
| February 29, 2016 |
68
Table of Contents
| Item 8. | FINANCIAL STATEMENTS AND SUPPLEMENTARY DATA |
REPORT OF INDEPENDENT REGISTERED PUBLIC ACCOUNTING FIRM
To the Audit Committee of the Board of Directors and the
Shareholders of United Bankshares, Inc.
We have audited the accompanying consolidated balance sheets of United Bankshares, Inc. and subsidiaries as of December 31, 2015 and 2014, and the related consolidated statements of income, comprehensive income, changes in shareholders’ equity, and cash flows for each of the three years in the period ended December 31, 2015. These financial statements are the responsibility of the Company’s management. Our responsibility is to express an opinion on these financial statements based on our audits.
We conducted our audits in accordance with the standards of the Public Company Accounting Oversight Board (United States). Those standards require that we plan and perform the audit to obtain reasonable assurance about whether the financial statements are free of material misstatement. An audit includes examining, on a test basis, evidence supporting the amounts and disclosures in the financial statements. An audit also includes assessing the accounting principles used and significant estimates made by management, as well as evaluating the overall financial statement presentation. We believe that our audits provide a reasonable basis for our opinion.
In our opinion, the financial statements referred to above present fairly, in all material respects, the consolidated financial position of United Bankshares, Inc. and subsidiaries at December 31, 2015 and 2014, and the consolidated results of their operations and their cash flows for each of the three years in the period ended December 31, 2015, in conformity with U.S. generally accepted accounting principles.
We also have audited, in accordance with the standards of the Public Company Accounting Oversight Board (United States), United Bankshares, Inc.’s internal control over financial reporting as of December 31, 2015, based on criteria established in Internal Control—Integrated Framework issued by the Committee of Sponsoring Organizations of the Treadway Commission (2013 framework) and our report dated February 29, 2016 expressed an unqualified opinion thereon.
| /s/ Ernst & Young LLP |
| Charleston, West Virginia |
| February 29, 2016 |
69
Table of Contents
CONSOLIDATED BALANCE SHEETS
UNITED BANKSHARES, INC. AND SUBSIDIARIES
(Dollars in thousands, except par value)
| December 31 2015 |
December 31 2014 |
|||||||
| Assets |
||||||||
| Cash and due from banks |
$ | 136,690 | $ | 175,713 | ||||
| Interest-bearing deposits with other banks |
719,923 | 576,630 | ||||||
| Federal funds sold |
722 | 721 | ||||||
|
|
|
|
|
|||||
| Total cash and cash equivalents |
857,335 | 753,064 | ||||||
| Securities available for sale at estimated fair value (amortized cost-$1,072,340 at December 31, 2015 and $1,180,016 at December 31, 2014) |
1,066,334 | 1,180,386 | ||||||
| Securities held to maturity (estimated fair value-$36,319 at December 31, 2015 and $36,784 at December 31, 2014) |
39,099 | 39,310 | ||||||
| Other investment securities |
98,749 | 96,344 | ||||||
| Loans held for sale |
10,681 | 8,680 | ||||||
| Loans |
9,398,952 | 9,119,492 | ||||||
| Less: Unearned income |
(14,872) | (14,840) | ||||||
|
|
|
|
|
|||||
| Loans net of unearned income |
9,384,080 | 9,104,652 | ||||||
| Less: Allowance for loan losses |
(75,726) | (75,529) | ||||||
|
|
|
|
|
|||||
| Net loans |
9,308,354 | 9,029,123 | ||||||
| Bank premises and equipment |
73,089 | 77,520 | ||||||
| Goodwill |
710,252 | 709,794 | ||||||
| Accrued interest receivable |
35,801 | 32,334 | ||||||
| Other assets |
378,250 | 402,256 | ||||||
|
|
|
|
|
|||||
| TOTAL ASSETS |
$ | 12,577,944 | $ | 12,328,811 | ||||
|
|
|
|
|
|||||
| Liabilities |
||||||||
| Deposits: |
||||||||
| Noninterest-bearing |
$ | 2,699,958 | $ | 2,591,619 | ||||
| Interest-bearing |
6,641,569 | 6,453,866 | ||||||
|
|
|
|
|
|||||
| Total deposits |
9,341,527 | 9,045,485 | ||||||
| Borrowings: |
||||||||
| Federal funds purchased |
22,230 | 53,840 | ||||||
| Securities sold under agreements to repurchase |
341,661 | 434,155 | ||||||
| Federal Home Loan Bank (FHLB) borrowings |
850,880 | 830,335 | ||||||
| Other long-term borrowings |
223,506 | 222,636 | ||||||
| Reserve for lending-related commitments |
936 | 1,518 | ||||||
| Accrued expenses and other liabilities |
84,569 | 84,682 | ||||||
|
|
|
|
|
|||||
| TOTAL LIABILITIES |
10,865,309 | 10,672,651 | ||||||
| Shareholders’ Equity |
||||||||
| Preferred stock, $1.00 par value; Authorized-50,000,000 shares; none issued |
0 | 0 | ||||||
| Common stock, $2.50 par value; Authorized-100,000,000 shares; issued- 69,626,932 and 69,314,407 at December 31, 2015 and 2014, respectively, including 23,835 and 18,548 shares in treasury at December 31, 2015 and 2014, respectively |
174,067 | 173,286 | ||||||
| Surplus |
752,997 | 742,960 | ||||||
| Retained earnings |
824,603 | 776,311 | ||||||
| Accumulated other comprehensive loss |
(38,212) | (35,764) | ||||||
| Treasury stock, at cost |
(820) | (633) | ||||||
|
|
|
|
|
|||||
| TOTAL SHAREHOLDERS’ EQUITY |
1,712,635 | 1,656,160 | ||||||
|
|
|
|
|
|||||
| TOTAL LIABILITIES AND SHAREHOLDERS’ EQUITY |
$ | 12,577,944 | $ | 12,328,811 | ||||
|
|
|
|
|
|||||
See notes to consolidated financial statements
70
Table of Contents
CONSOLIDATED STATEMENTS OF INCOME
UNITED BANKSHARES, INC. AND SUBSIDIARIES
(Dollars in thousands, except per share data)
| Year Ended December 31 | ||||||||||||
| 2015 | 2014 | 2013 | ||||||||||
| Interest income |
||||||||||||
| Interest and fees on loans |
$ | 387,713 | $ | 383,662 | $ | 286,033 | ||||||
| Interest on federal funds sold and other short-term investments |
1,645 | 954 | 613 | |||||||||
| Interest and dividends on securities: |
||||||||||||
| Taxable |
30,744 | 30,426 | 16,646 | |||||||||
| Tax-exempt |
3,528 | 3,500 | 2,862 | |||||||||
|
|
|
|
|
|
|
|||||||
| Total interest income |
423,630 | 418,542 | 306,154 | |||||||||
| Interest expense |
||||||||||||
| Interest on deposits |
28,023 | 27,461 | 26,531 | |||||||||
| Interest on short-term borrowings |
834 | 1,134 | 895 | |||||||||
| Interest on long-term borrowings |
10,649 | 14,239 | 8,887 | |||||||||
|
|
|
|
|
|
|
|||||||
| Total interest expense |
39,506 | 42,834 | 36,313 | |||||||||
|
|
|
|
|
|
|
|||||||
| Net interest income |
384,124 | 375,708 | 269,841 | |||||||||
| Provision for loan losses |
22,574 | 21,937 | 19,267 | |||||||||
|
|
|
|
|
|
|
|||||||
| Net interest income after provision for loan losses |
361,550 | 353,771 | 250,574 | |||||||||
| Other income |
||||||||||||
| Fees from trust and brokerage services |
19,085 | 18,141 | 16,447 | |||||||||
| Fees from deposit services |
37,962 | 42,372 | 40,245 | |||||||||
| Bankcard fees and merchant discounts |
4,786 | 4,207 | 3,591 | |||||||||
| Other service charges, commissions, and fees |
2,141 | 2,049 | 2,247 | |||||||||
| Income from bank-owned life insurance |
5,557 | 5,300 | 5,788 | |||||||||
| Income from mortgage banking |
2,507 | 1,876 | 2,571 | |||||||||
| Net gain on sale of bank premises |
0 | 8,976 | 0 | |||||||||
| Other income |
1,433 | 1,153 | 1,426 | |||||||||
| Total other-than-temporary impairment losses |
(113) | 1,935 | (860) | |||||||||
| Portion of loss recognized in other comprehensive income |
66 | (8,413) | (6,472) | |||||||||
|
|
|
|
|
|
|
|||||||
| Net other-than-temporary impairment losses |
(47) | (6,478) | (7,332) | |||||||||
| Net gains on sales/calls of investment securities |
202 | 3,366 | 1,523 | |||||||||
|
|
|
|
|
|
|
|||||||
| Net investment securities gains (losses) |
155 | (3,112) | (5,809) | |||||||||
|
|
|
|
|
|
|
|||||||
| Total other income |
73,626 | 80,962 | 66,506 | |||||||||
| Other expense |
||||||||||||
| Employee compensation |
88,123 | 90,823 | 68,074 | |||||||||
| Employee benefits |
27,086 | 20,457 | 22,970 | |||||||||
| Net occupancy expense |
24,301 | 25,796 | 19,818 | |||||||||
| Other real estate owned (OREO) expense |
3,613 | 7,740 | 6,441 | |||||||||
| Equipment expense |
9,034 | 9,565 | 7,748 | |||||||||
| Data processing expense |
14,867 | 14,455 | 11,394 | |||||||||
| Bankcard processing expense |
1,505 | 1,391 | 1,332 | |||||||||
| FDIC insurance expense |
8,367 | 7,565 | 6,188 | |||||||||
| Prepayment penalty on FHLB advance |
0 | 1,971 | 0 | |||||||||
| Other expense |
54,791 | 60,084 | 48,071 | |||||||||
|
|
|
|
|
|
|
|||||||
| Total other expense |
231,687 | 239,847 | 192,036 | |||||||||
|
|
|
|
|
|
|
|||||||
| Income before income taxes |
203,489 | 194,886 | 125,044 | |||||||||
| Income taxes |
65,530 | 64,998 | 39,416 | |||||||||
|
|
|
|
|
|
|
|||||||
| Net income |
$ | 137,959 | $ | 129,888 | $ | 85,628 | ||||||
|
|
|
|
|
|
|
|||||||
71
Table of Contents
CONSOLIDATED STATEMENTS OF INCOME
UNITED BANKSHARES, INC. AND SUBSIDIARIES
(Dollars in thousands, except per share data)
| Year Ended December 31 | ||||||||||||
| 2015 | 2014 | 2013 | ||||||||||
| Earnings per common share: |
||||||||||||
| Basic |
$ | 1.99 | $ | 1.93 | $ | 1.70 | ||||||
|
|
|
|
|
|
|
|||||||
| Diluted |
$ | 1.98 | $ | 1.92 | $ | 1.70 | ||||||
|
|
|
|
|
|
|
|||||||
| Dividends per common share |
$ | 1.29 | $ | 1.28 | $ | 1.25 | ||||||
|
|
|
|
|
|
|
|||||||
| Average outstanding shares: |
||||||||||||
| Basic |
69,334,849 | 67,404,254 | 50,353,452 | |||||||||
| Diluted |
69,625,531 | 67,648,673 | 50,426,078 | |||||||||
See notes to consolidated financial statements
72
Table of Contents
CONSOLIDATED STATEMENTS OF COMPREHENSIVE INCOME
UNITED BANKSHARES, INC. AND SUBSIDIARIES
(Dollars in thousands)
| Year Ended December 31 | ||||||||||||
| 2015 | 2014 | 2013 | ||||||||||
| Net income |
$ | 137,959 | $ | 129,888 | $ | 85,628 | ||||||
| Change in net unrealized (loss) gain on available-for-sale (AFS) securities, net of tax |
(4,068) | 24,788 | 6,452 | |||||||||
| Accretion of the net unrealized loss on the transfer of AFS securities to held-to-maturity (HTM) securities, net of tax |
5 | 5 | 5 | |||||||||
| Change in defined benefit pension plan, net of tax |
1,615 | (17,510) | 16,244 | |||||||||
|
|
|
|
|
|
|
|||||||
| Comprehensive income, net of tax |
$ | 135,511 | $ | 137,171 | $ | 108,329 | ||||||
|
|
|
|
|
|
|
|||||||
73
Table of Contents
CONSOLIDATED STATEMENT OF CHANGES IN SHAREHOLDERS’ EQUITY
UNITED BANKSHARES, INC. AND SUBSIDIARIES
(Dollars in thousands, except per share data)
| Accumulated | ||||||||||||||||||||||||||||
| Common Stock | Other | Total | ||||||||||||||||||||||||||
| Par | Retained | Comprehensive | Treasury | Shareholders’ | ||||||||||||||||||||||||
| Shares | Value | Surplus | Earnings | Income (Loss) | Stock | Equity | ||||||||||||||||||||||
|
|
|
|||||||||||||||||||||||||||
| Balance at January 1, 2013 |
50,867,630 | $127,169 | $ | 238,739 | $ | 712,299 | $ | (65,748) | $ | (20,208) | $992,251 | |||||||||||||||||
| Net income |
0 | 0 | 0 | 85,628 | 0 | 0 | 85,628 | |||||||||||||||||||||
| Other comprehensive income, net of tax |
0 | 0 | 0 | 0 | 22,701 | 0 | 22,701 | |||||||||||||||||||||
|
|
|
|||||||||||||||||||||||||||
| Total comprehensive income, net of tax |
108,329 | |||||||||||||||||||||||||||
| Stock based compensation expense |
0 | 0 | 1,786 | 0 | 0 | 0 | 1,786 | |||||||||||||||||||||
| Purchase of treasury stock (1,596 shares) |
0 | 0 | 0 | 0 | 0 | (93) | (93) | |||||||||||||||||||||
| Distribution of treasury stock for deferred compensation plan (3,827 shares) |
0 | 0 | 0 | 0 | 0 | 77 | 77 | |||||||||||||||||||||
| Cash dividends ($1.25 per share) |
0 | 0 | 0 | (62,982) | 0 | 0 | (62,982) | |||||||||||||||||||||
| Grant of restricted stock (52,825 shares) |
0 | 0 | (1,819) | 0 | 0 | 1,819 | 0 | |||||||||||||||||||||
| Forfeiture of restricted stock (1,664 shares) |
0 | 0 | 57 | 0 | 0 | (57) | 0 | |||||||||||||||||||||
| Common stock options exercised (100,302 shares) |
0 | 0 | (1,089) | 0 | 0 | 3,453 | 2,364 | |||||||||||||||||||||
|
|
|
|||||||||||||||||||||||||||
| Balance at December 31, 2013 |
50,867,630 | 127,169 | 237,674 | 734,945 | (43,047) | (15,009) | 1,041,732 | |||||||||||||||||||||
| Net income |
0 | 0 | 0 | 129,888 | 0 | 0 | 129,888 | |||||||||||||||||||||
| Other comprehensive income, net of tax |
0 | 0 | 0 | 0 | 7,283 | 0 | 7,283 | |||||||||||||||||||||
|
|
|
|||||||||||||||||||||||||||
| Total comprehensive income, net of tax |
137,171 | |||||||||||||||||||||||||||
| Stock based compensation expense |
0 | 0 | 2,195 | 0 | 0 | 0 | 2,195 | |||||||||||||||||||||
| Acquisition of Virginia Commerce Bancorp, Inc. (18,330,347 shares) |
18,330,347 | 45,826 | 506,436 | 0 | 0 | 0 | 552,262 | |||||||||||||||||||||
| Purchase of treasury stock (749 shares) |
0 | 0 | 0 | 0 | 0 | (25) | (25) | |||||||||||||||||||||
| Distribution of treasury stock for deferred compensation plan (3,640 shares) |
0 | 0 | 0 | 0 | 0 | 81 | 81 | |||||||||||||||||||||
| Cash dividends ($1.28 per share) |
0 | 0 | 0 | (88,522) | 0 | 0 | (88,522) | |||||||||||||||||||||
| Grant of restricted stock (66,949 shares) |
0 | 0 | (2,305) | 0 | 0 | 2,305 | 0 | |||||||||||||||||||||
| Forfeiture of restricted stock (3,528 shares) |
0 | 0 | 122 | 0 | 0 | (122) | 0 | |||||||||||||||||||||
| Common stock options exercised (468,933 shares) |
116,430 | 291 | (1,162) | 0 | 0 | 12,137 | 11,266 | |||||||||||||||||||||
|
|
|
|||||||||||||||||||||||||||
| Balance at December 31, 2014 |
69,314,407 | 173,286 | 742,960 | 776,311 | (35,764) | (633) | 1,656,160 | |||||||||||||||||||||
| Net income |
0 | 0 | 0 | 137,959 | 0 | 0 | 137,959 | |||||||||||||||||||||
| Other comprehensive income, net of tax |
0 | 0 | 0 | 0 | (2,448) | 0 | (2,448) | |||||||||||||||||||||
|
|
|
|||||||||||||||||||||||||||
| Total comprehensive income, net of tax |
135,511 | |||||||||||||||||||||||||||
| Stock based compensation expense |
0 | 0 | 2,484 | 0 | 0 | 0 | 2,484 | |||||||||||||||||||||
| Purchase of treasury stock (17 shares) |
0 | 0 | 0 | 0 | 0 | (1) | (1) | |||||||||||||||||||||
| Distribution of treasury stock for deferred compensation plan (24 shares) |
0 | 0 | 0 | 0 | 0 | 1 | 1 | |||||||||||||||||||||
| Cash dividends ($1.29 per share) |
0 | 0 | 0 | (89,667) | 0 | 0 | (89,667) | |||||||||||||||||||||
| Grant of restricted stock (53,071 shares) |
53,071 | 132 | (132) | 0 | 0 | 0 | 0 | |||||||||||||||||||||
| Forfeiture of restricted stock (5,294 shares) |
0 | 0 | 187 | 0 | 0 | (187) | 0 | |||||||||||||||||||||
| Common stock options exercised (259,454 shares) |
259,454 | 649 | 7,498 | 0 | 0 | 0 | 8,147 | |||||||||||||||||||||
|
|
|
|||||||||||||||||||||||||||
| Balance at December 31, 2015 |
69,626,932 | $ | 174,067 | $ | 752,997 | $ | 824,603 | $ | (38,212) | $ | (820) | $ | 1,712,635 | |||||||||||||||
|
|
|
|
|
|
|
|
|
|
|
|
|
|
|
|||||||||||||||
See notes to consolidated financial statements
74
Table of Contents
|
CONSOLIDATED STATEMENTS OF CASH FLOWS UNITED BANKSHARES, INC. AND SUBSIDIARIES
|
||||||||||||
| (In thousands) | Year Ended December 31 | |||||||||||
| 2015 | 2014 | 2013 | ||||||||||
| OPERATING ACTIVITIES |
||||||||||||
| Net income |
$ | 137,959 | $ | 129,888 | $ | 85,628 | ||||||
| Adjustments to reconcile net income to net cash provided by operating activities: |
||||||||||||
| Provision for loan losses |
22,574 | 21,937 | 19,267 | |||||||||
| Depreciation, amortization and accretion |
746 | 1,574 | 11,679 | |||||||||
| Loss (gain) on sales of bank premises, OREO and equipment |
181 | (8,523) | 592 | |||||||||
| (Gain) loss on securities |
(155) | 3,112 | 5,809 | |||||||||
| Loans originated for sale |
(145,836) | (96,437) | (135,260) | |||||||||
| Proceeds from sales of loans |
146,342 | 93,869 | 151,357 | |||||||||
| Gain on sales of loans |
(2,507) | (1,876) | (2,571) | |||||||||
| Stock-based compensation |
2,484 | 2,195 | 1,786 | |||||||||
| Deferred income tax expense |
1,729 | 10,097 | 2,990 | |||||||||
| Increase in cash surrender value of bank-owned life insurance policies |
(5,557) | (3,375) | (6,043) | |||||||||
| Amortization of net periodic pension costs |
4,380 | 432 | 4,094 | |||||||||
| Changes in: |
||||||||||||
| Interest receivable |
(3,467) | 1,708 | (364) | |||||||||
| Other assets |
21,663 | (5,356) | 9,721 | |||||||||
| Accrued expenses and other liabilities |
(2,245) | (4,460) | (6,486) | |||||||||
|
|
|
|
|
|
|
|||||||
| NET CASH PROVIDED BY OPERATING ACTIVITIES |
178,291 | 144,785 | 142,199 | |||||||||
|
|
|
|
|
|
|
|||||||
| INVESTING ACTIVITIES |
||||||||||||
| Proceeds from maturities and calls of held to maturity securities |
1,056 | 1,518 | 2,479 | |||||||||
| Purchases of held to maturity securities |
(1,000) | 0 | 0 | |||||||||
| Proceeds from sales of securities available for sale |
7,316 | 94,249 | 14,352 | |||||||||
| Proceeds from maturities and calls of securities available for sale |
183,950 | 440,240 | 683,913 | |||||||||
| Purchases of securities available for sale |
(85,249) | (445,477) | (845,908) | |||||||||
| Redemption of bank-owned life insurance policies |
1,974 | 8,930 | 2,573 | |||||||||
| Purchases of bank premises and equipment |
(5,263) | (8,876) | (5,995) | |||||||||
| Proceeds from sales of bank premises and equipment |
866 | 11,430 | 203 | |||||||||
| Acquisition of Virginia Commerce Bancorp, Inc., net of cash paid |
0 | 97,296 | 0 | |||||||||
| Proceeds from sales and redemptions of other investment securities |
19,845 | 52,804 | 27,648 | |||||||||
| Purchases of other investment securities |
(22,181) | (61,275) | (40,237) | |||||||||
| Net change in loans |
(291,025) | (395,638) | (212,137) | |||||||||
|
|
|
|
|
|
|
|||||||
| NET CASH USED IN INVESTING ACTIVITIES |
(189,711) | (204,799) | (373,109) | |||||||||
|
|
|
|
|
|
|
|||||||
| FINANCING ACTIVITIES |
||||||||||||
| Cash dividends paid |
(88,864) | (82,496) | (62,434) | |||||||||
| Excess tax benefits from stock-based compensation arrangements |
1,023 | 73 | 331 | |||||||||
| Acquisition of treasury stock |
(1) | (2) | (93) | |||||||||
| Proceeds from exercise of stock options |
7,871 | 9,878 | 2,364 | |||||||||
| Distribution of treasury stock for deferred compensation plan |
1 | 81 | 77 | |||||||||
| Repayment of long-term Federal Home Loan Bank borrowings |
(794,455) | (436,734) | (54,342) | |||||||||
| Proceeds of long-term Federal Home Loan Bank borrowings |
705,000 | 790,000 | 345,000 | |||||||||
| Redemption of issued trust preferred securities |
0 | (28,676) | 0 | |||||||||
| Changes in: |
||||||||||||
| Time deposits |
(135,674) | 262,989 | (220,640) | |||||||||
| Other deposits |
433,414 | 140,266 | 89,395 | |||||||||
| Federal funds purchased, securities sold under agreements to repurchase and other short-term borrowings |
(12,624) | (258,918) | 115,792 | |||||||||
|
|
|
|
|
|
|
|||||||
| NET CASH PROVIDED BY FINANCING ACTIVITIES |
115,691 | 396,461 | 215,450 | |||||||||
|
|
|
|
|
|
|
|||||||
| INCREASE (DECREASE) IN CASH AND CASH EQUIVALENTS |
104,271 | 336,447 | (15,460) | |||||||||
| CASH AND CASH EQUIVALENTS AT BEGINNING OF YEAR |
753,064 | 416,617 | 432,077 | |||||||||
|
|
|
|
|
|
|
|||||||
| CASH AND CASH EQUIVALENTS AT END OF YEAR |
$ | 857,335 | $ | 753,064 | $ | 416,617 | ||||||
|
|
|
|
|
|
|
|||||||
See notes to consolidated financial statements
75
Table of Contents
NOTES TO CONSOLIDATED FINANCIAL STATEMENTS
UNITED BANKSHARES, INC. AND SUBSIDIARIES
December 31, 2015
NOTE A—SUMMARY OF SIGNIFICANT ACCOUNTING POLICIES
Nature of Operations: United Bankshares, Inc. (United, the Company) is a multi-bank holding company headquartered in Charleston, West Virginia. United considers all of West Virginia to be included in its market area. This area includes the five largest West Virginia Metropolitan Statistical Areas (MSA): the Parkersburg MSA, the Charleston MSA, the Huntington MSA, the Morgantown MSA and the Wheeling MSA. United serves the Ohio counties of Lawrence, Belmont, Jefferson and Washington and Fayette county in Pennsylvania primarily because of their close proximity to the Ohio and Pennsylvania borders and United banking offices located in those counties or in nearby West Virginia. United’s Virginia markets include the Maryland, northern Virginia and Washington, D.C. MSA, the Winchester MSA, the Harrisonburg MSA, and the Charlottesville MSA. United considers all of the above locations to be the primary market area for the business of its banking subsidiaries.
Operating Segments: United’s business activities are confined to one reportable segment which is community banking. As a community banking entity, United offers a full range of products and services through various delivery channels.
Basis of Presentation: The consolidated financial statements and the notes to consolidated financial statements include the accounts of United Bankshares, Inc. and its wholly owned subsidiaries. All significant intercompany accounts and transactions have been eliminated in the consolidated financial statements.
At the close of business on January 31, 2014, United acquired Virginia Commerce Bancorp, Inc. (Virginia Commerce), a Virginia corporation headquartered in Arlington, Virginia. The transaction was accounted for using the acquisition method and their results of operations have been included in the United’s consolidated financial statements as of the acquisition date.
United determines whether it has a controlling financial interest in an entity by first evaluating whether the entity is a voting interest entity or a variable interest entity (VIE) under U.S. generally accepted accounting principles. Voting interest entities are entities in which the total equity investment at risk is sufficient to enable the entity to finance itself independently and provides the equity holders with the obligation to absorb losses, the right to receive residual returns and the right to make decisions about the entity’s activities. United consolidates voting interest entities in which it has all, or at least a majority of, the voting interest. As defined in applicable accounting standards, VIEs are entities that lack one or more of the characteristics of a voting interest entity. A controlling financial interest in a VIE is present when an enterprise has both the power to direct the activities of the VIE that most significantly impact the VIE’s economic performance and an obligation to absorb losses or the right to receive benefits that could potentially be significant to the VIE. The enterprise with a controlling financial interest, known as the primary beneficiary, consolidates the VIE. United’s wholly owned and indirect wholly owned statutory trust subsidiaries are VIEs for which United is not the primary beneficiary. Accordingly, its accounts are not included in United’s consolidated financial statements.
The accounting and reporting policies of United conform with U.S. generally accepted accounting principles. In preparing the consolidated financial statements, management is required to make estimates and assumptions that affect the amounts reported in the financial statements and accompanying notes. Actual results could differ from those estimates. To conform to the 2015 presentation, certain reclassifications have been made to prior period amounts, which had no impact on net income, comprehensive income or shareholders’ equity. In the opinion of management, all adjustments necessary for a fair presentation of financial position and results of operations have been made. Such adjustments are of a normal and recurring nature.
The Company has evaluated events and transactions subsequent to December 31, 2015 through the date these financial statements were issued. Based on definitions and requirements of generally accepted accounting principles for “Subsequent Events,” the Company has not identified any events that would require adjustments to, or disclosure in the financial statements.
Cash and Cash Equivalents: United considers cash and due from banks, interest-bearing deposits with other banks and federal funds sold as cash and cash equivalents.
76
Table of Contents
Securities: Management determines the appropriate classification of securities at the time of purchase. Debt securities that United has the positive intent and the ability to hold to maturity are carried at amortized cost. Securities to be held for indefinite periods of time and all marketable equity securities are classified as available for sale and carried at estimated fair value. Unrealized gains and losses on securities classified as available for sale are carried as a separate component of Accumulated Other Comprehensive Income (Loss), net of deferred income taxes.
Gains or losses on sales of securities are recognized by the specific identification method and are reported in securities gains and losses within noninterest income of the Consolidated Statements of Income. United reviews available-for-sale and held-to-maturity securities on a quarterly basis for possible impairment. United determines whether a decline in fair value below the amortized cost basis of a security is other-than-temporary. This determination requires significant judgment. In making this judgment, United’s review includes an analysis of the facts and circumstances of each individual investment such as the severity of loss, the length of time the fair value has been below cost, the expectation for that security’s performance, the creditworthiness of the issuer, recent changes in external credit ratings, and the assessment of collection of the security’s contractual amounts from the issuer or issuers. If United intends to sell, or it is more likely than not that United will be required to sell an impaired debt security before recovery of its amortized cost basis less any current period credit loss, other-than-temporary impairment is recognized in earnings. The credit loss is defined as the difference between the present value of cash flows expected to be collected (discounted at the contractual rate) and the amortized cost basis. The amount recognized in earnings is equal to the entire difference between the security’s amortized cost basis and its fair value at the balance sheet date. If United does not intend to sell, and it is not more likely than not that United will be required to sell the impaired debt security prior to recovery of its amortized cost basis less any current-period credit loss, the other-than-temporary impairment is separated into the following: 1) the amount representing the credit loss, which is recognized within noninterest income of the Consolidated Statements of Income, and 2) the amount related to all other factors, which is recognized in other comprehensive income within shareholders’ equity of the Consolidated Balance Sheets.
For equity securities, United evaluates the near-term prospects of the investment in relation to the severity and duration of any impairment and United’s ability and intent to hold these equity securities until a recovery of their fair value to at least the cost basis of the investment. Equity securities that are deemed to be other-than-temporarily impaired are written down to the fair value with the write-down recognized within noninterest income of the Consolidated Statements of Income.
Certain security investments that do not have readily determinable fair values and for which United does not exercise significant influence are carried at cost and are classified as other investment securities on the balance sheet. These cost-method investments are reviewed for impairment at least annually or sooner if events or changes in circumstances indicate the carrying value may not be recoverable.
Securities Purchased Under Resale Agreements and Securities Sold Under Agreements to Repurchase: Securities purchased under agreements to resell and securities sold under agreements to repurchase are accounted for as collateralized financing transactions. They are recorded at the amounts at which the securities were acquired or sold plus accrued interest. Securities, generally U.S. government and federal agency securities, pledged as collateral under these financing arrangements cannot be repledged or sold, unless replaced, by the secured party. The fair value of the collateral either received from or provided to a third party is continually monitored and additional collateral is obtained or is requested to be returned to United as deemed appropriate.
Loans: Loans are reported at the principal amount outstanding, net of unearned income. Interest on loans is accrued and credited to operations using methods that produce a level yield on individual principal amounts outstanding. Loan origination and commitment fees and related direct loan origination costs are deferred and amortized as an adjustment of loan yield over the estimated life of the related loan. Loan fees net of costs accreted and included in interest income were $15,798,000, $16,697,000 and $7,427,000 for the years of 2015, 2014 and 2013, respectively. The accrual of interest income on commercial and most consumer loans generally is discontinued when a loan becomes 90 to 120 days past due as to principal or interest. When interest accruals are discontinued, unpaid interest recognized in income in the current year is reversed, and interest accrued in prior years is charged to the allowance for loan losses. Management may elect to continue the accrual of interest when the estimated net realizable value of collateral exceeds the principal balance and accrued interest, and the loan is in the process of collection.
77
Table of Contents
Loans are designated as impaired when, in the opinion of management, based on current information and events, the collection of principal and interest in accordance with the loan contract is doubtful. Consistent with United’s existing method of income recognition for loans, interest on impaired loans, except those classified as nonaccrual, is recognized as income using the accrual method. United’s method of income recognition for impaired loans that are classified as nonaccrual is to recognize interest income on the cash basis or apply the cash receipt to principal when the ultimate collectibility of principal is in doubt.
A loan is categorized as restructured if a concession is granted to provide for a reduction of either interest or principal due to a deterioration in the financial condition of the borrower. A loan classified as restructured will generally retain such classification until the loan is paid in full. However, a restructured one-to-four-family residential mortgage loan that yields a market rate and demonstrates the ability to pay under the terms of the restructured note through a sustained period of repayment performance, which is generally one year, is removed from the restructured classification. Interest income on restructured loans is accrued at the reduced rate and the loan is returned to performing status once the borrower demonstrates the ability to pay under the terms of the restructured note through a sustained period of repayment performance, which is generally six months. The portfolio of restructured loans is monitored monthly.
Loans Acquired Through Transfer: Loans acquired through the completion of a transfer, including loans acquired in a business combination, that have evidence of deterioration of credit quality since origination and for which it is probable, at acquisition, that United will be unable to collect all contractually required payment receivable are initially recorded at fair value (as determined by the present value of expected future cash flows) with no valuation allowance. The difference between the undiscounted cash flows expected at acquisition and the investment in the loan, or the “accretable yield,” is recognized as interest income on a level-yield method over the life of the loan. Contractually required payments for interest and principal that exceed the undiscounted cash flows expected at acquisition, or the “nonaccretable difference,” are not recognized as a yield adjustment or as a loss accrual or a valuation allowance. Increases in expected cash flows subsequent to the initial investment are recognized prospectively through adjustment of the yield on the loan over its remaining life. Decreases in expected cash flows are recognized as impairment. Valuation allowances on these impaired loans reflect only losses incurred after the acquisition (meaning the present value of all cash flows expected at acquisition that ultimately are not to be received).
Loans Held for Sale: Loans held for sale consist of one-to-four family conforming residential real estate loans originated for sale in the secondary market and carried at the lower of cost or fair value determined on an aggregate basis. Generally, United’s current practice is to sell all fixed-rate, one-to-four family conforming residential real estate loans while holding adjustable–rate loans. However, United will sell certain adjustable-rate, one-to-four family conforming residential real estate loans based on prevailing interest rate conditions and interest rate risk management needs. Gains and losses on sales of loans held for sale are included in mortgage banking income.
Allowance for Credit Losses: United maintains an allowance for loan losses and a reserve for lending-related commitments such as unfunded loan commitments and letters of credit. The combined allowance for loan losses and reserve for lending-related commitments are referred to as the allowance for credit losses.
The allowance for loan losses is management’s estimate of the probable credit losses inherent in the loan portfolio. Management’s evaluation of the adequacy of the allowance for loan losses and the appropriate provision for credit losses is based upon a quarterly evaluation of the portfolio. This evaluation is inherently subjective and requires significant estimates, including the amounts and timing of estimated future cash flows, estimated losses on pools of loans based on historical loss experience, and consideration of current economic trends, all of which are susceptible to constant and significant change. The amounts allocated to specific credits and loan pools grouped by similar risk characteristics are reviewed on a quarterly basis and adjusted as necessary based upon subsequent changes in circumstances. In determining the components of the allowance for credit losses, management considers the risk arising in part from, but not limited to, charge-off and delinquency trends, current economic and business conditions, lending policies and procedures, the size and risk characteristics of the loan portfolio, concentrations of credit, and other various factors. Loans deemed to be uncollectible are charged against the allowance for loan losses, while recoveries of previously charged-off amounts are credited to the allowance for loan losses.
78
Table of Contents
In determining the adequacy of the allowance for loan losses, management makes allocations to specific commercial loans classified by management as to risk. Management determines the loan’s risk by considering the borrowers’ ability to repay, the collateral securing the credit and other borrower-specific factors that may impact collectibility. For impaired loans, specific allocations are based on the present value of expected future cash flows using the loan’s effective interest rate, or as a practical expedient, at the loan’s observable market price or the fair value of the collateral if the loan is collateral-dependent. Other commercial loans not specifically reviewed on an individual basis are evaluated based on loan pools, which are grouped by similar risk characteristics using management’s internal risk ratings. Allocations for these commercial loan pools are determined based upon historical loss experience adjusted for current environmental conditions and risk factors and the estimate period it takes for losses to result in a charge-off. Allocations for loans, other than commercial loans, are developed by applying historical loss experience adjusted for current environmental conditions and risk factors to loan pools grouped by similar risk characteristics. The environmental factors considered for each of the loan portfolios includes estimated probable inherent but undetected losses within the portfolio due to uncertainties in economic conditions, delays in obtaining information, including unfavorable information about a borrower’s financial condition, the difficulty in identifying triggering events that correlate perfectly to subsequent loss rates, and risk factors that have not yet fully manifested themselves in loss allocation factors. While allocations are made to specific loans and pools of loans, the allowance is available for all loan losses. Management believes that the allowance for credit losses is adequate to provide for probable losses on existing loans and loan-related commitments based on information currently available.
Bank Premises and Equipment: Bank premises and equipment are stated at cost, less allowances for depreciation and amortization. The provision for depreciation is computed principally by the straight-line method over the estimated useful lives of the respective assets. Useful lives range primarily from three to 15 years for furniture, fixtures and equipment and five to 40 years for buildings and improvements. Leasehold improvements are generally amortized over the lesser of the term of the respective leases or the estimated useful lives of the improvements.
Other Real Estate Owned: At December 31, 2015 and 2014, other real estate owned (OREO) included in other assets in the Consolidated Balance Sheets was $32,228,000 and $38,778,000, respectively. OREO consists of real estate acquired in foreclosure or other settlement of loans. Such assets are carried at the lower of the investment in the assets or the fair value of the assets less estimated selling costs. Any adjustment to the fair value at the date of transfer is charged against the allowance for loan losses. Any subsequent valuation adjustments as well as any costs relating to operating, holding or disposing of the property are recorded in other expense in the period incurred. At December 31, 2015 and 2014, the recorded investment of consumer mortgage loans secured by residential real estate properties for which formal foreclosure proceedings are in process was $234,000 and $311,000, respectively.
Advertising Costs: Advertising costs are generally expensed as incurred and included in Other Expense on the Consolidated Statements of Income. Advertising expense was $4,111,000, $4,759,000 and $3,777,000 for the years of 2015, 2014, and 2013, respectively.
Income Taxes: Income tax expense is the total of the current year income tax due or refundable and the change in deferred tax assets and liabilities (excluding deferred tax assets and liabilities related to business combinations or components of other comprehensive income). Deferred tax assets and liabilities are the expected future tax amounts for the temporary differences between carrying amounts and tax bases of assets and liabilities, computed using enacted tax rates. A valuation allowance, if needed, reduces deferred tax assets to the expected amount most likely to be realized. Realization of deferred tax assets is dependent upon the generation of a sufficient level of future taxable income and recoverable taxes paid in prior years. Although realization is not assured, management believes it is more likely than not that all of the deferred tax assets will be realized. Interest and/or penalties related to income taxes are reported as a component of income tax expense.
For uncertain income tax positions, United records a liability based on a recognition threshold of more-likely-than-not, and a measurement attribute for all tax positions taken on a tax return, in order for those tax positions to be recognized in the financial statements.
United files a consolidated income tax return with its subsidiaries. Federal income tax expense or benefit has been allocated to subsidiaries on a separate return basis.
Intangible Assets: Intangible assets relating to the estimated fair value of the deposit base of the acquired institutions are being amortized on an accelerated basis over a one to seven year period. Management reviews intangible assets on an annual basis, or sooner if indicators of impairment exist, and evaluates changes in facts and circumstances that may indicate impairment in the carrying value. United incurred amortization expense of $3,420,000, $4,021,000 and $1,969,000 in 2015, 2014, and 2013, respectively, related to all intangible assets.
Goodwill is not amortized, but is tested for impairment at least annually or sooner if indicators of impairment exist. Intangible assets with definite useful lives (such as core deposit intangibles) are amortized over their respective estimated useful lives to their estimated residual values, and reviewed for impairment at least annually. Based on the most recent goodwill impairment test, no impairment was noted. As of December 31, 2015 and 2014, total goodwill approximated $710,252,000 and $709,794,000, respectively.
79
Table of Contents
Derivative Financial Instruments: United accounts for its derivative financial instruments in accordance with the Derivatives and Hedging topic of the FASB Accounting Standards Codification. The Derivatives and Hedging topic requires all derivative instruments to be carried at fair value on the balance sheet. United has designated certain derivative instruments to manage interest rate risk as hedge relationships with certain assets, liabilities or cash flows being hedged. Certain derivatives used for interest rate risk management are not designated in a hedge relationship.
Derivative instruments designated in a hedge relationship to mitigate exposure to changes in the fair value of an asset, liability, or firm commitment attributable to a particular risk, such as interest rate risk, are considered fair value hedges. Derivative instruments designated in a hedge relationship to mitigate exposure to variability in expected future cash flows, or other types of forecasted transactions, are considered cash flow hedges.
For a fair value hedge, the fair value of the interest rate swap is recognized on the balance sheet as either a freestanding asset or liability with a corresponding adjustment to the hedged financial instrument. Subsequent adjustments due to changes in the fair value of a derivative that qualifies as a fair value hedge are offset in current period earnings. For a cash flow hedge, the fair value of the interest rate swap is recognized on the balance sheet as either a freestanding asset or liability with a corresponding adjustment to other comprehensive income within shareholders’ equity, net of tax. Subsequent adjustments due to changes in the fair value of a derivative that qualifies as a cash flow hedge are offset to other comprehensive income, net of tax. The portion of a hedge that is ineffective is recognized immediately in earnings.
At inception of a hedge relationship, United formally documents the hedged item, the particular risk management objective, the nature of the risk being hedged, the derivative being used, how effectiveness of the hedge will be assessed and how the ineffectiveness of the hedge will be measured. United also assesses hedge effectiveness at inception and on an ongoing basis using regression analysis. Hedge ineffectiveness is measured by using the change in fair value method. The change in fair value method compares the change in the fair value of the hedging derivative to the change in the fair value of the hedged exposure, attributable to changes in the benchmark rate.
For derivatives that are not designated in a hedge relationship, changes in the fair value of the derivatives are recognized in earnings in the same period as the change in the fair value.
Stock-Based Compensation: Compensation expense related to stock options and restricted stock awards issued to participants is based upon the fair value of the award at the date of grant. The fair value of stock options is estimated at the date of grant using a binomial lattice option pricing model, while the fair value of restricted stock awards is based upon the stock price at the date of grant. Compensation expense is recognized on a straight line basis over the vesting period for options and the respective period for stock awards.
Stock-based compensation expense was $2,484,000 in 2015, $2,195,000 in 2014 and $1,786,000 in 2013.
Treasury Stock: United records common stock purchased for treasury at cost. At the date of subsequent reissuance, the treasury stock account is reduced by the cost of such stock using the weighted-average cost method.
Trust Assets and Income: Assets held in a fiduciary or agency capacity for customers are not included in the balance sheets since such items are not assets of the company. Trust income is reported on an accrual basis.
Earnings Per Common Share: Basic earnings per common share is calculated by dividing net income by the weighted-average number of shares of common stock outstanding, excluding participating securities, for the respective period. For diluted earnings per common share, the weighted-average number of shares of common stock outstanding, excluding
80
Table of Contents
participating securities, for the respective period is increased by the number of shares of common stock that would be issued assuming the exercise of common stock options which have an exercise price below market price. The dilutive effect of stock options approximated 290,682 shares in 2015, 244,419 shares in 2014 and 72,626 shares in 2013. There are no other common stock equivalents.
Under the 2011 LTI Plan, United may award restricted common shares to key employees and non-employee directors. In the first quarter of 2015 and 2014, United granted 53,071 and 66,949 restricted shares, respectively, to participants with a four-year time-based vesting period. Recipients of restricted shares do not pay any consideration to United for the shares, have the right to vote all shares subject to such grant and receive all dividends with respect to such shares, whether or not the shares have vested. Presently, these nonvested participating securities have an immaterial impact on diluted earnings per share.
The reconciliation of the numerator and denominator of basic earnings per share with that of diluted earnings per share is presented as follows:
| Year Ended December 31 | ||||||||||||
| (Dollars in thousands, except per share) | 2015 | 2014 | 2013 | |||||||||
| Distributed earnings allocated to common stock |
$ | 89,497 | $ | 88,353 | $ | 62,982 | ||||||
| Undistributed earnings allocated to common stock |
48,218 | 41,305 | 22,512 | |||||||||
|
|
|
|
|
|
|
|||||||
| Net earnings allocated to common shareholders |
$ | 137,715 | $ | 129,658 | $ | 85,494 | ||||||
|
|
|
|
|
|
|
|||||||
| Average common shares outstanding |
69,334,849 | 67,404,254 | 50,353,452 | |||||||||
| Equivalents from stock options |
290,682 | 244,419 | 72,626 | |||||||||
|
|
|
|
|
|
|
|||||||
| Average diluted shares outstanding |
69,625,531 | 67,648,673 | 50,426,078 | |||||||||
|
|
|
|
|
|
|
|||||||
| Earnings per basic common share |
$ | 1.99 | $ | 1.93 | $ | 1.70 | ||||||
| Earnings per diluted common share |
$ | 1.98 | $ | 1.92 | $ | 1.70 | ||||||
Fair Value Measurements: United determines the fair values of its financial instruments based on the fair value hierarchy established in ASC topic 820, which also clarifies that fair value of certain assets and liabilities is an exit price, representing the amount that would be received to sell an asset or paid to transfer a liability in an orderly transaction between market participants.
The Fair Value Measurements and Disclosures topic specifies a hierarchy of valuation techniques based on whether the inputs to those valuation techniques are observable or unobservable. Observable inputs reflect market data obtained from independent sources, while unobservable inputs reflect United’s market assumptions.
The three levels of the fair value hierarchy based on these two types of inputs are as follows:
| Level 1 | - | Valuation is based on quoted prices in active markets for identical assets and liabilities. | ||
| Level 2 | - | Valuation is based on observable inputs including quoted prices in active markets for similar assets and liabilities, quoted prices for identical or similar assets and liabilities in less active markets, and model-based valuation techniques for which significant assumptions can be derived primarily from or corroborated by observable data in the market. | ||
| Level 3 | - | Valuation is based on model-based techniques that use one or more significant inputs or assumptions that are unobservable in the market. | ||
When determining the fair value measurements for assets and liabilities, United looks to active and observable markets to price identical assets or liabilities whenever possible and classifies such items in Level 1. When identical assets and liabilities are not traded in active markets, United looks to market observable data for similar assets and liabilities and classifies such items as Level 2. Nevertheless, certain assets and liabilities are not actively traded in observable markets and United must use alternative valuation techniques using unobservable inputs to determine a fair value and classifies such items as Level 3. For assets and liabilities that are not actively traded, the fair value measurement is based primarily upon
81
Table of Contents
estimates that require significant judgment. Therefore, the results may not be realized in an actual sale or immediate settlement of the asset or liability. Additionally, there are inherent weaknesses in any calculation technique, and changes in the underlying assumptions used, including discount rates and estimates of future cash flows, could significantly affect the results of current or future values. The level within the fair value hierarchy is based on the lowest level of input that is significant in the fair value measurement.
Recent Accounting Pronouncements: In September 2015, the FASB issued ASU 2015-16, “Simplifying the Accounting for Measurement-Period Adjustments” associated with a business combination, as part of its simplification initiative. ASU 2015-16 requires an acquirer to “recognize adjustments to provisional amounts that are identified during the measurement period in the reporting period in which the adjustment amounts are determined.” In addition, the acquirer must record, in the financial statements for the same period, “the effect on earnings of changes in depreciation, amortization, or other income effect, if any, as a result of the change to the provisional amounts, calculated as if the accounting had been completed at the acquisition date.” Entities must also “present separately on the face of the income statement or disclose in the notes the portion of the amount recorded in the current-period earnings by line item that would have been recorded in previous reporting periods if the adjustment to the provisional amount had been recognized as of the acquisition date.” ASU 2015-16 is effective for United on January 1, 2016 and is not expected to have a significant impact on the Company’s financial condition or results of operation.
In May 2015, the FASB issued ASU 2015-07, “Disclosures for Investment in Certain Entities That Calculate Net Asset Value per Share (or Its Equivalent), a consensus of the FASB Emerging Issues Task Force.” ASU 2015-07 modifies certain provisions of FASB Accounting Standards Codification Topic 820, Fair Value Measurement (ASC 820). ASU 2015-07 eliminates the requirement to categorize investments in the fair value hierarchy if an investment’s fair value is measured based on net asset value (NAV) per share (or its equivalent) using the practical expedient. The reporting entities will no longer be required to provide the related fair value disclosures for these securities but instead, will be required to disclose information to help users understand the nature of the investments as well as risks, including whether it is probable that the amount realized on the sale of the investments would differ from net asset value. ASU 2015-07 is effective for United on January 1, 2016 and is not expected to have a significant impact on the Company’s financial condition or results of operation.
In April 2015, the FASB issued ASU 2015-04, “Compensation – Retirement Benefits: Practical Expedient for the Measurement Date of an Employer’s Defined Benefit Obligation and Plan Assets.” ASU 2015-04 gives an employer whose fiscal year-end does not coincide with a calendar month-end the ability, as a practical expedient, to measure defined benefit retirement obligations and related plan assets as of the month-end that is closest to its fiscal year-end. ASU 2015-04 also provides guidance on accounting for contributions to the plan and significant events that require a remeasurement that occur during the period between a month-end measurement and the employer’s fiscal year-end. ASU 2015-04 is effective for United on January 1, 2016 and is not expected to have a significant impact on the Company’s financial condition or results of operation.
In April 2015, the FASB issued ASU 2015-03, “Simplifying the Presentation of Debt Issuance Costs.” Under ASU 2015-03, debt issuance costs are required to be presented as a direct deduction of debt balances on the statement of financial condition, similar to the presentation of debt discounts. ASU 2015-03 is limited to simplifying the presentation of debt issuance costs and does not change the recognition and measurement guidance for debt issuance costs. ASU 2015-03 is effective for United on January 1, 2016 and is not expected to have a significant impact on the Company’s financial condition or results of operation.
In February 2015, the FASB issued ASU 2015-02, “Amendments to the Consolidation Analysis.” ASU 2015-02 improves targeted areas of the consolidation guidance and reduces the number of consolidation models. The new consolidation standard eliminates the deferral of FAS 167 and makes changes to both the variable interest model and the voting model in ASC 810. ASU 2015-02 affects all entities, could change consolidation conclusions and may trigger additional disclosures. ASU 2015-02 is effective for United on January 1, 2016 and is not expected to have a significant impact on the Company’s financial condition or results of operation.
In January 2015, the FASB issued ASU 2015-01, “Income Statement, Extraordinary and Unusual Items (Subtopic 225-20).” ASU 2015-01 eliminates the separate presentation of extraordinary items but does not change the requirement to disclose material items that are unusual or infrequent in nature. Eliminating the concept of extraordinary items will allow entities to no longer have to assess whether a particular event or transaction is both unusual in nature and infrequent in occurrence. ASU 2015-01 is effective for United on January 1, 2016 and is not expected to have a significant impact on the Company’s financial condition or results of operation.
82
Table of Contents
In June 2014, the FASB issued ASU 2014-12, “Accounting for Share-Based Payments When the Terms of an Award Provide That a Performance Target Could Be Achieved after the Requisite Service Period.” ASU 2014-12 amends the guidance in FASB ASC 718, “Compensation-Stock Compensation”, to bring consistency to the accounting for share-based payment awards that require a specific performance target to be achieved in order for employees to become eligible to vest in the awards. The amendments affect all entities that grant their employees share-based payments in which the terms of the award provide that a performance target that affects vesting could be achieved after the requisite service period. ASU 2014-12 is effective for United on January 1, 2016, and is not expected to have a significant impact on the Company’s financial condition or results of operation.
In May 2014, the FASB issued ASU 2014-09, “Revenue from Contracts with Customers (Topic 606).” ASU 2014-09 supersedes the revenue recognition requirements in Accounting Standards Codification Topic 605, “Revenue Recognition”, and most industry-specific guidance throughout the Accounting Standards Codification. The amendments require an entity to recognize revenue upon the transfer of promised goods or services to customers in an amount that reflects the consideration to which the entity expects to be entitled in exchange for those goods and services. The new revenue recognition standard sets forth a five step principle-based approach for determining revenue recognition. In April 2015, the FASB voted to defer the effective date of ASU 2014-09 by one-year for both public and private companies, and gave both public and private companies the option to “early” adopt using the original effective dates. ASU 2014-09 now will be effective for United on January 1, 2018 with early adoption permitted on January 1, 2017. Management is currently evaluating this guidance to determine the impact on the Company’s financial condition or results of operation.
NOTE B—MERGERS AND ACQUISITIONS
Bank of Georgetown
On November 9, 2015, United announced the signing of a definite merger agreement with Bank of Georgetown, a privately held community bank headquartered in Washington, D.C. Bank of Georgetown had $1.2 billion in assets as of December 31, 2015. With this transaction, United continues to strengthen its franchise and enhance its existing footprint in the D.C. Metro Region. United will acquire 100% of the outstanding shares of Bank of Georgetown in exchange for common shares of United. The exchange ratio will be fixed at 0.9313 of United’s shares for each share of Bank of Georgetown which equates to $37.00 per share, based on the 15-day average price of $39.73 for United’s stock prior to the announcement. The transaction is expected to close in mid-2016, pending regulatory approvals and approval of Bank of Georgetown’s shareholders.
Virginia Commerce Bancorp, Inc.
At the close of business on January 31, 2014 (Acquisition Date), United acquired 100% of the outstanding common stock of Virginia Commerce Bancorp, Inc. (Virginia Commerce) of Arlington, Virginia. The acquisition of Virginia Commerce significantly enhances United’s existing footprint in the Washington, D.C. Metropolitan Statistical Area. The results of operations of Virginia Commerce are included in the consolidated results of operations from the date of acquisition.
At consummation, Virginia Commerce had assets of $2,769,716,000, loans of $2,065,490,000 and deposits of $2,018,962,000. The transaction was accounted for under the purchase acquisition method of accounting and accordingly, assets acquired, liabilities assumed and consideration exchanged were recorded at estimated fair value on the Acquisition Date.
The aggregate purchase price was $585,533,000, including common stock issued valued at $547,894,000, stock options exchanged valued at $4,368,000, $33,263,000 paid in cash to redeem the warrant held by the U.S. Department of the Treasury (the Treasury) issued by Virginia Commerce in connection with the TARP Capital Purchase Program and $8,000 paid in cash to holders of Virginia Commerce common stock and restricted stock in lieu of fractional shares of United common stock. The cash portion of the purchase price was funded by cash on hand. The purchase price of the warrant was based on its fair market as agreed upon by United and the Treasury. As a result of the purchase by United, the warrant has
83
Table of Contents
been canceled. The number of shares issued in the transaction was 18,330,347, which were valued based on the closing market price of $29.89 for United’s common shares on January 31, 2014. The purchase price has been allocated to the identifiable tangible and intangible assets resulting in additions to goodwill and core deposit intangibles of $335,644,000 and $17,143,000, respectively. The core deposit intangibles are being amortized over ten years. Because the consideration paid was greater than the net fair value of the acquired assets and liabilities, the Company recorded goodwill as part of the acquisition. None of the goodwill from the Virginia Commerce acquisition is deductible for tax purposes. As a result of the merger, United recorded a downward fair value adjustment of $88,129,000 on the loans acquired from Virginia Commerce, a downward fair value adjustment of $1,708,000 on certain other real estate owned properties, a premium on interest-bearing deposits of $6,007,000, a premium on term securities sold under agreements to repurchase of $3,700,000 and a discount of $16,384,000 on junior subordinated debt securities. The discount and premium amounts are being amortized or accreted on an accelerated basis over each asset’s or liability’s estimated remaining life at the time of acquisition. At December 31, 2015, the securities sold under agreements to repurchase has an estimated remaining life of 0.58 years while the discount on the junior subordinated debt securities has an estimated remaining life of 18.58 years. The premium on interest-bearing deposits has been fully accreted. United assumed $109,000 of liabilities to provide severance benefits to terminated employees of Virginia Commerce which has no remaining balance as of December 31, 2015.
In many cases, determining the estimated fair value of the acquired assets and assumed liabilities required United to estimate cash flows expected to result from those assets and liabilities and to discount those cash flows at appropriate rates of interest. The most significant of those determinations related to the fair valuation of acquired loans. The fair value of the acquired loans was based on the present value of the expected cash flows. Periodic principal and interest cash flows were adjusted for expected losses and prepayments, then discounted to determine the present value and summed to arrive at the estimated fair value. For such loans, the excess of cash flows expected at acquisition over the estimated fair value is recognized as interest income over the remaining lives of the loans. The difference between contractually required payments at acquisition and the cash flows expected to be collected at acquisition reflects the impact of estimated credit losses and other factors, such as prepayments. In accordance with GAAP, there was no carry-over of Virginia Commerce’s previously established allowance for loan losses. As a result, standard industry coverage ratios with regard to the allowance for credit losses are less meaningful after the acquisition of Virginia Commerce.
The acquired loans were divided into loans with evidence of credit quality deterioration, which are accounted for under ASC topic 310-30 (acquired impaired) and loans that do not meet this criteria, which are accounted for under ASC topic 310-20 (acquired performing). Acquired impaired loans have experienced a deterioration of credit quality from origination to acquisition for which it is probable that United will be unable to collect all contractually required payments receivable, including both principal and interest. Subsequent decreases in the expected cash flows require United to evaluate the need for additions to the Company’s allowance for credit losses. Subsequent improvements in expected cash flows generally result in the recognition of additional interest income over the then remaining lives of the loans.
In conjunction with the Virginia Commerce merger, the acquired loan portfolio was accounted for at fair value as follows:
| (In thousands) | January 31, 2014 |
|||
| Contractually required principal and interest at acquisition |
$ | 2,685,339 | ||
| Contractual cash flows not expected to be collected |
(396,024) | |||
|
|
|
|||
| Expected cash flows at acquisition |
2,289,315 | |||
| Interest component of expected cash flows |
(274,539) | |||
|
|
|
|||
| Basis in acquired loans at acquisition – estimated fair value |
$ | 2,014,776 | ||
|
|
|
|||
Included in the above table is information related to acquired impaired loans. Specifically, contractually required principal and interest, cash flows expected to be collected and estimated fair value of acquired impaired loans were $427,858,000, $189,277,000, and $179,199,000, respectively.
The following table shows the consideration paid for Virginia Commerce’s common equity and the amounts of acquired identifiable assets and liabilities assumed as of the Acquisition Date.
84
Table of Contents
| (Dollars in thousands) | ||||
| Purchase price: |
||||
| Value of common shares issued (18,330,347 shares) |
$ | 547,894 | ||
| Fair value of stock options assumed |
4,368 | |||
| Cash to redeem the Treasury warrant |
33,263 | |||
| Cash for fractional shares |
8 | |||
|
|
|
|||
| Total purchase price |
585,533 | |||
|
|
|
|||
| Identifiable assets: |
||||
| Cash and cash equivalents |
130,569 | |||
| Investment securities |
476,541 | |||
| Loans |
2,014,776 | |||
| Premises and equipment |
10,786 | |||
| Core deposit intangibles |
17,143 | |||
| Other assets |
104,131 | |||
|
|
|
|||
| Total identifiable assets |
$ | 2,753,946 | ||
| Identifiable liabilities: |
||||
| Deposits |
$ | 2,024,969 | ||
| Short-term borrowings |
263,816 | |||
| Long-term borrowings |
204,335 | |||
| Other liabilities |
11,395 | |||
|
|
|
|||
| Total identifiable liabilities |
2,504,515 | |||
|
|
|
|||
| Net assets acquired including identifiable intangible assets |
249,431 | |||
|
|
|
|||
| Resulting goodwill |
$ | 336,102 | ||
|
|
|
|||
The following table provides a reconciliation of goodwill:
| (In thousands) | ||||
| Goodwill at December 31, 2014 |
$ | 709,794 | ||
| Addition to goodwill from Virginia Commerce acquisition |
458 | |||
|
|
|
|||
| Goodwill at December 31, 2015 |
$ | 710,252 | ||
|
|
|
|||
NOTE C—INVESTMENT SECURITIES
The following is a summary of the amortized cost and estimated fair values of securities available for sale.
| December 31, 2015 | ||||||||||||||||||||
| (In thousands) | Amortized Cost |
Gross Unrealized Gains |
Gross Unrealized Losses |
Estimated Fair Value |
Cumulative OTTI in AOCI (1) |
|||||||||||||||
|
|
|
|||||||||||||||||||
| U.S. Treasury securities and obligations of U.S. Government corporations and agencies |
$ | 71,993 | $ | 1,793 | $ | 0 | $ | 73,786 | $ | 0 | ||||||||||
| State and political subdivisions |
130,685 | 3,144 | 51 | 133,778 | 0 | |||||||||||||||
| Residential mortgage-backed securities |
||||||||||||||||||||
| Agency |
473,109 | 5,580 | 707 | 477,982 | 0 | |||||||||||||||
| Non-agency |
9,119 | 457 | 5 | 9,571 | 458 | |||||||||||||||
| Commercial mortgage-backed securities |
||||||||||||||||||||
| Agency |
305,990 | 1,843 | 1,898 | 305,935 | 0 | |||||||||||||||
| Asset-backed securities |
3,404 | 0 | 5 | 3,399 | 0 | |||||||||||||||
| Trust preferred collateralized debt obligations |
49,386 | 635 | 15,335 | 34,686 | 25,952 | |||||||||||||||
| Single issue trust preferred securities |
13,811 | 249 | 2,367 | 11,693 | 0 | |||||||||||||||
| Other corporate securities |
9,999 | 50 | 0 | 10,049 | 0 | |||||||||||||||
| Marketable equity securities |
4,844 | 637 | 26 | 5,455 | 0 | |||||||||||||||
|
|
|
|||||||||||||||||||
| Total |
$ | 1,072,340 | $ | 14,388 | $ | 20,394 | $ | 1,066,334 | $ | 26,410 | ||||||||||
|
|
|
|||||||||||||||||||
85
Table of Contents
| December 31, 2014 | ||||||||||||||||||||
| (In thousands) | Amortized Cost |
Gross Unrealized Gains |
Gross Unrealized Losses |
Estimated Fair Value |
Cumulative OTTI in AOCI (1) |
|||||||||||||||
|
|
|
|||||||||||||||||||
| U.S. Treasury securities and obligations of U.S. Government corporations and agencies |
$ | 88,559 | $ | 1,425 | $ | 3 | $ | 89,981 | $ | 0 | ||||||||||
| State and political subdivisions |
133,730 | 3,165 | 32 | 136,863 | 0 | |||||||||||||||
| Residential mortgage-backed securities |
||||||||||||||||||||
| Agency |
547,825 | 8,407 | 547 | 555,685 | 0 | |||||||||||||||
| Non-agency |
11,474 | 544 | 0 | 12,018 | 458 | |||||||||||||||
| Commercial mortgage-backed securities |
||||||||||||||||||||
| Agency |
316,707 | 2,393 | 2,001 | 317,099 | 0 | |||||||||||||||
| Asset-backed securities |
8,004 | 23 | 0 | 8,027 | 0 | |||||||||||||||
| Trust preferred collateralized debt obligations |
51,328 | 922 | 12,692 | 39,558 | 25,886 | |||||||||||||||
| Single issue trust preferred securities |
13,760 | 173 | 2,189 | 11,744 | 0 | |||||||||||||||
| Other corporate securities |
4,998 | 137 | 0 | 5,135 | 0 | |||||||||||||||
| Marketable equity securities |
3,631 | 648 | 3 | 4,276 | 0 | |||||||||||||||
|
|
|
|||||||||||||||||||
| Total |
$ | 1,180,016 | $ | 17,837 | $ | 17,467 | $ | 1,180,386 | $ | 26,344 | ||||||||||
|
|
|
|||||||||||||||||||
| (1) | Other-than-temporary impairment in accumulated other comprehensive income. Amounts are before-tax. |
The following is a summary of securities available for sale which were in an unrealized loss position at December 31, 2015 and 2014.
| Less than 12 months | 12 months or longer | |||||||||||||||
| (In thousands) | Fair Value |
Unrealized Losses |
Fair Value |
Unrealized Losses |
||||||||||||
| December 31, 2015 |
||||||||||||||||
| U.S. Treasury securities and obligations of U.S. Government corporations and agencies |
$ | 0 | $ | 0 | $ | 0 | $ | 0 | ||||||||
| State and political subdivisions |
15,550 | 51 | 0 | 0 | ||||||||||||
| Residential mortgage-backed securities |
||||||||||||||||
| Agency |
90,004 | 707 | 0 | 0 | ||||||||||||
| Non-agency |
348 | 5 | 0 | 0 | ||||||||||||
| Commercial mortgage-backed securities |
||||||||||||||||
| Agency |
170,340 | 1,650 | 9,255 | 248 | ||||||||||||
| Asset-backed securities |
3,399 | 5 | 0 | 0 | ||||||||||||
| Trust preferred collateralized debt obligations |
3,304 | 135 | 28,633 | 15,200 | ||||||||||||
| Single issue trust preferred securities |
4,225 | 404 | 3,720 | 1,963 | ||||||||||||
| Marketable equity securities |
986 | 26 | 0 | 0 | ||||||||||||
|
|
|
|
|
|
|
|
|
|||||||||
| Total |
$ | 288,156 | $ | 2,983 | $ | 41,608 | $ | 17,411 | ||||||||
|
|
|
|
|
|
|
|
|
|||||||||
86
Table of Contents
| Less than 12 months | 12 months or longer | |||||||||||||||
| (In thousands) | Fair Value |
Unrealized Losses |
Fair Value |
Unrealized Losses |
||||||||||||
| December 31, 2014 |
||||||||||||||||
| U.S. Treasury securities and obligations of U.S. Government corporations and agencies |
$ | 7,142 | $ | 3 | $ | 0 | $ | 0 | ||||||||
| State and political subdivisions |
11,637 | 32 | 0 | 0 | ||||||||||||
| Residential mortgage-backed securities |
||||||||||||||||
| Agency |
96,550 | 547 | 0 | 0 | ||||||||||||
| Commercial mortgage-backed securities |
||||||||||||||||
| Agency |
21,674 | 56 | 146,897 | 1,945 | ||||||||||||
| Asset-backed securities |
0 | 0 | 0 | 0 | ||||||||||||
| Trust preferred collateralized debt obligations |
0 | 0 | 32,241 | 12,692 | ||||||||||||
| Single issue trust preferred securities |
0 | 0 | 8,080 | 2,189 | ||||||||||||
| Marketable equity securities |
23 | 3 | 0 | 0 | ||||||||||||
|
|
|
|
|
|
|
|
|
|||||||||
| Total |
$ | 137,026 | $ | 641 | $ | 187,218 | $ | 16,826 | ||||||||
|
|
|
|
|
|
|
|
|
|||||||||
Marketable equity securities consist mainly of equity securities of financial institutions and mutual funds within a rabbi trust for the payment of benefits under a deferred compensation plan for certain key officers of United and its subsidiaries. The following table shows the proceeds from maturities, sales and calls of available for sale securities and the gross realized gains and losses on sales and calls of those securities that have been included in earnings as a result of any sales and calls. Gains or losses on sales and calls of available for sale securities were recognized by the specific identification method. The realized losses relate to sales of securities within a rabbi trust for the payment of benefits under a deferred compensation plan for certain key officers and its subsidiaries.
| Year Ended | ||||||||||||
| (In thousands) | 2015 | 2014 | 2013 | |||||||||
| Proceeds from maturities, sales and calls |
$ | 191,266 | $ | 534,489 | $ | 698,264 | ||||||
| Gross realized gains |
143 | 3,592 | 1,259 | |||||||||
| Gross realized losses |
10 | 235 | 43 | |||||||||
At December 31, 2015, gross unrealized losses on available for sale securities were $20,394,000 on 87 securities of a total portfolio of 444 available for sale securities. Securities in an unrealized loss position at December 31, 2015 consisted primarily of pooled trust preferred collateralized debt obligations (Trup Cdos), single issue trust preferred securities and agency commercial mortgage-backed securities. The Trup Cdos and the single issue trust preferred securities relate mainly to securities of financial institutions. The agency commercial mortgage-backed securities relate to income-producing multifamily properties and provide a guaranty of full and timely payments of principal and interest by the issuing agency. In determining whether or not a security is other-than-temporarily impaired (OTTI), management considered the severity and the duration of the loss in conjunction with United’s positive intent and the more likely than not ability to hold these securities to recovery of their cost basis or maturity.
Agency mortgage-backed securities
United’s agency mortgage-backed securities portfolio relates to securities issued by Fannie Mae, Freddie Mac, and Ginnie Mae. The total amortized cost of available for sale agency mortgage securities was $779,099,000 at December 31, 2015. Of the $779,099,000, $305,990,000 was related to agency commercial mortgage securities and $473,109,000 was related to agency residential mortgage securities. Each of the agency mortgage securities provides a guarantee of full and timely payments of principal and interest by the issuing agency. Based upon management’s analysis and judgment, it was determined that none of the agency mortgage-backed securities were other-than-temporarily impaired at December 31, 2015.
87
Table of Contents
Non-agency residential mortgage-backed securities
United’s non-agency residential mortgage-backed securities portfolio relates to securities of various private label issuers. The Company has no exposure to real estate investment trusts (REITS) in its investment portfolio. The total amortized cost of available for sale non-agency residential mortgage securities was $9,119,000 at December 31, 2015. Of the $9,119,000, $1,913,000 was rated above investment grade and $7,206,000 was rated below investment grade. Approximately 29% of the portfolio includes collateral that was originated during the year of 2005 or before. The remaining 71% includes collateral that was originated in the years of 2006 and 2007. The entire portfolio of the non-agency residential mortgage securities are either the senior or super-senior tranches of their respective structure. In determining whether or not the non-agency mortgage-backed securities are other-than-temporarily impaired, management performs an in-depth analysis on each non-agency residential mortgage-backed security on a quarterly basis. The analysis includes a review of the following factors: weighted average loan to value, weighted average maturity, average FICO scores, historical collateral performance, geographic concentration, credit subordination, cross-collateralization, coverage ratios, origination year, full documentation percentage, event risk (repricing), and collateral type. Management completes a quarterly stress test to determine the level of loss protection remaining in each individual security and compares the protection remaining to the future expected performance of the underlying collateral. Additionally, management utilizes a third-party cash flow model to perform a cash flow test for each bond below investment grade. The model produces a bond specific set of cash flows based upon assumptions input by management. The input assumptions that are incorporated include the projected constant default rate (CDR) of the underlying mortgages, the loss severity upon default, and the prepayment rate on the underlying mortgage collateral. CDR and loss severities are forecasted by management after full evaluation of the underlying collateral including recent performance statistics. Therefore, based upon management’s analysis and judgment, there was no additional credit-related or noncredit-related other-than-temporary impairment recognized on the non-agency residential mortgage-backed securities at December 31, 2015.
Single issue trust preferred securities
The majority of United’s single-issue trust preferred portfolio consists of obligations from large cap banks (i.e. banks with market capitalization in excess of $10 billion). Management reviews each issuer’s current and projected earnings trends, asset quality, capitalization levels, and other key factors. Upon completing the review for the fourth quarter of 2015, it was determined that none of the single issue securities were other-than-temporarily impaired. All single-issue trust preferred securities are currently receiving interest payments. The available for sale single issue trust preferred securities’ ratings ranged from a low of B+ to a high of BBB-. The amortized cost of available for sale single issue trust preferred securities as of December 31, 2015 consisted of $2,999,000 in investment grade bonds, $5,129,000 in split-rated bonds and $5,683,000 in below investment grade bonds. All of the below investment grade bonds were in an unrealized loss position for twelve months or longer as of December 31, 2015.
Trust preferred collateralized debt obligations (Trup Cdos)
In order to determine how and when the Company recognizes OTTI, the Company first assesses its intentions regarding any sale of securities as well as the likelihood that it would be required to sell prior to recovery of the amortized cost. As of December 31, 2015, the Company has determined that it does not intend to sell any pooled trust preferred security and that it is not more likely than not that the Company will be required to sell such securities before recovery of their amortized cost.
To determine a net realizable value and assess whether other-than-temporary impairment existed, management performed detailed cash flow analysis to determine whether, in management’s judgment, it was more likely that United would not recover the entire amortized cost basis of the security. The Company discounts the security-specific cash flow projection at the security-specific interest rate and compares the present value to the amortized cost. Management’s cash flow analysis was performed for each security and considered the current deferrals and defaults within the underlying collateral, the likelihood that current deferrals would cure or ultimately default, potential future deferrals and defaults, potential prepayments, cash reserves, excess interest spread, credit analysis of the underlying collateral and the priority of payments in the cash flow structure. The underlying collateral analysis for each issuer took into consideration multiple factors including capital adequacy, earnings trends and asset quality. After completing its analysis of estimated cash flows, management determined that none of the Trup Cdos experienced an adverse change in cash flows during the fourth quarter of 2015, as the expected discounted cash flows from these particular securities were greater than or equal to the discounted cash flows originally expected at purchase or from the previous date of other-than-temporary impairment (cash flows are discounted at the contractual coupon rate for purposes of assessing OTTI).
88
Table of Contents
There was no credit-related other-than-temporary impairment recognized in earnings for the fourth quarter of 2015 related to these securities. The total credit-related other-than-temporary impairment recognized in earnings during 2015 related to these securities was $34,000, compared to $6,478,000 in 2014. At December 31, 2015, the balance of noncredit-related other-than-temporary impairment recognized on United’s Trup Cdo portfolio was $25,952,000 as compared to $25,886,000 at December 31, 2014.
The amortized cost of available for sale Trup Cdos in an unrealized loss position for twelve months or longer as of December 31, 2015 consisted of $4,573,000 in investment grade bonds and $42,700,000 in below investment grade bonds.
The following is a summary of the available for sale Trup Cdos as of December 31, 2015.
| Amortized Cost | ||||||||||||||||||||||||||
| Class | Amortized Cost |
Fair Value |
Unrealized Loss |
Investment Grade |
Split Rated |
Below Investment Grade |
||||||||||||||||||||
| (In thousands) | ||||||||||||||||||||||||||
| Senior – Bank |
$ | 6,714 | $ | 5,850 | $ | 864 | $ | 4,573 | $ | 0 | $ | 2,141 | ||||||||||||||
| Mezzanine —Bank (now in senior position) |
11,388 | 8,564 | 2,824 | 0 | 0 | 11,388 | ||||||||||||||||||||
| Mezzanine – Bank |
26,091 | 16,730 | 9,361 | 0 | 0 | 26,091 | ||||||||||||||||||||
| Mezzanine – Bank & Insurance (combination) |
5,193 | 3,542 | 1,651 | 0 | 0 | 5,193 | ||||||||||||||||||||
|
|
|
|
|
|||||||||||||||||||||||
| Totals |
$ | 49,386 | $ | 34,686 | $ | 14,700 | $ | 4,573 | $ | 0 | $ | 44,813 | ||||||||||||||
|
|
|
|
|
|||||||||||||||||||||||
While a large difference remains between the fair value and amortized cost, the Company believes the remaining unrealized losses are related to the illiquid market for Trup Cdos rather than an adverse change in expected cash flows. The expected future cash flow substantiates the return of the remaining amortized cost of the security. The Company believes the following evidence supports the position that the remaining unrealized loss is related to the illiquid market for Trup Cdos:
| • | The market for new issuance of Trup Cdos was robust from 2000 to 2007 with an estimated $60 billion in new issuance. The new market issuances came to an abrupt halt in 2007. |
| • | The secondary market for Trup Cdos ultimately became illiquid and although the market has improved, trading activity remains limited on these securities. In making this determination, the Company holds discussions with institutional traders to identify trends in the number and type of transactions related to the Trup Cdos. |
| • | The presence of a below-investment grade rating severely limits the pool of available buyers and contributes to the illiquidity of the market. |
| • | Trup Cdos have a more complex structure than most debt instruments, making projections of tranche returns difficult for non-specialists in the product. Deferral features available to the underlying issuers within each pool are unique to these securities. Additionally, it can be difficult for market participants to predict whether deferrals will ultimately cure or ultimately default. Due to the lack of transparency, market participants will require a higher risk premium, thus resulting in higher required discount rates. |
| • | The variability of cash flows at the time the securities were originated was expected to be very limited. Due to the financial crisis, Trup Cdos have experienced more substantive variability of cash flows compared to expectations, resulting in a higher risk premium when evaluating discount rates. |
| • | The limited, yet relevant, observable inputs indicate that market yield requirements for Trup Cdos, on a credit-adjusted basis, remained very high relative to discount rates at purchase and compared to other similarly rated debt securities. |
Overall, the Company believes the lack of new issuances, illiquid secondary market, limited pool of buyers, below investment grade ratings, and complex structures are the key drivers of the remaining unrealized losses in the Company’s Trup Cdos and the robust expected cash flow analysis substantiates the return of the remaining amortized cost under ASC 320.
Management also considered the ratings of the Company’s bonds in its portfolio and the extent of downgrades in United’s impairment analysis. However, management considered it imperative to independently perform its own credit analysis based on cash flows as described. The ratings of the investment grade Trup Cdos in the table above range from a low of BBB- to a high of Aaa. The below investment grade Trup Cdos range from a low of C to a high of Ba1.
89
Table of Contents
On the Trup Cdos that have not been deemed to be other-than-temporarily impaired, the collateralization ratios range from a low of 98.1% to a high of 305.5%, with a median of 155.0%, and a weighted average of 210.0%. The collateralization ratio is defined as the current performing collateral in a security, divided by the current balance of the specific tranche the Company owns, plus any debt which is senior or pari passu with the Company’s security’s priority level. Performing collateral excludes the balance of any issuer that has either defaulted or has deferred its interest payment. It is not uncommon for the collateralization of a security that is not other-than-temporarily impaired to be less than 100% due to the excess spread built into the securitization structure.
Except for the debt securities that have already been deemed to be other-than-temporarily impaired, management does not believe any other individual security with an unrealized loss as of December 31, 2015 is other-than-temporarily impaired. For these securities, United believes the decline in value resulted from changes in market interest rates, credit spreads and liquidity, not a change in the expected contractual cash flows. Based on a review of each of the securities in the investment portfolio, management concluded that it expected to recover the amortized cost basis of the investment in such securities.
Equity securities
The cost of United’s equity securities was $4,844,000 at December 31, 2015. For equity securities, management has evaluated the near-term prospects of the investment in relation to the severity and duration of any impairment and based on that evaluation, management determined that one equity security was other-than-temporarily impaired at December 31, 2015. The credit-related other-than-temporary impairment recognized in earnings for the fourth quarter of 2015 related to this security was $13,000. Except for the equity security that has already been deemed to be other-than-temporarily impaired, management does not believe any other individual security with an unrealized loss as of December 31, 2015 is other-than-temporarily impaired.
Other investment securities (cost method)
During the fourth quarter of 2015, United also evaluated all of its cost method investments to determine if certain events or changes in circumstances during the fourth quarter of 2015 had a significant adverse effect on the fair value of any of its cost method securities. United determined that there were no events or changes in circumstances during the fourth quarter which would have an adverse effect on the fair value of any of its cost method securities. Therefore, no impairment was recorded.
Below is a progression of the credit losses on securities which United has recorded other-than-temporary charges. These charges were recorded through earnings and other comprehensive income.
| (In thousands) | Year
Ended December 31 |
|||||||||||
| 2015 | 2014 | 2013 | ||||||||||
| Balance of cumulative credit losses at beginning of period |
$ | 23,739 | $ | 40,663 | $ | 39,012 | ||||||
| Additions for credit losses recognized in earnings during the period: |
||||||||||||
| Credit losses on securities for which OTTI was not previously recognized |
0 | 0 | 0 | |||||||||
| Additional credit losses on securities for which OTTI was previously recognized |
34 | 6,442 | 4,865 | |||||||||
| Reductions for securities sold or paid off during the period |
0 | (23,366) | (3,214) | |||||||||
|
|
|
|
|
|
|
|||||||
| Balance of cumulative credit losses at end of period |
$ | 23,773 | $ | 23,739 | $ | 40,663 | ||||||
|
|
|
|
|
|
|
|||||||
The amortized cost and estimated fair value of securities available for sale at December 31, 2015 by contractual maturity are shown below. Expected maturities may differ from contractual maturities because the issuers may have the right to call or prepay obligations without penalties.
Maturities of mortgage-backed securities with an amortized cost of $788,218,000 and an estimated fair value of $793,488,000 at December 31, 2015 are included below based upon contractual maturity.
90
Table of Contents
| Estimated | ||||||||
| (In thousands) | Amortized | Fair | ||||||
| Cost | Value | |||||||
| Due in one year or less |
$ | 10,448 | $ | 10,515 | ||||
| Due after one year through five years |
273,469 | 274,158 | ||||||
| Due after five years through ten years |
213,274 | 216,636 | ||||||
| Due after ten years |
570,305 | 559,570 | ||||||
| Marketable equity securities |
4,844 | 5,455 | ||||||
|
|
|
|
|
|||||
| Total |
$ | 1,072,340 | $ | 1,066,334 | ||||
|
|
|
|
|
|||||
The following is a summary of the amortized cost and estimated fair values of securities held to maturity.
| December 31, 2015 | ||||||||||||||||
| (In thousands) | Amortized Cost |
Gross Unrealized Gains |
Gross Unrealized Losses |
Estimated Fair Value |
||||||||||||
| U.S. Treasury securities and obligations of U.S. Government corporations and agencies |
$ | 10,425 | $ | 860 | $ | 0 | $ | 11,285 | ||||||||
| State and political subdivisions |
9,321 | 21 | 253 | 9,089 | ||||||||||||
| Residential mortgage-backed securities |
||||||||||||||||
| Agency |
35 | 6 | 0 | 41 | ||||||||||||
| Single issue trust preferred securities |
19,298 | 0 | 3,414 | 15,884 | ||||||||||||
| Other corporate securities |
20 | 0 | 0 | 20 | ||||||||||||
|
|
|
|||||||||||||||
| Total |
$ | 39,099 | $ | 887 | $ | 3,667 | $ | 36,319 | ||||||||
|
|
|
|||||||||||||||
| December 31, 2014 | ||||||||||||||||
| (In thousands) | Amortized Cost |
Gross Unrealized Gains |
Gross Unrealized Losses |
Estimated Fair Value |
||||||||||||
| U.S. Treasury securities and obligations of U.S. Government corporations and agencies |
$ | 10,599 | $ | 1,329 | $ | 0 | $ | 11,928 | ||||||||
| State and political subdivisions |
9,369 | 32 | 294 | 9,107 | ||||||||||||
| Residential mortgage-backed securities |
||||||||||||||||
| Agency |
41 | 7 | 0 | 48 | ||||||||||||
| Single issue trust preferred securities |
19,281 | 0 | 3,600 | 15,681 | ||||||||||||
| Other corporate securities |
20 | 0 | 0 | 20 | ||||||||||||
|
|
|
|||||||||||||||
| Total |
$ | 39,310 | $ | 1,368 | $ | 3,894 | $ | 36,784 | ||||||||
|
|
|
|||||||||||||||
Even though the market value of the held-to-maturity investment portfolio is less than its cost, the unrealized loss has no impact on the net worth or regulatory capital requirements of United. As of December 31, 2015, the Company’s two largest held-to-maturity single-issue trust preferred exposures were to Wells Fargo ($9,915,000) and SunTrust Bank ($7,409,000). The two held-to-maturity single-issue trust preferred exposures with at least one rating below investment grade included SunTrust Bank ($7,409,000) and Royal Bank of Scotland ($974,000). Other corporate securities consist mainly of bonds of corporations.
The following table shows the gross realized gains and losses on calls and sales of held to maturity securities that have been included in earnings as a result of those calls and sales. Gains or losses on calls of held to maturity securities are recognized by the specific identification method.
| Year Ended | ||||||||||||
| (In thousands) | 2015 | 2014 | 2013 | |||||||||
| Gross realized gains |
$ | 0 | $ | 9 | $ | 114 | ||||||
| Gross realized losses |
0 | 0 | 0 | |||||||||
91
Table of Contents
The amortized cost and estimated fair value of debt securities held to maturity at December 31, 2015 by contractual maturity are shown below. Expected maturities may differ from contractual maturities because the issuers may have the right to call or prepay obligations with or without call or prepayment penalties.
Maturities of mortgage-backed securities with an amortized cost of $35,000 and an estimated fair value of $41,000 at December 31, 2015 are included below based upon contractual maturity.
| Estimated | ||||||||
| (In thousands) | Amortized | Fair | ||||||
| Cost | Value | |||||||
| Due in one year or less |
$ | 5,029 | $ | 5,121 | ||||
| Due after one year through five years |
9,672 | 10,458 | ||||||
| Due after five years through ten years |
4,045 | 3,794 | ||||||
| Due after ten years |
20,353 | 16,946 | ||||||
|
|
|
|
|
|||||
| Total |
$ | 39,099 | $ | 36,319 | ||||
|
|
|
|
|
|||||
The carrying value of securities pledged to secure public deposits, securities sold under agreements to repurchase, and for other purposes as required or permitted by law, approximated $986,982,000 and $1,081,299,000 at December 31, 2015 and 2014, respectively.
The fair value of mortgage-backed securities is affected by changes in interest rates and prepayment speeds. When interest rates decline, prepayment speeds generally accelerate due to homeowners refinancing their mortgages at lower interest rates. This may result in the proceeds being reinvested at lower interest rates. Rising interest rates may decrease the assumed prepayment speed. Slower prepayment speeds may extend the maturity of the security beyond its estimated maturity. Therefore, investors may not be able to invest at current higher market rates due to the extended expected maturity of the security. United had a net unrealized gain of $5,276,000 at December 31, 2015 and a net unrealized gain of $8,803,000 at December 31, 2014 on all mortgage-backed securities.
The following table sets forth the maturities of all securities (based on amortized cost) at December 31, 2015, and the weighted-average yields of such securities (calculated on the basis of the cost and the effective yields weighted for the scheduled maturity of each security).
| (Dollars in thousands) | Within 1 Year | After 1 But Within 5 Years |
After 5 But Within 10 Years |
After 10 Years | ||||||||||||||||||||||||||||
| Amount | Yield | Amount | Yield | Amount | Yield | Amount | Yield | |||||||||||||||||||||||||
| U.S. Treasury and other U.S. Government agencies and corporations |
||||||||||||||||||||||||||||||||
| $ | 5,029 | 5.62 | % | $ | 38,512 | 2.69 | % | $ | 35,241 | 2.83 | % | $ | 3,636 | 3.99 | % | |||||||||||||||||
| States and political subdivisions (1) |
5,449 | 3.63 | % | 34,654 | 3.24 | % | 35,510 | 4.38 | % | 64,393 | 4.57 | % | ||||||||||||||||||||
| Residential mortgage-backed securities |
||||||||||||||||||||||||||||||||
| Agency |
0 | 0.00 | % | 5,219 | 4.17 | % | 34,547 | 3.04 | % | 433,378 | 2.55 | % | ||||||||||||||||||||
| Non-agency |
0 | 0.00 | % | 2,383 | 5.01 | % | 0 | 0.00 | % | 6,736 | 5.83 | % | ||||||||||||||||||||
| Commercial mortgage-backed |
||||||||||||||||||||||||||||||||
| Agency |
0 | 0.00 | % | 198,970 | 1.73 | % | 107,020 | 2.71 | % | 0 | 0.00 | % | ||||||||||||||||||||
| Asset-backed securities |
0 | 0.00 | % | 3,404 | 0.77 | % | 0 | 0.00 | % | 0 | 0.00 | % | ||||||||||||||||||||
| Trust preferred collateralized debt obligations |
0 | 0.00 | % | 0 | 0.00 | % | 0 | 0.00 | % | 49,386 | 3.04 | % | ||||||||||||||||||||
| Single issue trust preferred securities |
0 | 0.00 | % | 0 | 0.00 | % | 0 | 0.00 | % | 33,109 | 2.38 | % | ||||||||||||||||||||
| Marketable equity securities |
0 | 0.00 | % | 0 | 0.00 | % | 0 | 0.00 | % | 4,844 | 2.41 | % | ||||||||||||||||||||
| Other Corporate securities |
4,999 | 2.73 | % | 0 | 0.00 | % | 5,000 | 6.00 | % | 20 | 0.00 | % | ||||||||||||||||||||
| (1) | Tax-equivalent adjustments (using a 35% federal rate) have been made in calculating yields on obligations of states and political subdivisions. |
There are no securities with a single issuer, other than the U.S. government and its agencies and corporations, the book value of which in the aggregate exceeds 10% of United’s total shareholders’ equity.
92
Table of Contents
NOTE D—LOANS
Major classes of loans are as follows:
| December 31 | ||||||||
| (In thousands) | 2015 | 2014 | ||||||
| Commercial, financial, and agricultural |
||||||||
| Owner-occupied |
$ | 927,746 | $ | 1,016,364 | ||||
| Nonowner-occupied |
2,896,367 | 2,760,189 | ||||||
| Other commercial |
1,602,222 | 1,577,438 | ||||||
|
|
|
|
|
|||||
| Total commercial, financial & agricultural |
5,426,335 | 5,353,991 | ||||||
| Residential real estate |
2,268,685 | 2,263,354 | ||||||
| Construction & land development |
1,273,054 | 1,133,251 | ||||||
| Consumer: |
||||||||
| Bankcard |
11,653 | 10,437 | ||||||
| Other Consumer |
419,225 | 358,459 | ||||||
| Less: Unearned interest |
(14,872) | (14,840) | ||||||
|
|
|
|
|
|||||
| Total Loans, net of unearned interest |
$ | 9,384,080 | $ | 9,104,652 | ||||
|
|
|
|
|
|||||
The table above does not include loans held for sale of $10,681,000 and $8,680,000 at December 31, 2015 and December 31, 2014, respectively. Loans held for sale consist of single-family residential real estate loans originated for sale in the secondary market.
The outstanding balances in the table above include acquired impaired loans with a recorded investment of $148,197,000 or 1.58% of total gross loans at December 31, 2015 and $176,339,000, or 1.93% of total gross loans at December 31, 2014, respectively. The contractual principal in these acquired impaired loans was $208,765,000 and $252,759,000 at December 31, 2015 and 2014, respectively. The balances above do not include future accretable net interest (i.e. the difference between the undiscounted expected cash flows and the recorded investment in the loan) on the acquired impaired loans.
Activity for the accretable yield for the year of 2015 follows.
| (In thousands) | ||||
| Accretable yield at the beginning of the period |
$ | 11,339 | ||
| Accretion (including cash recoveries) |
(11,317 | ) | ||
| Net reclassifications to accretable from non-accretable |
12,867 | |||
| Disposals (including maturities, foreclosures, and charge-offs) |
(733 | ) | ||
|
|
|
|||
| Accretable yield at the ending of the period |
$ | 12,156 | ||
|
|
|
|||
At December 31, 2015 and 2014, loans-in-process of $66,501,000 and $40,279,000 and overdrafts from deposit accounts of $9,234,000 and $7,373,000, respectively, are included within the appropriate loan classifications above.
United’s subsidiary banks have made loans, in the normal course of business, to the directors and officers of United and its subsidiaries, and to their associates. The aggregate dollar amount of these loans was $241,000,000 and $188,516,000 at December 31, 2015 and 2014, respectively. During 2015, $212,848,000 of new loans were made, repayments totaled $160,364,000.
NOTE E—CREDIT QUALITY
Management monitors the credit quality of its loans on an ongoing basis. Measurement of delinquency and past due status are based on the contractual terms of each loan.
For all loan classes, past due loans are reviewed on a monthly basis to identify loans for nonaccrual status. Generally, when collection in full of the principal and interest is jeopardized, the loan is placed on nonaccrual status. The accrual of interest income on commercial and most consumer loans generally is discontinued when a loan becomes 90 to 120 days past due as to principal or interest. However, regardless of delinquency status, if a loan is fully secured and in the process of collection
93
Table of Contents
and resolution of collection is expected in the near term (generally less than 90 days), then the loan will not be placed on nonaccrual status. When interest accruals are discontinued, unpaid interest recognized in income in the current year is reversed, and unpaid interest accrued in prior years is charged to the allowance for loan losses. United’s method of income recognition for loans that are classified as nonaccrual is to recognize interest income on a cash basis or apply the cash receipt to principal when the ultimate collectibility of principal is in doubt. Nonaccrual loans will not normally be returned to accrual status unless all past due principal and interest has been paid and the borrower has evidenced their ability to meet the contractual provisions of the note.
A loan is categorized as a troubled debt restructuring (TDR) if a concession is granted and there is deterioration in the financial condition of the borrower. TDRs can take the form of a reduction of the stated interest rate, splitting a loan into separate loans with market terms on one loan and concessionary terms on the other loan, receipts of assets from a debtor in partial or full satisfaction of a loan, the extension of the maturity date or dates at a stated interest rate lower than the current market rate for new debt with similar risk, the reduction of the face amount or maturity amount of the debt as stated in the instrument or other agreement, the reduction of accrued interest or any other concessionary type of renegotiated debt. As of December 31, 2015, United had TDRs of $23,890,000 as compared to $22,234,000 as of December 31, 2014. Of the $23,890,000 aggregate balance of TDRs at December 31, 2015, $11,949,000 was on nonaccrual status and included in the “Loans on Nonaccrual Status” on the following page. Of the $22,234,000 aggregate balance of TDRs at December 31, 2014, $4,194,000 was on nonaccrual status and included in the “Loans on Nonaccrual Status” on the following page. As of December 31, 2015, there were no commitments to lend additional funds to debtors owing receivables whose terms have been modified in TDRs. At December 31, 2015, United had restructured loans in the amount of $3,852,000 that were modified by a reduction in the interest rate, $7,898,000 that were modified by a combination of a reduction in the interest rate and the principal and $12,140,000 that was modified by a change in terms.
A loan acquired and accounted for under ASC topic 310-30 “Loans and Debt Securities Acquired with Deteriorated Credit Quality” is reported as an accruing loan and a performing asset unless it does not perform in accordance with its restructured contractual provisions.
The following table sets forth United’s troubled debt restructurings that have been restructured during the year ended December 31, 2015 and 2014, segregated by class of loans:
| Troubled Debt Restructurings For the Year Ended December 31, 2015 |
||||||||||||
| (In thousands) | Number of Contracts |
Pre-Modification Outstanding Recorded Investment |
Post-Modification Outstanding Recorded Investment |
|||||||||
| Commercial real estate: |
||||||||||||
| Owner-occupied |
0 | $ | 0 | $ | 0 | |||||||
| Nonowner-occupied |
1 | 669 | 647 | |||||||||
| Other commercial |
3 | 2,942 | 2,918 | |||||||||
| Residential real estate |
0 | 0 | 0 | |||||||||
| Construction & land development |
0 | 0 | 0 | |||||||||
| Consumer: |
||||||||||||
| Bankcard |
0 | 0 | 0 | |||||||||
| Other consumer |
0 | 0 | 0 | |||||||||
|
|
|
|
|
|
|
|||||||
| Total |
4 | $ | 3,611 | $ | 3,565 | |||||||
|
|
|
|
|
|
|
|||||||
| Troubled Debt Restructurings For the Year Ended December 31, 2014 |
||||||||||||
| (In thousands) | Number of Contracts |
Pre-Modification Outstanding Recorded Investment |
Post-Modification Outstanding Recorded Investment |
|||||||||
| Commercial real estate: |
||||||||||||
| Owner-occupied |
0 | $ | 0 | $ | 0 | |||||||
| Nonowner-occupied |
1 | 185 | 183 | |||||||||
| Other commercial |
6 | 14,331 | 14,243 | |||||||||
| Residential real estate |
0 | 0 | 0 | |||||||||
| Construction & land development |
0 | 0 | 0 | |||||||||
| Consumer: |
||||||||||||
| Bankcard |
0 | 0 | 0 | |||||||||
| Other consumer |
0 | 0 | 0 | |||||||||
|
|
|
|
|
|
|
|||||||
| Total |
7 | $ | 14,516 | $ | 14,426 | |||||||
|
|
|
|
|
|
|
|||||||
94
Table of Contents
During 2015, restructured loans of $3,565,000 were modified by a change in terms. During 2014, restructured loans of $5,572,000 were modified by a combination of a reduction in the interest rate and a change in terms. The remaining $8,854,000 of loans restructured during 2014 was modified by a change in terms. In some instances, the post-modification balance on a restructured loan is larger than the pre-modification balance due to the advancement of monies for items such as delinquent taxes on real estate property. The loans were evaluated individually for allocation within United’s allowance for loan losses. The modifications had an immaterial impact on the financial condition and results of operations for United.
No loans restructured during the twelve-month period ended December 31, 2015 subsequently defaulted, resulting in a principal charge-off during the year ended December 31, 2015. The following table presents troubled debt restructurings, by class of loan, that had charge-offs during the year ended December 31, 2014. These loans were restructured during the twelve months ended December 31, 2014 and subsequently defaulted, resulting in a principal charge-off during the year of 2014. Loans modified in a troubled debt restructuring that defaulted with a recorded investment of zero were fully paid down through the sale of foreclosed real estate property prior to period end.
| Year Ended December 31, 2014 |
||||||||
| (In thousands) | Number of Contracts |
Recorded Investment |
||||||
| Troubled Debt Restructurings |
||||||||
| Commercial real estate: |
0 | $ | 0 | |||||
| Owner-occupied |
0 | 0 | ||||||
| Nonowner-occupied |
1 | 475 | ||||||
| Other commercial |
0 | 0 | ||||||
| Residential real estate |
0 | 0 | ||||||
| Construction & land development |
0 | 0 | ||||||
| Consumer: |
0 | 0 | ||||||
| Bankcard |
0 | 0 | ||||||
| Other consumer |
0 | 0 | ||||||
|
|
|
|
|
|||||
| Total |
1 | $ | 475 | |||||
|
|
|
|
|
|||||
The following table sets forth United’s age analysis of its past due loans, segregated by class of loans:
| Age Analysis of Past Due Loans As of December 31, 2015 |
||||||||||||||||||||||||
| (In thousands) | 30-89 Days Past Due |
90 Days or more Past Due |
Total Past Due |
Current & Other (1) |
Total Financing Receivables |
Recorded Investment >90 Days & Accruing |
||||||||||||||||||
| Commercial real estate: |
||||||||||||||||||||||||
| Owner-occupied |
$ | 8,639 | $ | 9,831 | $ | 18,470 | $ | 909,276 | $ | 927,746 | $ | 400 | ||||||||||||
| Nonowner-occupied |
24,209 | 26,126 | 50,335 | 2,846,032 | 2,896,367 | 552 | ||||||||||||||||||
| Other commercial |
14,888 | 33,297 | 48,185 | 1,554,037 | 1,602,222 | 3,643 | ||||||||||||||||||
| Residential real estate |
44,312 | 28,332 | 72,644 | 2,196,041 | 2,268,685 | 4,294 | ||||||||||||||||||
| Construction & land development |
2,412 | 15,416 | 17,828 | 1,255,226 | 1,273,054 | 1,347 | ||||||||||||||||||
| Consumer: |
||||||||||||||||||||||||
| Bankcard |
223 | 168 | 391 | 11,262 | 11,653 | 168 | ||||||||||||||||||
| Other consumer |
9,082 | 1,596 | 10,678 | 408,547 | 419,225 | 1,224 | ||||||||||||||||||
|
|
|
|
|
|
|
|
|
|
|
|
|
|||||||||||||
| Total |
$ | 103,765 | $ | 114,766 | $ | 218,531 | $ | 9,180,421 | $ | 9,398,952 | $ | 11,628 | ||||||||||||
|
|
|
|
|
|
|
|
|
|
|
|
|
|||||||||||||
| (1) | Other includes loans with a recorded investment of $148,197 acquired and accounted for under ASC topic 310-30 “Loans and Debt Securities Acquired with Deteriorated Credit Quality”. |
95
Table of Contents
| Age Analysis of Past Due Loans As of December 31, 2014 |
||||||||||||||||||||||||
| (In thousands) | 30-89 Days Past Due |
90 Days or more Past Due |
Total Past Due |
Current & Other (1) |
Total Financing Receivables |
Recorded Investment >90 Days & Accruing |
||||||||||||||||||
| Commercial real estate: |
||||||||||||||||||||||||
| Owner-occupied |
$ | 4,158 | $ | 13,582 | $ | 17,740 | $ | 998,624 | $ | 1,016,364 | $ | 1,039 | ||||||||||||
| Nonowner-occupied |
10,627 | 14,859 | 25,486 | 2,734,703 | 2,760,189 | 45 | ||||||||||||||||||
| Other commercial |
17,348 | 17,975 | 35,323 | 1,542,115 | 1,577,438 | 3,034 | ||||||||||||||||||
| Residential real estate |
40,793 | 25,544 | 66,337 | 2,197,017 | 2,263,354 | 5,417 | ||||||||||||||||||
| Construction & land development |
5,329 | 17,119 | 22,448 | 1,110,803 | 1,133,251 | 648 | ||||||||||||||||||
| Consumer: |
||||||||||||||||||||||||
| Bankcard |
471 | 114 | 585 | 9,852 | 10,437 | 114 | ||||||||||||||||||
| Other consumer |
8,992 | 1,727 | 10,719 | 347,740 | 358,459 | 1,378 | ||||||||||||||||||
|
|
|
|
|
|
|
|
|
|
|
|
|
|||||||||||||
| Total |
$ | 87,718 | $ | 90,920 | $ | 178,638 | $ | 8,940,854 | $ | 9,119,492 | $ | 11,675 | ||||||||||||
|
|
|
|
|
|
|
|
|
|
|
|
|
|||||||||||||
| (1) | Other includes loans with a recorded investment of $176,339 acquired and accounted for under ASC topic 310-30 “Loans and Debt Securities Acquired with Deteriorated Credit Quality”. |
The following table sets forth United’s nonaccrual loans, segregated by class of loans:
| Loans on Nonaccrual Status | ||||||||
| (In thousands) | December 31, 2015 |
December 31, 2014 |
||||||
| Commercial real estate: |
||||||||
| Owner-occupied |
$ | 9,431 | $ | 12,543 | ||||
| Nonowner-occupied |
25,574 | 14,814 | ||||||
| Other commercial |
29,654 | 14,941 | ||||||
| Residential real estate |
24,038 | 20,127 | ||||||
| Construction & land development |
14,069 | 16,471 | ||||||
| Consumer: |
||||||||
| Bankcard |
0 | 0 | ||||||
| Other consumer |
372 | 349 | ||||||
|
|
|
|
|
|||||
| Total |
$ | 103,138 | $ | 79,245 | ||||
|
|
|
|
|
|||||
United assigns credit quality indicators of pass, special mention, substandard and doubtful to its loans. For United’s loans with a corporate credit exposure, United internally assigns a grade based on the creditworthiness of the borrower. For loans with a consumer credit exposure, United internally assigns a grade based upon an individual loan’s delinquency status. United reviews and updates, as necessary, these grades on a quarterly basis.
Special mention loans, with a corporate credit exposure, have potential weaknesses that deserve management’s close attention. If left uncorrected, these potential weaknesses may result in deterioration of the repayment prospects for the loans or in the Company’s credit position at some future date. Borrowers may be experiencing adverse operating trends (declining revenues or margins) or an ill proportioned balance sheet (e.g., increasing inventory without an increase in sales, high leverage, tight liquidity). Adverse economic or market conditions, such as interest rate increases or the entry of a new competitor, may also support a special mention rating. Nonfinancial reasons for rating a credit exposure special mention include management problems, pending litigation, an ineffective loan agreement or other material structural weakness, and any other significant deviation from prudent lending practices. For loans with a consumer credit exposure, loans that are past due 30-89 days are generally considered special mention.
A substandard loan with a corporate credit exposure is inadequately protected by the current sound worth and paying capacity of the obligor or of the collateral pledged, if any. Loans so classified have a well-defined weakness, or weaknesses, that jeopardize the liquidation of the debt by the borrower. They are characterized by the distinct possibility that the Company will sustain some loss if the deficiencies are not corrected. They require more intensive supervision by management. Substandard loans are generally characterized by current or expected unprofitable operations, inadequate debt
96
Table of Contents
service coverage, inadequate liquidity, or marginal capitalization. Repayment may depend on collateral or other credit risk mitigants. For some substandard loans, the likelihood of full collection of interest and principal may be in doubt and thus, placed on nonaccrual. For loans with a consumer credit exposure, loans that are 90 days or more past due or that have been placed on nonaccrual are considered substandard.
A loan with corporate credit exposure is classified as doubtful if it has all the weaknesses inherent in one classified as substandard with the added characteristic that the weaknesses make collection in full, on the basis of currently existing facts, conditions, and values, highly questionable and improbable. A doubtful loan has a high probability of total or substantial loss, but because of specific pending events that may strengthen the loan, its classification as loss is deferred. Doubtful borrowers are usually in default, lack adequate liquidity or capital, and lack the resources necessary to remain an operating entity. Pending events can include mergers, acquisitions, liquidations, capital injections, the perfection of liens on additional collateral, the valuation of collateral, and refinancing. Generally, there are not any loans with a consumer credit exposure that are classified as doubtful. Usually, they are charged-off prior to such a classification. Loans classified as doubtful are also considered impaired.
The following tables set forth United’s credit quality indicators information, by class of loans:
Credit Quality Indicators
|
Corporate Credit Exposure |
| |||||||||||||||
| As of December 31, 2015 | ||||||||||||||||
| Commercial Real Estate | ||||||||||||||||
| (In thousands) | Owner- occupied |
Nonowner- occupied |
Other Commercial |
Construction & Land Development |
||||||||||||
| Grade: |
||||||||||||||||
| Pass |
$ | 835,082 | $ | 2,710,504 | $ | 1,436,670 | $ | 1,095,238 | ||||||||
| Special mention |
20,391 | 32,249 | 26,148 | 59,100 | ||||||||||||
| Substandard |
72,273 | 153,614 | 136,585 | 118,716 | ||||||||||||
| Doubtful |
0 | 0 | 2,819 | 0 | ||||||||||||
|
|
|
|
|
|
|
|
|
|||||||||
| Total |
$ | 927,746 | $ | 2,896,367 | $ | 1,602,222 | $ | 1,273,054 | ||||||||
|
|
|
|
|
|
|
|
|
|||||||||
Credit Quality Indicators
|
Corporate Credit Exposure |
| |||||||||||||||
| As of December 31, 2014 | ||||||||||||||||
| Commercial Real Estate | ||||||||||||||||
| (In thousands) | Owner- occupied |
Nonowner- occupied |
Other Commercial |
Construction & Land Development |
||||||||||||
| Grade: |
||||||||||||||||
| Pass |
$ | 920,981 | $ | 2,592,783 | $ | 1,407,853 | $ | 966,335 | ||||||||
| Special mention |
26,181 | 48,382 | 20,776 | 64,597 | ||||||||||||
| Substandard |
69,202 | 119,024 | 147,494 | 102,319 | ||||||||||||
| Doubtful |
0 | 0 | 1,315 | 0 | ||||||||||||
|
|
|
|
|
|
|
|
|
|||||||||
| Total |
$ | 1,016,364 | $ | 2,760,189 | $ | 1,577,438 | $ | 1,133,251 | ||||||||
|
|
|
|
|
|
|
|
|
|||||||||
Credit Quality Indicators
|
Consumer Credit Exposure |
| |||||||||||
| As of December 31, 2015 | ||||||||||||
| (In thousands) | Residential Real Estate |
Bankcard | Other Consumer |
|||||||||
| Grade: |
||||||||||||
| Pass |
$ | 2,195,420 | $ | 11,262 | $ | 408,271 | ||||||
| Special mention |
13,494 | 223 | 9,188 | |||||||||
| Substandard |
57,981 | 168 | 1,766 | |||||||||
| Doubtful |
1,790 | 0 | 0 | |||||||||
|
|
|
|
|
|
|
|||||||
| Total |
$ | 2,268,685 | $ | 11,653 | $ | 419,225 | ||||||
|
|
|
|
|
|
|
|||||||
97
Table of Contents
| As of December 31, 2014 | ||||||||||||
| (In thousands) | Residential Real Estate |
Bankcard | Other Consumer |
|||||||||
| Grade: |
||||||||||||
| Pass |
$ | 2,176,655 | $ | 9,852 | $ | 347,442 | ||||||
| Special mention |
18,254 | 471 | 9,113 | |||||||||
| Substandard |
66,973 | 114 | 1,904 | |||||||||
| Doubtful |
1,472 | 0 | 0 | |||||||||
|
|
|
|
|
|
|
|||||||
| Total |
$ | 2,263,354 | $ | 10,437 | $ | 358,459 | ||||||
|
|
|
|
|
|
|
|||||||
Loans are designated as impaired when, in the opinion of management, based on current information and events, the collection of principal and interest in accordance with the loan contract is doubtful. Typically, United does not consider loans for impairment unless a sustained period of delinquency (i.e. 90-plus days) is noted or there are subsequent events that impact repayment probability (i.e. negative financial trends, bankruptcy filings, eminent foreclosure proceedings, etc.). Impairment is evaluated in total for smaller-balance loans of a similar nature and on an individual loan basis for other loans. Consistent with United’s existing method of income recognition for loans, interest on impaired loans, except those classified as nonaccrual, is recognized as income using the accrual method. Impaired loans, or portions thereof, are charged off when deemed uncollectible.
The following table set forth United’s impaired loans information, by class of loans:
| Impaired Loans | ||||||||||||||||||||||||
| December 31, 2015 | December 31, 2014 | |||||||||||||||||||||||
| (In thousands) | Recorded Investment |
Unpaid Principal Balance |
Related Allowance |
Recorded Investment |
Unpaid Principal Balance |
Related Allowance |
||||||||||||||||||
| With no related allowance recorded: |
||||||||||||||||||||||||
| Commercial real estate: |
||||||||||||||||||||||||
| Owner-occupied |
$ | 36,615 | $ | 36,828 | $ | 0 | $ | 37,811 | $ | 37,811 | $ | 0 | ||||||||||||
| Nonowner-occupied |
69,053 | 69,517 | 0 | 48,126 | 48,462 | 0 | ||||||||||||||||||
| Other commercial |
30,433 | 32,158 | 0 | 38,521 | 40,329 | 0 | ||||||||||||||||||
| Residential real estate |
21,431 | 22,329 | 0 | 31,262 | 31,930 | 0 | ||||||||||||||||||
| Construction & land development |
28,245 | 29,953 | 0 | 64,945 | 68,799 | 0 | ||||||||||||||||||
| Consumer: |
||||||||||||||||||||||||
| Bankcard |
0 | 0 | 0 | 0 | 0 | 0 | ||||||||||||||||||
| Other consumer |
32 | 32 | 0 | 41 | 41 | 0 | ||||||||||||||||||
| With an allowance recorded: |
||||||||||||||||||||||||
| Commercial real estate: |
||||||||||||||||||||||||
| Owner-occupied |
$ | 4,555 | $ | 4,555 | $ | 1,253 | $ | 5,014 | $ | 5,014 | $ | 776 | ||||||||||||
| Nonowner-occupied |
7,890 | 7,890 | 1,362 | 6,994 | 6,994 | 797 | ||||||||||||||||||
| Other commercial |
29,486 | 33,127 | 18,269 | 17,554 | 20,554 | 7,168 | ||||||||||||||||||
| Residential real estate |
13,305 | 14,625 | 2,118 | 6,028 | 7,349 | 2,578 | ||||||||||||||||||
| Construction & land development |
14,132 | 20,135 | 4,789 | 10,779 | 14,189 | 3,627 | ||||||||||||||||||
| Consumer: |
||||||||||||||||||||||||
| Bankcard |
0 | 0 | 0 | 0 | 0 | 0 | ||||||||||||||||||
| Other consumer |
0 | 0 | 0 | 0 | 0 | 0 | ||||||||||||||||||
| Total: |
||||||||||||||||||||||||
| Commercial real estate: |
||||||||||||||||||||||||
| Owner-occupied |
$ | 41,170 | $ | 41,383 | $ | 1,253 | $ | 42,825 | $ | 42,825 | $ | 776 | ||||||||||||
| Nonowner-occupied |
76,943 | 77,407 | 1,362 | 55,120 | 55,456 | 797 | ||||||||||||||||||
| Other commercial |
59,919 | 65,285 | 18,269 | 56,075 | 60,883 | 7,168 | ||||||||||||||||||
| Residential real estate |
34,736 | 36,954 | 2,118 | 37,290 | 39,279 | 2,578 | ||||||||||||||||||
| Construction & land development |
42,377 | 50,088 | 4,789 | 75,724 | 82,988 | 3,627 | ||||||||||||||||||
| Consumer: |
||||||||||||||||||||||||
| Bankcard |
0 | 0 | 0 | 0 | 0 | 0 | ||||||||||||||||||
| Other consumer |
32 | 32 | 0 | 41 | 41 | 0 | ||||||||||||||||||
98
Table of Contents
| Impaired Loans | ||||||||||||||||
| For the Year Ended | ||||||||||||||||
| December 31, 2015 | December 31, 2014 | |||||||||||||||
| (In thousands) | Average Recorded Investment |
Interest Income Recognized |
Average Recorded Investment |
Interest Income Recognized |
||||||||||||
| With no related allowance recorded: |
||||||||||||||||
| Commercial real estate: |
||||||||||||||||
| Owner-occupied |
$ | 41,336 | $ | 264 | $ | 36,295 | $ | 877 | ||||||||
| Nonowner-occupied |
68,727 | 1,139 | 58,537 | 953 | ||||||||||||
| Other commercial |
33,510 | 463 | 30,071 | 698 | ||||||||||||
| Residential real estate |
27,224 | 234 | 30,602 | 341 | ||||||||||||
| Construction & land development |
33,167 | 199 | 51,337 | 513 | ||||||||||||
| Consumer: |
||||||||||||||||
| Bankcard |
0 | 0 | 0 | 0 | ||||||||||||
| Other consumer |
35 | 0 | 44 | 0 | ||||||||||||
| With an allowance recorded: |
||||||||||||||||
| Commercial real estate: |
||||||||||||||||
| Owner-occupied |
$ | 4,629 | $ | 122 | $ | 4,461 | $ | 235 | ||||||||
| Nonowner-occupied |
6,954 | 357 | 7,441 | 211 | ||||||||||||
| Other commercial |
20,885 | 580 | 13,701 | 274 | ||||||||||||
| Residential real estate |
9,314 | 41 | 7,986 | 90 | ||||||||||||
| Construction & land development |
12,196 | 252 | 10,721 | 68 | ||||||||||||
| Consumer: |
||||||||||||||||
| Bankcard |
0 | 0 | 0 | 0 | ||||||||||||
| Other consumer |
0 | 0 | 76 | 0 | ||||||||||||
| Total: |
||||||||||||||||
| Commercial real estate: |
||||||||||||||||
| Owner-occupied |
$ | 45,965 | $ | 386 | $ | 40,756 | $ | 1,112 | ||||||||
| Nonowner-occupied |
75,681 | 1,496 | 65,978 | 1,164 | ||||||||||||
| Other commercial |
54,395 | 1,043 | 43,772 | 972 | ||||||||||||
| Residential real estate |
36,538 | 275 | 38,588 | 431 | ||||||||||||
| Construction & land development |
45,363 | 451 | 62,058 | 581 | ||||||||||||
| Consumer: |
||||||||||||||||
| Bankcard |
0 | 0 | 0 | 0 | ||||||||||||
| Other consumer |
35 | 0 | 120 | 0 | ||||||||||||
NOTE F—ALLOWANCE FOR CREDIT LOSSES
The allowance for loan losses is management’s estimate of the probable credit losses inherent in the loan portfolio. For purposes of determining the general allowance, the loan portfolio is segregated by product type to recognize differing risk profiles among categories. It is further segregated by credit grade for non-homogenous loan pools and delinquency for homogeneous loan pools. The outstanding principal balance within each pool is multiplied by historical loss data, the loss emergence period (which is the period of time between the event that triggers a loss and the confirmation and / or charge off of that loss) and certain qualitative factors to derive the general loss allocation per pool. Specific loss allocations are calculated for loans in excess of $500,000 in accordance with ASC topic 310. Risk characteristics of owner-occupied commercial real estate loans and other commercial loans are similar in that they are normally dependent upon the borrower’s internal cash flow from operations to service debt. Nonowner-occupied commercial real estate loans differ in that cash flow to service debt is normally dependent on external income from third parties for use of the real estate such as rents, leases and room rates. Residential real estate loans are dependent upon individual borrowers who are affected by changes in general economic conditions, demand for housing and resulting residential real estate valuation. Construction and land development loans are impacted mainly by demand whether for new residential housing or for retail, industrial, office and other types of commercial construction within a given area. Consumer loan pool risk characteristics are influenced by general, regional and local economic conditions. During the year of 2015, United’s methodology related to the allowance for loan losses was enhanced by estimating the loss emergence period. The impact of this enhancement was not significant.
99
Table of Contents
Loans deemed to be uncollectible are charged against the allowance for loan losses, while recoveries of previously charged-off amounts are credited to the allowance for loan losses. For commercial loans, when a loan or a portion of a loan is identified to contain a loss, a charge-off recommendation is directed to management to charge-off all or a portion of that loan. Generally, any unsecured commercial loan more than six months delinquent in payment of interest must be charged-off in full. If secured, the charge-off is generally made to reduce the loan balance to a level equal to the liquidation value of the collateral when payment of principal and interest is six months delinquent. Any commercial loan, secured or unsecured, on which a principal or interest payment has not been made within 90 days, is reviewed monthly for appropriate action.
For consumer loans, closed-end retail loans that are past due 120 cumulative days delinquent from the contractual due date and open-end loans 180 cumulative days delinquent from the contractual due date are charged-off. Any consumer loan on which a principal or interest payment has not been made within 90 days is reviewed monthly for appropriate action. For a one-to-four family open-end or closed-end residential real estate loan, home equity loan, or high-loan-to-value loan that has reached 180 or more days past due, management evaluates the collateral position and charge-offs any amount that exceeds the value of the collateral. On retail credits for which the borrower is in bankruptcy, all amounts deemed unrecoverable are charged off within 60 days of the receipt of the notification. On retail credits effected by fraud, a loan is charged-off within 90 days of the discovery of the fraud. In the event of the borrower’s death and if repayment within the required timeframe is uncertain, the loan is generally charged-off as soon as the amount of the loss is determined.
For loans acquired through the completion of a transfer, including loans acquired in a business combination, that have evidence of deterioration of credit quality since origination and for which it is probable, at acquisition, that United will be unable to collect all contractually required payment receivable are initially recorded at fair value (as determined by the present value of expected future cash flows) with no valuation allowance. The difference between the undiscounted cash flows expected at acquisition and the investment in the loan, or the “accretable yield,” is recognized as interest income on a level-yield method over the life of the loan. Contractually required payments for interest and principal that exceed the undiscounted cash flows expected at acquisition, or the “nonaccretable difference,” are not recognized as a yield adjustment or as a loss accrual or a valuation allowance. Increases in expected cash flows subsequent to the initial investment are recognized prospectively through adjustment of the yield on the loan over its remaining life. Decreases in expected cash flows are recognized as impairment. Valuation allowances on these impaired loans reflect only losses incurred after the acquisition (meaning the present value of all cash flows expected at acquisition that ultimately are not to be received). The amount of provision for loan losses related to loans acquired that have evidence of deterioration of credit quality was $5,321,000, $1,915,000 and $2,407,000 for the years of 2015, 2014, and 2013, respectively.
A progression of the allowance for loan losses, by portfolio segment, for the year ended December 31, 2015 and 2014 is summarized as follows:
| Allowance for Loan Losses and Carrying Amount of Loans For the Year Ended December 31, 2015 |
||||||||||||||||||||||||||||||||
| (In thousands) | Commercial Real Estate |
Other Commercial |
Residential Real Estate |
Construction & Land Development |
Consumer | Allowance for Estimated Imprecision |
Total | |||||||||||||||||||||||||
| Owner- occupied |
Nonowner- occupied |
|||||||||||||||||||||||||||||||
| Allowance for Loan Losses: |
||||||||||||||||||||||||||||||||
| Beginning balance |
$ | 4,041 | $ | 8,167 | $ | 26,931 | $ | 13,835 | $ | 19,402 | $ | 3,083 | $ | 70 | $ | 75,529 | ||||||||||||||||
| Charge-offs |
4,755 | 1,120 | 10,042 | 6,411 | 862 | 2,309 | 0 | 25,499 | ||||||||||||||||||||||||
| Recoveries |
829 | 74 | 714 | 495 | 511 | 499 | 0 | 3,122 | ||||||||||||||||||||||||
| Provision |
3,522 | (1,812) | 13,725 | 7,229 | (846) | 722 | 34 | 22,574 | ||||||||||||||||||||||||
|
|
|
|
|
|
|
|
|
|
|
|
|
|
|
|
|
|||||||||||||||||
| Ending balance |
$ | 3,637 | $ | 5,309 | $ | 31,328 | $ | 15,148 | $ | 18,205 | $ | 1,995 | $ | 104 | $ | 75,726 | ||||||||||||||||
|
|
|
|
|
|
|
|
|
|
|
|
|
|
|
|
|
|||||||||||||||||
| Ending Balance: individually evaluated for impairment |
$ | 1,253 | $ | 1,362 | $ | 18,269 | $ | 2,119 | $ | 4,789 | $ | 0 | $ | 0 | $ | 27,792 | ||||||||||||||||
| Ending Balance: collectively evaluated for impairment |
$ | 2,384 | $ | 3,947 | $ | 13,059 | $ | 13,029 | $ | 13,416 | $ | 1,995 | $ | 104 | $ | 47,934 | ||||||||||||||||
100
Table of Contents
| Allowance for Loan Losses and Carrying Amount of Loans For the Year Ended December 31, 2015 |
||||||||||||||||||||||||||||||||
| (In thousands) | Commercial Real Estate |
Other Commercial |
Residential Real Estate |
Construction & Land Development |
Consumer | Allowance for Estimated Imprecision |
Total | |||||||||||||||||||||||||
| Owner- occupied |
Nonowner- occupied |
|||||||||||||||||||||||||||||||
| Ending Balance: loans acquired with deteriorated credit quality |
$ | 0 | $ | 0 | $ | 0 | $ | 0 | $ | 0 | $ | 0 | $ | 0 | $ | 0 | ||||||||||||||||
| Financing receivables: |
||||||||||||||||||||||||||||||||
| Ending balance |
$ | 927,746 | $ | 2,896,367 | $ | 1,602,222 | $ | 2,268,685 | $ | 1,273,054 | $ | 430,878 | $ | 0 | $ | 9,398,952 | ||||||||||||||||
| Ending Balance: individually evaluated for impairment |
$ | 12,670 | $ | 26,152 | $ | 35,342 | $ | 17,782 | $ | 15,779 | $ | 0 | $ | 0 | $ | 107,725 | ||||||||||||||||
| Ending Balance: collectively evaluated for impairment |
$ | 888,802 | $ | 2,817,748 | $ | 1,546,018 | $ | 2,237,865 | $ | 1,221,760 | $ | 430,837 | $ | 0 | $ | 9,143,030 | ||||||||||||||||
| Ending Balance: loans acquired with deteriorated credit quality |
$ | 26,274 | $ | 52,467 | $ | 20,862 | $ | 13,038 | $ | 35,515 | $ | 41 | $ | 0 | $ | 148,197 | ||||||||||||||||
| Allowance for Loan Losses and Carrying Amount of Loans For the Year Ended December 31, 2014 |
||||||||||||||||||||||||||||||||
| (In thousands) | Commercial Real Estate |
Other Commercial |
Residential Real Estate |
Construction & Land Development |
Consumer | Allowance for Estimated Imprecision |
Total | |||||||||||||||||||||||||
| Owner- occupied |
Nonowner- occupied |
|||||||||||||||||||||||||||||||
| Allowance for Loan Losses: |
||||||||||||||||||||||||||||||||
| Beginning balance |
$ | 5,653 | $ | 8,992 | $ | 20,917 | $ | 16,694 | $ | 18,953 | $ | 2,945 | $ | 44 | $ | 74,198 | ||||||||||||||||
| Charge-offs |
3,073 | 2,097 | 4,947 | 5,027 | 7,476 | 2,621 | 0 | 25,241 | ||||||||||||||||||||||||
| Recoveries |
2,372 | 268 | 294 | 573 | 685 | 443 | 0 | 4,635 | ||||||||||||||||||||||||
| Provision |
(911) | 1,004 | 10,667 | 1,595 | 7,240 | 2,316 | 26 | 21,937 | ||||||||||||||||||||||||
|
|
|
|
|
|
|
|
|
|
|
|
|
|
|
|
|
|||||||||||||||||
| Ending balance |
$ | 4,041 | $ | 8,167 | $ | 26,931 | $ | 13,835 | $ | 19,402 | $ | 3,083 | $ | 70 | $ | 75,529 | ||||||||||||||||
|
|
|
|
|
|
|
|
|
|
|
|
|
|
|
|
|
|||||||||||||||||
| Ending Balance: individually evaluated for impairment |
$ | 776 | $ | 797 | $ | 7,168 | $ | 2,578 | $ | 3,627 | $ | 0 | $ | 0 | $ | 14,946 | ||||||||||||||||
| Ending Balance: collectively evaluated for impairment |
$ | 3,265 | $ | 7,370 | $ | 19,763 | $ | 11,257 | $ | 15,775 | $ | 3,083 | $ | 70 | $ | 60,583 | ||||||||||||||||
| Ending Balance: loans acquired with deteriorated credit quality |
$ | 0 | $ | 0 | $ | 0 | $ | 0 | $ | 0 | $ | 0 | $ | 0 | $ | 0 | ||||||||||||||||
| Financing receivables: |
||||||||||||||||||||||||||||||||
| Ending balance |
$ | 1,016,364 | $ | 2,760,189 | $ | 1,577,438 | $ | 2,263,354 | $ | 1,133,251 | $ | 368,896 | $ | 0 | $ | 9,119,492 | ||||||||||||||||
101
Table of Contents
| Allowance for Loan Losses and Carrying Amount of Loans For the Year Ended December 31, 2014 |
||||||||||||||||||||||||||||||||
| (In thousands) | Commercial Real Estate |
Other Commercial |
Residential Real Estate |
Construction & Land Development |
Consumer | Allowance for Estimated Imprecision |
Total | |||||||||||||||||||||||||
| Owner- occupied |
Nonowner- occupied |
|||||||||||||||||||||||||||||||
| Ending Balance: individually evaluated for impairment |
$ | 12,869 | $ | 13,733 | $ | 27,491 | $ | 16,189 | $ | 17,168 | $ | 0 | $ | 0 | $ | 87,450 | ||||||||||||||||
| Ending Balance: collectively evaluated for impairment |
$ | 971,408 | $ | 2,692,374 | $ | 1,523,504 | $ | 2,227,605 | $ | 1,071,966 | $ | 368,846 | $ | 0 | $ | 8,855,703 | ||||||||||||||||
| Ending Balance: loans acquired with deteriorated credit quality |
$ | 32,087 | $ | 54,082 | $ | 26,443 | $ | 19,560 | $ | 44,117 | $ | 50 | $ | 0 | $ | 176,339 | ||||||||||||||||
United maintains an allowance for loan losses and a reserve for lending-related commitments such as unfunded loan commitments and letters of credit. The reserve for lending-related commitments of $936,000 and $1,518,000 at December 31, 2015 and December 31, 2014, respectively, is separately classified on the balance sheet and is included in other liabilities. The combined allowance for loan losses and reserve for lending-related commitments are referred to as the allowance for credit losses.
A progression of the allowance for credit losses, which includes the allowance for credit losses and the reserve for lending-related commitments, for the periods presented is summarized as follows:
| Year Ended December 31 | ||||||||||||
| (In thousands) | 2015 | 2014 | 2013 | |||||||||
| Balance at beginning of period |
$ | 77,047 | $ | 76,341 | $ | 75,557 | ||||||
| Provision for credit losses |
21,992 | 21,312 | 19,754 | |||||||||
|
|
|
|
|
|
|
|||||||
| 99,039 | 97,653 | 95,311 | ||||||||||
|
|
|
|
|
|
|
|||||||
| Loans charged off |
25,499 | 25,241 | 21,006 | |||||||||
| Less recoveries |
(3,122) | (4,635) | (2,036) | |||||||||
|
|
|
|
|
|
|
|||||||
| Net charge-offs |
22,377 | 20,606 | 18,970 | |||||||||
|
|
|
|
|
|
|
|||||||
| Balance at end of period |
$ | 76,662 | $ | 77,047 | $ | 76,341 | ||||||
|
|
|
|
|
|
|
|||||||
NOTE G—BANK PREMISES AND EQUIPMENT AND LEASES
Bank premises and equipment are summarized as follows:
| December 31 | ||||||||
| (In thousands) | 2015 | 2014 | ||||||
| Land |
$ | 24,497 | $ | 24,857 | ||||
| Buildings and improvements |
87,717 | 87,273 | ||||||
| Leasehold improvements |
26,875 | 27,923 | ||||||
| Furniture, fixtures and equipment |
60,233 | 57,878 | ||||||
|
|
|
|
|
|||||
| 199,322 | 197,931 | |||||||
| Less allowance for depreciation and amortization |
126,233 | 120,411 | ||||||
|
|
|
|
|
|||||
| Net bank premises and equipment |
$ | 73,089 | $ | 77,520 | ||||
|
|
|
|
|
|||||
Depreciation expense was $8,385,000, $9,351,000, and $7,912,000 for years ending December 31, 2015, 2014 and 2013, respectively, while amortization expense was $136,000 for the years ended December 31, 2015 and December 31, 2014, respectively, and $103,000 for the year ended December 31, 2013.
102
Table of Contents
United and certain banking subsidiaries have entered into various noncancelable-operating leases. These noncancelable operating leases are subject to renewal options under various terms and some leases provide for periodic rate adjustments based on cost-of-living index changes. Rent expense for noncancelable operating leases approximated $12,528,000, $12,610,000 and $8,969,000 for the years ended December 31, 2015, 2014 and 2013, respectively.
Future minimum lease payments, by year and in the aggregate, under noncancelable operating leases with initial or remaining terms of one year or more, for years subsequent to December 31, 2015, consisted of the following:
| Year |
Amount | |||
| (In thousands) | ||||
| 2016 |
$ | 10,549 | ||
| 2017 |
9,591 | |||
| 2018 |
8,722 | |||
| 2019 |
6,763 | |||
| 2020 |
4,599 | |||
| Thereafter |
12,376 | |||
|
|
|
|||
| Total minimum lease payments |
$ | 52,600 | ||
|
|
|
|||
NOTE H—GOODWILL AND OTHER INTANGIBLES
The following is a summary of intangible assets subject to amortization and those not subject to amortization:
| As of December 31, 2015 | ||||||||||||
| (In thousands) | Gross Carrying Amount |
Accumulated Amortization |
Net Carrying Amount |
|||||||||
| Amortized intangible assets: |
||||||||||||
| Core deposit intangible assets |
$ | 60,577 | $ | (42,737) | $ | 17,840 | ||||||
|
|
|
|
|
|
|
|||||||
| Goodwill not subject to amortization |
$ | 710,252 | ||||||||||
|
|
|
|||||||||||
| As of December 31, 2014 | ||||||||||||
| Gross Carrying Amount |
Accumulated Amortization |
Net Carrying Amount |
||||||||||
| Amortized intangible assets: |
||||||||||||
| Core deposit intangible assets |
$ | 60,577 | $ | (39,317) | $ | 21,260 | ||||||
|
|
|
|
|
|
|
|||||||
| Goodwill not subject to amortization |
$ | 709,794 | ||||||||||
|
|
|
|||||||||||
The following table sets forth the anticipated amortization expense for intangible assets for the years subsequent to 2015:
| Year |
Amount | |||
| (In thousands) | ||||
| 2016 |
$ | 2,981 | ||
| 2017 |
2,767 | |||
| 2018 |
2,574 | |||
| 2019 |
2,476 | |||
| 2020 and thereafter |
7,042 | |||
NOTE I—DEPOSITS
The book value of deposits consisted of the following:
| (Dollars in thousands) | December 31 | |||||||
| 2015 | 2014 | |||||||
| Demand deposits |
$ | 2,699,958 | $ | 2,591,619 | ||||
| Interest-bearing checking |
1,683,316 | 1,695,146 | ||||||
| Regular savings |
692,079 | 659,773 | ||||||
| Money market accounts |
2,368,063 | 2,065,162 | ||||||
| Time deposits under $100,000 |
794,428 | 955,178 | ||||||
| Time deposits over $100,000 |
1,103,683 | 1,078,607 | ||||||
|
|
|
|
|
|||||
| Total deposits |
$ | 9,341,527 | $ | 9,045,485 | ||||
|
|
|
|
|
|||||
103
Table of Contents
Included in time deposits over $100,000 at December 31, 2015 and 2014 were time deposits of $250,000 or more of $386,484,000 and $272,059,000, respectively. Interest paid on deposits approximated $28,447,000, $26,925,000 and $27,182,000 in 2015, 2014 and 2013, respectively.
United’s subsidiary banks have received deposits, in the normal course of business, from the directors and officers of United and its subsidiaries, and their associates. Such related party deposits were accepted on substantially the same terms, including interest rates and maturities, as those prevailing at the time for comparable transactions with unrelated persons. The aggregate dollar amount of these deposits was $174,790,000 and $189,126,000 at December 31, 2015 and 2014, respectively.
NOTE J—SHORT-TERM BORROWINGS
At December 31, 2015 and 2014, short-term borrowings and the related weighted-average interest rates were as follows:
| 2015 | 2014 | |||||||||||||||
| Weighted- | Weighted- | |||||||||||||||
| (Dollars in thousands) | Average | Average | ||||||||||||||
| Amount | Rate | Amount | Rate | |||||||||||||
| Federal funds purchased |
$ | 22,230 | 0.25 | % | $ | 53,840 | 0.20 | % | ||||||||
| Securities sold under agreements to repurchase |
290,798 | (1) | 0.15 | %(1) | 381,812 | (1) | 0.15 | % | ||||||||
|
|
|
|
|
|||||||||||||
| Total |
$ | 313,028 | $ | 435,652 | ||||||||||||
|
|
|
|
|
|||||||||||||
| (1) | Excludes a wholesale security sold under an agreement to repurchase assumed in the Virginia Commerce merger of $50,863 and $52,343, including an acquisition accounting adjustment to fair value, with an interest rate of 4.37% at December 31, 2015 and 2014, respectively, and scheduled to mature in May of 2018. |
Federal funds purchased and securities sold under agreements to repurchase have been a significant source of funds for the company. United has various unused lines of credit available from certain of its correspondent banks in the aggregate amount of $254,000,000. These lines of credit, which bear interest at prevailing market rates, permit United to borrow funds in the overnight market, and are renewable annually subject to certain conditions.
The following table shows the distribution of United’s federal funds purchased and securities sold under agreements to repurchase and the weighted-average interest rates thereon at the end of each of the last three years. Also provided are the maximum amount of borrowings and the average amounts of borrowings as well as weighted-average interest rates for the last three years. The table does not include the long-term wholesale security sold under an agreement to repurchase mentioned above assumed in the Virginia Commerce merger.
| (Dollars in thousands) | Federal Funds Purchased |
Securities Sold
Under Agreements To Repurchase |
||||||
| At December 31: |
||||||||
| 2015 |
$ | 22,230 | $ | 290,798 | ||||
| 2014 |
53,840 | 381,812 | ||||||
| 2013 |
27,685 | 188,069 | ||||||
| Weighted-average interest rate at year-end: |
||||||||
| 2015 |
0.25 | % | 0.15 | % | ||||
| 2014 |
0.20 | % | 0.15 | % | ||||
| 2013 |
0.20 | % | 0.09 | % | ||||
| Maximum amount outstanding at any month’s end: |
||||||||
| 2015 |
$ | 52,000 | $ | 379,818 | ||||
| 2014 |
53,840 | 527,904 | ||||||
| 2013 |
27,685 | 220,155 | ||||||
| Average amount outstanding during the year: |
||||||||
| 2015 |
$ | 38,526 | $ | 283,011 | ||||
| 2014 |
24,037 | 357,083 | ||||||
| 2013 |
12,595 | 199,823 | ||||||
104
Table of Contents
| (Dollars in thousands) | Federal Funds Purchased |
Securities Sold
Under Agreements To Repurchase |
||||||
| Weighted-average interest rate during the year: |
||||||||
| 2015 |
0.21 | % | 0.10 | % | ||||
| 2014 |
0.20 | % | 0.12 | % | ||||
| 2013 |
0.20 | % | 0.10 | % | ||||
At December 31, 2015, all the repurchase agreements were in overnight accounts. The rates offered on these funds vary according to movements in the federal funds and short-term investment market rates.
United has a $20,000,000 line of credit with an unrelated financial institution to provide for general liquidity needs. The line is an unsecured, revolving line of credit. The line is renewable on a 360 day basis and carries an indexed, floating-rate of interest. The line requires compliance with various financial and nonfinancial covenants. At December 31, 2015, United had no outstanding balance under this credit.
Interest paid on short-term borrowings approximated $835,000, $1,133,000 and $894,000 in 2015, 2014 and 2013, respectively.
NOTE K—LONG-TERM BORROWINGS
United’s subsidiary banks are members of the Federal Home Loan Bank (FHLB). Membership in the FHLB makes available short-term and long-term borrowings from collateralized advances. All FHLB borrowings are collateralized by a mix of single-family residential mortgage loans, commercial loans and investment securities. At December 31, 2015, the total carrying value of loans pledged as collateral for FHLB advances approximated $3,397,371,000. United had an unused borrowing amount as of December 31, 2015 of approximately $2,355,967,000 available subject to delivery of collateral after certain trigger points.
Advances may be called by the FHLB or redeemed by United based on predefined factors and penalties. In the fourth quarter of 2014, United prepaid a $15,000,000 long-term FHLB advance with an interest rate of 4.78%. The prepayment of the FHLB advance resulted in a before-tax penalty of $1,971,000.
At December 31, 2015 and 2014, FHLB advances and the related weighted-average interest rates were as follows:
| 2015 | 2014 | |||||||||||||||||||||||
| (Dollars in thousands) | Amount | Weighted- Average Contractual Rate |
Weighted- Average Effective Rate |
Amount | Weighted- Average Contractual Rate |
Weighted- Average Effective Rate |
||||||||||||||||||
| FHLB advances |
$ | 850,880 | 0.46 | % | 0.46 | % | $ | 830,335 | 0.37 | % | 0.37 | % | ||||||||||||
Overnight funds of $110,000,000 were included in the $850,880,000 above at December 31, 2015. No overnight funds were included in the $830,335,000 above at December 31, 2014. The weighted-average effective rate considers the effect of any interest rate swaps designated as fair value hedges outstanding at year-end 2015 and 2014 to manage interest rate risk on its long-term debt. Additional information is provided in Note Q, Notes to Consolidated Financial Statements.
A long-term wholesale security sold under an agreement to repurchase was assumed in the Virginia Commerce merger. At December 31, 2015, the balance of the wholesale security sold under an agreement to repurchase was $50,863,000, including an acquisition accounting adjustment to fair value. The repurchase agreement had an interest rate of 4.37% at December 31, 2015 and is scheduled to mature in May of 2018.
105
Table of Contents
At December 31, 2015, United had a total of thirteen statutory business trusts that were formed for the purpose of issuing or participating in pools of trust preferred capital securities (Capital Securities) with the proceeds invested in junior subordinated debt securities (Debentures) of United. The Debentures, which are subordinate and junior in right of payment to all present and future senior indebtedness and certain other financial obligations of United, are the sole assets of the trusts and United’s payment under the Debentures is the sole source of revenue for the trusts. At December 31, 2015 and 2014, the outstanding balance of the Debentures was $223,506,000 and $222,636,000, respectively, and was included in the category of long-term debt on the Consolidated Balance Sheets entitled “Other long-term borrowings.” The Capital Securities are not included as a component of shareholders’ equity in the Consolidated Balance Sheets. United fully and unconditionally guarantees each individual trust’s obligations under the Capital Securities.
Under the provisions of the subordinated debt, United has the right to defer payment of interest on the subordinated debt at any time, or from time to time, for periods not exceeding five years. If interest payments on the subordinated debt are deferred, the dividends on the Capital Securities are also deferred. Interest on the subordinated debt is cumulative.
The Trust Preferred Securities currently qualify as Tier 1 regulatory capital of United for regulatory purposes. In July of 2013, United’s primary federal regulator, the Federal Reserve, published final rules (the “Basel III Capital Rules”) establishing a new comprehensive capital framework for U.S. banking organizations. The Basel III Capital Rules grandfathers United’s Trust Preferred Securities as Tier 1 capital under the limitations for restricted capital elements in the general risk-based capital rules. As a result, beginning in 2015, United’s Trust Preferred Securities will be subject to a limit of 25 percent of Tier 1 capital elements excluding any non-qualifying capital instruments and after all regulatory capital deductions and adjustments applied to Tier 1 capital, which is substantially similar to the limit in the general risk-based capital rules. Trust preferred securities no longer included in United’s Tier 1 capital may be included as a component of Tier 2 capital on a permanent basis without phase-out.
Information related to United’s statutory trusts is presented in the table below:
| (Dollars in thousands) Description |
Issuance Date | Amount of Capital Securities Issued |
Interest Rate | Maturity Date | ||||
| Century Trust |
March 23, 2000 | $ 8,800 | 10.875% Fixed | March 8, 2030 | ||||
| United Statutory Trust III |
December 17, 2003 | $ 20,000 | 3-month LIBOR + 2.85% | December 17, 2033 | ||||
| United Statutory Trust IV |
December 19, 2003 | $ 25,000 | 3-month LIBOR + 2.85% | January 23, 2034 | ||||
| United Statutory Trust V |
July 12, 2007 | $ 50,000 | 3-month LIBOR + 1.55% | October 1, 2037 | ||||
| United Statutory Trust VI |
September 20, 2007 | $ 30,000 | 3-month LIBOR + 1.30% | December 15, 2037 | ||||
| Premier Statutory Trust II |
September 25, 2003 | $ 6,000 | 3-month LIBOR + 3.10% | October 8, 2033 | ||||
| Premier Statutory Trust III |
May 16, 2005 | $ 8,000 | 3-month LIBOR +1.74% | June 15, 2035 | ||||
| Premier Statutory Trust IV |
June 20, 2006 | $14,000 | 3-month LIBOR + 1.55% | September 23, 2036 | ||||
| Premier Statutory Trust V |
December 14, 2006 | $10,000 | 3-month LIBOR + 1.61% | March 1, 2037 | ||||
| Centra Statutory Trust I |
September 20, 2004 | $10,000 | 3-month LIBOR + 2.29% | September 20, 2034 | ||||
| Centra Statutory Trust II |
June 15, 2006 | $10,000 | 3-month LIBOR + 1.65% | July 7, 2036 | ||||
| Virginia Commerce Trust II |
December 19, 2002 | $15,000 | 6-month LIBOR + 3.30% | December 19, 2032 | ||||
| Virginia Commerce Trust III |
December 20, 2005 | $25,000 | 3-month LIBOR + 1.42% | February 23, 2036 |
At December 31, 2015 and 2014, the Debentures and their related weighted-average interest rates were as follows:
| 2015 | 2014 | |||||||||||||||
| (Dollars in thousands) | Amount | Weighted- Average Rate |
Amount | Weighted- Average Rate |
||||||||||||
| Century Trust |
$ | 8,800 | 10.88 | % | $ | 8,800 | 10.88 | % | ||||||||
| United Statutory Trust III |
20,619 | 3.38 | % | 20,619 | 3.09 | % | ||||||||||
| United Statutory Trust IV |
25,774 | 3.17 | % | 25,774 | 3.08 | % | ||||||||||
| United Statutory Trust V |
51,547 | 1.88 | % | 51,547 | 1.79 | % | ||||||||||
| United Statutory Trust VI |
30,928 | 1.81 | % | 30,928 | 1.54 | % | ||||||||||
| Premier Statutory Trust II |
6,186 | 3.42 | % | 6,186 | 3.33 | % | ||||||||||
| Premier Statutory Trust III |
8,248 | 2.25 | % | 8,248 | 1.98 | % | ||||||||||
| Premier Statutory Trust IV |
14,433 | 2.14 | % | 14,433 | 1.80 | % | ||||||||||
| Premier Statutory Trust V |
10,310 | 2.02 | % | 10,310 | 1.85 | % | ||||||||||
| Centra Statutory Trust I |
9,972 | 2.86 | % | 9,915 | 2.54 | % | ||||||||||
106
Table of Contents
| 2015 | 2014 | |||||||||||||||
| (Dollars in thousands) | Amount | Weighted- Average Rate |
Amount | Weighted- Average Rate |
||||||||||||
| Centra Statutory Trust II |
9,972 | 1.97 | % | 9,915 | 1.88 | % | ||||||||||
| Virginia Commerce Trust II |
11,554 | 4.13 | % | 11,323 | 3.63 | % | ||||||||||
| Virginia Commerce Trust III |
15,163 | 1.80 | % | 14,638 | 1.65 | % | ||||||||||
|
|
|
|
|
|||||||||||||
| Total |
$ | 223,506 | $ | 222,636 | ||||||||||||
|
|
|
|
|
|||||||||||||
At December 31, 2015, the scheduled maturities of long-term borrowings were as follows:
| Year |
Amount | |||
| (In thousands) |
||||
| 2016 |
$ | 704,797 | ||
| 2017 |
0 | |||
| 2018 |
50,107 | |||
| 2019 |
34,243 | |||
| 2020 and thereafter |
226,102 | |||
|
|
|
|||
| Total |
$ | 1,015,249 | ||
|
|
|
|||
Interest paid on long-term borrowings approximated $10,553,000, $13,954,000 and $8,846,000 in 2015, 2014 and 2013, respectively.
NOTE L—OTHER EXPENSE
The following details certain items of other expense for the periods indicated:
| Year Ended December 31 | ||||||||||||
| (In thousands) | 2015 | 2014 | 2013 | |||||||||
| Legal, consulting & other professional services |
$ | 9,310 | $ | 9,620 | $ | 7,250 | ||||||
| Franchise & other taxes not on income |
7,055 | 7,513 | 4,816 | |||||||||
| Automated Teller Machine (ATM) expenses |
7,107 | 6,626 | 5,195 | |||||||||
NOTE M—INCOME TAXES
The income tax provisions included in the consolidated statements of income are summarized as follows:
| (In thousands) | Year Ended December 31 | |||||||||||
| 2015 | 2014 | 2013 | ||||||||||
| Current expense: |
||||||||||||
| Federal |
$ | 58,373 | $ | 51,001 | $ | 32,378 | ||||||
| State |
5,428 | 3,900 | 4,048 | |||||||||
| Deferred expense: |
||||||||||||
| Federal and State |
1,729 | 10,097 | 2,990 | |||||||||
|
|
|
|
|
|
|
|||||||
| Total income taxes |
$ | 65,530 | $ | 64,998 | $ | 39,416 | ||||||
|
|
|
|
|
|
|
|||||||
107
Table of Contents
The following is a reconciliation of income tax expense to the amount computed by applying the statutory federal income tax rate to income before income taxes.
| Year Ended December 31 | ||||||||||||||||||||||||
| (Dollars in thousands) | 2015 | 2014 | 2013 | |||||||||||||||||||||
| Amount | % | Amount | % | Amount | % | |||||||||||||||||||
| Tax on income before taxes at statutory federal rate |
$ | 71,222 | 35.0% | $ | 68,210 | 35.0% | $ | 43,765 | 35.0% | |||||||||||||||
| Plus: State income taxes net of federal tax benefits |
3,516 | 1.7 | 2,523 | 1.3 | 2,392 | 1.9 | ||||||||||||||||||
|
|
|
|
|
|
|
|
|
|
|
|
|
|||||||||||||
| 74,738 | 36.7 | 70,733 | 36.3 | 46,157 | 36.9 | |||||||||||||||||||
| Increase (decrease) resulting from: |
||||||||||||||||||||||||
| Tax-exempt interest income |
(4,158 | ) | (2.0 | ) | (4,048 | ) | (2.1 | ) | (3,837 | ) | (3.1 | ) | ||||||||||||
| Historic tax credit |
(1,262 | ) | (0.6 | ) | 0 | 0.0 | 0 | 0.0 | ||||||||||||||||
| Other items-net |
(3,788 | ) | (1.9 | ) | (1,687 | ) | (0.8 | ) | (2,904 | ) | (2.3 | ) | ||||||||||||
|
|
|
|
|
|
|
|
|
|
|
|
|
|||||||||||||
| Income taxes |
$ | 65,530 | 32.2% | $ | 64,998 | 33.4% | $ | 39,416 | 31.5% | |||||||||||||||
|
|
|
|
|
|
|
|
|
|
|
|
|
|||||||||||||
For years ended 2015, 2014 and 2013, United incurred federal income tax expense applicable to the sales and calls of securities of $73,000, $1,178,000 and $533,000, respectively. Income taxes paid approximated $52,319,000, $60,431,000 and $49,114,000 in 2015, 2014 and 2013, respectively. Deferred income taxes reflect the net tax effects of temporary differences between the carrying amounts of assets and liabilities for financial reporting purposes and the amounts used for income tax purposes. At December 31, 2015, United had no state net operating loss carryforwards.
Taxes not on income, which consists mainly of business franchise taxes, were $7,055,000, $7,513,000 and $4,816,000 for the years ended December 31, 2015, 2014 and 2013, respectively. These amounts are recorded in other expense in the Consolidated Statements of Income.
Significant components of United’s deferred tax assets and liabilities (included in other assets in the Consolidated Balance Sheets) at December 31, 2015 and 2014 are as follows:
| (In thousands) | 2015 | 2014 | ||||||
| Deferred tax assets: |
||||||||
| Allowance for credit losses |
$ | 27,874 | $ | 27,868 | ||||
| Other accrued liabilities |
929 | 3,503 | ||||||
| Unrecognized components of net periodic pension costs |
20,901 | 21,868 | ||||||
| Unrealized loss on securities available for sale |
2,210 | 0 | ||||||
| Other real estate owned |
7,500 | 8,141 | ||||||
| Deferred mortgage points |
3,575 | 0 | ||||||
| Purchase accounting intangibles |
15,248 | 20,340 | ||||||
|
|
|
|
|
|||||
| Total deferred tax assets |
78,237 | 81,720 | ||||||
|
|
|
|
|
|||||
| Deferred tax liabilities: |
||||||||
| Unrealized gain on securities available for sale |
0 | 1,861 | ||||||
| Deferred mortgage points |
0 | 399 | ||||||
| Accrued benefits payable |
5,438 | 7,532 | ||||||
| Premises and equipment |
301 | 672 | ||||||
| Other |
1,856 | 939 | ||||||
|
|
|
|
|
|||||
| Total deferred tax liabilities |
7,595 | 11,403 | ||||||
|
|
|
|
|
|||||
| Net deferred tax assets |
$ | 70,642 | $ | 70,317 | ||||
|
|
|
|
|
|||||
In accordance with ASC topic 740, “Income Taxes,” United records a liability for uncertain income tax positions based on a recognition threshold of more-likely-than-not, and a measurement attribute for all tax positions taken on a tax return, in order for those tax positions to be recognized in the financial statements.
108
Table of Contents
Below is a reconciliation of the total amounts of unrecognized tax benefits:
| December 31 | ||||||||
| (In thousands) | 2015 | 2014 | ||||||
| Unrecognized tax benefits at beginning of year |
$ | 3,453 | $ | 2,512 | ||||
| (Decrease) Increase in unrecognized tax benefits as a result of tax positions taken during the current period |
207 | 983 | ||||||
| Decreases in the unrecognized tax benefits as a result of a lapse of the applicable statute of limitations |
(1,558) | (42) | ||||||
|
|
|
|
|
|||||
| Unrecognized tax benefits at end of year |
$ | 2,102 | $ | 3,453 | ||||
|
|
|
|
|
|||||
The entire amount of unrecognized tax benefits, if recognized, would impact United’s effective tax rate. Over the next 12 months, the statute of limitations will close on certain income tax returns. However, at this time, United cannot reasonably estimate the amount of tax benefits, if any, it may recognize over the next 12 months.
United is currently open to audit under the statute of limitations by the Internal Revenue Service for the years ended December 31, 2012, 2013 and 2014 and certain State Taxing authorities for the years ended December 31, 2012 through 2014.
As of December 31, 2015 and 2014, the total amount of accrued interest related to uncertain tax positions was $569,000 for each period end. United accounts for interest and penalties related to uncertain tax positions as part of its provision for federal and state income taxes. No interest or penalties were recognized in the results of operations for the years of 2015, 2014 and 2013.
NOTE N—EMPLOYEE BENEFIT PLANS
United has a defined benefit retirement plan covering a majority of all employees. Pension benefits are based on years of service and the average of the employee’s highest five consecutive plan years of basic compensation paid during the ten plan years preceding the date of determination. Contributions by United are intended to provide not only for benefits attributed to service to date, but also for those expected to be earned in the future.
In September of 2007, after a recommendation by United’s Pension Committee and approval by United’s Board of Directors, the United Bankshares, Inc. Pension Plan (the Plan) was amended to change the participation rules. The decision to change the participation rules for the Plan followed current industry trends, as many large and medium size companies have taken similar steps. The amendment provided that employees hired on or after October 1, 2007, will not be eligible to participate in the Plan. However, new employees will continue to be eligible to participate in United’s Savings and Stock Investment 401(k) plan. This change had no impact on current employees hired prior to October 1, 2007 as they will continue to participate in the Plan, with no change in benefit provisions, and will continue to be eligible to participate in United’s Savings and Stock Investment 401(k) Plan.
Included in accumulated other comprehensive income at December 31, 2015 are unrecognized actuarial losses of $55,998,000 ($35,727,000 net of tax) that have not yet been recognized in net periodic pension cost. The amortization of this item expected to be recognized in net periodic pension cost during the fiscal year ended December 31, 2016 is $4,618,000 ($2,946,000 net of tax).
Net consolidated periodic pension cost included the following components:
| (Dollars in thousands) | Year Ended December 31, | |||||||||||
| 2015 | 2014 | 2013 | ||||||||||
| Service cost |
$ | 2,787 | $ | 2,160 | $ | 2,672 | ||||||
| Interest cost |
5,902 | 5,379 | 4,913 | |||||||||
| Expected return on plan assets |
(9,290) | (9,102) | (8,313) | |||||||||
| Recognized net actuarial loss |
4,980 | 1,994 | 4,821 | |||||||||
| Amortization of prior service cost |
1 | 1 | 1 | |||||||||
|
|
|
|
|
|
|
|||||||
| Net periodic pension cost |
$ | 4,380 | $ | 432 | $ | 4,094 | ||||||
|
|
|
|
|
|
|
|||||||
109
Table of Contents
| (Dollars in thousands) | Year Ended December 31, | |||||||||||
| 2015 | 2014 | 2013 | ||||||||||
| Weighted-Average Assumptions: |
||||||||||||
| Discount rate |
4.35% | 5.20% | 4.40% | |||||||||
| Expected return on assets |
7.50% | 7.50% | 7.75% | |||||||||
| Rate of Compensation Increase (prior to age 45) |
3.50% | 3.50% | 3.75% | |||||||||
| Rate of Compensation Increase (otherwise) |
3.00% | 3.00% | 2.75% | |||||||||
The reconciliation of the beginning and ending balances of the projected benefit obligation and the fair value of plan assets for the years ended December 31, 2015 and 2014 and the accumulated benefit obligation at December 31, 2015 and 2014 are as follows:
| (Dollars in thousands) | December 31, | |||||||
| Change in Projected Benefit Obligation | 2015 | 2014 | ||||||
| Projected Benefit Obligation at the Beginning of the Year |
$ | 135,739 | $ | 105,186 | ||||
| Service Cost |
2,787 | 2,160 | ||||||
| Interest Cost |
5,902 | 5,379 | ||||||
| Actuarial Loss (Gain) |
(9,760 | ) | 26,733 | |||||
| Benefits Paid |
(9,265 | ) | (3,719 | ) | ||||
|
|
|
|
|
|||||
| Projected Benefit at the End of the Year |
$ | 125,403 | $ | 135,739 | ||||
| Accumulated Benefit Obligation at the End of the Year |
$ | 113,679 | $ | 123,453 | ||||
| Change in Plan Assets |
||||||||
| Fair Value of Plan Assets at the Beginning of the Year |
$ | 125,885 | $ | 123,188 | ||||
| Actual Return on Plan Assets |
(2,872 | ) | 6,416 | |||||
| Benefits Paid |
(9,265 | ) | (3,719 | ) | ||||
| Employer Contributions |
0 | 0 | ||||||
|
|
|
|
|
|||||
| Fair value of plan assets at end of year |
$ | 113,748 | $ | 125,885 | ||||
| Net Amount Recognized |
||||||||
| Funded Status |
$ | (11,655 | ) | $ | (9,854 | ) | ||
| Unrecognized Transition Asset |
0 | 0 | ||||||
| Unrecognized Prior Service Cost |
0 | 1 | ||||||
| Unrecognized Net Loss |
55,998 | 58,576 | ||||||
|
|
|
|
|
|||||
| Net Amount Recognized |
$ | 44,343 | $ | 48,723 | ||||
|
|
|
|
|
|||||
| Weighted-Average Assumptions at the End of the Year |
||||||||
| Discount Rate |
4.75 | % | 4.35 | % | ||||
| Rate of Compensation Increase (prior to age 45) |
3.50 | % | 3.50 | % | ||||
| Rate of Compensation Increase (otherwise) |
3.00 | % | 3.00 | % | ||||
Asset allocation for the defined benefit pension plan as of the measurement date, by asset category, is as follows:
| Plan Assets | Target Allocation 2016 |
Allowable Allocation Range |
Percentage of Plan Assets at |
|||||||||||||
| December 31, 2015 |
December 31, 2014 |
|||||||||||||||
| Equity Securities |
61 | % | 50-70 | % | 67 | % | 67% | |||||||||
| Debt Securities |
25 | % | 20-50 | % | 22 | % | 22% | |||||||||
| Other |
14 | % | 3-15 | % | 11 | % | 11% | |||||||||
|
|
|
|||||||||||||||
| Total |
100 | % | 100% | |||||||||||||
|
|
|
|||||||||||||||
Equity securities include United common stock in the amounts of $3,915,000 (3%) at December 31, 2015 and $3,963,000 (3%) at December 31, 2014.
110
Table of Contents
The policy, as established by the Pension Committee, primarily consisting of United’s Executive Management, is to invest assets based upon the target allocations stated above. The assets are reallocated periodically to meet the above target allocations. The investment policy is reviewed at least annually, subject to the approval of the Pension Committee, to determine if the policy should be changed. Prohibited investments include, but are not limited to, futures contracts, private placements, uncovered options, real estate, the use of margin, short sales, derivatives for speculative purposes, and other investments that are speculative in nature. In order to achieve a prudent level of portfolio diversification, the securities of any one company are not to exceed 10% of the total plan assets, and no more than the 15% of total plan assets is to be invested in any one industry (other than securities of U.S. Government or Agencies). Additionally, no more than 15% of the plan assets is to be invested in foreign securities, both equity and fixed. The expected long-term rate of return for the plan’s total assets is based on the expected return of each of the above categories, weighted based on the median of the target allocation for each class. United uses the corridor approach based on 10% of the greater of the projected benefit obligation and the market-related value of plan assets to amortize actuarial gains and losses.
At December 31, 2015, the benefits expected to be paid in each of the next five fiscal years, and in the aggregate for the five years thereafter are as follows:
| Year |
Amount | |||
| (In thousands) |
||||
| 2016 |
$ | 4,331 | ||
| 2017 |
4,577 | |||
| 2018 |
4,860 | |||
| 2019 |
5,189 | |||
| 2020 |
5,542 | |||
| 2021 through 2025 |
33,240 | |||
United did not contribute to the plan in 2015 and 2014 as no contributions were required by funding regulations or law. For 2016, no contributions to the plan are required by funding regulations or law. However, United may make a discretionary contribution in 2016, the amount of which cannot be reasonably estimated at this time.
In accordance with ASC topic 715 and using the guidance contained in ASC topic 820, the following is a description of the valuation methodologies used to measure the plan assets at fair value.
Cash and Cash Equivalents: These underlying assets are highly liquid U.S. government obligations. The fair value of cash and cash equivalents approximates cost (Level 1).
Debt Securities: Securities of the U.S. Government, municipalities, private issuers and corporations are valued at the closing price reported in the active market in which the individual security is traded, when available (Level 1). If quoted market prices are not available, fair values are measured utilizing independent valuation techniques of identical or similar securities for which significant assumptions are derived primarily from or corroborated by observable market data. Using a market approach valuation methodology, third party vendors compile prices from various sources and may determine the fair value of identical or similar securities by using pricing models that considers observable market data (Level 2).
Common and Preferred Stock: These securities are valued at the closing price on the respective stock exchange (Level 1).
Mutual Funds: Generally, these securities are valued at the closing price reported in the active market in which the individual mutual fund is traded (Level 1). However, certain funds are valued by the fund administrator using pricing models that considers observable market data (Level 2).
111
Table of Contents
The following tables present the balances of the plan assets, by fair value hierarchy level, as of December 31, 2015 and 2014:
| Fair Value Measurements at December 31, 2015 Using | ||||||||||||||||
| (In thousands)
Description |
Balance as
of December 31, 2015 |
Quoted Prices in Active Markets for Identical Assets (Level 1) |
Significant Other Observable Inputs (Level 2) |
Significant Unobservable Inputs (Level 3) |
||||||||||||
| Cash and Cash equivalents |
$ | 1,467 | $ | 1,467 | $ | 0 | $ | 0 | ||||||||
| Fixed Income Securities: |
||||||||||||||||
| Mortgage backed securities |
63 | 0 | 63 | 0 | ||||||||||||
| Collateralized mortgage obligations |
54 | 0 | 54 | 0 | ||||||||||||
| Municipal obligations |
836 | 0 | 836 | 0 | ||||||||||||
| Corporate bonds |
1,539 | 0 | 1,539 | 0 | ||||||||||||
| Foreign bonds, notes and debentures |
93 | 0 | 93 | 0 | ||||||||||||
| Fixed Income Mutual Funds: |
||||||||||||||||
| Taxable |
22,843 | 22,843 | 0 | 0 | ||||||||||||
| Alternative |
5,067 | 5,067 | 0 | 0 | ||||||||||||
| Equity Securities: |
||||||||||||||||
| Common stock |
20,464 | 20,464 | 0 | 0 | ||||||||||||
| Equity Mutual Funds: |
||||||||||||||||
| Domestic equity large cap |
20,470 | 20,470 | 0 | 0 | ||||||||||||
| Domestic equity mid cap |
5,804 | 5,804 | 0 | 0 | ||||||||||||
| Domestic equity small cap |
14,080 | 14,080 | 0 | 0 | ||||||||||||
| International emerging equity |
6,044 | 6,044 | 0 | 0 | ||||||||||||
| International equity developed |
8,772 | 8,772 | 0 | 0 | ||||||||||||
| Alternative equity |
6,152 | 6,152 | 0 | 0 | ||||||||||||
|
|
|
|
|
|
|
|
|
|||||||||
| Total |
$ | 113,748 | $ | 111,163 | $ | 2,585 | $ | 0 | ||||||||
|
|
|
|
|
|
|
|
|
|||||||||
| Fair Value Measurements at December 31, 2014 Using | ||||||||||||||||
| (In thousands)
Description |
Balance as
of December 31, 2014 |
Quoted Prices in Active Markets for Identical Assets (Level 1) |
Significant Other Observable Inputs (Level 2) |
Significant Unobservable Inputs (Level 3) |
||||||||||||
| Cash and Cash equivalents |
$ | 2,317 | $ | 2,317 | $ | 0 | $ | 0 | ||||||||
| Fixed Income Securities: |
||||||||||||||||
| Mortgage backed securities |
81 | 0 | 81 | 0 | ||||||||||||
| Collateralized mortgage obligations |
222 | 0 | 222 | 0 | ||||||||||||
| Municipal obligations |
1,108 | 0 | 1,108 | 0 | ||||||||||||
| Corporate bonds |
1,776 | 0 | 1,776 | 0 | ||||||||||||
| Foreign bonds, notes and debentures |
93 | 0 | 93 | 0 | ||||||||||||
| Fixed Income Mutual Funds: |
||||||||||||||||
| Taxable |
10,097 | 10,097 | 0 | 0 | ||||||||||||
| Domestic |
14,045 | 14,045 | 0 | 0 | ||||||||||||
| Alternative |
5,881 | 5,881 | 0 | 0 | ||||||||||||
| Equity Securities: |
||||||||||||||||
| Preferred stock |
207 | 207 | 0 | 0 | ||||||||||||
| Common stock |
22,113 | 22,113 | 0 | 0 | ||||||||||||
| Equity Mutual Funds: |
||||||||||||||||
| Domestic equity large cap |
25,318 | 25,318 | 0 | 0 | ||||||||||||
| Domestic equity mid cap |
6,064 | 6,064 | 0 | 0 | ||||||||||||
112
Table of Contents
| Fair Value Measurements at December 31, 2014 Using | ||||||||||||||||
| (In thousands)
Description |
Balance as
of December 31, 2014 |
Quoted Prices in Active Markets for Identical Assets (Level 1) |
Significant Other Observable Inputs (Level 2) |
Significant Unobservable Inputs (Level 3) |
||||||||||||
| Domestic equity small cap |
13,541 | 13,541 | 0 | 0 | ||||||||||||
| International emerging equity |
5,926 | 5,926 | 0 | 0 | ||||||||||||
| International equity developed |
11,664 | 11,664 | 0 | 0 | ||||||||||||
| Alternative equity |
5,432 | 5,432 | 0 | 0 | ||||||||||||
|
|
|
|
|
|
|
|
|
|||||||||
| Total |
$ | 125,885 | $ | 122,605 | $ | 3,280 | $ | 0 | ||||||||
|
|
|
|
|
|
|
|
|
|||||||||
Preferred stock investments are in financial institutions. Common stock investments are diversified amongst various industries with no industry representing more than 5% of the total plan assets.
The United Bankshares, Inc. Savings and Stock Investment Plan (the Plan) is a defined contribution plan under Section 401(k) of the Internal Revenue Code. Each employee of United, who completes ninety (90) days of qualified service, is eligible to participate in the Plan. Each participant may contribute from 1% to 100% of compensation to his/her account, subject to Internal Revenue Service maximum deferral limits. Prior to December 31, 2008, after one year of eligible service, United matched 100% of the first 2% of salary deferred and 25% of the second 2% of salary deferred with United stock. Beginning January 1, 2009, United matched 100% of the first 3% of salary deferred and 25% of the next 1% of salary deferred with United stock. Vesting is 100% for employee deferrals and the company match at the time the employee makes his/her deferral. United’s expense relating to the Plan approximated $1,894,000, $1,761,000 and $1,411,000 in 2015, 2014 and 2013, respectively.
The assets of United’s defined benefit plan and 401(k) Plan each include investments in United common stock. At December 31, 2015 and 2014, the combined plan assets included 876,989 and 886,139 shares, respectively, of United common stock with an approximate fair value of $32,440,000 and $33,186,000, respectively. Dividends paid on United common stock held by the plans approximated $1,139,000, $1,133,000 and $1,172,000 for the years ended December 31, 2015, 2014, and 2013, respectively.
United has certain other supplemental deferred compensation plans covering various key employees. Periodic charges are made to operations so that the liability due each employee is fully recorded as of the date of their retirement. Amounts charged to expense have not been significant in any year.
NOTE O—STOCK BASED COMPENSATION
On May 16, 2011, United’s shareholders approved the 2011 Long-Term Incentive Plan (2011 LTI Plan). The 2011 LTI Plan became effective as of July 1, 2011. An award granted under the 2011 LTI Plan may consist of any non-qualified stock options or incentive stock options, stock appreciation rights, restricted stock, or restricted stock units. These awards all relate to the common stock of United. The maximum number of shares of United common stock which may be issued under the 2011 LTI Plan is 1,500,000. Any and all shares may be issued in respect of any of the types of awards, provided that (1) the aggregate number of shares that may be issued in respect of restricted stock awards, and restricted stock units awards which are settled in shares is 350,000, and (2) the aggregate number of shares that may be issued pursuant to stock options is 1,150,000. The shares to be offered under the 2011 LTI Plan may be authorized and unissued shares or treasury shares. With respect to awards that are intended to satisfy the requirements for performance-based compensation under Code Section 162(m), the maximum number of options and stock appreciation rights, in the aggregate, which may be awarded pursuant to the 2011 LTI Plan to any individual participant during any calendar year is 100,000, and the maximum number of shares of restricted stock and/or shares subject to a restricted stock units award that may be granted pursuant to the 2011 LTI Plan to any individual participant during any calendar year is 50,000 shares. A participant may be any key employee of United or its affiliates or a non-employee member of United’s Board of Directors. Subject to certain change in control provisions, stock options, SARs, restricted stock and restricted stock units will vest in 25% increments over the first four anniversaries of the awards unless United’s Compensation Committee specifies otherwise in the award agreement. No award will vest sooner than 1/3 per year over the first three anniversaries of the award. Beginning in 2014, awards granted to executive officers of United have performance based vesting conditions. A Form S-8 was filed on September 2, 2011 with the Securities and Exchange Commission to register all the shares which were available for the 2011 LTI Plan. During the year of 2015, a total of 189,705 non-qualified stock options and 53,071 shares of restricted stock were granted under the 2011 LTI Plan.
113
Table of Contents
Compensation expense of $2,484,000, $2,195,000 and $1,786,000 related to the nonvested awards under the 2011 LTI Plan and the 2006 Stock Option Plan was incurred for the years 2015, 2014 and 2013, respectively. Compensation expense was included in employee compensation in the Consolidated Statements of Income.
Stock Options
United currently has options outstanding from various option plans other than the 2011 LTI Plan (the Prior Plans); however, no common shares of United stock are available for grants under the Prior Plans as these plans have expired. Awards outstanding under the Prior Plans will remain in effect in accordance with their respective terms. The maximum term for options granted under the plans is ten (10) years.
The fair value of the options for 2015 was estimated at the date of grant using a binomial lattice option pricing model with the following weighted-average assumptions: risk-free interest rates of 1.82%; dividend yield of 3.00%; volatility factors of the expected market price of United’s common stock of 0.280; and a weighted-average expected option life of 6.88 years, respectively. The estimated fair value of the options at the date of grant was $7.23 for the options granted during 2015. ASC topic 718, “Compensation – Stock Compensation” defines a lattice model as a model that produces an estimated fair value based on the assumed changes in prices of a financial instrument over successive periods of time. A binomial lattice model assumes at least two price movements are possible in each period of time.
A summary of activity under the United’s stock option plans as of December 31, 2015, and the changes during the year of 2015 are presented below:
| Year ended December 31, 2015 | ||||||||||||||||
| Weighted Average | ||||||||||||||||
| (Dollars in thousands, except per share data) | Aggregate | Remaining | ||||||||||||||
| Intrinsic | Contractual | Exercise | ||||||||||||||
| Shares | Value | Term (Yrs.) | Price | |||||||||||||
| Outstanding at January 1, 2015 |
1,380,548 | $ | 27.94 | |||||||||||||
| Granted |
189,705 | 36.92 | ||||||||||||||
| Exercised |
259,454 | 30.08 | ||||||||||||||
| Forfeited or expired |
103,689 | 35.72 | ||||||||||||||
|
|
|
|
|
|||||||||||||
| Outstanding at December 31, 2015 |
1,207,110 | $ | 10,668 | 6.1 | $ | 28.15 | ||||||||||
|
|
|
|
|
|
|
|
|
|||||||||
| Exercisable at December 31, 2015 |
780,715 | $ | 8,496 | 5.0 | $ | 26.11 | ||||||||||
|
|
|
|
|
|
|
|
|
|||||||||
The following table summarizes the status of United’s nonvested awards for the year ended December 31, 2015:
| Shares | Weighted-Average Grant Date Fair Value Per Share | |||||
| Nonvested at January 1, 2015 |
377,264 | $ 6.29 | ||||
| Granted |
189,705 | 7.23 | ||||
| Vested |
121,673 | 6.33 | ||||
| Forfeited or expired |
18,901 | 6.64 | ||||
|
|
|
| ||||
| Nonvested at December 31, 2015 |
426,395 | $ 6.68 | ||||
|
|
|
| ||||
As of December 31, 2015, the total unrecognized compensation cost related to nonvested option awards was $1,857,000 with a weighted-average expense recognition period of 1.2 years. The total fair value of awards vested during the year ended December 31, 2015, was $770,000.
Cash received from options exercised under the Plans for the years ended December 31, 2015, 2014 and 2013 was $7,871,000, $9,878,000, and $2,364,000, respectively. During 2015 and 2014, 259,454 and 468,933 shares, respectively, were issued in connection with stock option exercises. All shares issued in connection with stock option exercises for 2015 were issued from authorized and unissued stock. Of the 468,933 shares issued in connection with stock option exercises for
114
Table of Contents
2014, 352,503 were issued from available treasury stock while 116,430 shares were issued from authorized and unissued stock. The weighted-average grant-date fair value of options granted in the year of 2015, 2014, and 2013 was $7.23, $6.42, and $5.74, respectively. The total intrinsic value of options exercised under the Plans during the years ended December 31, 2015, 2014, and 2013 was $2,380,000, $4,832,000, and $507,000, respectively.
The Statement of Cash Flows topic of the FASB Accounting Standards Codification requires the benefits of tax deductions in excess of recognized compensation cost to be reported as a financing cash flow, rather than as an operating cash flow as required under previous standards. This requirement reduces net operating cash flows and increase net financing cash flows in periods after adoption. While the company cannot estimate what those amounts will be in the future (because they depend on, among other things, the date employees exercise stock options), United recognized cash flows from financing activities of $1,023,000, $73,000 and $331,000 from excess tax benefits related to share-based compensation arrangements for the year of 2015, 2014 and 2013, respectively.
Restricted Stock
Under the 2011 LTI Plan, United may award restricted common shares to key employees and non-employee directors. Restricted shares granted to participants have a four-year time-based vesting period. Recipients of restricted shares do not pay any consideration to United for the shares, have the right to vote all shares subject to such grant and receive all dividends with respect to such shares, whether or not the shares have vested. Presently, these nonvested participating securities have an immaterial impact on diluted earnings per share. As of December 31, 2015, the total unrecognized compensation cost related to nonvested stock awards was $2,642,000 with a weighted-average expense recognition period of 1.2 years.
The following summarizes the changes to United’s restricted common shares for the year ended December 31, 2015:
| Number of Shares |
Weighted-Average Grant Date Fair Value Per Share | |||||
| Outstanding at January 1, 2015 |
120,308 | $ 28.29 | ||||
| Granted |
53,071 | 36.92 | ||||
| Vested |
38,313 | 28.32 | ||||
| Forfeited |
5,294 | 31.39 | ||||
|
|
|
| ||||
| Outstanding at December 31, 2015 |
129,772 | $ 31.69 | ||||
|
|
|
| ||||
NOTE P—COMMITMENTS AND CONTINGENT LIABILITIES
United is a party to financial instruments with off-balance-sheet risk in the normal course of business to meet the financing needs of its customers and to alter its own exposure to fluctuations in interest rates. These financial instruments include loan commitments, standby letters of credit, and interest rate swap agreements. The instruments involve, to varying degrees, elements of credit and interest rate risk in excess of the amount recognized in the financial statements.
United’s maximum exposure to credit loss in the event of nonperformance by the counterparty to the financial instrument for the loan commitments and standby letters of credit is the contractual or notional amount of those instruments. United uses the same policies in making commitments and conditional obligations as it does for on-balance sheet instruments. Collateral may be obtained, if deemed necessary, based on management’s credit evaluation of the counterparty.
Commitments to extend credit are agreements to lend to a customer as long as there is no violation of any condition established in the commitment contract. Commitments generally have fixed expiration dates or other termination clauses and may require the payment of a fee. Since many of the commitments are expected to expire without being drawn upon, the total commitment amounts do not necessarily, and historically do not, represent future cash requirements. The amount of collateral obtained, if deemed necessary upon the extension of credit, is based on management’s credit evaluation of the counterparty. United had approximately $2,587,957,000 and $2,763,129,000 of loan commitments outstanding as of December 31, 2015 and 2014, respectively, the majority of which contractually expire within one year.
115
Table of Contents
Commercial and standby letters of credit are agreements used by United’s customers as a means of improving their credit standing in their dealings with others. Under these agreements, United guarantees certain financial commitments of its customers. A commercial letter of credit is issued specifically to facilitate trade or commerce. Typically, under the terms of a commercial letter of credit, a commitment is drawn upon when the underlying transaction is consummated as intended between the customer and a third party. As of December 31, 2015 and 2014, United had $226,000 and $216,000, respectively, of outstanding commercial letters of credit. A standby letter of credit is generally contingent upon the failure of a customer to perform according to the terms of an underlying contract with a third party. United has issued standby letters of credit of $135,146,000 and $160,230,000 as of December 31, 2015 and 2014, respectively. In accordance with the Contingencies Topic of the FASB Accounting Standards Codification, United has determined that substantially all of its letters of credit are renewed on an annual basis and the fees associated with these letters of credit are immaterial.
United and its subsidiaries are currently involved in various legal proceedings in the normal course of business. Management is vigorously pursuing all its legal and factual defenses and, after consultation with legal counsel, believes that all such litigation will be resolved with no material effect on United’s financial position.
NOTE Q—DERIVATIVE FINANCIAL INSTRUMENTS
United uses derivative instruments to help aid against adverse price changes or interest rate movements on the value of certain assets or liabilities and on future cash flows. These derivatives may consist of interest rate swaps, caps, floors, collars, futures, forward contracts, written and purchased options. United also executes derivative instruments with its commercial banking customers to facilitate its risk management strategies.
Derivative instruments designated in a hedge relationship to mitigate exposure to changes in the fair value of an asset, liability, or firm commitment attributable to a particular risk, such as interest rate risk, are considered fair value hedges. Derivative instruments designated in a hedge relationship to mitigate exposure to variability in expected future cash flows, or other types of forecasted transactions, are considered cash flow hedges. As of December 31, 2015, United has only fair value hedges.
For the years ended December 31, 2015 and 2014, the derivative portfolio also included derivative financial instruments not included in hedge relationships. These derivatives consist of interest rate swaps used for interest rate management purposes and derivatives executed with commercial banking customers to facilitate their interest rate management strategies. Gains and losses on other derivative financial instruments are netted in noninterest income.
The following table sets forth certain information regarding interest rate derivatives portfolio used for interest-rate risk management purposes and designated as accounting hedges at December 31, 2015 and 2014.
| Derivative Hedging Instruments | ||||||||||||||||
| December 31, 2015 | December 31, 2014 | |||||||||||||||
| (Dollars in thousands) | Notional Amount |
Average Pay Rate |
Notional Amount |
Average Pay Rate |
||||||||||||
| Fair Value Hedges: |
||||||||||||||||
| Pay Fixed Swap (Hedging Commercial Loans) |
$ | 97,157 | 3.64 | % | $ | 40,429 | 5.07 | % | ||||||||
|
|
|
|
|
|||||||||||||
| Total Derivatives Used in Fair Value Hedges |
$ | 97,157 | $ | 40,429 | ||||||||||||
|
|
|
|
|
|||||||||||||
| Total Derivatives Used for Interest Rate Risk Management and Designated as Hedges | $ | 97,157 | $ | 40,429 | ||||||||||||
|
|
|
|
|
|||||||||||||
116
Table of Contents
The following tables summarize the fair value of United’s derivative financial instruments:
| Asset Derivatives | ||||||||||||||||
| December 31, 2015 | December 31, 2014 | |||||||||||||||
| (In thousands) | Balance Sheet Location |
Fair Value |
Balance Sheet Location |
Fair Value |
||||||||||||
| Derivatives designated as hedging instruments | ||||||||||||||||
| Interest rate contracts |
Other assets | $ | 0 | Other assets | $ | 90 | ||||||||||
| Total derivatives designated as hedging instruments | $ | 0 | $ | 90 | ||||||||||||
| Derivatives not designated as hedging instruments | ||||||||||||||||
| Interest rate contracts |
Other assets | $ | 2,942 | Other assets | $ | 3,704 | ||||||||||
|
|
|
|
|
|||||||||||||
| Total derivatives not designated as hedging instruments | $ | 2,942 | $ | 3,704 | ||||||||||||
|
|
|
|
|
|||||||||||||
| Total asset derivatives | $ | 2,942 | $ | 3,794 | ||||||||||||
|
|
|
|
|
|||||||||||||
| Liability Derivatives | ||||||||||||||||
| December 31, 2015 | December 31, 2014 | |||||||||||||||
| (In thousands) | Balance Sheet Location |
Fair Value |
Balance Sheet Location |
Fair Value |
||||||||||||
| Derivatives designated as hedging instruments | ||||||||||||||||
| Interest rate contracts |
Other liabilities | $ | 1,179 | Other liabilities | $ | 432 | ||||||||||
|
|
|
|
|
|||||||||||||
| Total derivatives designated as hedging instruments | $ | 1,179 | $ | 432 | ||||||||||||
|
|
|
|
|
|||||||||||||
| Derivatives not designated as hedging instruments | ||||||||||||||||
| Interest rate contracts |
Other liabilities | $ | 2,942 | Other liabilities | $ | 3,704 | ||||||||||
|
|
|
|
|
|||||||||||||
| Total derivatives not designated as hedging instruments | $ | 2,942 | $ | 3,704 | ||||||||||||
|
|
|
|
|
|||||||||||||
| Total liability derivatives |
$ | 4,121 | $ | 4,136 | ||||||||||||
|
|
|
|
|
|||||||||||||
Derivative contracts involve the risk of dealing with both bank customers and institutional derivative counterparties and their ability to meet contractual terms. Credit risk arises from the possible inability of counterparties to meet the terms of their contracts. United’s exposure is limited to the replacement value of the contracts rather than the notional amount of the contract. The Company’s agreements generally contain provisions that limit the unsecured exposure up to an agreed upon threshold. Additionally, the Company attempts to minimize credit risk through certain approval processes established by management.
The effect of United’s derivative financial instruments on its Consolidated Statements of Income for the years ended December 31, 2015, 2014 and 2013 is presented as follows:
| Year Ended | ||||||||||||||||
| (In thousands) | Income
Statement Location |
December 31, 2015 |
December 31, 2014 |
December 31, 2013 |
||||||||||||
| Derivatives in fair value hedging relationships | ||||||||||||||||
| Interest rate contracts |
Interest income/ | (expense) | $ | (813 | ) | $ | (1,047 | ) | $ | (522 | ) | |||||
|
|
|
|
|
|
|
|||||||||||
| Total derivatives in fair value hedging relationships | $ | (813 | ) | $ | (1,047 | ) | $ | (522 | ) | |||||||
|
|
|
|
|
|
|
|||||||||||
| Derivatives not designated as hedging instruments | ||||||||||||||||
| Interest rate contracts (1) |
Other income | $ | 0 | $ | 0 | $ | 0 | |||||||||
|
|
|
|
|
|
|
|||||||||||
| Total derivatives not designated as hedging instruments | $ | 0 | $ | 0 | $ | 0 | ||||||||||
|
|
|
|
|
|
|
|||||||||||
| Total derivatives |
$ | (813) | $ | (1,047) | $ | (522) | ||||||||||
|
|
|
|
|
|
|
|||||||||||
(1) Represents net gains and net losses from derivative assets not designated as hedging instruments.
117
Table of Contents
For the years ended December 31, 2015, 2014 and 2013, changes in the fair value of any interest rate swaps attributed to hedge ineffectiveness were recorded, but not significant to United’s Consolidated Statements of Income.
NOTE R—COMPREHENSIVE INCOME
The changes in accumulated other comprehensive income are as follows:
| For the Years Ended December 31 | ||||||||||||
| (In thousands) | 2015 | 2014 | 2013 | |||||||||
| Net Income |
$ | 137,959 | $ | 129,888 | $ | 85,628 | ||||||
| Available for sale (“AFS”) securities: |
||||||||||||
| AFS securities with OTTI charges during the period |
(113) | (6,478) | (7,534) | |||||||||
| Related income tax effect |
41 | 2,267 | 2,637 | |||||||||
| Income tax rate change |
316 | 0 | 0 | |||||||||
| Less : OTTI charges recognized in net income |
47 | 6,478 | 7,332 | |||||||||
| Related income tax benefit |
(17) | (2,267) | (2,566) | |||||||||
| Reclassification of previous noncredit OTTI to credit OTTI |
0 | 8,413 | 12,425 | |||||||||
| Related income tax benefit |
0 | (2,944) | (4,349) | |||||||||
|
|
|
|
|
|
|
|||||||
| Net unrealized gains on AFS securities with OTTI |
274 | 5,469 | 7,945 | |||||||||
| AFS securities – all other: |
||||||||||||
| Change in net unrealized (losses) gains on AFS securities arising during the period |
(6,672) | 33,078 | (1,082) | |||||||||
| Related income tax effect |
2,415 | (11,577) | 379 | |||||||||
| Net reclassification adjustment for gains included in net income |
(133) | (3,357) | (1,216) | |||||||||
| Related income tax expense |
48 | 1,175 | 426 | |||||||||
|
|
|
|
|
|
|
|||||||
| (4,342 | ) | 19,319 | (1,493 | ) | ||||||||
|
|
|
|
|
|
|
|||||||
| Net effect of AFS securities on other comprehensive income |
(4,068) | 24,788 | 6,452 | |||||||||
| Held to maturity (“HTM”) securities: |
||||||||||||
| Accretion on the unrealized loss for securities transferred from AFS to the HTM investment portfolio prior to call or maturity |
8 | 8 | 8 | |||||||||
| Related income tax expense |
(3) | (3) | (3) | |||||||||
|
|
|
|
|
|
|
|||||||
| Net effect of HTM securities on other comprehensive income |
5 | 5 | 5 | |||||||||
| Defined benefit pension plan: |
||||||||||||
| Net actuarial loss during the period |
(2,285) | (28,876) | 20,305 | |||||||||
| Related income tax expense (benefit) |
827 | 10,106 | (7,107) | |||||||||
| Amortization of prior service cost recognized in net income |
1 | 1 | 1 | |||||||||
| Related income tax benefit |
0 | 0 | 0 | |||||||||
| Amortization of net actuarial loss recognized in net income |
4,980 | 1,994 | 4,821 | |||||||||
| Related income tax benefit |
(1,908) | (735) | (1,776) | |||||||||
|
|
|
|
|
|
|
|||||||
| Net effect of change in defined benefit pension plan on other comprehensive income |
1,615 | (17,510) | 16,244 | |||||||||
|
|
|
|
|
|
|
|||||||
| Total change in other comprehensive income, net of tax |
(2,448 | ) | 7,283 | 22,701 | ||||||||
|
|
|
|
|
|
|
|||||||
| Total Comprehensive Income |
$ | 135,511 | $ | 137,171 | $ | 108,329 | ||||||
|
|
|
|
|
|
|
|||||||
118
Table of Contents
The components of accumulated other comprehensive income for the year ended December 31, 2015 are as follows:
| Changes in Accumulated Other Comprehensive Income (AOCI) by Component (a) | ||||||||||||||||
| For the Year Ended December 31, 2015 | ||||||||||||||||
| (Dollars in thousands) |
Unrealized Gains/ Losses on AFS Securities |
Accretion on the unrealized loss for securities transferred from AFS to the HTM |
Defined Benefit Pension Items |
Total | ||||||||||||
| Balance at January 1, 2015 |
$ | 1,553 | ($ | 62 | ) | ($ | 37,255 | ) | ($ | 35,764 | ) | |||||
| Other comprehensive income before reclassification |
(3,983 | ) | 5 | 0 | (3,978 | ) | ||||||||||
| Amounts reclassified from accumulated other comprehensive income |
(85 | ) | 0 | 1,615 | 1,530 | |||||||||||
|
|
|
|
|
|
|
|
|
|||||||||
| Net current-period other comprehensive income, net of tax |
(4,068 | ) | 5 | 1,615 | (2,448 | ) | ||||||||||
|
|
|
|
|
|
|
|
|
|||||||||
| Balance at December 31, 2015 |
($ | 2,515 | ) | ($ | 57 | ) | ($ | 35,640 | ) | ($ | 38,212 | ) | ||||
|
|
|
|
|
|
|
|
|
|||||||||
(a) All amounts are net-of-tax.
| Reclassifications out of Accumulated Other Comprehensive Income (AOCI) For the Year Ended December 31, 2015 | ||||||
| (Dollars in thousands)
Details about AOCI Components |
Amount Reclassified from AOCI |
Affected Line Item in the Statement Where Net Income is Presented | ||||
| Available for sale (“AFS”) securities: |
||||||
| Reclassification of previous noncredit OTTI to credit OTTI |
$ | 0 | Total other-than-temporary impairment losses | |||
| Net reclassification adjustment for losses (gains) included in net income |
(133 | ) | Net gains on sales/calls of investment securities | |||
|
|
|
|||||
| (133 | ) | Total before tax | ||||
| Related income tax effect |
48 | Tax expense | ||||
|
|
|
|||||
| (85 | ) | Net of tax | ||||
| Pension plan: |
||||||
| Change in pension asset |
(2,285 | )(a) | ||||
| Amortization of prior service cost |
1 | (b) | ||||
| Recognized net actuarial loss |
4,980 | (b) | ||||
|
|
|
|||||
| 2,696 | Total before tax | |||||
| Related income tax effect |
(1,081 | ) | Tax expense | |||
|
|
|
|||||
| 1,615 | Net of tax | |||||
|
|
|
|||||
| Total reclassifications for the period |
$ | 1,530 | ||||
|
|
|
|||||
(a) This AOCI component is included in the computation of changes in plan assets (see Note N, Employee Benefit Plans)
(b) This AOCI component is included in the computation of net periodic pension cost (see Note N, Employee Benefit Plans)
NOTE S—UNITED BANKSHARES, INC. (PARENT COMPANY ONLY) FINANCIAL INFORMATION
| Condensed Balance Sheets | ||||||||||
| December 31 | ||||||||||
| (In thousands) | 2015 | 2014 | ||||||||
| Assets |
||||||||||
| Cash and due from banks |
$ | 39,680 | $ | 38,984 | ||||||
| Securities available for sale |
3,168 | 2,132 | ||||||||
| Securities held to maturity |
20 | 20 | ||||||||
| Other investment securities |
100 | 102 | ||||||||
| Investment in subsidiaries: |
||||||||||
| Bank subsidiaries |
1,835,440 | 1,769,962 | ||||||||
| Nonbank subsidiaries |
6,484 | 6,436 | ||||||||
| Other assets |
13,904 | 13,029 | ||||||||
|
|
|
|
|
|||||||
| Total Assets |
$ | 1,898,796 | $ | 1,830,665 | ||||||
|
|
|
|
|
|||||||
| Liabilities and Shareholders’ Equity |
||||||||||
| Junior subordinated debentures of subsidiary trusts |
$ | 128,868 | $ | 128,868 | ||||||
| Accrued expenses and other liabilities |
57,293 | 45,637 | ||||||||
| Shareholders’ equity (including other accumulated comprehensive loss of $38,212 and $35,764 at December 31, 2015 and 2014, respectively) |
1,712,635 | 1,656,160 | ||||||||
|
|
|
|
|
|||||||
| Total Liabilities and Shareholders’ Equity |
$ | 1,898,796 | $ | 1,830,665 | ||||||
|
|
|
|
|
|||||||
119
Table of Contents
| Condensed Statements of Income | ||||||||||||
| Year Ended December 31 | ||||||||||||
| (In thousands) | 2015 | 2014 | 2013 | |||||||||
| Income |
||||||||||||
| Dividends from banking subsidiaries |
$ | 70,500 | $ | 97,000 | $ | 69,500 | ||||||
| Net interest income |
59 | 59 | 74 | |||||||||
| Management fees: |
||||||||||||
| Bank subsidiaries |
28,955 | 19,400 | 17,665 | |||||||||
| Nonbank subsidiaries |
27 | 27 | 27 | |||||||||
| Other income |
58 | 96 | 555 | |||||||||
|
|
|
|
|
|
|
|||||||
| Total Income |
99,599 | 116,582 | 87,821 | |||||||||
|
|
|
|
|
|
|
|||||||
| Expenses |
||||||||||||
| Operating expenses |
30,016 | 24,043 | 20,595 | |||||||||
|
|
|
|
|
|
|
|||||||
| Income Before Income Taxes and Equity in Undistributed Net Income of Subsidiaries |
69,583 | 92,539 | 67,226 | |||||||||
| Applicable income tax benefit |
(316 | ) | (1,332 | ) | (709 | ) | ||||||
|
|
|
|
|
|
|
|||||||
| Income Before Equity in Undistributed Net Income of Subsidiaries |
69,899 | 93,871 | 67,935 | |||||||||
| Equity in undistributed net income of subsidiaries: |
||||||||||||
| Bank subsidiaries |
68,012 | 35,978 | 17,652 | |||||||||
| Nonbank subsidiaries |
48 | 39 | 41 | |||||||||
|
|
|
|
|
|
|
|||||||
| Net Income |
$ | 137,959 | $ | 129,888 | $ | 85,628 | ||||||
|
|
|
|
|
|
|
|||||||
| Condensed Statements of Cash Flows | ||||||||||||
| Year Ended December 31 | ||||||||||||
| (In thousands) | 2015 | 2014 | 2013 | |||||||||
| Operating Activities |
||||||||||||
| Net income |
$ | 137,959 | $ | 129,888 | $ | 85,628 | ||||||
| Adjustments to reconcile net income to net cash provided by operating activities: |
||||||||||||
| Equity in undistributed net income of subsidiaries |
(68,060) | (36,018) | (17,693) | |||||||||
| Amortization of net periodic pension costs |
384 | 34 | 373 | |||||||||
| Stock-based compensation |
2,484 | 2,195 | 1,786 | |||||||||
| Net gain on securities transactions |
(54) | (96) | (556) | |||||||||
| Net change in other assets and liabilities |
8,998 | 5,172 | 867 | |||||||||
|
|
|
|
|
|
|
|||||||
| Net Cash Provided by Operating Activities |
81,711 | 101,175 | 70,405 | |||||||||
|
|
|
|
|
|
|
|||||||
| Investing Activities |
||||||||||||
| Net (purchases of) proceeds from sales of securities |
(1,047) | (90) | 2,341 | |||||||||
| Net cash paid in acquisition of subsidiary |
0 | (33,271) | 0 | |||||||||
| Change in other investment securities |
2 | 23 | 37 | |||||||||
|
|
|
|
|
|
|
|||||||
| Net Cash (Used in) Provided by Investing Activities |
(1,045 | ) | (33,338 | ) | 2,378 | |||||||
|
|
|
|
|
|
|
|||||||
| Financing Activities |
||||||||||||
| Cash dividends paid |
(88,864) | (82,496) | (62,434) | |||||||||
| Acquisition of treasury stock |
(1) | (2) | (93) | |||||||||
| Proceeds from sale of treasury stock from deferred compensation plan |
1 | 81 | 77 | |||||||||
| Excess tax benefits from stock-based compensation arrangements |
1,023 | 73 | 331 | |||||||||
| Proceeds from exercise of stock options |
7,871 | 9,878 | 2,364 | |||||||||
|
|
|
|
|
|
|
|||||||
| Net Cash Used in Financing Activities |
(79,970) | (72,466) | (59,755) | |||||||||
|
|
|
|
|
|
|
|||||||
| Increase (Decrease) in Cash and Cash Equivalents |
696 | (4,629) | 13,028 | |||||||||
| Cash and Cash Equivalents at Beginning of Year |
38,984 | 43,613 | 30,585 | |||||||||
|
|
|
|
|
|
|
|||||||
| Cash and Cash Equivalents at End of Year |
$ | 39,680 | $ | 38,984 | $ | 43,613 | ||||||
|
|
|
|
|
|
|
|||||||
120
Table of Contents
NOTE T—REGULATORY MATTERS
The subsidiary banks are required to maintain average reserve balances with their respective Federal Reserve Bank. The average amount of those reserve balances maintained and required for the year ended December 31, 2015, were approximately $567,698,000 and $330,953,000, respectively. The average amount of those reserve balances maintained and required for the year ended December 31, 2014, was approximately $358,127,000 and $286,898,000, respectively.
The primary source of funds for the dividends paid by United Bankshares, Inc. to its shareholders is dividends received from its subsidiary banks. Dividends paid by United’s subsidiary banks are subject to certain regulatory limitations. Generally, the most restrictive provision requires regulatory approval if dividends declared in any year exceed that year’s net income, as defined, plus the retained net profits of the two preceding years.
During 2016, the retained net profits available for distribution to United Bankshares, Inc. by its banking subsidiaries as dividends without regulatory approval, are approximately $107,859,000, plus net income for the interim period through the date of declaration.
Under Federal Reserve regulation, the banking subsidiaries are also limited as to the amount they may loan to affiliates, including the parent company. Loans from the banking subsidiaries to the parent company are limited to 10% of the banking subsidiaries’ capital and surplus, as defined, or $145,475,000 at December 31, 2015, and must be secured by qualifying collateral.
United’s subsidiary banks are subject to various regulatory capital requirements administered by federal banking agencies. Pursuant to capital adequacy guidelines, United’s subsidiary banks must meet specific capital guidelines that involve various quantitative measures of the banks’ assets, liabilities, and certain off-balance-sheet items as calculated under regulatory accounting practices. United’s subsidiary banks’ capital amounts and classifications are also subject to qualitative judgments by the regulators about components, risk weightings, and other factors.
As previously mentioned, the new Basel III Capital Rules became effective for United and its banking subsidiaries on January 1, 2015 (subject to a phase-in period). These new quantitative measures established by regulation to ensure capital adequacy require United and its banking subsidiaries to maintain minimum amounts and ratios of total, Tier I capital, and common Tier I capital as defined in the regulations, to risk-weighted assets, as defined, and of Tier I capital, as defined, to average assets, as defined. Failure to meet minimum capital requirements can initiate certain mandatory and possibly additional discretionary actions by regulators that, if undertaken, could have a direct material effect on United’s financial statements. As of December 31, 2015, United exceeds all capital adequacy requirements to which it is subject.
At December 31, 2015, the most recent notification from its regulators, United and its subsidiary banks were categorized as well-capitalized. To be categorized as well-capitalized, United must maintain minimum total risk-based, Tier I risk-based, Common Tier I risk-based, and Tier I leverage ratios as set forth in the following table. There are no conditions or events since that notification that management believes would impact United’s well-capitalized status.
121
Table of Contents
United’s and its subsidiary banks’, United Bank (WV) and United Bank (VA), capital amounts (in thousands of dollars) and ratios are presented in the following table.
| (Dollars in thousands) | Actual | For Capital Adequacy Purposes |
To Be Well- Capitalized |
|||||||||||||||||||||
| Amount | Ratio | Amount | Ratio | Amount | Ratio | |||||||||||||||||||
| As of December 31, 2015: |
||||||||||||||||||||||||
| Total Capital (to Risk- Weighted Assets): |
||||||||||||||||||||||||
| United Bankshares |
$ | 1,331,492 | 12.6 | % | $ | 845,876 | ³8.0% | $ | 1,057,345 | ³10.0% | ||||||||||||||
| United Bank (WV) |
591,825 | 12.6 | % | 377,225 | ³8.0% | 471,532 | ³10.0% | |||||||||||||||||
| United Bank (VA) |
720,676 | 12.2 | % | 471,303 | ³8.0% | 589,129 | ³10.0% | |||||||||||||||||
| Tier I Capital (to Risk- Weighted Assets): |
||||||||||||||||||||||||
| United Bankshares |
$ | 1,254,555 | 11.9 | % | 634,407 | ³6.0% | 845,876 | ³8.0% | ||||||||||||||||
| United Bank (WV) |
547,903 | 11.6 | % | 282,919 | ³6.0% | 377,225 | ³8.0% | |||||||||||||||||
| United Bank (VA) |
687,937 | 11.7 | % | 353,477 | ³6.0% | 471,303 | ³8.0% | |||||||||||||||||
| Common Tier I Capital (to Risk Weighted Assets): |
||||||||||||||||||||||||
| United Bankshares |
$ | 1,022,755 | 9.7 | % | 475,805 | ³4.5% | 687,274 | ³6.5% | ||||||||||||||||
| United Bank (WV) |
547,903 | 11.6 | % | 212,189 | ³4.5% | 306,496 | ³6.5% | |||||||||||||||||
| United Bank (VA) |
687,937 | 11.7 | % | 265,108 | ³4.5% | 382,934 | ³6.5% | |||||||||||||||||
| Tier I Capital (to Average Assets): |
||||||||||||||||||||||||
| United Bankshares |
$ | 1,254,555 | 10.7 | % | 468,776 | ³4.0% | 585,970 | ³5.0% | ||||||||||||||||
| United Bank (WV) |
547,903 | 10.2 | % | 214,519 | ³4.0% | 268,149 | ³5.0% | |||||||||||||||||
| United Bank (VA) |
687,937 | 10.5 | % | 263,306 | ³4.0% | 329,132 | ³5.0% | |||||||||||||||||
| As of December 31, 2014: |
||||||||||||||||||||||||
| Total Capital (to Risk- Weighted Assets): |
||||||||||||||||||||||||
| United Bankshares |
$ | 1,269,893 | 13.2 | % | $ | 772,453 | ³8.0% | $ | 965,566 | ³10.0% | ||||||||||||||
| United Bank (WV) |
547,205 | 12.5 | % | 350,053 | ³8.0% | 437,567 | ³10.0% | |||||||||||||||||
| United Bank (VA) |
691,718 | 12.9 | % | 428,439 | ³8.0% | 535,549 | ³10.0% | |||||||||||||||||
| Tier I Capital (to Risk- Weighted Assets): |
||||||||||||||||||||||||
| United Bankshares |
1,183,870 | 12.3 | % | 386,226 | ³4.0% | 579,340 | ³6.0% | |||||||||||||||||
| United Bank (WV) |
504,795 | 11.5 | % | 175,027 | ³4.0% | 262,540 | ³6.0% | |||||||||||||||||
| United Bank (VA) |
657,078 | 12.3 | % | 214,220 | ³4.0% | 321,330 | ³6.0% | |||||||||||||||||
| Tier I Capital (to Average Assets): |
||||||||||||||||||||||||
| United Bankshares |
1,183,870 | 10.3 | % | 459,433 | ³4.0% | 574,291 | ³5.0% | |||||||||||||||||
| United Bank (WV) |
504,795 | 9.5 | % | 213,782 | ³4.0% | 267,228 | ³5.0% | |||||||||||||||||
| United Bank (VA) |
657,078 | 10.0 | % | 263,666 | ³4.0% | 329,582 | ³5.0% | |||||||||||||||||
NOTE U—FAIR VALUES OF FINANCIAL INSTRUMENTS
In accordance with ASC topic 820, the following describes the valuation techniques used by United to measure certain financial assets and liabilities recorded at fair value on a recurring basis in the financial statements.
Securities available for sale: Securities available for sale are recorded at fair value on a recurring basis. Fair value measurement is based upon quoted market prices, when available (Level 1). If quoted market prices are not available, fair values are measured utilizing independent valuation techniques of identical or similar securities for which significant assumptions are derived primarily from or corroborated by observable market data. Using a market approach valuation methodology, third party vendors compile prices from various sources and may determine the fair value of identical or similar securities by using pricing models that considers observable market data (Level 2). Management internally reviews the fair values provided by third party vendors on a monthly basis. Management’s review consists of comparing fair values
122
Table of Contents
assigned by third party vendors to trades and offerings observed by management. The review requires some degree of judgment as to the number or percentage of securities to review on the part of management which could fluctuate based on results of past reviews and in comparison to current expectations. Exceptions that are deemed to be material are reviewed by management. Additionally, to assess the reliability of the information received from third party vendors, management obtains documentation from third party vendors related to the sources, methodologies, and inputs utilized in valuing securities classified as Level 2. Management analyzes this information to ensure the underlying assumptions appear reasonable. Management also obtains an independent service auditor’s report from third party vendors to provide reasonable assurance that appropriate controls are in place over the valuation process. Upon completing its review of the pricing from third party vendors at December 31, 2015, management determined that the prices provided by its third party pricing source were reasonable and in line with management’s expectations for the market values of these securities. Therefore, prices obtained from third party vendors that did not reflect forced liquidation or distressed sales were not adjusted by management at December 31, 2015. Management utilizes a number of factors to determine if a market is inactive, all of which may require a significant level of judgment. Factors that management considers include: a significant widening of the bid-ask spread, a considerable decline in the volume and level of trading activity in the instrument, a significant variance in prices among market participants, and a significant reduction in the level of observable inputs. Any securities available for sale not valued based upon quoted market prices or third party pricing models that consider observable market data are considered Level 3. Currently, United considers its valuation of available-for-sale Trup Cdos as Level 3. The Fair Value Measurements and Disclosures topic assumes that fair values of financial assets are determined in an orderly transaction and not a forced liquidation or distressed sale at the measurement date. Based on financial market conditions, United feels that the fair values obtained from its third party vendor reflect forced liquidation or distressed sales for these Trup Cdos due to decreased volume and trading activity. Additionally, management held discussions with institutional traders to identify trends in the number and type of transactions related to the Trup Cdos sector. Based upon management’s review of the market conditions for Trup Cdos, it was determined that an income approach valuation technique (present value technique) that maximizes the use of relevant observable inputs and minimizes the use of unobservable inputs is more representative of fair value than the valuation technique used by United’s third party vendor. The present value technique discounts expected future cash flows of a security to arrive at a present value. Management considers the following items when calculating the appropriate discount rate: the implied rate of return when the market was last active, changes in the implied rate of return as markets moved from very active to inactive, recent changes in credit ratings, and recent activity showing that the market has built in increased liquidity and credit premiums. Management’s internal credit review of each security was also factored in to determine the appropriate discount rate. The credit review considered each security’s collateral, subordination, excess spread, priority of claims, principal and interest. Discount margins used in the valuation at December 31, 2015 ranged from LIBOR plus 4.25% to LIBOR plus 10.75%. Management completed a sensitivity analysis on the fair value of its Trup Cdos. Given a comprehensive 200 basis point increase in the discount rates, the total fair value of these securities would decline by approximately 17%, or $5.7 million.
Derivatives: United utilizes interest rate swaps to hedge exposure to interest rate risk and variability of cash flows associated to changes in the underlying interest rate of the hedged item. These hedging interest rate swaps are classified as either a fair value hedge or a cash flow hedge. United’s derivative portfolio also includes derivative financial instruments not included in hedge relationships. These derivatives consist of interest rate swaps used for interest rate management purposes and derivatives executed with commercial banking customers to facilitate their interest rate management strategies. United utilizes third-party vendors for derivative valuation purposes. These vendors determine the appropriate fair value based on a net present value calculation of the cash flows related to the interest rate swaps using primarily observable market inputs such as interest rate yield curves (Level 2). Valuation adjustments to derivative fair values for liquidity and credit risk are also taken into consideration, as well as the likelihood of default by United and derivative counterparties, the net counterparty exposure and the remaining maturities of the positions. Values obtained from third party vendors are typically not adjusted by management. Management internally reviews the derivative values provided by third party vendors on a quarterly basis. All derivative values are tested for reasonableness by management utilizing a net present value calculation.
For a fair value hedge, the fair value of the interest rate swap is recognized on the balance sheet as either a freestanding asset or liability with a corresponding adjustment to the hedged financial instrument. Subsequent adjustments due to changes in the fair value of a derivative that qualifies as a fair value hedge are offset in current period earnings either in interest income or interest expense depending on the nature of the hedged financial instrument. For a cash flow hedge, the fair value of the interest rate swap is recognized on the balance sheet as either a freestanding asset or liability with a corresponding adjustment to other comprehensive income within shareholders’ equity, net of tax. Subsequent adjustments due to changes in the fair value of a derivative that qualifies as a cash flow hedge are offset to other comprehensive income, net of tax. The portion of a hedge that is ineffective is recognized immediately in earnings.
123
Table of Contents
For derivatives that are not designated in a hedge relationship, changes in the fair value of the derivatives are recognized in earnings in the same period as the change in the fair value. Unrealized gains and losses due to changes in the fair value of other derivative financial instruments not in hedge relationship are included in noninterest income and noninterest expense, respectively.
The following table presents the balances of financial assets and liabilities measured at fair value on a recurring basis as of December 31, 2015 and 2014, segregated by the level of the valuation inputs within the fair value hierarchy:
| Balance as
of December 31, 2015 |
Fair Value at December 31, 2015 Using | |||||||||||||||
| (In thousands)
Description |
Quoted Prices in Active Markets for Identical Assets (Level 1) |
Significant Other Observable Inputs (Level 2) |
Significant Unobservable Inputs (Level 3) |
|||||||||||||
| Assets |
||||||||||||||||
| Available for sale debt securities: |
||||||||||||||||
| U.S. Treasury securities and obligations of U.S. Government corporations and agencies |
$ | 73,786 | $ | 0 | $ | 73,786 | $ | 0 | ||||||||
| State and political subdivisions |
133,778 | 0 | 133,778 | 0 | ||||||||||||
| Residential mortgage-backed securities |
||||||||||||||||
| Agency |
477,982 | 0 | 477,982 | 0 | ||||||||||||
| Non-agency |
9,571 | 0 | 9,571 | 0 | ||||||||||||
| Asset-backed securities |
3,399 | 0 | 3,399 | 0 | ||||||||||||
| Commercial mortgage-backed securities |
||||||||||||||||
| Agency |
305,935 | 0 | 305,935 | 0 | ||||||||||||
| Trust preferred collateralized debt obligations |
34,686 | 0 | 0 | 34,686 | ||||||||||||
| Single issue trust preferred securities |
11,693 | 0 | 11,693 | 0 | ||||||||||||
| Other corporate securities |
10,049 | 0 | 10,049 | 0 | ||||||||||||
|
|
|
|
|
|
|
|
|
|||||||||
| Total available for sale debt securities |
1,060,879 | 0 | 1,026,193 | 34,686 | ||||||||||||
| Available for sale equity securities: |
||||||||||||||||
| Financial services industry |
2,723 | 800 | 1,923 | 0 | ||||||||||||
| Equity mutual funds (1) |
1,596 | 1,596 | 0 | 0 | ||||||||||||
| Other equity securities |
1,136 | 1,136 | 0 | 0 | ||||||||||||
|
|
|
|
|
|
|
|
|
|||||||||
| Total available for sale equity securities |
5,455 | 3,532 | 1,923 | 0 | ||||||||||||
|
|
|
|
|
|
|
|
|
|||||||||
| Total available for sale securities |
1,066,334 | 3,532 | 1,028,116 | 34,686 | ||||||||||||
| Derivative financial assets: |
||||||||||||||||
| Interest rate contracts |
2,942 | 0 | 2,942 | 0 | ||||||||||||
| Liabilities |
||||||||||||||||
| Derivative financial liabilities: |
||||||||||||||||
| Interest rate contracts |
4,121 | 0 | 4,121 | 0 | ||||||||||||
(1) The equity mutual funds are within a rabbi trust for the payment of benefits under a deferred compensation plan for certain key officers of United and its subsidiaries.
124
Table of Contents
| Fair Value at December 31, 2014 Using | ||||||||||||||||
| (In thousands)
Description |
Balance as
of December 31, 2014 |
Quoted Prices
in Active Markets for Identical Assets (Level 1) |
Significant
Other Observable Inputs (Level 2) |
Significant Unobservable Inputs (Level 3) |
||||||||||||
| Assets |
||||||||||||||||
| Available for sale debt securities: |
||||||||||||||||
| U.S. Treasury securities and obligations of U.S. Government corporations and agencies |
$ | 89,981 | $ | 0 | $ | 89,981 | $ | 0 | ||||||||
| State and political subdivisions |
136,863 | 0 | 136,863 | 0 | ||||||||||||
| Residential mortgage-backed securities |
||||||||||||||||
| Agency |
555,685 | 0 | 555,685 | 0 | ||||||||||||
| Non-agency |
12,018 | 0 | 12,018 | 0 | ||||||||||||
| Asset-backed securities |
8,027 | 0 | 8,027 | 0 | ||||||||||||
| Commercial mortgage-backed securities |
||||||||||||||||
| Agency |
317,099 | 0 | 317,099 | 0 | ||||||||||||
| Trust preferred collateralized debt obligations |
39,558 | 0 | 0 | 39,558 | ||||||||||||
| Single issue trust preferred securities |
11,744 | 0 | 11,744 | 0 | ||||||||||||
| Other corporate securities |
5,135 | 0 | 5,135 | 0 | ||||||||||||
|
|
|
|
|
|
|
|
|
|||||||||
| Total available for sale debt securities |
1,176,110 | 0 | 1,136,552 | 39,558 | ||||||||||||
| Available for sale equity securities: |
||||||||||||||||
| Financial services industry |
2,533 | 759 | 1,774 | 0 | ||||||||||||
| Equity mutual funds (1) |
560 | 560 | 0 | 0 | ||||||||||||
| Other equity securities |
1,183 | 1,183 | 0 | 0 | ||||||||||||
|
|
|
|
|
|
|
|
|
|||||||||
| Total available for sale equity securities |
4,276 | 2,502 | 1,774 | 0 | ||||||||||||
|
|
|
|
|
|
|
|
|
|||||||||
| Total available for sale securities |
1,180,386 | 2,502 | 1,138,326 | 39,558 | ||||||||||||
| Derivative financial assets: |
||||||||||||||||
| Interest rate contracts |
3,794 | 0 | 3,794 | 0 | ||||||||||||
| Liabilities |
||||||||||||||||
| Derivative financial liabilities: |
||||||||||||||||
| Interest rate contracts |
4,136 | 0 | 4,136 | 0 | ||||||||||||
| (1) | The equity mutual funds are within a rabbi trust for the payment of benefits under a deferred compensation plan for certain key |
officers of United and its subsidiaries.
The following table presents additional information about financial assets and liabilities measured at fair value at December 31, 2015 and 2014 on a recurring basis and for which United has utilized Level 3 inputs to determine fair value:
| Available-for-sale Securities |
||||||||
| (In thousands) | Trust
preferred collateralized debt obligations |
|||||||
| 2015 | 2014 | |||||||
| Balance, beginning of year |
$ | 39,558 | $ | 43,449 | ||||
| Total gains or losses (realized/unrealized): |
||||||||
| Included in earnings (or changes in net assets) |
(34 | ) | (4,034 | ) | ||||
| Included in other comprehensive income |
(4,838 | ) | 12,312 | |||||
| Purchases, issuances, and settlements |
0 | (12,169 | ) | |||||
| Transfers in and/or out of Level 3 |
0 | 0 | ||||||
|
|
|
|
|
|||||
| Balance, ending of year |
$ | 34,686 | $ | 39,558 | ||||
|
|
|
|
|
|||||
| The amount of total gains or losses for the period included in earnings (or changes in net assets) attributable to the change in unrealized gains or losses relating to assets still held at reporting date |
0 | 0 | ||||||
125
Table of Contents
Certain financial assets are measured at fair value on a nonrecurring basis in accordance with GAAP. Adjustments to the fair value of these assets usually result from the application of lower-of-cost-or-market accounting or write-downs of individual assets.
The following describes the valuation techniques used by United to measure certain financial assets recorded at fair value on a nonrecurring basis in the financial statements.
Loans held for sale: Loans held for sale are carried at the lower of cost or market value. These loans currently consist of one-to-four family residential loans originated for sale in the secondary market. Fair value is based on the price secondary markets are currently offering for similar loans using observable market data which is not materially different than cost due to the short duration between origination and sale (Level 2). As such, United records any fair value adjustments on a nonrecurring basis. No nonrecurring fair value adjustments were recorded on loans held for sale during the year ended December 31, 2015. Gains and losses on sale of loans are recorded within income from mortgage banking on the Consolidated Statements of Income.
Impaired Loans: Loans are designated as impaired when, in the judgment of management based on current information and events, it is probable that all amounts due according to the contractual terms of the loan agreement will not be collected. Impairment is measured based upon the present value of expected future cash flows from the loan discounted at the loan’s effective rate and the loan’s observable market price or the fair value of collateral, if the loan is collateral dependent. Fair value is measured using a market approach based on the value of the collateral securing the loans. Collateral may be in the form of real estate or business assets including equipment, inventory, and accounts receivable. The vast majority of the collateral is real estate. The value of real estate collateral is determined utilizing an appraisal conducted by an independent, licensed appraiser outside of the Company using comparable property sales (Level 2). However, if the collateral is a house or building in the process of construction or if an appraisal of the real estate property is over two years old, then the fair value is considered Level 3. The value of business equipment is based upon an outside appraisal if deemed significant, or the net book value on the applicable business’ financial statements if not considered significant using observable market data. Likewise, values for inventory and accounts receivables collateral are based on financial statement balances or aging reports (Level 3). Impaired loans allocated to the Allowance for Loan Losses are measured at fair value on a nonrecurring basis. Any fair value adjustments are recorded in the period incurred as provision for credit losses expense on the Consolidated Statements of Income.
OREO: OREO consists of real estate acquired in foreclosure or other settlement of loans. Such assets are carried on the balance sheet at the lower of the investment in the assets or the fair value of the assets less estimated selling costs. Fair value is determined by one of two market approach methods depending on whether the property has been vacated and an appraisal can be conducted. If the property has yet to be vacated and thus an appraisal cannot be performed, a Brokers Price Opinion (i.e. BPO), is obtained. A BPO represents a best estimate valuation performed by a realtor based on knowledge of current property values and a visual examination of the exterior condition of the property. Once the property is subsequently vacated, a formal appraisal is obtained and the recorded asset value appropriately adjusted. On the other hand, if the OREO property has been vacated and an appraisal can be conducted, the fair value of the property is determined based upon the appraisal using a market approach. An authorized independent appraiser conducts appraisals for United. Appraisals for property other than ongoing construction are based on consideration of comparable property sales (Level 2). In contrast, valuation of ongoing construction assets requires some degree of professional judgment. In conducting an appraisal for ongoing construction property, the appraiser develops two appraised amounts: an “as is” appraised value and a “completed” value. Based on professional judgment and their knowledge of the particular situation, management determines the appropriate fair value to be utilized for such property (Level 3). As a matter of policy, valuations are reviewed at least annually and appraisals are generally updated on a bi-annual basis with values lowered as necessary.
126
Table of Contents
Intangible Assets: For United, intangible assets consist of goodwill and core deposit intangibles. Goodwill is tested for impairment at least annually or sooner if indicators of impairment exist. Goodwill impairment would be defined as the difference between the recorded value of goodwill (i.e. book value) and the implied fair value of goodwill. In determining the implied fair value of goodwill for purposes of evaluating goodwill impairment, United determines the fair value of the reporting unit using a market approach and compares the fair value to its carrying value. If the carrying value exceeds the fair value, a step two test is performed whereby the implied fair value is computed by deducting the fair value of all tangible and intangible net assets from the fair value of the reporting unit. Core deposit intangibles relate to the estimated value of the deposit base of acquired institutions. Management reviews core deposit intangible assets on an annual basis, or sooner if indicators of impairment exist, and evaluates changes in facts and circumstances that may indicate impairment in the carrying value. Other than those intangible assets recorded in the acquisition of Virginia Commerce, no fair value measurement of intangible assets was made during the year of 2015 and 2014.
The following table summarizes United’s financial assets that were measured at fair value on a nonrecurring basis as of December 31, 2015 and 2014:
| (In thousands)
Description |
Balance as
of December 31, 2015 |
Fair Value at December 31, 2015 Using | YTD Losses |
|||||||||||||||||
| Quoted Prices in Active Markets for Identical Assets (Level 1) |
Significant Other Observable Inputs (Level 2) |
Significant Unobservable Inputs (Level 3) |
||||||||||||||||||
| Assets |
||||||||||||||||||||
| Impaired Loans |
$ | 69,368 | $ | 0 | $ | 29,186 | $ | 40,182 | $ | 8,485 | ||||||||||
| OREO |
32,228 | 0 | 32,228 | 0 | 1,141 | |||||||||||||||
| (In thousands)
Description |
Balance as
of December 31, 2014 |
Fair Value at December 31, 2014 Using | YTD Losses |
|||||||||||||||||
| Quoted Prices in Active Markets for Identical Assets (Level 1) |
Significant Other Observable Inputs (Level 2) |
Significant Unobservable Inputs (Level 3) |
||||||||||||||||||
| Assets |
||||||||||||||||||||
| Impaired Loans |
$ | 46,369 | $ | 0 | $ | 8,518 | $ | 37,851 | $ | 7,349 | ||||||||||
| OREO |
38,778 | 0 | 38,778 | 0 | 3,307 | |||||||||||||||
The following methods and assumptions were used by United in estimating its fair value disclosures for other financial instruments:
Cash and Cash Equivalents: The carrying amounts reported in the balance sheet for cash and cash equivalents approximate those assets’ fair values.
Securities held to maturity and other securities: The estimated fair values of held to maturity are based on quoted market prices, where available. If quoted market prices are not available, fair values are measured utilizing independent valuation techniques of identical or similar securities for which significant assumptions are derived primarily from or corroborated by observable market data. Third party vendors compile prices from various sources and may determine the fair value of identical or similar securities by using pricing models that considers observable market data. Any securities held to maturity not valued based upon the methods above are valued based on a discounted cash flow methodology using appropriately adjusted discount rates reflecting nonperformance and liquidity risks. Other securities consist mainly of shares of Federal Home Loan Bank and Federal Reserve Bank stock that do not have readily determinable fair values and are carried at cost.
Loans: The fair values of loans are estimated using discounted cash flow analyses, adjusted for estimated prepayments based on historical experience, using market interest rates currently being offered for loans with similar terms to borrowers of similar creditworthiness. The rates used take into account the position of an appropriate yield curve adjusted for a spread that considers credit risk and liquidity concerns.
127
Table of Contents
Deposits: The fair values of demand deposits (e.g., interest and noninterest checking, regular savings and certain types of money market accounts) are, by definition, equal to the amount payable on demand at the reporting date (i.e., their carrying amounts). The carrying amounts of variable-rate, fixed-term money market accounts and certificates of deposit approximate their fair values at the reporting date. Fair values of fixed-rate certificates of deposit are estimated using a discounted cash flow calculation that applies interest rates currently being offered on certificates to a schedule of aggregated expected monthly maturities on time deposits.
Short-term Borrowings: The carrying amounts of federal funds purchased, borrowings under repurchase agreements and other short-term borrowings approximate their fair values.
Long-term Borrowings: The fair values of United’s Federal Home Loan Bank borrowings and trust preferred securities are estimated using discounted cash flow analyses, based on United’s current incremental borrowing rates for similar types of borrowing arrangements.
The estimated fair values of United’s financial instruments are summarized below:
| Fair Value Measurements | ||||||||||||||||||||
| (In thousands)
|
Carrying Amount |
Fair Value |
Quoted Prices in Active Markets for Identical Assets (Level 1) |
Significant Other Observable Inputs (Level 2) |
Significant Unobservable Inputs (Level 3) |
|||||||||||||||
| December 31, 2015 |
||||||||||||||||||||
| Cash and cash equivalents |
$ | 857,335 | $ | 857,335 | $ | 0 | $ | 857,335 | $ | 0 | ||||||||||
| Securities available for sale |
1,066,334 | 1,066,334 | 3,532 | 1,028,116 | 34,686 | |||||||||||||||
| Securities held to maturity |
39,099 | 36,320 | 0 | 33,300 | 3,020 | |||||||||||||||
| Other securities |
98,749 | 93,811 | 0 | 0 | 93,811 | |||||||||||||||
| Loans held for sale |
10,681 | 10,681 | 0 | 10,681 | 0 | |||||||||||||||
| Loans |
9,308,354 | 9,289,463 | 0 | 0 | 9,289,463 | |||||||||||||||
| Derivative financial assets |
2,942 | 2,942 | 0 | 2,942 | 0 | |||||||||||||||
| Deposits |
9,341,527 | 9,332,451 | 0 | 9,332,451 | 0 | |||||||||||||||
| Short-term borrowings |
423,028 | 423,028 | 0 | 423,028 | 0 | |||||||||||||||
| Long-term borrowings |
1,015,249 | 988,270 | 0 | 988,270 | 0 | |||||||||||||||
| Derivative financial liabilities |
4,121 | 4,121 | 0 | 4,121 | 0 | |||||||||||||||
| December 31, 2014 |
||||||||||||||||||||
| Cash and cash equivalents |
$ | 753,064 | $ | 753,064 | $ | 0 | $ | 753,064 | $ | 0 | ||||||||||
| Securities available for sale |
1,180,386 | 1,180,386 | 2,502 | 1,138,326 | 39,558 | |||||||||||||||
| Securities held to maturity |
39,310 | 36,784 | 0 | 34,764 | 2,020 | |||||||||||||||
| Other securities |
96,344 | 91,527 | 0 | 0 | 91,527 | |||||||||||||||
| Loans held for sale |
8,680 | 8,680 | 0 | 8,680 | 0 | |||||||||||||||
| Loans |
9,029,123 | 9,055,281 | 0 | 0 | 9,055,281 | |||||||||||||||
| Derivative financial assets |
3,794 | 3,794 | 0 | 3,794 | 0 | |||||||||||||||
| Deposits |
9,045,485 | 9,044,976 | 0 | 9,044,976 | 0 | |||||||||||||||
| Short-term borrowings |
435,652 | 435,652 | 0 | 435,652 | 0 | |||||||||||||||
| Long-term borrowings |
1,105,314 | 1,081,133 | 0 | 1,081,133 | 0 | |||||||||||||||
| Derivative financial liabilities |
4,136 | 4,136 | 0 | 4,136 | 0 | |||||||||||||||
NOTE V— VARIABLE INTEREST ENTITIES
Variable interest entities (VIEs) are entities that either have a total equity investment that is insufficient to permit the entity to finance its activities without additional subordinated financial support or whose equity investors lack the characteristics of a controlling financial interest (i.e., ability to make significant decisions, through voting rights, right to receive the expected residual returns of the entity, and obligation to absorb the expected losses of the entity). VIEs can be structured as corporations, trusts, partnerships, or other legal entities. United’s business practices include relationships with certain VIEs. For United, the business purpose of these relationships primarily consists of funding activities in the form of issuing trust preferred securities.
128
Table of Contents
United currently sponsors thirteen statutory business trusts that were created for the purpose of raising funds that qualify for Tier I regulatory capital. These trusts, of which several were acquired through bank acquisitions, issued or participated in pools of trust preferred capital securities to third-party investors with the proceeds invested in junior subordinated debt securities of United. The Company, through a small capital contribution, owns 100% of the voting equity shares of each trust. The assets, liabilities, operations, and cash flows of each trust are solely related to the issuance, administration, and repayment of the preferred equity securities held by third-party investors. United fully and unconditionally guarantees the obligations of each trust and is obligated to redeem the junior subordinated debentures upon maturity.
The trusts utilized in these transactions are variable interest entities (VIEs) as the third-party equity holders lack a controlling financial interest in the trusts through their inability to make decisions that have a significant effect on the operations and success of the entities. United does not consolidate these trusts as it is not the primary beneficiary of these entities because United’s equity interest does not absorb the majority of the trusts’ expected losses or receive a majority of their expected residual returns. Information related to United’s statutory trusts is presented in Note K, Notes to Consolidated Financial Statements.
United, through its banking subsidiaries, also makes limited partner equity investments in various low income housing and community development partnerships sponsored by independent third-parties. United invests in these partnerships to either realize tax credits on its consolidated federal income tax return or for purposes of earning a return on its investment. These partnerships are considered VIEs as the limited partners lack a controlling financial interest in the entities through their inability to make decisions that have a significant effect on the operations and success of the partnerships. United’s limited partner interests in these entities is immaterial, however; these partnerships are not consolidated as United is not deemed to be the primary beneficiary.
The following table summarizes quantitative information about United’s significant involvement in unconsolidated VIEs:
| As of December 31, 2015 | As of December 31, 2014 | |||||||||||||||||||||||
| (In thousands) | Aggregate
Assets |
Aggregate
Liabilities |
Risk Of
Loss (1) |
Aggregate
Assets |
Aggregate
Liabilities |
Risk Of
Loss (1) |
||||||||||||||||||
| Trust preferred securities |
$ | 240,468 | $ | 232,492 | $ | 7,976 | $ | 241,147 | $ | 233,222 | $ | 7,925 | ||||||||||||
| (1) Represents investment in VIEs. |
| |||||||||||||||||||||||
NOTE W—QUARTERLY FINANCIAL DATA (UNAUDITED)
Quarterly financial data for 2015 and 2014 is summarized below (dollars in thousands, except for per share data):
| (Dollars in thousands) | 1st Quarter | 2nd Quarter | 3rd Quarter | 4th Quarter | ||||||||||||
| 2015 |
||||||||||||||||
| Interest income |
$ | 104,549 | $ | 105,532 | $ | 106,309 | $ | 107,240 | ||||||||
| Interest expense |
9,800 | 9,630 | 9,991 | 10,085 | ||||||||||||
| Net interest income |
94,749 | 95,902 | 96,318 | 97,155 | ||||||||||||
| Provision for credit losses |
5,354 | 5,716 | 5,182 | 6,322 | ||||||||||||
| Mortgage banking income |
545 | 663 | 665 | 634 | ||||||||||||
| Securities gains (losses), net |
12 | 3 | 111 | 29 | ||||||||||||
| Other noninterest income |
17,634 | 18,832 | 17,036 | 17,462 | ||||||||||||
| Noninterest expense |
57,655 | 57,730 | 57,684 | 58,618 | ||||||||||||
| Income taxes |
15,304 | 17,145 | 16,217 | 16,864 | ||||||||||||
| Net income (1) |
34,627 | 34,809 | 35,047 | 33,476 | ||||||||||||
| Per share data: |
||||||||||||||||
| Average shares outstanding (000s): |
||||||||||||||||
| Basic |
69,208 | 69,306 | 69,391 | 69,432 | ||||||||||||
| Diluted |
69,477 | 69,587 | 69,690 | 69,737 | ||||||||||||
| Net income per share: |
||||||||||||||||
| Basic |
$ | 0.50 | $ | 0.50 | $ | 0.50 | $ | 0.48 | ||||||||
| Diluted |
$ | 0.50 | $ | 0.50 | $ | 0.50 | $ | 0.48 | ||||||||
| Dividends per share |
$ | 0.32 | $ | 0.32 | $ | 0.32 | $ | 0.33 | ||||||||
129
Table of Contents
| (Dollars in thousands) | 1st Quarter | 2nd Quarter | 3rd Quarter | 4th Quarter | ||||||||||||
| 2014 |
||||||||||||||||
| Interest income |
$ | 95,164 | $ | 104,799 | $ | 106,857 | $ | 111,722 | ||||||||
| Interest expense |
9,862 | 10,867 | 10,939 | 11,166 | ||||||||||||
| Net interest income |
85,302 | 93,932 | 95,918 | 100,556 | ||||||||||||
| Provision for credit losses |
4,679 | 6,201 | 4,748 | 6,309 | ||||||||||||
| Mortgage banking income |
259 | 438 | 774 | 405 | ||||||||||||
| Securities losses, net |
185 | (420) | (3,405) | 528 | ||||||||||||
| Other noninterest income |
25,943 | 18,976 | 18,797 | 18,482 | ||||||||||||
| Noninterest expense |
61,026 | 57,103 | 57,694 | 64,024 | ||||||||||||
| Income taxes |
15,860 | 16,375 | 16,382 | 16,381 | ||||||||||||
| Net income (1) |
30,124 | 33,247 | 33,260 | 33,257 | ||||||||||||
| Per share data: |
||||||||||||||||
| Average shares outstanding (000s): |
||||||||||||||||
| Basic |
62,435 | 68,956 | 69,045 | 69,089 | ||||||||||||
| Diluted |
62,707 | 69,154 | 69,269 | 69,355 | ||||||||||||
| Net income per share: |
||||||||||||||||
| Basic |
$ | 0.48 | $ | 0.48 | $ | 0.48 | $ | 0.48 | ||||||||
| Diluted |
$ | 0.48 | $ | 0.48 | $ | 0.48 | $ | 0.48 | ||||||||
| Dividends per share |
$ | 0.32 | $ | 0.32 | $ | 0.32 | $ | 0.32 | ||||||||
| (1) | For further information, see the related discussion “Quarterly Results” included in Management’s Discussion and Analysis. |
| Item 9. | CHANGES IN AND DISAGREEMENTS WITH ACCOUNTANTS ON ACCOUNTING AND FINANCIAL DISCLOSURES |
This item is omitted since it is not applicable.
| Item 9A. | CONTROLS AND PROCEDURES |
Disclosure Controls and Procedures
United Bankshares, Inc. (the Company) maintains controls and procedures designed to ensure that it is able to collect the information it is required to disclose in the reports it files with the SEC, and to process, summarize and disclose this information within the time periods specified in the rules of the SEC. Based on an evaluation of the Company’s disclosure controls and procedures as of the end of the period covered by this report conducted by the Company’s management, with the participation of the Chief Executive and Chief Financial Officer, the Chief Executive and Chief Financial Officer believe that these controls and procedures are effective to ensure that the Company is able to collect, process and disclose the information it is required to disclose in the reports it files with the SEC within the required time periods.
Management’s Report on Internal Control over Financial Reporting
Management’s Report on internal control over financial reporting and the audit report of Ernst & Young LLP, the Company’s independent registered public accounting firm, on internal control over financial reporting is included on pages 67-68 of this report and are incorporated in this Item 9A by reference.
Changes In Internal Control Over Financial Reporting
There have not been any changes in the Company’s internal control over financial reporting (as such term is defined in Rule 13a-15(f) under the Exchange Act) during the fiscal quarter ended December 31, 2015 that have materially affected, or are reasonably likely to materially affect, the Company’s internal control over financial reporting.
130
Table of Contents
| Item 9B. | OTHER INFORMATION |
United entered into an employment contract with Richard M. Adams, the Chairman of the Board of Directors and Chief Executive Officer of the Company effective February 28, 2011. The original term of Mr. Adams’ employment contract was for three years, with the provision that the contract could be extended annually for one (1) year to maintain a rolling three (3) year contract.
At the Compensation Committee (the “Committee”) meeting of the Company on February 29, 2016, the Committee approved the extension of the employment contract with Mr. Adams for an additional year until March 31, 2019.
131
Table of Contents
UNITED BANKSHARES, INC.
FORM 10-K, PART III
| Item 10. | DIRECTORS, EXECUTIVE OFFICERS AND CORPORATE GOVERNANCE |
Information regarding directors and executive officers of the registrant including their reporting compliance under Section 16(a) of the Securities Exchange Act of 1934 is incorporated by reference from United’s definitive proxy statement for the 2016 Annual Meeting of Shareholders under the caption “Directors Whose Terms Expire in 2016 and Nominees for Directors” under the heading “PROPOSAL 1: ELECTION OF DIRECTORS”, under the caption “Section 16(a) Beneficial Ownership Reporting Compliance” under the heading “COMMON STOCK OWNERSHIP OF CERTAIN BENEFICIAL OWNERS AND MANAGEMENT” and under the captions “Executive Officers” and “Family Relationships” under the heading “GOVERNANCE OF THE COMPANY.”
United has adopted a code of ethics for its Chief Executive Officer, Chief Financial Officer, Controller and persons performing similar functions of the registrant in accordance with Section 406 of the Sarbanes-Oxley Act of 2002. A copy of the code of ethics is posted on United’s web site at www.ubsi-inc.com.
Information related to the registrant’s audit committee and its financial expert in accordance with Section 407 of the Sarbanes-Oxley Act of 2002 is incorporated by reference from United’s definitive proxy statement for the 2016 Annual Meeting of Shareholders under the captions “The Audit Committee” and the “Audit Committee Financial Expert” under the heading “GOVERNANCE OF THE COMPANY.”
Since the disclosure of the procedures in the definitive proxy statement for the 2015 Annual Meeting of Shareholders, United has not adopted any changes to the procedures by which shareholders may recommend nominees to United’s Board of Directors as set forth in Article II, Section 5 of the Restated Bylaws of United.
| Item 11. | EXECUTIVE COMPENSATION |
Information regarding executive compensation is incorporated by reference from United’s definitive proxy statement for the 2016 Annual Meeting of Shareholders under the heading of “EXECUTIVE COMPENSATION”, under the heading “COMPENSATION DISCUSSION AND ANALYSIS (CD&A)”, and under the heading “REPORT OF THE COMPENSATION COMMITTEE ON EXECUTIVE COMPENSATION.”
| Item 12. | SECURITY OWNERSHIP OF CERTAIN BENEFICIAL OWNERS AND MANAGEMENT AND RELATED STOCKHOLDER MATTERS |
Information regarding security ownership of certain beneficial owners and management and securities authorized under equity compensation plans is incorporated by reference from United’s definitive proxy statement for the 2016 Annual Meeting of Shareholders under the caption “Directors Whose Terms Expire in 2016 and Nominees for Directors” under the heading “PROPOSAL 1: ELECTION OF DIRECTORS” and under the captions “Beneficial Ownership of Directors and Named Executive Officers”, “Principal Shareholders of United” and “Related Shareholder Matters” under the heading “COMMON STOCK OWNERSHIP OF CERTAIN BENEFICIAL OWNERS AND MANAGEMENT.”
| Item 13. | CERTAIN RELATIONSHIPS AND RELATED TRANSACTIONS, AND DIRECTOR INDEPENDENCE |
Information regarding certain relationships and related transactions is incorporated by reference from United’s definitive proxy statement for the 2016 Annual Meeting of Shareholders under the captions of “Related Party Transactions” and “Independence of Directors” under the heading “GOVERNANCE OF THE COMPANY.”
132
Table of Contents
| Item 14. | PRINCIPAL ACCOUNTING FEES AND SERVICES |
Information regarding approval of audit and non-audit services by the Audit Committee as well as fees paid to auditors is incorporated by reference from United’s definitive proxy statement for the 2016 Annual Meeting of Shareholders under the captions “Pre-Approval Policies and Procedures” and “Independent Registered Public Accounting Firm Fees Information” under the heading “AUDIT COMMITTEE AND INDEPENDENT REGISTERED PUBLIC ACCOUNTING FIRM.”
133
Table of Contents
UNITED BANKSHARES, INC.
FORM 10-K, PART IV
| Item 15. | EXHIBITS, FINANCIAL STATEMENT SCHEDULES |
| (a) | List of Documents Filed as Part of This Report: |
| (1) | Financial Statements |
United’s consolidated financial statements required in response to this Item are incorporated by reference from Item 8 of this Annual Report on Form 10-K.
| (2) | Financial Statement Schedules |
United is not filing separate financial statement schedules because of the absence of conditions under which they are required or because the required information is included in the consolidated financial statements or notes thereto.
| (3) | Exhibits Required by Item 601 |
Listing of Exhibits—See the Exhibits’ Index on page 135 of this Form 10-K.
| (b) | Exhibits — The exhibits to this Form 10-K begin on page 140. |
| (c) | Consolidated Financial Statement Schedules — All other schedules for which provision is made in the applicable accounting regulation of the Securities and Exchange Commission are not required under the related instructions or are inapplicable or pertain to items as to which the required disclosures have been made elsewhere in the financial statements and notes thereto, and therefore have been omitted. |
All reports filed electronically by United with the Securities and Exchange Commission (SEC), including the annual report on Form 10-K, quarterly reports on Form 10-Q, and current reports on Form 8-K, as well as any amendments to those reports, are accessible at no cost on United’s web site at www.ubsi-inc.com. These filings are also accessible on the SEC’s web site at www.sec.gov.
134
Table of Contents
UNITED BANKSHARES, INC.
FORM 10-K
INDEX TO EXHIBITS
| Description |
S-K Item 601 Table Reference |
Sequential Page Number | ||
| Agreement and Plan of Reorganization with Bank of Georgetown |
(2) | (a) | ||
| Joint Waiver and Agreement |
(b) | |||
| Articles of Incorporation and Bylaws: |
(3) | |||
| (a) Restated and Amended Articles of Incorporation |
(c) | |||
| (b) Bylaws |
(d) | |||
| Material Contracts |
(10) | |||
| (a) Fourth Amended Employment Agreement for |
(e) | |||
| (b) Third Amended Employment Agreement for |
(f) | |||
| (c) Second Amended and Restated Supplemental |
(g) | |||
| (d) First Amendment to Second Amended and Restated |
(h) | |||
| (e) Amended and Restated Change of Control Agreement |
(i) | |||
| (f) Form of the Amendment and First Restatement of |
(j) | |||
| (g) Form of the First Amendment to Second Amendment |
(k) | |||
| (h) Form of the Amendment and First Restatement of |
(l) | |||
| (i) Employment Agreement with J. Paul McNamara |
(m) | |||
135
Table of Contents
| Description |
S-K Item 601 Table Reference |
Sequential Page Number | ||
| (j) Amendment and Restated Supplemental Executive |
(n) | |||
| (k) Amended and Restated Deferred Compensation |
(o) | |||
| (l) First Amendment to Life Insurance Endorsement |
(p) | |||
| (m) Supplemental Executive Retirement Agreement for |
(q) | |||
| (n) Supplemental Executive Retirement Agreement for |
(r) | |||
| (o) Form of Independent Contractor Agreement with |
(s) | |||
| (p) Second Amended and Restated United Bankshares, Inc. |
(t) | |||
| (q) Amended and Restated United Bankshares, Inc. |
(u) | |||
| (r) United Bankshares, Inc., United Bank, Inc. and |
(v) | |||
| (s) United Bankshares, Inc., United Bank, Inc. and |
(w) | |||
| (t) United Bankshares, Inc. 2011 Long-term Incentive Plan |
(x) | |||
| (u) Form of Independent Contractor Agreement with |
(y) | |||
| (v) Form of Independent Contractor Agreement with |
(z) | |||
| Statement Re: Computation of Ratios |
(12) | Filed herewith | ||
| Subsidiaries of the Registrant |
(21) | Filed herewith | ||
| Consent of Ernst & Young LLP |
(23) | Filed herewith | ||
| Certification as Adopted Pursuant to Section 302(a) of the |
(31.1) | Filed herewith | ||
| Certification as Adopted Pursuant to Section 302(a) of the |
(31.2) | Filed herewith | ||
136
Table of Contents
| Description |
S-K Item 601 Table Reference |
Sequential Page Number | ||||
| Certification Pursuant to 18 U.S.C. Section 1350, as Adopted Pursuant to Section 906 of the Sarbanes-Oxley Act of 2002 by Chief Executive Officer |
*
|
(32.1) | Filed herewith | |||
| Certification Pursuant to 18 U.S.C. Section1350, as Adopted Pursuant to Section 906 of the Sarbanes-Oxley Act of 2002 by Chief Financial Officer |
*
|
(32.2) | Filed herewith | |||
| Interactive data file (XBRL) |
(101) | (aa) | ||||
Footnotes
| * | Furnished not filed. |
| (a) | Incorporated into this filing by reference to Exhibit 2.1 to the Form 8-K dated and filed November 9, 2015 for United Bankshares, Inc., File No. 0-13322. |
| (b) | Incorporated into this filing by reference to Exhibit 10.2 to the Form 8-K dated November 29, 2013 and filed November 29, 2013 for United Bankshares, Inc., File No. 0-13322. |
| (c) | Incorporated into this filing by reference to Exhibit 3.1 to the Form 8-K dated December 23, 2008 and filed December 31, 2008 for United Bankshares, Inc., File No. 0-13322. |
| (d) | Incorporated into this filing by reference to Exhibit 3.2 to the Form 8-K dated January 25, 2010 and filed January 29, 2010 for United Bankshares, Inc., File No. 0-13322. |
| (e) | Incorporated into this filing by reference to Exhibit 10.5 to the 2011 Form 10-K dated February 28, 2012 and filed February 29, 2012 for United Bankshares, Inc., File No. 0-13322. |
| (f) | Incorporated into this filing by reference to Exhibit 10.1 to the Form 8-K dated November 24, 2008 and filed November 26, 2008 for United Bankshares, Inc., File No. 0-13322. |
| (g) | Incorporated into this filing by reference to Exhibit 10.4 to the Form 8-K dated November 24, 2008 and filed November 26, 2008 for United Bankshares, Inc., File No. 0-13322. |
| (h) | Incorporated into this filing by reference to Exhibit 10.6 to the 2011 Form 10-K dated February 28, 2012 and filed February 29, 2012 for United Bankshares, Inc., File No. 0-13322. |
| (i) | Incorporated into this filing by reference to Exhibit 10.9 to the Form 8-K dated November 24, 2008 and filed November 26, 2008 for United Bankshares, Inc., File No. 0-13322. |
| (j) | Incorporated into this filing by reference to Exhibit 10.5 to the Form 8-K dated November 24, 2008 and filed November 26, 2008 for United Bankshares, Inc., File No. 0-13322. |
| (k) | Incorporated into this filing by reference to Exhibit 10.7 to the 2011 Form 10-K dated February 28, 2012 and filed February 29, 2012 for United Bankshares, Inc., File No. 0-13322. |
| (l) | Incorporated into this filing by reference to Exhibit 10.6 to the Form 8-K dated November 24, 2008 and filed November 26, 2008 for United Bankshares, Inc., File No. 0-13322. |
| (m) | Incorporated into this filing by reference to Exhibit 10.1 to Form S-4 Registration Statement of United Bankshares, Inc., Registration No. 33-106890 filed July 9, 2003. |
| (n) | Incorporated into this filing by reference to Exhibit 10.7 to the Form 8-K dated November 24, 2008 and filed November 26, 2008 for United Bankshares, Inc., File No. 0-13322. |
137
Table of Contents
| (o) | Incorporated into this filing by reference to Exhibit 10.8 to the Form 8-K dated November 24, 2008 and filed November 26, 2008 for United Bankshares, Inc., File No. 0-13322. |
| (p) | Incorporated into this filing by reference to Exhibit 10.11 to the Form 8-K dated November 24, 2008 and filed November 26, 2008 for United Bankshares, Inc., File No. 0-13322. |
| (q) | Incorporated into this filing by reference to Exhibit 10.1 to the 2013 Form 10-K dated and filed on March 3, 2014 for United Bankshares, Inc., File No. 0-13322. |
| (r) | Incorporated into this filing by reference to Exhibit 10.2 to the 2013 Form 10-K dated and filed on March 3, 2014 for United Bankshares, Inc., File No. 0-13322. |
| (s) | Incorporated into this filing by reference to Exhibit 10.2 to the Form 8-K dated January 31, 2014 and filed February 3, 2014 for United Bankshares, Inc., File No. 0-13322. |
| (t) | Incorporated into this filing by reference to Exhibit 10.3 to the Form 8-K dated November 24, 2008 and filed November 26, 2008 for United Bankshares, Inc., File No. 0-13322. |
| (u) | Incorporated into this filing by reference to Exhibit 10.10 to the Form 8-K dated November 24, 2008 and filed November 26, 2008 for United Bankshares, Inc., File No. 0-13322. |
| (v) | Incorporated into this filing by reference to Exhibit 10.12 to the Form 8-K dated November 24, 2008 and filed November 26, 2008 for United Bankshares, Inc., File No. 0-13322. |
| (w) | Incorporated into this filing by reference to Exhibit 10.13 to the Form 8-K dated November 24, 2008 and filed November 26, 2008 for United Bankshares, Inc., File No. 0-13322. |
| (x) | Incorporated into this filing by reference to Exhibit A to 2011 Proxy Statement dated April 8, 2011 and filed April 8, 2011 for United Bankshares, Inc., File No. 0-13322. |
| (y) | Incorporated into this filing by reference to Exhibit 10.1 to the Form 8-K dated April 30, 2014 and filed May 2, 2014 for United Bankshares, Inc., File No. 0-13322. |
| (z) | Incorporated into this filing by reference to Exhibit 10.1 to the Form 8-K dated December 31, 2014 and filed January 7, 2015 for United Bankshares, Inc., File No. 0-13322. |
| (aa) | Exhibit not provided herein. The interactive data file (XBRL) exhibit is available through United’s corporate website at www.ubsi-inc.com. |
138
Table of Contents
SIGNATURES
Pursuant to the requirements of Section 13 or 15 (d) of the Securities Exchange Act of 1934, the registrant has duly caused this report to be signed on its behalf by the undersigned thereunto duly authorized.
UNITED BANKSHARES, INC.
(Registrant)
/s/ Richard M. Adams
Chairman of the Board
Pursuant to the requirements of the Securities Exchange Act of 1934, this report has been signed below by the following persons on behalf of the registrant and in the capacities and on the dates indicated.
| Signatures | Title | Date | ||||
| /s/ Richard M. Adams |
Chairman of the Board, Director, and Chief Executive Officer | February 29, 2016 | ||||
| /s/ W.Mark Tatterson |
Chief Financial Officer Chief Accounting Officer | February 29, 2016 | ||||
| /s/ Theodore J. Georgelas |
Director | February 29, 2016 | ||||
| /s/ Mark R. Nesselroad |
Director | February 29, 2016 | ||||
| /s/ John M. McMahon |
Director | February 29, 2016 | ||||
| /s/ Lawrence K. Doll |
Director | February 29, 2016 | ||||
| /s/ Mary K. Weddle |
Director | February 29, 2016 | ||||
| /s/ Peter A. Converse |
Director | February 29, 2016 | ||||
| /s/ Robert G. Astorg |
Director | February 29, 2016 | ||||
| /s/ J. Paul McNamara |
Director | February 29, 2016 | ||||
| /s/ W. Douglas Fisher |
Director | February 29, 2016 | ||||
| /s/ Gary G. White |
Director |
February 29, 2016 | ||||
| /s/ P. Clinton Winter, Jr. |
Director |
February 29, 2016 | ||||
139