Attached files
| file | filename |
|---|---|
| EX-31.1 - EX-31.1 - ProShares Trust II | d92789dex311.htm |
| EX-32.2 - EX-32.2 - ProShares Trust II | d92789dex322.htm |
| EX-31.2 - EX-31.2 - ProShares Trust II | d92789dex312.htm |
| EX-32.1 - EX-32.1 - ProShares Trust II | d92789dex321.htm |
| EX-23.1 - EX-23.1 - ProShares Trust II | d92789dex231.htm |
| XML - IDEA: XBRL DOCUMENT - ProShares Trust II | R9999.htm |
Table of Contents
UNITED STATES
SECURITIES AND EXCHANGE COMMISSION
Washington, D.C. 20549
FORM 10-K
| x | Annual report pursuant to Section 13 or 15(d) of the Securities Exchange Act of 1934 for the fiscal year ended December 31, 2015. |
or
| ¨ | Transition report pursuant to Section 13 or 15(d) of the Securities Exchange Act of 1934 for the transition period from to . |
Commission file number: 001-34200
PROSHARES TRUST II
(Exact name of registrant as specified in its charter)
| Delaware | 87-6284802 | |
| (State or other jurisdiction of incorporation or organization) |
(I.R.S. Employer Identification No.) |
c/o ProShare Capital Management LLC
7501 Wisconsin Avenue, Suite 1000
Bethesda, Maryland 20814
(Address of principal executive offices) (Zip Code)
(240) 497-6400
(Registrant’s telephone number, including area code)
Securities registered pursuant to Section 12(b) of the Act:
| Common Units of Beneficial Interest | NYSE Arca, Inc. | |
| (Title of each class) | (Name of exchange on which registered) | |
| (Title of class) | (Name of exchange on which registered) | |
Securities registered pursuant to Section 12(g) of the Act: None
Indicate by check mark if the registrant is a well-known seasoned issuer, as defined in Rule 405 of the Securities Act. x Yes ¨ No
Indicate by check mark if the registrant is not required to file reports pursuant to Section 13 or Section 15(d) of the Act. ¨ Yes x No
Indicate by check mark whether the registrant (1) has filed all reports required to be filed by Section 13 or 15(d) of the Securities Exchange Act of 1934 during the preceding 12 months (or for such shorter period that the registrant was required to file such reports), and (2) has been subject to such filing requirements for the past 90 days. x Yes ¨ No
Indicate by check mark whether the registrant has submitted electronically and posted on its corporate Website, if any, every Interactive Data File required to be submitted and posted pursuant to Rule 405 of Regulation S-T (§232.405 of this chapter) during the preceding 12 months (or for such shorter period that the registrant was required to submit and post such files). x Yes ¨ No
Indicate by check mark if disclosure of delinquent filers pursuant to Item 405 of Regulation S-K (§229.405 of this chapter) is not contained herein, and will not be contained, to the best of registrant’s knowledge, in definitive proxy or information statements incorporated by reference in Part III of this Form 10-K or any amendment to this Form 10-K. x
Indicate by check mark whether the registrant is a large accelerated filer, an accelerated filer, a non-accelerated filer or a smaller reporting company. See the definitions of “large accelerated filer,” “accelerated filer” and “smaller reporting company” in Rule 12b-2 of the Exchange Act.
| Large accelerated filer x | Accelerated filer ¨ | |||
| Non-accelerated filer ¨ | (Do not check if a smaller reporting company) | Smaller reporting company ¨ | ||
Indicate by check mark whether the registrant is a shell company (as defined in Rule 12b-2 of the Exchange Act.). ¨ Yes x No
The aggregate market value of each Fund’s units held by non-affiliates as of June 30, 2015 and the number of outstanding units for each Fund as of February 18, 2016 are included in the table below.
Table of Contents
| Aggregate Market Value of the Fund’s Units Held by Non-Affiliates as of June 30, 2015 |
|
Number of Outstanding Units as of February 18, 2016 |
||||||||||||
| ProShares Managed Futures Strategy |
$ | 9,405,209 | 350,010 | |||||||||||
| ProShares VIX Short-Term Futures ETF |
168,418,477 | 5,099,811 | ||||||||||||
| ProShares VIX Mid-Term Futures ETF |
26,470,911 | 412,403 | ||||||||||||
| ProShares Short VIX Short-Term Futures ETF |
189,747,162 | 14,350,000 | ||||||||||||
| ProShares Ultra VIX Short-Term Futures ETF |
426,519,614 | 7,052,448 | ||||||||||||
| ProShares UltraShort Bloomberg Commodity |
5,337,333 | 59,995 | ||||||||||||
| ProShares UltraShort Bloomberg Crude Oil |
181,067,201 | 969,942 | ||||||||||||
| ProShares UltraShort Bloomberg Natural Gas |
13,156,390 | 74,944 | ||||||||||||
| ProShares UltraShort Gold |
73,816,366 | 596,977 | ||||||||||||
| ProShares UltraShort Silver |
60,618,396 | 616,976 | ||||||||||||
| ProShares Short Euro |
19,372,715 | 400,000 | ||||||||||||
| ProShares UltraShort Australian Dollar |
19,281,775 | 350,000 | ||||||||||||
| ProShares UltraShort Euro |
629,887,847 | 17,500,000 | ||||||||||||
| ProShares UltraShort Yen |
405,570,914 | 2,499,290 | ||||||||||||
| ProShares Ultra Bloomberg Commodity |
2,349,354 | 199,961 | ||||||||||||
| ProShares Ultra Bloomberg Crude Oil |
988,879,588 | 103,827,866 | ||||||||||||
| ProShares Ultra Bloomberg Natural Gas |
62,926,084 | 1,942,169 | ||||||||||||
| ProShares Ultra Gold |
88,896,519 | 2,250,000 | ||||||||||||
| ProShares Ultra Silver |
287,418,504 | 7,946,526 | ||||||||||||
| ProShares Ultra Euro |
13,272,232 | 700,000 | ||||||||||||
| ProShares Ultra Yen |
5,359,606 | 99,970 | ||||||||||||
DOCUMENTS INCORPORATED BY REFERENCE:
None.
THE FINANCIAL STATEMENT SCHEDULES CONTAINED IN PART IV OF THIS ANNUAL REPORT ON FORM 10-K CONSTITUTE THE ANNUAL REPORT WITH RESPECT TO THE COMMODITY POOLS FOR PURPOSES OF COMMODITY FUTURES TRADING COMMISSION RULE 4.22(C)
Table of Contents
PROSHARES TRUST II
Table of Contents
Table of Contents
Summary
ProShares Trust II (formerly known as the Commodities and Currencies Trust) (the “Trust”) is a Delaware statutory trust formed on October 9, 2007 and is currently organized into separate series (each, a “Fund” and collectively, the “Funds”). As of December 31, 2015, the following twenty-one series of the Trust have commenced investment operations: (i) ProShares Managed Futures Strategy (the “Managed Futures Fund”); (ii) ProShares VIX Short-Term Futures ETF and ProShares VIX Mid-Term Futures ETF (each, a “Matching VIX Fund” and collectively, the “Matching VIX Funds”); (iii) ProShares Short VIX Short-Term Futures ETF and ProShares Ultra VIX Short-Term Futures ETF (each, a “Geared VIX Fund” and collectively, the “Geared VIX Funds”); and (iv) ProShares UltraShort Bloomberg Commodity, ProShares UltraShort Bloomberg Crude Oil, ProShares UltraShort Bloomberg Natural Gas, ProShares UltraShort Gold, ProShares UltraShort Silver, ProShares UltraShort Australian Dollar, ProShares UltraShort Euro, ProShares UltraShort Yen, ProShares Ultra Bloomberg Commodity, ProShares Ultra Bloomberg Crude Oil, ProShares Ultra Bloomberg Natural Gas, ProShares Ultra Gold, ProShares Ultra Silver, ProShares Ultra Euro and ProShares Ultra Yen (each, a “Leveraged Fund” and collectively, the “Leveraged Funds”); and (v) ProShares Short Euro (the “Short Euro Fund”). Each of the Funds listed above issues common units of beneficial interest (“Shares”), which represent units of fractional undivided beneficial interest in and ownership of only that Fund. The Shares of each Fund are listed on the New York Stock Exchange Archipelago (“NYSE Arca”), as further described below. The Managed Futures Fund and the Matching VIX Funds are collectively referred to as the “Matching Funds” in this Annual Report on Form 10-K. The Geared VIX Funds and the Matching VIX Funds are collectively referred to as the “VIX Funds” in this Annual Report on Form 10-K. The Leveraged Funds, the Short Euro Fund and the Geared VIX Funds, are collectively referred to as the “Geared Funds” in this Annual Report on Form 10-K.
On May 22, 2015, the Trust announced plans to liquidate ProShares Ultra Australian Dollar (ticker symbol: GDAY). ProShares Ultra Australian Dollar was closed to purchases and redemptions as of the close of regular trading on the NYSE Arca on June 18, 2015. Beginning June 19, 2015, no secondary market for ProShares Ultra Australian Dollar’s Shares remained. Proceeds of the liquidation were distributed to shareholders on June 29, 2015. Any shareholders remaining in the fund on June 29, 2015 automatically had their shares redeemed for cash at ProShares Ultra Australian Dollar’s net asset value per Share as of June 19, 2015. On June 30, 2015, the NYSE Arca filed a Form 25 removing the listing of ProShares Ultra Australian Dollar on the NYSE Arca. On July 10, 2015, a Form 15 was filed with the U.S. Securities and Exchange Commission (“SEC”) terminating the registration of ProShares Ultra Australian Dollar.
The Trust had no operations prior to November 24, 2008, other than matters relating to its organization, the registration of each series under the Securities Act of 1933, as amended, and the sale and issuance to ProShare Capital Management LLC (the “Sponsor”) of fourteen Shares at an aggregate purchase price of $350 in each of the following Funds: ProShares UltraShort Bloomberg Commodity, ProShares UltraShort Bloomberg Crude Oil, ProShares UltraShort Gold, ProShares UltraShort Silver, ProShares UltraShort Euro, ProShares UltraShort Yen, ProShares Ultra Bloomberg Commodity, ProShares Ultra Bloomberg Crude Oil, ProShares Ultra Gold, ProShares Ultra Silver, ProShares Ultra Euro and ProShares Ultra Yen.
Groups of Funds are collectively referred to in this Annual Report on Form 10-K in several different ways. References to “Short Funds,” “UltraShort Funds,” or “Ultra Funds” refer to the different Funds based upon their investment objectives, but without distinguishing among the Funds’ benchmarks. References to “Commodity Index Funds,” “Commodity Funds” and “Currency Funds” refer to the different Funds according to their general benchmark categories without distinguishing among the Funds’ investment objectives or Fund-specific benchmarks. References to “VIX Funds” or the “Managed Futures Fund” refer to the different Funds based upon their investment objective and their general benchmark categories.
Each of the Funds generally invests in Financial Instruments (i.e., instruments whose value is derived from the value of an underlying asset, rate or index, including futures contracts, swap agreements, forward contracts and other instruments) as a substitute for investing directly in commodities, currencies, or spot volatility products in order to gain exposure to its applicable commodity futures index, commodity, currency exchange rate or equity volatility index. Financial Instruments also are used to produce economically “inverse,” “inverse leveraged” or “leveraged” investment results for the Geared Funds.
1
Table of Contents
As further described below, each “Short” Fund seeks daily investment results (before fees and expenses) that correspond to the inverse (-1x) of the daily performance of its corresponding benchmark. Each “UltraShort” Fund seeks daily investment results (before fees and expenses) that correspond to two times the inverse (-2x) of the daily performance of its corresponding benchmark. Each “Ultra” Fund seeks daily investment results (before fees and expenses) that correspond to two times (2x) the daily performance of its corresponding benchmark. Each Matching VIX Fund and the Managed Futures Fund seek investment results (before fees and expenses), both over a single day and over time, that match the performance of its corresponding benchmark. Daily performance is measured from the calculation of one net asset value per Share (“NAV”) to the next.
Each Geared Fund seeks investment results for a single day only, not for longer periods. A “single day” is measured from the time a Fund calculates its respective NAV to the time of the Fund’s next NAV calculation. This is different from most exchange-traded funds and means that the return of such Geared Fund for a period longer than a single trading day will be the result of each day’s returns compounded over the period, which will very likely differ from -1x, -2x or 2x of the return of the index to which such Geared Fund is benchmarked for that period. A Geared Fund will lose money if its benchmark’s performance is flat over time, and it is possible for a Geared Fund to lose money over time even if its benchmark’s performance increases (or decreases, in the case of a Short or UltraShort Fund). Longer holding periods, higher benchmark volatility, inverse exposure and greater leverage each affect the impact of compounding on a Geared Fund’s returns. Daily compounding of a Geared Fund’s investment returns can dramatically and adversely affect its longer-term performance during periods of high volatility. Geared Funds are riskier than similarly benchmarked exchange-traded funds that are not geared. Accordingly, these Funds may not be suitable for all investors and should be used only by knowledgeable investors who understand the potential consequences of seeking daily leveraged, inverse or inverse leveraged investment results. Shareholders who invest in the Funds should actively manage and monitor their investments, as frequently as daily.
Each Geared Fund and the Managed Futures Fund continuously offers and redeems its Shares in blocks of 50,000 Shares and each Matching VIX Fund continuously offers and redeems shares in blocks of 25,000 Shares (each such block a “Creation Unit”). Only Authorized Participants may purchase and redeem Shares from a Fund and then only in Creation Units. An Authorized Participant is an entity that has entered into an Authorized Participant Agreement with one or more of the Funds. Shares of the Funds are offered to Authorized Participants in Creation Units at each Fund’s respective NAV. Authorized Participants may then offer to the public, from time to time, Shares from any Creation Unit they create at a per-Share market price that varies depending on, among other factors, the trading price of the Shares of each Fund on the NYSE Arca, the NAV per Share and the supply of and demand for the Shares at the time of the offer. Shares from the same Creation Unit may be offered at different times and may have different offering prices based upon the above factors. Additionally, the price at which an Authorized Participant sells a Share may be higher or lower than the price paid by such Authorized Participant in connection with the creation of such Share in a Creation Unit. The form of Authorized Participant Agreement and related Authorized Participant Handbook set forth the terms and conditions under which an Authorized Participant may purchase or redeem a Creation Unit. Authorized Participants do not receive from any Fund, the Sponsor, or any of their affiliates, any fees or compensation in connection with their sale of Shares to the public. An Authorized Participant may receive commissions or fees from investors who purchase Shares through their commission or fee-based brokerage accounts.
On March 19, 2015, the company that ran the London U.S. dollar gold fixing, ceased calculating the price of gold for the London Bullion Market Association (the “LBMA”). The LBMA selected ICE Benchmark Administration to calculate the price, which was renamed the LBMA Gold Price, and is based on an electronic, physically settled auction-based methodology, beginning on March 20, 2015.
As of December 31, 2015, ProShare Capital Management LLC, a Maryland limited liability company, served as the Trust’s Sponsor (the “Sponsor”) and commodity pool operator. On February 17, 2013, the Sponsor’s commodity trading advisor registration was withdrawn. Wilmington Trust Company serves as the Trustee of the Trust (the “Trustee”). The Funds are commodity pools, as defined in the Commodity Exchange Act (the “CEA”) and the applicable regulations of the Commodity Futures Trading Commission (the “CFTC”) and are operated by the Sponsor, a commodity pool operator registered with the CFTC. The Trust is not an investment company registered under the Investment Company Act of 1940, as amended (the “1940 Act”).
2
Table of Contents
The Sponsor maintains an Internet website at www.ProShares.com, through which monthly account statements and the Trust’s Annual Report on Form 10-K, Quarterly Reports on Form 10-Q, Current Reports on Form 8-K and amendments to those reports filed or furnished pursuant to Section 13(a) or 15(d) of the Securities Exchange Act of 1934, as amended (the “1934 Act”), can be accessed free of charge, as soon as reasonably practicable after such material is electronically filed with, or furnished to, the U.S. Securities and Exchange Commission (the “SEC”). Additional information regarding the Trust may also be found on the SEC’s EDGAR database at www.sec.gov.
Investment Objectives and Principal Investment Strategies
Investment Objectives
The Matching Funds
Investment Objective of the Managed Futures Fund
The Managed Futures Fund seeks results that, both over a single day and over time, match (before fees and expenses) the performance of its index. If the Managed Futures Fund is successful in meeting its objective, its value (before fees and expenses) should gain approximately as much on a percentage basis as the level of the S&P Strategic Futures Index (the “SFI”) when the index rises. Conversely, its value (before fees and expenses) should lose approximately as much on a percentage basis as the level of the SFI when the index declines. The Managed Futures Fund attempts to profit in both rising and falling markets by obtaining investment exposure to its benchmark through the relevant futures contracts.
Investment Objectives of the “Matching VIX” Funds
Each “Matching VIX” Fund seeks results, both over a single day and over time, that match (before fees and expenses) the performance of the S&P 500 VIX Short-Term Futures Index (the “Short-Term VIX Index”) or the S&P 500 VIX Mid-Term Futures Index (the “Mid-Term VIX Index”) (each a “VIX Futures Index” and together, the “VIX Futures Indexes”). The VIX Futures Indexes seek to offer exposure to forward market equity volatility through publicly traded futures markets. If a Matching VIX Fund is successful in meeting its objective, its value (before fees and expenses) should gain approximately as much on a percentage basis as the level of its corresponding VIX Futures Index when the benchmark rises. Conversely, its value (before fees and expenses) should lose approximately as much on a percentage basis as the level of its benchmark when the benchmark declines. Each Matching VIX Fund acquires exposure through VIX futures contracts, such that each Matching VIX Fund has exposure intended to approximate its applicable VIX Futures Index at the time of its NAV calculation. The VIX Futures Indexes track the performance of VIX futures contracts; they do not track the performance of the Chicago Board Options Exchange (“CBOE”) Volatility Index (the “VIX”), and the Matching VIX Funds should not be expected to match the performance of the VIX.
The Geared Funds
Investment Objectives of the “Short” Funds
Each “Short” Fund seeks daily investment results (before fees and expenses) that correspond to the inverse (-1x) of the daily performance, whether positive or negative, of the corresponding benchmark shown below. Expenses may include, among other things, costs related to the purchase, sale and storage of commodities or currencies and the cost of leverage, all of which may be embedded in Financial Instruments used by that Fund. If a Short Fund is successful in meeting its objective, its value on a given day (before fees and expenses) should gain approximately as much on a percentage basis as its corresponding benchmark when the benchmark declines. Conversely, its value on a given day (before fees and expenses) should lose approximately as much on a percentage basis as the corresponding benchmark when the benchmark rises. Each Short Fund will acquire short exposure through any one of or combinations of Financial Instruments, including Financial Instruments with respect to the applicable Short Fund’s benchmark, such that each Short Fund has exposure intended to approximate the inverse (-1x) of its corresponding benchmark at the time of its NAV calculation.
3
Table of Contents
Investment Objectives of the “UltraShort” Funds
Each “UltraShort” Fund seeks daily investment results (before fees and expenses) that correspond to two times the inverse (-2x) of the daily performance, whether positive or negative, of the corresponding benchmark shown below. Expenses may include, among other things, costs related to the purchase, sale and storage of commodities or currencies and the cost of leverage, all of which may be embedded in Financial Instruments used by that Fund. If an UltraShort Fund is successful in meeting its objective, its value on a given day (before fees and expenses) should gain approximately two times as much on a percentage basis as its corresponding benchmark when the benchmark declines. Conversely, its value on a given day (before fees and expenses) should lose approximately two times as much on a percentage basis as the corresponding benchmark when the benchmark rises. Each UltraShort Fund acquires short exposure through any one of or combinations of Financial Instruments, including Financial Instruments with respect to the applicable UltraShort Fund’s benchmark, such that each UltraShort Fund has exposure intended to approximate two times the inverse (-2x) of its corresponding benchmark at the time of its NAV calculation.
Investment Objectives of the “Ultra” Funds
Each “Ultra” Fund seeks daily investment results (before fees and expenses) that correspond to two times (2x) the daily performance, whether positive or negative, of the corresponding benchmark shown below. Expenses may include, among other things, costs related to the purchase, sale and storage of commodities or currencies and the cost of leverage, all of which may be embedded in Financial Instruments used by that Fund. If an Ultra Fund is successful in meeting its objective, its value on a given day (before fees and expenses) should gain approximately two times as much on a percentage basis as its corresponding benchmark when the benchmark rises. Conversely, its value on a given day (before fees and expenses) should lose approximately two times as much on a percentage basis as the corresponding benchmark when the benchmark declines. Each Ultra Fund acquires long exposure through any one of or combinations of Financial Instruments, including Financial Instruments with respect to the applicable Ultra Fund’s benchmark such that each Ultra Fund has exposure intended to approximate two times (2x) its corresponding benchmark at the time of its NAV calculation.
The corresponding benchmark for each Fund is listed below:
ProShares Managed Futures Strategy: The S&P Strategic Futures Index (the “SFI”). The SFI is a long/short rules-based investable index that seeks to potentially capture the economic benefit derived from both rising and declining trends in futures prices.
ProShares VIX Short-Term Futures ProShares Short VIX Short-Term Futures and ProShares Ultra VIX Short-Term Futures: The S&P 500 VIX Short-Term Futures Index. The S&P 500 VIX Short-Term Futures Index seeks to offer exposure to market volatility through publicly traded futures markets and is designed to measure the return from a rolling long position in the first and second month VIX futures contracts.
ProShares VIX Mid-Term Futures: The S&P 500 VIX Mid-Term Futures Index. The S&P 500 VIX Mid-Term Futures Index seeks to offer exposure to market volatility through publicly traded futures markets and is designed to measure the return from a rolling long position in the fourth, fifth, sixth and seventh month VIX futures contracts.
ProShares UltraShort Bloomberg Commodity and ProShares Ultra Bloomberg Commodity: The Bloomberg Commodity IndexSM. The Bloomberg Commodity Index is designed to track commodity futures prices.
ProShares UltraShort Bloomberg Crude Oil and ProShares Ultra Bloomberg Crude Oil: The Bloomberg WTI Crude Oil SubindexSM. The Bloomberg WTI Crude Oil Subindex is designed to track crude oil futures prices.
ProShares UltraShort Bloomberg Natural Gas and ProShares Ultra Bloomberg Natural Gas: The Bloomberg Natural Gas SubindexSM. The Bloomberg Natural Gas Subindex is designed to track natural gas futures prices traded on the NYMEX.
4
Table of Contents
ProShares UltraShort Gold and ProShares Ultra Gold: The daily performance of gold bullion as measured by the U.S. dollar p.m. LBMA Gold Price.
ProShares UltraShort Silver and ProShares Ultra Silver: The daily performance of silver bullion as measured by the London Silver Price.
ProShares UltraShort Australian Dollar: The 4:00 p.m. (Eastern Time) spot price of the Australian dollar versus the U.S. dollar using Australian dollar/U.S. dollar exchange rate as provided by Bloomberg, expressed in terms of U.S. dollars per unit of foreign currency.
ProShares Short Euro, ProShares UltraShort Euro and ProShares Ultra Euro: The 4:00 p.m. (Eastern Time) spot price of the euro versus the U.S. dollar, using euro/U.S. dollar exchange rate as provided by Bloomberg, expressed in terms of U.S. dollars per unit of foreign currency.
ProShares UltraShort Yen and ProShares Ultra Yen: The 4:00 p.m. (Eastern Time) spot price of the Japanese yen versus the U.S. dollar using the Japanese yen/U.S. dollar exchange rate as provided by Bloomberg, expressed in terms of U.S. dollars per unit of foreign currency.
Principal Investment Strategies
In seeking to achieve each Fund’s investment objective, the Sponsor uses a mathematical approach to investing. Using this approach, the Sponsor determines the type, quantity and mix of investment positions, which the Sponsor believes in combination, should produce daily returns consistent with a Fund’s objective. The Sponsor relies upon a pre-determined model to generate orders that result in repositioning each Fund’s investments in accordance with their respective investment objectives. Each Geared Fund invests principally in any one of or combinations of Financial Instruments, including swap agreements, futures contracts, forward contracts and other instruments with respect to the applicable Fund’s benchmark to the extent determined appropriate by the Sponsor. The types of commodity or currency interests in which each Commodity Fund, Commodity Index Fund or Currency Fund invests may vary daily. The Funds do not currently intend to invest directly in any commodity or currency. Each VIX Fund intends to obtain exposure to the applicable equity market volatility index by primarily investing in VIX futures contracts based on the VIX. Each Fund will also hold cash or cash equivalents such as U.S. Treasury securities or other high credit quality, short-term fixed-income or similar securities (such as shares of money market funds and collateralized repurchase agreements) for direct investment or as collateral for Financial Instruments. Each Fund may invest up to 100% of its assets in any of these types of cash or cash equivalent securities.
The Sponsor does not invest the assets of the Funds based on its view of the investment merit of a particular investment, other than for cash management purposes, nor does it conduct conventional volatility, commodity or currency research or analysis, or forecast market movement or trends, in managing the assets of the Funds. Each Fund seeks to remain fully invested at all times in Financial Instruments and money market instruments that, in combination, provide exposure to its underlying benchmark consistent with its investment objective without regard to market conditions, trends or direction.
Certain of the Funds may obtain exposure through Financial Instruments to a representative sample of the components in its underlying index, which have aggregate characteristics similar to those of the underlying index. This “sampling” process typically involves selecting a representative sample of components in an index principally to enhance liquidity and reduce transaction costs while seeking to maintain high correlation with, and similar aggregate characteristics (e.g., underlying commodities and valuations) to, the underlying index. In addition, the Funds may obtain exposure to components not included in the underlying index, invest in assets that are not included in the underlying index or may overweight or underweight certain components contained in the underlying index. For further discussion of the Financial Instruments, see “Information About Financial Instruments and Commodities Markets” below.
5
Table of Contents
Information About Financial Instruments and Commodities Markets
Swap Agreements
Swap agreements are two-party contracts that have traditionally been entered into primarily by institutional investors in over the counter (“OTC”) markets for a specified period ranging from a day to more than a year. However, the Dodd-Frank Wall Street Reform and Consumer Protection Act (the “Dodd-Frank Act”) provides for significant reforms of the OTC derivatives markets, including a requirement to execute certain swap and forward transactions on a CFTC-regulated market and/or to clear such transactions through a CFTC-regulated central clearing organization. In a standard swap transaction, the parties agree to exchange the returns on a particular predetermined investment, instrument or index for a fixed or floating rate of return (the “interest rate leg,” which will also include the cost of borrowing for short swaps) in respect of a predetermined notional amount. The notional amount of the agreement reflects the extent of a Fund’s total investment exposure under the swap agreement. Transaction or commission costs are reflected in the benchmark level at which the transaction is entered into. The gross returns to be exchanged are calculated with respect to the notional amount and the benchmark returns to which the swap is linked. Swaps are usually closed out on a net basis, i.e., the two payment streams are netted out in a cash settlement on the payment date specified in the agreement, with the parties receiving or paying, as the case may be, only the net amount of the two payments. Thus, while the notional amount reflects a Fund’s total investment exposure under the swap agreement (i.e., the entire face amount or principal of a swap agreement), the net amount is a Fund’s current obligations (or rights) under the swap agreement, which is the net amount to be paid or received under the agreement based on the relative values of the positions held by each party to the agreement on any given termination date. In a typical swap agreement entered into by an UltraShort Fund or a Short Fund, absent fees, transaction costs and interest, such Fund would be required to make payments to the swap counterparty in the event the benchmark increases and would be entitled to settlement payments in the event the benchmark decreases. In a typical swap agreement entered into by an Ultra Fund, absent fees, transaction costs and interest, the Ultra Fund would be entitled to settlement payments in the event the benchmark increases and would be required to make payments to the swap counterparty in the event the benchmark decreases. In the case of futures contracts-based indexes, such as those used by the VIX Fund, the Managed Futures Fund and the Commodity Index Funds, the reference interest rate is zero, although a financing spread or fee is normally still applied.
Swap agreements involve, to varying degrees, elements of market risk and exposure to loss in excess of the amount which would be reflected on the Statement of Financial Condition. The notional amounts of the agreement reflect the extent of each Ultra Fund’s total investment exposure under the swap agreement. An UltraShort Fund’s or a Short Fund’s exposure is not limited by the notional amount and its exposure is in theory potentially infinite as there is no fixed limit on the increase in any index value. The primary risks associated with the use of swap agreements arise from the inability of counterparties to perform. Each Fund that invests in swaps bears the risk of loss of the net amount, if any, expected to be received under a swap agreement in the event of the default or bankruptcy of a swap counterparty. Each such Fund enters or intends to enter into swap agreements only with major, global financial institutions; however, there are no limitations on the percentage of its assets each Fund may invest in swap agreements with a particular counterparty. Each Fund that invests in swaps may use various techniques to minimize credit risk including early termination or reset and payment, using different counterparties and limiting the net amount due from any individual counterparty.
Each Fund that invests in swaps generally collateralizes the swap agreements with cash and/or certain securities. Collateral posted in connection with uncleared derivative transactions is generally held for the benefit of the counterparty in a segregated tri-party account at the Custodian to protect the counterparty against non-payment by the Fund. The counterparty also may collateralize the uncleared swap agreements with cash and/or certain securities, which collateral is typically held for the benefit of the Fund in a segregated tri-party account at the Custodian. In the event of a default by the counterparty, and the Fund is owed money in the uncleared swap transaction, such Fund will seek withdrawal of this collateral from the segregated account and may incur certain costs exercising its right with respect to the collateral. These Funds remain subject to credit risk with respect to the amount it expects to receive from counterparties.
The Funds have sought to mitigate these risks in connection with the uncleared OTC swaps by generally requiring that the counterparties for each Fund agree to post collateral for the benefit of the Fund, marked to market daily, subject to certain minimum thresholds; however there are no limitations on the percentage of its assets each Fund may invest in swap agreements with a particular counterparty. To the extent any such collateral is insufficient or there are delays in accessing the collateral, the Funds will be exposed to counterparty risk as described above, including possible delays in recovering amounts as a result of bankruptcy proceedings.
6
Table of Contents
The counterparty risk for cleared derivative transactions is generally lower than for uncleared OTC derivatives since generally a clearing organization becomes substituted for each counterparty to a cleared derivative contract and, in effect, guarantees the parties’ performance under the contract as each party to a trade looks only to the clearing house for performance of financial obligations. In addition, cleared derivative transactions benefit from daily marking-to-market and settlement, and segregation and minimum capital requirements applicable to intermediaries.
Forward Contracts
A forward contract is a contractual obligation to purchase or sell a specified quantity of a particular underlying asset at or before a specified date in the future at a specified price and, therefore, is economically similar to a futures contract. Unlike futures contracts, however, forward contracts are typically traded in the OTC markets and are not standardized contracts. Forward contracts for a given commodity or currency are generally available for various amounts and maturities and are subject to individual negotiation between the parties involved. Moreover, there is generally no direct means of offsetting or closing out a forward contract by taking an offsetting position as one would a futures contract on a U.S. exchange. If a trader desires to close out a forward contract position, he generally will establish an opposite position in the contract but will settle and recognize the profit or loss on both positions simultaneously on the delivery date. Thus, unlike in the futures contract market where a trader who has offset positions will recognize profit or loss immediately, in the forward market a trader with a position that has been offset at a profit will generally not receive such profit until the delivery date, and likewise a trader with a position that has been offset at a loss will generally not have to pay money until the delivery date. In recent years, however, the terms of forward contracts have become more standardized, and in some instances such contracts now provide a right of offset or cash settlement as an alternative to making or taking delivery of the underlying commodity or currency. The primary risks associated with the use of forward contracts arise from the inability of the counterparty to perform.
Each Fund that invests in forward contracts generally collateralizes the uncleared forward contracts with cash and/or certain securities. Such collateral is generally held for the benefit of the counterparty in a segregated tri-party account at the Custodian to protect the counterparty against non-payment by the Fund. The counterparty also may collateralize the uncleared forward contracts with cash and/or certain securities, which collateral is typically held for the benefit of the Fund in a segregated tri-party account at the Custodian. In the event of a default by the counterparty, and the Fund is owed money in the uncleared forward transaction, such Fund will seek withdrawal of this collateral from the segregated account and may incur certain costs exercising its right with respect to the collateral. These Funds remain subject to credit risk with respect to the amount it expects to receive from OTC counterparties.
The Funds have sought to mitigate these risks with respect to uncleared OTC forwards by generally requiring that the counterparties for each Fund agree to post collateral for the benefit of the Fund, marked to market daily, subject to certain minimum thresholds; however, there are no limitations on the percentage of its assets each Fund may invest in forward contracts with a particular counterparty. To the extent any such collateral is insufficient or there are delays in accessing the collateral, the Funds will be exposed to counterparty risk as described above, including possible delays in recovering amounts as a result of bankruptcy proceedings.
The forward markets provide what has typically been a highly liquid market for foreign exchange trading, and in certain cases the prices quoted for foreign exchange forward contracts may be more favorable than the prices for foreign exchange futures contracts traded on U.S. exchanges. Forward contracts have traditionally not been cleared or guaranteed by a third party. However, the Dodd-Frank Act provides for significant reforms of OTC derivatives markets. As a result of the Dodd-Frank Act, the CFTC now regulates non-deliverable forwards (including deliverable forwards where the parties do not take delivery). Certain non-deliverable forward contracts, such as non-deliverable foreign exchange forwards, may be subject to regulation as swap agreements, including mandatory clearing. All foreign exchange forwards, including non-deliverable foreign exchange forwards as well as physically settled foreign exchange forwards, are subject to new reporting requirements. Changes in the forward markets may entail increased costs and result in burdensome reporting requirements.
7
Table of Contents
Commercial banks participating in trading OTC foreign exchange forward contracts often do not require margin deposits, but rely upon internal credit limitations and their judgments regarding the creditworthiness of their counterparties. In recent years, however, many OTC market participants in foreign exchange trading have begun to require that their counterparties post margin.
Futures Contracts
A futures contract is a standardized contract traded on, or subject to the rules of, an exchange that calls for the future delivery of a specified quantity and type of commodity at a specified time and place or alternatively, may call for cash settlement as is the case with VIX futures contracts. Futures contracts are traded on a wide variety of commodities, including bonds, interest rates, agricultural products, stock indexes, currencies, energy, metals, economic indicators and statistical measures. The notional size and calendar term of futures contracts on a particular commodity are identical and are not subject to any negotiation, other than with respect to price and the number of contracts traded between the buyer and seller. Each Fund generally deposits cash with a Futures Commission Merchant (“FCM”) for its open positions in futures contracts, which may, in turn, transfer such deposits to the clearing house to protect the clearing house against non-payment by the Fund. The clearing house becomes substituted for each counterparty to a futures contract, and, in effect, guarantees performance. In addition, the FCM may require the Funds to deposit collateral in excess of the clearing house’s margin requirements for the FCM’s own protection.
Certain futures contracts, such as VIX futures contracts (including the futures contracts that comprise each of the VIX Futures Indexes), as well as stock index contracts and certain commodity futures contracts, settle in cash, reflecting the difference between the contract purchase/sale price and the contract settlement price. The cash settlement mechanism avoids the potential for either side to have to deliver the underlying asset. For other futures contracts, the contractual obligations of a buyer or seller may generally be satisfied by taking or making physical delivery of the underlying asset or by making an offsetting sale or purchase of an identical futures contract on the same or linked exchange before the designated date of delivery. The difference between the price at which the futures contract is purchased or sold and the price paid for the offsetting sale or purchase, after allowance for brokerage commissions, constitutes the profit or loss to the trader.
Regulations
Derivatives exchanges in the United States are subject to regulation under the CEA, by the CFTC, the governmental agency having responsibility for regulation of derivatives exchanges and trading on those exchanges. Following the adoption of the Dodd-Frank Act, the CFTC also has authority to regulate OTC derivative markets, including certain OTC foreign exchange markets. The CFTC has exclusive authority to designate exchanges for the trading of specific futures contracts and options on futures contracts and to prescribe rules and regulations of the marketing of each. The CFTC also regulates the activities of “commodity pool operators” and the CFTC has adopted regulations with respect to certain of such persons’ activities. Pursuant to its authority, the CFTC requires a commodity pool operator, such as the Sponsor, to keep accurate, current and orderly records with respect to each pool it operates. The CFTC may suspend, modify or terminate the registration of any registrant for failure to comply with CFTC rules or regulations. Suspension, restriction or termination of the Sponsor’s registration as a commodity pool operator would prevent it, until such time (if any) as such registration were to be reinstated, from managing, and might result in the termination of the Funds. If the Sponsor were unable to provide services and/or advice to the Funds, the Funds would be unable to pursue their investment objectives unless and until the Sponsor’s ability to provide services and advice to the Funds was reinstated or a replacement for the Sponsor as commodity pool operator could be found. Such an event could result in termination of the Funds.
The CEA requires all FCMs to meet and maintain specified fitness and financial requirements, segregate customer funds from proprietary funds and account separately for all customers’ funds and positions, and to maintain specified books and records open to inspection by the staff of the CFTC. See “Item 1A. Risk Factors. Risks Related to Regulatory Requirements and Potential Legislative Changes-Failure of the FCMs to segregate assets may increase losses in the Funds” in this Annual Report on Form 10-K.
The CEA also gives the states certain powers to enforce its provisions and the regulations of the CFTC.
Under certain circumstances, the CEA grants shareholders the right to institute a reparations proceeding before the CFTC against the Sponsor (as a registered commodity pool operator), an FCM, as well as those of their respective employees who are required to be registered under the CEA. Shareholders may also be able to maintain a private right of action for certain violations of the CEA.
8
Table of Contents
Pursuant to authority in the CEA, the National Futures Association (the “NFA”) has been formed and registered with the CFTC as a registered futures association. At the present time, the NFA is the only self-regulatory organization for commodities professionals other than exchanges. As such, the NFA promulgates rules governing the conduct of commodity professionals and disciplines those professionals that do not comply with such standards. The CFTC has delegated to the NFA responsibility for the registration of commodity pool operators, FCMs, swap dealers, commodity trading advisors, introducing brokers and their respective associated persons and floor brokers. The Sponsor is a member of the NFA (the Funds themselves are not required to become members of the NFA). As an NFA member, the Sponsor is subject to NFA standards relating to fair trade practices, financial condition, and consumer protection. The CFTC is prohibited by statute from regulating trading on foreign commodity exchanges and markets.
The CEA and CFTC regulations prohibit market abuse and generally require that all futures exchange-based trading be conducted in compliance with rules designed to ensure the integrity of market prices and without any intent to manipulate prices. CFTC regulations and futures exchange rules also impose limits on the size of the positions that a person may hold or control as well as standards for aggregating certain positions. The rules of the CFTC and the futures exchanges also authorize special emergency actions to halt, suspend or limit trading overall or to restrict, halt, suspend or limit the trading of an individual trader or to otherwise impose special reporting or margin requirements. See also “Item 1A. Risk Factors. Regulatory changes or actions, including the implementation of new Legislation, may alter the operations and profitability of the Funds” and “Item 1A. Risk Factors. Regulatory and exchange accountability levels may restrict the creation of Creation Units and the operation of the Trust” in this Annual Report on Form 10-K.
Description of the S&P Strategic Futures Index (“SFI”)
Developed by S&P and launched on August 14, 2014, the SFI is a long/short rules-based investable index that seeks to capture the economic benefit derived from both rising and declining trends in futures prices. The SFI is currently composed of 24 underlying futures contracts (each, a SFI Futures Contract, collectively, the SFI Futures Contracts), representing unleveraged long or short positions in futures contracts in the commodity and financial markets. The SFI includes both commodity futures contracts (the “Commodity Futures Contracts”) as well as currency and U.S. Treasury futures contracts (the “Financial Futures Contracts”) that were deemed to have sufficient liquidity.
The weight assigned to each SFI Futures Contract is determined on a monthly basis, and implemented as of each monthly repositioning. Weights are determined using a proprietary risk-weighting methodology that measures the risk exposure of the SFI Futures Contracts and then weights each SFI Futures Contract so that it contributes the same level of risk to the SFI.
The SFI’s exposure to the SFI Futures Contracts are not long-only, but will be either long or short based on a comparison of the current price input of each SFI Futures Contract with its own seven-month weighted moving average of its price input.
The following chart reflects the December 31, 2015 weight (rounded to the nearest one-hundredth) for each SFI Futures Contract of the SFI. The weights will be determined each month and implemented as of the next monthly rebalancing.
| SFI |
||||
| SFI Futures Contracts |
Base Weight (Rounded to the Nearest 0.01) |
|||
| Light Crude |
1.23 | % | ||
| Heating Oil |
1.59 | % | ||
| RBOB Gas |
1.54 | % | ||
| Natural Gas |
2.15 | % | ||
| Copper |
2.75 | % | ||
| Gold |
3.81 | % | ||
| Silver |
1.91 | % | ||
| Lean Hogs |
3.03 | % | ||
| Live Cattle |
4.61 | % | ||
9
Table of Contents
| Corn |
2.99 | % | ||
| Soybeans |
3.27 | % | ||
| Wheat |
2.72 | % | ||
| Coffee |
2.20 | % | ||
| Cocoa |
4.46 | % | ||
| Sugar |
2.62 | % | ||
| Cotton |
3.51 | % | ||
| Australian dollar |
3.77 | % | ||
| British pound |
5.37 | % | ||
| Canadian dollar |
5.13 | % | ||
| Euro |
4.35 | % | ||
| Japanese yen |
7.37 | % | ||
| Swiss franc |
3.44 | % | ||
| U.S. Treasury Notes |
16.23 | % | ||
| U.S. Treasury Bonds |
9.95 | % | ||
|
|
|
|||
| 100 | % |
Determining the Long/Short Positioning of each SFI Futures Contract
Each month, S&P will determine whether an SFI Futures Contract should be either a long or short position by comparing the price change of the most recent month (the “First Month Price Change”) of the SFI Futures Contract to the seven-month exponential weighted moving average price change (the “Seven Month Price Change”). Long positions are tracked when an SFI Futures Contract’s First Month Price Change is greater than or equal to the Seven Month Price Change. Short positions are tracked when an SFI Futures Contract’s First Month Price Change is less than the Seven Month Price Change. The First Month Price Change of each SFI Futures Contract is calculated by calculating the percentage difference of each SFI Futures Contract’s price on the last PDD (as defined below) relative to the current PDD.
When calculating the Seven Month Price Change, each month’s price input is represented as the monthly percentage change of an SFI Futures Contract’s price which is calculated in the same manner as the First Month Price Change. Monthly positions are determined on the second to last SFI business day of the month (defined as the position determination date, or “PDD”) when the monthly percentage change of an SFI Future Contract’s price is compared to past monthly price changes, exponentially weighted to give greatest weight to the most recent return and least weight to the return seven months prior. The weighted sum of the percentage changes of all SFI Futures Contract prices equals the daily movement of the SFI. To create an exponential average for comparison, price inputs (percentage change from current and previous PDDs) are weighted per the schedule below. Due to this weighting methodology, current price movements are more important than those of the more distant past.
| Number of Months |
Weight (Rounded to the Nearest 0.01) |
|||
| 7 |
2.32 | % | ||
| 6 |
3.71 | % | ||
| 5 |
5.94 | % | ||
| 4 |
9.51 | % | ||
| 3 |
15.22 | % | ||
| 2 |
24.34 | % | ||
| 1 |
38.96 | % | ||
|
|
|
|||
| Total |
100 | % | ||
Rolling
During this monthly rebalancing, the SFI will also “roll” certain of its positions from the current contract to a contract further from settlement. In order to maintain consistent exposure to the SFI Futures Contracts that compose the SFI, each SFI Futures Contract must be sold prior to its expiration date and replaced by a contract maturing at a specified date in the future. This process is known as “rolling.” SFI Futures Contracts are rolled periodically. The rolls are implemented pursuant to a roll schedule over a five-day period from the first (1st) through the fifth (5th) index business days of the month. An index business day is any day on which the majority of the SFI Futures Contracts are open for official trading and official settlement prices are provided, excluding holidays and weekends.
10
Table of Contents
In order to mitigate the potential negative impact of contango on long commodity positions, certain Commodity Futures Contracts will be rolled according to an “enhanced” rolling methodology. This methodology seeks to modify the normal roll methodology for futures contracts in the energy sector when such long position would be materially and negatively impacted by contango. In addition, the methodology identifies seasonal factors applicable to both the energy and agricultural futures markets and implements a modified roll to mitigate potential costs of such seasonal impacts.
Information about the Index Licensor
The “S&P Strategic Futures” is a product of S&P Dow Jones Indices LLC or its affiliates (“SPDJI”) and has been licensed for use by ProShares. Standard & Poor’s® and S&P® are registered trademarks of Standard & Poor’s Financial Services LLC (“S&P”) and Dow Jones® is a registered trademark of Dow Jones Trademark Holdings LLC (“Dow Jones”). The trademarks have been licensed to SPDJI and have been sublicensed for use for certain purposes by ProShares. The Managed Futures Fund is not sponsored, endorsed, sold or promoted by SPDJI, Dow Jones, S&P, any of their respective affiliates (collectively, “S&P Dow Jones Indices”). S&P Dow Jones Indices does not make any representation or warranty, express or implied, to the owners of the Managed Futures Fund or any member of the public regarding the advisability of investing in securities generally or in the Managed Futures Fund particularly or the ability of the SFI to track general market performance. S&P Dow Jones Indices’ only relationship to ProShares with respect to the SFI is the licensing of the Index and certain trademarks, service marks and/or trade names of S&P Dow Jones Indices and/or its licensors. The SFI is determined, composed and calculated by S&P Dow Jones Indices without regard to ProShares or the Managed Futures Fund. S&P Dow Jones Indices has no obligation to take the needs of ProShares or the owners of the Managed Futures Fund into consideration in determining, composing or calculating the SFI. S&P Dow Jones Indices is not responsible for and has not participated in the determination of the prices, and amount of the Managed Futures Fund or the timing of the issuance or sale of the Managed Futures Fund or in the determination or calculation of the equation by which the Managed Futures Fund is to be converted into cash, surrendered or redeemed, as the case may be. S&P Dow Jones Indices has no obligation or liability in connection with the administration, marketing or trading of the Managed Futures Fund. There is no assurance that investment products based on the SFI will accurately track index performance or provide positive investment returns. S&P Dow Jones Indices LLC is not an investment advisor. Inclusion of a security within an index is not a recommendation by S&P Dow Jones Indices to buy, sell, or hold such security, nor is it considered to be investment advice.
NEITHER S&P DOW JONES INDICES NOR THIRD PARTY LICENSOR GUARANTEES THE ADEQUACY, ACCURACY, TIMELINESS AND/OR THE COMPLETENESS OF THE SFI OR ANY DATA RELATED THERETO OR ANY COMMUNICATION, INCLUDING BUT NOT LIMITED TO, ORAL OR WRITTEN COMMUNICATION (INCLUDING ELECTRONIC COMMUNICATIONS) WITH RESPECT THERETO. S&P DOW JONES INDICES SHALL NOT BE SUBJECT TO ANY DAMAGES OR LIABILITY FOR ANY ERRORS, OMISSIONS, OR DELAYS THEREIN. S&P DOW JONES INDICES MAKES NO EXPRESS OR IMPLIED WARRANTIES, AND EXPRESSLY DISCLAIMS ALL WARRANTIES, OF MERCHANTABILITY OR FITNESS FOR A PARTICULAR PURPOSE OR USE OR AS TO RESULTS TO BE OBTAINED BY PROSHARES, OWNERS OF THE MANAGED FUTURES FUND, OR ANY OTHER PERSON OR ENTITY FROM THE USE OF THE SFI OR WITH RESPECT TO ANY DATA RELATED THERETO. WITHOUT LIMITING ANY OF THE FOREGOING, IN NO EVENT WHATSOEVER SHALL S&P DOW JONES INDICES BE LIABLE FOR ANY INDIRECT, SPECIAL, INCIDENTAL, PUNITIVE, OR CONSEQUENTIAL DAMAGES INCLUDING BUT NOT LIMITED TO, LOSS OF PROFITS, TRADING LOSSES, LOST TIME OR GOODWILL, EVEN IF THEY HAVE BEEN ADVISED OF THE POSSIBILITY OF SUCH DAMAGES, WHETHER IN CONTRACT, TORT, STRICT LIABILITY, OR OTHERWISE. THERE ARE NO THIRD PARTY BENEFICIARIES OF ANY AGREEMENTS OR ARRANGEMENTS BETWEEN S&P DOW JONES INDICES AND PROSHARES, OTHER THAN THE LICENSORS OF S&P DOW JONES INDICES.
11
Table of Contents
Description of the Bloomberg Commodity Index SM and its Sub-Indexes
Overview of the Bloomberg Family of Indices
Bloomberg Commodity IndexSM
The Bloomberg Commodity IndexSM (the “Bloomberg Commodity Index”) is designed to be a highly liquid and diversified benchmark for the commodity futures market. It is intended to reflect the overall commodity sector by measuring the performance of commodity futures contracts. The performance of the commodity futures market is often very different than the performance of the physical, or “spot”, commodities market. See “Item 1A. Risk Factors. The Commodity Index Funds are linked to an index comprised of commodity futures contracts, and are not linked to the spot prices of the underlying physical commodities. Commodity futures contracts may perform very differently from the spot price of the underlying physical commodities” in this Annual Report on Form 10-K. Unlike equities, which entitle the holder to a continuing stake in a corporation, commodity futures contracts specify a delivery date for the underlying physical commodity or its cash equivalent. The Bloomberg Commodity Index is a “rolling index,” which means that the Bloomberg Commodity Index does not take actual physical possession of any commodities; rather, it tracks a rolling futures position. An investor with a rolling futures position is able to avoid delivering (or taking delivery of) underlying physical commodities while maintaining exposure to those commodities. The roll for each index component occurs over a period of five Bloomberg Commodity Index business days in certain months according to a pre-determined schedule, generally beginning on the fifth business day of the month and ending on the ninth business day. Each day, approximately 20% of each rolling futures position that is included in the month’s roll is rolled, increasing from 0% to 20%, 40%, 60%, 80% and finally 100%. The Bloomberg Commodity Index is calculated by applying the weighting adjustments at the close of each day, with the adjusted weights used for the next day’s calculation. Not all contracts are rolled every month; generally the futures that underlie the indexes within the Bloomberg Commodity Index family roll approximately every other month. The exact roll methodology differs between certain commodities. The index will reflect the performance of its underlying commodities, including the impact of rolling, without regard to income earned on cash positions. For more information about the risks associated with rolling futures positions, see “Item 1A. Risk Factors. Potential negative impact from rolling futures positions” in this Annual Report on Form 10-K.
The Bloomberg Commodity Index is comprised of five different commodity sectors: energy, livestock, industrial metals, precious metals and agriculture. These five sectors track futures contracts prices of 22 specific commodities: natural gas, WTI crude oil, brent crude, RBOB gasoline, ULS Diesel, live cattle, lean hogs, Chicago wheat, Kansas City wheat, corn, soybeans, soybean oil, soybean meal, aluminum, COMEX copper, zinc, nickel, gold, silver, sugar, cotton and coffee. The Bloomberg Commodity Index is designed to minimize concentration in any one commodity or sector. No single commodity can constitute more than 15% of the Bloomberg Commodity Index and no related group of commodities (e.g., energy, precious metals, livestock or grains) may constitute more than 33% of the index as of the annual reweighting of the components. The Bloomberg Commodity Index family of indices also includes ten subindexes that group commodities based on type, as well as single commodity subindexes representing each of the commodities that are currently tracked by the Bloomberg Commodity Index. As discussed below, ProShares UltraShort Bloomberg Crude Oil and ProShares Ultra Bloomberg Crude Oil are designed to track one of these subindexes, the Bloomberg WTI Crude Oil SubindexSM and ProShares UltraShort Bloomberg Natural Gas and ProShares Ultra Bloomberg Natural Gas are designed to track another one of these sub-indexes, the Bloomberg Natural Gas SubindexSM.
To determine its component weightings, the Bloomberg Commodity Index relies primarily on liquidity data, or the relative amount of trading activity of a particular commodity. Liquidity is an important indicator of the value placed on a commodity by financial and physical market participants. The index also relies to a lesser extent on dollar-adjusted production data. The index thus relies on data that is endogenous to the futures markets (liquidity) and exogenous to the futures markets (production) in determining relative weightings. All data used in both the liquidity and production calculations is averaged over a five-year period.
In consultation with the Bloomberg Commodity Index Advisory Committee, the Bloomberg Commodity Index Supervisory Committee meets annually to determine the composition of the index in accordance with the rules established in the Bloomberg Handbook. The Supervisory Committee consists of employees of Bloomberg. Bloomberg Commodity Index Advisory Committee members are drawn from the academic, financial and legal communities. The Bloomberg Commodity Index is re-weighted and rebalanced each year in January on a price-percentage basis. The annual weightings for the Index are determined each year in June or July by Bloomberg under the supervision of the Bloomberg Commodity Index Oversight Committee, announced after approval by the Committee and implemented the following January.
12
Table of Contents
The Bloomberg Commodity Index is composed of commodities traded on U.S. exchanges, with the exception of aluminum, nickel and zinc, which trade on the London Metal Exchange. Trading hours for the U.S. commodity exchanges are between 8:00 a.m. and 3:00 p.m. (Eastern Time). The Bloomberg Commodity Index contract trades exclusively on the Chicago Board of Trade’s (“CBOT”) electronic trading platform. A daily settlement price for the Bloomberg Commodity Index is published at approximately 5:00 p.m. (Eastern Time).
The Bloomberg Commodity Index is designed to provide:
| • | Weightings that reflect economic significance |
| • | Diversification |
| • | Annual reweighting and rebalancing |
| • | Liquidity |
The Bloomberg Commodity Index is a proprietary index that Bloomberg calculates. The methodology for determining the composition and weighting of the Bloomberg Commodity Index and for calculating its level is subject to modification at any time. Bloomberg disseminates the Index level at least every 15 seconds from 8:00 a.m. to 3:00 p.m. (Eastern Time), and publishes a daily Index level at approximately 5:00 p.m. (Eastern Time), each business day.
As of December 31, 2015, the individual commodity weightings for the Bloomberg Commodity Index components were as follows:
| Commodity | Target Weights (%) | |||
| Gold |
12.68 | % | ||
| Corn |
7.98 | % | ||
| Natural Gas |
8.77 | % | ||
| COMEX Copper |
7.09 | % | ||
| Aluminum |
4.72 | % | ||
| WTI Crude Oil |
7.42 | % | ||
| Soybeans |
5.65 | % | ||
| Live Cattle |
3.34 | % | ||
| Sugar |
5.00 | % | ||
| Brent Crude Oil |
6.28 | % | ||
| Coffee |
1.95 | % | ||
| Chicago Wheat |
3.28 | % | ||
| Silver |
4.34 | % | ||
| Zinc |
2.21 | % | ||
| Soybean Oil |
3.17 | % | ||
| Nickel |
1.46 | % | ||
| ULS Diesel |
3.14 | % | ||
| Soybean Meal |
2.50 | % | ||
| RBOB Gasoline |
4.23 | % | ||
| Lean Hogs |
1.78 | % | ||
| Kansas City Wheat |
1.08 | % | ||
| Cotton |
1.93 | % | ||
Bloomberg WTI Crude Oil SubindexSM
ProShares UltraShort Bloomberg Crude Oil and ProShares Ultra Bloomberg Crude Oil are designed to correspond (before fees and expenses) to two times the inverse (-2x) or two times (2x), respectively, of the daily performance of the Bloomberg WTI Crude Oil SubindexSM, a sub-index of the Bloomberg Commodity Index. The Bloomberg WTI Crude Oil SubindexSM is intended to reflect the performance of crude oil as measured by the price of futures contracts of West Texas Intermediate sweet, light crude oil traded on the NYMEX, including the impact of rolling, without regard to income earned on cash positions. The performance of the crude oil futures market is normally very different than the performance of the physical crude oil market (e.g., the price of crude oil at port). See “Item 1A. Risk Factors. The Commodity Index Funds are linked to an index comprised of commodity futures contracts, and are not directly linked to the spot prices of the underlying physical commodities. Commodity futures contracts may perform very differently from the spot price of the underlying physical commodities” in this Annual Report on Form 10-K.
13
Table of Contents
The Bloomberg WTI Crude Oil SubindexSM is based on the Crude Oil component of the Bloomberg Commodity Index, which is described above under “Bloomberg Commodity IndexSM,” and tracks what is known as a rolling futures position. The roll occurs over a period of five Bloomberg business days in certain months according to a pre-determined schedule, generally beginning on the fifth business day of the month and ending on the ninth business day. Each day, approximately 20% of each rolling futures position that is included in the month’s roll is rolled, increasing from 0% to 20%, 40%, 60%, 80% and finally 100%. The exact roll methodology differs between certain commodities. The Bloomberg WTI Crude Oil SubindexSM will reflect the performance of its underlying crude oil futures contracts, including the impact of rolling, without regard to income earned on cash positions. For more information about the risks associated with rolling futures positions, see “Item 1A. Risk Factors. Potential negative impact from rolling futures positions” in this Annual Report on Form 10-K.
Bloomberg Natural Gas SubindexSM
ProShares UltraShort Bloomberg Natural Gas and ProShares Ultra Bloomberg Natural Gas are designed to correspond (before fees and expenses) to two times the inverse (-2x) or two times (2x) of the daily performance of the Bloomberg Natural Gas SubindexSM, respectively. The Bloomberg Natural Gas SubindexSM is intended to reflect the performance of a rolling position in natural gas futures contracts traded on the NYMEX without regard to income earned on cash positions. An investment in natural gas futures contracts may often perform very differently than the price of physical natural gas (e.g., the wellhead or end-user price of natural gas). See “Item 1A. Risk Factors. The Commodity Index Funds are linked to an index comprised of commodity futures contracts, and are not linked to the spot prices of the underlying physical commodities. Commodity futures contracts may perform very differently from the spot price of the underlying physical commodities” in this Annual Report on Form 10-K.
The Bloomberg Natural Gas SubindexSM is based on the Natural Gas component of the Bloomberg Commodity Index, which is described above under “Bloomberg Commodity IndexSM,” and tracks what is known as a rolling futures position. The roll occurs over a period of five Bloomberg Commodity Index business days in certain months according to a pre-determined schedule, generally beginning on the fifth business day of the month and ending on the ninth business day. Each day, approximately 20% of each rolling futures position that is included in the month’s roll is rolled, increasing from 0% to 20%, 40%, 60%, 80% and finally 100%. The exact roll methodology differs between certain commodities. The index will reflect the performance of its underlying natural gas contracts, including the impact of rolling, without regard to income earned on cash positions. For more information about the risks associated with rolling futures positions, see “Item 1A. Risk Factors. Potential negative impact from rolling futures positions” in this Annual Report on Form 10-K.
Information About the Index Licensor
“BLOOMBERG®”, “BLOOMBERG WTI CRUDE OIL SUBINDEXSM” and “BLOOMBERG NATURAL GAS SUBINDEXSM” ARE SERVICE MARKS OF BLOOMBERG FINANCE L.P. AND ITS AFFILIATES (COLLECTIVELY, “BLOOMBERG”) AND HAVE BEEN LICENSED FOR USE FOR CERTAIN PURPOSES BY PROSHARES TRUST II (“LICENSEE”).
The Funds are not sponsored, endorsed, sold or promoted by Bloomberg UBS AG, UBS Securities LLC (“UBS Securities”), or any of their subsidiaries or affiliates. None of Bloomberg, UBS AG, UBS Securities, or any of their subsidiaries or affiliates makes any representation or warranty, express or implied, to the owners of or counterparts to the Funds or any member of the public regarding the advisability of investing in securities or commodities generally or in the Funds particularly. The only relationship of Bloomberg, UBS AG, UBS Securities, or any of their subsidiaries or affiliates to the Licensee is the licensing of certain trademarks, trade names and service marks and of the Bloomberg Commodity IndexSM, Bloomberg WTI Crude Oil SubindexSM and Bloomberg Natural Gas SubindexSM, which are determined, composed and calculated by Bloomberg in conjunction with UBS Securities without regard to the Licensee or the Funds. Bloomberg and UBS Securities have no obligation to take the needs of the Licensee or the shareholders of the Funds into consideration in determining, composing or calculating the Bloomberg Commodity IndexSM, the Bloomberg WTI Crude Oil SubindexSM or the Bloomberg Natural Gas SubindexSM. None of Bloomberg, UBS AG, UBS Securities, or any of their respective subsidiaries or affiliates is
14
Table of Contents
responsible for or has participated in the determination of the timing of, prices at, or quantities of the shares of the Funds that have been or are to be issued or in the determination or calculation of the equation by which the Shares of the Funds are converted into cash. None of Bloomberg, UBS AG, UBS Securities or any of their subsidiaries or affiliates shall have any obligation or liability, including, without limitation, to Fund shareholders, in connection with the administration, marketing or trading of the Funds. Notwithstanding any of the foregoing, UBS AG, UBS Securities and their respective subsidiaries and affiliates may independently issue and/or sponsor financial products unrelated to the Shares currently being issued by the Licensee, but which may be similar to and competitive with the Funds. In addition, UBS AG, UBS Securities and their subsidiaries and affiliates actively trade commodities, commodity indexes and commodity futures (including the Bloomberg Commodity IndexSM, Bloomberg WTI Crude Oil SubindexSM and Bloomberg Natural Gas SubindexSM), as well as swaps, options and derivatives which are linked to the performance of such commodities, commodity indexes and commodity futures. It is possible that this trading activity will affect the value of the Bloomberg Commodity IndexSM, the Bloomberg WTI Crude Oil SubindexSM, the Bloomberg Natural Gas SubindexSM and Fund shares.
This Annual Report on Form 10-K relates only to the Funds and does not relate to the exchange-traded physical commodities underlying any of the Bloomberg Commodity IndexSM, the Bloomberg WTI Crude Oil SubindexSM or the Bloomberg Natural Gas SubindexSM components. Purchasers of the Shares should not conclude that the inclusion of a futures contract in the Bloomberg Commodity IndexSM, the Bloomberg WTI Crude Oil SubindexSM or the Bloomberg Natural Gas SubindexSM is any form of investment recommendation of the futures contract or the underlying exchange-traded physical commodity by Bloomberg, UBS AG, UBS Securities or any of their subsidiaries or affiliates. The information in this Annual Report on Form 10-K regarding the components of the Bloomberg Commodity IndexSM, the Bloomberg WTI Crude Oil SubindexSM and the Bloomberg Natural Gas SubindexSM has been derived solely from publicly available documents. None of Bloomberg, UBS AG, UBS Securities or any of their subsidiaries or affiliates has made any due diligence inquiries with respect to the Bloomberg Commodity IndexSM, the Bloomberg WTI Crude Oil SubindexSM or the Bloomberg Natural Gas SubindexSM components in connection with the Funds. None of Bloomberg, UBS AG, UBS Securities or any of their subsidiaries or affiliates makes any representation that these publicly available documents or any other publicly available information regarding the Bloomberg Commodity IndexSM, the Bloomberg WTI Crude Oil SubindexSM or the Bloomberg Natural Gas SubindexSM components, including without limitation a description of factors that affect the prices of such components, are accurate or complete.
NONE OF BLOOMBERG, UBS AG, UBS SECURITIES OR ANY OF THEIR SUBSIDIARIES OR AFFILIATES GUARANTEES THE ACCURACY AND/OR THE COMPLETENESS OF THE BLOOMBERG COMMODITY INDEXSM, THE BLOOMBERG WTI CRUDE OIL SUBINDEXSM OR THE BLOOMBERG NATURAL GAS SUBINDEXSM OR ANY DATA RELATED THERETO AND NONE OF BLOOMBERG, UBS AG, UBS SECURITIES OR ANY OF THEIR SUBSIDIARIES OR AFFILIATES SHALL HAVE ANY LIABILITY FOR ANY ERRORS, OMISSIONS, OR INTERRUPTIONS THEREIN. NONE OF BLOOMBERG, UBS AG, UBS SECURITIES OR ANY OF THEIR SUBSIDIARIES OR AFFILIATES MAKES ANY WARRANTY, EXPRESS OR IMPLIED, AS TO RESULTS TO BE OBTAINED BY THE LICENSEE, FUND SHAREHOLDERS, OR ANY OTHER PERSON OR ENTITY FROM THE USE OF THE BLOOMBERG COMMODITY INDEXSM, THE BLOOMBERG WTI CRUDE OIL SUBINDEXSM OR THE BLOOMBERG NATURAL GAS SUBINDEXSM OR ANY DATA RELATED THERETO. NONE OF BLOOMBERG, UBS AG, UBS SECURITIES OR ANY OF THEIR SUBSIDIARIES OR AFFILIATES MAKES ANY EXPRESS OR IMPLIED WARRANTIES, AND EXPRESSLY DISCLAIMS ALL WARRANTIES OF MERCHANTABILITY OR FITNESS FOR A PARTICULAR PURPOSE OR USE WITH RESPECT TO THE BLOOMBERG COMMODITY INDEXSM, THE BLOOMBERG WTI CRUDE OIL SUBINDEXSM, THE BLOOMBERG NATURAL GAS SUBINDEXSM OR ANY DATA RELATED THERETO. WITHOUT LIMITING ANY OF THE FOREGOING, TO THE MAXIMUM EXTENT ALLOWED BY LAW, BLOOMBERG ITS LICENSORS (INCLUDING UBS AG AND UBS SECURITIES) AND THEIR RESPECTIVE EMPLOYEES, CONTRACTORS, AGENTS, SUPPLIERS AND VENDORS SHALL HAVE NO LIABILITY OR RESPONSIBILITY WHATSOEVER FOR ANY INJURY OR DAMAGES WHETHER DIRECT, INDIRECT, CONSEQUENTIAL, INCIDENTAL, PUNITIVE OR OTHERWISE ARISING IN CONNECTION WITH THE PRODUCTS OR THE BLOOMBERG COMMODITY INDEXSM, THE BLOOMBERG NATURAL GAS SUBINDEXSM OR ANY DATA OR VALUES RELATING THERETO WHETHER ARISING FROM THEIR NEGLIGENCE OR OTHERWISE, EVEN IF NOTIFIED OF THE POSSIBILITY THEREOF. THERE ARE NO THIRD PARTY BENEFICIARIES OF ANY AGREEMENTS OR ARRANGEMENTS AMONG BLOOMBERG, UBS SECURITIES AND THE LICENSEE, OTHER THAN UBS AG.
15
Table of Contents
Description of the Commodity Benchmarks
Gold
ProShares UltraShort Gold and ProShares Ultra Gold are designed to correspond (before fees and expenses) to two times the inverse (-2x) or two times (2x), respectively, of the daily performance of gold bullion as measured by the U.S. dollar p.m. LBMA Gold Price. The Funds do not directly or physically hold the underlying gold, but instead, seek exposure to gold through the use of Financial Instruments whose value is based on the underlying price of gold to pursue their investment objective. The benchmark price of gold is the U.S. dollar price of gold bullion as measured by the London afternoon fixing price per troy ounce of unallocated gold bullion for delivery in London through a member of the LBMA authorized to affect such delivery. On March 19, 2015, the company that ran the London U.S. dollar gold fixing, ceased calculating the price of gold for the LBMA. The LBMA selected ICE Benchmark Administration to calculate the price, which was renamed the LBMA Gold Price, and is based on an electronic, physically settled auction-based methodology, beginning on March 20, 2015.
The price of gold is volatile with fluctuations expected to affect the value of the Shares of the Fund. The price movement of gold may be influenced by a variety of factors, including announcements from central banks regarding reserve gold holdings, agreements among central banks, political uncertainties and economic concerns. The gold market is a global marketplace consisting of both OTC transactions and exchange-traded products. The OTC market generally consists of transactions in spot, forwards, options and other derivatives, while exchange-traded transactions consist of futures and options.
The LBMA Gold Price is determined each trading day at 3:00 p.m. London time providing a reference gold price for that day’s trading. Many long-term contracts are priced on the basis of the LBMA Gold Price and market participants will usually refer to the LBMA Gold Price when looking for a basis for valuation.
Silver
ProShares UltraShort Silver and ProShares Ultra Silver are designed to correspond (before fees and expenses) to two times the inverse (-2x) or two times (2x), respectively, of the daily performance of silver bullion as measured by the London Silver Price. The Funds do not directly or physically hold the underlying silver, but instead seek exposure to silver through the use of Financial Instruments whose value is based on the underlying price of silver to pursue their investment objective. The benchmark price of silver is the daily performance silver bullion as measured by the London Silver Price.
The price of silver is volatile with fluctuations expected to affect the value of the Shares of the Fund. The largest industrial users of silver are the photographic, jewelry, and electronic industries and developments in these industries among other factors may influence the price of silver. Like gold, the silver market is a global marketplace consisting of both OTC transactions and exchange-traded products. The OTC market generally consists of transactions in spot, forwards, options and other derivatives, while exchange-traded transactions consist of futures and options.
The London Silver Price is determined each trading day at 12:00 p.m. London time providing a reference silver price for that day’s trading. Many long-term contracts are priced on the basis of the London Silver Price and market participants will usually refer to the London Silver Price when looking for a basis for valuation.
Description of the Currencies Benchmarks
The Currency Funds are designed to correspond (before fees and expenses) to the inverse (-1), two times the inverse (-2x), or two times (2x) of the daily performance of the spot price of the applicable currency versus the U.S. dollar. The spot price of each currency is measured by the 4:00 p.m. (Eastern Time) spot prices as provided by Bloomberg, expressed in terms of U.S. dollars per unit of foreign currency. The Currency Funds do not necessarily directly or physically hold the underlying currency and will instead seek exposure through the use of certain Financial Instruments whose value is based on the price of the underlying currency to pursue its investment objective.
16
Table of Contents
Australian Dollar
ProShares UltraShort Australian Dollar is designed to correspond (before fees and expenses) to two times the inverse (-2x) of the daily performance of the Australian dollar spot price versus the U.S. dollar, respectively. This Fund uses the 4:00 p.m. (Eastern Time) Australian dollar/U.S. dollar exchange rate as provided by Bloomberg, expressed in terms of U.S. dollars per unit of foreign currency, as the basis for the underlying benchmark.
The Australian dollar is the national currency of Australia and the currency of the accounts of the Reserve Bank of Australia, the Australian central bank. The official currency code for the Australian dollar is “AUD.” The Australian dollar is referred to in Australia as “dollar.” As with U.S. currency, 100 Australian cents are equal to one Australian dollar. In Australia, unlike most other countries, cash transactions are rounded to the nearest five cents. The most commonly used symbol used to represent the Australian dollar is “A$.”
In 1913, the Commonwealth Bank of Australia issued the first Australian currency notes. In 1915, the Commonwealth Bank of Australia became the exclusive issuer of currency in Australia. From 1930 through the 1960s, the Australian banking system underwent substantial transformation. In 1960, the Reserve Bank of Australia was established. In 1966, a new decimalized currency was introduced. At various times throughout the 1900s, the value of Australian currency was based on a fixed quantity of gold; at other times, the Australian dollar was pegged to foreign currencies, including the U.S. dollar. Beginning in 1983, the Australian dollar’s value was allowed to float, with the result that its value now depends almost entirely on market forces. The foregoing information is compiled from the Reserve Bank of Australia’s website (www.rba.gov.au).
Euro
ProShares Short Euro, ProShares UltraShort Euro and ProShares Ultra Euro are designed to correspond (before fees and expenses) to the inverse (-1), two times the inverse (-2x), or two times (2x) of the daily performance of the euro spot price versus the U.S. dollar, respectively. These Funds use the 4:00 p.m. (Eastern Time) euro/U.S. dollar exchange rate as provided by Bloomberg, expressed in terms of U.S. dollars per unit of foreign currency, as the basis for the underlying benchmark.
In 1998, the European Central Bank in Frankfurt was organized by Austria, Belgium, Finland, France, Germany, Ireland, Italy, Luxembourg, the Netherlands, Portugal and Spain in order to establish a common currency-the euro. Unlike the U.S. Federal Reserve System, the Bank of Japan and other comparable central banks, the European Central Bank is a central authority that conducts monetary policy for an economic area consisting of many otherwise largely autonomous states.
At its inception on January 1, 1999, the euro was launched as an electronic currency used by banks, foreign exchange dealers and stock markets. In 2002, the euro became cash currency for approximately 300 million citizens of twelve European countries (the eleven countries mentioned above, in addition to Greece). As of December 31, 2015, 23 countries used the euro, including Andorra, Austria, Belgium, Cyprus, Estonia, Finland, France, Germany, Greece, Ireland, Italy, Latvia, Lithuania, Luxembourg, Malta, Monaco, the Netherlands, Portugal, San Marino, Slovakia, Slovenia, Spain and the Vatican City.
Although the European countries that have adopted the euro are members of the European Union (“EU”), the United Kingdom, Denmark and Sweden are EU members that have not adopted the euro as their national currency.
Japanese Yen
ProShares UltraShort Yen and ProShares Ultra Yen are designed to correspond (before fees and expenses) to two times the inverse (-2x) or two times (2x), respectively, of the daily performance of the Japanese yen spot price versus the U.S. dollar. These Funds use the 4:00 p.m. (Eastern Time) Japanese yen/U.S. dollar exchange rate as provided by Bloomberg, expressed in terms of U.S. dollars per unit of foreign currency, as the basis for the underlying benchmark.
The Japanese yen has been the official currency of Japan since 1871. The Bank of Japan has been operating as the central bank of Japan since 1882.
17
Table of Contents
Description of the VIX Futures Indexes
The VIX Funds seek to offer exposure to forward equity market volatility by obtaining exposure to the VIX Futures Indexes, which are based on publicly traded VIX futures contracts. The VIX Futures Indexes are intended to reflect the returns that are potentially available through an unleveraged investment in the VIX futures contracts comprising each VIX Futures Index. The VIX, which is not the index underlying the VIX Funds, is calculated based on the prices of put and call options on the S&P 500. The VIX Funds can be expected to perform very differently from the VIX.
The Short-Term VIX Index employs rules for selecting VIX futures contracts comprising the Short-Term VIX Index and a formula to calculate a level for that index from the prices of these VIX futures contracts. Specifically, the VIX futures contracts comprising the Short-Term VIX Index represent the prices of two near-term VIX futures contracts, replicating a position that rolls the nearest month VIX futures to the next month VIX futures on a daily basis in equal fractional amounts. This results in a constant weighted average maturity of one-month. The roll period begins on the Tuesday prior to the monthly CBOE VIX futures settlement and runs through the Tuesday prior to the subsequent month’s CBOE VIX futures settlement date.
The Mid-Term VIX Index also employs rules for selecting its VIX futures contracts comprising the Mid-Term VIX Index and a formula to calculate a level for that index from the prices of these VIX futures contracts. Specifically, the VIX futures contracts comprising the Mid-Term VIX Index represent the prices for four contract months of VIX futures contracts, representing a rolling long position in the fourth, fifth, sixth and seventh month VIX futures contracts. The Mid-Term VIX Index rolls continuously throughout each month while maintaining positions in the fifth and sixth month contracts. This results in a constant weighted average maturity of five months.
The level of each VIX Futures Index will be published by Bloomberg L.P. in real time and at the close of trading on each VIX Futures Index business day under the following ticker symbols:
| Index |
Bloomberg Ticker Symbol | |
| S&P 500 VIX Short-Term Futures Index | SPVXSPID | |
| S&P 500 VIX Mid-Term Futures Index | SPVXMPID | |
The performance of the VIX Futures Indexes is influenced by the S&P 500 (and options thereon) and the VIX. A description of VIX futures contracts, the VIX and the S&P 500 follows:
VIX Futures Contracts
Both VIX Futures Indexes are comprised of VIX futures contracts. VIX futures contracts were first launched for trading by the CBOE in 2004. VIX futures contracts have expirations ranging from the front month consecutively out to the tenth month. VIX futures contracts allow investors the ability to invest based on their view of forward implied market volatility. Investors that believe the forward implied market volatility of the S&P 500, as represented by VIX futures contracts, will increase may buy VIX futures contracts. Conversely, investors that believe that the forward implied market volatility of the S&P 500, as represented by VIX futures contracts, will decline may sell VIX futures contracts. VIX futures contracts are reported by Bloomberg under the ticker symbol “VX.”
While the VIX represents a measure of the current expected volatility of the S&P 500 over the next 30 days, the prices of VIX futures contracts are based on the current expectation of what the expected 30-day volatility will be at a particular time in the future (on the expiration date). The VIX and VIX futures contracts generally behave quite differently. To illustrate, on November 30, 2015, the VIX was 16.13 and the price of the December 2015 VIX futures contracts expiring on December 16, 2015 was 16.98. In this example, the price of the VIX represented the 30-day implied, or “spot,” volatility (the volatility expected for the period from November 30, 2015 to December 1, 2015) of the S&P 500 and the February VIX futures contracts represented forward implied volatility (the volatility expected for the period from December 16, 2015 to January 15, 2016 of the S&P 500. The spot/forward relationship between the VIX and VIX futures contracts has two noteworthy consequences: (1) the price of a VIX futures contract can be lower, equal to or higher than the VIX, depending on whether the market expects volatility to be lower, equal to or higher in the 30-day forward period covered by the VIX futures contract than in the 30-day spot period covered by the VIX; and (2) an investor cannot create a position equivalent to one in VIX futures contracts by buying the VIX and holding the position to the futures expiration date while financing the transaction.
18
Table of Contents
The VIX
The VIX Funds are not linked to the VIX and can be expected to perform very differently from the VIX. The VIX is an index designed to measure the implied volatility of the S&P 500 over 30 days in the future, and is calculated based on the prices of certain put and call options on the S&P 500. The VIX is reflective of the premium paid by investors for certain options linked to the level of the S&P 500. During periods of rising investor uncertainty, including periods of market instability, the implied level of volatility of the S&P 500 typically increases and, consequently, the prices of options linked to the S&P 500 typically increase (assuming all other relevant factors remain constant or have negligible changes). This, in turn, causes the level of the VIX to increase. The VIX has historically had a negative correlation to the S&P 500. The VIX was developed by the CBOE and is calculated, maintained and published by the CBOE. The CBOE has no obligation to continue to publish, and may discontinue the publication of, the VIX. The VIX is reported by Bloomberg under the ticker symbol “VIX.”
The calculation of the VIX involves a formula that uses the prices of a weighted series of out-of-the-money put and call options on the level of the S&P 500 (“SPX Options”) with two adjacent expiry terms to derive a constant 30-day forward measure of market volatility. The VIX is calculated independent of any particular option pricing model and in doing so seeks to eliminate any biases which may otherwise be included in using options pricing methodology based on certain assumptions. Although the VIX measures the 30-day forward volatility of the S&P 500 as implied by the SPX Options, 30-day options are only available once a month. To arrive at the VIX level, a broad range of out-of-the-money SPX Options expiring on the two closest nearby months (“near term options” and “next term options,” respectively) are selected in order to bracket a 30-day calendar period. SPX Options having a maturity of less than eight days are excluded at the outset and, when the near term options have eight days or less left to expiration, the VIX rolls to the second and third contract months in order to minimize pricing anomalies that occur close to expiration. The model-free implied volatility using prices of the near term options and next term options are then calculated on a strike price weighted average basis in order to arrive at a single average implied volatility value for each month. The results of each of the two months are then interpolated to arrive at a single value with a constant maturity of 30 days to expiration.
The S&P 500
The S&P 500 is an index that measures large-cap U.S. stock market performance. It is a float-adjusted market capitalization weighted index of 500 U.S. operating companies and real estate investment trusts selected by the S&P U.S. Index Committee through a non-mechanical process that factors in criteria such as liquidity, price, market capitalization and financial viability. Reconstitution occurs both on a quarterly and ongoing basis. As of December 31, 2015, the S&P 500 included companies with capitalizations between $1.8 billion and $586.9 billion. The average capitalization of the companies comprising the Index was approximately $38.9 billion. S&P publishes the S&P 500. The daily calculation of the current value of the S&P 500 is based on the relative value of the aggregate market value of the common stocks of 500 companies as of a particular time compared to the aggregate average initial market value of the common stocks of 500 similar companies at the time of the inception of the S&P 500. The 500 companies are not the 500 largest publicly traded companies and not all 500 companies are listed on the NYSE. S&P chooses companies for inclusion in the S&P 500 with the objective of achieving a distribution by broad industry groupings that approximates the distribution of these groupings in the common stock population of the U.S. equity market. S&P may from time-to-time, in its sole discretion, add companies to, or delete companies from, the S&P 500 to achieve the objectives stated above. Relevant criteria employed by S&P include the viability of the particular company, the extent to which that company represents the industry group to which it is assigned, the extent to which the company’s common stock is widely held and the market value and trading activity of the common stock of that company.
THE VIX FUNDS ARE NOT SPONSORED, ENDORSED, SOLD OR PROMOTED BY S&P AND ITS AFFILIATES OR CBOE. S&P AND CBOE MAKE NO REPRESENTATION, CONDITION OR WARRANTY, EXPRESS OR IMPLIED, TO THE OWNERS OF THE VIX FUNDS OR ANY MEMBER OF THE PUBLIC REGARDING THE ADVISABILITY OF INVESTING IN SECURITIES GENERALLY OR IN THE VIX FUNDS PARTICULARLY OR THE ABILITY OF THE INDEXES TO TRACK MARKET PERFORMANCE AND/OR
19
Table of Contents
OF GROUPS OF ASSETS OR ASSET CLASSES AND/OR TO ACHIEVE ITS STATED OBJECTIVE AND/OR TO FORM THE BASIS OF A SUCCESSFUL INVESTMENT STRATEGY, AS APPLICABLE. S&P’S AND CBOE’S ONLY RELATIONSHIP TO THE TRUST ON BEHALF OF ITS APPLICABLE SERIES AND THE SPONSOR IS THE LICENSING OF CERTAIN TRADEMARKS AND TRADE NAMES AND OF THE VIX FUTURES INDEXES WHICH ARE DETERMINED, COMPOSED AND CALCULATED BY S&P WITHOUT REGARD TO THE TRUST ON BEHALF OF ITS APPLICABLE SERIES AND THE SPONSOR OR THE VIX FUNDS. S&P HAS NO OBLIGATION TO TAKE THE NEEDS OF THE TRUST ON BEHALF OF ITS APPLICABLE SERIES AND THE SPONSOR OR THE OWNERS OF THE VIX FUNDS INTO CONSIDERATION IN DETERMINING, COMPOSING OR CALCULATING THE VIX FUTURES INDEXES. S&P AND CBOE ARE NOT ADVISORS TO THE VIX FUNDS AND ARE NOT RESPONSIBLE FOR AND HAVE NOT PARTICIPATED IN THE DETERMINATION OF THE PRICES AND AMOUNT OF THE VIX FUNDS OR THE TIMING OF THE ISSUANCE OR SALE OF THE VIX FUNDS OR IN THE DETERMINATION OR CALCULATION OF THE EQUATION BY WHICH THE VIX FUND SHARES ARE TO BE CONVERTED INTO CASH. S&P AND CBOE HAVE NO OBLIGATION OR LIABILITY IN CONNECTION WITH THE ADMINISTRATION, MARKETING, OR TRADING OF THE VIX FUNDS.
NEITHER S&P, ITS AFFILIATES NOR THIRD PARTY LICENSORS, INCLUDING CBOE, GUARANTEES THE ACCURACY AND/OR THE COMPLETENESS OF THE VIX FUTURES INDEXES OR ANY DATA INCLUDED THEREIN AND S&P, ITS AFFILIATES AND THEIR THIRD PARTY LICENSORS, INCLUDING CBOE, SHALL HAVE NO LIABILITY FOR ANY ERRORS, OMISSIONS, OR INTERRUPTIONS THEREIN. S&P AND CBOE MAKE NO WARRANTY, CONDITION OR REPRESENTATION, EXPRESS OR IMPLIED, AS TO RESULTS TO BE OBTAINED BY THE TRUST ON BEHALF OF ITS APPLICABLE SERIES AND THE SPONSOR, OWNERS OF THE VIX FUNDS, OR ANY OTHER PERSON OR ENTITY FROM THE USE OF THE VIX FUTURES INDEXES OR ANY DATA INCLUDED THEREIN. S&P AND CBOE MAKE NO EXPRESS OR IMPLIED WARRANTIES, REPRESENTATIONS OR CONDITIONS, AND EXPRESSLY DISCLAIM ALL WARRANTIES OR CONDITIONS OF MERCHANTABILITY OR FITNESS FOR A PARTICULAR PURPOSE OR USE AND ANY OTHER EXPRESS OR IMPLIED WARRANTY OR CONDITION WITH RESPECT TO THE VIX FUTURES INDEXES OR ANY DATA INCLUDED THEREIN. WITHOUT LIMITING ANY OF THE FOREGOING, IN NO EVENT SHALL S&P, ITS AFFILIATES OR THEIR THIRD PARTY LICENSORS, INCLUDING CBOE, HAVE ANY LIABILITY FOR ANY SPECIAL, PUNITIVE, INDIRECT, OR CONSEQUENTIAL DAMAGES (INCLUDING LOST PROFITS) RESULTING FROM THE USE OF THE VIX FUTURES INDEXES OR ANY DATA INCLUDED THEREIN, EVEN IF NOTIFIED OF THE POSSIBILITY OF SUCH DAMAGES.
Creation and Redemption of Shares
Each Fund creates and redeems Shares from time to time, but only in one or more Creation Units. A Creation Unit is a block of 50,000 Shares of the Managed Futures Fund or a Geared Fund or a block of 25,000 Shares of a Matching VIX Fund. Creation Units may be created or redeemed only by Authorized Participants. Except when aggregated in Creation Units, the Shares are not redeemable securities.
The manner by which Creation Units are purchased and redeemed is dictated by the terms of the Authorized Participant Agreement and Authorized Participant Handbook. By placing a purchase order, an Authorized Participant agrees to deposit cash (unless as provided otherwise in the prospectus) with the Custodian of the Funds.
If permitted by the Sponsor in its sole discretion with respect to a Fund, an Authorized Participant may also agree to enter into or arrange for an exchange of a futures contract for related position (“EFCRP”) or block trade with the relevant Fund whereby the Authorized Participant would also transfer to such Fund a number and type of exchange-traded futures contracts at or near the closing settlement price for such contracts on the purchase order date. Similarly, the Sponsor in its sole discretion may agree with an Authorized Participant to use an EFCRP to affect an order to redeem Creation Units.
An EFCRP is a technique permitted by the rules of the applicable futures exchange that, as utilized by a Fund in the Sponsor’s discretion, would allow such Fund to take a position in a futures contract from an Authorized Participant, or give futures contracts to an Authorized Participant, in the case of a redemption, rather than to enter the futures exchange markets to obtain such a position. An EFCRP by itself will not change either party’s net risk position
20
Table of Contents
materially. Because the futures position that a Fund would otherwise need to take in order to meet its investment objective can be obtained without unnecessarily impacting the financial or futures markets or their pricing, EFCRPs can generally be viewed as transactions beneficial to a Fund. A block trade is a technique that permits certain Funds to obtain a futures position without going through the market auction system and can generally be viewed as a transaction beneficial to the Fund.
Authorized Participants pay a fixed transaction fee of up to $500 in connection with each order to create or redeem a Creation Unit in order to compensate Brown Brothers Harriman & Co. (“BBH&Co.”), as the Administrator, the Custodian and the Transfer Agent of each Fund and its Shares, for services in processing the creation and redemption of Creation Units and to offset the costs of increasing or decreasing derivative positions. Authorized Participants also may pay a variable transaction fee to the Funds of up to 0.10% (and a variable transaction fee to the Matching VIX Funds of 0.05%) of the value of the Creation Unit that is purchased or redeemed unless the transaction fee is waived or otherwise adjusted by the Sponsor. The Sponsor provides such Authorized Participant with prompt notice in advance of any such waiver or adjustment of the transaction fee. Authorized Participants may sell the Shares included in the Creation Units they purchase from the Funds to other investors in the secondary market.
The form of Authorized Participant Agreement and the related Authorized Participant Handbook set forth the procedures for the creation and redemption of Creation Units and for the payment of cash required for such creations and redemptions. The Sponsor may delegate its duties and obligations under the form of Authorized Participant Agreement to SEI Investments Distribution Co. (“SEI”) or BBH&Co., in its capacity as the Administrator, without consent from any shareholder or Authorized Participant. The form of Authorized Participant Agreement and the related procedures attached thereto may be amended by the Sponsor without the consent of any shareholder or Authorized Participant. Authorized Participants who purchase Creation Units from a Fund receive no fees, commissions or other form of compensation or inducement of any kind from either the Sponsor or the Fund, and no such person has any obligation or responsibility to the Sponsor or the Fund to affect any sale or resale of Shares.
Authorized Participants are cautioned that some of their activities may result in their being deemed participants in a distribution in a manner which would render them statutory underwriters and subject them to the prospectus delivery and liability provisions of the Securities Act of 1933, as amended (the “1933 Act”).
Each Authorized Participant must be registered as a broker-dealer under the 1934 Act and regulated by Financial Industry Regulatory Authority (“FINRA”), or exempt from being, or otherwise not required to be, so regulated or registered, and must be qualified to act as a broker or dealer in the states or other jurisdictions where the nature of its business so requires. Certain Authorized Participants may be regulated under federal and state banking laws and regulations. Each Authorized Participant must have its own set of rules and procedures, internal controls and information barriers as it determines is appropriate in light of its own regulatory regime.
Authorized Participants may act for their own accounts or as agents for broker-dealers, custodians and other securities market participants that wish to create or redeem Creation Units.
Persons interested in purchasing Creation Units should contact the Sponsor or the Administrator to obtain the contact information for the Authorized Participants. Shareholders who are not Authorized Participants are only able to redeem their Shares through an Authorized Participant.
Pursuant to the Authorized Participant Agreement, the Sponsor agreed to indemnify the Authorized Participants against certain liabilities, including liabilities under the 1933 Act, and to contribute to the payments the Authorized Participants may be required to make in respect of those liabilities.
The following description of the procedures for the creation and redemption of Creation Units is only a summary and an investor should refer to the relevant provisions of the Amended and Restated Trust Agreement of the Trust, as may be further amended from time to time (the “Trust Agreement”) and the form of Authorized Participant Agreement for more detail. The Trust Agreement and the form of Authorized Participant Agreement are incorporated by reference into this Annual Report on Form 10-K.
21
Table of Contents
Creation Procedures
On any Business Day, an Authorized Participant may place an order with the Distributor to create one or more Creation Units. For purposes of processing both purchase and redemption orders, a “Business Day” for each Fund means any day on which the NAV of such Fund is determined. Purchase orders must be placed by the cut-off time shown below or earlier if the NYSE, a Fund’s primary listing exchange, or other exchange material to the valuation or operation of such Fund (an “Exchange” as defined below) closes before the cut-off time. If a purchase order is received prior to the applicable cut-off time, the day on which SEI receives a valid purchase order is the purchase order date. If the purchase order is received after the applicable cut-off time, the purchase order date will be the next day. Purchase orders are irrevocable. By placing a purchase order, and prior to delivery of such Creation Units, an Authorized Participant’s DTC account will be charged the non-refundable transaction fee due for the purchase order.
Determination of Required Payment
The total payment required to create each Creation Unit is the NAV of 50,000 Shares of the Managed Futures Fund or the applicable Geared Fund or 25,000 Shares of the applicable Matching VIX Fund on the purchase order date plus the applicable transaction fee. For each Fund, Authorized Participants have create/redeem cut-off times prior to the NAV calculation time, which may be different from the close of the U.S. markets, as shown in the table below.
| Underlying Benchmark |
Create/Redeem Cutoff |
NAV Calculation Time | ||
| Silver | 6:30 a.m. (Eastern Time) | 7:00 a.m. (Eastern Time)* | ||
| Gold | 9:30 a.m. (Eastern Time) | 10:00 a.m. (Eastern Time)* | ||
| Bloomberg Commodity IndexSM | 10:45 a.m. (Eastern Time) | 2:30 p.m. (Eastern Time) | ||
| S&P Strategic Futures Index | 10:45 a.m. (Eastern Time) | 3:00 p.m. (Eastern Time) | ||
| S&P 500 VIX Short-Term Futures Index | 2:00 p.m. (Eastern Time) | 4:15 p.m. (Eastern Time) | ||
| S&P 500 VIX Mid-Term Futures Index | 2:00 p.m. (Eastern Time) | 4:15 p.m. (Eastern Time) | ||
| Bloomberg WTI Crude Oil SubindexSM | 2:00 p.m. (Eastern Time) | 2:30 p.m. (Eastern Time) | ||
| Bloomberg Natural Gas SubindexSM | 2:00 p.m. (Eastern Time) | 2:30 p.m. (Eastern Time) | ||
| Australian dollar | 3:00 p.m. (Eastern Time) | 4:00 p.m. (Eastern Time) | ||
| Euro | 3:00 p.m. (Eastern Time) | 4:00 p.m. (Eastern Time) | ||
| Yen | 3:00 p.m. (Eastern Time) | 4:00 p.m. (Eastern Time) |
| * | For silver and gold, this time may vary due to differences in when daylight savings time is effective between London and New York. The actual times equate to noon London time for silver and 3:00 p.m. London time for gold. |
Delivery of Cash
Cash required for settlement will typically be transferred to the Custodian through: (1) the Continuous Net Settlement (“CNS”) clearing process of the National Securities Clearing Corporation (“NSCC”), as such processes have been enhanced to effect creations and redemptions of Creation Units; or (2) the facilities of DTC on a Delivery Versus Payment (“DVP”) basis, which is the procedure in which the buyer’s payment for securities is due at the time of delivery. Security delivery and payment are simultaneous. If the Custodian does not receive the cash by the market close on the first Business Day following the purchase order date (T+1), such order may be charged interest for delayed settlement or cancelled. The Sponsor reserves the right to extend the deadline for the Custodian to receive the cash required for settlement up to the third Business Day following the purchase order date (T+3). In the event a purchase order is cancelled, the Authorized Participant will be responsible for reimbursing the Fund for all costs associated with cancelling the order including costs for repositioning the portfolio. At its sole discretion, the Sponsor may agree to a delivery date other than T+3. Additional fees may apply for special settlement. The Creation Unit will be delivered to the Authorized Participant upon the Custodian’s receipt of the purchase amount.
Delivery of Exchange of Futures Contract for Related Position (“EFCRP”) Futures Contracts or Block Trades
In the event that the Sponsor shall have determined to permit the Authorized Participant to transfer futures contracts pursuant to an EFCRP or to engage in a block trade purchase of futures contracts from the Authorized Participant with respect to a Fund, as well as to deliver cash, in the creation process, futures contracts required for settlement must be transferred directly to the Fund’s account at its FCM. If the cash is not received by the market close on the third Business Day following the purchase order date (T+3); such order may be charged interest for delayed
22
Table of Contents
settlements or cancelled. In the event a purchase order is cancelled, the Authorized Participant will be responsible for reimbursing a Fund for all costs associated with cancelling the order including costs for repositioning the portfolio. At its sole discretion, the Sponsor may agree to a delivery date other than T+3. The Creation Unit will be delivered to the Authorized Participant upon the Custodian’s receipt of the cash purchase amount and the futures contracts.
Suspension or Rejection of Purchase Orders
In respect of any Fund, the Sponsor may, in its discretion, suspend the right to purchase, or postpone the purchase settlement date, (1) for any period during which any of the NYSE, NYSE Arca, CBOE, CFE, CME (including CBOT and NYMEX) or ICE or other exchange material to the valuation or operation of the Funds (each, an “Exchange”) is closed or when trading is suspended or restricted on such exchanges in any of the underlying commodities; (2) for any period during which an emergency exists as a result of which the fulfillment of a purchase order is not reasonably practicable; or (3) for such other period as the Sponsor determines to be necessary for the protection of the shareholders. The Sponsor will not be liable to any person or in any way for any loss or damages that may result from any such suspension or postponement.
The Sponsor also may reject a purchase order if:
| • | it determines that the purchase order is not in proper form; |
| • | the Sponsor believes that the purchase order would have adverse tax consequences to a Fund or its shareholders; |
| • | the order would be illegal; or |
| • | circumstances outside the control of the Sponsor make it, for all practical purposes, not feasible to process creations of Creation Units. |
None of the Sponsor, the Administrator or the Custodian will be liable for the suspension or rejection of any purchase order.
Redemption Procedures
The procedures by which an Authorized Participant can redeem one or more Creation Units mirror the procedures for the creation of Creation Units. On any Business Day, an Authorized Participant may place an order with the Distributor to redeem one or more Creation Units. If a redemption order is received prior to the applicable cut-off time, or earlier if the Exchange, or other exchange material to the valuation or operation of such Fund, closes before the cut-off time, the day on which SEI receives a valid redemption order is the redemption order date. If the redemption order is received after the applicable cut-off time, the redemption order date will be the next day. Redemption orders are irrevocable. The redemption procedures allow Authorized Participants to redeem Creation Units. Individual shareholders may not redeem directly from a Fund.
By placing a redemption order, an Authorized Participant agrees to deliver the Creation Units to be redeemed through DTC’s book-entry system to the applicable Fund not later than noon (Eastern Time), on the first Business Day immediately following the redemption order date (T+1). The Sponsor reserves the right to extend the deadline for the Fund to receive the Creation Units required for settlement up to the third Business Day following the redemption order date (T+3). By placing a redemption order, and prior to receipt of the redemption proceeds, an Authorized Participant must wire to the Custodian the non-refundable transaction fee due for the redemption order or any proceeds due will be reduced by the amount of the fee payable. At its sole discretion, the Sponsor may agree to a delivery date other than T+3. Additional fees may apply for special settlement.
Upon request of an Authorized Participant made at the time of a redemption order, the Sponsor at its sole discretion may determine, in addition to delivering redemption proceeds, to transfer futures contracts to the Authorized Participant pursuant to an EFCRP or to a block trade sale of futures contracts to the Authorized Participant.
23
Table of Contents
Determination of Redemption Proceeds
The redemption proceeds from a Fund consist of the cash redemption amount and, if permitted by the Sponsor in its sole discretion with respect to a Fund, an EFCRP or block trade with the relevant Fund, as described in “Creation and Redemption of Shares” above. The cash redemption amount is equal to the NAV of the number of Creation Unit(s) of such Fund requested in the Authorized Participant’s redemption order as of the time of the calculation of such Fund’s NAV on the redemption order date, less transaction fees and any amounts attributable to any applicable EFCRP or block trade.
Delivery of Redemption Proceeds
The redemption proceeds due from a Fund are delivered to the Authorized Participant at noon (Eastern Time), on the third Business Day immediately following the redemption order date if, by such time on such Business Day immediately following the redemption order date, a Fund’s DTC account has been credited with the Creation Units to be redeemed. The Fund should be credited through: (1) the CNS clearing process of NSCC, as such processes have been enhanced to effect creations and redemptions of Creation Units; or (2) the facilities of DTC on a Delivery Versus Payment basis. If a Fund’s DTC account has not been credited with all of the Creation Units to be redeemed by such time, the redemption distribution is delivered to the extent whole Creation Units are received. Any remainder of the redemption distribution is delivered on the next Business Day to the extent any remaining whole Creation Units are received if: (1) the Sponsor receives the fee applicable to the extension of the redemption distribution date which the Sponsor may, from time to time, determine, and; (2) the remaining Creation Units to be redeemed are credited to the Fund’s DTC account by noon (Eastern Time), on such next Business Day. Any further outstanding amount of the redemption order may be cancelled. The Authorized Participant will be responsible for reimbursing a Fund for all costs associated with cancelling the order including costs for repositioning the portfolio.
The Sponsor is also authorized to deliver the redemption distribution notwithstanding that the Creation Units to be redeemed are not credited to a Fund’s DTC account by noon (Eastern Time), on the third Business Day immediately following the redemption order date if the Authorized Participant has collateralized its obligation to deliver the Creation Units through DTC’s book-entry system on such terms as the Sponsor may determine from time-to-time.
In the event that the Authorized Participant shall have requested, and the Sponsor shall have determined to permit the Authorized Participant to receive futures contracts pursuant to an EFCRP, as well as the cash redemption proceeds, in the redemption process, futures contracts required for settlement shall be transferred directly from the Fund’s account at its FCM to the account of the Authorized Participant at its FCM.
Suspension or Rejection of Redemption Orders
In respect of any Fund, the Sponsor may, in its discretion, suspend the right of redemption, or postpone the redemption settlement date: (1) for any period during which any Exchange, or other exchange material to the valuation or operation of the Fund, is closed or when trading is suspended or restricted on such Exchanges in any of the underlying commodities; (2) for any period during which an emergency exists as a result of which the redemption distribution is not reasonably practicable; or (3) for such other period as the Sponsor determines to be necessary for the protection of the shareholders. The Sponsor will not be liable to any person or in any way for any loss or damages that may result from any such suspension or postponement.
The Sponsor will reject a redemption order if the order is not in proper form as described in the form of Authorized Participant Agreement or if the fulfillment of the order might be unlawful.
Creation and Redemption Transaction Fee
To compensate BBH&Co. for services in processing the creation and redemption of Creation Units and to offset some or all of the transaction costs, an Authorized Participant may be required to pay a fixed transaction fee to BBH&Co. of up to $500 per order to create or redeem Creation Units and may pay a variable transaction fee to a Fund of up to 0.10% (and a variable transaction fee to the Matching VIX Funds of 0.05%) of the value of a Creation Unit. An order may include multiple Creation Units. The transaction fee(s) may be reduced, increased or otherwise changed by the Sponsor at its sole discretion.
24
Table of Contents
Special Settlement
The Sponsor may allow for early settlement of purchase or redemption orders. Such arrangements may result in additional charges to the Authorized Participant.
NAV
The NAV in respect of a Fund means the total assets of the Fund including, but not limited to, all cash and cash equivalents or other debt securities less total liabilities of such Fund, each determined on the basis of generally accepted accounting principles in the United States, consistently applied under the accrual method of accounting. In particular, the NAV includes any unrealized profit or loss on open Financial Instruments, and any other credit or debit accruing to a Fund but unpaid or not received by a Fund. The NAV per Share of each Fund is computed by dividing the value of the net assets of such Fund (i.e., the value of its total assets less total liabilities) by its total number of Shares outstanding. Expenses and fees are accrued daily and taken into account for purposes of determining the NAV. Each Fund’s NAV is calculated on each day other than a day when the Exchange is closed for regular trading. The Funds compute their NAVs at the times set forth below, or an earlier time as set forth on www.ProShares.com if necessitated by the Exchange or other exchange material to the valuation or operation of such Fund closing early. Each Fund’s NAV is calculated only once each trading day.
| Fund |
NAV Calculation Time | |
| UltraShort Silver, Ultra Silver |
7:00 a.m. (Eastern Time)* | |
| UltraShort Gold, Ultra Gold |
10:00 a.m. (Eastern Time)* | |
| UltraShort Bloomberg Commodity, |
||
| Ultra Bloomberg Commodity |
2:30 p.m. (Eastern Time) | |
| UltraShort Bloomberg Crude Oil, |
||
| Ultra Bloomberg Crude Oil |
2:30 p.m. (Eastern Time) | |
| UltraShort Bloomberg Natural Gas, |
||
| Ultra Bloomberg Natural Gas |
2:30 p.m. (Eastern Time) | |
| Managed Futures Strategy |
3:00 p.m. (Eastern Time) | |
| Short Euro, |
||
| UltraShort Euro, |
||
| Ultra Euro |
4:00 p.m. (Eastern Time) | |
| UltraShort Australian Dollar |
4:00 p.m. (Eastern Time) | |
| UltraShort Yen, |
||
| Ultra Yen |
4:00 p.m. (Eastern Time) | |
| VIX Short-Term Futures ETF, |
||
| Ultra VIX Short-Term Futures ETF, |
||
| Short VIX Short-Term Futures ETF |
4:15 p.m. (Eastern Time) | |
| VIX Mid-Term Futures ETF |
4:15 p.m. (Eastern Time) |
| * | For silver and gold, this time may vary due to differences in when daylight savings time is effective between London and New York. The actual times equate to noon London time for silver and 3:00 p.m. London time for gold. |
In calculating the NAV of a Fund, the settlement value of the Fund’s non-exchange traded Financial Instruments, is determined by applying the then-current disseminated value for the applicable benchmark to the terms of such Fund’s non-exchange traded Financial Instruments. However, in the event that an underlying reference asset is not trading due to the operation of daily limits or otherwise, the Sponsor may, in its sole discretion, choose to fair value the index level in order to value the Fund’s non-exchange traded Financial Instruments for purposes of the NAV calculation. Such fair value prices would generally be determined based on available inputs about the current value of the underlying reference assets and would be based on principles that the Sponsor deems fair and equitable so long as such principles are consistent with normal industry standards.
25
Table of Contents
Futures contracts traded on a U.S. exchange are calculated at their then-current market value, which is based upon the settlement price (for the VIX Funds, the Managed Futures Fund and the Commodity Index Funds) or the last traded price before the NAV time (for the Currency Funds), for that particular futures contract traded on the applicable U.S. exchange on the date with respect to which the NAV is being determined. If a futures contract traded on a U.S. exchange could not be liquidated on such day, due to the operation of daily limits or other rules of the exchange upon which that position is traded or otherwise, the Sponsor may, in its sole discretion, choose to determine a fair value price as the basis for determining the market value of such position for such day. Such fair value prices would generally be determined based on available inputs about the current value of the underlying reference assets and would be based on principles that the Sponsor deems fair and equitable so long as such principles are consistent with normal industry standards.
The Funds may use a variety of money market instruments to invest excess cash. Short-term debt instruments used in this capacity and expected to be held-to-maturity will be priced for NAV purposes at amortized cost.
Indicative Optimized Portfolio Value (“IOPV”)
The IOPV is an indicator of the value of a Fund’s net assets at the time the IOPV is disseminated. The IOPV is calculated and disseminated every 15 seconds throughout the trading day. The IOPV is generally calculated using the prior day’s closing net assets of a Fund as a base and updating throughout the trading day changes in the value of the Financial Instruments held by a Fund. The IOPV should not be viewed as an actual real time update of the NAV because NAV is calculated only once at the end of each trading day. The IOPV also should not be viewed as a precise value of the Shares. The IOPV for Funds based on the Bloomberg WTI Crude Oil SubindexSM and the Bloomberg Natural Gas IndexSM will not update following the determination of the 2:30 p.m. settlement price of the futures contracts underlying those indexes. The IOPVs for Funds based on the Bloomberg Commodity IndexSM will receive progressively more limited updates during a trading day as the settlement price for each individual component is determined, and such IOPVs will not update after all of the underlying components have determined settlement prices.
The NYSE Arca disseminates the IOPV. In addition, the IOPV is published on the NYSE Arca’s website and is available through on-line information services such as Bloomberg and Reuters.
Dissemination of the IOPV provides additional information that is not otherwise available to the public and may be useful to investors and market professionals in connection with the trading of Shares. Investors and market professionals are able throughout the trading day to compare the market price of a Fund and the IOPV. If the market price of Shares diverges significantly from the IOPV, market professionals may have an incentive to execute arbitrage trades. Such arbitrage trades can tighten the tracking between the market price of a Fund and the IOPV and thus can be beneficial to all market participants.
Purchases and Sales in the Secondary Market on the NYSE Arca
The Shares of each Fund are listed on the NYSE Arca. The Shares of each Fund that has commenced investment operations, began trading on the NYSE Arca on the respective dates below under the following symbols:
| Fund |
Commencement of Operations |
Ticker Symbol | ||
| ProShares Managed Futures Strategy |
October 1, 2014 | FUTS | ||
| ProShares VIX Short-Term Futures ETF |
January 3, 2011 | VIXY | ||
| ProShares VIX Mid-Term Futures ETF |
January 3, 2011 | VIXM | ||
| ProShares Short VIX Short-Term Futures ETF |
October 3, 2011 | SVXY | ||
| ProShares Ultra VIX Short-Term Futures ETF |
October 3, 2011 | UVXY | ||
| ProShares UltraShort Bloomberg Commodity |
November 25, 2008 | CMD | ||
| ProShares UltraShort Bloomberg Crude Oil |
November 25, 2008 | SCO | ||
| ProShares UltraShort Bloomberg Natural Gas |
October 4, 2011 | KOLD | ||
| ProShares UltraShort Gold |
December 3, 2008 | GLL |
26
Table of Contents
| Fund |
Commencement of Operations |
Ticker Symbol | ||
| ProShares UltraShort Silver |
December 3, 2008 | ZSL | ||
| ProShares Short Euro |
June 26, 2012 | EUFX | ||
| ProShares UltraShort Australian Dollar |
July 17, 2012 | CROC | ||
| ProShares UltraShort Euro |
November 25, 2008 | EUO | ||
| ProShares UltraShort Yen |
November 25, 2008 | YCS | ||
| ProShares Ultra Bloomberg Commodity |
November 25, 2008 | UCD | ||
| ProShares Ultra Bloomberg Crude Oil |
November 25, 2008 | UCO | ||
| ProShares Ultra Bloomberg Natural Gas |
October 4, 2011 | BOIL | ||
| ProShares Ultra Gold |
December 3, 2008 | UGL | ||
| ProShares Ultra Silver |
December 3, 2008 | AGQ | ||
| ProShares Ultra Euro |
November 25, 2008 | ULE | ||
| ProShares Ultra Yen |
November 25, 2008 | YCL |
Secondary market purchases and sales of Shares are subject to ordinary brokerage commissions and charges. The Shares of each Fund trade like any other exchange-listed security.
Fees and Expenses
Offering Expenses
The Trust has paid expenses incurred in connection with organizing the initial offering of each Fund’s Shares, and the Sponsor did not charge its fee in the first year of operations of each Fund in an amount equal to the offering costs. The Sponsor reimbursed each Geared Fund and the Short Euro Fund to the extent that its organizational and offering costs exceeded 0.95% of its average daily NAV for the first year of operations. The Sponsor reimbursed each Matching VIX Fund to the extent that its organizational and offering costs exceeded 0.85% of its average daily NAV for the first year of operations. The Sponsor reimbursed the Managed Futures Fund to the extent that its initial offering costs exceed 0.75% of its average daily net assets for the first year of operations. Normal and expected expenses incurred in connection with the continuous offering of Shares of each Fund are paid by the Sponsor.
Offering expenses mean those expenses incurred in connection with the qualification and registration of the Shares of each Fund and in offering, distributing and processing the Shares of each Fund under applicable federal law, and any other expenses actually incurred and, directly or indirectly, related to the organization of each offering of the Shares of such Fund, including, but not limited to, expenses such as:
| • | initial SEC registration fees and SEC and FINRA filing fees; |
| • | costs of preparing, printing (including typesetting), amending, supplementing, mailing and distributing the Trust’s Registration Statements, the exhibits thereto and the related prospectuses; |
| • | the costs of qualifying, printing (including typesetting), amending, supplementing and mailing sales materials used in connection with the offering and issuance of the Shares; and |
| • | accounting, auditing and legal fees (including disbursements related thereto) incurred in connection therewith. |
Management Fee
Each Geared Fund pays the Sponsor a Management Fee, monthly in arrears, in an amount equal to 0.95% per annum of its average daily NAV of such Fund. Each Matching VIX Fund pays the Sponsor a management fee, monthly in arrears, in an amount equal to 0.85% per annum of its average daily NAV. The Managed Futures Fund pays the Sponsor a Management Fee, monthly in arrears, in an amount equal to 0.75% per annum of its average daily NAV. For the first year of the Managed Futures Fund’s operations, the Sponsor will not charge its fee in an amount equal to the offering costs. The Sponsor reimbursed the Managed Futures Fund to the extent that its offering costs exceeded the Management Fee for the first year of operations. No other management fee is paid by the Funds. The Management Fee is paid in consideration of the Sponsor’s trading advisory services and the other services provided to the Funds that the Sponsor pays directly.
27
Table of Contents
Licensing Fee
The Sponsor pays S&P a licensing fee for use of the VIX Futures Indexes as the benchmarks for the VIX Funds and a licensing fee for the S&P Strategic Futures Index as the benchmark for the Managed Futures Fund. The Sponsor pays Bloomberg a licensing fee for the Bloomberg Commodity IndexSM, as well as each subindex that serves as a benchmark for a Commodity Index Fund.
Routine Operational, Administrative and Other Ordinary Expenses
The Sponsor pays all of the routine operational, administrative and other ordinary expenses of each Fund, generally, as determined by the Sponsor, including, but not limited to, fees and expenses of the Administrator, Custodian, Distributor, ProFunds Distributors, Inc., an affiliated broker-dealer of the Sponsor, and Transfer Agent, licensing fees, accounting and audit fees and expenses, tax preparation expenses, legal fees not in excess of $100,000 per annum, ongoing SEC registration fees not exceeding 0.021% per annum of the NAV of a Fund, Financial Industry Regulatory Authority (“FINRA”) filing fees, individual K-1 preparation and mailing fees not exceeding 0.10% per annum of the NAV of a Fund, and report preparation and mailing expenses.
Non-Recurring Fees and Expenses
Each Fund pays all its non-recurring and unusual fees and expenses, if any, as determined by the Sponsor. Non-recurring and unusual fees and expenses are fees and expenses which are unexpected or unusual in nature, such as legal claims and liabilities, litigation costs or indemnification or other material expenses which are not currently anticipated obligations of the Funds. Routine operational, administrative and other ordinary expenses are not deemed extraordinary expenses.
Selling Commission
Retail investors may purchase and sell Shares through traditional brokerage accounts. Investors are expected to be charged a customary commission by their brokers in connection with purchases of Shares that will vary from investor to investor. Investors are encouraged to review the terms of their brokerage accounts for applicable charges. The price at which an Authorized Participant sells a Share may be higher or lower than the price paid by such Authorized Participant in connection with the creation of such Share in a Creation Unit.
Brokerage Commissions and Fees
Each Fund, with the exception of the Matching VIX Funds, pays all of its brokerage commissions, including applicable exchange fees, NFA fees and give-up fees, pit brokerage fees and other transaction related fees and expenses charged in connection with trading activities for each Fund’s investments in CFTC regulated investments. The Sponsor is currently paying brokerage commissions on VIX futures contracts for the Matching VIX Funds in amounts that exceed variable create/redeem fees collected by more than 0.02% of the Matching VIX Fund’s average net assets annually.
Other Transaction Costs
The Funds bear other transaction costs including the effects of trading spreads and financing costs/fees, if any, associated with the use of Financial Instruments, and costs relating to the purchase of U.S. Treasury securities or similar high credit quality short-term fixed-income or similar securities (such as shares of money market funds and collateralized repurchase agreements).
Employees
The Trust has no employees.
These risk factors should be read in connection with the other information included in this Annual Report on Form 10-K, including Management’s Discussion and Analysis of Financial Condition and Results of Operations and the Funds’ Financial Statements and the related Notes to the Funds’ Financial Statements. For purposes of this section:
28
Table of Contents
| • | The term “Managed Futures Fund” refers to ProShares Managed Futures Strategy; |
| • | The term “Matching VIX Fund” refers to ProShares VIX Short-Term Futures ETF and ProShares VIX Mid-Term Futures ETF; |
| • | The term “Geared VIX Fund” refers to ProShares Ultra VIX Short-Term Futures ETF and ProShares Short VIX Short-Term Futures ETF; |
| • | The term “VIX Fund” refers to each Geared VIX Fund and each Matching VIX Fund; |
| • | The term “Geared Fund” refers to ProShares UltraShort Bloomberg Commodity, ProShares UltraShort Bloomberg Crude Oil, ProShares UltraShort Bloomberg Natural Gas, ProShares UltraShort Gold, ProShares UltraShort Silver, ProShares Short Euro, ProShares UltraShort Australian Dollar, ProShares UltraShort Euro, ProShares UltraShort Yen, ProShares Ultra Bloomberg Commodity, ProShares Ultra Bloomberg Crude Oil, ProShares Ultra Bloomberg Natural Gas, ProShares Ultra Gold, ProShares Ultra Silver, ProShares Ultra Euro and ProShares Ultra Yen, and each Geared VIX Fund; |
| • | The term “Commodity Index Fund” refers to ProShares UltraShort Bloomberg Commodity, ProShares UltraShort Bloomberg Crude Oil, ProShares UltraShort Bloomberg Natural Gas, ProShares Ultra Bloomberg Commodity, ProShares Ultra Bloomberg Crude Oil and ProShares Ultra Bloomberg Natural Gas; |
| • | The term “Commodity Fund” refers to ProShares UltraShort Gold, ProShares UltraShort Silver, ProShares Ultra Gold and ProShares Ultra Silver; and |
| • | The term “Currency Fund” refers to ProShares Short Euro, ProShares UltraShort Australian Dollar, ProShares UltraShort Euro, ProShares UltraShort Yen, ProShares Ultra Euro and ProShares Ultra Yen. |
Risks Specific to the Geared Funds
In addition to the risks described elsewhere in this “Risk Factors” section, the following risks apply to the Geared Funds.
Due to the compounding of daily returns, the Geared Funds’ returns over periods longer than a single day will likely differ in amount and possibly even direction from the Geared Fund multiple times the benchmark return for the period.
Each of the Geared Funds is “geared” in the sense that each has an investment objective to correspond (before fees and expenses) to the inverse (e.g., -1x), an inverse multiple (e.g., -2x), or a multiple (e.g., 2x), of the performance of a benchmark on a given day. Each Geared Fund seeks investment results for a single day only, as measured from its NAV calculation time to its next NAV calculation time, and not for any other period. The return of a Geared Fund for a period longer than a single day is the result of its return for each day compounded over the period and usually will differ from the inverse (-1x), two times the inverse (-2x), or two times (2x) the return of the Geared Fund’s benchmark for the period. A Geared Fund will lose money if its benchmark’s performance is flat over time, and it is possible for a Geared Fund to lose money over time regardless of the performance of an underlying benchmark, as a result of daily rebalancing, the benchmark’s volatility and compounding. Longer holding periods, higher benchmark volatility, inverse exposure and greater leverage each affect the impact of compounding on a Geared Fund’s returns. Daily compounding of a Geared Fund’s investment returns can dramatically and adversely affect its longer-term performance during periods of high volatility. Volatility may be at least as important to a Geared Fund’s return for a period as the return of the Geared Fund’s underlying benchmark.
Each Ultra or UltraShort Fund uses leverage and should produce daily returns that are more volatile than that of its benchmark. For example, the daily return of an Ultra Fund with a 2x multiple should be approximately two times as volatile on a daily basis as the return of a fund with an objective of matching the same benchmark. The daily return of a Short or an UltraShort Fund is designed to return the inverse (-1x) or two times the inverse (-2x) of the return, respectively, that would be expected of a fund with an objective of matching the same benchmark. The Geared Funds are not appropriate for all investors and present different risks than other funds. The Geared Funds that use leverage are riskier than similarly benchmarked exchange-traded funds that do not use leverage. An investor should
29
Table of Contents
only consider an investment in a Geared Fund if he or she understands the consequences of seeking daily leveraged, daily inverse or daily inverse leveraged investment results. Daily objective geared funds, if used properly and in conjunction with the investor’s view on the future direction and volatility of the markets, can be useful tools for investors who want to manage their exposure to various markets and market segments and who are willing to monitor and/or periodically rebalance their portfolios. Shareholders who invest in the Geared Funds should actively manage and monitor their investments, as frequently as daily.
The hypothetical examples below illustrate how daily geared fund returns can behave for periods longer than a single day. Each involves a hypothetical fund XYZ that seeks to double the daily performance of benchmark XYZ. On each day, fund XYZ performs in line with its objective (two times (2x) the benchmark’s daily performance before fees and expenses). Notice that, in the first example (showing an overall benchmark loss for the period), over the entire seven-day period, the fund’s total return is more than two times the loss of the period return of the benchmark. For the seven-day period, benchmark XYZ lost 3.26% while fund XYZ lost 7.01% (versus -6.52% or 2 x -3.26%).
| Benchmark XYZ | Fund XYZ | |||||||||||||||
| Level | Daily Performance |
Daily Performance |
Net Asset Value |
|||||||||||||
| Start |
100.00 | $ | 100.00 | |||||||||||||
| Day 1 |
97.00 | -3.00 | % | -6.00 | % | $ | 94.00 | |||||||||
| Day 2 |
99.91 | 3.00 | % | 6.00 | % | $ | 99.64 | |||||||||
| Day 3 |
96.91 | -3.00 | % | -6.00 | % | $ | 93.66 | |||||||||
| Day 4 |
99.82 | 3.00 | % | 6.00 | % | $ | 99.28 | |||||||||
| Day 5 |
96.83 | -3.00 | % | -6.00 | % | $ | 93.32 | |||||||||
| Day 6 |
99.73 | 3.00 | % | 6.00 | % | $ | 98.92 | |||||||||
| Day 7 |
96.74 | -3.00 | % | -6.00 | % | $ | 92.99 | |||||||||
|
|
|
|
|
|||||||||||||
| Total Return |
-3.26 | % | -7.01 | % | ||||||||||||
|
|
|
|
|
|||||||||||||
Similarly, in another example (showing an overall benchmark gain for the period), over the entire seven-day period, the fund’s total return is considerably less than double that of the period return of the benchmark. For the seven-day period, benchmark XYZ gained 2.72% while fund XYZ gained 4.86% (versus 5.44% (or 2 x 2.72%)).
| Benchmark XYZ | Fund XYZ | |||||||||||||||
| Level | Daily Performance |
Daily Performance |
Net Asset Value |
|||||||||||||
| Start |
100.00 | $ | 100.00 | |||||||||||||
| Day 1 |
103.00 | 3.00 | % | 6.00 | % | $ | 106.00 | |||||||||
| Day 2 |
99.91 | -3.00 | % | -6.00 | % | $ | 99.64 | |||||||||
| Day 3 |
102.91 | 3.00 | % | 6.00 | % | $ | 105.62 | |||||||||
| Day 4 |
99.82 | -3.00 | % | -6.00 | % | $ | 99.28 | |||||||||
| Day 5 |
102.81 | 3.00 | % | 6.00 | % | $ | 105.24 | |||||||||
| Day 6 |
99.73 | -3.00 | % | -6.00 | % | $ | 98.92 | |||||||||
| Day 7 |
102.72 | 3.00 | % | 6.00 | % | $ | 104.86 | |||||||||
|
|
|
|
|
|||||||||||||
| Total Return |
2.72 | % | 4.86 | % | ||||||||||||
|
|
|
|
|
|||||||||||||
These effects are caused by compounding, which exists in all investments, but has a more significant impact in geared funds. In general, during periods of higher benchmark volatility, compounding will cause an Ultra Fund’s results for periods longer than a single day to be less than two times (2x) the return of the benchmark (or less than the inverse (-1x) or two times the inverse (-2x) times the return of the benchmark for the Short Funds and UltraShort Funds, respectively). This effect becomes more pronounced as volatility increases. Conversely, in periods of lower benchmark volatility (particularly when combined with higher benchmark returns), an Ultra Fund’s returns over longer periods can be higher than two times (2x) the return of the benchmark. Actual results for a particular period, before fees and expenses, are also dependent on the magnitude of the benchmark return in addition to the benchmark volatility. Similar effects exist for the Short Funds and UltraShort Funds, and the significance of these effects may be even greater with such inverse or inverse leveraged funds.
30
Table of Contents
The graphs that follow illustrate this point. Each of the graphs shows a simulated hypothetical one-year performance of a benchmark compared with the performance of a geared fund that perfectly achieves its geared daily investment objective. The graphs demonstrate that, for periods greater than a single day, a geared fund is likely to underperform or overperform (but not match) the benchmark performance (or the inverse of the benchmark performance) times the multiple stated as the daily fund objective. Investors should understand the consequences of holding daily rebalanced funds for periods longer than a single day and should actively manage and monitor their investments, as frequently as daily. A one-year period is used solely for illustrative purposes. Deviations from the benchmark return (or the inverse of the benchmark return) times the fund multiple can occur over periods as short as two days (each day as measured from NAV to NAV) and may also occur in periods shorter than a single day (when measured intraday as opposed to NAV to NAV). See “Intraday Price Performance Risk” below for additional details. To isolate the impact of daily leveraged, inverse or inverse leveraged exposure, these graphs assume: a) no fund expenses or transaction costs; b) borrowing/lending rates (to obtain required inverse, inverse leveraged or leveraged exposure) and cash reinvestment rates of zero percent; and c) the fund consistently maintaining perfect exposure (-1x, -2x or 2x) as of the fund’s NAV time each day. If these assumptions were different, the fund’s performance would be different than that shown. If fund expenses, transaction costs and financing expenses greater than zero percent were included, the fund’s performance would also be different than that shown. Each of the graphs also assumes a volatility rate of 70%, which is an approximate average of the five-year historical volatility rate of the most volatile benchmark referenced herein (the S&P 500 VIX Short-Term Futures Index). A benchmark’s volatility rate is a statistical measure of the magnitude of fluctuations in its returns.
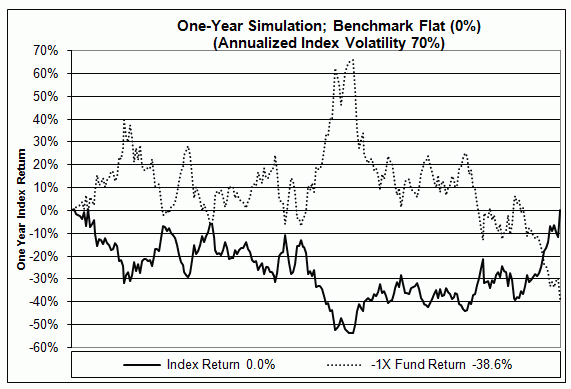
The graph above shows a scenario where the benchmark, which exhibits day-to-day volatility, is flat or trendless over the year (i.e., provides a return of 0% over the course of the year), but the Short Fund (-1x) is down.
31
Table of Contents
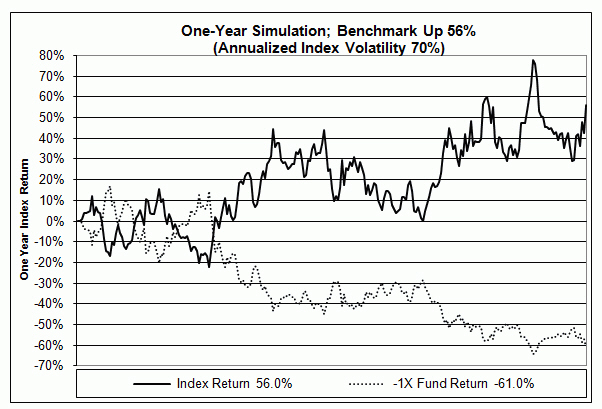
The graph above shows a scenario where the benchmark, which exhibits day-to-day volatility, is up over the year, but the Short Fund (-1x) is down more than the inverse of the benchmark.
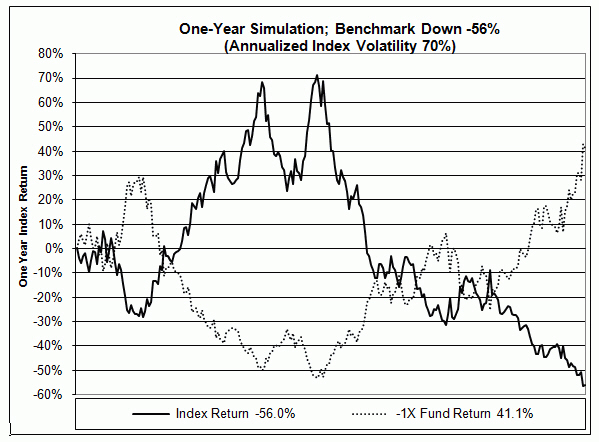
32
Table of Contents
The graph above shows a scenario where the benchmark, which exhibits day-to-day volatility, is down over the year, but the Short Fund (-1x) is up less than the inverse of the benchmark.
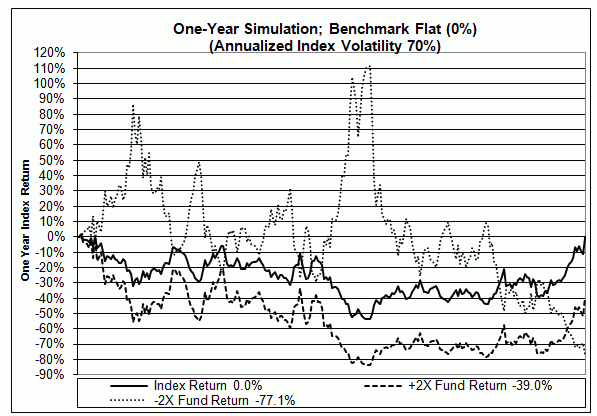
The graph above shows a scenario where the benchmark, which exhibits day-to-day volatility, is flat or trendless over the year (i.e., provides a return of 0% over the course of the year), but the Ultra Fund (2x) and the UltraShort Fund (-2x) are both down.
33
Table of Contents
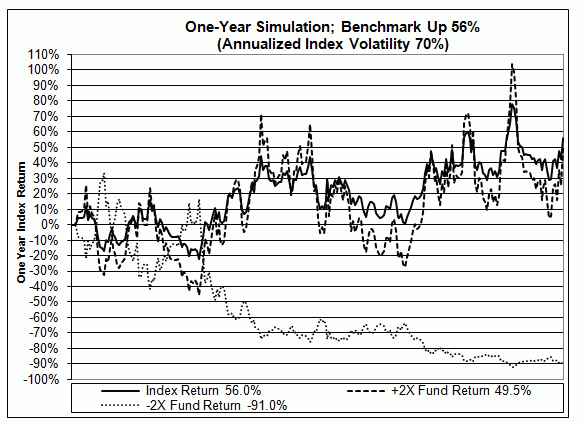
The graph above shows a scenario where the benchmark, which exhibits day-to-day volatility, is up over the year, but the Ultra Fund (2x) is up less than two times the benchmark and the UltraShort Fund (-2x) is down less than two times the inverse of the benchmark.
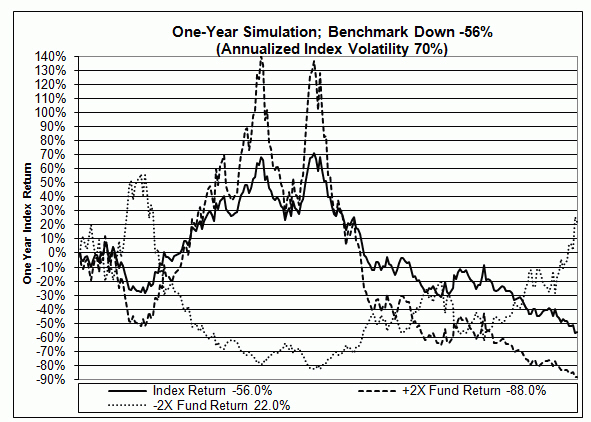
34
Table of Contents
The graph above shows a scenario where the benchmark, which exhibits day-to-day volatility, is down over the year, but the Ultra Fund (2x) is down less than two times the benchmark and the UltraShort Fund (-2x) is up less than two times the inverse of the benchmark.
The historical five year average volatility of the benchmarks utilized by the Funds ranges from 4.70% to 70.08%, as set forth in the table below.
| Index |
Identifier | Historical Five-Year Average Volatility Rate As of December 31, 2015 | ||
| S&P Strategic Futures Index* |
SPSFIT | 4.70% | ||
| S&P 500 VIX Short-Term Futures Index |
SPVXSPID | 70.08% | ||
| S&P 500 VIX Mid-Term Futures Index |
SPVXMPID | 33.25% | ||
| Bloomberg Commodity IndexSM |
BCOM | 13.91% | ||
| Bloomberg WTI Crude Oil SubindexSM |
BCOMCL | 30.84% | ||
| Bloomberg Natural Gas SubindexSM |
BCOMNG | 44.67% | ||
| The daily performance of gold bullion as measured by the U.S. dollar p.m. LBMA Gold Price |
GOLDLNPM | 17.80% | ||
| The daily performance of silver bullion as measured by the London Silver Price |
SLVRLN | 36.26% | ||
| The U.S. dollar price of the euro |
USDEUR | 9.36% | ||
| The U.S. dollar price of the Japanese yen |
USDJPY | 8.93% | ||
| The U.S. dollar price of the Australian dollar |
USDAUD | 10.77% |
| * | The S&P Strategic Futures Index launched on August 14, 2014. Accordingly, the Index has not been in existence for five years. |
The tables below illustrate the impact of two factors that affect a Geared Fund’s performance, benchmark volatility and benchmark return. Benchmark volatility is a statistical measure of the magnitude of fluctuations in the returns of a benchmark and is calculated as the standard deviation of the natural logarithms of one plus the benchmark return (calculated daily), multiplied by the square root of the number of trading days per year (assumed to be 252). The tables show estimated fund returns for a number of combinations of benchmark volatility and benchmark return over a one-year period. To isolate the impact of daily leveraged, inverse or inverse leveraged exposure, these graphs assume: a) no fund expenses or transaction costs; b) borrowing/lending rates of zero percent (to obtain required inverse, inverse leveraged or leveraged exposure) and cash reinvestment rates of zero percent; and c) the fund consistently maintaining perfect exposure (-1x, -2x or 2x) as of the fund’s NAV time each day. If these assumptions were different, the fund’s performance would be different than that shown. If fund expenses, transaction costs and financing expenses were included, the fund’s performance would be different than that shown. The tables below show examples in which a Geared Fund has an investment objective to correspond (before fees and expenses) to the inverse (-1), two times the inverse (-2x) or two times (2x) the daily performance of a benchmark. The Geared Fund that has an investment objective to correspond to two times (2x) the daily performance of a benchmark could incorrectly be expected to achieve a 20% return on a yearly basis if the benchmark return was 10%, absent the effects of compounding. However, as the tables below show, with a benchmark volatility of 40%, such a fund would return 3.1%. In the charts below, shaded areas represent those scenarios where a geared fund with the investment objective described will outperform (i.e., return more than) the benchmark performance times the stated multiple in the fund’s investment objective; conversely areas not shaded represent those scenarios where the fund will underperform (i.e., return less than) the benchmark performance times the multiple stated as the daily fund objective.
35
Table of Contents
Estimated Fund Return Over One Year When the Fund Objective is to Seek Daily Investment Results, Before Fees and Expenses, that Correspond to the Inverse (-1x) of the Daily Performance of a Benchmark.
| One Year Benchmark Performance |
Inverse (-1x) of One Year Benchmark Performance |
Benchmark Volatility | ||||||||||||||||||||||||||||||||||||||||||||||||||||||||||||
| 0% | 5% | 10% | 15% | 20% | 25% | 30% | 35% | 40% | 45% | 50% | 55% | 60% | 65% | 70% | ||||||||||||||||||||||||||||||||||||||||||||||||
| -60% |
60% | 150.0 | % | 149.4 | % | 147.5 | % | 144.4 | % | 140.2 | % | 134.9 | % | 128.5 | % | 121.2 | % | 113.0 | % | 104.2 | % | 94.7 | % | 84.7 | % | 74.4 | % | 63.9 | % | 53.2 | % | |||||||||||||||||||||||||||||||
| -55% |
55% | 122.2 | % | 121.7 | % | 120.0 | % | 117.3 | % | 113.5 | % | 108.8 | % | 103.1 | % | 96.6 | % | 89.4 | % | 81.5 | % | 73.1 | % | 64.2 | % | 55.0 | % | 45.6 | % | 36.1 | % | |||||||||||||||||||||||||||||||
| -50% |
50% | 100.0 | % | 99.5 | % | 98.0 | % | 95.6 | % | 92.2 | % | 87.9 | % | 82.8 | % | 76.9 | % | 70.4 | % | 63.3 | % | 55.8 | % | 47.8 | % | 39.5 | % | 31.1 | % | 22.5 | % | |||||||||||||||||||||||||||||||
| -45% |
45% | 81.8 | % | 81.4 | % | 80.0 | % | 77.8 | % | 74.7 | % | 70.8 | % | 66.2 | % | 60.9 | % | 54.9 | % | 48.5 | % | 41.6 | % | 34.4 | % | 26.9 | % | 19.2 | % | 11.4 | % | |||||||||||||||||||||||||||||||
| -40% |
40% | 66.7 | % | 66.3 | % | 65.0 | % | 63.0 | % | 60.1 | % | 56.6 | % | 52.3 | % | 47.5 | % | 42.0 | % | 36.1 | % | 29.8 | % | 23.2 | % | 16.3 | % | 9.2 | % | 2.1 | % | |||||||||||||||||||||||||||||||
| -35% |
35% | 53.8 | % | 53.5 | % | 52.3 | % | 50.4 | % | 47.8 | % | 44.5 | % | 40.6 | % | 36.1 | % | 31.1 | % | 25.6 | % | 19.8 | % | 13.7 | % | 7.3 | % | 0.8 | % | -5.7 | % | |||||||||||||||||||||||||||||||
| -30% |
30% | 42.9 | % | 42.5 | % | 41.4 | % | 39.7 | % | 37.3 | % | 34.2 | % | 30.6 | % | 26.4 | % | 21.7 | % | 16.7 | % | 11.3 | % | 5.6 | % | -0.3 | % | -6.4 | % | -12.5 | % | |||||||||||||||||||||||||||||||
| -25% |
25% | 33.3 | % | 33.0 | % | 32.0 | % | 30.4 | % | 28.1 | % | 25.3 | % | 21.9 | % | 18.0 | % | 13.6 | % | 8.9 | % | 3.8 | % | -1.5 | % | -7.0 | % | -12.6 | % | -18.3 | % | |||||||||||||||||||||||||||||||
| -20% |
20% | 25.0 | % | 24.7 | % | 23.8 | % | 22.2 | % | 20.1 | % | 17.4 | % | 14.2 | % | 10.6 | % | 6.5 | % | 2.1 | % | -2.6 | % | -7.6 | % | -12.8 | % | -18.1 | % | -23.4 | % | |||||||||||||||||||||||||||||||
| -15% |
15% | 17.6 | % | 17.4 | % | 16.5 | % | 15.0 | % | 13.0 | % | 10.5 | % | 7.5 | % | 4.1 | % | 0.3 | % | -3.9 | % | -8.4 | % | -13.1 | % | -17.9 | % | -22.9 | % | -27.9 | % | |||||||||||||||||||||||||||||||
| -10% |
10% | 11.1 | % | 10.8 | % | 10.0 | % | 8.6 | % | 6.8 | % | 4.4 | % | 1.5 | % | -1.7 | % | -5.3 | % | -9.3 | % | -13.5 | % | -17.9 | % | -22.5 | % | -27.2 | % | -31.9 | % | |||||||||||||||||||||||||||||||
| -5% |
5% | 5.3 | % | 5.0 | % | 4.2 | % | 2.9 | % | 1.1 | % | -1.1 | % | -3.8 | % | -6.9 | % | -10.3 | % | -14.0 | % | -18.0 | % | -22.2 | % | -26.6 | % | -31.0 | % | -35.5 | % | |||||||||||||||||||||||||||||||
| 0% |
0% | 0.0 | % | -0.2 | % | -1.0 | % | -2.2 | % | -3.9 | % | -6.1 | % | -8.6 | % | -11.5 | % | -14.8 | % | -18.3 | % | -22.1 | % | -26.1 | % | -30.2 | % | -34.5 | % | -38.7 | % | |||||||||||||||||||||||||||||||
| 5% |
-5% | -4.8 | % | -5.0 | % | -5.7 | % | -6.9 | % | -8.5 | % | -10.5 | % | -13.0 | % | -15.7 | % | -18.8 | % | -22.2 | % | -25.8 | % | -29.6 | % | -33.6 | % | -37.6 | % | -41.7 | % | |||||||||||||||||||||||||||||||
| 10% |
-10% | -9.1 | % | -9.3 | % | -10.0 | % | -11.1 | % | -12.7 | % | -14.6 | % | -16.9 | % | -19.6 | % | -22.5 | % | -25.8 | % | -29.2 | % | -32.8 | % | -36.6 | % | -40.4 | % | -44.3 | % | |||||||||||||||||||||||||||||||
| 15% |
-15% | -13.0 | % | -13.3 | % | -13.9 | % | -15.0 | % | -16.5 | % | -18.3 | % | -20.5 | % | -23.1 | % | -25.9 | % | -29.0 | % | -32.3 | % | -35.7 | % | -39.3 | % | -43.0 | % | -46.7 | % | |||||||||||||||||||||||||||||||
| 20% |
-20% | -16.7 | % | -16.9 | % | -17.5 | % | -18.5 | % | -19.9 | % | -21.7 | % | -23.8 | % | -26.3 | % | -29.0 | % | -31.9 | % | -35.1 | % | -38.4 | % | -41.9 | % | -45.4 | % | -48.9 | % | |||||||||||||||||||||||||||||||
| 25% |
-25% | -20.0 | % | -20.2 | % | -20.8 | % | -21.8 | % | -23.1 | % | -24.8 | % | -26.9 | % | -29.2 | % | -31.8 | % | -34.7 | % | -37.7 | % | -40.9 | % | -44.2 | % | -47.6 | % | -51.0 | % | |||||||||||||||||||||||||||||||
| 30% |
-30% | -23.1 | % | -23.3 | % | -23.8 | % | -24.8 | % | -26.1 | % | -27.7 | % | -29.7 | % | -31.9 | % | -34.5 | % | -37.2 | % | -40.1 | % | -43.2 | % | -46.3 | % | -49.6 | % | -52.9 | % | |||||||||||||||||||||||||||||||
| 35% |
-35% | -25.9 | % | -26.1 | % | -26.7 | % | -27.6 | % | -28.8 | % | -30.4 | % | -32.3 | % | -34.5 | % | -36.9 | % | -39.5 | % | -42.3 | % | -45.3 | % | -48.3 | % | -51.5 | % | -54.6 | % | |||||||||||||||||||||||||||||||
| 40% |
-40% | -28.6 | % | -28.7 | % | -29.3 | % | -30.2 | % | -31.4 | % | -32.9 | % | -34.7 | % | -36.8 | % | -39.1 | % | -41.7 | % | -44.4 | % | -47.2 | % | -50.2 | % | -53.2 | % | -56.2 | % | |||||||||||||||||||||||||||||||
| 45% |
-45% | -31.0 | % | -31.2 | % | -31.7 | % | -32.6 | % | -33.7 | % | -35.2 | % | -37.0 | % | -39.0 | % | -41.2 | % | -43.7 | % | -46.3 | % | -49.0 | % | -51.9 | % | -54.8 | % | -57.7 | % | |||||||||||||||||||||||||||||||
| 50% |
-50% | -33.3 | % | -33.5 | % | -34.0 | % | -34.8 | % | -35.9 | % | -37.4 | % | -39.1 | % | -41.0 | % | -43.2 | % | -45.6 | % | -48.1 | % | -50.7 | % | -53.5 | % | -56.3 | % | -59.2 | % | |||||||||||||||||||||||||||||||
| 55% |
-55% | -35.5 | % | -35.6 | % | -36.1 | % | -36.9 | % | -38.0 | % | -39.4 | % | -41.0 | % | -42.9 | % | -45.0 | % | -47.3 | % | -49.8 | % | -52.3 | % | -55.0 | % | -57.7 | % | -60.5 | % | |||||||||||||||||||||||||||||||
| 60% |
-60% | -37.5 | % | -37.7 | % | -38.1 | % | -38.9 | % | -40.0 | % | -41.3 | % | -42.9 | % | -44.7 | % | -46.7 | % | -49.0 | % | -51.3 | % | -53.8 | % | -56.4 | % | -59.0 | % | -61.7 | % | |||||||||||||||||||||||||||||||
Estimated Fund Return Over One Year When the Fund Objective is to Seek Daily Investment Results, Before Fees and Expenses, that Correspond to Two Times the Inverse (-2x) of the Daily Performance of a Benchmark.
36
Table of Contents
| One Year Benchmark Performance |
Two Times Inverse (-2x) of One Year Benchmark Performance |
Benchmark Volatility | ||||||||||||||||||||||||||||||||||||||||||||||||||||||||||||
| 0% | 5% | 10% | 15% | 20% | 25% | 30% | 35% | 40% | 45% | 50% | 55% | 60% | 65% | 70% | ||||||||||||||||||||||||||||||||||||||||||||||||
| -60% |
120% | 525.0% | 520.3% | 506.5% | 484.2% | 454.3% | 418.1% | 377.1% | 332.8% | 286.7% | 240.4% | 195.2% | 152.2% | 112.2% | 76.0% | 43.7% | ||||||||||||||||||||||||||||||||||||||||||||||
| -55% |
110% | 393.8% | 390.1% | 379.2% | 361.6% | 338.0% | 309.4% | 277.0% | 242.0% | 205.6% | 169.0% | 133.3% | 99.3% | 67.7% | 39.0% | 13.5% | ||||||||||||||||||||||||||||||||||||||||||||||
| -50% |
100% | 300.0% | 297.0% | 288.2% | 273.9% | 254.8% | 231.6% | 205.4% | 177.0% | 147.5% | 117.9% | 88.9% | 61.4% | 35.8% | 12.6% | -8.0% | ||||||||||||||||||||||||||||||||||||||||||||||
| -45% |
90% | 230.6% | 228.1% | 220.8% | 209.0% | 193.2% | 174.1% | 152.4% | 128.9% | 104.6% | 80.1% | 56.2% | 33.4% | 12.3% | -6.9% | -24.0% | ||||||||||||||||||||||||||||||||||||||||||||||
| -40% |
80% | 177.8% | 175.7% | 169.6% | 159.6% | 146.4% | 130.3% | 112.0% | 92.4% | 71.9% | 51.3% | 31.2% | 12.1% | -5.7% | -21.8% | -36.1% | ||||||||||||||||||||||||||||||||||||||||||||||
| -35% |
70% | 136.7% | 134.9% | 129.7% | 121.2% | 109.9% | 96.2% | 80.7% | 63.9% | 46.5% | 28.9% | 11.8% | -4.5% | -19.6% | -33.4% | -45.6% | ||||||||||||||||||||||||||||||||||||||||||||||
| -30% |
60% | 104.1% | 102.6% | 98.1% | 90.8% | 81.0% | 69.2% | 55.8% | 41.3% | 26.3% | 11.2% | -3.6% | -17.6% | -30.7% | -42.5% | -53.1% | ||||||||||||||||||||||||||||||||||||||||||||||
| -25% |
50% | 77.8% | 76.4% | 72.5% | 66.2% | 57.7% | 47.4% | 35.7% | 23.1% | 10.0% | -3.2% | -16.0% | -28.3% | -39.6% | -49.9% | -59.1% | ||||||||||||||||||||||||||||||||||||||||||||||
| -20% |
40% | 56.3% | 55.1% | 51.6% | 46.1% | 38.6% | 29.5% | 19.3% | 8.2% | -3.3% | -14.9% | -26.2% | -36.9% | -46.9% | -56.0% | -64.1% | ||||||||||||||||||||||||||||||||||||||||||||||
| -15% |
30% | 38.4% | 37.4% | 34.3% | 29.4% | 22.8% | 14.7% | 5.7% | -4.2% | -14.4% | -24.6% | -34.6% | -44.1% | -53.0% | -61.0% | -68.2% | ||||||||||||||||||||||||||||||||||||||||||||||
| -10% |
20% | 23.5% | 22.5% | 19.8% | 15.4% | 9.5% | 2.3% | -5.8% | -14.5% | -23.6% | -32.8% | -41.7% | -50.2% | -58.1% | -65.2% | -71.6% | ||||||||||||||||||||||||||||||||||||||||||||||
| -5% |
10% | 10.8% | 10.0% | 7.5% | 3.6% | -1.7% | -8.1% | -15.4% | -23.3% | -31.4% | -39.6% | -47.7% | -55.3% | -62.4% | -68.8% | -74.5% | ||||||||||||||||||||||||||||||||||||||||||||||
| 0% |
0% | 0.0% | -0.7% | -3.0% | -6.5% | -11.3% | -17.1% | -23.7% | -30.8% | -38.1% | -45.5% | -52.8% | -59.6% | -66.0% | -71.8% | -77.0% | ||||||||||||||||||||||||||||||||||||||||||||||
| 5% |
-10% | -9.3% | -10.0% | -12.0% | -15.2% | -19.6% | -24.8% | -30.8% | -37.2% | -43.9% | -50.6% | -57.2% | -63.4% | -69.2% | -74.5% | -79.1% | ||||||||||||||||||||||||||||||||||||||||||||||
| 10% |
-20% | -17.4% | -18.0% | -19.8% | -22.7% | -26.7% | -31.5% | -36.9% | -42.8% | -48.9% | -55.0% | -61.0% | -66.7% | -71.9% | -76.7% | -81.0% | ||||||||||||||||||||||||||||||||||||||||||||||
| 15% |
-30% | -24.4% | -25.0% | -26.6% | -29.3% | -32.9% | -37.3% | -42.3% | -47.6% | -53.2% | -58.8% | -64.3% | -69.5% | -74.3% | -78.7% | -82.6% | ||||||||||||||||||||||||||||||||||||||||||||||
| 20% |
-40% | -30.6% | -31.1% | -32.6% | -35.1% | -38.4% | -42.4% | -47.0% | -51.9% | -57.0% | -62.2% | -67.2% | -72.0% | -76.4% | -80.4% | -84.0% | ||||||||||||||||||||||||||||||||||||||||||||||
| 25% |
-50% | -36.0% | -36.5% | -37.9% | -40.2% | -43.2% | -46.9% | -51.1% | -55.7% | -60.4% | -65.1% | -69.8% | -74.2% | -78.3% | -82.0% | -85.3% | ||||||||||||||||||||||||||||||||||||||||||||||
| 30% |
-60% | -40.8% | -41.3% | -42.6% | -44.7% | -47.5% | -50.9% | -54.8% | -59.0% | -63.4% | -67.8% | -72.0% | -76.1% | -79.9% | -83.3% | -86.4% | ||||||||||||||||||||||||||||||||||||||||||||||
| 35% |
-70% | -45.1% | -45.5% | -46.8% | -48.7% | -51.3% | -54.5% | -58.1% | -62.0% | -66.0% | -70.1% | -74.1% | -77.9% | -81.4% | -84.6% | -87.4% | ||||||||||||||||||||||||||||||||||||||||||||||
| 40% |
-80% | -49.0% | -49.4% | -50.5% | -52.3% | -54.7% | -57.7% | -61.1% | -64.7% | -68.4% | -72.2% | -75.9% | -79.4% | -82.7% | -85.6% | -88.3% | ||||||||||||||||||||||||||||||||||||||||||||||
| 45% |
-90% | -52.4% | -52.8% | -53.8% | -55.5% | -57.8% | -60.6% | -63.7% | -67.1% | -70.6% | -74.1% | -77.5% | -80.8% | -83.8% | -86.6% | -89.1% | ||||||||||||||||||||||||||||||||||||||||||||||
| 50% |
-100% | -55.6% | -55.9% | -56.9% | -58.5% | -60.6% | -63.2% | -66.1% | -69.2% | -72.5% | -75.8% | -79.0% | -82.1% | -84.9% | -87.5% | -89.8% | ||||||||||||||||||||||||||||||||||||||||||||||
| 55% |
-110% | -58.4% | -58.7% | -59.6% | -61.1% | -63.1% | -65.5% | -68.2% | -71.2% | -74.2% | -77.3% | -80.3% | -83.2% | -85.9% | -88.3% | -90.4% | ||||||||||||||||||||||||||||||||||||||||||||||
| 60% |
-120% | -60.9% | -61.2% | -62.1% | -63.5% | -65.4% | -67.6% | -70.2% | -73.0% | -75.8% | -78.7% | -81.5% | -84.2% | -86.7% | -89.0% | -91.0% | ||||||||||||||||||||||||||||||||||||||||||||||
37
Table of Contents
Estimated Fund Return Over One Year When the Fund Objective is to Seek Daily Investment Results, Before Fees and Expenses, that Correspond to Two Times (2x) the Daily Performance of a Benchmark.
| One Year |
Two Times (2x) One Year Benchmark Performance |
Benchmark Volatility | ||||||||||||||||||||||||||||||||||||||||||||||||||||||||||||
| 0% | 5% | 10% | 15% | 20% | 25% | 30% | 35% | 40% | 45% | 50% | 55% | 60% | 65% | 70% | ||||||||||||||||||||||||||||||||||||||||||||||||
| -60% |
-120% | -84.0 | % | -84.0 | % | -84.2 | % | -84.4 | % | -84.6 | % | -85.0 | % | -85.4 | % | -85.8 | % | -86.4 | % | -86.9 | % | -87.5 | % | -88.2 | % | -88.8 | % | -89.5 | % | -90.2 | % | |||||||||||||||||||||||||||||||
| -55% |
-110% | -79.8 | % | -79.8 | % | -80.0 | % | -80.2 | % | -80.5 | % | -81.0 | % | -81.5 | % | -82.1 | % | -82.7 | % | -83.5 | % | -84.2 | % | -85.0 | % | -85.9 | % | -86.7 | % | -87.6 | % | |||||||||||||||||||||||||||||||
| -50% |
-100% | -75.0 | % | -75.1 | % | -75.2 | % | -75.6 | % | -76.0 | % | -76.5 | % | -77.2 | % | -77.9 | % | -78.7 | % | -79.6 | % | -80.5 | % | -81.5 | % | -82.6 | % | -83.6 | % | -84.7 | % | |||||||||||||||||||||||||||||||
| -45% |
-90% | -69.8 | % | -69.8 | % | -70.1 | % | -70.4 | % | -70.9 | % | -71.6 | % | -72.4 | % | -73.2 | % | -74.2 | % | -75.3 | % | -76.4 | % | -77.6 | % | -78.9 | % | -80.2 | % | -81.5 | % | |||||||||||||||||||||||||||||||
| -40% |
-80% | -64.0 | % | -64.1 | % | -64.4 | % | -64.8 | % | -65.4 | % | -66.2 | % | -67.1 | % | -68.2 | % | -69.3 | % | -70.6 | % | -72.0 | % | -73.4 | % | -74.9 | % | -76.4 | % | -77.9 | % | |||||||||||||||||||||||||||||||
| -35% |
-70% | -57.8 | % | -57.9 | % | -58.2 | % | -58.7 | % | -59.4 | % | -60.3 | % | -61.4 | % | -62.6 | % | -64.0 | % | -65.5 | % | -67.1 | % | -68.8 | % | -70.5 | % | -72.3 | % | -74.1 | % | |||||||||||||||||||||||||||||||
| -30% |
-60% | -51.0 | % | -51.1 | % | -51.5 | % | -52.1 | % | -52.9 | % | -54.0 | % | -55.2 | % | -56.6 | % | -58.2 | % | -60.0 | % | -61.8 | % | -63.8 | % | -65.8 | % | -67.9 | % | -70.0 | % | |||||||||||||||||||||||||||||||
| -25% |
-50% | -43.8 | % | -43.9 | % | -44.3 | % | -45.0 | % | -46.0 | % | -47.2 | % | -48.6 | % | -50.2 | % | -52.1 | % | -54.1 | % | -56.2 | % | -58.4 | % | -60.8 | % | -63.1 | % | -65.5 | % | |||||||||||||||||||||||||||||||
| -20% |
-40% | -36.0 | % | -36.2 | % | -36.6 | % | -37.4 | % | -38.5 | % | -39.9 | % | -41.5 | % | -43.4 | % | -45.5 | % | -47.7 | % | -50.2 | % | -52.7 | % | -55.3 | % | -58.1 | % | -60.8 | % | |||||||||||||||||||||||||||||||
| -15% |
-30% | -27.8 | % | -27.9 | % | -28.5 | % | -29.4 | % | -30.6 | % | -32.1 | % | -34.0 | % | -36.1 | % | -38.4 | % | -41.0 | % | -43.7 | % | -46.6 | % | -49.6 | % | -52.6 | % | -55.7 | % | |||||||||||||||||||||||||||||||
| -10% |
-20% | -19.0 | % | -19.2 | % | -19.8 | % | -20.8 | % | -22.2 | % | -23.9 | % | -26.0 | % | -28.3 | % | -31.0 | % | -33.8 | % | -36.9 | % | -40.1 | % | -43.5 | % | -46.9 | % | -50.4 | % | |||||||||||||||||||||||||||||||
| -5% |
-10% | -9.8 | % | -10.0 | % | -10.6 | % | -11.8 | % | -13.3 | % | -15.2 | % | -17.5 | % | -20.2 | % | -23.1 | % | -26.3 | % | -29.7 | % | -33.3 | % | -37.0 | % | -40.8 | % | -44.7 | % | |||||||||||||||||||||||||||||||
| 0% |
0% | 0.0 | % | -0.2 | % | -1.0 | % | -2.2 | % | -3.9 | % | -6.1 | % | -8.6 | % | -11.5 | % | -14.8 | % | -18.3 | % | -22.1 | % | -26.1 | % | -30.2 | % | -34.5 | % | -38.7 | % | |||||||||||||||||||||||||||||||
| 5% |
10% | 10.3 | % | 10.0 | % | 9.2 | % | 7.8 | % | 5.9 | % | 3.6 | % | 0.8 | % | -2.5 | % | -6.1 | % | -10.0 | % | -14.1 | % | -18.5 | % | -23.1 | % | -27.7 | % | -32.5 | % | |||||||||||||||||||||||||||||||
| 10% |
20% | 21.0 | % | 20.7 | % | 19.8 | % | 18.3 | % | 16.3 | % | 13.7 | % | 10.6 | % | 7.0 | % | 3.1 | % | -1.2 | % | -5.8 | % | -10.6 | % | -15.6 | % | -20.7 | % | -25.9 | % | |||||||||||||||||||||||||||||||
| 15% |
30% | 32.3 | % | 31.9 | % | 30.9 | % | 29.3 | % | 27.1 | % | 24.2 | % | 20.9 | % | 17.0 | % | 12.7 | % | 8.0 | % | 3.0 | % | -2.3 | % | -7.7 | % | -13.3 | % | -19.0 | % | |||||||||||||||||||||||||||||||
| 20% |
40% | 44.0 | % | 43.6 | % | 42.6 | % | 40.8 | % | 38.4 | % | 35.3 | % | 31.6 | % | 27.4 | % | 22.7 | % | 17.6 | % | 12.1 | % | 6.4 | % | 0.5 | % | -5.6 | % | -11.8 | % | |||||||||||||||||||||||||||||||
| 25% |
50% | 56.3 | % | 55.9 | % | 54.7 | % | 52.8 | % | 50.1 | % | 46.8 | % | 42.8 | % | 38.2 | % | 33.1 | % | 27.6 | % | 21.7 | % | 15.5 | % | 9.0 | % | 2.4 | % | -4.3 | % | |||||||||||||||||||||||||||||||
| 30% |
60% | 69.0 | % | 68.6 | % | 67.3 | % | 65.2 | % | 62.4 | % | 58.8 | % | 54.5 | % | 49.5 | % | 44.0 | % | 38.0 | % | 31.6 | % | 24.9 | % | 17.9 | % | 10.8 | % | 3.5 | % | |||||||||||||||||||||||||||||||
| 35% |
70% | 82.3 | % | 81.8 | % | 80.4 | % | 78.2 | % | 75.1 | % | 71.2 | % | 66.6 | % | 61.2 | % | 55.3 | % | 48.8 | % | 41.9 | % | 34.7 | % | 27.2 | % | 19.4 | % | 11.7 | % | |||||||||||||||||||||||||||||||
| 40% |
80% | 96.0 | % | 95.5 | % | 94.0 | % | 91.6 | % | 88.3 | % | 84.1 | % | 79.1 | % | 73.4 | % | 67.0 | % | 60.1 | % | 52.6 | % | 44.8 | % | 36.7 | % | 28.5 | % | 20.1 | % | |||||||||||||||||||||||||||||||
| 45% |
90% | 110.3 | % | 109.7 | % | 108.2 | % | 105.6 | % | 102.0 | % | 97.5 | % | 92.2 | % | 86.0 | % | 79.2 | % | 71.7 | % | 63.7 | % | 55.4 | % | 46.7 | % | 37.8 | % | 28.8 | % | |||||||||||||||||||||||||||||||
| 50% |
100% | 125.0 | % | 124.4 | % | 122.8 | % | 120.0 | % | 116.2 | % | 111.4 | % | 105.6 | % | 99.1 | % | 91.7 | % | 83.8 | % | 75.2 | % | 66.3 | % | 57.0 | % | 47.5 | % | 37.8 | % | |||||||||||||||||||||||||||||||
| 55% |
110% | 140.3 | % | 139.7 | % | 137.9 | % | 134.9 | % | 130.8 | % | 125.7 | % | 119.6 | % | 112.6 | % | 104.7 | % | 96.2 | % | 87.1 | % | 77.5 | % | 67.6 | % | 57.5 | % | 47.2 | % | |||||||||||||||||||||||||||||||
| 60% |
120% | 156.0 | % | 155.4 | % | 153.5 | % | 150.3 | % | 146.0 | % | 140.5 | % | 134.0 | % | 126.5 | % | 118.1 | % | 109.1 | % | 99.4 | % | 89.2 | % | 78.6 | % | 67.8 | % | 56.8 | % | |||||||||||||||||||||||||||||||
The foregoing tables are intended to isolate the effect of benchmark volatility and benchmark performance on the return of inverse, inverse leveraged or leveraged funds. The Geared Funds’ actual returns may be significantly greater or less than the returns shown above as a result of any of the factors discussed above or under the below risk factor describing correlation risks.
Correlation Risks Specific to the Geared Funds.
In order to achieve a high degree of correlation with their applicable underlying benchmarks, the Geared Funds seek to rebalance their portfolios daily to keep exposure consistent with their investment objectives. Being materially under- or overexposed to the benchmarks may prevent such Geared Funds from achieving a high degree of correlation with their applicable underlying benchmarks. Market disruptions or closures, large movements of assets into or out of the Geared Funds, regulatory restrictions or extreme market volatility will adversely affect such Geared Funds’ ability to adjust exposure to requisite levels. The target amount of portfolio exposure is impacted dynamically by the benchmarks’ movements during each day. Because of this, it is unlikely that the Geared Funds will be perfectly exposed (i.e., -1x, -2x or 2x, as applicable) at the end of each day, and the likelihood of being materially under- or overexposed is higher on days when the benchmark levels are volatile near the close of the trading day. In addition, unlike other funds that do not rebalance their portfolios as frequently, each Geared Fund may be subject to increased trading costs associated with daily portfolio rebalancing in order to maintain appropriate exposure to the underlying benchmarks. Such costs include commissions paid to the FCMs, and may vary by FCM.
38
Table of Contents
These risks are particularly acute for the Geared VIX Funds due to the high degree of volatility in VIX futures contracts. Investors in the Geared VIX Funds should be aware that these Funds bear a greater risk of not achieving their investment objective on a daily basis, a risk that increases with the level of volatility on a particular day.
For general correlation risks of the Funds, please see “Correlation Risks For All Funds.” below.
Intraday Price Performance Risk.
Each Geared Fund is typically rebalanced at or about the time of its NAV calculation time (which may be other than at the close of the U.S. equity markets). As such, the intraday position of the Geared Fund will generally be different from the Geared Fund’s stated daily investment objective (i.e., -1x, -2x or 2x). When Shares are bought intraday, the performance of a Geared Fund’s Shares until the Fund’s next NAV calculation will generally be greater than or less than the Geared Fund’s stated daily inverse, inverse multiple or multiple.
The use of leveraged, inverse and/or inverse leveraged positions could result in the total loss of an investor’s investment.
Each of the UltraShort and Ultra Funds utilize inverse leveraged or leveraged positions, respectively, in seeking to achieve their respective investment objectives and will lose more money in market environments adverse to their respective daily investment objectives than funds that do not employ leverage. The use of inverse leveraged and/or leveraged positions could result in the total loss of an investor’s investment.
For example, because the UltraShort and Ultra Funds include a two times the inverse (-2x) or two times (2x) multiplier, a single-day movement in the relevant benchmark approaching 50% at any point in the day could result in the total loss or almost total loss of an investor’s investment if that movement is contrary to the investment objective of the Fund in which an investor has invested, even if such Fund’s benchmark subsequently moves in an opposite direction, eliminating all or a portion of the movement. This would be the case with upward single-day or intraday movements in the underlying benchmark of the UltraShort Funds or downward single-day or intraday movements in the underlying benchmark of the Ultra Funds, even if the underlying benchmark maintains a level greater than zero at all times.
Inverse positions can also result in the total loss of an investor’s investment. For the Short Funds, a single-day or intraday increase in the level of the Fund’s benchmark approaching 100% could result in the total loss or almost total loss of an investor’s investment even if such Fund’s benchmark subsequently moves lower.
Risks Specific to the Managed Futures Fund
The level of the S&P Strategic Futures Index (the “SFI”) and the returns attributable to the underlying SFI index components (the “SFI Futures Contracts”) depend on whether a particular SFI Futures Contract is positioned long or short.
The impact of changes in the prices of the SFI Futures Contracts will affect the Managed Futures Fund differently depending upon whether such SFI Futures Contract is positioned long or short. Increases in the price of an underlying SFI Futures Contract will negatively impact the Managed Futures Fund’s performance when the SFI Futures Contract is positioned short and decreases in the price of an underlying SFI Futures Contract will negatively impact the Managed Futures Fund’s performance when the SFI Futures Contract is positioned long.
Short positions should be considered to be speculative and could result in the total loss of an investor’s investment.
The Managed Futures Fund may take short positions in the SFI Futures Contracts. Because the holder of a short position is exposed to losses upon any increase in price, and a price increase is potentially unlimited, short positions will expose the Managed Futures Fund to potentially unlimited losses, which could result in a total loss of investment.
39
Table of Contents
Monthly repositioning may expose the Managed Futures Fund to increased losses in volatile markets.
The SFI is designed to potentially capture the economic benefit derived from both rising and declining trends in futures prices. In order to accomplish this, the SFI positions are rebalanced and repositioned, either long or short, on a monthly basis. Long positions or short positions in each SFI Futures Contract are determined based on price movements over the past seven months. In volatile markets, this may result in the SFI Futures Contracts frequently being repositioned from long to short and vice versa. If the price movements that caused a particular SFI Futures Contract to be repositioned subsequently reverse themselves, the Managed Futures Fund’s index will be negatively impacted. For example, if Gold is positioned long for the month of March, and the underlying SFI Futures Contracts decline in price, the SFI will experience losses. Depending on the magnitude of the price decline, Gold may reposition itself to short at month end. If, in April, the market reverses and appreciates in price, Gold will again experience losses, even if the price of Gold futures contracts measured across both months is flat from a performance perspective. Such activity can cause the Managed Futures Fund to lose more, and possibly significantly more, than an investment focused only on long or short positions in the same futures contracts.
The Managed Futures Fund has a limited operating history, and, as a result, investors have a limited performance history to serve as a factor for evaluating an investment in the Managed Futures Fund.
The Managed Futures Fund has a limited performance history upon which to evaluate an investor’s investment in the Managed Futures Fund. Although past performance is not necessarily indicative of future results, if the Managed Futures Fund had a longer performance history, such performance history might (or might not) provide investors with more information on which to evaluate an investment in the Managed Futures Fund. Likewise, the SFI has a limited history which might (or might not) provide investors with more information on which to evaluate an investment in the Managed Futures Fund.
Risks Specific to the Managed Futures Fund, the Commodity Index Funds, the Commodity Funds, the Currency Funds and the VIX Funds.
With regard to the Managed Futures Fund, the Commodity Index Funds and the Commodity Fund, several factors may affect the price of commodities and, in turn, the Financial Instruments and other assets, if any, owned by such a Fund, including, but not limited to:
| • | Significant increases or decreases in the available supply of a physical commodity due to natural or technological factors. Natural factors would include depletion of known cost-effective sources for a commodity or the impact of severe weather on the ability to produce or distribute the commodity. Technological factors, such as increases in availability created by new or improved extraction, refining and processing equipment and methods or decreases caused by failure or unavailability of major refining and processing equipment (for example, shutting down or constructing oil refineries), also materially influence the supply of commodities. |
| • | Significant increases or decreases in the demand for a physical commodity due to natural or technological factors. Natural factors would include such events as unusual climatological conditions impacting the demand for commodities. Technological factors may include such developments as substitutes for particular commodities. |
| • | A significant change in the attitude of speculators and investors towards a commodity. Should the speculative community take a negative or positive view towards any given commodity, it could cause a change in world prices of any given commodity and the price of Shares based upon a benchmark related to that commodity will be affected. |
| • | Large purchases or sales of physical commodities by the official sector. Governments and large institutions have large commodities holdings or may establish major commodities positions. For example, a significant portion of the aggregate world gold holdings is owned by governments, central banks and related institutions. Similarly, nations with centralized or nationalized oil production and organizations such as the Organization of Petroleum Exporting Countries control large physical quantities of crude oil. If one or more of these institutions decides to buy or sell any commodity in amounts large enough to cause a change in world prices, the price of Shares based upon a benchmark related to that commodity will be affected. |
| • | Other political factors. In addition to the organized political and institutional trading-related activities described above, peaceful political activity such as imposition of regulations or entry into trade treaties, as well as political disruptions caused by societal breakdown, insurrection and/or war may greatly influence commodities prices. |
40
Table of Contents
| • | A significant increase or decrease in commodity hedging activity by commodity producers. Should there be an increase or decrease in the level of hedge activity of commodity producing companies, countries and/or organizations, it could cause a change in world prices of any given commodity, causing the price of Shares based upon a benchmark related to that commodity to be affected. |
| • | The recent proliferation of commodity-linked products and their unknown effect on the commodity markets. |
With regard to the Managed Futures Fund and the Currency Funds, several factors may affect the value of foreign currencies or the U.S. dollar and, in turn, Financial Instruments and other assets, if any, owned by a Fund, including, but not limited to:
| • | Debt level and trade deficit of the relevant foreign countries; |
| • | Inflation rates of the United States and the relevant foreign countries and investors’ expectations concerning inflation rates; |
| • | Interest rates of the United States and the relevant foreign countries and investors’ expectations concerning interest rates; |
| • | Investment and trading activities of mutual funds, hedge funds and currency funds; |
| • | Global or regional political, economic or financial events and situations; |
| • | Sovereign action to set or restrict currency conversion; and |
| • | Monetary policies and other related activities of central banks within the U.S. and other relevant foreign markets. |
With regard to the Managed Futures Fund, several factors may affect the value of U.S. Treasury securities and, in turn, certain Financial Instruments and related assets, if any, owned by the Managed Futures Fund, including, but not limited to:
| • | Perception of risk, or the lack thereof, in assets other than U.S. Treasury securities; |
| • | Debt level and trade deficit of the United States; |
| • | Inflation rates of the United States and the relevant foreign countries and investors’ expectations concerning inflation rates; |
| • | Interest rates of the United States and the relevant foreign countries and investors’ expectations concerning interest rates; |
| • | Fluctuations in the value of the U.S. dollar relative to other currencies; and |
| • | Fluctuations in the supply of, and demand for, the underlying U.S. Treasury securities. |
41
Table of Contents
With regard to the VIX Funds, several factors may affect the price and/or liquidity of VIX futures contracts and other assets, if any, owned by a VIX Fund, including, but not limited to:
| • | Prevailing market prices and forward volatility levels of the U.S. stock markets, the S&P 500, the equity securities included in the S&P 500 and prevailing market prices of options on the S&P 500, the VIX, options on the VIX, the relevant VIX futures contracts, or any other financial instruments related to the S&P 500 and the VIX or VIX futures contracts; |
| • | Interest rates; |
| • | Inflation rates and investors’ expectations concerning inflation rates; |
| • | Economic, financial, political, regulatory, geographical, biological or judicial events that affect the level of the Index or the market price or forward volatility of the U.S. stock markets, the equity securities included in the S&P 500, the S&P 500, the VIX or the relevant futures or option contracts on the VIX; |
| • | Supply and demand as well as hedging activities in the listed and OTC equity derivatives markets; |
| • | Disruptions in trading of the S&P 500, futures contracts on the S&P 500 or options on the S&P 500; and |
| • | The level of contango or backwardation in the VIX futures contracts market. |
These factors interrelate in complex ways, and the effect of one factor on the market value of a Fund may offset or enhance the effect of another factor. In addition, the impact of changes in the level of a commodity index or the value of a commodity or currency will affect investors differently depending upon the Managed Futures Fund, Commodity Index Fund, Commodity Fund, Currency Fund or VIX Fund in which an investor invests. Daily increases in the level of a commodity index or a VIX futures index or the value of a commodity or currency will negatively impact the daily performance of Shares of the Short and UltraShort Commodity Index, Commodity, Currency or VIX Funds.
The Managed Futures Fund and the Commodity Index Funds are linked to indexes comprised of commodity futures contracts and/or financial futures contracts, and are not directly linked to the “spot” prices of the underlying physical commodities or financial assets. Futures contracts may perform very differently from the spot price of the underlying physical commodities or financial assets.
The Managed Futures Fund and each Commodity Index Fund are designed to correspond (before fees and expenses) to the performance of, or a multiple or an inverse multiple of, the daily performance of its applicable benchmark, which is intended to reflect the performance of the prices of futures contracts on certain physical commodities and/or financial assets. The Managed Futures Fund and the Commodity Index Funds are not directly linked to the “spot” price of the physical commodities. While prices of swaps, futures contracts and other derivatives contracts are, as a rule, related to the prices of an underlying cash market, they are not perfectly correlated and often can perform very differently. It is possible that during certain time periods, the performance of different derivatives contracts may be substantially lower or higher than cash market prices for the underlying commodity or financial asset due to differences in derivatives contract terms or as supply, demand or other economic or regulatory factors become more pronounced in either the cash or derivatives markets. Depending upon the direction and level of the benchmark changes, the Funds may underperform or outperform a portfolio of cash market commodities or financial assets.
42
Table of Contents
Risks specific to ProShares UltraShort Euro, ProShares Short Euro and ProShares Ultra Euro
The European financial markets and the value of the euro have experienced significant volatility, in part related to unemployment, budget deficits and economic downturns. In addition, several member countries of the Economic and Monetary Union of the EU have experienced credit rating downgrades, rising government debt levels and, for certain EU member countries (including Greece, Spain, Portugal, Ireland and Italy), weaknesses in sovereign debt. These events, along with decreasing imports or exports, changes in governmental or EU regulations on trade, the default or threat of default by an EU member country on its sovereign debt and/or an economic recession in an EU member country may continue to cause prolonged volatility in euro-related investments.
In addition, given recent events, it is possible that the euro could be abandoned in the future by countries that have already adopted its use. If this were to occur, the value of the euro could fluctuate or decline drastically. Increased volatility related to the euro could exacerbate the effects of daily compounding on the performance of each of ProShares UltraShort Euro, ProShares Short Euro and ProShares Ultra Euro over periods longer than a single day. If the euro is abandoned by all countries that have adopted its use, the Fund may be forced to switch benchmarks or liquidate.
Risks Specific to the VIX Funds
In addition to the risks described elsewhere in this “Risk Factors” section, the following risks apply to the VIX Funds.
The VIX Funds are benchmarked to a VIX Futures Index. They are not benchmarked to the VIX or actual realized volatility of the S&P 500.
The level of each VIX Futures Index is based on the value of the relevant VIX futures contracts based on the Chicago Board Options Exchange, Incorporated Volatility Index (the “VIX”) comprising the applicable VIX Futures Index. Each VIX Fund is benchmarked to its respective VIX Futures Index. The VIX Funds are not linked to the VIX (which is a measure of implied volatility of the S&P 500 over the next 30 days derived from option prices), to realized volatility of the S&P 500 or to the options that underlie the VIX calculation. Each VIX Fund should be expected to perform very differently from the VIX over all periods of time. In many cases, the VIX Futures Indexes will significantly underperform the VIX.
VIX futures contracts are not directly based on a tradable underlying asset.
The VIX is not directly investable. The settlement price at maturity of VIX futures contracts are based on the calculation that determines the level of the VIX. As a result, the behavior of the VIX futures contracts may be different from traditional futures contracts whose settlement price is based on a specific tradable asset.
The level of the VIX has historically reverted to a long-term mean level and is subject to the risk associated with reversion to its mean. Accordingly, investors should not expect the VIX Funds to retain any appreciation in value over extended periods of time.
In the past, the level of the VIX has typically reverted over the longer term to a historical mean, and its absolute level has been constrained within a band. As such, the potential upside of long or short exposure to VIX futures contracts may be limited, and any gains may be subject to sharp reversals during such reversions to the mean.
When economic uncertainty increases and there is an associated increase in expected volatility, the value of VIX futures contracts will likely also increase and the potential upside of an investment in a VIX Short Fund will correspondingly be limited as a result. Similarly, when economic uncertainty recedes, and there is an associated decrease in expected volatility, the value of VIX futures contracts will likely also decrease and the potential upside of an investment in a VIX Ultra Fund or a Matching VIX Fund will correspondingly be limited as a result.
43
Table of Contents
Risks Related to All Funds
Correlation Risks for all Funds.
While the Funds seek to meet their investment objectives, there is no guarantee they will do so. Factors that may affect a Fund’s ability to meet its investment objective include: (1) the Sponsor’s ability to purchase and sell Financial Instruments in a manner that correlates to a Fund’s objective; (2) an imperfect correlation between the performance of the Financial Instruments held by a Fund and the performance of the applicable benchmark; (3) bid-ask spreads on such Financial Instruments; (4) fees, expenses, transaction costs, financing costs associated with the use of Financial Instruments and commission costs; (5) holding Financial Instruments traded in a market that has become illiquid or disrupted; (6) a Fund’s Share prices being rounded to the nearest cent and/or valuation methodologies; (7) changes to a benchmark that are not disseminated in advance; (8) the need to conform a Fund’s portfolio holdings to comply with investment restrictions or policies or regulatory or tax law requirements; (9) early and unanticipated closings of the markets on which the holdings of a Fund trade, resulting in the inability of the Fund to execute intended portfolio transactions; (10) accounting standards; and (11) differences caused by a Fund obtaining exposure to only a representative sample of the components of a benchmark, overweighting or underweighting certain components of a benchmark or obtaining exposure to assets that are not included in a benchmark.
Being materially over- or under-exposed to its benchmark may prevent such Funds from achieving a high degree of correlation with their applicable underlying benchmark. Market disruptions or closures, large movements of assets into or out of a Fund, regulatory restrictions or extreme market volatility will adversely affect such Fund’s ability to maintain a high degree of correlation. The number of components included in the applicable benchmark index across which a Fund needs to allocate, and the frequency at which it rebalances its portfolio (and related costs), may also impact correlation.
Each Fund seeks to provide investment results that correspond (before fees and expenses) to the performance of, or a multiple of, the inverse or an inverse multiple the daily performance of a benchmark at all times, even during periods when the applicable benchmark is flat as well as when the benchmark is moving in a manner which causes the Fund’s NAV to decline, thereby causing losses to such Fund.
Other than for cash management purposes, the Funds are not actively managed by traditional methods (e.g., by effecting changes in the composition of a portfolio on the basis of judgments relating to economic, financial and market considerations with a view toward obtaining positive results under all market conditions). Rather, the sponsor seeks to cause the NAV to track the daily performance of a benchmark in accordance with each Fund’s investment objective, even during periods in which the benchmark is flat or moving in a manner which causes the NAV of a Fund to decline. It is possible to lose money over time regardless of the performance of an underlying benchmark, due to the effects of daily rebalancing, volatility and compounding, as applicable (see “Correlation Risks Specific to the Geared Funds” in this Annual Report on Form 10-K for additional details).
The assets that the Funds invest in can be highly volatile and the Funds may experience large losses when buying, selling or holding such instruments.
Investments linked to volatility, commodity, currency or fixed income markets can be highly volatile compared to investments in traditional securities and the Funds may experience large losses. The value of these investments may be affected by changes in overall market movements, commodity or currency benchmarks (as the case may be), volatility, changes in interest rates, changes in inflation rates and investors’ expectations concerning inflation rates or factors affecting a particular industry, commodity or currency. For example, commodity futures contracts (as may be held by the Managed Futures Fund or the Commodity Index Funds) may be affected by numerous factors, including drought, floods, fires, weather, livestock diseases, pipeline ruptures or spills, embargoes, tariffs and international, economic, political or regulatory developments. In particular, trading in VIX futures contracts and trading in natural gas futures contracts (or other Financial Instruments linked to natural gas) have been very volatile and can be expected to be very volatile in the future. High volatility may have an adverse impact on the Funds beyond the impact of any performance-based losses of the underlying benchmark.
Potential negative impact from rolling futures positions.
Certain of the Funds invest in or have exposure to futures contracts and are subject to risks related to rolling. The contractual obligations of a buyer or seller holding a futures contract to expiration may generally be satisfied by settling in cash as designated in the contract specifications. Alternatively, futures contracts may be closed out prior
44
Table of Contents
to expiration by making an offsetting sale or purchase of an identical futures contract on the same or linked exchange before the designated date of settlement. Once this date is reached, the futures contract “expires.” As the futures contracts held by a Fund near expiration, they are generally closed out and replaced by contracts with a later expiration. This process is referred to as “rolling.” The Funds do not intend to hold futures contracts through expiration, but instead to “roll” their respective positions.
When the market for these contracts is such that the prices are higher in the more distant delivery months than in the nearer delivery months, the sale during the course of the “rolling process” of the more nearby contract would take place at a price that is lower than the price of the more distant contract. This pattern of higher futures prices for longer expiration futures contracts is often referred to as “contango.” Alternatively, when the market for these contracts is such that the prices are higher in the nearer months than in the more distant months, the sale during the course of the “rolling process” of the more nearby contract would take place at a price that is higher than the price of the more distant contract. This pattern of higher futures prices for shorter expiration futures contracts is referred to as “backwardation.”
The presence of contango in certain futures contracts at the time of rolling would be expected to adversely affect the relevant Funds with long positions, and positively affect the Funds with short positions. Similarly, the presence of backwardation in certain futures contracts at the time of rolling such contracts would be expected to adversely affect the Funds with short positions and positively affect the Funds with long positions.
There have been extended periods in which contango or backwardation has existed in the futures contract markets for various types of futures contracts, and such periods can be expected to occur in the future. These extended periods have in the past and can in the future cause significant losses for the Funds, and the periods can have as much or more impact over time than movements in the level of a Fund’s benchmark.
The Commodity Funds do not invest in bullion itself as certain other exchange-traded products do. Rather, the Commodity Funds use Financial Instruments to gain exposure to these precious metals. Not investing directly in bullion may introduce additional tracking error and these Commodity Funds are subject to the effects of contango and backwardation described above.
Using Financial Instruments such as forwards and futures in an effort to replicate the performance (or inverse performance) of gold and silver bullion may introduce tracking error to the performance of the Commodity Funds. While prices of Financial Instruments are, as a rule, related to the prices of an underlying cash market, they are not perfectly correlated. In addition, the use of Financial Instruments causes the need to roll futures or forward contracts as described above and the resulting possibility that contango or backwardation can occur Gold and silver historically exhibit contango markets during most periods. The existence of historically prevalent contango markets would be expected to adversely impact the Ultra Funds. Alternatively, the existence of historically prevalent backwardated markets would be expected to adversely impact the Ultra Funds.
Credit and liquidity risks associated with collateralized repurchase agreements.
A portion of each Fund’s assets may be held in cash and/or U.S. Treasury securities, agency securities, or other high credit quality short-term fixed-income or similar securities (such as shares of money market funds and collateralized repurchase agreements). These securities may be used for direct investment or serve as collateral for such Fund’s trading in Financial Instruments, as applicable, and may include collateralized repurchase agreements. Collateralized repurchase agreements involve an agreement to purchase a security and to sell that security back to the original seller at an agreed-upon price. The resale price reflects the purchase price plus an agreed-upon incremental amount which is unrelated to the coupon rate or maturity of the purchased security. As protection against the risk that the original seller will not fulfill its obligation, the buyer receives collateral marked-to-market daily, and maintained at a value at least equal to the sale price plus the accrued incremental amount. Although the collateralized repurchase agreements that the Funds enter into require that counterparties (which act as original sellers) over-collateralize the amount owed to a Fund with U.S. Treasury securities and/or agency securities, there is a risk that such collateral could decline in price at the same time that the counterparty defaults on its obligation to repurchase the security. If this occurs, a Fund may incur losses or delays in receiving proceeds. To minimize these risks, the Funds typically enter into transactions only with major global financial institutions.
45
Table of Contents
Possible illiquid markets may exacerbate losses.
Financial Instruments cannot always be liquidated at the desired price. It is difficult to execute a trade at a specific price when there is a relatively small volume of buy and sell orders in a market. A market disruption can also make it difficult to liquidate a position or find a swap or forward contract counterparty at a reasonable cost.
Market illiquidity may cause losses for the Funds. The large size of the positions which the Funds may acquire increases the risk of illiquidity by both making their positions more difficult to liquidate and increasing the losses incurred while trying to do so. Any type of disruption or illiquidity will potentially be exacerbated due to the fact that the Funds will typically invest in Financial Instruments related to one benchmark, which in many cases is highly concentrated.
It may not be possible to gain exposure to the benchmarks using exchange-traded Financial Instruments in the future.
The Funds may utilize exchange-traded Financial Instruments. It may not be possible to gain exposure to the benchmarks with these Financial Instruments in the future. If these Financial Instruments cease to be traded on regulated exchanges, they may be replaced with Financial Instruments traded on trading facilities that are subject to lesser degrees of regulation or, in some cases, no substantive regulation. As a result, trading in such Financial Instruments, and the manner in which prices and volumes are reported by the relevant trading facilities, may not be subject to the provisions of, and the protections afforded by, the Commodity Exchange Act (the “CEA”), or other applicable statutes and related regulations, that govern trading on regulated U.S. futures exchanges, or similar statutes and regulations that govern trading on regulated U.K. futures exchanges. In addition, many electronic trading facilities have only recently initiated trading and do not have significant trading histories. As a result, the trading of contracts on such facilities, and the inclusion of such contracts in a benchmark, may be subject to certain risks not presented by U.S. or U.K. exchange-traded futures contracts, including risks related to the liquidity and price histories of the relevant contracts.
Fees are charged regardless of a Fund’s returns and may result in depletion of assets.
The Funds are subject to the fees and expenses described herein which are payable irrespective of a Fund’s returns, as well as the effects of commissions, trading spreads, and embedded financing, borrowing costs and fees associated with applicable swaps, forwards, futures contracts, and costs relating to the purchase of U.S. Treasury securities or similar high credit quality, short-term fixed-income or similar securities. Additional charges may include other fees as applicable.
For the Funds linked to an index, changes implemented by the index provider or the CBOE that affect the composition and valuation of the index could adversely affect the value of an investment in a Fund’s Shares.
The VIX Fund, the Managed Futures Fund and the Commodity Index Funds are linked to indexes maintained by an index provider, either Standard & Poor’s (“S&P”) or Bloomberg, as applicable, each of which is unaffiliated with the Funds or the Sponsor. The policies implemented by each index provider concerning the calculation of the level of an index or the composition of an index could affect the level of an index and, therefore, the value of the corresponding Fund’s Shares. An index provider may change the composition of the indexes, or make other methodological changes that could change the level of an index. Additionally, an index provider may alter, discontinue or suspend calculation or dissemination of an index. Any of these actions could adversely affect the value of Shares of a Fund using that index as a benchmark. An index provider has no obligation to consider Fund shareholder interests in calculating or revising an index. In addition, for the VIX Fund, the CBOE can make methodological changes to the calculation of the VIX that could affect the value of VIX futures contracts and, consequently, the value of the VIX Fund’s Shares. There can be no assurance that the CBOE will not change the VIX calculation methodology in a way which may affect the value of the VIX Fund’s Shares. The CBOE may also alter, discontinue or suspend calculation or dissemination of the VIX and/or exercise settlement value. Any of these actions could adversely affect the value of such Fund’s Shares.
Calculation of an index may not be possible or feasible under certain events or circumstances that are beyond the reasonable control of the Sponsor, which in turn may adversely impact both the index and/or the Shares, as applicable. Additionally, index calculations may be disrupted by rollover disruptions, rebalancing disruptions and/or market emergencies, which may have an adverse effect on the value of the Shares.
46
Table of Contents
The Funds may be subject to counterparty risks.
Certain of the Funds will use swap agreements and/or forward contracts as a means to achieve their respective investment objectives. Such Funds will use either swap agreements and/or forward contracts referencing their respective benchmarks or in other swap agreements or forward contracts if such instruments tend to exhibit trading prices or returns that correlate with its benchmark or a component of the benchmark and will further the investment objective of the Fund. Each of the other Funds may invest in swap agreements (for the Managed Futures Fund, the VIX Funds and the Natural Gas Funds) or forward contracts (for the other Currency Funds: ProShares Short Euro, and ProShares UltraShort Australian Dollar) if position accountability rules or position limits are reached with respect to specific futures contracts or the market for a specific futures contract experiences emergencies (e.g., natural disaster, terrorist attack or an act of God) or disruptions (e.g., a trading halt or a flash crash) that prevent such Fund from obtaining the appropriate amount of investment exposure to the affected futures contract or certain other futures contracts. Although unlikely, the Funds, under these circumstances, could have 100% exposure to swap agreements or forward contracts, as applicable.
Swap agreements and forward contracts are generally traded in over-the–counter markets and have only recently become subject to regulation by the by the Commodity Futures Trading Commission (the “CFTC”). CFTC rules, however, do not cover all types of swap agreements and forward contracts. Investors, therefore, may not receive the protection of CFTC regulation or the statutory scheme of the CEA in connection with each Fund’s swap agreements or forward contracts. The lack of regulation in these markets could expose investors to significant losses under certain circumstances, including in the event of trading abuses or financial failure by participants.
The Funds will be subject to credit risk with respect to the counterparties to the derivatives contracts (whether a clearing corporation in the case of cleared instruments or another third party in the case of OTC uncleared instruments). Unlike in futures contracts, the counterparty to uncleared swap agreements or forward contracts is generally a single bank or other financial institution, rather than a clearing organization backed by a group of financial institutions. As a result, a Fund is subject to increased credit risk with respect to the amount it expects to receive from counterparties to uncleared swaps and forward contracts entered into as part of that Fund’s principal investment strategy. If a counterparty becomes bankrupt or otherwise fails to perform its obligations due to financial difficulties, a Fund could suffer significant losses on these contracts and the value of an investor’s investment in a Fund may decline.
The Funds have sought to mitigate these risks by generally requiring that the counterparties for each Fund agree to post collateral for the benefit of the Fund, marked to market daily, subject to certain minimum thresholds; however there are no limitations on the percentage of its assets each Fund may invest in swap agreements or forward contracts with a particular counterparty. To the extent any such collateral is insufficient or there are delays in accessing the collateral, the Funds will be exposed to counterparty risk as described above, including possible delays in recovering amounts as a result of bankruptcy proceedings. The Funds typically enter into transactions only with major, global financial institutions.
OTC swaps and forward contracts of the type that may be utilized by the Funds are less liquid than futures contracts because they are not traded on an exchange, do not have uniform terms and conditions, and are generally entered into based upon the creditworthiness of the parties and the availability of credit support, such as collateral, and in general, are not transferable without the consent of the counterparty. These agreements contain various conditions, events of default, termination events, covenants and representations. The triggering of certain events or the default on certain terms of the agreement could allow a party to terminate a transaction under the agreement and request immediate payment in an amount equal to the net positions owed the party under the agreement. For example, if the level of the Fund’s benchmark has a dramatic intraday move that would cause a material decline in the Fund’s NAV, the terms of the swap may permit the counterparty to immediately close out the transaction with the Fund. In that event, it may not be possible for the Fund to enter into another swap agreement or to invest in other Financial Instruments necessary to achieve the desired exposure consistent with the Fund’s objective. This, in turn, may prevent the Fund from achieving its investment objective, particularly if the level of the Fund’s benchmark reverses all or part of its intraday move by the end of the day. In addition, cleared derivatives transactions benefit from daily
47
Table of Contents
marking-to-market and settlement, and segregation and minimum capital requirements applicable to intermediaries. Transactions entered into directly between two counterparties generally do not benefit from such protections. This exposes the Funds to the risk that a counterparty will not settle a transaction in accordance with its terms and conditions because of a dispute over the terms of the contract (whether or not bona fide) or because of a credit or liquidity problem, thus causing the Funds to suffer a loss.
As of December 31, 2015, the Funds’ approved counterparties for swap agreements and forward contracts are: Deutsche Bank AG, Citibank N.A., UBS AG, Goldman Sachs International and Société Générale. The Sponsor regularly reviews the performance of its counterparties for, among other things, creditworthiness and execution quality. In addition, the Sponsor periodically considers the addition of new counterparties. Thus, the list of counterparties noted above may change at any time. Each day, the Funds disclose their portfolio holdings as of the prior Business Day (as such term is defined in “Creation and Redemption of Shares-Creation Procedures” in Part I, Item 1 of this Annual Report on Form 10-K). Each Fund’s portfolio holdings identifies its counterparties, as applicable. This portfolio holdings information may be accessed through the web on the Sponsor’s website at www.ProShares.com.
More information about Deutsche Bank AG, including its current financial statements, may be found on the SEC’s EDGAR website under Central Index Key No (“CIK No.”) 0001159508 (for Deutsche Bank AG). More information about Citibank N.A., including its current financial statements, may also be found on the SEC’s EDGAR website under CIK No. 0000036684 (for Citibank N.A.). More information about UBS AG, including its current financial statements, may also be found on the SEC’s EDGAR website under CIK No. 0001114446 (for UBS AG). More information about Goldman Sachs International, a U.K. broker-dealer and subsidiary of The Goldman Sachs Group, Inc., may also be found on the SEC’s EDGAR website under CIK No. 0000886982 (for The Goldman Sachs Group, Inc.). The Goldman Sachs Group, Inc. consolidates the financial statements of each of its subsidiaries, including Goldman Sachs International, with its own. More information about Société Générale, a French public limited company, including its current financial statements as filed with the AMF (the French securities regulator), may be found on Société Générale’s website. Please note that the references to third-party websites have been provided solely for informational purposes. Neither the Funds nor the Sponsor endorses or is responsible for the content or information contained on any third-party website, including with respect to any financial statements. In addition, neither the Funds nor the Sponsor makes any warranty, express or implied or assumes any legal liability or responsibility for the accuracy, completeness or usefulness of any such information.
Each counterparty and/or any of its affiliates may be an Authorized Participant or shareholder of a Fund, subject to applicable law.
The counterparty risk for cleared derivatives transactions is generally lower than for uncleared OTC derivatives since generally a clearing organization becomes substituted for each counterparty to a cleared derivatives contract and, in effect, guarantees the parties’ performance under the contract as each party to a trade looks only to the clearing house for performance of financial obligations. However, there can be no assurance that the clearing house, or its members, will satisfy its obligations to the Fund.
Historical correlation trends between Fund benchmarks and other asset classes may not continue or may reverse, limiting or eliminating any potential diversification or other benefit from owning a Fund.
To the extent that an investor purchases a Fund seeking diversification benefits based on the historic correlation (whether positive or negative) between the returns of that Fund or its underlying benchmark and other asset classes, such historic correlation may not continue or may reverse itself. In this circumstance, the diversification or other benefits sought may be limited or nonexistent.
Investors cannot be assured of the Sponsor’s continued services, the discontinuance of which may be detrimental to the Funds.
Investors cannot be assured that the Sponsor will be able to continue to service the Funds for any length of time. If the Sponsor discontinues its activities on behalf of the Funds, the Funds may be adversely affected, as there may be no entity servicing the Funds for a period of time. If the Sponsor’s registrations with the CFTC or memberships in the NFA were revoked or suspended, the Sponsor would no longer be able to provide services and/or to render
48
Table of Contents
advice to the Funds. If the Sponsor were unable to provide services and/or advice to the Funds, the Funds would be unable to pursue their investment objectives unless and until the Sponsor’s ability to provide services and advice to the Funds was reinstated or a replacement for the Sponsor as commodity pool operator could be found. Such an event could result in termination of the Funds.
The lack of active trading markets for any of the Shares of the Funds may result in losses on investors’ investments at the time of disposition of such Shares.
Although the Shares of the Funds are publicly listed and traded on the applicable Exchange, there can be no guarantee that an active trading market for the Shares of any Fund will develop or be maintained. In this regard, if a Fund is not able to meet the continued listing standards of NYSE Arca and is delisted, there will not be an active trading market for such Fund’s Shares. If investors need to sell their Shares at a time when no active market for them exists, the price investors receive for their Shares, assuming that investors are able to sell them, likely will be lower than the price that investors would receive if an active market did exist. In addition, if there is no active trading market for the Shares of a Fund for an extended period of time, the Fund would likely be forced to liquidate.
A Fund may terminate and liquidate at a time that is disadvantageous to shareholders.
If a Fund lacks the demand necessary to remain open, then the Fund will likely be terminated and liquidated. For example, the ProShares Ultra Australian Dollar Fund was terminated and liquidated in June 2015 because it lacked the demand necessary to remain open. Termination and liquidation of a Fund could occur at a time that is disadvantageous to shareholders. When the Fund’s assets are sold as part of the Fund’s liquidation, the resulting proceeds distributed to shareholders may be less than those that may be realized in a sale outside of a liquidation context.
Investors may be adversely affected by redemption or creation orders that are subject to postponement, suspension or rejection under certain circumstances.
A Fund may, in its discretion, suspend the right of creation or redemption or may postpone the redemption or purchase settlement date, for (1) any period during which the NYSE Arca, NYSE, Chicago Mercantile Exchange (including the Chicago Board of Trade and the New York Mercantile Exchange), the Intercontinental Exchange, CBOE, CFE or any other exchange, marketplace or trading center, deemed to affect the normal operations of the Funds, is closed, or when trading is restricted or suspended or restricted on such exchanges in any of the Funds’ futures contracts, (2) any period during which an emergency exists as a result of which the fulfillment of a purchase order or the redemption distribution is not reasonably practicable, or (3) such other period as the Sponsor determines to be necessary for the protection of the shareholders of the Funds. In addition, a Fund will reject a redemption order if the order is not in proper form as described in the Authorized Participant Agreement or if the fulfillment of the order might be unlawful. Any such postponement, suspension or rejection could adversely affect a redeeming Authorized Participant. For example, the resulting delay may adversely affect the value of the Authorized Participant’s redemption proceeds if the NAV of the Funds decline during the period of delay. The Funds disclaim any liability for any loss or damage that may result from any such suspension or postponement. Suspension of creation privileges may adversely impact how the Shares are traded and arbitraged on the applicable Exchange, which could cause them to trade at levels materially different (premiums and discounts) from the fair value of their underlying holdings.
The NAV may not always correspond to market price and, as a result, investors may be adversely affected by the creation or redemption of Creation Units at a value that differs from the market price of the Shares.
The NAV per Share of a Fund changes as fluctuations occur in the market value of a Fund’s portfolio. Investors should be aware the public trading price per Share of a Fund may be different from the NAV per Share of the Fund (i.e., the secondary market price may trade at a premium or discount to NAV). Consequently, an Authorized Participant may be able to create or redeem a Creation Unit of a Fund at a discount or a premium to the public trading price per Share of that Fund.
49
Table of Contents
Authorized Participants or their clients or customers may have an opportunity to realize a profit if they can purchase a Creation Unit at a discount to the public trading price of the Shares of a Fund or can redeem a Creation Unit at a premium over the public trading price of the Shares of a Fund. The Sponsor expects that the exploitation of such arbitrage opportunities by Authorized Participants and their clients and customers will tend to cause the public trading price to track the NAV per Share of the Funds closely over time.
The value of a Share may be influenced by non-concurrent trading hours between the applicable Exchange and the market in which the Financial Instruments (or related reference assets) held by a Fund are traded. The Shares of each Fund trade on the applicable Exchange, from 9:30 a.m. to 4:00 p.m. (Eastern Time). The Financial Instruments (and/or the related reference assets) held by a particular Fund, however, may have different fixing or settlement times. Consequently, liquidity in the Financial Instruments (and/or the reference assets) may be reduced after such fixing or settlement time. As a result, during the time when the applicable Exchange is open but after the applicable fixing or settlement time of an underlying component, trading spreads and the resulting premium or discount on the Shares of a Fund may widen, and, therefore, may increase the difference between the price of the Shares of a Fund and the NAV of such Shares. Furthermore, the NAVs for certain Funds are determined prior to the close of the applicable Exchange, and the NAVs for certain Funds are determined at 4:15 p.m. (Eastern Time) after the close of its applicable Exchange. Consequently, for those Funds, the closing market price per Share may differ from the NAV per Share at the end of each day. Also, during the time when the Exchange is open but the Fund’s NAV has already been determined (or, in the case of a VIX Fund, closed but before the determination of its NAV), there could be market developments or other events that cause or exacerbate the difference between the price of the Shares of such Funds and the NAV of such Shares.
The number of underlying components included in a Fund’s benchmark may impact volatility, which could adversely affect an investment in the Shares.
The number of underlying components in a Fund’s benchmark may also impact volatility, which could adversely affect an investment in the Shares. For example, each of the indexes for the Commodity Index Funds is concentrated in terms of the number and type of commodities represented, and some of the subindexes are solely concentrated in a single commodity futures contract. In addition, the benchmarks for the Currency Funds are concentrated solely on a single currency and the benchmarks for the VIX Funds are concentrated solely in VIX futures contracts. Investors should be aware that other benchmarks are more diversified in terms of both the number and variety of investments included. Concentration in fewer underlying components may result in a greater degree of volatility in a benchmark and the NAV of the Fund which corresponds to that benchmark under specific market conditions and over time.
Trading on exchanges outside the United States is generally not subject to U.S. regulation and may result in different or diminished investor protections.
Some of the Funds’ trading may be conducted on exchanges outside the United States. Trading on such exchanges is generally not regulated by any U.S. governmental agency and may involve certain risks not applicable to trading on U.S. exchanges, including different or diminished investor protections. In trading contracts denominated in currencies other than U.S. dollars, the Shares are subject to the risk of adverse exchange rate movements between the dollar and the functional currencies of such contracts. Investors could incur substantial losses from trading on foreign exchanges which such investors would not have otherwise been subject had the Funds’ trading been limited to U.S. markets.
Competing claims of intellectual property rights may adversely affect the Funds and an investment in the Shares.
Although the Sponsor does not anticipate that such claims will adversely impact the Funds, it is impossible to provide definite assurances that no such negative impact will occur. The Sponsor believes that it has properly licensed or obtained the appropriate consent of all necessary parties with respect to intellectual property rights. However, other third parties could allege ownership as to such rights and may bring an action in asserting their claims. To the extent any action is brought by a third party asserting such rights, the expenses in litigating, negotiating, cross-licensing or otherwise settling such claims may adversely affect the Funds.
50
Table of Contents
Investors may be adversely affected by an overstatement or understatement of the NAV calculation of the Funds due to the valuation method employed on the date of the NAV calculation.
Calculating the NAV of the Funds includes, in part, any unrealized profits or losses on open Financial Instrument positions. Under normal circumstances, the NAV of a Fund reflects the value of the Financial Instruments held by a Fund, as of the time the NAV is calculated. However, if any of the Financial Instruments held by a Fund could not be purchased or sold on a day when a Fund is accepting creation and redemption orders (due to the operation of daily limits or other rules of an exchange or otherwise), a Fund may be improperly exposed which could cause it to fail to meet its stated investment objective. Alternatively, a Fund may attempt to calculate the fair value of such Financial Instruments. In such a situation, there is a risk that the calculation of the relevant benchmark, and therefore, the NAV of the applicable Fund on such day, may not accurately reflect the realizable market value of the Financial Instruments underlying such benchmark.
The liquidity of the Shares may also be affected by the withdrawal from participation of Authorized Participants, which could adversely affect the market price of the Shares.
In the event that one or more Authorized Participants which have substantial interests in the Shares withdraw from participation, the liquidity of the Shares will likely decrease, which could adversely affect the market price of the Shares and result in investors incurring a loss on their investment.
Shareholders that are not Authorized Participants may only purchase or sell their Shares in secondary trading markets, and the conditions associated with trading in secondary markets may adversely affect investors’ investment in the Shares.
Only Authorized Participants may create or redeem Creation Units. All other investors that desire to purchase or sell Shares must do so through the NYSE Arca or in other markets, if any, in which the Shares may be traded. Shares may trade at a premium or discount to NAV per Share.
The applicable Exchange may halt trading in the Shares of a Fund which would adversely impact investors’ ability to sell Shares.
Trading in Shares of a Fund may be halted due to market conditions or, in light of the applicable Exchange rules and procedures, for reasons that, in the view of the applicable Exchange, make trading in Shares of a Fund inadvisable. In addition, trading is subject to trading halts caused by extraordinary market volatility pursuant to “circuit breaker” rules that require trading to be halted for a specified period based on a specified decline or rise in a market index (e.g., the Dow Jones Industrial Average) or in the price of a Fund’s Shares. Additionally, the ability to short sell a Fund’s Shares may be restricted when there is a 10% or greater change from the previous day’s official closing price. There can be no assurance that the requirements necessary to maintain the listing of the Shares of a Fund will continue to be met or will remain unchanged.
Shareholders do not have the protections associated with ownership of shares in an investment company registered under the 1940 Act.
None of the Funds are subject to registration or regulation under the 1940 Act. Consequently, shareholders do not have the regulatory protections provided to investors in investment companies.
Shareholders do not have the rights enjoyed by investors in certain other vehicles and may be adversely affected by a lack of statutory rights and by limited voting and distribution rights.
The Shares have limited voting and distribution rights. For example, shareholders do not have the right to elect directors, the Funds may enact splits or reverse splits without shareholder approval and the Funds are not required to pay regular distributions, although the Funds may pay distributions at the discretion of the Sponsor.
The value of the Shares will be adversely affected if the Funds are required to indemnify the Trustee.
Under the Amended and Restated Trust Agreement of the Trust, as may be further amended and restated from time to time (the “Trust Agreement”), the Trustee has the right to be indemnified for any liability or expense incurred without gross negligence or willful misconduct. That means the Sponsor may require the assets of a Fund to be sold in order to cover losses or liability suffered by it or by the Trustee. Any sale of that kind would reduce the NAV of one or more of the Funds.
51
Table of Contents
Although the Shares of the Funds are limited liability investments, certain circumstances such as bankruptcy of a Fund will increase a shareholder’s liability.
The Shares of the Funds are limited liability investments; investors may not lose more than the amount that they invest plus any profits recognized on their investment. However, shareholders could be required, as a matter of bankruptcy law, to return to the estate of a Fund any distribution they received at a time when such Fund was in fact insolvent or in violation of the Trust Agreement.
Failure of the FCMs to segregate assets may increase losses in the Funds.
The CEA requires a clearing broker to segregate all funds received from customers from such broker’s proprietary assets. There is a risk that assets deposited by the Sponsor on behalf of the Funds as margin with the FCMs may, in certain circumstances, be used to satisfy losses of other clients of the FCMs. If an FCM fails to segregate the funds received from the Sponsor, the assets of the Funds might not be fully protected in the event of the FCM’s bankruptcy. Furthermore, in the event of an FCM’s bankruptcy, Fund Shares could be limited to recovering only a pro rata share of all available funds segregated on behalf of the FCM’s combined customer accounts, even though certain property specifically traceable to a particular Fund was held by the FCM. Each FCM may, from time to time, be the subject of certain regulatory and private causes of action.
Similarly, the CEA requires a clearing organization approved by the CFTC as a derivatives clearing organization to segregate all funds and other property received from a clearing member’s clients in connection with domestic futures and options contracts from any funds held at the clearing organization to support the clearing member’s proprietary trading. Nevertheless, customer funds held at a clearing organization in connection with any futures or options contracts may be held in a commingled omnibus account, which may not identify the name of the clearing member’s individual customers. With respect to futures and options contracts, a clearing organization may use assets of a non-defaulting customer held in an omnibus account at the clearing organization to satisfy payment obligations of a defaulting customer of the clearing member to the clearing organization. As a result, in the event of a default of the clearing FCM’s other clients or the clearing FCM’s failure to extend its own funds in connection with any such default, a Fund may not be able to recover the full amount of assets deposited by the clearing FCM on behalf of the Fund with the clearing organization.
In the event of a bankruptcy or insolvency of any exchange or a clearing house, a Fund could experience a loss of the funds deposited through its FCM as margin with the exchange or clearing house, a loss of any profits on its open positions on the exchange, and the loss of unrealized profits on its closed positions on the exchange.
A court could potentially conclude that the assets and liabilities of one Fund are not segregated from those of another Fund and may thereby potentially expose assets in a Fund to the liabilities of another Fund.
Each Fund is a separate series of a Delaware statutory trust and not itself a separate legal entity. Section 3804(a) of the Delaware Statutory Trust Act, as amended (the “DSTA”) provides that if certain provisions are in the formation and governing documents of a statutory trust organized in series, and if separate and distinct records are maintained for any series and the assets associated with that series are held in separate and distinct records (directly or indirectly, including through a nominee or otherwise) and accounted for in such separate and distinct records separately from the other assets of the statutory trust, or any series thereof, then the debts, liabilities, obligations and expenses incurred, contracted for or otherwise existing with respect to a particular series are enforceable against the assets of such series only, and not against the assets of the statutory trust generally or any other series thereof, and none of the debts, liabilities, obligations and expenses incurred, contracted for or otherwise existing with respect to the statutory trust generally or any other series thereof shall be enforceable against the assets of such series. The Sponsor is not aware of any court case that has interpreted Section 3804(a) of the DSTA or provided any guidance as to what is required for compliance. The Sponsor maintains separate and distinct records for each Fund and accounts for them separately, but it is possible a court could conclude that the methods used did not satisfy Section 3804(a) of the DSTA and thus potentially expose assets in a Fund to the liabilities of another Fund.
52
Table of Contents
There may be circumstances that could prevent a Fund from being operated in a manner consistent with its investment objective and principal investment strategies.
There may be circumstances outside the control of the Sponsor and/or a Fund that make it, for all practical purposes, impossible to re-position such Fund and/or to process a purchase or redemption order. Examples of such circumstances include: natural disasters; public service disruptions or utility problems such as those caused by fires, floods, extreme weather conditions, and power outages resulting in telephone, telecopy, and computer failures; market conditions or activities causing trading halts; systems failures involving computer or other information systems affecting the aforementioned parties, as well as the Depository Trust Company (“DTC”), the National Securities Clearing Corporation (“NSCC”), or any other participant in the purchase process; and similar extraordinary events. Accordingly, while the Sponsor has implemented and tested a business continuity plan that transfers functions of any disrupted facility to another location and has effected a disaster recovery plan, circumstances, such as those above, may prevent a Fund from being operated in a manner consistent with its investment objective and/or principal investment strategies.
Due to the increased use of technologies, intentional and unintentional cyber attacks pose operational and information security risks.
With the increased use of technologies such as the Internet and the dependence on computer systems to perform necessary business functions, the Funds are susceptible to operational and information security risks. In general, cyber incidents can result from deliberate attacks or unintentional events. Cyber attacks include, but are not limited to gaining unauthorized access to digital systems for purposes of misappropriating assets or sensitive information, corrupting data, or causing operational disruption. Cyber attacks may also be carried out in a manner that does not require gaining unauthorized access, such as causing denial-of-service attacks on websites. Cyber security failures or breaches of a Fund’s third party service provider (including, but not limited to, index providers, the administrator and transfer agent) or the issuers of securities in which the Funds invest, have the ability to cause disruptions and impact business operations, potentially resulting in financial losses, the inability of Fund shareholders to transact business, violations of applicable privacy and other laws, regulatory fines, penalties, reputational damage, reimbursement or other compensation costs, and/or additional compliance costs. In addition, substantial costs may be incurred in order to prevent any cyber incidents in the future. The Funds and their shareholders could be negatively impacted as a result. While the Funds have established business continuity plans and systems to prevent such cyber attacks, there are inherent limitations in such plans and systems including the possibility that certain risks have not been identified. Furthermore, the Funds cannot control the cyber security plans and systems put in place by issuers in which the Funds invest.
Shareholders’ tax liability will exceed cash distributions on the Shares.
Shareholders of each Fund are subject to U.S. federal income taxation and, in some cases, state, local, or foreign income taxation on their share of the Fund’s taxable income, whether or not they receive cash distributions from the Fund. Each Fund does not currently expect to make distributions with respect to capital gains or ordinary income.
Accordingly, shareholders of a Fund will not receive cash distributions equal to their share of the Fund’s taxable income or the tax liability that results from such income. A Fund’s income, gains, losses and deductions are allocated to shareholders on a monthly basis. If you own Shares in a Fund at the beginning of a month and sell them during the month, you are generally still considered a shareholder through the end of that month.
The U.S. Internal Revenue Service (“IRS”) could adjust or reallocate items of income, gain, deduction, loss and credit with respect to the Shares if the IRS does not accept the assumptions or conventions utilized by the Fund.
U.S. federal income tax rules applicable to partnerships, which each Fund is anticipated to be treated as under the Internal Revenue Code of 1986, as amended (the “Code”), are complex and their application is not always clear. Moreover, the rules generally were not written for, and in some respects are difficult to apply to, publicly traded interests in partnerships. The Funds apply certain assumptions and conventions intended to comply with the intent of the rules and to report income, gain, deduction, loss and credit to shareholders in a manner that reflects the shareholders’ economic gains and losses, but these assumptions and conventions may not comply with all aspects of the applicable regulations. It is possible therefore that the IRS will successfully assert that these assumptions or conventions do not satisfy the technical requirements of the Code or the Treasury regulations promulgated thereunder and will require that items of income, gain, deduction, loss and credit be adjusted or reallocated in a manner that could be adverse to investors.
Shareholders will receive partner information tax returns on Schedule K-1, which could increase the complexity of tax returns.
The partner information tax returns on Schedule K-1 which the Funds will distribute to shareholders will contain information regarding the income items and expense items of the Funds. If you have not received Schedule K-1s from other investments, you may find that preparing your tax return may require additional time, or it may be necessary for you to retain an accountant or other tax preparer, at an additional expense to you, to assist you in the preparation of your return.
Investors could be adversely affected if the current treatment of long-term capital gains under current U.S. federal income tax law is changed or repealed in the future.
Under current law, long-term capital gains are taxed to non-corporate investors at a maximum U.S. federal income tax rate of 20%. This tax treatment may be adversely affected, changed or repealed by future changes in tax laws at any time.
53
Table of Contents
Shareholders of each Fund may recognize significant amounts of ordinary income and short-term capital gain.
Due to the investment strategy of the Funds, the Funds may realize and pass-through to Shareholders significant amounts of ordinary income and short-term capital gains as opposed to long-term capital gains, which generally are taxed at a preferential rate. A Fund’s income, gains, losses and deductions are allocated to shareholders on a monthly basis. If you own shares in a Fund at the beginning of a month and sell them during the month, you are generally still considered a shareholder through the end of that month.
INVESTORS ARE STRONGLY URGED TO CONSULT THEIR OWN TAX ADVISERS AND COUNSEL WITH RESPECT TO THE POSSIBLE TAX CONSEQUENCES TO THEM OF AN INVESTMENT IN THE SHARES OF A FUND; SUCH TAX CONSEQUENCES MAY DIFFER IN RESPECT OF DIFFERENT INVESTORS.
Regulatory changes or actions, including the implementation of new legislation, may alter the operations and profitability of the Funds.
The U.S. derivatives markets and market participants have been subject to comprehensive regulation, not only by the CFTC but also by self-regulatory organizations, including the NFA and the exchanges on which the derivatives contracts are traded and/or cleared. As with any regulated activity, changes in regulations may have unexpected results. For example, changes in the amount or quality of the collateral that traders in derivatives contracts are required to provide to secure their open positions, or in the limits on number or size of positions that a trader may have open at a given time, may adversely affect the ability of the Funds to enter into certain transactions that could otherwise present lucrative opportunities. Considerable regulatory attention has been focused on non-traditional investment pools which are publicly distributed in the United States. There is a possibility of future regulatory changes altering, perhaps to a material extent, the nature of an investment in the Funds or the ability of the Funds to continue to implement their investment strategies.
In addition, the SEC, CFTC and the exchanges are authorized to take extraordinary actions in the event of a market emergency, including, for example, the retroactive implementation of speculative position limits or higher margin requirements, the establishment of daily price limits and the suspension of trading. The regulation of swaps, forwards and futures transactions in the United States is a rapidly changing area of law and is subject to modification by government and judicial action. The effect of any future regulatory change on the Funds is impossible to predict, but could be substantial and adverse.
In particular, the Dodd-Frank Act was signed into law on July 21, 2010. The Dodd-Frank Act has made and will continue to make sweeping changes to the way in which the U.S. financial system is supervised and regulated. Title VII of the Dodd-Frank Act sets forth a new legislative framework for OTC derivatives, including certain Financial Instruments, such as swaps, in which certain of the Funds may invest. Title VII of the Dodd-Frank Act makes broad changes to the OTC derivatives market, grants significant new authority to the SEC and the CFTC to regulate OTC derivatives and market participants, and will require clearing and exchange trading of many OTC derivatives transactions.
Provisions in the Dodd-Frank Act include the requirement that position limits on commodity futures contracts be established; new registration, recordkeeping, capital and margin requirements for “swap dealers” and “major swap participants” as determined by the Dodd-Frank Act and applicable regulations; and the mandatory use of clearinghouse mechanisms for many OTC derivatives transactions.
The CFTC, the SEC and other federal regulators have been tasked with developing the rules and regulations enacting the provisions of the Dodd-Frank Act. While certain regulations have been promulgated and are already in effect, the full impact of the Dodd-Frank Act on any of the Funds remains uncertain. The legislation and the related regulations that have been and may be promulgated in the future may negatively impact a Fund’s ability to meet its investment objective either through limits on its investments or requirements imposed on it or any of its counterparties. In particular, new requirements, including capital requirements and mandatory clearing of OTC derivatives transactions, which may increase derivative counterparties’ costs and are expected to generally be passed through to other market participants in the form of higher upfront and mark-to-market margin, less favorable trade pricing, and the imposition of new or increased fees, including clearinghouse account maintenance fees, may increase the cost of a Fund’s investments and the cost of doing business, which could adversely affect investors.
54
Table of Contents
Regulatory and exchange accountability levels may restrict the creation of Creation Units and the operation of the Trust.
Many U.S. commodities exchanges and boards of trade limit the amount of fluctuation permitted in futures contract prices during a single trading day by regulations referred to as “daily price fluctuation limits” or “daily limits.” Once the daily limit has been reached in a particular contract, no trades may be made that day at a price beyond that limit or trading may be suspended for specified periods during the trading day. In addition, the CFTC, U.S. futures exchanges and certain non-U.S. exchanges have established limits referred to as “speculative position limits” or “accountability levels” on the maximum net long or short futures positions that any person may hold or control in derivatives traded on such exchanges.
In connection with these limits, the Dodd-Frank Act has required the CFTC to adopt regulations establishing speculative position limits applicable to regulated futures and OTC derivatives and impose aggregate speculative position limits across regulated U.S. futures, OTC positions and certain futures contracts traded on non-U.S. exchanges.
On November 5, 2013, the CFTC re-proposed regulations on position limits with respect to the 28 physical delivery commodity futures and options contracts, as well as to swaps that are economically equivalent to such contracts. The proposed position limits would apply with respect to contracts traded on all U.S. and certain foreign exchanges on an aggregate basis. In addition, the CFTC proposed amendments to the requirement of U.S. commodities exchanges to establish corresponding speculative position limits. Under the proposed CFTC regulations, all accounts owned or managed by an entity that is responsible for such accounts’ trading decisions, their principals and their affiliates would be combined for position limit purposes. Although it is unclear what future position limit rules will be, the Sponsor is subject to current position and accountability limits established by the CFTC and exchanges. Accordingly, it may be required to reduce the size of outstanding positions or not enter into new positions that would otherwise be taken for the Funds or not trade certain markets on behalf of the Funds in order to comply with those limits or any future limits established by the CFTC and the relevant exchanges. Derivatives contract prices could move to a limit for several consecutive trading days with little or no trading, thereby preventing prompt liquidation of derivatives positions and potentially subjecting the Funds to substantial losses or periods in which such Funds do not create additional Creation Units. Modification of trades made by the Trust, if required, could adversely affect the Trust’s operations and profitability and significantly limit the Trust’s ability to reinvest income in additional contracts, create additional Creation Units, or add to existing positions in the desired amount.
In addition, the Sponsor may be required to liquidate certain open positions in order to ensure compliance with the speculative position limits at unfavorable prices, which may result in substantial losses for the relevant Funds. There also can be no assurance that the Sponsor will liquidate positions held on behalf of all the Sponsor’s accounts, including any proprietary accounts, in a proportionate manner. In the event the Sponsor chooses to liquidate a disproportionate number of positions held on behalf of any of the Funds at unfavorable prices, such Funds may incur substantial losses and the value of the Shares may be adversely affected.
Further, in October 2012, a new CFTC rule became effective, which requires each registered FCM to establish risk-based limits on position and order size. As a result, the Trust’s FCMs may be required to reduce their internal limits on the size of the positions they will execute or clear for the Funds, and the Trust may seek to use additional FCMs, which may increase the costs for the Funds and adversely affect the value of the Shares.
55
Table of Contents
The Trust may apply to the CFTC or to the relevant exchanges for relief from certain position limits. If the Trust is unable to obtain such relief, a Fund’s ability to issue new Creation Units, or the Fund’s ability to reinvest income in additional futures contracts, may be limited to the extent these activities cause the Trust to exceed applicable position limits. Limiting the size of a Fund may affect the correlation between the price of the Shares, as traded on an exchange, and the net asset value of the Fund. Accordingly, the inability to create additional Creation Units or add to existing positions in the desired amount could result in Shares trading at a premium or discount to NAV.
Margin for Non-cleared Swap and Forward Transactions
In 2015, the regulators adopted, and in 2016 the CFTC adopted new mandatory margin requirements for non-cleared swap and foreign currency forward transactions and new requirements for the holding of collateral by derivative dealers. These requirements, which are still pending final adoption, may increase the amount of collateral a Fund is required to provide to derivative dealers for non-cleared swaps and foreign currency forwards.
Item 1B. Unresolved Staff Comments.
None.
Not applicable.
None.
Item 4. Mine Safety Disclosures.
Not applicable.
Item 5. Market for Registrant’s Common Equity, Related Stockholder Matters and Issuer Purchases of Equity Securities.
| a) | Eight of the Funds, ProShares UltraShort Bloomberg Commodity, ProShares UltraShort Bloomberg Crude Oil, ProShares UltraShort Euro, ProShares UltraShort Yen, ProShares Ultra Bloomberg Commodity, ProShares Ultra Bloomberg Crude Oil, ProShares Ultra Euro and ProShares Ultra Yen, commenced trading on the NYSE Arca on November 25, 2008. Four of the Funds, ProShares UltraShort Gold, ProShares UltraShort Silver, ProShares Ultra Gold, and ProShares Ultra Silver, commenced trading on the NYSE Arca on December 3, 2008. Two of the Funds, ProShares VIX Short-Term Futures ETF and ProShares VIX Mid-Term Futures ETF, commenced trading on the NYSE Arca on January 3, 2011. Two of the Funds, ProShares Ultra VIX Short-Term Futures ETF and ProShares Short VIX Short-Term Futures ETF, commenced trading on the NYSE Arca on October 3, 2011. Two of the Funds, ProShares UltraShort Bloomberg Natural Gas and ProShares Ultra Bloomberg Natural Gas, commenced trading on the NYSE Arca on October 4, 2011. One of the Funds, ProShares Short Euro, commenced trading on the NYSE Arca on June 26, 2012. One of the Funds, ProShares UltraShort Australian Dollar, commenced trading on the NYSE Arca on July 17, 2012. One of the Funds, ProShares Managed Futures Strategy, commenced trading on the NYSE Arca on October 1, 2014. The following tables set forth the ranges of reported high and low sales prices of each Fund’s Shares as reported on the NYSE Arca for the periods indicated below. |
56
Table of Contents
Fiscal Year 2015
| Fund |
High | Low | ||||||
| ProShares Managed Futures Strategy |
||||||||
| First Quarter |
22.22 | 20.62 | ||||||
| Second Quarter |
22.00 | 16.20 | ||||||
| Third Quarter |
22.00 | 19.00 | ||||||
| Fourth Quarter |
22.00 | 19.00 | ||||||
| ProShares VIX Short-Term Futures ETF |
||||||||
| First Quarter |
24.83 | 16.38 | ||||||
| Second Quarter |
17.56 | 11.22 | ||||||
| Third Quarter |
20.97 | 10.32 | ||||||
| Fourth Quarter |
17.68 | 11.79 | ||||||
| ProShares VIX Mid-Term Futures ETF |
||||||||
| First Quarter |
69.26 | 59.40 | ||||||
| Second Quarter |
62.14 | 51.80 | ||||||
| Third Quarter |
70.77 | 49.07 | ||||||
| Fourth Quarter |
64.15 | 51.90 | ||||||
| ProShares Short VIX Short-Term Futures ETF |
||||||||
| First Quarter |
70.77 | 48.51 | ||||||
| Second Quarter |
98.13 | 65.84 | ||||||
| Third Quarter |
97.13 | 41.63 | ||||||
| Fourth Quarter |
64.74 | 43.08 | ||||||
| ProShares Ultra VIX Short-Term Futures ETF* |
||||||||
| First Quarter |
170.05 | 70.00 | ||||||
| Second Quarter |
80.05 | 31.33 | ||||||
| Third Quarter |
91.25 | 24.34 | ||||||
| Fourth Quarter |
59.86 | 23.83 | ||||||
| ProShares UltraShort Bloomberg Commodity |
||||||||
| First Quarter |
98.25 | 72.42 | ||||||
| Second Quarter |
96.33 | 85.85 | ||||||
| Third Quarter |
183.29 | 88.96 | ||||||
| Fourth Quarter |
150.26 | 106.66 | ||||||
| ProShares UltraShort Bloomberg Crude Oil |
||||||||
| First Quarter |
110.94 | 66.52 | ||||||
| Second Quarter |
86.07 | 50.90 | ||||||
| Third Quarter |
137.18 | 58.79 | ||||||
| Fourth Quarter |
147.69 | 69.91 | ||||||
| ProShares UltraShort Bloomberg Natural Gas |
||||||||
| First Quarter |
93.75 | 61.00 | ||||||
| Second Quarter |
98.87 | 62.50 | ||||||
| Third Quarter |
97.89 | 68.51 | ||||||
| Fourth Quarter |
222.91 | 94.00 | ||||||
| ProShares UltraShort Gold |
||||||||
| First Quarter |
105.58 | 81.59 | ||||||
| Second Quarter |
100.58 | 90.40 | ||||||
| Third Quarter |
115.85 | 98.09 | ||||||
| Fourth Quarter |
118.85 | 93.48 | ||||||
| ProShares UltraShort Silver* |
||||||||
| First Quarter |
60.89 | 42.25 | ||||||
| Second Quarter |
56.51 | 43.25 | ||||||
| Third Quarter |
66.70 | 53.43 | ||||||
| Fourth Quarter |
66.29 | 47.04 | ||||||
| ProShares Short Euro |
||||||||
| First Quarter |
46.16 | 40.29 | ||||||
57
Table of Contents
| Fund |
High | Low | ||||||
| Second Quarter |
45.59 | 41.93 | ||||||
| Third Quarter |
44.21 | 40.26 | ||||||
| Fourth Quarter |
45.14 | 41.52 | ||||||
| ProShares UltraShort Australian Dollar |
||||||||
| First Quarter |
58.62 | 50.07 | ||||||
| Second Quarter |
58.17 | 49.70 | ||||||
| Third Quarter |
66.91 | 55.24 | ||||||
| Fourth Quarter |
64.60 | 57.40 | ||||||
| ProShares UltraShort Euro |
||||||||
| First Quarter |
28.58 | 21.84 | ||||||
| Second Quarter |
27.88 | 23.55 | ||||||
| Third Quarter |
26.20 | 22.26 | ||||||
| Fourth Quarter |
27.18 | 23.04 | ||||||
| ProShares UltraShort Yen |
||||||||
| First Quarter |
91.49 | 84.06 | ||||||
| Second Quarter |
97.60 | 86.80 | ||||||
| Third Quarter |
96.20 | 83.73 | ||||||
| Fourth Quarter |
93.23 | 85.29 | ||||||
| ProShares Ultra Bloomberg Commodity* |
||||||||
| First Quarter |
52.08 | 36.80 | ||||||
| Second Quarter |
52.84 | 13.04 | ||||||
| Third Quarter |
48.18 | 34.15 | ||||||
| Fourth Quarter |
40.31 | 27.80 | ||||||
| ProShares Ultra Bloomberg Crude Oil* |
||||||||
| First Quarter |
51.80 | 29.45 | ||||||
| Second Quarter |
53.60 | 34.35 | ||||||
| Third Quarter |
43.92 | 17.05 | ||||||
| Fourth Quarter |
27.45 | 11.56 | ||||||
| ProShares Ultra Bloomberg Natural Gas* |
||||||||
| First Quarter |
78.48 | 45.00 | ||||||
| Second Quarter |
58.64 | 38.40 | ||||||
| Third Quarter |
48.70 | 31.70 | ||||||
| Fourth Quarter |
32.75 | 12.42 | ||||||
| ProShares Ultra Gold |
||||||||
| First Quarter |
46.85 | 35.69 | ||||||
| Second Quarter |
40.93 | 36.54 | ||||||
| Third Quarter |
37.18 | 31.30 | ||||||
| Fourth Quarter |
37.75 | 29.06 | ||||||
| ProShares Ultra Silver |
||||||||
| First Quarter |
52.29 | 35.37 | ||||||
| Second Quarter |
46.83 | 35.47 | ||||||
| Third Quarter |
37.17 | 28.40 | ||||||
| Fourth Quarter |
38.32 | 26.55 | ||||||
| ProShares Ultra Euro |
||||||||
| First Quarter |
19.65 | 14.80 | ||||||
| Second Quarter |
17.62 | 14.96 | ||||||
| Third Quarter |
18.19 | 15.63 | ||||||
| Fourth Quarter |
17.48 | 14.67 | ||||||
| ProShares Ultra Yen* |
||||||||
| First Quarter |
59.88 | 54.16 | ||||||
| Second Quarter |
57.16 | 50.86 | ||||||
| Third Quarter |
58.07 | 51.08 | ||||||
| Fourth Quarter |
56.88 | 52.07 | ||||||
| * | See Note 1 of the Notes to Financial Statements in Item 15 of Part IV in this Annual Report on Form 10-K. |
58
Table of Contents
Fiscal Year 2014
| Fund |
High | Low | ||||||
| ProShares Managed Futures Strategy** |
||||||||
| First Quarter |
$ | — | $ | — | ||||
| Second Quarter |
— | — | ||||||
| Third Quarter |
— | — | ||||||
| Fourth Quarter |
22.15 | 19.50 | ||||||
| ProShares VIX Short-Term Futures ETF |
||||||||
| First Quarter |
$ | 36.91 | $ | 26.66 | ||||
| Second Quarter |
30.88 | 18.84 | ||||||
| Third Quarter |
23.51 | 17.86 | ||||||
| Fourth Quarter |
29.68 | 17.06 | ||||||
| ProShares VIX Mid-Term Futures ETF* |
||||||||
| First Quarter |
$ | 84.92 | $ | 73.56 | ||||
| Second Quarter |
76.08 | 61.60 | ||||||
| Third Quarter |
67.20 | 58.20 | ||||||
| Fourth Quarter |
77.84 | 59.05 | ||||||
| ProShares Short VIX Short-Term Futures ETF* |
||||||||
| First Quarter |
$ | 71.80 | $ | 49.80 | ||||
| Second Quarter |
89.20 | 55.86 | ||||||
| Third Quarter |
93.33 | 68.65 | ||||||
| Fourth Quarter |
80.94 | 48.29 | ||||||
| ProShares Ultra VIX Short-Term Futures ETF* |
||||||||
| First Quarter |
$ | 108.41 | $ | 58.40 | ||||
| Second Quarter |
71.72 | 26.06 | ||||||
| Third Quarter |
39.11 | 22.22 | ||||||
| Fourth Quarter |
56.28 | 17.62 | ||||||
| ProShares UltraShort Bloomberg Commodity |
||||||||
| First Quarter |
$ | 63.49 | $ | 52.13 | ||||
| Second Quarter |
55.31 | 49.66 | ||||||
| Third Quarter |
72.95 | 52.47 | ||||||
| Fourth Quarter |
87.44 | 67.37 | ||||||
| ProShares UltraShort Bloomberg Crude Oil |
||||||||
| First Quarter |
$ | 36.64 | $ | 27.10 | ||||
| Second Quarter |
30.02 | 24.06 | ||||||
| Third Quarter |
31.78 | 24.31 | ||||||
| Fourth Quarter |
80.24 | 29.57 | ||||||
| ProShares UltraShort Bloomberg Natural Gas |
||||||||
| First Quarter |
$ | 76.94 | $ | 34.00 | ||||
| Second Quarter |
45.82 | 35.39 | ||||||
| Third Quarter |
56.10 | 40.03 | ||||||
| Fourth Quarter |
84.00 | 37.00 | ||||||
| ProShares UltraShort Gold |
||||||||
| First Quarter |
$ | 100.84 | $ | 76.83 | ||||
| Second Quarter |
94.80 | 82.11 | ||||||
| Third Quarter |
98.69 | 80.41 | ||||||
| Fourth Quarter |
109.22 | 91.01 | ||||||
| ProShares UltraShort Silver |
||||||||
| First Quarter |
$ | 92.60 | $ | 68.26 | ||||
| Second Quarter |
93.00 | 71.66 | ||||||
| Third Quarter |
110.00 | 69.36 | ||||||
| Fourth Quarter |
131.34 | 97.46 | ||||||
| ProShares Short Euro |
||||||||
| First Quarter |
$ | 36.30 | $ | 35.15 | ||||
| Second Quarter |
36.17 | 35.06 | ||||||
| Third Quarter |
38.56 | 35.60 | ||||||
59
Table of Contents
| Fund |
High | Low | ||||||
| Fourth Quarter |
40.04 | 37.15 | ||||||
| ProShares UltraShort Australian Dollar |
||||||||
| First Quarter |
$ | 48.89 | $ | 42.22 | ||||
| Second Quarter |
42.80 | 40.26 | ||||||
| Third Quarter |
46.23 | 39.55 | ||||||
| Fourth Quarter |
52.36 | 43.86 | ||||||
| ProShares UltraShort Euro |
||||||||
| First Quarter |
$ | 17.74 | $ | 16.50 | ||||
| Second Quarter |
17.51 | 16.50 | ||||||
| Third Quarter |
20.09 | 17.03 | ||||||
| Fourth Quarter |
21.61 | 19.11 | ||||||
| ProShares UltraShort Yen |
||||||||
| First Quarter |
$ | 70.50 | $ | 64.61 | ||||
| Second Quarter |
68.77 | 64.74 | ||||||
| Third Quarter |
75.85 | 64.63 | ||||||
| Fourth Quarter |
92.61 | 69.51 | ||||||
| ProShares Ultra Bloomberg Commodity |
||||||||
| First Quarter |
$ | 23.50 | $ | 18.51 | ||||
| Second Quarter |
23.65 | 20.76 | ||||||
| Third Quarter |
21.93 | 17.00 | ||||||
| Fourth Quarter |
19.13 | 12.86 | ||||||
| ProShares Ultra Bloomberg Crude Oil |
||||||||
| First Quarter |
$ | 36.71 | $ | 27.62 | ||||
| Second Quarter |
40.17 | 32.79 | ||||||
| Third Quarter |
39.69 | 29.52 | ||||||
| Fourth Quarter |
32.35 | 9.84 | ||||||
| ProShares Ultra Bloomberg Natural Gas |
||||||||
| First Quarter |
$ | 64.36 | $ | 34.86 | ||||
| Second Quarter |
54.35 | 42.94 | ||||||
| Third Quarter |
45.60 | 31.59 | ||||||
| Fourth Quarter |
41.19 | 15.45 | ||||||
| ProShares Ultra Gold |
||||||||
| First Quarter |
$ | 54.53 | $ | 41.80 | ||||
| Second Quarter |
49.85 | 43.15 | ||||||
| Third Quarter |
50.43 | 40.30 | ||||||
| Fourth Quarter |
43.54 | 35.98 | ||||||
| ProShares Ultra Silver* |
||||||||
| First Quarter |
$ | 80.77 | $ | 60.50 | ||||
| Second Quarter |
72.07 | 56.25 | ||||||
| Third Quarter |
74.31 | 45.20 | ||||||
| Fourth Quarter |
50.18 | 36.62 | ||||||
| ProShares Ultra Euro |
||||||||
| First Quarter |
$ | 26.75 | $ | 24.93 | ||||
| Second Quarter |
26.61 | 25.07 | ||||||
| Third Quarter |
25.80 | 21.72 | ||||||
| Fourth Quarter |
26.10 | 19.80 | ||||||
| ProShares Ultra Yen |
||||||||
| First Quarter |
$ | 20.25 | $ | 18.71 | ||||
| Second Quarter |
20.15 | 18.95 | ||||||
| Third Quarter |
20.05 | 16.96 | ||||||
| Fourth Quarter |
18.75 | 13.73 | ||||||
| * | See Note 1 of the Notes to Financial Statements in Item 15 of Part IV in this Annual Report on Form 10-K. |
| ** | Fund commenced investment operations on October 1, 2014. |
60
Table of Contents
The approximate number of holders of the Shares of each Fund as of December 31, 2015 was as follows:
| Fund |
Number of Holders | |||
| ProShares Managed Futures Strategy |
171 | |||
| ProShares VIX Short-Term Futures ETF |
7,262 | |||
| ProShares VIX Mid-Term Futures ETF |
2,184 | |||
| ProShares Short VIX Short-Term Futures ETF |
14,523 | |||
| ProShares Ultra VIX Short-Term Futures ETF |
30,834 | |||
| ProShares UltraShort Bloomberg Commodity |
218 | |||
| ProShares UltraShort Bloomberg Crude Oil |
4,320 | |||
| ProShares UltraShort Bloomberg Natural Gas |
432 | |||
| ProShares UltraShort Gold |
3,063 | |||
| ProShares UltraShort Silver |
3,767 | |||
| ProShares Short Euro |
598 | |||
| ProShares UltraShort Australian Dollar |
462 | |||
| ProShares UltraShort Euro |
17,045 | |||
| ProShares UltraShort Yen |
7,578 | |||
| ProShares Ultra Bloomberg Commodity |
390 | |||
| ProShares Ultra Bloomberg Crude Oil |
56,982 | |||
| ProShares Ultra Bloomberg Natural Gas |
4,408 | |||
| ProShares Ultra Gold |
7,452 | |||
| ProShares Ultra Silver |
25,889 | |||
| ProShares Ultra Euro |
1,867 | |||
| ProShares Ultra Yen |
365 | |||
| Total: |
189,810 | |||
The Funds made no distributions to Shareholders during the fiscal year ended December 31, 2015 The Funds have no obligation to make periodic distributions to Shareholders.
b) The Trust initially registered Shares on its Registration Statement on Form S-1 (File No. 333-146801), which was declared effective on November 21, 2008, and registered additional Shares on its Registration Statement on Form S-1 (File No. 333-156888), which was declared effective on February 13, 2009. The Trust terminated these two offerings before the sale of all registered Shares and re-allocated the remaining amount of the registered Shares among the Funds listed on its Registration Statement on Form S-3 (File No. 333-163511), which became effective on December 4, 2009. It then registered additional Shares and/or added Funds pursuant to post-effective amendments to that Registration Statement on Form S-3, which became effective on May 28, 2010, November 5, 2010, December 23, 2010 and April 13, 2011, as well as on a Registration Statement on Form S-1 (File No. 333-178707), which became effective on June 25, 2012. On June 26, 2012, a post-effective amendment to the Registration Statement on Form S-3 (File No. 333-163511) was declared effective, which registered additional Shares for ProShares Ultra Bloomberg Crude Oil and terminated the offerings for certain publicly offered Funds and certain Funds that had never been publicly offered. New offerings for those Funds that had been publicly offered were registered on an accompanying Registration Statement on Form S-1 (File No. 333-176878), which was also declared effective on June 26, 2012. On September 24, 2012, a Registration Statement on Form S-1 (File No. 333-183672) was declared effective, which registered additional Shares for ProShares Ultra VIX Short-Term Futures ETF, ProShares VIX Short-Term Futures ETF and ProShares Short VIX Short-Term Futures ETF. This registration statement (File No. 333-183672) was a combined prospectus and acted as a post-effective amendment to the Form S-1 (File No. 333-176878). On September 27, 2012, a Registration Statement on Form S-3 (File No. 333-183674) was declared effective, which registered additional Shares for ProShares Ultra Bloomberg Crude Oil, ProShares UltraShort Bloomberg Crude Oil and ProShares UltraShort Euro. This registration statement was a combined prospectus and acted as a post-effective amendment to the Form S-3 (File No. 333-163511). On September 28, 2012, a post-effective amendment to a Registration Statement on Form S-1 (File No. 333-178707) was declared effective, terminating the proposed offerings of several unlaunched currency funds. On January 30, 2013, a Registration Statement on Form S-1 (File No. 333-185288) was declared effective. That registration statement, which registered additional Shares to ProShares Short VIX Short-Term Futures ETF, acted as a combined prospectus and post-effective amendment to the Trust’s Form S-1 Registration Statements (File Nos. 333-183672 and 333-178707).
61
Table of Contents
Also, on January 30, 2013, a Registration Statement on Form S-3 (File No. 333-185289) was declared effective. That registration statement, which registered additional Shares to ProShares Ultra Bloomberg Crude Oil, ProShares UltraShort Euro, ProShares Ultra VIX Short-Term Futures ETF and ProShares VIX Short-Term Futures ETF, acted as a combined prospectus and post-effective amendment to the Trust’s Form S-1 Registration Statement (File No. 333-193672) and Form S-3 Registration Statement (File No. 333-183674). On April 24, 2013, a post-effective amendment to the Form S-1 Registration Statement (File No. 333-185288) was declared effective, terminating the registered but unlaunched offerings related to: ProShares UltraPro Short Euro, ProShares Managed Futures Strategy and ProShares Commodity Managed Futures Strategy. On April 29, 2013, a Registration Statement on Form S-3 (File No. 333-187820) was declared effective, which registered additional Shares for ProShares Ultra Bloomberg Crude Oil, ProShares UltraShort Bloomberg Crude Oil, ProShares Ultra Silver, ProShares UltraShort Silver, ProShares UltraShort Euro, ProShares UltraShort Yen, ProShares Ultra VIX Short-Term Futures ETF and ProShares VIX Short-Term Futures ETF. That registration statement was a combined prospectus and acted as a post-effective amendment to the Form S-3 (File No. 333-185289). On May 21, 2013, a Registration Statement on Form S-1 (File 333-188215) was declared effective, which registered additional Shares for ProShares Ultra Bloomberg Natural Gas, ProShares UltraShort Bloomberg Natural Gas, ProShares Short VIX Short-Term Futures ETF and ProShares VIX Mid-Term Futures ETF. That registration statement was a combined prospectus and acted as a post-effective amendment to the Form S-1 (File No. 333-185288). On July 30, 2013, a Registration Statement on Form S-3 (File No. 333-189967) was declared effective, which registered additional Shares for ProShares Bloomberg Crude Oil and ProShares UltraShort Yen and partially terminated registered and unissued Shares of ProShares Ultra Bloomberg Crude Oil, ProShares Ultra Silver, ProShares UltraShort Silver, ProShares UltraShort Euro and ProShares VIX Short-Term Futures ETF. That registration statement was a combined prospectus and acted as a post-effective amendment to the Form S-3 (File No. 333-187820). On May 6, 2014, a post-effective amendment to the Form S-1 Registration Statement (File No. 333-188215) was declared effective, updating the Form S-1 Registration Statement by, among other things, incorporating by reference the audited financial statements for the fiscal year ended December 31, 2013. The post-effective amendment did not register any additional shares. On July 30, 2014, a Registration Statement on Form S-1 (File No. 333-196884) was declared effective, which partially terminated registered and unissued Shares of ProShares VIX Mid-Term Futures ETF, ProShares Ultra Bloomberg Commodity, ProShares Ultra Euro, ProShares Ultra Yen and ProShares UltraShort Bloomberg Commodity. That registration statement was a combined prospectus and acted as a post-effective amendment to two Form S-1 registration statements (File Nos. 333-188215 and 333-185288). On July 30, 2014, a Registration Statement on Form S-3 (File No. 333-196885) was also declared effective, which registered additional Shares for ProShares Ultra Bloomberg Crude Oil, ProShares UltraShort Bloomberg Crude Oil and ProShares UltraShort Euro and partially terminated registered and unissued Shares of ProShares Ultra Gold, ProShares Ultra Silver and ProShares UltraShort Silver. That Registration Statement also was a combined prospectus and acted as a post-effective amendment to the Form S-3 (File No. 333-189967). Through the July 30, 2014 filings, ProShares Short VIX Short-Term Futures ETF was transferred from the Form S-1 to the Form S-3. On September 29, 2014, a Registration Statement on Form S-1 (File No. 333-198189) was declared effective, which registered a new offering of the Managed Futures Fund and acted as a post-effective amendment to the Form S-1 Registration Statement (File No. 333-196884). On November 25, 2014, a Registration Statement on Form S-1 (File No. 333-199642) was declared effective, which registered additional Shares for ProShares Ultra Bloomberg Natural Gas, ProShares UltraShort Bloomberg Natural Gas and ProShares UltraShort Silver. That registration statement was a combined prospectus and acted as a post-effective amendment to the Form S-1 registration statement (File No. 333-198189) and the Form S-3 registration statement (333-196885). On November 25, 2014, a Registration Statement on Form S-3 (File No. 333-199641) was also declared effective, which registered additional Shares for ProShares Ultra Bloomberg Crude Oil, ProShares Ultra Gold, ProShares UltraShort Gold, ProShares Ultra Silver, ProShares UltraShort Euro, ProShares UltraShort Yen, ProShares Ultra VIX Short-Term Futures ETF, ProShares Short VIX Short-Term Futures ETF and ProShares VIX Short-Term Futures ETF. That Registration Statement also was a combined prospectus and acted as a post-effective amendment to the Form S-3 (File No. 333-196885). Through the November 25, 2014 filings, ProShares UltraShort Silver was transferred from the Form S-3 to the Form S-1. On March 31, 2015, a Registration Statement on Form S-1 (File No. 333-202724) was declared effective, which registered additional Shares for ProShares VIX Mid-Term Futures ETF,
62
Table of Contents
ProShares Managed Futures Strategy, ProShares Ultra Bloomberg Commodity, ProShares Ultra Bloomberg Natural Gas, ProShares UltraShort Bloomberg Natural Gas, ProShares UltraShort Silver, ProShares Ultra Australian Dollar, ProShares UltraShort Australian Dollar, ProShares Ultra Euro, ProShares Short Euro and ProShares Ultra Yen. That registration statement was a combined prospectus and acted as a post-effective amendment to the Form S-1 registration statement (File No. 333-199642). On March 31, 2015, a Registration Statement on Form S-3 (File No. 333-202725) was also declared effective, which registered additional Shares for ProShares Ultra Bloomberg Crude Oil, ProShares UltraShort Bloomberg Crude Oil, ProShares Ultra Gold, ProShares UltraShort Gold, ProShares Ultra Silver, ProShares UltraShort Euro, ProShares UltraShort Yen, ProShares Ultra VIX Short-Term Futures ETF, ProShares Short VIX Short-Term Futures ETF and ProShares VIX Short-Term Futures ETF. That Registration Statement also was a combined prospectus and acted as a post-effective amendment to the Form S-3 (File No. 333-199641). On August 11, 2015, a Registration Statement on Form S-1 (File No. 333-202724) was declared effective which removed ProShares Ultra Australian Dollar from the Form S-1. No additional shares were registered. That registration statement was a combined prospectus and acted as a pre-effective amendment to post-effective amendment No. 1 of the Form S-1. Thus, as of December 31, 2015, the Trust continued to have two effective registration statements outstanding: 1) a Form S-1 Registration Statement (No. 333-202724); and 2) a Form S-3 Registration Statement (No. 333-199641).
Substantially all of the proceeds received by each Fund from the issuance and sale of Shares to Authorized Participants are used by each Fund to enter into Financial Instruments relating to that Fund’s benchmark in combination with cash or cash equivalents and/or U.S. Treasury securities or other high credit quality, short-term fixed-income or similar securities (such as shares of money market funds and collateralized repurchase agreements) that may in part be used for direct investment or deposited with the FCMs as margin in connection with futures contracts or in segregated accounts at the Funds’ custodian bank as collateral for swap agreements or forward contracts, as applicable. The Managed Futures Fund and each Geared Fund continuously offers and redeems its Shares in blocks of 50,000 Shares, and each Matching VIX Fund continuously offers and redeems Shares in blocks of 25,000 Shares.
| Title of Securities Registered |
Amount Registered As of December 31, 2015 |
Shares Sold For the Three Months Ended December 31, 2015 |
Sale Price of Shares Sold For the Three Months Ended December 31, 2015 |
Shares Sold For the Year Ended December 31, 2015 |
Sale Price of Shares Sold For the Year Ended December 31, 2015 |
|||||||||||||||
| ProShares Managed Futures Strategy Common Units of Beneficial Interest |
$ | 509,027,538 | 150,000 | $ | 3,096,161 | 550,000 | $ | 11,524,992 | ||||||||||||
| ProShares VIX Short-Term Futures ETF Common Units of Beneficial Interest |
$ | 2,068,623,063 | 1,925,000 | $ | 25,251,144 | 12,475,000 | $ | 187,659,682 | ||||||||||||
| ProShares VIX Mid-Term Futures ETF Common Units of Beneficial Interest |
$ | 619,302,925 | 25,000 | $ | 1,447,922 | 325,000 | $ | 19,318,111 | ||||||||||||
| ProShares Short VIX Short-Term Futures ETF Common Units of Beneficial Interest |
$ | 3,589,767,641 | 5,400,000 | $ | 257,452,762 | 24,100,000 | $ | 1,403,231,166 | ||||||||||||
| ProShares Ultra VIX Short-Term Futures ETF Common Units of Beneficial Interest* |
$ | 4,255,550,774 | 27,400,000 | $ | 802,932,366 | 72,180,000 | $ | 3,192,766,319 | ||||||||||||
63
Table of Contents
| Title of Securities Registered |
Amount Registered As of December 31, 2015 |
Shares Sold For the Three Months Ended December 31, 2015 |
Sale Price of Shares Sold For the Three Months Ended December 31, 2015 |
Shares Sold For the Year Ended December 31, 2015 |
Sale Price of Shares Sold For the Year Ended December 31, 2015 |
|||||||||||||||
| ProShares UltraShort Bloomberg Commodity Common Units of Beneficial Interest |
$ | 172,839,931 | — | $ | — | — | $ | — | ||||||||||||
| ProShares UltraShort Bloomberg Crude Oil Common Units of Beneficial Interest |
$ | 2,114,776,247 | 600,000 | $ | 49,768,085 | 10,800,000 | $ | 796,070,368 | ||||||||||||
| ProShares UltraShort Bloomberg Natural Gas Common Units of Beneficial Interest |
$ | 412,030,981 | 50,000 | $ | 7,753,058 | 450,000 | $ | 37,204,187 | ||||||||||||
| ProShares UltraShort Gold Common Units of Beneficial Interest |
$ | 503,545,611 | 50,000 | $ | 4,859,925 | 150,000 | $ | 13,383,255 | ||||||||||||
| ProShares UltraShort Silver Common Units of Beneficial Interest* |
$ | 2,083,528,399 | 550,000 | $ | 28,700,095 | 1,650,000 | $ | 84,272,164 | ||||||||||||
| ProShares Short Euro Common Units of Beneficial Interest |
$ | 174,672,977 | — | $ | — | 550,000 | $ | 23,563,492 | ||||||||||||
| ProShares UltraShort Australian Dollar Common Units of Beneficial Interest |
$ | 172,771,084 | — | $ | — | 50,000 | $ | 2,764,167 | ||||||||||||
| ProShares UltraShort Euro Common Units of Beneficial Interest |
$ | 1,888,450,946 | 700,000 | $ | 17,798,452 | 12,600,000 | $ | 328,253,174 | ||||||||||||
| ProShares UltraShort Yen Common Units of Beneficial Interest |
$ | 951,962,134 | — | $ | — | 1,350,000 | $ | 124,524,909 | ||||||||||||
| ProShares Ultra Bloomberg Commodity Common Units of Beneficial Interest* |
$ | 129,604,130 | 150,000 | $ | 5,583,484 | 225,000 | $ | 8,571,369 | ||||||||||||
| ProShares Ultra Bloomberg Crude Oil Common Units of Beneficial Interest* |
$ | 3,838,773,188 | 32,300,000 | $ | 564,704,767 | 86,830,000 | $ | 2,505,616,928 | ||||||||||||
| ProShares Ultra Bloomberg Natural Gas Common Units of Beneficial Interest* |
$ | 540,275,387 | 450,000 | $ | 8,582,442 | 2,137,500 | $ | 83,526,876 | ||||||||||||
| ProShares Ultra Gold Common Units of Beneficial Interest |
$ | 683,270,223 | 50,000 | $ | 1,549,917 | 150,000 | $ | 5,401,300 | ||||||||||||
| ProShares Ultra Silver Common Units of Beneficial Interest |
$ | 2,251,471,600 | 700,000 | $ | 20,094,769 | 2,700,000 | $ | 96,078,803 | ||||||||||||
| ProShares Ultra Euro Common Units of Beneficial Interest |
$ | 126,652,323 | 150,000 | $ | 2,376,043 | 950,000 | $ | 15,916,613 | ||||||||||||
| ProShares Ultra Yen Common Units of Beneficial Interest* |
$ | 138,726,333 | — | $ | — | 75,000 | $ | 4,285,016 | ||||||||||||
| Total: |
$ | 27,225,623,435 | 70,650,000 | $ | 1,801,951,392 | 230,297,500 | $ | 8,943,932,891 | ||||||||||||
| c) | From October 1, 2015 through December 31, 2015, the number of Shares redeemed and average price per Share for each Fund were as follows: |
64
Table of Contents
| Fund |
Total Number of Shares Redeemed |
Average Price Per Share |
||||||
| ProShares Managed Futures Strategy |
||||||||
| 10/01/15 to 10/31/15 |
100,000 | $ | 20.29 | |||||
| 11/01/15 to 11/30/15 |
100,000 | $ | 20.38 | |||||
| 12/01/15 to 12/31/15 |
50,000 | $ | 20.52 | |||||
| ProShares VIX Short-Term Futures ETF |
||||||||
| 10/01/15 to 10/31/15 |
— | $ | — | |||||
| 11/01/15 to 11/30/15 |
— | $ | — | |||||
| 12/01/15 to 12/31/15 |
400,000 | $ | 14.09 | |||||
| ProShares VIX Mid-Term Futures ETF |
||||||||
| 10/01/15 to 10/31/15 |
— | $ | — | |||||
| 11/01/15 to 11/30/15 |
— | $ | — | |||||
| 12/01/15 to 12/31/15 |
— | $ | — | |||||
| ProShares Short VIX Short-Term Futures ETF |
||||||||
| 10/01/15 to 10/31/15 |
2,850,000 | $ | 59.54 | |||||
| 11/01/15 to 11/30/15 |
1,000,000 | $ | 59.27 | |||||
| 12/01/15 to 12/31/15 |
2,250,000 | $ | 53.32 | |||||
| ProShares Ultra VIX Short-Term Futures ETF |
||||||||
| 10/01/15 to 10/31/15 |
100,000 | $ | 29.53 | |||||
| 11/01/15 to 11/30/15 |
2,150,000 | $ | 33.87 | |||||
| 12/01/15 to 12/31/15 |
11,500,000 | $ | 34.65 | |||||
| ProShares UltraShort Bloomberg Commodity |
||||||||
| 10/01/15 to 10/31/15 |
— | $ | — | |||||
| 11/01/15 to 11/30/15 |
— | $ | — | |||||
| 12/01/15 to 12/31/15 |
— | $ | — | |||||
| ProShares UltraShort Bloomberg Crude Oil |
||||||||
| 10/01/15 to 10/31/15 |
600,000 | $ | 83.17 | |||||
| 11/01/15 to 11/30/15 |
400,000 | $ | 93.81 | |||||
| 12/01/15 to 12/31/15 |
500,000 | $ | 127.33 | |||||
| ProShares UltraShort Bloomberg Natural Gas |
||||||||
| 10/01/15 to 10/31/15 |
50,000 | $ | 126.67 | |||||
| 11/01/15 to 11/30/15 |
50,000 | $ | 139.16 | |||||
| 12/01/15 to 12/31/15 |
— | $ | — | |||||
| ProShares UltraShort Gold |
||||||||
| 10/01/15 to 10/31/15 |
— | $ | — | |||||
| 11/01/15 to 11/30/15 |
50,000 | $ | 112.46 | |||||
| 12/01/15 to 12/31/15 |
50,000 | $ | 115.59 | |||||
| ProShares UltraShort Silver* |
||||||||
| 10/01/15 to 10/31/15 |
100,000 | $ | 51.49 | |||||
| 11/01/15 to 11/30/15 |
250,000 | $ | 62.55 | |||||
| 12/01/15 to 12/31/15 |
250,000 | $ | 62.02 | |||||
| ProShares Short Euro |
||||||||
| 10/01/15 to 10/31/15 |
400,000 | $ | 42.75 | |||||
| 11/01/15 to 11/30/15 |
— | $ | — | |||||
| 12/01/15 to 12/31/15 |
— | $ | — | |||||
| ProShares UltraShort Australian Dollar |
||||||||
| 10/01/15 to 10/31/15 |
— | $ | — | |||||
| 11/01/15 to 11/30/15 |
— | $ | — | |||||
| 12/01/15 to 12/31/15 |
— | $ | — | |||||
| ProShares UltraShort Euro |
||||||||
| 10/01/15 to 10/31/15 |
500,000 | $ | 24.09 | |||||
| 11/01/15 to 11/30/15 |
2,000,000 | $ | 26.14 | |||||
| 12/01/15 to 12/31/15 |
200,000 | $ | 25.54 | |||||
| ProShares UltraShort Yen |
||||||||
| 10/01/15 to 10/31/15 |
50,000 | $ | 87.76 | |||||
| 11/01/15 to 11/30/15 |
350,000 | $ | 91.79 | |||||
| 12/01/15 to 12/31/15 |
350,000 | $ | 88.69 | |||||
| ProShares Ultra Bloomberg Commodity |
||||||||
| 10/01/15 to 10/31/15 |
— | $ | — | |||||
| 11/01/15 to 11/30/15 |
— | $ | — | |||||
| 12/01/15 to 12/31/15 |
— | $ | — | |||||
| ProShares Ultra Bloomberg Crude Oil |
||||||||
| 10/01/15 to 10/31/15 |
3,450,000 | $ | 24.86 | |||||
| 11/01/15 to 11/30/15 |
1,550,000 | $ | 24.48 | |||||
| 12/01/15 to 12/31/15 |
200,000 | $ | 12.57 | |||||
| ProShares Ultra Bloomberg Natural Gas |
||||||||
| 10/01/15 to 10/31/15 |
— | $ | — | |||||
| 11/01/15 to 11/30/15 |
— | $ | — | |||||
| 12/01/15 to 12/31/15 |
— | $ | — | |||||
| ProShares Ultra Gold |
||||||||
| 10/01/15 to 10/31/15 |
150,000 | $ | 36.05 | |||||
| 11/01/15 to 11/30/15 |
— | $ | — | |||||
| 12/01/15 to 12/31/15 |
— | $ | — | |||||
| ProShares Ultra Silver |
||||||||
| 10/01/15 to 10/31/15 |
350,000 | $ | 35.28 | |||||
| 11/01/15 to 11/30/15 |
250,000 | $ | 30.91 | |||||
| 12/01/15 to 12/31/15 |
— | $ | — | |||||
| ProShares Ultra Euro |
||||||||
| 10/01/15 to 10/31/15 |
— | $ | — | |||||
| 11/01/15 to 11/30/15 |
— | $ | — | |||||
| 12/01/15 to 12/31/15 |
100,000 | $ | 15.70 | |||||
| ProShares Ultra Yen |
||||||||
| 10/01/15 to 10/31/15 |
— | $ | — | |||||
| 11/01/15 to 11/30/15 |
— | $ | — | |||||
| 12/01/15 to 12/31/15 |
— | $ | — | |||||
| Total: |
32,700,000 | $ | 41.39 | |||||
| * | See Note 1 of the Notes to Financial Statements in Item 15 of Part IV in this Annual Report on Form 10-K regarding the reverse Share splits for ProShares Ultra VIX Short-Term Futures ETF, ProShares Ultra Bloomberg Commodity, ProShares Ultra Bloomberg Crude Oil, ProShares Ultra Bloomberg Natural Gas and ProShares Ultra Yen and the Share split for ProShares UltraShort Silver. |
65
Table of Contents
Item 6. Selected Financial Data.
Financial Highlights for the years ended December 31, 2015, 2014, 2013, 2012 and 2011 for each Fund, as applicable, are summarized below and should be read in conjunction with the Funds’ audited financial statements, and the notes and schedules related thereto, which are included in this Annual Report on Form 10-K.
PROSHARES MANAGED FUTURES STRATEGY
| Year ended December 31, 2015 |
October 1, 2014 (Inception) through December 31, 2014 |
|||||||
| Total assets |
$ | 7,211,467 | $ | 6,406,630 | ||||
| Total shareholders’ equity at end of period |
7,187,022 | 6,340,845 | ||||||
| Net investment income (loss) |
(71,554 | ) | (7,531 | ) | ||||
| Net realized and unrealized gain (loss) |
(325,345 | ) | 213,333 | |||||
| Net income (loss) |
(396,899 | ) | 205,802 | |||||
| Net increase (decrease) in net asset value per share |
(0.60 | ) | 1.14 | |||||
PROSHARES VIX SHORT-TERM FUTURES ETF
| Year ended December 31, 2015 |
Year ended December 31, 2014 |
Year ended December 31, 2013 |
Year ended December 31, 2012 |
Year ended December 31, 2011 |
||||||||||||||||
| Total assets |
$ | 105,350,240 | $ | 111,540,076 | $ | 279,169,502 | $ | 183,678,945 | $ | 30,574,178 | ||||||||||
| Total shareholders’ equity at end of period |
105,272,823 | 111,459,325 | 270,398,554 | 137,657,464 | 30,549,903 | |||||||||||||||
| Net investment income (loss) |
(1,150,794 | ) | (1,118,548 | ) | (1,584,119 | ) | (1,053,112 | ) | (282,569 | ) | ||||||||||
| Net realized and unrealized gain (loss) |
(26,753,742 | ) | 22,228,972 | (161,051,480 | ) | (159,588,720 | ) | 2,157,514 | ||||||||||||
| Net income (loss) |
(27,904,536 | ) | 21,110,424 | (162,635,599 | ) | (160,641,832 | ) | 1,874,945 | ||||||||||||
| Net increase (decrease) in net asset value per share |
(7.69 | ) | (7.61 | ) | (55.40 | ) | (297.93 | ) | (18.13 | ) | ||||||||||
66
Table of Contents
PROSHARES VIX MID-TERM FUTURES ETF
| Year ended December 31, 2015 |
Year ended December 31, 2014 |
Year ended December 31, 2013 |
Year ended December 31, 2012 |
Year ended December 31, 2011 |
||||||||||||||||
| Total assets |
$ | 27,671,016 | $ | 29,430,266 | $ | 56,501,754 | $ | 89,824,581 | $ | 90,821,428 | ||||||||||
| Total shareholders’ equity at end of period |
27,650,638 | 21,459,575 | 51,134,323 | 37,302,992 | 90,821,428 | |||||||||||||||
| Net investment income (loss) |
(240,600 | ) | (386,478 | ) | (546,566 | ) | (786,167 | ) | (117,121 | ) | ||||||||||
| Net realized and unrealized gain (loss) |
(3,939,933 | ) | (9,219,527 | ) | (31,648,251 | ) | (70,590,582 | ) | (6,632,431 | ) | ||||||||||
| Net income (loss) |
(4,180,533 | ) | (9,606,005 | ) | (32,194,817 | ) | (71,376,749 | ) | (6,749,552 | ) | ||||||||||
| Net increase (decrease) in net asset value per share |
(9.64 | ) | (13.58 | ) | (61.62 | ) | (157.76 | ) | (23.44 | ) | ||||||||||
PROSHARES SHORT VIX SHORT-TERM FUTURES ETF
| Year ended December 31, 2015 |
Year ended December 31, 2014 |
Year ended December 31, 2013 |
Year ended December 31, 2012 |
April 5, 2011 (Inception) through December 31, 2011 |
||||||||||||||||
| Total assets |
$ | 674,236,256 | $ | 541,342,389 | $ | 141,868,875 | $ | 95,411,974 | $ | 7,795,104 | ||||||||||
| Total shareholders’ equity at end of period |
642,811,361 | 506,556,124 | 141,751,202 | 82,663,633 | 7,760,424 | |||||||||||||||
| Net investment income (loss) |
(5,798,200 | ) | (4,285,469 | ) | (1,328,369 | ) | (437,699 | ) | (16,333 | ) | ||||||||||
| Net realized and unrealized gain (loss) |
96,936,157 | 52,474,493 | 96,687,035 | 11,731,268 | 1,446,017 | |||||||||||||||
| Net income (loss) |
91,137,957 | 48,189,024 | 95,358,666 | 11,293,569 | 1,429,684 | |||||||||||||||
| Net increase (decrease) in net asset value per share |
(10.59 | ) | (6.10 | ) | 34.43 | 20.13 | 2.93 | |||||||||||||
PROSHARES ULTRA VIX SHORT-TERM FUTURES ETF
| Year ended December 31, 2015 |
Year ended December 31, 2014 |
Year ended December 31, 2013 |
Year ended December 31, 2012 |
April 5, 2011 (Inception) through December 31, 2011 |
||||||||||||||||
| Total assets |
$ | 560,771,363 | $ | 358,364,869 | $ | 229,779,878 | $ | 156,387,315 | $ | 11,767,107 | ||||||||||
| Total shareholders’ equity at end of period |
547,708,740 | 351,789,953 | 226,233,584 | 84,716,132 | 9,881,113 | |||||||||||||||
| Net investment income (loss) |
(7,410,148 | ) | (5,359,486 | ) | (4,828,761 | ) | (3,001,646 | ) | (16,778 | ) | ||||||||||
| Net realized and unrealized gain (loss) |
(419,888,086 | ) | (75,812,141 | ) | (432,159,208 | ) | (506,284,763 | ) | (4,287,543 | ) | ||||||||||
| Net income (loss) |
(427,298,234 | ) | (81,171,627 | ) | (436,987,969 | ) | (509,286,409 | ) | (4,304,321 | ) | ||||||||||
| Net increase (decrease) in net asset value per share |
(97.38 | ) | (209.96 | ) | (3691.01 | ) | (144,182.85 | ) | (331,848.32 | ) | ||||||||||
67
Table of Contents
PROSHARES ULTRASHORT BLOOMBERG COMMODITY
| Year ended December 31, 2015 |
Year ended December 31, 2014 |
Year ended December 31, 2013 |
Year ended December 31, 2012 |
Year ended December 31, 2011 |
||||||||||||||||
| Total assets |
$ | 8,574,050 | $ | 5,268,573 | $ | 3,828,135 | $ | 3,248,525 | $ | 9,114,501 | ||||||||||
| Total shareholders’ equity at end of period |
8,514,039 | 5,264,706 | 3,797,427 | 3,245,965 | 9,107,146 | |||||||||||||||
| Net investment income (loss) |
(56,626 | ) | (34,070 | ) | (32,130 | ) | (47,749 | ) | (133,153 | ) | ||||||||||
| Net realized and unrealized gain (loss) |
3,305,959 | 1,501,349 | 583,592 | 340,212 | (2,775,425 | ) | ||||||||||||||
| Net income (loss) |
3,249,333 | 1,467,279 | 551,462 | 292,463 | (2,908,578 | ) | ||||||||||||||
| Net increase (decrease) in net asset value per share |
54.16 | 24.46 | 9.19 | (2.82 | ) | 8.92 | ||||||||||||||
PROSHARES ULTRASHORT BLOOMBERG CRUDE OIL
| Year ended December 31, 2015 |
Year ended December 31, 2014 |
Year ended December 31, 2013 |
Year ended December 31, 2012 |
Year ended December 31, 2011 |
||||||||||||||||
| Total assets |
$ | 96,858,373 | $ | 173,193,149 | $ | 258,594,876 | $ | 96,137,916 | $ | 144,499,971 | ||||||||||
| Total shareholders’ equity at end of period |
95,897,894 | 169,210,110 | 256,060,149 | 89,481,266 | 144,389,893 | |||||||||||||||
| Net investment income (loss) |
(2,166,211 | ) | (2,415,841 | ) | (2,544,628 | ) | (1,078,664 | ) | (1,211,735 | ) | ||||||||||
| Net realized and unrealized gain (loss) |
57,732,875 | 145,729,447 | (6,221,827 | ) | 35,047,625 | 36,113,078 | ||||||||||||||
| Net income (loss) |
55,566,664 | 143,313,606 | (8,766,455 | ) | 33,968,961 | 34,901,343 | ||||||||||||||
| Net increase (decrease) in net asset value per share |
55.22 | 46.25 | (8.58 | ) | 1.49 | (12.03 | ) | |||||||||||||
PROSHARES ULTRASHORT BLOOMBERG NATURAL GAS
| Year ended December 31, 2015 |
Year ended December 31, 2014 |
Year ended December 31, 2013 |
Year ended December 31, 2012 |
April 5, 2011 (Inception) through December 31, 2011 |
||||||||||||||||
| Total assets |
$ | 11,260,804 | $ | 14,698,814 | $ | 22,744,708 | $ | 12,780,598 | $ | 7,174,003 | ||||||||||
| Total shareholders’ equity at end of period |
10,462,856 | 14,688,564 | 22,734,767 | 12,768,340 | 7,142,310 | |||||||||||||||
| Net investment income (loss) |
(177,124 | ) | (460,907 | ) | (209,360 | ) | (196,407 | ) | (15,612 | ) | ||||||||||
| Net realized and unrealized gain (loss) |
8,800,372 | 11,696,119 | (1,952,152 | ) | 241,864 | 3,157,122 | ||||||||||||||
| Net income (loss) |
8,623,248 | 11,235,212 | (2,161,512 | ) | 45,457 | 3,141,510 | ||||||||||||||
| Net increase (decrease) in net asset value per share |
55.64 | 13.99 | (32.18 | ) | 6.92 | 41.89 | ||||||||||||||
68
Table of Contents
PROSHARES ULTRASHORT GOLD
| Year ended December 31, 2015 |
Year ended December 31, 2014 |
Year ended December 31, 2013 |
Year ended December 31, 2012 |
Year ended December 31, 2011 |
||||||||||||||||
| Total assets |
$ | 75,031,735 | $ | 84,214,601 | $ | 154,835,279 | $ | 92,495,298 | $ | 198,423,144 | ||||||||||
| Total shareholders’ equity at end of period |
74,971,764 | 81,861,762 | 139,436,456 | 92,416,742 | 198,298,571 | |||||||||||||||
| Net investment income (loss) |
(703,582 | ) | (857,817 | ) | (1,175,860 | ) | (1,106,213 | ) | (1,043,199 | ) | ||||||||||
| Net realized and unrealized gain (loss) |
16,807,446 | (13,246,612 | ) | 63,024,399 | (39,758,386 | ) | (8,458,117 | ) | ||||||||||||
| Net income (loss) |
16,103,864 | (14,104,429 | ) | 61,848,539 | (40,864,599 | ) | (9,501,316 | ) | ||||||||||||
| Net increase (decrease) in net asset value per share |
19.23 | (6.87 | ) | 39.65 | (18.84 | ) | (30.77 | ) | ||||||||||||
PROSHARES ULTRASHORT SILVER
| Year ended December 31, 2015 |
Year ended December 31, 2014 |
Year ended December 31, 2013 |
Year ended December 31, 2012 |
Year ended December 31, 2011 |
||||||||||||||||
| Total assets |
$ | 56,035,123 | $ | 53,254,791 | $ | 115,311,683 | $ | 105,882,964 | $ | 267,497,929 | ||||||||||
| Total shareholders’ equity at end of period |
55,987,938 | 53,007,867 | 112,989,686 | 100,656,703 | 246,813,921 | |||||||||||||||
| Net investment income (loss) |
(516,464 | ) | (585,841 | ) | (973,304 | ) | (1,403,142 | ) | (3,388,013 | ) | ||||||||||
| Net realized and unrealized gain (loss) |
14,943,700 | 17,926,873 | 91,898,519 | (51,826,102 | ) | (117,764,498 | ) | |||||||||||||
| Net income (loss) |
14,427,236 | 17,341,032 | 90,925,215 | (53,229,244 | ) | (121,152,511 | ) | |||||||||||||
| Net increase (decrease) in net asset value per share |
6.77 | 12.92 | 19.19 | (12.64 | ) | (61.39 | ) | |||||||||||||
PROSHARES SHORT EURO
| Year ended December 31, 2015 |
Year ended December 31, 2014 |
Year ended December 31, 2013 |
Year ended December 31, 2012 |
December 12, 2011 (Inception) through December 31, 2011 |
||||||||||||||||
| Total assets |
$ | 17,524,993 | $ | 14,032,932 | $ | 8,903,836 | $ | 3,804,040 | $ | 41,200 | ||||||||||
| Total shareholders’ equity at end of period |
17,510,898 | 14,021,804 | 8,896,842 | 3,763,040 | 200 | |||||||||||||||
| Net investment income (loss) |
(178,761 | ) | (118,247 | ) | (51,170 | ) | (17,891 | ) | — | |||||||||||
| Net realized and unrealized gain (loss) |
1,417,580 | 2,011,540 | (359,542 | ) | (219,269 | ) | — | |||||||||||||
| Net income (loss) |
1,238,819 | 1,893,293 | (410,712 | ) | (237,160 | ) | — | |||||||||||||
| Net increase (decrease) in net asset value per share |
3.72 | 4.48 | (2.04 | ) | (2.37 | ) | — | |||||||||||||
69
Table of Contents
PROSHARES ULTRASHORT AUSTRALIAN DOLLAR
| Year ended December 31, 2015 |
Year ended December 31, 2014 |
Year ended December 31, 2013 |
Year ended December 31, 2012 |
December 12, 2011 (Inception) through December 31, 2011 |
||||||||||||||||
| Total assets |
$ | 20,477,446 | $ | 23,139,187 | $ | 28,091,462 | $ | 3,832,949 | $ | 41,200 | ||||||||||
| Total shareholders’ equity at end of period |
20,460,679 | 23,120,790 | 27,983,279 | 3,780,999 | 200 | |||||||||||||||
| Net investment income (loss) |
(209,987 | ) | (213,183 | ) | (159,424 | ) | (16,229 | ) | — | |||||||||||
| Net realized and unrealized gain (loss) |
3,166,384 | 2,121,121 | 3,553,299 | (202,972 | ) | — | ||||||||||||||
| Net income (loss) |
2,956,397 | 1,907,938 | 3,393,875 | (219,201 | ) | — | ||||||||||||||
| Net increase (decrease) in net asset value per share |
7.08 | 4.74 | 8.83 | (2.19 | ) | — | ||||||||||||||
PROSHARES ULTRASHORT EURO
| Year ended December 31, 2015 |
Year ended December 31, 2014 |
Year ended December 31, 2013 |
Year ended December 31, 2012 |
Year ended December 31, 2011 |
||||||||||||||||
| Total assets |
$ | 556,539,359 | $ | 519,833,940 | $ | 438,217,450 | $ | 553,957,981 | $ | 1,101,007,056 | ||||||||||
| Total shareholders’ equity at end of period |
522,306,518 | 517,191,349 | 418,001,115 | 526,778,026 | 1,100,159,546 | |||||||||||||||
| Net investment income (loss) |
(5,000,587 | ) | (3,994,145 | ) | (4,375,512 | ) | (7,447,508 | ) | (5,907,849 | ) | ||||||||||
| Net realized and unrealized gain (loss) |
86,176,969 | 114,182,807 | (48,644,550 | ) | (33,586,639 | ) | 85,179,270 | |||||||||||||
| Net income (loss) |
81,176,382 | 110,188,662 | (53,020,062 | ) | (41,034,147 | ) | 79,271,421 | |||||||||||||
| Net increase (decrease) in net asset value per share |
3.95 | 4.53 | (1.96 | ) | (1.32 | ) | 0.05 | |||||||||||||
PROSHARES ULTRASHORT YEN
| Year ended December 31, 2015 |
Year ended December 31, 2014 |
Year ended December 31, 2013 |
Year ended December 31, 2012 |
Year ended December 31, 2011 |
||||||||||||||||
| Total assets |
$ | 261,207,696 | $ | 534,061,601 | $ | 590,489,940 | $ | 409,067,507 | $ | 225,676,364 | ||||||||||
| Total shareholders’ equity at end of period |
237,372,900 | 531,471,873 | 588,121,516 | 408,563,630 | 221,131,994 | |||||||||||||||
| Net investment income (loss) |
(3,623,678 | ) | (3,741,601 | ) | (4,398,231 | ) | (2,184,694 | ) | (2,642,134 | ) | ||||||||||
| Net realized and unrealized gain (loss) |
(3,541,134 | ) | 96,873,706 | 155,319,469 | 69,835,696 | (38,262,661 | ) | |||||||||||||
| Net income (loss) |
(7,164,812 | ) | 93,132,105 | 150,921,238 | 67,651,002 | (40,904,795 | ) | |||||||||||||
| Net increase (decrease) in net asset value per share |
(1.39 | ) | 18.47 | 20.11 | 9.80 | (6.06 | ) | |||||||||||||
70
Table of Contents
PROSHARES ULTRA BLOOMBERG COMMODITY
| Year ended December 31, 2015 |
Year ended December 31, 2014 |
Year ended December 31, 2013 |
Year ended December 31, 2012 |
Year ended December 31, 2011 |
||||||||||||||||
| Total assets |
$ | 7,328,066 | $ | 2,940,584 | $ | 2,917,408 | $ | 6,408,497 | $ | 9,773,138 | ||||||||||
| Total shareholders’ equity at end of period |
7,105,984 | 2,606,920 | 2,915,034 | 6,097,211 | 9,058,529 | |||||||||||||||
| Net investment income (loss) |
(33,542 | ) | (30,991 | ) | (38,477 | ) | (73,484 | ) | (145,601 | ) | ||||||||||
| Net realized and unrealized gain (loss) |
(2,805,455 | ) | (1,412,039 | ) | (933,021 | ) | (134,794 | ) | (4,514,955 | ) | ||||||||||
| Net income (loss) |
(2,838,997 | ) | (1,443,030 | ) | (971,498 | ) | (208,278 | ) | (4,660,556 | ) | ||||||||||
| Net increase (decrease) in net asset value per share |
(23.71 | ) | (25.59 | ) | (19.82 | ) | (5.97 | ) | (41.97 | ) | ||||||||||
PROSHARES ULTRA BLOOMBERG CRUDE OIL
| Year ended December 31, 2015 |
Year ended December 31, 2014 |
Year ended December 31, 2013 |
Year ended December 31, 2012 |
Year ended December 31, 2011 |
||||||||||||||||
| Total assets |
$ | 859,276,004 | $ | 532,881,413 | $ | 143,904,994 | $ | 499,982,244 | $ | 261,618,033 | ||||||||||
| Total shareholders’ equity at end of period |
783,922,475 | 450,562,988 | 142,773,429 | 483,508,964 | 251,395,322 | |||||||||||||||
| Net investment income (loss) |
(8,473,155 | ) | (1,766,364 | ) | (2,196,281 | ) | (3,248,430 | ) | (3,186,369 | ) | ||||||||||
| Net realized and unrealized gain (loss) |
(863,611,244 | ) | (368,561,922 | ) | 68,042,170 | (17,357,813 | ) | 87,943,855 | ||||||||||||
| Net income (loss) |
(872,084,399 | ) | (370,328,286 | ) | 65,845,889 | (20,606,243 | ) | 84,757,486 | ||||||||||||
| Net increase (decrease) in net asset value per share |
(38.16 | ) | (109.71 | ) | 13.48 | (57.44 | ) | (45.60 | ) | |||||||||||
PROSHARES ULTRA BLOOMBERG NATURAL GAS
| Year ended December 31, 2015 |
Year ended December 31, 2014 |
Year ended December 31, 2013 |
Year ended December 31, 2012 |
April 5, 2011 (Inception) through December 31, 2011 |
||||||||||||||||
| Total assets |
$ | 38,879,917 | $ | 80,051,311 | $ | 68,626,038 | $ | 77,963,078 | $ | 4,107,427 | ||||||||||
| Total shareholders’ equity at end of period |
38,851,184 | 70,433,207 | 62,915,779 | 73,019,370 | 4,079,349 | |||||||||||||||
| Net investment income (loss) |
(761,335 | ) | (528,581 | ) | (821,690 | ) | (566,310 | ) | (10,459 | ) | ||||||||||
| Net realized and unrealized gain (loss) |
(59,570,610 | ) | (37,694,009 | ) | 41,585,400 | (5,825,840 | ) | (2,307,329 | ) | |||||||||||
| Net income (loss) |
(60,331,945 | ) | (38,222,590 | ) | 40,763,710 | (6,392,150 | ) | (2,317,788 | ) | |||||||||||
| Net increase (decrease) in net asset value per share |
(43.08 | ) | (93.70 | ) | (0.84 | ) | (251.71 | ) | (392.08 | ) | ||||||||||
71
Table of Contents
PROSHARES ULTRA GOLD
| Year ended December 31, 2015 |
Year ended December 31, 2014 |
Year ended December 31, 2013 |
Year ended December 31, 2012 |
Year ended December 31, 2011 |
||||||||||||||||
| Total assets |
$ | 72,172,441 | $ | 104,091,956 | $ | 141,039,466 | $ | 350,986,079 | $ | 407,538,760 | ||||||||||
| Total shareholders’ equity at end of period |
69,864,815 | 102,003,345 | 132,017,405 | 335,054,752 | 326,399,360 | |||||||||||||||
| Net investment income (loss) |
(796,424 | ) | (1,157,348 | ) | (1,925,215 | ) | (3,169,265 | ) | (2,975,486 | ) | ||||||||||
| Net realized and unrealized gain (loss) |
(22,915,651 | ) | (784,329 | ) | (156,804,545 | ) | 31,641,746 | 10,169,127 | ||||||||||||
| Net income (loss) |
(23,712,075 | ) | (1,941,677 | ) | (158,729,760 | ) | 28,472,481 | 7,193,641 | ||||||||||||
| Net increase (decrease) in net asset value per share |
(10.27 | ) | (1.25 | ) | (42.51 | ) | 7.85 | 6.69 | ||||||||||||
PROSHARES ULTRA SILVER
| Year ended December 31, 2015 |
Year ended December 31, 2014 |
Year ended December 31, 2013 |
Year ended December 31, 2012 |
Year ended December 31, 2011 |
||||||||||||||||
| Total assets |
$ | 239,160,686 | $ | 305,793,515 | $ | 468,353,977 | $ | 894,123,114 | $ | 786,720,628 | ||||||||||
| Total shareholders’ equity at end of period |
216,416,642 | 291,169,743 | 465,479,519 | 747,725,400 | 606,824,420 | |||||||||||||||
| Net investment income (loss) |
(2,507,859 | ) | (3,968,608 | ) | (5,280,707 | ) | (6,918,157 | ) | (7,956,212 | ) | ||||||||||
| Net realized and unrealized gain (loss) |
(88,492,326 | ) | (165,444,157 | ) | (558,275,777 | ) | (32,752,438 | ) | (438,094,409 | ) | ||||||||||
| Net income (loss) |
(91,000,185 | ) | (169,412,765 | ) | (563,556,484 | ) | (39,670,595 | ) | (446,050,621 | ) | ||||||||||
| Net increase (decrease) in net asset value per share |
(12.31 | ) | (23.96 | ) | (108.56 | ) | (0.87 | ) | (139.81 | ) | ||||||||||
PROSHARES ULTRA EURO
| Year ended December 31, 2015 |
Year ended December 31, 2014 |
Year ended December 31, 2013 |
Year ended December 31, 2012 |
Year ended December 31, 2011 |
||||||||||||||||
| Total assets |
$ | 12,437,492 | $ | 3,089,736 | $ | 2,626,494 | $ | 4,876,503 | $ | 10,079,176 | ||||||||||
| Total shareholders’ equity at end of period |
10,857,730 | 2,981,441 | 2,603,827 | 4,870,316 | 9,554,748 | |||||||||||||||
| Net investment income (loss) |
(104,071 | ) | (22,247 | ) | (35,024 | ) | (60,126 | ) | (75,102 | ) | ||||||||||
| Net realized and unrealized gain (loss) |
(1,274,395 | ) | (625,043 | ) | 224,084 | 207,279 | (512,495 | ) | ||||||||||||
| Net income (loss) |
(1,378,466 | ) | (647,290 | ) | 189,060 | 147,153 | (587,597 | ) | ||||||||||||
| Net increase (decrease) in net asset value per share |
(4.36 | ) | (6.16 | ) | 1.68 | 0.46 | (1.87 | ) | ||||||||||||
PROSHARES ULTRA YEN
| Year ended December 31, 2015 |
Year ended December 31, 2014 |
Year ended December 31, 2013 |
Year ended December 31, 2012 |
Year ended December 31, 2011 |
||||||||||||||||
| Total assets |
$ | 5,483,876 | $ | 2,135,192 | $ | 2,960,724 | $ | 4,739,474 | $ | 5,475,400 | ||||||||||
| Total shareholders’ equity at end of period |
5,473,848 | 2,118,028 | 2,795,026 | 4,227,995 | 5,471,075 | |||||||||||||||
| Net investment income (loss) |
(44,423 | ) | (20,862 | ) | (31,774 | ) | (44,440 | ) | (39,572 | ) | ||||||||||
| Net realized and unrealized gain (loss) |
(196,091 | ) | (396,529 | ) | (1,544,017 | ) | (1,198,640 | ) | 383,849 | |||||||||||
| Net income (loss) |
(240,514 | ) | (417,391 | ) | (1,575,791 | ) | (1,243,080 | ) | 344,277 | |||||||||||
| Net increase (decrease) in net asset value per share |
(1.72 | ) | (18.05 | ) | (38.21 | ) | (33.15 | ) | 11.91 | |||||||||||
72
Table of Contents
Item 7. Management’s Discussion and Analysis of Financial Condition and Results of Operations.
This information should be read in conjunction with the financial statements and notes to the financial statements included with this Annual Report on Form 10-K. The discussion and analysis that follows may contain statements that relate to future events or future performance. In some cases, such forward-looking statements can be identified by terminology such as “will,” “may,” “should,” “expect,” “plan,” “anticipate,” “believe,” “estimate,” “predict,” “potential” or the negative of these terms or other comparable terminology. None of the Trust, the Sponsor or the Trustee assumes responsibility for the accuracy or completeness of any forward-looking statements. Except as expressly required by federal securities laws, none of the Trust, the Sponsor or the Trustee is under a duty to update any of the forward-looking statements to conform such statements to actual results or to a change in expectations or predictions.
Introduction
As further described in Item 1 in this Annual Report on Form 10-K, each “Short” Fund seeks daily investment results (before fees and expenses) that correspond to the inverse (-1x) of the daily performance of its corresponding benchmark. Each “UltraShort” Fund seeks daily investment results (before fees and expenses) that correspond to two times the inverse (-2x) of the daily performance of its corresponding benchmark. Each “Ultra” Fund seeks daily investment results (before fees and expenses) that correspond to two times (2x) the daily performance of its corresponding benchmark. Each Matching VIX Fund and the Managed Futures Fund seeks investment results (before fees and expenses), both over a single day and over time, that match the performance of its corresponding benchmark. Daily performance is measured from the calculation of one NAV to the next.
Each of the Funds generally invests in Financial Instruments (i.e., instruments whose value is derived from the value of an underlying asset, rate or index), including futures contracts, swap agreements, forward contracts and other instruments as a substitute for investing directly in commodities, currencies, or spot volatility products in order to gain exposure to its applicable underlying commodity futures index, commodity, currency exchange rate or equity volatility index. Financial Instruments also are used to produce economically “inverse,” “inverse leveraged” or “leveraged” investment results for the Geared Funds.
Each Geared Fund seeks investment results for a single day only, not for longer periods. This is different from most exchange-traded funds and means that the return of such Fund for a period longer than a single trading day will be the result of each day’s returns compounded over the period, and usually will differ from -1x, -2x or 2x, of the return of the Geared Fund’s benchmark for that period. Longer holding periods, higher benchmark volatility, inverse exposure and greater leverage each affect the impact of compounding on a Geared Fund’s returns. Daily compounding of a Geared Fund’s investment returns can dramatically and adversely affect its longer-term performance during periods of high volatility. Geared Funds are riskier than similarly benchmarked exchange-traded funds that are not geared. Accordingly, these funds may not be suitable for all investors and should be used only by knowledgeable investors who understand the potential consequences of seeking daily, leveraged, inverse or inverse leveraged investment results. Shareholders who invest in the Geared Funds should actively manage and monitor their investments, as frequently as daily.
The Matching VIX Funds seek results that, both over a single day and over time, match (before fees and expenses) the performance of its index. If the Matching VIX Fund is successful in meeting its objective, its value (before fees and expenses) should gain approximately as much on a percentage basis as the level of the applicable VIX Futures Index when the index rises. Conversely, its value (before fees and expenses) should lose approximately as much on a percentage basis as the level of the applicable VIX Futures Index when the index declines. The Matching VIX Funds seeks to obtain investment exposure to its benchmark through the relevant futures contracts.
The Managed Futures Fund seeks results that, both over a single day and over time, match (before fees and expenses) the performance of its index. If the Managed Futures Fund is successful in meeting its objective, its value (before fees and expenses) should gain approximately as much on a percentage basis as the level of the S&P Strategic Futures Index when the index rises. Conversely, its value (before fees and expenses) should lose approximately as much on a percentage basis as the level of the S&P Strategic Futures Index when the index declines. The Managed Futures Fund attempts to profit in both rising and falling markets by obtaining investment exposure to its benchmark through the relevant futures contracts.
73
Table of Contents
Liquidity and Capital Resources
In order to collateralize derivatives positions in indices, commodities or currencies, a significant portion of the NAV of each Fund is held in cash and/or U.S. Treasury securities, agency securities, or other high credit quality short-term fixed-income or similar securities (such as shares of money market funds, bank deposits, bank money market accounts, certain variable rate-demand notes and repurchase agreements collateralized by government securities, whether denominated in U.S. dollars or the applicable foreign currency with respect to a Currency Fund). A portion of these investments may be posted as collateral in connection with swap agreements and each Fund’s trading in futures and forward contracts. The percentage that U.S. Treasury bills and other short-term fixed-income securities bear to the shareholders’ equity of each Fund varies from period to period as the market values of the underlying swaps, futures contracts and forward contracts change. During the years ended December 31, 2015, 2014 and 2013, each of the Funds earned interest income as follows:
Interest Income
| Fund |
Interest Income Year Ended December 31, 2015 |
Interest Income Year Ended December 31, 2014 |
Interest Income Year Ended December 31, 2013 |
|||||||||
| ProShares Managed Futures Strategy* |
$ | — | $ | — | $ | N/A | ||||||
| ProShares VIX Short-Term Futures ETF |
42,319 | 47,562 | 77,010 | |||||||||
| ProShares VIX Mid-Term Futures ETF |
8,293 | 16,573 | 25,811 | |||||||||
| ProShares Short VIX Short-Term Futures ETF |
180,686 | 81,544 | 36,503 | |||||||||
| ProShares Ultra VIX Short-Term Futures ETF |
156,187 | 72,700 | 70,016 | |||||||||
| ProShares UltraShort Bloomberg Commodity |
2,698 | 1,232 | 1,899 | |||||||||
| ProShares UltraShort Bloomberg Crude Oil |
60,884 | 110,620 | 113,487 | |||||||||
| ProShares UltraShort Bloomberg Natural Gas |
5,830 | 16,306 | 8,620 | |||||||||
| ProShares UltraShort Gold |
31,999 | 40,675 | 61,891 | |||||||||
| ProShares UltraShort Silver |
23,831 | 30,901 | 60,178 | |||||||||
| ProShares Short Euro |
4,504 | 4,716 | 1,996 | |||||||||
| ProShares UltraShort Australian Dollar |
5,998 | 8,225 | 5,653 | |||||||||
| ProShares UltraShort Euro |
264,845 | 199,596 | 224,967 | |||||||||
| ProShares UltraShort Yen |
135,814 | 197,253 | 209,601 | |||||||||
| ProShares Ultra Bloomberg Commodity |
733 | 1,330 | 2,066 | |||||||||
| ProShares Ultra Bloomberg Crude Oil |
396,158 | 68,292 | 135,291 | |||||||||
| ProShares Ultra Bloomberg Natural Gas |
20,167 | 15,961 | 33,341 | |||||||||
| ProShares Ultra Gold |
42,700 | 54,755 | 130,437 | |||||||||
| ProShares Ultra Silver |
156,353 | 179,642 | 348,317 | |||||||||
| ProShares Ultra Euro |
2,797 | 1,083 | 1,901 | |||||||||
| ProShares Ultra Yen |
3,609 | 1,101 | 1,795 | |||||||||
| * | Fund commenced investment operations on October 1, 2014. |
Each Fund’s underlying swaps, futures, forward contracts and foreign currency forward contracts, as applicable, may be subject to periods of illiquidity because of market conditions, regulatory considerations and other reasons. For example, swaps and forward contracts are not traded on an exchange, do not have uniform terms and conditions, and in general are not transferable without the consent of the counterparty. In the case of futures contracts, commodity exchanges may limit fluctuations in certain futures contract prices during a single day by regulations referred to as “daily limits.” During a single day, no futures trades may be executed at prices beyond the daily limit. Once the price of a futures contract has increased or decreased by an amount equal to the daily limit, positions in such futures contracts can neither be taken nor liquidated unless the traders are willing to effect trades at or within the limit. Futures contract prices have occasionally moved to the daily limit for several consecutive days with little or no trading. Such market conditions could prevent a Fund from promptly liquidating its futures positions.
Entry into swap agreements or forward contracts may further impact liquidity because these contractual agreements are executed “off-exchange” between private parties and, therefore, the time required to offset or “unwind” these positions may be greater than that for exchange-traded instruments. This potential delay could be exacerbated to the extent a counterparty is not a United States person.
74
Table of Contents
The large size of the positions in which a Fund may acquire increases the risk of illiquidity by both making their positions more difficult to liquidate and increasing the losses incurred while trying to do so. Any type of disruption or illiquidity will potentially be exacerbated due to the fact that the Funds will typically invest in Financial Investments related to one benchmark, which in many cases is highly concentrated.
Because each Fund may enter into swaps and may trade futures and forward contracts, its capital is at risk due to changes in the value of these contracts (market risk) or the inability of counterparties to perform under the terms of the contracts (credit risk).
Market Risk
Trading in derivatives contracts involves each Fund entering into contractual commitments to purchase or sell a commodity, currency or spot volatility product underlying the Fund’s benchmark at a specified date and price, should it hold such derivatives contract into the deliverable period. Should a Fund enter into a contractual commitment to sell a physical commodity, currency or spot volatility product, it would be required to make delivery of that commodity, currency or spot volatility product at the contract price and then repurchase the contract at prevailing market prices or settle in cash. Since the repurchase price to which the value of a commodity, currency or spot volatility product can rise is unlimited, entering into commitments to sell commodities, currencies or spot volatility products would expose a Fund to theoretically unlimited risk.
For more information, see “Item 7A. Quantitative and Qualitative Disclosures About Market Risk” in this Annual Report on Form 10-K.
Credit Risk
When a Fund enters into swap agreements, futures contracts or forward contracts, the Fund is exposed to credit risk that the counterparty to the contract will not meet its obligations.
The counterparty for futures contracts traded on United States and most foreign futures exchanges as well as certain swaps is the clearing house associated with the particular exchange. In general, clearing houses are backed by their corporate members who may be required to share in the financial burden resulting from the nonperformance by one of their members and, as such, should significantly reduce this credit risk. In cases where the clearing house is not backed by the clearing members (i.e., some foreign exchanges, which may become applicable in the future), it may be backed by a consortium of banks or other financial institutions.
Certain swap and forward agreements are contracted for directly with counterparties. There can be no assurance that any counterparty, clearing member or clearing house will meet its obligations to a Fund.
Swap agreements do not generally involve the delivery of underlying assets either at the outset of a transaction or upon settlement. Accordingly, if the counterparty to an uncleared swap agreement defaults, the Fund’s risk of loss typically consists of the net amount of payments that the Fund is contractually entitled to receive, if any. Swap counterparty risk is generally limited to the amount of any unrealized gains, although in the event of a counterparty bankruptcy, there could be delays and costs associated with recovery collateral posted in segregated tri-party accounts at the Fund’s custodian bank.
Forward agreements do not involve the delivery of assets at the onset of a transaction, but may be settled physically in the underlying asset if such contracts are held to expiration, particularly in the case of currency forwards. Thus, prior to settlement, if the counterparty to a forward contract defaults, a Fund’s risk of loss will generally consist of the net amount of payments that the Fund is contractually entitled to receive, if any. However, if physically settled forwards are held until expiration (presently, there is no plan to do this), at the time of settlement, a Fund may be at risk for the full notional value of the forward contracts depending on the type of settlement procedures used.
75
Table of Contents
The Sponsor attempts to minimize certain of these market and credit risks by normally:
| • | executing and clearing trades with creditworthy counterparties, as determined by the Sponsor; |
| • | limiting the outstanding amounts due from counterparties to the Funds; |
| • | not posting margin directly with a counterparty; |
| • | requiring that the counterparty posts collateral in amounts approximately equal to that owed to the Funds, as marked to market daily, subject to certain minimum thresholds; |
| • | limiting the amount of margin or premium posted at a futures commission merchant (“FCM”); and |
| • | ensuring that deliverable contracts are not held to such a date when delivery of the underlying asset could be called for. |
Off-Balance Sheet Arrangements and Contractual Obligations
As of February 22, 2016, the Funds have not used, nor do they expect to use in the future, special purpose entities to facilitate off-balance sheet financing arrangements and have no loan guarantee arrangements or off-balance sheet arrangements of any kind other than agreements entered into in the normal course of business, which may include indemnification provisions related to certain risks service providers undertake in performing services which are in the best interests of the Funds. While each Fund’s exposure under such indemnification provisions cannot be estimated, these general business indemnifications are not expected to have a material impact on a Fund’s financial position.
Management fee payments made to the Sponsor are calculated as a fixed percentage of each Fund’s NAV. As such, the Sponsor cannot anticipate the amount of payments that will be required under these arrangements for future periods as NAVs are not known until a future date. The agreement with the Sponsor may be terminated by either party upon 30 days written notice to the other party.
Critical Accounting Policies
The Trust’s and the Funds’ critical accounting policies are as follows:
Preparation of the financial statements and related disclosures in compliance with accounting principles generally accepted in the United States of America requires the application of appropriate accounting rules and guidance, as well as the use of estimates. The Trust’s and the Funds’ application of these policies involves judgments and actual results may differ from the estimates used.
Each Fund has significant exposure to Financial Instruments. The Funds hold a significant portion of their assets in swaps, futures, forward contracts or foreign currency forward contracts, all of which are recorded on a trade date basis and at fair value in the financial statements, with changes in fair value reported in the Statements of Operations.
The use of fair value to measure Financial Instruments, with related unrealized gains or losses recognized in earnings in each period, is fundamental to the Trust’s and the Funds’ financial statements. The fair value of a Financial Instrument is the amount that would be received to sell an asset or paid to transfer a liability in an orderly transaction between market participants at the measurement date (the exit price).
For financial reporting purposes, the Funds value transactions based upon the final closing price in their primary markets. Accordingly, the investment valuations in these financial statements may differ from those used in the calculation of certain Funds’ final creation/redemption NAV for the year ended December 31, 2015.
Short-term investments are valued at amortized cost which approximates fair value for daily NAV purposes. For financial reporting purposes, short-term investments are valued at their market price using information provided by a third-party pricing service or market quotations.
76
Table of Contents
Derivatives (e.g., futures contracts, swap agreements, forward agreements and foreign currency forward contracts) are generally valued using independent sources and/or agreements with counterparties or other procedures as determined by the Sponsor. Futures contracts, except for those entered into by the Gold, Silver, Australian Dollar and Short Euro Funds, are generally valued at the last settled price on the applicable exchange on which that future trades. Futures contracts entered into by the Gold, Silver, Australian Dollar and Short Euro Funds are valued at the last sales price prior to the time at which the NAV per Share of a Fund is determined. For financial reporting purposes, all futures contracts are valued at last settled price. If there was no sale on that day, and for non-exchange-traded derivatives, the Sponsor may in its sole discretion choose to determine a fair value price as the basis for determining the market value of such position for such day. Such fair value prices would be generally determined based on available inputs about the current value of the underlying financial instrument or commodity and would be based on principles that the Sponsor deems fair and equitable so long as such principles are consistent with normal industry standards. When market closing prices are not available, the Sponsor may fair value an asset of a Fund pursuant to the policies the Sponsor has adopted, which are consistent with normal industry standards.
Fair value pricing may require subjective determinations about the value of an investment. While each Leveraged and VIX Fund’s policy is intended to result in a calculation of the Leveraged or the VIX Fund’s NAV that fairly reflects investment values as of the time of pricing, the Leveraged and the VIX Funds cannot ensure that fair values determined by the Sponsor or persons acting at their direction would accurately reflect the price that the Leveraged or the VIX Fund could obtain for an investment if it were to dispose of that investment as of the time of pricing (for instance, in a forced or distressed sale). The prices used by the Leveraged or the VIX Fund may differ from the value that would be realized if the investments were sold and the differences could be material to the financial statements.
The Funds disclose the fair value of their investments in a hierarchy that prioritizes the inputs to valuation techniques used to measure fair value. See Note 2 in the Financial Statements in this Annual Report on Form 10-K for further information.
Discounts on short-term securities purchased are amortized and reflected as Interest Income in the Statements of Operations.
Realized gains (losses) and changes in unrealized gain (loss) on open positions are determined on a specific identification basis and recognized in the Statements of Operations in the period in which the contract is closed or the changes occur, respectively.
Each Fund pays its respective brokerage commissions, including applicable exchange fees, NFA fees, give-up fees, pit brokerage fees and other transaction related fees and expenses charged in connection with trading activities for each Fund’s investment in U.S. Commodity Futures Trading Commission regulated investments. Brokerage commissions on futures contracts are recognized on a half-turn basis. Through July 30, 2014, the Sponsor paid brokerage commissions on VIX futures contracts for the Matching VIX Funds. On July 31, 2014, the Sponsor began paying, and is currently paying, brokerage commissions on VIX futures contracts for the Matching VIX Funds that exceed variable create/redeem fees collected by more than 0.02% of the Matching VIX Fund’s average net assets annually.
Results of Operations for the Year Ended December 31, 2015 Compared to the Years Ended December 31, 2014 and 2013
ProShares Managed Futures Strategy
Since the Fund commenced investment operations on October 1, 2014, the Fund’s results of operations for the period ended December 31, 2014 may not be meaningful.
Fund Performance
The following table provides summary performance information for the Fund for the year ended December 31, 2015 and from commencement of operations to December 31, 2015:
77
Table of Contents
| Year Ended December 31, 2015 |
October 1, 2014 (Commencement of Operations) through December 31, 2014 |
|||||||
| NAV beginning of period |
$ | 6,340,845 | $ | 200 | ||||
| NAV end of period |
$ | 7,187,022 | $ | 6,340,845 | ||||
| Percentage change in NAV |
13.3 | % | 3,170,322.5 | % | ||||
| Shares outstanding beginning of period |
300,010 | 10 | ||||||
| Shares outstanding end of period |
350,010 | 300,010 | ||||||
| Percentage change in shares outstanding |
16.7 | % | 3,000,000.0 | % | ||||
| Shares created |
550,000 | 400,000 | ||||||
| Shares redeemed |
500,000 | 100,000 | ||||||
| Per share NAV beginning of period |
$ | 21.14 | $ | 20.00 | ||||
| Per share NAV end of period |
$ | 20.53 | $ | 21.14 | ||||
| Percentage change in per share NAV |
(2.9 | )% | 5.7 | % | ||||
| Percentage change in benchmark |
(2.0 | )% | 5.2 | % | ||||
| Benchmark annualized volatility |
5.3 | % | 5.9 | % | ||||
During the period ended December 31, 2015, the increase in the Fund’s NAV resulted from an increase from 300,010 outstanding Shares at December 31, 2014 to 350,010 outstanding Shares at December 31, 2015. The increase in the Fund’s NAV was offset by the cumulative effect of the Fund seeking daily investment results (before fees and expenses) that correspond to the daily performance of the S&P Strategic Futures Index. By comparison, during the period ended December 31, 2014, the increase in the Fund’s NAV resulted primarily from 10 outstanding Shares at October 1, 2014 to 300,010 outstanding Shares at December 31, 2014. The increase in the Fund’s NAV also resulted in part from the cumulative effect of the Fund seeking daily investment results (before fees and expenses) that correspond to the daily performance of the S&P Strategic Futures Index.
For the period ended December 31, 2015, the Fund’s daily performance had a statistical correlation over 0.99 of the daily performance of its benchmark. The Fund’s per Share NAV decrease of 2.9% for the year ended December 31, 2015, as compared to the Fund’s per Share NAV increase of 5.7% for the period ended December 31, 2014, was primarily due to depreciation in the value of the futures contracts that make up the S&P Strategic Futures Index during the period ended December 31, 2015.
During the period ended December 31, 2015, the Fund’s per Share NAV reached its high for the period on January 29, 2015 at $21.88 per Share and reached its low for the period on October 9, 2015 at $20.20 per Share. By comparison, during the period ended December 31, 2014, the Fund’s per Share NAV reached its high for the period on December 29, 2014 at $21.16 per Share and reached its low for the period on October 7, 2014 at $19.89 per Share.
The benchmark’s decline of 2.0% for the year ended December 31, 2015, as compared to the benchmark’s rise of 5.2% for the period ended December 31, 2014, can be attributed to depreciation in value of the futures contracts that make up the S&P Strategic Futures Index during the period ended December 31, 2015.
Net Income/Loss
The following table provides summary income information for the Fund for the year ended December 31, 2015 and the period from commencement of operations to December 31, 2014:
| Year Ended December 31, 2015 |
October 1, 2014 (Commencement of Operations) through December 31, 2014 |
|||||||
| Net investment income (loss) |
$ | (71,554 | ) | $ | (7,531 | ) | ||
| Management fee |
16,121 | — | ||||||
| Brokerage commission |
7,768 | 604 | ||||||
| Offering costs |
59,479 | 16,401 | ||||||
| Limitation by Sponsor |
(11,814 | ) | (9,474 | ) | ||||
| Net realized gain (loss) |
(278,197 | ) | 109,006 | |||||
| Change in net unrealized appreciation/depreciation |
(47,148 | ) | 104,327 | |||||
| Net income (loss) |
$ | (396,899 | ) | $ | 205,802 | |||
78
Table of Contents
The Fund’s net income decreased for the year ended December 31, 2015, as compared to the year ended December 31, 2014, primarily due to a decline in the futures prices during the year ended December 31, 2015.
ProShares VIX Short-Term Futures ETF
Fund Performance
The following table provides summary performance information for the Fund for the years ended December 31, 2015, 2014 and 2013:
| Year Ended December 31, 2015 |
Year Ended December 31, 2014 |
Year Ended December 31, 2013 |
||||||||||
| NAV beginning of period |
$ | 111,459,325 | $ | 270,398,554 | $ | 137,657,464 | ||||||
| NAV end of period |
$ | 105,272,823 | $ | 111,459,325 | $ | 270,398,554 | ||||||
| Percentage change in NAV |
(5.6 | )% | (58.8 | )% | 96.4 | % | ||||||
| Shares outstanding beginning of period |
5,324,812 | 9,474,812 | 1,640,001 | |||||||||
| Shares outstanding end of period |
7,949,812 | 5,324,812 | 9,474,812 | |||||||||
| Percentage change in shares outstanding |
49.3 | % | (43.8 | )% | 477.7 | % | ||||||
| Shares created |
12,475,000 | 10,575,000 | 16,095,000 | |||||||||
| Shares redeemed |
9,850,000 | 14,725,000 | 8,260,189 | |||||||||
| Per share NAV beginning of period |
$ | 20.93 | $ | 28.54 | $ | 83.94 | ||||||
| Per share NAV end of period |
$ | 13.24 | $ | 20.93 | $ | 28.54 | ||||||
| Percentage change in per share NAV |
(36.7 | )% | (26.7 | )% | (66.0 | )% | ||||||
| Percentage change in benchmark |
(36.1 | )% | (25.5 | )% | (65.7 | )% | ||||||
| Benchmark annualized volatility |
78.6 | % | 61.4 | % | 57.9 | % | ||||||
During the year ended December 31, 2015, the decrease in the Fund’s NAV resulted from the cumulative effect of the Fund seeking daily investment results (before fees and expenses) that correspond to the daily performance of the S&P 500 VIX Short-Term Futures Index. The decrease in the Fund’s NAV was offset by an increase from 5,324,812 outstanding Shares at December 31, 2014 to 7,949,812 outstanding Shares at December 31, 2015. By comparison, during the year ended December 31, 2014, the decrease in the Fund’s NAV resulted primarily from a decrease from 9,474,812 outstanding Shares at December 31, 2013 to 5,324,812 outstanding Shares at December 31, 2014. The decrease in the Fund’s NAV also resulted in part from the cumulative effect of the Fund seeking daily investment results (before fees and expenses) that correspond to the daily performance of the S&P 500 VIX Short-Term Futures Index. By comparison, during the year ended December 31, 2013, the increase in the Fund’s NAV resulted from an increase from 1,640,001 outstanding Shares at December 31, 2012 to 9,474,812 outstanding Shares at December 31, 2013. The increase in the Fund’s NAV was offset by the cumulative effect of the Fund seeking daily investment results (before fees and expenses) that correspond to the daily performance of the S&P 500 VIX Short-Term Futures Index.
For the years ended December 31, 2015, 2014 and 2013, the Fund’s daily performance had a statistical correlation over 0.99 of the daily performance of its benchmark. The Fund’s per Share NAV decrease of 36.7% for the year ended December 31, 2015, as compared to the Fund’s per Share NAV decrease of 26.7% for the year ended December 31, 2014, was primarily due to a greater decline in prices of the first and second month VIX futures during the year ended December 31, 2015. The Fund’s per Share NAV decrease of 26.7% for the year ended December 31, 2014, as compared to the Fund’s per Share NAV decrease of 66.0% for the year ended December 31, 2013, was primarily due to a lesser decline in prices of the first and second month VIX futures during the year ended December 31, 2014.
79
Table of Contents
During the year ended December 31, 2015, the Fund’s per Share NAV reached its high for the year on January 15, 2015 at $24.15 per Share and reached its low for the year on August 10, 2015 at $10.35 per Share. By comparison, during the year ended December 31, 2014, the Fund’s per Share NAV reached its high for the year on February 5, 2014 at $36.25 per Share and reached its low for the year on December 5, 2014 at $17.25 per Share. By comparison, during the year ended December 31, 2013, the Fund’s per Share NAV reached its high for the year on January 3, 2013 at $76.11 per Share and reached its low for the year on December 26, 2013 at $27.63 per Share.
The benchmark’s decline of 36.1% for the year ended December 31, 2015, as compared to the benchmark’s decline of 25.5% for the year ended December 31, 2014, can be attributed to a greater decline in prices of the near-term futures contracts on the VIX futures curve during the year ended December 31, 2015. The benchmark’s decline of 25.5% for the year ended December 31, 2014, as compared to the benchmark’s decline of 65.7% for the year ended December 31, 2013, can be attributed to a lesser decline in prices of the near-term futures contracts on the VIX futures curve during the year ended December 31, 2014.
Net Income/Loss
The following table provides summary income information for the Fund for the years ended December 31, 2015, 2014 and 2013:
| Year Ended December 31, 2015 |
Year Ended December 31, 2014 |
Year Ended December 31, 2013 |
||||||||||
| Net investment income (loss) |
$ | (1,150,794 | ) | $ | (1,118,548 | ) | $ | (1,584,119 | ) | |||
| Management fee |
1,062,171 | 1,083,189 | 1,661,129 | |||||||||
| Brokerage commission |
130,942 | 82,921 | — | |||||||||
| Net realized gain (loss) |
(19,406,840 | ) | (682,105 | ) | (144,624,652 | ) | ||||||
| Change in net unrealized appreciation/depreciation |
(7,346,902 | ) | 22,911,077 | (16,426,828 | ) | |||||||
| Net income (loss) |
$ | (27,904,536 | ) | $ | 21,110,424 | $ | (162,635,599 | ) | ||||
The Fund’s net income decreased for the year ended December 31, 2015, as compared to the year ended December 31, 2014, primarily due to a greater decline in the futures prices and benchmark volatility during the year ended December 31, 2015. By comparison, the Fund’s net income increased for the year ended December 31, 2014, as compared to the year ended December 31, 2013, primarily due to a lesser decline in the futures prices in conjunction with an increase in Share turnover and benchmark volatility during the year ended December 31, 2014.
ProShares VIX Mid-Term Futures ETF
Fund Performance
The following table provides summary performance information for the Fund for the years ended December 31, 2015, 2014 and 2013:
| Year Ended December 31, 2015 |
Year Ended December 31, 2014 |
Year Ended December 31, 2013 |
||||||||||
| NAV beginning of period |
$ | 21,459,575 | $ | 51,134,323 | $ | 37,302,992 | ||||||
| NAV end of period |
$ | 27,650,638 | $ | 21,459,575 | $ | 51,134,323 | ||||||
| Percentage change in NAV |
28.8 | % | (58.0 | )% | 37.1 | % | ||||||
| Shares outstanding beginning of period |
337,404 | 662,501 | 268,751 | |||||||||
| Shares outstanding end of period |
512,404 | 337,404 | 662,501 | |||||||||
| Percentage change in shares outstanding |
51.9 | % | (49.1 | )% | 146.5 | % | ||||||
| Shares created |
325,000 | 593,750 | 1,512,500 | |||||||||
| Shares redeemed |
150,000 | 918,847 | 1,118,750 | |||||||||
| Per share NAV beginning of period |
$ | 63.60 | $ | 77.18 | $ | 138.80 | ||||||
| Per share NAV end of period |
$ | 53.96 | $ | 63.60 | $ | 77.18 | ||||||
| Percentage change in per share NAV |
(15.2 | )% | (17.6 | )% | (44.4 | )% | ||||||
| Percentage change in benchmark |
(14.3 | )% | (16.5 | )% | (43.8 | )% | ||||||
| Benchmark annualized volatility |
38.8 | % | 29.1 | % | 25.1 | % | ||||||
80
Table of Contents
During the year ended December 31, 2015, the increase in the Fund’s NAV resulted from an increase from 337,404 outstanding Shares at December 31, 2014 to 512,404 outstanding Shares at December 31, 2015. The increase in the Fund’s NAV was offset by the cumulative effect of the Fund seeking daily investment results (before fees and expenses) that correspond to the daily performance of the S&P 500 VIX Mid-Term Futures Index. By comparison, during the year ended December 31, 2014, the decrease in the Fund’s NAV resulted primarily from a decrease from 662,501 outstanding Shares at December 31, 2013 to 337,404 outstanding Shares at December 31, 2014. The decrease in the Fund’s NAV also resulted in part from the cumulative effect of the Fund seeking daily investment results (before fees and expenses) that correspond to the daily performance of the S&P 500 VIX Mid-Term Futures Index. By comparison, during the year ended December 31, 2013, the increase in the Fund’s NAV resulted from an increase from 268,751 outstanding Shares at December 31, 2012 to 662,501 outstanding Shares at December 31, 2013. The increase in the Fund’s NAV was offset by the cumulative effect of the Fund seeking daily investment results (before fees and expenses) that correspond to the daily performance of the S&P 500 VIX Mid-Term Futures Index.
For the years ended December 31, 2015, 2014 and 2013, the Fund’s daily performance had a statistical correlation over 0.99 of the daily performance of its benchmark. The Fund’s per Share NAV decrease of 15.2% for the year ended December 31, 2015, as compared to the Fund’s per Share NAV decrease of 17.6% for the year ended December 31, 2014, was primarily due to a lesser depreciation in the value of the assets of the Fund during the year ended December 31, 2015. The Fund’s per Share NAV decrease of 17.6% for the year ended December 31, 2014, as compared to the Fund’s per Share NAV decrease of 44.4% for the year ended December 31, 2013, was primarily due to a lesser depreciation in the value of the assets of the Fund during the year ended December 31, 2014.
During the year ended December 31, 2015, the Fund’s per Share NAV reached its high for the year on September 1, 2015 at $69.30 per Share and reached its low for the year on August 10, 2015 at $49.68 per Share. By comparison, during the year ended December 31, 2014, the Fund’s per Share NAV reached its high for the year on February 5, 2014 at $85.56 per Share and reached its low for the year on August 19, 2014 at $58.76 per Share. By comparison, during the year ended December 31, 2013, the Fund’s per Share NAV reached its high for the year on January 3, 2013 at $129.47 per Share and reached its low for the year on December 26, 2013 at $77.03 per Share.
The benchmark’s decline of 14.3 % for the year ended December 31, 2015, as compared to the benchmark’s decline of 16.5% for the year ended December 31, 2014, can be attributed to a lesser decline in prices of the futures contracts that made up the S&P 500 VIX Mid-Term Futures Index during the year ended December 31, 2015. By comparison, the benchmark’s decline of 16.5% for the year ended December 31, 2014, as compared to the benchmark’s decline of 43.8% for the year ended December 31, 2013, can be attributed to a lesser decline in prices of the futures contracts that made up the S&P 500 VIX Mid-Term Futures Index during the year ended December 31, 2014.
Net Income/Loss
The following table provides summary income information for the Fund for the years ended December 31, 2015, 2014 and 2013:
| Year Ended December 31, 2015 |
Year Ended December 31, 2014 |
Year Ended December 31, 2013 |
||||||||||
| Net investment income (loss) |
$ | (240,600 | ) | $ | (386,478 | ) | $ | (546,566 | ) | |||
| Management fee |
233,390 | 392,120 | 572,377 | |||||||||
| Brokerage commission |
15,503 | 10,931 | — | |||||||||
| Net realized gain (loss) |
(3,334,581 | ) | (14,377,068 | ) | (28,219,941 | ) | ||||||
| Change in net unrealized appreciation/depreciation |
(605,352 | ) | 5,157,541 | (3,428,310 | ) | |||||||
| Net income (loss) |
$ | (4,180,533 | ) | $ | (9,606,005 | ) | $ | (32,194,817 | ) | |||
The Fund’s net income increased for the year ended December 31, 2015, as compared to the year ended December 31, 2014, primarily due to a lesser decline in futures prices during the year ended December 31, 2015. By comparison, the Fund’s net income increased for the year ended December 31, 2014, as compared to the year ended December 31, 2013, primarily due to a lesser decline in futures prices during the year ended December 31, 2014.
81
Table of Contents
ProShares Short VIX Short-Term Futures ETF
Fund Performance
The following table provides summary performance information for the Fund for the years ended December 31, 2015, 2014 and 2013:
| Year Ended December 31, 2015 |
Year Ended December 31, 2014 |
Year Ended December 31, 2013 |
||||||||||
| NAV beginning of period |
$ | 506,556,124 | $ | 141,751,202 | $ | 82,663,633 | ||||||
| NAV end of period |
$ | 642,811,361 | $ | 506,556,124 | $ | 141,751,202 | ||||||
| Percentage change in NAV |
26.9 | % | 257.4 | % | 71.5 | % | ||||||
| Shares outstanding beginning of period |
8,250,040 | 2,100,040 | 2,500,040 | |||||||||
| Shares outstanding end of period |
12,650,040 | 8,250,040 | 2,100,040 | |||||||||
| Percentage change in shares outstanding |
53.3 | % | 292.9 | % | (16.0 | )% | ||||||
| Shares created |
24,100,000 | 16,100,000 | 11,500,000 | |||||||||
| Shares redeemed |
19,700,000 | 9,950,000 | 11,900,000 | |||||||||
| Per share NAV beginning of period |
$ | 61.40 | $ | 67.50 | $ | 33.06 | ||||||
| Per share NAV end of period |
$ | 50.81 | $ | 61.40 | $ | 67.50 | ||||||
| Percentage change in per share NAV |
(17.2 | )% | (9.0 | )% | 104.2 | % | ||||||
| Percentage change in benchmark |
(36.1 | )% | (25.5 | )% | (65.7 | )% | ||||||
| Benchmark annualized volatility |
78.6 | % | 61.4 | % | 57.9 | % | ||||||
During the year ended December 31, 2015, the increase in the Fund’s NAV resulted from an increase from 8,250,040 outstanding Shares at December 31, 2014 to 12,650,040 outstanding Shares at December 31, 2015. The increase in the Fund’s NAV also resulted from the cumulative effect of the Fund seeking daily investment results (before fees and expenses) that correspond to the inverse of the daily performance of the S&P 500 VIX Short-Term Futures Index. By comparison, during the year ended December 31, 2014, the increase in the Fund’s NAV resulted from an increase from 2,100,040 outstanding Shares at December 31, 2013 to 8,250,040 outstanding Shares at December 31, 2014. The increase in the Fund’s NAV also resulted from the cumulative effect of the Fund seeking daily investment results (before fees and expenses) that correspond to the inverse of the daily performance of the S&P 500 VIX Short-Term Futures Index. By comparison, during the year ended December 31, 2013, the increase in the Fund’s NAV resulted from the cumulative effect of the Fund seeking daily investment results (before fees and expenses) that correspond to the inverse of the daily performance of the S&P 500 VIX Short-Term Futures Index. The increase in the Fund’s NAV was offset by a decrease from 2,500,040 outstanding Shares at December 31, 2012 to 2,100,040 outstanding Shares at December 31, 2013.
For the years ended December 31, 2015, 2014 and 2013, the Fund’s daily performance had a statistical correlation over 0.99 of the inverse of the daily performance of its benchmark. The Fund’s per Share NAV decrease of 17.2% for the year ended December 31, 2015, as compared to the Fund’s per Share NAV decrease of 9.0% for the year ended December 31, 2014, was primarily due to a greater decline in prices of the first and second month VIX futures during the year ended December 31, 2015. The Fund’s per Share NAV decrease of 9.0% for the year ended December 31, 2014, as compared to the Fund’s per Share NAV increase of 104.2% for the year ended December 31, 2013, was primarily due to a decline in prices of the first and second month VIX futures during the year ended December 31, 2014.
During the year ended December 31, 2015, the Fund’s per Share NAV reached its high for the year on June 23, 2015 at $97.71 per Share and reached its low for the year on September 1, 2015 at $43.58 per Share. By comparison, during the year ended December 31, 2014, the Fund’s per Share NAV reached its high for the year on July 3, 2014 at $92.60 per Share and reached its low for the year on October 15, 2014 at $50.31 per Share. By comparison, during the year ended December 31, 2013, the Fund’s per Share NAV reached its high for the year on December 26, 2013 at $69.78 per Share and reached its low for the year on June 24, 2013 at $35.51 per Share.
The benchmark’s decline of 36.1% for the year ended December 31, 2015, as compared to the benchmark’s decline of 25.5% for the year ended December 31, 2014, can be attributed to a greater decline of the prices of the near-term futures contracts on the VIX futures curve during the year ended December 31, 2015. The benchmark’s decline of 25.5% for the year ended December 31, 2014, as compared to the benchmark’s decline of 65.7% for the year ended December 31, 2013, can be attributed to a lesser decline of the prices of the near-term futures contracts on the VIX futures curve during the year ended December 31, 2014.
82
Table of Contents
Net Income/Loss
The following table provides summary income information for the Fund for the years ended December 31, 2015, 2014 and 2013:
| Year Ended December 31, 2015 |
Year Ended December 31, 2014 |
Year Ended December 31, 2013 |
||||||||||
| Net investment income (loss) |
$ | (5,798,200 | ) | $ | (4,285,469 | ) | $ | (1,328,369 | ) | |||
| Management fee |
4,043,491 | 2,785,597 | 845,479 | |||||||||
| Brokerage commission |
1,935,395 | 1,581,416 | 519,393 | |||||||||
| Net realized gain (loss) |
69,828,657 | 76,945,361 | 87,181,110 | |||||||||
| Change in net unrealized appreciation/depreciation |
27,107,500 | (24,470,868 | ) | 9,505,925 | ||||||||
| Net income (loss) |
$ | 91,137,957 | $ | 48,189,024 | $ | 95,358,666 | ||||||
The Fund’s net income increased for the year ended December 31, 2015, as compared to the year ended December 31, 2014, primarily due to a greater decline in futures prices during the year ended December 31, 2015. The Fund’s net income decreased for the year ended December 31, 2014, as compared to the year ended December 31, 2013, primarily due to a lesser decline in futures prices during the year ended December 31, 2014.
ProShares Ultra VIX Short-Term Futures ETF*
Fund Performance
The following table provides summary performance information for the Fund for the years ended December 31, 2015, 2014 and 2013:
| Year Ended December 31, 2015 |
Year Ended December 31, 2014 |
Year Ended December 31, 2013 |
||||||||||
| NAV beginning of period |
$ | 351,789,953 | $ | 226,233,584 | $ | 84,716,132 | ||||||
| NAV end of period |
$ | 547,708,740 | $ | 351,789,953 | $ | 226,233,584 | ||||||
| Percentage change in NAV |
55.7 | % | 55.5 | % | 167.0 | % | ||||||
| Shares outstanding beginning of period |
2,804,020 | 674,478 | 21,040 | |||||||||
| Shares outstanding end of period |
19,502,448 | 2,804,020 | 674,478 | |||||||||
| Percentage change in shares outstanding |
595.5 | % | 315.7 | % | 3,105.7 | % | ||||||
| Shares created |
72,180,000 | 10,215,000 | 1,980,000 | |||||||||
| Shares redeemed |
55,481,572 | 8,085,458 | 1,326,563 | |||||||||
| Per share NAV beginning of period |
$ | 125.46 | $ | 335.42 | $ | 4,026.43 | ||||||
| Per share NAV end of period |
$ | 28.08 | $ | 125.46 | $ | 335.42 | ||||||
| Percentage change in per share NAV |
(77.6 | )% | (62.6 | )% | (91.7 | )% | ||||||
| Percentage change in benchmark |
(36.1 | )% | (25.5 | )% | (65.7 | )% | ||||||
| Benchmark annualized volatility |
78.6 | % | 61.4 | % | 57.9 | % | ||||||
During the year ended December 31, 2015, the increase in the Fund’s NAV resulted from an increase from 2,804,020 outstanding Shares at December 31, 2014 to 19,502,448 outstanding Shares at December 31, 2015. The increase in the Fund’s NAV was offset by the cumulative effect of the Fund seeking daily investment results (before fees and expenses) that correspond to 2x of the daily performance of the S&P 500 VIX Short-Term Futures Index. By comparison, during the year ended December 31, 2014, the increase in the Fund’s NAV resulted from an increase from 674,478 outstanding Shares at December 31, 2013 to 2,804,020 outstanding Shares at December 31, 2014. The increase in the Fund’s NAV was offset by the cumulative effect of the Fund seeking daily investment results (before fees and expenses) that correspond to 2x of the daily performance of the S&P 500 VIX Short-Term Futures Index. By comparison, during the year ended December 31, 2013, the increase in the Fund’s NAV resulted from an increase from 21,040 outstanding Shares at December 31, 2012 to 674,478 outstanding Shares at December 31, 2013. The increase in the Fund’s NAV was offset by the cumulative effect of the Fund seeking daily investment results (before fees and expenses) that correspond to 2x of the daily performance of the S&P 500 VIX Short-Term Futures Index.
83
Table of Contents
For the years ended December 31, 2015, 2014 and 2013, the Fund’s daily performance had a statistical correlation over 0.99 to 2x of the daily performance of its benchmark. The Fund’s per Share NAV decrease of 77.6% for the year ended December 31, 2015, as compared to the Fund’s per Share NAV decrease of 62.6% for the year ended December 31, 2014, was primarily due to a greater decline in prices of the first and second month VIX futures during the year ended December 31, 2015. The Fund’s per Share NAV decrease of 62.6% for the year ended December 31, 2014, as compared to the Fund’s per Share NAV decrease of 91.7% for the year ended December 31, 2013, was primarily due to a lesser decline in prices of the first and second month VIX futures during the year ended December 31, 2014.
During the year ended December 31, 2015, the Fund’s per Share NAV reached its high for the year on January 15, 2015 at $164.28 per Share and reached its low for the year on December 1, 2015 at $24.28 per Share. By comparison, during the year ended December 31, 2014, the Fund’s per Share NAV reached its high for the year on February 5, 2014 at $522.60 per Share and reached its low for the year on December 5, 2014 at $90.15 per Share. By comparison, during the year ended December 31, 2013, the Fund’s per Share NAV reached its high for the year on January 3, 2013 at $3,261.25 per Share and reached its low for the year on December 26, 2013 at $314.45 per Share.
The benchmark’s decline of 36.1% for the year ended December 31, 2015, as compared to the benchmark’s decline of 25.5% for the year ended December 31, 2014, can be attributed to a greater decline in prices of the near-term futures contracts on the VIX futures curve during the year ended December 31, 2015. The benchmark’s decline of 25.5% for the year ended December 31, 2014, as compared to the benchmark’s decline of 65.7% for the year ended December 31, 2013, can be attributed to a lesser decline in prices of the near-term futures contracts on the VIX futures curve during the year ended December 31, 2014.
Net Income/Loss
The following table provides summary income information for the Fund for the years ended December 31, 2015, 2014 and 2013:
| Year Ended December 31, 2015 |
Year Ended December 31, 2014 |
Year Ended December 31, 2013 |
||||||||||
| Net investment income (loss) |
$ | (7,410,148 | ) | $ | (5,359,486 | ) | $ | (4,828,761 | ) | |||
| Management fee |
4,362,460 | 2,868,337 | 2,555,345 | |||||||||
| Brokerage commission |
3,203,875 | 2,563,849 | 2,343,432 | |||||||||
| Net realized gain (loss) |
(392,223,946 | ) | (139,402,604 | ) | (405,797,946 | ) | ||||||
| Change in net unrealized appreciation/depreciation |
(27,664,140 | ) | 63,590,463 | (26,361,262 | ) | |||||||
| Net income (loss) |
$ | (427,298,234 | ) | $ | (81,171,627 | ) | $ | (436,987,969 | ) | |||
The Fund’s net income decreased for the year ended December 31, 2015, as compared to the year ended December 31, 2014, primarily due to a greater decline in futures prices during the year ended December 31, 2015. By comparison, the Fund’s net income increased for the year ended December 31, 2014, as compared to the year ended December 31, 2013, primarily due to a lesser decline in futures prices during the year ended December 31, 2014.
| * | See Note 1 of the Notes to Financial Statements in Item 15 of Part IV in this Annual Report on Form 10-K regarding the reverse Share split for the ProShares Ultra VIX Short-Term Futures ETF. |
84
Table of Contents
ProShares UltraShort Bloomberg Commodity
Fund Performance
The following table provides summary performance information for the Fund for the years ended December 31, 2015, 2014 and 2013:
| Year Ended December 31, 2015 |
Year Ended December 31, 2014 |
Year Ended December 31, 2013 |
||||||||||
| NAV beginning of period |
$ | 5,264,706 | $ | 3,797,427 | $ | 3,245,965 | ||||||
| NAV end of period |
$ | 8,514,039 | $ | 5,264,706 | $ | 3,797,427 | ||||||
| Percentage change in NAV |
61.7 | % | 38.6 | % | 17.0 | % | ||||||
| Shares outstanding beginning of period |
59,997 | 59,997 | 59,997 | |||||||||
| Shares outstanding end of period |
59,997 | 59,997 | 59,997 | |||||||||
| Percentage change in shares outstanding |
0.0 | % | 0.0 | % | 0.0 | % | ||||||
| Shares created |
— | — | — | |||||||||
| Shares redeemed |
— | — | — | |||||||||
| Per share NAV beginning of period |
$ | 87.75 | $ | 63.29 | $ | 54.10 | ||||||
| Per share NAV end of period |
$ | 141.91 | $ | 87.75 | $ | 63.29 | ||||||
| Percentage change in per share NAV |
61.7 | % | 38.6 | % | 17.0 | % | ||||||
| Percentage change in benchmark |
(24.7 | )% | (17.0 | )% | (9.6 | )% | ||||||
| Benchmark annualized volatility |
15.4 | % | 10.3 | % | 10.0 | % | ||||||
During the year ended December 31, 2015, the increase in the Fund’s NAV resulted from the cumulative effect of the Fund seeking daily investment results (before fees and expenses) that correspond to 2x of the inverse of the daily performance of the Bloomberg Commodity Index. There was no net change in the Fund’s outstanding Shares from December 31, 2014 to December 31, 2015. By comparison, during the year ended December 31, 2014, the increase in the Fund’s NAV resulted from the cumulative effect of the Fund seeking daily investment results (before fees and expenses) that correspond to 2x of the inverse of the daily performance of the Bloomberg Commodity Index. There was no net change in the Fund’s outstanding Shares from December 31, 2013 to December 31, 2014. By comparison, during the year ended December 31, 2013, the increase in the Fund’s NAV resulted from the cumulative effect of the Fund seeking daily investment results (before fees and expenses) that correspond to 2x of the inverse of the daily performance of the Bloomberg Commodity Index. There was no net change in the Fund’s outstanding Shares from December 31, 2012 to December 31, 2013.
For the years ended December 31, 2015, 2014 and 2013, the Fund’s daily performance had a statistical correlation over 0.99 to 2x of the inverse of the daily performance of its benchmark. The Fund’s per Share NAV increase of 61.7% for the year ended December 31, 2015, as compared to the Fund’s per Share NAV increase of 38.6% for the year ended December 31, 2014, was primarily due to a greater appreciation in the value of the assets of the Fund during the year ended December 31, 2015. The Fund’s per Share NAV increase of 38.6% for the year ended December 31, 2014, as compared to the Fund’s per Share NAV increase of 17.0% for the year ended December 31, 2013, was primarily due to a greater appreciation in the value of the assets of the Fund during the year ended December 31, 2014.
During the year ended December 31, 2015, the Fund’s per Share NAV reached its high for the year on December 17, 2015 at $149.68 per Share and reached its low for the year on May 14, 2015 at $83.15 per Share. By comparison, during the year ended December 31, 2014, the Fund’s per Share NAV reached its high for the year on December 31, 2014 at $87.75 per Share and reached its low for the year on April 29, 2014 at $51.38 per Share. By comparison, during the year ended December 31, 2013, the Fund’s per Share NAV reached its high for the year on November 19, 2013 at $67.46 per Share and reached its low for the year on January 30, 2013 at $51.04 per Share.
The benchmark’s decline of 24.7% for the year ended December 31, 2015, as compared to the benchmark’s decline of 17.0% for the year ended December 31, 2014, can be attributed to a greater depreciation of the underlying components of the index during the year ended December 31, 2015. The benchmark’s decline of 17.0% for the year ended December 31, 2014, as compared to the benchmark’s decline of 9.6% for the year ended December 31, 2013, can be attributed to a greater depreciation of the underlying components of the index during the year ended December 31, 2014.
85
Table of Contents
Net Income/Loss
The following table provides summary income information for the Fund for the years ended December 31, 2015, 2014 and 2013:
| Year Ended December 31, 2015 |
Year Ended December 31, 2014 |
Year Ended December 31, 2013 |
||||||||||
| Net investment income (loss) |
$ | (56,626 | ) | $ | (34,070 | ) | $ | (32,130 | ) | |||
| Management fee |
59,324 | 35,302 | 34,029 | |||||||||
| Net realized gain (loss) |
3,701,255 | 906,312 | 760,026 | |||||||||
| Change in net unrealized appreciation/depreciation |
(395,296 | ) | 595,037 | (176,434 | ) | |||||||
| Net income (loss) |
$ | 3,249,333 | $ | 1,467,279 | $ | 551,462 | ||||||
The Fund’s net income increased for the year ended December 31, 2015, as compared to the year ended December 31, 2014, primarily due to a greater depreciation of the underlying components of the index during the year ended December 31, 2015. By comparison, the Fund’s net income increased for the year ended December 31, 2014, as compared to the year ended December 31, 2013, primarily due to a greater depreciation of the underlying components of the index during the year ended December 31, 2014.
ProShares UltraShort Bloomberg Crude Oil
Fund Performance
The following table provides summary performance information for the Fund for the years ended December 31, 2015, 2014 and 2013:
| Year Ended December 31, 2015 |
Year Ended December 31, 2014 |
Year Ended December 31, 2013 |
||||||||||
| NAV beginning of period |
$ | 169,210,110 | $ | 256,060,149 | $ | 89,481,266 | ||||||
| NAV end of period |
$ | 95,897,894 | $ | 169,210,110 | $ | 256,060,149 | ||||||
| Percentage change in NAV |
(43.3 | )% | (33.9 | )% | 186.2 | % | ||||||
| Shares outstanding beginning of period |
2,169,944 | 8,069,944 | 2,219,944 | |||||||||
| Shares outstanding end of period |
719,944 | 2,169,944 | 8,069,944 | |||||||||
| Percentage change in shares outstanding |
(66.8 | )% | (73.1 | )% | 263.5 | % | ||||||
| Shares created |
10,800,000 | 15,700,000 | 23,300,000 | |||||||||
| Shares redeemed |
12,250,000 | 21,600,000 | 17,450,000 | |||||||||
| Per share NAV beginning of period |
$ | 77.98 | $ | 31.73 | $ | 40.31 | ||||||
| Per share NAV end of period |
$ | 133.20 | $ | 77.98 | $ | 31.73 | ||||||
| Percentage change in per share NAV |
70.8 | % | 145.8 | % | (21.3 | )% | ||||||
| Percentage change in benchmark |
(44.4 | )% | (41.7 | )% | 6.8 | % | ||||||
| Benchmark annualized volatility |
45.5 | % | 23.7 | % | 18.0 | % | ||||||
During the year ended December 31, 2015, the decrease in the Fund’s NAV resulted from a decrease from 2,169,944 outstanding Shares at December 31, 2014 to 719,944 outstanding Shares at December 31, 2015. The decrease in the Fund’s NAV was offset by the cumulative effect of the Fund seeking daily investment results (before fees and expenses) that correspond to 2x of the inverse of the daily performance of the Bloomberg WTI Crude Oil SubindexSM. By comparison, during the year ended December 31, 2014, the decrease in the Fund’s NAV resulted from a decrease from 8,069,944 outstanding Shares at December 31, 2013 to 2,169,944 outstanding Shares at December 31, 2014. The decrease in the Fund’s NAV was offset by the cumulative effect of the Fund seeking daily investment results (before fees and expenses) that correspond to 2x of the inverse of the daily performance of the Bloomberg WTI Crude Oil SubindexSM. By comparison, during the year ended December 31, 2013, the increase in the Fund’s NAV resulted from an increase from 2,219,944 outstanding Shares at December 31, 2012 to 8,069,944 outstanding Shares at December 31, 2013. The increase in the Fund’s NAV was offset by the cumulative effect of the Fund seeking daily investment results (before fees and expenses) that correspond to 2x of the inverse of the daily performance of the Bloomberg WTI Crude Oil SubindexSM.
For the years ended December 31, 2015, 2014 and 2013, the Fund’s daily performance had a statistical correlation over 0.99 to 2x of the inverse of the daily performance of its benchmark. The Fund’s per Share NAV increase of 70.8% for the year ended December 31, 2015, as compared to the Fund’s per Share NAV increase of 145.8% for the year ended December 31, 2014, was primarily due to a lesser appreciation in the value of the assets of the Fund during the year ended December 31, 2015. The Fund’s per Share NAV increase of 145.8% for the year ended December 31, 2014, as compared to the Fund’s per Share NAV decrease of 21.3% for the year ended December 31, 2013, was primarily due to an appreciation in the value of the assets of the Fund during the year ended December 31, 2014.
86
Table of Contents
During the year ended December 31, 2015, the Fund’s per Share NAV reached its high for the year on December 21, 2015 at $144.87 per Share and reached its low for the year on June 10, 2015 at $52.91 per Share. By comparison, during the year ended December 31, 2014, the Fund’s per Share NAV reached its high for the year on December 31, 2014 at $77.98 per Share and reached its low for the year on June 20, 2014 at $24.07 per Share. By comparison, during the year ended December 31, 2013, the Fund’s per Share NAV reached its high for the year on April 17, 2013 at $45.45 per Share and reached its low for the year on September 9, 2013 at $26.59 per Share.
The benchmark’s decline of 44.4% for the year ended December 31, 2015, as compared to the benchmark’s decline of 41.7% for the year ended December 31, 2014, can be attributed to a greater decrease in the price of WTI Crude Oil during the year ended December 31, 2015. By comparison, the benchmark’s decline of 41.7% for the year ended December 31, 2014, as compared to the benchmark’s rise of 6.8% for the year ended December 31, 2013, can be attributed to a decrease in the price of WTI Crude Oil during the year ended December 31, 2014.
Net Income/Loss
The following table provides summary income information for the Fund for the years ended December 31, 2015, 2014 and 2013:
| Year Ended December 31, 2015 |
Year Ended December 31, 2014 |
Year Ended December 31, 2013 |
||||||||||
| Net investment income (loss) |
$ | (2,166,211 | ) | $ | (2,415,841 | ) | $ | (2,544,628 | ) | |||
| Management fee |
1,978,613 | 2,448,428 | 2,581,084 | |||||||||
| Brokerage commission |
248,482 | 78,033 | 77,031 | |||||||||
| Net realized gain (loss) |
91,684,782 | 99,347,798 | (12,299,811 | ) | ||||||||
| Change in net unrealized appreciation/depreciation |
(33,951,907 | ) | 46,381,649 | 6,077,984 | ||||||||
| Net income (loss) |
$ | 55,566,664 | $ | 143,313,606 | $ | (8,766,455 | ) | |||||
The Fund’s net income decreased for the year ended December 31, 2015, as compared to the year ended December 31, 2014, primarily due to a greater decrease in the price of WTI Crude Oil during the year ended December 31, 2015. By comparison, the Fund’s net income increased for the year ended December 31, 2014, as compared to the year ended December 31, 2013, primarily due to a decrease in the price of WTI Crude Oil during the year ended December 31, 2014.
ProShares UltraShort Bloomberg Natural Gas
Fund Performance
The following table provides summary performance information for the Fund for the years ended December 31, 2015, 2014 and 2013:
| Year Ended December 31, 2015 |
Year Ended December 31, 2014 |
Year Ended December 31, 2013 |
||||||||||
| NAV beginning of period |
$ | 14,688,564 | $ | 22,734,767 | $ | 12,768,340 | ||||||
| NAV end of period |
$ | 10,462,856 | $ | 14,688,564 | $ | 22,734,767 | ||||||
| Percentage change in NAV |
(28.8 | )% | (35.4 | )% | 78.1 | % | ||||||
| Shares outstanding beginning of period |
174,952 | 324,952 | 125,008 | |||||||||
| Shares outstanding end of period |
74,952 | 174,952 | 324,952 | |||||||||
| Percentage change in shares outstanding |
(57.2 | )% | (46.2 | )% | 159.9 | % | ||||||
| Shares created |
450,000 | 2,850,000 | 587,500 | |||||||||
| Shares redeemed |
550,000 | 3,000,000 | 387,556 | |||||||||
| Per share NAV beginning of period |
$ | 83.96 | $ | 69.96 | $ | 102.14 | ||||||
| Per share NAV end of period |
$ | 139.59 | $ | 83.96 | $ | 69.96 | ||||||
| Percentage change in per share NAV |
66.3 | % | 20.0 | % | (31.5 | )% | ||||||
| Percentage change in benchmark |
(40.0 | )% | (30.7 | )% | 4.9 | % | ||||||
| Benchmark annualized volatility |
40.4 | % | 42.1 | % | 29.9 | % | ||||||
87
Table of Contents
During the year ended December 31, 2015, the decrease in the Fund’s NAV resulted from a decrease from 174,952 outstanding Shares at December 31, 2014 to 74,952 outstanding Shares at December 31, 2015. The decrease in the Fund’s NAV was offset by the cumulative effect of the Fund seeking daily investment results (before fees and expenses) that correspond to 2x of the inverse of the daily performance of the Bloomberg Natural Gas SubindexSM. By comparison, during the year ended December 31, 2014, the decrease in the Fund’s NAV resulted from a decrease from 324,952 outstanding Shares at December 31, 2013 to 174,952 outstanding Shares at December 31, 2014. The decrease in the Fund’s NAV was offset by the cumulative effect of the Fund seeking daily investment results (before fees and expenses) that correspond to 2x of the inverse of the daily performance of the Bloomberg Natural Gas SubindexSM. By comparison, during the period ended December 31, 2013, the increase in the Fund’s NAV resulted from an increase from 125,008 outstanding Shares at December 31, 2012 to 324,952 outstanding Shares at December 31, 2013. The increase in the Fund’s NAV was offset by the cumulative effect of the Fund seeking daily investment results (before fees and expenses) that correspond to 2x of the inverse of the daily performance of the Bloomberg Natural Gas SubindexSM.
For the years ended December 31, 2015, 2014 and 2013, the Fund’s daily performance had a statistical correlation over 0.99 to 2x of the inverse of the daily performance of its benchmark. The Fund’s per Share NAV increase of 66.3% for the year ended December 31, 2015, as compared to the Fund’s per Share NAV increase of 20.0% for the year ended December 31, 2014, was primarily due to a greater appreciation in the value of the assets of the Fund during the year ended December 31, 2015. The Fund’s per Share NAV increase of 20.0% for the year ended December 31, 2014, as compared to the Fund’s per Share NAV decrease of 31.5% for the year ended December 31, 2013, was primarily due to an appreciation in the value of the assets of the Fund during the year ended December 31, 2014.
During the year ended December 31, 2015, the Fund’s per Share NAV reached its high for the year on December 16, 2015 at $216.64 per Share and reached its low for the year on January 14, 2015 at $64.60 per Share. By comparison, during the year ended December 31, 2014, the Fund’s per Share NAV reached its high for the year on December 31, 2014 at $83.96 per Share and reached its low for the year on June 12, 2014 at $35.78 per Share. By comparison, during the year ended December 31, 2013, the Fund’s per Share NAV reached its high for the year on April 19, 2013 at $116.81 per Share and reached its low for the year on January 9, 2013 at $59.27 per Share.
The benchmark’s decline of 40.0% for the year ended December 31, 2015, as compared to the benchmark’s decline of 30.7% for the year ended December 31, 2014, can be attributed to a greater decrease in the price of Henry Hub Natural Gas during the year ended December 31, 2015. The benchmark’s decline of 30.7% for the year ended December 31, 2014, as compared to the benchmark’s rise of 4.9% for the year ended December 31, 2013, can be attributed to a decrease in the price of Henry Hub Natural Gas during the year ended December 31, 2014.
Net Income/Loss
The following table provides summary income information for the Fund for the years ended December 31, 2015, 2014 and 2013:
| Year Ended December 31, 2015 |
Year Ended December 31, 2014 |
Year Ended December 31, 2013 |
||||||||||
| Net investment income (loss) |
$ | (177,124 | ) | $ | (460,907 | ) | $ | (209,360 | ) | |||
| Management fee |
112,277 | 385,014 | 172,542 | |||||||||
| Brokerage commission |
70,677 | 92,199 | 45,438 | |||||||||
| Net realized gain (loss) |
15,212,833 | 8,796,882 | (2,584,895 | ) | ||||||||
| Change in net unrealized appreciation/depreciation |
(6,412,461 | ) | 2,899,237 | 632,743 | ||||||||
| Net income (loss) |
$ | 8,623,248 | $ | 11,235,212 | $ | (2,161,512 | ) | |||||
The Fund’s net income decreased for the year ended December 31, 2015, as compared to the year ended December 31, 2014, primarily due to a greater decrease in the price of Henry Hub Natural Gas, during the year ended December 31, 2015. By comparison, the Fund’s net income increased for the year ended December 31, 2014, as compared to the year ended December 31, 2013, primarily due to a decrease in the price of Henry Hub Natural Gas, during the year ended December 31, 2014.
88
Table of Contents
ProShares UltraShort Gold
Fund Performance
The following table provides summary performance information for the Fund for the years ended December 31, 2015, 2014 and 2013:
| Year Ended December 31, 2015 |
Year Ended December 31, 2014 |
Year Ended December 31, 2013 |
||||||||||
| NAV beginning of period |
$ | 81,861,762 | $ | 139,436,456 | $ | 92,416,742 | ||||||
| NAV end of period |
$ | 74,971,764 | $ | 81,861,762 | $ | 139,436,456 | ||||||
| Percentage change in NAV |
(8.4 | )% | (41.3 | )% | 50.9 | % | ||||||
| Shares outstanding beginning of period |
846,978 | 1,346,978 | 1,446,978 | |||||||||
| Shares outstanding end of period |
646,978 | 846,978 | 1,346,978 | |||||||||
| Percentage change in shares outstanding |
(23.6 | )% | (37.1 | )% | (6.9 | )% | ||||||
| Shares created |
150,000 | 550,000 | 2,650,000 | |||||||||
| Shares redeemed |
350,000 | 1,050,000 | 2,750,000 | |||||||||
| Per share NAV beginning of period |
$ | 96.65 | $ | 103.52 | $ | 63.87 | ||||||
| Per share NAV end of period |
$ | 115.88 | $ | 96.65 | $ | 103.52 | ||||||
| Percentage change in per share NAV |
19.9 | % | (6.6 | )% | 62.1 | % | ||||||
| Percentage change in benchmark |
(12.1 | )% | 0.1 | % | (27.3 | )% | ||||||
| Benchmark annualized volatility |
14.4 | % | 12.9 | % | 21.8 | % | ||||||
During the year ended December 31, 2015, the decrease in the Fund’s NAV resulted from a decrease from 846,978 outstanding Shares at December 31, 2014 to 646,978 outstanding Shares at December 31, 2015. The decrease in the Fund’s NAV was offset by the cumulative effect of the Fund seeking daily investment results (before fees and expenses) that correspond to 2x of the inverse of the daily performance of gold bullion as measured by the U.S. dollar p.m. LBMA Gold Price†. By comparison, during the year ended December 31, 2014, the decrease in the Fund’s NAV resulted primarily from a decrease from 1,346,978 outstanding Shares at December 31, 2013 to 846,978 outstanding Shares at December 31, 2014. The decrease in the Fund’s NAV also resulted in part from the cumulative effect of the Fund seeking daily investment results (before fees and expenses) that correspond to 2x of the inverse of the daily performance of gold bullion as measured by the U.S. dollar p.m. fixing price for delivery in London. By comparison, during the year ended December 31, 2013, the increase in the Fund’s NAV resulted from the cumulative effect of the Fund seeking daily investment results (before fees and expenses) that correspond to 2x of the inverse of the daily performance of gold bullion as measured by the U.S. dollar p.m. fixing price for delivery in London. The increase in the Fund’s NAV was offset by a decrease from 1,446,978 outstanding Shares at December 31, 2012 to 1,346,978 outstanding Shares at December 31, 2013.
For the years ended December 31, 2015, 2014 and 2013, the Fund’s daily performance had a statistical correlation over 0.99 to 2x of the inverse of the daily performance of its benchmark. The Fund’s per Share NAV increase of 19.9% for the year ended December 31, 2014, as compared to the Fund’s per Share NAV decrease of 6.6% for the year ended December 31, 2014, was primarily due to an appreciation in the value of the assets of the Fund during the year ended December 31, 2015. The Fund’s per Share NAV decrease of 6.6% for the year ended December 31, 2014, as compared to the Fund’s per Share NAV increase of 62.1% for the year ended December 31, 2013, was primarily due to a depreciation in the value of the assets of the Fund during the year ended December 31, 2014.
During the year ended December 31, 2015, the Fund’s per Share NAV reached its high for the year on December 17, 2015 at $118.51 per Share and reached its low for the year on January 22, 2015 at $83.07 per Share. By comparison, during the year ended December 31, 2014, the Fund’s per Share NAV reached its high for the year on November 5, 2014 at $109.00 per Share and reached its low for the year on March 14, 2014 at $77.10 per Share. By comparison, during the year ended December 31, 2013, the Fund’s per Share NAV reached its high for the year on June 28, 2013 at $114.11 per Share and reached its low for the year on January 1, 2013 at $61.07 per Share.
The benchmark’s decrease of 12.1% for the year ended December 31, 2015, as compared to the benchmark’s increase of 0.1% for the year ended December 31, 2014, can be attributed to a decrease in the price of spot gold in U.S. dollar terms during the year ended December 31, 2015. By comparison, the benchmark’s increase of 0.1% for the year ended December 31, 2014, as compared to the benchmark’s decline of 27.3% for the year ended December 31, 2013, can be attributed to an increase in the price of spot gold in U.S. dollar terms during the year ended December 31, 2014.
89
Table of Contents
Net Income /Loss
The following table provides summary income information for the Fund for the years ended December 31, 2015, 2014 and 2013:
| Year Ended December 31, 2015 |
Year Ended December 31, 2014 |
Year Ended December 31, 2013 |
||||||||||
| Net investment income (loss) |
$ | (703,582 | ) | $ | (857,817 | ) | $ | (1,175,860 | ) | |||
| Management fee |
735,540 | 898,453 | 1,237,712 | |||||||||
| Brokerage commission |
41 | 39 | 39 | |||||||||
| Net realized gain (loss) |
12,708,936 | (5,312,609 | ) | 61,123,058 | ||||||||
| Change in net unrealized appreciation/depreciation |
4,098,510 | (7,934,003 | ) | 1,901,341 | ||||||||
| Net income (loss) |
$ | 16,103,864 | $ | (14,104,429 | ) | $ | 61,848,539 | |||||
The Fund’s net income increased for the year ended December 31, 2015, as compared to the year ended December 31, 2014, primarily due to a decrease in the price of spot gold in U.S. dollar terms during the year ended December 31, 2015. By comparison, the Fund’s net income decreased for the year ended December 31, 2014, as compared to the year ended December 31, 2013, primarily due to an increase in the price of spot gold in U.S. dollar terms during the year ended December 31, 2014.
| † | On March 19, 2015, the company that ran the London U.S. dollar gold fixing ceased calculating the price of gold for the LBMA. The LBMA selected ICE Benchmark Administration to calculate the price, which was renamed the LBMA Gold Price, and is based on an electronic, physically settled auction-based methodology, beginning on March 20, 2015. |
ProShares UltraShort Silver*
Fund Performance
The following table provides summary performance information for the Fund for the years ended December 31, 2015, 2014 and 2013:
| Year Ended December 31, 2015 |
Year Ended December 31, 2014 |
Year Ended December 31, 2013 |
||||||||||
| NAV beginning of period |
$ | 53,007,867 | $ | 112,989,686 | $ | 100,656,703 | ||||||
| NAV end of period |
$ | 55,987,938 | $ | 53,007,867 | $ | 112,989,686 | ||||||
| Percentage change in NAV |
5.6 | % | (53.1 | )% | 12.3 | % | ||||||
| Shares outstanding beginning of period |
916,978 | 2,516,978 | 3,916,978 | |||||||||
| Shares outstanding end of period |
866,978 | 916,978 | 2,516,978 | |||||||||
| Percentage change in shares outstanding |
(5.5 | )% | (63.6 | )% | (35.7 | )% | ||||||
| Shares created |
1,650,000 | 1,800,000 | 6,900,000 | |||||||||
| Shares redeemed |
1,700,000 | 3,400,000 | 8,300,000 | |||||||||
| Per share NAV beginning of period |
$ | 57.81 | $ | 44.89 | $ | 25.70 | ||||||
| Per share NAV end of period |
$ | 64.58 | $ | 57.81 | $ | 44.89 | ||||||
| Percentage change in per share NAV |
11.7 | % | 28.8 | % | 74.7 | % | ||||||
| Percentage change in benchmark |
(13.5 | )% | (18.1 | )% | (34.9 | )% | ||||||
| Benchmark annualized volatility |
24.1 | % | 21.8 | % | 31.5 | % | ||||||
During the year ended December 31, 2015, the increase in the Fund’s NAV resulted from the cumulative effect of the Fund seeking daily investment results (before fees and expenses) that correspond to 2x of the inverse of the daily performance of silver bullion as measured by the London Silver Price†. The increase in the Fund’s NAV was offset by a decrease from 916,978 outstanding shares at December 31, 2014 to 866,978 outstanding shares at December 31, 2015. By comparison, during the year ended December 31, 2014, the decrease in the Fund’s NAV resulted from a decrease from 2,516,978 outstanding Shares at December 31, 2013 to 916,978 outstanding shares at December 31,
90
Table of Contents
2014. The decrease in the Fund’s NAV was offset by the cumulative effect of the Fund seeking daily investment results (before fees and expenses) that correspond to 2x of the inverse of the daily performance of silver bullion as measured by the London Silver Price†. By comparison, during the year ended December 31, 2013, the increase in the Fund’s NAV resulted from the cumulative effect of the Fund seeking daily investment results (before fees and expenses) that correspond to 2x of the inverse of the daily performance of silver bullion as measured by the U.S. dollar fixing price for delivery in London. The increase in the Fund’s NAV was offset by a decrease from 3,916,978 outstanding Shares at December 31, 2012 to 2,516,978 outstanding Shares at December 31, 2013.
For the years ended December 31, 2015, 2014 and 2013, the Fund’s daily performance had a statistical correlation over 0.99 to 2x of the inverse of the daily performance of its benchmark. The Fund’s per Share NAV increase of 11.7% for the year ended December 31, 2015, as compared to the Fund’s per Share NAV increase of 28.8% for the year ended December 31, 2014, was primarily due to a lesser appreciation in the value of the assets of the Fund during the year ended December 31, 2015. The Fund’s per Share NAV increase of 28.8% for the year ended December 31, 2014, as compared to the Fund’s per Share NAV increase of 74.7% for the year ended December 31, 2013, was primarily due to a lesser appreciation in the value of the assets of the Fund during the year ended December 31, 2014.
During the year ended December 31, 2015, the Fund’s per Share NAV reached its high for the year on December 14, 2015 at $66.08 per Share and reached its low for the year on January 23, 2015 at $43.39 per Share. By comparison, during the year ended December 31, 2014, the Fund’s per Share NAV reached its high for the year on November 6, 2014 at $65.64 per Share and reached its low for the year on February 24, 2014 at $34.40 per Share. By comparison, during the year ended December 31, 2013, the Fund’s per Share NAV reached its high for the year on June 27, 2013 at $56.84 per Share and reached its low for the year on January 23, 2013 at $21.86 per Share.
The benchmark’s decline of 13.5% for the year ended December 31, 2015, as compared to the benchmark’s decline of 18.1% for the year ended December 31, 2014, can be attributed to a lesser decline in the price of spot silver in U.S. dollar terms during the year ended December 31, 2015. The benchmark’s decline of 18.1% for the year ended December 31, 2014, as compared to the benchmark’s decline of 34.9% for the year ended December 31, 2013, can be attributed to a lesser decline in the price of spot silver in U.S. dollar terms during the year ended December 31, 2014.
Net Income/Loss
The following table provides summary income information for the Fund for the years ended December 31, 2015, 2014 and 2013:
| Year Ended December 31, 2015 |
Year Ended December 31, 2014 |
Year Ended December 31, 2013 |
||||||||||
| Net investment income (loss) |
$ | (516,464 | ) | $ | (585,841 | ) | $ | (973,304 | ) | |||
| Management fee |
540,253 | 616,703 | 1,033,442 | |||||||||
| Brokerage commission |
42 | 39 | 40 | |||||||||
| Net realized gain (loss) |
10,756,758 | 15,119,117 | 113,463,320 | |||||||||
| Change in net unrealized appreciation/depreciation |
4,186,942 | 2,807,756 | (21,564,801 | ) | ||||||||
| Net income (loss) |
$ | 14,427,236 | $ | 17,341,032 | $ | 90,925,215 | ||||||
The Fund’s net income decreased for the year ended December 31, 2015, as compared to the year ended December 31, 2014, primarily due to a lesser decline in the price of spot silver in U.S. dollar terms during the year ended December 31, 2015. By comparison, the Fund’s net income decreased for the year ended December 31, 2014, as compared to the year ended December 31, 2013, primarily due to a lesser decline in the price of spot silver in U.S. dollar terms during the year ended December 31, 2014.
| * | See Note 1 of the Notes to Financial Statements in Item 15 of Part IV in this Annual Report on Form 10-K regarding the Share split for ProShares UltraShort Silver. |
| † | On August 14, 2014, the company that ran the London U.S. dollar silver fixing ceased calculating the price of silver for the LBMA. The LBMA selected the CME Group and Thomson Reuters to calculate the price, which was renamed the London Silver Price, beginning August 15, 2014. |
91
Table of Contents
ProShares Short Euro
Fund Performance
The following table provides summary performance information for the Fund for the years ended December 31, 2015, 2014 and 2013:
| Year Ended December 31, 2015 |
Year Ended December 31, 2014 |
Year Ended December 31, 2013 |
||||||||||
| NAV beginning of period |
$ | 14,021,804 | $ | 8,896,842 | $ | 3,763,040 | ||||||
| NAV end of period |
$ | 17,510,898 | $ | 14,021,804 | $ | 8,896,842 | ||||||
| Percentage change in NAV |
24.9 | % | 57.6 | % | 136.4 | % | ||||||
| Shares outstanding beginning of period |
350,005 | 250,005 | 100,005 | |||||||||
| Shares outstanding end of period |
400,005 | 350,005 | 250,005 | |||||||||
| Percentage change in shares outstanding |
14.3 | % | 40.0 | % | 150.0 | % | ||||||
| Shares created |
550,000 | 250,000 | 150,000 | |||||||||
| Shares redeemed |
500,000 | 150,000 | — | |||||||||
| Per share NAV beginning of period |
$ | 40.06 | $ | 35.59 | $ | 37.63 | ||||||
| Per share NAV end of period |
$ | 43.78 | $ | 40.06 | $ | 35.59 | ||||||
| Percentage change in per share NAV |
9.3 | % | 12.6 | % | (5.4 | )% | ||||||
| Percentage change in benchmark |
(10.2 | )% | (12.0 | )% | 4.3 | % | ||||||
| Benchmark annualized volatility |
12.1 | % | 6.1 | % | 7.5 | % | ||||||
During the year ended December 31, 2015, the increase in the Fund’s NAV resulted primarily from an increase from 350,005 outstanding shares at December 31, 2014 to 400,005 outstanding shares at December 31, 2015. The increase in the Fund’s NAV also resulted in part from the cumulative effect of the Fund seeking daily investment results (before fees and expenses) that correspond to the inverse of the daily performance of the spot price of the euro versus the U.S. dollar. By comparison, during the year ended December 31, 2014, the increase in the Fund’s NAV resulted primarily from an increase from 250,005 outstanding Shares at December 31, 2013 to 350,005 outstanding shares at December 31, 2014. The increase in the Fund’s NAV also resulted in part from the cumulative effect of the Fund seeking daily investment results (before fees and expenses) that correspond to the inverse of the daily performance of the spot price of the euro versus the U.S. dollar. By comparison, during the year ended December 31, 2013, the increase in the Fund’s NAV resulted from an increase from 100,005 outstanding Shares at December 31, 2012 to 250,005 outstanding Shares at December 31, 2013. The increase in the Fund’s NAV was offset by the cumulative effect of the Fund seeking daily investment results (before fees and expenses) that correspond to the inverse of the daily performance of the spot price of the euro versus the U.S. dollar.
For the years ended December 31, 2015, 2014 and 2013, the Fund’s daily performance had a statistical correlation over 0.99 of the inverse of the daily performance of its benchmark. The Fund’s per Share NAV increase of 9.3% for the year ended December 31, 2015, as compared to the Fund’s per Share NAV increase of 12.6% for the year ended December 31, 2014, was primarily due to a lesser appreciation in the value of the assets held by the Fund during the year ended December 31, 2015. The Fund’s per Share NAV increase of 12.6% for the year ended December 31, 2014, as compared to the Fund’s per Share NAV decrease of 5.4% for the year ended December 31, 2013, was primarily due to an appreciation in the value of the assets held by the Fund during the year ended December 31, 2014.
During the year ended December 31, 2015, the Fund’s per Share NAV reached its high for the year on March 13, 2015 at $46.07 per Share and reached its low for the year on January 2, 2015 at $40.37 per Share. By comparison, during the year ended December 31, 2014, the Fund’s per Share NAV reached its high for the year on December 31, 2014 at $40.06 per Share and reached its low for the year on May 6, 2014 at $35.07 per Share. By comparison, during the year ended December 31, 2013, the Fund’s per Share NAV reached its high for the year on March 27, 2013 at $38.76 per Share and reached its low for the year on December 30, 2013 at $35.56 per Share.
The benchmark’s decline of 10.2% for the year ended December 31, 2015, as compared to the benchmark’s decline of 12.0% for the year ended December 31, 2014, can be attributed to a lesser decrease in the value of the euro versus the U.S. dollar during the period ended December 31, 2015. By comparison, the benchmark’s decline of 12.0% for the year ended December 31, 2014, as compared to the benchmark’s rise of 4.3% for the year ended December 31, 2013, can be attributed to a decrease in the value of the euro versus the U.S. dollar during the period ended December 31, 2014.
92
Table of Contents
Net Income/Loss
The following table provides summary income information for the Fund for the years ended December 31, 2015, 2014 and 2013:
| Year Ended December 31, 2015 |
Year Ended December 31, 2014 |
Year Ended December 31, 2013 |
||||||||||
| Net investment income (loss) |
$ | (178,761 | ) | $ | (118,247 | ) | $ | (51,170 | ) | |||
| Management fee |
179,286 | 121,126 | 35,075 | |||||||||
| Brokerage commission |
3,979 | 1,837 | 812 | |||||||||
| Offering costs |
— | — | 45,511 | |||||||||
| Limitation by Sponsor |
— | — | (28,232 | ) | ||||||||
| Net realized gain (loss) |
1,559,643 | 1,593,450 | (381,830 | ) | ||||||||
| Change in net unrealized appreciation/depreciation |
(142,063 | ) | 418,090 | 22,288 | ||||||||
| Net income (loss) |
$ | 1,238,819 | $ | 1,893,293 | $ | (410,712 | ) | |||||
The Fund’s net income decreased for the year ended December 31, 2015, as compared to the year ended December 31, 2014, primarily due to a lesser decrease in the value of the euro versus the U.S. dollar and a higher asset base during the year ended December 31, 2015. The Fund’s net income increased for the year ended December 31, 2014, as compared to the year ended December 31, 2013, primarily due to a decrease in the value of the euro versus the U.S. dollar and a higher asset base during the year ended December 31, 2014.
ProShares UltraShort Australian Dollar
Fund Performance
The following table provides summary performance information for the Fund for the years ended December 31, 2015, 2014 and 2013:
| Year Ended December 31, 2015 |
Year Ended December 31, 2014 |
Year Ended December 31, 2013 |
||||||||||
| NAV beginning of period |
$ | 23,120,790 | $ | 27,983,279 | $ | 3,780,999 | ||||||
| NAV end of period |
$ | 20,460,679 | $ | 23,120,790 | $ | 27,983,279 | ||||||
| Percentage change in NAV |
(11.5 | )% | (17.4 | )% | 640.1 | % | ||||||
| Shares outstanding beginning of period |
450,005 | 600,005 | 100,005 | |||||||||
| Shares outstanding end of period |
350,005 | 450,005 | 600,005 | |||||||||
| Percentage change in shares outstanding |
(22.2 | )% | (25.0 | )% | 500.0 | % | ||||||
| Shares created |
50,000 | — | 500,000 | |||||||||
| Shares redeemed |
150,000 | 150,000 | — | |||||||||
| Per share NAV beginning of period |
$ | 51.38 | $ | 46.64 | $ | 37.81 | ||||||
| Per share NAV end of period |
$ | 58.46 | $ | 51.38 | $ | 46.64 | ||||||
| Percentage change in per share NAV |
13.8 | % | 10.2 | % | 23.4 | % | ||||||
| Percentage change in benchmark |
(10.7 | )% | (8.6 | )% | (14.1 | )% | ||||||
| Benchmark annualized volatility |
11.9 | % | 8.4 | % | 10.1 | % | ||||||
During the year ended December 31, 2015, the decrease in the Fund’s NAV resulted from a decrease from 450,005 outstanding Shares at December 31, 2014 to 350,005 outstanding Shares at December 31, 2015. The decrease in the Fund’s NAV was offset by the cumulative effect of the Fund seeking daily investment results (before fees and expenses) that correspond to 2x of the inverse of the daily performance of the spot price of the Australian dollar versus the U.S. dollar. By comparison, during the year ended December 31, 2014, the decrease in the Fund’s NAV resulted from a decrease from 600,005 outstanding Shares at December 31, 2013 to 450,005 outstanding Shares at December 31, 2014. The decrease in the Fund’s NAV was offset by the cumulative effect of the Fund seeking daily investment results (before fees and expenses) that correspond to 2x of the inverse of the daily performance of the
93
Table of Contents
spot price of the Australian dollar versus the U.S. dollar. By comparison, during the year ended December 31, 2013, the increase in the Fund’s NAV resulted primarily from an increase from 100,005 outstanding Shares at December 31, 2012 to 600,005 outstanding Shares at December 31, 2013. The increase in the Fund’s NAV also resulted in part from the cumulative effect of the Fund seeking daily investment results (before fees and expenses) that correspond to 2x of the inverse of the daily performance of the spot price of the Australian dollar versus the U.S. dollar.
For the years ended December 31, 2015, 2014 and 2013, the Fund’s daily performance had a statistical correlation over 0.99 to 2x of the inverse of the daily performance of its benchmark. The Fund’s per Share NAV increase of 13.8% for the year ended December 31, 2015, as compared to the Fund’s per Share NAV increase of 10.2% for the year ended December 31, 2014, was primarily due to a greater appreciation in the value of the assets held by the Fund during the year ended December 31, 2015. The Fund’s per Share NAV increase of 10.2% for the year ended December 31, 2014, as compared to the Fund’s per Share NAV increase of 23.4% for the year ended December 31, 2013, was primarily due to a lesser appreciation in the value of the assets held by the Fund during the year ended December 31, 2013.
During the year ended December 31, 2015, the Fund’s per Share NAV reached its high for the year on September 4, 2015 at $66.75 per Share and reached its low for the year on May 13, 2015 at $50.07 per Share. By comparison, during the year ended December 31, 2014, the Fund’s per Share NAV reached its high for the year on December 23, 2014 at $52.32 per Share and reached its low for the year on July 1, 2014 at $39.67 per Share. By comparison, during the year ended December 31, 2013, the Fund’s per Share NAV reached its high for the year on August 2, 2013 at $48.58 per Share and reached its low for the year on April 11, 2013 at $35.89 per Share.
The benchmark’s decline of 10.7% for the year ended December 31, 2015, as compared to the benchmark’s decline of 8.6% for the year ended December 31, 2014, can be attributed to a greater decline in the value of the Australian dollar versus the U.S. dollar during the period ended December 31, 2015. By comparison, the benchmark’s decline of 8.6% for the year ended December 31, 2014, as compared to the benchmark’s decline of 14.1% for the year ended December 31, 2013, can be attributed to a lesser decline in the value of the Australian dollar versus the U.S. dollar during the period ended December 31, 2014.
Net Income/Loss
The following table provides summary income information for the Fund for the years ended December 31, 2015, 2014 and 2013:
| Year Ended December 31, 2015 |
Year Ended December 31, 2014 |
Year Ended December 31, 2013 |
||||||||||
| Net investment income (loss) |
$ | (209,987 | ) | $ | (213,183 | ) | $ | (159,424 | ) | |||
| Management fee |
199,845 | 208,597 | 106,713 | |||||||||
| Brokerage commission |
16,140 | 12,811 | 11,753 | |||||||||
| Offering costs |
— | — | 47,870 | |||||||||
| Limitation by Sponsor |
— | — | (1,259 | ) | ||||||||
| Net realized gain (loss) |
4,330,688 | 2,296,708 | 2,720,005 | |||||||||
| Change in net unrealized appreciation/depreciation |
(1,164,304 | ) | (175,587 | ) | 833,294 | |||||||
| Net income (loss) |
$ | 2,956,397 | $ | 1,907,938 | $ | 3,393,875 | ||||||
The Fund’s net income increased for the year ended December 31, 2015, as compared to the year ended December 31, 2014, primarily due to a greater decline in the value of the Australian dollar versus the U.S. dollar during the year ended December 31, 2015. The Fund’s net income decreased for the year ended December 31, 2014, as compared to the year ended December 31, 2013, primarily due to a lesser decline in the value of the Australian dollar versus the U.S. dollar during the year ended December 31, 2014.
94
Table of Contents
ProShares UltraShort Euro
Fund Performance
The following table provides summary performance information for the Fund for the years ended December 31, 2015, 2014 and 2013:
| Year Ended December 31, 2015 |
Year Ended December 31, 2014 |
Year Ended December 31, 2013 |
||||||||||
| NAV beginning of period |
$ | 517,191,349 | $ | 418,001,115 | $ | 526,778,026 | ||||||
| NAV end of period |
$ | 522,306,518 | $ | 517,191,349 | $ | 418,001,115 | ||||||
| Percentage change in NAV |
1.0 | % | 23.7 | % | (20.6 | )% | ||||||
| Shares outstanding beginning of period |
23,950,014 | 24,500,014 | 27,700,014 | |||||||||
| Shares outstanding end of period |
20,450,014 | 23,950,014 | 24,500,014 | |||||||||
| Percentage change in shares outstanding |
(14.6 | )% | (2.2 | )% | (11.6 | )% | ||||||
| Shares created |
12,600,000 | 4,500,000 | 6,250,000 | |||||||||
| Shares redeemed |
16,100,000 | 5,050,000 | 9,450,000 | |||||||||
| Per share NAV beginning of period |
$ | 21.59 | $ | 17.06 | $ | 19.02 | ||||||
| Per share NAV end of period |
$ | 25.54 | $ | 21.59 | $ | 17.06 | ||||||
| Percentage change in per share NAV |
18.3 | % | 26.6 | % | (10.3 | )% | ||||||
| Percentage change in benchmark |
(10.2 | )% | (12.0 | )% | 4.3 | % | ||||||
| Benchmark annualized volatility |
12.1 | % | 6.1 | % | 7.5 | % | ||||||
During the year ended December 31, 2015, the increase in the Fund’s NAV resulted from the cumulative effect of the Fund seeking daily investment results (before fees and expenses) that correspond to 2x of the inverse of the daily performance of the spot price of the euro versus the U.S. dollar. The increase in the Fund’s NAV was offset by a decrease from 23,950,014 outstanding Shares at December 31, 2014 to 20,450,014 outstanding Shares at December 31, 2015. By comparison, during the year ended December 31, 2014, the increase in the Fund’s NAV resulted primarily from the cumulative effect of the Fund seeking daily investment results (before fees and expenses) that correspond to 2x of the inverse of the daily performance of the spot price of the euro versus the U.S. dollar. The increase in the Fund’s NAV was offset by a decrease from 24,500,014 outstanding Shares at December 31, 2013 to 23,950,014 outstanding Shares at December 31, 2014. By comparison, during the year ended December 31, 2013, the decrease in the Fund’s NAV resulted primarily from a decrease from 27,700,014 outstanding Shares at December 31, 2012 to 24,500,014 outstanding Shares at December 31, 2013. The decrease in the Fund’s NAV also resulted in part from the cumulative effect of the Fund seeking daily investment results (before fees and expenses) that correspond to 2x of the inverse of the daily performance of the spot price of the euro versus the U.S. dollar.
For the years ended December 31, 2015, 2014 and 2013, the Fund’s daily performance had a statistical correlation over 0.99 to 2x of the inverse of the daily performance of its benchmark. The Fund’s per Share NAV increase of 18.3% for the year ended December 31, 2015, as compared to the Fund’s per Share NAV increase of 26.6% for the year ended December 31, 2014, was primarily due to a lesser appreciation in the value of the assets held by the Fund during the year ended December 31, 2015. The Fund’s per Share NAV increase of 26.6% for the year ended December 31, 2014, as compared to the Fund’s per Share NAV decrease of 10.3% for the year ended December 31, 2013, was primarily due to an appreciation in the value of the assets held by the Fund during the year ended December 31, 2014.
During the year ended December 31, 2015, the Fund’s per Share NAV reached its high for the year on March 13, 2015 at $28.50 per Share and reached its low for the year on January 2, 2015 at $21.94 per Share. By comparison, during the year ended December 31, 2014, the Fund’s per Share NAV reached its high for the year on December 31, 2014 at $21.59 per Share and reached its low for the year on May 6, 2014 at $16.52 per Share. By comparison, during the year ended December 31, 2013, the Fund’s per Share NAV reached its high for the year on March 27, 2013 at $20.16 per Share and reached its low for the year on December 30, 2013 at $16.96 per Share.
The benchmark’s decline of 10.2% for the year ended December 31, 2015, as compared to the benchmark’s decline of 12.0% for the year ended December 31, 2014, can be attributed to a lesser decline in the value of the euro versus the U.S. dollar during the year ended December 31, 2015. By comparison, the benchmark’s decline of 12.0% for the year ended December 31, 2014, as compared to the benchmark’s rise of 4.3% for the year ended December 31, 2013, can be attributed to a decline in the value of the euro versus the U.S. dollar during the year ended December 31, 2014.
95
Table of Contents
Net Income/Loss
The following table provides summary income information for the Fund for the years ended December 31, 2015, 2014 and 2013:
| Year Ended December 31, 2015 |
Year Ended December 31, 2014 |
Year Ended December 31, 2013 |
||||||||||
| Net investment income (loss) |
$ | (5,000,587 | ) | $ | (3,994,145 | ) | $ | (4,375,512 | ) | |||
| Management fee |
5,265,432 | 4,193,741 | 4,600,479 | |||||||||
| Net realized gain (loss) |
131,674,081 | 83,683,592 | (48,055,883 | ) | ||||||||
| Change in net unrealized appreciation/depreciation |
(45,497,112 | ) | 30,499,215 | (588,667 | ) | |||||||
| Net income (loss) |
$ | 81,176,382 | $ | 110,188,662 | $ | (53,020,062 | ) | |||||
The Fund’s net income decreased for the year ended December 31, 2015, as compared to the year ended December 31, 2014, primarily due to a lesser decline in the value of the euro versus the U.S. dollar during the year ended December 31, 2015. By comparison, the Fund’s net income increased for the year ended December 31, 2014, as compared to the year ended December 31, 2013, primarily due to a decline in the value of the euro versus the U.S. dollar during the year ended December 31, 2014.
ProShares UltraShort Yen
Fund Performance
The following table provides summary performance information for the Fund for the years ended December 31, 2015, 2014 and 2013:
| Year Ended December 31, 2015 |
Year Ended December 31, 2014 |
Year Ended December 31, 2013 |
||||||||||
| NAV beginning of period |
$ | 531,471,873 | $ | 588,121,516 | $ | 408,563,630 | ||||||
| NAV end of period |
$ | 237,372,900 | $ | 531,471,873 | $ | 588,121,516 | ||||||
| Percentage change in NAV |
(55.3 | )% | (9.6 | )% | 43.9 | % | ||||||
| Shares outstanding beginning of period |
5,949,294 | 8,299,294 | 8,049,294 | |||||||||
| Shares outstanding end of period |
2,699,294 | 5,949,294 | 8,299,294 | |||||||||
| Percentage change in shares outstanding |
(54.6 | )% | (28.3 | )% | 3.1 | % | ||||||
| Shares created |
1,350,000 | 2,850,000 | 5,650,000 | |||||||||
| Shares redeemed |
4,600,000 | 5,200,000 | 5,400,000 | |||||||||
| Per share NAV beginning of period |
$ | 89.33 | $ | 70.86 | $ | 50.76 | ||||||
| Per share NAV end of period |
$ | 87.94 | $ | 89.33 | $ | 70.86 | ||||||
| Percentage change in per share NAV |
(1.6 | )% | 26.1 | % | 39.6 | % | ||||||
| Percentage change in benchmark |
(0.4 | )% | (12.1 | )% | (17.6 | )% | ||||||
| Benchmark annualized volatility |
8.2 | % | 7.9 | % | 12.3 | % | ||||||
During the year ended December 31, 2015, the decrease in the Fund’s NAV resulted primarily from a decrease from 5,949,294 outstanding Shares at December 31, 2014 to 2,699,294 outstanding Shares at December 31, 2015. The decrease in the Fund’s NAV also resulted in part from the cumulative effect of the Fund seeking daily investment results (before fees and expenses) that correspond to 2x of the inverse of the daily performance of the spot price of the Japanese yen versus the U.S. dollar. By comparison, during the year ended December 31, 2014, the decrease in the Fund’s NAV resulted from a decrease from 8,299,294 outstanding Shares at December 31, 2013 to 5,949,294 outstanding Shares at December 31, 2014. The decrease in the Fund’s NAV was offset by the cumulative effect of the Fund seeking daily investment results (before fees and expenses) that correspond to 2x of the inverse of the daily performance of the spot price of the Japanese yen versus the U.S. dollar. By comparison, during the year ended December 31, 2013, the increase in the Fund’s NAV resulted primarily from an increase from 8,049,294 outstanding Shares at December 31, 2012 to 8,299,294 outstanding Shares at December 31, 2013. The increase in the Fund’s NAV also resulted in part from the cumulative effect of the Fund seeking daily investment results (before fees and expenses) that correspond to 2x of the inverse of the daily performance of the spot price of the Japanese yen versus the U.S. dollar.
96
Table of Contents
For the years ended December 31, 2015, 2014 and 2013, the Fund’s daily performance had a statistical correlation over 0.99 to 2x of the inverse of the daily performance of its benchmark. The Fund’s per Share NAV decrease of 1.6% for the year ended December 31, 2015, as compared to the Fund’s per Share NAV increase of 26.1% for the year ended December 31, 2014, was primarily due to a depreciation in the value of the assets held by the Fund during the year ended December 31, 2015. The Fund’s per Share NAV increase of 26.1% for the year ended December 31, 2014, as compared to the Fund’s per Share NAV increase of 39.6% for the year ended December 31, 2013, was primarily due to a lesser appreciation in the value of the assets held by the Fund during the year ended December 31, 2014.
During the year ended December 31, 2015, the Fund’s per Share NAV reached its high for the year on June 5, 2015 at $97.30 per Share and reached its low for the year on January 15, 2015 at $84.11 per Share. By comparison, during the year ended December 31, 2014, the Fund’s per Share NAV reached its high for the year on December 5, 2014 at $92.07 per Share and reached its low for the year on July 17, 2014 at $64.75 per Share. By comparison, during the year ended December 31, 2013, the Fund’s per Share NAV reached its high for the year on December 31, 2013 at $70.86 per Share and reached its low for the year on January 8, 2013 at $51.09 per Share.
The benchmark’s decline of 0.4% for the year ended December 31, 2015, as compared to the benchmark’s decline of 12.1% for the year ended December 31, 2014, can be attributed to a lesser decline in the value of the Japanese yen versus the U.S. dollar during the year ended December 31, 2015. By comparison, the benchmark’s decline of 12.1% for the year ended December 31, 2014, as compared to the benchmark’s decline of 17.6% for the year ended December 31, 2013, can be attributed to a lesser decline in the value of the Japanese yen versus the U.S. dollar during the year ended December 31, 2014.
Net Income/Loss
The following table provides summary income information for the Fund for the years ended December 31, 2015, 2014 and 2013:
| Year Ended December 31, 2015 |
Year Ended December 31, 2014 |
Year Ended December 31, 2013 |
||||||||||
| Net investment income (loss) |
$ | (3,623,678 | ) | $ | (3,741,601 | ) | $ | (4,398,231 | ) | |||
| Management fee |
3,759,492 | 3,938,854 | 4,607,832 | |||||||||
| Net realized gain (loss) |
8,806,429 | 127,860,058 | 164,024,125 | |||||||||
| Change in net unrealized appreciation/depreciation |
(12,347,563 | ) | (30,986,352 | ) | (8,704,656 | ) | ||||||
| Net income (loss) |
$ | (7,164,812 | ) | $ | 93,132,105 | $ | 150,921,238 | |||||
The Fund’s net income decreased for the year ended December 31, 2015, as compared to the year ended December 31, 2014, primarily due to a lesser decline in the value of the Japanese yen versus the U.S. dollar during the year ended December 31, 2015. By comparison, the Fund’s net income decreased for the year ended December 31, 2014, as compared to the year ended December 31, 2013, primarily due to a lesser decline in the value of the Japanese yen versus the U.S. dollar during the year ended December 31, 2014.
ProShares Ultra Bloomberg Commodity*
Fund Performance
The following table provides summary performance information for the Fund for the years ended December 31, 2015, 2014 and 2013:
| Year Ended December 31, 2015 |
Year Ended December 31, 2014 |
Year Ended December 31, 2013 |
||||||||||
| NAV beginning of period |
$ | 2,606,920 | $ | 2,915,034 | $ | 6,097,211 | ||||||
| NAV end of period |
$ | 7,105,984 | $ | 2,606,920 | $ | 2,915,034 | ||||||
| Percentage change in NAV |
172.6 | % | (10.6 | )% | (52.2 | )% | ||||||
| Shares outstanding beginning of period |
50,004 | 37,504 | 62,504 | |||||||||
| Shares outstanding end of period |
249,965 | 50,004 | 37,504 | |||||||||
| Percentage change in shares outstanding |
399.9 | % | 33.3 | % | (40.0 | )% | ||||||
97
Table of Contents
| Year Ended December 31, 2015 |
Year Ended December 31, 2014 |
Year Ended December 31, 2013 |
||||||||||
| Shares created |
225,000 | 12,500 | — | |||||||||
| Shares redeemed |
25,039 | — | 25,000 | |||||||||
| Per share NAV beginning of period |
$ | 52.13 | $ | 77.73 | $ | 97.55 | ||||||
| Per share NAV end of period |
$ | 28.43 | $ | 52.13 | $ | 77.73 | ||||||
| Percentage change in per share NAV |
(45.5 | )% | (32.9 | )% | (20.3 | )% | ||||||
| Percentage change in benchmark |
(24.7 | )% | (17.0 | )% | (9.6 | )% | ||||||
| Benchmark annualized volatility |
15.4 | % | 10.3 | % | 10.0 | % | ||||||
During the year ended December 31, 2015, the increase in the Fund’s NAV resulted from an increase from 50,004 outstanding Shares at December 31, 2014 to 249,965 outstanding Shares at December 31, 2015. The increase in the Fund’s NAV was offset by the cumulative effect of the Fund seeking daily investment results (before fees and expenses) that correspond to 2x of the daily performance of the Bloomberg Commodity Index. By comparison, during the year ended December 31, 2014, the decrease in the Fund’s NAV resulted from the cumulative effect of the Fund seeking daily investment results (before fees and expenses) that correspond to 2x of the daily performance of the Bloomberg Commodity Index. The decrease in the Fund’s NAV was offset by an increase from 37,504 outstanding Shares at December 31, 2013 to 50,004 outstanding Shares at December 31, 2014. By comparison, during the year ended December 31, 2013, the decrease in the Fund’s NAV resulted primarily from a decrease from 62,504 outstanding shares at December 31, 2012 to 37,504 outstanding Shares at December 31, 2013. The decrease in the Fund’s NAV also resulted in part from the cumulative effect of the Fund seeking daily investment results (before fees and expenses) that correspond to 2x of the daily performance of the Bloomberg Commodity Index.
For the years ended December 31, 2015, 2014 and 2013, the Fund’s daily performance had a statistical correlation over 0.99 to 2x of the daily performance of its benchmark. The Fund’s per Share NAV decrease of 45.5% for the year ended December 31, 2015, as compared to the Fund’s per Share NAV decrease of 32.9% for the year ended December 31, 2014, was primarily due to a greater depreciation in the value of the assets of the Fund during the year ended December 31, 2015. The Fund’s per Share NAV decrease of 32.9% for the year ended December 31, 2014, as compared to the Fund’s per Share NAV decrease of 20.3% for the year ended December 31, 2013, was primarily due to a greater depreciation in the value of the assets of the Fund during the year ended December 31, 2014.
During the year ended December 31, 2015, the Fund’s per Share NAV reached its high for the year on May 14, 2015 at $52.57 per Share and reached its low for the year on December 17, 2015 at $27.07 per Share. By comparison, during the year ended December 31, 2014, the Fund’s per Share NAV reached its high for the year on April 29, 2014 at $93.80 per Share and reached its low for the year on December 31, 2014 at $52.13 per Share. By comparison, during the year ended December 31, 2013, the Fund’s per Share NAV reached its high for the year on January 30, 2013 at $102.88 per Share and reached its low for the year on November 19, 2013 at $73.32 per Share.
The benchmark’s decline of 24.7% for the year ended December 31, 2015, as compared to the benchmark’s decline of 17.0% for the year ended December 31, 2014, can be attributed to a greater depreciation of the underlying components of the index during the year ended December 31, 2015. By comparison, the benchmark’s decline of 17.0% for the year ended December 31, 2014, as compared to the benchmark’s decline of 9.6% for the year ended December 31, 2013, can be attributed to a greater depreciation of the underlying components of the index during the year ended December 31, 2014.
Net Income/Loss
The following table provides summary income information for the Fund for the years ended December 31, 2015, 2014 and 2013:
| Year Ended December 31, 2015 |
Year Ended December 31, 2014 |
Year Ended December 31, 2013 |
||||||||||
| Net investment income (loss) |
$ | (33,542 | ) | $ | (30,991 | ) | $ | (38,477 | ) | |||
| Management fee |
34,275 | 32,321 | 40,543 | |||||||||
| Net realized gain (loss) |
(2,952,171 | ) | (1,065,579 | ) | (1,254,295 | ) | ||||||
| Change in net unrealized appreciation/depreciation |
146,716 | (346,460 | ) | 321,274 | ||||||||
| Net income (loss) |
$ | (2,838,997 | ) | $ | (1,443,030 | ) | $ | (971,498 | ) | |||
98
Table of Contents
The Fund’s net income decreased for the year ended December 31, 2015, as compared to the year ended December 31, 2014, primarily due to a greater depreciation of the underlying components of the index, during the year ended December 31, 2015. By comparison, the Fund’s net income decreased for the year ended December 31, 2014, as compared to the year ended December 31, 2013, primarily due to a greater depreciation of the underlying components of the index, during the year ended December 31, 2014.
| * | See Note 1 of the Notes to Financial Statements in Item 15 of Part IV in this Annual Report on Form 10-K regarding the reverse Share split for ProShares Ultra Bloomberg Commodity. |
ProShares Ultra Bloomberg Crude Oil*
Fund Performance
The following table provides summary performance information for the Fund for the years ended December 31, 2015, 2014 and 2013:
| Year Ended December 31, 2015 |
Year Ended December 31, 2014 |
Year Ended December 31, 2013 |
||||||||||
| NAV beginning of period |
$ | 450,562,988 | $ | 142,773,429 | $ | 483,508,964 | ||||||
| NAV end of period |
$ | 783,922,475 | $ | 450,562,988 | $ | 142,773,429 | ||||||
| Percentage change in NAV |
74.0 | % | 215.6 | % | (70.5 | )% | ||||||
| Shares outstanding beginning of period |
8,879,834 | 889,834 | 3,289,834 | |||||||||
| Shares outstanding end of period |
62,327,867 | 8,879,834 | 889,834 | |||||||||
| Percentage change in shares outstanding |
601.9 | % | 897.9 | % | (73.0 | )% | ||||||
| Shares created |
86,830,000 | 10,080,000 | 2,290,000 | |||||||||
| Shares redeemed |
33,381,967 | 2,090,000 | 4,690,000 | |||||||||
| Per share NAV beginning of period |
$ | 50.74 | $ | 160.45 | $ | 146.97 | ||||||
| Per share NAV end of period |
$ | 12.58 | $ | 50.74 | $ | 160.45 | ||||||
| Percentage change in per share NAV |
(75.2 | )% | (68.4 | )% | 9.2 | % | ||||||
| Percentage change in benchmark |
(44.4 | )% | (41.7 | )% | 6.8 | % | ||||||
| Benchmark annualized volatility |
45.5 | % | 23.7 | % | 18.0 | % | ||||||
During the year ended December 31, 2015, the increase in the Fund’s NAV resulted from an increase from 8,879,834 outstanding Shares at December 31, 2014 to 62,327,867 outstanding Shares at December 31, 2015. The increase in the Fund’s NAV was offset by the cumulative effect of the Fund seeking daily investment results (before fees and expenses) that correspond to 2x of the daily performance of the Bloomberg WTI Crude Oil SubindexSM. By comparison, during the year ended December 31, 2014, the increase in the Fund’s NAV resulted from an increase from 889,834 outstanding Shares at December 31, 2013 to 8,879,834 outstanding Shares at December 31, 2014. The increase in the Fund’s NAV was offset by the cumulative effect of the Fund seeking daily investment results (before fees and expenses) that correspond to 2x of the daily performance of the Bloomberg WTI Crude Oil SubindexSM. By comparison, during the year ended December 31, 2013, the decrease in the Fund’s NAV resulted from a decrease from 3,289,834 outstanding Shares at December 31, 2012 to 889,834 outstanding Shares at December 31, 2013. The decrease in the Fund’s NAV was offset by the cumulative effect of the Fund seeking daily investment results (before fees and expenses) that correspond to 2x of the daily performance of the Bloomberg WTI Crude Oil SubindexSM.
For the years ended December 31, 2015, 2014 and 2013, the Fund’s daily performance had a statistical correlation over 0.99 to 2x of the daily performance of its benchmark. The Fund’s per Share NAV decrease of 75.2% for the year ended December 31, 2015, as compared to the Fund’s per Share NAV decrease of 68.4% for the year ended December 31, 2014, was primarily due to a greater depreciation in the value of the assets of the Fund during the year ended December 31, 2015. The Fund’s per Share NAV decrease of 68.4% for the year ended December 31, 2014, as compared to the Fund’s per Share NAV increase of 9.2% for the year ended December 31, 2013, was primarily due to a depreciation in the value of the assets of the Fund during the year ended December 31, 2014.
99
Table of Contents
During the year ended December 31, 2015, the Fund’s per Share NAV reached its high for the year on May 6, 2015 at $50.96 per Share and reached its low for the year on December 21, 2015 at $11.79 per Share. By comparison, during the year ended December 31, 2014, the Fund’s per Share NAV reached its high for the year on June 20, 2014 at $200.70 per Share and reached its low for the year on December 31, 2014 at $50.74 per Share. By comparison, during the year ended December 31, 2013, the Fund’s per Share NAV reached its high for the year on September 6, 2013 at $199.35 per Share and reached its low for the year on April 17, 2013 at $125.30 per Share.
The benchmark’s decline of 44.4% for the year ended December 31, 2015, as compared to the benchmark’s decline of 41.7% for the year ended December 31, 2014, can be attributed to a greater decrease in the price of WTI Crude Oil during the year ended December 31, 2015. By comparison, the benchmark’s decline of 41.7% for the year ended December 31, 2014, as compared to the benchmark’s rise of 6.8% for the year ended December 31, 2013, can be attributed to a decrease in the price of WTI Crude Oil during the year ended December 31, 2014.
Net Income/Loss
The following table provides summary income information for the Fund for the years ended December 31, 2015, 2014 and 2013:
| Year Ended December 31, 2015 |
Year Ended December 31, 2014 |
Year Ended December 31, 2013 |
||||||||||
| Net investment income (loss) |
$ | (8,473,155 | ) | $ | (1,766,364 | ) | $ | (2,196,281 | ) | |||
| Management fee |
8,230,180 | 1,769,248 | 2,275,701 | |||||||||
| Brokerage commission |
639,133 | 65,408 | 55,871 | |||||||||
| Net realized gain (loss) |
(896,154,368 | ) | (243,314,151 | ) | 120,757,237 | |||||||
| Change in net unrealized appreciation/depreciation |
32,543,124 | (125,247,771 | ) | (52,715,067 | ) | |||||||
| Net income (loss) |
$ | (872,084,399 | ) | $ | (370,328,286 | ) | $ | 65,845,889 | ||||
The Fund’s net income decreased for the year ended December 31, 2015, as compared to the year ended December 31, 2014, primarily due to a greater decrease in the price of WTI Crude Oil during the year ended December 31, 2015. By comparison, the Fund’s net income decreased for the year ended December 31, 2014, as compared to the year ended December 31, 2013, primarily due to a decrease in the price of WTI Crude Oil during the year ended December 31, 2014.
| * | See Note 1 of the Notes to Financial Statements in Item 15 of Part IV in this Annual Report on Form 10-K regarding the reverse Share split for ProShares Ultra Bloomberg Crude Oil. |
ProShares Ultra Bloomberg Natural Gas*
Fund Performance
The following table provides summary performance information for the Fund for the years ended December 31, 2015, 2014 and 2013:
| Year Ended December 31, 2015 |
Year Ended December 31, 2014 |
Year Ended December 31, 2013 |
||||||||||
| NAV beginning of period |
$ | 70,433,207 | $ | 62,915,779 | $ | 73,019,370 | ||||||
| NAV end of period |
$ | 38,851,184 | $ | 70,433,207 | $ | 62,915,779 | ||||||
| Percentage change in NAV |
(44.8 | )% | 11.9 | % | (13.8 | )% | ||||||
| Shares outstanding beginning of period |
1,142,485 | 404,985 | 467,485 | |||||||||
| Shares outstanding end of period |
2,092,170 | 1,142,485 | 404,985 | |||||||||
| Percentage change in shares outstanding |
83.1 | % | 182.1 | % | (13.4 | )% | ||||||
| Shares created |
2,137,500 | 1,437,500 | 1,350,000 | |||||||||
| Shares redeemed |
1,187,815 | 700,000 | 1,412,500 | |||||||||
| Per share NAV beginning of period |
$ | 61.65 | $ | 155.35 | $ | 156.20 | ||||||
| Per share NAV end of period |
$ | 18.57 | $ | 61.65 | $ | 155.35 | ||||||
| Percentage change in per share NAV |
(69.9 | )% | (60.3 | )% | (0.5 | )% | ||||||
| Percentage change in benchmark |
(40.0 | )% | (30.7 | )% | 4.9 | % | ||||||
| Benchmark annualized volatility |
40.4 | % | 42.1 | % | 29.9 | % | ||||||
100
Table of Contents
During the year ended December 31, 2015, the decrease in the Fund’s NAV resulted from the cumulative effect of the Fund seeking daily investment results (before fees and expenses) that correspond to 2x of the daily performance of the Bloomberg Natural Gas SubindexSM. The decrease in the Fund’s NAV was offset by an increase from 1,142,485 outstanding Shares at December 31, 2014 to 2,092,170 outstanding Shares at December 31, 2015. By comparison, during the year ended December 31, 2014, the increase in the Fund’s NAV resulted from an increase from 404,985 outstanding Shares at December 31, 2013 to 1,142,485 outstanding Shares at December 31, 2014. The increase in the Fund’s NAV was offset by the cumulative effect of the Fund seeking daily investment results (before fees and expenses) that correspond to 2x of the daily performance of the Bloomberg Natural Gas SubindexSM. By comparison, during the year ended December 31, 2013, the decrease in the Fund’s NAV resulted primarily from a decrease from 467,485 outstanding Shares at December 31, 2012 to 404,985 outstanding Shares at December 31, 2013. The decrease in the Fund’s NAV also resulted in part from the cumulative effect of the Fund seeking daily investment results (before fees and expenses) that correspond to 2x of the daily performance of the Bloomberg Natural Gas SubindexSM.
For the years ended December 31, 2015, 2014 and 2013, the Fund’s daily performance had a statistical correlation over 0.99 to 2x of the daily performance of its benchmark. The Fund’s per Share NAV decrease of 69.9% for the year ended December 31, 2015, as compared to the Fund’s per Share NAV decrease of 60.3% for the year ended December 31, 2014, was primarily due to a greater depreciation in the value of the assets of the Fund during the year ended December 31, 2015. The Fund’s per Share NAV decrease of 60.3% for the year ended December 31, 2014, as compared to the Fund’s per Share NAV decrease of 0.5% for the year ended December 31, 2013, was primarily due to a greater depreciation in the value of the assets of the Fund during the year ended December 31, 2014.
During the year ended December 31, 2015, the Fund’s per Share NAV reached its high for the year on January 14, 2015 at $74.33 per Share and reached its low for the year on December 16, 2015 at $12.83 per Share. By comparison, during the year ended December 31, 2014, the Fund’s per Share NAV reached its high for the year on January 29, 2014 at $255.12 per Share and reached its low for the year on December 31, 2014 at $61.65 per Share. By comparison, during the year ended December 31, 2013, the Fund’s per Share NAV reached its high for the year on April 19, 2013 at $237.28 per Share and reached its low for the year on November 4, 2013 at $109.64 per Share.
The benchmark’s decline of 40.0% for the year ended December 31, 2015, as compared to the benchmark’s decline of 30.7% for the year ended December 31, 2014, can be attributed to a greater decrease in the price of Henry Hub Natural Gas during the year ended December 31, 2015. By comparison, the benchmark’s decline of 30.7% for the year ended December 31, 2014, as compared to the benchmark’s rise of 4.9% for the year ended December 31, 2013, can be attributed to a decrease in the price of Henry Hub Natural Gas during the year ended December 31, 2014.
Net Income/Loss
The following table provides summary income information for the Fund for the years ended December 31, 2015, 2014 and 2013:
| Year Ended December 31, 2015 |
Year Ended December 31, 2014 |
Year Ended December 31, 2013 |
||||||||||
| Net investment income (loss) |
$ | (761,335 | ) | $ | (528,581 | ) | $ | (821,690 | ) | |||
| Management fee |
574,158 | 455,794 | 707,598 | |||||||||
| Brokerage commission |
207,344 | 88,748 | 147,433 | |||||||||
| Net realized gain (loss) |
(100,772,476 | ) | (6,459,728 | ) | 41,422,856 | |||||||
| Change in net unrealized appreciation/depreciation |
41,201,866 | (31,234,281 | ) | 162,544 | ||||||||
| Net income (loss) |
$ | (60,331,945 | ) | $ | (38,222,590 | ) | $ | 40,763,710 | ||||
101
Table of Contents
The Fund’s net income decreased for the year ended December 31, 2015, as compared to the year ended December 31, 2014, primarily due to a greater decrease in the price of Henry Hub Natural Gas during the year ended December 31, 2015. By comparison, the Fund’s net income decreased for the year ended December 31, 2014, as compared to the year ended December 31, 2013, primarily due to a decrease in the price of Henry Hub Natural Gas during the year ended December 31, 2014.
| * | See Note 1 of the Notes to Financial Statements in Item 15 of Part IV in this Annual Report on Form 10-K regarding the reverse Share split for ProShares Ultra Bloomberg Natural Gas. |
ProShares Ultra Gold
Fund Performance
The following table provides summary performance information for the Fund for the years ended December 31, 2015, 2014 and 2013:
| Year Ended December 31, 2015 |
Year Ended December 31, 2014 |
Year Ended December 31, 2013 |
||||||||||
| NAV beginning of period |
$ | 102,003,345 | $ | 132,017,405 | $ | 335,054,752 | ||||||
| NAV end of period |
$ | 69,864,815 | $ | 102,003,345 | $ | 132,017,405 | ||||||
| Percentage change in NAV |
(31.5 | )% | (22.7 | )% | (60.6 | )% | ||||||
| Shares outstanding beginning of period |
2,550,014 | 3,200,014 | 4,000,014 | |||||||||
| Shares outstanding end of period |
2,350,014 | 2,550,014 | 3,200,014 | |||||||||
| Percentage change in shares outstanding |
(7.8 | )% | (20.3 | )% | (20.0 | )% | ||||||
| Shares created |
150,000 | 300,000 | 550,000 | |||||||||
| Shares redeemed |
350,000 | 950,000 | 1,350,000 | |||||||||
| Per share NAV beginning of period |
$ | 40.00 | $ | 41.26 | $ | 83.76 | ||||||
| Per share NAV end of period |
$ | 29.73 | $ | 40.00 | $ | 41.26 | ||||||
| Percentage change in per share NAV |
(25.7 | )% | (3.1 | )% | (50.7 | )% | ||||||
| Percentage change in benchmark |
(12.1 | )% | 0.1 | % | (27.3 | )% | ||||||
| Benchmark annualized volatility |
14.4 | % | 12.9 | % | 21.8 | % | ||||||
During the year ended December 31, 2015, the decrease in the Fund’s NAV resulted primarily from a decrease from 2,550,014 outstanding Shares at December 31, 2014 to 2,350,014 outstanding Shares at December 31, 2015. The decrease in the Fund’s NAV also resulted in part from the cumulative effect of the Fund seeking daily investment results (before fees and expenses) that correspond to 2x of the daily performance of gold bullion as measured by the U.S. dollar p.m. LBMA Gold Price†. By comparison, during the year ended December 31, 2014, the decrease in the Fund’s NAV resulted primarily from the cumulative effect of the Fund seeking daily investment results (before fees and expenses) that correspond to 2x of the daily performance of gold bullion as measured by the U.S. dollar p.m. fixing price for delivery in London. The decrease in the Fund’s NAV also resulted in part from a decrease from 3,200,014 outstanding Shares at December 31, 2013 to 2,550,014 outstanding Shares at December 31, 2014. By comparison, during the year ended December 31, 2013, the decrease in the Fund’s NAV resulted primarily from the cumulative effect of the Fund seeking daily investment results (before fees and expenses) that correspond to 2x of the daily performance of gold bullion as measured by the U.S. dollar p.m. fixing price for delivery in London. The decrease in the Fund’s NAV also resulted in part from a decrease from 4,000,014 outstanding Shares at December 31, 2012 to 3,200,014 outstanding Shares at December 31, 2013.
For the years ended December 31, 2015, 2014 and 2013, the Fund’s daily performance had a statistical correlation over 0.99 to 2x of the daily performance of its benchmark. The Fund’s per Share NAV decrease of 25.7% for the year ended December 31, 2015, as compared to the Fund’s per Share NAV decrease of 3.1% for the year ended December 31, 2014, was primarily due to a greater depreciation in the value of the assets of the Fund during the year ended December 31, 2015. The Fund’s per Share NAV decrease of 3.1% for the year ended December 31, 2014, as compared to the Fund’s per Share NAV decrease of 50.7% for the year ended December 31, 2013, was primarily due to a lesser depreciation in the value of the assets of the Fund during the year ended December 31, 2014.
During the year ended December 31, 2015, the Fund’s per Share NAV reached its high for the year on January 22, 2015 at $46.03 per Share and reached its low for the year on December 17, 2015 at $29.17 per Share. By comparison, during the year ended December 31, 2014, the Fund’s per Share NAV reached its high for the year on March 14, 2014 at $54.16 per Share and reached its low for the year on November 5, 2014 at $36.05 per Share. By comparison, during the year ended December 31, 2013, the Fund’s per Share NAV reached its high for the year on January 2, 2013 at $87.40 per Share and reached its low for the year on December 20, 2013 at $40.65 per Share.
102
Table of Contents
The benchmark’s decrease of 12.1% for the year ended December 31, 2015, as compared to the benchmark’s increase of 0.1% for the year ended December 31, 2014, can be attributed to a decrease in the price of spot gold in U.S. dollar terms during the year ended December 31, 2015. By comparison, the benchmark’s increase of 0.1% for the year ended December 31, 2014, as compared to the benchmark’s decline of 27.3% for the year ended December 31, 2013, can be attributed to an increase in the price of spot gold in U.S. dollar terms during the year ended December 31, 2014.
Net Income/Loss
The following table provides summary income information for the Fund for the years ended December 31, 2015, 2014 and 2013:
| Year Ended December 31, 2015 |
Year Ended December 31, 2014 |
Year Ended December 31, 2013 |
||||||||||
| Net investment income (loss) |
$ | (796,424 | ) | $ | (1,157,348 | ) | $ | (1,925,215 | ) | |||
| Management fee |
839,083 | 1,212,064 | 2,055,613 | |||||||||
| Brokerage commission |
41 | 39 | 39 | |||||||||
| Net realized gain (loss) |
(18,606,208 | ) | (9,672,972 | ) | (165,625,006 | ) | ||||||
| Change in net unrealized appreciation/depreciation |
(4,309,443 | ) | 8,888,643 | 8,820,461 | ||||||||
| Net income (loss) |
$ | (23,712,075 | ) | $ | (1,941,677 | ) | $ | (158,729,760 | ) | |||
The Fund’s net income decreased for the year ended December 31, 2015, as compared to the year ended December 31, 2014, primarily due to a decrease in the price of spot gold in U.S. dollar terms in conjunction with share transactions during the year ended December 31, 2015. By comparison, the Fund’s net income increased for the year ended December 31, 2014, as compared to the year ended December 31, 2013, primarily due to an increase in the price of spot gold in U.S. dollar terms in conjunction with share transactions during the year ended December 31, 2014.
† On March 19, 2015, the company that ran the London U.S. dollar gold fixing ceased calculating the price of gold for the LBMA. The LBMA selected ICE Benchmark Administration to calculate the price, which was renamed the LBMA Gold Price, and is based on an electronic, physically settled auction-based methodology, beginning on March 20, 2015.
ProShares Ultra Silver
Fund Performance
The following table provides summary performance information for the Fund for the years ended December 31, 2015, 2014 and 2013:
| Year Ended December 31, 2015 |
Year Ended December 31, 2014 |
Year Ended December 31, 2013 |
||||||||||
| NAV beginning of period |
$ | 291,169,743 | $ | 465,479,519 | $ | 747,725,400 | ||||||
| NAV end of period |
$ | 216,416,642 | $ | 291,169,743 | $ | 465,479,519 | ||||||
| Percentage change in NAV |
(25.7 | )% | (37.4 | )% | (37.7 | )% | ||||||
| Shares outstanding beginning of period |
7,396,533 | 7,350,007 | 4,350,007 | |||||||||
| Shares outstanding end of period |
7,996,533 | 7,396,533 | 7,350,007 | |||||||||
| Percentage change in shares outstanding |
8.1 | % | 0.6 | % | 69.0 | % | ||||||
| Shares created |
2,700,000 | 2,487,500 | 4,112,500 | |||||||||
| Shares redeemed |
2,100,000 | 2,440,974 | 1,112,500 | |||||||||
| Per share NAV beginning of period |
$ | 39.37 | $ | 63.33 | $ | 171.89 | ||||||
| Per share NAV end of period |
$ | 27.06 | $ | 39.37 | $ | 63.33 | ||||||
| Percentage change in per share NAV |
(31.3 | )% | (37.8 | )% | (63.2 | )% | ||||||
| Percentage change in benchmark |
(13.5 | )% | (18.1 | )% | (34.9 | )% | ||||||
| Benchmark annualized volatility |
24.1 | % | 21.8 | % | 31.5 | % | ||||||
103
Table of Contents
During the year ended December 31, 2015, the decrease in the Fund’s NAV resulted from the cumulative effect of the Fund seeking daily investment results (before fees and expenses) that correspond to 2x of the daily performance of silver bullion as measured by the London Silver Price†. The decrease in the Fund’s NAV was offset by an increase from 7,396,533 outstanding Shares at December 31, 2014 to 7,996,533 outstanding Shares at December 31, 2015. By comparison, during the year ended December 31, 2014, the decrease in the Fund’s NAV resulted from the cumulative effect of the Fund seeking daily investment results (before fees and expenses) that correspond to 2x of the daily performance of silver bullion as measured by the London Silver Price†. The decrease in the Fund’s NAV was offset by an increase from 7,350,007 outstanding Shares at December 31, 2013 to 7,396,533 outstanding Shares at December 31, 2014. By comparison, during the year ended December 31, 2013, the decrease in the Fund’s NAV resulted from the cumulative effect of the Fund seeking daily investment results (before fees and expenses) that correspond to 2x of the daily performance of silver bullion as measured by the U.S. dollar fixing price for delivery in London. The decrease in the Fund’s NAV was offset by an increase from 4,350,007 outstanding Shares at December 31, 2012 to 7,350,007 outstanding Shares at December 31, 2013.
For the years ended December 31, 2015, 2014 and 2013, the Fund’s daily performance had a statistical correlation over 0.99 to 2x of the daily performance of its benchmark. The Fund’s per Share NAV decrease of 31.3% for the year ended December 31, 2015, as compared to the Fund’s per Share NAV decrease of 37.8% for the year ended December 31, 2014, was primarily due to a lesser depreciation in the value of the assets of the Fund during the year ended December 31, 2015. The Fund’s per Share NAV decrease of 37.8% for the year ended December 31, 2014, as compared to the Fund’s per Share NAV decrease of 63.2% for the year ended December 31, 2013, was primarily due to a lesser depreciation in the value of the assets of the Fund during the year ended December 31, 2014.
During the year ended December 31, 2015, the Fund’s per Share NAV reached its high for the year on January 23, 2015 at $50.86 per Share and reached its low for the year on December 14, 2015 at $26.73 per Share. By comparison, during the year ended December 31, 2014, the Fund’s per Share NAV reached its high for the year on February 24, 2014 at $80.11 per Share and reached its low for the year on November 6, 2014 at $36.63 per Share. By comparison, during the year ended December 31, 2013, the Fund’s per Share NAV reached its high for the year on January 23, 2013 at $197.58 per Share and reached its low for the year on December 4, 2013 at $60.89 per Share.
The benchmark’s decline of 13.5% for the year ended December 31, 2015, as compared to the benchmark’s decline of 18.1% for the year ended December 31, 2014, can be attributed to a lesser decline in the price of spot silver in U.S. dollar terms during the year ended December 31, 2015. The benchmark’s decline of 18.1% for the year ended December 31, 2014, as compared to the benchmark’s decline of 34.9% for the year ended December 31, 2013, can be attributed to a lesser decline in the price of spot silver in U.S. dollar terms during the year ended December 31, 2014.
Net Income/Loss
The following table provides summary income information for the Fund for the years ended December 31, 2015, 2014 and 2013:
| Year Ended December 31, 2015 |
Year Ended December 31, 2014 |
Year Ended December 31, 2013 |
||||||||||
| Net investment income (loss) |
$ | (2,507,859 | ) | $ | (3,968,608 | ) | $ | (5,280,707 | ) | |||
| Management fee |
2,664,160 | 4,148,207 | 5,628,988 | |||||||||
| Brokerage commission |
52 | 43 | 36 | |||||||||
| Net realized gain (loss) |
(78,309,750 | ) | (155,543,194 | ) | (701,518,468 | ) | ||||||
| Change in net unrealized appreciation/depreciation |
(10,182,576 | ) | (9,900,963 | ) | 143,242,691 | |||||||
| Net income (loss) |
$ | (91,000,185 | ) | $ | (169,412,765 | ) | $ | (563,556,484 | ) | |||
104
Table of Contents
The Fund’s net income increased for the year ended December 31, 2015, as compared to the year ended December 31, 2014, primarily due to a lesser decline in the price of spot silver in U.S. dollar terms during the year ended December 31, 2015. By comparison, the Fund’s net income increased for the year ended December 31, 2014, as compared to the year ended December 31, 2013, primarily due to a lesser decline in the price of spot silver in U.S. dollar terms during the year ended December 31, 2014.
| † | On August 14, 2014, the company that ran the London U.S. dollar silver fixing ceased calculating the price of silver for the LBMA. The LBMA selected the CME Group and Thomson Reuters to calculate the price, which was renamed the London Silver Price, beginning August 15, 2014. |
ProShares Ultra Euro
Fund Performance
The following table provides summary performance information for the Fund for the years ended December 31, 2015, 2014 and 2013:
| Year Ended December 31, 2015 |
Year Ended December 31, 2014 |
Year Ended December 31, 2013 |
||||||||||
| NAV beginning of period |
$ | 2,981,441 | $ | 2,603,827 | $ | 4,870,316 | ||||||
| NAV end of period |
$ | 10,857,730 | $ | 2,981,441 | $ | 2,603,827 | ||||||
| Percentage change in NAV |
264.2 | % | 14.5 | % | (46.5 | )% | ||||||
| Shares outstanding beginning of period |
150,014 | 100,014 | 200,014 | |||||||||
| Shares outstanding end of period |
700,014 | 150,014 | 100,014 | |||||||||
| Percentage change in shares outstanding |
366.6 | % | 50.0 | % | (50.0 | )% | ||||||
| Shares created |
950,000 | 50,000 | 50,000 | |||||||||
| Shares redeemed |
400,000 | — | 150,000 | |||||||||
| Per share NAV beginning of period |
$ | 19.87 | $ | 26.03 | $ | 24.35 | ||||||
| Per share NAV end of period |
$ | 15.51 | $ | 19.87 | $ | 26.03 | ||||||
| Percentage change in per share NAV |
(21.9 | )% | (23.7 | )% | 6.9 | % | ||||||
| Percentage change in benchmark |
(10.2 | )% | (12.0 | )% | 4.3 | % | ||||||
| Benchmark annualized volatility |
12.1 | % | 6.1 | % | 7.5 | % | ||||||
During the year ended December 31, 2015, the increase in the Fund’s NAV resulted from an increase from 150,014 outstanding Shares at December 31, 2014 to 700,014 outstanding Shares at December 31, 2015. The increase in the Fund’s NAV was offset by the cumulative effect of the Fund seeking daily investment results (before fees and expenses) that correspond to 2x of the daily performance of the spot price of the euro versus the U.S. dollar. By comparison, during the year ended December 31, 2014, the increase in the Fund’s NAV resulted from an increase from 100,014 outstanding Shares at December 31, 2013 to 150,014 outstanding Shares at December 31, 2014. The increase in the Fund’s NAV was offset by the cumulative effect of the Fund seeking daily investment results (before fees and expenses) that correspond to 2x of the daily performance of the spot price of the euro versus the U.S. dollar. By comparison, during the year ended December 31, 2013, the decrease in the Fund’s NAV resulted from a decrease from 200,014 outstanding Shares at December 31, 2012 to 100,014 outstanding Shares at December 31, 2013. The decrease in the Fund’s NAV was offset by the cumulative effect of the Fund seeking daily investment results (before fees and expenses) that correspond to 2x of the daily performance of the spot price of the euro versus the U.S. dollar.
For the years ended December 31, 2015, 2014 and 2013, the Fund’s daily performance had a statistical correlation over 0.99 to 2x of the daily performance of its benchmark. The Fund’s per Share NAV decrease of 21.9% for the year ended December 31, 2015, as compared to the Fund’s per Share NAV decrease of 23.7% for the year ended December 31, 2014, was primarily due to a lesser depreciation in the value of the assets held by the Fund during the year ended December 31, 2015. The Fund’s per Share NAV decrease of 23.7% for the year ended December 31, 2014, as compared to the Fund’s per Share NAV increase of 6.9% for the year ended December 31, 2013, was primarily due to a depreciation in the value of the assets held by the Fund during the year ended December 31, 2014.
During the year ended December 31, 2015, the Fund’s per Share NAV reached its high for the year on January 2, 2015 at $19.55 per Share and reached its low for the year on November 30, 2015 at $14.73 per Share. By comparison, during the year ended December 31, 2014, the Fund’s per Share NAV reached its high for the year on March 18, 2014 at $26.63 per Share and reached its low for the year on December 31, 2014 at $19.87 per Share. By comparison, during the year ended December 31, 2013, the Fund’s per Share NAV reached its high for the year on October 25, 2013 at $26.28 per Share and reached its low for the year on July 9, 2013 at $22.64 per Share.
105
Table of Contents
The benchmark’s decline of 10.2% for the year ended December 31, 2015, as compared to the benchmark’s decline of 12.0% for the year ended December 31, 2014, can be attributed to a lesser decrease in the value of the euro versus the U.S. dollar during the year ended December 31, 2015. By comparison, the benchmark’s decline of 12.0% for the year ended December 31, 2014, as compared to the benchmark’s rise of 4.3% for the year ended December 31, 2013, can be attributed to a decrease in the value of the euro versus the U.S. dollar during the year ended December 31, 2014.
Net Income/Loss
The following table provides summary income information for the Fund for the years ended December 31, 2015, 2014 and 2013:
| Year Ended December 31, 2015 |
Year Ended December 31, 2014 |
Year Ended December 31, 2013 |
||||||||||
| Net investment income (loss) |
$ | (104,071 | ) | $ | (22,247 | ) | $ | (35,024 | ) | |||
| Management fee |
106,868 | 23,330 | 36,925 | |||||||||
| Net realized gain (loss) |
(1,982,317 | ) | (420,528 | ) | 210,205 | |||||||
| Change in net unrealized appreciation/depreciation |
707,922 | (204,515 | ) | 13,879 | ||||||||
| Net income (loss) |
$ | (1,378,466 | ) | $ | (647,290 | ) | $ | 189,060 | ||||
The Fund’s net income decreased for the year ended December 31, 2015, as compared to the year ended December 31, 2014, primarily due to a lesser decrease in the value of the euro versus the U.S. dollar during the year ended December 31, 2015. By comparison, the Fund’s net income decreased for the year ended December 31, 2014, as compared to the year ended December 31, 2013, primarily due to a decrease in the value of the euro versus the U.S. dollar during the year ended December 31, 2014.
ProShares Ultra Yen*
Fund Performance
The following table provides summary performance information for the Fund for the years ended December 31, 2015, 2014 and 2013:
| Year Ended December 31, 2015 |
Year Ended December 31, 2014 |
Year Ended December 31, 2013 |
||||||||||
| NAV beginning of period |
$ | 2,118,028 | $ | 2,795,026 | $ | 4,227,995 | ||||||
| NAV end of period |
$ | 5,473,848 | $ | 2,118,028 | $ | 2,795,026 | ||||||
| Percentage change in NAV |
158.4 | % | (24.2 | )% | (33.9 | )% | ||||||
| Shares outstanding beginning of period |
37,504 | 37,504 | 37,504 | |||||||||
| Shares outstanding end of period |
99,974 | 37,504 | 37,504 | |||||||||
| Percentage change in shares outstanding |
166.6 | % | 0.0 | % | 0.0 | % | ||||||
| Shares created |
75,000 | 12,500 | 12,500 | |||||||||
| Shares redeemed |
12,530 | 12,500 | 12,500 | |||||||||
| Per share NAV beginning of period |
$ | 56.47 | $ | 74.53 | $ | 112.73 | ||||||
| Per share NAV end of period |
$ | 54.75 | $ | 56.47 | $ | 74.53 | ||||||
| Percentage change in per share NAV |
(3.0 | )% | (24.2 | )% | (33.9 | )% | ||||||
| Percentage change in benchmark |
(0.4 | )% | (12.1 | )% | (17.6 | )% | ||||||
| Benchmark annualized volatility |
8.2 | % | 7.9 | % | 12.3 | % | ||||||
During the year ended December 31, 2015, the increase in the Fund’s NAV resulted from an increase from 37,504 outstanding Shares at December 31, 2014 to 99,974 outstanding Shares at December 31, 2015. The increase in the Fund’s NAV was offset by the cumulative effect of the Fund seeking daily investment results (before fees and expenses) that correspond to 2x of the daily performance of the spot price of the Japanese yen versus the U.S. dollar during the year ended December 31, 2015. By comparison, during the year ended December 31, 2014, the decrease in the Fund’s NAV resulted from the cumulative effect of the Fund seeking daily investment results (before fees and expenses) that correspond to 2x of the daily performance of the spot price of the Japanese yen versus the U.S. dollar
106
Table of Contents
during the year ended December 31, 2014. There was no net change in the Fund’s outstanding Shares from December 31, 2013 to December 31, 2014. By comparison, during the year ended December 31, 2013, the decrease in the Fund’s NAV resulted from the cumulative effect of the Fund seeking daily investment results (before fees and expenses) that correspond to 2x of the daily performance of the spot price of the Japanese yen versus the U.S. dollar during the year ended December 31, 2012. There was no net change in the Fund’s outstanding Shares from December 31, 2012 to December 31, 2013.
For the years ended December 31, 2015, 2014 and 2013, the Fund’s daily performance had a statistical correlation over 0.99 to 2x of the daily performance of its benchmark. The Fund’s per Share NAV decrease of 3.0% for the year ended December 31, 2015, as compared to the Fund’s per Share NAV decrease of 24.2% for the year ended December 31, 2014, was primarily due to a lesser depreciation in the value of the assets held by the Fund during the year ended December 31, 2015. The Fund’s per Share NAV decrease of 24.2% for the year ended December 31, 2014, as compared to the Fund’s per Share NAV decrease of 33.9% for the year ended December 31, 2013, was primarily due to a lesser depreciation in the value of the assets held by the Fund during the year ended December 31, 2014.
During the year ended December 31, 2015, the Fund’s per Share NAV reached its high for the year on January 15, 2015 at $59.83 per Share and reached its low for the year on June 5, 2015 at $50.86 per Share. By comparison, during the year ended December 31, 2014, the Fund’s per Share NAV reached its high for the year on February 3, 2014 at $80.84 per Share and reached its low for the year on December 5, 2014 at $55.12 per Share. By comparison, during the year ended December 31, 2013, the Fund’s per Share NAV reached its high for the year on January 8, 2013 at $111.88 per Share and reached its low for the year on December 31, 2013 at $74.52 per Share.
The benchmark’s decline of 0.4% for the year ended December 31, 2015, as compared to the benchmark’s decline of 12.1% for the year ended December 31, 2014, can be attributed to a lesser decline in the value of the Japanese yen versus the U.S. dollar during the year ended December 31, 2015. By comparison, the benchmark’s decline of 12.1% for the year ended December 31, 2014, as compared to the benchmark’s decline of 17.6% for the year ended December 31, 2013, can be attributed to a lesser decline in the value of the Japanese yen versus the U.S. dollar during the year ended December 31, 2014.
Net Income/Loss
The following table provides summary income information for the Fund for the years ended December 31, 2015, 2014 and 2013:
| Year Ended December 31, 2015 |
Year Ended December 31, 2014 |
Year Ended December 31, 2013 |
||||||||||
| Net investment income (loss) |
$ | (44,423 | ) | $ | (20,862 | ) | $ | (31,774 | ) | |||
| Management fee |
48,032 | 21,963 | 33,569 | |||||||||
| Net realized gain (loss) |
(472,907 | ) | (540,304 | ) | (1,879,101 | ) | ||||||
| Change in net unrealized appreciation/depreciation |
276,816 | 143,775 | 335,084 | |||||||||
| Net income (loss) |
$ | (240,514 | ) | $ | (417,391 | ) | $ | (1,575,791 | ) | |||
The Fund’s net income increased for the year ended December 31, 2015, as compared to the year ended December 31, 2014, primarily due to a lesser decline in the value of the Japanese yen versus the U.S. dollar during the year ended December 31, 2015. By comparison, the Fund’s net income increased for the year ended December 31, 2014, as compared to the year ended December 31, 2013, primarily due to a lesser decline in the value of the Japanese yen versus the U.S. dollar during the year ended December 31, 2014.
| * | See Note 1 of the Notes to Financial Statements in Item 15 of Part IV in this Annual Report on Form 10-K regarding the reverse Share split for ProShares Ultra Yen. |
107
Table of Contents
Item 7A. Quantitative and Qualitative Disclosures About Market Risk
Quantitative Disclosure
Commodity Price Sensitivity and Exchange Rate Sensitivity
The Managed Futures Fund is exposed to commodity price risk through its holdings of commodity futures contracts and exchange rate risk through its holdings of currency and U.S. Treasury futures contracts. The following table provides information about the Managed Futures Fund’s Financial Instruments, which were sensitive to both commodity price and exchange rate risk. As of December 31, 2015 and 2014, the Managed Futures Fund’s positions were as follows:
ProShares Managed Futures Strategy:
As of December 31, 2015 and 2014, the Managed Futures Fund was exposed to commodity price and exchange rate risk through its holdings of Financial Instruments linked to the S&P Strategic Futures Index. The following table provides information about the Fund’s commodity and currency futures contracts as of December 31, 2015 and 2014, which were sensitive to commodity price risk and exchange rate price risk.
Futures Positions as of December 31, 2015
| Contract |
Long or Short |
Expiration | Contracts | Valuation Price |
Contract Multiplier |
Notional Amount at Value |
||||||||||||||
| Australian Dollar Fx Currency Futures (CME) |
Long | March 2016 | 4 | $ | 72.66 | 1,000 | $ | 290,640 | ||||||||||||
| Cocoa Futures (ICE) |
Long | March 2016 | 9 | 3,211.00 | 10 | 288,990 | ||||||||||||||
| Cotton No. 2 Futures (ICE) |
Long | March 2016 | 9 | 0.63 | 50,000 | 284,760 | ||||||||||||||
| Sugar #11 Futures (ICE) |
Long | March 2016 | 11 | 0.15 | 112,000 | 187,757 | ||||||||||||||
| Gold 100 OZ Futures (COMEX) |
Short | February 2016 | 1 | 1,060.20 | 100 | (106,020 | ) | |||||||||||||
| Gold Mini Futures (ICE) |
Short | February 2016 | 4 | 1,060.20 | 32.15 | (136,342 | ) | |||||||||||||
| Lean Hogs Futures (CME) |
Short | February 2016 | 11 | 0.60 | 40,000 | (263,120 | ) | |||||||||||||
| Live Cattle Futures (CME) |
Short | February 2016 | 7 | 1.37 | 40,000 | (383,040 | ) | |||||||||||||
| Natural Gas Futures (NYMEX) |
Short | February 2016 | 7 | 2.34 | 10,000 | (163,590 | ) | |||||||||||||
| NY Harbor ULSD Futures (NYMEX) |
Short | February 2016 | 2 | 1.12 | 42,000 | (94,408 | ) | |||||||||||||
| RBOB Gasoline Futures (NYMEX) |
Short | February 2016 | 2 | 1.27 | 42,000 | (106,764 | ) | |||||||||||||
| WTI Crude Oil Futures (NYMEX) |
Short | February 2016 | 2 | 37.04 | 1,000 | (74,080 | ) | |||||||||||||
| British Pound Fx Currency Futures (CME) |
Short | March 2016 | 4 | 147.34 | 625 | (368,350 | ) | |||||||||||||
| Euro Fx Currency Futures (CME) |
Short | March 2016 | 2 | 1.09 | 125,000 | (272,150 | ) | |||||||||||||
| Canadian Dollar Fx Currency Futures (CME) |
Short | March 2016 | 5 | 72.33 | 1,000 | (361,650 | ) | |||||||||||||
| Coffee ‘C’ Futures (ICE) |
Short | March 2016 | 3 | 1.27 | 37,500 | (142,537 | ) | |||||||||||||
| Copper Futures (COMEX) |
Short | March 2016 | 4 | 2.14 | 25,000 | (213,500 | ) | |||||||||||||
| Corn Futures (CBT) |
Short | March 2016 | 11 | 3.59 | 5,000 | (197,312 | ) | |||||||||||||
| Japanese Yen Fx Currency Futures (CME) |
Short | March 2016 | 5 | 83.33 | 1,250 | (520,813 | ) | |||||||||||||
| Silver Futures (COMEX) |
Short | March 2016 | 1 | 13.80 | 5,000 | (69,015 | ) | |||||||||||||
| Silver Mini Futures (ICE) |
Short | March 2016 | 4 | 13.80 | 1,000 | (55,212 | ) | |||||||||||||
| Soybean Futures (CBT) |
Short | March 2016 | 5 | 8.64 | 5,000 | (216,063 | ) | |||||||||||||
| Swiss Franc Fx Currency Futures (CME) |
Short | March 2016 | 2 | 100.32 | 1,250 | (250,800 | ) | |||||||||||||
| U.S. 10 YR Note Futures (CBT) |
Short | March 2016 | 9 | 125.91 | 1,000 | (1,133,156 | ) | |||||||||||||
| U.S. Treasury Long Bond Futures—CBT |
Short | March 2016 | 5 | 153.75 | 1,000 | (768,750 | ) | |||||||||||||
| Wheat Futures (CBT) |
Short | March 2016 | 9 | 4.70 | 5,000 | (211,500 | ) | |||||||||||||
108
Table of Contents
Futures Positions as of December 31, 2014
| Contract |
Long or Short |
Expiration | Contracts | Valuation Price |
Contract Multiplier |
Notional Amount at Value |
||||||||||||||
| Coffee ‘C’ Futures (ICE) |
Long | March 2015 | 1 | $ | 1.67 | 37,500 | $ | 62,475 | ||||||||||||
| Soybean Futures (CBT) |
Long | March 2015 | 3 | 10.24 | 5,000 | 153,525 | ||||||||||||||
| US Treasury Long Bond Futures (CBT) |
Long | March 2015 | 3 | 144.56 | 1,000 | 433,688 | ||||||||||||||
| US 10 YR Note Futures (CBT) |
Long | March 2015 | 6 | 126.80 | 1,000 | 760,781 | ||||||||||||||
| Live Cattle Futures (CME) |
Long | April 2015 | 5 | 1.62 | 40,000 | 324,800 | ||||||||||||||
| Corn Futures (CBT) |
Long | July 2015 | 6 | 4.13 | 5,000 | 123,750 | ||||||||||||||
| Wheat Futures (CBT) |
Long | December 2015 | 4 | 6.15 | 5,000 | 122,950 | ||||||||||||||
| Natural Gas Futures (NYMEX) |
Long | January 2016 | 3 | 3.53 | 10,000 | 105,930 | ||||||||||||||
| Gold Mini Futures (ICE) |
Short | February 2015 | 4 | 1,184.10 | 32.15 | (152,275 | ) | |||||||||||||
| Lean Hogs Futures (CME) |
Short | February 2015 | 6 | 0.81 | 40,000 | (194,880 | ) | |||||||||||||
| NY Harbor ULSD Futures (NYMEX) |
Short | February 2015 | 2 | 1.83 | 42,000 | (154,022 | ) | |||||||||||||
| RBOB Gasoline Futures (NYMEX) |
Short | February 2015 | 2 | 1.47 | 42,000 | (123,656 | ) | |||||||||||||
| WTI Crude Oil Mini Futures (NYMEX) |
Short | February 2015 | 4 | 53.27 | 500 | (106,472 | ) | |||||||||||||
| Australian Dollar Fx Currency Futures (CME) |
Short | March 2015 | 3 | 81.22 | 1,000 | (243,660 | ) | |||||||||||||
| British Pound Fx Currency Futures (CME) |
Short | March 2015 | 6 | 155.70 | 625 | (583,875 | ) | |||||||||||||
| Canadian Dollar Fx Currency Futures (CME) |
Short | March 2015 | 4 | 85.97 | 1,000 | (343,880 | ) | |||||||||||||
| Cocoa Futures (ICE) |
Short | March 2015 | 13 | 2,910.00 | 10 | (378,300 | ) | |||||||||||||
| Copper Futures (COMEX) |
Short | March 2015 | 3 | 2.83 | 25,000 | (211,913 | ) | |||||||||||||
| Copper Mini Futures (COMEX) |
Short | March 2015 | 3 | 2.83 | 12,500 | (105,975 | ) | |||||||||||||
| Cotton No. 2 Futures (ICE) |
Short | March 2015 | 5 | 0.60 | 50,000 | (150,675 | ) | |||||||||||||
| Euro Fx Currency Mini Futures (CME) |
Short | March 2015 | 5 | 1.21 | 62,500 | (378,344 | ) | |||||||||||||
| Japanese Yen Fx Currency Futures (CME) |
Short | March 2015 | 3 | 83.49 | 1,250 | (313,088 | ) | |||||||||||||
| Silver Mini Futures (ICE) |
Short | March 2015 | 6 | 15.60 | 1,000 | (93,594 | ) | |||||||||||||
| Swiss Franc Fx Currency Futures (CME) |
Short | March 2015 | 3 | 100.74 | 1,250 | (377,775 | ) | |||||||||||||
| Sugar #11 Futures (ICE) |
Short | March 2015 | 8 | 0.15 | 112,000 | (130,099 | ) | |||||||||||||
The December 31, 2015 and 2014 futures notional values are calculated by multiplying the number of contracts held times the valuation price times the contract multiplier. These notional values will increase (decrease) proportionally with decreases (increases) in the price of the futures contract or the level of the Index, as applicable. Additional gains (losses) associated with these contracts will be equal to any such subsequent decreases (increases) in short notional values, before accounting for spreads or transaction or financing costs. The Fund will generally attempt to adjust its positions in Financial Instruments each day to match the performance of the Index. While the above information properly represents the then current applicable commodity or exchange rate price risk and is adequate for estimating the following day’s gains or losses, estimates of future values over longer periods should take the Fund’s daily rebalancing efforts into account. Future period returns, before fees and expenses, cannot be estimated simply by estimating the return of the Index. See “Item 1A. Risk Factors” in this Annual Report on Form 10-K for additional information regarding performance for periods longer than a single day.
Equity Market Volatility Sensitivity
Each of the VIX Funds is exposed to equity market volatility risk through its holdings of Financial Instruments. The following tables provide information about each of the VIX Funds’ Financial Instruments, which are sensitive to changes in equity market volatility indexes. As of December 31, 2015 and 2014, each of the VIX Funds’ positions were as follows:
ProShares VIX Short-Term Futures ETF
As of December 31, 2015 and 2014, the ProShares VIX Short-Term Futures ETF Fund was exposed to equity market volatility risk through its holding of VIX futures contracts. The following table provides information about the Fund’s positions in VIX futures contracts as of December 31, 2015 and 2014, which were sensitive to equity market volatility risk.
Futures Positions as of December 31, 2015
| Contract |
Long or Short |
Expiration | Contracts | Valuation Price |
Contract Multiplier |
Notional Amount at Value |
||||||||||||||||
| VIX Futures (CBOE) |
Long | January 2016 | 2,821 | $ | 18.53 | 1,000 | $ | 52,259,025 | ||||||||||||||
| VIX Futures (CBOE) |
Long | February 2016 | 2,821 | 18.88 | 1,000 | 53,246,375 | ||||||||||||||||
109
Table of Contents
Futures Positions as of December 31, 2014
| Contract |
Long or Short |
Expiration | Contracts | Valuation Price |
Contract Multiplier |
Notional Amount at Value |
||||||||||||||||
| VIX Futures (CBOE) |
Long | January 2015 | 3,326 | $ | 18.03 | 1,000 | $ | 59,951,150 | ||||||||||||||
| VIX Futures (CBOE) |
Long | February 2015 | 2,775 | 18.23 | 1,000 | 50,574,375 | ||||||||||||||||
The December 31, 2015 and 2014 futures notional values are calculated by multiplying the number of contracts held times the valuation price times the contract multiplier. The notional values will increase (decrease) proportionally with increases (decreases) in the price of the futures contract. Additional gains (losses) associated with these contracts will be equal to any such subsequent increases (decreases) in notional values, before accounting for spreads or transaction or financing costs. The Fund will generally attempt to adjust its positions in Financial Instruments each day to match the performance of the Index. While the above information properly represents the then current equity price risk and is adequate for estimating the following day’s gains or losses, estimates of future values over longer periods should take the Fund’s daily rebalancing efforts into account. Future period returns, before fees and expenses, cannot be estimated simply by estimating the return of the Index. See “Item 1A. Risk Factors” in this Annual Report on Form 10-K for additional information regarding performance for periods longer than a single day.
ProShares VIX Mid-Term Futures ETF
As of December 31, 2015 and 2014, the ProShares VIX Mid-Term Futures ETF Fund was exposed to equity market volatility risk through its holding of VIX futures contracts. The following table provides information about the Fund’s positions in VIX futures contracts as of December 31, 2015 and 2014, which were sensitive to equity market volatility risk.
Futures Positions as of December 31, 2015
| Contract |
Long or Short |
Expiration | Contracts | Valuation Price |
Contract Multiplier |
Notional Amount at Value |
||||||||||||||
| VIX Futures (CBOE) |
Long | April 2016 | 235 | $ | 19.35 | 1,000 | $ | 4,547,250 | ||||||||||||
| VIX Futures (CBOE) |
Long | May 2016 | 469 | 19.50 | 1,000 | 9,145,500 | ||||||||||||||
| VIX Futures (CBOE) |
Long | June 2016 | 469 | 19.75 | 1,000 | 9,262,750 | ||||||||||||||
| VIX Futures (CBOE) |
Long | July 2016 | 234 | 20.05 | 1,000 | 4,691,700 | ||||||||||||||
Futures Positions as of December 31, 2014
| Contract |
Long or Short |
Expiration | Contracts | Valuation Price |
Contract Multiplier |
Notional Amount at Value |
||||||||||||||
| VIX Futures (CBOE) |
Long | April 2015 | 205 | $ | 18.63 | 1,000 | $ | 3,818,125 | ||||||||||||
| VIX Futures (CBOE) |
Long | May 2015 | 376 | 18.88 | 1,000 | 7,097,000 | ||||||||||||||
| VIX Futures (CBOE) |
Long | June 2015 | 376 | 19.13 | 1,000 | 7,191,000 | ||||||||||||||
| VIX Futures (CBOE) |
Long | July 2015 | 172 | 19.48 | 1,000 | 3,349,700 | ||||||||||||||
The December 31, 2015 and 2014 futures notional values are calculated by multiplying the number of contracts held times the valuation price times the contract multiplier. The notional values will increase (decrease) proportionally with increases (decreases) in the price of the futures contract. Additional gains (losses) associated with these contracts will be equal to any such subsequent increases (decreases) in notional values, before accounting for spreads or transaction or financing costs. The Fund will generally attempt to adjust its positions in Financial Instruments each day to match the performance of the Index. While the above information properly represents the then current equity price risk and is adequate for estimating the following day’s gains or losses, estimates of future values over longer periods should take the Fund’s daily rebalancing efforts into account. Future period returns, before fees and expenses, cannot be estimated simply by estimating the return of the Index. See “Item 1A. Risk Factors” in this Annual Report on Form 10-K for additional information regarding performance for periods longer than a single day.
ProShares Short VIX Short-Term Futures ETF
As of December 31, 2015 and 2014, the ProShares Short VIX Short-Term Futures ETF Fund was exposed to inverse equity market volatility risk through its holding of VIX futures contracts. The following table provides information about the Fund’s positions in VIX futures contracts as of December 31, 2015 and 2014, which were sensitive to equity market volatility risk.
110
Table of Contents
Futures Positions as of December 31, 2015
| Contract |
Long or Short |
Expiration | Contracts | Valuation Price |
Contract Multiplier |
Notional Amount at Value |
||||||||||||||||
| VIX Futures (CBOE) |
Short | January 2016 | 17,150 | $ | 18.53 | 1,000 | $ | (317,703,750 | ) | |||||||||||||
| VIX Futures (CBOE) |
Short | February 2016 | 17,151 | 18.88 | 1,000 | (323,725,125 | ) | |||||||||||||||
Futures Positions as of December 31, 2014
| Contract |
Long or Short |
Expiration | Contracts | Valuation Price |
Contract Multiplier |
Notional Amount at Value |
||||||||||||||||
| VIX Futures (CBOE) |
Short | January 2015 | 15,388 | $ | 18.03 | 1,000 | $ | (277,368,700 | ) | |||||||||||||
| VIX Futures (CBOE) |
Short | February 2015 | 12,811 | 18.23 | 1,000 | (233,480,475 | ) | |||||||||||||||
The December 31, 2015 and 2014 short futures notional values are calculated by multiplying the number of contracts held times the valuation price times the contract multiplier. The short notional values will increase (decrease) proportionally with decreases (increases) in the price of the futures contract. Additional gains (losses) associated with these contracts will be equal to any such subsequent decreases (increases) in short notional values, before accounting for spreads or transaction or financing costs. The Fund will generally attempt to adjust its positions in Financial Instruments each day to have $1.00 of short exposure to the Index for every $1.00 of net assets. While the above information properly represents the then current equity price risk and is adequate for estimating the following day’s gains or losses, estimates of future values over longer periods should take the Fund’s daily rebalancing efforts into account. Future period returns, before fees and expenses, cannot be estimated simply by estimating the return of the Index and multiplying by negative one. See “Item 1A. Risk Factors” in this Annual Report on Form 10-K for additional information regarding performance for periods longer than a single day.
ProShares Ultra VIX Short-Term Futures ETF
As of December 31, 2015 and 2014, the ProShares Ultra VIX Short-Term Futures ETF Fund was exposed to equity market volatility risk through its holding of VIX futures contracts. The following tables provide information about the Fund’s positions in these VIX futures contracts as of December 31, 2015 and 2014, which were sensitive to equity market volatility risk.
Futures Positions as of December 31, 2015
| Contract |
Long or Short |
Expiration | Contracts | Valuation Price |
Contract Multiplier |
Notional Amount at Value |
||||||||||||||||
| VIX Futures (CBOE) |
Long | January 2016 | 29,321 | $ | 18.53 | 1,000 | $ | 543,171,525 | ||||||||||||||
| VIX Futures (CBOE) |
Long | February 2016 | 29,320 | 18.88 | 1,000 | 553,415,000 | ||||||||||||||||
Futures Positions as of December 31, 2014
| Contract |
Long or Short |
Expiration | Contracts | Valuation Price |
Contract Multiplier |
Notional Amount at Value |
||||||||||||||||
| VIX Futures (CBOE) |
Long | January 2015 | 21,092 | $ | 18.03 | 1,000 | $ | 380,183,300 | ||||||||||||||
| VIX Futures (CBOE) |
Long | February 2015 | 17,586 | 18.23 | 1,000 | 320,497,650 | ||||||||||||||||
The December 31, 2015 and 2014 futures notional values are calculated by multiplying the number of contracts held times the valuation price times the contract multiplier. These notional values will increase (decrease) proportionally with increases (decreases) in the price of the futures contract or the level of the Index, as applicable. Additional gains (losses) associated with these contracts will be equal to any such subsequent increases (decreases) in notional values, before accounting for spreads or transaction or financing costs. The Fund will generally attempt to adjust its positions in Financial Instruments each day to have $2.00 of exposure to the Index for every $1.00 of net assets. While the above information properly represents the then current equity price risk and is adequate for estimating the following day’s gains or losses, estimates of future values over longer periods should take the Fund’s daily rebalancing efforts into account. Future period returns, before fees and expenses, cannot be estimated simply by estimating the return of the Index and multiplying by two. See “Item 1A. Risk Factors” in this Annual Report on Form 10-K for additional information regarding performance for periods longer than a single day.
111
Table of Contents
Commodity Price Sensitivity
Each of the Commodity Funds and the Commodity Index Funds is exposed to commodity price risk through its holdings of Financial Instruments. The following tables provide information about each of the Commodity Funds’ and the Commodity Index Funds’ Financial Instruments, which were sensitive to commodity price risk. As of December 31, 2015 and 2014, each of the Commodity Funds and the Commodity Index Funds’ positions were as follows:
ProShares UltraShort Bloomberg Commodity:
As of December 31, 2015 and 2014, the ProShares UltraShort Bloomberg Commodity Fund was exposed to inverse commodity price risk through its holding of swap agreements linked to the Bloomberg Commodity Index. The following tables provide information about the Fund’s short swap positions as of December 31, 2015 and 2014, which were sensitive to commodity price risk.
Swap Agreements as of December 31, 2015
| Reference Index |
Counterparty | Long or Short |
Index Close |
Notional Amount at Value |
||||||||
| Bloomberg Commodity Index |
Citibank N.A. | Short | $ | 78.5588 | $ | (1,923,025 | ) | |||||
| Bloomberg Commodity Index |
Deutsche Bank AG | Short | 78.5588 | (7,650,954 | ) | |||||||
| Bloomberg Commodity Index |
Goldman Sachs International | Short | 78.5588 | (4,813,083 | ) | |||||||
| Bloomberg Commodity Index |
UBS AG | Short | 78.5588 | (2,647,863 | ) | |||||||
Swap Agreements as of December 31, 2014
| Reference Index |
Counterparty | Long or Short |
Index Close | Notional Amount at Value |
||||||||
| Bloomberg Commodity Index |
Deutsche Bank AG | Short | $ | 104.3285 | $ | (4,847,743 | ) | |||||
| Bloomberg Commodity Index |
Goldman Sachs International | Short | 104.3285 | (4,242,243 | ) | |||||||
| Bloomberg Commodity Index |
UBS AG | Short | 104.3285 | (1,460,197 | ) | |||||||
The December 31, 2015 and 2014 short swap notional values are calculated by multiplying units times the closing level of the Index. These short notional values will increase (decrease) proportionally with decreases (increases) in the level of the Index. Additional gains (losses) associated with these contracts will be equal to any such subsequent decreases (increases) in short notional values, before accounting for spreads or transaction or financing costs. The Fund will generally attempt to adjust its positions in Financial Instruments each day to have $2.00 of short exposure to the Index for every $1.00 of net assets. While the above information properly represents the then current commodity price risk and is adequate for estimating the following day’s gains or losses, estimates of future values over longer periods should take the Fund’s daily rebalancing efforts into account. Future period returns, before fees and expenses, cannot be estimated simply by estimating the return of the Index and multiplying by negative two. See “Item 1A. Risk Factors” in this Annual Report on Form 10-K for additional information regarding performance for periods longer than a single day. Swap counterparty risk is generally limited to the amount of any unrealized gains, although in the event of a counterparty bankruptcy, there could be delays and costs associated with recovering collateral posted in segregated tri-party accounts at the Fund’s custodian bank.
ProShares UltraShort Bloomberg Crude Oil:
As of December 31, 2015 and 2014, the ProShares UltraShort Bloomberg Crude Oil Fund was exposed to inverse commodity price risk through its holding of Crude Oil futures contracts and its holding of swap agreements linked to the Bloomberg WTI Crude Oil SubindexSM. The following tables provide information about the Fund’s positions in these Financial Instruments as of December 31, 2015 and 2014, which were sensitive to commodity price risk.
112
Table of Contents
Futures Positions as of December 31, 2015
| Contract |
Long or Short |
Expiration | Contracts | Valuation Price |
Contract Multiplier |
Notional Amount at Value |
||||||||||||||||
| WTI Crude Oil (NYMEX) |
Short | March 2016 | 2,367 | $ | 38.17 | 1,000 | $ | (90,348,390 | ) | |||||||||||||
Swap Agreements as of December 31, 2015
| Reference Index |
Counterparty | Long or Short |
Index Close |
Notional Amount at Value |
||||||||||
| Bloomberg WTI Crude Oil Subindex |
Citibank N.A. | Short | 79.2476 | (19,234,533 | ) | |||||||||
| Bloomberg WTI Crude Oil Subindex |
Deutsche Bank AG | Short | $ | 79.2476 | $ | (29,881,854 | ) | |||||||
| Bloomberg WTI Crude Oil Subindex |
Goldman Sachs International | Short | 79.2476 | (17,799,590 | ) | |||||||||
| Bloomberg WTI Crude Oil Subindex |
Societe Generale S.A. | Short | 79.2476 | (8,303,436 | ) | |||||||||
| Bloomberg WTI Crude Oil Subindex |
UBS AG | Short | 79.2476 | (26,258,293 | ) | |||||||||
Futures Positions as of December 31, 2014
| Contract |
Long or Short |
Expiration | Contracts | Valuation Price |
Contract Multiplier |
Notional Amount at Value |
||||||||||||||||||
| WTI Crude Oil (NYMEX) |
Short | March 2015 | 2,569 | $ | 53.70 | 1,000 | $ | (137,955,300 | ) | |||||||||||||||
Swap Agreements as of December 31, 2014
| Reference Index |
Counterparty | Long or Short |
Index Close | Notional Amount at Value |
||||||||
| Bloomberg WTI Crude Oil Subindex |
Deutsche Bank AG | Short | $ | 142.4858 | $ | (66,394,305 | ) | |||||
| Bloomberg WTI Crude Oil Subindex |
Goldman Sachs International | Short | 142.4858 | (57,892,826 | ) | |||||||
| Bloomberg WTI Crude Oil Subindex |
Societe Generale S.A. | Short | 142.4858 | (21,413,784 | ) | |||||||
| Bloomberg WTI Crude Oil Subindex |
UBS AG | Short | 142.4858 | (54,735,210 | ) | |||||||
The December 31, 2015 and 2014 short futures notional values are calculated by multiplying the number of contracts held times the valuation price times the contract multiplier. The December 31, 2015 and 2014 short swap notional values are calculated by multiplying the number of units times the closing level of the Index. These short notional values will increase (decrease) proportionally with decreases (increases) in the price of the futures contract or the level of the Index, as applicable. Additional gains (losses) associated with these contracts will be equal to any such subsequent decreases (increases) in short notional values, before accounting for spreads or transaction or financing costs. The Fund will generally attempt to adjust its positions in Financial Instruments each day to have $2.00 of short exposure to the Index for every $1.00 of net assets. While the above information properly represents the then current commodity price risk and is adequate for estimating the following day’s gains or losses, estimates of future values over longer periods should take the Fund’s daily rebalancing efforts into account. Future period returns, before fees and expenses, cannot be estimated simply by estimating the return of the Index and multiplying by negative two. See “Item 1A. Risk Factors” in this Annual Report on Form 10-K for additional information regarding performance for periods longer than a single day. Swap counterparty risk is generally limited to the amount of any unrealized gains, although in the event of a counterparty bankruptcy, there could be delays and costs associated with recovering collateral posted in segregated tri-party accounts at the Fund’s custodian bank.
ProShares UltraShort Bloomberg Natural Gas:
As of December 31, 2015 and 2014, the ProShares UltraShort Bloomberg Natural Gas Fund was exposed to inverse commodity price risk through its holding of Natural Gas futures contracts. The following tables provide information about the Fund’s positions in these Financial Instruments as of December 31, 2015 and 2014, which were sensitive to commodity price risk.
113
Table of Contents
Futures Positions as of December 31, 2015
| Contract |
Long or Short |
Expiration | Contracts | Valuation Price |
Contract Multiplier |
Notional Amount at Value |
||||||||||||||||
| Natural Gas (NYMEX) |
Short | March 2016 | 886 | $ | 2.36 | 10,000 | $ | (20,936,180 | ) | |||||||||||||
Futures Positions as of December 31, 2014
| Contract |
Long or Short |
Expiration | Contracts | Valuation Price |
Contract Multiplier |
Notional Amount at Value |
||||||||||||||||
| Natural Gas (NYMEX) |
Short | March 2015 | 1,014 | $ | 2.90 | 10,000 | $ | (29,365,440 | ) | |||||||||||||
The December 31, 2015 and 2014 short futures notional values are calculated by multiplying the number of contracts held times the valuation price times the contract multiplier. The short notional values will increase (decrease) proportionally with decreases (increases) in the price of the futures contract. Additional gains (losses) associated with these contracts will be equal to any such subsequent decreases (increases) in short notional values, before accounting for spreads or transaction or financing costs. The Fund will generally attempt to adjust its positions in Financial Instruments each day to have $2.00 of short exposure to the Index for every $1.00 of net assets. While the above information properly represents the then current commodity price risk and is adequate for estimating the following day’s gains or losses, estimates of future values over longer periods should take the Fund’s daily rebalancing efforts into account. Future period returns, before fees and expenses, cannot be estimated simply by estimating the return of the Index and multiplying by negative two. See “Item 1A. Risk Factors” in this Annual Report on Form 10-K for additional information regarding performance for periods longer than a single day.
ProShares UltraShort Gold:
As of December 31, 2015 and 2014, the ProShares UltraShort Gold Fund was exposed to inverse commodity price risk through its holding of Gold futures contracts and Gold forward agreements. The following tables provide information about the Fund’s positions in these Financial Instruments as of December 31, 2015 and 2014, which were sensitive to commodity price risk.
Futures Positions as of December 31, 2015
| Contract |
Long or Short |
Expiration | Contracts | Valuation Price |
Contract Multiplier |
Notional Amount at Value |
||||||||||||||||||
| Gold Futures (COMEX) |
Short | February 2016 | 2 | $ | 1,060.20 | 100 | $ | (212,040 | ) | |||||||||||||||
Forward Agreements as of December 31, 2015
| Reference Index |
Counterparty | Long or Short |
Valuation Price | Notional Amount at Value |
||||||||
| 0.995 Fine Troy Ounce Gold |
Citibank N.A. | Short | 1,059.96 | (6,889,740 | ) | |||||||
| 0.995 Fine Troy Ounce Gold |
Deutsche Bank AG | Short | $ | 1,060.01 | $ | (72,186,681 | ) | |||||
| 0.995 Fine Troy Ounce Gold |
Goldman Sachs International | Short | 1,059.96 | (27,874,828 | ) | |||||||
| 0.995 Fine Troy Ounce Gold |
Societe Generale S.A. | Short | 1,059.96 | (14,839,440 | ) | |||||||
| 0.995 Fine Troy Ounce Gold |
UBS AG | Short | 1,059.96 | (27,929,946 | ) | |||||||
Futures Positions as of December 31, 2014
| Contract |
Long or Short |
Expiration | Contracts | Valuation Price |
Contract Multiplier |
Notional Amount at Value |
||||||||||||||||
| Gold Futures (COMEX) |
Short | February 2015 | 2 | $ | 1,184.10 | 100 | $ | (236,820 | ) | |||||||||||||
Forward Agreements as of December 31, 2014
| Reference Index |
Counterparty | Long or Short |
Valuation Price | Notional Amount at Value |
||||||||
| 0.995 Fine Troy Ounce Gold |
Deutsche Bank AG | Short | $ | 1,205.99 | $ | (85,504,691 | ) | |||||
| 0.995 Fine Troy Ounce Gold |
Goldman Sachs International | Short | 1,205.99 | (32,438,719 | ) | |||||||
| 0.995 Fine Troy Ounce Gold |
Societe Generale S.A. | Short | 1,205.99 | (16,522,063 | ) | |||||||
| 0.995 Fine Troy Ounce Gold |
UBS AG | Short | 1,205.99 | (29,004,060 | ) | |||||||
114
Table of Contents
The December 31, 2015 and 2014 short futures notional values are calculated by multiplying the number of contracts held times the valuation price times the contract multiplier. The December 31, 2015 and 2014 short forward notional values equal units multiplied by the forward price. These short notional values will increase (decrease) proportionally with decreases (increases) in the price of the futures contract or forward price, as applicable. Additional gains (losses) associated with these contracts will be equal to any such subsequent decreases (increases) in notional values, before accounting for spreads or transaction or financing costs. The Fund will generally attempt to adjust its positions in Financial Instruments each day to have $2.00 of short exposure to the Index for every $1.00 of net assets. While the above information properly represents the then current commodity price risk and is adequate for estimating the following day’s gains or losses, estimates of future values over longer periods should take the Fund’s daily rebalancing efforts into account. Future period returns, before fees and expenses, cannot be estimated simply by estimating the return of the Index and multiplying by negative two. See “Item 1A. Risk Factors” in this Annual Report on Form 10-K for additional information regarding performance for periods longer than a single day. Counterparty risk related to the forward agreements is generally limited to the amount of any unrealized gains, although in the event of a counterparty bankruptcy, there could be delays and costs associated with recovering collateral posted in segregated tri-party accounts at the Fund’s custodian bank.
ProShares UltraShort Silver:
As of December 31, 2015 and 2014, the ProShares UltraShort Silver Fund was exposed to inverse commodity price risk through its holding of Silver futures contracts and Silver forward agreements. The following tables provide information about the Fund’s positions in these Financial Instruments as of December 31, 2015 and 2014, which were sensitive to commodity price risk.
Futures Positions as of December 31, 2015
| Contract |
Long or Short |
Expiration | Contracts | Valuation Price |
Contract Multiplier |
Notional Amount at Value |
||||||||||||||||
| Silver Futures (COMEX) |
Short | March 2016 | 2 | $ | 13.80 | 5,000 | $ | (138,030 | ) | |||||||||||||
Forward Agreements as of December 31, 2015
| Reference Index |
Counterparty | Long or Short |
Valuation Price | Notional Amount at Value |
||||||||
| 0.999 Fine Troy Ounce Silver |
Deutsche Bank AG | Short | $ | 13.8218 | $ | (44,962,315 | ) | |||||
| 0.999 Fine Troy Ounce Silver |
Goldman Sachs International | Short | 13.8212 | (28,298,907 | ) | |||||||
| 0.999 Fine Troy Ounce Silver |
Societe Generale S.A. | Short | 13.8212 | (9,066,707 | ) | |||||||
| 0.999 Fine Troy Ounce Silver |
UBS AG | Short | 13.8212 | (29,508,262 | ) | |||||||
Futures Positions as of December 31, 2014
| Contract |
Long or Short |
Expiration | Contracts | Valuation Price |
Contract Multiplier |
Notional Amount at Value |
||||||||||||||||
| Silver Futures (COMEX) |
Short | March 2015 | 2 | $ | 15.60 | 5,000 | $ | (155,990 | ) | |||||||||||||
Forward Agreements as of December 31, 2014
| Reference Index |
Counterparty | Long or Short |
Valuation Price | Notional Amount at Value |
||||||||
| 0.999 Fine Troy Ounce Silver |
Deutsche Bank AG | Short | $ | 15.9718 | $ | (54,447,866 | ) | |||||
| 0.999 Fine Troy Ounce Silver |
Goldman Sachs International | Short | 15.9716 | (19,094,048 | ) | |||||||
| 0.999 Fine Troy Ounce Silver |
Societe Generale S.A. | Short | 15.9716 | (10,972,489 | ) | |||||||
| 0.999 Fine Troy Ounce Silver |
UBS AG | Short | 15.9716 | (21,338,058 | ) | |||||||
115
Table of Contents
The December 31, 2015 and 2014 short futures notional values are calculated by multiplying the number of contracts held times the valuation price times the contract multiplier. The December 31, 2015 and 2014 short forward notional values equal units multiplied by the forward price. These short notional values will increase (decrease) proportionally with decreases (increases) in the price of the futures contract or forward price, as applicable. Additional gains (losses) associated with these contracts will be equal to any such subsequent decreases (increases) in short notional values, before accounting for spreads or transaction or financing costs. The Fund will generally attempt to adjust its positions in Financial Instruments each day to have $2.00 of short exposure to the Index for every $1.00 of net assets. While the above information properly represents the then current commodity price risk and is adequate for estimating the following day’s gains or losses, estimates of future values over longer periods should take the Fund’s daily rebalancing efforts into account. Future period returns, before fees and expenses, cannot be estimated simply by estimating the return of the Index and multiplying by negative two. See “Item 1A. Risk Factors” in this Annual Report on Form 10-K for additional information regarding performance for periods longer than a single day. Counterparty risk related to the forward agreements is generally limited to the amount of any unrealized gains, although in the event of a counterparty bankruptcy, there could be delays and costs associated with recovering collateral posted in segregated tri-party accounts at the Fund’s custodian bank.
Exchange Rate Sensitivity
Each of the Currency Funds is exposed to exchange rate risk through its holdings of Financial Instruments. The following tables provide information about each of the Currency Fund’s Financial Instruments, which are sensitive to changes in exchange rates. As of December 31, 2015 and 2014, each of the Currency Funds’ positions was as follows:
ProShares Short Euro:
As of December 31, 2015 and 2014, the ProShares Short Euro Fund was exposed to inverse exchange rate price risk through its holdings of Euro/USD foreign currency futures contracts. The following table provides information about the Fund’s positions in these Financial Instruments as of December 31, 2015 and 2014, which were sensitive to exchange rate price risk.
Futures Positions as of December 31, 2015
| Contract |
Long or Short |
Expiration | Contracts | Valuation Price |
Contract Multiplier |
Notional Amount at Value |
||||||||||||||||
| Euro Fx Currency Futures (CME) |
Short | March 2016 | 129 | $ | 1.09 | 125,000 | $ | (17,553,675 | ) | |||||||||||||
Futures Positions as of December 31, 2014
| Contract |
Long or Short |
Expiration | Contracts | Valuation Price |
Contract Multiplier |
Notional Amount at Value |
||||||||||||||||
| Euro Fx Currency Futures (CME) |
Short | March 2015 | 92 | $ | 1.21 | 125,000 | $ | (13,923,050 | ) | |||||||||||||
The December 31, 2015 and 2014 short futures notional values are calculated by multiplying the number of contracts held times the valuation price times the contract multiplier. The short notional values will increase (decrease) proportionally with decreases (increases) in the price of the futures contract. Additional gains (losses) associated with these contracts will be equal to any such subsequent decreases (increases) in short notional values, before accounting for spreads or transaction or financing costs. The Fund will generally attempt to adjust its positions in Financial Instruments each day to have $1.00 of short exposure to the euro for every $1.00 of net assets. While the above information properly represents the then current exchange rate price risk and is adequate for estimating the following day’s gains or losses, estimates of future values over longer periods should take the Fund’s daily rebalancing efforts into account. Future period returns, before fees and expenses, cannot be estimated simply by estimating the appreciation or depreciation of the euro and multiplying by negative one. See “Item 1A. Risk Factors” in this Annual Report on Form 10-K for additional information regarding performance for periods longer than a single day.
116
Table of Contents
ProShares UltraShort Australian Dollar:
As of December 31, 2015 and 2014, the ProShares UltraShort Australian Dollar Fund was exposed to inverse exchange rate price risk through its holdings of AUD/USD foreign currency futures contracts. The following table provides information about the Fund’s positions in these Financial Instruments as of December 31, 2015 and 2014, which were sensitive to exchange rate price risk.
Futures Positions as of December 31, 2015
| Contract |
Long or Short |
Expiration | Contracts | Valuation Price |
Contract Multiplier |
Notional Amount at Value |
||||||||||||||||
| Australian Dollar Fx Currency Futures (CME) |
Short | March 2016 | 562 | $ | 72.66 | 1,000 | $ | (40,834,920 | ) | |||||||||||||
Futures Positions as of December 31, 2014
| Contract |
Long or Short |
Expiration | Contracts | Valuation Price |
Contract Multiplier |
Notional Amount at Value |
||||||||||||||||
| Australian Dollar Fx Currency Futures (CME) |
Short | March 2015 | 569 | $ | 81.22 | 1,000 | $ | (46,214,180 | ) | |||||||||||||
The December 31, 2015 and 2014 short futures notional values are calculated by multiplying the number of contracts held times the valuation price times the contract multiplier. The short notional values will increase (decrease) proportionally with decreases (increases) in the price of the futures contract. Additional gains (losses) associated with these contracts will be equal to any such subsequent decreases (increases) in short notional values, before accounting for spreads or transaction or financing costs. The Fund will generally attempt to adjust its positions in Financial Instruments each day to have $2.00 of short exposure to the Australian dollar for every $1.00 of net assets. While the above information properly represents the then current exchange rate price risk and is adequate for estimating the following day’s gains or losses, estimates of future values over longer periods should take the Fund’s daily rebalancing efforts into account. Future period returns, before fees and expenses, cannot be estimated simply by estimating the appreciation or depreciation of the Australian dollar and multiplying by negative two. See “Item 1A. Risk Factors” in this Annual Report on Form 10-K for additional information regarding performance for periods longer than a single day.
ProShares UltraShort Euro:
As of December 31, 2015 and 2014, the ProShares UltraShort Euro Fund was exposed to inverse exchange rate price risk through its holdings of Euro/USD foreign currency forward contracts. The following tables provide information about the Fund’s positions in these Financial Instruments as of December 31, 2015 and 2014, which were sensitive to exchange rate price risk.
Foreign Currency Forward Contracts as of December 31, 2015
| Reference Currency |
Counterparty | Long or Short |
Settlement Date |
Euro | Forward Rate |
Market Value USD |
||||||||||||
| Euro |
Goldman Sachs International | Long | 01/08/16 | 129,386,700 | 1.0868 | $ | 140,627,935 | |||||||||||
| Euro |
UBS AG | Long | 01/08/16 | 75,393,200 | 1.0868 | 81,943,430 | ||||||||||||
| Euro |
Goldman Sachs International | Short | 01/08/16 | (602,732,925 | ) | 1.0868 | (655,098,912 | ) | ||||||||||
| Euro |
UBS AG | Short | 01/08/16 | (562,621,100 | ) | 1.0868 | (611,502,135 | ) | ||||||||||
Foreign Currency Forward Contracts as of December 31, 2014
| Reference Currency |
Counterparty | Long or Short |
Settlement Date |
Euro | Forward Rate |
Market Value USD |
||||||||||||
| Euro |
Goldman Sachs International | Long | 01/09/15 | 31,647,600 | 1.2101 | $ | 38,298,521 | |||||||||||
| Euro |
UBS AG | Long | 01/09/15 | 40,314,300 | 1.2101 | 48,786,577 | ||||||||||||
| Euro |
Goldman Sachs International | Short | 01/09/15 | (443,778,725 | ) | 1.2101 | (537,041,321 | ) | ||||||||||
| Euro |
UBS AG | Short | 01/09/15 | (483,290,100 | ) | 1.2101 | (584,856,233 | ) | ||||||||||
117
Table of Contents
The December 31, 2015 and 2014 USD market values equal the number of euros multiplied by the forward rate. These short notional values will increase (decrease) proportionally with decreases (increases) in the forward price. Additional gains (losses) associated with these contracts will be equal to any such subsequent decreases (increases) in short notional values, before accounting for spreads or transaction or financing costs. The Fund will generally attempt to adjust its positions in Financial Instruments each day to have $2.00 of short exposure to the euro for every $1.00 of net assets. While the above information properly represents the then current exchange rate price risk and is adequate for estimating the following day’s gains or losses, estimates of future values over longer periods should take the Fund’s daily rebalancing efforts into account. Future period returns, before fees and expenses, cannot be estimated simply by estimating the appreciation or depreciation of the euro and multiplying by negative two. See “Item 1A. Risk Factors” in this Annual Report on Form 10-K for additional information regarding performance for periods longer than a single day. Counterparty risk related to foreign currency forward contracts is generally limited to the amount of any unrealized gains, although in the event of a counterparty bankruptcy, there could be delays and costs associated with recovering collateral posted in segregated tri-party accounts at the Fund’s custodian bank.
ProShares UltraShort Yen:
As of December 31, 2015 and 2014, the ProShares UltraShort Yen Fund was exposed to inverse exchange rate price risk through its holdings of Yen/USD foreign currency forward contracts. The following tables provide information about the Fund’s positions in these Financial Instruments as of December 31, 2015 and 2014, which were sensitive to exchange rate price risk.
Foreign Currency Forward Contracts as of December 31, 2015
| Reference Currency |
Counterparty | Long or Short |
Settlement Date |
Yen | Forward Rate |
Market Value USD |
||||||||||||
| Yen |
Goldman Sachs International | Long | 01/08/16 | 5,938,040,200 | 0.00832 | $ | 49,402,434 | |||||||||||
| Yen |
UBS AG | Long | 01/08/16 | 11,521,875,200 | 0.00832 | 95,858,003 | ||||||||||||
| Yen |
Goldman Sachs International | Short | 01/08/16 | (33,696,676,000 | ) | 0.00832 | (280,344,651 | ) | ||||||||||
| Yen |
UBS AG | Short | 01/08/16 | (40,852,769,100 | ) | 0.00832 | (339,880,862 | ) | ||||||||||
Foreign Currency Forward Contracts as of December 31, 2014
| Reference Currency |
Counterparty | Long or Short |
Settlement Date |
Yen | Forward Rate |
Market Value USD |
||||||||||||
| Yen |
Goldman Sachs International | Long | 01/09/15 | 8,266,326,300 | 0.00835 | $ | 69,025,668 | |||||||||||
| Yen |
UBS AG | Long | 01/09/15 | 13,530,509,400 | 0.00835 | 112,982,770 | ||||||||||||
| Yen |
Goldman Sachs International | Short | 01/09/15 | (72,481,612,100 | ) | 0.00835 | (605,237,623 | ) | ||||||||||
| Yen |
UBS AG | Short | 01/09/15 | (76,736,367,800 | ) | 0.00835 | (640,765,782 | ) | ||||||||||
The December 31, 2015 and 2014 USD market values equal the number of yen multiplied by the forward rate. These short notional values will increase (decrease) proportionally with decreases (increases) in the forward price. Additional gains (losses) associated with these contracts will be equal to any such subsequent decreases (increases) in short notional values, before accounting for spreads or transaction or financing costs. The Fund will generally attempt to adjust its positions in Financial Instruments each day to have $2.00 of short exposure to the yen for every $1.00 of net assets. While the above information properly represents the then current exchange rate price risk and is adequate for estimating the following day’s gains or losses, estimates of future values over longer periods should take the Fund’s daily rebalancing efforts into account. Future period returns, before fees and expenses, cannot be estimated simply by estimating the appreciation or depreciation of the yen and multiplying by negative two. See “Item 1A. Risk Factors” in this Annual Report on Form 10-K for additional information regarding performance for periods longer than a single day. Counterparty risk related to foreign currency forward contracts is generally limited to the amount of any unrealized gains, although in the event of a counterparty bankruptcy, there could be delays and costs associated with recovering collateral posted in segregated tri-party accounts at the Fund’s custodian bank.
118
Table of Contents
Commodity Price Sensitivity
Each of the Commodity Funds and the Commodity Index Funds is exposed to commodity price risk through its holdings of Financial Instruments. The following tables provide information about each of the Commodity Funds’ and the Commodity Index Funds’ Financial Instruments, which were sensitive to commodity price risk. As of December 31, 2015 and 2014, each of the Commodity Funds and the Commodity Index Funds’ positions were as follows:
ProShares Ultra Bloomberg Commodity:
As of December 31, 2015 and 2014, the ProShares Ultra Bloomberg Commodity Fund was exposed to commodity price risk through its holding of swap agreements linked to the Bloomberg Commodity Index. The following tables provide information about the Fund’s swap positions as of December 31, 2015 and 2014, which were sensitive to commodity price risk.
Swap Agreements as of December 31, 2015
| Reference Index |
Counterparty | Long or Short |
Index Close |
Notional Amount at Value |
||||||||
| Bloomberg Commodity Index |
Citibank N.A | Long | $ | 78.5588 | $ | 1,622,466 | ||||||
| Bloomberg Commodity Index |
Deutsche Bank AG | Long | 78.5588 | 6,571,903 | ||||||||
| Bloomberg Commodity Index |
Goldman Sachs International | Long | 78.5588 | 4,426,279 | ||||||||
| Bloomberg Commodity Index |
UBS AG | Long | 78.5588 | 1,576,626 | ||||||||
Swap Agreements as of December 31, 2014
| Reference Index |
Counterparty | Long or Short |
Index Close | Notional Amount at Value |
||||||||
| Bloomberg Commodity Index |
Deutsche Bank AG | Long | $ | 104.3285 | $ | 2,207,567 | ||||||
| Bloomberg Commodity Index |
Goldman Sachs International | Long | 104.3285 | 2,221,450 | ||||||||
| Bloomberg Commodity Index |
UBS AG | Long | 104.3285 | 780,251 | ||||||||
The December 31, 2015 and 2014 swap notional values are calculated by multiplying units times the closing level of the Index. These notional values will increase (decrease) proportionally with increases (decreases) in the level of the Index. Additional gains (losses) associated with these contracts will be equal to any such subsequent increases (decreases) in notional values, before accounting for spreads or transaction or financing costs. The Fund will generally attempt to adjust its positions in Financial Instruments each day to have $2.00 of exposure to the Index for every $1.00 of net assets. While the above information properly represents the then current commodity price risk and is adequate for estimating the following day’s gains or losses, estimates of future values over longer periods should take the Fund’s daily rebalancing efforts into account. Future period returns, before fees and expenses, cannot be estimated simply by estimating the return of the Index and multiplying by two. See “Item 1A. Risk Factors” in this Annual Report on Form 10-K for additional information regarding performance for periods longer than a single day. Swap counterparty risk is generally limited to the amount of any unrealized gains, although in the event of a counterparty bankruptcy, there could be delays and costs associated with recovering collateral posted in segregated tri-party accounts at the Fund’s custodian bank.
ProShares Ultra Bloomberg Crude Oil:
As of December 31, 2015 and 2014, the ProShares Ultra Bloomberg Crude Oil Fund was exposed to commodity price risk through its holding of Crude Oil futures contracts and its holding of swap agreements linked to the Bloomberg WTI Crude Oil SubindexSM. The following tables provide information about the Fund’s positions in these Financial Instruments as of December 31, 2015 and 2014, which were sensitive to commodity price risk.
119
Table of Contents
Futures Positions as of December 31, 2015
| Contract |
Long or Short |
Expiration | Contracts | Valuation Price |
Contract Multiplier |
Notional Amount at Value |
||||||||||||||
| WTI Crude Oil (NYMEX) |
Long | March 2016 | 11,089 | $ | 38.17 | 1,000 | $ | 423,267,130 | ||||||||||||
Swap Agreements as of December 31, 2015
| Reference Index |
Counterparty | Long or Short |
Index Close |
Notional Amount at Value |
||||||||
| Bloomberg WTI Crude Oil Subindex |
Citibank N.A. | Long | $ | 79.2476 | $ | 158,594,078 | ||||||
| Bloomberg WTI Crude Oil Subindex |
Deutsche Bank AG | Long | 79.2476 | 292,553,469 | ||||||||
| Bloomberg WTI Crude Oil Subindex |
Goldman Sachs International | Long | 79.2476 | 298,419,036 | ||||||||
| Bloomberg WTI Crude Oil Subindex |
Societe Generale S.A. | Long | 79.2476 | 100,733,521 | ||||||||
| Bloomberg WTI Crude Oil Subindex |
UBS AG | Long | 79.2476 | 294,338,185 | ||||||||
Futures Positions as of December 31, 2014
| Contract |
Long or Short |
Expiration | Contracts | Valuation Price |
Contract Multiplier |
Notional Amount at Value |
||||||||||||||
| WTI Crude Oil (NYMEX) |
Long | March 2015 | 7,232 | $ | 53.70 | 1,000 | $ | 388,358,400 | ||||||||||||
Swap Agreements as of December 31, 2014
| Reference Index |
Counterparty | Long or Short |
Index Close | Notional Amount at Value |
||||||||
| Bloomberg WTI Crude Oil Subindex |
Deutsche Bank AG | Long | $ | 142.4858 | $ | 165,659,833 | ||||||
| Bloomberg WTI Crude Oil Subindex |
Goldman Sachs International | Long | 142.4858 | 151,188,034 | ||||||||
| Bloomberg WTI Crude Oil Subindex |
Societe Generale S.A. | Long | 142.4858 | 39,239,652 | ||||||||
| Bloomberg WTI Crude Oil Subindex |
UBS AG | Long | 142.4858 | 156,716,204 | ||||||||
The December 31, 2015 and 2014 futures notional values are calculated by multiplying the number of contracts held times the valuation price times the contract multiplier. The December 31, 2015 and 2014 swap notional values are calculated by multiplying the number of units times the closing level of the Index. These notional values will increase (decrease) proportionally with increases (decreases) in the price of the futures contract or the level of the Index, as applicable. Additional gains (losses) associated with these contracts will be equal to any such subsequent increases (decreases) in notional values, before accounting for spreads or transaction or financing costs. The Fund will generally attempt to adjust its positions in Financial Instruments each day to have $2.00 of exposure to the Index for every $1.00 of net assets. While the above information properly represents the then current commodity price risk and is adequate for estimating the following day’s gains or losses, estimates of future values over longer periods should take the Fund’s daily rebalancing efforts into account. Future period returns, before fees and expenses, cannot be estimated simply by estimating the return of the Index and multiplying by two. See “Item 1A. Risk Factors” in this Annual Report on Form 10-K for additional information regarding performance for periods longer than a single day. Swap counterparty risk is generally limited to the amount of any unrealized gains, although in the event of a counterparty bankruptcy, there could be delays and costs associated with recovering collateral posted in segregated tri-party accounts at the Fund’s custodian bank.
ProShares Ultra Bloomberg Natural Gas:
As of December 31, 2015 and 2014, the ProShares Ultra Bloomberg Natural Gas Fund was exposed to commodity price risk through its holding of Natural Gas futures contracts. The following tables provide information about the Fund’s positions in these Financial Instruments as of December 31, 2015 and 2014, which were sensitive to commodity price risk.
120
Table of Contents
Futures Positions as of December 31, 2015
| Contract |
Long or Short |
Expiration | Contracts | Valuation Price |
Contract Multiplier |
Notional Amount at Value |
||||||||||||||
| Natural Gas (NYMEX) |
Long | March 2016 | 3,288 | $ | 2.36 | 10,000 | $ | 77,695,440 | ||||||||||||
Futures Positions as of December 31, 2014
| Contract |
Long or Short |
Expiration | Contracts | Valuation Price |
Contract Multiplier |
Notional Amount at Value |
||||||||||||||
| Natural Gas (NYMEX) |
Long | March 2015 | 4,864 | $ | 2.90 | 10,000 | $ | 140,861,440 | ||||||||||||
The December 31, 2015 and 2014 futures notional values are calculated by multiplying the number of contracts held times the valuation price times the contract multiplier. The notional values will increase (decrease) proportionally with increases (decreases) in the price of the futures contract, as applicable. Additional gains (losses) associated with these contracts will be equal to any such subsequent increases (decreases) in notional values, before accounting for spreads or transaction or financing costs. The Fund will generally attempt to adjust its positions in Financial Instruments each day to have $2.00 of exposure to the Index for every $1.00 of net assets. While the above information properly represents the then current commodity price risk and is adequate for estimating the following day’s gains or losses, estimates of future values over longer periods should take the Fund’s daily rebalancing efforts into account. Future period returns, before fees and expenses, cannot be estimated simply by estimating the return of the Index and multiplying by two. See “Item 1A. Risk Factors” in this Annual Report on Form 10-K for additional information regarding performance for periods longer than a single day.
ProShares Ultra Gold:
As of December 31, 2015 and 2014, the ProShares Ultra Gold Fund was exposed to commodity price risk through its holding of Gold futures contracts and Gold forward agreements. The following tables provide information about the Fund’s positions in these Financial Instruments as of December 31, 2015 and 2014, which were sensitive to commodity price risk.
Futures Positions as of December 31, 2015
| Contract |
Long or Short |
Expiration | Contracts | Valuation Price |
Contract Multiplier |
Notional Amount at Value |
||||||||||||||
| Gold Futures (COMEX) |
Long | February 2016 | 2 | $ | 1,060.20 | 100 | $ | 212,040 | ||||||||||||
Forward Agreements as of December 31, 2015
| Reference Index |
Counterparty | Long or Short |
Valuation Price |
Notional Amount at Value |
||||||||
| 0.995 Fine Troy Ounce Gold |
Citibank N.A. | Long | $ | 1,059.96 | $ | 3,179,880 | ||||||
| 0.995 Fine Troy Ounce Gold |
Deutsche Bank AG | Long | 1,060.01 | 67,734,639 | ||||||||
| 0.995 Fine Troy Ounce Gold |
Goldman Sachs International | Long | 1,059.96 | 25,036,255 | ||||||||
| 0.995 Fine Troy Ounce Gold |
Societe Generale S.A. | Long | 1,059.96 | 16,323,384 | ||||||||
| 0.995 Fine Troy Ounce Gold |
UBS AG | Long | 1,059.96 | 27,240,972 | ||||||||
Futures Positions as of December 31, 2014
| Contract |
Long or Short |
Expiration | Contracts | Valuation Price |
Contract Multiplier |
Notional Amount at Value |
||||||||||||||
| Gold Futures (COMEX) |
Long | February 2015 | 2 | $ | 1,184.10 | 100 | $ | 236,820 | ||||||||||||
Forward Agreements as of December 31, 2014
| Reference Index |
Counterparty | Long or Short |
Valuation Price |
Notional Amount at Value |
||||||||
| 0.995 Fine Troy Ounce Gold |
Deutsche Bank AG | Long | $ | 1,205.99 | $ | 109,503,892 | ||||||
| 0.995 Fine Troy Ounce Gold |
Goldman Sachs International | Long | 1,205.99 | 37,892,206 | ||||||||
| 0.995 Fine Troy Ounce Gold |
Societe Generale S.A. | Long | 1,205.99 | 18,331,048 | ||||||||
| 0.995 Fine Troy Ounce Gold |
UBS AG | Long | 1,205.99 | 38,109,284 | ||||||||
121
Table of Contents
The December 31, 2015 and 2014 futures notional values are calculated by multiplying the number of contracts held times the valuation price times the contract multiplier. The December 31, 2015 and 2014 forward notional values equal units multiplied by the forward price. These notional values will increase (decrease) proportionally with increases (decreases) in the price of the futures contract or forward price, as applicable. Additional gains (losses) associated with these contracts will be equal to any such subsequent increases (decreases) in notional values, before accounting for spreads or transaction or financing costs. The Fund will generally attempt to adjust its positions in Financial Instruments each day to have $2.00 of exposure to the Index for every $1.00 of net assets. While the above information properly represents the then current commodity price risk and is adequate for estimating the following day’s gains or losses, estimates of future values over longer periods should take the Fund’s daily rebalancing efforts into account. Future period returns, before fees and expenses, cannot be estimated simply by estimating the return of the Index and multiplying by two. See “Item 1A. Risk Factors” in this Annual Report on Form 10-K for additional information regarding performance for periods longer than a single day. Counterparty risk related to the forward agreements is generally limited to the amount of any unrealized gains, although in the event of a counterparty bankruptcy, there could be delays and costs associated with recovering collateral posted in segregated tri-party accounts at the Fund’s custodian bank.
ProShares Ultra Silver:
As of December 31, 2015 and 2014, the ProShares Ultra Silver Fund was exposed to commodity price risk through its holding of Silver futures contracts and Silver forward agreements. The following tables provide information about the Fund’s positions in these Financial Instruments as of December 31, 2015 and 2014, which were sensitive to commodity price risk.
Futures Positions as of December 31, 2015
| Contract |
Long or Short |
Expiration | Contracts | Valuation Price |
Contract Multiplier |
Notional Amount at Value |
||||||||||||||
| Silver Futures (COMEX) |
Long | March 2016 | 3 | $ | 13.80 | 5,000 | $ | 207,045 | ||||||||||||
Forward Agreements as of December 31, 2015
| Reference Index |
Counterparty | Long or Short |
Valuation Price | Notional Amount at Value |
||||||||
| 0.999 Fine Troy Ounce Silver |
Deutsche Bank AG | Long | $ | 13.8218 | $ | 180,899,718 | ||||||
| 0.999 Fine Troy Ounce Silver |
Goldman Sachs International | Long | 13.8212 | 94,755,383 | ||||||||
| 0.999 Fine Troy Ounce Silver |
Societe Generale S.A. | Long | 13.8212 | 55,063,661 | ||||||||
| 0.999 Fine Troy Ounce Silver |
UBS AG | Long | 13.8212 | 101,903,708 | ||||||||
Futures Positions as of December 31, 2014
| Contract |
Long or Short |
Expiration | Contracts | Valuation Price |
Contract Multiplier |
Notional Amount at Value |
||||||||||||||
| Silver Futures (COMEX) |
Long | March 2015 | 2 | $ | 15.60 | 5,000 | $ | 155,990 | ||||||||||||
Forward Agreements as of December 31, 2014
| Reference Index |
Counterparty | Long or Short |
Valuation Price | Notional Amount at Value |
||||||||
| 0.999 Fine Troy Ounce Silver |
Deutsche Bank AG | Long | $ | 15.9718 | $ | 304,550,282 | ||||||
| 0.999 Fine Troy Ounce Silver |
Goldman Sachs International | Long | 15.9716 | 113,411,137 | ||||||||
| 0.999 Fine Troy Ounce Silver |
Societe Generale S.A. | Long | 15.9716 | 73,916,565 | ||||||||
| 0.999 Fine Troy Ounce Silver |
UBS AG | Long | 15.9716 | 90,287,455 | ||||||||
The December 31, 2015 and 2014 futures notional values are calculated by multiplying the number of contracts held times the valuation price times the contract multiplier. The December 31, 2015 and 2014 forward notional values equal units multiplied by the forward price. These notional values will increase (decrease) proportionally with increases (decreases) in the price of the futures contract or forward price, as applicable. Additional gains (losses) associated with these contracts will be equal to any such subsequent increases (decreases) in notional values, before accounting for spreads or transaction or financing costs. The Fund will generally attempt to adjust its positions in Financial Instruments each day to have $2.00 of exposure to the Index for every $1.00 of net assets. While the above
122
Table of Contents
information properly represents the then current commodity price risk and is adequate for estimating the following day’s gains or losses, estimates of future values over longer periods should take the Fund’s daily rebalancing efforts into account. Future period returns, before fees and expenses, cannot be estimated simply by estimating the return of the Index and multiplying by two. See “Item 1A. Risk Factors” in this Annual Report on Form 10-K for additional information regarding performance for periods longer than a single day. Counterparty risk related to the forward agreements is generally limited to the amount of any unrealized gains, although in the event of a counterparty bankruptcy, there could be delays and costs associated with recovering collateral posted in segregated tri-party accounts at the Fund’s custodian bank.
Exchange Rate Sensitivity
Each of the Currency Funds is exposed to exchange rate risk through its holdings of Financial Instruments. The following tables provide information about each of the Currency Fund’s Financial Instruments, which are sensitive to changes in exchange rates. As of December 31, 2015 and 2014, each of the Currency Funds’ positions was as follows:
ProShares Ultra Euro:
As of December 31, 2015 and 2014, the ProShares Ultra Euro Fund was exposed to exchange rate price risk through its holdings of Euro/USD foreign currency forward contracts. The following tables provide information about the Fund’s positions in these Financial Instruments as of December 31, 2015 and 2014, which were sensitive to exchange rate price risk.
Foreign Currency Forward Contracts as of December 31, 2015
| Reference Currency |
Counterparty | Long or Short |
Settlement Date |
Euro | Forward Rate |
Market Value USD |
||||||||||||||
| Euro |
Goldman Sachs International | Long | 01/08/16 | 12,451,525 | 1.0868 | $ | 13,533,325 | |||||||||||||
| Euro |
UBS AG | Long | 01/08/16 | 11,518,600 | 1.0868 | 12,519,346 | ||||||||||||||
| Euro |
Goldman Sachs International | Short | 01/08/16 | (3,430,700 | ) | 1.0868 | (3,728,762 | ) | ||||||||||||
| Euro |
UBS AG | Short | 01/08/16 | (555,100 | ) | 1.0868 | (603,328 | ) | ||||||||||||
Foreign Currency Forward Contracts as of December 31, 2014
| Reference Currency |
Counterparty | Long or Short |
Settlement Date |
Euro | Forward Rate |
Market Value USD |
||||||||||||||
| Euro |
Goldman Sachs International | Long | 01/09/15 | 2,080,425 | 1.2101 | $ | 2,517,638 | |||||||||||||
| Euro |
UBS AG | Long | 01/09/15 | 3,032,200 | 1.2101 | 3,669,434 | ||||||||||||||
| Euro |
Goldman Sachs International | Short | 01/09/15 | (63,400 | ) | 1.2101 | (76,724 | ) | ||||||||||||
| Euro |
UBS AG | Short | 01/09/15 | (122,500 | ) | 1.2101 | (148,244 | ) | ||||||||||||
The December 31, 2015 and 2014 USD market value equals the number of euros multiplied by the forward rate. These notional values will increase (decrease) proportionally with increases (decreases) in the forward price. Additional gains (losses) associated with these contracts will be equal to any such subsequent increases (decreases) in notional values, before accounting for spreads or transaction or financing costs. The Fund will generally attempt to adjust its positions in Financial Instruments each day to have $2.00 of exposure to the euro for every $1.00 of net assets. While the above information properly represents the then current exchange rate price risk and is adequate for estimating the following day’s gains or losses, estimates of future values over longer periods should take the Fund’s daily rebalancing efforts into account. Future period returns, before fees and expenses, cannot be estimated simply by estimating the appreciation or depreciation of the euro and multiplying by two. See “Item 1A. Risk Factors” in this Annual Report on Form 10-K for additional information regarding performance for periods longer than a single day. Counterparty risk related to foreign currency forward contracts is generally limited to the amount of any unrealized gains, although in the event of a counterparty bankruptcy, there could be delays and costs associated with recovering collateral posted in segregated tri-party accounts at the Fund’s custodian bank.
123
Table of Contents
ProShares Ultra Yen:
As of December 31, 2015 and 2014, the ProShares Ultra Yen Fund was exposed to exchange rate price risk through its holdings of Yen/USD foreign currency forward contracts. The following table provides information about the Fund’s positions in these Financial Instruments as of December 31, 2015 and 2014, which were sensitive to exchange rate price risk.
Foreign Currency Forward Contracts as of December 31, 2015
| Reference Currency |
Counterparty | Long or Short |
Settlement Date |
Yen | Forward Rate |
Market Value USD |
||||||||||||||
| Yen |
Goldman Sachs International | Long | 01/08/16 | 866,666,900 | 0.00832 | $ | 7,210,368 | |||||||||||||
| Yen |
UBS AG | Long | 01/08/16 | 488,922,300 | 0.00832 | 4,067,664 | ||||||||||||||
| Yen |
Goldman Sachs International | Short | 01/08/16 | (18,830,800 | ) | 0.00832 | (156,666 | ) | ||||||||||||
| Yen |
UBS AG | Short | 01/08/16 | (21,100,300 | ) | 0.00832 | (175,547 | ) | ||||||||||||
Foreign Currency Forward Contracts as of December 31, 2014
| Reference Currency |
Counterparty | Long or Short |
Settlement Date |
Yen | Forward Rate |
Market Value USD |
||||||||||||||
| Yen |
Goldman Sachs International | Long | 01/09/15 | 229,660,300 | 0.00835 | $ | 1,917,715 | |||||||||||||
| Yen |
UBS AG | Long | 01/09/15 | 304,204,900 | 0.00835 | 2,540,179 | ||||||||||||||
| Yen |
Goldman Sachs International | Short | 01/09/15 | (9,518,600 | ) | 0.00835 | (79,482 | ) | ||||||||||||
| Yen |
UBS AG | Short | 01/09/15 | (16,144,000 | ) | 0.00835 | (134,806 | ) | ||||||||||||
The December 31, 2015 and 2014 USD market values equal the number of yen multiplied by the forward rate. These notional values will increase (decrease) proportionally with increases (decreases) in the forward price. Additional gains (losses) associated with these contracts will be equal to any such subsequent increases (decreases) in notional values, before accounting for spreads or transaction or financing costs. The Fund will generally attempt to adjust its positions in Financial Instruments each day to have $2.00 of exposure to the yen for every $1.00 of net assets. While the above information properly represents the then current exchange rate price risk and is adequate for estimating the following day’s gains or losses, estimates of future values over longer periods should take the Fund’s daily rebalancing efforts into account. Future period returns, before fees and expenses, cannot be estimated simply by estimating the appreciation or depreciation of the yen and multiplying by two. See “Item 1A. Risk Factors” in this Annual Report on Form 10-K for additional information regarding performance for periods longer than a single day. Counterparty risk related to foreign currency forward contracts is generally limited to the amount of any unrealized gains, although in the event of a counterparty bankruptcy, there could be delays and costs associated with recovering collateral posted in segregated tri-party accounts at the Fund’s custodian bank.
Qualitative Disclosure
As described above in Item 7 in this Annual Report on Form 10-K, it is the investment objective of each Geared Fund to seek daily investment results, before fees and expenses, which correspond to a multiple, the inverse or an inverse multiple of the daily performance, whether positive or negative, of its corresponding benchmark. Each Short Fund seeks daily investment results (before fees and expenses) that correspond to the inverse (-1x) of the daily performance of its corresponding benchmark. Each UltraShort Fund seeks daily investment results (before fees and expenses) that correspond to two times the inverse (-2x) of the daily performance of its corresponding benchmark. Each Ultra Fund seeks daily investment results (before fees and expenses) that correspond to two times (2x) the daily performance of its corresponding benchmark. Each Matching VIX Fund and the Managed Futures Fund seeks investment results (before fees and expenses), both over a single day and over time, that match the performance of a benchmark. The Geared Funds do not seek to achieve these stated investment objectives over a period of time greater than a single day because mathematical compounding prevents the Geared Funds from achieving such results. Performance over longer periods of time will be influenced not only by the cumulative period performance of the corresponding benchmark but equally by the intervening volatility of the benchmark as well as fees and expenses, including costs associated with the use of Financial Instruments such as financing costs and trading spreads. Future period returns, before fees and expenses, cannot be estimated simply by estimating the percent change in the corresponding benchmark and multiplying by two or negative two. Each Matching VIX Fund and the
124
Table of Contents
Managed Futures Fund seek investment results (before fees and expenses), both over a single day and over time, that match the performance of a benchmark. Shareholders who invest in the Funds should actively manage and monitor their investments, as frequently as daily. See “Item 1A. Risk Factors” in this Annual Report on Form 10-K for additional information regarding performance for periods longer than a single day. The Matching VIX Funds seek to achieve their stated investment objective both over a single day and over time.
Primary Market Risk Exposure
The primary market risks that the Funds are exposed to depend on each Fund’s investment objective and corresponding benchmark. For example, the primary market risk that the ProShares UltraShort Bloomberg Crude Oil and the ProShares Ultra Bloomberg Crude Oil Funds are exposed to are inverse and direct exposure, respectively, to the price of crude oil as measured by the return of holding and periodically rolling crude oil futures contracts (the Bloomberg Commodity Index and its sub-indexes are based on the price of rolling futures positions, rather than on the cash price for immediate delivery of the corresponding commodity).
Each Fund’s exposure to market risk is further influenced by a number of factors, including the liquidity of the markets in which the contracts are traded and the relationships among the contracts held. The inherent uncertainty of each Fund’s trading as well as the development of drastic market occurrences could ultimately lead to a loss of all or substantially all of investors’ capital.
As described above in Item 7 in this Annual Report on Form 10-K, trading in certain futures contracts or forward agreements involves each Fund entering into contractual commitments to purchase or sell a commodity underlying a Fund’s benchmark at a specified date and price, should it hold such futures contracts or forward agreements into the deliverable period. Should a Fund enter into a contractual commitment to sell a physical commodity, it is required to make delivery of that commodity at the contract price and then repurchase the contract at prevailing market prices or settle in cash. Since the repurchase price to which the value of a commodity can rise is unlimited, entering into commitments to sell commodities would expose a Fund to theoretically unlimited risk.
Commodity Price Sensitivity
As further described above in “Item 1A. Risk Factors” in this Annual Report on Form 10-K, the value of the Shares of each Fund relates directly to the value of, and realized profit or loss from, the Financial Instruments and other assets held by the Fund and fluctuations in the price of these assets could materially adversely affect an investment in the Shares. With regard to the Managed Futures Fund, the Commodity Index Funds or the Commodity Funds, several factors may affect the price of a commodity underlying the Managed Futures Fund, a Commodity Index Fund or a Commodity Fund, and in turn, the Financial Instruments and other assets, if any, owned by such a Fund. The impact of changes in the price of a physical commodity or of a commodity index (comprised of commodity futures contracts) will affect investors differently depending upon the Fund in which investors invest. Daily increases in the price of an underlying commodity or commodity index will negatively impact the daily performance of Shares of an UltraShort Fund and daily decreases in the price of an underlying commodity or commodity index will negatively impact the daily performance of Shares of an Ultra Fund.
Additionally, performance over time is a cumulative effect of geometrically linking each day’s leveraged or inverse leveraged returns. For instance, if a corresponding benchmark was up 10% and then down 10%, which would result in a (1.1*0.9)-1 = -1% period benchmark return, the two-day period return for a theoretical two-times fund would be equal to a (1.2 *0.8)-1 = -4% period Fund return (rather than simply two times the period return of the benchmark).
Exchange Rate Sensitivity
As further described above in “Item 1A. Risk Factors” in this Annual Report on Form 10-K, the value of the Shares of each Fund relates directly to the value of, and realized profit or loss from, the Financial Instruments and other assets held by the Fund and fluctuations in the price of these assets could materially adversely affect an investment in the Shares. With regard to the Managed Futures Fund and the Currency Funds, several factors may affect the value of the foreign currencies or the U.S. dollar, and, in turn, the Financial Instruments and other assets, if any, owned by a Fund. The impact of changes in the price of a currency will affect investors differently depending upon the Fund in which investors invest. Daily increases in the price of a currency will negatively impact the daily performance of Shares of a Short Fund or an UltraShort Fund and daily decreases in the price of a currency will negatively impact the daily performance of Shares of an Ultra Fund.
125
Table of Contents
Additionally, performance over time is a cumulative effect of geometrically linking each day’s leveraged or inverse leveraged returns. For instance, if a corresponding benchmark was up 10% and then down 10%, which would result in a (1.1*0.9)-1 = -1% period benchmark return, the two-day period return for a theoretical two-times fund would be equal to a (1.2 *0.8)-1 = -4% period Fund return (rather than simply two times the period return of the benchmark).
Equity Market Volatility Sensitivity
As further described above in “Item 1A. Risk Factors” in this Annual Report on Form 10-K, the value of the Shares of each VIX Fund relates directly to the value of, and realized profit or loss from, the Financial Instruments and other assets held by the Fund and fluctuations in the price of these assets could materially adversely affect an investment in the Shares. Several factors may affect the price and/or liquidity of VIX futures contracts and other assets, if any, owned by a VIX Fund. The impact of changes in the price of these assets will affect investors differently depending upon the Fund in which investors invest.
Managing Market Risks
Each Fund seeks to remain fully exposed to the corresponding benchmark at the levels implied by the relevant investment objective (-1x, -2x or 2x), regardless of market direction or sentiment. At the close of the relevant markets each trading day (see NAV calculation times), each Fund will seek to position its portfolio so that its exposure to its benchmark is consistent with its investment objective. As described above in Item 7 in this Annual Report on Form 10-K, these adjustments are done through the use of various Financial Instruments. No attempt is made to adjust market exposure in order to avoid changes to the benchmark that would cause the Funds to lose value. Factors common to all Funds that may require portfolio re-positioning are create/redeem activity and index rebalances.
For Geared Funds, the impact of the index’s movements during the day also affects whether the Fund’s portfolio needs to be re-positioned. For example, if the index for an Ultra Fund has risen on a given day, net assets of the Fund should rise. As a result, the Fund’s long exposure will need to be increased to the extent there are not offsetting factors such as redemption activity. Conversely, if the Index has fallen on a given day, net assets of an Ultra Fund should fall. As a result, the Fund’s long exposure will generally need to be decreased. Net assets for Short Funds or UltraShort Funds will generally decrease when the Index rises on a given day. As a result, the Fund’s short exposure may need to be decreased. Conversely, if the Index has fallen on a given day, a Short Fund’s, or an UltraShort Fund’s assets should rise. As a result, the Fund’s short exposure may need to be increased.
The use of certain Financial Instruments introduces counterparty risk. A Fund will be subject to credit risk with respect to the amount it expects to receive from counterparties to Financial Instruments entered into by the Fund. A Fund may be negatively impacted if a counterparty fails to perform its obligations. Each Fund intends to enter into swap and forward agreements only with major global financial institutions that meet certain credit quality standards and monitoring policies. Each Fund may use various techniques to minimize credit risk including early termination or reset and payment, limiting the net amount due from any individual counterparty, and generally requiring that the counterparty post collateral with respect to amounts owed to the Funds, marked to market daily.
Most Financial Instruments held by the Funds are “unfunded” meaning that the Fund will obtain exposure to the corresponding benchmark while still being in possession of its original cash assets. The cash positions that result from use of such Financial Instruments are held in a manner to minimize both interest rate and credit risk. During the reporting period, cash positions were maintained in a non-interest bearing demand deposit account. The Funds also invest a portion of this cash in cash equivalents (such as shares of money market funds, bank deposits, bank money market accounts, certain variable rate-demand notes and repurchase agreements collateralized by government securities).
126
Table of Contents
Item 8. Financial Statements and Supplementary Data.
Statement of Operations for the three month periods ended March 31, 2015 and 2014, June 30, 2015 and 2014, September 30, 2015 and 2014, and December 31, 2015 and 2014, and the years ended December 31, 2015 and 2014 for each Fund, as applicable.
PROSHARES MANAGED FUTURES STRATEGY
| Three months ended (unaudited) | ||||||||||||||||||||
| March 31, 2015 |
June 30, 2015 |
September 30, 2015 |
December 31, 2015 |
Year ended December 31, 2015 |
||||||||||||||||
| Net investment income (loss) |
$ | (16,021 | ) | $ | (18,095 | ) | $ | (19,272 | ) | $ | (18,166 | ) | $ | (71,554 | ) | |||||
|
|
|
|
|
|
|
|
|
|
|
|||||||||||
| Net realized and unrealized gain (loss) |
$ | 98,158 | $ | (389,310 | ) | $ | 27,957 | $ | (62,150 | ) | $ | (325,345 | ) | |||||||
| Net income (loss) |
$ | 82,137 | $ | (407,405 | ) | $ | 8,685 | $ | (80,316 | ) | $ | (396,899 | ) | |||||||
| Net increase (decrease) in net asset value per share |
$ | 0.33 | $ | (0.97 | ) | $ | 0.08 | $ | (0.05 | ) | $ | (0.61 | ) | |||||||
| October 1, 2014 (Commencement of Investment Operations) through December 31, 2014 |
||||
| Net investment income (loss) |
$ | (7,531 | ) | |
|
|
|
|||
| Net realized and unrealized gain (loss) |
$ | 213,333 | ||
| Net income (loss) |
$ | 205,802 | ||
| Net increase (decrease) in net asset value per share |
$ | 1.14 | ||
PROSHARES VIX SHORT-TERM FUTURES ETF
| Three months ended (unaudited) | ||||||||||||||||||||
| March 31, 2015 |
June 30, 2015 |
September 30, 2015 |
December 31, 2015 |
Year ended December 31, 2015 |
||||||||||||||||
| Net investment income (loss) |
$ | (274,472 | ) | $ | (331,587 | ) | $ | (318,561 | ) | $ | (226,174 | ) | $ | (1,150,794 | ) | |||||
|
|
|
|
|
|
|
|
|
|
|
|||||||||||
| Net realized and unrealized gain (loss) |
$ | (20,348,051 | ) | $ | (32,570,365 | ) | $ | 51,225,945 | $ | (25,061,271 | ) | $ | (26,753,742 | ) | ||||||
| Net income (loss) |
$ | (20,622,523 | ) | $ | (32,901,952 | ) | $ | 50,907,384 | $ | (25,287,445 | ) | $ | (27,904,536 | ) | ||||||
| Net increase (decrease) in net asset value per share |
$ | (3.85 | ) | $ | (3.56 | ) | $ | 3.75 | $ | (4.03 | ) | $ | (7.69 | ) | ||||||
| Three months ended (unaudited) | ||||||||||||||||||||
| March 31, 2014 |
June 30, 2014 |
September 30, 2014 |
December 31, 2014 |
Year ended December 31, 2014 |
||||||||||||||||
| Net investment income (loss) |
$ | (353,797 | ) | $ | (226,038 | ) | $ | (253,370 | ) | $ | (285,343 | ) | $ | (1,118,548 | ) | |||||
|
|
|
|
|
|
|
|
|
|
|
|||||||||||
| Net realized and unrealized gain (loss) |
$ | 27,407,450 | $ | (42,811,471 | ) | $ | 16,054,928 | $ | 21,578,065 | $ | 22,228,972 | |||||||||
| Net income (loss) |
$ | 27,053,653 | $ | (43,037,509 | ) | $ | 15,801,558 | $ | 21,292,722 | $ | 21,110,424 | |||||||||
| Net increase (decrease) in net asset value per share |
$ | (0.34 | ) | $ | (9.19 | ) | $ | 1.81 | $ | 0.11 | $ | (7.61 | ) | |||||||
PROSHARES VIX MID-TERM FUTURES ETF
| Three months ended (unaudited) | ||||||||||||||||||||
| March 31, 2015 |
June 30, 2015 |
September 30, 2015 |
December 31, 2015 |
Year ended December 31, 2015 |
||||||||||||||||
| Net investment income (loss) |
$ | (63,559 | ) | $ | (57,794 | ) | $ | (59,501 | ) | $ | (59,746 | ) | $ | (240,600 | ) | |||||
|
|
|
|
|
|
|
|
|
|
|
|||||||||||
| Net realized and unrealized gain (loss) |
$ | (633,713 | ) | $ | (2,850,316 | ) | $ | 4,392,949 | $ | (4,848,853 | ) | $ | (3,939,933 | ) | ||||||
| Net income (loss) |
$ | (697,272 | ) | $ | (2,908,110 | ) | $ | 4,333,448 | $ | (4,908,599 | ) | $ | (4,180,533 | ) | ||||||
| Net increase (decrease) in net asset value per share |
$ | (2.23 | ) | $ | (6.43 | ) | $ | 8.89 | $ | (9.87 | ) | $ | (9.64 | ) | ||||||
127
Table of Contents
| Three months ended (unaudited) | ||||||||||||||||||||
| March 31, 2014 |
June 30, 2014 |
September 30, 2014 |
December 31, 2014 |
Year ended December 31, 2014 |
||||||||||||||||
| Net investment income (loss) |
$ | (110,008 | ) | $ | (97,187 | ) | $ | (92,236 | ) | $ | (87,047 | ) | $ | (386,478 | ) | |||||
|
|
|
|
|
|
|
|
|
|
|
|||||||||||
| Net realized and unrealized gain (loss) |
$ | (2,507,472 | ) | $ | (8,154,254 | ) | $ | 1,961,421 | $ | (519,222 | ) | $ | (9,219,527 | ) | ||||||
| Net income (loss) |
$ | (2,617,480 | ) | $ | (8,251,441 | ) | $ | 1,869,185 | $ | (606,269 | ) | $ | (9,606,005 | ) | ||||||
| Net increase (decrease) in net asset value per share |
$ | (3.21 | ) | $ | (12.21 | ) | $ | 2.25 | $ | (0.41 | ) | $ | (13.58 | ) | ||||||
PROSHARES SHORT VIX SHORT-TERM FUTURES ETF
| Three months ended (unaudited) | ||||||||||||||||||||
| March 31, 2015 |
June 30, 2015 |
September 30, 2015 |
December 31, 2015 |
Year ended December 31, 2015 |
||||||||||||||||
| Net investment income (loss) |
$ | (1,492,492 | ) | $ | (840,088 | ) | $ | (1,375,292 | ) | $ | (2,090,328 | ) | $ | (5,798,200 | ) | |||||
|
|
|
|
|
|
|
|
|
|
|
|||||||||||
| Net realized and unrealized gain (loss) |
$ | 47,179,205 | $ | 62,471,026 | $ | (119,325,102 | ) | $ | 106,611,026 | $ | 96,936,157 | |||||||||
| Net income (loss) |
$ | 45,686,713 | $ | 61,630,938 | $ | (120,700,394 | ) | $ | 104,520,698 | $ | 91,137,957 | |||||||||
| Net increase (decrease) in net asset value per share |
$ | 6.27 | $ | 11.18 | $ | (31.68 | ) | $ | 3.64 | $ | (10.59 | ) | ||||||||
| Three months ended (unaudited) | ||||||||||||||||||||
| March 31, 2014 |
June 30, 2014 |
September 30, 2014 |
December 31, 2014 |
Year ended December 31, 2014 |
||||||||||||||||
| Net investment income (loss) |
$ | (771,039 | ) | $ | (740,111 | ) | $ | (989,160 | ) | $ | (1,785,159 | ) | $ | (4,285,469 | ) | |||||
|
|
|
|
|
|
|
|
|
|
|
|||||||||||
| Net realized and unrealized gain (loss) |
$ | 2,702,003 | $ | 74,375,658 | $ | (15,817,047 | ) | $ | (8,786,121 | ) | $ | 52,474,493 | ||||||||
| Net income (loss) |
$ | 1,930,964 | $ | 73,635,547 | $ | (16,806,207 | ) | $ | (10,571,280 | ) | $ | 48,189,024 | ||||||||
| Net increase (decrease) in net asset value per share |
$ | (5.64 | ) | $ | 26.55 | $ | (13.59 | ) | $ | (13.42 | ) | $ | (6.10 | ) | ||||||
PROSHARES ULTRA VIX SHORT-TERM FUTURES ETF
| Three months ended (unaudited) | ||||||||||||||||||||
| March 31, 2015 |
June 30, 2015 |
September 30, 2015 |
December 31, 2015 |
Year ended December 31, 2015 |
||||||||||||||||
| Net investment income (loss) |
$ | (2,049,613 | ) | $ | (2,003,111 | ) | $ | (1,444,542 | ) | $ | (1,912,882 | ) | $ | (7,410,148 | ) | |||||
|
|
|
|
|
|
|
|
|
|
|
|||||||||||
| Net realized and unrealized gain (loss) |
$ | (223,600,088 | ) | $ | (264,338,289 | ) | $ | 182,002,869 | $ | (113,952,578 | ) | $ | (419,888,086 | ) | ||||||
| Net income (loss) |
$ | (225,649,701 | ) | $ | (266,341,400 | ) | $ | 180,558,327 | $ | (115,865,460 | ) | $ | (427,298,234 | ) | ||||||
| Net increase (decrease) in net asset value per share* |
$ | (49.51 | ) | $ | (31.43 | ) | $ | 12.70 | $ | (29.14 | ) | $ | (97.38 | ) | ||||||
| Three months ended (unaudited) | ||||||||||||||||||||
| March 31, 2014 |
June 30, 2014 |
September 30, 2014 |
December 31, 2014 |
Year ended December 31, 2014 |
||||||||||||||||
| Net investment income (loss) |
$ | (1,084,303 | ) | $ | (1,418,872 | ) | $ | (1,308,139 | ) | $ | (1,548,172 | ) | $ | (5,359,486 | ) | |||||
|
|
|
|
|
|
|
|
|
|
|
|||||||||||
| Net realized and unrealized gain (loss) |
$ | (9,236,592 | ) | $ | (258,000,022 | ) | $ | 84,470,033 | $ | 106,954,440 | $ | (75,812,141 | ) | |||||||
| Net income (loss) |
$ | (10,320,895 | ) | $ | (259,418,894 | ) | $ | 83,161,894 | $ | 105,406,268 | $ | (81,171,627 | ) | |||||||
| Net increase (decrease) in net asset value per share* |
$ | (33.94 | ) | $ | (168.72 | ) | $ | 16.07 | $ | (23.37 | ) | $ | (209.96 | ) | ||||||
PROSHARES ULTRASHORT BLOOMBERG COMMODITY
| Three months ended (unaudited) | ||||||||||||||||||||
| March 31, 2015 |
June 30, 2015 |
September 30, 2015 |
December 31, 2015 |
Year ended December 31, 2015 |
||||||||||||||||
| Net investment income (loss) |
$ | (12,318 | ) | $ | (12,273 | ) | $ | (15,054 | ) | $ | (16,981 | ) | $ | (56,626 | ) | |||||
|
|
|
|
|
|
|
|
|
|
|
|||||||||||
| Net realized and unrealized gain (loss) |
$ | 565,975 | $ | (589,890 | ) | $ | 1,735,002 | $ | 1,594,872 | $ | 3,305,959 | |||||||||
| Net income (loss) |
$ | 553,657 | $ | (602,163 | ) | $ | 1,719,948 | $ | 1,577,891 | $ | 3,249,333 | |||||||||
| Net increase (decrease) in net asset value per share |
$ | 9.23 | $ | (10.04 | ) | $ | 28.67 | $ | 26.30 | $ | 54.16 | |||||||||
128
Table of Contents
| Three months ended (unaudited) | ||||||||||||||||||||
| March 31, 2014 |
June 30, 2014 |
September 30, 2014 |
December 31, 2014 |
Year ended December 31, 2014 |
||||||||||||||||
| Net investment income (loss) |
$ | (7,991 | ) | $ | (7,267 | ) | $ | (8,532 | ) | $ | (10,280 | ) | $ | (34,070 | ) | |||||
|
|
|
|
|
|
|
|
|
|
|
|||||||||||
| Net realized and unrealized gain (loss) |
$ | (505,706 | ) | $ | (22,047 | ) | $ | 903,300 | $ | 1,125,802 | $ | 1,501,349 | ||||||||
| Net income (loss) |
$ | (513,697 | ) | $ | (29,314 | ) | $ | 894,768 | $ | 1,115,522 | $ | 1,467,279 | ||||||||
| Net increase (decrease) in net asset value per share |
$ | (8.56 | ) | $ | (0.49 | ) | $ | 14.91 | $ | 18.60 | $ | 24.46 | ||||||||
PROSHARES ULTRASHORT BLOOMBERG CRUDE OIL
| Three months ended (unaudited) | ||||||||||||||||||||
| March 31, 2015 |
June 30, 2015 |
September 30, 2015 |
December 31, 2015 |
Year ended December 31, 2015 |
||||||||||||||||
| Net investment income (loss) |
$ | (627,608 | ) | $ | (732,642 | ) | $ | (463,183 | ) | $ | (342,778 | ) | $ | (2,166,211 | ) | |||||
|
|
|
|
|
|
|
|
|
|
|
|||||||||||
| Net realized and unrealized gain (loss) |
$ | 46,090,543 | $ | (130,174,273 | ) | $ | 86,025,955 | $ | 55,790,650 | $ | 57,732,875 | |||||||||
| Net income (loss) |
$ | 45,462,935 | $ | (130,906,915 | ) | $ | 85,562,772 | $ | 55,447,872 | $ | 55,566,664 | |||||||||
| Net increase (decrease) in net asset value per share |
$ | 8.75 | $ | (29.92 | ) | $ | 30.71 | $ | 45.68 | $ | 55.22 | |||||||||
| Three months ended (unaudited) | ||||||||||||||||||||
| March 31, 2014 |
June 30, 2014 |
September 30, 2014 |
December 31, 2014 |
Year ended December 31, 2014 |
||||||||||||||||
| Net investment income (loss) |
$ | (599,273 | ) | $ | (829,357 | ) | $ | (639,303 | ) | $ | (347,908 | ) | $ | (2,415,841 | ) | |||||
|
|
|
|
|
|
|
|
|
|
|
|||||||||||
| Net realized and unrealized gain (loss) |
$ | (15,666,162 | ) | $ | (45,885,286 | ) | $ | 71,664,478 | $ | 135,616,417 | $ | 145,729,447 | ||||||||
| Net income (loss) |
$ | (16,265,435 | ) | $ | (46,714,643 | ) | $ | 71,025,175 | $ | 135,268,509 | $ | 143,313,606 | ||||||||
| Net increase (decrease) in net asset value per share |
$ | (3.25 | ) | $ | (3.85 | ) | $ | 6.16 | $ | 47.19 | $ | 46.25 | ||||||||
PROSHARES ULTRASHORT BLOOMBERG NATURAL GAS
| Three months ended (unaudited) | ||||||||||||||||||||
| March 31, 2015 |
June 30, 2015 |
September 30, 2015 |
December 31, 2015 |
Year ended December 31, 2015 |
||||||||||||||||
| Net investment income (loss) |
$ | (41,587 | ) | $ | (48,062 | ) | $ | (37,310 | ) | $ | (50,165 | ) | $ | (177,124 | ) | |||||
|
|
|
|
|
|
|
|
|
|
|
|||||||||||
| Net realized and unrealized gain (loss) |
$ | 2,097,816 | $ | (910,106 | ) | $ | 3,698,383 | $ | 3,914,279 | $ | 8,800,372 | |||||||||
| Net income (loss) |
$ | 2,056,229 | $ | (958,168 | ) | $ | 3,661,073 | $ | 3,864,114 | $ | 8,623,248 | |||||||||
| Net increase (decrease) in net asset value per share |
$ | 3.53 | $ | (12.69 | ) | $ | 22.33 | $ | 42.46 | $ | 55.63 | |||||||||
| Three months ended (unaudited) | ||||||||||||||||||||
| March 31, 2014 |
June 30, 2014 |
September 30, 2014 |
December 31, 2014 |
Year ended December 31, 2014 |
||||||||||||||||
| Net investment income (loss) |
$ | (155,585 | ) | $ | (172,282 | ) | $ | (86,019 | ) | $ | (47,021 | ) | $ | (460,907 | ) | |||||
|
|
|
|
|
|
|
|
|
|
|
|||||||||||
| Net realized and unrealized gain (loss) |
$ | (5,773,719 | ) | $ | (3,982,380 | ) | $ | 9,581,777 | $ | 11,870,441 | $ | 11,696,119 | ||||||||
| Net income (loss) |
$ | (5,929,304 | ) | $ | (4,154,662 | ) | $ | 9,495,758 | $ | 11,823,420 | $ | 11,235,212 | ||||||||
| Net increase (decrease) in net asset value per share |
$ | (26.06 | ) | $ | (3.35 | ) | $ | 5.76 | $ | 37.64 | $ | 13.99 | ||||||||
PROSHARES ULTRASHORT GOLD
| Three months ended (unaudited) | ||||||||||||||||||||
| March 31, 2015 |
June 30, 2015 |
September 30, 2015 |
December 31, 2015 |
Year ended December 31, 2015 |
||||||||||||||||
| Net investment income (loss) |
$ | (185,696 | ) | $ | (167,434 | ) | $ | (181,720 | ) | $ | (168,732 | ) | $ | (703,582 | ) | |||||
|
|
|
|
|
|
|
|
|
|
|
|||||||||||
| Net realized and unrealized gain (loss) |
$ | 2,615,871 | $ | 1,077,517 | $ | 5,999,565 | $ | 7,114,493 | $ | 16,807,446 | ||||||||||
| Net income (loss) |
$ | 2,430,175 | $ | 910,083 | $ | 5,817,845 | $ | 6,945,761 | $ | 16,103,864 | ||||||||||
| Net increase (decrease) in net asset value per share |
$ | 1.17 | $ | 1.18 | $ | 7.99 | $ | 8.89 | $ | 19.23 | ||||||||||
129
Table of Contents
| Three months ended (unaudited) | ||||||||||||||||||||
| March 31, 2014 |
June 30, 2014 |
September 30, 2014 |
December 31, 2014 |
Year ended December 31, 2014 |
||||||||||||||||
| Net investment income (loss) |
$ | (250,373 | ) | $ | (218,689 | ) | $ | (185,871 | ) | $ | (202,884 | ) | $ | (857,817 | ) | |||||
|
|
|
|
|
|
|
|
|
|
|
|||||||||||
| Net realized and unrealized gain (loss) |
$ | (19,243,614 | ) | $ | (5,262,045 | ) | $ | 11,832,873 | $ | (573,826 | ) | $ | (13,246,612 | ) | ||||||
| Net income (loss) |
$ | (19,493,987 | ) | $ | (5,480,734 | ) | $ | 11,647,002 | $ | (776,710 | ) | $ | (14,104,429 | ) | ||||||
| Net increase (decrease) in net asset value per share |
$ | (15.22 | ) | $ | (4.30 | ) | $ | 12.93 | $ | (0.28 | ) | $ | (6.87 | ) | ||||||
PROSHARES ULTRASHORT SILVER
| Three months ended (unaudited) | ||||||||||||||||||||
| March 31, 2015 |
June 30, 2015 |
September 30, 2015 |
December 31, 2015 |
Year ended December 31, 2015 |
||||||||||||||||
| Net investment income (loss) |
$ | (118,220 | ) | $ | (130,679 | ) | $ | (129,265 | ) | $ | (138,300 | ) | $ | (516,464 | ) | |||||
|
|
|
|
|
|
|
|
|
|
|
|||||||||||
| Net realized and unrealized gain (loss) |
$ | (5,691,197 | ) | $ | 5,720,789 | $ | 6,242,356 | $ | 8,671,752 | $ | 14,943,700 | |||||||||
| Net income (loss) |
$ | (5,809,417 | ) | $ | 5,590,110 | $ | 6,113,091 | $ | 8,533,452 | $ | 14,427,236 | |||||||||
| Net increase (decrease) in net asset value per share* |
$ | (7.22 | ) | $ | 4.13 | $ | 5.31 | $ | 4.55 | $ | 6.77 | |||||||||
| Three months ended (unaudited) | ||||||||||||||||||||
| March 31, 2014 |
June 30, 2014 |
September 30, 2014 |
December 31, 2014 |
Year ended December 31, 2014 |
||||||||||||||||
| Net investment income (loss) |
$ | (191,211 | ) | $ | (133,126 | ) | $ | (129,289 | ) | $ | (132,215 | ) | $ | (585,841 | ) | |||||
|
|
|
|
|
|
|
|
|
|
|
|||||||||||
| Net realized and unrealized gain (loss) |
$ | (2,651,815 | ) | $ | (5,873,834 | ) | $ | 21,824,710 | $ | 4,627,812 | $ | 17,926,873 | ||||||||
| Net income (loss) |
$ | (2,843,026 | ) | $ | (6,006,960 | ) | $ | 21,695,421 | $ | 4,495,597 | $ | 17,341,032 | ||||||||
| Net increase (decrease) in net asset value per share* |
$ | (3.52 | ) | $ | (4.54 | ) | $ | 16.73 | $ | 4.25 | $ | 12.92 | ||||||||
PROSHARES SHORT EURO
| Three months ended (unaudited) | ||||||||||||||||||||
| March 31, 2015 |
June 30, 2015 |
September 30, 2015 |
December 31, 2015 |
Year ended December 31, 2015 |
||||||||||||||||
| Net investment income (loss) |
$ | (38,347 | ) | $ | (45,895 | ) | $ | (47,612 | ) | $ | (46,907 | ) | $ | (178,761 | ) | |||||
| Net realized and unrealized gain (loss) |
$ | 1,781,715 | $ | (777,986 | ) | $ | (32,048 | ) | $ | 445,899 | $ | 1,417,580 | ||||||||
| Net income (loss) |
$ | 1,743,368 | $ | (823,881 | ) | $ | (79,660 | ) | $ | 398,992 | $ | 1,238,819 | ||||||||
| Net increase (decrease) in net asset value per share |
$ | 4.79 | $ | (1.83 | ) | $ | (0.26 | ) | $ | 1.02 | $ | 3.72 | ||||||||
| Three months ended (unaudited) | ||||||||||||||||||||
| March 31, 2014 |
June 30, 2014 |
September 30, 2014 |
December 31, 2014 |
Year ended December 31, 2014 |
||||||||||||||||
| Net investment income (loss) |
$ | (16,599 | ) | $ | (27,255 | ) | $ | (37,429 | ) | $ | (36,964 | ) | $ | (118,247 | ) | |||||
|
|
|
|
|
|
|
|
|
|
|
|||||||||||
| Net realized and unrealized gain (loss) |
$ | 14,611 | $ | 65,929 | $ | 1,308,992 | $ | 622,008 | $ | 2,011,540 | ||||||||||
| Net income (loss) |
$ | (1,988 | ) | $ | 38,674 | $ | 1,271,563 | $ | 585,044 | $ | 1,893,293 | |||||||||
| Net increase (decrease) in net asset value per share |
$ | (0.08 | ) | $ | 0.10 | $ | 2.91 | $ | 1.55 | $ | 4.48 | |||||||||
130
Table of Contents
PROSHARES ULTRASHORT AUSTRALIAN DOLLAR
| Three months ended (unaudited) | ||||||||||||||||||||
| March 31, 2015 |
June 30, 2015 |
September 30, 2015 |
December 31, 2015 |
Year ended December 31, 2015 |
||||||||||||||||
| Net investment income (loss) |
$ | (55,714 | ) | $ | (48,012 | ) | $ | (54,415 | ) | $ | (51,846 | ) | $ | (209,987 | ) | |||||
|
|
|
|
|
|
|
|
|
|
|
|||||||||||
| Net realized and unrealized gain (loss) |
$ | 2,656,367 | $ | (963,218 | ) | $ | 3,544,373 | $ | (2,071,138 | ) | $ | 3,166,384 | ||||||||
| Net income (loss) |
$ | 2,600,653 | $ | (1,011,230 | ) | $ | 3,489,958 | $ | (2,122,984 | ) | $ | 2,956,397 | ||||||||
| Net increase (decrease) in net asset value per share |
$ | 6.06 | $ | (2.89 | ) | $ | 9.97 | $ | (6.06 | ) | $ | 7.08 | ||||||||
| Three months ended (unaudited) | ||||||||||||||||||||
| March 31, 2014 |
June 30, 2014 |
September 30, 2014 |
December 31, 2014 |
Year ended December 31, 2014 |
||||||||||||||||
| Net investment income (loss) |
$ | (59,178 | ) | $ | (49,562 | ) | $ | (50,580 | ) | $ | (53,863 | ) | $ | (213,183 | ) | |||||
|
|
|
|
|
|
|
|
|
|
|
|||||||||||
| Net realized and unrealized gain (loss) |
$ | (2,218,104 | ) | $ | (988,871 | ) | $ | 2,798,717 | $ | 2,529,379 | $ | 2,121,121 | ||||||||
| Net income (loss) |
$ | (2,277,282 | ) | $ | (1,038,433 | ) | $ | 2,748,137 | $ | 2,475,516 | $ | 1,907,938 | ||||||||
| Net increase (decrease) in net asset value per share |
$ | (4.31 | ) | $ | (2.08 | ) | $ | 5.62 | $ | 5.51 | $ | 4.74 | ||||||||
PROSHARES ULTRASHORT EURO
| Three months ended (unaudited) | ||||||||||||||||||||
| March 31, 2015 |
June 30, 2015 |
September 30, 2015 |
December 31, 2015 |
Year ended December 31, 2015 |
||||||||||||||||
| Net investment income (loss) |
$ | (1,189,555 | ) | $ | (1,296,221 | ) | $ | (1,351,762 | ) | $ | (1,163,049 | ) | $ | (5,000,587 | ) | |||||
|
|
|
|
|
|
|
|
|
|
|
|||||||||||
| Net realized and unrealized gain (loss) |
$ | 114,159,808 | $ | (48,496,893 | ) | $ | (7,308,030 | ) | $ | 27,822,084 | $ | 86,176,969 | ||||||||
| Net income (loss) |
$ | 112,970,253 | $ | (49,793,114 | ) | $ | (8,659,792 | ) | $ | 26,659,035 | $ | 81,176,382 | ||||||||
| Net increase (decrease) in net asset value per share |
$ | 5.36 | $ | (2.21 | ) | $ | (0.36 | ) | $ | 1.16 | $ | 3.95 | ||||||||
| Three months ended (unaudited) | ||||||||||||||||||||
| March 31, 2014 |
June 30, 2014 |
September 30, 2014 |
December 31, 2014 |
Year ended December 31, 2014 |
||||||||||||||||
| Net investment income (loss) |
$ | (901,399 | ) | $ | (948,368 | ) | $ | (1,070,109 | ) | $ | (1,074,269 | ) | $ | (3,994,145 | ) | |||||
|
|
|
|
|
|
|
|
|
|
|
|||||||||||
| Net realized and unrealized gain (loss) |
$ | (2,166,393 | ) | $ | 4,020,165 | $ | 74,943,078 | $ | 37,385,957 | $ | 114,182,807 | |||||||||
| Net income (loss) |
$ | (3,067,792 | ) | $ | 3,071,797 | $ | 73,872,969 | $ | 36,311,688 | $ | 110,188,662 | |||||||||
| Net increase (decrease) in net asset value per share |
$ | (0.13 | ) | $ | 0.13 | $ | 2.91 | $ | 1.62 | $ | 4.53 | |||||||||
PROSHARES ULTRASHORT YEN
| Three months ended (unaudited) | ||||||||||||||||||||
| March 31, 2015 |
June 30, 2015 |
September 30, 2015 |
December 31, 2015 |
Year ended December 31, 2015 |
||||||||||||||||
| Net investment income (loss) |
$ | (1,116,544 | ) | $ | (973,386 | ) | $ | (865,306 | ) | $ | (668,442 | ) | $ | (3,623,678 | ) | |||||
|
|
|
|
|
|
|
|
|
|
|
|||||||||||
| Net realized and unrealized gain (loss) |
$ | (2,867,365 | ) | $ | 15,764,799 | $ | (19,107,015 | ) | $ | 2,668,447 | $ | (3,541,134 | ) | |||||||
| Net income (loss) |
$ | (3,983,909 | ) | $ | 14,791,413 | $ | (19,972,321 | ) | $ | 2,000,005 | $ | (7,164,812 | ) | |||||||
| Net increase (decrease) in net asset value per share |
$ | (0.36 | ) | $ | 3.21 | $ | (4.36 | ) | $ | 0.12 | $ | (1.39 | ) | |||||||
| Three months ended (unaudited) | ||||||||||||||||||||
| March 31, 2014 |
June 30, 2014 |
September 30, 2014 |
December 31, 2014 |
Year ended December 31, 2014 |
||||||||||||||||
| Net investment income (loss) |
$ | (950,309 | ) | $ | (820,394 | ) | $ | (866,070 | ) | $ | (1,104,828 | ) | $ | (3,741,601 | ) | |||||
|
|
|
|
|
|
|
|
|
|
|
|||||||||||
| Net realized and unrealized gain (loss) |
$ | (24,636,797 | ) | $ | (14,260,091 | ) | $ | 60,575,000 | $ | 75,195,594 | $ | 96,873,706 | ||||||||
| Net income (loss) |
$ | (25,587,106 | ) | $ | (15,080,485 | ) | $ | 59,708,930 | $ | 74,090,766 | $ | 93,132,105 | ||||||||
| Net increase (decrease) in net asset value per share |
$ | (3.25 | ) | $ | (2.72 | ) | $ | 10.86 | $ | 13.58 | $ | 18.47 | ||||||||
131
Table of Contents
PROSHARES ULTRA BLOOMBERG COMMODITY
| Three months ended (unaudited) | ||||||||||||||||||||
| March 31, 2015 |
June 30, 2015 |
September 30, 2015 |
December 31, 2015 |
Year ended December 31, 2015 |
||||||||||||||||
| Net investment income (loss) |
$ | (5,519 | ) | $ | (5,763 | ) | $ | (5,077 | ) | $ | (17,183 | ) | $ | (33,542 | ) | |||||
|
|
|
|
|
|
|
|
|
|
|
|||||||||||
| Net realized and unrealized gain (loss) |
$ | (318,493 | ) | $ | 232,998 | $ | (676,874 | ) | $ | (2,043,086 | ) | $ | (2,805,455 | ) | ||||||
| Net income (loss) |
$ | (324,012 | ) | $ | 227,235 | $ | (681,951 | ) | $ | (2,060,269 | ) | $ | (2,838,997 | ) | ||||||
| Net increase (decrease) in net asset value per share* |
$ | (6.48 | ) | $ | 3.93 | $ | (13.74 | ) | $ | (7.41 | ) | $ | (23.70 | ) | ||||||
| Three months ended (unaudited) | ||||||||||||||||||||
| March 31, 2014 |
June 30, 2014 |
September 30, 2014 |
December 31, 2014 |
Year ended December 31, 2014 |
||||||||||||||||
| Net investment income (loss) |
$ | (6,957 | ) | $ | (7,738 | ) | $ | (8,944 | ) | $ | (7,352 | ) | $ | (30,991 | ) | |||||
|
|
|
|
|
|
|
|
|
|
|
|||||||||||
| Net realized and unrealized gain (loss) |
$ | 408,227 | $ | (37,364 | ) | $ | (991,280 | ) | $ | (791,622 | ) | $ | (1,412,039 | ) | ||||||
| Net income (loss) |
$ | 401,270 | $ | (45,102 | ) | $ | (1,000,224 | ) | $ | (798,974 | ) | $ | (1,443,030 | ) | ||||||
| Net increase (decrease) in net asset value per share* |
$ | 10.70 | $ | (0.31 | ) | $ | (20.01 | ) | $ | (15.98 | ) | $ | (25.60 | ) | ||||||
PROSHARES ULTRA BLOOMBERG CRUDE OIL
| Three months ended (unaudited) | ||||||||||||||||||||
| March 31, 2015 |
June 30, 2015 |
September 30, 2015 |
December 31, 2015 |
Year ended December 31, 2015 |
||||||||||||||||
| Net investment income (loss) |
$ | (1,844,712 | ) | $ | (2,559,682 | ) | $ | (2,085,145 | ) | $ | (1,983,616 | ) | $ | (8,473,155 | ) | |||||
|
|
|
|
|
|
|
|
|
|
|
|||||||||||
| Net realized and unrealized gain (loss) |
$ | (193,319,571 | ) | $ | 358,080,448 | $ | (588,538,331 | ) | $ | (439,833,790 | ) | $ | (863,611,244 | ) | ||||||
| Net income (loss) |
$ | (195,164,283 | ) | $ | 355,520,766 | $ | (590,623,476 | ) | $ | (441,817,406 | ) | $ | (872,084,399 | ) | ||||||
| Net increase (decrease) in net asset value per share* |
$ | (16.62 | ) | $ | 11.38 | $ | (23.15 | ) | $ | (9.77 | ) | $ | (38.16 | ) | ||||||
| Three months ended (unaudited) | ||||||||||||||||||||
| March 31, 2014 |
June 30, 2014 |
September 30, 2014 |
December 31, 2014 |
Year ended December 31, 2014 |
||||||||||||||||
| Net investment income (loss) |
$ | (333,392 | ) | $ | (224,621 | ) | $ | (329,563 | ) | $ | (878,788 | ) | $ | (1,766,364 | ) | |||||
|
|
|
|
|
|
|
|
|
|
|
|||||||||||
| Net realized and unrealized gain (loss) |
$ | 21,676,202 | $ | 11,978,443 | $ | (28,886,080 | ) | $ | (373,330,487 | ) | $ | (368,561,922 | ) | |||||||
| Net income (loss) |
$ | 21,342,810 | $ | 11,753,822 | $ | (29,215,643 | ) | $ | (374,209,275 | ) | $ | (370,328,286 | ) | |||||||
| Net increase (decrease) in net asset value per share* |
$ | 12.68 | $ | 22.82 | $ | (45.36 | ) | $ | (99.85 | ) | $ | (109.71 | ) | |||||||
PROSHARES ULTRA BLOOMBERG NATURAL GAS
| Three months ended (unaudited) | ||||||||||||||||||||
| March 31, 2015 |
June 30, 2015 |
September 30, 2015 |
December 31, 2015 |
Year ended December 31, 2015 |
||||||||||||||||
| Net investment income (loss) |
$ | (206,884 | ) | $ | (222,837 | ) | $ | (190,466 | ) | $ | (141,148 | ) | $ | (761,335 | ) | |||||
|
|
|
|
|
|
|
|
|
|
|
|||||||||||
| Net realized and unrealized gain (loss) |
$ | (18,381,540 | ) | $ | 2,617,359 | $ | (21,633,331 | ) | $ | (22,173,098 | ) | $ | (59,570,610 | ) | ||||||
| Net income (loss) |
$ | (18,588,424 | ) | $ | 2,394,522 | $ | (21,823,797 | ) | $ | (22,314,246 | ) | $ | (60,331,945 | ) | ||||||
| Net increase (decrease) in net asset value per share* |
$ | (15.98 | ) | $ | (0.25 | ) | $ | (13.40 | ) | $ | (13.45 | ) | $ | (43.08 | ) | |||||
| Three months ended (unaudited) | ||||||||||||||||||||
| March 31, 2014 |
June 30, 2014 |
September 30, 2014 |
December 31, 2014 |
Year ended December 31, 2014 |
||||||||||||||||
| Net investment income (loss) |
$ | (117,562 | ) | $ | (51,717 | ) | $ | (128,208 | ) | $ | (231,094 | ) | $ | (528,581 | ) | |||||
|
|
|
|
|
|
|
|
|
|
|
|||||||||||
| Net realized and unrealized gain (loss) |
$ | 18,608,808 | $ | 603,144 | $ | (1,319,583 | ) | $ | (55,586,378 | ) | $ | (37,694,009 | ) | |||||||
| Net income (loss) |
$ | 18,491,246 | $ | 551,427 | $ | (1,447,791 | ) | $ | (55,817,472 | ) | $ | (38,222,590 | ) | |||||||
| Net increase (decrease) in net asset value per share* |
$ | 25.20 | $ | (0.41 | ) | $ | (35.29 | ) | $ | (83.20 | ) | $ | (93.70 | ) | ||||||
132
Table of Contents
PROSHARES ULTRA GOLD
| Three months ended (unaudited) | ||||||||||||||||||||
| March 31, 2015 |
June 30, 2015 |
September 30, 2015 |
December 31, 2015 |
Year ended December 31, 2015 |
||||||||||||||||
| Net investment income (loss) |
$ | (227,743 | ) | $ | (212,388 | ) | $ | (190,084 | ) | $ | (166,209 | ) | $ | (796,424 | ) | |||||
|
|
|
|
|
|
|
|
|
|
|
|||||||||||
| Net realized and unrealized gain (loss) |
$ | (3,374,221 | ) | $ | (3,014,902 | ) | $ | (9,190,257 | ) | $ | (7,336,271 | ) | $ | (22,915,651 | ) | |||||
| Net income (loss) |
$ | (3,601,964 | ) | $ | (3,227,290 | ) | $ | (9,380,341 | ) | $ | (7,502,480 | ) | $ | (23,712,075 | ) | |||||
| Net increase (decrease) in net asset value per share |
$ | (1.62 | ) | $ | (1.36 | ) | $ | (3.87 | ) | $ | (3.42 | ) | $ | (10.27 | ) | |||||
| Three months ended (unaudited) | ||||||||||||||||||||
| March 31, 2014 |
June 30, 2014 |
September 30, 2014 |
December 31, 2014 |
Year ended December 31, 2014 |
||||||||||||||||
| Net investment income (loss) |
$ | (317,539 | ) | $ | (297,090 | ) | $ | (293,686 | ) | $ | (249,033 | ) | $ | (1,157,348 | ) | |||||
|
|
|
|
|
|
|
|
|
|
|
|||||||||||
| Net realized and unrealized gain (loss) |
$ | 18,243,517 | $ | 3,768,105 | $ | (20,002,547 | ) | $ | (2,793,404 | ) | $ | (784,329 | ) | |||||||
| Net income (loss) |
$ | 17,925,978 | $ | 3,471,015 | $ | (20,296,233 | ) | $ | (3,042,437 | ) | $ | (1,941,677 | ) | |||||||
| Net increase (decrease) in net asset value per share |
$ | 5.77 | $ | 1.35 | $ | (7.28 | ) | $ | (1.09 | ) | $ | (1.25 | ) | |||||||
PROSHARES ULTRA SILVER
| Three months ended (unaudited) | ||||||||||||||||||||
| March 31, 2015 |
June 30, 2015 |
September 30, 2015 |
December 31, 2015 |
Year ended December 31, 2015 |
||||||||||||||||
| Net investment income (loss) |
$ | (699,839 | ) | $ | (679,148 | ) | $ | (596,454 | ) | $ | (532,418 | ) | $ | (2,507,859 | ) | |||||
|
|
|
|
|
|
|
|
|
|
|
|||||||||||
| Net realized and unrealized gain (loss) |
$ | 17,250,785 | $ | (34,725,040 | ) | $ | (42,765,969 | ) | $ | (28,252,102 | ) | $ | (88,492,326 | ) | ||||||
| Net income (loss) |
$ | 16,550,946 | $ | (35,404,188 | ) | $ | (43,362,423 | ) | $ | (28,784,520 | ) | $ | (91,000,185 | ) | ||||||
| Net increase (decrease) in net asset value per share |
$ | 2.11 | $ | (5.03 | ) | $ | (5.40 | ) | $ | (3.99 | ) | $ | (12.31 | ) | ||||||
| Three months ended (unaudited) | ||||||||||||||||||||
| March 31, 2014 |
June 30, 2014 |
September 30, 2014 |
December 31, 2014 |
Year ended December 31, 2014 |
||||||||||||||||
| Net investment income (loss) |
$ | (1,125,310 | ) | $ | (1,047,200 | ) | $ | (1,023,432 | ) | $ | (772,666 | ) | $ | (3,968,608 | ) | |||||
|
|
|
|
|
|
|
|
|
|
|
|||||||||||
| Net realized and unrealized gain (loss) |
$ | 18,318,102 | $ | 38,803,113 | $ | (169,039,274 | ) | $ | (53,526,098 | ) | $ | (165,444,157 | ) | |||||||
| Net income (loss) |
$ | 17,192,792 | $ | 37,755,913 | $ | (170,062,706 | ) | $ | (54,298,764 | ) | $ | (169,412,765 | ) | |||||||
| Net increase (decrease) in net asset value per share |
$ | 1.90 | $ | 4.87 | $ | (23.70 | ) | $ | (7.03 | ) | $ | (23.96 | ) | |||||||
PROSHARES ULTRA EURO
| Three months ended (unaudited) | ||||||||||||||||||||
| March 31, 2015 |
June 30, 2015 |
September 30, 2015 |
December 31, 2015 |
Year ended December 31, 2015 |
||||||||||||||||
| Net investment income (loss) |
$ | (15,698 | ) | $ | (34,217 | ) | $ | (26,696 | ) | $ | (27,460 | ) | $ | (104,071 | ) | |||||
|
|
|
|
|
|
|
|
|
|
|
|||||||||||
| Net realized and unrealized gain (loss) |
$ | (1,740,537 | ) | $ | 1,082,327 | $ | 59,448 | $ | (675,633 | ) | $ | (1,274,395 | ) | |||||||
| Net income (loss) |
$ | (1,756,235 | ) | $ | 1,048,110 | $ | 32,752 | $ | (703,093 | ) | $ | (1,378,466 | ) | |||||||
| Net increase (decrease) in net asset value per share |
$ | (4.33 | ) | $ | 1.05 | $ | (0.04 | ) | $ | (1.04 | ) | $ | (4.36 | ) | ||||||
133
Table of Contents
| Three months ended (unaudited) | ||||||||||||||||||||
| March 31, 2014 |
June 30, 2014 |
September 30, 2014 |
December 31, 2014 |
Year ended December 31, 2014 |
||||||||||||||||
| Net investment income (loss) |
$ | (5,664 | ) | $ | (5,779 | ) | $ | (5,529 | ) | $ | (5,275 | ) | $ | (22,247 | ) | |||||
|
|
|
|
|
|
|
|
|
|
|
|||||||||||
| Net realized and unrealized gain (loss) |
$ | 5,119 | $ | (30,602 | ) | $ | (385,103 | ) | $ | (214,457 | ) | $ | (625,043 | ) | ||||||
| Net income (loss) |
$ | (545 | ) | $ | (36,381 | ) | $ | (390,632 | ) | $ | (219,732 | ) | $ | (647,290 | ) | |||||
| Net increase (decrease) in net asset value per share |
$ | 0.01 | $ | (0.36 | ) | $ | (3.91 | ) | $ | (1.90 | ) | $ | (6.16 | ) | ||||||
PROSHARES ULTRA YEN
| Three months ended (unaudited) | ||||||||||||||||||||
| March 31, 2015 |
June 30, 2015 |
September 30, 2015 |
December 31, 2015 |
Year ended December 31, 2015 |
||||||||||||||||
| Net investment income (loss) |
$ | (9,090 | ) | $ | (12,481 | ) | $ | (11,745 | ) | $ | (11,107 | ) | $ | (44,423 | ) | |||||
|
|
|
|
|
|
|
|
|
|
|
|||||||||||
| Net realized and unrealized gain (loss) |
$ | (106,753 | ) | $ | (237,139 | ) | $ | 197,237 | $ | (49,436 | ) | $ | (196,091 | ) | ||||||
| Net income (loss) |
$ | (115,843 | ) | $ | (249,620 | ) | $ | 185,492 | $ | (60,543 | ) | $ | (240,514 | ) | ||||||
| Net increase (decrease) in net asset value per share* |
$ | (0.47 | ) | $ | (2.50 | ) | $ | 1.86 | $ | (0.61 | ) | $ | (1.72 | ) | ||||||
| Three months ended (unaudited) | ||||||||||||||||||||
| March 31, 2014 |
June 30, 2014 |
September 30, 2014 |
December 31, 2014 |
Year ended December 31, 2014 |
||||||||||||||||
| Net investment income (loss) |
$ | (6,420 | ) | $ | (6,068 | ) | $ | (4,379 | ) | $ | (3,995 | ) | $ | (20,862 | ) | |||||
|
|
|
|
|
|
|
|
|
|
|
|||||||||||
| Net realized and unrealized gain (loss) |
$ | 107,537 | $ | 82,626 | $ | (295,508 | ) | $ | (291,184 | ) | $ | (396,529 | ) | |||||||
| Net income (loss) |
$ | 101,117 | $ | 76,558 | $ | (299,887 | ) | $ | (295,179 | ) | $ | (417,391 | ) | |||||||
| Net increase (decrease) in net asset value per share* |
$ | 2.69 | $ | 2.65 | $ | (11.99 | ) | $ | (11.41 | ) | $ | (18.06 | ) | |||||||
See the Index to Financial Statements for a list of the financial statements being filed as part of this Annual Report on Form 10-K. Those Financial Statements, and the notes and schedules related thereto, are incorporated by reference into this Item 8.
| * | See Note 1 of the Notes to Financial Statements in Item 15 of Part IV in this Annual Report on Form 10-K. |
Item 9. Changes in and Disagreements With Accountants on Accounting and Financial Disclosure.
Not applicable.
Item 9A. Controls and Procedures.
Disclosure Controls and Procedures
Under the supervision and with the participation of the principal executive officer and principal financial officer of the Trust, Trust management has evaluated the effectiveness of the Trust’s and the Funds’ disclosure controls and procedures, and have concluded that the disclosure controls and procedures (as defined in Rule 13a-15(e) and 15d-15(e) under the 1934 Act) of the Trust and the Funds were effective, as of December 31, 2015, including providing reasonable assurance that information required to be disclosed in the reports that the Trust files or submits under the 1934 Act on behalf of the Trust and the Funds is recorded, processed, summarized and reported, within the time periods specified in the applicable rules and forms, and that such information is accumulated and communicated to the duly authorized officers of the Trust as appropriate to allow timely decisions regarding required disclosure.
Management’s Annual Report on Internal Control Over Financial Reporting
The Trust’s management takes responsibility for establishing and maintaining adequate internal control over financial reporting of the Trust and the Funds, as defined in Rules 13a-15(f) and 15d-15(f) under the 1934 Act. The Trust’s and the Funds’ internal control over financial reporting is a process designed to provide reasonable assurance regarding the reliability of financial reporting and the preparation of financial statements for external purposes in accordance with accounting principles generally accepted in the United States of America. Internal control over financial reporting includes those policies and procedures that: (1) pertain to the maintenance of records that, in reasonable detail, accurately and fairly reflect the transactions and dispositions of the assets of the Trust and the
134
Table of Contents
Funds; (2) provide reasonable assurance that transactions are recorded as necessary to permit preparation of financial statements in accordance with generally accepted accounting principles, and that the Trust’s and the Funds’ receipts and expenditures are being made only in accordance with appropriate authorizations of management of the Trust on behalf of the Trust and the Funds; and (3) provide reasonable assurance regarding prevention or timely detection of unauthorized acquisition, use or disposition of the Trust’s or the Funds’ assets that could have a material effect on the Trust’s or the Funds’ financial statements.
Because of its inherent limitations, internal control over financial reporting may not prevent or detect misstatements. Also, projections of any evaluation of effectiveness to future periods are subject to the risk that controls may become inadequate because of changes in conditions, or that the degree of compliance with the policies or procedures may deteriorate.
The principal executive officer and principal financial officer of the Trust assessed the effectiveness of the Trust’s and the Funds’ internal control over financial reporting as of December 31, 2015. Their assessment included an evaluation of the design of the Trust’s and the Funds’ internal control over financial reporting and testing of the operational effectiveness of their internal control over financial reporting. In making its assessment, the Trust’s management has utilized the criteria set forth by the Committee of Sponsoring Organizations of the Treadway Commission (COSO) in its report entitled Internal Control – Integrated Framework (2013). Based on their assessment and those criteria, the principal executive officer and principal financial officer of the Trust concluded that the Trust’s and the Funds’ internal control over financial reporting was effective as of December 31, 2015.
The effectiveness of the Trust’s and the Funds’ internal control over financial reporting as of December 31, 2015 has been audited by PricewaterhouseCoopers LLP, the independent registered public accounting firm, as stated in their report which is included herein.
Changes in Internal Control over Financial Reporting
There were no changes in the Trust’s or the Funds’ internal control over financial reporting that occurred during the quarter ended December 31, 2015 that have materially affected, or are reasonably likely to materially affect, the Trust’s or the Funds’ internal control over financial reporting.
Certifications
The certifications by the Principal Executive Officer and Principal Financial Officer of the Trust required by Section 302 and Section 906 of the Sarbanes-Oxley Act of 2002, which are filed or furnished as exhibits to this Annual Report on Form 10-K, apply both to the Trust taken as a whole and each Fund, and the Principal Executive Officer and Principal Financial Officer of the Trust are certifying both as to the Trust taken as a whole and each Fund.
Not applicable.
135
Table of Contents
Item 10. Directors, Executive Officers and Corporate Governance.
The Sponsor
ProShare Capital Management LLC is the Sponsor of the Trust and the Funds. The Sponsor has exclusive management and control of all aspects of the business of the Funds. The Trustee has no duty or liability to supervise the performance of the Sponsor, nor will the Trustee have any liability for the acts or omissions of the Sponsor.
As of December 31, 2015, the Sponsor serves as the Trust’s commodity pool operator.
Specifically, with respect to the Trust, the Sponsor:
| • | selects the Funds’ service providers; |
| • | negotiates various agreements and fees; |
| • | performs such other services as the Sponsor believes that the Trust may require from time to time; |
| • | selects the FCM and Financial Instrument counterparties; |
| • | manages each Fund’s portfolio of other assets, including cash equivalents; and |
| • | manages the Funds with a view toward achieving the Funds’ investment objectives. |
Background and Principals
As of December 31, 2015, the Sponsor served as the commodity pool operator of the Trust and the Funds, and previously also served as the commodity trading advisor to the Trust and the Funds. The Sponsor is registered as a commodity pool operator with the CFTC and is a member in good standing of the NFA. The Sponsor’s membership with the NFA was originally approved on June 11, 1999. It withdrew its membership with the NFA on August 31, 2000 but later re-applied and had its membership subsequently approved on January 8, 2001. Its membership with the NFA is currently effective. The Sponsor’s registration as a commodity trading advisor was approved on June 11, 1999. On February 17, 2013, the Sponsor’s commodity trading advisor registration was withdrawn. The Sponsor’s registration as a commodity pool operator was originally approved on June 11, 1999. It withdrew its registration as a commodity pool operator on August 30, 2000 but later re-applied and had its registration subsequently approved on November 28, 2007. Its registration as a commodity pool operator is currently effective. As a registered commodity pool operator, with respect to the Trust, the Sponsor must comply with various regulatory requirements under the CEA, and the rules and regulations of the CFTC and the NFA, including investor protection requirements, antifraud prohibitions, disclosure requirements, and reporting and recordkeeping requirements. The NFA approved the Sponsor as a Swaps Firm on January 4, 2013. The Sponsor is also subject to periodic inspections and audits by the CFTC and NFA. Its principal place of business is 7501 Wisconsin Avenue, Suite 1000, Bethesda, Maryland 20814 and its telephone number is (240) 497-6400. The registration of the Sponsor with the CFTC and its membership in the NFA must not be taken as an indication that either the CFTC or the NFA has recommended or approved the Sponsor, the Trust and the Funds.
In its capacity as a commodity pool operator, the Sponsor is an organization which operates or solicits funds for commodity pools; that is, an enterprise in which funds contributed by a number of persons are combined for the purpose of trading futures contracts.
136
Table of Contents
Executive Officers of the Trust and Principals and Significant Employees of the Sponsor
| Name |
Position | |
| Michael L. Sapir | Chief Executive Officer and Principal of the Sponsor | |
| Louis M. Mayberg | Principal of the Sponsor | |
| William E. Seale | Principal of the Sponsor | |
| Sapir Family Trust | Principal of the Sponsor | |
| Northstar Trust | Principal of the Sponsor | |
| Timothy N. Coakley | Chief Financial Officer and Principal of the Sponsor | |
| Edward J. Karpowicz | Principal Financial Officer of the Trust and Principal of the Sponsor | |
| Todd B. Johnson* | Principal Executive Officer of the Trust and Chief Investment Officer and Principal of the Sponsor | |
| Hratch Najarian | Director, Portfolio Management and Principal of the Sponsor | |
| Jeffrey A. Ploshnick | Senior Portfolio Manager and Associated Person of the Sponsor | |
| Ryan T. Dofflemeyer | Portfolio Manager and Associated Person of the Sponsor | |
| Victor M. Frye | Principal of the Sponsor |
| * | Denotes principal of the Sponsor who supervises persons who participate in making trading decisions for the Funds. |
The following is a biographical summary of the business experience of the executive officers of the Trust and the principals and significant employees of the Sponsor.
ProFund Advisors LLC (“PFA”) and ProShare Advisors LLC (“PSA”) are investment advisers registered under the Investment Advisers Act of 1940 and commodity pool operators registered under the CEA. PFA is also a commodity trading advisor registered under the CEA.
Michael L. Sapir, Chairman and Chief Executive Officer and a listed principal of the Sponsor since August 14, 2008; Chairman and Chief Executive Officer and a member of PFA since April 1997, and a listed principal of PFA since November 26, 2012; and Chairman and Chief Executive Officer and a member of PSA since January 2005 and a listed principal of PSA since January 14, 2014. As Chairman and Chief Executive Officer of the Sponsor, PFA and PSA, Mr. Sapir’s responsibilities include oversight of all aspects of the Sponsor, PFA and PSA, respectively.
Louis M. Mayberg, a member and a listed principal of the Sponsor since June 9, 2008; a member of PFA since April 1997 and a listed principal of PFA since November 26, 2012; and a member of PSA since January 2005 and a listed principal of PSA since January 14, 2014. Mr. Mayberg served as Principal Executive Officer of the Trust from June 2008 to December 2013.
William E. Seale, Ph.D., a member of the Sponsor and a listed principal of the Sponsor since June 11, 1999; a member of PFA since April 1997 and a listed principal of PFA since November 8, 2013; and a member of PSA since April 2005 and a listed principal of PSA since January 14, 2014. Dr. Seale served as Chief Investment Officer of PFA from January 2003 to July 2005 and from October 2006 to June 2008 and as Director of Portfolio from January 1997 to January 2003. Dr. Seale served as Chief Investment Officer of PSA from October 2006 to June 2008. In these roles, Dr. Seale’s responsibilities included oversight of the investment management activities of the respective entities. Dr. Seale is a former commissioner of the CFTC.
Sapir Family Trust, a listed principal of the Sponsor. The Sapir Family Trust has an ownership interest in the Sponsor and PSA. The Sapir Family Trust has a passive ownership interest in the Sponsor and exercises no management authority over the Funds.
Northstar Trust, a listed principal of the Sponsor. Northstar Trust has an ownership interest in the Sponsor and PFA. Northstar Trust has a passive ownership interest in the Sponsor and exercises no management authority over the Funds.
Timothy N. Coakley, Chief Financial Officer and a listed principal of the Sponsor since March 7, 2014; Chief Financial Officer and a listed principal of PFA since March 11, 2014; and Chief Financial Officer and a listed principal of PSA since March 11, 2014. As Chief Financial Officer of the Sponsor, Mr. Coakley’s responsibilities include oversight of the financial matters of the Sponsor.
137
Table of Contents
Edward J. Karpowicz, Principal Financial Officer of the Trust since July 2008 and a listed principal of the Sponsor since September 18, 2013. Mr. Karpowicz has been employed by PFA since July 2002 and PSA since its inception as Vice President of Financial Administration. Mr. Karpowicz is 52 years old.
Todd B. Johnson, Principal Executive Officer of the Trust since January 2014; Chief Investment Officer of the Sponsor since February 27, 2009, a registered swap associated person of the Sponsor since January 4, 2013, a registered associated person of the Sponsor since January 29, 2010, and a listed principal of the Sponsor since January 16, 2009. As Principal Executive Officer of the Trust, Mr. Johnson’s responsibilities include oversight of the operations of the Trust. As Chief Investment Officer of the Sponsor, Mr. Johnson’s responsibilities include oversight of the investment management activities of the Sponsor. Mr. Johnson has served as Chief Investment Officer of PFA and PSA since December 2008 and has been registered as an associated person of PFA since December 5, 2012 and listed as a principal of PFA since November 26, 2012. In addition, Mr. Johnson has been listed as a principal and associated person of PSA since January 14, 2014. Mr. Johnson served from 2002 to December 2008 at World Asset Management (a financial services firm), working as President and Chief Investment Officer from January 2006 to December 2008, and as Managing Director and Chief Investment Officer of Quantitative Investments of Munder Capital Management, an asset management firm, from January 2002 to December 2005. Mr. Johnson is 52 years old.
Hratch Najarian, Director, Portfolio Management of the Sponsor since August 2013 and a listed principal of the Sponsor since October 15, 2013. In these roles, Mr. Najarian’s responsibilities include oversight of the investment management activities of the Sponsor. Mr. Najarian also serves as Director, Portfolio Management of PFA and PSA since August 2013, and is listed as a principal of PFA since January 8, 2014 and a principal and associated person of PSA since January 14, 2014. Mr. Najarian served as Senior Portfolio Manager of PSA from December 2009 through September 2013. He also served as Senior Portfolio Manager of PFA from December 2009 through September 2013, as Portfolio Manager of PFA from May 2007 through November 2009, and as Associate Portfolio Manager of PFA from November 2004 through April 2007.
Jeffrey A. Ploshnick, Senior Portfolio Manager of the Sponsor since April 12, 2011, a registered associated person and an NFA associate member of the Sponsor since April 12, 2011. In these roles, Mr. Ploshnick’s responsibilities include day-to-day portfolio management of the Currency Funds. Mr. Ploshnick has been registered as an associated person of PFA since December 5, 2012. Mr. Ploshnick also serves as a Senior Portfolio Manager of PFA since May 2007 and has served as Portfolio Manager from February 2001 to April 2007. In addition, Mr. Ploshnick also serves as a Senior Portfolio Manager of PSA since March 2011.
Ryan T. Dofflemeyer, Portfolio Manager of the Sponsor since January 3, 2011, a registered associated person and an NFA associate member of the Sponsor since October 26, 2010. In these roles, Mr. Dofflemeyer’s responsibilities include day-to-day portfolio management of the VIX Funds, the Managed Futures Fund, the Commodity Index Funds, the Commodity Funds and certain other series of the Trust. Mr. Dofflemeyer has been registered as an associated person of PFA since December 5, 2012. Mr. Dofflemeyer also serves as a Portfolio Manager of PFA since August 2007 and was a Portfolio Analyst between October 2003 and August 2007. In addition, Mr. Dofflemeyer also serves as Portfolio Manager for Horizon BetaPro Funds (investment funds) since May 2008 and served as a Portfolio Manager of PSA from March 2010 through September 2013. Mr. Dofflemeyer worked as a Research Assistant for the Investment Company Institute (investment funds trade organization) from September 2001 to August 2003.
Victor M. Frye, a listed principal of the Sponsor since December 2, 2008, a listed principal of PFA since November 26, 2012, and a listed principal of PSA since January 14, 2014. Mr. Frye’s responsibilities include the review and approval of advertising material of the Sponsor. Mr. Frye has been employed as Chief Compliance Officer of PFA since October 2002 and of PSA since December 2004.
Indemnification
The Trust Agreement provides that the Sponsor and its affiliates shall have no liability to the Trust or to any shareholder for any loss suffered by the Trust arising out of any action or inaction of the Sponsor or its affiliates or their respective directors, officers, shareholders, partners, members, managers or employees (the “Sponsor Related Parties”), if the Sponsor Related Parties, in good faith, determined that such course of conduct was in the best
138
Table of Contents
interests of the Funds and such course of conduct did not constitute gross negligence or willful misconduct by the Sponsor Related Parties. The Trust has agreed to indemnify the Sponsor Related Parties against claims, losses or liabilities based on their conduct relating to the Trust, provided that the conduct resulting in the claims, losses or liabilities for which indemnity is sought did not constitute gross negligence or willful misconduct and was done in good faith and in a manner reasonably believed to be in the best interests of the Funds.
Code of Ethics
The Trust has adopted a code of ethics (“Code of Ethics”) that applies to its Principal Executive Officer and Principal Financial Officer. A copy of the Code of Ethics can be obtained, without charge, upon written request to the Sponsor at the following address: ProShare Capital Management LLC, Attn: General Counsel, 7501 Wisconsin Avenue, Suite 1000, Bethesda, MD 20814.
Item 11. Executive Compensation.
The Funds have no employees or directors and are managed by the Sponsor. None of the officers of the Trust, or the members or officers of the Sponsor receive compensation from the Funds.
The Sponsor receives a monthly Management Fee from each Fund, with the exception of each Matching VIX Fund and the Managed Futures Strategy, equal to 0.95% annually of the average daily net asset value per share at the end of each month. The Sponsor receives a monthly Management Fee from each Matching VIX Fund equal to 0.85% annually of the average daily net asset value per share at the end of each month. The Sponsor will receive a monthly Management Fee from the Managed Futures Fund equal to 0.75% annually of the average daily net asset value per share at the end of each month. During the first year of each Fund’s operations, the Sponsor will waive the Management Fee to the extent that such amounts cumulatively exceed the offering costs incurred by each Fund. For the year ended December 31, 2015, the following represents Management Fees earned by the Sponsor:
| Fund |
||||
| ProShares Managed Futures Strategy |
$ | 16,121 | ||
| ProShares VIX Short-Term Futures ETF |
1,062,171 | |||
| ProShares VIX Mid-Term Futures ETF |
233,390 | |||
| ProShares Short VIX Short-Term Futures ETF |
4,043,491 | |||
| ProShares Ultra VIX Short-Term Futures ETF |
4,362,460 | |||
| ProShares UltraShort Bloomberg Commodity |
59,324 | |||
| ProShares UltraShort Bloomberg Crude Oil |
1,978,613 | |||
| ProShares UltraShort Bloomberg Natural Gas |
112,277 | |||
| ProShares UltraShort Gold |
735,540 | |||
| ProShares UltraShort Silver |
540,253 | |||
| ProShares Short Euro |
179,286 | |||
| ProShares UltraShort Australian Dollar |
199,845 | |||
| ProShares UltraShort Euro |
5,265,432 | |||
| ProShares UltraShort Yen |
3,759,492 | |||
| ProShares Ultra Bloomberg Commodity |
34,275 | |||
| ProShares Ultra Bloomberg Crude Oil |
8,230,180 | |||
| ProShares Ultra Bloomberg Natural Gas |
574,158 | |||
| ProShares Ultra Gold |
839,083 | |||
| ProShares Ultra Silver |
2,664,160 | |||
| ProShares Ultra Euro |
106,868 | |||
| ProShares Ultra Yen |
48,032 | |||
139
Table of Contents
Item 12. Security Ownership of Certain Beneficial Owners and Management and Related Stockholder Matters.
The following table sets forth certain information regarding ownership of Shares of certain beneficial owners as of December 31, 2015:
| Title of Class |
Name and Address of Beneficial Owner |
Amount and Nature of Beneficial Ownership |
Percent of Class |
|||||
| Common Shares of ProShares Managed Futures Strategy |
ProShares Morningstar Alternatives Solution ETF 7501 Wisconsin Avenue, East Tower Suite 1000 Bethesda, Maryland 20814 |
179,867 shares | 51.4 | % | ||||
Item 13. Certain Relationships and Related Transactions, and Director Independence.
See “Item 11. Executive Compensation” in this Annual Report on Form 10-K.
Item 14. Principal Accounting Fees and Services.
(1) to (4). Fees for services performed by PricewaterhouseCoopers LLP (“PwC”) for the years ended December 31, 2015 and 2014 were as follows:
| Year Ended December 31, 2015 |
Year Ended December 31, |
|||||||
| Audit Fees |
775,725 | 754,000 | ||||||
| Audit-Related Fees |
12,500 | 24,000 | ||||||
| Tax Fees |
3,369,100 | 3,324,250 | ||||||
| All Other Fees |
— | — | ||||||
|
|
|
|
|
|||||
| Total |
4,157,325 | 4,102,250 | ||||||
Audit fees for the year ended December 31, 2015 consist of fees paid to PwC for the audit of the Funds’ December 31, 2015 annual financial statements included in the Annual Report on Form 10-K for the year ended December 31, 2015, for the review of the financial statements included in each Form 10-Q, and for the audits of financial statements included with registration statements. Audit fees for the year ended December 31, 2014 consist of fees paid to PwC for the audit of the Funds’ December 31, 2014 annual financial statements included in the Annual Report on Form 10-K for the year ended December 31, 2014, for the review of the financial statements included in each Form 10-Q, and for the audits of financial statements included with registration statements. Tax fees include certain tax compliance and reporting services provided by PwC to the Trust, including processing beneficial ownership information as it relates to the preparation of tax reporting packages and the subsequent delivery of related information to the IRS. Services also include assistance with tax reporting and related information using a web-based tax package product developed by PwC and a toll-free tax package support help line.
(5) The Sponsor approved all of the services provided by PwC described above. The Sponsor pre-approves all audit and allowed non-audit services of the Trust’s independent registered public accounting firm, including all engagement fees and terms.
(6) None of the hours expended on PwC’s engagement to audit each Fund’s financial statements for the years ended December 31, 2014 or 2015 were attributable to work performed by persons other than the principal accountant’s full-time, permanent employees.
140
Table of Contents
Item 15. Exhibits and Financial Statement Schedules.
Financial Statement Schedules
See the Index to Financial Statements for a list of the financial statements being filed as part of this Annual Report on Form 10-K. Schedules may have been omitted since they are either not required, not applicable, or the information has otherwise been included.
| Exhibit No. |
Description of Document | |
| 4.1 | Trust Agreement of ProShares Trust II (1) | |
| 4.2 | Form of Amended and Restated Trust Agreement of ProShares Trust II (2) | |
| 4.2.1 | Amended and Restated Trust Agreement of ProShares Trust II (3) | |
| 4.3 | Form of Authorized Participant Agreement (4) | |
| 10.1 | Form of Sponsor Agreement (2) | |
| 10.2 | Form of Administration and Transfer Agency Services Agreement (4) | |
| 10.3 | Form of Custodian Agreement (5) | |
| 10.4 | Form of Distribution Agreement (4) | |
| 10.5 | Form of Futures Account Agreement (4) | |
| 23.1 | Consent of Independent Registered Public Accounting Firm (6) | |
| 31.1 | Certification by Principal Executive Officer of the Trust Pursuant to Rule 13a-14(a) under the Securities Exchange Act of 1934, as amended (6) | |
| 31.2 | Certification by Principal Financial Officer of the Trust Pursuant to Rule 13a-14(a) under the Securities Exchange Act of 1934, as amended (6) | |
| 32.1 | Certification by Principal Executive Officer of the Trust Pursuant to 18 U.S.C. Section 1350, As Adopted Pursuant to Section 906 of the Sarbanes-Oxley Act of 2002 (6) | |
| 32.2 | Certification by Principal Financial Officer of the Trust Pursuant to 18 U.S.C. Section 1350, As Adopted Pursuant to Section 906 of the Sarbanes-Oxley Act of 2002 (6) | |
| 101.INS | XBRL Instance Document (6) | |
| 101.SCH | XBRL Taxonomy Extension Schema (6) | |
| 101.CAL | XBRL Taxonomy Extension Calculation Linkbase (6) | |
| 101.DEF | XBRL Taxonomy Extension Definition Linkbase (6) | |
| 101.LAB | XBRL Taxonomy Extension Label Linkbase (6) | |
| 101.PRE | XBRL Taxonomy Extension Presentation Linkbase (6) | |
| (1) | Incorporated by reference to the Trust’s Registration Statement, filed on October 18, 2007. |
| (2) | Incorporated by reference to the Trust’s Registration Statement, filed on August 15, 2008. |
| (3) | Incorporated by reference to the Trust’s Registration Statement, filed on September 18, 2008. |
| (4) | Incorporated by reference to the Trust’s Registration Statement, filed on November 17, 2008. |
| (5) | Incorporated by reference to the Trust’s Registration Statement, filed on October 22, 2008. |
| (6) | Filed herewith. |
141
Table of Contents
ProShares Trust II
Financial Statements as of December 31, 2015
| Documents | Page | |
| 143 | ||
| 144 | ||
| 150 | ||
| 156 | ||
| 162 | ||
| 168 | ||
| 174 | ||
| 180 | ||
| 186 | ||
| 192 | ||
| 198 | ||
| 204 | ||
| 210 | ||
| 216 | ||
| 222 | ||
| 228 | ||
| 234 | ||
| 240 | ||
| 246 | ||
| 252 | ||
| 258 | ||
| 264 | ||
| 270 | ||
| 274 |
142
Table of Contents
Report of Independent Registered Public Accounting Firm
To the Shareholders of ProShares Trust II:
In our opinion, the accompanying combined and individual statements of financial condition, including the individual schedules of investments, and the related combined and individual statements of operations, of changes in shareholders’ equity and of cash flows, present fairly, in all material respects, the combined financial position of the ProShares Trust II at December 31, 2015 and 2014, and the individual financial positions of each of the following twenty-one funds comprising ProShares Trust II
| ProShares Managed Futures Strategy (a) | ProShares UltraShort Euro (b) | |
| ProShares VIX Short-Term Futures ETF (b) | ProShares UltraShort Yen (b) | |
| ProShares VIX Mid-Term Futures ETF (b) | ProShares Ultra Bloomberg Commodity (b) | |
| ProShares Short VIX Short-Term Futures ETF (b) | ProShares Ultra Bloomberg Crude Oil (b) | |
| ProShares Ultra VIX Short-Term Futures ETF (b) | ProShares Ultra Bloomberg Natural Gas (b) | |
| ProShares UltraShort Bloomberg Commodity (b) | ProShares Ultra Gold (b) | |
| ProShares UltraShort Bloomberg Crude Oil (b) | ProShares Ultra Silver (b) | |
| ProShares UltraShort Bloomberg Natural Gas (b) | ProShares Ultra Euro (b) | |
| ProShares UltraShort Gold (b) | ProShares Ultra Yen (b) | |
| ProShares UltraShort Silver (b) |
| |
| ProShares Short Euro (b) | ProShares Trust II (“combined”) (c) | |
| ProShares UltraShort Australian Dollar (b) |
| (a) | A statement of financial condition, including the schedule of investments, is presented as of December 31, 2015 and 2014, and the related statements of operations, of changes in shareholders’ equity and of cash flows are presented for the year ended December 31, 2015 and for the period from October 1, 2014 (Inception) through December 31, 2014. |
| (b) | A statement of financial condition, including the schedule of investments, is presented as of December 31, 2015 and 2014, and the related statements of operations, of changes in shareholders’ equity and of cash flows are presented for each of the three years in the period ended December 31, 2015. |
| (c) | A statement of financial condition is presented as of December 31, 2015 and 2014, and the related statements of operations, of changes in shareholders’ equity and of cash flows are presented for each of the three years in the period ended December 31, 2015. |
(collectively, the “Trust”) at December 31, 2015 and 2014, and the combined and individual results of their operations and their cash flows, for the respective periods described in (a) (b) and (c) above in conformity with accounting principles generally accepted in the United States of America. Also in our opinion, the combined Trust and each of the individual funds maintained, in all material respects, effective internal control over financial reporting as of December 31, 2015, based on criteria established in Internal Control - Integrated Framework (2013) issued by the Committee of Sponsoring Organizations of the Treadway Commission (COSO). The Trust’s management is responsible for these financial statements, for maintaining effective internal control over financial reporting and for its assessment of the effectiveness of internal control over financial reporting, included in Management’s Annual Report on Internal Control Over Financial Reporting appearing under Item 9A. Our responsibility is to express opinions on the combined Trust and each of the individual fund’s financial statements and on the combined Trust’s and each of the individual fund’s internal control over financial reporting based on our integrated audits. We conducted our audits in accordance with the standards of the Public Company Accounting Oversight Board (United States). Those standards require that we plan and perform the audits to obtain reasonable assurance about whether the financial statements are free of material misstatement and whether effective internal control over financial reporting was maintained in all material respects. Our audits of the financial statements included examining, on a test basis, evidence supporting the amounts and disclosures in the financial statements, assessing the accounting principles used and significant estimates made by management, and evaluating the overall financial statement presentation. Our audits of internal control over financial reporting included obtaining an understanding of internal control over financial reporting, assessing the risk that a material weakness exists, and testing and evaluating the design and operating effectiveness of internal control based on the assessed risk. Our audits also included performing such other procedures as we considered necessary in the circumstances. We believe that our audits provide a reasonable basis for our opinions.
As discussed in Note 9 to the financial statements, the ProShares Managed Futures Strategy will liquidate after the close of business on March 18, 2016.
A trust’s internal control over financial reporting is a process designed to provide reasonable assurance regarding the reliability of financial reporting and the preparation of financial statements for external purposes in accordance with generally accepted accounting principles. A trust’s internal control over financial reporting includes those policies and procedures that (i) pertain to the maintenance of records that, in reasonable detail, accurately and fairly reflect the transactions and dispositions of the assets of the trust; (ii) provide reasonable assurance that transactions are recorded as necessary to permit preparation of financial statements in accordance with generally accepted accounting principles, and that receipts and expenditures of the trust are being made only in accordance with authorizations of management of the trust; and (iii) provide reasonable assurance regarding prevention or timely detection of unauthorized acquisition, use, or disposition of the trust’s assets that could have a material effect on the financial statements.
Because of its inherent limitations, internal control over financial reporting may not prevent or detect misstatements. Also, projections of any evaluation of effectiveness to future periods are subject to the risk that controls may become inadequate because of changes in conditions, or that the degree of compliance with the policies or procedures may deteriorate.
| /s/ PricewaterhouseCoopers LLP |
| Baltimore, Maryland |
| February 29, 2016 |
143
Table of Contents
PROSHARES MANAGED FUTURES STRATEGY
STATEMENTS OF FINANCIAL CONDITION
| December 31, 2015 | December 31, 2014 | |||||||
| Assets |
||||||||
| Cash |
$ | 6,931,145 | $ | 6,135,185 | ||||
| Segregated cash balances with brokers for futures contracts |
280,322 | 195,142 | ||||||
| Receivable on open futures contracts |
— | 17,445 | ||||||
| Offering costs (Note 5) |
— | 49,384 | ||||||
| Limitation by Sponsor |
— | 9,474 | ||||||
|
|
|
|
|
|||||
| Total assets |
7,211,467 | 6,406,630 | ||||||
|
|
|
|
|
|||||
| Liabilities and shareholders’ equity |
||||||||
| Liabilities |
||||||||
| Payable on open futures contracts |
19,990 | — | ||||||
| Brokerage commissions and fees payable |
164 | — | ||||||
| Management fee payable |
4,291 | — | ||||||
| Payable for offering costs |
— | 65,785 | ||||||
|
|
|
|
|
|||||
| Total liabilities |
24,445 | 65,785 | ||||||
|
|
|
|
|
|||||
| Commitments and Contingencies (Note 2) |
||||||||
| Shareholders’ equity |
||||||||
| Shareholders’ equity |
7,187,022 | 6,340,845 | ||||||
|
|
|
|
|
|||||
| Total liabilities and shareholders’ equity |
$ | 7,211,467 | $ | 6,406,630 | ||||
|
|
|
|
|
|||||
| Shares outstanding |
350,010 | 300,010 | ||||||
|
|
|
|
|
|||||
| Net asset value per share |
$ | 20.53 | $ | 21.14 | ||||
|
|
|
|
|
|||||
| Market value per share (Note 2) |
$ | 20.76 | $ | 21.28 | ||||
|
|
|
|
|
|||||
See accompanying notes to financial statements.
144
Table of Contents
PROSHARES MANAGED FUTURES STRATEGY
SCHEDULE OF INVESTMENTS
DECEMBER 31, 2015
Futures Contracts Purchased††
| Number of Contracts |
Notional Amount at Value |
Unrealized Appreciation (Depreciation) |
||||||||||
| Australian Dollar Fx Currency Futures—CME, expires March 2016 |
4 | $ | 290,640 | $ | 540 | |||||||
| Cocoa Futures—ICE, expires March 2016 |
9 | 288,990 | (5,850 | ) | ||||||||
| Cotton No. 2 Futures—ICE, expires March 2016 |
9 | 284,760 | (4,780 | ) | ||||||||
| Sugar #11 Futures—ICE, expires March 2016 |
11 | 187,757 | 7,721 | |||||||||
|
|
|
|||||||||||
| $ | (2,369 | ) | ||||||||||
|
|
|
|||||||||||
| Futures Contracts Sold†† |
||||||||||||
| Gold 100 OZ Futures—COMEX, expires February 2016 |
1 | $ | 106,020 | $ | 2,390 | |||||||
| Gold Mini Futures—ICE, expires February 2016 |
4 | 136,342 | 645 | |||||||||
| Lean Hogs Futures—CME, expires February 2016 |
11 | 263,120 | (1,560 | ) | ||||||||
| Live Cattle Futures—CME, expires February 2016 |
7 | 383,040 | (4,950 | ) | ||||||||
| Natural Gas Futures—NYMEX, expires February 2016 |
7 | 163,590 | (11,237 | ) | ||||||||
| NY Harbor ULSD Futures—NYMEX, expires February 2016 |
2 | 94,408 | 14,028 | |||||||||
| RBOB Gasoline Futures—NYMEX, expires February 2016 |
2 | 106,764 | 2,033 | |||||||||
| WTI Crude Oil Futures—NYMEX, expires February 2016 |
2 | 74,080 | 8,680 | |||||||||
| British Pound Fx Currency Futures—CME, expires March 2016 |
4 | 368,350 | 8,806 | |||||||||
| Euro Fx Currency Futures—CME, expires March 2016 |
2 | 272,150 | 363 | |||||||||
| Canadian Dollar Fx Currency Futures—CME, expires March 2016 |
5 | 361,650 | 10,180 | |||||||||
| Coffee ‘C’ Futures—ICE, expires March 2016 |
3 | 142,537 | (4,181 | ) | ||||||||
| Copper Futures—COMEX, expires March 2016 |
4 | 213,500 | 10,975 | |||||||||
| Corn Futures—CBT, expires March 2016 |
11 | 197,312 | 14,512 | |||||||||
| Japanese Yen Fx Currency Futures—CME, expires March 2016 |
5 | 520,813 | (10,399 | ) | ||||||||
| Silver Futures—COMEX, expires March 2016 |
1 | 69,015 | 3,625 | |||||||||
| Silver Mini Futures—ICE, expires March 2016 |
4 | 55,212 | 455 | |||||||||
| Soybean Futures—CBT, expires March 2016 |
5 | 216,063 | 5,937 | |||||||||
| Swiss Franc Fx Currency Futures—CME, expires March 2016 |
2 | 250,800 | 1,275 | |||||||||
| U.S. 10 YR Note Futures—CBT, expires March 2016 |
9 | 1,133,156 | 1,234 | |||||||||
| U.S. Treasury Long Bond Futures—CBT, expires March 2016 |
5 | 768,750 | 2,312 | |||||||||
| Wheat Futures—CBT, expires March 2016 |
9 | 211,500 | 4,425 | |||||||||
|
|
|
|||||||||||
| $ | 59,548 | |||||||||||
|
|
|
|||||||||||
| †† | Cash collateral in the amount of $280,322 was pledged to cover margin requirements for open futures contracts as of December 31, 2015. |
See accompanying notes to financial statements.
145
Table of Contents
PROSHARES MANAGED FUTURES STRATEGY
SCHEDULE OF INVESTMENTS
DECEMBER 31, 2014
Futures Contracts Purchased††
| Number of Contracts |
Notional Amount at Value |
Unrealized Appreciation (Depreciation) |
||||||||||
| Coffee ‘C’ Futures—ICE, expires March 2015 |
1 | $ | 62,475 | $ | (5,231 | ) | ||||||
| Soybean Futures—CBT, expires March 2015 |
3 | 153,525 | (2,350 | ) | ||||||||
| US Treasury Long Bond Futures—CBT, expires March 2015 |
3 | 433,688 | 5,750 | |||||||||
| US 10 YR Note Futures—CBT, expires March 2015 |
6 | 760,781 | 4,536 | |||||||||
| Live Cattle Futures—CME, expires April 2015 |
5 | 324,800 | (930 | ) | ||||||||
| Corn Futures—CBT, expires July 2015 |
6 | 123,750 | 838 | |||||||||
| Wheat Futures—CBT, expires December 2015 |
4 | 122,950 | (1,013 | ) | ||||||||
| Natural Gas Futures—NYMEX, expires January 2016 |
3 | 105,930 | (8,980 | ) | ||||||||
|
|
|
|||||||||||
| $ | (7,380 | ) | ||||||||||
|
|
|
|||||||||||
| Futures Contracts Sold†† | ||||||||||||
| Gold Mini Futures—ICE, expires February 2015 |
4 | $ | 152,275 | $ | 1,530 | |||||||
| Lean Hogs Futures—CME, expires February 2015 |
6 | 194,880 | 7,980 | |||||||||
| NY Harbor ULSD Futures—NYMEX, expires February 2015 |
2 | 154,022 | 14,704 | |||||||||
| RBOB Gasoline Futures—NYMEX, expires February 2015 |
2 | 123,656 | 16,057 | |||||||||
| WTI Crude Oil Mini Futures—NYMEX, expires February 2015 |
4 | 106,472 | 19,116 | |||||||||
| Australian Dollar Fx Currency Futures—CME, expires March 2015 |
3 | 243,660 | 3,865 | |||||||||
| British Pound Fx Currency Futures—CME, expires March 2015 |
6 | 583,875 | 2,540 | |||||||||
| Canadian Dollar Fx Currency Futures—CME, expires March 2015 |
4 | 343,880 | 4,190 | |||||||||
| Cocoa Futures—ICE, expires March 2015 |
13 | 378,300 | 1,360 | |||||||||
| Copper Futures—COMEX, expires March 2015 |
3 | 211,913 | 7,700 | |||||||||
| Copper Mini Futures—COMEX, expires March 2015 |
3 | 105,975 | 2,850 | |||||||||
| Cotton No. 2 Futures—ICE, expires March 2015 |
5 | 150,675 | 2,272 | |||||||||
| Euro Fx Currency Mini Futures—CME, expires March 2015 |
5 | 378,344 | 7,069 | |||||||||
| Japanese Yen Fx Currency Futures—CME, expires March 2015 |
3 | 313,088 | 2,413 | |||||||||
| Silver Mini Futures—ICE, expires March 2015 |
6 | 93,594 | 3,966 | |||||||||
| Swiss Franc Fx Currency Futures—CME, expires March 2015 |
3 | 377,775 | 6,000 | |||||||||
| Sugar #11 Futures—ICE, expires March 2015 |
8 | 130,099 | 8,095 | |||||||||
|
|
|
|||||||||||
| $ | 111,707 | |||||||||||
|
|
|
|||||||||||
| †† | Cash collateral in the amount of $195,142 was pledged to cover margin requirements for open futures contracts as of December 31, 2014. |
See accompanying notes to financial statements.
146
Table of Contents
PROSHARES MANAGED FUTURES STRATEGY*
FOR THE YEAR ENDED DECEMBER 31, 2015
AND FOR THE PERIOD FROM OCTOBER 1, 2014 (INCEPTION) THROUGH DECEMBER 31, 2014
| Year ended December 31, 2015 |
October 1, 2014 (Inception) through December 31, 2014 |
|||||||
| Investment Income |
||||||||
| Interest |
$ | — | $ | — | ||||
| Expense |
||||||||
| Management fee |
16,121 | — | ||||||
| Brokerage commissions and fees |
7,768 | 604 | ||||||
| Offering costs |
59,479 | 16,401 | ||||||
| Limitation by Sponsor |
(11,814 | ) | (9,474 | ) | ||||
|
|
|
|
|
|||||
| Total expenses |
71,554 | 7,531 | ||||||
|
|
|
|
|
|||||
| Net investment income (loss) |
(71,554 | ) | (7,531 | ) | ||||
|
|
|
|
|
|||||
| Realized and unrealized gain (loss) on investment activity |
||||||||
| Net realized gain (loss) on |
||||||||
| Futures contracts |
(278,197 | ) | 109,006 | |||||
|
|
|
|
|
|||||
| Net realized gain (loss) |
(278,197 | ) | 109,006 | |||||
|
|
|
|
|
|||||
| Change in net unrealized appreciation/depreciation on |
||||||||
| Futures contracts |
(47,148 | ) | 104,327 | |||||
|
|
|
|
|
|||||
| Change in net unrealized appreciation/depreciation |
(47,148 | ) | 104,327 | |||||
|
|
|
|
|
|||||
| Net realized and unrealized gain (loss) |
(325,345 | ) | 213,333 | |||||
|
|
|
|
|
|||||
| Net income (loss) |
$ | (396,899 | ) | $ | 205,802 | |||
|
|
|
|
|
|||||
| Net income (loss) per weighted-average share |
$ | (0.97 | ) | $ | 1.14 | |||
|
|
|
|
|
|||||
| Weighted-average shares outstanding |
408,914 | 180,779 | ||||||
|
|
|
|
|
|||||
| * | Since the Fund commenced investment operations on October 1, 2014, the Statement of Operations for the year ended December 31, 2013 has not been provided. |
See accompanying notes to financial statements.
147
Table of Contents
PROSHARES MANAGED FUTURES STRATEGY*
STATEMENTS OF CHANGES IN SHAREHOLDERS’ EQUITY
FOR THE YEAR ENDED DECEMBER 31, 2015
AND FOR THE PERIOD FROM OCTOBER 1, 2014 (INCEPTION) THROUGH DECEMBER 31, 2014
| Year ended December 31, 2015 |
October 1, 2014 (Inception) through December 31, 2014 |
|||||||
| Shareholders’ equity, beginning of period |
$ | 6,340,845 | $ | — | ||||
| Addition of 550,000 and 400,010 shares, respectively |
11,524,992 | 8,174,604 | ||||||
| Redemption of 500,000 and 100,000 shares, respectively |
(10,281,916 | ) | (2,039,561 | ) | ||||
|
|
|
|
|
|||||
| Net addition (redemption) of 50,000 and 300,010 shares, respectively |
1,243,076 | 6,135,043 | ||||||
|
|
|
|
|
|||||
| Net investment income (loss) |
(71,554 | ) | (7,531 | ) | ||||
| Net realized gain (loss) |
(278,197 | ) | 109,006 | |||||
| Change in net unrealized appreciation/depreciation |
(47,148 | ) | 104,327 | |||||
|
|
|
|
|
|||||
| Net income (loss) |
(396,899 | ) | 205,802 | |||||
|
|
|
|
|
|||||
| Shareholders’ equity, end of period |
$ | 7,187,022 | $ | 6,340,845 | ||||
|
|
|
|
|
|||||
| * | Since the Fund commenced investment operations on October 1, 2014, the Statement of Changes in Shareholders’ Equity for the year ended December 31, 2013 has not been provided. |
See accompanying notes to financial statements.
148
Table of Contents
PROSHARES MANAGED FUTURES STRATEGY*
STATEMENTS OF CASH FLOWS
FOR THE YEAR ENDED DECEMBER 31, 2015
AND FOR THE PERIOD FROM OCTOBER 1, 2014 (INCEPTION) THROUGH DECEMBER 31, 2014
| Year ended December 31, 2015 |
October 1, 2014 (Inception) through December 31, 2014 |
|||||||
| Cash flow from operating activities |
||||||||
| Net income (loss) |
$ | (396,899 | ) | $ | 205,802 | |||
| Adjustments to reconcile net income (loss) to net cash provided by (used in) operating activities: |
||||||||
| Decrease (Increase) in segregated cash balances with brokers for futures contracts |
(85,180 | ) | (195,142 | ) | ||||
| Decrease (Increase) in receivable on futures contracts |
17,445 | (17,445 | ) | |||||
| Decrease (Increase) in Limitation by Sponsor |
9,474 | (9,474 | ) | |||||
| Change in offering cost |
49,384 | (49,384 | ) | |||||
| Increase (Decrease) in management fee payable |
4,291 | — | ||||||
| Increase (Decrease) in brokerage commissions and fees payable |
164 | — | ||||||
| Increase (Decrease) in payable on futures contracts |
19,990 | — | ||||||
| Increase (Decrease) in payable for offering costs |
(65,785 | ) | 65,785 | |||||
|
|
|
|
|
|||||
| Net cash provided by (used in) operating activities |
(447,116 | ) | 142 | |||||
|
|
|
|
|
|||||
| Cash flow from financing activities |
||||||||
| Proceeds from addition of shares |
11,524,992 | 8,174,604 | ||||||
| Payment on shares redeemed |
(10,281,916 | ) | (2,039,561 | ) | ||||
|
|
|
|
|
|||||
| Net cash provided by (used in) financing activities |
1,243,076 | 6,135,043 | ||||||
|
|
|
|
|
|||||
| Net increase (decrease) in cash |
795,960 | 6,135,185 | ||||||
| Cash, beginning of period |
6,135,185 | — | ||||||
|
|
|
|
|
|||||
| Cash, end of period |
$ | 6,931,145 | $ | 6,135,185 | ||||
|
|
|
|
|
|||||
| * | Since the Fund commenced investment operations on October 1, 2014, the Statement of Cash Flows for the year ended December 31, 2013 has not been provided. |
See accompanying notes to financial statements.
149
Table of Contents
PROSHARES VIX SHORT-TERM FUTURES ETF
STATEMENTS OF FINANCIAL CONDITION
| December 31, 2015 | December 31, 2014 | |||||||
| Assets |
||||||||
| Cash |
$ | 2,124,103 | $ | 1,694,791 | ||||
| Segregated cash balances with brokers for futures contracts |
5,888,545 | 18,439,750 | ||||||
| Short-term U.S. government and agency obligations (Note 3) (cost $96,075,481 and $82,086,464, respectively) |
96,073,659 | 82,088,299 | ||||||
| Receivable on open futures contracts |
1,263,933 | 9,317,236 | ||||||
|
|
|
|
|
|||||
| Total assets |
105,350,240 | 111,540,076 | ||||||
|
|
|
|
|
|||||
| Liabilities and shareholders’ equity |
||||||||
| Liabilities |
||||||||
| Management fee payable |
77,417 | 80,751 | ||||||
|
|
|
|
|
|||||
| Total liabilities |
77,417 | 80,751 | ||||||
|
|
|
|
|
|||||
| Commitments and Contingencies (Note 2) |
||||||||
| Shareholders’ equity |
||||||||
| Shareholders’ equity |
105,272,823 | 111,459,325 | ||||||
|
|
|
|
|
|||||
| Total liabilities and shareholders’ equity |
$ | 105,350,240 | $ | 111,540,076 | ||||
|
|
|
|
|
|||||
| Shares outstanding |
7,949,812 | 5,324,812 | ||||||
|
|
|
|
|
|||||
| Net asset value per share |
$ | 13.24 | $ | 20.93 | ||||
|
|
|
|
|
|||||
| Market value per share (Note 2) |
$ | 13.33 | $ | 20.99 | ||||
|
|
|
|
|
|||||
See accompanying notes to financial statements.
150
Table of Contents
PROSHARES VIX SHORT-TERM FUTURES ETF
SCHEDULE OF INVESTMENTS
DECEMBER 31, 2015
| Principal Amount | Value | |||||||
| Short-term U.S. government and agency obligations |
||||||||
| (91% of shareholders’ equity) |
||||||||
| U.S. Treasury Bills: |
||||||||
| 0.087% due 01/07/16 |
$ | 5,167,000 | $ | 5,166,983 | ||||
| 0.165% due 01/28/16 |
4,768,000 | 4,767,587 | ||||||
| 0.007% due 02/04/16 |
44,408,000 | 44,404,749 | ||||||
| 0.000% due 02/25/16 |
6,625,000 | 6,624,282 | ||||||
| 0.190% due 03/03/16 |
2,943,000 | 2,942,542 | ||||||
| 0.070% due 03/10/16 |
2,214,000 | 2,213,533 | ||||||
| 0.201% due 03/17/16† |
14,428,000 | 14,425,221 | ||||||
| 0.060% due 03/24/16† |
5,088,000 | 5,085,965 | ||||||
| 0.366% due 05/26/16† |
10,459,000 | 10,442,797 | ||||||
|
|
|
|||||||
| Total short-term U.S. government and agency obligations (cost $96,075,481) |
$ | 96,073,659 | ||||||
|
|
|
|||||||
| Futures Contracts Purchased†† |
||||||||||||
| Number of Contracts |
Notional Amount at Value |
Unrealized Appreciation (Depreciation) |
||||||||||
| VIX Futures - CBOE, expires January 2016 |
2,821 | $ | 52,259,025 | $ | (958,831 | ) | ||||||
| VIX Futures - CBOE, expires February 2016 |
2,821 | 53,246,375 | (119,794 | ) | ||||||||
|
|
|
|||||||||||
| $ | (1,078,625 | ) | ||||||||||
|
|
|
|||||||||||
| † | All or partial amount pledged as collateral for futures contracts . |
| †† | Cash collateral in the amount of $5,888,545 was pledged to cover margin requirements for open futures contracts as of December 31, 2015. |
See accompanying notes to financial statements.
151
Table of Contents
PROSHARES VIX SHORT-TERM FUTURES ETF
SCHEDULE OF INVESTMENTS
DECEMBER 31, 2014
| Principal Amount | Value | |||||||
| Short-term U.S. government and agency obligations |
||||||||
| (74% of shareholders’ equity) |
||||||||
| U.S. Treasury Bills: |
||||||||
| 0.033% due 01/08/15 |
$ | 3,961,000 | $ | 3,960,990 | ||||
| 0.000% due 01/22/15 |
305,000 | 304,995 | ||||||
| 0.000% due 01/29/15 |
12,836,000 | 12,835,807 | ||||||
| 0.011% due 02/12/15 |
1,357,000 | 1,356,969 | ||||||
| 0.018% due 02/19/15 |
3,939,000 | 3,938,895 | ||||||
| 0.023% due 03/05/15 |
12,894,000 | 12,893,667 | ||||||
| 0.036% due 04/16/15 |
5,181,000 | 5,180,626 | ||||||
| 0.056% due 04/30/15 |
186,000 | 185,976 | ||||||
| 0.061% due 05/14/15 |
4,724,000 | 4,723,221 | ||||||
| 0.028% due 05/21/15 |
6,927,000 | 6,925,663 | ||||||
| 0.071% due 05/28/15 |
11,197,000 | 11,194,275 | ||||||
| 0.087% due 06/11/15 |
18,593,000 | 18,587,215 | ||||||
|
|
|
|||||||
| Total short-term U.S. government and agency obligations (cost $82,086,464) |
$ | 82,088,299 | ||||||
|
|
|
|||||||
Futures Contracts Purchased††
| Number of Contracts |
Notional Amount at Value |
Unrealized Appreciation (Depreciation) |
||||||||||
| VIX Futures - CBOE, expires January 2015 |
3,326 | $ | 59,951,150 | $ | 3,425,757 | |||||||
| VIX Futures - CBOE, expires February 2015 |
2,775 | 50,574,375 | 2,838,863 | |||||||||
|
|
|
|||||||||||
| $ | 6,264,620 | |||||||||||
|
|
|
|||||||||||
| †† | Cash collateral in the amount of $18,439,750 was pledged to cover margin requirements for open futures contracts as of December 31, 2014 |
See accompanying notes to financial statements.
152
Table of Contents
PROSHARES VIX SHORT-TERM FUTURES ETF
STATEMENTS OF OPERATIONS
FOR THE YEARS ENDED DECEMBER 31, 2015, 2014 AND 2013
| Year ended December 31, 2015 |
Year ended December 31, 2014 |
Year ended December 31, 2013 |
||||||||||
| Investment Income |
||||||||||||
| Interest |
$ | 42,319 | $ | 47,562 | $ | 77,010 | ||||||
|
|
|
|
|
|
|
|||||||
| Expenses |
||||||||||||
| Management fee |
1,062,171 | 1,083,189 | 1,661,129 | |||||||||
| Brokerage commissions and fees |
130,942 | 82,921 | — | |||||||||
|
|
|
|
|
|
|
|||||||
| Total expenses |
1,193,113 | 1,166,110 | 1,661,129 | |||||||||
|
|
|
|
|
|
|
|||||||
| Net investment income (loss) |
(1,150,794 | ) | (1,118,548 | ) | (1,584,119 | ) | ||||||
|
|
|
|
|
|
|
|||||||
| Realized and unrealized gain (loss) on investment activity |
||||||||||||
| Net realized gain (loss) on |
||||||||||||
| Futures contracts |
(19,408,543 | ) | (694,347 | ) | (144,618,136 | ) | ||||||
| Short-term U.S. government and agency obligations |
1,703 | 12,242 | (6,516 | ) | ||||||||
|
|
|
|
|
|
|
|||||||
| Net realized gain (loss) |
(19,406,840 | ) | (682,105 | ) | (144,624,652 | ) | ||||||
|
|
|
|
|
|
|
|||||||
| Change in net unrealized appreciation/depreciation on |
||||||||||||
| Futures contracts |
(7,343,245 | ) | 22,917,306 | (16,431,267 | ) | |||||||
| Short-term U.S. government and agency obligations |
(3,657 | ) | (6,229 | ) | 4,439 | |||||||
|
|
|
|
|
|
|
|||||||
| Change in net unrealized appreciation/depreciation |
(7,346,902 | ) | 22,911,077 | (16,426,828 | ) | |||||||
|
|
|
|
|
|
|
|||||||
| Net realized and unrealized gain (loss) |
(26,753,742 | ) | 22,228,972 | (161,051,480 | ) | |||||||
|
|
|
|
|
|
|
|||||||
| Net income (loss) |
$ | (27,904,536 | ) | $ | 21,110,424 | $ | (162,635,599 | ) | ||||
|
|
|
|
|
|
|
|||||||
| Net income (loss) per weighted-average share |
$ | (3.21 | ) | $ | 3.86 | $ | (36.12 | ) | ||||
|
|
|
|
|
|
|
|||||||
| Weighted-average shares outstanding |
8,688,990 | 5,463,511 | 4,503,256 | |||||||||
|
|
|
|
|
|
|
|||||||
See accompanying notes to financial statements.
153
Table of Contents
PROSHARES VIX SHORT-TERM FUTURES ETF
STATEMENTS OF CHANGES IN SHAREHOLDERS’ EQUITY
FOR THE YEARS ENDED DECEMBER 31, 2015, 2014 AND 2013
| Year ended December 31, 2015 |
Year ended December 31, 2014 |
Year ended December 31, 2013 |
||||||||||
| Shareholders’ equity, beginning of period |
$ | 111,459,325 | $ | 270,398,554 | $ | 137,657,464 | ||||||
| Addition of 12,475,000, 10,575,000 and 16,095,000 shares, respectively |
187,659,682 | 228,373,046 | 688,146,488 | |||||||||
| Redemption of 9,850,000, 14,725,000 and 8,260,189 shares, respectively |
(165,941,648 | ) | (408,422,699 | ) | (392,769,799 | ) | ||||||
|
|
|
|
|
|
|
|||||||
| Net addition (redemption) of 2,625,000, (4,150,000) and 7,834,811 shares, respectively |
21,718,034 | (180,049,653 | ) | 295,376,689 | ||||||||
|
|
|
|
|
|
|
|||||||
| Net investment income (loss) |
(1,150,794 | ) | (1,118,548 | ) | (1,584,119 | ) | ||||||
| Net realized gain (loss) |
(19,406,840 | ) | (682,105 | ) | (144,624,652 | ) | ||||||
| Change in net unrealized appreciation/depreciation |
(7,346,902 | ) | 22,911,077 | (16,426,828 | ) | |||||||
|
|
|
|
|
|
|
|||||||
| Net income (loss) |
(27,904,536 | ) | 21,110,424 | (162,635,599 | ) | |||||||
|
|
|
|
|
|
|
|||||||
| Shareholders’ equity, end of period |
$ | 105,272,823 | $ | 111,459,325 | $ | 270,398,554 | ||||||
|
|
|
|
|
|
|
|||||||
See accompanying notes to financial statements.
154
Table of Contents
PROSHARES VIX SHORT-TERM FUTURES ETF
STATEMENTS OF CASH FLOWS
FOR THE YEARS ENDED DECEMBER 31, 2015, 2014 AND 2013
| Year ended December 31, 2015 |
Year ended December 31, 2014 |
Year ended December 31, 2013 |
||||||||||
| Cash flow from operating activities |
||||||||||||
| Net income (loss) |
$ | (27,904,536 | ) | $ | 21,110,424 | $ | (162,635,599 | ) | ||||
| Adjustments to reconcile net income (loss) to net cash provided by (used in) operating activities: |
||||||||||||
| Decrease (Increase) in segregated cash balances with brokers for futures contracts |
12,551,205 | 45,580,600 | (29,910,352 | ) | ||||||||
| Purchases of short-term U.S. government and agency obligations |
(599,166,468 | ) | (674,817,750 | ) | (1,149,809,572 | ) | ||||||
| Proceeds from sales or maturities of short-term U.S. government and agency obligations |
585,220,876 | 800,418,587 | 1,086,309,043 | |||||||||
| Net amortization and accretion on short-term U.S. government and agency obligations |
(41,722 | ) | (46,740 | ) | (77,010 | ) | ||||||
| Net realized gain (loss) on investments |
(1,703 | ) | (12,242 | ) | 6,516 | |||||||
| Change in unrealized appreciation/depreciation on investments |
3,657 | 6,229 | (4,439 | ) | ||||||||
| Decrease (Increase) in receivable on futures contracts |
8,053,303 | (6,138,219 | ) | (3,179,017 | ) | |||||||
| Increase (Decrease) in management fee payable |
(3,334 | ) | (128,002 | ) | 102,304 | |||||||
| Increase (Decrease) in payable on futures contracts |
— | — | (31,540,181 | ) | ||||||||
|
|
|
|
|
|
|
|||||||
| Net cash provided by (used in) operating activities |
(21,288,722 | ) | 185,972,887 | (290,738,307 | ) | |||||||
|
|
|
|
|
|
|
|||||||
| Cash flow from financing activities |
||||||||||||
| Proceeds from addition of shares |
187,659,682 | 228,373,046 | 690,664,556 | |||||||||
| Payment on shares redeemed |
(165,941,648 | ) | (416,984,894 | ) | (398,582,455 | ) | ||||||
|
|
|
|
|
|
|
|||||||
| Net cash provided by (used in) financing activities |
21,718,034 | (188,611,848 | ) | 292,082,101 | ||||||||
|
|
|
|
|
|
|
|||||||
| Net increase (decrease) in cash |
429,312 | (2,638,961 | ) | 1,343,794 | ||||||||
| Cash, beginning of period |
1,694,791 | 4,333,752 | 2,989,958 | |||||||||
|
|
|
|
|
|
|
|||||||
| Cash, end of period |
$ | 2,124,103 | $ | 1,694,791 | $ | 4,333,752 | ||||||
|
|
|
|
|
|
|
|||||||
See accompanying notes to financial statements.
155
Table of Contents
PROSHARES VIX MID-TERM FUTURES ETF
STATEMENTS OF FINANCIAL CONDITION
| December 31, 2015 | December 31, 2014 | |||||||
| Assets |
||||||||
| Cash |
$ | 671,791 | $ | 1,634,082 | ||||
| Segregated cash balances with brokers for futures contracts |
980,750 | 1,906,950 | ||||||
| Short-term U.S. government and agency obligations (Note 3) (cost $25,975,462 and $24,104,754, respectively) |
25,976,287 | 24,105,906 | ||||||
| Receivable on open futures contracts |
42,188 | 1,783,328 | ||||||
|
|
|
|
|
|||||
| Total assets |
27,671,016 | 29,430,266 | ||||||
|
|
|
|
|
|||||
| Liabilities and shareholders’ equity |
||||||||
| Liabilities |
||||||||
| Payable for capital shares redeemed |
— | 7,947,955 | ||||||
| Management fee payable |
20,378 | 22,736 | ||||||
|
|
|
|
|
|||||
| Total liabilities |
20,378 | 7,970,691 | ||||||
|
|
|
|
|
|||||
| Commitments and Contingencies (Note 2) |
||||||||
| Shareholders’ equity |
||||||||
| Shareholders’ equity |
27,650,638 | 21,459,575 | ||||||
|
|
|
|
|
|||||
| Total liabilities and shareholders’ equity |
$ | 27,671,016 | $ | 29,430,266 | ||||
|
|
|
|
|
|||||
| Shares outstanding |
512,404 | 337,404 | ||||||
|
|
|
|
|
|||||
| Net asset value per share |
$ | 53.96 | $ | 63.60 | ||||
|
|
|
|
|
|||||
| Market value per share (Note 2) |
$ | 53.99 | $ | 63.89 | ||||
|
|
|
|
|
|||||
See accompanying notes to financial statements.
156
Table of Contents
PROSHARES VIX MID-TERM FUTURES ETF
SCHEDULE OF INVESTMENTS
DECEMBER 31, 2015
| Principal Amount | Value | |||||||
| Short-term U.S. government and agency obligations |
||||||||
| (94% of shareholders’ equity) |
||||||||
| U.S. Treasury Bills: |
||||||||
| 0.019% due 02/04/16 |
$ | 15,119,000 | $ | 15,117,893 | ||||
| 0.000% due 02/25/16 |
1,778,000 | 1,777,808 | ||||||
| 0.209% due 03/03/16† |
9,082,000 | 9,080,586 | ||||||
|
|
|
|||||||
| Total short-term U.S. government and agency obligations (cost $25,975,462) |
$ | 25,976,287 | ||||||
|
|
|
|||||||
Futures Contracts Purchased††
| Number of Contracts |
Notional Amount at Value |
Unrealized Appreciation (Depreciation) |
||||||||||
| VIX Futures—CBOE, expires April 2016 |
235 | $ | 4,547,250 | $ | (168,335 | ) | ||||||
| VIX Futures—CBOE, expires May 2016 |
469 | 9,145,500 | 10,005 | |||||||||
| VIX Futures—CBOE, expires June 2016 |
469 | 9,262,750 | (135,125 | ) | ||||||||
| VIX Futures—CBOE, expires July 2016 |
234 | 4,691,700 | (50,905 | ) | ||||||||
|
|
|
|||||||||||
| $ | (344,360 | ) | ||||||||||
|
|
|
|||||||||||
| † | All or partial amount pledged as collateral for futures contracts. |
| †† | Cash collateral in the amount of $980,750 was pledged to cover margin requirements for open futures contracts as of December 31, 2015. |
See accompanying notes to financial statements.
157
Table of Contents
PROSHARES VIX MID-TERM FUTURES ETF
SCHEDULE OF INVESTMENTS
DECEMBER 31, 2014
| Principal Amount | Value | |||||||||||
| Short-term U.S. government and agency obligations |
||||||||||||
| (112% of shareholders’ equity) |
||||||||||||
| U.S. Treasury Bills: |
||||||||||||
| 0.012% due 01/22/15 |
$ | 1,894,000 | $ | 1,893,968 | ||||||||
| 0.012% due 02/12/15 |
345,000 | 344,992 | ||||||||||
| 0.025% due 03/05/15 |
1,563,000 | 1,562,960 | ||||||||||
| 0.043% due 04/16/15 |
12,807,000 | 12,806,075 | ||||||||||
| 0.047% due 04/30/15 |
771,000 | 770,899 | ||||||||||
| 0.071% due 05/28/15 |
1,551,000 | 1,550,623 | ||||||||||
| 0.087% due 06/11/15 |
5,178,000 | 5,176,389 | ||||||||||
|
|
|
|||||||||||
| Total short-term U.S. government and agency obligations (cost $24,104,754) |
$ | 24,105,906 | ||||||||||
|
|
|
|||||||||||
| Futures Contracts Purchased†† |
||||||||||||
| Number of Contracts |
Notional Amount at Value |
Unrealized Appreciation (Depreciation) |
||||||||||
| VIX Futures—CBOE, expires April 2015 |
205 | $ | 3,818,125 | $ | (222,845 | ) | ||||||
| VIX Futures—CBOE, expires May 2015 |
376 | 7,097,000 | 302,905 | |||||||||
| VIX Futures—CBOE, expires June 2015 |
376 | 7,191,000 | 54,730 | |||||||||
| VIX Futures—CBOE, expires July 2015 |
172 | 3,349,700 | 125,875 | |||||||||
|
|
|
|||||||||||
| $ | 260,665 | |||||||||||
|
|
|
|||||||||||
| †† | Cash collateral in the amount of $1,906,950 was pledged to cover margin requirements for open futures contracts as of December 31, 2014. |
See accompanying notes to financial statements.
158
Table of Contents
PROSHARES VIX MID-TERM FUTURES ETF
STATEMENTS OF OPERATIONS
FOR THE YEARS ENDED DECEMBER 31, 2015, 2014 AND 2013
| Year ended December 31, 2015 |
Year ended December 31, 2014 |
Year ended December 31, 2013 |
||||||||||
| Investment Income |
||||||||||||
| Interest |
$ | 8,293 | $ | 16,573 | $ | 25,811 | ||||||
| Expenses |
||||||||||||
| Management fee |
233,390 | 392,120 | 572,377 | |||||||||
| Brokerage commissions and fees |
15,503 | 10,931 | — | |||||||||
|
|
|
|
|
|
|
|||||||
| Total expenses |
248,893 | 403,051 | 572,377 | |||||||||
|
|
|
|
|
|
|
|||||||
| Net investment income (loss) |
(240,600 | ) | (386,478 | ) | (546,566 | ) | ||||||
|
|
|
|
|
|
|
|||||||
| Realized and unrealized gain (loss) on investment activity |
||||||||||||
| Net realized gain (loss) on |
||||||||||||
| Futures contracts |
(3,335,936 | ) | (14,378,810 | ) | (28,219,863 | ) | ||||||
| Short-term U.S. government and agency obligations |
1,355 | 1,742 | (78 | ) | ||||||||
|
|
|
|
|
|
|
|||||||
| Net realized gain (loss) |
(3,334,581 | ) | (14,377,068 | ) | (28,219,941 | ) | ||||||
|
|
|
|
|
|
|
|||||||
| Change in net unrealized appreciation/depreciation on |
||||||||||||
| Futures contracts |
(605,025 | ) | 5,157,354 | (3,426,279 | ) | |||||||
| Short-term U.S. government and agency obligations |
(327 | ) | 187 | (2,031 | ) | |||||||
|
|
|
|
|
|
|
|||||||
| Change in net unrealized appreciation/depreciation |
(605,352 | ) | 5,157,541 | (3,428,310 | ) | |||||||
|
|
|
|
|
|
|
|||||||
| Net realized and unrealized gain (loss) |
(3,939,933 | ) | (9,219,527 | ) | (31,648,251 | ) | ||||||
|
|
|
|
|
|
|
|||||||
| Net income (loss) |
$ | (4,180,533 | ) | $ | (9,606,005 | ) | $ | (32,194,817 | ) | |||
|
|
|
|
|
|
|
|||||||
| Net income (loss) per weighted-average share (Note 1) |
$ | (8.78 | ) | $ | (14.08 | ) | $ | (46.49 | ) | |||
|
|
|
|
|
|
|
|||||||
| Weighted-average shares outstanding (Note 1) |
476,171 | 682,131 | 692,570 | |||||||||
|
|
|
|
|
|
|
|||||||
See accompanying notes to financial statements.
159
Table of Contents
PROSHARES VIX MID-TERM FUTURES ETF
STATEMENTS OF CHANGES IN SHAREHOLDERS’ EQUITY
FOR THE YEARS ENDED DECEMBER 31, 2015, 2014 AND 2013
| Year ended December 31, 2015 |
Year ended December 31, 2014 |
Year ended December 31, 2013 |
||||||||||
| Shareholders’ equity, beginning of period |
$ | 21,459,575 | $ | 51,134,323 | $ | 37,302,992 | ||||||
| Addition of 325,000, 593,750 and 1,512,500 shares, respectively (Note 1) |
19,318,111 | 41,886,902 | 151,394,850 | |||||||||
| Redemption of 150,000, 918,847 and 1,118,750 shares, respectively (Note 1) |
(8,946,515 | ) | (61,955,645 | ) | (105,368,702 | ) | ||||||
|
|
|
|
|
|
|
|||||||
| Net addition (redemption) of 175,000, (325,097) and 393,750 shares, respectively (Note 1) |
10,371,596 | (20,068,743 | ) | 46,026,148 | ||||||||
|
|
|
|
|
|
|
|||||||
| Net investment income (loss) |
(240,600 | ) | (386,478 | ) | (546,566 | ) | ||||||
| Net realized gain (loss) |
(3,334,581 | ) | (14,377,068 | ) | (28,219,941 | ) | ||||||
| Change in net unrealized appreciation/depreciation |
(605,352 | ) | 5,157,541 | (3,428,310 | ) | |||||||
|
|
|
|
|
|
|
|||||||
| Net income (loss) |
(4,180,533 | ) | (9,606,005 | ) | (32,194,817 | ) | ||||||
|
|
|
|
|
|
|
|||||||
| Shareholders’ equity, end of period |
$ | 27,650,638 | $ | 21,459,575 | $ | 51,134,323 | ||||||
|
|
|
|
|
|
|
|||||||
See accompanying notes to financial statements.
160
Table of Contents
PROSHARES VIX MID-TERM FUTURES ETF
STATEMENTS OF CASH FLOWS
FOR THE YEARS ENDED DECEMBER 31, 2015, 2014 AND 2013
| Year ended December 31, 2015 |
Year ended December 31, 2014 |
Year ended December 31, 2013 |
||||||||||
| Cash flow from operating activities |
||||||||||||
| Net income (loss) |
$ | (4,180,533 | ) | $ | (9,606,005 | ) | $ | (32,194,817 | ) | |||
| Adjustments to reconcile net income (loss) to net cash provided by (used in) operating activities: |
||||||||||||
| Decrease (Increase) in segregated cash balances with brokers for futures contracts |
926,200 | 6,547,440 | (624,390 | ) | ||||||||
| Purchases of short-term U.S. government and agency obligations |
(95,567,067 | ) | (161,570,392 | ) | (290,242,216 | ) | ||||||
| Proceeds from sales or maturities of short-term U.S. government and agency obligations |
93,706,007 | 183,523,221 | 324,156,552 | |||||||||
| Net amortization and accretion on short-term U.S. government and agency obligations |
(8,293 | ) | (16,573 | ) | (25,812 | ) | ||||||
| Net realized gain (loss) on investments |
(1,355 | ) | (1,742 | ) | 78 | |||||||
| Change in unrealized appreciation/depreciation on investments |
327 | (187 | ) | 2,031 | ||||||||
| Decrease (Increase) in receivable on futures contracts |
1,741,140 | (1,682,594 | ) | (100,734 | ) | |||||||
| Increase (Decrease) in management fee payable |
(2,358 | ) | (22,712 | ) | (13,917 | ) | ||||||
| Increase (Decrease) in payable on futures contracts |
— | — | (1,890,675 | ) | ||||||||
|
|
|
|
|
|
|
|||||||
| Net cash provided by (used in) operating activities |
(3,385,932 | ) | 17,170,456 | (933,900 | ) | |||||||
|
|
|
|
|
|
|
|||||||
| Cash flow from financing activities |
||||||||||||
| Proceeds from addition of shares |
19,318,111 | 41,886,902 | 151,394,850 | |||||||||
| Payment on shares redeemed |
(16,894,470 | ) | (59,329,673 | ) | (150,618,268 | ) | ||||||
|
|
|
|
|
|
|
|||||||
| Net cash provided by (used in) financing activities |
2,423,641 | (17,442,771 | ) | 776,582 | ||||||||
|
|
|
|
|
|
|
|||||||
| Net increase (decrease) in cash |
(962,291 | ) | (272,315 | ) | (157,318 | ) | ||||||
| Cash, beginning of period |
1,634,082 | 1,906,397 | 2,063,715 | |||||||||
|
|
|
|
|
|
|
|||||||
| Cash, end of period |
$ | 671,791 | $ | 1,634,082 | $ | 1,906,397 | ||||||
|
|
|
|
|
|
|
|||||||
See accompanying notes to financial statements.
161
Table of Contents
PROSHARES SHORT VIX SHORT-TERM FUTURES ETF
STATEMENTS OF FINANCIAL CONDITION
| December 31, 2015 | December 31, 2014 | |||||||
| Assets |
||||||||
| Cash |
$ | 5,150,976 | $ | 9,122,219 | ||||
| Segregated cash balances with brokers for futures contracts |
123,528,405 | 85,244,950 | ||||||
| Short-term U.S. government and agency obligations (Note 3) (cost $535,381,199 and $446,972,637, respectively) |
535,392,718 | 446,975,220 | ||||||
| Receivable from capital shares sold |
10,164,157 | — | ||||||
|
|
|
|
|
|||||
| Total assets |
674,236,256 | 541,342,389 | ||||||
|
|
|
|
|
|||||
| Liabilities and shareholders’ equity |
||||||||
| Liabilities |
||||||||
| Payable for capital shares redeemed |
29,497,107 | 3,358,781 | ||||||
| Payable on open futures contracts |
1,420,271 | 31,020,019 | ||||||
| Management fee payable |
507,517 | 407,465 | ||||||
|
|
|
|
|
|||||
| Total liabilities |
31,424,895 | 34,786,265 | ||||||
|
|
|
|
|
|||||
| Commitments and Contingencies (Note 2) |
||||||||
| Shareholders’ equity |
||||||||
| Shareholders’ equity |
642,811,361 | 506,556,124 | ||||||
|
|
|
|
|
|||||
| Total liabilities and shareholders’ equity |
$ | 674,236,256 | $ | 541,342,389 | ||||
|
|
|
|
|
|||||
| Shares outstanding |
12,650,040 | 8,250,040 | ||||||
|
|
|
|
|
|||||
| Net asset value per share |
$ | 50.81 | $ | 61.40 | ||||
|
|
|
|
|
|||||
| Market value per share (Note 2) |
$ | 50.45 | $ | 61.16 | ||||
|
|
|
|
|
|||||
See accompanying notes to financial statements.
162
Table of Contents
PROSHARES SHORT VIX SHORT-TERM FUTURES ETF
SCHEDULE OF INVESTMENTS
DECEMBER 31, 2015
| Principal Amount | Value | |||||||
| Short-term U.S. government and agency obligations |
| |||||||
| (83% of shareholders’ equity) |
||||||||
| U.S. Treasury Bills: |
||||||||
| 0.065% due 01/07/16 |
$ | 44,561,000 | $ | 44,560,853 | ||||
| 0.053% due 01/14/16 |
13,600,000 | 13,599,660 | ||||||
| 0.000% due 01/21/16 |
10,817,000 | 10,816,540 | ||||||
| 0.165% due 01/28/16 |
22,342,000 | 22,340,063 | ||||||
| 0.035% due 02/04/16 |
36,091,000 | 36,088,358 | ||||||
| 0.036% due 02/11/16 |
85,348,000 | 85,336,743 | ||||||
| 0.000% due 02/25/16 |
10,901,000 | 10,899,819 | ||||||
| 0.208% due 03/03/16 |
63,916,000 | 63,906,048 | ||||||
| 0.194% due 03/17/16 |
74,289,000 | 74,274,692 | ||||||
| 0.206% due 03/24/16 |
35,842,000 | 35,827,663 | ||||||
| 0.364% due 05/26/16† |
137,956,000 | 137,742,279 | ||||||
|
|
|
|||||||
| Total short-term U.S. government and agency obligations (cost $535,381,199) |
$ | 535,392,718 | ||||||
|
|
|
|||||||
Futures Contracts Sold††
| Number of Contracts |
Notional Amount at Value |
Unrealized Appreciation (Depreciation) |
||||||||||
| VIX Futures—CBOE, expires January 2016 |
17,150 | $ | 317,703,750 | $ | 10,805,245 | |||||||
| VIX Futures—CBOE, expires February 2016 |
17,151 | 323,725,125 | (58,830 | ) | ||||||||
|
|
|
|||||||||||
| $ | 10,746,415 | |||||||||||
|
|
|
|||||||||||
| † | All or partial amount pledged as collateral for futures contracts. |
| †† | Cash collateral in the amount of $123,528,405 was pledged to cover margin requirements for open futures contracts as of December 31, 2015. |
See accompanying notes to financial statements.
163
Table of Contents
PROSHARES SHORT VIX SHORT-TERM FUTURES ETF
SCHEDULE OF INVESTMENTS
DECEMBER 31, 2014
| Principal Amount | Value | |||||||
| Short-term U.S. government and agency obligations |
|
|||||||
| (88% of shareholders’ equity) |
||||||||
| U.S. Treasury Bills: |
||||||||
| 0.040% due 01/08/15 |
$ | 1,850,000 | $ | 1,849,995 | ||||
| 0.006% due 01/22/15 |
22,078,000 | 22,077,632 | ||||||
| 0.010% due 01/29/15 |
9,864,000 | 9,863,852 | ||||||
| 0.021% due 02/19/15 |
1,830,000 | 1,829,951 | ||||||
| 0.019% due 03/05/15 |
90,719,000 | 90,716,657 | ||||||
| 0.016% due 03/12/15 |
151,190,000 | 151,184,205 | ||||||
| 0.043% due 04/16/15 |
6,920,000 | 6,919,500 | ||||||
| 0.063% due 05/14/15 |
7,752,000 | 7,750,721 | ||||||
| 0.066% due 05/21/15 |
61,759,000 | 61,747,077 | ||||||
| 0.073% due 05/28/15 |
16,216,000 | 16,212,054 | ||||||
| 0.072% due 06/04/15 |
67,517,000 | 67,495,479 | ||||||
| 0.030% due 06/11/15 |
9,331,000 | 9,328,097 | ||||||
|
|
|
|||||||
| Total short-term U.S. government and agency obligations (cost $446,972,637) |
$ | 446,975,220 | ||||||
|
|
|
|||||||
Futures Contracts Sold††
| Number of Contracts |
Notional Amount at Value |
Unrealized Appreciation (Depreciation) |
||||||||||
| VIX Futures—CBOE, expires January 2015 |
15,388 | $ | 277,368,700 | $ | (701,599) | |||||||
| VIX Futures—CBOE, expires February 2015 |
12,811 | 233,480,475 | (15,650,550 | ) | ||||||||
|
|
|
|||||||||||
| $ | (16,352,149 | ) | ||||||||||
|
|
|
|||||||||||
| †† | Cash collateral in the amount of $85,244,950 was pledged to cover margin requirements for open futures contracts as of December 31, 2014. |
See accompanying notes to financial statements.
164
Table of Contents
PROSHARES SHORT VIX SHORT-TERM FUTURES ETF
STATEMENTS OF OPERATIONS
FOR THE YEARS ENDED DECEMBER 31, 2015, 2014 AND 2013
| Year ended December 31, 2015 |
Year ended December 31, 2014 |
Year ended December 31, 2013 |
||||||||||
| Investment Income |
||||||||||||
| Interest |
$ | 180,686 | $ | 81,544 | $ | 36,503 | ||||||
|
|
|
|
|
|
|
|||||||
| Expenses |
||||||||||||
| Management fee |
4,043,491 | 2,785,597 | 845,479 | |||||||||
| Brokerage commissions and fees |
1,935,395 | 1,581,416 | 519,393 | |||||||||
|
|
|
|
|
|
|
|||||||
| Total expenses |
5,978,886 | 4,367,013 | 1,364,872 | |||||||||
|
|
|
|
|
|
|
|||||||
| Net investment income (loss) |
(5,798,200 | ) | (4,285,469 | ) | (1,328,369 | ) | ||||||
|
|
|
|
|
|
|
|||||||
| Realized and unrealized gain (loss) on investment activity |
||||||||||||
| Net realized gain (loss) on |
||||||||||||
| Futures contracts |
69,793,028 | 76,925,998 | 87,175,105 | |||||||||
| Short-term U.S. government and agency obligations |
35,629 | 19,363 | 6,005 | |||||||||
|
|
|
|
|
|
|
|||||||
| Net realized gain (loss) |
69,828,657 | 76,945,361 | 87,181,110 | |||||||||
|
|
|
|
|
|
|
|||||||
| Change in net unrealized appreciation/depreciation on |
||||||||||||
| Futures contracts |
27,098,564 | (24,469,104 | ) | 9,504,130 | ||||||||
| Short-term U.S. government and agency obligations |
8,936 | (1,764 | ) | 1,795 | ||||||||
|
|
|
|
|
|
|
|||||||
| Change in net unrealized appreciation/depreciation |
27,107,500 | (24,470,868 | ) | 9,505,925 | ||||||||
|
|
|
|
|
|
|
|||||||
| Net realized and unrealized gain (loss) |
96,936,157 | 52,474,493 | 96,687,035 | |||||||||
|
|
|
|
|
|
|
|||||||
| Net income (loss) |
$ | 91,137,957 | $ | 48,189,024 | $ | 95,358,666 | ||||||
|
|
|
|
|
|
|
|||||||
| Net income (loss) per weighted-average share (Note 1) |
$ | 12.83 | $ | 11.52 | $ | 53.11 | ||||||
|
|
|
|
|
|
|
|||||||
| Weighted-average shares outstanding (Note 1) |
7,103,739 | 4,182,232 | 1,795,656 | |||||||||
|
|
|
|
|
|
|
|||||||
See accompanying notes to financial statements.
165
Table of Contents
PROSHARES SHORT VIX SHORT-TERM FUTURES ETF
STATEMENTS OF CHANGES IN SHAREHOLDERS’ EQUITY
FOR THE YEARS ENDED DECEMBER 31, 2015, 2014 AND 2013
| Year ended December 31, 2015 |
Year ended December 31, 2014 |
Year ended December 31, 2013 |
||||||||||
| Shareholders’ equity, beginning of period |
$ | 506,556,124 | $ | 141,751,202 | $ | 82,663,633 | ||||||
| Addition of 24,100,000, 16,100,000 and 11,500,000 shares, respectively (Note 1) |
1,403,231,166 | 1,056,547,830 | 529,295,847 | |||||||||
| Redemption of 19,700,000, 9,950,000 and 11,900,000 shares, respectively (Note 1) |
(1,358,113,886 | ) | (739,931,932 | ) | (565,566,944 | ) | ||||||
|
|
|
|
|
|
|
|||||||
| Net addition (redemption) of 4,400,000, 6,150,000 and (400,000) shares, respectively (Note 1) |
45,117,280 | 316,615,898 | (36,271,097 | ) | ||||||||
|
|
|
|
|
|
|
|||||||
| Net investment income (loss) |
(5,798,200 | ) | (4,285,469 | ) | (1,328,369 | ) | ||||||
| Net realized gain (loss) |
69,828,657 | 76,945,361 | 87,181,110 | |||||||||
| Change in net unrealized appreciation/depreciation |
27,107,500 | (24,470,868 | ) | 9,505,925 | ||||||||
|
|
|
|
|
|
|
|||||||
| Net income (loss) |
91,137,957 | 48,189,024 | 95,358,666 | |||||||||
|
|
|
|
|
|
|
|||||||
| Shareholders’ equity, end of period |
$ | 642,811,361 | $ | 506,556,124 | $ | 141,751,202 | ||||||
|
|
|
|
|
|
|
|||||||
See accompanying notes to financial statements.
166
Table of Contents
PROSHARES SHORT VIX SHORT-TERM FUTURES ETF
STATEMENTS OF CASH FLOWS
FOR THE YEARS ENDED DECEMBER 31, 2015, 2014 AND 2013
| Year ended December 31, 2015 |
Year ended December 31, 2014 |
Year ended December 31, 2013 |
||||||||||
| Cash flow from operating activities |
||||||||||||
| Net income (loss) |
$ | 91,137,957 | $ | 48,189,024 | $ | 95,358,666 | ||||||
| Adjustments to reconcile net income (loss) to net cash provided by (used in) operating activities: |
||||||||||||
| Decrease (Increase) in segregated cash balances with brokers for futures contracts |
(38,283,455 | ) | (51,692,300 | ) | (12,821,153 | ) | ||||||
| Purchases of short-term U.S. government and agency obligations |
(2,104,319,382 | ) | (1,647,460,143 | ) | (675,205,073 | ) | ||||||
| Proceeds from sales or maturities of short-term U.S. government and agency obligations |
2,016,127,119 | 1,306,143,088 | 623,376,707 | |||||||||
| Net amortization and accretion on short-term U.S. government and agency obligations |
(180,670 | ) | (81,544 | ) | (36,504 | ) | ||||||
| Net realized gain (loss) on investments |
(35,629 | ) | (19,363 | ) | (6,005 | ) | ||||||
| Change in unrealized appreciation/depreciation on investments |
(8,936 | ) | 1,764 | (1,795 | ) | |||||||
| Decrease (Increase) in receivable on futures contracts |
— | 603,833 | 4,920,888 | |||||||||
| Increase (Decrease) in management fee payable |
100,052 | 289,792 | 68,716 | |||||||||
| Increase (Decrease) in payable on futures contracts |
(29,599,748 | ) | 31,020,019 | — | ||||||||
|
|
|
|
|
|
|
|||||||
| Net cash provided by (used in) operating activities |
(65,062,692 | ) | (313,005,830 | ) | 35,654,447 | |||||||
|
|
|
|
|
|
|
|||||||
| Cash flow from financing activities |
||||||||||||
| Proceeds from addition of shares |
1,393,067,009 | 1,056,547,830 | 542,528,525 | |||||||||
| Payment on shares redeemed |
(1,331,975,560 | ) | (736,573,151 | ) | (578,266,328 | ) | ||||||
|
|
|
|
|
|
|
|||||||
| Net cash provided by (used in) financing activities |
61,091,449 | 319,974,679 | (35,737,803 | ) | ||||||||
|
|
|
|
|
|
|
|||||||
| Net increase (decrease) in cash |
(3,971,243 | ) | 6,968,849 | (83,356 | ) | |||||||
| Cash, beginning of period |
9,122,219 | 2,153,370 | 2,236,726 | |||||||||
|
|
|
|
|
|
|
|||||||
| Cash, end of period |
$ | 5,150,976 | $ | 9,122,219 | $ | 2,153,370 | ||||||
|
|
|
|
|
|
|
|||||||
See accompanying notes to financial statements.
167
Table of Contents
PROSHARES ULTRA VIX SHORT-TERM FUTURES ETF
STATEMENTS OF FINANCIAL CONDITION
| December 31, 2015 | December 31, 2014 | |||||||
| Assets |
||||||||
| Cash |
$ | 9,081,964 | $ | 3,737,292 | ||||
| Segregated cash balances with brokers for futures contracts |
62,348,600 | 116,907,700 | ||||||
| Short-term U.S. government and agency obligations (Note 3) (cost $438,333,277 and $182,641,263, respectively) |
438,357,849 | 182,639,188 | ||||||
| Receivable from capital shares sold |
32,987,472 | 12,549,248 | ||||||
| Receivable on open futures contracts |
17,995,478 | 42,531,441 | ||||||
|
|
|
|
|
|||||
| Total assets |
560,771,363 | 358,364,869 | ||||||
|
|
|
|
|
|||||
| Liabilities and shareholders’ equity |
||||||||
| Liabilities |
||||||||
| Payable for capital shares redeemed |
12,635,235 | 6,272,056 | ||||||
| Management fee payable |
427,388 | 302,860 | ||||||
|
|
|
|
|
|||||
| Total liabilities |
13,062,623 | 6,574,916 | ||||||
|
|
|
|
|
|||||
| Commitments and Contingencies (Note 2) |
||||||||
| Shareholders’ equity |
||||||||
| Shareholders’ equity |
547,708,740 | 351,789,953 | ||||||
|
|
|
|
|
|||||
| Total liabilities and shareholders’ equity |
$ | 560,771,363 | $ | 358,364,869 | ||||
|
|
|
|
|
|||||
| Shares outstanding (Note 1) |
19,502,448 | 2,804,020 | ||||||
|
|
|
|
|
|||||
| Net asset value per share (Note 1) |
$ | 28.08 | $ | 125.46 | ||||
|
|
|
|
|
|||||
| Market value per share (Note 1) (Note 2) |
$ | 28.35 | $ | 125.75 | ||||
|
|
|
|
|
|||||
See accompanying notes to financial statements.
168
Table of Contents
PROSHARES ULTRA VIX SHORT-TERM FUTURES ETF
SCHEDULE OF INVESTMENTS
DECEMBER 31, 2015
| Principal Amount | Value | |||||||
| Short-term U.S. government and agency obligations |
||||||||
| (80% of shareholders’ equity) |
||||||||
| U.S. Treasury Bills: |
||||||||
| 0.000% due 01/07/16 |
$ | 1,000,000 | $ | 999,997 | ||||
| 0.000% due 01/14/16 |
9,071,000 | 9,070,773 | ||||||
| 0.000% due 01/21/16 |
1,327,000 | 1,326,944 | ||||||
| 0.055% due 01/28/16 |
3,000,000 | 2,999,740 | ||||||
| 0.130% due 02/04/16 |
2,385,000 | 2,384,825 | ||||||
| 0.150% due 02/11/16 |
15,718,000 | 15,715,927 | ||||||
| 0.129% due 02/18/16 |
8,386,000 | 8,384,795 | ||||||
| 0.125% due 02/25/16 |
62,257,000 | 62,250,257 | ||||||
| 0.181% due 03/03/16 |
71,491,000 | 71,479,869 | ||||||
| 0.066% due 03/10/16† |
62,525,000 | 62,511,820 | ||||||
| 0.207% due 03/17/16† |
94,427,000 | 94,408,813 | ||||||
| 0.101% due 03/24/16† |
29,399,000 | 29,387,240 | ||||||
| 0.366% due 05/26/16† |
77,557,000 | 77,436,849 | ||||||
|
|
|
|||||||
| Total short-term U.S. government and agency obligations |
||||||||
| (cost $438,333,277) |
$ | 438,357,849 | ||||||
|
|
|
|||||||
Futures Contracts Purchased††
| Number of Contracts |
Notional Amount at Value |
Unrealized Appreciation (Depreciation) |
||||||||||
| VIX Futures - CBOE, expires January 2016 |
29,321 | $ | 543,171,525 | $ | 10,546,019 | |||||||
| VIX Futures - CBOE, expires February 2016 |
29,320 | 553,415,000 | 1,348,447 | |||||||||
|
|
|
|||||||||||
| $ | 11,894,466 | |||||||||||
|
|
|
|||||||||||
| † | All or partial amount pledged as collateral for futures contracts. |
| †† | Cash collateral in the amount of $62,348,600 was pledged to cover margin requirements for open futures contracts as of December 31, 2015. |
See accompanying notes to financial statements.
169
Table of Contents
PROSHARES ULTRA VIX SHORT-TERM FUTURES ETF
SCHEDULE OF INVESTMENTS
DECEMBER 31, 2014
| Principal Amount | Value |
| ||||||||
| Short-term U.S. government and agency obligations |
||||||||||
| (52% of shareholders’ equity) |
||||||||||
| U.S. Treasury Bills: |
||||||||||
| 0.033% due 01/08/15 |
$ | 2,925,000 | $ | 2,924,993 | ||||||
| 0.009% due 01/22/15 |
15,872,000 | 15,871,735 | ||||||||
| 0.010% due 01/29/15 |
12,113,000 | 12,112,818 | ||||||||
| 0.012% due 02/12/15 |
1,436,000 | 1,435,967 | ||||||||
| 0.021% due 02/19/15 |
16,715,000 | 16,714,554 | ||||||||
| 0.014% due 03/05/15 |
12,248,000 | 12,247,684 | ||||||||
| 0.015% due 03/12/15 |
1,602,000 | 1,601,939 | ||||||||
| 0.036% due 04/16/15 |
43,147,000 | 43,143,884 | ||||||||
| 0.061% due 05/14/15 |
14,824,000 | 14,821,554 | ||||||||
| 0.026% due 05/21/15 |
24,222,000 | 24,217,324 | ||||||||
| 0.049% due 05/28/15 |
35,702,000 | 35,693,313 | ||||||||
| 0.030% due 06/11/15 |
1,854,000 | 1,853,423 | ||||||||
|
|
|
|||||||||
| Total short-term U.S. government and agency obligations |
||||||||||
| (cost $182,641,263) |
$ | 182,639,188 | ||||||||
|
|
|
|||||||||
Futures Contracts Purchased††
| Number of Contracts |
Notional Amount at Value |
Unrealized Appreciation (Depreciation) |
||||||||||
| VIX Futures - CBOE, expires January 2015 |
21,092 | $ | 380,183,300 | $ | 22,932,077 | |||||||
| VIX Futures - CBOE, expires February 2015 |
17,586 | 320,497,650 | 16,653,176 | |||||||||
|
|
|
|||||||||||
| $ | 39,585,253 | |||||||||||
|
|
|
|||||||||||
| †† | Cash collateral in the amount of $116,907,700 was pledged to cover margin requirements for open futures contracts as of December 31, 2014. |
See accompanying notes to financial statements.
170
Table of Contents
PROSHARES ULTRA VIX SHORT-TERM FUTURES ETF
STATEMENTS OF OPERATIONS
FOR THE YEARS ENDED DECEMBER 31, 2015, 2014 AND 2013
| Year ended December 31, 2015 |
Year ended December 31, 2014 |
Year ended December 31, 2013 |
||||||||||
| Investment Income |
||||||||||||
| Interest |
$ | 156,187 | $ | 72,700 | $ | 70,016 | ||||||
|
|
|
|
|
|
|
|||||||
| Expenses |
||||||||||||
| Management fee |
4,362,460 | 2,868,337 | 2,555,345 | |||||||||
| Brokerage commissions and fees |
3,203,875 | 2,563,849 | 2,343,432 | |||||||||
|
|
|
|
|
|
|
|||||||
| Total expenses |
7,566,335 | 5,432,186 | 4,898,777 | |||||||||
|
|
|
|
|
|
|
|||||||
| Net investment income (loss) |
(7,410,148 | ) | (5,359,486 | ) | (4,828,761 | ) | ||||||
|
|
|
|
|
|
|
|||||||
| Realized and unrealized gain (loss) on investment activity |
||||||||||||
| Net realized gain (loss) on |
||||||||||||
| Futures contracts |
(392,174,228 | ) | (139,412,525 | ) | (401,363,569 | ) | ||||||
| Swap agreements |
— | — | (4,453,107 | ) | ||||||||
| Short-term U.S. government and agency obligations |
(49,718 | ) | 9,921 | 18,730 | ||||||||
|
|
|
|
|
|
|
|||||||
| Net realized gain (loss) |
(392,223,946 | ) | (139,402,604 | ) | (405,797,946 | ) | ||||||
|
|
|
|
|
|
|
|||||||
| Change in net unrealized appreciation/depreciation on |
||||||||||||
| Futures contracts |
(27,690,787 | ) | 63,595,164 | (26,066,973 | ) | |||||||
| Swap agreements |
— | — | (301,351 | ) | ||||||||
| Short-term U.S. government and agency obligations |
26,647 | (4,701 | ) | 7,062 | ||||||||
|
|
|
|
|
|
|
|||||||
| Change in net unrealized appreciation/depreciation |
(27,664,140 | ) | 63,590,463 | (26,361,262 | ) | |||||||
|
|
|
|
|
|
|
|||||||
| Net realized and unrealized gain (loss) |
(419,888,086 | ) | (75,812,141 | ) | (432,159,208 | ) | ||||||
|
|
|
|
|
|
|
|||||||
| Net income (loss) |
$ | (427,298,234 | ) | $ | (81,171,627 | ) | $ | (436,987,969 | ) | |||
|
|
|
|
|
|
|
|||||||
| Net income (loss) per weighted-average share (Note 1) |
$ | (41.66 | ) | $ | (44.00 | ) | $ | (1,357.88 | ) | |||
|
|
|
|
|
|
|
|||||||
| Weighted-average shares outstanding (Note 1) |
10,257,573 | 1,844,625 | 321,817 | |||||||||
|
|
|
|
|
|
|
|||||||
See accompanying notes to financial statements.
171
Table of Contents
PROSHARES ULTRA VIX SHORT-TERM FUTURES ETF
STATEMENTS OF CHANGES IN SHAREHOLDERS’ EQUITY
FOR THE YEARS ENDED DECEMBER 31, 2015, 2014 AND 2013
| Year ended December 31, 2015 |
Year ended December 31, 2014 |
Year ended December 31, 2013 |
||||||||||
| Shareholders’ equity, beginning of period |
$ | 351,789,953 | $ | 226,233,584 | $ | 84,716,132 | ||||||
| Addition of 72,180,000, 10,215,000 and 1,980,000 shares, respectively (Note 1) |
3,192,766,319 | 1,646,851,705 | 1,958,417,114 | |||||||||
| Redemption of 55,481,572, 8,085,458 and 1,326,563 shares, respectively (Note 1) |
(2,569,549,298 | ) | (1,440,123,709 | ) | (1,379,911,693 | ) | ||||||
|
|
|
|
|
|
|
|||||||
| Net addition (redemption) of 16,698,428, 2,129,542 and 653,437 shares, respectively (Note 1) |
623,217,021 | 206,727,996 | 578,505,421 | |||||||||
|
|
|
|
|
|
|
|||||||
| Net investment income (loss) |
(7,410,148 | ) | (5,359,486 | ) | (4,828,761 | ) | ||||||
| Net realized gain (loss) |
(392,223,946 | ) | (139,402,604 | ) | (405,797,946 | ) | ||||||
| Change in net unrealized appreciation/depreciation |
(27,664,140 | ) | 63,590,463 | (26,361,262 | ) | |||||||
|
|
|
|
|
|
|
|||||||
| Net income (loss) |
(427,298,234 | ) | (81,171,627 | ) | (436,987,969 | ) | ||||||
|
|
|
|
|
|
|
|||||||
| Shareholders’ equity, end of period |
$ | 547,708,740 | $ | 351,789,953 | $ | 226,233,584 | ||||||
|
|
|
|
|
|
|
|||||||
See accompanying notes to financial statements.
172
Table of Contents
PROSHARES ULTRA VIX SHORT-TERM FUTURES ETF
STATEMENTS OF CASH FLOWS
FOR THE YEARS ENDED DECEMBER 31, 2015, 2014 AND 2013
| Year ended December 31, 2015 |
Year ended December 31, 2014 |
Year ended December 31, 2013 |
||||||||||
| Cash flow from operating activities |
||||||||||||
| Net income (loss) |
$ | (427,298,234 | ) | $ | (81,171,627 | ) | $ | (436,987,969 | ) | |||
| Adjustments to reconcile net income (loss) to net cash provided by (used in) operating activities: |
||||||||||||
| Decrease (Increase) in segregated cash balances with brokers for futures contracts |
54,559,100 | (9,805,950 | ) | (68,374,743 | ) | |||||||
| Purchases of short-term U.S. government and agency obligations |
(3,411,109,730 | ) | (2,489,268,812 | ) | (1,990,709,180 | ) | ||||||
| Proceeds from sales or maturities of short-term U.S. government and agency obligations |
3,155,524,185 | 2,416,241,031 | 1,978,712,334 | |||||||||
| Net amortization and accretion on short-term U.S. government and agency obligations |
(156,187 | ) | (72,700 | ) | (70,006 | ) | ||||||
| Net realized gain (loss) on investments |
49,718 | (9,921 | ) | (18,730 | ) | |||||||
| Change in unrealized appreciation/depreciation on investments |
(26,647 | ) | 4,701 | 294,289 | ||||||||
| Decrease (Increase) in receivable on futures contracts |
24,535,963 | (42,531,441 | ) | — | ||||||||
| Increase (Decrease) in management fee payable |
124,528 | 113,369 | 92,830 | |||||||||
| Increase (Decrease) in payable on futures contracts |
— | (3,356,803 | ) | (32,309,932 | ) | |||||||
|
|
|
|
|
|
|
|||||||
| Net cash provided by (used in) operating activities |
(603,797,304 | ) | (209,858,153 | ) | (549,371,107 | ) | ||||||
|
|
|
|
|
|
|
|||||||
| Cash flow from financing activities |
||||||||||||
| Proceeds from addition of shares |
3,172,328,095 | 1,645,206,121 | 1,965,640,739 | |||||||||
| Payment on shares redeemed |
(2,563,186,119 | ) | (1,433,851,653 | ) | (1,415,819,480 | ) | ||||||
|
|
|
|
|
|
|
|||||||
| Net cash provided by (used in) financing activities |
609,141,976 | 211,354,468 | 549,821,259 | |||||||||
|
|
|
|
|
|
|
|||||||
| Net increase (decrease) in cash |
5,344,672 | 1,496,315 | 450,152 | |||||||||
| Cash, beginning of period |
3,737,292 | 2,240,977 | 1,790,825 | |||||||||
|
|
|
|
|
|
|
|||||||
| Cash, end of period |
$ | 9,081,964 | $ | 3,737,292 | $ | 2,240,977 | ||||||
|
|
|
|
|
|
|
|||||||
See accompanying notes to financial statements.
173
Table of Contents
PROSHARES ULTRASHORT BLOOMBERG COMMODITY
STATEMENTS OF FINANCIAL CONDITION
| December 31, 2015 | December 31, 2014 | |||||||
| Assets |
||||||||
| Cash |
$ | 831,440 | $ | 467,766 | ||||
| Short-term U.S. government and agency obligations (Note 3) (cost $7,517,328 and $4,233,396, respectively) |
7,518,119 | 4,233,548 | ||||||
| Unrealized appreciation on swap agreements |
224,491 | 567,259 | ||||||
|
|
|
|
|
|||||
| Total assets |
8,574,050 | 5,268,573 | ||||||
|
|
|
|
|
|||||
| Liabilities and shareholders’ equity |
||||||||
| Liabilities |
||||||||
| Management fee payable |
6,844 | 3,867 | ||||||
| Unrealized depreciation on swap agreements |
53,167 | — | ||||||
|
|
|
|
|
|||||
| Total liabilities |
60,011 | 3,867 | ||||||
|
|
|
|
|
|||||
| Commitments and Contingencies (Note 2) |
||||||||
| Shareholders’ equity |
||||||||
| Shareholders’ equity |
8,514,039 | 5,264,706 | ||||||
|
|
|
|
|
|||||
| Total liabilities and shareholders’ equity |
$ | 8,574,050 | $ | 5,268,573 | ||||
|
|
|
|
|
|||||
| Shares outstanding |
59,997 | 59,997 | ||||||
|
|
|
|
|
|||||
| Net asset value per share |
$ | 141.91 | $ | 87.75 | ||||
|
|
|
|
|
|||||
| Market value per share (Note 2) |
$ | 140.41 | $ | 87.44 | ||||
|
|
|
|
|
|||||
See accompanying notes to financial statements.
174
Table of Contents
PROSHARES ULTRASHORT BLOOMBERG COMMODITY
SCHEDULE OF INVESTMENTS
DECEMBER 31, 2015
| Principal Amount | Value | |||||||
| Short-term U.S. government and agency obligations |
| |||||||
| (88% of shareholders’ equity) |
||||||||
| U.S. Treasury Bills: |
||||||||
| 0.000% due 01/21/16 |
$ | 1,033,000 | $ | 1,032,956 | ||||
| 0.225% due 03/17/16† |
3,653,000 | 3,652,297 | ||||||
| 0.143% due 03/24/16† |
2,834,000 | 2,832,866 | ||||||
|
|
|
|||||||
| Total short-term U.S. government and agency obligations |
||||||||
| (cost $7,517,328) |
$ | 7,518,119 | ||||||
|
|
|
|||||||
Swap Agreements^
| Rate Paid (Received)* |
Termination Date | Notional Amount at Value** |
Unrealized Appreciation (Depreciation) |
|||||||||||||
| Swap agreement with Citibank N.A. based on Bloomberg Commodity Index |
0.18 | % | 01/06/16 | $ | (1,923,025 | ) | $ | (53,167 | ) | |||||||
| Swap agreement with Deutsche Bank AG based on Bloomberg Commodity Index |
0.25 | 01/06/16 | (7,650,954 | ) | 84,161 | |||||||||||
| Swap agreement with Goldman Sachs International based on Bloomberg Commodity Index |
0.25 | 01/06/16 | (4,813,083 | ) | 36,878 | |||||||||||
| Swap agreement with UBS AG based on Bloomberg Commodity Index |
0.60 | 01/06/16 | (2,647,863 | ) | 103,452 | |||||||||||
|
|
|
|||||||||||||||
| $ | 171,324 | |||||||||||||||
|
|
|
|||||||||||||||
| † | All or partial amount pledged as collateral for swap agreements. |
| ^ | The positions and counterparties herein are as of December 31, 2015. The Funds continually evaluate different counterparties for their transactions and counterparties are subject to change. New counterparties can be added at any time. |
| * | Reflects the floating financing rate, as of December 31, 2015, on the notional amount of the swap agreement paid to the counterparty or received from the counterparty, excluding any commissions. |
| ** | For swap agreements, a positive amount represents “long” exposure to the benchmark index. A negative amount represents short” exposure to the benchmark index. |
See accompanying notes to financial statements.
175
Table of Contents
PROSHARES ULTRASHORT BLOOMBERG COMMODITY
SCHEDULE OF INVESTMENTS
DECEMBER 31, 2014
| Principal Amount | Value | |||||||
| Short-term U.S. government and agency obligations |
| |||||||
| (80% of shareholders’ equity) |
||||||||
| U.S. Treasury Bills: |
||||||||
| 0.002% due 01/22/15† |
$ | 618,000 | $ | 617,990 | ||||
| 0.022% due 02/12/15 |
151,000 | 150,997 | ||||||
| 0.020% due 03/05/15† |
457,000 | 456,988 | ||||||
| 0.039% due 04/16/15† |
2,131,000 | 2,130,846 | ||||||
| 0.087% due 06/11/15 |
877,000 | 876,727 | ||||||
|
|
|
|||||||
| Total short-term U.S. government and agency obligations (cost $4,233,396) |
$ | 4,233,548 | ||||||
|
|
|
|||||||
Swap Agreements^
| Rate Paid (Received)* |
Termination Date | Notional Amount at Value** |
Unrealized Appreciation (Depreciation) |
|||||||||||||
| Swap agreement with Deutsche Bank AG based on Bloomberg Commodity Index |
0.25 | % | 01/06/15 | $ | (4,847,743 | ) | $ | 243,474 | ||||||||
| Swap agreement with Goldman Sachs International based on Bloomberg Commodity Index |
0.25 | 01/06/15 | (4,242,243 | ) | 240,271 | |||||||||||
| Swap agreement with UBS AG based on Bloomberg Commodity Index |
0.60 | 01/06/15 | (1,460,197 | ) | 83,514 | |||||||||||
|
|
|
|||||||||||||||
| $ | 567,259 | |||||||||||||||
|
|
|
|||||||||||||||
| † | All or partial amount pledged as collateral for swap agreements. |
| ^ | The positions and counterparties herein are as of December 31, 2014. The Funds continually evaluate different counterparties for their transactions and counterparties are subject to change. New counterparties can be added at any time. |
| * | Reflects the floating financing rate, as of December 31, 2014, on the notional amount of the swap agreement paid to the counterparty or received from the counterparty, excluding any commissions. |
| ** | For swap agreements, a positive amount represents “long” exposure to the benchmark index. A negative amount represents “short” exposure to the benchmark index. |
See accompanying notes to financial statements.
176
Table of Contents
PROSHARES ULTRASHORT BLOOMBERG COMMODITY
STATEMENTS OF OPERATIONS
FOR THE YEARS ENDED DECEMBER 31, 2015, 2014 AND 2013
| Year ended December 31, 2015 |
Year ended December 31, 2014 |
Year ended December 31, 2013 |
||||||||||
| Investment Income |
||||||||||||
| Interest |
$ | 2,698 | $ | 1,232 | $ | 1,899 | ||||||
|
|
|
|
|
|
|
|||||||
| Expenses |
||||||||||||
| Management fee |
59,324 | 35,302 | 34,029 | |||||||||
|
|
|
|
|
|
|
|||||||
| Total expenses |
59,324 | 35,302 | 34,029 | |||||||||
|
|
|
|
|
|
|
|||||||
| Net investment income (loss) |
(56,626 | ) | (34,070 | ) | (32,130 | ) | ||||||
|
|
|
|
|
|
|
|||||||
| Realized and unrealized gain (loss) on investment activity |
||||||||||||
| Net realized gain (loss) on |
||||||||||||
| Swap agreements |
3,701,239 | 906,309 | 760,002 | |||||||||
| Short-term U.S. government and agency obligations |
16 | 3 | 24 | |||||||||
|
|
|
|
|
|
|
|||||||
| Net realized gain (loss) |
3,701,255 | 906,312 | 760,026 | |||||||||
|
|
|
|
|
|
|
|||||||
| Change in net unrealized appreciation/depreciation on |
||||||||||||
| Swap agreements |
(395,935 | ) | 594,924 | (176,167 | ) | |||||||
| Short-term U.S. government and agency obligations |
639 | 113 | (267 | ) | ||||||||
|
|
|
|
|
|
|
|||||||
| Change in net unrealized appreciation/depreciation |
(395,296 | ) | 595,037 | (176,434 | ) | |||||||
|
|
|
|
|
|
|
|||||||
| Net realized and unrealized gain (loss) |
3,305,959 | 1,501,349 | 583,592 | |||||||||
|
|
|
|
|
|
|
|||||||
| Net income (loss) |
$ | 3,249,333 | $ | 1,467,279 | $ | 551,462 | ||||||
|
|
|
|
|
|
|
|||||||
| Net income (loss) per weighted-average share |
$ | 54.16 | $ | 24.46 | $ | 9.19 | ||||||
|
|
|
|
|
|
|
|||||||
| Weighted-average shares outstanding |
59,997 | 59,997 | 59,997 | |||||||||
|
|
|
|
|
|
|
|||||||
See accompanying notes to financial statements.
177
Table of Contents
PROSHARES ULTRASHORT BLOOMBERG COMMODITY
STATEMENTS OF CHANGES IN SHAREHOLDERS’ EQUITY
FOR THE YEARS ENDED DECEMBER 31, 2015, 2014 AND 2013
| Year ended December 31, 2015 |
Year ended December 31, 2014 |
Year ended December 31, 2013 |
||||||||||
| Shareholders’ equity, beginning of period |
$ | 5,264,706 | $ | 3,797,427 | $ | 3,245,965 | ||||||
| Net investment income (loss) |
(56,626 | ) | (34,070 | ) | (32,130 | ) | ||||||
| Net realized gain (loss) |
3,701,255 | 906,312 | 760,026 | |||||||||
| Change in net unrealized appreciation/depreciation |
(395,296 | ) | 595,037 | (176,434 | ) | |||||||
|
|
|
|
|
|
|
|||||||
| Net income (loss) |
3,249,333 | 1,467,279 | 551,462 | |||||||||
|
|
|
|
|
|
|
|||||||
| Shareholders’ equity, end of period |
$ | 8,514,039 | $ | 5,264,706 | $ | 3,797,427 | ||||||
|
|
|
|
|
|
|
|||||||
See accompanying notes to financial statements.
178
Table of Contents
PROSHARES ULTRASHORT BLOOMBERG COMMODITY
STATEMENTS OF CASH FLOWS
FOR THE YEARS ENDED DECEMBER 31, 2015, 2014 AND 2013
| Year ended December 31, 2015 |
Year ended December 31, 2014 |
Year ended December 31, 2013 |
||||||||||
| Cash flow from operating activities |
||||||||||||
| Net income (loss) |
$ | 3,249,333 | $ | 1,467,279 | $ | 551,462 | ||||||
| Adjustments to reconcile net income (loss) to net cash provided by (used in) operating activities: |
||||||||||||
| Purchases of short-term U.S. government and agency obligations |
(16,569,217 | ) | (10,193,241 | ) | (11,125,326 | ) | ||||||
| Proceeds from sales or maturities of short-term U.S. government and agency obligations |
13,287,999 | 9,414,931 | 10,476,996 | |||||||||
| Net amortization and accretion on short-term U.S. government and agency obligations |
(2,698 | ) | (1,232 | ) | (1,899 | ) | ||||||
| Net realized gain (loss) on investments |
(16 | ) | (3 | ) | (24 | ) | ||||||
| Change in unrealized appreciation/depreciation on investments |
395,296 | (595,037 | ) | 176,434 | ||||||||
| Increase (Decrease) in management fee payable |
2,977 | 824 | 483 | |||||||||
|
|
|
|
|
|
|
|||||||
| Net cash provided by (used in) operating activities |
363,674 | 93,521 | 78,126 | |||||||||
|
|
|
|
|
|
|
|||||||
| Net increase (decrease) in cash |
363,674 | 93,521 | 78,126 | |||||||||
| Cash, beginning of period |
467,766 | 374,245 | 296,119 | |||||||||
|
|
|
|
|
|
|
|||||||
| Cash, end of period |
$ | 831,440 | $ | 467,766 | $ | 374,245 | ||||||
|
|
|
|
|
|
|
|||||||
See accompanying notes to financial statements.
179
Table of Contents
PROSHARES ULTRASHORT BLOOMBERG CRUDE OIL
STATEMENTS OF FINANCIAL CONDITION
| December 31, 2015 | December 31, 2014 | |||||||
| Assets |
||||||||
| Cash |
$ | 598,645 | $ | 994,268 | ||||
| Segregated cash balances with brokers for futures contracts |
10,154,430 | 12,292,665 | ||||||
| Short-term U.S. government and agency obligations (Note 3) (cost $79,694,797 and $131,592,367, respectively) |
79,692,642 | 131,594,608 | ||||||
| Unrealized appreciation on swap agreements |
6,412,656 | 27,018,077 | ||||||
| Receivable on open futures contracts |
— | 1,293,531 | ||||||
|
|
|
|
|
|||||
| Total assets |
96,858,373 | 173,193,149 | ||||||
|
|
|
|
|
|||||
| Liabilities and shareholders’ equity |
||||||||
| Liabilities |
||||||||
| Payable for capital shares redeemed |
— | 3,854,654 | ||||||
| Payable on open futures contracts |
850,883 | — | ||||||
| Brokerage commissions and fees payable |
8,453 | — | ||||||
| Management fee payable |
101,143 | 128,385 | ||||||
|
|
|
|
|
|||||
| Total liabilities |
960,479 | 3,983,039 | ||||||
|
|
|
|
|
|||||
| Commitments and Contingencies (Note 2) |
||||||||
| Shareholders’ equity |
||||||||
| Shareholders’ equity |
95,897,894 | 169,210,110 | ||||||
|
|
|
|
|
|||||
| Total liabilities and shareholders’ equity |
$ | 96,858,373 | $ | 173,193,149 | ||||
|
|
|
|
|
|||||
| Shares outstanding |
719,944 | 2,169,944 | ||||||
|
|
|
|
|
|||||
| Net asset value per share |
$ | 133.20 | $ | 77.98 | ||||
|
|
|
|
|
|||||
| Market value per share (Note 2) |
$ | 133.64 | $ | 76.52 | ||||
|
|
|
|
|
|||||
See accompanying notes to financial statements.
180
Table of Contents
PROSHARES ULTRASHORT BLOOMBERG CRUDE OIL
SCHEDULE OF INVESTMENTS
DECEMBER 31, 2015
| Principal Amount | Value | |||||||
| Short-term U.S. government and agency obligations |
| |||||||
| (83% of shareholders’ equity) |
||||||||
| U.S. Treasury Bills: |
||||||||
| 0.080% due 01/07/16 |
$ | 3,329,000 | $ | 3,328,989 | ||||
| 0.020% due 01/21/16 |
21,612,000 | 21,611,082 | ||||||
| 0.026% due 02/04/16 |
5,980,000 | 5,979,562 | ||||||
| 0.180% due 02/18/16† |
5,106,000 | 5,105,266 | ||||||
| 0.000% due 02/25/16† |
14,974,000 | 14,972,378 | ||||||
| 0.200% due 03/10/16 |
2,835,000 | 2,834,403 | ||||||
| 0.172% due 03/17/16† |
2,372,000 | 2,371,543 | ||||||
| 0.176% due 03/24/16† |
14,653,000 | 14,647,139 | ||||||
| 0.353% due 05/26/16† |
8,856,000 | 8,842,280 | ||||||
|
|
|
|||||||
| Total short-term U.S. government and agency obligations |
||||||||
| (cost $79,694,797) |
$ | 79,692,642 | ||||||
|
|
|
|||||||
Futures Contracts Sold††
| Number of Contracts |
Notional Amount at Value |
Unrealized Appreciation (Depreciation) |
||||||||||
| Crude Oil - NYMEX, expires March 2016 |
2,367 | $ | 90,348,390 | $ | 2,464,513 | |||||||
Swap Agreements^
| Rate Paid (Received)* |
Termination Date | Notional Amount at Value** |
Unrealized Appreciation (Depreciation) |
|||||||||||||
| Swap agreement with Citibank N.A. based on Bloomberg Crude Oil Subindex |
0.18 | % | 01/06/16 | $ | (19,234,533 | ) | $ | 1,098,278 | ||||||||
| Swap agreement with Deutsche Bank AG based on Bloomberg Crude Oil Subindex |
0.25 | 01/06/16 | (29,881,854 | ) | 1,722,894 | |||||||||||
| Swap agreement with Goldman Sachs International based on Bloomberg Crude Oil Subindex |
0.25 | 01/06/16 | (17,799,590 | ) | 1,595,552 | |||||||||||
| Swap agreement with Societe Generale S.A. based on Bloomberg Crude Oil Subindex |
0.25 | 01/06/16 | (8,303,436 | ) | 521,142 | |||||||||||
| Swap agreement with UBS AG based on Bloomberg Crude Oil Subindex |
0.25 | 01/06/16 | (26,258,293 | ) | 1,474,790 | |||||||||||
|
|
|
|||||||||||||||
| $ | 6,412,656 | |||||||||||||||
|
|
|
|||||||||||||||
| † | All or partial amount pledged as collateral for swap agreements and/or futures contracts. |
| †† | Cash collateral in the amount of $10,154,430 was pledged to cover margin requirements for open futures contracts as of December 31, 2015. |
| ^ | The positions and counterparties herein are as of December 31, 2015. The Funds continually evaluate different counterparties for their transactions and counterparties are subject to change. New counterparties can be added at any time. |
| * | Reflects the floating financing rate, as of December 31, 2015, on the notional amount of the swap agreement paid to the counterparty or received from the counterparty, excluding any commissions. |
| ** | For swap agreements, a positive amount represents “long” exposure to the benchmark index. A negative amount represents “short” exposure to the benchmark index. |
See accompanying notes to financial statements.
181
Table of Contents
PROSHARES ULTRASHORT BLOOMBERG CRUDE OIL
SCHEDULE OF INVESTMENTS
DECEMBER 31, 2014
| Principal Amount | Value | |||||||||||
| Short-term U.S. government and agency obligations |
|
|||||||||||
| (78% of shareholders’ equity) |
||||||||||||
| U.S. Treasury Bills: |
||||||||||||
| 0.051% due 01/08/15 |
$ | 7,520,000 | $7,519,981 | |||||||||
| 0.010% due 01/22/15 |
8,188,000 | 8,187,864 | ||||||||||
| 0.014% due 02/12/15† |
4,424,000 | 4,423,899 | ||||||||||
| 0.024% due 02/19/15† |
3,423,000 | 3,422,909 | ||||||||||
| 0.023% due 03/05/15† |
8,064,000 | 8,063,792 | ||||||||||
| 0.021% due 03/12/15† |
7,534,000 | 7,533,711 | ||||||||||
| 0.041% due 04/16/15† |
8,635,000 | 8,634,376 | ||||||||||
| 0.044% due 04/30/15† |
27,059,000 | 27,055,452 | ||||||||||
| 0.064% due 05/14/15 |
25,974,000 | 25,969,714 | ||||||||||
| 0.061% due 05/21/15 |
3,842,000 | 3,841,258 | ||||||||||
| 0.073% due 05/28/15† |
2,920,000 | 2,919,290 | ||||||||||
| 0.072% due 06/04/15† |
21,246,000 | 21,239,228 | ||||||||||
| 0.030% due 06/11/15 |
2,784,000 | 2,783,134 | ||||||||||
|
|
|
|||||||||||
| Total short-term U.S. government and agency obligations |
||||||||||||
| (cost $131,592,367) |
$131,594,608 | |||||||||||
|
|
|
|||||||||||
|
Futures Contracts Sold††
|
||||||||||||
| Number of Contracts |
Notional Amount at Value |
Unrealized Appreciation (Depreciation) |
||||||||||
| Crude Oil—NYMEX, expires March 2015 |
2,569 | $ | 137,955,300 | $ | 15,806,603 | |||||||
Swap Agreements^
| Rate Paid (Received)* |
Termination Date | Notional Amount at Value** |
Unrealized Appreciation (Depreciation) |
|||||||||||||
| Swap agreement with Deutsche Bank AG based on Bloomberg WTI Crude Oil Subindex |
0.25 | % | 01/06/15 | $ | (66,394,305 | ) | $ | 7,669,493 | ||||||||
| Swap agreement with Goldman Sachs International based on Bloomberg WTI Crude Oil Subindex |
0.25 | 01/06/15 | (57,892,826 | ) | 8,362,336 | |||||||||||
| Swap agreement with Societe Generale S.A. based on Bloomberg WTI Crude Oil Subindex |
0.25 | 01/06/15 | (21,413,784 | ) | 2,132,657 | |||||||||||
| Swap agreement with UBS AG based on Bloomberg WTI Crude Oil Subindex |
0.25 | 01/06/15 | (54,735,210 | ) | 8,853,591 | |||||||||||
|
|
|
|||||||||||||||
| $ | 27,018,077 | |||||||||||||||
|
|
|
|||||||||||||||
| † | All or partial amount pledged as collateral for swap agreements. |
| †† | Cash collateral in the amount of $12,292,665 was pledged to cover margin requirements for open futures contracts as of December 31, 2014. |
| ^ | The positions and counterparties herein are as of December 31, 2014. The Funds continually evaluate different counterparties for their transactions and counterparties are subject to change. New counterparties can be added at any time. |
| * | Reflects the floating financing rate, as of December 31, 2014, on the notional amount of the swap agreement paid to the counterparty or received from the counterparty, excluding any commissions. |
| ** | For swap agreements, a positive amount represents “long” exposure to the benchmark index. A negative amount represents “short” exposure to the benchmark index. |
See accompanying notes to financial statements.
182
Table of Contents
PROSHARES ULTRASHORT BLOOMBERG CRUDE OIL
STATEMENTS OF OPERATIONS
FOR THE YEARS ENDED DECEMBER 31, 2015, 2014 AND 2013
| Year ended December 31, 2015 |
Year ended December 31, 2014 |
Year ended December 31, 2013 |
||||||||||
| Investment Income |
||||||||||||
| Interest |
$ | 60,884 | $ | 110,620 | $ | 113,487 | ||||||
|
|
|
|
|
|
|
|||||||
| Expenses |
||||||||||||
| Management fee |
1,978,613 | 2,448,428 | 2,581,084 | |||||||||
| Brokerage commissions and fees |
248,482 | 78,033 | 77,031 | |||||||||
|
|
|
|
|
|
|
|||||||
| Total expenses |
2,227,095 | 2,526,461 | 2,658,115 | |||||||||
|
|
|
|
|
|
|
|||||||
| Net investment income (loss) |
(2,166,211 | ) | (2,415,841 | ) | (2,544,628 | ) | ||||||
|
|
|
|
|
|
|
|||||||
| Realized and unrealized gain (loss) on investment activity |
||||||||||||
| Net realized gain (loss) on |
||||||||||||
| Futures contracts |
46,904,474 | 44,472,509 | (4,299,671 | ) | ||||||||
| Swap agreements |
44,765,850 | 54,854,588 | (8,005,328 | ) | ||||||||
| Short-term U.S. government and agency obligations |
14,458 | 20,701 | 5,188 | |||||||||
|
|
|
|
|
|
|
|||||||
| Net realized gain (loss) |
91,684,782 | 99,347,798 | (12,299,811 | ) | ||||||||
|
|
|
|
|
|
|
|||||||
| Change in net unrealized appreciation/depreciation on |
||||||||||||
| Futures contracts |
(13,342,090 | ) | 17,039,376 | 2,796,948 | ||||||||
| Swap agreements |
(20,605,421 | ) | 29,350,977 | 3,274,160 | ||||||||
| Short-term U.S. government and agency obligations |
(4,396 | ) | (8,704 | ) | 6,876 | |||||||
|
|
|
|
|
|
|
|||||||
| Change in net unrealized appreciation/depreciation |
(33,951,907 | ) | 46,381,649 | 6,077,984 | ||||||||
|
|
|
|
|
|
|
|||||||
| Net realized and unrealized gain (loss) |
57,732,875 | 145,729,447 | (6,221,827 | ) | ||||||||
|
|
|
|
|
|
|
|||||||
| Net income (loss) |
$ | 55,566,664 | $ | 143,313,606 | $ | (8,766,455 | ) | |||||
|
|
|
|
|
|
|
|||||||
| Net income (loss) per weighted-average share |
$ | 20.13 | $ | 16.45 | $ | (1.05 | ) | |||||
|
|
|
|
|
|
|
|||||||
| Weighted-average shares outstanding |
2,760,218 | 8,711,177 | 8,388,848 | |||||||||
|
|
|
|
|
|
|
|||||||
See accompanying notes to financial statements.
183
Table of Contents
PROSHARES ULTRASHORT BLOOMBERG CRUDE OIL
STATEMENTS OF CHANGES IN SHAREHOLDERS’ EQUITY
FOR THE YEARS ENDED DECEMBER 31, 2015, 2014 AND 2013
| Year ended December 31, 2015 |
Year ended December 31, 2014 |
Year ended December 31, 2013 |
||||||||||
| Shareholders’ equity, beginning of period |
$ | 169,210,110 | $ | 256,060,149 | $ | 89,481,266 | ||||||
| Addition of 10,800,000, 15,700,000 and 23,300,000 shares, respectively |
796,070,368 | 474,919,955 | 764,617,811 | |||||||||
| Redemption of 12,250,000, 21,600,000 and 17,450,000 shares, respectively |
(924,949,248 | ) | (705,083,600 | ) | (589,272,473 | ) | ||||||
|
|
|
|
|
|
|
|||||||
| Net addition (redemption) of (1,450,000), (5,900,000) and 5,850,000 shares, respectively |
(128,878,880 | ) | (230,163,645 | ) | 175,345,338 | |||||||
| Net investment income (loss) |
(2,166,211 | ) | (2,415,841 | ) | (2,544,628 | ) | ||||||
| Net realized gain (loss) |
91,684,782 | 99,347,798 | (12,299,811 | ) | ||||||||
| Change in net unrealized appreciation/depreciation |
(33,951,907 | ) | 46,381,649 | 6,077,984 | ||||||||
|
|
|
|
|
|
|
|||||||
| Net income (loss) |
55,566,664 | 143,313,606 | (8,766,455 | ) | ||||||||
|
|
|
|
|
|
|
|||||||
| Shareholders’ equity, end of period |
$ | 95,897,894 | $ | 169,210,110 | $ | 256,060,149 | ||||||
|
|
|
|
|
|
|
|||||||
See accompanying notes to financial statements.
184
Table of Contents
PROSHARES ULTRASHORT BLOOMBERG CRUDE OIL
STATEMENTS OF CASH FLOWS
FOR THE YEARS ENDED DECEMBER 31, 2015, 2014 AND 2013
| Year ended December 31, 2015 |
Year ended December 31, 2014 |
Year ended December 31, 2013 |
||||||||||
| Cash flow from operating activities |
||||||||||||
| Net income (loss) |
$ | 55,566,664 | $ | 143,313,606 | $ | (8,766,455 | ) | |||||
| Adjustments to reconcile net income (loss) to net cash provided by (used in) operating activities: |
||||||||||||
| Decrease (Increase) in segregated cash balances with brokers for futures contracts |
2,138,235 | (4,659,270 | ) | (3,232,021 | ) | |||||||
| Purchases of short-term U.S. government and agency obligations |
(1,238,357,695 | ) | (1,127,199,240 | ) | (1,381,886,204 | ) | ||||||
| Proceeds from sales or maturities of short-term U.S. government and agency obligations |
1,290,330,607 | 1,243,311,872 | 1,221,473,521 | |||||||||
| Net amortization and accretion on short-term U.S. government and agency obligations |
(60,884 | ) | (110,620 | ) | (113,487 | ) | ||||||
| Net realized gain (loss) on investments |
(14,458 | ) | (20,701 | ) | (5,188 | ) | ||||||
| Change in unrealized appreciation/depreciation on investments |
20,609,817 | (29,342,273 | ) | (3,281,036 | ) | |||||||
| Decrease (Increase) in receivable on futures contracts |
1,293,531 | 210,412 | (1,503,943 | ) | ||||||||
| Increase (Decrease) in management fee payable |
(27,242 | ) | (73,442 | ) | 131,573 | |||||||
| Increase (Decrease) in brokerage commissions and fees payable |
8,453 | — | — | |||||||||
| Increase (Decrease) in payable on futures contracts |
850,883 | — | (979,336 | ) | ||||||||
|
|
|
|
|
|
|
|||||||
| Net cash provided by (used in) operating activities |
132,337,911 | 225,430,344 | (178,162,576 | ) | ||||||||
|
|
|
|
|
|
|
|||||||
| Cash flow from financing activities |
||||||||||||
| Proceeds from addition of shares |
796,070,368 | 474,919,955 | 768,649,288 | |||||||||
| Payment on shares redeemed |
(928,803,902 | ) | (701,228,946 | ) | (589,272,473 | ) | ||||||
|
|
|
|
|
|
|
|||||||
| Net cash provided by (used in) financing activities |
(132,733,534 | ) | (226,308,991 | ) | 179,376,815 | |||||||
|
|
|
|
|
|
|
|||||||
| Net increase (decrease) in cash |
(395,623 | ) | (878,647 | ) | 1,214,239 | |||||||
| Cash, beginning of period |
994,268 | 1,872,915 | 658,676 | |||||||||
|
|
|
|
|
|
|
|||||||
| Cash, end of period |
$ | 598,645 | $ | 994,268 | $ | 1,872,915 | ||||||
|
|
|
|
|
|
|
|||||||
See accompanying notes to financial statements.
185
Table of Contents
PROSHARES ULTRASHORT BLOOMBERG NATURAL GAS
STATEMENTS OF FINANCIAL CONDITION
| December 31, 2015 | December 31, 2014 | |||||||
| Assets |
||||||||
| Cash |
$ | 1,099,140 | $ | 696,743 | ||||
| Segregated cash balances with brokers for futures contracts |
2,046,660 | 4,405,830 | ||||||
| Short-term U.S. government and agency obligations (Note 3) (cost $8,114,653 and $8,672,527, respectively) |
8,115,004 | 8,672,710 | ||||||
| Receivable on open futures contracts |
— | 923,531 | ||||||
|
|
|
|
|
|||||
| Total assets |
11,260,804 | 14,698,814 | ||||||
|
|
|
|
|
|||||
| Liabilities and shareholders’ equity |
||||||||
| Liabilities |
||||||||
| Payable on open futures contracts |
785,170 | — | ||||||
| Brokerage commissions and fees payable |
1,908 | — | ||||||
| Management fee payable |
10,870 | 10,250 | ||||||
|
|
|
|
|
|||||
| Total liabilities |
797,948 | 10,250 | ||||||
|
|
|
|
|
|||||
| Commitments and Contingencies (Note 2) |
||||||||
| Shareholders’ equity |
||||||||
| Shareholders’ equity |
10,462,856 | 14,688,564 | ||||||
|
|
|
|
|
|||||
| Total liabilities and shareholders’ equity |
$ | 11,260,804 | $ | 14,698,814 | ||||
|
|
|
|
|
|||||
| Shares outstanding |
74,952 | 174,952 | ||||||
|
|
|
|
|
|||||
| Net asset value per share |
$ | 139.59 | $ | 83.96 | ||||
|
|
|
|
|
|||||
| Market value per share (Note 2) |
$ | 139.66 | $ | 82.03 | ||||
|
|
|
|
|
|||||
See accompanying notes to financial statements.
186
Table of Contents
PROSHARES ULTRASHORT BLOOMBERG NATURAL GAS
SCHEDULE OF INVESTMENTS
DECEMBER 31, 2015
| Principal Amount | Value | |||||||
| Short-term U.S. government and agency obligations |
| |||||||
| (78% of shareholders’ equity) |
||||||||
| U.S. Treasury Bills: |
||||||||
| 0.233% due 03/17/16 |
$ | 814,000 | $ | 813,843 | ||||
| 0.185% due 03/24/16 |
1,294,000 | 1,293,482 | ||||||
| 0.386% due 05/26/16 |
6,017,000 | 6,007,679 | ||||||
|
|
|
|||||||
| Total short-term U.S. government and agency obligations |
||||||||
| (cost $8,114,653) |
$ | 8,115,004 | ||||||
|
|
|
|||||||
Futures Contracts Sold††
| Number of Contracts |
Notional Amount at Value |
Unrealized Appreciation (Depreciation) |
||||||||||
| Natural Gas - NYMEX, expires March 2016 |
886 | $ | 20,936,180 | $ | (2,471,164 | ) | ||||||
| †† | Cash collateral in the amount of $2,046,660 was pledged to cover margin requirements for open futures contracts as of December 31, 2015. |
See accompanying notes to financial statements.
187
Table of Contents
PROSHARES ULTRASHORT BLOOMBERG NATURAL GAS
SCHEDULE OF INVESTMENTS
DECEMBER 31, 2014
| Principal Amount | Value | |||||||
| Short-term U.S. government and agency obligations |
| |||||||
| (59% of shareholders’ equity) |
||||||||
| U.S. Treasury Bills: |
||||||||
| 0.010% due 02/12/15 |
$ | 129,000 | $ | 128,997 | ||||
| 0.021% due 02/19/15 |
717,000 | 716,981 | ||||||
| 0.041% due 04/16/15 |
1,190,000 | 1,189,914 | ||||||
| 0.056% due 04/30/15 |
790,000 | 789,897 | ||||||
| 0.061% due 05/14/15 |
3,398,000 | 3,397,439 | ||||||
| 0.035% due 05/21/15 |
2,093,000 | 2,092,596 | ||||||
| 0.073% due 06/04/15 |
357,000 | 356,886 | ||||||
|
|
|
|||||||
| Total short-term U.S. government and agency obligations |
||||||||
| (cost $8,672,527) |
$ | 8,672,710 | ||||||
|
|
|
|||||||
Futures Contracts Sold††
| Number of Contracts |
Notional Amount at Value |
Unrealized Appreciation (Depreciation) |
||||||||||
| Natural Gas—NYMEX, expires March 2015 |
1,014 | $ | 29,365,440 | $ | 3,941,465 | |||||||
| †† | Cash collateral in the amount of $4,405,830 was pledged to cover margin requirements for open futures contracts as of December 31, 2014. |
See accompanying notes to financial statements.
188
Table of Contents
PROSHARES ULTRASHORT BLOOMBERG NATURAL GAS
STATEMENTS OF OPERATIONS
FOR THE YEARS ENDED DECEMBER 31, 2015, 2014 AND 2013
| Year ended December 31, 2015 |
Year ended December 31, 2014 |
Year ended December 31, 2013 |
||||||||||
| Investment Income |
||||||||||||
| Interest |
$ | 5,830 | $ | 16,306 | $ | 8,620 | ||||||
|
|
|
|
|
|
|
|||||||
| Expenses |
||||||||||||
| Management fee |
112,277 | 385,014 | 172,542 | |||||||||
| Brokerage commissions and fees |
70,677 | 92,199 | 45,438 | |||||||||
|
|
|
|
|
|
|
|||||||
| Total expenses |
182,954 | 477,213 | 217,980 | |||||||||
|
|
|
|
|
|
|
|||||||
| Net investment income (loss) |
(177,124 | ) | (460,907 | ) | (209,360 | ) | ||||||
|
|
|
|
|
|
|
|||||||
| Realized and unrealized gain (loss) on investment activity |
||||||||||||
| Net realized gain (loss) on |
||||||||||||
| Futures contracts |
15,212,804 | 8,791,719 | (2,585,514 | ) | ||||||||
| Short-term U.S. government and agency obligations |
29 | 5,163 | 619 | |||||||||
|
|
|
|
|
|
|
|||||||
| Net realized gain (loss) |
15,212,833 | 8,796,882 | (2,584,895 | ) | ||||||||
|
|
|
|
|
|
|
|||||||
| Change in net unrealized appreciation/depreciation on |
||||||||||||
| Futures contracts |
(6,412,629 | ) | 2,899,165 | 633,165 | ||||||||
| Short-term U.S. government and agency obligations |
168 | 72 | (422 | ) | ||||||||
|
|
|
|
|
|
|
|||||||
| Change in net unrealized appreciation/depreciation |
(6,412,461 | ) | 2,899,237 | 632,743 | ||||||||
|
|
|
|
|
|
|
|||||||
| Net realized and unrealized gain (loss) |
8,800,372 | 11,696,119 | (1,952,152 | ) | ||||||||
|
|
|
|
|
|
|
|||||||
| Net income (loss) |
$ | 8,623,248 | $ | 11,235,212 | $ | (2,161,512 | ) | |||||
|
|
|
|
|
|
|
|||||||
| Net income (loss) per weighted-average share |
$ | 64.82 | $ | 12.09 | $ | (9.52 | ) | |||||
|
|
|
|
|
|
|
|||||||
| Weighted-average shares outstanding |
133,033 | 929,061 | 227,135 | |||||||||
|
|
|
|
|
|
|
|||||||
See accompanying notes to financial statements.
189
Table of Contents
PROSHARES ULTRASHORT BLOOMBERG NATURAL GAS
STATEMENTS OF CHANGES IN SHAREHOLDERS’ EQUITY
FOR THE YEARS ENDED DECEMBER 31, 2015, 2014 AND 2013
| Year ended December 31, 2015 |
Year ended December 31, 2014 |
Year ended December 31, 2013 |
||||||||||
| Shareholders’ equity, beginning of period |
$ | 14,688,564 | $ | 22,734,767 | $ | 12,768,340 | ||||||
| Addition of 450,000, 2,850,000 and 587,500 shares, respectively |
37,204,187 | 119,491,987 | 43,490,786 | |||||||||
| Redemption of 550,000, 3,000,000 and 387,556 shares, respectively |
(50,053,143 | ) | (138,773,402 | ) | (31,362,847 | ) | ||||||
|
|
|
|
|
|
|
|||||||
| Net addition (redemption) of (100,000), (150,000) and 199,944 shares, respectively |
(12,848,956 | ) | (19,281,415 | ) | 12,127,939 | |||||||
|
|
|
|
|
|
|
|||||||
| Net investment income (loss) |
(177,124 | ) | (460,907 | ) | (209,360 | ) | ||||||
| Net realized gain (loss) |
15,212,833 | 8,796,882 | (2,584,895 | ) | ||||||||
| Change in net unrealized appreciation/depreciation |
(6,412,461 | ) | 2,899,237 | 632,743 | ||||||||
|
|
|
|
|
|
|
|||||||
| Net income (loss) |
8,623,248 | 11,235,212 | (2,161,512 | ) | ||||||||
|
|
|
|
|
|
|
|||||||
| Shareholders’ equity, end of period |
$ | 10,462,856 | $ | 14,688,564 | $ | 22,734,767 | ||||||
|
|
|
|
|
|
|
|||||||
See accompanying notes to financial statements.
190
Table of Contents
PROSHARES ULTRASHORT BLOOMBERG NATURAL GAS
STATEMENTS OF CASH FLOWS
FOR THE YEARS ENDED DECEMBER 31, 2015, 2014 AND 2013
| Year ended December 31, 2015 |
Year ended December 31, 2014 |
Year ended December 31, 2013 |
||||||||||
| Cash flow from operating activities |
||||||||||||
| Net income (loss) |
$ | 8,623,248 | $ | 11,235,212 | $ | (2,161,512 | ) | |||||
| Adjustments to reconcile net income (loss) to net cash provided by (used in) operating activities: |
||||||||||||
| Decrease (Increase) in segregated cash balances with brokers for futures contracts |
2,359,170 | (2,021,030 | ) | (589,770 | ) | |||||||
| Purchases of short-term U.S. government and agency obligations |
(59,678,558 | ) | (208,007,837 | ) | (111,087,096 | ) | ||||||
| Proceeds from sales or maturities of short-term U.S. government and agency obligations |
60,242,291 | 217,631,381 | 102,863,931 | |||||||||
| Net amortization and accretion on short-term U.S. government and agency obligations |
(5,830 | ) | (16,306 | ) | (8,620 | ) | ||||||
| Net realized gain (loss) on investments |
(29 | ) | (5,163 | ) | (619 | ) | ||||||
| Change in unrealized appreciation/depreciation on investments |
(168 | ) | (72 | ) | 422 | |||||||
| Decrease (Increase) in receivable on futures contracts |
923,531 | 597,017 | (887,771 | ) | ||||||||
| Increase (Decrease) in management fee payable |
620 | 309 | (2,317 | ) | ||||||||
| Increase (Decrease) in brokerage commissions and fees payable |
1,908 | — | — | |||||||||
| Increase (Decrease) in payable on futures contracts |
785,170 | — | — | |||||||||
|
|
|
|
|
|
|
|||||||
| Net cash provided by (used in) operating activities |
13,251,353 | 19,413,511 | (11,873,352 | ) | ||||||||
|
|
|
|
|
|
|
|||||||
| Cash flow from financing activities |
||||||||||||
| Proceeds from addition of shares |
37,204,187 | 119,491,987 | 43,490,786 | |||||||||
| Payment on shares redeemed |
(50,053,143 | ) | (138,773,402 | ) | (31,362,847 | ) | ||||||
|
|
|
|
|
|
|
|||||||
| Net cash provided by (used in) financing activities |
(12,848,956 | ) | (19,281,415 | ) | 12,127,939 | |||||||
|
|
|
|
|
|
|
|||||||
| Net increase (decrease) in cash |
402,397 | 132,096 | 254,587 | |||||||||
| Cash, beginning of period |
696,743 | 564,647 | 310,060 | |||||||||
|
|
|
|
|
|
|
|||||||
| Cash, end of period |
$ | 1,099,140 | $ | 696,743 | $ | 564,647 | ||||||
|
|
|
|
|
|
|
|||||||
See accompanying notes to financial statements.
191
Table of Contents
STATEMENTS OF FINANCIAL CONDITION
| December 31, 2015 | December 31, 2014 | |||||||
| Assets |
||||||||
| Cash |
$ | 151,638 | $ | 162,434 | ||||
| Segregated cash balances with brokers for futures contracts |
91,250 | 8,800 | ||||||
| Short-term U.S. government and agency obligations (Note 3) (cost $72,981,653 and $84,038,905, respectively) |
72,979,905 | 84,040,107 | ||||||
| Unrealized appreciation on forward agreements |
1,808,942 | — | ||||||
| Receivable on open futures contracts |
— | 3,260 | ||||||
|
|
|
|
|
|||||
| Total assets |
75,031,735 | 84,214,601 | ||||||
|
|
|
|
|
|||||
| Liabilities and shareholders’ equity |
||||||||
| Liabilities |
||||||||
| Payable on open futures contracts |
80 | — | ||||||
| Management fee payable |
59,891 | 70,061 | ||||||
| Unrealized depreciation on forward agreements |
— | 2,282,778 | ||||||
|
|
|
|
|
|||||
| Total liabilities |
59,971 | 2,352,839 | ||||||
|
|
|
|
|
|||||
| Commitments and Contingencies (Note 2) |
||||||||
| Shareholders’ equity |
||||||||
| Shareholders’ equity |
74,971,764 | 81,861,762 | ||||||
|
|
|
|
|
|||||
| Total liabilities and shareholders’ equity |
$ | 75,031,735 | $ | 84,214,601 | ||||
|
|
|
|
|
|||||
| Shares outstanding |
646,978 | 846,978 | ||||||
|
|
|
|
|
|||||
| Net asset value per share |
$ | 115.88 | $ | 96.65 | ||||
|
|
|
|
|
|||||
| Market value per share (Note 2) |
$ | 115.83 | $ | 100.22 | ||||
|
|
|
|
|
|||||
See accompanying notes to financial statements.
192
Table of Contents
PROSHARES ULTRASHORT GOLD
SCHEDULE OF INVESTMENTS
DECEMBER 31, 2015
| Principal Amount | Value | |||||||||||
| Short-term U.S. government and agency obligations |
|
|||||||||||
| (97% of shareholders’ equity) |
||||||||||||
| U.S. Treasury Bills: |
||||||||||||
| 0.135% due 01/07/16† |
$ | 10,805,000 | $10,804,964 | |||||||||
| 0.040% due 01/14/16† |
30,298,000 | 30,297,243 | ||||||||||
| 0.043% due 01/21/16 |
6,940,000 | 6,939,705 | ||||||||||
| 0.000% due 02/25/16† |
10,734,000 | 10,732,837 | ||||||||||
| 0.210% due 03/03/16 |
1,742,000 | 1,741,729 | ||||||||||
| 0.070% due 03/10/16† |
4,806,000 | 4,804,987 | ||||||||||
| 0.181% due 03/17/16† |
500,000 | 499,904 | ||||||||||
| 0.203% due 03/24/16† |
2,297,000 | 2,296,081 | ||||||||||
| 0.353% due 05/26/16† |
4,870,000 | 4,862,455 | ||||||||||
|
|
|
|||||||||||
| Total short-term U.S. government and agency obligations |
||||||||||||
| (cost $72,981,653) |
$72,979,905 | |||||||||||
|
|
|
|||||||||||
|
Futures Contracts Sold††
|
||||||||||||
| Number of Contracts |
Notional Amount at Value |
Unrealized Appreciation (Depreciation) |
||||||||||
|
|
|
|||||||||||
| Gold Futures—COMEX, expires February 2016 |
2 | $ | 212,040 | $ | 5,220 | |||||||
Forward Agreements^
| Rate Paid (Received)* |
Settlement Date | Commitment to (Deliver)/Receive |
Notional Amount at Value** |
Unrealized Appreciation (Depreciation) |
||||||||||||||||
| Forward agreements with Citibank N.A. based on 0.995 Fine Troy Ounce Gold |
0.50 | % | 01/06/16 | $ | (6,500 | ) | $ | (6,889,740 | ) | $ | 3,915 | |||||||||
| Forward agreements with Deutsche Bank AG based on 0.995 Fine Troy Ounce Gold |
0.25 | 01/06/16 | (68,100 | ) | (72,186,681 | ) | 1,046,664 | |||||||||||||
| Forward agreements with Goldman Sachs International based on 0.995 Fine Troy Ounce Gold |
0.60 | 01/06/16 | (26,298 | ) | (27,874,828 | ) | 158,827 | |||||||||||||
| Forward agreements with Societe Generale S.A. based on 0.995 Fine Troy Ounce Gold |
0.74 | 01/06/16 | (14,000 | ) | (14,839,440 | ) | 212,680 | |||||||||||||
| Forward agreements with UBS AG based on 0.995 Fine Troy Ounce Gold |
0.61 | 01/06/16 | (26,350 | ) | (27,929,946 | ) | 386,856 | |||||||||||||
|
|
|
|||||||||||||||||||
| $ | 1,808,942 | |||||||||||||||||||
|
|
|
|||||||||||||||||||
| † | All or partial amount pledged as collateral for forward agreements and/or futures contracts. |
| †† | Cash collateral in the amount of $8,250 was pledged to cover margin requirements for open futures contracts as of December 31, 2015. |
| ^ | The positions and counterparties herein are as of December 31, 2015. The Funds continually evaluate different counterparties for their transactions and counterparties are subject to change. New counterparties can be added at any time. |
| * | Reflects the floating financing rate, as of December 31, 2015, on the notional amount of the swap agreement paid to the counterparty or received from the counterparty, excluding any commissions. |
| ** | For forward agreements, a positive amount represents “long” exposure to the underlying commodity. A negative amount represents “short” exposure to the underlying commodity. |
See accompanying notes to financial statements.
193
Table of Contents
PROSHARES ULTRASHORT GOLD
SCHEDULE OF INVESTMENTS
DECEMBER 31, 2014
| Principal Amount | Value | |||||||
| Short-term U.S. government and agency obligations |
| |||||||
| (103% of shareholders’ equity) |
||||||||
| U.S. Treasury Bills: |
||||||||
| 0.051% due 01/08/15† |
$ | 995,000 | $ | 994,998 | ||||
| 0.007% due 01/22/15 |
5,194,000 | 5,193,913 | ||||||
| 0.021% due 02/12/15† |
7,310,000 | 7,309,833 | ||||||
| 0.017% due 02/19/15† |
24,106,000 | 24,105,357 | ||||||
| 0.023% due 03/05/15† |
4,814,000 | 4,813,876 | ||||||
| 0.015% due 03/12/15 |
4,878,000 | 4,877,813 | ||||||
| 0.041% due 04/16/15† |
2,572,000 | 2,571,814 | ||||||
| 0.042% due 04/30/15† |
6,386,000 | 6,385,163 | ||||||
| 0.056% due 05/14/15 |
25,151,000 | 25,146,850 | ||||||
| 0.061% due 05/21/15† |
2,641,000 | 2,640,490 | ||||||
|
|
|
|||||||
| Total short-term U.S. government and agency obligations |
||||||||
| (cost $84,038,905) |
$ | 84,040,107 | ||||||
|
|
|
|||||||
Futures Contracts Sold††
| Number of Contracts |
Notional Amount at Value |
Unrealized Appreciation (Depreciation) |
||||||||||
| Gold Futures—COMEX, expires February 2015 |
2 | $ | 236,820 | $ | (4,520 | ) | ||||||
Forward Agreements^
| Rate Paid (Received)* |
Settlement Date | Commitment to (Deliver)/Receive |
Notional Amount at Value** |
Unrealized Appreciation (Depreciation) |
||||||||||||||||
| Forward agreements with Deutsche Bank AG based on 0.995 Fine Troy Ounce Gold |
0.34 | % | 01/06/15 | $ | (70,900 | ) | $ | (85,504,691 | ) | $ | (1,422,997 | ) | ||||||||
| Forward agreements with Goldman Sachs International based on 0.995 Fine Troy Ounce Gold |
0.44 | 01/06/15 | (26,898 | ) | (32,438,719 | ) | (354,660 | ) | ||||||||||||
| Forward agreements with Societe Generale S.A. based on 0.995 Fine Troy Ounce Gold |
0.54 | 01/06/15 | (13,700 | ) | (16,522,063 | ) | (182,225 | ) | ||||||||||||
| Forward agreements with UBS AG based on 0.995 Fine Troy Ounce Gold |
0.44 | 01/06/15 | (24,050 | ) | (29,004,060 | ) | (322,896 | ) | ||||||||||||
|
|
|
|||||||||||||||||||
| $ | (2,282,778 | ) | ||||||||||||||||||
|
|
|
|||||||||||||||||||
| † | All or partial amount pledged as collateral for forward agreements. |
| †† | Cash collateral in the amount of $8,800 was pledged to cover margin requirements for open futures contracts as of December 31, 2014. |
| ^ | The positions and counterparties herein are as of December 31, 2014. The Funds continually evaluate different counterparties for their transactions and counterparties are subject to change. New counterparties can be added at any time. |
| * | Reflects the floating financing rate, as of December 31, 2014, on the notional amount of the forward agreement paid to the counterparty or received from the counterparty, excluding any commissions. |
| ** | For forward agreements, a positive amount represents “long” exposure to the underlying commodity. A negative amount represents “short” exposure to the underlying commodity. |
See accompanying notes to financial statements.
194
Table of Contents
PROSHARES ULTRASHORT GOLD
STATEMENTS OF OPERATIONS
FOR THE YEARS ENDED DECEMBER 31, 2015, 2014 AND 2013
| Year ended December 31, 2015 |
Year ended December 31, 2014 |
Year ended December 31, 2013 |
||||||||||
| Investment Income |
||||||||||||
| Interest |
$ | 31,999 | $ | 40,675 | $ | 61,891 | ||||||
|
|
|
|
|
|
|
|||||||
| Expenses |
||||||||||||
| Management fee |
735,540 | 898,453 | 1,237,712 | |||||||||
| Brokerage commissions and fees |
41 | 39 | 39 | |||||||||
|
|
|
|
|
|
|
|||||||
| Total expenses |
735,581 | 898,492 | 1,237,751 | |||||||||
|
|
|
|
|
|
|
|||||||
| Net investment income (loss) |
(703,582 | ) | (857,817 | ) | (1,175,860 | ) | ||||||
|
|
|
|
|
|
|
|||||||
| Realized and unrealized gain (loss) on investment activity |
||||||||||||
| Net realized gain (loss) on |
||||||||||||
| Futures contracts |
15,950 | 23,310 | 97,060 | |||||||||
| Forward agreements |
12,691,685 | (5,339,792 | ) | 61,027,349 | ||||||||
| Short-term U.S. government and agency obligations |
1,301 | 3,873 | (1,351 | ) | ||||||||
|
|
|
|
|
|
|
|||||||
| Net realized gain (loss) |
12,708,936 | (5,312,609 | ) | 61,123,058 | ||||||||
|
|
|
|
|
|
|
|||||||
| Change in net unrealized appreciation/depreciation on |
||||||||||||
| Futures contracts |
9,740 | (19,040 | ) | (720 | ) | |||||||
| Forward agreements |
4,091,720 | (7,915,831 | ) | 1,903,197 | ||||||||
| Short-term U.S. government and agency obligations |
(2,950 | ) | 868 | (1,136 | ) | |||||||
|
|
|
|
|
|
|
|||||||
| Change in net unrealized appreciation/depreciation |
4,098,510 | (7,934,003 | ) | 1,901,341 | ||||||||
|
|
|
|
|
|
|
|||||||
| Net realized and unrealized gain (loss) |
16,807,446 | (13,246,612 | ) | 63,024,399 | ||||||||
|
|
|
|
|
|
|
|||||||
| Net income (loss) |
$ | 16,103,864 | $ | (14,104,429 | ) | $ | 61,848,539 | |||||
|
|
|
|
|
|
|
|||||||
| Net income (loss) per weighted-average share |
$ | 20.94 | $ | (13.54 | ) | $ | 39.77 | |||||
|
|
|
|
|
|
|
|||||||
| Weighted-average shares outstanding |
769,032 | 1,041,909 | 1,555,197 | |||||||||
|
|
|
|
|
|
|
|||||||
See accompanying notes to financial statements.
195
Table of Contents
PROSHARES ULTRASHORT GOLD
STATEMENTS OF CHANGES IN SHAREHOLDERS’ EQUITY
FOR THE YEARS ENDED DECEMBER 31, 2015, 2014 AND 2013
| Year ended December 31, 2015 |
Year ended December 31, 2014 |
Year ended December 31, 2013 |
||||||||||
| Shareholders’ equity, beginning of period |
$ | 81,861,762 | $ | 139,436,456 | $ | 92,416,742 | ||||||
| Addition of 150,000, 550,000 and 2,650,000 shares, respectively |
13,383,255 | 51,784,693 | 233,728,116 | |||||||||
| Redemption of 350,000, 1,050,000 and 2,750,000 shares, respectively |
(36,377,117 | ) | (95,254,958 | ) | (248,556,941 | ) | ||||||
|
|
|
|
|
|
|
|||||||
| Net addition (redemption) of (200,000), (500,000) and (100,000) shares, respectively |
(22,993,862 | ) | (43,470,265 | ) | (14,828,825 | ) | ||||||
|
|
|
|
|
|
|
|||||||
| Net investment income (loss) |
(703,582 | ) | (857,817 | ) | (1,175,860 | ) | ||||||
| Net realized gain (loss) |
12,708,936 | (5,312,609 | ) | 61,123,058 | ||||||||
| Change in net unrealized appreciation/depreciation |
4,098,510 | (7,934,003 | ) | 1,901,341 | ||||||||
|
|
|
|
|
|
|
|||||||
| Net income (loss) |
16,103,864 | (14,104,429 | ) | 61,848,539 | ||||||||
|
|
|
|
|
|
|
|||||||
| Shareholders’ equity, end of period |
$ | 74,971,764 | $ | 81,861,762 | $ | 139,436,456 | ||||||
|
|
|
|
|
|
|
|||||||
See accompanying notes to financial statements.
196
Table of Contents
PROSHARES ULTRASHORT GOLD
STATEMENTS OF CASH FLOWS
FOR THE YEARS ENDED DECEMBER 31, 2015, 2014 AND 2013
| Year ended December 31, 2015 |
Year ended December 31, 2014 |
Year ended December 31, 2013 |
||||||||||
| Cash flow from operating activities |
||||||||||||
| Net income (loss) |
$ | 16,103,864 | $ | (14,104,429 | ) | $ | 61,848,539 | |||||
| Adjustments to reconcile net income (loss) to net cash provided by (used in) operating activities: |
||||||||||||
| Decrease (Increase) in segregated cash balances with brokers for futures contracts |
(82,450 | ) | 7,150 | (1,100 | ) | |||||||
| Purchases of short-term U.S. government and agency obligations |
(254,497,395 | ) | (320,898,147 | ) | (678,813,513 | ) | ||||||
| Proceeds from sales or maturities of short-term U.S. government and agency obligations |
265,587,947 | 385,891,756 | 618,459,986 | |||||||||
| Net amortization and accretion on short-term U.S. government and agency obligations |
(31,999 | ) | (40,646 | ) | (61,891 | ) | ||||||
| Net realized gain (loss) on investments |
(1,301 | ) | (3,873 | ) | 1,351 | |||||||
| Change in unrealized appreciation/depreciation on investments |
(4,088,770 | ) | 7,914,963 | (1,902,061 | ) | |||||||
| Decrease (Increase) in receivable on futures contracts |
3,260 | (2,960 | ) | (300 | ) | |||||||
| Increase (Decrease) in management fee payable |
(10,170 | ) | (53,758 | ) | 49,243 | |||||||
| Increase (Decrease) in payable on futures contracts |
80 | — | (3,980 | ) | ||||||||
|
|
|
|
|
|
|
|||||||
| Net cash provided by (used in) operating activities |
22,983,066 | 58,710,056 | (423,726 | ) | ||||||||
|
|
|
|
|
|
|
|||||||
| Cash flow from financing activities |
||||||||||||
| Proceeds from addition of shares |
13,383,255 | 51,784,693 | 233,728,116 | |||||||||
| Payment on shares redeemed |
(36,377,117 | ) | (110,529,962 | ) | (233,281,937 | ) | ||||||
|
|
|
|
|
|
|
|||||||
| Net cash provided by (used in) financing activities |
(22,993,862 | ) | (58,745,269 | ) | 446,179 | |||||||
|
|
|
|
|
|
|
|||||||
| Net increase (decrease) in cash |
(10,796 | ) | (35,213 | ) | 22,453 | |||||||
| Cash, beginning of period |
162,434 | 197,647 | 175,194 | |||||||||
|
|
|
|
|
|
|
|||||||
| Cash, end of period |
$ | 151,638 | $ | 162,434 | $ | 197,647 | ||||||
|
|
|
|
|
|
|
|||||||
See accompanying notes to financial statements.
197
Table of Contents
STATEMENTS OF FINANCIAL CONDITION
| December 31, 2015 | December 31, 2014 | |||||||
| Assets |
||||||||
| Cash |
$ | 514,784 | $ | 207,506 | ||||
| Segregated cash balances with brokers for futures contracts |
11,440 | 14,300 | ||||||
| Short-term U.S. government and agency obligations (Note 3) (cost $50,730,044 and $52,225,712, respectively) |
50,730,230 | 52,226,692 | ||||||
| Unrealized appreciation on forward agreements |
4,778,279 | 799,523 | ||||||
| Receivable on open futures contracts |
390 | 6,770 | ||||||
|
|
|
|
|
|||||
| Total assets |
56,035,123 | 53,254,791 | ||||||
|
|
|
|
|
|||||
| Liabilities and shareholders’ equity |
||||||||
| Liabilities |
||||||||
| Management fee payable |
47,185 | 42,354 | ||||||
| Unrealized depreciation on forward agreements |
— | 204,570 | ||||||
|
|
|
|
|
|||||
| Total liabilities |
47,185 | 246,924 | ||||||
|
|
|
|
|
|||||
| Commitments and Contingencies (Note 2) |
||||||||
| Shareholders’ equity |
||||||||
| Shareholders’ equity |
55,987,938 | 53,007,867 | ||||||
|
|
|
|
|
|||||
| Total liabilities and shareholders’ equity |
$ | 56,035,123 | $ | 53,254,791 | ||||
|
|
|
|
|
|||||
| Shares outstanding (Note 1) |
866,978 | 916,978 | ||||||
|
|
|
|
|
|||||
| Net asset value per share (Note 1) |
$ | 64.58 | $ | 57.81 | ||||
|
|
|
|
|
|||||
| Market value per share (Note 1) (Note 2) |
$ | 64.55 | $ | 59.70 | ||||
|
|
|
|
|
|||||
See accompanying notes to financial statements.
198
Table of Contents
PROSHARES ULTRASHORT SILVER
SCHEDULE OF INVESTMENTS
DECEMBER 31, 2015
| Principal Amount | Value | |||||||
| Short-term U.S. government and agency obligations |
| |||||||
| (91% of shareholders’ equity) |
||||||||
| U.S. Treasury Bills: |
||||||||
| 0.135% due 01/07/16† |
$ | 8,744,000 | $ | 8,743,971 | ||||
| 0.043% due 01/21/16 |
1,641,000 | 1,640,930 | ||||||
| 0.055% due 01/28/16 |
1,000,000 | 999,913 | ||||||
| 0.000% due 02/11/16† |
1,982,000 | 1,981,739 | ||||||
| 0.138% due 02/18/16† |
8,323,000 | 8,321,804 | ||||||
| 0.000% due 02/25/16† |
4,001,000 | 4,000,567 | ||||||
| 0.181% due 03/17/16† |
4,573,000 | 4,572,119 | ||||||
| 0.163% due 03/24/16† |
18,199,000 | 18,191,721 | ||||||
| 0.386% due 05/26/16† |
2,281,000 | 2,277,466 | ||||||
|
|
|
|||||||
| Total short-term U.S. government and agency obligations |
||||||||
| (cost $50,730,044) |
$ | 50,730,230 | ||||||
|
|
|
|||||||
Futures Contracts Sold††
| Number of Contracts |
Notional Amount at Value |
Unrealized Appreciation (Depreciation) |
||||||||||
| Silver Futures—COMEX, expires March 2016 |
2 | $ | 138,030 | $ | 5,970 | |||||||
Forward Agreements^
| Rate Paid (Received)* |
Settlement Date | Commitment to (Deliver)/Receive |
Notional Amount at Value** |
Unrealized Appreciation (Depreciation) |
||||||||||||||||
| Forward agreements with Deutsche Bank AG based on 0.999 Fine Troy Ounce Silver |
(0.50 | )% | 01/06/16 | $ | (3,253,000 | ) | $ | (44,962,315 | ) | $ | 2,500,263 | |||||||||
| Forward agreements with Goldman Sachs International based on 0.999 Fine Troy Ounce Silver |
(0.10 | ) | 01/06/16 | (2,047,500 | ) | (28,298,907 | ) | 1,044,986 | ||||||||||||
| Forward agreements with Societe Generale based on 0.999 Fine Troy Ounce Silver |
0.00 | 01/06/16 | (656,000 | ) | (9,066,707 | ) | 438,975 | |||||||||||||
| Forward agreements with UBS AG based on 0.999 Fine Troy Ounce Silver |
(0.09 | ) | 01/06/16 | (2,135,000 | ) | (29,508,262 | ) | 794,055 | ||||||||||||
|
|
|
|||||||||||||||||||
| $ | 4,778,279 | |||||||||||||||||||
|
|
|
|||||||||||||||||||
| † | All or partial amount pledged as collateral for forward agreements and/or futures contracts. |
| †† | Cash collateral in the amount of $11,440 was pledged to cover margin requirements for open futures contracts as of December 31, 2015. |
| ^ | The positions and counterparties herein are as of December 31, 2015. The Funds continually evaluate different counterparties for their transactions and counterparties are subject to change. New counterparties can be added at any time. |
| * | Reflects the floating financing rate, as of December 31, 2015, on the notional amount of the forward agreement paid to the counterparty or received from the counterparty, excluding any commissions. |
| ** | For forward agreements, a positive amount represents “long” exposure to the underlying commodity. A negative amount represents “short” exposure to the underlying commodity. |
See accompanying notes to financial statements.
199
Table of Contents
PROSHARES ULTRASHORT SILVER
SCHEDULE OF INVESTMENTS
DECEMBER 31, 2014
| Principal Amount | Value | |||||||
| Short-term U.S. government and agency obligations |
| |||||||
| (99% of shareholders’ equity) |
||||||||
| U.S. Treasury Bills: |
||||||||
| 0.051% due 01/08/15† |
$ | 992,000 | $ | 991,997 | ||||
| 0.020% due 02/12/15† |
6,632,000 | 6,631,849 | ||||||
| 0.014% due 02/19/15† |
5,857,000 | 5,856,844 | ||||||
| 0.030% due 03/12/15† |
12,806,000 | 12,805,509 | ||||||
| 0.051% due 04/30/15† |
11,917,000 | 11,915,438 | ||||||
| 0.056% due 05/14/15† |
1,504,000 | 1,503,752 | ||||||
| 0.061% due 05/21/15 |
2,355,000 | 2,354,545 | ||||||
| 0.078% due 06/04/15† |
10,170,000 | 10,166,758 | ||||||
|
|
|
|||||||
| Total short-term U.S. government and agency obligations |
||||||||
| (cost $52,225,712) |
$ | 52,226,692 | ||||||
|
|
|
|||||||
Futures Contracts Sold††
| Number of Contracts |
Notional Amount at Value |
Unrealized Appreciation (Depreciation) |
||||||||||
| Silver Futures—COMEX, expires March 2015 |
2 | $ | 155,990 | $ | 1,560 | |||||||
Forward Agreements^
| Rate Paid (Received)* |
Settlement Date | Commitment to (Deliver)/Receive |
Notional Amount at Value** |
Unrealized Appreciation (Depreciation) |
||||||||||||||||
| Forward agreements with Deutsche Bank AG based on 0.999 Fine Troy Ounce Silver |
(0.37 | )% | 01/06/15 | $ | (3,409,000 | ) | $ | (54,447,866 | ) | $ | 462,619 | |||||||||
| Forward agreements with Goldman Sachs International based on 0.999 Fine Troy Ounce Silver |
(0.20 | ) | 01/06/15 | (1,195,500 | ) | (19,094,048 | ) | 138,563 | ||||||||||||
| Forward agreements with Societe Generale S.A. based on 0.999 Fine Troy Ounce Silver |
(0.09 | ) | 01/06/15 | (687,000 | ) | (10,972,489 | ) | 198,341 | ||||||||||||
| Forward agreements with UBS AG based on 0.999 Fine Troy Ounce Silver |
(0.15 | ) | 01/06/15 | (1,336,000 | ) | (21,338,058 | ) | (204,570 | ) | |||||||||||
|
|
|
|||||||||||||||||||
| $ | 594,953 | |||||||||||||||||||
|
|
|
|||||||||||||||||||
| † | All or partial amount pledged as collateral for forward agreements. |
| †† | Cash collateral in the amount of $14,300 was pledged to cover margin requirements for open futures contracts as of December 31, 2014. |
| ^ | The positions and counterparties herein are as of December 31, 2014. The Funds continually evaluate different counterparties for their transactions and counterparties are subject to change. New counterparties can be added at any time. |
| * | Reflects the floating financing rate, as of December 31, 2015, on the notional amount of the swap agreement paid to the counterparty or received from the counterparty, excluding any commissions. |
| ** | For forward agreements, a positive amount represents “long” exposure to the underlying commodity. A negative amount represents “short” exposure to the underlying commodity. |
See accompanying notes to financial statements.
200
Table of Contents
PROSHARES ULTRASHORT SILVER
STATEMENTS OF OPERATIONS
FOR THE YEARS ENDED DECEMBER 31, 2015, 2014, 2013
| Year ended December 31, 2015 |
Year ended December 31, 2014 |
Year ended December 31, 2013 |
||||||||||
| Investment Income |
||||||||||||
| Interest |
$ | 23,831 | $ | 30,901 | $ | 60,178 | ||||||
|
|
|
|
|
|
|
|||||||
| Expenses |
||||||||||||
| Management fee |
540,253 | 616,703 | 1,033,442 | |||||||||
| Brokerage commissions and fees |
42 | 39 | 40 | |||||||||
|
|
|
|
|
|
|
|||||||
| Total expenses |
540,295 | 616,742 | 1,033,482 | |||||||||
|
|
|
|
|
|
|
|||||||
| Net investment income (loss) |
(516,464 | ) | (585,841 | ) | (973,304 | ) | ||||||
|
|
|
|
|
|
|
|||||||
| Realized and unrealized gain (loss) on investment activity |
||||||||||||
| Net realized gain (loss) on |
||||||||||||
| Futures contracts |
15,575 | 32,275 | 137,040 | |||||||||
| Forward agreements |
10,743,970 | 15,082,608 | 113,319,364 | |||||||||
| Short-term U.S. government and agency obligations |
(2,787 | ) | 4,234 | 6,916 | ||||||||
|
|
|
|
|
|
|
|||||||
| Net realized gain (loss) |
10,756,758 | 15,119,117 | 113,463,320 | |||||||||
|
|
|
|
|
|
|
|||||||
| Change in net unrealized appreciation/depreciation on |
||||||||||||
| Futures contracts |
4,410 | (12,640 | ) | (25,820 | ) | |||||||
| Forward agreements |
4,183,326 | 2,822,810 | (21,535,542 | ) | ||||||||
| Short-term U.S. government and agency obligations |
(794 | ) | (2,414 | ) | (3,439 | ) | ||||||
|
|
|
|
|
|
|
|||||||
| Change in net unrealized appreciation/depreciation |
4,186,942 | 2,807,756 | (21,564,801 | ) | ||||||||
|
|
|
|
|
|
|
|||||||
| Net realized and unrealized gain (loss) |
14,943,700 | 17,926,873 | 91,898,519 | |||||||||
|
|
|
|
|
|
|
|||||||
| Net income (loss) |
$ | 14,427,236 | $ | 17,341,032 | $ | 90,925,215 | ||||||
|
|
|
|
|
|
|
|||||||
| Net income (loss) per weighted-average share (Note 1) |
$ | 13.88 | $ | 11.65 | $ | 29.07 | ||||||
|
|
|
|
|
|
|
|||||||
| Weighted-average shares outstanding (Note 1) |
1,039,579 | 1,487,936 | 3,127,936 | |||||||||
|
|
|
|
|
|
|
|||||||
See accompanying notes to financial statements.
201
Table of Contents
PROSHARES ULTRASHORT SILVER
STATEMENTS OF CHANGES IN SHAREHOLDERS’ EQUITY
FOR THE YEARS ENDED DECEMBER 31, 2015, 2014 AND 2013
| Year ended December 31, 2015 |
Year ended December 31, 2014 |
Year ended December 31, 2013 |
||||||||||
| Shareholders’ equity, beginning of period |
$ | 53,007,867 | $ | 112,989,686 | $ | 100,656,703 | ||||||
| Addition of 1,650,000, 1,800,000 and 6,900,000 shares, respectively (Note 1) |
84,272,164 | 72,497,634 | 251,109,632 | |||||||||
| Redemption of 1,700,000, 3,400,000 and 8,300,000 shares, respectively (Note 1) |
(95,719,329 | ) | (149,820,485 | ) | (329,701,864 | ) | ||||||
|
|
|
|
|
|
|
|||||||
| Net addition (redemption) of (50,000), (1,600,000) and (1,400,000) shares, respectively (Note 1) |
(11,447,165 | ) | (77,322,851 | ) | (78,592,232 | ) | ||||||
|
|
|
|
|
|
|
|||||||
| Net investment income (loss) |
(516,464 | ) | (585,841 | ) | (973,304 | ) | ||||||
| Net realized gain (loss) |
10,756,758 | 15,119,117 | 113,463,320 | |||||||||
| Change in net unrealized appreciation/depreciation |
4,186,942 | 2,807,756 | (21,564,801 | ) | ||||||||
|
|
|
|
|
|
|
|||||||
| Net income (loss) |
14,427,236 | 17,341,032 | 90,925,215 | |||||||||
|
|
|
|
|
|
|
|||||||
| Shareholders’ equity, end of period |
$ | 55,987,938 | $ | 53,007,867 | $ | 112,989,686 | ||||||
|
|
|
|
|
|
|
|||||||
See accompanying notes to financial statements.
202
Table of Contents
PROSHARES ULTRASHORT SILVER
STATEMENTS OF CASH FLOWS
FOR THE YEARS ENDED DECEMBER 31, 2015, 2014 AND 2013
| Year ended December 31, 2015 |
Year ended December 31, 2014 |
Year ended December 31, 2013 |
||||||||||
| Cash flow from operating activities |
||||||||||||
| Net income (loss) |
$ | 14,427,236 | $ | 17,341,032 | $ | 90,925,215 | ||||||
| Adjustments to reconcile net income (loss) to net cash provided by (used in) operating activities: |
||||||||||||
| Decrease (Increase) in segregated cash balances with brokers for futures contracts |
2,860 | 7,700 | 2,200 | |||||||||
| Purchases of short-term U.S. government and agency obligations |
(220,073,123 | ) | (243,452,982 | ) | (593,520,715 | ) | ||||||
| Proceeds from sales or maturities of short-term U.S. government and agency obligations |
221,589,835 | 306,085,077 | 564,965,005 | |||||||||
| Net amortization and accretion on short-term U.S. government and agency obligations |
(23,831 | ) | (30,901 | ) | (60,178 | ) | ||||||
| Net realized gain (loss) on investments |
2,787 | (4,234 | ) | (6,916 | ) | |||||||
| Change in unrealized appreciation/depreciation on investments |
(4,182,532 | ) | (2,820,396 | ) | 21,538,981 | |||||||
| Decrease (Increase) in receivable on futures contracts |
6,380 | (4,320 | ) | (2,450 | ) | |||||||
| Increase (Decrease) in management fee payable |
4,831 | (51,786 | ) | 8,515 | ||||||||
| Increase (Decrease) in payable on futures contracts |
— | — | (2,520 | ) | ||||||||
|
|
|
|
|
|
|
|||||||
| Net cash provided by (used in) operating activities |
11,754,443 | 77,069,190 | 83,847,137 | |||||||||
|
|
|
|
|
|
|
|||||||
| Cash flow from financing activities |
||||||||||||
| Proceeds from addition of shares |
84,272,164 | 72,497,634 | 251,109,632 | |||||||||
| Payment on shares redeemed |
(95,719,329 | ) | (149,820,485 | ) | (334,839,980 | ) | ||||||
|
|
|
|
|
|
|
|||||||
| Net cash provided by (used in) financing activities |
(11,447,165 | ) | (77,322,851 | ) | (83,730,348 | ) | ||||||
|
|
|
|
|
|
|
|||||||
| Net increase (decrease) in cash |
307,278 | (253,661 | ) | 116,789 | ||||||||
| Cash, beginning of period |
207,506 | 461,167 | 344,378 | |||||||||
|
|
|
|
|
|
|
|||||||
| Cash, end of period |
$ | 514,784 | $ | 207,506 | $ | 461,167 | ||||||
|
|
|
|
|
|
|
|||||||
See accompanying notes to financial statements.
203
Table of Contents
STATEMENTS OF FINANCIAL CONDITION
| December 31, 2015 | December 31, 2014 | |||||||
| Assets |
||||||||
| Cash |
$ | 1,783,802 | $ | 1,640,225 | ||||
| Segregated cash balances with brokers for futures contracts |
503,745 | 242,880 | ||||||
| Short-term U.S. government and agency obligations (Note 3) (cost $15,153,202 and $12,086,398, respectively) |
15,153,211 | 12,086,577 | ||||||
| Receivable on open futures contracts |
84,235 | 63,250 | ||||||
|
|
|
|
|
|||||
| Total assets |
17,524,993 | 14,032,932 | ||||||
|
|
|
|
|
|||||
| Liabilities and shareholders’ equity |
||||||||
| Liabilities |
||||||||
| Management fee payable |
14,095 | 11,128 | ||||||
|
|
|
|
|
|||||
| Total liabilities |
14,095 | 11,128 | ||||||
|
|
|
|
|
|||||
| Commitments and Contingencies (Note 2) |
||||||||
| Shareholders’ equity |
||||||||
| Shareholders’ equity |
17,510,898 | 14,021,804 | ||||||
|
|
|
|
|
|||||
| Total liabilities and shareholders’ equity |
$ | 17,524,993 | $ | 14,032,932 | ||||
|
|
|
|
|
|||||
| Shares outstanding |
400,005 | 350,005 | ||||||
|
|
|
|
|
|||||
| Net asset value per share |
$ | 43.78 | $ | 40.06 | ||||
|
|
|
|
|
|||||
| Market value per share (Note 2) |
$ | 43.74 | $ | 40.03 | ||||
|
|
|
|
|
|||||
See accompanying notes to financial statements.
204
Table of Contents
PROSHARES SHORT EURO
SCHEDULE OF INVESTMENTS
DECEMBER 31, 2015
| Principal Amount | Value | |||||||
| Short-term U.S. government and agency obligations |
| |||||||
| (87% of shareholders’ equity) |
||||||||
| U.S. Treasury Bills: |
||||||||
| 0.000% due 01/07/16 |
$ | 5,605,000 | $ | 5,604,982 | ||||
| 0.027% due 02/04/16 |
2,555,000 | 2,554,813 | ||||||
| 0.000% due 02/25/16 |
2,962,000 | 2,961,679 | ||||||
| 0.200% due 03/10/16 |
1,635,000 | 1,634,655 | ||||||
| 0.181% due 03/17/16 |
200,000 | 199,961 | ||||||
| 0.203% due 03/24/16 |
2,198,000 | 2,197,121 | ||||||
|
|
|
|||||||
| Total short-term U.S. government and agency obligations |
||||||||
| (cost $15,153,202) |
$ | 15,153,211 | ||||||
|
|
|
|||||||
Futures Contracts Sold††
| Number of Contracts |
Notional Amount at Value |
Unrealized Appreciation (Depreciation) |
||||||||||
| Euro Fx Currency Futures—CME, expires March 2016 |
129 | $ | 17,553,675 | $ | 243,438 | |||||||
| †† | Cash collateral in the amount of $503,745 was pledged to cover margin requirements for open futures contracts as of December 31, 2015. |
See accompanying notes to financial statements.
205
Table of Contents
PROSHARES SHORT EURO
SCHEDULE OF INVESTMENTS
DECEMBER 31, 2014
| Principal Amount | Value | |||||||
| Short-term U.S. government and agency obligations |
| |||||||
| (86% of shareholders’ equity) |
||||||||
| U.S. Treasury Bills: |
||||||||
| 0.013% due 02/12/15 |
$ | 390,000 | $ | 389,991 | ||||
| 0.024% due 02/19/15 |
4,903,000 | 4,902,869 | ||||||
| 0.041% due 04/16/15 |
2,278,000 | 2,277,836 | ||||||
| 0.040% due 04/30/15 |
1,708,000 | 1,707,776 | ||||||
| 0.078% due 06/04/15 |
2,809,000 | 2,808,105 | ||||||
|
|
|
|||||||
| Total short-term U.S. government and agency obligations (cost $12,086,398) |
$ | 12,086,577 | ||||||
|
|
|
|||||||
Futures Contracts Sold††
| Number of Contracts |
Notional Amount at Value |
Unrealized Appreciation (Depreciation) |
||||||||||
| Euro Fx Currency Futures—CME, expires March 2015 |
92 | $ | 13,923,050 | $ | 385,331 | |||||||
| †† | Cash collateral in the amount of $242,880 was pledged to cover margin requirements for open futures contracts as of December 31, 2014. |
See accompanying notes to financial statements.
206
Table of Contents
PROSHARES SHORT EURO
STATEMENTS OF OPERATIONS
FOR THE YEARS ENDED DECEMBER 31, 2015, 2014 and 2013
| Year ended December 31, 2015 |
Year ended December 31, 2014 |
Year ended December 31, 2013 |
||||||||||
| Investment Income |
||||||||||||
| Interest |
$ | 4,504 | $ | 4,716 | $ | 1,996 | ||||||
|
|
|
|
|
|
|
|||||||
| Expenses |
||||||||||||
| Management fee |
179,286 | 121,126 | 35,075 | |||||||||
| Brokerage commissions and fees |
3,979 | 1,837 | 812 | |||||||||
| Offering costs |
— | — | 45,511 | |||||||||
| Limitation by Sponsor |
— | — | (28,232 | ) | ||||||||
|
|
|
|
|
|
|
|||||||
| Total expenses |
183,265 | 122,963 | 53,166 | |||||||||
|
|
|
|
|
|
|
|||||||
| Net investment income (loss) |
(178,761 | ) | (118,247 | ) | (51,170 | ) | ||||||
|
|
|
|
|
|
|
|||||||
| Realized and unrealized gain (loss) on investment activity |
||||||||||||
| Net realized gain (loss) on |
||||||||||||
| Futures contracts |
1,559,425 | 1,593,048 | (381,987 | ) | ||||||||
| Short-term U.S. government and agency obligations |
218 | 402 | 157 | |||||||||
|
|
|
|
|
|
|
|||||||
| Net realized gain (loss) |
1,559,643 | 1,593,450 | (381,830 | ) | ||||||||
|
|
|
|
|
|
|
|||||||
| Change in net unrealized appreciation/depreciation on |
||||||||||||
| Futures contracts |
(141,893 | ) | 418,562 | 21,825 | ||||||||
| Short-term U.S. government and agency obligations |
(170 | ) | (472 | ) | 463 | |||||||
|
|
|
|
|
|
|
|||||||
| Change in net unrealized appreciation/depreciation |
(142,063 | ) | 418,090 | 22,288 | ||||||||
|
|
|
|
|
|
|
|||||||
| Net realized and unrealized gain (loss) |
1,417,580 | 2,011,540 | (359,542 | ) | ||||||||
|
|
|
|
|
|
|
|||||||
| Net income (loss) |
$ | 1,238,819 | $ | 1,893,293 | $ | (410,712 | ) | |||||
|
|
|
|
|
|
|
|||||||
| Net income (loss) per weighted-average share |
$ | 2.84 | $ | 5.49 | $ | (2.75 | ) | |||||
|
|
|
|
|
|
|
|||||||
| Weighted-average shares outstanding |
436,443 | 344,937 | 149,183 | |||||||||
|
|
|
|
|
|
|
|||||||
See accompanying notes to financial statements.
207
Table of Contents
PROSHARES SHORT EURO
STATEMENTS OF CHANGES IN SHAREHOLDERS’ EQUITY
FOR THE YEARS ENDED DECEMBER 31, 2015, 2014 and 2013
| Year ended December 31, 2015 |
Year ended December 31, 2014 |
Year ended December 31, 2013 |
||||||||||
| Shareholders’ equity, beginning of period |
$ | 14,021,804 | $ | 8,896,842 | $ | 3,763,040 | ||||||
| Addition of 550,000, 250,000 and 150,000 shares, respectively |
23,563,492 | 8,924,282 | 5,544,514 | |||||||||
| Redemption of 500,000, 150,000 and 0 shares, respectively |
(21,313,217 | ) | (5,692,613 | ) | — | |||||||
|
|
|
|
|
|
|
|||||||
| Net addition (redemption) of 50,000, 100,000 and 150,000 shares, respectively |
2,250,275 | 3,231,669 | 5,544,514 | |||||||||
|
|
|
|
|
|
|
|||||||
| Net investment income (loss) |
(178,761 | ) | (118,247 | ) | (51,170 | ) | ||||||
| Net realized gain (loss) |
1,559,643 | 1,593,450 | (381,830 | ) | ||||||||
| Change in net unrealized appreciation/depreciation |
(142,063 | ) | 418,090 | 22,288 | ||||||||
|
|
|
|
|
|
|
|||||||
| Net income (loss) |
1,238,819 | 1,893,293 | (410,712 | ) | ||||||||
|
|
|
|
|
|
|
|||||||
| Shareholders’ equity, end of period |
$ | 17,510,898 | $ | 14,021,804 | $ | 8,896,842 | ||||||
|
|
|
|
|
|
|
|||||||
See accompanying notes to financial statements.
208
Table of Contents
PROSHARES SHORT EURO
STATEMENTS OF CASH FLOWS
FOR THE YEARS ENDED DECEMBER 31, 2015, 2014 and 2013
| Year ended December 31, 2015 |
Year ended December 31, 2014 |
Year ended December 31, 2013 |
||||||||||
| Cash flow from operating activities |
||||||||||||
| Net income (loss) |
$ | 1,238,819 | $ | 1,893,293 | $ | (410,712 | ) | |||||
| Adjustments to reconcile net income (loss) to net cash provided by (used in) operating activities: |
||||||||||||
| Decrease (Increase) in segregated cash balances with brokers for futures contracts |
(260,865 | ) | (114,180 | ) | (65,450 | ) | ||||||
| Purchases of short-term U.S. government and agency obligations |
(56,503,913 | ) | (36,652,485 | ) | (21,563,433 | ) | ||||||
| Proceeds from sales or maturities of short-term U.S. government and agency obligations |
53,441,831 | 32,472,610 | 17,073,898 | |||||||||
| Net amortization and accretion on short-term U.S. government and agency obligations |
(4,504 | ) | (4,716 | ) | (1,997 | ) | ||||||
| Net realized gain (loss) on investments |
(218 | ) | (402 | ) | (157 | ) | ||||||
| Change in unrealized appreciation/depreciation on investments |
170 | 472 | (463 | ) | ||||||||
| Decrease (Increase) in receivable on futures contracts |
(20,985 | ) | (54,150 | ) | (2,488 | ) | ||||||
| Decrease (Increase) in Limitation by Sponsor |
— | — | 2,145 | |||||||||
| Change in offering cost |
— | — | 19,770 | |||||||||
| Increase (Decrease) in management fee payable |
2,967 | 4,134 | 6,994 | |||||||||
| Increase (Decrease) in payable for offering costs |
— | — | (41,000 | ) | ||||||||
|
|
|
|
|
|
|
|||||||
| Net cash provided by (used in) operating activities |
(2,106,698 | ) | (2,455,424 | ) | (4,982,893 | ) | ||||||
|
|
|
|
|
|
|
|||||||
| Cash flow from financing activities |
||||||||||||
| Proceeds from addition of shares |
23,563,492 | 8,924,282 | 5,544,514 | |||||||||
| Payment on shares redeemed |
(21,313,217 | ) | (5,692,613 | ) | — | |||||||
|
|
|
|
|
|
|
|||||||
| Net cash provided by (used in) financing activities |
2,250,275 | 3,231,669 | 5,544,514 | |||||||||
|
|
|
|
|
|
|
|||||||
| Net increase (decrease) in cash |
143,577 | 776,245 | 561,621 | |||||||||
| Cash, beginning of period |
1,640,225 | 863,980 | 302,359 | |||||||||
|
|
|
|
|
|
|
|||||||
| Cash, end of period |
$ | 1,783,802 | $ | 1,640,225 | $ | 863,980 | ||||||
|
|
|
|
|
|
|
|||||||
See accompanying notes to financial statements.
209
Table of Contents
PROSHARES ULTRASHORT AUSTRALIAN DOLLAR
STATEMENTS OF FINANCIAL CONDITION
| December 31, 2015 | December 31, 2014 | |||||||
| Assets |
||||||||
| Cash |
$ | 1,958,996 | $ | 1,788,757 | ||||
| Segregated cash balances with brokers for futures contracts |
57,065 | 1,020,217 | ||||||
| Short-term U.S. government and agency obligations (Note 3) (cost $18,409,449 and $20,267,681, respectively) |
18,408,894 | 20,267,679 | ||||||
| Receivable on open futures contracts |
52,491 | 62,534 | ||||||
|
|
|
|
|
|||||
| Total assets |
20,477,446 | 23,139,187 | ||||||
|
|
|
|
|
|||||
| Liabilities and shareholders’ equity |
||||||||
| Liabilities |
||||||||
| Management fee payable |
16,767 | 18,397 | ||||||
|
|
|
|
|
|||||
| Total liabilities |
16,767 | 18,397 | ||||||
|
|
|
|
|
|||||
| Commitments and Contingencies (Note 2) |
||||||||
| Shareholders’ equity |
||||||||
| Shareholders’ equity |
20,460,679 | 23,120,790 | ||||||
|
|
|
|
|
|||||
| Total liabilities and shareholders’ equity |
$ | 20,477,446 | $ | 23,139,187 | ||||
|
|
|
|
|
|||||
| Shares outstanding |
350,005 | 450,005 | ||||||
|
|
|
|
|
|||||
| Net asset value per share |
$ | 58.46 | $ | 51.38 | ||||
|
|
|
|
|
|||||
| Market value per share (Note 2) |
$ | 58.15 | $ | 51.37 | ||||
|
|
|
|
|
|||||
See accompanying notes to financial statements.
210
Table of Contents
PROSHARES ULTRASHORT AUSTRALIAN DOLLAR
SCHEDULE OF INVESTMENTS
DECEMBER 31, 2015
| Principal Amount | Value | |||||||
| Short-term U.S. government and agency obligations |
| |||||||
| (90% of shareholders’ equity) |
||||||||
| U.S. Treasury Bills: |
||||||||
| 0.048% due 02/04/16 |
$ | 2,538,000 | $ | 2,537,814 | ||||
| 0.000% due 02/25/16 |
415,000 | 414,955 | ||||||
| 0.151% due 03/03/16† |
1,267,000 | 1,266,803 | ||||||
| 0.156% due 03/24/16† |
14,195,000 | 14,189,322 | ||||||
|
|
|
|||||||
| Total short-term U.S. government and agency obligations |
||||||||
| (cost $18,409,449) |
$ | 18,408,894 | ||||||
|
|
|
|||||||
| Futures Contracts Sold†† |
||||||||||||
| Number of Contracts |
Notional Amount at Value |
Unrealized Appreciation (Depreciation) |
||||||||||
| Australian Dollar Fx Currency Futures—CME, expires March 2016 |
562 | $ | 40,834,920 | $ | (420,270 | ) | ||||||
| † | All or partial amount pledged as collateral for futures contracts. |
| †† | Cash collateral in the amount of $57,065 was pledged to cover margin requirements for open futures contracts as of December 31, 2015. |
See accompanying notes to financial statements.
211
Table of Contents
PROSHARES ULTRASHORT AUSTRALIAN DOLLAR
SCHEDULE OF INVESTMENTS
DECEMBER 31, 2014
| Principal Amount | Value | |||||||
| Short-term U.S. government and agency obligations |
| |||||||
| (88% of shareholders’ equity) |
||||||||
| U.S. Treasury Bills: |
||||||||
| 0.010% due 02/12/15 |
$ | 735,000 | $ | 734,983 | ||||
| 0.012% due 02/19/15 |
15,300,000 | 15,299,592 | ||||||
| 0.021% due 03/05/15 |
267,000 | 266,993 | ||||||
| 0.043% due 04/16/15 |
756,000 | 755,946 | ||||||
| 0.056% due 04/30/15 |
351,000 | 350,954 | ||||||
| 0.035% due 05/21/15 |
854,000 | 853,835 | ||||||
| 0.087% due 06/11/15 |
2,006,000 | 2,005,376 | ||||||
|
|
|
|||||||
| Total short-term U.S. government and agency obligations (cost $20,267,681) |
$ | 20,267,679 | ||||||
|
|
|
|||||||
Futures Contracts Sold††
| Number of Contracts |
Notional Amount at Value |
Unrealized Appreciation (Depreciation) |
||||||||||
| Australian Dollar Fx Currency Futures—CME, expires March 2015 |
569 | $ | 46,214,180 | $ | 743,481 | |||||||
| †† | Cash collateral in the amount of $1,020,217 was pledged to cover margin requirements for open futures contracts as of December 31, 2014. |
See accompanying notes to financial statements.
212
Table of Contents
PROSHARES ULTRASHORT AUSTRALIAN DOLLAR
STATEMENTS OF OPERATIONS
FOR THE YEARS ENDED DECEMBER 31, 2015, 2014 and 2013
| Year ended December 31, 2015 |
Year ended December 31, 2014 |
Year ended December 31, 2013 |
||||||||||
| Investment Income |
||||||||||||
| Interest |
$ | 5,998 | $ | 8,225 | $ | 5,653 | ||||||
|
|
|
|
|
|
|
|||||||
| Expenses |
||||||||||||
| Management fee |
199,845 | 208,597 | 106,713 | |||||||||
| Brokerage commissions and fees |
16,140 | 12,811 | 11,753 | |||||||||
| Offering costs |
— | — | 47,870 | |||||||||
| Limitation by Sponsor |
— | — | (1,259 | ) | ||||||||
|
|
|
|
|
|
|
|||||||
| Total expenses |
215,985 | 221,408 | 165,077 | |||||||||
|
|
|
|
|
|
|
|||||||
| Net investment income (loss) |
(209,987 | ) | (213,183 | ) | (159,424 | ) | ||||||
|
|
|
|
|
|
|
|||||||
| Realized and unrealized gain (loss) on investment activity |
||||||||||||
| Net realized gain (loss) on |
||||||||||||
| Futures contracts |
4,330,463 | 2,296,216 | 2,720,079 | |||||||||
| Short-term U.S. government and agency obligations |
225 | 492 | (74 | ) | ||||||||
|
|
|
|
|
|
|
|||||||
| Net realized gain (loss) |
4,330,688 | 2,296,708 | 2,720,005 | |||||||||
|
|
|
|
|
|
|
|||||||
| Change in net unrealized appreciation/depreciation on |
||||||||||||
| Futures contracts |
(1,163,751 | ) | (174,124 | ) | 832,015 | |||||||
| Short-term U.S. government and agency obligations |
(553 | ) | (1,463 | ) | 1,279 | |||||||
|
|
|
|
|
|
|
|||||||
| Change in net unrealized appreciation/depreciation |
(1,164,304 | ) | (175,587 | ) | 833,294 | |||||||
|
|
|
|
|
|
|
|||||||
| Net realized and unrealized gain (loss) |
3,166,384 | 2,121,121 | 3,553,299 | |||||||||
|
|
|
|
|
|
|
|||||||
| Net income (loss) |
$ | 2,956,397 | $ | 1,907,938 | $ | 3,393,875 | ||||||
|
|
|
|
|
|
|
|||||||
| Net income (loss) per weighted-average share |
$ | 8.08 | $ | 3.82 | $ | 9.21 | ||||||
|
|
|
|
|
|
|
|||||||
| Weighted-average shares outstanding |
365,758 | 499,046 | 368,635 | |||||||||
|
|
|
|
|
|
|
|||||||
See accompanying notes to financial statements.
213
Table of Contents
PROSHARES ULTRASHORT AUSTRALIAN DOLLAR
STATEMENTS OF CHANGES IN SHAREHOLDERS’ EQUITY
FOR THE YEARS ENDED DECEMBER 31, 2015, 2014 and 2013
| Year ended December 31, 2015 |
Year ended December 31, 2014 |
Year ended December 31, 2013 |
||||||||||
| Shareholders’ equity, beginning of period |
$ | 23,120,790 | $ | 27,983,279 | $ | 3,780,999 | ||||||
| Addition of 50,000, 0 and 500,000 shares, respectively |
2,764,167 | — | 20,808,405 | |||||||||
| Redemption of 150,000, 150,000 and 0 shares, respectively |
(8,380,675 | ) | (6,770,427 | ) | — | |||||||
|
|
|
|
|
|
|
|||||||
| Net addition (redemption) of (100,000), (150,000) and 500,000 shares, respectively |
(5,616,508 | ) | (6,770,427 | ) | 20,808,405 | |||||||
|
|
|
|
|
|
|
|||||||
| Net investment income (loss) |
(209,987 | ) | (213,183 | ) | (159,424 | ) | ||||||
| Net realized gain (loss) |
4,330,688 | 2,296,708 | 2,720,005 | |||||||||
| Change in net unrealized appreciation/depreciation |
(1,164,304 | ) | (175,587 | ) | 833,294 | |||||||
|
|
|
|
|
|
|
|||||||
| Net income (loss) |
2,956,397 | 1,907,938 | 3,393,875 | |||||||||
|
|
|
|
|
|
|
|||||||
| Shareholders’ equity, end of period |
$ | 20,460,679 | $ | 23,120,790 | $ | 27,983,279 | ||||||
|
|
|
|
|
|
|
|||||||
See accompanying notes to financial statements.
214
Table of Contents
PROSHARES ULTRASHORT AUSTRALIAN DOLLAR
STATEMENTS OF CASH FLOWS
FOR THE YEARS ENDED DECEMBER 31, 2015, 2014 and 2013
| Year ended December 31, 2015 |
Year ended December 31, 2014 |
Year ended December 31, 2013 |
||||||||||
| Cash flow from operating activities |
||||||||||||
| Net income (loss) |
$ | 2,956,397 | $ | 1,907,938 | $ | 3,393,875 | ||||||
| Adjustments to reconcile net income (loss) to net cash provided by (used in) operating activities: |
||||||||||||
| Decrease (Increase) in segregated cash balances with brokers for futures contracts |
963,152 | 121,418 | (997,095 | ) | ||||||||
| Purchases of short-term U.S. government and agency obligations |
(61,647,966 | ) | (41,309,385 | ) | (69,157,620 | ) | ||||||
| Proceeds from sales or maturities of short-term U.S. government and agency obligations |
63,512,421 | 45,247,467 | 48,268,878 | |||||||||
| Net amortization and accretion on short-term U.S. government and agency obligations |
(5,998 | ) | (8,225 | ) | (5,653 | ) | ||||||
| Net realized gain (loss) on investments |
(225 | ) | (492 | ) | 74 | |||||||
| Change in unrealized appreciation/depreciation on investments |
553 | 1,463 | (1,279 | ) | ||||||||
| Decrease (Increase) in receivable on futures contracts |
10,043 | (62,534 | ) | — | ||||||||
| Decrease (Increase) in Limitation by Sponsor |
— | — | 2,216 | |||||||||
| Change in offering cost |
— | — | 22,129 | |||||||||
| Increase (Decrease) in management fee payable |
(1,630 | ) | (3,620 | ) | 22,017 | |||||||
| Increase (Decrease) in payable on futures contracts |
— | (86,166 | ) | 75,216 | ||||||||
| Increase (Decrease) in payable for offering costs |
— | — | (41,000 | ) | ||||||||
|
|
|
|
|
|
|
|||||||
| Net cash provided by (used in) operating activities |
5,786,747 | 5,807,864 | (18,418,242 | ) | ||||||||
|
|
|
|
|
|
|
|||||||
| Cash flow from financing activities |
||||||||||||
| Proceeds from addition of shares |
2,764,167 | — | 20,808,405 | |||||||||
| Payment on shares redeemed |
(8,380,675 | ) | (6,770,427 | ) | — | |||||||
|
|
|
|
|
|
|
|||||||
| Net cash provided by (used in) financing activities |
(5,616,508 | ) | (6,770,427 | ) | 20,808,405 | |||||||
|
|
|
|
|
|
|
|||||||
| Net increase (decrease) in cash |
170,239 | (962,563 | ) | 2,390,163 | ||||||||
| Cash, beginning of period |
1,788,757 | 2,751,320 | 361,157 | |||||||||
|
|
|
|
|
|
|
|||||||
| Cash, end of period |
$ | 1,958,996 | $ | 1,788,757 | $ | 2,751,320 | ||||||
|
|
|
|
|
|
|
|||||||
See accompanying notes to financial statements.
215
Table of Contents
STATEMENTS OF FINANCIAL CONDITION
| December 31, 2015 |
December 31, 2014 |
|||||||
| Assets |
||||||||
| Cash |
$ | 10,372,583 | $ | 746,454 | ||||
| Short-term U.S. government and agency obligations (Note 3) (cost $546,177,230 and $487,097,789, respectively) |
546,166,776 | 487,111,117 | ||||||
| Unrealized appreciation on foreign currency forward contracts |
— | 19,019,765 | ||||||
| Receivable from capital shares sold |
— | 12,956,604 | ||||||
|
|
|
|
|
|||||
| Total assets |
556,539,359 | 519,833,940 | ||||||
|
|
|
|
|
|||||
| Liabilities and shareholders’ equity |
||||||||
| Liabilities |
||||||||
| Payable for capital shares redeemed |
5,108,230 | — | ||||||
| Management fee payable |
414,275 | 385,820 | ||||||
| Unrealized depreciation on foreign currency forward contracts |
28,710,336 | 2,256,771 | ||||||
|
|
|
|
|
|||||
| Total liabilities |
34,232,841 | 2,642,591 | ||||||
|
|
|
|
|
|||||
| Commitments and Contingencies (Note 2) |
||||||||
| Shareholders’ equity |
||||||||
| Shareholders’ equity |
522,306,518 | 517,191,349 | ||||||
|
|
|
|
|
|||||
| Total liabilities and shareholders’ equity |
$ | 556,539,359 | $ | 519,833,940 | ||||
|
|
|
|
|
|||||
| Shares outstanding |
20,450,014 | 23,950,014 | ||||||
|
|
|
|
|
|||||
| Net asset value per share |
$ | 25.54 | $ | 21.59 | ||||
|
|
|
|
|
|||||
| Market value per share (Note 2) |
$ | 25.53 | $ | 21.61 | ||||
|
|
|
|
|
|||||
See accompanying notes to financial statements.
216
Table of Contents
PROSHARES ULTRASHORT EURO
SCHEDULE OF INVESTMENTS
DECEMBER 31, 2015
| Principal Amount | Value | |||||||
| Short-term U.S. government and agency obligations |
| |||||||
| (105% of shareholders’ equity) |
||||||||
| U.S. Treasury Bills: |
||||||||
| 0.000% due 01/21/16 |
$ | 44,995,000 | $ | 44,993,088 | ||||
| 0.133% due 01/28/16 |
67,289,000 | 67,283,166 | ||||||
| 0.027% due 02/04/16† |
98,693,000 | 98,685,776 | ||||||
| 0.150% due 02/11/16 |
29,669,000 | 29,665,087 | ||||||
| 0.180% due 02/18/16 |
7,296,000 | 7,294,952 | ||||||
| 0.000% due 02/25/16† |
21,719,000 | 21,716,648 | ||||||
| 0.167% due 03/03/16† |
44,405,000 | 44,398,086 | ||||||
| 0.175% due 03/24/16† |
143,484,000 | 143,426,606 | ||||||
| 0.353% due 05/26/16† |
88,841,000 | 88,703,367 | ||||||
|
|
|
|||||||
| Total short-term U.S. government and agency obligations |
||||||||
| (cost $546,177,230) |
$ | 546,166,776 | ||||||
|
|
|
|||||||
Foreign Currency Forward Contracts^
| Settlement Date | Local Currency | Notional Amount at Value (USD) |
Unrealized Appreciation (Depreciation) |
|||||||||||||
| Contracts to Purchase |
||||||||||||||||
| Euro with Goldman Sachs International |
01/08/16 | 129,386,700 | $ | 140,627,935 | $ | (1,100,282 | ) | |||||||||
| Euro with UBS AG |
01/08/16 | 75,393,200 | 81,943,430 | (865,112 | ) | |||||||||||
|
|
|
|||||||||||||||
| $ | (1,965,394 | ) | ||||||||||||||
|
|
|
|||||||||||||||
| Contracts to Sell |
||||||||||||||||
| Euro with Goldman Sachs International |
01/08/16 | (602,732,925 | ) | $ | (655,098,912 | ) | $ | (13,891,742 | ) | |||||||
| Euro with UBS AG |
01/08/16 | (562,621,100 | ) | (611,502,135 | ) | (12,853,200 | ) | |||||||||
|
|
|
|||||||||||||||
| $ | (26,744,942 | ) | ||||||||||||||
|
|
|
|||||||||||||||
| † | All or partial amount segregated as collateral for foreign currency forward contracts. |
| ^ | The positions and counterparties herein are as of December 31, 2015. The Funds continually evaluate different counterparties for their transactions and counterparties are subject to change. New counterparties can be added at any time. |
See accompanying notes to financial statements.
217
Table of Contents
PROSHARES ULTRASHORT EURO
SCHEDULE OF INVESTMENTS
DECEMBER 31, 2014
| Principal Amount | Value | |||||||
| Short-term U.S. government and agency obligations |
| |||||||
| (94% of shareholders’ equity) |
||||||||
| U.S. Treasury Bills: |
||||||||
| 0.011% due 01/22/15† |
$ | 37,647,000 | $ | 37,646,372 | ||||
| 0.022% due 02/12/15 |
8,135,000 | 8,134,815 | ||||||
| 0.010% due 02/19/15† |
69,601,000 | 69,599,144 | ||||||
| 0.027% due 03/05/15† |
58,406,000 | 58,404,491 | ||||||
| 0.015% due 03/12/15 |
12,133,000 | 12,132,535 | ||||||
| 0.041% due 04/16/15† |
2,717,000 | 2,716,804 | ||||||
| 0.048% due 04/30/15† |
57,015,000 | 57,007,525 | ||||||
| 0.061% due 05/21/15 |
67,461,000 | 67,447,976 | ||||||
| 0.070% due 05/28/15 |
6,919,000 | 6,917,316 | ||||||
| 0.082% due 06/04/15† |
112,157,000 | 112,121,250 | ||||||
| 0.090% due 06/11/15† |
55,000,000 | 54,982,889 | ||||||
|
|
|
|||||||
| Total short-term U.S. government and agency obligations |
||||||||
| (cost $487,097,789) |
$ | 487,111,117 | ||||||
|
|
|
|||||||
.Foreign Currency Forward Contracts^
| Settlement Date | Local Currency | Notional Amount at Value (USD) |
Unrealized Appreciation (Depreciation) |
|||||||||||||
| Contracts to Purchase |
||||||||||||||||
| Euro with Goldman Sachs International |
01/09/15 | 31,647,600 | $ | 38,298,521 | $ | (1,118,702 | ) | |||||||||
| Euro with UBS AG |
01/09/15 | 40,314,300 | 48,786,577 | (1,138,069 | ) | |||||||||||
|
|
|
|||||||||||||||
| $ | (2,256,771 | ) | ||||||||||||||
|
|
|
|||||||||||||||
| Contracts to Sell |
||||||||||||||||
| Euro with Goldman Sachs International |
01/09/15 | (443,778,725 | ) | $ | (537,041,321 | ) | $ | 9,312,005 | ||||||||
| Euro with UBS AG |
01/09/15 | (483,290,100 | ) | (584,856,233 | ) | 9,707,760 | ||||||||||
|
|
|
|||||||||||||||
| $ | 19,019,765 | |||||||||||||||
|
|
|
|||||||||||||||
| † | All or partial amount segregated as collateral for foreign currency forward contracts. |
| ^ | The positions and counterparties herein are as of December 31, 2014. The Funds continually evaluate different counterparties for their transactions and counterparties are subject to change. New counterparties can be added at any time. |
See accompanying notes to financial statements.
218
Table of Contents
PROSHARES ULTRASHORT EURO
STATEMENTS OF OPERATIONS
FOR THE YEARS ENDED DECEMBER 31, 2015, 2014 and 2013
| Year ended December 31, 2015 |
Year ended December 31, 2014 |
Year ended December 31, 2013 |
||||||||||
| Investment Income |
||||||||||||
| Interest |
$ | 264,845 | $ | 199,596 | $ | 224,967 | ||||||
|
|
|
|
|
|
|
|||||||
| Expenses |
||||||||||||
| Management fee |
5,265,432 | 4,193,741 | 4,600,479 | |||||||||
|
|
|
|
|
|
|
|||||||
| Total expenses |
5,265,432 | 4,193,741 | 4,600,479 | |||||||||
|
|
|
|
|
|
|
|||||||
| Net investment income (loss) |
(5,000,587 | ) | (3,994,145 | ) | (4,375,512 | ) | ||||||
|
|
|
|
|
|
|
|||||||
| Realized and unrealized gain (loss) on investment activity |
||||||||||||
| Net realized gain (loss) on |
||||||||||||
| Foreign currency forward contracts |
131,651,572 | 83,678,955 | (48,063,036 | ) | ||||||||
| Short-term U.S. government and agency obligations |
22,509 | 4,637 | 7,153 | |||||||||
|
|
|
|
|
|
|
|||||||
| Net realized gain (loss) |
131,674,081 | 83,683,592 | (48,055,883 | ) | ||||||||
|
|
|
|
|
|
|
|||||||
| Change in net unrealized appreciation/depreciation on |
||||||||||||
| Foreign currency forward contracts |
(45,473,330 | ) | 30,511,501 | (600,935 | ) | |||||||
| Short-term U.S. government and agency obligations |
(23,782 | ) | (12,286 | ) | 12,268 | |||||||
|
|
|
|
|
|
|
|||||||
| Change in net unrealized appreciation/depreciation |
(45,497,112 | ) | 30,499,215 | (588,667 | ) | |||||||
|
|
|
|
|
|
|
|||||||
| Net realized and unrealized gain (loss) |
86,176,969 | 114,182,807 | (48,644,550 | ) | ||||||||
|
|
|
|
|
|
|
|||||||
| Net income (loss) |
$ | 81,176,382 | $ | 110,188,662 | $ | (53,020,062 | ) | |||||
|
|
|
|
|
|
|
|||||||
| Net income (loss) per weighted-average share |
$ | 3.66 | $ | 4.53 | $ | (2.03 | ) | |||||
|
|
|
|
|
|
|
|||||||
| Weighted-average shares outstanding |
22,169,740 | 24,321,384 | 26,095,630 | |||||||||
|
|
|
|
|
|
|
|||||||
See accompanying notes to financial statements.
219
Table of Contents
PROSHARES ULTRASHORT EURO
STATEMENTS OF CHANGES IN SHAREHOLDERS’ EQUITY
FOR THE YEARS ENDED DECEMBER 31, 2015, 2014 and 2013
| Year ended December 31, 2015 |
Year ended December 31, 2014 |
Year ended December 31, 2013 |
||||||||||
| Shareholders’ equity, beginning of period |
$ | 517,191,349 | $ | 418,001,115 | $ | 526,778,026 | ||||||
| Addition of 12,600,000, 4,500,000 and 6,250,000 shares, respectively |
328,253,174 | 84,751,333 | 119,076,233 | |||||||||
| Redemption of 16,100,000, 5,050,000 and 9,450,000 shares, respectively |
(404,314,387 | ) | (95,749,761 | ) | (174,833,082 | ) | ||||||
|
|
|
|
|
|
|
|||||||
| Net addition (redemption) of (3,500,000), (550,000) and (3,200,000) shares, respectively |
(76,061,213 | ) | (10,998,428 | ) | (55,756,849 | ) | ||||||
|
|
|
|
|
|
|
|||||||
| Net investment income (loss) |
(5,000,587 | ) | (3,994,145 | ) | (4,375,512 | ) | ||||||
| Net realized gain (loss) |
131,674,081 | 83,683,592 | (48,055,883 | ) | ||||||||
| Change in net unrealized appreciation/depreciation |
(45,497,112 | ) | 30,499,215 | (588,667 | ) | |||||||
|
|
|
|
|
|
|
|||||||
| Net income (loss) |
81,176,382 | 110,188,662 | (53,020,062 | ) | ||||||||
|
|
|
|
|
|
|
|||||||
| Shareholders’ equity, end of period |
$ | 522,306,518 | $ | 517,191,349 | $ | 418,001,115 | ||||||
|
|
|
|
|
|
|
|||||||
See accompanying notes to financial statements.
220
Table of Contents
PROSHARES ULTRASHORT EURO
STATEMENTS OF CASH FLOWS
FOR THE YEARS ENDED DECEMBER 31, 2015, 2014 and 2013
| Year ended December 31, 2015 |
Year ended December 31, 2014 |
Year ended December 31, 2013 |
||||||||||
| Cash flow from operating activities |
||||||||||||
| Net income (loss) |
$ | 81,176,382 | $ | 110,188,662 | $ | (53,020,062 | ) | |||||
| Adjustments to reconcile net income (loss) to net cash provided by (used in) operating activities: |
||||||||||||
| Purchases of short-term U.S. government and agency obligations |
(1,901,774,819 | ) | (1,291,071,881 | ) | (2,234,974,275 | ) | ||||||
| Proceeds from sales or maturities of short-term U.S. government and agency obligations |
1,842,981,707 | 1,241,999,870 | 2,350,802,065 | |||||||||
| Net amortization and accretion on short-term U.S. government and agency obligations |
(263,820 | ) | (199,596 | ) | (224,966 | ) | ||||||
| Net realized gain (loss) on investments |
(22,509 | ) | (4,637 | ) | (7,153 | ) | ||||||
| Change in unrealized appreciation/depreciation on investments |
45,497,112 | (30,499,215 | ) | 588,667 | ||||||||
| Increase (Decrease) in management fee payable |
28,455 | 40,427 | (153,734 | ) | ||||||||
|
|
|
|
|
|
|
|||||||
| Net cash provided by (used in) operating activities |
67,622,508 | 30,453,630 | 63,010,542 | |||||||||
|
|
|
|
|
|
|
|||||||
| Cash flow from financing activities |
||||||||||||
| Proceeds from addition of shares |
341,209,778 | 71,794,729 | 119,076,233 | |||||||||
| Payment on shares redeemed |
(399,206,157 | ) | (101,720,845 | ) | (182,144,207 | ) | ||||||
|
|
|
|
|
|
|
|||||||
| Net cash provided by (used in) financing activities |
(57,996,379 | ) | (29,926,116 | ) | (63,067,974 | ) | ||||||
|
|
|
|
|
|
|
|||||||
| Net increase (decrease) in cash |
9,626,129 | 527,514 | (57,432 | ) | ||||||||
| Cash, beginning of period |
746,454 | 218,940 | 276,372 | |||||||||
|
|
|
|
|
|
|
|||||||
| Cash, end of period |
$ | 10,372,583 | $ | 746,454 | $ | 218,940 | ||||||
|
|
|
|
|
|
|
|||||||
See accompanying notes to financial statements.
221
Table of Contents
STATEMENTS OF FINANCIAL CONDITION
| December 31, 2015 | December 31, 2014 | |||||||
| Assets |
||||||||
| Cash |
$ | 276,968 | $ | 532,706 | ||||
| Short-term U.S. government and agency obligations (Note 3) (cost $260,014,650 and $532,944,509, respectively) |
259,997,001 | 532,957,746 | ||||||
| Unrealized appreciation on foreign currency forward contracts |
933,727 | 571,149 | ||||||
|
|
|
|
|
|||||
| Total assets |
261,207,696 | 534,061,601 | ||||||
|
|
|
|
|
|||||
| Liabilities and shareholders’ equity |
||||||||
| Liabilities |
||||||||
| Payable for capital shares redeemed |
8,794,729 | — | ||||||
| Management fee payable |
210,888 | 439,804 | ||||||
| Unrealized depreciation on foreign currency forward contracts |
14,829,179 | 2,149,924 | ||||||
|
|
|
|
|
|||||
| Total liabilities |
23,834,796 | 2,589,728 | ||||||
|
|
|
|
|
|||||
| Commitments and Contingencies (Note 2) |
||||||||
| Shareholders’ equity |
||||||||
| Shareholders’ equity |
237,372,900 | 531,471,873 | ||||||
|
|
|
|
|
|||||
| Total liabilities and shareholders’ equity |
$ | 261,207,696 | $ | 534,061,601 | ||||
|
|
|
|
|
|||||
| Shares outstanding |
2,699,294 | 5,949,294 | ||||||
|
|
|
|
|
|||||
| Net asset value per share |
$ | 87.94 | $ | 89.33 | ||||
|
|
|
|
|
|||||
| Market value per share (Note 2) |
$ | 87.89 | $ | 89.30 | ||||
|
|
|
|
|
|||||
See accompanying notes to financial statements.
222
Table of Contents
PROSHARES ULTRASHORT YEN
SCHEDULE OF INVESTMENTS
DECEMBER 31, 2015
| Principal Amount | Value | |||||||
| Short-term U.S. government and agency obligations |
| |||||||
| (110% of shareholders’ equity) |
||||||||
| U.S. Treasury Bills: |
||||||||
| 0.080% due 01/07/16 |
$ | 4,417,000 | $ | 4,416,985 | ||||
| 0.148% due 01/14/16 |
6,017,000 | 6,016,850 | ||||||
| 0.043% due 01/21/16 |
5,361,000 | 5,360,772 | ||||||
| 0.110% due 01/28/16 |
6,089,000 | 6,088,472 | ||||||
| 0.013% due 02/04/16 |
38,515,000 | 38,512,181 | ||||||
| 0.150% due 02/11/16 |
9,617,000 | 9,615,732 | ||||||
| 0.000% due 02/25/16† |
142,667,000 | 142,651,549 | ||||||
| 0.208% due 03/03/16 |
8,000,000 | 7,998,754 | ||||||
| 0.181% due 03/17/16† |
800,000 | 799,846 | ||||||
| 0.152% due 03/24/16† |
28,369,000 | 28,357,652 | ||||||
| 0.366% due 05/26/16† |
10,194,000 | 10,178,208 | ||||||
|
|
|
|||||||
| Total short-term U.S. government and agency obligations (cost $260,014,650) |
$ | 259,997,001 | ||||||
|
|
|
|||||||
Foreign Currency Forward Contracts^
| Settlement Date | Local Currency | Notional Amount at Value (USD) |
Unrealized Appreciation (Depreciation) |
|||||||||||||
| Contracts to Purchase |
||||||||||||||||
| Yen with Goldman Sachs International |
01/08/16 | 5,938,040,200 | $ | 49,402,434 | $ | 319,567 | ||||||||||
| Yen with UBS AG |
01/08/16 | 11,521,875,200 | 95,858,003 | 614,160 | ||||||||||||
|
|
|
|||||||||||||||
| $ | 933,727 | |||||||||||||||
|
|
|
|||||||||||||||
| Contracts to Sell |
||||||||||||||||
| Yen with Goldman Sachs International |
01/08/16 | (33,696,676,000 | ) | $ | (280,344,651 | ) | $ | (6,789,972 | ) | |||||||
| Yen with UBS AG |
01/08/16 | (40,852,769,100 | ) | (339,880,862 | ) | (8,039,207 | ) | |||||||||
|
|
|
|||||||||||||||
| $ | (14,829,179 | ) | ||||||||||||||
|
|
|
|||||||||||||||
| † | All or partial amount segregated as collateral for foreign currency forward contracts. |
| ^ | The positions and counterparties herein are as of December 31, 2015. The Funds continually evaluate different counterparties for their transactions and counterparties are subject to change. New counterparties can be added at any time. |
See accompanying notes to financial statements.
223
Table of Contents
PROSHARES ULTRASHORT YEN
SCHEDULE OF INVESTMENTS
DECEMBER 31, 2014
| Principal Amount | Value | |||||||
| Short-term U.S. government and agency obligations |
| |||||||
| (100% of shareholders’ equity) |
||||||||
| U.S. Treasury Bills: |
||||||||
| 0.017% due 01/29/15 |
$ | 32,686,000 | $ | 32,685,510 | ||||
| 0.019% due 02/12/15† |
92,533,000 | 92,530,892 | ||||||
| 0.027% due 02/19/15† |
19,439,000 | 19,438,482 | ||||||
| 0.026% due 03/05/15† |
164,216,000 | 164,211,758 | ||||||
| 0.014% due 03/12/15 |
51,533,000 | 51,531,025 | ||||||
| 0.041% due 04/16/15† |
81,110,000 | 81,104,142 | ||||||
| 0.056% due 04/30/15† |
22,696,000 | 22,693,024 | ||||||
| 0.063% due 05/14/15 |
1,002,000 | 1,001,835 | ||||||
| 0.070% due 05/21/15 |
18,340,000 | 18,336,459 | ||||||
| 0.087% due 06/11/15† |
49,440,000 | 49,424,619 | ||||||
|
|
|
|||||||
| Total short-term U.S. government and agency obligations (cost $532,944,509) |
$ | 532,957,746 | ||||||
|
|
|
|||||||
Foreign Currency Forward Contracts^
| Settlement Date | Local Currency | Notional Amount at Value (USD) |
Unrealized Appreciation (Depreciation) |
|||||||||||||
| Contracts to Purchase |
||||||||||||||||
| Yen with Goldman Sachs International |
01/09/15 | 8,266,326,300 | $ | 69,025,668 | $ | (1,395,668 | ) | |||||||||
| Yen with UBS AG |
01/09/15 | 13,530,509,400 | 112,982,770 | (683,685 | ) | |||||||||||
|
|
|
|||||||||||||||
| $ | (2,079,353 | ) | ||||||||||||||
|
|
|
|||||||||||||||
| Contracts to Sell |
||||||||||||||||
| Yen with Goldman Sachs International |
01/09/15 | (72,481,612,100 | ) | $ | (605,237,623 | ) | $ | (70,571 | ) | |||||||
| Yen with UBS AG |
01/09/15 | (76,736,367,800 | ) | (640,765,782 | ) | 571,149 | ||||||||||
|
|
|
|||||||||||||||
| $ | 500,578 | |||||||||||||||
|
|
|
|||||||||||||||
| † | All or partial amount segregated as collateral for foreign currency forward contracts. |
| ^ | The positions and counterparties herein are as of December 31, 2014. The Funds continually evaluate different counterparties for their transactions and counterparties are subject to change. New counterparties can be added at any time. |
See accompanying notes to financial statements.
224
Table of Contents
PROSHARES ULTRASHORT YEN
STATEMENTS OF OPERATIONS
FOR THE YEARS ENDED DECEMBER 31, 2015, 2014 and 2013
| Year ended December 31, 2015 |
Year ended December 31, 2014 |
Year ended December 31, 2013 |
||||||||||
| Investment Income |
||||||||||||
| Interest |
$ | 135,814 | $ | 197,253 | $ | 209,601 | ||||||
|
|
|
|
|
|
|
|||||||
| Expenses |
||||||||||||
| Management fee |
3,759,492 | 3,938,854 | 4,607,832 | |||||||||
|
|
|
|
|
|
|
|||||||
| Total expenses |
3,759,492 | 3,938,854 | 4,607,832 | |||||||||
|
|
|
|
|
|
|
|||||||
| Net investment income (loss) |
(3,623,678 | ) | (3,741,601 | ) | (4,398,231 | ) | ||||||
|
|
|
|
|
|
|
|||||||
| Realized and unrealized gain (loss) on investment activity |
||||||||||||
| Net realized gain (loss) on |
||||||||||||
| Foreign currency forward contracts |
8,809,464 | 127,846,225 | 164,019,598 | |||||||||
| Short-term U.S. government and agency obligations |
(3,035 | ) | 13,833 | 4,527 | ||||||||
|
|
|
|
|
|
|
|||||||
| Net realized gain (loss) |
8,806,429 | 127,860,058 | 164,024,125 | |||||||||
|
|
|
|
|
|
|
|||||||
| Change in net unrealized appreciation/depreciation on |
||||||||||||
| Foreign currency forward contracts |
(12,316,677 | ) | (30,965,459 | ) | (8,727,491 | ) | ||||||
| Short-term U.S. government and agency obligations |
(30,886 | ) | (20,893 | ) | 22,835 | |||||||
|
|
|
|
|
|
|
|||||||
| Change in net unrealized appreciation/depreciation |
(12,347,563 | ) | (30,986,352 | ) | (8,704,656 | ) | ||||||
|
|
|
|
|
|
|
|||||||
| Net realized and unrealized gain (loss) |
(3,541,134 | ) | 96,873,706 | 155,319,469 | ||||||||
|
|
|
|
|
|
|
|||||||
| Net income (loss) |
$ | (7,164,812 | ) | $ | 93,132,105 | $ | 150,921,238 | |||||
|
|
|
|
|
|
|
|||||||
| Net income (loss) per weighted-average share |
$ | (1.63 | ) | $ | 15.96 | $ | 19.43 | |||||
|
|
|
|
|
|
|
|||||||
| Weighted-average shares outstanding |
4,396,143 | 5,835,184 | 7,767,376 | |||||||||
|
|
|
|
|
|
|
|||||||
See accompanying notes to financial statements.
225
Table of Contents
PROSHARES ULTRASHORT YEN
STATEMENTS OF CHANGES IN SHAREHOLDERS’ EQUITY
FOR THE YEARS ENDED DECEMBER 31, 2015, 2014 and 2013
| Year ended December 31, 2015 |
Year ended December 31, 2014 |
Year ended December 31, 2013 |
||||||||||
| Shareholders’ equity, beginning of period |
$ | 531,471,873 | $ | 588,121,516 | $ | 408,563,630 | ||||||
| Addition of 1,350,000, 2,850,000 and 5,650,000 shares, respectively |
124,524,909 | 216,403,570 | 362,152,598 | |||||||||
| Redemption of 4,600,000, 5,200,000 and 5,400,000 shares, respectively |
(411,459,070 | ) | (366,185,318 | ) | (333,515,950 | ) | ||||||
|
|
|
|
|
|
|
|||||||
| Net addition (redemption) of (3,250,000), (2,350,000) and 250,000 shares, respectively |
(286,934,161 | ) | (149,781,748 | ) | 28,636,648 | |||||||
|
|
|
|
|
|
|
|||||||
| Net investment income (loss) |
(3,623,678 | ) | (3,741,601 | ) | (4,398,231 | ) | ||||||
| Net realized gain (loss) |
8,806,429 | 127,860,058 | 164,024,125 | |||||||||
| Change in net unrealized appreciation/depreciation |
(12,347,563 | ) | (30,986,352 | ) | (8,704,656 | ) | ||||||
|
|
|
|
|
|
|
|||||||
| Net income (loss) |
(7,164,812 | ) | 93,132,105 | 150,921,238 | ||||||||
|
|
|
|
|
|
|
|||||||
| Shareholders’ equity, end of period |
$ | 237,372,900 | $ | 531,471,873 | $ | 588,121,516 | ||||||
|
|
|
|
|
|
|
|||||||
See accompanying notes to financial statements.
226
Table of Contents
PROSHARES ULTRASHORT YEN
STATEMENTS OF CASH FLOWS
FOR THE YEARS ENDED DECEMBER 31, 2015, 2014 and 2013
| Year ended December 31, 2015 |
Year ended December 31, 2014 |
Year ended December 31, 2013 |
||||||||||
| Cash flow from operating activities |
||||||||||||
| Net income (loss) |
$ | (7,164,812 | ) | $ | 93,132,105 | $ | 150,921,238 | |||||
| Adjustments to reconcile net income (loss) to net cash provided by (used in) operating activities: |
||||||||||||
| Purchases of short-term U.S. government and agency obligations |
(1,322,695,643 | ) | (1,219,436,703 | ) | (2,181,412,341 | ) | ||||||
| Proceeds from sales or maturities of short-term U.S. government and agency obligations |
1,595,758,281 | 1,245,266,414 | 1,985,795,270 | |||||||||
| Net amortization and accretion on short-term U.S. government and agency obligations |
(135,814 | ) | (197,253 | ) | (209,600 | ) | ||||||
| Net realized gain (loss) on investments |
3,035 | (13,833 | ) | (4,527 | ) | |||||||
| Change in unrealized appreciation/depreciation on investments |
12,347,563 | 30,986,352 | 8,704,656 | |||||||||
| Increase (Decrease) in management fee payable |
(228,916 | ) | 2,264 | 166,305 | ||||||||
|
|
|
|
|
|
|
|||||||
| Net cash provided by (used in) operating activities |
277,883,694 | 149,739,346 | (36,038,999 | ) | ||||||||
|
|
|
|
|
|
|
|||||||
| Cash flow from financing activities |
||||||||||||
| Proceeds from addition of shares |
124,524,909 | 216,403,570 | 369,766,231 | |||||||||
| Payment on shares redeemed |
(402,664,341 | ) | (366,185,318 | ) | (333,515,950 | ) | ||||||
|
|
|
|
|
|
|
|||||||
| Net cash provided by (used in) financing activities |
(278,139,432 | ) | (149,781,748 | ) | 36,250,281 | |||||||
|
|
|
|
|
|
|
|||||||
| Net increase (decrease) in cash |
(255,738 | ) | (42,402 | ) | 211,282 | |||||||
| Cash, beginning of period |
532,706 | 575,108 | 363,826 | |||||||||
|
|
|
|
|
|
|
|||||||
| Cash, end of period |
$ | 276,968 | $ | 532,706 | $ | 575,108 | ||||||
|
|
|
|
|
|
|
|||||||
See accompanying notes to financial statements.
227
Table of Contents
PROSHARES ULTRA BLOOMBERG COMMODITY
STATEMENTS OF FINANCIAL CONDITION
| December 31, 2015 | December 31, 2014 | |||||||
| Assets |
||||||||
| Cash |
$ | 211,629 | $ | 185,684 | ||||
| Short-term U.S. government and agency obligations (Note 3) (cost $7,084,754 and $2,754,883, respectively) |
7,084,065 | 2,754,900 | ||||||
| Unrealized appreciation on swap agreements |
32,372 | — | ||||||
|
|
|
|
|
|||||
| Total assets |
7,328,066 | 2,940,584 | ||||||
|
|
|
|
|
|||||
| Liabilities and shareholders’ equity |
||||||||
| Liabilities |
||||||||
| Management fee payable |
5,794 | 2,326 | ||||||
| Unrealized depreciation on swap agreements |
216,288 | 331,338 | ||||||
|
|
|
|
|
|||||
| Total liabilities |
222,082 | 333,664 | ||||||
|
|
|
|
|
|||||
| Commitments and Contingencies (Note 2) |
||||||||
| Shareholders’ equity |
||||||||
| Shareholders’ equity |
7,105,984 | 2,606,920 | ||||||
|
|
|
|
|
|||||
| Total liabilities and shareholders’ equity |
$ | 7,328,066 | $ | 2,940,584 | ||||
|
|
|
|
|
|||||
| Shares outstanding (Note 1) |
249,965 | 50,004 | ||||||
|
|
|
|
|
|||||
| Net asset value per share (Note 1) |
$ | 28.43 | $ | 52.13 | ||||
|
|
|
|
|
|||||
| Market value per share (Note 1) (Note 2) |
$ | 28.07 | $ | 51.44 | ||||
|
|
|
|
|
|||||
See accompanying notes to financial statements.
228
Table of Contents
PROSHARES ULTRA BLOOMBERG COMMODITY
SCHEDULE OF INVESTMENTS
DECEMBER 31, 2015
| Principal Amount | Value | |||||||
| Short-term U.S. government and agency obligations |
| |||||||
| (100% of shareholders’ equity) |
||||||||
| U.S. Treasury Bills: |
||||||||
| 0.032% due 02/04/16† |
$ | 3,527,000 | $ | 3,526,742 | ||||
| 0.000% due 02/25/16† |
2,558,000 | 2,557,723 | ||||||
| 0.060% due 03/24/16† |
1,000,000 | 999,600 | ||||||
|
|
|
|||||||
| Total short-term U.S. government and agency obligations (cost $7,084,754) |
$ | 7,084,065 | ||||||
|
|
|
|||||||
Swap Agreements^
| Rate Paid (Received)* |
Termination Date | Notional Amount at Value** |
Unrealized Appreciation (Depreciation) |
|||||||||||||
| Swap agreement with Citibank N.A. based on Bloomberg Commodity Index |
0.18 | % | 01/06/16 | $ | 1,622,466 | $ | 32,372 | |||||||||
| Swap agreement with Deutsche Bank AG based on Bloomberg Commodity Index |
0.25 | 01/06/16 | 6,571,903 | (82,976 | ) | |||||||||||
| Swap agreement with Goldman Sachs International based on Bloomberg Commodity Index |
0.25 | 01/06/16 | 4,426,279 | (60,830 | ) | |||||||||||
| Swap agreement with UBS AG based on Bloomberg Commodity Index |
0.60 | 01/06/16 | 1,576,626 | (72,482 | ) | |||||||||||
|
|
|
|||||||||||||||
| $ | (183,916 | ) | ||||||||||||||
|
|
|
|||||||||||||||
| † | All or partial amount pledged as collateral for swap agreements. |
| ^ | The positions and counterparties herein are as of December 31, 2015. The Funds continually evaluate different counterparties for their transactions and counterparties are subject to change. New counterparties can be added at any time. |
| * | Reflects the floating financing rate, as of December 31, 2015, on the notional amount of the swap agreement paid to the counterparty or received from the counterparty, excluding any commissions. |
| ** | For swap agreements, a positive amount represents “long” exposure to the benchmark index. A negative amount represents “short” exposure to the benchmark index. |
See accompanying notes to financial statements.
229
Table of Contents
PROSHARES ULTRA BLOOMBERG COMMODITY
SCHEDULE OF INVESTMENTS
DECEMBER 31, 2014
| Principal Amount | Value | |||||||
| Short-term U.S. government and agency obligations |
||||||||
| (106% of shareholders’ equity) |
||||||||
| U.S. Treasury Bills: |
||||||||
| 0.051% due 01/08/15† |
$ | 984,000 | $ | 983,997 | ||||
| 0.019% due 02/19/15† |
1,288,000 | 1,287,966 | ||||||
| 0.047% due 04/30/15 |
483,000 | 482,937 | ||||||
|
|
|
|||||||
| Total short-term U.S. government and agency obligations (cost $2,754,883) |
$ | 2,754,900 | ||||||
|
|
|
|||||||
Swap Agreements^
| Rate Paid (Received)* |
Termination Date | Notional Amount at Value** |
Unrealized Appreciation (Depreciation) |
|||||||||||||
| Swap agreement with Deutsche Bank AG based on Bloomberg Commodity Index |
0.25 | % | 01/06/15 | $ | 2,207,567 | $ | (143,751 | ) | ||||||||
| Swap agreement with Goldman Sachs International based on Bloomberg Commodity Index |
0.25 | 01/06/15 | 2,221,450 | (138,532 | ) | |||||||||||
| Swap agreement with UBS AG based on Bloomberg Commodity Index |
0.60 | 01/06/15 | 780,251 | (49,055 | ) | |||||||||||
|
|
|
|||||||||||||||
| $ | (331,338 | ) | ||||||||||||||
|
|
|
|||||||||||||||
| † | All or partial amount pledged as collateral for swap agreements. |
| ^ | The positions and counterparties herein are as of December 31, 2014. The Funds continually evaluate different counterparties for their transactions and counterparties are subject to change. New counterparties can be added at any time. |
| * | Reflects the floating financing rate, as of December 31, 2014, on the notional amount of the swap agreement paid to the counterparty or received from the counterparty, excluding any commissions. |
| ** | For swap agreements, a positive amount represents “long” exposure to the benchmark index. A negative amount represents “short” exposure to the benchmark index. |
See accompanying notes to financial statements.
230
Table of Contents
PROSHARES ULTRA BLOOMBERG COMMODITY
STATEMENTS OF OPERATIONS
FOR THE YEARS ENDED DECEMBER 31, 2015, 2014 and 2013
| Year ended December 31, 2015 |
Year ended December 31, 2014 |
Year ended December 31, 2013 |
||||||||||
| Investment Income |
||||||||||||
| Interest |
$ | 733 | $ | 1,330 | $ | 2,066 | ||||||
|
|
|
|
|
|
|
|||||||
| Expenses |
||||||||||||
| Management fee |
34,275 | 32,321 | 40,543 | |||||||||
|
|
|
|
|
|
|
|||||||
| Total expenses |
34,275 | 32,321 | 40,543 | |||||||||
|
|
|
|
|
|
|
|||||||
| Net investment income (loss) |
(33,542 | ) | (30,991 | ) | (38,477 | ) | ||||||
|
|
|
|
|
|
|
|||||||
| Realized and unrealized gain (loss) on investment activity |
||||||||||||
| Net realized gain (loss) on |
||||||||||||
| Swap agreements |
(2,951,820 | ) | (1,065,622 | ) | (1,254,251 | ) | ||||||
| Short-term U.S. government and agency obligations |
(351 | ) | 43 | (44 | ) | |||||||
|
|
|
|
|
|
|
|||||||
| Net realized gain (loss) |
(2,952,171 | ) | (1,065,579 | ) | (1,254,295 | ) | ||||||
|
|
|
|
|
|
|
|||||||
| Change in net unrealized appreciation/depreciation on |
||||||||||||
| Swap agreements |
147,422 | (346,416 | ) | 321,346 | ||||||||
| Short-term U.S. government and agency obligations |
(706 | ) | (44 | ) | (72 | ) | ||||||
|
|
|
|
|
|
|
|||||||
| Change in net unrealized appreciation/depreciation |
146,716 | (346,460 | ) | 321,274 | ||||||||
|
|
|
|
|
|
|
|||||||
| Net realized and unrealized gain (loss) |
(2,805,455 | ) | (1,412,039 | ) | (933,021 | ) | ||||||
|
|
|
|
|
|
|
|||||||
| Net income (loss) |
$ | (2,838,997 | ) | $ | (1,443,030 | ) | $ | (971,498 | ) | |||
|
|
|
|
|
|
|
|||||||
| Net income (loss) per weighted-average share (Note 1) |
$ | (29.55 | ) | $ | (32.81 | ) | $ | (19.64 | ) | |||
|
|
|
|
|
|
|
|||||||
| Weighted-average shares outstanding (Note 1) |
96,077 | 43,976 | 49,456 | |||||||||
|
|
|
|
|
|
|
|||||||
See accompanying notes to financial statements.
231
Table of Contents
PROSHARES ULTRA BLOOMBERG COMMODITY
STATEMENTS OF CHANGES IN SHAREHOLDERS’ EQUITY
FOR THE YEARS ENDED DECEMBER 31, 2015, 2014 and 2013
| Year ended December 31, 2015 |
Year ended December 31, 2014 |
Year ended December 31, 2013 |
||||||||||
| Shareholders’ equity, beginning of period |
$ | 2,606,920 | $ | 2,915,034 | $ | 6,097,211 | ||||||
| Addition of 225,000, 12,500 and 0 shares, respectively (Note 1) |
8,571,369 | 1,134,916 | — | |||||||||
| Redemption of 25,039, 0 and 25,000 shares, respectively (Note 1) |
(1,233,308 | ) | — | (2,210,679 | ) | |||||||
|
|
|
|
|
|
|
|||||||
| Net addition (redemption) of 199,961, 12,500 and (25,000) shares, respectively (Note 1) |
7,338,061 | 1,134,916 | (2,210,679 | ) | ||||||||
|
|
|
|
|
|
|
|||||||
| Net investment income (loss) |
(33,542 | ) | (30,991 | ) | (38,477 | ) | ||||||
| Net realized gain (loss) |
(2,952,171 | ) | (1,065,579 | ) | (1,254,295 | ) | ||||||
| Change in net unrealized appreciation/depreciation |
146,716 | (346,460 | ) | 321,274 | ||||||||
|
|
|
|
|
|
|
|||||||
| Net income (loss) |
(2,838,997 | ) | (1,443,030 | ) | (971,498 | ) | ||||||
|
|
|
|
|
|
|
|||||||
| Shareholders’ equity, end of period |
$ | 7,105,984 | $ | 2,606,920 | $ | 2,915,034 | ||||||
|
|
|
|
|
|
|
|||||||
See accompanying notes to financial statements.
232
Table of Contents
PROSHARES ULTRA BLOOMBERG COMMODITY
STATEMENTS OF CASH FLOWS
FOR THE YEARS ENDED DECEMBER 31, 2015, 2014 and 2013
| Year ended December 31, 2015 |
Year ended December 31, 2014 |
Year ended December 31, 2013 |
||||||||||
| Cash flow from operating activities |
||||||||||||
| Net income (loss) |
$ | (2,838,997 | ) | $ | (1,443,030 | ) | $ | (971,498 | ) | |||
| Adjustments to reconcile net income (loss) to net cash provided by (used in) operating activities: |
||||||||||||
| Purchases of short-term U.S. government and agency obligations |
(11,943,072 | ) | (9,482,798 | ) | (17,205,322 | ) | ||||||
| Proceeds from sales or maturities of short-term U.S. government and agency obligations |
7,613,583 | 9,545,915 | 20,631,535 | |||||||||
| Net amortization and accretion on short-term U.S. government and agency obligations |
(733 | ) | (1,330 | ) | (2,066 | ) | ||||||
| Net realized gain (loss) on investments |
351 | (43 | ) | 44 | ||||||||
| Change in unrealized appreciation/depreciation on investments |
(146,716 | ) | 346,460 | (321,274 | ) | |||||||
| Increase (Decrease) in management fee payable |
3,468 | (48 | ) | (2,644 | ) | |||||||
|
|
|
|
|
|
|
|||||||
| Net cash provided by (used in) operating activities |
(7,312,116 | ) | (1,034,874 | ) | 2,128,775 | |||||||
|
|
|
|
|
|
|
|||||||
| Cash flow from financing activities |
||||||||||||
| Proceeds from addition of shares |
8,571,369 | 1,134,916 | — | |||||||||
| Payment on shares redeemed |
(1,233,308 | ) | — | (2,210,679 | ) | |||||||
|
|
|
|
|
|
|
|||||||
| Net cash provided by (used in) financing activities |
7,338,061 | 1,134,916 | (2,210,679 | ) | ||||||||
|
|
|
|
|
|
|
|||||||
| Net increase (decrease) in cash |
25,945 | 100,042 | (81,904 | ) | ||||||||
| Cash, beginning of period |
185,684 | 85,642 | 167,546 | |||||||||
|
|
|
|
|
|
|
|||||||
| Cash, end of period |
$ | 211,629 | $ | 185,684 | $ | 85,642 | ||||||
|
|
|
|
|
|
|
|||||||
See accompanying notes to financial statements.
233
Table of Contents
PROSHARES ULTRA BLOOMBERG CRUDE OIL
STATEMENTS OF FINANCIAL CONDITION
| December 31, 2015 | December 31, 2014 | |||||||
| Assets |
||||||||
| Cash |
$ | 4,008,379 | $ | 2,349,384 | ||||
| Segregated cash balances with brokers for futures contracts |
47,571,810 | 34,605,120 | ||||||
| Short-term U.S. government and agency obligations (Note 3) (cost $797,652,302 and $467,195,638, respectively) |
797,650,543 | 467,200,736 | ||||||
| Receivable from capital shares sold |
4,894,509 | 28,726,173 | ||||||
| Receivable on open futures contracts |
5,150,763 | — | ||||||
|
|
|
|
|
|||||
| Total assets |
859,276,004 | 532,881,413 | ||||||
|
|
|
|
|
|||||
| Liabilities and shareholders’ equity |
||||||||
| Liabilities |
||||||||
| Payable for capital shares redeemed |
2,514,956 | — | ||||||
| Payable on open futures contracts |
— | 5,817,266 | ||||||
| Brokerage commissions and fees payable |
25,000 | — | ||||||
| Management fee payable |
636,984 | 320,062 | ||||||
| Unrealized depreciation on swap agreements |
72,176,589 | 76,181,097 | ||||||
|
|
|
|
|
|||||
| Total liabilities |
75,353,529 | 82,318,425 | ||||||
|
|
|
|
|
|||||
| Commitments and Contingencies (Note 2) |
||||||||
| Shareholders’ equity |
||||||||
| Shareholders’ equity |
783,922,475 | 450,562,988 | ||||||
|
|
|
|
|
|||||
| Total liabilities and shareholders’ equity |
$ | 859,276,004 | $ | 532,881,413 | ||||
|
|
|
|
|
|||||
| Shares outstanding (Note 1) |
62,327,867 | 8,879,834 | ||||||
|
|
|
|
|
|||||
| Net asset value per share (Note 1) |
$ | 12.58 | $ | 50.74 | ||||
|
|
|
|
|
|||||
| Market value per share (Note 1) (Note 2) |
$ | 12.54 | $ | 51.85 | ||||
|
|
|
|
|
|||||
See accompanying notes to financial statements.
234
Table of Contents
PROSHARES ULTRA BLOOMBERG CRUDE OIL
SCHEDULE OF INVESTMENTS
DECEMBER 31, 2015
| Principal Amount | Value | |||||||
| Short-term U.S. government and agency obligations |
| |||||||
| (102% of shareholders’ equity) |
||||||||
| U.S. Treasury Bills: |
||||||||
| 0.087% due 01/07/16 |
$ | 55,485,000 | $ | 55,484,817 | ||||
| 0.040% due 01/14/16 |
18,803,000 | 18,802,530 | ||||||
| 0.001% due 01/21/16 |
6,843,000 | 6,842,709 | ||||||
| 0.094% due 01/28/16† |
91,564,000 | 91,556,061 | ||||||
| 0.025% due 02/04/16 |
80,508,000 | 80,502,107 | ||||||
| 0.005% due 02/11/16† |
74,430,000 | 74,420,183 | ||||||
| 0.119% due 02/18/16† |
68,546,000 | 68,536,150 | ||||||
| 0.013% due 02/25/16† |
38,009,000 | 38,004,884 | ||||||
| 0.202% due 03/03/16† |
86,544,000 | 86,530,525 | ||||||
| 0.200% due 03/10/16† |
25,596,000 | 25,590,604 | ||||||
| 0.147% due 03/17/16† |
73,235,000 | 73,220,895 | ||||||
| 0.178% due 03/24/16† |
44,753,000 | 44,735,099 | ||||||
| 0.356% due 05/26/16† |
133,631,000 | 133,423,979 | ||||||
|
|
|
|||||||
| Total short-term U.S. government and agency obligations (cost $797,652,302) |
$ | 797,650,543 | ||||||
|
|
|
|||||||
Futures Contracts Purchased††
| Number of Contracts |
Notional Amount at Value |
Unrealized Appreciation (Depreciation) |
||||||||||
| Crude Oil - NYMEX, expires March 2016 |
11,089 | $ | 423,267,130 | $ | (17,929,314 | ) | ||||||
Swap Agreements^
| Rate Paid (Received)* |
Termination Date | Notional Amount at Value** |
Unrealized Appreciation (Depreciation) |
|||||||||||||
| Swap agreement with Citibank N.A. based on Bloomberg Crude Oil Subindex |
0.18 | % | 01/06/16 | $ | 158,594,078 | $ | (2,509,989 | ) | ||||||||
| Swap agreement with Deutsche Bank AG based on Bloomberg Crude Oil Subindex |
0.25 | 01/06/16 | 292,553,469 | (20,221,872 | ) | |||||||||||
| Swap agreement with Goldman Sachs International based on Bloomberg Crude Oil Subindex |
0.25 | 01/06/16 | 298,419,036 | (20,806,119 | ) | |||||||||||
| Swap agreement with Societe Generale S.A. based on Bloomberg Crude Oil Subindex |
0.25 | 01/06/16 | 100,733,521 | (6,357,459 | ) | |||||||||||
| Swap agreement with UBS AG based on Bloomberg Crude Oil Subindex |
0.25 | 01/06/16 | 294,338,185 | (22,281,150 | ) | |||||||||||
|
|
|
|||||||||||||||
| $ | (72,176,589 | ) | ||||||||||||||
|
|
|
|||||||||||||||
| † | All or partial amount pledged as collateral for swap agreements and/or futures contracts. |
| †† | Cash collateral in the amount of $47,571,810 was pledged to cover margin requirements for open futures contracts as of December 31, 2015. |
| ^ | The positions and counterparties herein are as of December 31, 2015. The Funds continually evaluate different counterparties for their transactions and counterparties are subject to change. New counterparties can be added at any time. |
| * | Reflects the floating financing rate, as of December 31, 2015, on the notional amount of the swap agreement paid to the counterparty or received from the counterparty, excluding any commissions. |
| ** | For swap agreements, a positive amount represents “long” exposure to the benchmark index. A negative amount represents “short” exposure to the benchmark index. |
See accompanying notes to financial statements.
235
Table of Contents
PROSHARES ULTRA BLOOMBERG CRUDE OIL
SCHEDULE OF INVESTMENTS
DECEMBER 31, 2014
| Principal Amount | Value | |||||||
| Short-term U.S. government and agency obligations |
| |||||||
| (104% of shareholders’ equity) |
||||||||
| U.S. Treasury Bills: |
||||||||
| 0.051% due 01/08/15 |
$ | 14,590,000 | $ | 14,589,964 | ||||
| 0.015% due 01/22/15 |
20,210,000 | 20,209,663 | ||||||
| 0.009% due 01/29/15 |
13,133,000 | 13,132,803 | ||||||
| 0.017% due 02/19/15 |
19,325,000 | 19,324,485 | ||||||
| 0.020% due 03/05/15† |
85,597,000 | 85,594,789 | ||||||
| 0.014% due 03/12/15 |
50,156,000 | 50,154,077 | ||||||
| 0.039% due 04/16/15† |
23,346,000 | 23,344,314 | ||||||
| 0.049% due 04/30/15† |
50,260,000 | 50,253,410 | ||||||
| 0.061% due 05/14/15† |
15,454,000 | 15,451,450 | ||||||
| 0.051% due 05/21/15† |
60,018,000 | 60,006,413 | ||||||
| 0.071% due 05/28/15† |
40,567,000 | 40,557,129 | ||||||
| 0.074% due 06/04/15† |
72,011,000 | 71,988,046 | ||||||
| 0.030% due 06/11/15 |
2,595,000 | 2,594,193 | ||||||
|
|
|
|||||||
| Total short-term U.S. government and agency obligations (cost $467,195,638) |
$ | 467,200,736 | ||||||
|
|
|
|||||||
Futures Contracts Purchased††
| Number of Contracts |
Notional Amount at Value |
Unrealized Appreciation (Depreciation) |
||||||||||
| Crude Oil - NYMEX, expires March 2015 |
7,232 | $ | 388,358,400 | $ | (46,474,787 | ) | ||||||
Swap Agreements^
| Rate Paid (Received)* |
Termination Date | Notional Amount at Value** |
Unrealized Appreciation (Depreciation) |
|||||||||||||
| Swap agreement with Deutsche Bank AG based on Bloomberg WTI Crude Oil Subindex |
0.25 | % | 01/06/15 | $ | 165,659,833 | $ | (24,223,667 | ) | ||||||||
| Swap agreement with Goldman Sachs International based on Bloomberg WTI Crude Oil Subindex |
0.25 | 01/06/15 | 151,188,034 | (24,285,701 | ) | |||||||||||
| Swap agreement with Societe Generale S.A. based on Bloomberg WTI Crude Oil Subindex |
0.25 | 01/06/15 | 39,239,652 | (5,528,160 | ) | |||||||||||
| Swap agreement with UBS AG based on Bloomberg WTI Crude Oil Subindex |
0.25 | 01/06/15 | 156,716,204 | (22,143,569 | ) | |||||||||||
|
|
|
|||||||||||||||
| $ | (76,181,097 | ) | ||||||||||||||
|
|
|
|||||||||||||||
| † | All or partial amount pledged as collateral for swap agreements. |
| †† | Cash collateral in the amount of $34,605,120 was pledged to cover margin requirements for open futures contracts as of December 31, 2014. |
| ^ | The positions and counterparties herein are as of December 31, 2014. The Funds continually evaluate different counterparties for their transactions and counterparties are subject to change. New counterparties can be added at any time. |
| * | Reflects the floating financing rate, as of December 31, 2014, on the notional amount of the swap agreement paid to the counterparty or received from the counterparty, excluding any commissions. |
| ** | For swap agreements, a positive amount represents “long” exposure to the benchmark index. A negative amount represents “short” exposure to the benchmark index. |
See accompanying notes to financial statements.
236
Table of Contents
PROSHARES ULTRA BLOOMBERG CRUDE OIL
STATEMENTS OF OPERATIONS
FOR THE YEARS ENDED DECEMBER 31, 2015, 2014 and 2013
| Year ended December 31, 2015 |
Year ended December 31, 2014 |
Year ended December 31, 2013 |
||||||||||
| Investment Income |
||||||||||||
| Interest |
$ | 396,158 | $ | 68,292 | $ | 135,291 | ||||||
|
|
|
|
|
|
|
|||||||
| Expenses |
||||||||||||
| Management fee |
8,230,180 | 1,769,248 | 2,275,701 | |||||||||
| Brokerage commissions and fees |
639,133 | 65,408 | 55,871 | |||||||||
|
|
|
|
|
|
|
|||||||
| Total expenses |
8,869,313 | 1,834,656 | 2,331,572 | |||||||||
|
|
|
|
|
|
|
|||||||
| Net investment income (loss) |
(8,473,155 | ) | (1,766,364 | ) | (2,196,281 | ) | ||||||
|
|
|
|
|
|
|
|||||||
| Realized and unrealized gain (loss) on investment activity |
||||||||||||
| Net realized gain (loss) on |
||||||||||||
| Futures contracts |
(297,227,106 | ) | (109,160,069 | ) | 52,686,859 | |||||||
| Swap agreements |
(598,949,990 | ) | (134,165,888 | ) | 68,059,089 | |||||||
| Short-term U.S. government and agency obligations |
22,728 | 11,806 | 11,289 | |||||||||
|
|
|
|
|
|
|
|||||||
| Net realized gain (loss) |
(896,154,368 | ) | (243,314,151 | ) | 120,757,237 | |||||||
|
|
|
|
|
|
|
|||||||
| Change in net unrealized appreciation/depreciation on |
||||||||||||
| Futures contracts |
28,545,473 | (47,101,448 | ) | (21,333,749 | ) | |||||||
| Swap agreements |
4,004,508 | (78,138,990 | ) | (31,375,727 | ) | |||||||
| Short-term U.S. government and agency obligations |
(6,857 | ) | (7,333 | ) | (5,591 | ) | ||||||
|
|
|
|
|
|
|
|||||||
| Change in net unrealized appreciation/depreciation |
32,543,124 | (125,247,771 | ) | (52,715,067 | ) | |||||||
|
|
|
|
|
|
|
|||||||
| Net realized and unrealized gain (loss) |
(863,611,244 | ) | (368,561,922 | ) | 68,042,170 | |||||||
|
|
|
|
|
|
|
|||||||
| Net income (loss) |
$ | (872,084,399 | ) | $ | (370,328,286 | ) | $ | 65,845,889 | ||||
|
|
|
|
|
|
|
|||||||
| Net income (loss) per weighted-average share (Note 1) |
$ | (28.93 | ) | $ | (229.11 | ) | $ | 42.70 | ||||
|
|
|
|
|
|
|
|||||||
| Weighted-average shares outstanding (Note 1) |
30,146,006 | 1,616,382 | 1,541,998 | |||||||||
|
|
|
|
|
|
|
|||||||
See accompanying notes to financial statements.
237
Table of Contents
PROSHARES ULTRA BLOOMBERG CRUDE OIL
STATEMENTS OF CHANGES IN SHAREHOLDERS’ EQUITY
FOR THE YEARS ENDED DECEMBER 31, 2015, 2014 and 2013
| Year ended December 31, 2015 |
Year ended December 31, 2014 |
Year ended December 31, 2013 |
||||||||||
| Shareholders’ equity, beginning of period |
$ | 450,562,988 | $ | 142,773,429 | $ | 483,508,964 | ||||||
| Addition of 86,830,000, 10,080,000 and 2,290,000 shares, respectively (Note 1) |
2,505,616,928 | 1,007,757,253 | 334,161,435 | |||||||||
| Redemption of 33,381,967, 2,090,000 and 4,690,000 shares, respectively (Note 1) |
(1,300,173,042 | ) | (329,639,408 | ) | (740,742,859 | ) | ||||||
|
|
|
|
|
|
|
|||||||
| Net addition (redemption) of 53,448,033, 7,990,000 and (2,400,000) shares, respectively (Note 1) |
1,205,443,886 | 678,117,845 | (406,581,424 | ) | ||||||||
|
|
|
|
|
|
|
|||||||
| Net investment income (loss) |
(8,473,155 | ) | (1,766,364 | ) | (2,196,281 | ) | ||||||
| Net realized gain (loss) |
(896,154,368 | ) | (243,314,151 | ) | 120,757,237 | |||||||
| Change in net unrealized appreciation/depreciation |
32,543,124 | (125,247,771 | ) | (52,715,067 | ) | |||||||
|
|
|
|
|
|
|
|||||||
| Net income (loss) |
(872,084,399 | ) | (370,328,286 | ) | 65,845,889 | |||||||
|
|
|
|
|
|
|
|||||||
| Shareholders’ equity, end of period |
$ | 783,922,475 | $ | 450,562,988 | $ | 142,773,429 | ||||||
|
|
|
|
|
|
|
|||||||
See accompanying notes to financial statements.
238
Table of Contents
PROSHARES ULTRA BLOOMBERG CRUDE OIL
STATEMENTS OF CASH FLOWS
FOR THE YEARS ENDED DECEMBER 31, 2015, 2014 and 2013
| Year ended December 31, 2015 |
Year ended December 31, 2014 |
Year ended December 31, 2013 |
||||||||||
| Cash flow from operating activities |
||||||||||||
| Net income (loss) |
$ | (872,084,399 | ) | $ | (370,328,286 | ) | $ | 65,845,889 | ||||
| Adjustments to reconcile net income (loss) to net cash provided by (used in) operating activities: |
||||||||||||
| Decrease (Increase) in segregated cash balances with brokers for futures contracts |
(12,966,690 | ) | (30,783,225 | ) | 19,534,732 | |||||||
| Purchases of short-term U.S. government and agency obligations |
(4,300,690,737 | ) | (1,059,239,810 | ) | (1,333,100,462 | ) | ||||||
| Proceeds from sales or maturities of short-term U.S. government and agency obligations |
3,970,639,458 | 729,547,449 | 1,633,468,496 | |||||||||
| Net amortization and accretion on short-term U.S. government and agency obligations |
(382,657 | ) | (68,292 | ) | (135,296 | ) | ||||||
| Net realized gain (loss) on investments |
(22,728 | ) | (11,806 | ) | (11,289 | ) | ||||||
| Change in unrealized appreciation/depreciation on investments |
(3,997,651 | ) | 78,146,323 | 31,381,318 | ||||||||
| Decrease (Increase) in receivable on futures contracts |
(5,150,763 | ) | — | 3,430,415 | ||||||||
| Increase (Decrease) in management fee payable |
316,922 | 185,707 | (267,682 | ) | ||||||||
| Increase (Decrease) in brokerage commissions and fees payable |
25,000 | — | — | |||||||||
| Increase (Decrease) in payable on futures contracts |
(5,817,266 | ) | 4,820,056 | 997,210 | ||||||||
|
|
|
|
|
|
|
|||||||
| Net cash provided by (used in) operating activities |
(1,230,131,511 | ) | (647,731,884 | ) | 421,143,331 | |||||||
|
|
|
|
|
|
|
|||||||
| Cash flow from financing activities |
||||||||||||
| Proceeds from addition of shares |
2,529,448,592 | 979,031,080 | 334,161,435 | |||||||||
| Payment on shares redeemed |
(1,297,658,086 | ) | (329,639,408 | ) | (756,814,102 | ) | ||||||
|
|
|
|
|
|
|
|||||||
| Net cash provided by (used in) financing activities |
1,231,790,506 | 649,391,672 | (422,652,667 | ) | ||||||||
|
|
|
|
|
|
|
|||||||
| Net increase (decrease) in cash |
1,658,995 | 1,659,788 | (1,509,336 | ) | ||||||||
| Cash, beginning of period |
2,349,384 | 689,596 | 2,198,932 | |||||||||
|
|
|
|
|
|
|
|||||||
| Cash, end of period |
$ | 4,008,379 | $ | 2,349,384 | $ | 689,596 | ||||||
|
|
|
|
|
|
|
|||||||
See accompanying notes to financial statements.
239
Table of Contents
PROSHARES ULTRA BLOOMBERG NATURAL GAS
STATEMENTS OF FINANCIAL CONDITION
| December 31, 2015 | December 31, 2014 | |||||||
| Assets |
||||||||
| Cash |
$ | 1,411,137 | $ | 1,653,582 | ||||
| Segregated cash balances with brokers for futures contracts |
7,595,280 | 21,134,080 | ||||||
| Short-term U.S. government and agency obligations (Note 3) (cost $26,806,648 and $53,408,848, respectively) |
26,807,731 | 53,410,227 | ||||||
| Receivable from capital shares sold |
— | 3,853,422 | ||||||
| Receivable on open futures contracts |
3,065,769 | — | ||||||
|
|
|
|
|
|||||
| Total assets |
38,879,917 | 80,051,311 | ||||||
|
|
|
|
|
|||||
| Liabilities and shareholders’ equity |
||||||||
| Liabilities |
||||||||
| Payable on open futures contracts |
— | 9,552,314 | ||||||
| Brokerage commissions and fees payable |
3,623 | — | ||||||
| Management fee payable |
25,110 | 65,790 | ||||||
|
|
|
|
|
|||||
| Total liabilities |
28,733 | 9,618,104 | ||||||
|
|
|
|
|
|||||
| Commitments and Contingencies (Note 2) |
||||||||
| Shareholders’ equity |
||||||||
| Shareholders’ equity |
38,851,184 | 70,433,207 | ||||||
|
|
|
|
|
|||||
| Total liabilities and shareholders’ equity |
$ | 38,879,917 | $ | 80,051,311 | ||||
|
|
|
|
|
|||||
| Shares outstanding (Note 1) |
2,092,170 | 1,142,485 | ||||||
|
|
|
|
|
|||||
| Net asset value per share (Note 1) |
$ | 18.57 | $ | 61.65 | ||||
|
|
|
|
|
|||||
| Market value per share (Note 1) (Note 2) |
$ | 18.48 | $ | 63.12 | ||||
|
|
|
|
|
|||||
See accompanying notes to financial statements.
240
Table of Contents
PROSHARES ULTRA BLOOMBERG NATURAL GAS
SCHEDULE OF INVESTMENTS
DECEMBER 31, 2015
| Principal Amount | Value | |||||||
| Short-term U.S. government and agency obligations |
| |||||||
| (69% of shareholders’ equity) |
||||||||
| U.S. Treasury Bills: |
||||||||
| 0.080% due 01/07/16 |
$ | 1,137,000 | $ | 1,136,996 | ||||
| 0.165% due 01/28/16 |
861,000 | 860,925 | ||||||
| 0.035% due 02/04/16 |
1,316,000 | 1,315,904 | ||||||
| 0.000% due 02/25/16 |
588,000 | 587,936 | ||||||
| 0.151% due 03/03/16 |
3,234,000 | 3,233,497 | ||||||
| 0.200% due 03/10/16 |
1,823,000 | 1,822,616 | ||||||
| 0.186% due 03/24/16 |
17,857,000 | 17,849,857 | ||||||
|
|
|
|||||||
| Total short-term U.S. government and agency obligations (cost $26,806,648) |
$ | 26,807,731 | ||||||
|
|
|
|||||||
Futures Contracts Purchased††
| Number of Contracts |
Notional Amount at Value |
Unrealized Appreciation (Depreciation) |
||||||||||
| Natural Gas - NYMEX, expires March 2016 |
3,288 | $ | 77,695,440 | $ | 6,312,879 | |||||||
| †† | Cash collateral in the amount of $7,595,280 was pledged to cover margin requirements for open futures contracts as of December 31, 2015. |
See accompanying notes to financial statements.
241
Table of Contents
PROSHARES ULTRA BLOOMBERG NATURAL GAS
SCHEDULE OF INVESTMENTS
DECEMBER 31, 2014
| Principal Amount | Value | |||||||
| Short-term U.S. government and agency obligations |
| |||||||
| (76% of shareholders’ equity) |
||||||||
| U.S. Treasury Bills: |
||||||||
| 0.051% due 01/08/15 |
$ | 3,173,000 | $ | 3,172,992 | ||||
| 0.008% due 01/22/15 |
2,973,000 | 2,972,950 | ||||||
| 0.010% due 01/29/15 |
1,773,000 | 1,772,973 | ||||||
| 0.018% due 02/12/15 |
2,356,000 | 2,355,946 | ||||||
| 0.024% due 03/05/15 |
3,145,000 | 3,144,919 | ||||||
| 0.015% due 03/12/15 |
2,011,000 | 2,010,923 | ||||||
| 0.037% due 04/16/15 |
3,175,000 | 3,174,771 | ||||||
| 0.054% due 04/30/15 |
9,743,000 | 9,741,723 | ||||||
| 0.061% due 05/14/15 |
10,840,000 | 10,838,211 | ||||||
| 0.056% due 05/21/15 |
5,588,000 | 5,586,921 | ||||||
| 0.060% due 05/28/15 |
8,640,000 | 8,637,898 | ||||||
|
|
|
|||||||
| Total short-term U.S. government and agency obligations (cost $53,408,848) |
$ | 53,410,227 | ||||||
|
|
|
|||||||
Futures Contracts Purchased††
| Number of Contracts |
Notional Amount at Value |
Unrealized Appreciation (Depreciation) |
||||||||||
| Natural Gas - NYMEX, expires March 2015 |
4,864 | $ | 140,861,440 | $ | (34,889,283 | ) | ||||||
| †† | Cash collateral in the amount of $21,134,080 was pledged to cover margin requirements for open futures contracts as of December 31, 2014. |
See accompanying notes to financial statements.
242
Table of Contents
PROSHARES ULTRA BLOOMBERG NATURAL GAS
STATEMENTS OF OPERATIONS
FOR THE YEARS ENDED DECEMBER 31, 2015, 2014 and 2013
| Year ended December 31, 2015 |
Year ended December 31, 2014 |
Year ended December 31, 2013 |
||||||||||
| Investment Income |
||||||||||||
| Interest |
$ | 20,167 | $ | 15,961 | $ | 33,341 | ||||||
|
|
|
|
|
|
|
|||||||
| Expenses |
||||||||||||
| Management fee |
574,158 | 455,794 | 707,598 | |||||||||
| Brokerage commissions and fees |
207,344 | 88,748 | 147,433 | |||||||||
|
|
|
|
|
|
|
|||||||
| Total expenses |
781,502 | 544,542 | 855,031 | |||||||||
|
|
|
|
|
|
|
|||||||
| Net investment income (loss) |
(761,335 | ) | (528,581 | ) | (821,690 | ) | ||||||
|
|
|
|
|
|
|
|||||||
| Realized and unrealized gain (loss) on investment activity |
||||||||||||
| Net realized gain (loss) on |
||||||||||||
| Futures contracts |
(100,776,817 | ) | (6,464,796 | ) | 41,418,165 | |||||||
| Short-term U.S. government and agency obligations |
4,341 | 5,068 | 4,691 | |||||||||
|
|
|
|
|
|
|
|||||||
| Net realized gain (loss) |
(100,772,476 | ) | (6,459,728 | ) | 41,422,856 | |||||||
|
|
|
|
|
|
|
|||||||
| Change in net unrealized appreciation/depreciation on |
||||||||||||
| Futures contracts |
41,202,162 | (31,232,744 | ) | 160,411 | ||||||||
| Short-term U.S. government and agency obligations |
(296 | ) | (1,537 | ) | 2,133 | |||||||
|
|
|
|
|
|
|
|||||||
| Change in net unrealized appreciation/depreciation |
41,201,866 | (31,234,281 | ) | 162,544 | ||||||||
|
|
|
|
|
|
|
|||||||
| Net realized and unrealized gain (loss) |
(59,570,610 | ) | (37,694,009 | ) | 41,585,400 | |||||||
|
|
|
|
|
|
|
|||||||
| Net income (loss) |
$ | (60,331,945 | ) | $ | (38,222,590 | ) | $ | 40,763,710 | ||||
|
|
|
|
|
|
|
|||||||
| Net income (loss) per weighted-average share (Note 1) |
$ | (39.48 | ) | $ | (109.67 | ) | $ | 80.44 | ||||
|
|
|
|
|
|
|
|||||||
| Weighted-average shares outstanding (Note 1) |
1,528,192 | 348,513 | 506,766 | |||||||||
|
|
|
|
|
|
|
|||||||
See accompanying notes to financial statements.
243
Table of Contents
PROSHARES ULTRA BLOOMBERG NATURAL GAS
STATEMENTS OF CHANGES IN SHAREHOLDERS’ EQUITY
FOR THE YEARS ENDED DECEMBER 31, 2015, 2014 and 2013
| Year ended December 31, 2015 |
Year ended December 31, 2014 |
Year ended December 31, 2013 |
||||||||||
| Shareholders’ equity, beginning of period |
$ | 70,433,207 | $ | 62,915,779 | $ | 73,019,370 | ||||||
| Addition of 2,137,500, 1,437,500 and 1,350,000 shares, respectively (Note 1) |
83,526,876 | 171,856,215 | 182,988,911 | |||||||||
| Redemption of 1,187,815, 700,000 and 1,412,500 shares, respectively (Note 1) |
(54,776,954 | ) | (126,116,197 | ) | (233,856,212 | ) | ||||||
|
|
|
|
|
|
|
|||||||
| Net addition (redemption) of 949,685, 737,500 and (62,500) shares, respectively (Note 1) |
28,749,922 | 45,740,018 | (50,867,301 | ) | ||||||||
|
|
|
|
|
|
|
|||||||
| Net investment income (loss) |
(761,335 | ) | (528,581 | ) | (821,690 | ) | ||||||
| Net realized gain (loss) |
(100,772,476 | ) | (6,459,728 | ) | 41,422,856 | |||||||
| Change in net unrealized appreciation/depreciation |
41,201,866 | (31,234,281 | ) | 162,544 | ||||||||
|
|
|
|
|
|
|
|||||||
| Net income (loss) |
(60,331,945 | ) | (38,222,590 | ) | 40,763,710 | |||||||
|
|
|
|
|
|
|
|||||||
| Shareholders’ equity, end of period |
$ | 38,851,184 | $ | 70,433,207 | $ | 62,915,779 | ||||||
|
|
|
|
|
|
|
|||||||
See accompanying notes to financial statements.
244
Table of Contents
PROSHARES ULTRA BLOOMBERG NATURAL GAS
STATEMENTS OF CASH FLOWS
FOR THE YEARS ENDED DECEMBER 31, 2015, 2014 AND 2013
| Year ended December 31, 2015 |
Year ended December 31, 2014 |
Year ended December 31, 2013 |
||||||||||
| Cash flow from operating activities |
||||||||||||
| Net income (loss) |
$ | (60,331,945 | ) | $ | (38,222,590 | ) | $ | 40,763,710 | ||||
| Adjustments to reconcile net income (loss) to net cash provided by (used in) operating activities: |
||||||||||||
| Decrease (Increase) in segregated cash balances with brokers for futures contracts |
13,538,800 | (14,531,880 | ) | 3,661,890 | ||||||||
| Purchases of short-term U.S. government and agency obligations |
(262,203,648 | ) | (269,350,242 | ) | (417,636,625 | ) | ||||||
| Proceeds from sales or maturities of short-term U.S. government and agency obligations |
288,829,035 | 274,880,518 | 423,069,003 | |||||||||
| Net amortization and accretion on short-term U.S. government and agency obligations |
(18,846 | ) | (15,961 | ) | (33,341 | ) | ||||||
| Net realized gain (loss) on investments |
(4,341 | ) | (5,068 | ) | (4,691 | ) | ||||||
| Change in unrealized appreciation/depreciation on investments |
296 | 1,537 | (2,133 | ) | ||||||||
| Decrease (Increase) in receivable on futures contracts |
(3,065,769 | ) | — | — | ||||||||
| Increase (Decrease) in management fee payable |
(40,680 | ) | (15,937 | ) | 29,802 | |||||||
| Increase (Decrease) in brokerage commissions and fees payable |
3,623 | — | — | |||||||||
| Increase (Decrease) in payable on futures contracts |
(9,552,314 | ) | 3,923,782 | 736,749 | ||||||||
|
|
|
|
|
|
|
|||||||
| Net cash provided by (used in) operating activities |
(32,845,789 | ) | (43,335,841 | ) | 50,584,364 | |||||||
|
|
|
|
|
|
|
|||||||
| Cash flow from financing activities |
||||||||||||
| Proceeds from addition of shares |
87,380,298 | 168,002,793 | 182,988,911 | |||||||||
| Payment on shares redeemed |
(54,776,954 | ) | (126,116,197 | ) | (233,856,212 | ) | ||||||
|
|
|
|
|
|
|
|||||||
| Net cash provided by (used in) financing activities |
32,603,344 | 41,886,596 | (50,867,301 | ) | ||||||||
|
|
|
|
|
|
|
|||||||
| Net increase (decrease) in cash |
(242,445 | ) | (1,449,245 | ) | (282,937 | ) | ||||||
| Cash, beginning of period |
1,653,582 | 3,102,827 | 3,385,764 | |||||||||
|
|
|
|
|
|
|
|||||||
| Cash, end of period |
$ | 1,411,137 | $ | 1,653,582 | $ | 3,102,827 | ||||||
|
|
|
|
|
|
|
|||||||
See accompanying notes to financial statements.
245
Table of Contents
STATEMENTS OF FINANCIAL CONDITION
| December 31, 2015 | December 31, 2014 | |||||||
| Assets |
||||||||
| Cash |
$ | 251,524 | $ | 104,145 | ||||
| Segregated cash balances with brokers for futures contracts |
8,250 | 8,800 | ||||||
| Short-term U.S. government and agency obligations (Note 3) (cost $71,908,280 and $101,925,636, respectively) |
71,912,587 | 101,927,857 | ||||||
| Unrealized appreciation on forward agreements |
— | 2,051,154 | ||||||
| Receivable on open futures contracts |
80 | — | ||||||
|
|
|
|
|
|||||
| Total assets |
72,172,441 | 104,091,956 | ||||||
|
|
|
|
|
|||||
| Liabilities and shareholders’ equity |
||||||||
| Liabilities |
||||||||
| Payable for capital shares redeemed |
— | 1,999,718 | ||||||
| Payable on open futures contracts |
— | 3,260 | ||||||
| Management fee payable |
57,031 | 85,633 | ||||||
| Unrealized depreciation on forward agreements |
2,250,595 | — | ||||||
|
|
|
|
|
|||||
| Total liabilities |
2,307,626 | 2,088,611 | ||||||
|
|
|
|
|
|||||
| Commitments and Contingencies (Note 2) |
||||||||
| Shareholders’ equity |
||||||||
| Shareholders’ equity |
69,864,815 | 102,003,345 | ||||||
|
|
|
|
|
|||||
| Total liabilities and shareholders’ equity |
$ | 72,172,441 | $ | 104,091,956 | ||||
|
|
|
|
|
|||||
| Shares outstanding |
2,350,014 | 2,550,014 | ||||||
|
|
|
|
|
|||||
| Net asset value per share |
$ | 29.73 | $ | 40.00 | ||||
|
|
|
|
|
|||||
| Market value per share (Note 2) |
$ | 29.73 | $ | 38.41 | ||||
|
|
|
|
|
|||||
See accompanying notes to financial statements.
246
Table of Contents
PROSHARES ULTRA GOLD
SCHEDULE OF INVESTMENTS
DECEMBER 31, 2015
| Principal Amount | Value | |||||||
| Short-term U.S. government and agency obligations |
||||||||
| (103% of shareholders’ equity) |
||||||||
| U.S. Treasury Bills: |
||||||||
| 0.135% due 01/07/16† |
$ | 7,778,000 | $ | 7,777,974 | ||||
| 0.110% due 01/28/16 |
9,751,000 | 9,750,155 | ||||||
| 0.000% due 02/04/16† |
1,484,000 | 1,483,891 | ||||||
| 0.000% due 02/25/16† |
2,659,000 | 2,658,712 | ||||||
| 0.208% due 03/03/16 |
22,780,000 | 22,776,453 | ||||||
| 0.240% due 03/17/16 |
1,450,000 | 1,449,721 | ||||||
| 0.184% due 03/24/16† |
18,286,000 | 18,278,686 | ||||||
| 0.353% due 05/26/16† |
7,749,000 | 7,736,995 | ||||||
|
|
|
|||||||
| Total short-term U.S. government and agency obligations |
||||||||
| (cost $71,908,280) |
$ | 71,912,587 | ||||||
|
|
|
|||||||
Futures Contracts Purchased††
| Number of Contracts |
Notional Amount at Value |
Unrealized Appreciation (Depreciation) |
||||||||||
| Gold Futures - COMEX, expires February 2016 |
2 | $ | 212,040 | $ | (5,200 | ) | ||||||
Forward Agreements^
| Rate Paid (Received)* |
Settlement Date | Commitment to (Deliver)/Receive |
Notional Amount at Value** |
Unrealized Appreciation (Depreciation) |
||||||||||||||||
| Forward agreements with Citibank N.A. based on 0.995 Fine Troy Ounce gold |
0.00 | % | 01/06/16 | $ | 3,000 | $ | 3,179,880 | $ | (4,614 | ) | ||||||||||
| Forward agreements with Deutsche Bank AG based on 0.995 Fine Troy Ounce Gold |
0.35 | 01/06/16 | 63,900 | 67,734,639 | (1,049,383 | ) | ||||||||||||||
| Forward agreements with Goldman Sachs International based on 0.995 Fine Troy Ounce Gold |
0.25 | 01/06/16 | 23,620 | 25,036,255 | (520,730 | ) | ||||||||||||||
| Forward agreements with Societe Generale based on 0.995 Fine Troy Ounce Gold |
0.26 | 01/06/16 | 15,400 | 16,323,384 | (244,992 | ) | ||||||||||||||
| Forward agreements with UBS AG based on 0.995 Fine Troy Ounce Gold |
0.19 | 01/06/16 | 25,700 | 27,240,972 | (430,876 | ) | ||||||||||||||
|
|
|
|||||||||||||||||||
| $ | (2,250,595 | ) | ||||||||||||||||||
|
|
|
|||||||||||||||||||
| † | All or partial amount pledged as collateral for forward agreements and/or futures contracts. |
| †† | Cash collateral in the amount of $8,250 was pledged to cover margin requirements for open futures contracts as of December 31, 2015. |
| ^ | The positions and counterparties herein are as of December 31, 2015. The Funds continually evaluate different counterparties for their transactions and counterparties are subject to change. New counterparties can be added at any time. |
| * | Reflects the floating financing rate, as of December 31, 2015, on the notional amount of the forward agreement paid to the counterparty or received from the counterparty, excluding any commissions. |
| ** | For forward agreements, a positive amount represents “long” exposure to the underlying commodity. A negative amount represents “short” exposure to the underlying commodity. |
See accompanying notes to financial statements.
247
Table of Contents
PROSHARES ULTRA GOLD
SCHEDULE OF INVESTMENTS
DECEMBER 31, 2014
| Principal Amount | Value | |||||||
| Short-term U.S. government and agency obligations |
| |||||||
| (100% of shareholders’ equity) |
||||||||
| U.S. Treasury Bills: |
||||||||
| 0.051% due 01/08/15† |
$ | 13,004,000 | $ | 13,003,967 | ||||
| 0.010% due 01/29/15† |
2,843,000 | 2,842,957 | ||||||
| 0.010% due 02/19/15† |
17,175,000 | 17,174,542 | ||||||
| 0.045% due 04/30/15† |
11,287,000 | 11,285,520 | ||||||
| 0.057% due 05/14/15† |
37,832,000 | 37,825,758 | ||||||
| 0.061% due 05/21/15 |
3,373,000 | 3,372,349 | ||||||
| 0.078% due 06/04/15† |
16,428,000 | 16,422,764 | ||||||
|
|
|
|||||||
| Total short-term U.S. government and agency obligations |
||||||||
| (cost $101,925,636) |
$ | 101,927,857 | ||||||
|
|
|
|||||||
Futures Contracts Purchased††
| Number of Contracts |
Notional Amount at Value |
Unrealized Appreciation (Depreciation) |
||||||||||
| Gold Futures - COMEX, expires February 2015 |
2 | $ | 236,820 | $ | 4,580 | |||||||
Forward Agreements^
| Rate Paid (Received)* |
Settlement Date | Commitment to (Deliver)/Receive |
Notional Amount at Value** |
Unrealized Appreciation (Depreciation) |
||||||||||||||||
| Forward agreements with Deutsche Bank AG based on 0.995 Fine Troy Ounce Gold |
0.26 | % | 01/06/15 | $ | 90,800 | $ | 109,503,892 | $ | 1,231,694 | |||||||||||
| Forward agreements with Goldman Sachs International based on 0.995 Fine Troy Ounce Gold |
0.41 | 01/06/15 | 31,420 | 37,892,206 | 222,126 | |||||||||||||||
| Forward agreements with Societe Generale S.A. based on 0.995 Fine Troy Ounce Gold |
0.46 | 01/06/15 | 15,200 | 18,331,048 | 190,591 | |||||||||||||||
| Forward agreements with UBS AG based on 0.995 Fine Troy Ounce Gold |
0.36 | 01/06/15 | 31,600 | 38,109,284 | 406,743 | |||||||||||||||
|
|
|
|||||||||||||||||||
| $ | 2,051,154 | |||||||||||||||||||
|
|
|
|||||||||||||||||||
| † | All or partial amount pledged as collateral for forward agreements. |
| †† | Cash collateral in the amount of $8,800 was pledged to cover margin requirements for open futures contracts as of December 31, 2014. |
| ^ | The positions and counterparties herein are as of December 31, 2014. The Funds continually evaluate different counterparties for their transactions and counterparties are subject to change. New counterparties can be added at any time. |
| * | Reflects the floating financing rate, as of December 31, 2014, on the notional amount of the forward agreement paid to the counterparty or received from the counterparty, excluding any commissions. |
| ** | For forward agreements, a positive amount represents “long” exposure to the underlying commodity. A negative amount represents “short” exposure to the underlying commodity. |
See accompanying notes to financial statements.
248
Table of Contents
PROSHARES ULTRA GOLD
STATEMENTS OF OPERATIONS
FOR THE YEARS ENDED DECEMBER 31, 2015, 2014 AND 2013
| Year ended December 31, 2015 |
Year ended December 31, 2014 |
Year ended December 31, 2013 |
||||||||||
| Investment Income |
||||||||||||
| Interest |
$ | 42,700 | $ | 54,755 | $ | 130,437 | ||||||
|
|
|
|
|
|
|
|||||||
| Expenses |
||||||||||||
| Management fee |
839,083 | 1,212,064 | 2,055,613 | |||||||||
| Brokerage commissions and fees |
41 | 39 | 39 | |||||||||
|
|
|
|
|
|
|
|||||||
| Total expenses |
839,124 | 1,212,103 | 2,055,652 | |||||||||
|
|
|
|
|
|
|
|||||||
| Net investment income (loss) |
(796,424 | ) | (1,157,348 | ) | (1,925,215 | ) | ||||||
|
|
|
|
|
|
|
|||||||
| Realized and unrealized gain (loss) on investment activity |
||||||||||||
| Net realized gain (loss) on |
||||||||||||
| Futures contracts |
(16,180 | ) | (23,260 | ) | (97,160 | ) | ||||||
| Forward agreements |
(18,589,635 | ) | (9,651,073 | ) | (165,535,626 | ) | ||||||
| Short-term U.S. government and agency obligations |
(393 | ) | 1,361 | 7,780 | ||||||||
|
|
|
|
|
|
|
|||||||
| Net realized gain (loss) |
(18,606,208 | ) | (9,672,972 | ) | (165,625,006 | ) | ||||||
|
|
|
|
|
|
|
|||||||
| Change in net unrealized appreciation/depreciation on |
||||||||||||
| Futures contracts |
(9,780 | ) | 19,140 | 680 | ||||||||
| Forward agreements |
(4,301,749 | ) | 8,864,128 | 8,839,084 | ||||||||
| Short-term U.S. government and agency obligations |
2,086 | 5,375 | (19,303 | ) | ||||||||
|
|
|
|
|
|
|
|||||||
| Change in net unrealized appreciation/depreciation |
(4,309,443 | ) | 8,888,643 | 8,820,461 | ||||||||
|
|
|
|
|
|
|
|||||||
| Net realized and unrealized gain (loss) |
(22,915,651 | ) | (784,329 | ) | (156,804,545 | ) | ||||||
|
|
|
|
|
|
|
|||||||
| Net income (loss) |
$ | (23,712,075 | ) | $ | (1,941,677 | ) | $ | (158,729,760 | ) | |||
|
|
|
|
|
|
|
|||||||
| Net income (loss) per weighted-average share |
$ | (9.80 | ) | $ | (0.68 | ) | $ | (44.55 | ) | |||
|
|
|
|
|
|
|
|||||||
| Weighted-average shares outstanding |
2,418,918 | 2,838,096 | 3,562,617 | |||||||||
|
|
|
|
|
|
|
|||||||
See accompanying notes to financial statements.
249
Table of Contents
PROSHARES ULTRA GOLD
STATEMENTS OF CHANGES IN SHAREHOLDERS’ EQUITY
FOR THE YEARS ENDED DECEMBER 31, 2015, 2014 AND 2013
| Year ended December 31, 2015 |
Year ended December 31, 2014 |
Year ended December 31, 2013 |
||||||||||
| Shareholders’ equity, beginning of period |
$ | 102,003,345 | $ | 132,017,405 | $ | 335,054,752 | ||||||
| Addition of 150,000, 300,000 and 550,000 shares, respectively |
5,401,300 | 13,559,078 | 30,696,013 | |||||||||
| Redemption of 350,000, 950,000 and 1,350,000 shares, respectively |
(13,827,755 | ) | (41,631,461 | ) | (75,003,600 | ) | ||||||
|
|
|
|
|
|
|
|||||||
| Net addition (redemption) of (200,000), (650,000) and (800,000) shares, respectively |
(8,426,455 | ) | (28,072,383 | ) | (44,307,587 | ) | ||||||
|
|
|
|
|
|
|
|||||||
| Net investment income (loss) |
(796,424 | ) | (1,157,348 | ) | (1,925,215 | ) | ||||||
| Net realized gain (loss) |
(18,606,208 | ) | (9,672,972 | ) | (165,625,006 | ) | ||||||
| Change in net unrealized appreciation/depreciation |
(4,309,443 | ) | 8,888,643 | 8,820,461 | ||||||||
|
|
|
|
|
|
|
|||||||
| Net income (loss) |
(23,712,075 | ) | (1,941,677 | ) | (158,729,760 | ) | ||||||
|
|
|
|
|
|
|
|||||||
| Shareholders’ equity, end of period |
$ | 69,864,815 | $ | 102,003,345 | $ | 132,017,405 | ||||||
|
|
|
|
|
|
|
|||||||
See accompanying notes to financial statements.
250
Table of Contents
PROSHARES ULTRA GOLD
STATEMENTS OF CASH FLOWS
FOR THE YEARS ENDED DECEMBER 31, 2015, 2014 AND 2013
| Year ended December 31, 2015 |
Year ended December 31, 2014 |
Year ended December 31, 2013 |
||||||||||
| Cash flow from operating activities |
||||||||||||
| Net income (loss) |
$ | (23,712,075 | ) | $ | (1,941,677 | ) | $ | (158,729,760 | ) | |||
| Adjustments to reconcile net income (loss) to net cash provided by (used in) operating activities: |
||||||||||||
| Decrease (Increase) in segregated cash balances with brokers for futures contracts |
550 | 7,150 | (1,100 | ) | ||||||||
| Purchases of short-term U.S. government and agency obligations |
(260,988,119 | ) | (407,203,130 | ) | (923,993,097 | ) | ||||||
| Proceeds from sales or maturities of short-term U.S. government and agency obligations |
291,047,782 | 446,217,714 | 1,133,855,965 | |||||||||
| Net amortization and accretion on short-term U.S. government and agency obligations |
(42,700 | ) | (54,755 | ) | (130,437 | ) | ||||||
| Net realized gain (loss) on investments |
393 | (1,361 | ) | (7,780 | ) | |||||||
| Change in unrealized appreciation/depreciation on investments |
4,299,663 | (8,869,503 | ) | (8,819,781 | ) | |||||||
| Decrease (Increase) in receivable on futures contracts |
(80 | ) | — | 3,980 | ||||||||
| Increase (Decrease) in management fee payable |
(28,602 | ) | (25,929 | ) | (167,707 | ) | ||||||
| Increase (Decrease) in payable on futures contracts |
(3,260 | ) | 2,960 | 300 | ||||||||
|
|
|
|
|
|
|
|||||||
| Net cash provided by (used in) operating activities |
10,573,552 | 28,131,469 | 42,010,583 | |||||||||
|
|
|
|
|
|
|
|||||||
| Cash flow from financing activities |
||||||||||||
| Proceeds from addition of shares |
5,401,300 | 13,559,078 | 30,696,013 | |||||||||
| Payment on shares redeemed |
(15,827,473 | ) | (41,728,968 | ) | (72,906,375 | ) | ||||||
|
|
|
|
|
|
|
|||||||
| Net cash provided by (used in) financing activities |
(10,426,173 | ) | (28,169,890 | ) | (42,210,362 | ) | ||||||
|
|
|
|
|
|
|
|||||||
| Net increase (decrease) in cash |
147,379 | (38,421 | ) | (199,779 | ) | |||||||
| Cash, beginning of period |
104,145 | 142,566 | 342,345 | |||||||||
|
|
|
|
|
|
|
|||||||
| Cash, end of period |
$ | 251,524 | $ | 104,145 | $ | 142,566 | ||||||
|
|
|
|
|
|
|
|||||||
See accompanying notes to financial statements.
251
Table of Contents
STATEMENTS OF FINANCIAL CONDITION
| December 31, 2015 | December 31, 2014 | |||||||
| Assets |
||||||||
| Cash |
$ | 243,900 | $ | 305,004 | ||||
| Segregated cash balances with brokers for futures contracts |
17,160 | 14,300 | ||||||
| Short-term U.S. government and agency obligations (Note 3) (cost $238,900,176 and $305,465,636, respectively) |
238,899,626 | 305,474,211 | ||||||
|
|
|
|
|
|||||
| Total assets |
239,160,686 | 305,793,515 | ||||||
|
|
|
|
|
|||||
| Liabilities and shareholders’ equity |
||||||||
| Liabilities |
||||||||
| Payable for capital shares redeemed |
— | 1,967,832 | ||||||
| Payable on open futures contracts |
1,875 | 6,770 | ||||||
| Management fee payable |
181,068 | 254,050 | ||||||
| Unrealized depreciation on forward agreements |
22,561,101 | 12,395,120 | ||||||
|
|
|
|
|
|||||
| Total liabilities |
22,744,044 | 14,623,772 | ||||||
|
|
|
|
|
|||||
| Commitments and Contingencies (Note 2) |
||||||||
| Shareholders’ equity |
||||||||
| Shareholders’ equity |
216,416,642 | 291,169,743 | ||||||
|
|
|
|
|
|||||
| Total liabilities and shareholders’ equity |
$ | 239,160,686 | $ | 305,793,515 | ||||
|
|
|
|
|
|||||
| Shares outstanding |
7,996,533 | 7,396,533 | ||||||
|
|
|
|
|
|||||
| Net asset value per share |
$ | 27.06 | $ | 39.37 | ||||
|
|
|
|
|
|||||
| Market value per share (Note 2) |
$ | 27.08 | $ | 38.05 | ||||
|
|
|
|
|
|||||
See accompanying notes to financial statements.
252
Table of Contents
PROSHARES ULTRA SILVER
SCHEDULE OF INVESTMENTS
DECEMBER 31, 2015
| Principal Amount | Value | |||||||
| Short-term U.S. government and agency obligations |
||||||||
| (110% of shareholders’ equity) |
||||||||
| U.S. Treasury Bills: |
||||||||
| 0.135% due 01/07/16† |
$ | 19,913,000 | $ | 19,912,934 | ||||
| 0.040% due 01/14/16 |
17,050,000 | 17,049,574 | ||||||
| 0.001% due 01/21/16† |
34,041,000 | 34,039,553 | ||||||
| 0.039% due 02/04/16† |
29,869,000 | 29,866,814 | ||||||
| 0.115% due 02/18/16 |
2,811,000 | 2,810,596 | ||||||
| 0.000% due 02/25/16† |
41,656,000 | 41,651,489 | ||||||
| 0.199% due 03/03/16† |
40,444,000 | 40,437,703 | ||||||
| 0.200% due 03/10/16 |
2,873,000 | 2,872,394 | ||||||
| 0.180% due 03/24/16† |
30,018,000 | 30,005,993 | ||||||
| 0.356% due 05/26/16† |
20,284,000 | 20,252,576 | ||||||
|
|
|
|||||||
| Total short-term U.S. government and agency obligations |
||||||||
| (cost $238,900,176) |
$ | 238,899,626 | ||||||
|
|
|
|||||||
Futures Contracts Purchased††
| Number of Contracts |
Notional Amount at Value |
Unrealized Appreciation (Depreciation) |
||||||||||
| Silver Futures - COMEX, expires March 2016 |
3 | $ | 207,045 | $ | (9,030 | ) | ||||||
Forward Agreements^
| Rate Paid (Received)* |
Settlement Date | Commitment to (Deliver)/Receive |
Notional Amount at Value** |
Unrealized Appreciation (Depreciation) |
||||||||||||||||
| Forward agreements with Deutsche Bank AG based on 0.999 Fine Troy Ounce Silver |
1.10 | % | 01/06/16 | $ | 13,088,000 | $ | 180,899,718 | $ | (9,355,945 | ) | ||||||||||
| Forward agreements with Goldman Sachs International based on 0.999 Fine Troy Ounce Silver |
0.95 | 01/06/16 | 6,855,800 | 94,755,383 | (5,106,853 | ) | ||||||||||||||
| Forward agreements with Societe Generale S.A. based on 0.999 Fine Troy Ounce Silver |
1.00 | 01/06/16 | 3,984,000 | 55,063,661 | (2,704,459 | ) | ||||||||||||||
| Forward agreements with UBS AG based on 0.999 Fine Troy Ounce Silver |
0.99 | 01/06/16 | 7,373,000 | 101,903,708 | (5,393,844 | ) | ||||||||||||||
|
|
|
|||||||||||||||||||
| $ | (22,561,101 | ) | ||||||||||||||||||
|
|
|
|||||||||||||||||||
| † | All or partial amount pledged as collateral for forward agreements and/or futures contracts. |
| †† | Cash collateral in the amount of $17,160 was pledged to cover margin requirements for open futures contracts as of December 31, 2015. |
| ^ | The positions and counterparties herein are as of December 31, 2015. The Funds continually evaluate different counterparties for their transactions and counterparties are subject to change. New counterparties can be added at any time. |
| * | Reflects the floating financing rate, as of December 31, 2015, on the notional amount of the forward agreement paid to the counterparty or received from the counterparty, excluding any commissions. |
| ** | For forward agreements, a positive amount represents “long” exposure to the underlying commodity. A negative amount represents “short” exposure to the underlying commodity. |
See accompanying notes to financial statements.
253
Table of Contents
PROSHARES ULTRA SILVER
SCHEDULE OF INVESTMENTS
DECEMBER 31, 2014
.
| Principal Amount | Value | |||||||
| Short-term U.S. government and agency obligations |
||||||||
| (105% of shareholders’ equity) |
||||||||
| U.S. Treasury Bills: |
||||||||
| 0.016% due 01/22/15 |
$ | 2,309,000 | $ | 2,308,961 | ||||
| 0.012% due 01/29/15 |
14,382,000 | 14,381,784 | ||||||
| 0.011% due 02/12/15† |
92,778,000 | 92,775,887 | ||||||
| 0.020% due 02/19/15† |
35,850,000 | 35,849,044 | ||||||
| 0.012% due 03/05/15† |
9,368,000 | 9,367,758 | ||||||
| 0.041% due 04/16/15† |
18,037,000 | 18,035,697 | ||||||
| 0.047% due 04/30/15† |
6,604,000 | 6,603,134 | ||||||
| 0.060% due 05/14/15† |
76,886,000 | 76,873,314 | ||||||
| 0.078% due 06/04/15† |
4,277,000 | 4,275,637 | ||||||
| 0.090% due 06/11/15† |
45,017,000 | 45,002,995 | ||||||
|
|
|
|||||||
| Total short-term U.S. government and agency obligations |
||||||||
| (cost $305,465,636) |
$ | 305,474,211 | ||||||
|
|
|
|||||||
Futures Contracts Purchased††
| Number of Contracts |
Notional Amount at Value |
Unrealized Appreciation (Depreciation) |
||||||||||
| Silver Futures - COMEX, expires March 2015 |
2 | $ | 155,990 | $ | (1,560 | ) | ||||||
Forward Agreements^
| Rate Paid (Received)* |
Settlement Date | Commitment to (Deliver)/Receive |
Notional Amount at Value** |
Unrealized Appreciation (Depreciation) |
||||||||||||||||
| Forward agreements with Deutsche Bank AG based on 0.999 Fine Troy Ounce Silver |
0.97 | % | 01/06/15 | $ | 19,068,000 | $ | 304,550,282 | $ | (6,220,069 | ) | ||||||||||
| Forward agreements with Goldman Sachs International based on 0.999 Fine Troy Ounce Silver |
1.05 | 01/06/15 | 7,100,800 | 113,411,137 | (2,124,796 | ) | ||||||||||||||
| Forward agreements with Societe Generale S.A. based on 0.999 Fine Troy Ounce Silver |
1.09 | 01/06/15 | 4,628,000 | 73,916,565 | (1,384,207 | ) | ||||||||||||||
| Forward agreements with UBS AG based on 0.999 Fine Troy Ounce Silver |
1.05 | 01/06/15 | 5,653,000 | 90,287,455 | (2,666,048 | ) | ||||||||||||||
|
|
|
|||||||||||||||||||
| $ | (12,395,120 | ) | ||||||||||||||||||
|
|
|
|||||||||||||||||||
| † | All or partial amount pledged as collateral for forward agreements. |
| †† | Cash collateral in the amount of $14,300 was pledged to cover margin requirements for open futures contracts as of December 31, 2014. |
| ^ | The positions and counterparties herein are as of December 31, 2014. The Funds continually evaluate different counterparties for their transactions and counterparties are subject to change. New counterparties can be added at any time. |
| * | Reflects the floating financing rate, as of December 31, 2014, on the notional amount of the forward agreement paid to the counterparty or received from the counterparty, excluding any commissions. |
| ** | For forward agreements, a positive amount represents “long” exposure to the underlying commodity. A negative amount represents “short” exposure to the underlying commodity. |
See accompanying notes to financial statements.
254
Table of Contents
PROSHARES ULTRA SILVER
STATEMENTS OF OPERATIONS
FOR THE YEARS ENDED DECEMBER 31, 2015, 2014 AND 2013
| Year ended December 31, 2015 |
Year ended December 31, 2014 |
Year ended December 31, 2013 |
||||||||||
| Investment Income |
||||||||||||
| Interest |
$ | 156,353 | $ | 179,642 | $ | 348,317 | ||||||
|
|
|
|
|
|
|
|||||||
| Expenses |
||||||||||||
| Management fee |
2,664,160 | 4,148,207 | 5,628,988 | |||||||||
| Brokerage commissions and fees |
52 | 43 | 36 | |||||||||
|
|
|
|
|
|
|
|||||||
| Total expenses |
2,664,212 | 4,148,250 | 5,629,024 | |||||||||
|
|
|
|
|
|
|
|||||||
| Net investment income (loss) |
(2,507,859 | ) | (3,968,608 | ) | (5,280,707 | ) | ||||||
|
|
|
|
|
|
|
|||||||
| Realized and unrealized gain (loss) on investment activity |
||||||||||||
| Net realized gain (loss) on |
||||||||||||
| Futures contracts |
(19,600 | ) | (52,451 | ) | (137,594 | ) | ||||||
| Forward agreements |
(78,289,709 | ) | (155,498,969 | ) | (701,395,135 | ) | ||||||
| Short-term U.S. government and agency obligations |
(441 | ) | 8,226 | 14,261 | ||||||||
|
|
|
|
|
|
|
|||||||
| Net realized gain (loss) |
(78,309,750 | ) | (155,543,194 | ) | (701,518,468 | ) | ||||||
|
|
|
|
|
|
|
|||||||
| Change in net unrealized appreciation/depreciation on |
||||||||||||
| Futures contracts |
(7,470 | ) | 12,640 | 25,820 | ||||||||
| Forward agreements |
(10,165,981 | ) | (9,902,240 | ) | 143,247,826 | |||||||
| Short-term U.S. government and agency obligations |
(9,125 | ) | (11,363 | ) | (30,955 | ) | ||||||
|
|
|
|
|
|
|
|||||||
| Change in net unrealized appreciation/depreciation |
(10,182,576 | ) | (9,900,963 | ) | 143,242,691 | |||||||
|
|
|
|
|
|
|
|||||||
| Net realized and unrealized gain (loss) |
(88,492,326 | ) | (165,444,157 | ) | (558,275,777 | ) | ||||||
|
|
|
|
|
|
|
|||||||
| Net income (loss) |
$ | (91,000,185 | ) | $ | (169,412,765 | ) | $ | (563,556,484 | ) | |||
|
|
|
|
|
|
|
|||||||
| Net income (loss) per weighted-average share |
$ | (11.82 | ) | $ | (22.83 | ) | $ | (93.80 | ) | |||
|
|
|
|
|
|
|
|||||||
| Weighted-average shares outstanding |
7,697,629 | 7,420,839 | 6,008,363 | |||||||||
|
|
|
|
|
|
|
|||||||
See accompanying notes to financial statements.
255
Table of Contents
PROSHARES ULTRA SILVER
STATEMENTS OF CHANGES IN SHAREHOLDERS’ EQUITY
FOR THE YEARS ENDED DECEMBER 31, 2015, 2014 AND 2013
| Year ended December 31, 2015 |
Year ended December 31, 2014 |
Year ended December 31, 2013 |
||||||||||
| Shareholders’ equity, beginning of period |
$ | 291,169,743 | $ | 465,479,519 | $ | 747,725,400 | ||||||
| Addition of 2,700,000, 2,487,500 and 4,112,500 shares, respectively |
96,078,803 | 144,929,400 | 383,200,214 | |||||||||
| Redemption of 2,100,000, 2,440,974 and 1,112,500 shares, respectively |
(79,831,719 | ) | (149,826,411 | ) | (101,889,611 | ) | ||||||
|
|
|
|
|
|
|
|||||||
| Net addition (redemption) of 600,000, 46,526 and 3,000,000 shares, respectively |
16,247,084 | (4,897,011 | ) | 281,310,603 | ||||||||
|
|
|
|
|
|
|
|||||||
| Net investment income (loss) |
(2,507,859 | ) | (3,968,608 | ) | (5,280,707 | ) | ||||||
| Net realized gain (loss) |
(78,309,750 | ) | (155,543,194 | ) | (701,518,468 | ) | ||||||
| Change in net unrealized appreciation/depreciation |
(10,182,576 | ) | (9,900,963 | ) | 143,242,691 | |||||||
|
|
|
|
|
|
|
|||||||
| Net income (loss) |
(91,000,185 | ) | (169,412,765 | ) | (563,556,484 | ) | ||||||
|
|
|
|
|
|
|
|||||||
| Shareholders’ equity, end of period |
$ | 216,416,642 | $ | 291,169,743 | $ | 465,479,519 | ||||||
|
|
|
|
|
|
|
|||||||
See accompanying notes to financial statements.
256
Table of Contents
PROSHARES ULTRA SILVER
STATEMENTS OF CASH FLOWS
FOR THE YEARS ENDED DECEMBER 31, 2015, 2014 AND 2013
| Year ended December 31, 2015 |
Year ended December 31, 2014 |
Year ended December 31, 2013 |
||||||||||
| Cash flow from operating activities |
||||||||||||
| Net income (loss) |
$ | (91,000,185 | ) | $ | (169,412,765 | ) | $ | (563,556,484 | ) | |||
| Adjustments to reconcile net income (loss) to net cash provided by (used in) operating activities: |
||||||||||||
| Decrease (Increase) in segregated cash balances with brokers for futures contracts |
(2,860 | ) | 7,700 | 2,200 | ||||||||
| Purchases of short-term U.S. government and agency obligations |
(835,846,036 | ) | (1,432,093,309 | ) | (2,495,134,063 | ) | ||||||
| Proceeds from sales or maturities of short-term U.S. government and agency obligations |
902,567,408 | 1,594,662,608 | 2,918,654,096 | |||||||||
| Net amortization and accretion on short-term U.S. government and agency obligations |
(156,353 | ) | (177,671 | ) | (348,317 | ) | ||||||
| Net realized gain (loss) on investments |
441 | (8,226 | ) | (14,261 | ) | |||||||
| Change in unrealized appreciation/depreciation on investments |
10,175,106 | 9,913,603 | (143,216,871 | ) | ||||||||
| Decrease (Increase) in receivable on futures contracts |
— | — | 2,520 | |||||||||
| Increase (Decrease) in management fee payable |
(72,982 | ) | (125,078 | ) | (277,880 | ) | ||||||
| Increase (Decrease) in payable on futures contracts |
(4,895 | ) | 4,320 | 2,450 | ||||||||
|
|
|
|
|
|
|
|||||||
| Net cash provided by (used in) operating activities |
(14,340,356 | ) | 2,771,182 | (283,886,610 | ) | |||||||
|
|
|
|
|
|
|
|||||||
| Cash flow from financing activities |
||||||||||||
| Proceeds from addition of shares |
96,078,803 | 144,929,400 | 385,349,171 | |||||||||
| Payment on shares redeemed |
(81,799,551 | ) | (147,858,579 | ) | (101,889,611 | ) | ||||||
|
|
|
|
|
|
|
|||||||
| Net cash provided by (used in) financing activities |
14,279,252 | (2,929,179 | ) | 283,459,560 | ||||||||
|
|
|
|
|
|
|
|||||||
| Net increase (decrease) in cash |
(61,104 | ) | (157,997 | ) | (427,050 | ) | ||||||
| Cash, beginning of period |
305,004 | 463,001 | 890,051 | |||||||||
|
|
|
|
|
|
|
|||||||
| Cash, end of period |
$ | 243,900 | $ | 305,004 | $ | 463,001 | ||||||
|
|
|
|
|
|
|
|||||||
See accompanying notes to financial statements.
257
Table of Contents
STATEMENTS OF FINANCIAL CONDITION
| December 31, 2015 | December 31, 2014 | |||||||
| Assets |
||||||||
| Cash |
$ | 227,310 | $ | 671,117 | ||||
| Short-term U.S. government and agency obligations (Note 3) (cost $11,605,665 and $2,415,732, respectively) |
11,605,262 | 2,415,698 | ||||||
| Unrealized appreciation on foreign currency forward contracts |
604,920 | 2,921 | ||||||
|
|
|
|
|
|||||
| Total assets |
12,437,492 | 3,089,736 | ||||||
|
|
|
|
|
|||||
| Liabilities and shareholders’ equity |
||||||||
| Liabilities |
||||||||
| Payable for capital shares redeemed |
1,569,718 | — | ||||||
| Management fee payable |
10,044 | 2,003 | ||||||
| Unrealized depreciation on foreign currency forward contracts |
— | 106,292 | ||||||
|
|
|
|
|
|||||
| Total liabilities |
1,579,762 | 108,295 | ||||||
|
|
|
|
|
|||||
| Commitments and Contingencies (Note 2) |
||||||||
| Shareholders’ equity |
||||||||
| Shareholders’ equity |
10,857,730 | 2,981,441 | ||||||
|
|
|
|
|
|||||
| Total liabilities and shareholders’ equity |
$ | 12,437,492 | $ | 3,089,736 | ||||
|
|
|
|
|
|||||
| Shares outstanding |
700,014 | 150,014 | ||||||
|
|
|
|
|
|||||
| Net asset value per share |
$ | 15.51 | $ | 19.87 | ||||
|
|
|
|
|
|||||
| Market value per share (Note 2) |
$ | 15.51 | $ | 19.80 | ||||
|
|
|
|
|
|||||
See accompanying notes to financial statements.
258
Table of Contents
PROSHARES ULTRA EURO
SCHEDULE OF INVESTMENTS
DECEMBER 31, 2015
| Principal Amount | Value | |||||||
| Short-term U.S. government and agency obligations |
| |||||||
| (107% of shareholders’ equity) |
||||||||
| U.S. Treasury Bills: |
||||||||
| 0.000% due 01/21/16† |
$ | 7,404,000 | $ | 7,403,685 | ||||
| 0.035% due 02/04/16 |
790,000 | 789,942 | ||||||
| 0.166% due 03/24/16† |
3,413,000 | 3,411,635 | ||||||
|
|
|
|||||||
| Total short-term U.S. government and agency obligations |
||||||||
| (cost $11,605,665) |
$ | 11,605,262 | ||||||
|
|
|
|||||||
| Foreign Currency Forward Contracts^ |
| |||||||||||||||
| Settlement Date | Local Currency | Notional Amount at Value (USD) |
Unrealized Appreciation (Depreciation) |
|||||||||||||
| Contracts to Purchase |
||||||||||||||||
| Euro with Goldman Sachs International |
01/08/16 | 12,451,525 | $ | 13,533,325 | $ | 298,929 | ||||||||||
| Euro with UBS AG |
01/08/16 | 11,518,600 | 12,519,346 | 288,302 | ||||||||||||
|
|
|
|||||||||||||||
| $ | 587,231 | |||||||||||||||
|
|
|
|||||||||||||||
| Contracts to Sell |
||||||||||||||||
| Euro with Goldman Sachs International |
01/08/16 | (3,430,700 | ) | $ | (3,728,762 | ) | $ | 16,425 | ||||||||
| Euro with UBS AG |
01/08/16 | (555,100 | ) | (603,328 | ) | 1,264 | ||||||||||
|
|
|
|||||||||||||||
| $ | 17,689 | |||||||||||||||
|
|
|
|||||||||||||||
| † | All or partial amount segregated as collateral for foreign currency forward contracts. |
| ^ | The positions and counterparties herein are as of December 31, 2015. The Funds continually evaluate different counterparties for their transactions and counterparties are subject to change. New counterparties can be added at any time. |
See accompanying notes to financial statements.
259
Table of Contents
PROSHARES ULTRA EURO
SCHEDULE OF INVESTMENTS
DECEMBER 31, 2014
| Principal Amount | Value | |||||||
| Short-term U.S. government and agency obligations |
| |||||||
| (81% of shareholders’ equity) |
||||||||
| U.S. Treasury Bills: |
||||||||
| 0.010% due 02/12/15 |
$ | 245,000 | $ | 244,994 | ||||
| 0.021% due 03/05/15† |
342,000 | 341,991 | ||||||
| 0.036% due 04/16/15 |
242,000 | 241,983 | ||||||
| 0.047% due 04/30/15† |
587,000 | 586,923 | ||||||
| 0.035% due 05/21/15 |
1,000,000 | 999,807 | ||||||
|
|
|
|||||||
| Total short-term U.S. government and agency obligations |
||||||||
| (cost $2,415,732) |
$ | 2,415,698 | ||||||
|
|
|
|||||||
| Foreign Currency Forward Contracts^ |
| |||||||||||||||
| Settlement Date | Local Currency | Notional Amount at Value (USD) |
Unrealized Appreciation (Depreciation) |
|||||||||||||
| Contracts to Purchase |
||||||||||||||||
| Euro with Goldman Sachs International |
01/09/15 | 2,080,425 | $ | 2,517,638 | $ | (40,058 | ) | |||||||||
| Euro with UBS AG |
01/09/15 | 3,032,200 | 3,669,434 | (66,234 | ) | |||||||||||
|
|
|
|||||||||||||||
| $ | (106,292 | ) | ||||||||||||||
|
|
|
|||||||||||||||
| Contracts to Sell |
||||||||||||||||
| Euro with Goldman Sachs International |
01/09/15 | (63,400 | ) | $ | (76,724 | ) | $ | 1,202 | ||||||||
| Euro with UBS AG |
01/09/15 | (122,500 | ) | (148,244 | ) | 1,719 | ||||||||||
|
|
|
|||||||||||||||
| $ | 2,921 | |||||||||||||||
|
|
|
|||||||||||||||
| † | All or partial amount segregated as collateral for foreign currency forward contracts. |
| ^ | The positions and counterparties herein are as of December 31, 2014. The Funds continually evaluate different counterparties for their transactions and counterparties are subject to change. New counterparties can be added at any time. |
See accompanying notes to financial statements.
260
Table of Contents
PROSHARES ULTRA EURO
STATEMENTS OF OPERATIONS
FOR THE YEARS ENDED DECEMBER 31, 2015, 2014 AND 2013
| Year ended December 31, 2015 |
Year ended December 31, 2014 |
Year ended December 31, 2013 |
||||||||||
| Investment Income |
||||||||||||
| Interest |
$ | 2,797 | $ | 1,083 | $ | 1,901 | ||||||
|
|
|
|
|
|
|
|||||||
| Expenses |
||||||||||||
| Management fee |
106,868 | 23,330 | 36,925 | |||||||||
|
|
|
|
|
|
|
|||||||
| Total expenses |
106,868 | 23,330 | 36,925 | |||||||||
|
|
|
|
|
|
|
|||||||
| Net investment income (loss) |
(104,071 | ) | (22,247 | ) | (35,024 | ) | ||||||
|
|
|
|
|
|
|
|||||||
| Realized and unrealized gain (loss) on investment activity |
||||||||||||
| Net realized gain (loss) on |
||||||||||||
| Foreign currency forward contracts |
(1,982,208 | ) | (420,533 | ) | 210,150 | |||||||
| Short-term U.S. government and agency obligations |
(109 | ) | 5 | 55 | ||||||||
|
|
|
|
|
|
|
|||||||
| Net realized gain (loss) |
(1,982,317 | ) | (420,528 | ) | 210,205 | |||||||
|
|
|
|
|
|
|
|||||||
| Change in net unrealized appreciation/depreciation on |
||||||||||||
| Foreign currency forward contracts |
708,291 | (204,333 | ) | 13,803 | ||||||||
| Short-term U.S. government and agency obligations |
(369 | ) | (182 | ) | 76 | |||||||
|
|
|
|
|
|
|
|||||||
| Change in net unrealized appreciation/depreciation |
707,922 | (204,515 | ) | 13,879 | ||||||||
|
|
|
|
|
|
|
|||||||
| Net realized and unrealized gain (loss) |
(1,274,395 | ) | (625,043 | ) | 224,084 | |||||||
|
|
|
|
|
|
|
|||||||
| Net income (loss) |
$ | (1,378,466 | ) | $ | (647,290 | ) | $ | 189,060 | ||||
|
|
|
|
|
|
|
|||||||
| Net income (loss) per weighted-average share |
$ | (1.99 | ) | $ | (6.36 | ) | $ | 1.19 | ||||
|
|
|
|
|
|
|
|||||||
| Weighted-average shares outstanding |
691,384 | 101,795 | 159,192 | |||||||||
|
|
|
|
|
|
|
|||||||
See accompanying notes to financial statements.
261
Table of Contents
PROSHARES ULTRA EURO
STATEMENTS OF CHANGES IN SHAREHOLDERS’ EQUITY
FOR THE YEARS ENDED DECEMBER 31, 2015, 2014 AND 2013
| Year ended December 31, 2015 |
Year ended December 31, 2014 |
Year ended December 31, 2013 |
||||||||||
| Shareholders’ equity, beginning of period |
$ | 2,981,441 | $ | 2,603,827 | $ | 4,870,316 | ||||||
| Addition of 950,000, 50,000 and 50,000 shares, respectively |
15,916,613 | 1,024,904 | 1,261,329 | |||||||||
| Redemption of 400,000, 0 and 150,000 shares, respectively |
(6,661,858 | ) | — | (3,716,878 | ) | |||||||
|
|
|
|
|
|
|
|||||||
| Net addition (redemption) of 550,000, 50,000 and (100,000) shares, respectively |
9,254,755 | 1,024,904 | (2,455,549 | ) | ||||||||
|
|
|
|
|
|
|
|||||||
| Net investment income (loss) |
(104,071 | ) | (22,247 | ) | (35,024 | ) | ||||||
| Net realized gain (loss) |
(1,982,317 | ) | (420,528 | ) | 210,205 | |||||||
| Change in net unrealized appreciation/depreciation |
707,922 | (204,515 | ) | 13,879 | ||||||||
|
|
|
|
|
|
|
|||||||
| Net income (loss) |
(1,378,466 | ) | (647,290 | ) | 189,060 | |||||||
|
|
|
|
|
|
|
|||||||
| Shareholders’ equity, end of period |
$ | 10,857,730 | $ | 2,981,441 | $ | 2,603,827 | ||||||
|
|
|
|
|
|
|
|||||||
See accompanying notes to financial statements.
262
Table of Contents
PROSHARES ULTRA EURO
STATEMENTS OF CASH FLOWS
FOR THE YEARS ENDED DECEMBER 31, 2015, 2014 AND 2013
| Year ended December 31, 2015 |
Year ended December 31, 2014 |
Year ended December 31, 2013 |
||||||||||
| Cash flow from operating activities |
||||||||||||
| Net income (loss) |
$ | (1,378,466 | ) | $ | (647,290 | ) | $ | 189,060 | ||||
| Adjustments to reconcile net income (loss) to net cash provided by (used in) operating activities: |
||||||||||||
| Purchases of short-term U.S. government and agency obligations |
(42,137,395 | ) | (7,297,855 | ) | (15,171,747 | ) | ||||||
| Proceeds from sales or maturities of short-term U.S. government and agency obligations |
32,950,150 | 7,338,926 | 17,264,860 | |||||||||
| Net amortization and accretion on short-term U.S. government and agency obligations |
(2,797 | ) | (1,083 | ) | (1,901 | ) | ||||||
| Net realized gain (loss) on investments |
109 | (5 | ) | (55 | ) | |||||||
| Change in unrealized appreciation/depreciation on investments |
(707,922 | ) | 204,515 | (13,879 | ) | |||||||
| Increase (Decrease) in management fee payable |
8,041 | (718 | ) | (1,152 | ) | |||||||
|
|
|
|
|
|
|
|||||||
| Net cash provided by (used in) operating activities |
(11,268,280 | ) | (403,510 | ) | 2,265,186 | |||||||
|
|
|
|
|
|
|
|||||||
| Cash flow from financing activities |
||||||||||||
| Proceeds from addition of shares |
15,916,613 | 1,024,904 | 1,261,329 | |||||||||
| Payment on shares redeemed |
(5,092,140 | ) | — | (3,716,878 | ) | |||||||
|
|
|
|
|
|
|
|||||||
| Net cash provided by (used in) financing activities |
10,824,473 | 1,024,904 | (2,455,549 | ) | ||||||||
|
|
|
|
|
|
|
|||||||
| Net increase (decrease) in cash |
(443,807 | ) | 621,394 | (190,363 | ) | |||||||
| Cash, beginning of period |
671,117 | 49,723 | 240,086 | |||||||||
|
|
|
|
|
|
|
|||||||
| Cash, end of period |
$ | 227,310 | $ | 671,117 | $ | 49,723 | ||||||
|
|
|
|
|
|
|
|||||||
See accompanying notes to financial statements.
263
Table of Contents
STATEMENTS OF FINANCIAL CONDITION
| December 31, 2015 | December 31, 2014 | |||||||
| Assets |
||||||||
| Cash |
$ | 147,371 | $ | 846,919 | ||||
| Short-term U.S. government and agency obligations (Note 3) (cost $5,069,206 and $1,287,844, respectively) |
5,069,491 | 1,287,869 | ||||||
| Unrealized appreciation on foreign currency forward contracts |
267,014 | 404 | ||||||
|
|
|
|
|
|||||
| Total assets |
5,483,876 | 2,135,192 | ||||||
|
|
|
|
|
|||||
| Liabilities and shareholders’ equity |
||||||||
| Liabilities |
||||||||
| Management fee payable |
4,325 | 1,515 | ||||||
| Unrealized depreciation on foreign currency forward contracts |
5,703 | 15,649 | ||||||
|
|
|
|
|
|||||
| Total liabilities |
10,028 | 17,164 | ||||||
|
|
|
|
|
|||||
| Commitments and Contingencies (Note 2) |
||||||||
| Shareholders’ equity |
||||||||
| Shareholders’ equity |
5,473,848 | 2,118,028 | ||||||
|
|
|
|
|
|||||
| Total liabilities and shareholders’ equity |
$ | 5,483,876 | $ | 2,135,192 | ||||
|
|
|
|
|
|||||
| Shares outstanding (Note 1) |
99,974 | 37,504 | ||||||
|
|
|
|
|
|||||
| Net asset value per share (Note 1) |
$ | 54.75 | $ | 56.47 | ||||
|
|
|
|
|
|||||
| Market value per share (Note 1) (Note 2) |
$ | 54.70 | $ | 56.48 | ||||
|
|
|
|
|
|||||
See accompanying notes to financial statements.
264
Table of Contents
PROSHARES ULTRA YEN
SCHEDULE OF INVESTMENTS
DECEMBER 31, 2015
| Principal Amount | Value | |||||||
| Short-term U.S. government and agency obligations |
| |||||||
| (93% of shareholders’ equity) |
||||||||
| U.S. Treasury Bills: |
||||||||
| 0.165% due 01/28/16† |
$ | 3,811,000 | $ | 3,810,670 | ||||
| 0.000% due 02/25/16 |
360,000 | 359,961 | ||||||
| 0.208% due 03/03/16 |
899,000 | 898,860 | ||||||
|
|
|
|||||||
| Total short-term U.S. government and agency obligations |
||||||||
| (cost $5,069,206) |
$ | 5,069,491 | ||||||
|
|
|
|||||||
| Foreign Currency Forward Contracts^ |
| |||||||||||||||
| Settlement Date | Local Currency | Notional Amount at Value (USD) |
Unrealized Appreciation (Depreciation) |
|||||||||||||
| Contracts to Purchase |
||||||||||||||||
| Yen with Goldman Sachs International |
01/08/16 | 866,666,900 | $ | 7,210,368 | $ | 172,891 | ||||||||||
| Yen with UBS AG |
01/08/16 | 488,922,300 | 4,067,664 | 94,123 | ||||||||||||
|
|
|
|||||||||||||||
| $ | 267,014 | |||||||||||||||
|
|
|
|||||||||||||||
| Contracts to Sell |
||||||||||||||||
| Yen with Goldman Sachs International |
01/08/16 | (18,830,800 | ) | $ | (156,666 | ) | $ | (3,104 | ) | |||||||
| Yen with UBS AG |
01/08/16 | (21,100,300 | ) | (175,547 | ) | (2,599 | ) | |||||||||
|
|
|
|||||||||||||||
| $ | (5,703 | ) | ||||||||||||||
|
|
|
|||||||||||||||
| † | All or partial amount segregated as collateral for foreign currency forward contracts. |
| ^ | The positions and counterparties herein are as of December 31, 2015. The Funds continually evaluate different counterparties for their transactions and counterparties are subject to change. New counterparties can be added at any time. |
See accompanying notes to financial statements.
265
Table of Contents
PROSHARES ULTRA YEN
SCHEDULE OF INVESTMENTS
DECEMBER 31, 2014
| Principal Amount | Value | |||||||
| Short-term U.S. government and agency obligations |
| |||||||
| (61% of shareholders’ equity) |
||||||||
| U.S. Treasury Bills: |
||||||||
| 0.021% due 03/05/15† |
$ | 357,000 | $ | 356,991 | ||||
| 0.047% due 04/30/15 |
931,000 | 930,878 | ||||||
|
|
|
|||||||
| Total short-term U.S. government and agency obligations |
||||||||
| (cost $1,287,844) |
$ | 1,287,869 | ||||||
|
|
|
|||||||
Foreign Currency Forward Contracts^
| Settlement Date | Local Currency | Notional Amount at Value (USD) |
Unrealized Appreciation (Depreciation) |
|||||||||||||
| Contracts to Purchase |
||||||||||||||||
| Yen with Goldman Sachs International |
01/09/15 | 229,660,300 | $ | 1,917,715 | $ | (11,754 | ) | |||||||||
| Yen with UBS AG |
01/09/15 | 304,204,900 | 2,540,179 | (3,394 | ) | |||||||||||
|
|
|
|||||||||||||||
| $ | (15,148 | ) | ||||||||||||||
|
|
|
|||||||||||||||
| Contracts to Sell |
||||||||||||||||
| Yen with Goldman Sachs International |
01/09/15 | (9,518,600 | ) | $ | (79,482 | ) | $ | (501 | ) | |||||||
| Yen with UBS AG |
01/09/15 | (16,144,000 | ) | (134,806 | ) | 404 | ||||||||||
|
|
|
|||||||||||||||
| $ | (97 | ) | ||||||||||||||
|
|
|
|||||||||||||||
| † | All or partial amount pledged as collateral for foreign currency forward contracts. |
| ^ | The positions and counterparties herein are as of December 31, 2014. The Funds continually evaluate different counterparties for their transactions and counterparties are subject to change. New counterparties can be added at any time. |
See accompanying notes to financial statements.
266
Table of Contents
PROSHARES ULTRA YEN
STATEMENTS OF OPERATIONS
FOR THE YEARS ENDED DECEMBER 31, 2015, 2014 AND 2013
| Year ended December 31, 2015 |
Year ended December 31, 2014 |
Year ended December 31, 2013 |
||||||||||
| Investment Income |
||||||||||||
| Interest |
$ | 3,609 | $ | 1,101 | $ | 1,795 | ||||||
|
|
|
|
|
|
|
|||||||
| Expenses |
||||||||||||
| Management fee |
48,032 | 21,963 | 33,569 | |||||||||
|
|
|
|
|
|
|
|||||||
| Total expenses |
48,032 | 21,963 | 33,569 | |||||||||
|
|
|
|
|
|
|
|||||||
| Net investment income (loss) |
(44,423 | ) | (20,862 | ) | (31,774 | ) | ||||||
|
|
|
|
|
|
|
|||||||
| Realized and unrealized gain (loss) on investment activity |
||||||||||||
| Net realized gain (loss) on |
||||||||||||
| Foreign currency forward contracts |
(472,913 | ) | (540,398 | ) | (1,879,169 | ) | ||||||
| Short-term U.S. government and agency obligations |
6 | 94 | 68 | |||||||||
|
|
|
|
|
|
|
|||||||
| Net realized gain (loss) |
(472,907 | ) | (540,304 | ) | (1,879,101 | ) | ||||||
|
|
|
|
|
|
|
|||||||
| Change in net unrealized appreciation/depreciation on |
||||||||||||
| Foreign currency forward contracts |
276,556 | 144,064 | 334,987 | |||||||||
| Short-term U.S. government and agency obligations |
260 | (289 | ) | 97 | ||||||||
|
|
|
|
|
|
|
|||||||
| Change in net unrealized appreciation/depreciation |
276,816 | 143,775 | 335,084 | |||||||||
|
|
|
|
|
|
|
|||||||
| Net realized and unrealized gain (loss) |
(196,091 | ) | (396,529 | ) | (1,544,017 | ) | ||||||
|
|
|
|
|
|
|
|||||||
| Net income (loss) |
$ | (240,514 | ) | $ | (417,391 | ) | $ | (1,575,791 | ) | |||
|
|
|
|
|
|
|
|||||||
| Net income (loss) per weighted-average share (Note 1) |
$ | (2.59 | ) | $ | (13.39 | ) | $ | (39.59 | ) | |||
|
|
|
|
|
|
|
|||||||
| Weighted-average shares outstanding (Note 1) |
92,794 | 31,168 | 39,798 | |||||||||
|
|
|
|
|
|
|
|||||||
See accompanying notes to financial statements.
267
Table of Contents
PROSHARES ULTRA YEN
STATEMENTS OF CHANGES IN SHAREHOLDERS’ EQUITY
FOR THE YEARS ENDED DECEMBER 31, 2015, 2014 AND 2013
| Year ended December 31, 2015 |
Year ended December 31, 2014 |
Year ended December 31, 2013 |
||||||||||
| Shareholders’ equity, beginning of period |
$ | 2,118,028 | $ | 2,795,026 | $ | 4,227,995 | ||||||
| Addition of 75,000, 12,500 and 12,500 shares, respectively (Note 1) |
4,285,016 | 716,043 | 1,323,474 | |||||||||
| Redemption of 12,530, 12,500 and 12,500 shares, respectively (Note 1) |
(688,682 | ) | (975,650 | ) | (1,180,652 | ) | ||||||
|
|
|
|
|
|
|
|||||||
| Net addition of 62,470, 0, and 0 shares, respectively |
3,596,334 | (259,607 | ) | 142,822 | ||||||||
|
|
|
|
|
|
|
|||||||
| Net investment income (loss) |
(44,423 | ) | (20,862 | ) | (31,774 | ) | ||||||
| Net realized gain (loss) |
(472,907 | ) | (540,304 | ) | (1,879,101 | ) | ||||||
| Change in net unrealized appreciation/depreciation |
276,816 | 143,775 | 335,084 | |||||||||
|
|
|
|
|
|
|
|||||||
| Net income (loss) |
(240,514 | ) | (417,391 | ) | (1,575,791 | ) | ||||||
|
|
|
|
|
|
|
|||||||
| Shareholders’ equity, end of period |
$ | 5,473,848 | $ | 2,118,028 | $ | 2,795,026 | ||||||
|
|
|
|
|
|
|
|||||||
See accompanying notes to financial statements.
268
Table of Contents
PROSHARES ULTRA YEN
STATEMENTS OF CASH FLOWS
FOR THE YEARS ENDED DECEMBER 31, 2015, 2014 AND 2013
| Year ended December 31, 2015 |
Year ended December 31, 2014 |
Year ended December 31, 2013 |
||||||||||
| Cash flow from operating activities |
||||||||||||
| Net income (loss) |
$ | (240,514 | ) | $ | (417,391 | ) | $ | (1,575,791 | ) | |||
| Adjustments to reconcile net income (loss) to net cash provided by (used in) operating activities: |
||||||||||||
| Purchases of short-term U.S. government and agency obligations |
(12,557,564 | ) | (5,540,122 | ) | (14,074,486 | ) | ||||||
| Proceeds from sales or maturities of short-term U.S. government and agency obligations |
8,779,817 | 7,181,715 | 15,735,808 | |||||||||
| Net amortization and accretion on short-term U.S. government and agency obligations |
(3,609 | ) | (1,101 | ) | (1,795 | ) | ||||||
| Net realized gain (loss) on investments |
(6 | ) | (94 | ) | (68 | ) | ||||||
| Change in unrealized appreciation/depreciation on investments |
(276,816 | ) | (143,775 | ) | (335,084 | ) | ||||||
| Increase (Decrease) in management fee payable |
2,810 | (822 | ) | (1,323 | ) | |||||||
|
|
|
|
|
|
|
|||||||
| Net cash provided by (used in) operating activities |
(4,295,882 | ) | 1,078,410 | (252,739 | ) | |||||||
|
|
|
|
|
|
|
|||||||
| Cash flow from financing activities |
||||||||||||
| Proceeds from addition of shares |
4,285,016 | 716,043 | 1,323,474 | |||||||||
| Payment on shares redeemed |
(688,682 | ) | (975,650 | ) | (1,180,652 | ) | ||||||
|
|
|
|
|
|
|
|||||||
| Net cash provided by (used in) financing activities |
3,596,334 | (259,607 | ) | 142,822 | ||||||||
|
|
|
|
|
|
|
|||||||
| Net increase (decrease) in cash |
(699,548 | ) | 818,803 | (109,917 | ) | |||||||
| Cash, beginning of period |
846,919 | 28,116 | 138,033 | |||||||||
|
|
|
|
|
|
|
|||||||
| Cash, end of period |
$ | 147,371 | $ | 846,919 | $ | 28,116 | ||||||
|
|
|
|
|
|
|
|||||||
See accompanying notes to financial statements.
269
Table of Contents
PROSHARES TRUST II
COMBINED STATEMENTS OF FINANCIAL CONDITION
| December 31, 2015 | December 31, 2014 | |||||||
| Assets |
||||||||
| Cash |
$ | 48,049,225 | $ | 35,899,231 | ||||
| Segregated cash balances with brokers for futures contracts |
261,083,712 | 296,561,615 | ||||||
| Short-term U.S. government and agency obligations (Note 3) (cost $3,313,585,456 and $3,005,824,301, respectively) |
3,313,591,600 | 3,005,876,580 | ||||||
| Unrealized appreciation on swap agreements |
6,669,519 | 27,585,336 | ||||||
| Unrealized appreciation on forward agreements |
6,587,221 | 2,850,677 | ||||||
| Unrealized appreciation on foreign currency forward contracts |
1,805,661 | 19,594,239 | ||||||
| Receivable from capital shares sold |
48,046,138 | 58,085,447 | ||||||
| Receivable on open futures contracts |
27,655,327 | 56,002,326 | ||||||
| Offering costs (Note 5) |
— | 49,384 | ||||||
| Limitation by Sponsor |
— | 9,474 | ||||||
|
|
|
|
|
|||||
| Total assets |
3,713,488,403 | 3,502,514,309 | ||||||
|
|
|
|
|
|||||
| Liabilities and shareholders’ equity |
||||||||
| Liabilities |
||||||||
| Payable for capital shares redeemed |
60,119,975 | 25,400,996 | ||||||
| Payable on open futures contracts |
3,078,269 | 46,405,998 | ||||||
| Brokerage commissions and fees payable |
39,148 | — | ||||||
| Management fee payable |
2,839,305 | 2,657,505 | ||||||
| Payable for offering costs |
— | 65,785 | ||||||
| Unrealized depreciation on swap agreements |
72,446,044 | 76,512,435 | ||||||
| Unrealized depreciation on forward agreements |
24,811,696 | 14,882,468 | ||||||
| Unrealized depreciation on foreign currency forward contracts |
43,545,218 | 4,528,636 | ||||||
|
|
|
|
|
|||||
| Total liabilities |
206,879,655 | 170,453,823 | ||||||
|
|
|
|
|
|||||
| Commitments and Contingencies (Note 2) |
||||||||
| Shareholders’ equity |
||||||||
| Shareholders’ equity |
3,506,608,748 | 3,332,060,486 | ||||||
|
|
|
|
|
|||||
| Total liabilities and shareholders’ equity |
$ | 3,713,488,403 | $ | 3,502,514,309 | ||||
|
|
|
|
|
|||||
| Shares outstanding |
143,049,418 | 72,190,846 | ||||||
|
|
|
|
|
|||||
See accompanying notes to financial statements.
270
Table of Contents
COMBINED STATEMENTS OF OPERATIONS
FOR THE YEARS ENDED DECEMBER 31, 2015, 2014 AND 2013*
| Year ended December 31, 2015 |
Year ended December 31, 2014 |
Year ended December 31, 2013 |
||||||||||
| Investment Income |
||||||||||||
| Interest |
$ | 1,546,729 | $ | 1,151,784 | $ | 1,552,350 | ||||||
|
|
|
|
|
|
|
|||||||
| Expenses |
||||||||||||
| Management fee |
35,055,606 | 27,669,705 | 30,836,871 | |||||||||
| Brokerage commissions and fees |
6,480,284 | 4,580,430 | 3,202,862 | |||||||||
| Offering costs |
59,479 | 16,401 | 141,251 | |||||||||
| Limitation by Sponsor |
(11,814 | ) | (9,474 | ) | (57,127 | ) | ||||||
|
|
|
|
|
|
|
|||||||
| Total expenses |
41,583,555 | 32,257,062 | 34,123,857 | |||||||||
|
|
|
|
|
|
|
|||||||
| Net investment income (loss) |
(40,036,826 | ) | (31,105,278 | ) | (32,571,507 | ) | ||||||
|
|
|
|
|
|
|
|||||||
| Realized and unrealized gain (loss) on investment activity |
||||||||||||
| Net realized gain (loss) on |
||||||||||||
| Futures contracts |
(675,706,798 | ) | (136,360,050 | ) | (398,397,208 | ) | ||||||
| Swap agreements |
(553,434,721 | ) | (79,470,613 | ) | 55,106,405 | |||||||
| Forward agreements |
(73,443,689 | ) | (155,407,226 | ) | (692,584,048 | ) | ||||||
| Foreign currency forward contracts |
138,005,915 | 210,564,249 | 114,287,543 | |||||||||
| Short-term U.S. government and agency obligations |
47,732 | 123,212 | 79,408 | |||||||||
|
|
|
|
|
|
|
|||||||
| Net realized gain (loss) |
(1,164,531,561 | ) | (160,550,428 | ) | (921,507,900 | ) | ||||||
|
|
|
|
|
|
|
|||||||
| Change in net unrealized appreciation/depreciation on |
||||||||||||
| Futures contracts |
40,193,356 | 9,175,329 | (53,329,004 | ) | ||||||||
| Swap agreements |
(16,849,426 | ) | (48,539,505 | ) | (28,257,739 | ) | ||||||
| Forward agreements |
(6,192,684 | ) | (6,131,133 | ) | 132,454,565 | |||||||
| Foreign currency forward contracts |
(56,805,160 | ) | (514,227 | ) | (8,979,636 | ) | ||||||
| Short-term U.S. government and agency obligations |
(46,135 | ) | (73,469 | ) | (3,687 | ) | ||||||
|
|
|
|
|
|
|
|||||||
| Change in net unrealized appreciation/depreciation |
(39,700,049 | ) | (46,083,005 | ) | 41,884,499 | |||||||
|
|
|
|
|
|
|
|||||||
| Net realized and unrealized gain (loss) |
(1,204,231,610 | ) | (206,633,433 | ) | (879,623,401 | ) | ||||||
|
|
|
|
|
|
|
|||||||
| Net income (loss) |
$ | (1,244,268,436 | ) | $ | (237,738,711 | ) | $ | (912,194,908 | ) | |||
|
|
|
|
|
|
|
|||||||
| * | The operations include the activity of ProShares Ultra Australian Dollar through June 29, 2015, the date of liquidation. See Note 1. |
See accompanying notes to financial statements.
271
Table of Contents
PROSHARES TRUST II
COMBINED STATEMENTS OF CHANGES IN SHAREHOLDERS’ EQUITY
FOR THE YEARS ENDED DECEMBER 31, 2015, 2014 AND 2013*
| Year ended December 31, 2015 |
Year ended December 31, 2014 |
Year ended December 31, 2013 |
||||||||||
| Shareholders’ equity, beginning of period |
$ | 3,332,060,486 | $ | 3,082,207,084 | $ | 3,242,449,608 | ||||||
| Addition of 230,297,500, 80,763,760 and 85,440,000 shares, respectively |
8,943,932,891 | 5,351,585,350 | 6,061,413,770 | |||||||||
| Redemption of 159,438,928, 79,572,779 and 75,095,573** shares, respectively |
(7,525,116,193 | ) | (4,863,993,237 | ) | (5,309,461,386 | ) | ||||||
|
|
|
|
|
|
|
|||||||
| Net addition (redemption) of 70,858,572, 1,190,981 and 10,343,842 shares, respectively |
1,418,816,698 | 487,592,113 | 751,952,384 | |||||||||
|
|
|
|
|
|
|
|||||||
| Net investment income (loss) |
(40,036,826 | ) | (31,105,278 | ) | (32,571,507 | ) | ||||||
| Net realized gain (loss) |
(1,164,531,561 | ) | (160,550,428 | ) | (921,507,900 | ) | ||||||
| Change in net unrealized appreciation/depreciation |
(39,700,049 | ) | (46,083,005 | ) | 41,884,499 | |||||||
|
|
|
|
|
|
|
|||||||
| Net income (loss) |
(1,244,268,436 | ) | (237,738,711 | ) | (912,194,908 | ) | ||||||
|
|
|
|
|
|
|
|||||||
| Shareholders’ equity, end of period |
$ | 3,506,608,748 | $ | 3,332,060,486 | $ | 3,082,207,084 | ||||||
|
|
|
|
|
|
|
|||||||
| * | The operations include the activity of ProShares Ultra Australian Dollar through June 29, 2015, the date of liquidation. See Note 1. |
| ** | Amount includes $600 of redemptions related to the termination of offerings of certain Funds. |
See accompanying notes to financial statements.
272
Table of Contents
PROSHARES TRUST II
COMBINED STATEMENTS OF CASH FLOWS
FOR THE YEARS ENDED DECEMBER 31, 2015, 2014 AND 2013*
| Year ended December 31, 2015 |
Year ended December 31, 2014 |
Year ended December 31, 2013 |
||||||||||
| Cash flow from operating activities |
||||||||||||
| Net income (loss) |
$ | (1,244,268,436 | ) | $ | (237,738,711 | ) | $ | (912,194,908 | ) | |||
| Adjustments to reconcile net income (loss) to net cash provided by (used in) operating activities: |
||||||||||||
| Decrease (Increase) in segregated cash balances with brokers for futures contracts |
35,477,903 | (61,515,085 | ) | (93,386,617 | ) | |||||||
| Purchases of short-term U.S. government and agency obligations |
(17,070,603,480 | ) | (12,667,505,150 | ) | (16,624,948,160 | ) | ||||||
| Proceeds from sales or maturities of short-term U.S. government and agency obligations |
16,764,420,326 | 12,509,293,100 | 17,115,395,982 | |||||||||
| Net amortization and accretion on short-term U.S. government and agency obligations |
(1,530,269 | ) | (1,148,962 | ) | (1,552,346 | ) | ||||||
| Net realized gain (loss) on investments |
(47,732 | ) | (123,212 | ) | (79,408 | ) | ||||||
| Change in unrealized appreciation/depreciation on investments |
79,893,405 | 55,258,334 | (95,213,503 | ) | ||||||||
| Decrease (Increase) in receivable on futures contracts |
28,346,999 | (49,071,751 | ) | 2,682,450 | ||||||||
| Decrease (Increase) in Limitation by Sponsor |
9,474 | (9,474 | ) | 5,373 | ||||||||
| Change in offering cost |
49,384 | (49,384 | ) | 64,027 | ||||||||
| Increase (Decrease) in management fee payable |
181,800 | 134,637 | (206,989 | ) | ||||||||
| Increase (Decrease) in brokerage commissions and fees payable |
39,148 | — | — | |||||||||
| Increase (Decrease) in payable on futures contracts |
(43,327,729 | ) | 36,334,537 | (64,914,699 | ) | |||||||
| Increase (Decrease) in payable for offering costs |
(65,785 | ) | 65,785 | (123,000 | ) | |||||||
|
|
|
|
|
|
|
|||||||
| Net cash provided by (used in) operating activities |
(1,451,424,992 | ) | (416,075,336 | ) | (674,471,798 | ) | ||||||
|
|
|
|
|
|
|
|||||||
| Cash flow from financing activities |
||||||||||||
| Proceeds from addition of shares |
8,953,972,200 | 5,304,403,567 | 6,098,182,208 | |||||||||
| Payment on shares redeemed |
(7,490,397,088 | ) | (4,875,819,732 | ) | (5,420,279,034 | )** | ||||||
|
|
|
|
|
|
|
|||||||
| Net cash provided by (used in) financing activities |
1,463,575,112 | 428,583,835 | 677,903,174 | |||||||||
|
|
|
|
|
|
|
|||||||
| Net increase (decrease) in cash |
12,150,120 | 12,508,499 | 3,431,376 | |||||||||
| Cash, beginning of period |
35,899,231 | 23,390,732 | 19,959,356 | |||||||||
|
|
|
|
|
|
|
|||||||
| Cash, end of period |
$ | 48,049,351 | $ | 35,899,231 | $ | 23,390,732 | ||||||
|
|
|
|
|
|
|
|||||||
| * | Amounts include the activity of ProShares Ultra Australian Dollar through June 29, 2015, the date of liquidation. See Note 1. |
| ** | Amount includes $600 of redemptions related to the termination of offerings of certain Funds. |
See accompanying notes to financial statements.
273
Table of Contents
PROSHARES TRUST II
December 31, 2015
NOTE 1 – ORGANIZATION
ProShares Trust II (formerly known as the Commodities and Currencies Trust) (the “Trust”) is a Delaware statutory trust formed on October 9, 2007 and is currently organized into separate series (each, a “Fund” and collectively, the “Funds”). As of December 31, 2015, the following twenty-one series of the Trust have commenced investment operations: (i) ProShares Managed Futures Strategy (the “Managed Futures Fund”); (ii) ProShares VIX Short-Term Futures ETF and ProShares VIX Mid-Term Futures ETF (each, a “Matching VIX Fund” and collectively, the “Matching VIX Funds”); (iii) ProShares Short VIX Short-Term Futures ETF and ProShares Ultra VIX Short-Term Futures ETF (each, a “Geared VIX Fund” and collectively, the “Geared VIX Funds”); and (iv) ProShares UltraShort Bloomberg Commodity, ProShares UltraShort Bloomberg Crude Oil, ProShares UltraShort Bloomberg Natural Gas, ProShares UltraShort Gold, ProShares UltraShort Silver, ProShares UltraShort Australian Dollar, ProShares UltraShort Euro, ProShares UltraShort Yen, ProShares Ultra Bloomberg Commodity, ProShares Ultra Bloomberg Crude Oil, ProShares Ultra Bloomberg Natural Gas, ProShares Ultra Gold, ProShares Ultra Silver, ProShares Ultra Euro and ProShares Ultra Yen (each, a “Leveraged Fund” and collectively, the “Leveraged Funds”); and (v) ProShares Short Euro (the “Short Euro Fund”). Each of the Funds listed above issues common units of beneficial interest (“Shares”), which represent units of fractional undivided beneficial interest in and ownership of only that Fund. The Shares of each Fund are listed on the New York Stock Exchange Archipelago (“NYSE Arca”). The Leveraged Funds, the Short Euro Fund and the Geared VIX Funds, are collectively referred to as the “Geared Funds” in these Notes to Financial Statements. The Geared VIX Funds and the Matching VIX Funds are collectively referred to as the “VIX Funds” in these Notes to Financial Statements.
On May 22, 2015, the Trust announced plans to liquidate ProShares Ultra Australian Dollar (ticker symbol: GDAY). ProShares Ultra Australian Dollar was closed to purchases and redemptions as of the close of regular trading on the NYSE Arca on June 18, 2015. Beginning June 19, 2015, no secondary market for ProShares Ultra Australian Dollar’s Shares remained. Proceeds of the liquidation were distributed to shareholders on June 29, 2015. Any shareholders remaining in the fund on June 29, 2015 automatically had their shares redeemed for cash at ProShares Ultra Australian Dollar’s net asset value per Share as of June 19, 2015. On June 30, 2015, the NYSE Arca filed a Form 25 removing the listing of ProShares Ultra Australian Dollar on the NYSE Arca. On July 10, 2015 a Form 15 was filed with the U.S. Securities and Exchange Commission (“SEC”) terminating the registration of ProShares Ultra Australian Dollar.
The Trust had no operations prior to November 24, 2008, other than matters relating to its organization, the registration of each series under the Securities Act of 1933, as amended, and the sale and issuance to ProShare Capital Management LLC (the “Sponsor”) of fourteen Shares at an aggregate purchase price of $350 in each of the following Funds: ProShares UltraShort Bloomberg Commodity, ProShares UltraShort Bloomberg Crude Oil, ProShares UltraShort Gold, ProShares UltraShort Silver, ProShares UltraShort Euro, ProShares UltraShort Yen, ProShares Ultra Bloomberg Commodity, ProShares Ultra Bloomberg Crude Oil, ProShares Ultra Gold, ProShares Ultra Silver, ProShares Ultra Euro and ProShares Ultra Yen.
Groups of Funds are collectively referred to in several different ways. References to “Short Funds,” “UltraShort Funds,” or “Ultra Funds” refer to the different Funds based upon their investment objectives, but without distinguishing among the Funds’ benchmarks.
References to “Commodity Index Funds,” “Commodity Funds” and “Currency Funds” refer to the different Funds according to their general benchmark categories without distinguishing among the Funds’ investment objectives or Fund-specific benchmarks. References to “VIX Funds” refer to the different Funds based upon their investment objective and their general benchmark categories.
Each “Short” Fund seeks daily investment results (before fees and expenses) that correspond to the inverse (-1x) of the daily performance of its corresponding benchmark. Each “UltraShort” Fund seeks daily investment results (before fees and expenses) that correspond to two times the inverse (-2x) of the daily performance of its corresponding benchmark. Each “Ultra” Fund seeks daily investment results (before fees and expenses) that
274
Table of Contents
correspond to two times (2x) the daily performance of its corresponding benchmark. Each Matching VIX Fund and the Managed Futures Fund seeks investment results (before fees and expenses), both over a single day and over time, that match the performance of its corresponding benchmark. Daily performance is measured from the calculation of one NAV to the next.
The Geared Funds do not seek to achieve their stated investment objective over a period of time greater than a single day because mathematical compounding prevents the Geared Funds from achieving such results. Accordingly, results over periods of time greater than a single day should not be expected to be a simple multiple (e.g., -1x, -2x or 2x) of the period return of the corresponding benchmark and will likely differ significantly.
The Matching VIX Funds and the Managed Futures Fund seek to achieve their stated investment objective both over a single day and over time.
Each of the Funds generally invests in Financial Instruments (i.e., instruments whose value is derived from the value of an underlying asset, rate or index, including futures contracts, swap agreements, forward contracts and other instruments) as a substitute for investing directly in commodities, currencies, or spot volatility products in order to gain exposure to its applicable underlying commodity futures index, commodity, currency exchange rate or equity volatility index. Financial Instruments also are used to produce economically “inverse,” “inverse leveraged” or “leveraged” investment results for the Geared Funds.
Share Splits and Reverse Share Splits
The table below includes Share splits and reverse Share splits for the Funds during the years ended December 31, 2013, 2014 and 2015. The ticker symbols for these Funds did not change, and each Fund continues to trade on the NYSE Arca.
| Fund | Execution Date (Prior to Opening of Trading) |
Type of Split | Date Trading Resumed at Post- Split Price | |||
| ProShares VIX Short-Term Futures ETF |
June 10, 2013 | 1-for-5 reverse Share split | June 10, 2013 | |||
| ProShares VIX Mid-Term Futures ETF |
November 6, 2014 | 1-for-4 reverse Share split | November 6, 2014 | |||
| ProShares Short VIX Short-Term Futures ETF |
January 21, 2014 | 2-for-1 Share split | January 24, 2014 | |||
| ProShares Ultra VIX Short-Term Futures ETF |
June 10, 2013 | 1-for-10 reverse Share split |
June 10, 2013 | |||
| ProShares Ultra VIX Short-Term Futures ETF |
January 21, 2014 | 1-for-4 reverse Share split | January 24, 2014 | |||
| ProShares Ultra VIX Short-Term Futures ETF |
May 20, 2015 | 1-for-5 reverse Share split | May 20, 2015 | |||
| ProShares UltraShort Bloomberg Natural Gas |
June 10, 2013 | 1-for-4 reverse Share split | June 10, 2013 | |||
| ProShares UltraShort Silver |
November 13, 2015 | 2-for-1 Share split | November 13, 2015 | |||
| ProShares Ultra Silver |
January 21, 2014 | 1-for-4 reverse Share split | January 24, 2014 | |||
| ProShares Ultra Bloomberg Commodity |
May 20, 2015 | 1-for-4 reverse Share split | May 20, 2015 | |||
| ProShares Ultra Bloomberg Crude Oil |
May 20, 2015 | 1-for-5 reverse Share split | May 20, 2015 | |||
| ProShares Ultra Bloomberg Natural Gas |
May 20, 2015 | 1-for-4 reverse Share split | May 20, 2015 | |||
| ProShares Ultra Yen |
May 20, 2015 | 1-for-4 reverse Share split | May 20, 2015 |
The reverse splits were applied retroactively for all periods presented, reducing the number of Shares outstanding for each of the Funds, and resulted in a proportionate increase in the price per Share and per Share information of each such Fund. Therefore, the reverse splits did not change the aggregate net asset value of a shareholder’s investment at the time of the reverse split.
The splits were applied retroactively for all periods presented, increasing the number of Shares outstanding for each of the Funds, and resulted in a proportionate decrease in the price per Share and per Share information of each such Fund. Therefore, the splits did not change the aggregate net asset value of a shareholder’s investment at the time of the split.
275
Table of Contents
NOTE 2 – SIGNIFICANT ACCOUNTING POLICIES
Each Fund is an investment company, as defined by Financial Accounting Standards Board (FASB) Accounting Standards Codification (ASC) Topic 946 “Financial Services — Investment Companies.” As such, the Funds follow the investment company accounting and reporting guidance. The following is a summary of significant accounting policies followed by each Fund, as applicable, in preparation of its financial statements. These policies are in conformity with accounting principles generally accepted in the United States of America (“GAAP”). Certain prior year amounts have been reclassified to conform to the current year presentation.
Use of Estimates & Indemnifications
The preparation of financial statements in conformity with GAAP requires management to make estimates and assumptions that affect the reported amounts and disclosures in these financial statements. Actual results could differ from those estimates.
In the normal course of business, the Trust enters into contracts that contain a variety of representations which provide general indemnifications. The Trust’s maximum exposure under these arrangements cannot be known; however, the Trust expects any risk of loss to be remote.
Basis of Presentation
Pursuant to rules and regulations of the U.S. Securities and Exchange Commission (“SEC”), audited financial statements are presented for the Trust as a whole, as the SEC registrant, and for each Fund individually. The debts, liabilities, obligations and expenses incurred, contracted for or otherwise existing with respect to a particular Fund shall be enforceable only against the assets of such Fund and not against the assets of the Trust generally or any other Fund. Accordingly, the assets of one Fund of the Trust include only those funds and other assets that are paid to, held by or distributed to the Trust for the purchase of Shares in that Fund.
Statement of Cash Flows
The cash amount shown in the Statements of Cash Flows is the amount reported as cash in the Statement of Financial Condition dated December 31, 2015 and 2014, and represents non-segregated cash with the custodian and does not include short-term investments.
Final Net Asset Value for Fiscal Period
The cut-off times and the times of the calculation of the Funds’ final net asset value for creation and redemption of fund Shares for the year ended December 31, 2015 were as follows. All times are Eastern Standard Time:
| Create/Redeem Cut-off* |
NAV Calculation Time |
NAV Calculation Date |
||||||||||
| UltraShort Silver, Ultra Silver |
6:30 a.m. | 7:00 a.m. | December 31 | |||||||||
| UltraShort Gold, Ultra Gold |
9:30 a.m. | 10:00 a.m. | December 31 | |||||||||
| UltraShort Bloomberg Crude Oil, Ultra Bloomberg Crude Oil |
2:00 p.m. | 2:30 p.m. | December 31 | |||||||||
| UltraShort Bloomberg Natural Gas, Ultra Bloomberg Natural Gas |
2:00 p.m. | 2:30 p.m. | December 31 | |||||||||
| UltraShort Bloomberg Commodity, Ultra Bloomberg Commodity |
10:45 a.m. | 2:30 p.m. | December 31 | |||||||||
| Managed Futures Strategy |
10:45 a.m. | 3:00 p.m. | December 31 | |||||||||
| UltraShort Australian Dollar |
3:00 p.m. | 4:00 p.m. | December 31 | |||||||||
| Short Euro, UltraShort Euro, Ultra Euro |
3:00 p.m. | 4:00 p.m. | December 31 | |||||||||
| UltraShort Yen, Ultra Yen |
3:00 p.m. | 4:00 p.m. | December 31 | |||||||||
| VIX Short-Term Futures ETF, Ultra VIX Short-Term Futures ETF, Short VIX Short-Term Futures ETF |
2:00 p.m. | 4:15 p.m. | December 31 | |||||||||
| VIX Mid-Term Futures ETF |
2:00 p.m. | 4:15 p.m. | December 31 | |||||||||
| * | Although the Funds’ shares may continue to trade on secondary markets subsequent to the calculation of the final NAV, these times represent the final opportunity to transact in creation or redemption units for the year ended December 31, 2015. |
276
Table of Contents
Market value per Share is determined at the close of the NYSE Arca and may be later than when the Funds’ NAV per Share is calculated.
For financial reporting purposes, the Funds value transactions based upon the final closing price in their primary markets. Accordingly, the investment valuations in these financial statements may differ from those used in the calculation of certain of the Funds’ final creation/redemption NAV for the year ended December 31, 2015.
Investment Valuation
Short-term investments are valued at amortized cost which approximates fair value for daily NAV purposes. For financial reporting purposes, short-term investments are valued at their market price using information provided by a third-party pricing service or market quotations. In each of these situations, valuations are typically categorized as Level I in the fair value hierarchy.
Derivatives (e.g., futures contracts, swap agreements, forward agreements and foreign currency forward contracts) are generally valued using independent sources and/or agreements with counterparties or other procedures as determined by the Sponsor. Futures contracts, except for those entered into by the Gold, Silver, Australian Dollar and Short Euro Funds, are generally valued at the last settled price on the applicable exchange on which that future trades. Futures contracts entered into by the Gold, Silver, Australian Dollar and Short Euro Funds are valued at the last sales price prior to the time at which the NAV per Share of a Fund is determined. For financial reporting purposes, all futures contracts are valued at the last settled price. Futures contracts valuations are typically categorized as Level I in the fair value hierarchy. Swap agreements, forward agreements and foreign currency forward contracts valuations are typically categorized as Level II in the fair value hierarchy. If there was no sale on that day, and for non-exchange-traded derivatives, the Sponsor may in its sole discretion choose to determine a fair value price as the basis for determining the market value of such position for such day. Such fair value prices would generally be determined based on available inputs about the current value of the underlying financial instrument or commodity and would be based on principles that the Sponsor deems fair and equitable so long as such principles are consistent with industry standards. When market closing prices are not available, the Sponsor may fair value an asset of a Fund pursuant to the policies the Sponsor has adopted, which are consistent with normal industry standards. Depending on the source and relevant significance of valuation inputs, these instruments may be classified as Level II or Level III in the fair value hierarchy.
Fair value pricing may require subjective determinations about the value of an investment. While the Funds’ policies are intended to result in a calculation of its respective Fund’s NAV that fairly reflects investment values as of the time of pricing, such Fund cannot ensure that fair values determined by the Sponsor or persons acting at their direction would accurately reflect the price that a Fund could obtain for an investment if it were to dispose of that investment as of the time of pricing (for instance, in a forced or distressed sale). The prices used by such Fund may differ from the value that would be realized if the investments were sold and the differences could be material to the financial statements.
Fair Value of Financial Instruments
The Funds disclose the fair value of their investments in a hierarchy that prioritizes the inputs to valuation techniques used to measure fair value. The disclosure requirements establish a fair value hierarchy that distinguishes between: (1) market participant assumptions developed based on market data obtained from sources independent of the Funds (observable inputs); and (2) the Funds’ own assumptions about market participant assumptions developed based on the best information available under the circumstances (unobservable inputs). The three levels defined by the disclosure requirements hierarchy are as follows:
277
Table of Contents
Level I – Quoted prices (unadjusted) in active markets for identical assets or liabilities that the reporting entity has the ability to access at the measurement date.
Level II – Inputs other than quoted prices included within Level I that are observable for the asset or liability, either directly or indirectly. Level II assets include the following: quoted prices for similar assets or liabilities in active markets, quoted prices for identical or similar assets or liabilities in markets that are not active, inputs other than quoted prices that are observable for the asset or liability, and inputs that are derived principally from or corroborated by observable market data by correlation or other means (market-corroborated inputs).
Level III – Unobservable pricing input at the measurement date for the asset or liability. Unobservable inputs shall be used to measure fair value to the extent that observable inputs are not available.
In some instances, the inputs used to measure fair value might fall in different levels of the fair value hierarchy. The level in the fair value hierarchy within which the fair value measurement in its entirety falls is determined based on the lowest input level that is significant to the fair value measurement in its entirety.
Fair value measurements also require additional disclosure when the volume and level of activity for the asset or liability have significantly decreased, as well as when circumstances indicate that a transaction is not orderly.
278
Table of Contents
The following table summarizes the valuation of investments at December 31, 2015 using the fair value hierarchy:
| Level I - Quoted Prices | Level II - Other Significant Observable Inputs | |||||||||||||||||||||||
| Short-Term U.S. Government and Agencies |
Futures Contracts* |
Forward Agreements |
Foreign Currency Forward Contracts |
Swap Agreements |
Total | |||||||||||||||||||
| Managed Futures Strategy |
$ | — | $ | 57,179 | $ | — | $ | — | $ | — | $ | 57,179 | ||||||||||||
| VIX Short-Term Futures ETF |
96,073,659 | (1,078,625 | ) | — | — | — | 94,995,034 | |||||||||||||||||
| VIX Mid-Term Futures ETF |
25,976,287 | (344,360 | ) | — | — | — | 25,631,927 | |||||||||||||||||
| Short VIX Short-Term Futures ETF |
535,392,718 | 10,746,415 | — | — | — | 546,139,133 | ||||||||||||||||||
| Ultra VIX Short-Term Futures ETF |
438,357,849 | 11,894,466 | — | — | — | 450,252,315 | ||||||||||||||||||
| UltraShort Bloomberg Commodity |
7,518,119 | — | — | — | 171,324 | 7,689,443 | ||||||||||||||||||
| UltraShort Bloomberg Crude Oil |
79,692,642 | 2,464,513 | — | — | 6,412,656 | 88,569,811 | ||||||||||||||||||
| UltraShort Bloomberg Natural Gas |
8,115,004 | (2,471,164 | ) | — | — | — | 5,643,840 | |||||||||||||||||
| UltraShort Gold |
72,979,905 | 5,220 | 1,808,942 | — | — | 74,794,067 | ||||||||||||||||||
| UltraShort Silver |
50,730,230 | 5,970 | 4,778,279 | — | — | 55,514,479 | ||||||||||||||||||
| Short Euro |
15,153,211 | 243,438 | — | — | — | 15,396,649 | ||||||||||||||||||
| UltraShort Australian Dollar |
18,408,894 | (420,270 | ) | — | — | — | 17,988,624 | |||||||||||||||||
| UltraShort Euro |
546,166,776 | — | — | (28,710,336 | ) | — | 517,456,440 | |||||||||||||||||
| UltraShort Yen |
259,997,001 | — | — | (13,895,452 | ) | — | 246,101,549 | |||||||||||||||||
| Ultra Bloomberg Commodity |
7,084,065 | — | — | — | (183,916 | ) | 6,900,149 | |||||||||||||||||
| Ultra Bloomberg Crude Oil |
797,650,543 | (17,929,314 | ) | — | — | (72,176,589 | ) | 707,544,640 | ||||||||||||||||
| Ultra Bloomberg Natural Gas |
26,807,731 | 6,312,879 | — | — | — | 33,120,610 | ||||||||||||||||||
| Ultra Gold |
71,912,587 | (5,200 | ) | (2,250,595 | ) | — | — | 69,656,792 | ||||||||||||||||
| Ultra Silver |
238,899,626 | (9,030 | ) | (22,561,101 | ) | — | — | 216,329,495 | ||||||||||||||||
| Ultra Euro |
11,605,262 | — | — | 604,920 | — | 12,210,182 | ||||||||||||||||||
| Ultra Yen |
5,069,491 | — | — | 261,311 | — | 5,330,802 | ||||||||||||||||||
|
|
|
|
|
|
|
|
|
|
|
|
|
|||||||||||||
| Total Trust |
$ | 3,313,591,600 | $ | 9,472,117 | $ | (18,224,475 | ) | $ | (41,739,557 | ) | $ | (65,776,525 | ) | $ | 3,197,323,160 | |||||||||
| * | Includes cumulative appreciation/depreciation of futures contracts as reported in the Schedules of Investments. Only current day’s variation margin is reported within the Statements of Financial Condition in receivable/payable on open futures. |
At December 31, 2015, there were no Level III portfolio investments for which significant unobservable inputs were used to determine fair value.
The Funds’ policy is to recognize transfers between valuation levels at the end of the reporting period.
At December 31, 2015, there were no significant transfers in or out of Level I and Level II fair value measurements.
The inputs or methodology used for valuing investments are not necessarily an indication of the risk associated with investing in those securities.
279
Table of Contents
The following table summarizes the valuation of investments at December 31, 2014 using the fair value hierarchy:
| Level I - Quoted Prices | Level II - Other Significant Observable Inputs | |||||||||||||||||||||||
| Short-Term U.S. Government and Agencies |
Futures Contracts* |
Forward Agreements |
Foreign Currency Forward Contracts |
Swap Agreements |
Total | |||||||||||||||||||
| Managed Futures Strategy |
$ | — | $ | 104,327 | $ | — | $ | — | $ | — | $ | 104,327 | ||||||||||||
| VIX Short-Term Futures ETF |
82,088,299 | 6,264,620 | — | — | — | 88,352,919 | ||||||||||||||||||
| VIX Mid-Term Futures ETF |
24,105,906 | 260,665 | — | — | — | 24,366,571 | ||||||||||||||||||
| Short VIX Short-Term Futures ETF |
446,975,220 | (16,352,149 | ) | — | — | — | 430,623,071 | |||||||||||||||||
| Ultra VIX Short-Term Futures ETF |
182,639,188 | 39,585,253 | — | — | — | 222,224,441 | ||||||||||||||||||
| UltraShort Bloomberg Commodity |
4,233,548 | — | — | — | 567,259 | 4,800,807 | ||||||||||||||||||
| UltraShort Bloomberg Crude Oil |
131,594,608 | 15,806,603 | — | — | 27,018,077 | 174,419,288 | ||||||||||||||||||
| UltraShort Bloomberg Natural Gas |
8,672,710 | 3,941,465 | — | — | — | 12,614,175 | ||||||||||||||||||
| UltraShort Gold |
84,040,107 | (4,520 | ) | (2,282,778 | ) | — | — | 81,752,809 | ||||||||||||||||
| UltraShort Silver |
52,226,692 | 1,560 | 594,953 | — | — | 52,823,205 | ||||||||||||||||||
| Short Euro |
12,086,577 | 385,331 | — | — | — | 12,471,908 | ||||||||||||||||||
| UltraShort Australian Dollar |
20,267,679 | 743,481 | — | — | — | 21,011,160 | ||||||||||||||||||
| UltraShort Euro |
487,111,117 | — | — | 16,762,994 | — | 503,874,111 | ||||||||||||||||||
| UltraShort Yen |
532,957,746 | — | — | (1,578,775 | ) | — | 531,378,971 | |||||||||||||||||
| Ultra Bloomberg Commodity |
2,754,900 | — | — | — | (331,338 | ) | 2,423,562 | |||||||||||||||||
| Ultra Bloomberg Crude Oil |
467,200,736 | (46,474,787 | ) | — | — | (76,181,097 | ) | 344,544,852 | ||||||||||||||||
| Ultra Bloomberg Natural Gas |
53,410,227 | (34,889,283 | ) | — | — | — | 18,520,944 | |||||||||||||||||
| Ultra Gold |
101,927,857 | 4,580 | 2,051,154 | — | — | 103,983,591 | ||||||||||||||||||
| Ultra Silver |
305,474,211 | (1,560 | ) | (12,395,120 | ) | — | — | 293,077,531 | ||||||||||||||||
| Ultra Euro |
2,415,698 | — | — | (103,371 | ) | — | 2,312,327 | |||||||||||||||||
| Ultra Yen |
1,287,869 | — | — | (15,245 | ) | — | 1,272,624 | |||||||||||||||||
|
|
|
|
|
|
|
|
|
|
|
|
|
|||||||||||||
| Total Trust** |
$ | 3,003,470,895 | $ | (30,624,414 | ) | $ | (12,031,791 | ) | $ | 15,065,603 | $ | (48,927,099 | ) | $ | 2,926,953,194 | |||||||||
| * | Includes cumulative appreciation/depreciation of futures contracts as reported in the Schedules of Investments. Only current day’s variation margin is reported within the Statements of Financial Condition in receivable/payable on open futures. |
| ** | Amount excludes the activity of ProShares Ultra Australian Dollar which liquidated in June 2015. |
At December 31, 2014, there were no Level III portfolio investments for which significant unobservable inputs were used to determine fair value.
The Funds’ policy is to recognize transfers between valuation levels at the end of the reporting period.
At December 31, 2014, there were no significant transfers in or out of Level I and Level II fair value measurements.
The inputs or methodology used for valuing investments are not necessarily an indication of the risk associated with investing in those securities.
280
Table of Contents
Investment Transactions and Related Income
Investment transactions are recorded on the trade date. All such transactions are recorded on the identified cost basis and marked to market daily. Unrealized appreciation/depreciation on open contracts are reflected in the Statements of Financial Condition and changes in the unrealized appreciation/depreciation between periods are reflected in the Statements of Operations. Discounts on short-term securities purchased are amortized and reflected as Interest Income in the Statements of Operations.
Brokerage Commissions and Fees
Each Fund pays its respective brokerage commissions, including applicable exchange fees, National Futures Association (“NFA”) fees, give-up fees, pit brokerage fees and other transaction related fees and expenses charged in connection with trading activities for each Fund’s investment in U.S. Commodity Futures Trading Commission (“CFTC”) regulated investments. The effects of trading spreads, financing costs/fees associated with Financial Instruments, and costs relating to the purchase of U.S. Treasury securities or similar high credit quality short-term fixed-income or similar securities would also be borne by the Funds. Brokerage commissions on futures contracts are recognized on a half-turn basis (e.g., the first half is recognized when the contract is purchased (opened) and the second half is recognized when the transaction is closed). Through July 30, 2014, the Sponsor paid brokerage commissions on VIX futures contracts for the Matching VIX Funds. On July 31, 2014, the Sponsor began paying, and is currently paying, brokerage commissions on VIX futures contracts for the Matching VIX Funds that exceed variable create/redeem fees collected by more than 0.02% of the Matching VIX Fund’s average net assets annually.
Federal Income Tax
Each Fund is registered as a series of a Delaware statutory trust and is treated as a partnership for U.S. federal income tax purposes. Accordingly, no Fund expects to incur U.S. federal income tax liability; rather, each beneficial owner of a Fund’s Shares is required to take into account its allocable share of its Fund’s income, gain, loss, deductions and other items for its Fund’s taxable year ending with or within the beneficial owner’s taxable year.
Management of the Funds has reviewed all open tax years and major jurisdictions (i.e., the last four tax year ends and the interim tax period since then, as applicable) and concluded that there is no tax liability resulting from unrecognized tax benefits relating to uncertain income tax positions taken or expected to be taken in future tax returns. The Funds are also not aware of any tax positions for which it is reasonably possible that the total amounts of unrecognized tax benefits will significantly change in the next twelve months. On an ongoing basis, management will monitor its tax positions taken under the interpretation to determine if adjustments to conclusions are necessary based on factors including, but not limited to, on-going analysis of tax law, regulation, and interpretations thereof.
NOTE 3 – INVESTMENTS
Short-Term Investments
The Funds may purchase U.S. Treasury Bills, agency securities, and other high-credit quality short-term fixed income or similar securities with original maturities of one year or less. A portion of these investments may be posted as collateral in connection with swap agreements and/or used as collateral for a Fund’s trading in futures and forward contracts.
Accounting for Derivative Instruments
In seeking to achieve each Fund’s investment objective, the Sponsor uses a mathematical approach to investing. Using this approach, the Sponsor determines the type, quantity and mix of investment positions, including derivative positions, which the Sponsor believes in combination, should produce returns consistent with a Fund’s objective.
All open derivative positions at period end are reflected on each respective Fund’s Schedule of Investments. Certain Funds utilized a varying level of derivative instruments in conjunction with investment securities in seeking to meet their investment objective during the period. While the volume of open positions may vary on a daily basis as each Fund transacts derivatives contracts in order to achieve the appropriate exposure to meet its investment objective, the volume of these open positions relative to the net assets of each respective Fund at the date of this report is generally representative of open positions throughout the reporting period.
281
Table of Contents
Following is a description of the derivative instruments used by the Funds during the reporting period, including the primary underlying risk exposures related to each instrument type.
Futures Contracts
The Funds enter into futures contracts to gain exposure to changes in the value of, or as a substitute for investing directly in (or shorting), an underlying index, currency or commodity. A futures contract obligates the seller to deliver (and the purchaser to accept) the future delivery of a specified quantity and type of asset at a specified time and place. The contractual obligations of a buyer or seller may generally be satisfied by taking or making physical delivery of the underlying commodity, if applicable, or by making an offsetting sale or purchase of an identical futures contract on the same or linked exchange before the designated date of delivery, or by cash settlement at expiration of contract.
Upon entering into a futures contract, each Fund is required to deposit and maintain as collateral at least such initial margin as required by the exchange on which the transaction is affected. The initial margin is segregated as cash and/or securities balances with brokers for futures contracts, as disclosed in the Statements of Financial Condition, and is restricted as to its use. The Funds that enter into futures contracts maintain collateral at the broker in the form of cash. Pursuant to the futures contract, each Fund generally agrees to receive from or pay to the broker(s) an amount of cash equal to the daily fluctuation in value of the futures contract. Such receipts or payments are known as variation margin and are recorded by each Fund as unrealized gains or losses. Each Fund will realize a gain or loss upon closing of a futures transaction.
Futures contracts involve, to varying degrees, elements of market risk (specifically commodity price risk or equity market volatility risk) and exposure to loss in excess of the amount of variation margin. The face or contract amounts reflect the extent of the total exposure each Fund has in the particular classes of instruments. Additional risks associated with the use of futures contracts are imperfect correlation between movements in the price of the futures contracts and the market value of the underlying index or commodity and the possibility of an illiquid market for a futures contract. With futures contracts, there is minimal but some counterparty risk to the Funds since futures contracts are exchange-traded and the exchange’s clearinghouse, as counterparty to all exchange-traded futures contracts, guarantees the futures contracts against default. Many futures exchanges and boards of trade limit the amount of fluctuation permitted in futures contract prices during a single trading day. Once the daily limit has been reached in a particular contract, no trades may be made that day at a price beyond that limit or trading may be suspended for specified times during the trading day. Futures contracts prices could move to the limit for several consecutive trading days with little or no trading, thereby preventing prompt liquidation of futures positions and potentially subjecting a Fund to substantial losses. If trading is not possible, or if a Fund determines not to close a futures position in anticipation of adverse price movements, the Fund will be required to make daily cash payments of variation margin. The risk the Fund will be unable to close out a futures position will be minimized by entering into such transactions on a national exchange with an active and liquid secondary market.
Swap Agreements
Certain of the Funds enter into swap agreements for purposes of pursuing their investment objectives or as a substitute for investing directly in (or shorting) an underlying index, currency or commodity, or to create an economic hedge against a position. Swap agreements are two-party contracts that have traditionally been entered into primarily with institutional investors in over-the-counter (“OTC”) markets for a specified period, ranging from a day to more than one year. However, the Dodd-Frank Wall Street Reform and Consumer Protection Act (the “Dodd-Frank Act”) provides for significant reforms of the OTC derivative markets, including a requirement to execute certain swap transactions on a CFTC-regulated market and/or to clear such transactions through a CFTC-regulated central clearing organization. In a standard swap transaction, two parties agree to exchange the returns earned or realized on a particular predetermined investment, instrument or index in exchange for a fixed or floating rate of return in respect of a predetermined notional amount. Transaction or commission costs are reflected in the benchmark level at which the transaction is entered into. The gross returns to be exchanged are calculated with respect to a notional amount and the benchmark returns to which the swap is linked. Swap agreements do not involve the delivery of underlying instruments.
282
Table of Contents
Generally, swap agreements entered into by the Funds calculate and settle the obligations of the parties to the agreement on a “net basis” with a single payment. Consequently, each Fund’s current obligations (or rights) under a swap agreement will generally be equal only to the net amount to be paid or received under the agreement based on the relative values of such obligations (or rights) (the “net amount”). In a typical swap agreement entered into by a Matching VIX Fund or an Ultra Fund, the Matching VIX Fund or Ultra Fund would be entitled to settlement payments in the event the level of the benchmark increases and would be required to make payments to the swap counterparties in the event the level of the benchmark decreases, adjusted for any transaction costs or trading spreads on the notional amount the Funds may pay. In a typical swap agreement entered into by a Short Fund or an UltraShort Fund, the Short Fund or UltraShort Fund would be required to make payments to the swap counterparties in the event the level of the benchmark increases and would be entitled to settlement payments in the event the level of the benchmark decreases, adjusted for any transaction costs or trading spreads on the notional amount the Funds may pay.
The net amount of the excess, if any, of each Fund’s obligations over its entitlements with respect to each uncleared swap agreement is accrued on a daily basis and an amount of cash and/or securities having an aggregate value at least equal to such accrued excess is maintained for the benefit of the counterparty in a segregated account by the Funds’ Custodian. The net amount of the excess, if any, of each Fund’s entitlements over its obligations with respect to each uncleared swap agreement is accrued on a daily basis and an amount of cash and/or securities having an aggregate value at least equal to such accrued excess is maintained for the benefit of the Fund in a segregated account by the Fund’s Custodian. Until a swap agreement is settled in cash, the gain or loss on the notional amount less any transaction costs or trading spreads payable by each Fund on the notional amount are recorded as “unrealized appreciation or depreciation on swap agreements” and, when cash is exchanged, the gain or loss realized is recorded as “realized gains or losses on swap agreements.” Swap agreements are generally valued at the last settled price of the benchmark referenced asset.
The Trust, on behalf of a Fund, may enter into agreements with certain counterparties for derivative transactions. These agreements contain various conditions, events of default, termination events, covenants and representations. The triggering of certain events or the default on certain terms of the agreement could allow a party to terminate a transaction under the agreement and request immediate payment in an amount equal to the net positions owed the party under the agreement. This could cause a Fund to have to enter into a new transaction with the same counterparty, enter into a transaction with a different counterparty or seek to achieve its investment objective through any number of different investments or investment techniques.
Swap agreements involve, to varying degrees, elements of market risk and exposure to loss in excess of the unrealized gain/loss reflected. The notional amounts reflect the extent of the total investment exposure each Fund has under the swap agreement, which may exceed the NAV of each Fund. Additional risks associated with the use of swap agreements are imperfect correlations between movements in the notional amount and the price of the underlying reference index and the inability of counterparties to perform. Each Fund bears the risk of loss of the amount expected to be received under a swap agreement in the event of the default or bankruptcy of a swap agreement counterparty. A Fund will typically enter into swap agreements only with major global financial institutions. The creditworthiness of each of the firms that is a party to a swap agreement is monitored by the Sponsor. The Sponsor may use various techniques to minimize credit risk including early termination and payment, using different counterparties, limiting the net amount due from any individual counterparty and generally requiring collateral to be posted by the counterparty in an amount approximately equal to that owed to the Funds. All of the outstanding swap agreements at December 31, 2015 contractually terminate within one month but may be terminated without penalty by either party daily. Upon termination, the Fund is entitled to pay or receive the “unrealized appreciation or depreciation” amount.
The Funds, as applicable, collateralize swap agreements by segregating or designating cash and/or certain securities as indicated on the Statements of Financial Condition or Schedules of Investments. As noted above, collateral posted in connection with uncleared derivative transactions is held for the benefit of the counterparty in a segregated tri-party account at the Custodian to protect the counterparty against non-payment by the Funds. In the event of a default by the counterparty, the Funds will seek withdrawal of this collateral from the segregated account and may
283
Table of Contents
incur certain costs in exercising its right with respect to the collateral. If a counterparty becomes bankrupt or otherwise fails to perform its obligations due to financial difficulties, the Funds may experience significant delays in obtaining any recovery in a bankruptcy or other reorganizational proceeding. The Funds may obtain only limited recovery or may obtain no recovery in such circumstances.
The Funds remain subject to credit risk with respect to the amount they expect to receive from counterparties. However, the Funds have sought to mitigate these risks in connection with uncleared swaps by generally requiring that the counterparties for each Fund agree to post collateral for the benefit of the Fund, marked to market daily, in an amount approximately equal to what the counterparty owes the Fund, subject to certain minimum thresholds. In the event of the bankruptcy of a counterparty, the Fund will have direct access to the collateral received from the counterparty, generally as of the day prior to the bankruptcy, because there is a one day time lag between the Fund’s request for collateral and the delivery of such collateral. To the extent any such collateral is insufficient, the Funds will be exposed to counterparty risk as described above, including the possible delays in recovering amounts as a result of bankruptcy proceedings. As of December 31, 2015, the collateral posted by counterparties consisted of cash and/or U.S. Treasury securities.
The counterparty/credit risk for cleared derivative transactions is generally lower than for uncleared OTC derivatives since generally a clearing organization becomes substituted for each counterparty to a cleared derivative contract and, in effect, guarantees the parties’ performance under the contract as each party to a trade looks only to the clearing organization for performance of financial obligations. In addition, cleared derivative transactions benefit from daily marking-to-market and settlement, and segregation and minimum capital requirements applicable to intermediaries.
Forward Contracts
Certain of the Funds enter into forward contracts for purposes of pursuing their investment objectives and as a substitute for investing directly in (or shorting) commodities and/or currencies. A forward contract is an agreement between two parties to purchase or sell a specified quantity of an asset at or before a specified date in the future at a specified price. Forward contracts are typically traded in OTC markets and all details of the contract are negotiated between the counterparties to the agreement. Accordingly, the forward contracts are valued by reference to the contracts traded in the OTC markets.
The contractual obligations of a buyer or seller may generally be satisfied by taking or making physical delivery of the underlying commodity or currency, establishing an opposite position in the contract and recognizing the profit or loss on both positions simultaneously on the delivery date or, in some instances, paying a cash settlement before the designated date of delivery. The forward contracts are adjusted by the daily fluctuation of the underlying commodity or currency and any gains or losses are recorded for financial statement purposes as unrealized gains or losses until the contract settlement date.
Forward contracts have traditionally not been cleared or guaranteed by a third party. As a result of the Dodd-Frank Act, the CFTC now regulates non-deliverable forwards (including deliverable forwards where the parties do not take delivery). Certain non-deliverable forward contracts, such as non-deliverable foreign exchange forwards, may be subject to regulation as swap agreements, including mandatory clearing. Changes in the forward markets may entail increased costs and result in burdensome reporting requirements.
The Funds may collateralize uncleared forward commodity contracts by segregating or designating cash and/or certain securities as indicated on their Statements of Financial Condition or Schedules of Investments. Such collateral is held for the benefit of the counterparty in a segregated tri-party account at the Custodian to protect the counterparty against non-payment by the Funds. In the event of a default by the counterparty, the Funds will seek withdrawal of this collateral from the segregated account and may incur certain costs in exercising its right with respect to the collateral. If a counterparty becomes bankrupt or otherwise fails to perform its obligations due to financial difficulties, the Funds may experience significant delays in obtaining any recovery in a bankruptcy or other reorganizational proceeding. The Funds may obtain only limited recovery or may obtain no recovery in such circumstances.
284
Table of Contents
The Funds remain subject to credit risk with respect to the amount they expect to receive from counterparties. However, the Funds have sought to mitigate these risks by generally requiring that the counterparties for each Fund agree to post collateral for the benefit of the Fund, marked to market daily, in an amount approximately equal to what the counterparty owes the Fund, subject to minimum thresholds. In the event of the bankruptcy of a counterparty, the Fund will have direct access to the collateral received from the counterparty, generally as of the day prior to the bankruptcy, because there is a one day time lag between the Fund’s request for collateral and the delivery of such collateral. To the extent any such collateral is insufficient, the Fund will be exposed to counterparty risk as described above, including the possible delays in recovering amounts as a result of bankruptcy proceedings. As of December 31, 2015, the collateral posted by counterparties consisted of cash and/or U.S. Treasury securities.
Participants in trading foreign exchange forward contracts often do not require margin deposits, but rely upon internal credit limitations and their judgments regarding the creditworthiness of their counterparties. In recent years, however, many OTC market participants in foreign exchange trading have begun to require their counterparties to post margin.
A Fund will typically enter into forward contracts only with major global financial institutions. The creditworthiness of each of the firms that is a party to a forward contract is monitored by the Sponsor.
The counterparty/credit risk for cleared derivative transactions is generally lower than for uncleared OTC derivatives since generally a clearing organization becomes substituted for each counterparty to a cleared derivative contract and, in effect, guarantees the parties’ performance under the contract as each party to a trade looks only to the clearing organization for performance of financial obligations. In addition, cleared derivative transactions benefit from daily marking-to-market and settlement, and segregation and minimum capital requirements applicable to intermediaries.
The following tables indicate the location of derivative related items on the Statement of Financial Condition as well as the effect of derivative instruments on the Statement of Operations during the reporting period.
285
Table of Contents
Fair Value of Derivative Instruments
as of December 31, 2015
| Asset Derivatives |
Liability Derivatives |
|||||||||||||||
| Derivatives not |
Statements of Financial Condition Location |
Fund |
Unrealized Appreciation |
Statements of Financial Condition Location |
Fund |
Unrealized Depreciation |
||||||||||
| Managed Futures Contracts |
Receivables on open futures contracts |
ProShares Managed Futures Strategy |
$ | 100,136 | * | Payable on open futures contracts |
ProShares Managed Futures Strategy |
$ | 42,957 | * | ||||||
| VIX Futures Contracts |
Receivables on open futures contracts |
ProShares VIX Mid-Term Futures ETF |
10,005 | * | Payable on open futures contracts |
ProShares VIX Short-Term Futures ETF |
1,078,625 | * | ||||||||
| ProShares Short VIX Short-Term ETF |
10,805,245 | * | ProShares VIX Mid-Term Futures ETF |
354,365 | * | |||||||||||
| ProShares Ultra VIX Short-Term Futures ETF |
11,894,466 | * | ProShares Short VIX Short-Term ETF |
58,830 | * | |||||||||||
| Commodities Contracts |
Receivables on open futures contracts, unrealized appreciation on swap and/or forward agreements |
ProShares UltraShort Bloomberg Commodity |
224,491 | Payable on open futures contracts, unrealized depreciation on swap and/or forward agreements |
ProShares UltraShort Bloomberg Commodity |
53,167 | ||||||||||
| ProShares UltraShort Bloomberg Crude Oil |
8,877,169 | * | ProShares UltraShort Bloomberg Natural Gas |
2,471,164 | * | |||||||||||
| ProShares Ultra Bloomberg Commodity |
32,372 | ProShares Ultra Bloomberg Commodity |
216,288 | |||||||||||||
| ProShares Ultra Bloomberg Natural Gas |
6,312,879 | * | ProShares Ultra Bloomberg Crude Oil |
90,105,903 | * | |||||||||||
| ProShares UltraShort Gold |
1,814,162 | * | ProShares Ultra Gold |
2,255,795 | * | |||||||||||
| ProShares UltraShort Silver |
4,784,249 | * | ProShares Ultra Silver |
22,570,131 | * | |||||||||||
| Foreign Exchange Contracts |
Unrealized appreciation on foreign currency forward contracts and receivables on open futures contracts |
ProShares Short Euro |
243,438 | * | Unrealized depreciation on foreign currency forward contracts and payable on open futures contracts |
ProShares UltraShort Australian Dollar |
420,270 | * | ||||||||
| ProShares UltraShort Yen |
933,727 | ProShares UltraShort Euro |
28,710,336 | |||||||||||||
| ProShares Ultra Euro |
604,920 | ProShares UltraShort Yen |
14,829,179 | |||||||||||||
| ProShares Ultra Yen |
267,014 | ProShares Ultra Yen |
5,703 | |||||||||||||
|
|
|
|
|
|||||||||||||
| Total Trust |
$ | 46,904,273 | * | Total Trust |
$ | 163,172,713 | * | |||||||||
| * | Includes cumulative appreciation/depreciation of futures contracts as reported in the Schedules of Investments. Only current day’s variation margin is reported within the Statements of Financial Condition in receivable/payable on open futures contracts. |
286
Table of Contents
Fair Value of Derivative Instruments
as of December 31, 2014
| Asset Derivatives |
Liability Derivatives |
|||||||||||||||
| Derivatives not |
Statements of Financial Condition Location |
Fund |
Unrealized Appreciation |
Statements of Financial Condition Location |
Fund |
Unrealized Depreciation |
||||||||||
| Managed Futures Contracts |
Receivables on open futures contracts |
ProShares Managed Futures Strategy |
$ | 122,831 | * | Payable on open futures contracts |
ProShares Managed Futures Strategy |
$ | 18,504 | * | ||||||
| VIX Futures Contracts |
Receivables on open futures contracts |
ProShares VIX Short-Term Futures ETF |
6,264,620 | * | Payable on open futures contracts |
ProShares VIX Mid-Term Futures ETF |
222,845 | * | ||||||||
| ProShares VIX Mid-Term Futures ETF |
483,510 | * | ProShares Short VIX Short-Term ETF |
16,352,149 | * | |||||||||||
| ProShares Ultra VIX Short-Term Futures ETF |
39,585,253 | * | ||||||||||||||
| Commodities Contracts |
Receivables on open futures contracts, unrealized appreciation on swap and/or forward agreements |
ProShares UltraShort Bloomberg Commodity |
567,259 | Payable on open futures contracts, unrealized depreciation on swap and/or forward agreements |
ProShares UltraShort Gold |
2,287,298 | * | |||||||||
| ProShares UltraShort Bloomberg Crude Oil |
42,824,680 | * | ProShares UltraShort Silver |
204,570 | ||||||||||||
| ProShares UltraShort Bloomberg Natural Gas |
3,941,465 | * | ProShares Ultra Bloomberg Commodity |
331,338 | ||||||||||||
| ProShares UltraShort Silver |
801,083 | * | ProShares Ultra Bloomberg Crude Oil |
122,655,884 | * | |||||||||||
| ProShares Ultra Gold |
2,055,734 | * | ProShares Ultra Bloomberg Natural Gas |
34,889,283 | * | |||||||||||
| ProShares Ultra Silver |
12,396,680 | * | ||||||||||||||
| Foreign Exchange Contracts |
Unrealized appreciation on foreign currency forward contracts and receivables on open futures contracts |
ProShares Short Euro |
385,331 | * | Unrealized depreciation on foreign currency forward contracts and payable on open futures contracts |
ProShares UltraShort Euro |
2,256,771 | |||||||||
| ProShares UltraShort Australian Dollar |
743,481 | * | ProShares UltraShort Yen |
2,149,924 | ||||||||||||
| ProShares UltraShort Euro |
19,019,765 | ProShares Ultra Euro |
106,292 | |||||||||||||
| ProShares UltraShort Yen |
571,149 | ProShares Ultra Yen |
15,649 | |||||||||||||
| ProShares Ultra Euro |
2,921 | |||||||||||||||
| ProShares Ultra Yen |
404 | |||||||||||||||
|
|
|
|
|
|||||||||||||
| Total Trust** |
$ | 117,369,486 | * | Total Trust |
$ | 193,887,187 | * | |||||||||
| * | Includes cumulative appreciation/depreciation of futures contracts as reported in the Schedules of Investments. Only current day’s variation margin is reported within the Statements of Financial Condition in receivable/payable on open futures contracts. |
| ** | Amount excludes the activity of ProShares Ultra Australian Dollar which liquidated in June 2015. |
287
Table of Contents
The Effect of Derivative Instruments on the Statements of Operations
For the year ended December 31, 2015
| Derivatives not accounted for as |
Location of Gain or (Loss) on Derivatives |
Fund |
Realized Gain or (Loss) on Derivatives Recognized in Income |
Change in Unrealized Appreciation or Depreciation on Derivatives Recognized in Income |
||||||||
| Managed Futures Contracts |
Net realized gain (loss) on futures contracts / changes in unrealized appreciation/ depreciation on futures contracts |
ProShares Managed Futures Strategy |
$ | (278,197 | ) | $ | (47,148 | ) | ||||
| VIX Futures Contracts |
Net realized gain (loss) on futures contracts / changes in unrealized appreciation/ depreciation on futures contracts |
ProShares VIX Short-Term Futures ETF |
(19,408,543 | ) | (7,343,245 | ) | ||||||
| ProShares VIX Mid-Term Futures ETF |
(3,335,936 | ) | (605,025 | ) | ||||||||
| ProShares Short VIX Short-Term Futures ETF |
69,793,028 | 27,098,564 | ||||||||||
| ProShares Ultra VIX Short-Term Futures ETF |
(392,174,228 | ) | (27,690,787 | ) | ||||||||
| Commodity Contracts |
Net realized gain (loss) on futures contracts, swap and/or forward agreements/changes in unrealized appreciation/ depreciation on futures contracts, swap and/or forward agreements |
ProShares UltraShort Bloomberg Commodity |
3,701,239 | (395,935 | ) | |||||||
| ProShares UltraShort Bloomberg Crude Oil |
91,670,324 | (33,947,511 | ) | |||||||||
| ProShares UltraShort Bloomberg Natural Gas |
15,212,804 | (6,412,629 | ) | |||||||||
| ProShares UltraShort Gold |
12,707,635 | 4,101,460 | ||||||||||
| ProShares UltraShort Silver |
10,759,545 | 4,187,736 | ||||||||||
| ProShares Ultra Bloomberg Commodity |
(2,951,820 | ) | 147,422 | |||||||||
| ProShares Ultra Bloomberg Crude Oil |
(896,177,096 | ) | 32,549,981 | |||||||||
| ProShares Ultra Bloomberg Natural Gas |
(100,776,817 | ) | 41,202,162 | |||||||||
| ProShares Ultra Gold |
(18,605,815 | ) | (4,311,529 | ) | ||||||||
| ProShares Ultra Silver |
(78,309,309 | ) | (10,173,451 | ) | ||||||||
| Foreign Exchange Contracts |
Net realized gain (loss) on futures contracts or forward agreements/changes in unrealized appreciation/ depreciation on futures contracts or forward agreements |
ProShares Short Euro |
1,559,425 | (141,893 | ) | |||||||
| ProShares UltraShort Australian Dollar |
4,330,463 | (1,163,751 | ) | |||||||||
| ProShares UltraShort Euro |
131,651,572 | (45,473,330 | ) | |||||||||
| ProShares UltraShort Yen |
8,809,464 | (12,316,677 | ) | |||||||||
| ProShares Ultra Euro |
(1,982,208 | ) | 708,291 | |||||||||
| ProShares Ultra Yen |
(472,913 | ) | 276,556 | |||||||||
|
|
|
|
|
|||||||||
| Total Trust | $ | (1,164,277,383 | ) | $ | (39,750,739 | ) | ||||||
288
Table of Contents
The Effect of Derivative Instruments on the Statements of Operations
For the year ended December 31, 2014
| Derivatives not accounted for as |
Location of Gain or (Loss) on Derivatives |
Fund |
Realized Gain or (Loss) on Derivatives Recognized in Income |
Change in Unrealized Appreciation or Depreciation on Derivatives Recognized in Income |
||||||||
| Managed Futures Contracts |
Net realized gain (loss) on futures contracts / changes in unrealized appreciation/ depreciation on futures contracts |
ProShares Managed Futures Strategy |
$ | 109,006 | $ | 104,327 | ||||||
| VIX Futures Contracts |
Net realized gain (loss) on futures contracts / changes in unrealized appreciation/ depreciation on futures contracts |
ProShares VIX Short-Term Futures ETF |
(694,347 | ) | 22,917,306 | |||||||
| ProShares VIX Mid-Term Futures ETF |
(14,378,810 | ) | 5,157,354 | |||||||||
| ProShares Short VIX Short-Term Futures ETF |
76,925,998 | (24,469,104 | ) | |||||||||
| ProShares Ultra VIX Short-Term Futures ETF |
(139,412,525 | ) | 63,595,164 | |||||||||
| Commodity Contracts |
Net realized gain (loss) on futures contracts, swap and/or forward agreements/changes in unrealized appreciation/ depreciation on futures contracts, swap and/or forward agreements |
ProShares UltraShort Bloomberg Commodity |
906,309 | 594,924 | ||||||||
| ProShares UltraShort Bloomberg Crude Oil |
99,327,097 | 46,390,353 | ||||||||||
| ProShares UltraShort Bloomberg Natural Gas |
8,791,719 | 2,899,165 | ||||||||||
| ProShares UltraShort Gold |
(5,316,482 | ) | (7,934,871 | ) | ||||||||
| ProShares UltraShort Silver |
15,114,883 | 2,810,170 | ||||||||||
| ProShares Ultra Bloomberg Commodity |
(1,065,622 | ) | (346,416 | ) | ||||||||
| ProShares Ultra Bloomberg Crude Oil |
(243,325,957 | ) | (125,240,438 | ) | ||||||||
| ProShares Ultra Bloomberg Natural Gas |
(6,464,796 | ) | (31,232,744 | ) | ||||||||
| ProShares Ultra Gold |
(9,674,333 | ) | 8,883,268 | |||||||||
| ProShares Ultra Silver |
(155,551,420 | ) | (9,889,600 | ) | ||||||||
| Foreign Exchange Contracts |
Net realized gain (loss) on futures contracts or forward agreements/changes in unrealized appreciation/ depreciation on futures contracts or forward agreements |
ProShares Short Euro |
1,593,048 | 418,562 | ||||||||
| ProShares UltraShort Australian Dollar |
2,296,216 | (174,124 | ) | |||||||||
| ProShares UltraShort Euro |
83,678,955 | 30,511,501 | ||||||||||
| ProShares UltraShort Yen |
127,846,225 | (30,965,459 | ) | |||||||||
| ProShares Ultra Euro |
(420,533 | ) | (204,333 | ) | ||||||||
| ProShares Ultra Yen |
(540,398 | ) | 144,064 | |||||||||
|
|
|
|
|
|||||||||
| Total Trust* |
$ | (160,255,767 | ) | $ | (46,030,931 | ) | ||||||
| * | Amount excludes the activity of ProShares Ultra Australian Dollar which liquidated in June 2015. |
289
Table of Contents
The Effect of Derivative Instruments on the Statements of Operations
For the year ended December 31, 2013
| Derivatives not accounted for as |
Location of Gain or (Loss) on Derivatives |
Fund |
Realized Gain or (Loss) on Derivatives Recognized in Income |
Change in Unrealized Appreciation or Depreciation on Derivatives Recognized in Income |
||||||||
| VIX Futures Contracts |
Net realized gain (loss) on futures contracts and/or swap agreements /changes in unrealized appreciation/ depreciation on futures contracts and/or swap agreements |
ProShares VIX Short-Term Futures ETF |
$ | (144,618,136 | ) | $ | (16,431,267 | ) | ||||
| ProShares VIX Mid-Term Futures ETF |
(28,219,863 | ) | (3,426,279 | ) | ||||||||
| ProShares Short VIX Short-Term Futures ETF |
87,175,105 | 9,504,130 | ||||||||||
| ProShares Ultra VIX Short-Term Futures ETF |
(405,816,676 | ) | (26,368,324 | ) | ||||||||
| Commodity Contracts |
Net realized gain (loss) on futures contracts, swap and/or forward agreements/changes in unrealized appreciation/ depreciation on futures contracts, swap and/or forward agreements |
ProShares UltraShort Bloomberg Commodity |
760,002 | (176,167 | ) | |||||||
| ProShares UltraShort Bloomberg Crude Oil |
(12,304,999 | ) | 6,071,108 | |||||||||
| ProShares UltraShort Bloomberg Natural Gas |
(2,585,514 | ) | 633,165 | |||||||||
| ProShares UltraShort Gold |
61,124,409 | 1,902,477 | ||||||||||
| ProShares UltraShort Silver |
113,456,404 | (21,561,362 | ) | |||||||||
| ProShares Ultra Bloomberg Commodity |
(1,254,251 | ) | 321,346 | |||||||||
| ProShares Ultra Bloomberg Crude Oil |
120,745,948 | (52,709,476 | ) | |||||||||
| ProShares Ultra Bloomberg Natural Gas |
41,418,165 | 160,411 | ||||||||||
| ProShares Ultra Gold |
(165,632,786 | ) | 8,839,764 | |||||||||
| ProShares Ultra Silver |
(701,532,729 | ) | 143,273,646 | |||||||||
| Foreign Exchange Contracts |
Net realized gain (loss) on futures contracts, swap and/or forward agreements/changes in unrealized appreciation/ depreciation on futures contracts, swap and/or forward agreements |
ProShares Short Euro |
(381,987 | ) | 21,825 | |||||||
| ProShares UltraShort Australian Dollar |
2,720,079 | 832,015 | ||||||||||
| ProShares UltraShort Euro |
(48,063,036 | ) | (600,935 | ) | ||||||||
| ProShares UltraShort Yen |
164,019,598 | (8,727,491 | ) | |||||||||
| ProShares Ultra Euro |
210,150 | 13,803 | ||||||||||
| ProShares Ultra Yen |
(1,879,169 | ) | 334,987 | |||||||||
|
|
|
|
|
|||||||||
| Total Trust* |
$ | (920,659,286 | ) | $ | 41,907,376 | |||||||
| * | Amount excludes the activity of ProShares Ultra Australian Dollar which liquidated in June 2015. |
290
Table of Contents
Offsetting Assets and Liabilities
Each Fund is subject to master netting agreements or similar arrangements that allow for amounts owed between each Fund and the counterparty to be netted upon an early termination. The party that has the larger payable pays the excess of the larger amount over the smaller amount to the other party. The master netting agreements or similar arrangements do not apply to amounts owed to/from different counterparties. As described above, the Funds utilize derivative instruments to achieve their investment objective during the year. The amounts shown in the Statements of Financial Condition do not take into consideration the effects of legally enforceable master netting agreements or similar arrangements.
For financial reporting purposes, the Funds do not offset derivative assets and derivative liabilities that are subject to netting arrangements in the Statements of Financial Condition. The following table presents each Fund’s derivatives by investment type and by counterparty net of amounts available for offset under a master netting agreement and the related collateral received or pledged by the Funds as of December 31, 2015 and 2014:
| Fair Values of Derivative Instruments as of December 31, 2015 |
||||||||||||||||||||||||
| Assets | Liabilities | |||||||||||||||||||||||
| Gross Amounts of Recognized Assets presented in the Statements of Financial Condition |
Gross Amounts Offset in the Statements of Financial Condition |
Net Amounts of Assets presented in the Statements of Financial Condition |
Gross Amounts of Recognized Liabilities presented in the Statements of Financial Condition |
Gross Amounts Offset in the Statements of Financial Condition |
Net Amounts of Liabilities presented in the Statements of Financial Condition |
|||||||||||||||||||
| ProShares UltraShort Bloomberg Commodity Swap agreements |
$ | 224,491 | $ | — | $ | 224,491 | $ | 53,167 | $ | — | $ | 53,167 | ||||||||||||
| ProShares UltraShort Bloomberg Crude Oil Swap agreements |
6,412,656 | — | 6,412,656 | — | — | — | ||||||||||||||||||
| ProShares UltraShort Gold Forward agreements |
1,808,942 | — | 1,808,942 | — | — | — | ||||||||||||||||||
| ProShares UltraShort Silver Forward agreements |
4,778,279 | — | 4,778,279 | — | — | — | ||||||||||||||||||
| ProShares UltraShort Euro Foreign currency forward contracts |
— | — | — | 28,710,336 | — | 28,710,336 | ||||||||||||||||||
| ProShares UltraShort Yen Foreign currency forward contracts |
933,727 | — | 933,727 | 14,829,179 | — | 14,829,179 | ||||||||||||||||||
| ProShares Ultra Bloomberg Commodity Swap agreements |
32,372 | — | 32,372 | 216,288 | — | 216,288 | ||||||||||||||||||
| ProShares Ultra Bloomberg Crude Oil Swap agreements |
— | — | — | 72,176,589 | — | 72,176,589 | ||||||||||||||||||
| ProShares Ultra Gold Forward agreements |
— | — | — | 2,250,595 | — | 2,250,595 | ||||||||||||||||||
| ProShares Ultra Silver Forward agreements |
— | — | — | 22,561,101 | — | 22,561,101 | ||||||||||||||||||
| ProShares Ultra Euro Foreign currency forward contracts |
604,920 | — | 604,920 | — | — | — | ||||||||||||||||||
| ProShares Ultra Yen Foreign currency forward contracts |
267,014 | — | 267,014 | 5,703 | — | 5,703 | ||||||||||||||||||
Asset (Liability) amounts shown in the table below represent amounts owed to (by) the Funds for the derivative-related investments at December 31, 2015. These amounts may be collateralized by cash or financial instruments, segregated for the benefit of the Funds or the counterparties, depending on whether the related contracts are in an
291
Table of Contents
appreciated or depreciated position at period end. Amounts shown in the column labeled “Net Amount” represent the uncollateralized portions of these amounts at period end. These amounts may be un-collateralized due to timing differences related to market movements or due to minimum thresholds for collateral movement, as further described above under the caption “Accounting for Derivative Instruments”.
| Gross Amounts Not Offset in the Statement of Financial Condition as of December 31, 2015 |
||||||||||||||||
| Amounts of Recognized Assets / (Liabilities) presented in the Statements of Financial Condition |
Financial Instruments for the Benefit of (the Funds) / the Counterparties |
Cash Collateral for the Benefit of (the Funds) / the Counterparties |
Net Amount | |||||||||||||
| ProShares UltraShort Bloomberg Commodity |
||||||||||||||||
| Citibank N.A. |
$ | (53,167 | ) | $ | 53,167 | $ | — | $ | — | |||||||
| Deutsche Bank AG |
84,161 | — | (50,000 | ) | 34,161 | |||||||||||
| Goldman Sachs International |
36,878 | (28,466 | ) | — | 8,412 | |||||||||||
| UBS AG |
103,452 | (103,452 | ) | — | — | |||||||||||
| ProShares UltraShort Bloomberg Crude Oil |
||||||||||||||||
| Citibank N.A. |
1,098,278 | — | — | 1,098,278 | ||||||||||||
| Deutsche Bank AG |
1,722,894 | — | (1,722,894 | ) | — | |||||||||||
| Goldman Sachs International |
1,595,552 | (1,595,552 | ) | — | — | |||||||||||
| Societe Generale S.A. |
521,142 | (521,142 | ) | — | — | |||||||||||
| UBS AG |
1,474,790 | (1,474,790 | ) | — | — | |||||||||||
| ProShares UltraShort Gold |
||||||||||||||||
| Citibank N.A. |
3,915 | — | — | 3,915 | ||||||||||||
| Deutsche Bank AG |
1,046,664 | — | (1,046,664 | ) | — | |||||||||||
| Goldman Sachs International |
158,827 | — | — | 158,827 | ||||||||||||
| Societe Generale S.A. |
212,680 | (212,680 | ) | — | — | |||||||||||
| UBS AG |
386,856 | (386,856 | ) | — | — | |||||||||||
| ProShares UltraShort Silver |
||||||||||||||||
| Deutsche Bank AG |
2,500,263 | — | (2,500,000 | ) | 263 | |||||||||||
| Goldman Sachs International |
1,044,986 | (858,460 | ) | — | 186,526 | |||||||||||
| Societe Generale S.A. |
438,975 | (438,975 | ) | — | — | |||||||||||
| UBS AG |
794,055 | (582,692 | ) | — | 211,363 | |||||||||||
| ProShares UltraShort Euro |
||||||||||||||||
| Goldman Sachs International |
(14,992,024 | ) | 14,992,024 | — | — | |||||||||||
| UBS AG |
(13,718,312 | ) | 13,718,312 | — | — | |||||||||||
| ProShares UltraShort Yen |
||||||||||||||||
| Goldman Sachs International |
(6,470,405 | ) | 6,470,405 | — | — | |||||||||||
| UBS AG |
(7,425,047 | ) | 7,425,047 | — | — | |||||||||||
| ProShares Ultra Bloomberg Commodity |
||||||||||||||||
| Citibank N.A. |
32,372 | — | — | 32,372 | ||||||||||||
| Deutsche Bank AG |
(82,976 | ) | 82,976 | — | — | |||||||||||
| Goldman Sachs International |
(60,830 | ) | 60,830 | — | — | |||||||||||
| UBS AG |
(72,482 | ) | 72,482 | — | — | |||||||||||
| ProShares Ultra Bloomberg Crude Oil |
||||||||||||||||
| Citibank N.A. |
(2,509,989 | ) | 2,509,989 | — | — | |||||||||||
| Deutsche Bank AG |
(20,221,872 | ) | 20,221,872 | — | — | |||||||||||
| Goldman Sachs International |
(20,806,119 | ) | 20,806,119 | — | — | |||||||||||
| Societe Generale S.A. |
(6,357,459 | ) | 6,357,459 | — | — | |||||||||||
| UBS AG |
(22,281,150 | ) | 22,281,150 | — | — | |||||||||||
| ProShares Ultra Gold |
||||||||||||||||
| Citibank N.A. |
(4,614 | ) | — | — | (4,614 | ) | ||||||||||
| Deutsche Bank AG |
(1,049,383 | ) | 1,049,383 | — | — | |||||||||||
| Goldman Sachs International |
(520,730 | ) | 520,730 | — | — | |||||||||||
| Societe Generale S.A. |
(244,992 | ) | 244,992 | — | — | |||||||||||
| UBS AG |
(430,876 | ) | 430,876 | — | — | |||||||||||
| ProShares Ultra Silver |
||||||||||||||||
| Deutsche Bank AG |
(9,355,945 | ) | 9,355,945 | — | — | |||||||||||
| Goldman Sachs International |
(5,106,853 | ) | 5,106,853 | — | — | |||||||||||
| Societe Generale S.A. |
(2,704,459 | ) | 2,704,459 | — | — | |||||||||||
| UBS AG |
(5,393,844 | ) | 5,393,844 | — | — | |||||||||||
| ProShares Ultra Euro |
||||||||||||||||
| Goldman Sachs International |
315,354 | (315,354 | ) | — | — | |||||||||||
| UBS AG |
289,566 | (289,566 | ) | — | — | |||||||||||
| ProShares Ultra Yen |
||||||||||||||||
| Goldman Sachs International |
169,787 | — | — | 169,787 | ||||||||||||
| UBS AG |
91,524 | — | — | 91,524 | ||||||||||||
292
Table of Contents
| Fair Values of Derivative Instruments as of December 31, 2014 |
||||||||||||||||||||||||
| Assets | Liabilities | |||||||||||||||||||||||
| Gross Amounts of Recognized Assets presented in the Statements of Financial Condition |
Gross Amounts Offset in the Statements of Financial Condition |
Net Amounts of Assets presented in the Statements of Financial Condition |
Gross Amounts of Recognized Liabilities presented in the Statements of Financial Condition |
Gross Amounts Offset in the Statements of Financial Condition |
Net Amounts of Liabilities presented in the Statements of Financial Condition |
|||||||||||||||||||
| ProShares UltraShort Bloomberg Commodity |
||||||||||||||||||||||||
| Swap agreements |
$ | 567,259 | $ | — | $ | 567,259 | $ | — | $ | — | $ | — | ||||||||||||
| ProShares UltraShort Bloomberg Crude Oil |
||||||||||||||||||||||||
| Swap agreements |
27,018,077 | — | 27,018,077 | — | — | — | ||||||||||||||||||
| ProShares UltraShort Gold |
||||||||||||||||||||||||
| Forward agreements |
— | — | — | 2,282,778 | — | 2,282,778 | ||||||||||||||||||
| ProShares UltraShort Silver |
||||||||||||||||||||||||
| Forward agreements |
799,523 | — | 799,523 | 204,570 | — | 204,570 | ||||||||||||||||||
| ProShares UltraShort Euro |
||||||||||||||||||||||||
| Foreign currency forward contracts |
19,019,765 | — | 19,019,765 | 2,256,771 | — | 2,256,771 | ||||||||||||||||||
| ProShares UltraShort Yen |
||||||||||||||||||||||||
| Foreign currency forward contracts |
571,149 | — | 571,149 | 2,149,924 | — | 2,149,924 | ||||||||||||||||||
| ProShares Ultra Bloomberg Commodity |
||||||||||||||||||||||||
| Swap agreements |
— | — | — | 331,338 | — | 331,338 | ||||||||||||||||||
| ProShares Ultra Bloomberg Crude Oil |
||||||||||||||||||||||||
| Swap agreements |
— | — | — | 76,181,097 | — | 76,181,097 | ||||||||||||||||||
| ProShares Ultra Gold |
||||||||||||||||||||||||
| Forward agreements |
2,051,154 | — | 2,051,154 | — | — | — | ||||||||||||||||||
| ProShares Ultra Silver |
||||||||||||||||||||||||
| Forward agreements |
— | — | — | 12,395,120 | — | 12,395,120 | ||||||||||||||||||
| ProShares Ultra Euro |
||||||||||||||||||||||||
| Foreign currency forward contracts |
2,921 | — | 2,921 | 106,292 | — | 106,292 | ||||||||||||||||||
| ProShares Ultra Yen |
||||||||||||||||||||||||
| Foreign currency forward contracts |
404 | — | 404 | 15,649 | — | 15,649 | ||||||||||||||||||
Asset (Liability) amounts shown in the table below represent amounts owed to (by) the Funds for the derivative-related investments at December 31, 2014. These amounts may be collateralized by cash or financial instruments, segregated for the benefit of the Funds or the counterparties, depending on whether the related contracts are in an appreciated or depreciated position at period end. Amounts shown in the column labeled “Net Amount” represent the uncollateralized portions of these amounts at period end. These amounts may be un-collateralized due to timing differences related to market movements or due to minimum thresholds for collateral movement, as further described above under the caption “Accounting for Derivative Instruments”.
293
Table of Contents
| Gross Amounts Not Offset in the Statements of Financial Condition as of December 31, 2014 |
||||||||||||||||
| Amounts of Recognized Assets / (Liabilities) presented in the Statements of Financial Condition |
Financial Instruments for the Benefit of (the Funds) / the Counterparties |
Cash Collateral for the Benefit of (the Funds) / the Counterparties |
Net Amount | |||||||||||||
| ProShares UltraShort Bloomberg Commodity |
||||||||||||||||
| Deutsche Bank AG |
$ | 243,474 | $ | — | $ | — | $ | 243,474 | ||||||||
| Goldman Sachs International |
240,271 | — | — | 240,271 | ||||||||||||
| UBS AG |
83,514 | — | — | 83,514 | ||||||||||||
| ProShares UltraShort Bloomberg Crude Oil |
||||||||||||||||
| Deutsche Bank AG |
7,669,493 | — | (6,800,000 | ) | 869,493 | |||||||||||
| Goldman Sachs International |
8,362,336 | (7,598,657 | ) | — | 763,679 | |||||||||||
| Societe Generale S.A. |
2,132,657 | (2,132,657 | ) | — | — | |||||||||||
| UBS AG |
8,853,591 | (8,281,350 | ) | — | 572,241 | |||||||||||
| ProShares UltraShort Gold |
||||||||||||||||
| Deutsche Bank AG |
(1,422,997 | ) | 1,422,997 | — | — | |||||||||||
| Goldman Sachs International |
(354,660 | ) | 354,660 | — | — | |||||||||||
| Societe Generale S.A. |
(182,225 | ) | 182,225 | — | — | |||||||||||
| UBS AG |
(322,896 | ) | 322,896 | — | — | |||||||||||
| ProShares UltraShort Silver |
||||||||||||||||
| Deutsche Bank AG |
462,619 | — | (462,619 | ) | — | |||||||||||
| Goldman Sachs International |
138,563 | (138,563 | ) | — | — | |||||||||||
| Societe Generale S.A. |
198,341 | (198,341 | ) | — | — | |||||||||||
| UBS AG |
(204,570 | ) | 204,570 | — | — | |||||||||||
| ProShares UltraShort Euro |
||||||||||||||||
| Goldman Sachs International |
8,193,303 | (6,008,925 | ) | — | 2,184,378 | |||||||||||
| UBS AG |
8,569,691 | (6,592,366 | ) | (11,518 | ) | 1,965,807 | ||||||||||
| ProShares UltraShort Yen |
||||||||||||||||
| Goldman Sachs International |
(1,466,239 | ) | 1,466,239 | — | — | |||||||||||
| UBS AG |
(112,536 | ) | 112,536 | — | — | |||||||||||
| ProShares Ultra Bloomberg Commodity |
||||||||||||||||
| Deutsche Bank AG |
(143,751 | ) | 143,751 | — | — | |||||||||||
| Goldman Sachs International |
(138,532 | ) | 138,532 | — | — | |||||||||||
| UBS AG |
(49,055 | ) | 49,055 | — | — | |||||||||||
| ProShares Ultra Bloomberg Crude Oil |
||||||||||||||||
| Deutsche Bank AG |
(24,223,667 | ) | 24,223,667 | — | — | |||||||||||
| Goldman Sachs International |
(24,285,701 | ) | 24,285,701 | — | — | |||||||||||
| Societe Generale S.A. |
(5,528,160 | ) | 5,528,160 | — | — | |||||||||||
| UBS AG |
(22,143,569 | ) | 22,143,569 | — | — | |||||||||||
| ProShares Ultra Gold |
||||||||||||||||
| Deutsche Bank AG |
1,231,694 | — | (1,231,694 | ) | — | |||||||||||
| Goldman Sachs International |
222,126 | — | — | 222,126 | ||||||||||||
| Societe Generale S.A. |
190,591 | (190,591 | ) | — | — | |||||||||||
| UBS AG |
406,743 | (406,743 | ) | — | — | |||||||||||
| ProShares Ultra Silver |
||||||||||||||||
| Deutsche Bank AG |
(6,220,069 | ) | 6,220,069 | — | — | |||||||||||
| Goldman Sachs International |
(2,124,796 | ) | 2,124,796 | — | — | |||||||||||
| Societe Generale S.A. |
(1,384,207 | ) | 1,384,207 | — | — | |||||||||||
| UBS AG |
(2,666,048 | ) | 2,666,048 | — | — | |||||||||||
| ProShares Ultra Euro |
||||||||||||||||
| Goldman Sachs International |
(38,856 | ) | 38,856 | — | — | |||||||||||
| UBS AG |
(64,515 | ) | 64,515 | — | — | |||||||||||
| ProShares Ultra Yen |
||||||||||||||||
| Goldman Sachs International |
(12,255 | ) | 12,255 | — | — | |||||||||||
| UBS AG |
(2,990 | ) | 2,990 | — | — | |||||||||||
294
Table of Contents
NOTE 4 – AGREEMENTS
Management Fee
Each Leveraged Fund, the Short Euro Fund and each Geared VIX Fund pays the Sponsor a Management Fee, monthly in arrears, in an amount equal to 0.95% per annum of its average daily NAV of such Fund. Each Matching VIX Fund pays the Sponsor a Management Fee, monthly in arrears, in an amount equal to 0.85% per annum of its average daily NAV of such Fund. The Managed Futures Fund will pay the Sponsor a Management Fee, monthly in arrears, in an amount equal to 0.75% per annum of its average daily net assets. The Sponsor did not and will not charge the Management Fee in the first year of operation of each Fund in an amount equal to the offering costs. The Sponsor reimbursed each Fund, to the extent that its offering costs exceed the Management Fee, for the first year of operations.
The Management Fee is paid in consideration of the Sponsor’s services as commodity pool operator, and for managing the business and affairs of the Funds. From the Management Fee, the Sponsor pays all of the routine operational, administrative and other ordinary expenses of each Fund, generally as determined by the Sponsor, including but not limited to the Administrator, Custodian, Distributor, ProFunds Distributors, Inc. (“PDI”), an affiliated broker-dealer of the Sponsor, Transfer Agent, accounting and auditing fees and expenses, any index licensors for the Funds, and the normal and expected expenses incurred in connection with the continuous offering of Shares of each Fund after the commencement of its trading operations, including, but not limited to, expenses such as tax preparation expenses, legal fees not in excess of $100,000 per annum, ongoing SEC registration fees not exceeding 0.021% per annum of the NAV of a Fund and Financial Industry Regulatory Authority (“FINRA”) filing fees, individual Schedule K-1 preparation and mailing fees not exceeding 0.10% per annum of the net assets of a Fund, and report preparation and mailing expenses.
Non-Recurring Fees and Expenses
Each Fund pays all its non-recurring and unusual fees and expenses, if any, as determined by the Sponsor. Non-recurring and unusual fees and expenses are fees and expenses which are unexpected or unusual in nature, such as legal claims and liabilities, litigation costs or indemnification or other material expenses which are not currently anticipated obligations of the Funds. Such fees and expenses are those that are non-recurring, unexpected or unusual in nature.
The Administrator
The Sponsor and the Trust, for itself and on behalf of each Fund, has appointed Brown Brothers Harriman & Co. (“BBH&Co.”) as the Administrator of the Funds, and the Sponsor, and the Trust, on its own behalf and on behalf of each Fund, and BBH&Co. have entered into an Administrative Agency Agreement (the “Administration Agreement”) in connection therewith. Pursuant to the terms of the Administration Agreement and under the supervision and direction of the Sponsor and the Trust, BBH&Co. prepares and files certain regulatory filings on behalf of the Funds. BBH&Co. may also perform other services for the Funds pursuant to the Administration Agreement as mutually agreed upon by the Sponsor, the Trust and BBH&Co. from time to time. Pursuant to the terms of the Administration Agreement, BBH&Co. also serves as the Transfer Agent of the Funds. The Administrator’s fees are paid on behalf of the Funds by the Sponsor.
The Custodian
BBH&Co. serves as the Custodian of the Funds, and the Trust, on its own behalf and on behalf of each Fund, and BBH&Co. have entered into a Custodian Agreement in connection therewith. Pursuant to the terms of the Custodian Agreement, BBH&Co. is responsible for the holding and safekeeping of assets delivered to it by the Funds, and performing various administrative duties in accordance with instructions delivered to BBH&Co. by the Funds. The Custodian’s fees are paid on behalf of the Funds by the Sponsor.
The Distributor
SEI Investments Distribution Co. (“SEI”), serves as Distributor of the Funds and assists the Sponsor and the Administrator with certain functions and duties relating to distribution and marketing, including taking creation and redemption orders, consulting with the marketing staff of the Sponsor and its affiliates with respect to compliance with the requirements of FINRA and/or the NFA in connection with marketing efforts, and reviewing and filing of marketing materials with FINRA and/or the NFA. SEI retains all marketing materials separately for each Fund, at c/o SEI, One Freedom Valley Drive, Oaks, PA 19456. The Sponsor, on behalf of each Fund, has entered into a Distribution Services Agreement with SEI. The Sponsor pays SEI for performing its duties on behalf of the Funds.
295
Table of Contents
NOTE 5 – OFFERING COSTS
Offering costs will be amortized by the Funds over a twelve month period on a straight-line basis beginning once the fund commences operations. The Sponsor did not and will not charge its Management Fee in the first year of operations of the Managed Futures Fund in an amount equal to the offering costs. The Sponsor will reimburse the Managed Futures Fund to the extent its offering costs exceed 0.75% of its average daily NAV for the first year of operations. Normal and expected expenses incurred in connection with the continuous offering of Shares of the Managed Futures Fund after the commencement of its trading operations will be paid by the Sponsor.
NOTE 6 – CREATION AND REDEMPTION OF CREATION UNITS
Each Fund issues and redeems shares from time to time, but only in one or more Creation Units. A Creation Unit is a block of 50,000 Shares of a Geared Fund and the Managed Futures Fund and 25,000 Shares of a Matching VIX Fund. Creation Units may be created or redeemed only by Authorized Participants. As a result of the Share splits and reverse Share splits as described in Note 1, certain redemptions as disclosed in the Statements of Changes in Shareholders’ Equity reflect payment of fractional share balances on beneficial shareholder accounts.
Except when aggregated in Creation Units, the Shares are not redeemable securities. Retail investors, therefore, generally will not be able to purchase or redeem Shares directly from or with a Fund. Rather, most retail investors will purchase or sell Shares in the secondary market with the assistance of a broker. Thus, some of the information contained in these Notes to Financial Statements—such as references to the Transaction Fees imposed on purchases and redemptions—is not relevant to retail investors.
Transaction Fees on Creation and Redemption Transactions
The manner by which Creation Units are purchased or redeemed is dictated by the terms of the Authorized Participant Agreement and Authorized Participant Handbook. By placing a purchase order, an Authorized Participant agrees to: (1) deposit cash with the Custodian; and (2) if permitted by the Sponsor in its sole discretion, enter into or arrange for an exchange of futures contract for related position or block trade whereby the Authorized Participant would also transfer to such Fund a number and type of exchange-traded futures contracts at or near the closing settlement price for such contracts on the purchase order date.
Authorized Participants may pay a fixed transaction fee of up to $500 in connection with each order to create or redeem a Creation Unit in order to compensate BBH&Co., as the Administrator, the Custodian and the Transfer Agent of each Fund and its Shares, for services in processing the creation and redemption of Creation Units and to offset the costs of increasing or decreasing derivative positions. Authorized Participants also may pay a variable transaction fee to the Fund of up to 0.10% (and a variable transaction fee to the Matching VIX Funds of 0.05%) of the value of the Creation Unit that is purchased or redeemed unless the transaction fee is waived or otherwise adjusted by the Sponsor. The Sponsor provides such Authorized Participant with prompt notice in advance of any such waiver or adjustment of the transaction fee. Authorized Participants may sell the Shares included in the Creation Units they purchase from the Funds to other investors in the secondary market.
296
Table of Contents
Transaction fees for the years ended December 31, 2015, 2014 and 2013, which are included in the Addition and/or Redemption of Shares on the Statements of Changes in Shareholders’ Equity, were as follows:
| Fund |
Year Ended December 31, 2015 |
Year Ended December 31, 2014 |
Year Ended December 31, 2013 |
|||||||||
| Managed Futures Strategy* |
$ | — | $ | — | $ | N/A | ||||||
| VIX Short-Term Futures ETF |
105,024 | 72,020 | — | |||||||||
| VIX Mid-Term Futures ETF |
8,521 | 8,927 | — | |||||||||
| Short VIX Short-Term Futures ETF |
342,734 | 218,121 | 130,779 | |||||||||
| Ultra VIX Short-Term Futures ETF |
1,391,292 | 734,298 | 814,195 | |||||||||
| UltraShort Bloomberg Commodity |
— | — | — | |||||||||
| UltraShort Bloomberg Crude Oil |
382,054 | 257,458 | 298,261 | |||||||||
| UltraShort Bloomberg Natural Gas |
8,853 | 26,053 | 7,434 | |||||||||
| UltraShort Gold |
11,024 | 32,473 | 105,508 | |||||||||
| UltraShort Silver |
39,354 | 48,832 | 128,850 | |||||||||
| Short Euro |
— | — | — | |||||||||
| UltraShort Australian Dollar |
— | — | — | |||||||||
| UltraShort Euro |
— | — | — | |||||||||
| UltraShort Yen |
— | — | — | |||||||||
| Ultra Bloomberg Commodity |
2,194 | 249 | 487 | |||||||||
| Ultra Bloomberg Crude Oil |
847,422 | 299,493 | 236,956 | |||||||||
| Ultra Bloomberg Natural Gas |
13,939 | 30,073 | 42,172 | |||||||||
| Ultra Gold |
4,218 | 12,088 | 23,035 | |||||||||
| Ultra Silver |
38,848 | 65,208 | 107,285 | |||||||||
| Ultra Euro |
— | — | — | |||||||||
| Ultra Yen |
— | — | — | |||||||||
|
|
|
|
|
|
|
|||||||
| Total Trust |
$ | 3,195,477 | $ | 1,805,293 | $ | 1,894,962 | ||||||
| * | Fund commenced investment operations on October 1, 2014. |
297
Table of Contents
NOTE 7 – FINANCIAL HIGHLIGHTS
Selected data for a Share outstanding throughout the year ended December 31, 2015:
For the Year Ended December 31, 2015
| Per Share Operating Performance |
Managed Futures Strategy |
VIX Short- Term Futures ETF |
VIX Mid- Term Futures ETF |
Short VIX Short-Term Futures ETF |
Ultra VIX Short-Term Futures ETF* |
UltraShort Bloomberg Commodity |
UltraShort Bloomberg Crude Oil |
|||||||||||||||||||||
| Net asset value, at December 31, 2014 |
$ | 21.1354 | $ | 20.9321 | $ | 63.6020 | $ | 61.4004 | $ | 125.4591 | $ | 87.7495 | $ | 77.9790 | ||||||||||||||
| Net investment income (loss) |
(0.1750 | ) | (0.1324 | ) | (0.5053 | ) | (0.8162 | ) | (0.7224 | ) | (0.9438 | ) | (0.7848 | ) | ||||||||||||||
| Net realized and unrealized gain (loss)# |
(0.4266 | ) | (7.5575 | ) | (9.1341 | ) | (9.7692 | ) | (96.6526 | ) | 55.1020 | 56.0077 | ||||||||||||||||
| Change in net asset value from operations |
(0.6016 | ) | (7.6899 | ) | (9.6394 | ) | (10.5854 | ) | (97.3750 | ) | 54.1582 | 55.2229 | ||||||||||||||||
| Net asset value, at December 31, 2015 |
$ | 20.5338 | $ | 13.2422 | $ | 53.9626 | $ | 50.8150 | $ | 28.0841 | $ | 141.9077 | $ | 133.2019 | ||||||||||||||
| Market value per share, at December 31, 2014† |
$ | 21.28 | $ | 20.99 | $ | 63.89 | $ | 61.16 | $ | 125.75 | $ | 87.44 | $ | 76.52 | ||||||||||||||
| Market value per share, at December 31, 2015† |
$ | 20.76 | $ | 13.33 | $ | 53.99 | $ | 50.45 | $ | 28.35 | $ | 140.41 | $ | 133.64 | ||||||||||||||
| Total Return, at net asset value |
(2.8 | )% | (36.7 | )% | (15.2 | )% | (17.2 | )% | (77.6 | )% | 61.7 | % | 70.8 | % | ||||||||||||||
| Total Return, at market value |
(2.4 | )% | (36.5 | )% | (15.5 | )% | (17.5 | )% | (77.5 | )% | 60.6 | % | 74.6 | % | ||||||||||||||
| Ratios to Average Net Assets |
||||||||||||||||||||||||||||
| Expense ratio |
(0.84 | )% | (0.95 | )% | (0.91 | )% | (1.40 | )% | (1.65 | )% | (0.95 | )% | (1.07 | )% | ||||||||||||||
| Expense ratio, excluding brokerage commissions |
(0.75 | )% | (0.85 | )% | (0.85 | )% | (0.95 | )% | (0.95 | )% | (0.95 | )% | (0.95 | )% | ||||||||||||||
| Net investment income (loss) |
(0.84 | )% | (0.92 | )% | (0.88 | )% | (1.36 | )% | (1.61 | )% | (0.91 | )% | (1.04 | )% | ||||||||||||||
| * | See Note 1 of these Notes to Financial Statements. |
| # | The amount shown for a share outstanding throughout the period may not accord with the change in aggregate gains and losses during the period because of timing of creation and redemption units in relation to fluctuating net asset value during the period. |
| † | Market values are determined at the close of the New York Stock Exchange, which may be later than when the Funds’ net asset value is calculated. |
298
Table of Contents
For the Year Ended December 31, 2015
| Per Share Operating Performance |
UltraShort Bloomberg Natural Gas |
UltraShort Gold |
UltraShort Silver* |
Short Euro |
UltraShort Australian Dollar |
UltraShort Euro |
UltraShort Yen |
|||||||||||||||||||||
| Net asset value, at December 31, 2014 |
$ | 83.9577 | $ | 96.6516 | $ | 57.8071 | $ | 40.0617 | $ | 51.3790 | $ | 21.5946 | $ | 89.3336 | ||||||||||||||
| Net investment income (loss) |
(1.3314 | ) | (0.9149 | ) | (0.4968 | ) | (0.4096 | ) | (0.5741 | ) | (0.2256 | ) | (0.8243 | ) | ||||||||||||||
| Net realized and unrealized gain (loss)# |
56.9678 | 20.1432 | 7.2680 | 4.1246 | 7.6533 | 4.1716 | (0.5704 | ) | ||||||||||||||||||||
| Change in net asset value from operations |
55.6364 | 19.2283 | 6.7712 | 3.7150 | 7.0792 | 3.9460 | (1.3947 | ) | ||||||||||||||||||||
| Net asset value, at December 31, 2015 |
$ | 139.5941 | $ | 115.8799 | $ | 64.5783 | $ | 43.7767 | $ | 58.4582 | $ | 25.5406 | $ | 87.9389 | ||||||||||||||
| Market value per share, at December 31, 2014† |
$ | 82.03 | $ | 100.22 | $ | 59.70 | $ | 40.03 | $ | 51.37 | $ | 21.61 | $ | 89.30 | ||||||||||||||
| Market value per share, at December 31, 2015† |
$ | 139.66 | $ | 115.83 | $ | 64.55 | $ | 43.74 | $ | 58.15 | $ | 25.53 | $ | 87.89 | ||||||||||||||
| Total Return, at net asset value |
66.3 | % | 19.9 | % | 11.7 | % | 9.3 | % | 13.8 | % | 18.3 | % | (1.6 | )% | ||||||||||||||
| Total Return, at market value |
70.3 | % | 15.6 | % | 8.1 | % | 9.3 | % | 13.2 | % | 18.1 | % | (1.6 | )% | ||||||||||||||
| Ratios to Average Net Assets |
||||||||||||||||||||||||||||
| Expense ratio |
(1.55 | )% | (0.95 | )% | (0.95 | )% | (0.97 | )% | (1.03 | )% | (0.95 | )% | (0.95 | )% | ||||||||||||||
| Expense ratio, excluding brokerage commissions |
(0.95 | )% | (0.95 | )% | (0.95 | )% | (0.95 | )% | (0.95 | )% | (0.95 | )% | (0.95 | )% | ||||||||||||||
| Net investment income (loss) |
(1.50 | )% | (0.91 | )% | (0.91 | )% | (0.95 | )% | (1.00 | )% | (0.90 | )% | (0.92 | )% | ||||||||||||||
| * | See Note 1 of these Notes to Financial Statements. |
| # | The amount shown for a share outstanding throughout the period may not accord with the change in aggregate gains and losses during the period because of timing of creation and redemption units in relation to fluctuating net asset value during the period. |
| † | Market values are determined at the close of the New York Stock Exchange, which may be later than when the Funds’ net asset value is calculated. |
299
Table of Contents
For the Year Ended December 31, 2015
| Per Share Operating Performance |
Ultra Bloomberg Commodity* |
Ultra Bloomberg Crude Oil* |
Ultra Bloomberg Natural Gas* |
Ultra Gold | Ultra Silver | Ultra Euro |
Ultra Yen* |
|||||||||||||||||||||
| Net asset value, at December 31, 2014 |
$ | 52.1342 | $ | 50.7400 | $ | 61.6491 | $ | 40.0011 | $ | 39.3657 | $ | 19.8744 | $ | 56.4747 | ||||||||||||||
| Net investment income (loss) |
(0.3491 | ) | (0.2811 | ) | (0.4982 | ) | (0.3292 | ) | (0.3258 | ) | (0.1505 | ) | (0.4787 | ) | ||||||||||||||
| Net realized and unrealized gain (loss)# |
(23.3572 | ) | (37.8815 | ) | (42.5811 | ) | (9.9424 | ) | (11.9761 | ) | (4.2132 | ) | (1.2433 | ) | ||||||||||||||
| Change in net asset value from operations |
(23.7063 | ) | (38.1626 | ) | (43.0793 | ) | (10.2716 | ) | (12.3019 | ) | (4.3637 | ) | (1.7220 | ) | ||||||||||||||
| Net asset value, at December 31, 2015 |
$ | 28.4279 | $ | 12.5774 | $ | 18.5698 | $ | 29.7295 | $ | 27.0638 | $ | 15.5107 | $ | 54.7527 | ||||||||||||||
| Market value per share, at December 31, 2014† |
$ | 51.44 | $ | 51.85 | $ | 63.12 | $ | 38.41 | $ | 38.05 | $ | 19.80 | $ | 56.48 | ||||||||||||||
| Market value per share, at December 31, 2015† |
$ | 28.07 | $ | 12.54 | $ | 18.48 | $ | 29.73 | $ | 27.08 | $ | 15.51 | $ | 54.70 | ||||||||||||||
| Total Return, at net asset value |
(45.5 | )% | (75.2 | )% | (69.9 | )% | (25.7 | )% | (31.3 | )% | (22.0 | )% | (3.0 | )% | ||||||||||||||
| Total Return, at market value |
(45.4 | )% | (75.8 | )% | (70.7 | )% | (22.6 | )% | (28.8 | )% | (21.7 | )% | (3.2 | )% | ||||||||||||||
| Ratios to Average Net Assets |
||||||||||||||||||||||||||||
| Expense ratio |
(0.95 | )% | (1.02 | )% | (1.29 | )% | (0.95 | )% | (0.95 | )% | (0.95 | )% | (0.95 | )% | ||||||||||||||
| Expense ratio, excluding brokerage commissions |
(0.95 | )% | (0.95 | )% | (0.95 | )% | (0.95 | )% | (0.95 | )% | (0.95 | )% | (0.95 | )% | ||||||||||||||
| Net investment income (loss) |
(0.93 | )% | (0.98 | )% | (1.26 | )% | (0.90 | )% | (0.89 | )% | (0.93 | )% | (0.88 | )% | ||||||||||||||
| * | See Note 1 of these Notes to Financial Statements. |
| # | The amount shown for a share outstanding throughout the period may not accord with the change in aggregate gains and losses during the period because of timing of creation and redemption units in relation to fluctuating net asset value during the period. |
| † | Market values are determined at the close of the New York Stock Exchange, which may be later than when the Funds’ net asset value is calculated. |
300
Table of Contents
Selected data for a Share outstanding throughout the year ended December 31, 2014:
For the Year Ended December 31, 2014
| Per Share Operating Performance |
Managed Futures Strategy+ |
VIX Short- Term Futures ETF |
VIX Mid- Term Futures ETF* |
Short VIX Short- Term Futures ETF |
Ultra VIX Short-Term Futures ETF* |
UltraShort Bloomberg Commodity |
UltraShort Bloomberg Crude Oil |
|||||||||||||||||||||
| Net asset value, beginning of period |
$ | 20.0000 | $ | 28.5387 | $ | 77.1837 | $ | 67.4993 | $ | 335.4203 | $ | 63.2936 | $ | 31.7301 | ||||||||||||||
| Net investment income (loss) |
(0.0417 | ) | (0.2047 | ) | (0.5666 | ) | (1.0247 | ) | (2.9055 | ) | (0.5679 | ) | (0.2773 | ) | ||||||||||||||
| Net realized and unrealized gain (loss)# |
1.1771 | (7.4019 | ) | (13.0151 | ) | (5.0742 | ) | (207.0557 | ) | 25.0238 | 46.5262 | |||||||||||||||||
| Change in net asset value from operations |
1.1354 | (7.6066 | ) | (13.5817 | ) | (6.0989 | ) | (209.9612 | ) | 24.4559 | 46.2489 | |||||||||||||||||
| Net asset value, at December 31, 2014 |
$ | 21.1354 | $ | 20.9321 | $ | 63.6020 | $ | 61.4004 | $ | 125.4591 | $ | 87.7495 | $ | 77.9790 | ||||||||||||||
| Market value per share, at December 31, 2013† |
$ | — | $ | 28.53 | $ | 77.16 | $ | 67.47 | $ | 335.60 | $ | 58.41 | $ | 31.58 | ||||||||||||||
| Market value per share, at December 31, 2014† |
$ | 21.28 | $ | 20.99 | $ | 63.89 | $ | 61.16 | $ | 125.75 | $ | 87.44 | $ | 76.52 | ||||||||||||||
| Total Return, at net asset value |
5.7 | %^ | (26.7 | )% | (17.6 | )% | (9.0 | )% | (62.6 | )% | 38.6 | % | 145.8 | % | ||||||||||||||
| Total Return, at market value |
6.4 | %^ | (26.4 | )% | (17.2 | )% | (9.4 | )% | (62.5 | )% | 49.7 | % | 142.3 | % | ||||||||||||||
| Ratios to Average Net Assets |
||||||||||||||||||||||||||||
| Expense ratio |
(0.82 | )%** | (0.92 | )% | (0.87 | )% | (1.49 | )% | (1.80 | )% | (0.95 | )% | (0.98 | )% | ||||||||||||||
| Expense ratio, excluding brokerage commissions |
(0.75 | )%** | (0.85 | )% | (0.85 | )% | (0.95 | )% | (0.95 | )% | (0.95 | )% | (0.95 | )% | ||||||||||||||
| Net investment income (loss) |
(0.82 | )%** | (0.88 | )% | (0.84 | )% | (1.46 | )% | (1.78 | )% | (0.92 | )% | (0.94 | )% | ||||||||||||||
| * | See Note 1 of these Notes to Financial Statements. |
| + | From commencement of operations, October 1, 2014, through December 31, 2014. |
| # | The amount shown for a share outstanding throughout the period may not accord with the change in aggregate gains and losses during the period because of timing of creation and redemption units in relation to fluctuating net asset value during the period. |
| † | Market values are determined at the close of the New York Stock Exchange, which may be later than when the Funds’ net asset value is calculated. |
| ^ | Percentages are not annualized for the period ended December 31, 2014. The return for a share outstanding for 2014 is calculated based on the initial offering price upon commencement of investment operations of $20.0000 for ProShares Managed Futures Strategy. |
| ** | Percentage are annualized. |
301
Table of Contents
For the Year Ended December 31, 2014
| Per Share Operating Performance |
UltraShort Bloomberg Natural Gas |
UltraShort Gold |
UltraShort Silver* |
Short Euro |
UltraShort Australian Dollar |
UltraShort Euro |
UltraShort Yen |
|||||||||||||||||||||
| Net asset value, at December 31, 2013 |
$ | 69.9635 | $ | 103.5180 | $ | 44.8910 | $ | 35.5867 | $ | 46.6384 | $ | 17.0613 | $ | 70.8640 | ||||||||||||||
| Net investment income (loss) |
(0.4961 | ) | (0.8233 | ) | (0.3937 | ) | (0.3428 | ) | (0.4272 | ) | (0.1642 | ) | (0.6412 | ) | ||||||||||||||
| Net realized and unrealized gain (loss)# |
14.4903 | (6.0431 | ) | 13.3098 | 4.8178 | 5.1678 | 4.6975 | 19.1108 | ||||||||||||||||||||
| Change in net asset value from operations |
13.9942 | (6.8664 | ) | 12.9161 | 4.4750 | 4.7406 | 4.5333 | 18.4696 | ||||||||||||||||||||
| Net asset value, at December 31, 2014 |
$ | 83.9577 | $ | 96.6516 | $ | 57.8071 | $ | 40.0617 | $ | 51.3790 | $ | 21.5946 | $ | 89.3336 | ||||||||||||||
| Market value per share, at December 31, 2013† |
$ | 69.36 | $ | 103.53 | $ | 45.10 | $ | 35.66 | $ | 46.66 | $ | 17.06 | $ | 70.91 | ||||||||||||||
| Market value per share, at December 31, 2014† |
$ | 82.03 | $ | 100.22 | $ | 59.70 | $ | 40.03 | $ | 51.37 | $ | 21.61 | $ | 89.30 | ||||||||||||||
| Total Return, at net asset value |
20.0 | % | (6.6 | )% | 28.8 | % | 12.6 | % | 10.2 | % | 26.6 | % | 26.1 | % | ||||||||||||||
| Total Return, at market value |
18.3 | % | (3.2 | )% | 32.4 | % | 12.3 | % | 10.1 | % | 26.7 | % | 25.9 | % | ||||||||||||||
| Ratios to Average Net Assets |
||||||||||||||||||||||||||||
| Expense ratio |
(1.18 | )% | (0.95 | )% | (0.95 | )% | (0.96 | )% | (1.01 | )% | (0.95 | )% | (0.95 | )% | ||||||||||||||
| Expense ratio, excluding brokerage commissions |
(0.95 | )% | (0.95 | )% | (0.95 | )% | (0.95 | )% | (0.95 | )% | (0.95 | )% | (0.95 | )% | ||||||||||||||
| Net investment income (loss) |
(1.14 | )% | (0.91 | )% | (0.90 | )% | (0.93 | )% | (0.97 | )% | (0.90 | )% | (0.90 | )% | ||||||||||||||
| * | See Note 1 of these Notes to Financial Statements. |
| # | The amount shown for a share outstanding throughout the period may not accord with the change in aggregate gains and losses during the period because of timing of creation and redemption units in relation to fluctuating net asset value during the period. |
| † | Market values are determined at the close of the New York Stock Exchange, which may be later than when the Funds’ net asset value is calculated. |
302
Table of Contents
For the Year Ended December 31, 2014
| Per Share Operating Performance |
Ultra Bloomberg Commodity* |
Ultra Bloomberg Crude Oil* |
Ultra Bloomberg Natural Gas* |
Ultra Gold | Ultra Silver | Ultra Euro |
Ultra Yen* | |||||||||||||||||||||
| Net asset value, at December 31, 2013 |
$ | 77.7259 | $ | 160.4495 | $ | 155.3534 | $ | 41.2553 | $ | 63.3305 | $ | 26.0346 | $ | 74.5261 | ||||||||||||||
| Net investment income (loss) |
(0.7047 | ) | (1.0928 | ) | (1.5167 | ) | (0.4078 | ) | (0.5348 | ) | (0.2185 | ) | (0.6693 | ) | ||||||||||||||
| Net realized and unrealized gain (loss)# |
(24.8870 | ) | (108.6167 | ) | (92.1876 | ) | (0.8464 | ) | (23.4300 | ) | (5.9417 | ) | (17.3821 | ) | ||||||||||||||
| Change in net asset value from operations |
(25.5917 | ) | (109.7095 | ) | (93.7043 | ) | (1.2542 | ) | (23.9648 | ) | (6.1602 | ) | (18.0514 | ) | ||||||||||||||
| Net asset value, at December 31, 2014 |
$ | 52.1342 | $ | 50.7400 | $ | 61.6491 | $ | 40.0011 | $ | 39.3657 | $ | 19.8744 | $ | 56.4747 | ||||||||||||||
| Market value per share, at December 31, 2013† |
$ | 76.52 | $ | 161.10 | $ | 157.12 | $ | 41.26 | $ | 63.04 | $ | 25.98 | $ | 74.44 | ||||||||||||||
| Market value per share, at December 31, 2014† |
$ | 51.44 | $ | 51.85 | $ | 63.12 | $ | 38.41 | $ | 38.05 | $ | 19.80 | $ | 56.48 | ||||||||||||||
| Total Return, at net asset value |
(32.9 | )% | (68.4 | )% | (60.3 | )% | (3.0 | )% | (37.8 | )% | (23.7 | )% | (24.2 | )% | ||||||||||||||
| Total Return, at market value |
(32.8 | )% | (67.8 | )% | (59.8 | )% | (6.9 | )% | (39.6 | )% | (23.8 | )% | (24.1 | )% | ||||||||||||||
| Ratios to Average Net Assets |
||||||||||||||||||||||||||||
| Expense ratio |
(0.95 | )% | (0.99 | )% | (1.13 | )% | (0.95 | )% | (0.95 | )% | (0.95 | )% | (0.95 | )% | ||||||||||||||
| Expense ratio, excluding brokerage commissions |
(0.95 | )% | (0.95 | )% | (0.95 | )% | (0.95 | )% | (0.95 | )% | (0.95 | )% | (0.95 | )% | ||||||||||||||
| Net investment income (loss) |
(0.91 | )% | (0.95 | )% | (1.10 | )% | (0.91 | )% | (0.91 | )% | (0.91 | )% | (0.90 | )% | ||||||||||||||
| * | See Note 1 of these Notes to Financial Statements. |
| # | The amount shown for a share outstanding throughout the period may not accord with the change in aggregate gains and losses during the period because of timing of creation and redemption units in relation to fluctuating net asset value during the period. |
| † | Market values are determined at the close of the New York Stock Exchange, which may be later than when the Funds’ net asset value is calculated. |
303
Table of Contents
Selected data for a Share outstanding throughout the year ended December 31, 2013
For the Year Ended December 31, 2013
| Per Share Operating Performance |
VIX Short- Term Futures ETF* |
VIX Mid- Term Futures ETF* |
Short VIX Short- Term Futures ETF* |
Ultra VIX Short-Term Futures ETF* |
UltraShort Bloomberg Commodity |
UltraShort Bloomberg Crude Oil |
UltraShort Bloomberg Natural Gas* |
|||||||||||||||||||||
| Net asset value, at December 31, 2012 |
$ | 83.9374 | $ | 138.8013 | $ | 33.0649 | $ | 4,026.4321 | $ | 54.1021 | $ | 40.3079 | $ | 102.1402 | ||||||||||||||
| Net investment income (loss) |
(0.3518 | ) | (0.7892 | ) | (0.7398 | ) | (15.0047 | ) | (0.5355 | ) | (0.3033 | ) | (0.9217 | ) | ||||||||||||||
| Net realized and unrealized gain (loss)# |
(55.0469 | ) | (60.8284 | ) | 35.1742 | (3,676.0071 | ) | 9.7270 | (8.2745 | ) | (31.2550 | ) | ||||||||||||||||
| Change in net asset value from operations |
(55.3987 | ) | (61.6176 | ) | 34.4344 | (3,691.0118 | ) | 9.1915 | (8.5778 | ) | (32.1767 | ) | ||||||||||||||||
| Net asset value, at December 31, 2013 |
$ | 28.5387 | $ | 77.1837 | $ | 67.4993 | $ | 335.4203 | $ | 63.2936 | $ | 31.7301 | $ | 69.9635 | ||||||||||||||
| Market value per share, at December 31, 2012† |
$ | 85.05 | $ | 136.88 | $ | 32.73 | $ | 4,180.00 | $ | 51.64 | $ | 40.44 | $ | 101.64 | ||||||||||||||
| Market value per share, at December 31, 2013† |
$ | 28.53 | $ | 77.16 | $ | 67.47 | $ | 335.60 | $ | 58.41 | $ | 31.58 | $ | 69.36 | ||||||||||||||
| Total Return, at net asset value |
(66.0 | )% | (44.4 | )% | 104.1 | % | (91.7 | )% | 17.0 | % | (21.3 | )% | (31.5 | )% | ||||||||||||||
| Total Return, at market value |
(66.5 | )% | (43.6 | )% | 106.2 | % | (92.0 | )% | 13.1 | % | (21.9 | )% | (31.8 | )% | ||||||||||||||
| Ratios to Average Net Assets |
||||||||||||||||||||||||||||
| Expense ratio |
(0.85 | )% | (0.85 | )% | (1.53 | )% | (1.82 | )% | (0.95 | )% | (0.98 | )% | (1.20 | )% | ||||||||||||||
| Expense ratio, excluding brokerage commissions |
(0.85 | )% | (0.85 | )% | (0.95 | )% | (0.95 | )% | (0.95 | )% | (0.95 | )% | (0.95 | )% | ||||||||||||||
| Net investment income (loss) |
(0.81 | )% | (0.81 | )% | (1.49 | )% | (1.80 | )% | (0.90 | )% | (0.94 | )% | (1.15 | )% | ||||||||||||||
| * | See Note 1 of these Notes to Financial Statements. |
| # | The amount shown for a share outstanding throughout the period may not accord with the change in aggregate gains and losses during the period because of timing of creation and redemption units in relation to fluctuating net asset value during the period. |
| † | Market values are determined at the close of the New York Stock Exchange, which may be later than when the Funds’ net asset value is calculated. |
304
Table of Contents
For the Year Ended December 31, 2013
| Per Share Operating Performance |
UltraShort Gold |
UltraShort Silver* |
Short Euro | UltraShort Australian Dollar |
UltraShort Euro |
UltraShort Yen |
Ultra Bloomberg Commodity* |
|||||||||||||||||||||
| Net asset value, at December 31, 2012 |
$ | 63.8688 | $ | 25.6975 | $ | 37.6285 | $ | 37.8081 | $ | 19.0172 | $ | 50.7577 | $ | 97.5491 | ||||||||||||||
| Net investment income (loss) |
(0.7561 | ) | (0.3112 | ) | (0.3430 | ) | (0.4325 | ) | (0.1677 | ) | (0.5662 | ) | (0.7780 | ) | ||||||||||||||
| Net realized and unrealized gain (loss)# |
40.4053 | 19.5047 | (1.6988 | ) | 9.2628 | (1.7882 | ) | 20.6725 | (19.0452 | ) | ||||||||||||||||||
| Change in net asset value from operations |
39.6492 | 19.1935 | (2.0418 | ) | 8.8303 | (1.9559 | ) | 20.1063 | (19.8232 | ) | ||||||||||||||||||
| Net asset value, at December 31, 2013 |
$ | 103.5180 | $ | 44.8910 | $ | 35.5867 | $ | 46.6384 | $ | 17.0613 | $ | 70.8640 | $ | 77.7259 | ||||||||||||||
| Market value per share, at December 31, 2012† |
$ | 62.60 | $ | 25.04 | $ | 37.64 | $ | 37.74 | $ | 19.01 | $ | 50.77 | $ | 95.72 | ||||||||||||||
| Market value per share, at December 31, 2013† |
$ | 103.53 | $ | 45.10 | $ | 35.66 | $ | 46.66 | $ | 17.06 | $ | 70.91 | $ | 76.52 | ||||||||||||||
| Total Return, at net asset value |
62.1 | % | 74.7 | % | (5.4 | )% | 23.4 | % | (10.3 | )% | 39.6 | % | (20.3 | )% | ||||||||||||||
| Total Return, at market value |
65.4 | % | 80.1 | % | (5.3 | )% | 23.6 | % | (10.3 | )% | 39.7 | % | (20.1 | )% | ||||||||||||||
| Ratios to Average Net Assets |
||||||||||||||||||||||||||||
| Expense ratio |
(0.95 | )% | (0.95 | )% | (0.96 | )% | (1.02 | )% | (0.95 | )% | (0.95 | )% | (0.95 | )% | ||||||||||||||
| Expense ratio, excluding brokerage commissions |
(0.95 | )% | (0.95 | )% | (0.95 | )% | (0.95 | )% | (0.95 | )% | (0.95 | )% | (0.95 | )% | ||||||||||||||
| Net investment income (loss) |
(0.90 | )% | (0.89 | )% | (0.93 | )% | (0.99 | )% | (0.90 | )% | (0.91 | )% | (0.90 | )% | ||||||||||||||
| * | See Note 1 of these Notes to Financial Statements. |
| # | The amount shown for a share outstanding throughout the period may not accord with the change in aggregate gains and losses during the period because of timing of creation and redemption units in relation to fluctuating net asset value during the period. |
| † | Market values are determined at the close of the New York Stock Exchange, which may be later than when the Funds’ net asset value is calculated. |
305
Table of Contents
For the Year Ended December 31, 2013
| Per Share Operating Performance |
Ultra Bloomberg Crude Oil* |
Ultra Bloomberg Natural Gas* |
Ultra Gold | Ultra Silver* | Ultra Euro | Ultra Yen* | ||||||||||||||||||
| Net asset value, at December 31, 2012 |
$ | 146.9706 | $ | 156.1962 | $ | 83.7634 | $ | 171.8906 | $ | 24.3499 | $ | 112.7345 | ||||||||||||
| Net investment income (loss) |
(1.4243 | ) | (1.6214 | ) | (0.5404 | ) | (0.8789 | ) | (0.2200 | ) | (0.7984 | ) | ||||||||||||
| Net realized and unrealized gain (loss)# |
14.9032 | 0.7786 | (41.9677 | ) | (107.6812 | ) | 1.9047 | (37.4100 | ) | |||||||||||||||
| Change in net asset value from operations |
13.4789 | (0.8428 | ) | (42.5081 | ) | (108.5601 | ) | 1.6847 | (38.2084 | ) | ||||||||||||||
| Net asset value, at December 31, 2013 |
$ | 160.4495 | $ | 155.3534 | $ | 41.2553 | $ | 63.3305 | $ | 26.0346 | $ | 74.5261 | ||||||||||||
| Market value per share, at December 31, 2012† |
$ | 146.60 | $ | 156.96 | $ | 85.34 | $ | 176.40 | $ | 24.32 | $ | 113.12 | ||||||||||||
| Market value per share, at December 31, 2013† |
$ | 161.10 | $ | 157.12 | $ | 41.26 | $ | 63.04 | $ | 25.98 | $ | 74.44 | ||||||||||||
| Total Return, at net asset value |
9.2 | % | (0.5 | )% | (50.7 | )% | (63.2 | )% | 6.9 | % | (33.9 | )% | ||||||||||||
| Total Return, at market value |
9.9 | % | 0.1 | % | (51.7 | )% | (64.3 | )% | 6.8 | % | (34.2 | )% | ||||||||||||
| Ratios to Average Net Assets |
||||||||||||||||||||||||
| Expense ratio |
(0.97 | )% | (1.15 | )% | (0.95 | )% | (0.95 | )% | (0.95 | )% | (0.95 | )% | ||||||||||||
| Expense ratio, excluding brokerage commissions |
(0.95 | )% | (0.95 | )% | (0.95 | )% | (0.95 | )% | (0.95 | )% | (0.95 | )% | ||||||||||||
| Net investment income (loss) |
(0.92 | )% | (1.10 | )% | (0.89 | )% | (0.89 | )% | (0.90 | )% | (0.90 | )% | ||||||||||||
| * | See Note 1 of these Notes to Financial Statements. |
| # | The amount shown for a share outstanding throughout the period may not accord with the change in aggregate gains and losses during the period because of timing of creation and redemption units in relation to fluctuating net asset value during the period. |
| † | Market values are determined at the close of the New York Stock Exchange, which may be later than when the Funds’ net asset value is calculated. |
306
Table of Contents
NOTE 8 – RISK
Correlation and Compounding Risk
The Geared Funds do not seek to achieve their stated investment objective over a period of time greater than a single day (as measured from NAV calculation time to NAV calculation time). The return of a Geared Fund for a period longer than a single day is the result of its return for each day compounded over the period and usually will differ from the inverse (-1x), two times the inverse (-2x), or two times (2x) of the return of the Geared Fund’s benchmark for the period. A Fund will lose money if its benchmark performance is flat over time, and it is possible for a Geared Fund to lose money over time even if the performance of its benchmark increases (or decreases in the case of Short and UltraShort Funds), as a result of daily rebalancing, the benchmark’s volatility and compounding. Longer holding periods, higher benchmark volatility, inverse exposure and greater leverage each affect the impact of compounding on a Fund’s returns. Daily compounding of a Geared Fund’s investment returns can dramatically and adversely affect its longer-term performance during periods of high volatility. Volatility may be at least as important to a Geared Fund’s return for a period as the return of the Fund’s underlying benchmark. The Matching VIX Funds and the Managed Futures Fund seek to achieve their stated investment objective both over a single day and over time.
Each Ultra and UltraShort Fund uses leverage and should produce daily returns that are more volatile than that of its benchmark. For example, the daily return of an Ultra Fund with a 2x multiple should be approximately two times as volatile on a daily basis as is the return of a fund with an objective of matching the same benchmark. The daily return of a Short or UltraShort Fund is designed to return the inverse (-1x) or two times the inverse (-2x) of the return that would be expected of a fund with an objective of matching the same benchmark. The Geared Funds are not appropriate for all investors and present different risks than other funds. The Leveraged Funds use leverage and are riskier than similarly benchmarked exchange-traded funds that do not use leverage. An investor should only consider an investment in a Geared Fund if he or she understands the consequences of seeking daily leveraged, daily inverse or daily inverse leveraged investment results. Daily objective geared funds, if used properly and in conjunction with the investor’s view on the future direction and volatility of the markets, can be useful tools for investors who want to manage their exposure to various markets and market segments and who are willing to monitor and/or periodically rebalance their portfolios. Shareholders who invest in the Funds should actively manage and monitor their investments, as frequently as daily.
While the Funds expect to meet their investment objectives, several factors may affect their ability to do so. Among these factors are: (1) the Sponsor’s ability to purchase and sell Financial Instruments in a manner that correlates to a Fund’s objective; (2) an imperfect correlation between the performance of Financial Instruments held by a Fund and the performance of the applicable benchmark; (3) bid-ask spreads on such Financial Instruments; (4) fees, expenses, transaction costs, financing costs associated with the use of Financial Instruments and commission costs; (5) holding instruments traded in a market that has become illiquid or disrupted; (6) a Fund’s Share prices being rounded to the nearest cent and/or valuation methodology; (7) changes to a benchmark index that are not disseminated in advance; (8) the need to conform a Fund’s portfolio holdings to comply with investment restrictions or policies or regulatory or tax law requirements; (9) early and unanticipated closings of the markets on which the holdings of a Fund trade, resulting in the inability of the Fund to execute intended portfolio transactions; (10) accounting standards; and (11) differences caused by a Fund obtaining exposure to only a representative sample of the components of a benchmark, overweighting or underweighting certain components of a benchmark or obtaining exposure to assets that are not included in a benchmark.
A number of factors may affect a Geared Fund’s ability to achieve a high degree of correlation with its benchmark, and there can be no guarantee that a Fund will achieve a high degree of correlation. Failure to achieve a high degree of correlation may prevent a Geared Fund from achieving its investment objective. In order to achieve a high degree of correlation with their underlying benchmarks, the Geared Funds seek to rebalance their portfolios daily to keep exposure consistent with their investment objectives. Being materially under- or over-exposed to the benchmark may prevent such Geared Funds from achieving a high degree of correlation with such benchmark. Market disruptions or closure, large amounts of assets into or out of the Geared Funds, regulatory restrictions or extreme market volatility will adversely affect such Funds’ ability to adjust exposure to requisite levels. The target amount of portfolio exposure is impacted dynamically by the benchmarks’ movements during each day. Because of this, it is unlikely that the Geared Funds will be perfectly exposed (i.e., -1x, -2x or 2x, as applicable) to its benchmark at the
307
Table of Contents
end of each day, and the likelihood of being materially under- or over-exposed is higher on days when the benchmark levels are volatile near the close of the trading day. In addition, unlike other funds that do not rebalance their portfolios as frequently, each Geared Fund may be subject to increased trading costs associated with daily portfolio rebalancing in order to maintain appropriate exposure to the underlying benchmarks.
Counterparty Risk
Certain of the Funds will use swap agreements and/or forward contracts as a means to achieve their respective investment objectives. Such Funds will use either swap agreements and/or forward contracts referencing their respective benchmarks. These Funds may also invest in other swap agreements or forward contracts if such instruments tend to exhibit trading prices or returns that correlate with the benchmark or a component of the benchmark and will further the investment objective of the Fund. Certain Funds may invest in swap agreements or forward contracts if position accountability rules or position limits are reached with respect to specific futures contracts or the market for a specific futures contract experiences emergencies (e.g., natural disaster, terrorist attack or an act of God) or disruptions (e.g., a trading halt or a flash crash) that prevent the Funds from obtaining the appropriate amount of investment exposure to the affected futures contract or certain other futures contracts. Although unlikely, those Funds, under these circumstances, could have 100% exposure to swap agreements or forward contracts.
Swap agreements and forward contracts are generally traded in OTC markets and have only recently become subject to regulation by the CFTC. CFTC rules, however, do not cover all types of swap agreements and forward contracts. Investors, therefore, may not receive the protection of CFTC regulation or the statutory scheme of the Commodity Exchange Act (the “CEA”) in connection with each Fund’s swap agreements or forward contracts. The lack of regulation in these markets could expose investors to significant losses under certain circumstances, including in the event of trading abuses or financial failure by participants.
The Funds will be subject to credit risk with respect to the counterparties to the derivatives contracts (whether a clearing corporation in the case of cleared instruments or another third party in the case of OTC uncleared instruments). Unlike in futures contracts, the counterparty to uncleared swap agreements or forward contracts is generally a single bank or other financial institution, rather than a clearing organization backed by a group of financial institutions. As a result, a Fund is subject to credit risk with respect to the amount it expects to receive from counterparties to uncleared swaps and forward contracts entered into as part of that Fund’s principal investment strategy. If a counterparty becomes bankrupt or otherwise fails to perform its obligations due to financial difficulties, a Fund could suffer significant losses on these contracts and the value of an investor’s investment in a Fund may decline.
The Funds have sought to mitigate these risks by generally requiring that the counterparties for each Fund agree to post collateral for the benefit of the Fund, marked to market daily, subject to certain minimum thresholds; however there are no limitations on the percentage of its assets each Fund may invest in swap agreements or forward contracts with a particular counterparty. To the extent any such collateral is insufficient or there are delays in accessing the collateral, the Funds will be exposed to counterparty risk as described above, including possible delays in recovering amounts as a result of bankruptcy proceedings. The Funds typically enter into transactions only with major global financial institutions.
OTC swaps or forward contracts are less liquid than futures contracts because they are not traded on an exchange, do not have uniform terms and conditions, and are generally entered into based upon the creditworthiness of the parties and the availability of credit support, such as collateral, and in general, are not transferable without the consent of the counterparty. If the level of the Fund’s benchmark has a dramatic intraday move that would cause a material decline in the Fund’s NAV, the terms of the swap may permit the counterparty to immediately close out the transaction with the Fund. In that event, it may not be possible for the Fund to enter into another swap agreement or to invest in other Financial Instruments necessary to achieve the desired exposure consistent with the Fund’s objective. This, in turn, may prevent the Fund from achieving its investment objective, particularly if the level of the Fund’s benchmark reverses all or part of its intraday move by the end of the day. In addition, cleared derivative transactions benefit from daily marking-to-market and settlement, and segregation and minimum capital requirements applicable to intermediaries. Transactions entered into directly between two counterparties generally do not benefit from such protections. This exposes the Funds to the risk that a counterparty will not settle a transaction in accordance with its terms and conditions because of a dispute over the terms of the contract (whether or not bona fide) or because of a credit or liquidity problem, thus causing the Funds to suffer a loss.
308
Table of Contents
Each counterparty and/or any of its affiliates may be an Authorized Participant or shareholder of a Fund.
The counterparty risk for cleared derivative transactions is generally lower than for uncleared OTC derivatives since generally a clearing organization becomes substituted for each counterparty to a cleared derivative contract and, in effect, guarantees the parties’ performance under the contract as each party to a trade looks only to the clearing house for performance of financial obligations. However, there can be no assurance that the clearing house, or its members, will satisfy its obligations to the Fund.
Leverage Risk
The Leveraged Funds may utilize leverage in seeking to achieve their respective investment objectives and will lose more money in market environments adverse to their respective daily investment objectives than funds that do not employ leverage. The use of leveraged and/or inverse leveraged positions could result in the total loss of an investor’s investment.
For example, because the UltraShort Funds and Ultra Funds include a two times the inverse (-2x), or a two times (2x) multiplier, a single-day movement in the relevant benchmark approaching 50% at any point in the day (for an UltraShort Fund or an UltraShort Fund) could result in the total loss or almost total loss of an investor’s investment if that movement is contrary to the investment objective of the Fund in which an investor has invested, even if such Fund’s benchmark subsequently moves in an opposite direction, eliminating all or a portion of the movement. This would be the case with downward single-day or intraday movements in the underlying benchmark of an Ultra Fund or upward single-day or intraday movements in the benchmark of an UltraShort Fund, even if the underlying benchmark maintains a level greater than zero at all times.
Liquidity Risk
Financial Instruments cannot always be liquidated at the desired price. It is difficult to execute a trade at a specific price when there is a relatively small volume of buy and sell orders in a market. A market disruption can also make it difficult to liquidate a position or find a swap or forward contract counterparty at a reasonable cost. Market illiquidity may cause losses for the Funds. The large size of the positions which the Funds may acquire increases the risk of illiquidity by both making their positions more difficult to liquidate and increasing the losses incurred while trying to do so. Any type of disruption or illiquidity will potentially be exacerbated due to the fact that the Funds will typically invest in Financial Instruments related to one benchmark, which in many cases is highly concentrated.
“Contango” and “Backwardation” Risk
In Funds that hold futures contracts, as the futures contracts near expiration, they are generally replaced by contracts that have a later expiration. Thus, for example, a contract purchased and held in November 2014 may specify a January 2015 expiration. As that contract nears expiration, it may be replaced by selling the January 2015 contract and purchasing the contract expiring in March 2015. This process is referred to as “rolling.” Rolling may have a positive or negative impact on performance. For example, historically, the prices of certain types of futures contracts have frequently been higher for contracts with shorter-term expirations than for contracts with longer-term expirations, which is referred to as “backwardation.” In these circumstances, absent other factors, the sale of the January 2015 contract would take place at a price that is higher than the price at which the March 2015 contract is purchased, thereby creating a gain in connection with rolling. While certain types of futures contracts have historically exhibited consistent periods of backwardation, backwardation will likely not exist in these markets at all times. The presence of contango (where prices of contracts are higher in the distant delivery months than in the nearer delivery months due to the costs of long-term storage of a physical commodity prior to delivery or other factors) in certain futures contracts at the time of rolling would be expected to adversely affect an Ultra Fund, the Managed Futures Fund or a Matching VIX Fund that invests in such futures, and positively affect a Short Fund or an UltraShort Fund that invests in such futures. Similarly, the presence of backwardation in certain futures contracts at the time of rolling such contracts would be expected to adversely affect the Short Funds and UltraShort Funds, and positively affect the Ultra Funds, the Managed Futures Fund and Matching VIX Funds.
309
Table of Contents
Since the introduction of VIX futures contracts, there have frequently been periods where VIX futures prices reflect higher expected volatility levels further out in time. This can result in a loss from “rolling” the VIX futures to maintain the constant weighted average maturity of the applicable VIX Futures Index. Losses from exchanging a lower priced VIX future for a higher priced longer-term future in the rolling process would adversely affect the value of each VIX Futures Index and, accordingly, decrease the return of the Ultra VIX Short-Term Futures ETF and the Matching VIX Funds.
Gold and silver historically exhibit persistent “contango” markets rather than backwardation. Natural gas, like crude oil, moves in and out of backwardation and contango but historically has been in contango most commonly. It is generally believed this is because the market needs to build inventories for most of the year in order to have enough storage to make it through a normal winter. Periods of backwardation are typically thought to be caused by demand shocks or supply shortages such as an unusually cold winter or a hurricane.
Shareholder Concentration
As of December 31, 2015, ProShares Morningstar Alternatives Solution ETF, an ETF affiliated with the Funds, owned 51.4% of the outstanding shares of the Managed Futures Fund. Subscription and redemption activity by concentrated shareholders may have a significant effect on the operations of the Fund.
NOTE 9 – SUBSEQUENT EVENTS
Management has evaluated the possibility of subsequent events existing in the Trust’s and the Funds’ financial statements through the date the financial statements were issued. The subsequent events were as follows:
On February 18, 2016, the Trust announced that it plans to close and liquidate ProShares Managed Futures Strategy (ticker symbol: FUTS). The fund trades on NYSE Arca.
After the close of business on March 18, 2016, the fund will no longer accept creation orders. Trading in the fund on NYSE Arca will be halted prior to market open on March 21, 2016. Fund holdings will be liquidated by March 21, 2016 or shortly thereafter. Beginning on March 21, 2016, the fund will not be traded on NYSE Arca and there will be no secondary market for the fund’s shares. Once the fund is in the process of liquidating its portfolio holdings, it will not be managed in accordance with its investment objective. Proceeds of the liquidation are scheduled to be distributed to shareholders on or about March 30, 2016.
Any shareholders remaining in the fund on the distribution date will automatically have their shares redeemed for cash at the fund’s net asset value per share as of the liquidation date. The cash distribution will be deposited into their brokerage accounts. These cash distributions are taxable events and shareholders should consult their tax advisors about potential tax consequences.
310
Table of Contents
Pursuant to the requirements of Section 13 or 15(d) of the Securities Exchange Act of 1934, the registrant has duly caused this report to be signed on its behalf by the undersigned, thereunto duly authorized.
PROSHARES TRUST II
| /s/ Todd Johnson |
| By: Todd Johnson |
| Principal Executive Officer |
| Date: February 29, 2016 |
Pursuant to the requirements of the Securities Exchange Act of 1934, this report has been signed below by the following persons on behalf of the registrant and in the capacities and on the dates indicated.
| /s/ Todd Johnson |
| By: Todd Johnson |
| Principal Executive Officer |
| Date: February 29, 2016 |
| /s/ Edward Karpowicz |
| By: Edward Karpowicz |
| Principal Financial Officer |
| Date: February 29, 2016 |
311