Attached files
| file | filename |
|---|---|
| EX-31.1 - EX-31.1 - NUTRI SYSTEM INC /DE/ | ntri-ex311_13.htm |
| EX-21.1 - EX-21.1 - NUTRI SYSTEM INC /DE/ | ntri-ex211_393.htm |
| EX-32.1 - EX-32.1 - NUTRI SYSTEM INC /DE/ | ntri-ex321_11.htm |
| EX-31.2 - EX-31.2 - NUTRI SYSTEM INC /DE/ | ntri-ex312_12.htm |
| EX-32.2 - EX-32.2 - NUTRI SYSTEM INC /DE/ | ntri-ex322_10.htm |
| EX-23.1 - EX-23.1 - NUTRI SYSTEM INC /DE/ | ntri-ex231_14.htm |
UNITED STATES
SECURITIES AND EXCHANGE COMMISSION
Washington, D.C. 20549
FORM 10-K
(Mark One)
|
x |
ANNUAL REPORT PURSUANT TO SECTION 13 OR 15(d) OF THE SECURITIES EXCHANGE ACT OF 1934 for the fiscal year ended December 31, 2015 |
|
o |
TRANSITION REPORT PURSUANT TO SECTION 13 OR 15(d) OF THE SECURITIES EXCHANGE ACT OF 1934 for the transition period from to |
Commission File Number 0-28551
Nutrisystem, Inc.
(Exact name of registrant as specified in its charter)
|
Delaware |
|
23-3012204 |
|
(State or other jurisdiction of incorporation or organization) |
|
(I.R.S. Employer Identification No.) |
|
|
|
|
|
Fort Washington Executive Center 600 Office Center Drive Fort Washington, Pennsylvania |
|
19034 |
|
(Address of principal executive offices) |
|
(Zip Code) |
Registrant's telephone number, including area code: (215) 706-5300
Securities registered pursuant to Section 12(b) of the Act:
|
Title of each class |
|
Name of each exchange on which registered |
|
Common Stock, $.001 par value |
|
The NASDAQ Stock Market LLC |
Securities registered pursuant to Section 12(g) of the Act:
None
Indicate by check mark if the registrant is a well-known seasoned issuer, as defined in Rule 405 of the Securities Act. Yes o No x
Indicate by check mark if the registrant is not required to file reports pursuant to Section 13 or Section 15(d) of the Act. Yes o No x
Indicate by check mark whether the registrant: (1) has filed all reports required to be filed by Section 13 or 15(d) of the Securities Exchange Act of 1934 during the preceding 12 months (or for such shorter period that the registrant was required to file such reports), and (2) has been subject to such filing requirements for the past 90 days. Yes x No o
Indicate by check mark whether the registrant has submitted electronically and posted on its corporate Website, if any, every Interactive Data File required to be submitted and posted pursuant to Rule 405 of Regulation S-T during the preceding 12 months (or for such shorter period that the registrant was required to submit and post such files). Yes x No o
Indicate by check mark if disclosure of delinquent filers pursuant to Item 405 of Regulation S-K is not contained herein, and will not be contained, to the best of registrant’s knowledge, in the definitive proxy or information statements incorporated by reference in Part III of this Form 10-K or any amendment to this Form 10-K. o
Indicate by check mark whether the registrant is a large accelerated filer, an accelerated filer, a non-accelerated filer or a smaller reporting company (as defined in Exchange Act Rule 12b-2).
|
Large accelerated filer |
|
x |
Accelerated filer |
|
o |
|
|
|
|
|
|
|
|
Non-accelerated filer |
|
o |
Smaller reporting company |
|
o |
Indicate by check mark whether the registrant is a shell company (as defined in Rule 12b-2 of the Act). Yes o No x
The aggregate market value of the voting and non-voting common equity held by non-affiliates of the registrant as of June 30, 2015, was $709,984,910. Such aggregate market value was computed by reference to the closing price of the common stock as reported on the NASDAQ Stock Market on June 30, 2015 (the last business day of the registrant’s most recently completed second fiscal quarter).
Number of shares outstanding of the registrant’s common stock, $0.001 par value, as of February 19, 2016: 29,413,596 shares
DOCUMENTS INCORPORATED BY REFERENCE
Portions of the definitive proxy statement to be filed with the United States Securities and Exchange Commission (the “SEC”) for Nutrisystem, Inc.’s annual meeting of stockholders are incorporated by reference into Part III of this Form 10-K.
Table of Contents
|
|
|
Page |
|
|
|
|
|
|
|
|
|
|
|
|
Item 1. |
|
4 |
|
|
|
|
|
|
|
Item 1A. |
|
11 |
|
|
|
|
|
|
|
Item 1B. |
|
17 |
|
|
|
|
|
|
|
Item 2. |
|
17 |
|
|
|
|
|
|
|
Item 3. |
|
17 |
|
|
|
|
|
|
|
Item 4. |
|
17 |
|
|
|
|
|
|
|
|
|
|
|
|
|
|
|
|
|
Item 5. |
|
18 |
|
|
|
|
|
|
|
Item 6. |
|
20 |
|
|
|
|
|
|
|
Item 7. |
Management’s Discussion and Analysis of Financial Condition and Results of Operations |
|
21 |
|
|
|
|
|
|
Item 7A. |
|
26 |
|
|
|
|
|
|
|
Item 8. |
|
26 |
|
|
|
|
|
|
|
Item 9. |
Changes in and Disagreements with Accountants on Accounting and Financial Disclosure |
|
26 |
|
|
|
|
|
|
Item 9A. |
|
26 |
|
|
|
|
|
|
|
Item 9B. |
|
29 |
|
|
|
|
|
|
|
|
|
|
|
|
|
|
|
|
|
Item 10. |
|
30 |
|
|
|
|
|
|
|
Item 11. |
|
30 |
|
|
|
|
|
|
|
Item 12. |
Security Ownership of Certain Beneficial Owners and Management and Related Stockholder Matters |
|
30 |
|
|
|
|
|
|
Item 13. |
Certain Relationships and Related Transactions, and Director Independence |
|
30 |
|
|
|
|
|
|
Item 14. |
|
30 |
|
|
|
|
|
|
|
|
|
|
|
|
|
|
|
|
|
Item 15. |
|
31 |
2
Special Note Regarding Forward-Looking Statements
From time to time, information provided by us, including but not limited to statements in this Annual Report, or other statements made by or on our behalf, may contain “forward-looking” information within the meaning of the Private Securities Litigation Reform Act of 1995. Words such as “believe,” “estimate,” “will be,” “will,” “would,” “expect,” “anticipate,” “plan,” “project,” “intend,” “could,” “should,” or other similar words or expressions often identify forward-looking statements.
Such statements are based on current expectations only, and are subject to certain risks, uncertainties, and assumptions, many of which are beyond our control. Should one or more of these risks or uncertainties materialize, or should underlying assumptions prove incorrect, actual results, performance, or achievements may vary materially from those anticipated, estimated, or projected. Among the factors that could cause actual results to materially differ include:
|
|
· |
competition from other weight management industry participants or the development of more effective or more favorably perceived weight management methods; |
|
|
· |
our ability to continue to develop innovative new programs and enhance our existing programs, or the failure of our programs to continue to appeal to the market; |
|
|
· |
the effectiveness of our marketing and advertising programs; |
|
|
· |
loss, or disruption in the business, of any of our food suppliers; |
|
|
· |
loss, or disruption in the business, of our fulfillment provider; |
|
|
· |
disruptions in the shipping of our food products; |
|
|
· |
claims that our personnel are unqualified to provide proper weight loss advice and other health or advertising related claims by consumers; |
|
|
· |
failure to attract or negative publicity with respect to any of our spokespersons or negative publicity with respect to the weight loss industry; |
|
|
· |
our ability to successfully make acquisitions or enter into joint ventures, including our ability to successfully integrate, operate or realize the projected benefits of such businesses; |
|
|
· |
general business and economic conditions; |
|
|
· |
the seasonal nature of our business; |
|
|
· |
loss of any of our third-party retailer agreements and any obligations associated with such loss; |
|
|
· |
our ability to enforce our intellectual property rights, as well as the impact of our involvement in any claims related to intellectual property rights; |
|
|
· |
uncertainties regarding the satisfactory operation of our information technology or systems; |
|
|
· |
risks associated with unauthorized penetration of our information security; |
|
|
· |
the impact of existing and future laws and regulations; |
|
|
· |
exposure to product liability claims if the use of our products results in illness or injury; |
|
|
· |
the impact of our debt covenants; |
|
|
· |
our inability to recruit and retain key executive officers; |
|
|
· |
potential litigation from our competitors; |
|
|
· |
provisions in our certificate of incorporation may deter or delay an acquisition or prevent a change in control; and |
|
|
· |
other risks and uncertainties, including those detailed herein and from time to time in our periodic reports filed with the SEC. |
We undertake no obligation to publicly update or revise any forward-looking statements, whether as a result of new information, future events, or otherwise.
3
Overview
Nutrisystem, Inc. (together with its consolidated subsidiaries, “Nutrisystem,” the “Company,” “we,” “us,” or “our”) is a provider of weight management products and services, including nutritionally balanced weight loss programs, multi-day kits available at select retail locations and digital tools to support weight loss. Typically, our program customers purchase monthly food packages containing a four-week meal plan consisting of breakfasts, lunches, dinners and snacks and flex meal plan recipes, which they supplement with fresh fruits, vegetables and dairy. Most of our customers order on an auto-delivery basis (“Auto-Delivery”), which means we send a four-week meal plan on an ongoing basis until notified of a customer’s cancellation. Monthly notifications are also sent to remind customers to update order preferences. We offer our pre-selected favorites food pack or personalized plans where customers can hand pick their entire menu or customize plans to their dietary preference. Our meal plans feature more than 150 menu options at different price points including frozen and ready-to-go entrees, snacks and shakes. Additionally, we offer comprehensive individualized counseling options from trained weight loss counselors, registered dietitians and certified diabetes educators and provide further support through our digital tools.
Our program is based on the following cornerstones that represent who we are to our customers:
|
|
· |
Real Results. The Nutrisystem program has helped millions of people lose weight successfully over our 40-plus year history. Our program is portioned for weight loss, nutritionally balanced and consistent with national guidelines for dietary intake meeting targets for total fat, saturated fat, trans fat, sodium, added sugar, cholesterol, carbohydrates, fiber and protein as well as national guidelines for physical activity. We also offer transition and maintenance plans, which include personalized menu options (e.g., only dinner entrees) as well as continued counseling support and access to NuMi by Nutrisystem. NuMi is an easy-to-use, interactive and personalized solution to the nutritional and emotional components of a weight loss journey, giving users the help they need, when and where they need it most. This digital product integrates with wearable fitness devices and health platforms and is available for free to Nutrisystem customers as well as the general population of do-it-yourself dieters. These plans are designed to help our customers keep the weight off. |
|
|
· |
Sound Science. The Nutrisystem program is based on more than 40 years of nutrition research and the science of the low Glycemic Index, and offers portion-controlled items that include relatively higher amounts of fiber and contain “good” carbohydrates and zero trans fats. The Glycemic Index is a measure of the quality of carbohydrates in foods. Foods on the lower end of the Glycemic Index are generally considered “good” carbohydrates. In addition, in 2015, we continued to offer customers more meal choices, including more than 100 foods that contain no artificial preservatives, colors or flavors. |
|
|
· |
Complete Convenience. Nutrisystem sells its weight management program primarily through a direct-to-consumer sales and distribution approach using the Internet and telephone. Our customers can place orders 24 hours a day, seven days a week on our website, www.nutrisystem.com, and the food is shipped directly to our customers’ doors. Our customers can either choose our pre-selected favorites food pack or personalize their monthly food orders for their specific tastes or dietary needs. Our program does not require customers to visit centers, measure foods or count calories. The entrees are individually packaged and food preparation time is minimal. The direct-to-consumer approach using the Internet and telephone provides the convenience and privacy that our customers value. In addition, we provide online and telephone counseling and support to our customers using trained weight loss counselors, registered dietitians, certified diabetes educators and other nutrition and dietary staff, and as a result, our customers do not need to travel for face-to-face meetings. |
|
|
· |
Value. We believe we are very competitively priced within the weight management industry and provide a compelling value proposition to our customers, which includes a selection of more than 150 food items, expert guides, tools, including NuMi and access to trained weight loss counselors, registered dietitians, certified diabetes educators and other nutrition and dietary staff. We do not charge membership fees. Various promotional offers and pricing are offered throughout the year. |
Competitive Strengths
We believe our program, kits and digital tools offer consumers a sensible approach to losing weight without the use of faddish, unhealthy or unrealistic weight loss methods by educating them about proper portion size, as well as the appropriate combinations of fiber, protein, good carbohydrates and fat.
4
We intend to capitalize on the following competitive strengths:
|
|
· |
Product Efficacy. We believe most of our customers are very satisfied with our products and believe they have lost weight while using our program. Our customer research has found that customers lost an average of 1.0 to 2.0 pounds per week and tended to stay on the program for 11 to 12 weeks. We have also sponsored clinical trials at leading academic centers in patients with Type 2 diabetes. Statistically significant and clinically meaningful weight loss and improvements in HbA1c (a key measure of blood glucose control) were observed, in addition to improvements in secondary endpoints such as waist circumference, total plasma cholesterol and blood pressure. |
|
|
· |
Strong Brand Recognition. We believe that our brand is well recognized in the weight management industry. The Nutrisystem name has been in the weight management industry for more than 40 years, and we estimate that our company and our predecessors have spent hundreds of millions of dollars in advertising over that time period. |
|
|
· |
Low Cost, Highly Scalable Model. Unlike traditional commercial weight loss programs, which primarily sell through franchisee and company-owned centers, we primarily generate revenue in our direct channel through the Internet and telephone (including the redemption of prepaid program cards). Our method of distribution removes the fixed costs and capital investment associated with diet centers. We also minimize fixed costs and capital investments in food procurement and fulfillment: we outsource the production of our food products to a number of vendors and we outsource 100% of our fulfillment operations to a third-party provider. |
|
|
· |
Retail. We also generate revenue through the sale of our products and kits at select retail locations. These products and kits represent a significant departure from our traditional four-week program and have expanded our products and consumer reach. The retail channel provides us with great brand exposure, offering consumers who may not be aware of our program an opportunity to sample Nutrisystem at an attractive price point. |
|
|
· |
Superior Consumer Value Proposition. Our goal is to offer our customers a complete weight management program that is convenient, private and cost-effective. Our customers primarily place their orders through the Internet or over the telephone and have their food delivered directly to their homes. This affords our customers the convenience and anonymity that other diets, which rely on weight-loss centers, cannot ensure. Additionally, we provide our customers with a package of food, including breakfast, lunch, dinner and snacks, which removes the confusion of reading nutrition labels, measuring portions or counting calories, carbohydrates or points. We believe our weight management program offers our customers significant value and is priced below those of our competitors. In addition, unlike some of our competitors, we do not charge a membership fee. |
Our Industry
Weight management is a challenge for a significant portion of the U.S. population, as well as the global population. More than one-third (34.9% or 78.6 million) of U.S. adults are obese.
According to the U.S. Department of Health and Human Services, overweight and obese individuals are increasingly at risk for diseases such as Type 2 diabetes, heart disease, certain types of cancer, stroke, arthritis, sleep apnea and depression. However, there is evidence that weight loss may reduce the risk of developing these conditions, as well as improve the health and quality of life of people who have these conditions. Our clinical trial results suggest and analyses of real world customer results confirm that people who stay on the Nutrisystem program for at least three months have a high probability of achieving clinically meaningful weight loss.
In addition to the health risks, there are also cultural implications for those who are overweight or obese. U.S. consumers are inundated with imagery in media, fashion and entertainment that depicts the thin body as the ideal body type. Studies suggest that there is rampant discrimination against people with obesity. Despite the high percentage of overweight and obese individuals in the U.S., the popularity of dieting appears to indicate consumers’ desire to be thin.
Competition
The weight loss industry is very competitive and consists of pharmaceutical products and weight loss programs, digital tools and wearable trackers, as well as a wide variety of diet foods and meal replacement bars and shakes, appetite suppressants and nutritional supplements. The weight loss market is served by a diverse array of competitors. Potential customers seeking to manage their weight can turn to traditional center-based competitors, online diet-oriented sites, self-directed dieting and self-administered products such as prescription drugs, over-the-counter drugs and supplements, as well as medically supervised programs. Our identified competitors include, but are not limited to, Weight Watchers International, Inc., Jenny Craig, Medifast, Inc., Atkins Nutritionals, Inc. and Slimfast.
5
We believe that the principal competitive factors in the weight loss market are:
|
|
· |
the availability, convenience, privacy and effectiveness of the weight reduction program; |
|
|
· |
brand recognition and trustworthiness; |
|
|
· |
media spending; |
|
|
· |
new products and innovative offerings; |
|
|
· |
program pricing; and |
|
|
· |
the ability to attract and retain customers through promotion and personal referral. |
Based on these factors, we believe that we can compete effectively in the weight loss industry. We, however, have no control over how successful competitors will be in addressing these factors. By providing a well-recognized food-based weight management program using the direct channel, we believe that we have a competitive advantage in our market.
Our Products and Services
For more than 40 years, the Nutrisystem name has been recognized as a leader in the weight loss industry. We provide a comprehensive weight management program, consisting primarily of a pre-packaged food program, digital tools and counseling. Typically, our customers purchase monthly food packages of frozen and ready-to-go food containing a four-week meal plan consisting of breakfasts, lunches, dinners and snacks and flex meal plan recipes, which they supplement with fresh fruits, vegetables and dairy. Most customers order through our Auto-Delivery feature. Our program features more than 150 menu options at different price points including frozen and ready-to-go entrees, snacks and shakes. Trained counselors are available to answer questions and make recommendations to help each customer achieve and maintain his or her weight loss goal. Customers support and encourage each other and share information online and via Nutrisystem social media channels. These services are complemented with relevant information on diet, nutrition and physical activity, including a personalized “My Daily 3®” physical activity program and expert guides with tips to help customers succeed on the program. Additionally, NuMi, our digital product that integrates with wearable fitness devices and health platforms, is offered to our customers free of charge.
Our Nutrisystem® program consists of more than 150 portion-controlled items that serve as the foundation of a low Glycemic Index diet. Our program is portioned for weight loss and offers a balance of carbohydrate, protein and fat that meets national dietary guidelines. We have also worked to reduce the sodium content of our meal program. Including grocery additions to supplement our meals, our plans contain 1800-2200 milligrams of sodium per day, consistent with national guidelines, and tailored versions of the plans are available that deliver as low as 1500 mg/day. In contrast, the average American consumes 2800-4000 milligrams of sodium per day. We constantly strive to meet or exceed nutritional guidelines as they are updated.
We offer a customizable program. In December 2015, we announced the launch of our Turbo10 program, a clinically tested program that could deliver up to a 10-pound weight loss and a reduction of five inches overall in the first month of dieting. Previously, we had offered the Fast 5+ kit, a one-week starter kit that could help customers lose five pounds plus one inch off their waist in their first week of dieting. A large and growing body of scientific evidence suggests a key predictor of long-term weight loss success is quick, early results, which these programs were designed to deliver. Our program includes seven days of breakfasts, lunches, and dinners, plus shakes with formulations for men and women to meet their unique nutritional needs. As part of our program, customers are given a meal plan, access to trackers and tools via NuMi, educational digital content and exercise suggestions and are also encouraged to check in periodically with a Nutrisystem counselor as their needs change in response to weight loss. Our program delivers a combination of portion-controlled foods and an eating plan based on slow digesting carbohydrates like fiber, designed to help keep blood sugar levels stable throughout the day, minimizing hunger spikes and the feelings of deprivation that cause cravings.
Additionally, our multi-day kits are available at select retailers and represent a significant departure from our traditional four-week program. We offer several varieties of our 5-day kit, a “D” kit targeted to individuals with or at risk of Type 2 diabetes, as well as SmartCarb and PowerFuel products including blueberry muffins, cinnamon buns, vanilla shakes, chocolate shakes and chocolate chip cookie packs, designed to complement our multi-day kits. The retail channel provides us with great brand exposure, offering consumers who may not be aware of our program an opportunity to sample Nutrisystem at an attractive price point. We are seeing repeat business as well as multiple kit purchases, indicating that customers are seeing results or enlisting other family members to diet with them. Also, we continue to offer our program at Costco through the use of prepaid program cards and gift cards. We are actively developing our retail product pipeline and have multiple kits and single items available for purchase.
For Type 2 diabetics or for those at risk for Type 2 diabetes, we have the Nutrisystem® D® Program, a weight loss program specifically designed to produce gradual weight loss. It provides nutrition consistent with the guidelines of the American Diabetes Association. Two randomized controlled trials published in peer-reviewed medical journals found the Nutrisystem D program, in
6
combination with counseling sessions, produced statistically and clinically meaningful improvements in weight, HbA1c (a key measure of blood glucose control), and several other risk factors. Notably, improvements in diabetes control were observed despite a reduction in diabetes medications among participants who received the Nutrisystem D intervention. A third study, utilizing continuous glucose monitoring technology, found improvements in blood glucose control when subjects used the Nutrisystem D program, even before the achievement of significant weight loss.
By offering a variety of frozen and ready-to-go foods, we help our customers sustain their weight loss efforts. On our website, customers can order food 24 hours a day, seven days a week. The transition and maintenance plans allow customers the means to gradually increase their responsibility for grocery shopping and food preparation while adhering to the principles of the Nutrisystem approach. These lower cost programs help extend the supportive relationship and allow time to reinforce the dietary changes that produced the initial weight loss. These plans include recipes and portion-control tools in addition to a reduced number of Nutrisystem® entrees delivered each month.
The features of our weight loss program address many of the most common limitations of traditional weight loss programs, including high initiation and recurring membership fees, the inconvenience of traveling to weight loss centers for scheduled appointments and lack of privacy. In addition, our prepared meals provide our customers with a structured program with limited weighing and measuring of foods and no need to count calories, carbohydrates or points. We believe that the convenience of home delivery, reduced grocery shopping time, the portability of the food, and rapid food preparation also aid customer compliance with our weight loss program.
Our food items have accounted for 98%, 99% and 99% of our revenue for the years ended December 31, 2015, 2014 and 2013, respectively. No other product or service has accounted for more than 1% of our revenue in any of the last three years. Approximately 99% of our revenue was generated in the United States in each of the years end December 31, 2015, 2014 and 2013.
The Customer Experience
Our sales, marketing, ecommerce and service operations seek to understand our customers’ needs throughout their weight loss and management journey to help us develop effective, compelling and innovative products and services. Through a combination of consumer research and data management, we personalize the introduction, on-boarding, weight loss, transition and maintenance phases of our customers’ experience.
|
|
· |
Introduction/Acquisition |
We attract new customers via direct response television, online marketing (search engine marketing, search engine optimization, affiliate marketing, display advertising, partnerships, retargeting social and email), direct mail, print advertisements and a variety of other direct marketing efforts. We have a fully integrated acquisition enterprise. Response is tracked to the specific vehicle, and analytic models are used to attribute other orders back to the response source, in order to closely manage the effectiveness of our specific direct marketing efforts.
The majority of our new customers buy via our website. We consistently seek to refine our sales conversion funnel through thoughtful testing to improve the learning and buying experience for prospects and to increase conversion rates.
We also have an in-house call center. Staffing levels fluctuate seasonally and are aligned to marketing spend and consequent call volume. Sales agents, paid primarily on commission, take in-bound responses from our advertisements and personalize the weight loss plan for each customer. They also make out-bound calls to our leads.
|
|
· |
On-Boarding |
To help customers get off to a strong, successful and simple start, we provide both printed materials in initial shipments of food (including Expert Guides, a Quick-Start guide, a Grocery Guide, an Eating Out Guide and a Daily Food Tracker) and a robust set of personalized online tools and trackers.
|
|
· |
On-Program |
We use customer preferences to offer a variety of additional products and services that help customers while on the path to their weight loss goals. These offers are made via our website, emails and newsletters and our call center.
We also offer unlimited complementary counseling services for our customers with trained weight loss counselors, registered dietitians and certified diabetes educators. We seek to hire counselors with backgrounds in psychology, sociology, nutrition, dietetics or other health-related fields and with suitable, compassionate personalities to help and support our customers throughout their weight loss journey. Counselors are trained in our programs, motivational techniques and problem solving. Counselors take in-bound requests for help and also reach out to customers via email and phone.
7
As customers reach their weight loss goals, we offer transition and maintenance programs that provide products and guidance that combine the right amount of structure and flexibility. These programs are offered online, via email marketing and via our call center’s retention agents.
|
|
· |
Reactivation |
Because we realize that weight management is a lifelong process, and that customers may need our programs again from time to time, we reach out to past customers to attempt to put them back on structured programs if needed. We attract past customers primarily via our advertising vehicles, targeted emails and data-driven direct mail attempts.
|
|
· |
Customer Service |
We are committed to the highest levels of customer service and manage our customer relations through our in-house call center. Our representatives are trained to answer questions and solve problems once a purchase has been made. Customers contact us via email and phone. Typical inquiries concern delivery dates, reported missing or damaged items, and requests for credits or exchanges. For email inquiries, we have a software system that scans the customer’s email for key words and automatically supplies the representative with a response that is then reviewed, edited and sent to the customer. We regularly review customer satisfaction levels and improve our practices accordingly.
Supply Chain
An integrated order receipt, billing, picking, shipping and delivery tracking system comprised of proprietary and third-party components is utilized for our orders. This system integrates the front end, or website customer interface, with order processing and shipping, and allows customers to access shippers’ order tracking numbers online. Our computer-assisted picking system allows for virtually paperless order picking in all warehouse facilities.
We utilize an integrated network of distribution facilities through an existing arrangement with our outside fulfillment provider. We work closely with our fulfillment provider to drive out waste and continuously improve processes. We currently utilize five outsourced distribution facilities. Three are located in Pennsylvania (Allentown, Bethlehem and Chambersburg) and two in Nevada (both in Sparks). As of December 31, 2015, all fulfillment was being handled by one outsourced provider. In February 2016, we will have one additional outsourced distribution facility in Troy, Illinois with the same provider.
We have a service agreement with our outside fulfillment provider which provides for storage, handling of frozen and ready-to-go foods and other services, including pricing and minimum space commitments. The current contract expires in 2020 but may be terminated sooner upon 180 days written notice. We believe that other outside fulfillment providers could be utilized if needed and we continually evaluate the need for secondary fulfillment services.
We continue to partner with our fulfillment provider to reduce the warehouse order turn-around time for processing and shipping orders. In 2015, approximately, 97% of all customer initial orders were shipped within 3 business days of the date the order was received.
Direct customers are not charged for their orders until the ordered product is shipped. We do not charge customers for shipping and handling on any four-week meal plan. For customers who purchase an Auto-Delivery plan, we provide a discount off the full retail value of the four-week meal plan. If an Auto-Delivery customer cancels before receipt of a second shipment and after the 14 day money back guarantee period, the customer will be charged a cancellation fee.
Product Development
All of our foods and supplements are currently outsourced from more than 35 manufacturers or vendors. We have entered into supply agreements with several of these food vendors, some of which may provide for annual pricing, annual purchase obligations, exclusivity in the production of certain products, as well as certain rebates to us if certain volume thresholds are exceeded. These contracts have terms of five years or less and may be terminated by us upon written notice, generally between 30 and 180 days, or under certain circumstances only upon a default of the vendor. We anticipate meeting all annual purchase obligations.
In 2015, approximately 19% and 17% of inventory purchases were from two vendors. We have a supply agreement with one of these vendors that requires us to make certain minimum purchases. In 2014, these vendors supplied approximately 14% and 17% of inventory purchases and in 2013, approximately 12% and 14% of inventory purchases.
Our product development team uses a number of sources – customer feedback, market trends, nutrition science, national dietary guidelines and breakthroughs in food technology – to create new ideas for our program. New foods are created to enhance the variety
8
of our current offerings or to support the efforts of creating a new program. Typically, concepts are formulated in collaboration with our food manufacturers to meet our requirements for nutrition and stability. We then contract with these food manufacturers to produce these products based on our specifications. Alternatively, food manufacturers may suggest items. Regardless of a given food item’s pathway through development, that food is evaluated for nutrition, compliance with our program, taste, and cost considerations. The number of stock keeping units, or SKUs, we introduce each year varies depending on whether we are introducing a new program or simply updating an existing one.
Public Relations
We conduct a proactive public relations program that is designed to garner positive coverage of Nutrisystem and our weight management programs across all media platforms including television, magazine, print, online news, bloggers and social media, particularly around the key dieting seasons. In addition, the public relations team supports an executive communication program to broadly support the Nutrisystem brand.
Our Customers
We offer weight loss programs designed for women and men as well as people with Type 2 diabetes who want to lose weight and manage their diabetes. Based on our customer research, our typical customer is female, approximately 45-55 years of age. We believe that, on average, our customers want to lose more than 40 pounds over a period of time. Additionally, based on our customer research, we believe our typical customers tend to stay on our program for 11 to 12 weeks, lose an average of 1.0 to 2.0 pounds per week and have tried other popular diet programs. We believe that this research indicates our customers value the following Nutrisystem program attributes:
|
|
· |
effective weight loss; |
|
|
· |
convenient direct delivery to their door; |
|
|
· |
simple to follow and stay on program; |
|
|
· |
food can be easily prepared in minutes; |
|
|
· |
wide variety of food choices; and |
|
|
· |
they feel satisfied while on the program. |
Information Systems
Our ecommerce and community websites and our tools and trackers, all of which are based primarily on third-party software customized to meet our business needs, are each hosted in top tier hosting facilities. These facilities provide redundant network connections, physical and fire security and diesel generated power back up for the equipment upon which our websites rely and are intended to provide an uninterruptible power supply. Our servers and our network are monitored 24 hours a day, seven days a week.
We use a variety of security techniques to protect our confidential customer data. When our customers place an order or access their account information, we secure that transaction by using encryption technologies, including transport layer security, or TLS. Our customer data is protected against unauthorized access by security measures and we engage a variety of industry leading technology providers including VeriSign, CyberSource and SecureWorks to further ensure the security of our credit card transactions and the safety of our customers’ personal information.
Intellectual Property
We own numerous domestic and international trademarks and other proprietary rights that are important to our business. Depending upon the jurisdiction, trademarks are valid as long as they are used in the regular course of trade and/or their registrations are properly maintained. We believe the protection of our trademarks, copyrights, patents, domain names, trade dress, and trade secrets are important to our success. We aggressively protect our intellectual property rights by relying on a combination of watch services and trademark, copyright, patent, trade dress and trade secret laws, and through the domain name dispute resolution system.
Employees
As of December 31, 2015, we had 451 employees and consider our relations with these employees to be good.
9
Typically in the weight loss industry, revenue is greatest in the first calendar quarter and lowest in the fourth quarter. We believe our business experiences seasonality, driven primarily by the predisposition of dieters to initiate a diet at certain times of the year and the placement of our advertising, which is based on the price and availability of certain media at such times.
Available Information
All periodic and current reports, registration statements, code of conduct and other material that we are required to file with the SEC, including our annual report on Form 10-K, quarterly reports on Form10-Q, current reports on Form 8-K, and amendments to those reports filed or furnished pursuant to Section 13(a) of the Securities Exchange Act of 1934, as amended (the “Exchange Act”), are available free of charge through our investor relations page at www.nutrisystem.com. Such documents are available as soon as reasonably practicable after electronic filing of the material with the SEC. Our Internet website and the information contained therein or connected thereto are not intended to be incorporated into this Annual Report.
The public may also read and copy any materials filed by the Company with the SEC at the SEC’s Public Reference Room at 100 F Street, NE, Washington, DC 20549. The public may obtain information on the operation of the Public Reference Room by calling the SEC at 1-800-SEC-0330. The SEC maintains an Internet site, www.sec.gov, which contains reports, proxy and information statements, and other information regarding issuers that file such information electronically with the SEC.
Executive Officers of the Company
The Company’s current executive officers and their respective ages and positions are as follows:
|
Name |
|
Age |
|
Position |
|
Dawn M. Zier |
|
50 |
|
President and Chief Executive Officer |
|
|
|
|
|
|
|
Michael P. Monahan |
|
43 |
|
Executive Vice President and Chief Financial Officer |
|
|
|
|
|
|
|
Keira Krausz |
|
50 |
|
Executive Vice President and Chief Marketing Officer |
Dawn M. Zier has served as our President and Chief Executive Officer and as a member of our Board of Directors since November 2012. Before joining us, Ms. Zier served as the President of International at RDA Holding Co., the holding company and parent of The Reader's Digest Association, Inc., a global media and direct marketing company (the “Reader's Digest Association”), since April 2011 and as an Executive Vice President of the Reader's Digest Association since February 2011. From October 2009 to February 2011, Ms. Zier served as President, Europe of the Reader's Digest Association. In February 2013, RDA Holdings Co., the holding company and parent of the Reader’s Digest Association, filed voluntary petitions for reorganization relief pursuant to Chapter 11 of the United States Bankruptcy Code. Prior to serving in these roles, Ms. Zier served as the President of Global Consumer Marketing for the Reader's Digest Association from June 2008 to October 2009 and as the President and Chief Executive Officer of Direct Holdings U.S. Corp., a marketer of audio and video products and at such time a subsidiary of the Reader's Digest Association, from June 2009 to October 2009. From August 2005 to June 2008, Ms. Zier served as the President of North American Consumer Marketing for the Reader's Digest Association.
Michael P. Monahan has served as our Executive Vice President and Chief Financial Officer since May 2013. Prior to joining us, Mr. Monahan served as the Chief Financial Officer of PetroChoice Holdings, Inc., a privately-held distributor of industrial, commercial and passenger car lubricants since January 2009. From April 2006 through January 2009, Mr. Monahan served as our Vice President of Finance. Prior to that, Mr. Monahan held positions with Exelon Corporation, Accenture and Arthur Andersen LLP.
Keira Krausz has served as our Executive Vice President and Chief Marketing Officer since February 2013. Prior to joining us, Ms. Krausz served as head of new business development for Animated Storyboards, a global independent provider of television test spots to the advertising industry, from April 2012 to January 2013. Prior to that, Ms. Krausz served as Vice President of Marketing for QSP, Inc., a subsidiary of Time, Inc. from 2005 until March 2012 as QSP was sold. Ms. Krausz started her career at Reader's Digest Association in 1992, and held a number of progressively-responsible positions in product management, marketing, and business management, ultimately ascending to Vice President, Marketing and General Manager, of Reader's Digest Association’s Books & Music Business.
10
You should consider carefully the following risks and uncertainties when reading this Annual Report. If any of the events described below actually occurs, the Company’s business, financial condition and operating results could be materially adversely affected. You should understand that it is not possible to predict or identify all such risks and uncertainties. Consequently, you should not consider the following to be a complete discussion of all potential risks or uncertainties.
Our future growth and profitability will depend in large part upon the effectiveness and efficiency of our marketing expenditures and our ability to select effective markets and media in which to advertise.
Our marketing expenditures were $124.2 million, $107.7 million and $95.8 million in 2015, 2014 and 2013, respectively. Our future growth and profitability will depend in large part upon the effectiveness and efficiency of our marketing expenditures, including our ability to:
|
|
· |
create greater awareness of our brand and our program; |
|
|
· |
identify the most effective and efficient levels of spending in each market, media and specific media vehicle; |
|
|
· |
determine the appropriate creative messages and media mix for advertising, marketing and promotional expenditures; |
|
|
· |
effectively manage marketing costs (including creative and media) in order to maintain acceptable customer acquisition costs; |
|
|
· |
acquire cost-effective national television advertising; |
|
|
· |
select the most effective markets, media and specific media vehicles in which to advertise; and |
|
|
· |
convert consumer inquiries into actual orders. |
Our planned marketing expenditures may not result in increased revenue or generate sufficient levels of brand name and program awareness. We may not be able to manage our marketing expenditures on a cost-effective basis whereby our customer acquisition costs may exceed the contribution profit generated from each additional customer.
Our sales may be adversely impacted by the health and stability of the general economy.
Unfavorable changes in general economic conditions, such as a recession or prolonged economic slowdown, may reduce the demand for our products and otherwise adversely affect our sales. For example, economic forces, including general economic conditions, demographic trends, consumer confidence in the economy, changes in disposable consumer income and/or reductions in discretionary spending, may cause consumers to defer purchases of our program which could adversely affect our revenue, gross margins, and/or our overall financial condition and operating results.
We rely on third parties to provide us with adequate food supply, freight and fulfillment and Internet and networking services, the loss of any of which could cause our revenue, earnings or reputation to suffer.
Food Manufacturers and Other Suppliers. We rely solely on third-party manufacturers to supply all of the food, other products we sell and packaging materials. In 2015, approximately 19% and 17% of inventory purchases were from two vendors. If we are unable to obtain sufficient quantity, quality and variety of food, other products and packaging materials in a timely and low-cost manner from our manufacturers, we will be unable to fulfill our customers’ orders in a timely manner, which may cause us to lose revenue and market share or incur higher costs, as well as damage the value of the Nutrisystem brand.
Freight and Fulfillment. In 2015, more than 96% of our orders were shipped by one third-party provider and 100% of our order fulfillment was handled by one third-party provider. Should these providers be unable to service our needs for even a short duration, our revenue and business could be harmed. Additionally, the cost and time associated with replacing these providers on short notice would add to our costs. Any replacement fulfillment provider would also require startup time, which could cause us to lose sales and market share.
Internet and Networking. Our business also depends on a number of third parties for Internet access and networking, and we have limited control over these third parties. Should our network connections go down, our ability to fulfill orders would be delayed. Further, if our website or call center become unavailable for a noticeable period of time due to Internet or communication failures, our business could be adversely affected, including harm to our brand and loss of sales.
11
Therefore, we are dependent on maintaining good relationships with these third parties. The services we require from these parties may be disrupted by a number of factors associated with their businesses, including the following:
|
|
· |
labor disruptions; |
|
|
· |
delivery problems; |
|
|
· |
financial condition or results of operations; |
|
|
· |
internal inefficiencies; |
|
|
· |
equipment failure; |
|
|
· |
severe weather; |
|
|
· |
fire; |
|
|
· |
natural or man-made disasters; and |
|
|
· |
with respect to our food suppliers, shortages of ingredients or United States Department of Agriculture (“USDA”) or United States Food and Drug Administration (“FDA”) compliance issues. |
We may be subject to claims that our personnel are unqualified to provide proper weight loss advice.
We offer comprehensive individualized counseling options from registered dietitians, certified diabetes educators and weight loss counselors with varying levels of training. We may be subject to claims from our customers alleging that our personnel lack the qualifications necessary to provide proper advice regarding weight loss and related topics. We may also be subject to claims that our personnel have provided inappropriate advice or have inappropriately referred or failed to refer customers to health care providers for matters other than weight loss. Such claims could result in lawsuits, damage to our reputation and divert management’s attention from our business, which would adversely affect our business.
We may be subject to health or advertising related claims from our customers.
Our weight loss program does not include medical treatment or medical advice, and we do not engage physicians or nurses to monitor the progress of our customers. Many people who are overweight suffer from other physical conditions, and our target consumers could be considered a high-risk population. A customer who experiences health problems could allege or bring a lawsuit against us on the basis that those problems were caused or worsened by participating in our weight management program. For example, our predecessor businesses suffered substantial losses due to health-related claims and related publicity. Further, customers who allege that they were deceived by any statements that we made in advertising or labeling could bring a lawsuit against us under consumer protection laws. Currently, we are neither subject to any such allegations nor have we been named in any such litigation. If we were subject to any such claims, while we would defend ourselves against such claims, we may ultimately be unsuccessful in our defense. Also, defending ourselves against such claims, regardless of their merit and ultimate outcome, would likely be lengthy and costly, and adversely affect our results of operations. Further, our general liability insurance may not cover claims of these types.
The weight management industry is highly competitive. If any of our competitors or a new entrant into the market with significant resources pursues a weight management program similar to ours, our business could be significantly affected.
Competition is intense in the weight management industry and we must remain competitive in the areas of program efficacy, price, taste, customer service and brand recognition. Our competitors include companies selling pharmaceutical products and weight loss programs, digital tools and wearable trackers, as well as a wide variety of diet foods and meal replacement bars and shakes, appetite suppressants and nutritional supplements. Some of our competitors are significantly larger than we are and have substantially greater resources. Our business could be adversely affected if someone with significant resources decided to imitate our weight management program. For example, if a major supplier of pre-packaged foods decided to enter this market and made a substantial investment of resources in advertising and training diet counselors, our business could be significantly affected. Any increased competition from new entrants into our industry or any increased success by existing competition could result in reductions in our sales or prices, or both, which could have an adverse effect on our business and results of operations.
We are dependent on certain third-party agreements for a percentage of revenue.
We have contractual agreements with certain third-party retailers. Under the agreements, these third parties control when and how often our products and services are offered and we are not guaranteed any minimum level of sales or transactions. Additionally, some agreements contain exclusive rights in specified locations to promote our products during the contract term and for a specified period thereafter. If any third party elects not to renew their agreement with us or reduces the promotion of our products, our revenue will
12
suffer. In addition, our third-party retailers may decide to stop selling our products upon written notice, which may result in an increased level of reclamation claims as inventory held by the retailer is depleted. In the event any retailer terminates its relationship with us and the level of reclamation claims exceeds the estimated amount reserved on our balance sheet at the time of sale to the retailer, we will have to record an expense for the excess claims, which could adversely impact our results of operations and financial condition. Additionally, in certain instances, we could be prohibited from selling our products through competitors of these third parties for a specified time after the termination of the agreements.
New weight loss products or services may put us at a competitive disadvantage.
On an ongoing basis, many existing and potential providers of weight loss solutions, including many pharmaceutical firms with significantly greater financial and operating resources than we have, are developing new products and services. The creation of a weight loss solution, such as a drug therapy, that is perceived to be safe, effective and “easier” than a portion-controlled meal plan would put us at a disadvantage in the marketplace and our results of operations could be negatively affected.
We may be subject to litigation from our competitors.
Our competitors may pursue litigation against us based on our advertising or other marketing practices regardless of its merit and chances of success, especially if we engage in competitive advertising, which includes advertising that directly or indirectly mentions a competitor or a competitor’s weight loss program in comparison to our program. While we would defend ourselves against any such claims, our defense may ultimately be unsuccessful. Also, defending against such claims, regardless of their merit and ultimate outcome, may be lengthy and costly, strain our resources and divert management’s attention from their core responsibilities, which would have a negative impact on our business.
Our business is subject to online security risks, including security breaches and identity theft.
Unauthorized users who penetrate our information security could misappropriate proprietary or customer information or data or cause interruptions to the product offerings on our website. As a result, it may become necessary to expend significant additional amounts of capital and resources to protect against, or to alleviate, problems caused by unauthorized users. These expenditures, however, may not prove to be a timely remedy against unauthorized users who are able to penetrate our information security. In addition to purposeful security breaches, the inadvertent transmission of computer viruses could adversely affect our computer systems and, in turn, harm our business.
A significant number of states require that customers be notified if a security breach results in the disclosure of their personal financial account or other information. Additional states and governmental entities are considering such “notice” laws. In addition, other public disclosure laws may require that material security breaches be reported. If we experience a security breach and such notice or public disclosure is required in the future, our reputation and our business may be harmed.
In the ordinary course of our business, we collect and utilize proprietary and customer information and data. Privacy concerns among prospective and existing customers regarding our use of such information or data collected on our website or through our services and products, such as weight management information, financial data, email addresses and home addresses, could keep them from using our website or purchasing our services or products. We currently face certain legal obligations regarding the manner in which we treat such information and data. Businesses have been criticized by privacy groups and governmental bodies for their use and handling of such information and data. Currently, a significant number of our customers authorize us to bill their credit cards directly for fees charged by us. We rely on third-party software products to secure our credit card transactions. Although we have developed systems and processes that are designed to protect consumer information and prevent fraudulent payment transactions and other security breaches, failure to prevent or mitigate such fraud or breaches or changes in industry standards or regulations may adversely affect our business and operating results or cause us to lose our ability to accept credit cards as a form of payment and result in chargebacks of the fraudulently charged amounts. Furthermore, widespread credit card fraud may lessen our customers’ willingness to purchase our products on our website.
We may experience fluctuations in our operating results which may cause our stock price to be volatile.
We have experienced and expect to continue to experience fluctuations in our quarterly results of operations. Our business is seasonal, with revenue generally greatest in the first quarter and weaker in the fourth quarter. The market price of our common stock is subject to fluctuations in response to our operating results, general trends in the weight loss industry, announcements by our competitors, our ability to meet or exceed securities analysts’ expectations, recommendations by securities analysts, the condition of the financial markets and other factors. These fluctuations, as well as general economic and market conditions, may adversely affect the market price of our common stock and cause it to fluctuate significantly.
13
Acquisitions and the pursuit of new business opportunities present risks, and we may be unable to achieve the financial and strategic goals of any acquisition or new business.
A component of our growth strategy has been and may continue to be to acquire existing businesses or pursue other business opportunities in the market for weight management and fitness products and other complimentary products and services. On December 17, 2015, we acquired the South Beach Diet (“SBD”) brand for a cash payment of $15.0 million. These types of transactions will face a number of risks and uncertainties, including:
|
|
· |
difficulties in integrating newly acquired or newly started businesses into existing operations, which may result in increasing operating costs that would adversely affect our operating income and earnings; |
|
|
· |
the risk that our current and planned facilities, information systems, personnel and controls will not be adequate to support our future operations; |
|
|
· |
diversion of management time and capital resources from our existing businesses, which could adversely affect their performance and our operating results; |
|
|
· |
dependence on key management personnel of acquired or newly started businesses and the risk that we will be unable to integrate or retain such personnel; |
|
|
· |
the risk that the new products or services we may introduce or begin offering, whether as a result of internal expansion or business acquisitions, will not gain acceptance among consumers and existing customers; |
|
|
· |
the risk that new efforts may have a detrimental effect on our brand; |
|
|
· |
the risk that we will face competition from established or larger competitors in the new markets we may enter, which could adversely affect the financial performance of any businesses we might acquire or start; and |
|
|
· |
the risk that the anticipated benefits of any acquisition or of the commencement of any new business may not be realized, in which event we will not be able to achieve any return on our investment in that new business. |
Consummating these transactions could also result in the incurrence of additional debt and related interest expense, as well as unforeseen contingent liabilities, all of which could have a material adverse effect on our business, financial condition or results of operations. We may also issue additional equity in connection with these transactions, which would dilute our existing stockholders.
If we do not continue to receive referrals from existing customers, our customer acquisition cost may increase.
We rely on word-of-mouth advertising for a portion of our new customers. If our brand suffers or the number of customers acquired through referrals drops due to other circumstances, our costs associated with acquiring new customers and generating revenue will increase, which will, in turn, have an adverse effect on our profitability.
We use third-party marketing vendors to promote our products. If the spokespersons affiliated with the third-party marketing vendors suffer adverse publicity or elect to not renew, our revenue could be adversely affected.
Our marketing strategy depends in part on celebrity spokespersons, as well as customer spokespersons, to promote our weight management program. Any of these spokespersons may become the subject of adverse news reports, negative publicity or otherwise be alienated from a segment of our customer base, whether weight loss related or not. If so, such events may reduce the effectiveness of his or her endorsement and, in turn, adversely affect our revenue and results of operations. Additionally, if a spokesperson elects not to renew their agreement with us, our revenue may suffer.
Third parties may infringe on our brand, trademarks and other intellectual property rights, which may have an adverse impact on our business.
We currently rely on a combination of trademark and other intellectual property laws and confidentiality procedures to establish and protect our proprietary rights, including our brand. If we fail to successfully enforce our intellectual property rights, the value of our brand, services and products could be diminished and our business may suffer. Our precautions may not prevent misappropriation of our intellectual property. Any legal action that we may bring to protect our brand and other intellectual property could be unsuccessful and expensive and could divert management’s attention from other business concerns. In addition, legal standards relating to the validity, enforceability and scope of protection of intellectual property, especially in Internet-related businesses, are uncertain and evolving. We cannot assure you that these evolving legal standards will sufficiently protect our intellectual property rights in the future.
14
We may in the future be subject to intellectual property rights claims.
Third parties may in the future make claims against us alleging infringement of their intellectual property rights. Any intellectual property claims, regardless of merit, could be time-consuming and expensive to litigate or settle and could significantly divert management’s attention from other business concerns. In addition, if we were unable to successfully defend against such claims, we may have to pay damages, stop selling the service or product or stop using the software, technology or content found to be in violation of a third party’s rights, seek a license for the infringing service, product, software, technology or content or develop alternative non-infringing services, products, software, technology or content. If we cannot license on reasonable terms, develop alternatives or stop using the service, product, software, technology or content for any infringing aspects of our business, we may be forced to limit our service and product offerings. Any of these results could reduce our revenue and our ability to compete effectively, increase our costs or harm our business.
Our credit agreement contains financial and other covenants. The failure to comply with such covenants could have an adverse effect on us.
Our credit agreement contains certain financial and other covenants including a minimum consolidated fixed charge coverage ratio, if there are outstanding borrowings, and limitations on, among other things, liens, indebtedness, certain acquisitions, consolidations and sales of assets. There were no borrowings outstanding as of December 31, 2015. Any failure to comply with the restrictions of the credit agreement may result in an event of default under the agreement.
We are dependent on our key executive officers for future success. If we lose the services of any of our key executive officers and we are unable to timely retain a qualified replacement, our business could be harmed.
Our future success depends to a significant degree on the skills, experience and efforts of our key executive officers. The loss of the services of any of these individuals could harm our business. We have not obtained life insurance on any key executive officers. If any key executive officers left us or were seriously injured and became unable to work, our business could be harmed.
Provisions in our certificate of incorporation may deter or delay an acquisition of us or prevent a change in control, even if an acquisition or a change of control would be beneficial to our stockholders.
Provisions of our certificate of incorporation (as amended) may have the effect of deterring unsolicited takeovers or delaying or preventing a third party from acquiring control of us, even if our stockholders might otherwise receive a premium for their shares over then current market prices. In addition, these provisions may limit the ability of stockholders to approve transactions that they may deem to be in their best interests.
Our certificate of incorporation (as amended) permits our Board of Directors to issue preferred stock without stockholder approval upon such terms as the Board of Directors may determine. The rights of the holders of our common stock will be junior to, and may be adversely affected by, the rights of the holders of any preferred stock that may be issued in the future. The issuance of preferred stock could have the effect of making it more difficult for a third party to acquire, or of discouraging a third party from acquiring, a majority of our outstanding common stock. The issuance of a substantial number of preferred shares could adversely affect the price of our common stock.
Changes in consumer preferences could negatively impact our operating results.
Our program features frozen and ready-to-go food selections, which we believe offer convenience and value to our customers. Our continued success depends, to a large degree, upon the continued popularity of our program versus various other weight loss, weight management and fitness regimens, such as low carbohydrate diets, appetite suppressants and diets featured in the published media. Changes in consumer tastes and preferences away from our frozen or ready-to-go food and support and counseling services, and any failure to provide innovative responses to these changes, may have a materially adverse impact on our business, financial condition, operating results, cash flows and prospects.
Our success is also dependent on our food innovation including maintaining a robust array of food items and improving the quality of existing items. If we do not continually expand our food items or provide customers with items that are desirable in taste and quality, our business could be harmed.
The weight loss industry is subject to adverse publicity, which could harm our business.
The weight loss industry receives adverse publicity from time to time, and the occurrence of such publicity could harm us, even if the adverse publicity is not directly related to us. In the early 1990s, our predecessor businesses were subject to extremely damaging adverse publicity relating to a large number of lawsuits alleging that the Nutrisystem® weight loss program in use at that time led to
15
gall bladder disease. This publicity was a factor that contributed to the bankruptcy of our predecessor businesses in 1993. More recently, our predecessor businesses were severely impacted by significant litigation and damaging publicity related to their customers’ use of fen-phen as an appetite suppressant, which the FDA ordered withdrawn from the market in September 1997. The significant decline in business resulting from the fen-phen problems caused our predecessor businesses to close all of their company-owned weight loss centers.
Congressional hearings about practices in the weight loss industry have also resulted in adverse publicity and a consequent decline in the revenue of weight loss businesses. Future research reports or publicity that is perceived as unfavorable or that question certain weight loss programs, products or methods could result in a decline in our revenue. Because of our dependence on consumer perceptions, adverse publicity associated with illness or other undesirable effects resulting from the consumption of our products or similar products by competitors, whether or not accurate, could also damage customer confidence in our weight loss program and result in a decline in revenue. Adverse publicity could arise even if the unfavorable effects associated with weight loss products or services resulted from the user’s failure to use such products or services appropriately.
Our industry is subject to governmental regulation that could increase in severity and hurt results of operations.
Our industry is subject to federal, state and other governmental regulation. Certain federal and state agencies, such as the Federal Trade Commission (the “FTC”), regulate and enforce such laws relating to advertising, disclosures to consumers, privacy, consumer pricing and billing arrangements and other consumer protection matters. A determination by a federal or state agency, or a court, that any of our practices do not meet existing or new laws or regulations could result in liability, adverse publicity and restrictions of our business operations. Some advertising practices in the weight loss industry have led to investigations from time to time by the FTC and other governmental agencies. Many companies in the weight loss industry, including our predecessor businesses, have entered into consent decrees with the FTC relating to weight loss claims and other advertising practices. In October 2009, the FTC published its revised Guides concerning the Use of Endorsements and Testimonials in Advertising which now requires us to use a statement as to what the typical weight loss a customer can expect to achieve on our program when using a customer’s weight loss testimonial in advertising. Federal and state regulation of advertising practices generally, and in the weight loss industry in particular, may increase in scope or severity in the future, which could have a material adverse impact on our business.
Other aspects of our industry are also subject to government regulation. For example, the labeling and distribution of food products, including dietary supplements, are subject to strict USDA and FDA requirements and food manufacturers are subject to rigorous inspection and other requirements of the USDA and FDA, and companies operating in foreign markets must comply with those countries’ requirements for proper labeling, controls on hygiene, food preparation and other matters. If federal, state, local or foreign regulation of our industry increases for any reason, then we may be required to incur significant expenses, as well as modify our operations to comply with new regulatory requirements, which could harm our operating results. Additionally, remedies available in any potential administrative or regulatory actions may include product recalls and requiring us to refund amounts paid by all affected customers or pay other damages, which could be substantial.
Laws and regulations directly applicable to communications, operations or commerce over the Internet such as those governing intellectual property, privacy, libel and taxation, are more prevalent and remain unsettled. If we are required to comply with new laws or regulations or new interpretations of existing laws or regulations, or if we are unable to comply with these laws, regulations or interpretations, our business could be adversely affected.
Future laws or regulations, including laws or regulations affecting our marketing and advertising practices, relations with consumers, employees, service providers, or our services and products, may have an adverse impact on us.
The sale of ingested products involves product liability and other risks.
Like other distributors of products that are ingested, we face an inherent risk of exposure to product liability claims if the use of our products results in illness or injury. The foods that we resell in the U.S. are subject to laws and regulations, including those administered by the USDA and FDA that establish manufacturing practices and quality standards for food products. Product liability claims could have a material adverse effect on our business as existing insurance coverage may not be adequate. Distributors of weight loss food products, including dietary supplements, as well as our predecessor businesses, have been named as defendants in product liability lawsuits from time to time. The successful assertion or settlement of an uninsured claim, a significant number of insured claims or a claim exceeding the limits of our insurance coverage would harm us by adding costs to the business and by diverting the attention of senior management from the operation of the business. We may also be subject to claims that our products contain contaminants, are improperly labeled, include inadequate instructions as to use or inadequate warnings covering interactions with other substances. Product liability litigation, even if not meritorious, is very expensive and could also entail adverse publicity for us and reduce our revenue. In addition, the products we distribute, or certain components of those products, may be subject to product recalls or other deficiencies. Any negative publicity associated with these actions would adversely affect our brand and may result in decreased product sales and, as a result, lower revenue and profits.
16
None.
We currently lease one location in Fort Washington, Pennsylvania. This location totals 119,767 square feet of office space and our lease expires in 2022. Our fulfillment capacity is located in Chambersburg, Pennsylvania, Allentown, Pennsylvania, Bethlehem, Pennsylvania and Sparks, Nevada through an outsourced provider. In February 2016, we will have one additional outsourced distribution facility located in Troy, Illinois with the same provider. We have no lease obligations to any of our outsourced fulfillment providers; however, we are subject to minimum space commitments which we may reduce over a specified period of time. Management believes our outsourced fulfillment capacity is adequate to meet our needs for the foreseeable future.
Litigation
The Company is involved in various claims and routine litigation matters. In the opinion of management, after consultation with legal counsel, the outcomes of such matters are not anticipated to have a material adverse effect on the Company’s consolidated financial position, results of operations or cash flows in future years.
Not applicable.
17
|
ITEM 5. |
MARKET FOR REGISTRANT’S COMMON EQUITY, RELATED STOCKHOLDER MATTERS AND ISSUER PURCHASES OF EQUITY SECURITIES |
Market Information
The Company’s common stock trades on the NASDAQ Stock Market, under the symbol “NTRI.” The following table sets forth, for the periods indicated, the high and low sale prices for the Company’s common stock as reported on the NASDAQ Stock Market.
|
|
|
High |
|
|
Low |
|
||
|
2016 First Quarter (through February 19, 2016) |
|
$ |
21.86 |
|
|
$ |
17.25 |
|
|
|
|
|
|
|
|
|
|
|
|
2015 First Quarter |
|
$ |
21.47 |
|
|
$ |
16.86 |
|
|
2015 Second Quarter |
|
|
25.57 |
|
|
|
18.87 |
|
|
2015 Third Quarter |
|
|
32.05 |
|
|
|
23.48 |
|
|
2015 Fourth Quarter |
|
|
27.44 |
|
|
|
20.16 |
|
|
|
|
|
|
|
|
|
|
|
|
2014 First Quarter |
|
$ |
17.49 |
|
|
$ |
13.62 |
|
|
2014 Second Quarter |
|
|
17.70 |
|
|
|
13.76 |
|
|
2014 Third Quarter |
|
|
18.45 |
|
|
|
15.21 |
|
|
2014 Fourth Quarter |
|
|
19.97 |
|
|
|
14.88 |
|
Holders
As of February 19, 2016, the Company had approximately 234 record holders of its common stock.
Dividends
Prior to 2008, we had not declared or paid any dividend since inception. We have paid a quarterly dividend of $0.175 per share beginning with the second quarter of 2008. The declaration and payment of dividends in the future will be determined by our Board of Directors in light of conditions then existing, including our earnings, financial condition, capital requirements and other factors. See “Management’s Discussion and Analysis of Financial Condition and Results of Operations – Liquidity, Capital Resources and Other Financial Data.”
Securities Authorized for Issuance Under Equity Compensation Plans
The information under the heading “Securities Authorized for Issuance Under Equity Compensation Plans” will be filed in the Company’s definitive proxy statement for the 2016 annual meeting of stockholders and is incorporated herein by reference.
Issuer Purchases of Equity Securities
There were no reportable purchases during the quarter ended December 31, 2015, provided however that 2,705 shares of common stock, at an average purchase price of $22.72, were surrendered by employees to the Company during such quarter for the payment of the minimum tax liability withholding obligations upon the vesting of shares of restricted stock.
18
The following graph shows a comparison of cumulative total return since December 31, 2010, for our common stock, the Russell 2000 Index and the Dow Jones US Specialized Consumer Services Index (a published industry index), each of which assumes an initial value of $100 and reinvestment of dividends. Our common stock trades on the NASDAQ Stock Market under the ticker symbol NTRI.
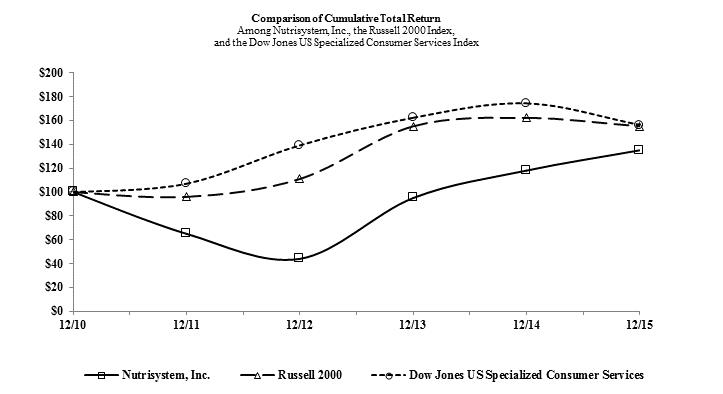
|
|
|
12/10 |
|
|
12/11 |
|
|
12/12 |
|
|
12/13 |
|
|
12/14 |
|
|
12/15 |
|
||||||
|
Nutrisystem, Inc. |
|
$ |
100 |
|
|
$ |
65 |
|
|
$ |
44 |
|
|
$ |
95 |
|
|
$ |
118 |
|
|
$ |
135 |
|
|
Russell 2000 Index |
|
|
100 |
|
|
|
96 |
|
|
|
111 |
|
|
|
155 |
|
|
|
162 |
|
|
|
155 |
|
|
Dow Jones US Specialized Consumer Services Index |
|
|
100 |
|
|
|
107 |
|
|
|
139 |
|
|
|
162 |
|
|
|
174 |
|
|
|
156 |
|
19
The selected consolidated financial data presented below has been derived from our Consolidated Financial Statements for each of the periods indicated. The data set forth below is qualified by reference to and should be read in conjunction with “Management’s Discussion and Analysis of Financial Condition and Results of Operations” and our Consolidated Financial Statements included as Items 7 and 8, respectively, in this Annual Report.
Selected Consolidated Financial Data
(In thousands, except per share data)
|
|
|
Year Ended December 31, |
|
|||||||||||||||||
|
|
|
2015 |
|
|
2014 |
|
|
2013 |
|
|
2012(d) |
|
|
2011 |
|
|||||
|
Statements of Operations Data: |
|
|
|
|
|
|
|
|
|
|
|
|
|
|
|
|
|
|
|
|
|
Revenue |
|
$ |
462,609 |
|
|
$ |
403,083 |
|
|
$ |
358,086 |
|
|
$ |
396,878 |
|
|
$ |
401,336 |
|
|
Costs and expenses: |
|
|
|
|
|
|
|
|
|
|
|
|
|
|
|
|
|
|
|
|
|
Cost of revenue |
|
|
224,581 |
|
|
|
199,053 |
|
|
|
184,210 |
|
(b) |
|
213,095 |
|
|
|
198,405 |
|
|
Marketing |
|
|
124,209 |
|
|
|
107,706 |
|
|
|
95,784 |
|
|
|
111,095 |
|
|
|
110,922 |
|
|
General and administrative |
|
|
64,651 |
|
(a) |
|
59,231 |
|
|
|
58,227 |
|
(c) |
|
66,332 |
|
|
|
60,812 |
|
|
Depreciation and amortization |
|
|
9,158 |
|
|
|
7,849 |
|
|
|
8,896 |
|
|
|
10,724 |
|
|
|
12,068 |
|
|
Operating income (loss) |
|
|
40,010 |
|
|
|
29,244 |
|
|
|
10,969 |
|
|
|
(4,368 |
) |
|
|
19,129 |
|
|
Other expense |
|
|
0 |
|
|
|
0 |
|
|
|
0 |
|
|
|
78 |
|
|
|
0 |
|
|
Interest expense, net |
|
|
169 |
|
|
|
142 |
|
|
|
89 |
|
|
|
2,034 |
|
|
|
468 |
|
|
Income tax expense (benefit) |
|
|
13,698 |
|
|
|
9,791 |
|
|
|
3,510 |
|
|
|
(3,675 |
) |
|
|
6,400 |
|
|
Net income (loss) |
|
$ |
26,143 |
|
|
$ |
19,311 |
|
|
$ |
7,370 |
|
|
$ |
(2,805 |
) |
|
$ |
12,261 |
|
|
Basic income (loss) per common share |
|
$ |
0.90 |
|
|
$ |
0.67 |
|
|
$ |
0.26 |
|
|
$ |
(0.10 |
) |
|
$ |
0.44 |
|
|
Diluted income (loss) per common share |
|
$ |
0.89 |
|
|
$ |
0.66 |
|
|
$ |
0.25 |
|
|
$ |
(0.10 |
) |
|
$ |
0.43 |
|
|
Weighted average shares outstanding: |
|
|
|
|
|
|
|
|
|
|
|
|
|
|
|
|
|
|
|
|
|
Basic |
|
|
28,695 |
|
|
|
28,323 |
|
|
|
28,013 |
|
|
|
27,499 |
|
|
|
27,033 |
|
|
Diluted |
|
|
29,175 |
|
|
|
28,787 |
|
|
|
28,287 |
|
|
|
27,499 |
|
|
|
27,325 |
|
|
Dividends declared per common share |
|
$ |
0.70 |
|
|
$ |
0.70 |
|
|
$ |
0.70 |
|
|
$ |
0.70 |
|
|
$ |
0.70 |
|
|
|
|
December 31, |
|
|||||||||||||||||
|
|
|
2015 |
|
|
2014 |
|
|
2013 |
|
|
2012 |
|
|
2011 |
|
|||||
|
Balance Sheet Data: |
|
|
|
|
|
|
|
|
|
|
|
|
|
|
|
|
|
|
|
|
|
Cash, cash equivalents and short term investments |
|
$ |
15,508 |
|
|
$ |
29,247 |
|
|
$ |
26,323 |
|
|
$ |
19,391 |
|
|
$ |
57,607 |
|
|
Working capital |
|
|
19,201 |
|
|
|
24,831 |
|
|
|
21,772 |
|
|
|
31,403 |
|
|
|
76,239 |
|
|
Total assets |
|
|
129,893 |
|
|
|
109,892 |
|
|
|
102,445 |
|
|
|
98,406 |
|
|
|
150,354 |
|
|
Borrowings under credit facility |
|
|
0 |
|
|
|
0 |
|
|
|
0 |
|
|
|
0 |
|
|
|
30,000 |
|
|
Non-current liabilities |
|
|
2,284 |
|
|
|
2,710 |
|
|
|
2,779 |
|
|
|
3,525 |
|
|
|
4,734 |
|
|
Stockholders' equity |
|
|
69,928 |
|
|
|
55,515 |
|
|
|
52,157 |
|
|
|
60,109 |
|
|
|
74,958 |
|
|
|
(a) |
On December 17, 2015, we acquired the SBD brand for a cash payment of $15,000. In connection with this acquisition, we incurred $2,498 in transaction costs which have been charged to expense in 2015. |
|
|
(b) |
In 2013, a charge of $5,000 was recorded to settle certain disputes that had arisen with a supplier over a legacy contract. |
|
|
(c) |
In 2013, we recorded $2,357 for severance, including $696 of non-cash expense related to the acceleration of previously awarded equity-based awards. |
|
|
(d) |
During 2012, we recorded $5,724 of severance in general and administrative expense, including $3,293 of non-cash expense related to the acceleration of previously awarded equity-based awards, for our former President and Chief Executive Officer’s cessation of employment. Additionally, we recorded an impairment charge of $2,100 related to advances paid to a frozen food supplier as the supplier was in default with its bank lender and negotiating a work out plan and a charge of $1,980 to vacate a facility. We also recorded a charge of $2,476 to restructure certain third party marketing vendor contracts and a charge of $1,079 to write off unamortized debt issuance costs. |
20
The following discussion should be read in conjunction with the financial information included elsewhere in this Annual Report.
Background
We provide weight management products and services, including nutritionally balanced weight loss programs, multi-day kits available at select retail locations and digital tools to support weight loss. The weight loss programs are designed for women and men. Additionally, our Nutrisystem® D® program is designed specifically to help people with Type 2 diabetes who want to lose weight and manage their diabetes. Our programs are based on more than 40 years of nutrition research. Our food is created to be nutritious, delicious and portioned for weight loss and management. Our pre-packaged foods are sold directly to weight loss program participants primarily through the Internet and telephone (including the redemption of prepaid program cards), referred to as the direct channel, through QVC, a television shopping network and select retailers.
Revenue consists primarily of food sales. For 2015, 2014 and 2013, the direct channel accounted for 90%, 91% and 92%, respectively, of revenue compared to 8%, 7% and 5%, respectively, for retail and 2%, 2% and 3%, respectively, for QVC. We incur significant marketing expenditures to support our brand as we continue to advertise across various media channels. New media channels are tested on a continual basis and we consider our media mix to be diverse. We market our weight management system through television, print, direct mail, Internet, public relations and social media. We review and analyze a number of key operating and financial metrics to manage our business, including the number of new customers, revenue per customer, total revenue, marketing per new customer, operating margins and reactivation revenue.
Our mix of revenue for the direct channel can be divided into three categories. First, new customer revenue is all revenue within a quarter from customers joining within that quarter. New customer revenue is the main driver of revenue growth. Second, on-program revenue is all revenue from customers who joined in previous quarters but who are still within their first nine months on the program. Third, reactivation revenue is all revenue generated from customers who are more than nine months from their initial purchase.
Our ecommerce, direct-to-consumer business model provides flexibility which allows us to manage marketing spend according to customer demand. We believe this flexibility is especially valuable as it allows us to react to changing market conditions relatively quickly. Additionally, we are continuously looking to make investments to improve lifetime customer economics, length of stay and overall customer satisfaction. We are able to test new commercials, offers and website configurations to allow us to be more responsive to customer needs and attempt to drive conversion.
We offer a customizable four-week program. In December 2015, we announced the launch of our Turbo10 program, a clinically tested program that could deliver up to a 10-pound weight loss and a reduction of five inches overall in the first month of dieting. Previously, we offered our Fast 5+ kit, a one-week starter kit that could help customers lose five pounds plus one inch off their waist in their first week of dieting. Customers are given a meal plan, access to trackers and tools via NuMi, educational digital content and exercise suggestions and are also encouraged to check in periodically with a Nutrisystem counselor as their needs change in response to weight loss.
Additionally, our multi-day weight loss kits are available at select retailers and represent a significant departure from our traditional four-week program. The retail channel provides us with great brand exposure, offering consumers who may not be aware of our program an opportunity to sample Nutrisystem at an attractive price point. Also, we continue to offer our program at Costco through the use of the prepaid program cards and gift cards. We are actively developing our retail product pipeline and have multiple kits and single items available for purchase.
We believe these new product and program innovations are resonating well with our customers. We provide an increasing diverse array of weight loss solutions for our customers through an effective and expanding portfolio of products. Our customers now have greater flexibility in choosing between ready-to-go and frozen options, with no restrictions. We had an effective acquisition marketing campaign with increased pricing and reduced promotional incentives which drove increases in customer activations, average selling price, length of stay and gross margins in 2015 as compared to 2014. Revenue for 2015 increased 15% from 2014 to $462.6 million. We have continued to attract more customers to our brand at our targeted marketing efficiency through the use of expanded media channels. Our revenue growth was attributable primarily to increases in new customers, on-program revenue, retail revenue and reactivation revenue. QVC revenue also increased in 2015 as compared to 2014. Reactivation revenue increased due to higher volumes building off of recent increases in customer counts and marketing efforts to former customers. Retail revenue growth was primarily from expanded product offerings and product placement.
On December 17, 2015, we acquired the SBD brand for a cash payment of $15.0 million. We will begin developing South Beach Diet meal programs, products and services as a distinct brand with the intent to launch in both the direct-to-consumer and retail channels in
21
2017. The acquisition will provide consumers with additional quality choices and enable us to capture an even more significant share of the commercial weight loss market as we further leverage our expertise in product development, marketing, ecommerce, supply chain logistics, and retail.
Critical Accounting Policies and Estimates
Our consolidated financial statements are prepared in accordance with U.S. generally accepted accounting principles. Our significant accounting policies are described in Note 2 of the consolidated financial statements included in Item 8.
The preparation of these financial statements requires management to make estimates and assumptions that affect the reported amounts of assets and liabilities, the disclosure of contingent assets and liabilities at the date of the financial statements and the reported amounts of revenue and expenses during the reporting period. Management develops, and changes periodically, these estimates and assumptions based on historical experience and on various other factors that are believed to be reasonable under the circumstances. Actual results may differ from these estimates under different assumptions or conditions. Management considers the following accounting estimates to be the most critical in preparing our consolidated financial statements. These critical accounting estimates are discussed with our audit committee quarterly.
Reserves for Returns. We review the reserves for customer returns at each reporting period and adjust them to reflect data available at that time. To estimate reserves for returns, we consider actual return rates in preceding periods and changes in product offerings or marketing methods that might impact returns going forward. To the extent the estimate of returns changes, we will adjust the reserve, which will impact the amount of revenue recognized in the period of the adjustment. The provision for estimated returns for the years ended December 31, 2015, 2014 and 2013 was $13.2 million, $12.7 million and $10.8 million, respectively. The reserve for estimated returns incurred but not received and processed was $870,000 and $762,000 at December 31, 2015 and 2014, respectively, and has been included in other accrued expenses and current liabilities in the accompanying consolidated balance sheets.
Excess and Obsolete Inventory. We continually assess the quantities of inventory on hand to identify excess or obsolete inventory and a provision is recorded for any estimated loss. We estimate the reserve for excess and obsolete inventory based primarily on our forecasted demand and/or our ability to sell the products, introduction of new products, future production requirements and changes in our customers’ behavior. The reserve for excess and obsolete inventory was $1.3 million and $460,000 at December 31, 2015 and 2014, respectively. The increase in the reserve was due to the change over to the 2016 product and packaging redesign and increased inventories.
Income Taxes. Deferred tax assets and liabilities are recognized for the future tax consequences attributable to differences between the financial statement carrying amounts of existing assets and liabilities and the respective tax bases and operating loss and tax credit carryforwards. Deferred tax assets are evaluated for future realization and reduced by a valuation allowance to the extent we believe a portion will not be realized. We consider many factors when assessing the likelihood of future realization of our deferred tax assets, including our recent earnings and expectations of future taxable income and other relevant factors. At December 31, 2014, we had a valuation allowance of $800,000 recorded against our deferred tax asset generated for charitable contributions. During the year ended December 31, 2015, we reduced the valuation allowance due to the expiration of certain charitable contribution carryovers. At December 31, 2015, there is no valuation allowance. We estimate the annual effective income tax rate at the beginning of each year and revise the estimate at each reporting period based on a number of factors including operating results, level of tax exempt interest income, charitable contributions and sales by state, among other items.
Results of Operations
Revenue and expenses consist of the following components:
Revenue. Revenue consists primarily of food sales. Food sales include sales of food, supplements, shipping and handling charges billed to customers and sales credits and adjustments, including product returns. Revenue from the retail programs is also net of any trade allowances, reclamation reserves or broker commissions. No revenue is recorded for food products provided at no charge as part of promotions.
Cost of Revenue. Cost of revenue consists primarily of the cost of the products sold, including compensation related to fulfillment, the costs of outside fulfillment, incoming and outgoing shipping costs, charge card fees and packing material. Cost of products sold includes products provided at no charge as part of promotions and the non-food materials provided with customer orders.
Marketing Expense. Marketing expense includes media, advertising production, marketing and promotional expenses and payroll-related expenses, including share-based payment arrangements, for personnel engaged in these activities. Internet advertising expense is recorded based on either the rate of delivery of a guaranteed number of impressions over the advertising contract term or on a cost per customer acquired, depending upon the terms. Direct-mail advertising costs are capitalized if the primary purpose was to elicit
22
sales to customers who could be shown to have responded specifically to the advertising and results in probable future economic benefits. The capitalized costs are amortized to expense over the period during which the future benefits are expected to be received. All other advertising costs are charged to expense as incurred or the first time the advertising takes place.
General and Administrative Expense. General and administrative expense consists of compensation for administrative, information technology, counselors, customer service and sales personnel, share-based payment arrangements for related employees, facility expenses, website development costs, professional service fees and other general corporate expenses.
Interest Expense, Net. Interest expense, net consists of interest expense and unused line fees on our revolving credit facility net of interest income earned on cash balances and short term investments.
Income Tax Expense. We are subject to corporate level income taxes and record income taxes based on an effective income tax rate for the year.
Overview of the Direct Channel
In 2015, 2014 and 2013, the direct channel represented 90%, 91% and 92%, respectively, of our revenue. Revenue through the direct channel was $415.8 million in 2015 compared to $365.1 million in 2014 and $327.8 million in 2013. Revenue is generated primarily through customer starts, reactivation of former customers and the customer ordering behavior, including length of time on our program and the diet program selection. The revenue increase in 2015 was attributable primarily to an increase in new customers, on-program revenue and reactivation revenue. Additionally, we had a higher average selling price in 2015 as compared 2014. Critical to increasing customer starts is our ability to deploy marketing dollars while maintaining marketing effectiveness. Factors influencing our marketing effectiveness include the quality of the advertisements, promotional activity by our competitors, as well as the price and availability of appropriate media.
Year Ended December 31, 2015 Compared to Year Ended December 31, 2014
|
|
|
Year Ended December 31, |
|
|||||||||||||
|
|
|
2015 |
|
|
2014 |
|
|
$ Change |
|
|
% Change |
|
||||
|
|
|
(in thousands) |
|
|||||||||||||
|
REVENUE |
|
$ |
462,609 |
|
|
$ |
403,083 |
|
|
$ |
59,526 |
|
|
|
15 |
% |
|
|
|
|
|
|
|
|
|
|
|
|
|
|
|
|
|
|
|
COSTS AND EXPENSES: |
|
|
|
|
|
|
|
|
|
|
|
|
|
|
|
|
|
Cost of revenue |
|
|
224,581 |
|
|
|
199,053 |
|
|
|
25,528 |
|
|
|
13 |
% |
|
Marketing |
|
|
124,209 |
|
|
|
107,706 |
|
|
|
16,503 |
|
|
|
15 |
% |
|
General and administrative |
|
|
64,651 |
|
|
|
59,231 |
|
|
|
5,420 |
|
|
|
9 |
% |
|
Depreciation and amortization |
|
|
9,158 |
|
|
|
7,849 |
|
|
|
1,309 |
|
|
|
17 |
% |
|
Total costs and expenses |
|
|
422,599 |
|
|
|
373,839 |
|
|
|
48,760 |
|
|
|
13 |
% |
|
Operating income |
|
|
40,010 |
|
|
|
29,244 |
|
|
|
10,766 |
|
|
|
37 |
% |
|
INTEREST EXPENSE, net |
|
|
169 |
|
|
|
142 |
|
|
|
27 |
|
|
|
19 |
% |
|
Income before income tax expense |
|
|
39,841 |
|
|
|
29,102 |
|
|
|
10,739 |
|
|
|
37 |
% |
|
INCOME TAX EXPENSE |
|
|
13,698 |
|
|
|
9,791 |
|
|
|
3,907 |
|
|
|
40 |
% |
|
Net income |
|
$ |
26,143 |
|
|
$ |
19,311 |
|
|
$ |
6,832 |
|
|
|
35 |
% |
|
|
|
|
|
|
|
|
|
|
|
|
|
|
|
|
|
|
|
% of revenue |
|
|
|
|
|
|
|
|
|
|
|
|
|
|
|
|
|
Gross margin |
|
|
51.5 |
% |
|
|
50.6 |
% |
|
|
|
|
|
|
|
|
|
Marketing |
|
|
26.8 |
% |
|
|
26.7 |
% |
|
|
|
|
|
|
|
|
|
General and administrative |
|
|
14.0 |
% |
|
|
14.7 |
% |
|
|
|
|
|
|
|
|
|
Operating income |
|
|
8.6 |
% |
|
|
7.3 |
% |
|
|
|
|
|
|
|
|
Revenue. Revenue increased to $462.6 million in 2015 from $403.1 million in 2014. The increase in revenue is primarily attributable to an increase in new customers, on-program revenue, retail revenue and reactivation revenue. Additionally, we had a higher average selling price in 2015 as compared to 2014. In 2015, direct revenue accounted for 90% of revenue compared to 8% for retail and 2% for QVC. In 2014, direct revenue accounted for 91% of revenue compared to 7% for retail and 2% for QVC.
Costs and Expenses. Cost of revenue increased to $224.6 million in 2015 from $199.1 million in 2014. Gross margin as a percent of revenue increased to 51.5% in 2015 from 50.6% in 2014. The increase in gross margin was attributable primarily to selling price
23
increases and the discontinuation of the promotional offer of a free week of food. These increases were partially offset by increased product costs due to the package redesign and a higher mix of lower margin products.
Marketing expense increased to $124.2 million in 2015 from $107.7 million in 2014. Marketing expense as a percent of revenue increased to 26.8% in 2015 from 26.7% in 2014. Substantially all of the marketing spending in 2015 promoted the direct business. The increase in marketing expense was attributable to increased spending for media ($15.3 million) primarily for short form television media and Internet advertising, public relations ($751,000), marketing consulting ($643,000) and marketing compensation and benefits ($402,000). These increases were slightly offset by decreased television production ($765,000). In total, media spending was $104.6 million in 2015 and $89.3 million in 2014.
General and administrative expense increased to $64.7 million in 2015 from $59.2 million in 2014 and as a percent of revenue decreased to 14.0% in 2015 from 14.7% in 2014. The increase in spending was attributable to transaction costs ($2.5 million) associated with the acquisition of the SBD brand in December 2015. Additionally, there was increased spending for program and product innovation ($1.8 million) and higher compensation and benefits ($845,000).
Depreciation and amortization expense increased to $9.2 million in 2015 from $7.8 million in 2014 due to increased capital expenditures for our website and digital tools.
Interest Expense, Net. Interest expense, net, was $169,000 in 2015 compared to $142,000 in 2014.
Income Tax Expense. In 2015, we recorded income tax expense of $13.7 million, which reflects an effective tax rate of 34.4%, as compared to $9.8 million in 2014 with an effective tax rate of 33.6%. The change in the effective income tax rate was due to the write-off of certain deferred tax assets and liabilities offset by increased levels of food donations.
Year Ended December 31, 2014 Compared to Year Ended December 31, 2013
|
|
|
Year Ended December 31, |
|
|||||||||||||
|
|
|
2014 |
|
|
2013 |
|
|
$ Change |
|
|
% Change |
|
||||
|
|
|
(in thousands) |
|
|||||||||||||
|
REVENUE |
|
$ |
403,083 |
|
|
$ |
358,086 |
|
|
$ |
44,997 |
|
|
|
13 |
% |
|
|
|
|
|
|
|
|
|
|
|
|
|
|
|
|
|
|
|
COSTS AND EXPENSES: |
|
|
|
|
|
|
|
|
|
|
|
|
|
|
|
|
|
Cost of revenue |
|
|
199,053 |
|
|
|
184,210 |
|
|
|
14,843 |
|
|
|
8 |
% |
|
Marketing |
|
|
107,706 |
|
|
|
95,784 |
|
|
|
11,922 |
|
|
|
12 |
% |
|
General and administrative |
|
|
59,231 |
|
|
|
58,227 |
|
|
|
1,004 |
|
|
|
2 |
% |
|
Depreciation and amortization |
|
|
7,849 |
|
|
|
8,896 |
|
|
|
(1,047 |
) |
|
|
(12 |
)% |
|
Total costs and expenses |
|
|
373,839 |
|
|
|
347,117 |
|
|
|
26,722 |
|
|
|
8 |
% |
|
Operating income |
|
|
29,244 |
|
|
|
10,969 |
|
|
|
18,275 |
|
|
|
167 |
% |
|
INTEREST EXPENSE, net |
|
|
142 |
|
|
|
89 |
|
|
|
53 |
|
|
|
60 |
% |
|
Income before income tax expense |
|
|
29,102 |
|
|
|
10,880 |
|
|
|
18,222 |
|
|
|
167 |
% |
|
INCOME TAX EXPENSE |
|
|
9,791 |
|
|
|
3,510 |
|
|
|
6,281 |
|
|
|
179 |
% |
|
Net income |
|
$ |
19,311 |
|
|
$ |
7,370 |
|
|
$ |
11,941 |
|
|
|
162 |
% |
|
|
|
|
|
|
|
|
|
|
|
|
|
|
|
|
|
|
|
% of revenue |
|
|
|
|
|
|
|
|
|
|
|
|
|
|
|
|
|
Gross margin |
|
|
50.6 |
% |
|
|
48.6 |
% |
|
|
|
|
|
|
|
|
|
Marketing |
|
|
26.7 |
% |
|
|
26.7 |
% |
|
|
|
|
|
|
|
|
|
General and administrative |
|
|
14.7 |
% |
|
|
16.3 |
% |
|
|
|
|
|
|
|
|
|
Operating income |
|
|
7.3 |
% |
|
|
3.1 |
% |
|
|
|
|
|
|
|
|
Revenue. Revenue increased to $403.1 million in 2014 from $358.1 million in 2013. The increase in revenue was attributable primarily to an increase in new customers, retail and on-program revenue that was slightly offset by decreased reactivation and QVC revenue. Additionally, we had a higher average selling price in 2014 as compared to 2013. In 2014, direct revenue accounted for 91% of revenue compared to 7% for retail and 2% for QVC. In 2013, direct revenue accounted for 92% of revenue compared to 5% for retail and 3% for QVC.
Costs and Expenses. Cost of revenue increased to $199.1 million in 2014 from $184.2 million in 2013. Gross margin as a percent of revenue increased to 50.6% in 2014 from 48.6% in 2013. The increase in gross margin was attributable primarily to selling price
24
increases partially offset by an increase in certain promotional items. Additionally, 2013 was negatively impacted by a $5.0 million charge recorded to settle certain disputes that had arisen with a supplier over a legacy contract.
Marketing expense increased to $107.7 million in 2014 from $95.8 million in 2013. Marketing expense as a percent of revenue was 26.7% in both 2014 and 2013. Substantially all of the marketing spending in 2014 promoted the direct business. The increase in marketing expense was attributable to increased spending for media ($11.9 million) and public relations ($368,000). Slightly offsetting these increases was a decrease in marketing consulting ($352,000). In total, media spending was $89.3 million in 2014 and $77.4 million in 2013.
General and administrative expense increased to $59.2 million in 2014 from $58.2 million in 2013 and as a percent of revenue decreased to 14.7% in 2014 from 16.3% in 2013. The increased spending was due to higher compensation and benefits ($1.3 million) reflecting increased call center commissions and labor costs for key initiatives and increased spending in miscellaneous taxes ($262,000). These increases were partially offset by decreased professional, outside and computer services expenses ($390,000), decreased new packaging expense ($274,000).
Depreciation and amortization expense decreased to $7.8 million in 2014 from $8.9 million in 2013 as certain fixed assets for our website and assets purchased when we relocated our corporate headquarters reached the end of their useful lives.
Interest Expense, Net. Interest expense, net, was $142,000 in 2014 compared to $89,000 in 2013.
Income Tax Expense. In 2014, we recorded income tax expense of $9.8 million, which reflects an effective tax rate of 33.6%, as compared to $3.5 million in 2013 with an effective tax rate of 32.3%. The change in the effective income tax rate was due to changes in executive compensation, decreased levels of food donations and the reduction in tax reserves during 2013 due to the lapse of the statute of limitations which offset a charge to record a valuation allowance for charitable contributions recorded in 2013.
Contractual Obligations and Commercial Commitments
As of December 31, 2015, our principal commitments consisted of obligations under supply agreements with food vendors, an agreement with our outside fulfillment provider, agreements with our internet and networking providers, operating leases and employment contracts. Although we have no material commitments for capital expenditures, we anticipate continuing requirements for capital expenditures.
Following is a summary of our contractual obligations.
|
|
|
Payments Due by Period (in millions) |
|
|||||||||||||||||
|
Contractual obligations |
|
Total |
|
|
Less Than 1 Year |
|
|
1-3 Years |
|
|
4-5 Years |
|
|
More Than 5 Years |
|
|||||
|
Purchase obligations |
|
$ |
43.6 |
|
|
$ |
15.5 |
|
|
$ |
27.7 |
|
|
$ |
0.4 |
|
|
$ |
0 |
|
|
Operating leases |
|
|
18.7 |
|
|
|
2.7 |
|
|
|
5.5 |
|
|
|
5.8 |
|
|
|
4.7 |
|
|
|
|
$ |
62.3 |
|
|
$ |
18.2 |
|
|
$ |
33.2 |
|
|
$ |
6.2 |
|
|
$ |
4.7 |
|
We have entered into supply agreements with several food vendors, some of which may provide for annual pricing, annual purchase obligations, exclusivity in the production of certain products, as well as certain rebates to us if certain volume thresholds are exceeded, with terms of five years or less. Purchase obligations may vary depending on product mix. We anticipate that we will meet all annual purchase obligations.
Off-Balance Sheet Arrangements
We have no off-balance sheet financing arrangements.
Liquidity, Capital Resources and Other Financial Data
At December 31, 2015, we had working capital of $19.2 million, a decrease of $5.6 million from the $24.8 million working capital balance at December 31, 2014. Cash and cash equivalents at December 31, 2015 were $6.2 million, a decrease of $6.4 million from the balance of $12.6 million at December 31, 2014. In addition, we had $9.3 million and $16.6 million invested in short term investments at December 31, 2015 and 2014, respectively. The decrease in cash, cash equivalents and short term investments was related primarily to the acquisition of SBD for a cash payment of $15.0 million in December 2015. Our principal sources of liquidity during 2015 were cash flows from operations.
25
On November 6, 2015, we entered into a $50.0 million unsecured revolving credit facility with a lender. The credit facility provides for interest on borrowings at either a base rate or the London Inter-Bank Offered Rate, in each case plus an applicable margin and is also subject to an unused fee payable quarterly. The credit facility contains financial and other covenants, including a minimum consolidated fixed charge coverage ratio, if there are outstanding borrowings, and limitations on, among other things, liens, indebtedness, certain acquisitions, consolidations and sales of assets. The credit facility can be drawn upon through November 6, 2020, at which time all amounts must be repaid. This credit facility amended and restated the previous credit agreement dated as of November 8, 2012, which matured on November 6, 2015. There were no borrowings outstanding at December 31, 2015 and 2014.
In 2015, we generated cash flow of $31.2 million from operating activities, a decrease of $1.6 million from 2014. The decrease in cash flow from operations was primarily attributable to net changes in operating assets and liabilities, including changes in income taxes, an increase in inventories due to increased demand and the package redesign and an increase in receivables due to increased retail revenue. These decreases in cash flow were offset by an increase in net income.
In 2015, net cash used in investing activities was $20.8 million primarily from the cash payment of $15.0 million for the acquisition of SBD and capital additions of $13.0 million offset by the net proceeds from short term investments of $7.2 million. We are continuing to invest in our ecommerce and web platform and facilities to incorporate new product initiatives and growth opportunities.
In 2015, net cash used in financing activities was $16.8 million primarily for the payment of dividends partially offset by increased proceeds from the exercise of stock options.
Our Board of Directors declared quarterly dividends of $0.175 per share, which were paid on March 23, 2015, May 21, 2015, August 20, 2015 and November 19, 2015. Subsequent to December 31, 2015, our Board of Directors declared a quarterly dividend of $0.175 per share payable on March 17, 2016 to stockholders of record as of March 7, 2016. Although we intend to continue to pay regular quarterly dividends, the declaration and payment of future dividends are discretionary and will be subject to quarterly determination by our Board of Directors following its review of our financial performance.
We believe that our available capital resources are sufficient to fund our working capital requirements, capital expenditures, income tax obligations and dividends for the foreseeable future.
Seasonality
Typically in the weight loss industry, revenue is greatest in the first calendar quarter and lowest in the fourth calendar quarter. We believe our business experiences seasonality, driven primarily by the predisposition of dieters to initiate a diet at certain times of the year and the placement of our advertising, which is based on the price and availability of certain media at such times.
We believe that we are not subject to any material risks arising from changes in foreign currency exchange rates, commodity prices, equity prices or other market changes that affect market risk instruments. Our cash and cash equivalents at December 31, 2015 of $6.2 million were maintained in bank and money market funds. Additionally, we invested $9.3 million in short term investments, which are classified as available-for-sale securities and are reported at fair value in the accompanying consolidated balance sheets. As such, a change in interest rates of 1 percentage point would not have a material impact on our operating results and cash flows.
The information required by this Item is set forth on pages 32 through 51 hereto.
None.
Disclosure Controls and Procedures
The SEC defines the term “disclosure controls and procedures” to mean a company’s controls and other procedures that are designed to ensure that information required to be disclosed in the reports that it files or submits under the Exchange Act is recorded, processed, summarized and reported, within the time periods specified in the SEC’s rules and forms. Based on the evaluation of the effectiveness of our disclosure controls and procedures by our management, with the participation of our Chief Executive Officer and our Chief
26
Financial Officer, as of the end of the period covered by this report, our Chief Executive Officer and our Chief Financial Officer have concluded that our disclosure controls and procedures at the end of the period covered by this report were effective to ensure that information required to be disclosed in the reports that we file or submit under the Exchange Act is (i) recorded, processed, summarized and reported, within the time periods specified in the Commission’s rules and forms, and (ii) accumulated and communicated to our management, including our Chief Executive Officer and Chief Financial Officer, as appropriate to allow timely decisions regarding disclosure.
Management’s Report on Internal Control Over Financial Reporting
Management is responsible for establishing and maintaining adequate internal control over the Company’s financial reporting. Internal control over financial reporting is a process designed to provide reasonable assurance regarding the reliability of the Company’s financial reporting and the preparation of consolidated financial statements for external purposes in accordance with generally accepted accounting principles. Internal control over financial reporting includes policies and procedures that: (i) pertain to maintaining records that, in reasonable detail, accurately and fairly reflect the transactions and dispositions of the assets of the Company; (ii) provide reasonable assurance that transactions are recorded as necessary for preparation of the Company’s financial statements in accordance with generally accepted accounting principles and that the receipts and expenditures of the Company are being made in accordance with management and board of director authorization; and (iii) provide reasonable assurance that unauthorized acquisition, use or disposition of the Company’s assets that could have a material effect on its financial statements would be prevented or detected on a timely basis.
Because of its inherent limitations, internal control over financial reporting may not prevent or detect misstatements. Also, projections of any evaluation of effectiveness to future periods are subject to the risk that controls may become inadequate because of changes in conditions, or that the degree of compliance with the policies or procedures may deteriorate.
There was no change in our internal control over financial reporting that occurred during the most recent fiscal quarter that has materially affected, or is reasonably likely to materially affect, our internal control over financial reporting.
Management evaluated the effectiveness of the Company’s internal control over financial reporting based on the framework in Internal Control – Integrated Framework (2013) issued by the Committee of Sponsoring Organizations of the Treadway Commission (COSO). Based upon that evaluation, management concluded that the Company’s internal control over financial reporting was effective as of December 31, 2015.
The Company’s independent registered public accounting firm, KPMG LLP, has audited the Company’s internal control over financial reporting as of December 31, 2015. Their report on the effectiveness of the Company’s internal control over financial reporting appears on page 28.
27
Report of Independent Registered Public Accounting Firm
The Board of Directors and Stockholders
Nutrisystem, Inc.:
We have audited Nutrisystem, Inc.’s internal control over financial reporting as of December 31, 2015, based on criteria established in Internal Control ‑ Integrated Framework (2013) issued by the Committee of Sponsoring Organizations of the Treadway Commission (COSO). Nutrisystem, Inc.'s management is responsible for maintaining effective internal control over financial reporting and for its assessment of the effectiveness of internal control over financial reporting, included in the accompanying Management’s Report on Internal Control Over Financial Reporting. Our responsibility is to express an opinion on the Company’s internal control over financial reporting based on our audit.
We conducted our audit in accordance with the standards of the Public Company Accounting Oversight Board (United States). Those standards require that we plan and perform the audit to obtain reasonable assurance about whether effective internal control over financial reporting was maintained in all material respects. Our audit included obtaining an understanding of internal control over financial reporting, assessing the risk that a material weakness exists, and testing and evaluating the design and operating effectiveness of internal control based on the assessed risk. Our audit also included performing such other procedures as we considered necessary in the circumstances. We believe that our audit provides a reasonable basis for our opinion.
A company's internal control over financial reporting is a process designed to provide reasonable assurance regarding the reliability of financial reporting and the preparation of financial statements for external purposes in accordance with generally accepted accounting principles. A company's internal control over financial reporting includes those policies and procedures that (1) pertain to the maintenance of records that, in reasonable detail, accurately and fairly reflect the transactions and dispositions of the assets of the company; (2) provide reasonable assurance that transactions are recorded as necessary to permit preparation of financial statements in accordance with generally accepted accounting principles, and that receipts and expenditures of the company are being made only in accordance with authorizations of management and directors of the company; and (3) provide reasonable assurance regarding prevention or timely detection of unauthorized acquisition, use, or disposition of the company’s assets that could have a material effect on the financial statements.
Because of its inherent limitations, internal control over financial reporting may not prevent or detect misstatements. Also, projections of any evaluation of effectiveness to future periods are subject to the risk that controls may become inadequate because of changes in conditions, or that the degree of compliance with the policies or procedures may deteriorate.
In our opinion, Nutrisystem, Inc. maintained, in all material respects, effective internal control over financial reporting as of December 31, 2015, based on criteria established in Internal Control ‑ Integrated Framework (2013) issued by the Committee of Sponsoring Organizations of the Treadway Commission.
We also have audited, in accordance with the standards of the Public Company Accounting Oversight Board (United States), the consolidated balance sheets of Nutrisystem, Inc. and subsidiaries as of December 31, 2015 and 2014, and the related consolidated statements of operations, comprehensive income, stockholders’ equity, and cash flows for each of the years in the three-year period ended December 31, 2015, and our report dated February 26, 2016 expressed an unqualified opinion on those consolidated financial statements.
/s/ KPMG LLP
Philadelphia, Pennsylvania
February 26, 2016
28
None.
29
The information concerning directors and compliance with Section 16(a) of the Exchange Act and our Code of Conduct that applies to our principal executive officer, principal financial officer, principal accounting officer or controller called for by Item 10 of Form 10-K will be set forth under the captions “Election of Directors,” “Section 16(a) Beneficial Ownership Reporting Compliance” and “Code of Conduct” in our definitive proxy statement for the 2016 annual meeting of stockholders, to be filed within 120 days after the end of the fiscal year covered by this annual report on Form 10-K, and is incorporated herein by reference.
The required information as to executive officers is set forth in Part I hereof.
The information required by Item 11 of Form 10-K is incorporated by reference to the information contained in our definitive proxy statement for the 2016 annual meeting of stockholders.
|
ITEM 12. |
SECURITY OWNERSHIP OF CERTAIN BENEFICIAL OWNERS AND MANAGEMENT AND RELATED STOCKHOLDER MATTERS |
The information required by Item 12 of Form 10-K is incorporated by reference to the information contained in our definitive proxy statement for the 2016 annual meeting of stockholders.
The information required by Item 13 of Form 10-K is incorporated by reference to the information contained in our definitive proxy statement for the 2016 annual meeting of stockholders.
The information required by Item 14 of Form 10-K is incorporated by reference to the information contained in our definitive proxy statement for the 2016 annual meeting of stockholders.
30
(a) 1. Financial Statements
See Index to the Consolidated Financial Statements on page 32 of this Annual Report.
2. Financial Statement Schedules
None, as all information required in these schedules is included in the Notes to the Consolidated Financial Statements.
3. Exhibits
Reference is made to the Exhibit Index on page 52 of this Annual Report for a list of exhibits required by Item 601 of Regulation S-K to be filed as part of this Annual Report.
31
NUTRISYSTEM, INC. AND SUBSIDIARIES
INDEX TO CONSOLIDATED FINANCIAL STATEMENTS
32
Report of Independent Registered Public Accounting Firm
The Board of Directors and Stockholders
Nutrisystem, Inc.:
We have audited the accompanying consolidated balance sheets of Nutrisystem, Inc. and subsidiaries (the Company) as of December 31, 2015 and 2014, and the related consolidated statements of operations, comprehensive income, stockholders’ equity, and cash flows for each of the years in the three-year period ended December 31, 2015. These consolidated financial statements are the responsibility of the Company’s management. Our responsibility is to express an opinion on these consolidated financial statements based on our audits.
We conducted our audits in accordance with the standards of the Public Company Accounting Oversight Board (United States). Those standards require that we plan and perform the audit to obtain reasonable assurance about whether the financial statements are free of material misstatement. An audit includes examining, on a test basis, evidence supporting the amounts and disclosures in the financial statements. An audit also includes assessing the accounting principles used and significant estimates made by management, as well as evaluating the overall financial statement presentation. We believe that our audits provide a reasonable basis for our opinion.
In our opinion, the consolidated financial statements referred to above present fairly, in all material respects, the financial position of Nutrisystem, Inc. and subsidiaries as of December 31, 2015 and 2014, and the results of their operations and their cash flows for each of the years in the three-year period ended December 31, 2015, in conformity with U.S. generally accepted accounting principles.
We also have audited, in accordance with the standards of the Public Company Accounting Oversight Board (United States), Nutrisystem, Inc.’s internal control over financial reporting as of December 31, 2015, based on criteria established in Internal Control - Integrated Framework (2013) issued by the Committee of Sponsoring Organizations of the Treadway Commission (COSO), and our report dated February 26, 2016 expressed an unqualified opinion on the effectiveness of the Company’s internal control over financial reporting.
/s/ KPMG LLP
Philadelphia, Pennsylvania
February 26, 2016
33
NUTRISYSTEM, INC. AND SUBSIDIARIES
(In thousands, except par value amounts)
|
|
|
December 31, |
|
|||||
|
|
|
2015 |
|
|
2014 |
|
||
|
ASSETS |
|
|
|
|
|
|
|
|
|
CURRENT ASSETS: |
|
|
|
|
|
|
|
|
|
Cash and cash equivalents |
|
$ |
6,191 |
|
|
$ |
12,620 |
|
|
Short term investments |
|
|
9,317 |
|
|
|
16,627 |
|
|
Receivables |
|
|
18,385 |
|
|
|
12,206 |
|
|
Inventories |
|
|
30,530 |
|
|
|
26,899 |
|
|
Prepaid income taxes |
|
|
1,149 |
|
|
|
0 |
|
|
Deferred income taxes |
|
|
1,192 |
|
|
|
1,051 |
|
|
Other current assets |
|
|
10,118 |
|
|
|
7,095 |
|
|
Total current assets |
|
|
76,882 |
|
|
|
76,498 |
|
|
FIXED ASSETS, net |
|
|
30,849 |
|
|
|
26,851 |
|
|
INTANGIBLE ASSETS |
|
|
15,084 |
|
|
|
84 |
|
|
DEFERRED INCOME TAXES |
|
|
6,107 |
|
|
|
5,461 |
|
|
OTHER ASSETS |
|
|
971 |
|
|
|
998 |
|
|
Total assets |
|
$ |
129,893 |
|
|
$ |
109,892 |
|
|
LIABILITIES AND STOCKHOLDERS’ EQUITY |
|
|
|
|
|
|
|
|
|
CURRENT LIABILITIES: |
|
|
|
|
|
|
|
|
|
Accounts payable |
|
$ |
38,381 |
|
|
$ |
34,261 |
|
|
Accrued payroll and related benefits |
|
|
7,556 |
|
|
|
6,550 |
|
|
Income taxes payable |
|
|
0 |
|
|
|
301 |
|
|
Deferred revenue |
|
|
5,618 |
|
|
|
4,424 |
|
|
Other accrued expenses and current liabilities |
|
|
6,126 |
|
|
|
6,131 |
|
|
Total current liabilities |
|
|
57,681 |
|
|
|
51,667 |
|
|
NON-CURRENT LIABILITIES |
|
|
2,284 |
|
|
|
2,710 |
|
|
Total liabilities |
|
|
59,965 |
|
|
|
54,377 |
|
|
COMMITMENTS AND CONTINGENCIES (Note 8) |
|
|
|
|
|
|
|
|
|
STOCKHOLDERS’ EQUITY: |
|
|
|
|
|
|
|
|
|
Preferred stock, $.001 par value (5,000 shares authorized, no shares issued and |
|
|
|
|
|
|
|
|
|
outstanding) |
|
|
0 |
|
|
|
0 |
|
|
Common stock, $.001 par value (100,000 shares authorized; shares issued – 29,621 at December 31, 2015 and 28,990 at December 31, 2014) |
|
|
29 |
|
|
|
29 |
|
|
Additional paid-in capital |
|
|
41,392 |
|
|
|
29,992 |
|
|
Treasury stock, at cost, 389 shares at December 31, 2015 and 249 shares at December 31, 2014 |
|
|
(5,672 |
) |
|
|
(3,062 |
) |
|
Retained earnings |
|
|
34,191 |
|
|
|
28,552 |
|
|
Accumulated other comprehensive (loss) income |
|
|
(12 |
) |
|
|
4 |
|
|
Total stockholders’ equity |
|
|
69,928 |
|
|
|
55,515 |
|
|
Total liabilities and stockholders’ equity |
|
$ |
129,893 |
|
|
$ |
109,892 |
|
The accompanying notes are an integral part of these consolidated financial statements.
34
NUTRISYSTEM, INC. AND SUBSIDIARIES
CONSOLIDATED STATEMENTS OF OPERATIONS
(In thousands, except per share amounts)
|
|
|
Year Ended December 31, |
|
|||||||||
|
|
|
2015 |
|
|
2014 |
|
|
2013 |
|
|||
|
REVENUE |
|
$ |
462,609 |
|
|
$ |
403,083 |
|
|
$ |
358,086 |
|
|
|
|
|
|
|
|
|
|
|
|
|
|
|
|
COSTS AND EXPENSES: |
|
|
|
|
|
|
|
|
|
|
|
|
|
Cost of revenue |
|
|
224,581 |
|
|
|
199,053 |
|
|
|
184,210 |
|
|
Marketing |
|
|
124,209 |
|
|
|
107,706 |
|
|
|
95,784 |
|
|
General and administrative |
|
|
64,651 |
|
|
|
59,231 |
|
|
|
58,227 |
|
|
Depreciation and amortization |
|
|
9,158 |
|
|
|
7,849 |
|
|
|
8,896 |
|
|
Total costs and expenses |
|
|
422,599 |
|
|
|
373,839 |
|
|
|
347,117 |
|
|
Operating income |
|
|
40,010 |
|
|
|
29,244 |
|
|
|
10,969 |
|
|
INTEREST EXPENSE, net |
|
|
169 |
|
|
|
142 |
|
|
|
89 |
|
|
Income before income tax expense |
|
|
39,841 |
|
|
|
29,102 |
|
|
|
10,880 |
|
|
INCOME TAX EXPENSE |
|
|
13,698 |
|
|
|
9,791 |
|
|
|
3,510 |
|
|
Net income |
|
$ |
26,143 |
|
|
$ |
19,311 |
|
|
$ |
7,370 |
|
|
BASIC INCOME PER COMMON SHARE |
|
$ |
0.90 |
|
|
$ |
0.67 |
|
|
$ |
0.26 |
|
|
DILUTED INCOME PER COMMON SHARE |
|
$ |
0.89 |
|
|
$ |
0.66 |
|
|
$ |
0.25 |
|
|
WEIGHTED AVERAGE SHARES OUTSTANDING: |
|
|
|
|
|
|
|
|
|
|
|
|
|
Basic |
|
|
28,695 |
|
|
|
28,323 |
|
|
|
28,013 |
|
|
Diluted |
|
|
29,175 |
|
|
|
28,787 |
|
|
|
28,287 |
|
|
DIVIDENDS DECLARED PER COMMON SHARE |
|
$ |
0.70 |
|
|
$ |
0.70 |
|
|
$ |
0.70 |
|
The accompanying notes are an integral part of these consolidated financial statements.
35
NUTRISYSTEM, INC. AND SUBSIDIARIES
CONSOLIDATED STATEMENTS OF COMPREHENSIVE INCOME
(In thousands)
|
|
|
Year Ended December 31, |
|
|||||||||
|
|
|
2015 |
|
|
2014 |
|
|
2013 |
|
|||
|
Net income |
|
$ |
26,143 |
|
|
$ |
19,311 |
|
|
$ |
7,370 |
|
|
OTHER COMPREHENSIVE (LOSS) INCOME: |
|
|
|
|
|
|
|
|
|
|
|
|
|
Short term investments: |
|
|
|
|
|
|
|
|
|
|
|
|
|
Unrealized (loss) gain on short term investments, net of income tax (benefit) expense of $(8), $(2) and $4, respectively |
|
|
(16 |
) |
|
|
(4 |
) |
|
|
8 |
|
|
Reclassification adjustments, net of income tax expense of $2 in 2013 |
|
|
0 |
|
|
|
0 |
|
|
|
4 |
|
|
Other comprehensive (loss) income, net of tax |
|
|
(16 |
) |
|
|
(4 |
) |
|
|
12 |
|
|
Comprehensive income |
|
$ |
26,127 |
|
|
$ |
19,307 |
|
|
$ |
7,382 |
|
The accompanying notes are an integral part of these consolidated financial statements.
36
NUTRISYSTEM, INC. AND SUBSIDIARIES
CONSOLIDATED STATEMENTS OF STOCKHOLDERS’ EQUITY
(In thousands)
|
|
|
Common Shares |
|
|
Common Stock |
|
|
Additional Paid-in Capital |
|
|
Treasury Stock |
|
|
Retained Earnings |
|
|
Accumulated Other Comprehensive (Loss) Income |
|
|
Total |
|
|||||||
|
BALANCE, January 1, 2013 |
|
|
28,632 |
|
|
$ |
29 |
|
|
$ |
18,466 |
|
|
$ |
(636 |
) |
|
$ |
42,254 |
|
|
$ |
(4 |
) |
|
$ |
60,109 |
|
|
Net income |
|
0 |
|
|
0 |
|
|
0 |
|
|
0 |
|
|
|
7,370 |
|
|
0 |
|
|
|
7,370 |
|
|||||
|
Share-based compensation expense |
|
233 |
|
|
0 |
|
|
|
5,832 |
|
|
0 |
|
|
0 |
|
|
0 |
|
|
|
5,832 |
|
|||||
|
Exercise of stock options |
|
1 |
|
|
0 |
|
|
0 |
|
|
0 |
|
|
0 |
|
|
0 |
|
|
0 |
|
|||||||
|
Equity compensation awards, net |
|
0 |
|
|
0 |
|
|
|
(203 |
) |
|
0 |
|
|
0 |
|
|
0 |
|
|
|
(203 |
) |
|||||
|
Cash dividends |
|
0 |
|
|
0 |
|
|
0 |
|
|
0 |
|
|
|
(20,013 |
) |
|
0 |
|
|
|
(20,013 |
) |
|||||
|
Employee tax withholdings related to the vesting of equity awards |
|
0 |
|
|
0 |
|
|
0 |
|
|
|
(950 |
) |
|
0 |
|
|
0 |
|
|
|
(950 |
) |
|||||
|
Other comprehensive income, net of tax |
|
0 |
|
|
0 |
|
|
0 |
|
|
0 |
|
|
0 |
|
|
12 |
|
|
|
12 |
|
||||||
|
BALANCE, December 31, 2013 |
|
|
28,866 |
|
|
29 |
|
|
|
24,095 |
|
|
|
(1,586 |
) |
|
|
29,611 |
|
|
8 |
|
|
|
52,157 |
|
||
|
Net income |
|
0 |
|
|
0 |
|
|
0 |
|
|
0 |
|
|
|
19,311 |
|
|
0 |
|
|
|
19,311 |
|
|||||
|
Share-based compensation expense |
|
92 |
|
|
0 |
|
|
|
5,651 |
|
|
0 |
|
|
0 |
|
|
0 |
|
|
|
5,651 |
|
|||||
|
Exercise of stock options |
|
32 |
|
|
0 |
|
|
314 |
|
|
0 |
|
|
0 |
|
|
0 |
|
|
314 |
|
|||||||
|
Equity compensation awards, net |
|
0 |
|
|
0 |
|
|
|
(68 |
) |
|
0 |
|
|
0 |
|
|
0 |
|
|
|
(68 |
) |
|||||
|
Cash dividends |
|
0 |
|
|
0 |
|
|
0 |
|
|
0 |
|
|
|
(20,370 |
) |
|
0 |
|
|
|
(20,370 |
) |
|||||
|
Employee tax withholdings related to the vesting of equity awards |
|
0 |
|
|
0 |
|
|
0 |
|
|
|
(1,476 |
) |
|
0 |
|
|
0 |
|
|
|
(1,476 |
) |
|||||
|
Other comprehensive loss, net of tax |
|
0 |
|
|
0 |
|
|
0 |
|
|
0 |
|
|
0 |
|
|
|
(4 |
) |
|
|
(4 |
) |
|||||
|
BALANCE, December 31, 2014 |
|
|
28,990 |
|
|
29 |
|
|
|
29,992 |
|
|
|
(3,062 |
) |
|
|
28,552 |
|
|
4 |
|
|
|
55,515 |
|
||
|
Net income |
|
0 |
|
|
0 |
|
|
0 |
|
|
0 |
|
|
|
26,143 |
|
|
0 |
|
|
|
26,143 |
|
|||||
|
Share-based compensation expense |
|
296 |
|
|
0 |
|
|
|
5,468 |
|
|
0 |
|
|
0 |
|
|
0 |
|
|
|
5,468 |
|
|||||
|
Exercise of stock options |
|
335 |
|
|
0 |
|
|
|
3,182 |
|
|
0 |
|
|
0 |
|
|
0 |
|
|
|
3,182 |
|
|||||
|
Equity compensation awards, net |
|
0 |
|
|
0 |
|
|
|
2,750 |
|
|
0 |
|
|
0 |
|
|
0 |
|
|
|
2,750 |
|
|||||
|
Cash dividends |
|
0 |
|
|
0 |
|
|
0 |
|
|
0 |
|
|
|
(20,504 |
) |
|
0 |
|
|
|
(20,504 |
) |
|||||
|
Employee tax withholdings related to the vesting of equity awards |
|
0 |
|
|
0 |
|
|
0 |
|
|
|
(2,610 |
) |
|
0 |
|
|
0 |
|
|
|
(2,610 |
) |
|||||
|
Other comprehensive loss, net of tax |
|
0 |
|
|
0 |
|
|
0 |
|
|
0 |
|
|
0 |
|
|
|
(16 |
) |
|
|
(16 |
) |
|||||
|
BALANCE, December 31, 2015 |
|
|
29,621 |
|
|
$ |
29 |
|
|
$ |
41,392 |
|
|
$ |
(5,672 |
) |
|
$ |
34,191 |
|
|
$ |
(12 |
) |
|
$ |
69,928 |
|
The accompanying notes are an integral part of these consolidated financial statements.
37
NUTRISYSTEM, INC. AND SUBSIDIARIES
CONSOLIDATED STATEMENTS OF CASH FLOWS
(In thousands)
|
|
|
Year Ended December 31, |
|
|||||||||
|
|
|
2015 |
|
|
2014 |
|
|
2013 |
|
|||
|
CASH FLOWS FROM OPERATING ACTIVITIES: |
|
|
|
|
|
|
|
|
|
|
|
|
|
Net income |
|
$ |
26,143 |
|
|
$ |
19,311 |
|
|
$ |
7,370 |
|
|
Adjustments to reconcile net income to net cash provided by operating activities: |
|
|
|
|
|
|
|
|
|
|
|
|
|
Depreciation and amortization |
|
|
9,158 |
|
|
|
7,849 |
|
|
|
8,896 |
|
|
Loss on disposal of fixed assets |
|
|
17 |
|
|
|
35 |
|
|
|
145 |
|
|
Share–based compensation expense |
|
|
5,468 |
|
|
|
5,651 |
|
|
|
5,832 |
|
|
Deferred income tax benefit |
|
|
(728 |
) |
|
|
(248 |
) |
|
|
(1,560 |
) |
|
Other non-cash charges |
|
|
67 |
|
|
|
22 |
|
|
|
48 |
|
|
Changes in operating assets and liabilities: |
|
|
|
|
|
|
|
|
|
|
|
|
|
Receivables |
|
|
(6,179 |
) |
|
|
(4,468 |
) |
|
|
749 |
|
|
Inventories |
|
|
(3,631 |
) |
|
|
(811 |
) |
|
|
(2,451 |
) |
|
Other assets |
|
|
(2,972 |
) |
|
|
(932 |
) |
|
|
1,192 |
|
|
Accounts payable |
|
|
4,336 |
|
|
|
4,688 |
|
|
|
6,018 |
|
|
Accrued payroll and related benefits |
|
|
1,006 |
|
|
|
(173 |
) |
|
|
5,397 |
|
|
Deferred revenue |
|
|
1,194 |
|
|
|
196 |
|
|
|
885 |
|
|
Income taxes |
|
|
(1,873 |
) |
|
|
3,051 |
|
|
|
2,316 |
|
|
Other accrued expenses and liabilities |
|
|
(834 |
) |
|
|
(1,364 |
) |
|
|
549 |
|
|
Net cash provided by operating activities |
|
|
31,172 |
|
|
|
32,807 |
|
|
|
35,386 |
|
|
CASH FLOWS FROM INVESTING ACTIVITIES: |
|
|
|
|
|
|
|
|
|
|
|
|
|
Purchases of short term investments |
|
|
(16,811 |
) |
|
|
(8,225 |
) |
|
|
(24,513 |
) |
|
Proceeds from sales of short term investments |
|
|
24,030 |
|
|
|
8,121 |
|
|
|
11,137 |
|
|
Capital additions |
|
|
(12,986 |
) |
|
|
(8,265 |
) |
|
|
(7,614 |
) |
|
Proceeds from the sale of fixed assets |
|
|
0 |
|
|
|
0 |
|
|
|
28 |
|
|
Cash paid for acquisition of a business |
|
|
(15,000 |
) |
|
|
0 |
|
|
|
0 |
|
|
Net cash used in investing activities |
|
|
(20,767 |
) |
|
|
(8,369 |
) |
|
|
(20,962 |
) |
|
CASH FLOWS FROM FINANCING ACTIVITIES: |
|
|
|
|
|
|
|
|
|
|
|
|
|
Exercise of stock options |
|
|
3,182 |
|
|
|
314 |
|
|
|
0 |
|
|
Taxes related to equity compensation awards, net |
|
|
512 |
|
|
|
(1,534 |
) |
|
|
(825 |
) |
|
Payment of dividends |
|
|
(20,504 |
) |
|
|
(20,370 |
) |
|
|
(20,013 |
) |
|
Debt issuance costs |
|
|
(24 |
) |
|
|
0 |
|
|
|
0 |
|
|
Net cash used in financing activities |
|
|
(16,834 |
) |
|
|
(21,590 |
) |
|
|
(20,838 |
) |
|
NET (DECREASE) INCREASE IN CASH AND CASH EQUIVALENTS |
|
|
(6,429 |
) |
|
|
2,848 |
|
|
|
(6,414 |
) |
|
CASH AND CASH EQUIVALENTS, beginning of year |
|
|
12,620 |
|
|
|
9,772 |
|
|
|
16,186 |
|
|
CASH AND CASH EQUIVALENTS, end of year |
|
$ |
6,191 |
|
|
$ |
12,620 |
|
|
$ |
9,772 |
|
The accompanying notes are an integral part of these consolidated financial statements.
38
NUTRISYSTEM, INC. AND SUBSIDIARIES
NOTES TO CONSOLIDATED FINANCIAL STATEMENTS
(In thousands, except per share amounts)
|
1. |
BACKGROUND |
Nature of the Business
Nutrisystem, Inc. (the “Company” or “Nutrisystem”) is a provider of weight management products and services, including nutritionally balanced weight loss programs, multi-day kits available at select retail locations and digital tools to support weight loss. The weight loss programs are designed for women and men. Additionally, the Nutrisystem® D® program is designed specifically to help people with Type 2 diabetes who want to lose weight and manage their diabetes. The Nutrisystem® programs are based on over 40 years of nutrition research. The Company’s pre-packaged foods are sold directly to weight loss program participants primarily through the Internet and telephone (including the redemption of prepaid program cards), referred to as the direct channel, through QVC, a television shopping network, and select retailers. Approximately 99% of revenue for each of the years ended December 31, 2015, 2014 and 2013 was generated in the United States.
|
2. |
SUMMARY OF SIGNIFICANT ACCOUNTING POLICIES |
Presentation of Financial Statements
The Company’s consolidated financial statements include 100% of the assets and liabilities of Nutrisystem, Inc. and its wholly-owned subsidiaries. All significant intercompany accounts and transactions have been eliminated.
Cash Equivalents and Short Term Investments
Cash equivalents include only securities having a maturity of three months or less at the time of purchase. At December 31, 2015 and 2014, demand accounts and money market funds comprised all of the Company’s cash and cash equivalents.
Short term investments consist of investments in government and agency securities and corporate debt securities with original maturities of greater than three months at the time of purchase. The Company classifies these investments as available-for-sale securities. These investments are reported at fair value with the related unrealized gains and losses included in accumulated other comprehensive (loss) income, a component of stockholders’ equity, net of related tax effects.
The Company evaluates its investments for other-than-temporary impairment by reviewing factors such as the length of time and extent to which fair value has been below cost basis and the Company’s ability and intent to hold the investment for a period of time which may be sufficient for anticipated recovery of the market value. There were no other-than-temporary impairments in 2015, 2014 or 2013.
Inventories
Inventories consist principally of packaged food held in outside fulfillment locations. Inventories are valued at the lower of cost or market, with cost determined using the first-in, first-out method. Quantities of inventory on hand are continually assessed to identify excess or obsolete inventory and a provision is recorded for any estimated loss. The reserve is estimated for excess and obsolete inventory based primarily on forecasted demand and/or the Company’s ability to sell the products, introduction of new products, future production requirements and changes in customers’ behavior. The reserve for excess and obsolete inventory was $1,253 and $460 at December 31, 2015 and 2014, respectively.
Fixed Assets
Fixed assets are stated at cost. Depreciation expense is calculated using the straight-line method over the estimated useful lives of the related assets, which are generally two to seven years. Leasehold improvements are amortized on a straight-line basis over the lesser of the estimated useful life of the asset or the related lease term. Expenditures for repairs and maintenance are charged to expense as incurred, while major renewals and improvements are capitalized.
39
Included in fixed assets is the capitalized cost of internal-use software and website development incurred during the application development stage. Capitalized costs are amortized using the straight-line method over the estimated useful life of the asset, which is generally two to five years. Costs incurred related to planning or maintenance of internal-use software and website development are charged to expense as incurred. The net book value of capitalized software was $15,022 and $13,162 at December 31, 2015 and December 31, 2014, respectively.
Intangible Assets
Intangible assets consist of a trade name from the acquisition of the South Beach Diet (“SBD”) brand in December 2015 and domain names (see Note 6). The trade name is presented at cost, net of accumulated amortization, and is amortized on a straight-line basis over its estimated useful life. The domain names have indefinite lives and are not being amortized but are reviewed for impairment.
Long-Lived Assets
The Company continually evaluates whether events or circumstances have occurred that would indicate that the remaining estimated useful lives of long-lived assets may warrant revision or that the remaining balance may not be recoverable. Long-lived assets are evaluated for indicators of impairment. When factors indicate that long-lived assets should be evaluated for possible impairment, an estimate of the related undiscounted cash flows over the remaining life of the long-lived assets is used to measure recoverability. If any impairment is indicated, measurement of the impairment will be based on the difference between the carrying value and fair value of the asset, generally determined based on the present value of expected future cash flows associated with the use of the asset. As of December 31, 2015, management believes that no reductions to the remaining useful lives or write-downs of long-lived assets are required.
Revenue Recognition
Revenue from direct to consumer product sales is recognized when the earnings process is complete, which is upon transfer of title to the product. Recognition of revenue upon shipment meets the revenue recognition criteria in that persuasive evidence of an arrangement exists, delivery has occurred, the selling price is fixed or determinable and collection is reasonably assured. The Company also sells prepaid program cards to wholesalers and retailers. Revenue from these cards is recognized after the card is redeemed online at the Company’s website or via telephone by the customer and the product is shipped to the customer. Revenue from the retail programs is recognized when the product is received at the seller’s location.
Deferred revenue consists primarily of unredeemed prepaid gift cards and unshipped food. When a customer orders the frozen program, two separate shipments are delivered. One contains Nutrisystem’s standard shelf-stable food and the second contains the frozen foods. Both shipments qualify as separate units of accounting and the fair value is based on estimated selling prices of both units.
Direct to consumer customers may return unopened shelf-stable products within 30 days of purchase in order to receive a refund or credit. Frozen products are non-returnable and they are non-refundable unless the order is canceled within 14 days of delivery. Estimated returns are accrued at the time the sale is recognized and actual returns are tracked monthly.
The Company reviews its history of actual versus estimated returns to ensure reserves are appropriate.
Revenue from product sales includes amounts billed for shipping and handling and is presented net of estimated returns and billed sales tax. Revenue from the retail programs is also net of any trade allowances, reclamation reserves or broker commissions. Revenue from shipping and handling charges was $2,561, $2,013 and $2,000 in 2015, 2014 and 2013, respectively. Shipping-related costs are included in cost of revenue in the accompanying consolidated statements of operations.
Dependence on Suppliers
In 2015, approximately 19% and 17% of inventory purchases were from two suppliers. The Company has a supply arrangement with one of these suppliers that requires the Company to make minimum purchases. In 2014, these suppliers provided approximately 14% and 17% of inventory purchases and in 2013, approximately 12% and 14% of inventory purchases (see Note 8). In 2013, a charge of $5,000 was recorded to settle certain disputes that had arisen with a supplier over a legacy contract. This charge is included in cost of revenue in the accompanying consolidated statements of operations.
The Company outsources 100% of its fulfillment operations to a third-party provider and more than 96% of its orders are shipped by one third-party provider.
40
One of the Company’s suppliers provides for rebates based on purchasing levels. The Company accounts for this rebate on an accrual basis as purchases are made at a rebate percentage determined based upon the estimated total purchases from the supplier. The estimated rebate is recorded as a receivable from the supplier with a corresponding reduction in the carrying value of purchased inventory and is reflected in the consolidated statements of operations when the associated inventory is sold. The rebate period is June 1 through May 31 of each year. For the years ended December 31, 2015, 2014 and 2013, the Company reduced cost of revenue by $698, $883 and $1,068 respectively, for these rebates. At December 31, 2015, no receivable was recorded but at December 31, 2014 $360 was recorded in receivables in the accompanying consolidated balance sheets. Effective June 1, 2015, the Company entered into a new agreement with the supplier that includes lower initial pricing and higher levels of purchases required to earn rebates resulting in the Company projecting as of December 31, 2015 that no rebate will be earned. Historically, the actual rebate received from the supplier has closely matched the estimated rebate recorded. An adjustment is made to the estimate upon determination of the final rebate.
Marketing Expense
Marketing expense includes media, advertising production, marketing and promotional expenses and payroll-related expenses, including share-based payment arrangements, for personnel engaged in these activities. Media expense was $104,621, $89,304 and $77,396 in 2015, 2014 and 2013, respectively. Direct-mail advertising costs are capitalized if the primary purpose was to elicit sales to customers who could be shown to have responded specifically to the direct mailing and results in probable future economic benefits. The capitalized costs are amortized to expense over the period during which the future benefits are expected to be received. Typically, this period falls within 40 days of the initial direct mailing. All other advertising costs are charged to expense as incurred or the first time the advertising takes place. At December 31, 2015 and 2014, $3,311 and $1,958, respectively, of costs have been prepaid for future advertisements and promotions.
Lease Related Expenses
Certain of the Company’s lease contracts contain rent holidays, various escalation clauses, or landlord/tenant incentives.
The Company records rental costs, including costs related to fixed rent escalation clauses and rent holidays, on a straight-line basis over the lease term. Lease allowances utilized for space improvement are recorded as leasehold improvement assets and amortized over the shorter of the economic useful life of the asset or the lease term. Tenant lease incentive allowances received are recorded as deferred rent and amortized as reductions to rent expense over the lease term. Included in the accompanying consolidated balance sheets is $2,266 of a tenant improvement allowance at December 31, 2015, of which $345 is included in other accrued expenses and current liabilities and $1,921 in non-current liabilities. At December 31, 2014, the tenant improvement allowance was $2,611, of which $345 was included in other accrued expenses and current liabilities and $2,266 in non-current liabilities.
Income Taxes
Deferred tax assets and liabilities are recognized for the future tax consequences attributable to differences between the financial statement carrying amounts of existing assets and liabilities and the respective tax bases and operating loss and tax credit carryforwards. Deferred tax assets and liabilities are measured using enacted tax rates expected to apply to taxable income in the years in which those temporary differences are expected to be recovered or settled. The effect on deferred tax assets and liabilities of a change in tax rates is recognized in the consolidated statements of operations in the period that includes the enactment date. In assessing the ability to realize deferred tax assets, the Company considers whether it is more likely than not that some portion or all of the deferred tax assets will not be realized.
A tax benefit from an uncertain tax position may be recognized only if it is “more likely than not” that the position is sustainable, based on its technical merits. The tax benefit of a qualifying position is the largest amount of tax benefit that is greater than 50% likely of being realized upon settlement with a taxing authority having full knowledge of all relevant information. The liability for unrecognized tax benefits is classified as noncurrent unless the liability is expected to be settled in cash within 12 months of the reporting date. The Company records accrued interest and penalties related to unrecognized tax benefits as part of interest expense, net.
Segment Information
The Company is managed and operated as one business. The entire business is managed by a single management team that reports to the chief executive officer. Revenue consists primarily of food sales.
41
The Company uses the two-class method to calculate earnings per share (“EPS”) as the unvested restricted stock issued under the Company’s equity incentive plans are participating shares with nonforfeitable rights to dividends. Under the two-class method, earnings per common share are computed by dividing the sum of distributed earnings to common stockholders and undistributed earnings allocated to common stockholders by the weighted average number of common shares outstanding for the period. In applying the two-class method, undistributed earnings are allocated to both common shares and participating securities based on the number of weighted average shares outstanding during the period. Undistributed losses are not allocated to unvested restricted stock as the restricted stockholders are not obligated to share in the losses. The following table sets forth the computation of basic and diluted EPS:
|
|
|
Year Ended December 31, |
|
|||||||||
|
|
|
2015 |
|
|
2014 |
|
|
2013 |
|
|||
|
Net income |
|
$ |
26,143 |
|
|
$ |
19,311 |
|
|
$ |
7,370 |
|
|
Net income allocated to unvested restricted stock |
|
|
(306 |
) |
|
|
(368 |
) |
|
|
(183 |
) |
|
Net income allocated to common shares |
|
$ |
25,837 |
|
|
$ |
18,943 |
|
|
$ |
7,187 |
|
|
Weighted average shares outstanding: |
|
|
|
|
|
|
|
|
|
|
|
|
|
Basic |
|
|
28,695 |
|
|
|
28,323 |
|
|
|
28,013 |
|
|
Effect of dilutive securities |
|
|
480 |
|
|
|
464 |
|
|
|
274 |
|
|
Diluted |
|
|
29,175 |
|
|
|
28,787 |
|
|
|
28,287 |
|
|
|
|
|
|
|
|
|
|
|
|
|
|
|
|
Basic income per common share |
|
$ |
0.90 |
|
|
$ |
0.67 |
|
|
$ |
0.26 |
|
|
Diluted income per common share |
|
$ |
0.89 |
|
|
$ |
0.66 |
|
|
$ |
0.25 |
|
In 2015, 2014 and 2013, common stock equivalents representing 229, 377 and 786 shares of common stock, respectively, were excluded from weighted average shares outstanding for diluted income per common share purposes because the effect would be anti-dilutive or the minimum performance requirements have not yet been met.
Share-Based Payment Awards
The cost of all share-based awards to employees and non-employees, including grants of stock options, restricted stock and restricted stock units, is recognized in the financial statements based on the fair value of the awards at grant date. The fair value of stock option awards is determined using the Black-Scholes valuation model on the date of grant. The fair value of restricted stock and performance-based restricted stock unit awards is equal to the market price of the Company’s common stock on the date of grant.
The fair value of share-based awards is recognized on a straight-line basis over the requisite service period, net of estimated forfeitures. The Company relies primarily upon historical experience to estimate expected forfeitures and recognizes compensation expense on a straight-line basis from the date of grant. The Company issues new shares upon exercise of stock options, granting of restricted stock or vesting of restricted stock units.
Cash Flow Information
The Company made payments for income taxes of $13,508, $7,118 and $2,842 in 2015, 2014, and 2013, respectively. Interest payments in 2015, 2014 and 2013 were $182, $168 and $116, respectively. During 2015, 2014 and 2013, the Company had non-cash capital additions of $670, $483 and $42, respectively, of unpaid invoices in accounts payable and other accrued expenses and current liabilities.
Recently Issued Accounting Pronouncements
In May 2014, the Financial Accounting Standards Board (“FASB”) issued Accounting Standards Update (“ASU”) No. 2014-09, “Revenue from Contracts with Customers,” (“ASU 2014-09”). ASU 2014-09 outlines a new, single comprehensive model for entities to use in accounting for revenue arising from contracts with customers and supersedes most current revenue recognition guidance, including industry-specific guidance. This new revenue recognition model provides a five-step analysis in determining when and how revenue is recognized. The new model will require an entity to recognize revenue when it transfers promised goods or services to customers in an amount that reflects what it expects in exchange for the goods or services. It also requires more detailed disclosures to enable users of financial statements to understand the nature, amount, timing and uncertainty of revenue and cash flows arising from contracts with customers. This guidance is effective for annual periods beginning on or after December 15, 2017, including interim reporting periods within that reporting period and should be applied retrospectively to each prior reporting period presented or retrospectively with the cumulative effect of initially applying the ASU recognized at the date of initial application. The
42
Company is currently assessing the impact that adopting this new accounting standard will have on the consolidated financial statements and footnote disclosures.
In April 2015, the FASB issued ASU No. 2015-05, “Customer’s Accounting for Fees Paid in a Cloud Computing Arrangement,” to provide guidance to customers about whether a cloud computing arrangement includes a software license. If a cloud computing arrangement includes a software license, then the customer should account for the software license element of the arrangement consistent with the acquisition of other software licenses. If a cloud computing arrangement does not include a software license, the customer should account for the arrangement as a service contract. The new standard is effective for annual periods beginning after December 15, 2015, and interim periods within those annual periods. Early adoption is permitted. The Company is currently assessing the impact that adopting this new accounting standard will have on its consolidated financial statements and footnote disclosures.
In July 2015, the FASB issued ASU No. 2015-11, “Simplifying the Measurement of Inventory.” An entity using an inventory method other than last-in, first out or the retail inventory method should measure inventory at the lower of cost and net realizable value. The new guidance clarifies that net realizable value is the estimated selling prices in the ordinary course of business, less reasonably predictable costs of completion, disposal and transportation. This guidance is effective for annual periods beginning after December 15, 2016, including interim reporting periods within that reporting period. The Company is currently assessing the impact that adopting this new accounting standard will have on its consolidated financial statements and footnote disclosures.
In November 2015, the FASB issued ASU No. 2015-17, “Balance Sheet Classification of Deferred Taxes,” which eliminates the current requirement to present deferred tax assets and liabilities as current and noncurrent amounts in a classified statement of financial position. Instead, entities will be required to classify all deferred tax assets and liabilities as noncurrent in a statement of financial position. This standard is effective for financial statements issued for annual periods beginning after December 15, 2016, and interim periods within those annual periods. Early application is permitted. The Company does not expect this new accounting standard to have a material impact of its consolidated financial statements and footnote disclosures.
Use of Estimates
The preparation of financial statements in accordance with U.S. generally accepted accounting principles requires management to make estimates and assumptions that affect the reported amounts of assets and liabilities at the date of the financial statements and the reported amounts of revenue and operating expenses during the reporting period. Actual results could differ from these estimates.
|
3. |
CASH, CASH EQUIVALENTS AND SHORT TERM INVESTMENTS |
At December 31, 2015, cash, cash equivalents and short term investments consisted of the following:
|
|
|
|
|
|
|
Gross |
|
|
Gross |
|
|
|
|
|
||
|
|
|
|
|
|
|
Unrealized |
|
|
Unrealized |
|
|
Estimated |
|
|||
|
|
|
Cost |
|
|
Gains |
|
|
Losses |
|
|
Fair Value |
|
||||
|
Cash |
|
$ |
5,890 |
|
|
$ |
0 |
|
|
$ |
0 |
|
|
$ |
5,890 |
|
|
Money market funds |
|
|
301 |
|
|
|
0 |
|
|
|
0 |
|
|
|
301 |
|
|
Government and agency securities |
|
|
6,233 |
|
|
|
14 |
|
|
|
(30 |
) |
|
|
6,217 |
|
|
Corporate debt securities |
|
|
3,102 |
|
|
|
10 |
|
|
|
(12 |
) |
|
|
3,100 |
|
|
|
|
$ |
15,526 |
|
|
$ |
24 |
|
|
$ |
(42 |
) |
|
$ |
15,508 |
|
At December 31, 2014, cash, cash equivalents and short term investments consisted of the following:
|
|
|
|
|
|
|
Gross |
|
|
Gross |
|
|
|
|
|
||
|
|
|
|
|
|
|
Unrealized |
|
|
Unrealized |
|
|
Estimated |
|
|||
|
|
|
Cost |
|
|
Gains |
|
|
Losses |
|
|
Fair Value |
|
||||
|
Cash |
|
$ |
12,471 |
|
|
$ |
0 |
|
|
$ |
0 |
|
|
$ |
12,471 |
|
|
Money market funds |
|
|
149 |
|
|
|
0 |
|
|
|
0 |
|
|
|
149 |
|
|
Government and agency securities |
|
|
9,912 |
|
|
|
31 |
|
|
|
(8 |
) |
|
|
9,935 |
|
|
Corporate debt securities |
|
|
6,709 |
|
|
|
25 |
|
|
|
(42 |
) |
|
|
6,692 |
|
|
|
|
$ |
29,241 |
|
|
$ |
56 |
|
|
$ |
(50 |
) |
|
$ |
29,247 |
|
43
A three-tier fair value hierarchy has been established by the FASB to prioritize the inputs used in measuring fair value. These tiers are as follows:
Level 1—Valuations based on quoted prices for identical assets and liabilities in active markets.
Level 2—Valuations based on observable inputs other than quoted prices included in Level 1, such as quoted prices for similar assets and liabilities in active markets, quoted prices for identical or similar assets and liabilities in markets that are not active, or other inputs that are observable or can be corroborated by observable market data.
Level 3—Valuations based on unobservable inputs reflecting the Company’s own assumptions, consistent with reasonably available assumptions made by other market participants. These valuations require significant judgment.
The fair values of the Company’s Level 1 instruments are based on quoted prices in active exchange markets for identical assets. The Company had no Level 2 or 3 instruments at December 31, 2015 and 2014.
The following table summarizes the Company’s financial assets measured at fair value at December 31, 2015:
|
|
|
Total Fair Value |
|
|
Quoted Prices in Active Markets for Identical Assets (Level 1) |
|
||
|
Money market funds |
|
$ |
301 |
|
|
$ |
301 |
|
|
Government and agency securities |
|
|
6,217 |
|
|
|
6,217 |
|
|
Corporate debt securities |
|
|
3,100 |
|
|
|
3,100 |
|
|
Total assets |
|
$ |
9,618 |
|
|
$ |
9,618 |
|
The following table summarizes the Company’s financial assets measured at fair value at December 31, 2014:
|
|
|
Total Fair Value |
|
|
Quoted Prices in Active Markets for Identical Assets (Level 1) |
|
||
|
Money market funds |
|
$ |
149 |
|
|
$ |
149 |
|
|
Government and agency securities |
|
|
9,935 |
|
|
|
9,935 |
|
|
Corporate debt securities |
|
|
6,692 |
|
|
|
6,692 |
|
|
Total assets |
|
$ |
16,776 |
|
|
$ |
16,776 |
|
|
5. |
FIXED ASSETS |
Fixed assets consist of the following:
|
|
|
December 31, |
|
|||||
|
|
|
2015 |
|
|
2014 |
|
||
|
Furniture and fixtures |
|
$ |
5,701 |
|
|
$ |
5,673 |
|
|
Computer hardware and software |
|
|
68,387 |
|
|
|
59,035 |
|
|
Equipment |
|
|
3,326 |
|
|
|
2,621 |
|
|
Leasehold improvements |
|
|
11,367 |
|
|
|
11,357 |
|
|
|
|
|
88,781 |
|
|
|
78,686 |
|
|
Accumulated depreciation |
|
|
(57,932 |
) |
|
|
(51,835 |
) |
|
|
|
$ |
30,849 |
|
|
$ |
26,851 |
|
Depreciation and amortization expense was $9,158, $7,849 and $8,896 in 2015, 2014 and 2013, respectively.
6. INTANGIBLE ASSETS
On December 17, 2015, the Company acquired the SBD brand for a cash payment of $15,000. The acquisition was financed with existing cash.
44
The Company will begin developing South Beach Diet meal programs, products, and services as a distinct brand with the intent to launch in both the direct-to-consumer and retail channels in 2017. The acquisition will provide consumers with additional quality choices and enable the Company to capture an even more significant share of the commercial weight loss market as it further leverages its expertise in product development, marketing, ecommerce, supply chain logistics and retail.
The preliminary allocation of the purchase price is to the SBD trade name and is expected to be amortized on a straight-line basis over a period of 15 years. The approximate fair value of the trade name is based on preliminary estimates and assumptions. The fair value measurement method used to measure the assets acquired utilizes a number of significant unobservable inputs or Level 3 assumptions. These assumptions include, among others, projections of the acquired businesses future operating results, the implied fair value of assets using an income approach by preparing a discounted cash flow analysis and other subjective assumptions. These preliminary estimates and assumptions could change during the purchase price measurement period as the Company finalizes the valuation of the asset acquired.
No amortization expense was recorded for 2015. Estimated amortization expense for identifiable intangible assets for the next five years is expected to be as follows:
|
2016 |
$ 1,000 |
|
2017 |
1,000 |
|
2018 |
1,000 |
|
2019 |
1,000 |
|
2020 |
1,000 |
The acquisition was accounted for under the acquisition method of accounting. During 2015, SBD did not contribute to the operations of the Company as the product offering will be developed over the next year. The Company incurred $2,498 in transaction costs associated with the acquisition of SBD, which have been charged to expense in 2015.
Additionally, the Company had $84 of domain names acquired in previous years with indefinite lives that are not being amortized.
|
7. |
CREDIT FACILITY |
On November 6, 2015, the Company entered into an Amended and Restated Credit Agreement that provides for a $50,000 unsecured revolving credit facility (the “Credit Facility”) with a lender. The Credit Facility can be drawn upon through November 6, 2020, at which time all amounts must be repaid. There were no borrowings outstanding at December 31, 2015. The Credit Facility amended and restated the previous credit agreement dated as of November 8, 2012, which matured on November 6, 2015. There were no borrowings outstanding at December 31, 2014 under the previous credit agreement.
The Credit Facility provides for interest at either a base rate or a LIBOR rate, in each case plus an applicable margin. The base rate will be the highest of (i) the Administrative Agent’s prime rate, (ii) 0.50% above the Federal Funds Rate and (iii) the LIBOR rate for deposits in dollars for a one-month interest period as determined three business days prior to such date, plus 1.50%. The LIBOR rate is equal to the London Inter-Bank Offered Rate for the relevant term. The applicable margin is subject to adjustment based on the Company’s consolidated fixed charge coverage ratio and ranges from 0.00-0.50% per year for base rate loans and from 1.25-1.75% per year for LIBOR rate loans. The Company will also pay an unused line fee. The unused line fee is 0.25% of the total available credit. The Company incurred no interest expense during 2015, 2014 and 2013. During 2015, 2014 and 2013, the Company incurred $118, $135 and $140 in an unused line fee, respectively, under the Credit Facility and prior financing arrangements. Interest payments and unused line fees are classified within interest expense, net in the accompanying consolidated statements of operations.
The Credit Facility contains financial and other covenants including a minimum consolidated fixed charge coverage ratio, if there are outstanding borrowings and limitations on, among other things, liens, indebtedness, certain acquisitions, consolidations and sales of assets. As of December 31, 2015, the Company was in compliance with all covenants contained in the Credit Facility.
At December 31, 2015, the Company had $23 of unamortized debt issuance costs associated with the Credit Facility that are being amortized over its remaining term.
|
8. |
COMMITMENTS AND CONTINGENCIES |
Operating Leases
The Company leases its corporate headquarters and certain equipment. These leases generally have initial terms of one to 12 years and have renewal options for additional periods. Certain of the leases also contain escalation clauses based upon increases in costs related
45
to the properties. Lease obligations, with initial or remaining terms of one or more years, consist of the following at December 31, 2015:
|
2016 |
|
$ |
2,719 |
|
|
2017 |
|
|
2,747 |
|
|
2018 |
|
|
2,792 |
|
|
2019 |
|
|
2,844 |
|
|
2020 |
|
|
2,903 |
|
|
Thereafter |
|
|
4,716 |
|
|
|
|
$ |
18,721 |
|
Total rent expense for 2015, 2014 and 2013 was $2,304, $2,237 and $2,261, respectively.
Litigation
The Company is involved in various claims and routine litigation matters. In the opinion of management, after consultation with legal counsel, the outcomes of such matters are not anticipated to have a material adverse effect on the Company’s consolidated financial position, results of operations or cash flows in future years.
Contractual Commitments
The Company has entered into agreements with various food suppliers. These agreements may provide for annual pricing, annual purchase obligations, exclusivity in the production of certain products, as well as rebates if certain volume thresholds are exceeded, with terms of five years or less. The Company has total purchase obligations of $43,582 as of December 31, 2015. The Company anticipates it will meet all annual purchase obligations outstanding at December 31, 2015.
|
9. |
STOCKHOLDERS’ EQUITY |
Common Stock
In 2015, the Company issued 335 shares of common stock upon the exercise of stock options and received proceeds of $3,182. During 2015, employees surrendered to the Company 140 shares of common stock valued at $2,610 in satisfaction of minimum tax withholding obligations associated with the vesting of equity awards. These shares are included in treasury stock. Also, in 2015, the Company issued 22 shares of common stock as compensation to board members. During each of the four quarters of 2015, the Company paid a dividend of $0.175 per share to all stockholders of record. Subsequent to December 31, 2015, the Board of Directors declared a quarterly dividend of $0.175 per share payable on March 17, 2016 to stockholders of record as of March 7, 2016.
In 2014, the Company issued 32 shares of common stock upon the exercise of stock options and received proceeds of $314. During 2014, employees surrendered to the Company 91 shares of common stock valued at $1,476 in satisfaction of minimum tax withholding obligations associated with the vesting of equity awards. These shares are included in treasury stock. Also, in 2014, the Company issued 29 shares of common stock as compensation to board members and consultants. During each of the four quarters of 2014, the Company paid a dividend of $0.175 per share to all stockholders of record.
In 2013, the Company issued 1 share of common stock upon the exercise of stock options. During 2013, employees surrendered to the Company 85 shares of common stock valued at $950 in satisfaction of minimum tax withholding obligations associated with the vesting of equity awards. These shares are included in treasury stock. Also, in 2013, the Company issued 50 shares of common stock as compensation to board members. During each of the four quarters of 2013, the Company paid a dividend of $0.175 per share to all stockholders of record.
Preferred Stock
The Company has authorized 5,000 shares of preferred stock issuable in series upon resolution of the Board of Directors. Unless otherwise required by law, the Board of Directors can, without stockholder approval, issue preferred stock in the future with voting and conversion rights that could adversely affect the voting power of the common stock. The issuance of preferred stock may have the effect of delaying, averting or preventing a change in control of the Company.
46
Income tax expense consists of the following:
|
|
|
Year Ended December 31, |
|
|||||||||
|
|
|
2015 |
|
|
2014 |
|
|
2013 |
|
|||
|
Current: |
|
|
|
|
|
|
|
|
|
|
|
|
|
Federal |
|
$ |
14,395 |
|
|
$ |
10,039 |
|
|
$ |
5,080 |
|
|
State |
|
|
31 |
|
|
|
0 |
|
|
|
(10 |
) |
|
|
|
|
14,426 |
|
|
|
10,039 |
|
|
|
5,070 |
|
|
Deferred: |
|
|
|
|
|
|
|
|
|
|
|
|
|
Federal |
|
|
(662 |
) |
|
|
(425 |
) |
|
|
(435 |
) |
|
State |
|
|
(66 |
) |
|
|
177 |
|
|
|
(1,125 |
) |
|
|
|
|
(728 |
) |
|
|
(248 |
) |
|
|
(1,560 |
) |
|
|
|
$ |
13,698 |
|
|
$ |
9,791 |
|
|
$ |
3,510 |
|
A reconciliation of the statutory federal income tax rate to the Company’s effective tax rate is as follows:
|
|
|
Year Ended December 31, |
|
|||||||||
|
|
|
2015 |
|
|
2014 |
|
|
2013 |
|
|||
|
Statutory federal income tax rate |
|
|
35.0 |
% |
|
|
35.0 |
% |
|
|
35.0 |
% |
|
State income taxes, net of federal benefit |
|
|
0 |
|
|
|
0.5 |
|
|
|
(0.6 |
) |
|
Executive compensation limitation |
|
|
0 |
|
|
|
0.9 |
|
|
|
1.6 |
|
|
Food donations |
|
|
(1.2 |
) |
|
|
(0.4 |
) |
|
|
(2.8 |
) |
|
Fixed assets |
|
|
0.5 |
|
|
|
(1.4 |
) |
|
|
0 |
|
|
Changes in reserves |
|
|
(0.1 |
) |
|
|
0.1 |
|
|
|
(6.7 |
) |
|
Tax credits |
|
|
(0.5 |
) |
|
|
(0.5 |
) |
|
|
(1.7 |
) |
|
Other |
|
|
0.8 |
|
|
|
(0.6 |
) |
|
|
0.4 |
|
|
Expired charitable contribution carryover |
|
|
1.9 |
|
|
|
0 |
|
|
|
0 |
|
|
Valuation allowance |
|
|
(2.0 |
) |
|
|
0 |
|
|
|
7.1 |
|
|
|
|
|
34.4 |
% |
|
|
33.6 |
% |
|
|
32.3 |
% |
The change in the effective tax rate from 2014 to 2015 was due to the write-off of certain deferred tax assets and liabilities offset by increased levels of food donations. The change in the effective tax rate from 2013 to 2014 was due to the changes in executive compensation, decreased levels of food donations and the reduction in tax reserves due to the lapse of the statute of limitations which offset a charge to record a valuation allowance for charitable contributions carryforwards that might not be realized due to the short carryforward period for this temporary difference.
The significant items comprising the Company’s deferred income tax assets and liabilities are as follows:
|
|
|
December 31, |
|
|||||
|
|
|
2015 |
|
|
2014 |
|
||
|
Deferred tax asset: |
|
|
|
|
|
|
|
|
|
Reserves and accrual |
|
$ |
1,071 |
|
|
$ |
920 |
|
|
Goodwill/Intangible assets |
|
|
801 |
|
|
|
235 |
|
|
Net operating loss carryforward |
|
|
1,591 |
|
|
|
1,639 |
|
|
Stock-based compensation |
|
|
1,839 |
|
|
|
1,880 |
|
|
Charitable contribution carryforward |
|
|
1,895 |
|
|
|
3,180 |
|
|
Other |
|
|
1,068 |
|
|
|
909 |
|
|
|
|
|
8,265 |
|
|
|
8,763 |
|
|
Valuation allowance |
|
|
0 |
|
|
|
(800 |
) |
|
Deferred tax asset |
|
|
8,265 |
|
|
|
7,963 |
|
|
Deferred tax liability: |
|
|
|
|
|
|
|
|
|
Property and equipment |
|
|
(966 |
) |
|
|
(1,451 |
) |
|
Net deferred tax asset |
|
$ |
7,299 |
|
|
$ |
6,512 |
|
47
At December 31, 2015 and 2014, the Company had net operating loss carryforwards of approximately $28,696 and $29,474, respectively, for state tax purposes. For state tax purposes, there is a limitation on the amount of net operating loss carryforwards that can be utilized in a given year to offset state taxable income. Net operating losses will begin to expire in 2025.
In 2013, the Company recorded a valuation allowance of $800 against its deferred tax asset generated for charitable contributions. The Company recorded the valuation allowance to reduce the deferred tax asset to an amount it expects is more likely than not to be realized due to the short carryforward period for this temporary difference. In 2015, the Company wrote off the valuation allowance as certain charitable contribution carryovers expired. Based on the projected level of future taxable income over the periods in which the deferred tax assets are deductible, management believes it is more likely than not that the Company will realize the remaining net deferred tax assets. An analysis of the activity of the valuation allowance is as follows:
|
|
|
Year Ended December 31, |
|
|||||||||
|
|
|
2015 |
|
|
2014 |
|
|
2013 |
|
|||
|
Balance at beginning of year |
|
$ |
800 |
|
|
$ |
800 |
|
|
$ |
0 |
|
|
Additions charged to expense |
|
|
0 |
|
|
|
0 |
|
|
|
800 |
|
|
Deductions |
|
|
(800 |
) |
|
|
0 |
|
|
|
0 |
|
|
Balance at end of year |
|
$ |
0 |
|
|
$ |
800 |
|
|
$ |
800 |
|
The total amount of gross unrecognized tax benefits as of December 31, 2015, 2014 and 2013 was $272, $332 and $311, respectively. The total amount of unrecognized tax benefits that, if recognized, would affect the effective income tax rate is approximately $177, $216 and $202 as of December 31, 2015, 2014 and 2013, respectively. The Company records accrued interest and penalties related to unrecognized tax benefits as part of interest expense, net. During 2014 and 2013, the Company recognized interest income of $28 and $71, respectively, from interest and penalties. No interest income was recognized during 2015. The Company’s federal income tax returns for 2012 through 2014 are open and are subject to examination by the Internal Revenue Service. State tax jurisdictions that remain open to examination range from 2012 through 2014. The Company does not believe that that there will be any material changes to unrecognized tax positions over the next 12 months.
A reconciliation of the beginning and ending amounts of the total unrecognized tax benefit is as follows:
|
|
|
Year Ended December 31, |
|
|||||||||
|
|
|
2015 |
|
|
2014 |
|
|
2013 |
|
|||
|
Balance at beginning of year |
|
$ |
332 |
|
|
$ |
311 |
|
|
$ |
1,474 |
|
|
Increase related to current year tax positions |
|
|
19 |
|
|
|
15 |
|
|
|
60 |
|
|
Increase related to prior year tax positions |
|
|
72 |
|
|
|
138 |
|
|
|
0 |
|
|
Decrease due to lapse of statute of limitations |
|
|
(151 |
) |
|
|
(132 |
) |
|
|
(1,223 |
) |
|
Balance at end of year |
|
$ |
272 |
|
|
$ |
332 |
|
|
$ |
311 |
|
|
11. |
EQUITY INSTRUMENTS |
Equity Incentive Plans
The Company has three equity incentive plans: the 1999 Equity Incentive Plan, the 2000 Equity Incentive Plan and the Amended and Restated 2008 Long-Term Incentive Plan (collectively, the “Equity Incentive Plans”). The Amended and Restated 2008 Long-Term Incentive Plan is currently the only plan under which new awards may be granted. Under that plan, a variety of equity instruments can be granted to key employees and directors including incentive and nonqualified stock options to purchase shares of the Company’s common stock, restricted stock, restricted stock units or shares of common stock. The 1999 Equity Incentive Plan, the 2000 Equity Incentive Plan and the Amended and Restated 2008 Long-Term Incentive Plan authorize up to 1,000, 5,600 and 5,400 shares of common stock, respectively, for issuance. At December 31, 2015, the Amended and Restated 2008 Long-Term Incentive Plan had 1,476 shares available for grant.
Under each of the plans, the Board of Directors determines the term of each award, but no award can be exercisable more than 10 years from the date the award is granted. The stock options issued under the Equity Incentive Plans generally expire between seven and 10 years from the grant date. The Board also determines the vesting provisions of all awards and the exercise price per share of stock options issued under the plans, which is the fair market value at date of grant. Awards issued to employees generally vest over terms ranging from two to four years.
48
The following table summarizes the Company’s stock option activity for 2013, 2014 and 2015:
|
|
|
Number of Shares |
|
|
Weighted- Average Exercise Price Per Share |
|
|
Weighted- Average Remaining Contractual Life (years) |
|
|
Aggregate Intrinsic Value |
|
||||
|
Outstanding, January 1, 2013 |
|
|
634 |
|
|
$ |
11.92 |
|
|
|
|
|
|
|
|
|
|
Granted |
|
|
536 |
|
|
$ |
8.68 |
|
|
|
|
|
|
|
|
|
|
Exercised |
|
|
(1 |
) |
|
$ |
0.58 |
|
|
|
|
|
|
|
|
|
|
Forfeited/expired |
|
|
(375 |
) |
|
$ |
13.70 |
|
|
|
|
|
|
|
|
|
|
Outstanding, December 31, 2013 |
|
|
794 |
|
|
$ |
8.91 |
|
|
|
|
|
|
|
|
|
|
Granted |
|
|
179 |
|
|
$ |
14.95 |
|
|
|
|
|
|
|
|
|
|
Exercised |
|
|
(32 |
) |
|
$ |
9.60 |
|
|
|
|
|
|
|
|
|
|
Forfeited/expired |
|
|
(49 |
) |
|
$ |
11.16 |
|
|
|
|
|
|
|
|
|
|
Outstanding, December 31, 2014 |
|
|
892 |
|
|
$ |
9.97 |
|
|
|
|
|
|
|
|
|
|
Granted |
|
|
194 |
|
|
$ |
19.82 |
|
|
|
|
|
|
|
|
|
|
Exercised |
|
|
(335 |
) |
|
$ |
9.50 |
|
|
|
|
|
|
|
|
|
|
Forfeited/expired |
|
|
(25 |
) |
|
$ |
16.54 |
|
|
|
|
|
|
|
|
|
|
Outstanding, December 31, 2015 |
|
|
726 |
|
|
$ |
12.60 |
|
|
|
4.92 |
|
|
$ |
6,563 |
|
|
Exercisable at December 31, 2015 |
|
|
131 |
|
|
$ |
8.56 |
|
|
|
4.21 |
|
|
$ |
1,709 |
|
|
Expected to vest at December 31, 2015 |
|
|
712 |
|
|
$ |
12.60 |
|
|
|
4.92 |
|
|
$ |
6,432 |
|
In 2015, 2014 and 2013, the Company recorded compensation expense of $647, $426 and $382, respectively, for stock option awards. The weighted-average grant date fair value of stock options granted in 2015, 2014 and 2013 was $5.18, $3.88 and $1.61, respectively. The total intrinsic value of stock options exercised in 2015, 2014 and 2013 was $5,520, $219 and $7, respectively.
The fair value of each stock option was estimated on the date of grant using the Black-Scholes option pricing model and the following weighted average assumptions:
|
|
|
2015 |
|
|
2014 |
|
|
2013 |
|
|||
|
Expected dividend yield |
|
|
3.48 |
% |
|
|
4.58 |
% |
|
|
7.78 |
% |
|
Expected volatility |
|
|
40.81 |
% |
|
|
43.76 |
% |
|
|
44.08 |
% |
|
Risk-free interest rate |
|
|
1.55 |
% |
|
|
1.62 |
% |
|
|
0.79 |
% |
|
Expected life (in years) |
|
|
4.42 |
|
|
|
4.75 |
|
|
|
4.71 |
|
In 2015, 2014 and 2013, the Company authorized the issuance of 22, 27 and 50 fully vested shares of common stock, respectively, as compensation to the Board of Directors resulting in compensation expense of $509, $455 and $455, respectively. In addition, in 2014, the Company issued 2 shares of common stock to consultants for services. No shares were issued to consultants during 2015 or 2013, although certain shares issued in 2012 vested during 2013 resulting in expense upon vesting. Costs recognized for shares issued to non-employees for services were $30 and $195 in 2014 and 2013, respectively. No expense was recognized in 2015.
49
The Company has issued restricted stock to employees generally with vesting terms ranging from two to four years. The fair value is equal to the market price of the Company’s common stock on the date of grant. Expense for restricted stock is amortized ratably over the vesting period. The following table summarizes the restricted stock activity for 2013, 2014 and 2015:
|
|
|
Number of Shares |
|
|
Weighted- Average Grant-Date Fair Value |
|
|
Aggregate Intrinsic Value |
|
|||
|
Nonvested, January 1, 2013 |
|
|
830 |
|
|
$ |
13.71 |
|
|
|
|
|
|
Granted |
|
|
312 |
|
|
$ |
8.84 |
|
|
|
|
|
|
Vested |
|
|
(293 |
) |
|
$ |
12.72 |
|
|
|
|
|
|
Forfeited |
|
|
(163 |
) |
|
$ |
12.64 |
|
|
|
|
|
|
Nonvested, December 31, 2013 |
|
|
686 |
|
|
$ |
12.17 |
|
|
|
|
|
|
Granted |
|
|
116 |
|
|
$ |
14.99 |
|
|
|
|
|
|
Vested |
|
|
(303 |
) |
|
$ |
11.31 |
|
|
|
|
|
|
Forfeited |
|
|
(77 |
) |
|
$ |
12.21 |
|
|
|
|
|
|
Nonvested, December 31, 2014 |
|
|
422 |
|
|
$ |
13.56 |
|
|
|
|
|
|
Granted |
|
|
89 |
|
|
$ |
19.72 |
|
|
|
|
|
|
Vested |
|
|
(183 |
) |
|
$ |
11.30 |
|
|
|
|
|
|
Forfeited |
|
|
(52 |
) |
|
$ |
13.51 |
|
|
|
|
|
|
Nonvested, December 31, 2015 |
|
|
276 |
|
|
$ |
17.05 |
|
|
$ |
5,958 |
|
Additionally, the Company grants performance-based stock units. The performance-based units have performance conditions and service-based vesting conditions. Each vesting tranche is treated as an individual award and the compensation expense is recognized on a straight-line basis over the requisite service period for each tranche. The requisite service period is a combination of the performance period and the subsequent vesting period based on continued service. The level of achievement of such goals may cause the actual amount of units that ultimately vest to range from 0% to 200% of the original units granted. The Company recognizes expense ratably over the vesting period for performance-based restricted stock units when it is probable that the performance criteria specified will be achieved. The fair value is equal to the market price of the Company’s common stock on the date of grant.
The following table summarizes the restricted stock unit activity:
|
|
|
Number of Restricted Stock Units |
|
|
Weighted- Average Grant-Date Fair Value |
|
|
Aggregate Intrinsic Value |
|
|||
|
Nonvested, January 1, 2013 |
|
|
133 |
|
|
$ |
11.76 |
|
|
|
|
|
|
Granted |
|
|
162 |
|
|
$ |
8.68 |
|
|
|
|
|
|
Performance factor adjustment |
|
|
(1 |
) |
|
$ |
10.70 |
|
|
|
|
|
|
Vested |
|
|
(34 |
) |
|
$ |
17.53 |
|
|
|
|
|
|
Forfeited |
|
|
(29 |
) |
|
$ |
12.01 |
|
|
|
|
|
|
Nonvested, December 31, 2013 |
|
|
231 |
|
|
$ |
8.74 |
|
|
|
|
|
|
Granted |
|
|
93 |
|
|
$ |
14.95 |
|
|
|
|
|
|
Performance factor adjustment |
|
|
76 |
|
|
$ |
8.60 |
|
|
|
|
|
|
Vested |
|
|
(24 |
) |
|
$ |
14.72 |
|
|
|
|
|
|
Forfeited |
|
|
(10 |
) |
|
$ |
11.69 |
|
|
|
|
|
|
Nonvested, December 31, 2014 |
|
|
366 |
|
|
$ |
9.81 |
|
|
|
|
|
|
Granted |
|
|
123 |
|
|
$ |
19.28 |
|
|
|
|
|
|
Performance factor adjustment |
|
|
62 |
|
|
$ |
12.48 |
|
|
|
|
|
|
Vested |
|
|
(237 |
) |
|
$ |
8.64 |
|
|
|
|
|
|
Forfeited |
|
|
(1 |
) |
|
$ |
16.67 |
|
|
|
|
|
|
Nonvested, December 31, 2015 |
|
|
313 |
|
|
$ |
14.92 |
|
|
$ |
6,771 |
|
The Company recorded compensation expense of $4,312, $4,740 and $4,800 in the accompanying consolidated statements of operations for 2015, 2014 and 2013, respectively, in connection with the restricted stock and restricted stock units. As of December 31, 2015, the Company expects 264 shares of restricted stock and 308 restricted stock units to vest.
50
The Company recognized a decrease/(increase) in taxes payable of $2,750, $(68) and $(203) in 2015, 2014 and 2013, respectively, from the exercise of certain stock options and restricted stock and payment of certain dividends and recorded these amounts as decreases and increases to additional paid-in capital in the accompanying consolidated statements of stockholders’ equity.
As of December 31, 2015, there was $5,714 of total unrecognized compensation expense related to unvested share-based compensation arrangements, which is expected to be recognized over a weighted-average period of 1.1 years. The total unrecognized compensation expense will be fully charged to expense through the fourth quarter of 2018.
|
12. |
EMPLOYEE BENEFIT PLAN |
The Company maintains a qualified tax deferred defined contribution retirement plan (the “Plan”). Under the provisions of the Plan, substantially all employees meeting minimum age and service requirements are entitled to contribute on a before and after-tax basis a certain percentage of their compensation. The Company matched 100% of employees’ first 3% contribution and 50% of the employees’ next 2% contribution. Employees vest immediately in their contributions and the Company’s contribution. The Company’s contributions in 2015, 2014 and 2013 were $794, $748 and $633, respectively.
|
13. |
RETURNS RESERVE |
Following is an analysis for the returns reserve:
|
|
|
Year Ended December 31, |
|
|||||||||
|
|
|
2015 |
|
|
2014 |
|
|
2013 |
|
|||
|
Balance at beginning of year |
|
$ |
762 |
|
|
$ |
637 |
|
|
$ |
652 |
|
|
Provision for estimated returns |
|
|
13,225 |
|
|
|
12,661 |
|
|
|
10,838 |
|
|
Actual returns |
|
|
(13,117 |
) |
|
|
(12,536 |
) |
|
|
(10,853 |
) |
|
Balance at end of year |
|
$ |
870 |
|
|
$ |
762 |
|
|
$ |
637 |
|
|
14. |
QUARTERLY CONSOLIDATED FINANCIAL DATA (UNAUDITED) |
|
|
|
Quarter |
|
|
|
|
|
|||||||||||||
|
|
|
First |
|
|
Second |
|
|
Third |
|
|
Fourth |
|
|
Year |
|
|||||
|
(In thousands, except per share amounts) |
|
|
|
|
|
|
|
|
|
|
|
|
|
|
|
|
|
|
|
|
|
2015: |
|
|
|
|
|
|
|
|
|
|
|
|
|
|
|
|
|
|
|
|
|
Revenue |
|
$ |
137,225 |
|
|
$ |
130,261 |
|
|
$ |
104,877 |
|
|
$ |
90,246 |
|
|
$ |
462,609 |
|
|
Gross margin |
|
$ |
71,356 |
|
|
$ |
67,691 |
|
|
$ |
53,128 |
|
|
$ |
45,853 |
|
|
$ |
238,028 |
|
|
Net income |
|
$ |
2,943 |
|
|
$ |
12,085 |
|
|
$ |
7,309 |
|
|
$ |
3,806 |
|
|
$ |
26,143 |
|
|
Basic income per common share |
|
$ |
0.10 |
|
|
$ |
0.42 |
|
|
$ |
0.25 |
|
|
$ |
0.13 |
|
|
$ |
0.90 |
|
|
Diluted income per common share |
|
$ |
0.10 |
|
|
$ |
0.41 |
|
|
$ |
0.25 |
|
|
$ |
0.13 |
|
|
$ |
0.89 |
|
|
2014: |
|
|
|
|
|
|
|
|
|
|
|
|
|
|
|
|
|
|
|
|
|
Revenue |
|
$ |
122,228 |
|
|
$ |
111,052 |
|
|
$ |
90,570 |
|
|
$ |
79,233 |
|
|
$ |
403,083 |
|
|
Gross margin |
|
$ |
59,807 |
|
|
$ |
56,911 |
|
|
$ |
46,527 |
|
|
$ |
40,785 |
|
|
$ |
204,030 |
|
|
Net income |
|
$ |
224 |
|
|
$ |
8,703 |
|
|
$ |
5,076 |
|
|
$ |
5,308 |
|
|
$ |
19,311 |
|
|
Basic income per common share |
|
$ |
0.01 |
|
|
$ |
0.30 |
|
|
$ |
0.18 |
|
|
$ |
0.18 |
|
|
$ |
0.67 |
|
|
Diluted income per common share |
|
$ |
0.01 |
|
|
$ |
0.30 |
|
|
$ |
0.17 |
|
|
$ |
0.18 |
|
|
$ |
0.66 |
|
The sum of the quarterly basic and diluted per share amounts may not equal amounts reported for the year. This is due to the effects of rounding and changes in weighted average shares outstanding for each period.
51
|
No. |
|
Description |
|
|
|
|
|
2.1 |
|
Asset Purchase Agreement, dated as of December 17, 2015, between Nutrisystem SBD, LLC and SBD Holdings Group Corp., incorporated by reference to the designated exhibit of the Company’s Current Report on Form 8-K filed on December 17, 2015. |
|
|
|
|
|
*3.1 |
|
Certificate of Incorporation. |
|
|
|
|
|
3.2 |
|
Amended and Restated Bylaws of Nutrisystem, Inc., incorporated by reference to the designated exhibit of the Company’s Current Report on Form 8-K filed on July 22, 2009.
|
|
3.3 |
|
Amendment to the Amended and Restated Bylaws of Nutrisystem, Inc., incorporated by reference to the designated exhibit of the Company’s Current Report on Form 8-K filed on January 7, 2016.
|
|
+10.1 |
|
Amended and Restated Nutrisystem, Inc. 2008 Long Term Incentive Plan incorporated by reference to the designated exhibit of the Company’s Current Report on Form 8-K filed on September 6, 2012. |
|
|
|
|
|
+** 10.2 |
|
2000 Equity Incentive Plan of the Company. |
|
|
|
|
|
+** 10.3 |
|
2000 Equity Incentive Plan for Outside Directors and Consultants of the Company. |
|
|
|
|
|
10.4 |
|
Agreement, dated December 21, 2004, between Nutrisystem, Inc. and QVC, Inc. incorporated by reference to the designated exhibit of the Company’s Annual Report on Form 10-K filed on March 14, 2006. |
|
|
|
|
|
+10.5 |
|
Compensation Policy For Non-Employee Directors incorporated by reference to the designated exhibit of the Company’s Current Report on Form 8-K filed on March 6, 2008. |
|
|
|
|
|
10.6 |
|
Amended and Restated Credit Agreement, dated November 6, 2015, among Nutrisystem, Inc., as Borrower, Manufacturers and Traders Trust Company, as the Administrative Agent, Swing Line Lender, L/C Issuer and a Lender, and other Lenders, incorporated by reference to the designated exhibit of the Company’s Current Report on Form 8-K filed on November 10, 2015. |
|
|
|
|
|
+10.7 |
|
Letter Agreement, dated November 1, 2012, between Nutrisystem, Inc. and Dawn Zier, the Company’s President and Chief Executive Officer, incorporated by reference to the designated exhibit of the Company’s Current Report on Form 8-K filed on November 7, 2012. |
|
|
|
|
|
+10.8 |
|
Letter Agreement, dated May 21, 2013, between Nutrisystem, Inc. and Dawn Zier, incorporated by reference to the designated exhibit of the Company’s Current Report on Form 8-K filed on May 28, 2013. |
|
|
|
|
|
+10.9 |
|
First Amendment to the Employment Agreement between Nutrisystem, Inc. and Dawn M. Zier, dated January 2, 2015, incorporated by reference to the designated exhibit on the Company’s Current Report on Form 8-K filed on January 2, 2015. |
|
|
|
|
|
+10.10 |
|
Form of Restricted Stock Agreement for Dawn Zier, incorporated by reference to the designated exhibit of the Company’s Current Report on Form 8-K filed on November 7, 2012. |
|
|
|
|
|
+10.11 |
|
Form of Nonqualified Stock Option Grant Agreement for Dawn Zier, incorporated by reference to the designated exhibit of the Company’s Current Report on Form 8-K filed on November 7, 2012. |
|
|
|
|
|
+10.12 |
|
Form of Performance-Based Restricted Stock Unit Agreement for Dawn Zier, incorporated by reference to the designated exhibit of the Company’s Current Report on Form 8-K filed on November 7, 2012. |
|
|
|
|
|
+10.13 |
|
2015 Nonqualified Stock Option Grant Agreement dated December 31, 2015 for Dawn Zier, incorporated by reference to the designated exhibit of the Company’s Current Report on Form 8-K filed on January 5, 2016. |
|
|
|
|
|
+10.14 |
|
2015 Performance-Based Restricted Stock Unit Grant Agreement, dated December 31, 2015 for Dawn Zier, incorporated by reference to the designated exhibit of the Company’s Current Report on Form 8-K filed on January 5, 2016. |
|
|
|
|
|
+10.15 |
|
Letter Agreement, dated April 19, 2013, between Nutrisystem, Inc. and Michael Monahan, the Company’s Executive Vice President and Chief Financial Officer, incorporated by reference to the designated exhibit of the Company’s Quarterly Report on Form 10-Q filed on May 8, 2013. |
|
|
|
|
|
+10.16 |
|
First Amendment to the Employment Agreement between Nutrisystem, Inc. and Michael P. Monahan, dated January 2, 2015, incorporated by reference to the designated exhibit on the Company’s Current Report on Form 8-K filed on January 2, 2015. |
|
|
|
|
52
|
No. |
|
Description |
|
|
2013 Performance-Based Restricted Stock Unit Grant Agreement for Michael Monahan, incorporated by reference to the designated exhibit of the Company’s Quarterly Report on Form 10-Q filed on August 6, 2013. |
|
|
|
|
|
|
+10.18 |
|
Employment Agreement, dated February 5, 2013 between Nutrisystem, Inc. and Keira Krausz, the Company’s Executive Vice President and Chief Marketing Officer, incorporated by reference to the designated exhibit on the Company’s Annual Report on Form 10-K filed on March 12, 2013. |
|
|
|
|
|
+10.19 |
|
First Amendment to the Employment Agreement between Nutrisystem, Inc. and Keira Krausz, dated January 2, 2015, incorporated by reference to the designated exhibit on the Company’s Current Report on Form 8-K filed on January 2, 2015. |
|
|
|
|
|
+10.20 |
|
Form of Restricted Stock Agreement for Keira Krausz, incorporated by reference to the designated exhibit on the Company’s Annual Report on Form 10-K filed on March 12, 2013. |
|
|
|
|
|
+10.21 |
|
Form of Nonqualified Stock Option Grant Agreement for Keira Krausz, incorporated by reference to the designated exhibit on the Company’s Annual Report on Form 10-K filed on March 12, 2013. |
|
|
|
|
|
+10.22 |
|
2013 Performance-Based Restricted Stock Unit Grant Agreement for Keira Krausz, incorporated by reference to the designated exhibit of the Company’s Quarterly Report on Form 10-Q filed on August 6, 2013. |
|
|
|
|
|
+10.23 |
|
Form of Performance-Based Restricted Stock Unit Grant Agreement for Executives (for all grants issued prior to 2015), incorporated by reference to the designated exhibit on the Company’s Quarterly Report on Form 10-Q filed on August 6, 2013. |
|
|
|
|
|
+10.24 |
|
Form of Nonqualified Stock Option Grant Agreement for Executives (for all grants issued prior to 2015), incorporated by reference to the designated exhibit on the Company’s Annual Report on Form 10-K filed on March 12, 2013. |
|
|
|
|
|
+10.25 |
|
Form of Restricted Stock Award Agreement for Executives (for all grants issued prior to 2015), incorporated by reference to the designated exhibit on the Company’s Annual Report on Form 10-K filed on March 12, 2013. |
|
|
|
|
|
+10.26 |
|
Form of Performance-Based Restricted Stock Unit Grant Agreement for Executives (for all grants issued in or after 2015), incorporated by reference to the designated exhibit on the Company’s Current Report on Form 8-K filed on January 2, 2015. |
|
|
|
|
|
+10.27 |
|
Form of Nonqualified Stock Option Grant Agreement for Executives (for all grants issued in or after 2015), incorporated by reference to the designated exhibit on the Company’s Current Report on Form 8-K filed on January 2, 2015. |
|
|
|
|
|
+10.28 |
|
Form of Restricted Stock Award Agreement for Executives (for all grants issued in or after 2015), incorporated by reference to the designated exhibit on the Company’s Current Report on Form 8-K filed on January 2, 2015. |
|
|
|
|
|
10.29 |
|
Lease Agreement, dated October 13, 2009, between B.R. Properties Owner, LP and Nutrisystem, Inc., incorporated by reference to the designated exhibit of the Company’s Quarterly Report on Form 10-Q filed on August 5, 2010. |
|
|
|
|
|
10.30 |
|
Mutual Release and Settlement Agreement, effective October 28, 2013, between Nutrisystem, Inc. and Hormel Food Sales, LLC, incorporated by reference to the designated exhibit on the Company’s Current Report on Form 8-K filed on October 29, 2013. |
|
|
|
|
|
21.1 |
|
Subsidiaries of Nutrisystem, Inc. |
|
|
|
|
|
23.1 |
|
Consent of KPMG LLP. |
|
|
|
|
|
31.1 |
|
Certifying Statement of the Chief Executive Officer pursuant to Section 302 of the Sarbanes-Oxley Act of 2002. |
|
|
|
|
|
31.2 |
|
Certifying Statement of the Chief Financial Officer pursuant to Section 302 of the Sarbanes-Oxley Act of 2002. |
|
|
|
|
|
32.1 |
|
Certifying Statement of the Chief Executive Officer pursuant to Section 1350 of Title 18 of the United States Code. |
|
|
|
|
|
32.2 |
|
Certifying Statement of the Chief Financial Officer pursuant to Section 1350 of Title 18 of the United States Code. |
|
|
|
|
|
101.INS |
|
XBRL Instance Document |
|
|
|
|
|
101.SCH |
|
XBRL Taxonomy Extension Schema Document |
|
|
|
|
|
101.CAL |
|
XBRL Taxonomy Extension Calculation Linkbase Document |
|
|
|
|
|
101.LAB |
|
XBRL Taxonomy Extension Label Linkbase Document |
|
|
|
|
|
101.PRE |
|
XBRL Taxonomy Extension Presentation Linkbase Document |
|
|
|
|
53
|
* |
Incorporated by reference to the designated exhibit of the Company’s Registration Statement on Form 10 filed on December 17, 1999 (file number 0-28551). |
|
** |
Incorporated by reference to the designated exhibit of the Company’s Form PRE 14A filed on May 12, 2000 (file number 0-28551). |
|
+ |
Management contract or compensatory plan or arrangement. |
54
Pursuant to the requirements of Section 13 or 15(d) of the Securities Exchange Act of 1934, the Registrant has duly caused this Report to be signed on its behalf by the undersigned, thereunto duly authorized.
|
Nutrisystem, Inc. |
||
|
|
|
|
|
By: |
|
/S/ DAWN M. ZIER |
|
|
|
Dawn M. Zier, President and |
|
|
|
Chief Executive Officer |
Dated: February 26, 2016
Pursuant to the requirements of the Securities Exchange Act of 1934, this Report has been signed below by the following persons on behalf of the Registrant and in the capabilities indicated.
|
BY: |
/S/ DAWN M. ZIER |
|
February 26, 2016 |
|
Dawn M. Zier |
|
|
|
|
President and Chief Executive Officer and Director |
|
|
|
|
|
|
|
|
|
BY: |
/S/ MICHAEL P. MONAHAN |
|
February 26, 2016 |
|
Michael P. Monahan |
|
|
|
|
Executive Vice President, Chief Financial Officer and Principal Accounting Officer |
|
|
|
|
|
|
|
|
|
BY: |
/S/ ROBERT F. BERNSTOCK |
|
February 26, 2016 |
|
Robert F. Bernstock |
|
|
|
|
Director |
|
|
|
|
|
|
|
|
|
BY: |
/S/ PAUL GUYARDO |
|
February 26, 2016 |
|
Paul Guyardo |
|
|
|
|
Director |
|
|
|
|
|
|
|
|
|
BY: |
/S/ MICHAEL J. HAGAN |
|
February 26, 2016 |
|
Michael J. Hagan |
|
|
|
|
Chairman, Director |
|
|
|
|
|
|
|
|
|
BY: |
/S/ JAY HERRATTI |
|
February 26, 2016 |
|
Jay Herratti |
|
|
|
|
Director |
|
|
|
|
|
|
|
|
|
BY: |
/S/ MICHAEL D. MANGAN |
|
February 26, 2016 |
|
Michael D. Mangan |
|
|
|
|
Director |
|
|
|
|
|
|
|
|
|
BY: |
/S/ BRIAN P. TIERNEY |
|
February 26, 2016 |
|
Brian P. Tierney |
|
|
|
|
Director |
|
|
|
|
|
|
|
|
|
BY: |
/S/ ANDREA WEISS |
|
February 26, 2016 |
|
Andrea Weiss |
|
|
|
|
Director |
|
|
|
55