Attached files
| file | filename |
|---|---|
| EX-32.1 - EXHIBIT 32.1 - HEARTLAND PAYMENT SYSTEMS INC | phpyexhibit32110k2015sec90.htm |
| EX-23.1 - EXHIBIT 23.1 - HEARTLAND PAYMENT SYSTEMS INC | phpyexhibit23110k2015ye.htm |
| EX-32.2 - EXHIBIT 32.2 - HEARTLAND PAYMENT SYSTEMS INC | phpyexhibit32210k2015sec30.htm |
| EX-31.2 - EXHIBIT 31.2 - HEARTLAND PAYMENT SYSTEMS INC | phpyexhibit31210k2015sec30.htm |
| EX-21.1 - EXHIBIT 21.1 - HEARTLAND PAYMENT SYSTEMS INC | phpyexhibit21110k2015ye.htm |
| EX-31.1 - EXHIBIT 31.1 - HEARTLAND PAYMENT SYSTEMS INC | phpyexhibit31110k2015sec30.htm |
UNITED STATES
SECURITIES AND EXCHANGE COMMISSION
WASHINGTON, D.C. 20549
__________________________________
FORM 10-K
__________________________________
(Mark One)
x | ANNUAL REPORT PURSUANT TO SECTION 13 OR 15(d) OF THE SECURITIES EXCHANGE ACT OF 1934 |
For the fiscal year ended December 31, 2015
OR
o | TRANSITION REPORT PURSUANT TO SECTION 13 OR 15(d) OF THE SECURITIES EXCHANGE ACT OF 1934 |
For the transition period from to
Commission File No. 001-32594
______________________________________________

HEARTLAND PAYMENT SYSTEMS, INC.
(Exact name of registrant as specified in its charter)
Delaware | 22-3755714 | |
(State or other jurisdiction of incorporation or organization) | (I.R.S. Employer Identification Number) | |
90 Nassau Street, Princeton, New Jersey 08542
(Address of principal executive offices) (Zip Code)
(609) 683-3831
(Registrant’s telephone number, including area code)
____________________________________________________________
Securities registered pursuant to 12(b) of the Act:
Title of each class | Name of each exchange on which registered | |
Common Stock, $0.001 par value | New York Stock Exchange | |
Securities registered pursuant to 12(g) of the Act: | ||
(NONE) | ||
(title of Class) | ||
Indicate by check mark if the registrant is a well-known seasoned issuer, as defined in Rule 405 of the Securities Act. x YES o NO
Indicate by check mark if the registrant is not required to file reports pursuant to Section 13 or Section 15(d) of the Act. o YES x NO
Indicate by check mark whether the registrant (1) has filed all reports required to be filed by Section 13 or 15(d) of the Securities Exchange Act of 1934 during the preceding 12 months (or for such shorter period that the registrant was required to file such reports), and (2) has been subject to such filing requirements for the past 90 days. x YES o NO
Indicate by check mark whether the registrant has submitted electronically and posted on its corporate Web site, if any, every Interactive Data File required to be submitted and posted pursuant to Rule 405 of Regulation S-T (§232.405 of this chapter) during the preceding 12 months (or for such shorter period that the registrant was required to submit and post such files). x YES o NO
Indicate by check mark if disclosure of delinquent filer pursuant to Item 405 of Regulation S-K (§229.405 of this chapter) is not contained herein, and will not be contained, to the best of registrant's knowledge, in definitive proxy or information statements incorporated by reference in Part III of this Form 10-K or any amendment to this Form 10-K. [X]
Indicate by check mark whether the registrant is a large accelerated filer, an accelerated filer, a non-accelerated filer, or a smaller reporting company. See definitions of “large accelerated filer,” “accelerated filer,” and “smaller reporting company” in Rule 12b-2 of the Exchange Act. (Check one):
Large accelerated filer | x | Accelerated filer | o | |||
Non-accelerated filer | o (Do not check if a smaller reporting company) | Smaller reporting company | o | |||
Indicate by check mark whether the registrant is a shell company (as defined in Rule 12b-2 of the Exchange Act). o YES x NO
The aggregate market value of the voting and non-voting common stock held by non-affiliates computed by reference to the price at which the common stock was last sold on the New York Stock Exchange on June 30, 2015 was approximately $1.5 billion.
As of February 24, 2016, there were 36,996,676 shares of the registrant’s Common Stock, $0.001 par value, outstanding.
DOCUMENTS INCORPORATED BY REFERENCE
Specifically identified portions of the registrant's definitive proxy statement to be filed with the Securities and Exchange Commission pursuant to Regulation 14A in connection with the 2016 annual meeting of shareholders are incorporated by reference into Part III of this Annual Report on Form 10-K for fiscal year ended December 31, 2015.
Heartland Payment Systems, Inc.
Annual Report on Form 10-K
For the Year Ended December 31, 2015
TABLE OF CONTENTS
Page | ||
Item 1. | ||
Item 1A. | ||
Item 1B. | ||
Item 2. | ||
Item 3. | ||
Item 4. | MINE SAFETY DISCLOSURES | |
Item 5. | ||
Item 6. | ||
Item 7. | ||
Item 7A. | ||
Item 8. | ||
Item 9. | ||
Item 9A. | ||
Item 9B. | ||
Item 10. | ||
Item 11. | ||
Item 12. | ||
Item 13. | ||
Item 14. | ||
Item 15. | ||
FORWARD LOOKING STATEMENTS
Unless the context requires otherwise, references in this Annual Report on Form 10-K to “the Company,” “we,” “us,” and “our” refer to Heartland Payment Systems, Inc. and its subsidiaries.
Some of the information in this report may contain forward-looking statements that are based on our management's beliefs and assumptions and on information currently available to our management. Forward-looking statements include the information concerning our possible or assumed future results of operations, financial condition and prospects, business strategies, financing plans, competitive position, industry environment, potential growth opportunities, the effects of future regulation and the effects of competition. Forward-looking statements include all statements that are not historical facts and can be identified by the use of forward-looking terminology such as the words “anticipate,” “believe,” "estimate," “expect,” “intend,” “plan,” "predict," "will be," "will continue" or similar expressions.
Forward-looking statements involve risks, uncertainties and assumptions. Actual results may differ materially from those expressed in the forward-looking statements. You should understand that many important factors, in addition to those discussed elsewhere in this report, could cause our results to differ materially from those expressed in the forward-looking statements. Certain of these factors are described in Item 1A. Risk Factors in this Annual Report on Form 10-K and include, without limitation, the risk that our proposed merger with Global Payments Inc. may not be consummated, on a timely basis and on the expected terms or at all, changes in the price of Global Payments common stock prior to the consummation of the merger, the ability to realize the anticipated benefits of the proposed merger, on the expected timeline or at all, the effect of the pending merger on our business, financial results, operations, and relationships with customers, vendors, and employees, unauthorized disclosure of user data through breaches of our computer systems or otherwise, our failure to comply with the applicable requirements of the Visa and MasterCard bankcard networks, our competitive environment, the business cycles and credit risks of our merchants, chargeback liability, merchant attrition, reliance on and problems with our sponsor banks, our relationships with third-party bankcard payment processors, our inability to pass increased interchange fees, assessments, and transaction fees along to our merchants, economic conditions, systems failures and government regulation.
PART I.
ITEM 1. BUSINESS
Overview of Our Company
Heartland Payment Systems, Inc.
90 Nassau Street, Princeton, NJ 08542
(609) 683-3831
Our primary business is to provide Payment Processing services to merchants throughout the United States. This involves providing end-to-end electronic payment processing services to merchants by facilitating the exchange of information and funds between them and cardholders' financial institutions. To accomplish this, we undertake merchant set-up and training, transaction authorization and electronic draft capture, clearing and settlement, merchant accounting, merchant assistance and support, and risk management. We also sell and rent point-of-sale ("POS") devices. Our card-accepting customers primarily fall into two categories: small and mid-sized merchants (referred to as "Small and Midsized Enterprises," or “SME merchants”) and Network Services merchants, which are predominantly petroleum industry merchants of all sizes (referred to as “Network Services merchants”).
We provide additional services in our other business segments such as:
• | Integrated commerce solutions, payment processing, higher education loan services and open and closed-loop payment solutions to higher-education institutions through Campus Solutions, |
• | School nutrition, POS solutions, and associated payment solutions, including online prepayment solutions, to kindergarten through 12th grade ("K-12") schools through Heartland School Solutions, |
• | Full-service payroll processing and related tax filing services throughout the United States provided by Heartland Payroll Solutions, and |
• | Other, including (1) integrated payments solutions for small ticket merchants throughout the United States and Canada provided by Micropayments, (2) POS solutions and other adjacent business service applications provided by Heartland Commerce, and (3) marketing solutions including loyalty and gift cards which we provide through Heartland Marketing Solutions. |
We were incorporated in June 2000, in the state of Delaware. As of December 31, 2015, we employed 4,272 full- and part-time personnel, including 1,460 sales professionals, 730 customer service, risk management, financial and operations support and underwriting employees, 431 systems and technology employees, 457 Heartland Payroll Solutions employees, 230 Heartland School Solutions employees, 434 Campus Solutions employees, 39 Micropayments employees, 229 accounting and administration employees, and 262 Heartland Commerce employees. Our sales professionals include 1,069 Relationship Managers and Territory Managers and 171 Senior Product Advisors, primarily payroll specialists. None of our employees were represented by a labor union, and we have experienced no work stoppages. We consider our employee relations to be good.
Agreement and Plan of Merger
On December 15, 2015, we entered into an Agreement and Plan of Merger (the “Merger Agreement”) with Global Payments Inc., a Georgia corporation (“Global”), Data Merger Sub One, Inc., a Delaware corporation and wholly owned subsidiary of Global (“Merger Sub One”) and Data Merger Sub Two, LLC, a Delaware limited liability company and wholly owned subsidiary of Global (“Merger Sub Two”, and together with Merger Sub One, the “Merger Subs”).
Pursuant to the terms and subject to the conditions set forth in the Merger Agreement, Global will acquire the Company in a two-step transaction. First, Merger Sub One will merge with and into the Company, with the Company continuing as a wholly owned subsidiary of Global. Second, the Company will merge with and into Merger Sub Two immediately following the initial merger, with Merger Sub Two surviving the second merger as a wholly owned subsidiary of Global.
As a result of the merger, subject to the terms and conditions of the Merger Agreement, each outstanding share of our common stock (other than certain shares owned by the parties to the Merger Agreement or by stockholders who have validly exercised their appraisal rights) will be converted into the right to receive (subject to adjustment as set forth in the next sentence) $53.28 in cash, without interest, and 0.6687 shares of Global common stock. Under the terms of the Merger Agreement, in the event that the number of shares of Global common stock issuable as a result of the merger would exceed 19.9% of the issued and outstanding shares of Global common stock immediately prior to the closing of the merger, the stock consideration will be reduced so that no more than 19.9% of the outstanding shares of Global common stock will be issuable in
1
the merger and the cash consideration will be increased by a corresponding amount, so that the value of the per share merger consideration will remain the same.
Consummation of the merger is subject to customary conditions, including without limitation, (1) approval by the holders of at least a majority of the outstanding shares of the Company’s common stock, (2) the absence of any law or order of any governmental entity which prohibits the consummation of the merger, (3) the effectiveness under the Securities Act of 1933 (as amended) of the Registration Statement on Form S-4 filed by Global with respect to the merger, and (4) subject to certain materiality exceptions, the accuracy of the representations and warranties made by the parties and compliance by the parties with their respective obligations under the Merger Agreement.
Each of the Company and Global has made customary representations and warranties in the Merger Agreement. The Merger Agreement also contains customary covenants, including, without limitation, (1) covenants providing for the parties to use reasonable best efforts to cause the closing of the merger to be consummated, and (2) the Company’s agreement to not solicit proposals relating to alternative transactions to the merger or engage in discussions or negotiations with respect thereto, subject to certain exceptions. Additionally, the parties have agreed to select two Company nominees for appointment to Global’s board of directors in connection with the closing of the merger.
The Merger Agreement contains certain termination rights for Global and the Company, including a mutual termination right in the event the merger is not consummated by June 15, 2016 (subject to extension under certain circumstances). Upon termination of the Merger Agreement under specified circumstances described in the Merger Agreement, including (1) if Global terminates the Merger Agreement following a change of recommendation of the Company’s board of directors, (2) if the Company terminates the Merger Agreement to enter into a definitive agreement with a third party with respect to a superior acquisition proposal, or (3) if the Merger Agreement is terminated under certain circumstances and the Company subsequently enters into, or consummates, an alternative acquisition proposal within 12 months, the Company will be required to pay Global a termination fee of $153,000,000.
Certain terms of the Merger Agreement are summarized in, and the Merger Agreement has been filed as an exhibit to the Current Report on Form 8-K filed by the Company on December 17, 2015.
General Business Developments
Acquisitions
Campus Solutions
On September 4, 2014, we completed the acquisition of TouchNet Information Systems, Inc. (“TouchNet”), an integrated commerce solutions provider to higher-education institutions for a cash payment of $375 million, less a net working capital deficit, for all outstanding common shares. The purchase was funded primarily with a new five year, $375 million secured term loan. See “Management's Discussion and Analysis of Financial Condition and Results of Operations — Liquidity and Capital Resources — Credit Facilities,” for further discussion. TouchNet added over 600 higher education institutions serving more than 6 million students, nearly one-third of the higher education enrollment in the United States, to our Campus Solutions business.
Heartland School Solutions
On April 1, 2014, we purchased the net assets of MCS Software Corporation ("MCS Software") for a $17.3 million cash payment. The purchase price was funded from a combination of operating cash and financing under our revolving credit facility. This acquisition further expanded our market-leading position in the K-12 school nutrition and POS technology industry.
Heartland Payroll Solutions
On February 27, 2015, we purchased the stock of Payroll 1, Inc. ("Payroll 1") for a $30.0 million cash payment, plus net working capital. The purchase price was financed under our 2014 Revolving Credit Facility. The acquisition of Payroll 1 expanded our existing payroll processing business and customer base by adding 6,573 customers at acquisition.
Heartland Commerce
Heartland Commerce provides a comprehensive suite of POS solutions and is comprised primarily of the following businesses acquired since February 2014:
2
On October 30, 2015, we acquired the stock of Menusoft Systems Corporation (a.k.a. “Digital Dining”) for a cash payment of $18.7 million. The purchase was funded from a combination of operating cash and financing under the 2014 Revolving Credit Facility. Digital Dining offers restaurants the convenience of a handheld POS on an iPhone, iPod and iPad in a hybrid environment with conventional fixed terminals, and is also used by restaurateurs for table management, delivery, reservations, labor scheduling, inventory and loyalty programs.
On February 11, 2015, we acquired the stock of Dinerware, Inc. ("Dinerware") for a cash payment of $15.0 million. The purchase was funded from a combination of operating cash and financing under the 2014 Revolving Credit Facility. Dinerware provides restaurant POS software solutions to the hospitality industry and POS systems to enhance the operations of a wide range of food service establishments.
On January 30, 2015, we acquired the net assets of Automation Inc. ("pcAmerica") for a cash payment of $15.0 million. The purchase was funded from a combination of operating cash and financing under the 2014 Revolving Credit Facility. PcAmerica delivers POS systems to streamline daily operations, including customer transactions, inventory tracking, employee labor, and marketing reports to meet the evolving needs of retail stores and restaurants.
On October 31, 2014, we acquired the net assets of Xpient Solutions, LLC (“Xpient”) for a cash payment of $30.0 million, plus net working capital. The purchase price was funded from a combination of operating cash and financing under our revolving credit facility. Xpient provides POS software solutions to customers primarily in the food service industry.
On February 15, 2014, we purchased the net assets of Merchant Software Corporation ("Liquor POS") for a $3.3 million cash payment. The purchase price was funded from operating cash flows. Liquor POS is a leading provider of POS systems to the liquor retail vertical serving more than 3,400 merchants.
Business Segment Overview
Payment Processing
Performance Update
At December 31, 2015, we provided our card payment processing services to 182,526 active SME merchants located across the United States. This compares to 169,831 active SME merchants at December 31, 2014. At December 31, 2015, we provided card payment processing services to approximately 3,194 Network Services merchants with approximately 43,987 locations, compared to 2,181 Network Services merchants with 42,397 locations at December 31, 2014.
Our total card processing volume for the year ended December 31, 2015 was $117.4 billion, a 6.8% increase from the $109.9 billion processed during the year ended December 31, 2014. Our SME card processing volume for the year ended December 31, 2015 was $93.1 billion, a 14.8% increase over $81.1 billion in 2014. Total card processing volume for 2015 also included $24.3 billion of settled volume for Network Services merchants, compared to $28.8 billion for 2014.
In addition to settling card transactions, Network Services processes a wide range of payment transactions for its predominantly petroleum customer base, including providing 2.4 billion transaction authorizations (primarily for Visa and MasterCard) through its front-end card processing systems in 2015.
According to The Nilson Report, in 2014 we were the 5th largest merchant acquirer in the United States ranked by transaction count and the 9th largest merchant acquirer by processed dollar volume, which consisted of Visa and MasterCard credit and debit cards, as well as other credit cards such as American Express, Discover, Diners Club, Carte Blanche, UnionPay, etc. These rankings represented 3.8 billion transactions and 2.9% of the total U.S. bankcard processed dollar volume.
3
The following table summarizes revenue, net revenue (which we define as total revenue less interchange fees and dues, assessments and fees) and operating income for our Payment Processing segment for the years ended December 31, 2015, 2014 and 2013:
Year Ended December 31, | ||||||||||||
2015 | 2014 | 2013 | ||||||||||
(In thousands) | ||||||||||||
Revenue | $ | 2,371,878 | $ | 2,111,487 | $ | 1,979,579 | ||||||
Net revenue | 518,313 | 472,731 | 443,189 | |||||||||
Operating income | 119,312 | 127,553 | 138,226 | |||||||||
Business Structure
Our Payment Processing revenue from SME merchants and Network Services merchants is recurring in nature. We typically enter into three-year service contracts with our SME merchants and three-to-five-year agreements with Network Services merchants.
Most of our SME revenue is from fees for processing transactions, which are primarily a combination of a percentage of the dollar amount of each card transaction we process, a flat fee per transaction and monthly fees for services. We make mandatory payments of interchange fees to card issuing banks through card networks and dues, assessments and transaction authorization fees to Visa, MasterCard and Discover, and we retain the remainder as net revenue. For example, in a transaction using a Visa or MasterCard card, the allocation of funds resulting from a $100 transaction follows.
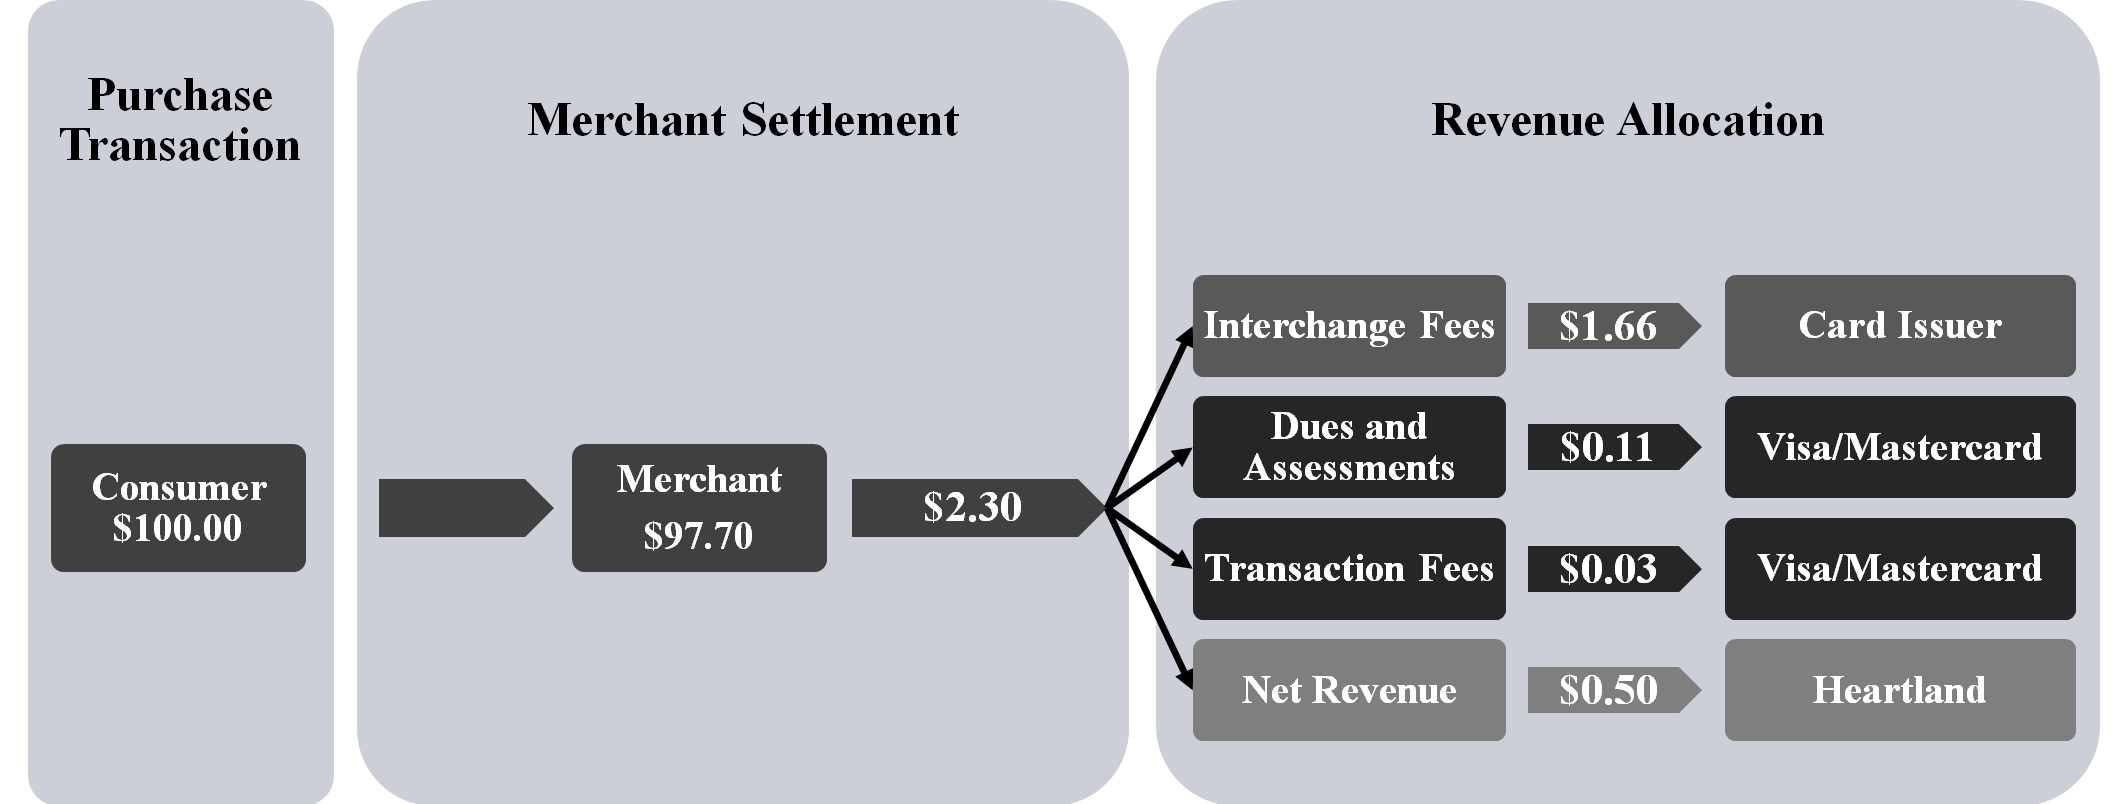
In contrast, our processing revenues from Network Services merchants generally consist of a flat fee per transaction, thus revenues are driven primarily by the number of transactions we process (whether settled or only authorized), not card processing volume.
Our Merchant Base
We have developed significant expertise in industries that we believe present relatively low risks as the consumers are generally present and the products or services are generally delivered at the time the transaction is processed. These include:
• | Restaurants |
• | Brick-and-mortar retailers |
• | Hotel and lodging |
• | Automotive sales and repair shops |
• | Convenience and liquor stores |
• | Professional service providers |
• | Gas stations |
4
Generally, we define SME merchants as generating annual Visa and MasterCard card processing volume between $50,000 and $5,000,000. However, with the added functionality and cost benefits that our in-house processing platforms afford us, we also market to merchants with annual processing volume above $5,000,000.
The following table summarizes our SME processing volume by merchant category for the month of December 2015, compared to the months of December 2014 and December 2013.
Month of December | |||||
2015 | 2014 | 2013 | |||
Restaurants | 35.1% | 35.1% | 35.2% | ||
Retail | 17.2% | 17.9% | 17.8% | ||
Convenience, Fast Food & Liquor | 11.8% | 11.4% | 11.0% | ||
Professional Services | 7.4% | 7.3% | 7.4% | ||
Automotive | 6.6% | 6.7% | 6.8% | ||
Lodging | 4.1% | 4.5% | 4.6% | ||
Petroleum | 1.3% | 1.6% | 1.9% | ||
Other | 16.5% | 15.5% | 15.3% | ||
Total SME processing volume $7.6 billion $6.6 billion $5.9 billion
No single SME merchant accounted for more than 0.42% of our total SME Visa and MasterCard card processing volume in 2015, and during 2015, our top 25 SME merchants represented only 3.69% of our SME Visa and MasterCard card processing volume and 3.31% of our SME Visa and MasterCard gross processing revenue. In 2015, approximately 93% of our SME card processing volume came from merchants we installed in 2014 and earlier.
In December 2015, SME merchants located in the following states represented the following percentages of our SME card processing volume: California represented 13.0%, Texas represented 6.2%, Florida represented 5.8%, New York represented 5.1% and Pennsylvania represented 3.5%, respectively. No other state represented more than 3.3% of our total SME card processing volume. Our geographic concentration tends to reflect the states with the highest economic activity, as well as certain states where we have historically maintained a stronger sales force. This merchant and geographic diversification makes us less sensitive to changing economic conditions in any particular industry or region. We believe that the loss of any single SME merchant would not have a material adverse effect on our financial condition or results of operations.
Payment Processing Platforms
We have developed a number of proprietary payment processing systems to increase our operating efficiencies and customize our product offerings. These include:
• | HPS Exchange, VAPS and NWS, our internal front-end authorization systems, provide authorization and data capture services that distribute processing and merchant data to card networks, merchants, and our sales force and customer service staff. These systems provide us greater control of the electronic transaction process, allow us to offer our merchants a differentiated product offering, and offer economies of scale that we expect will increase our long-term profitability. |
HPS Exchange, VAPS and NWS enable us to provide more customized solutions to merchants that demand customized front-end solutions and take advantage of new terminal hardware platforms and technology like our end-to-end encryption solution (included in our Heartland Secure solutions), as well as near field communication ("NFC") and Europay, MasterCard and Visa (“EMV”) processing. HPS Exchange, VAPS and NWS offer our merchants authorization and capture services in multiple industry verticals to a variety of POS systems including legacy terminals, petroleum pumps, middleware technologies, PC-integrated POS systems and web-based virtual terminals. In addition, HPS Exchange, VAPS and NWS offer third-party POS developers multiple protocols to meet their needs for integration.
During 2015, approximately 97% of the transactions of our SME merchants were processed on HPS Exchange, and 97% of all SME merchant accounts established in 2015 were placed on the system. During 2015, 100% of the transactions for our Network Services merchants were processed on VAPS or NWS.
• | Passport, our internally developed back-end processing system, provides one settlement platform for SME merchants and Network Services merchants, providing value-added features such as optimized funding, multi-bank next day Funding, automated dispute resolution, advanced interchange management and single portal integration via |
5
InfoCentral. In addition, Passport generates significant cost savings and allows us greater economies of scale, by replacing third-party processors' per-transaction charges with more of a fixed-cost structure. This structure allows per-transaction savings as increasing numbers of transactions are processed on Passport. In addition, Passport provides us the opportunity to offer our merchants significantly greater amounts of information regarding their processing characteristics, in more usable formats, and to offer our services to larger merchants. At both December 31, 2015 and 2014, substantially all of our SME merchants were processing on Passport, and all of our Network Services settled transactions were processing on Passport.
Security, Disaster Recovery and Back-up Systems
In the course of our operations, we compile and maintain a large database of information relating to our merchants and their transactions, and large amounts of card information cross our network as we authorize transactions. We have placed significant emphasis on maintaining a high level of security in order to attempt to protect the information of our merchants and their customers. We maintain current updates of network and operating system security releases and virus definitions, and have engaged a third party to regularly test our systems for vulnerability to unauthorized access. Further, we encrypt the cardholder numbers and merchant data that are stored in our databases using what we believe are the strongest commercially available encryption methods.
Our internal network configuration provides multiple layers of security to isolate our databases from unauthorized access and implements detailed security rules to limit access to all critical systems.
Visa, STAR, NYCE and other debit card networks have established security guidelines for PIN-based debit transaction processing that is based upon ANSI standards that are published as the “ASC X9 TG-3 Retail Financial Services Compliance Guideline; Part 1: PIN Security and Key Management.” We have a regularly scheduled Security Review of our Key Management Procedures against this standard that is performed by an external auditor.
We also have engaged external auditors to perform an annual Statement on Standards for Attestation Engagements No. 16 ("SSAE 16") review and make available the “Report on Heartland's Description of Transaction Processing System and on the Suitability on the Design and Operating Effectiveness of its Controls."
We operate our front-end processing, back-end processing, and other product platforms in two geographically dispersed outsourced data centers located in Texas and California. We establish system service level operational thresholds based on our large national merchants' requirements, and regularly exceed those levels, with system availability of greater than 99.9%. To achieve this standard, transactions are mirrored between the two data centers, and each center has the capacity to handle our full merchant transaction load. This duplicate processing capability ensures uninterrupted transaction processing during maintenance windows and other times processing may be interrupted in one data center. We regularly process through both data centers.
Sponsor Banks
Because we are not a ''member bank'' as defined by Visa and MasterCard, in order to process and settle these bankcard transactions for our merchants, we have entered into sponsorship agreements with member banks. Visa and MasterCard rules restrict us from performing funds settlement or accessing merchant settlement funds and require that these funds be in the possession of the member bank until the merchant is funded.
A sponsorship agreement permits us to route Visa and MasterCard bankcard transactions under the member bank's control and identification numbers to clear credit and signature debit bankcard transactions through Visa and MasterCard. A sponsorship agreement also enables us to settle funds between cardholders and merchants by delivering funding files to the member bank, which in turn transfers settlement funds to the merchants' bank accounts. These restrictions place the settlement assets and liabilities under the control of the member bank.
The sponsorship agreements with the member banks require, among other things, that we abide by the bylaws and regulations of the Visa and MasterCard networks. If we were to breach a sponsorship agreement, the sponsor banks can terminate the agreement and, under the terms of the agreement, we would have 180 days to identify an alternative sponsor bank. As of December 31, 2015, we have not been notified of any such issues by our sponsor banks, Visa or MasterCard.
At December 31, 2015, we were party to three bank sponsorship agreements.
• | Processing for the majority of our small and mid-sized merchants (referred to as "Small and Midsized Enterprises," or “SME merchants”) is performed under a February 8, 2012, sponsorship agreement with Wells |
6
Fargo Bank, N.A. ("WFB"). The WFB sponsorship agreement was in effect until February 8, 2016 and would have automatically renewed for three years unless either party provided written notice of non-renewal to the other party. On November 5, 2015, we provided written notice of non-renewal to WFB. Under the terms of the WFB sponsorship agreement, we have up to six months beyond February 8, 2016 to complete a conversion of its SME merchants to another sponsorship arrangement.
On November 5, 2015, we entered into a sponsorship agreement with Deutsche Bank Trust Company Americas ("Deutsche Bank") for our SME merchants. We are highly confident we will complete the conversion of our SME merchants to the Deutsche Bank sponsorship arrangement within the six-month conversion period beginning February 8, 2016. The sponsorship agreement with Deutsche Bank involves substantially the same terms as applied in the February 8, 2012 agreement with WFB. The agreement with Deutsche Bank is for a five-year term expiring on November 5, 2020 and will automatically renew for successive one-year periods unless either party provides six months written notice of non-renewal to the other party.
• | On November 23, 2009, we entered into a sponsorship agreement with The Bancorp Bank ("TBB") to sponsor processing for our Network Services merchants, which are predominantly petroleum industry merchants of all sizes (referred to as "Network Services Merchants"), and since October 2013, certain of our SME merchants. In August 2015, the agreement with TBB automatically renewed until February 2017, with subsequent one-year auto-renewal periods, unless either party provides six months written notice of non-renewal to the other party. |
• | On March 24, 2011, we entered into a sponsorship agreement with Barclays Bank Delaware to sponsor processing for certain of our large national merchants. The original agreement with Barclays Bank Delaware would have expired in March 2016; however, in September 2015, the agreement with Barclays Bank Delaware automatically renewed until March 2017. In January 2016, we signed an extension of this agreement, which will now expire in March 2021. The agreement will continue to automatically renew for successive one-year periods thereafter, unless either party provides six months written notice of non-renewal to the other party. |
The following is a breakout of our total Visa and MasterCard settled card processing volume for the month of December 2015 by percentage processed under our individual bank sponsorship agreements:
% of | December 2015 | |
Sponsor Bank | Bankcard Processing Volume | |
Wells Fargo Bank, N.A. | 75% | |
The Bancorp Bank | 18% | |
Barclays Bank Delaware | 7% | |
Customer Acquisition
Unlike many of our competitors who rely on Independent Sales Organizations ("ISOs") or salaried salespeople and telemarketers, we have built a direct, primarily commission-based, sales force. Our sales model divides the United States into nine primary markets overseen by Senior Vice Presidents and Vice Presidents of Sales. These Senior Vice Presidents and Vice Presidents are responsible for hiring Relationship Managers and increasing the sales of our products in their markets.
We measure the overall production of our sales force by new gross margin installed, which reflects the expected annual gross profit from a merchant contract after deducting processing and servicing costs associated with that revenue. We measure installed margin primarily for our SME card processing, payroll processing and loyalty and gift card marketing businesses. In 2015, our newly installed gross margin for the year increased 21.4% from the gross margin we installed during the year ended December 31, 2014 an increase from 17.3% growth achieved in 2014. We attribute this increase in newly installed gross margin to higher volumes and margins at newly installed merchants and improved individual productivity achieved by our salespersons, as well as growth in our sales force. Our SME sales force included Relationship Managers, Territory Managers, and Senior Product Advisors ("SPAs"), amounted to 1,240 and 985 at December 31, 2015 and 2014, respectively. We expect to drive increases in year-over-year installed margin in future periods primarily by increasing the number of SPAs and Relationship and Territory Managers.
We designed our sales force compensation structure to motivate our Relationship Managers to establish profitable long-term relationships with low-risk merchants and create a predictable and recurring revenue stream. Compensation for Relationship Managers is entirely commission-based, with commissions paid as a percentage of the financial value of new merchant accounts installed, which is measured in terms of the annual gross margin we estimate we will receive from the
7
merchant accounts installed. This is calculated by deducting the cost of processing (on a per-transaction basis) and servicing (measured in dollars per month) from the expected first-year net revenue the account is expected to generate.
The Relationship Manager and SPA generally will be paid a signing bonus equal to 50% of the first 12 months' estimated gross margin. The Relationship Manager and SPA will also receive, beginning the month installed, 15% and 20%, respectively, of the gross margin generated from the merchant each month as residual commissions for as long as the merchant remains our customer.
In addition, the Division Manager will receive an amount equal to 25% of the amount paid to the Relationship Manager and SPA (split with a Territory Manager, if one exists for the account). The Senior Vice Presidents and Vice Presidents will receive an amount equal to 25% of the amount paid to the Division Manager. For example, if an SME merchant account has $1,000 of estimated annual gross margin for the first 12 months and estimated monthly gross margin of $83.33, our sales force would be compensated as follows:
Signing Bonus: | ||||||
Estimated gross margin for first 12 months | $ | 1,000 | ||||
Signing bonus paid to: | ||||||
Relationship Manager | $ | 500 | 50.0 | % | ||
Division Manager (plus Territory Manager) | $ | 125 | 12.5 | % | ||
SVP/VP | $ | 31 | 3.13 | % | ||
Residual Commission: | ||||||
Estimated monthly gross margin | $ | 83.33 | ||||
Monthly residual commission paid to: | ||||||
Relationship Manager | $ | 12.50 | 15.0 | % | ||
Division Manager (plus Territory Manager) | $ | 3.12 | 3.75 | % | ||
SVP/VP | $ | 0.78 | 0.94 | % | ||
Marketing
Our marketing efforts have historically focused on industry verticals and marketing partnerships. We focus our marketing efforts on industries in which we believe our direct sales model is most effective and on merchants with certain key attributes. These attributes include owners who are typically on location, interact with customers, value a local sales presence, and consult with trade associations and other civic groups to make purchasing decisions.
We also determine which additional markets to enter into based on the following criteria:
•Average potential customer revenue;
•Number of locations to be serviced;
•Underwriting risk; and
•Required technological upgrades.
We have focused significantly on the hospitality industry and, in particular, independent restaurants. The number of restaurants to which we provide our payment processing services was approximately 43,800 as of December 31, 2015.
We have also historically had success in marketing our products and services through relationships with key trade associations, agent banks and value-added resellers.
As of December 31, 2015, we had preferred partner agreements with more than 250 trade associations. Of these partnerships, 48 are restaurant associations, including 46 state restaurant associations, the National Restaurant Association and the Counsel of State Restaurant Associations and another 20 are state lodging associations.
In exchange for an association's endorsements and recommendation of our products and services to their members, and upon the installation of a new merchant that is a member of the association, we pay to the trade association a signing bonus and residual commission.
We offer programs to banks across the United States that allow them access to leverage our extensive sales and support teams and other resources. The program provides our partner banks a source to refer their customers for merchant services as well as payroll processing and other electronic payment processing services. We offer on-site sales, training, installation, and ongoing service and support to the referred merchants. In exchange for a bank's endorsement of our products
8
and services, we typically pay the bank a monthly residual fee based on the referred merchant's processing volumes or margin. As of December 31, 2015, we provide these services to more than 1,500 banking locations in the United States.
In order to further market our products and services, we enter into arrangements with value-added resellers and third-party software developers. Value-added resellers typically sell complementary products and services such as hardware and software applications and POS hardware, software and communication network services to merchants in markets similar to ours. Our agreements with value-added resellers provide that, in exchange for their endorsement of our products and services and upon the installation of a new merchant referred by them, we will pay the value-added reseller a portion of the sales commission from the Relationship Manager responsible for that merchant and/or a transaction fee.
As we continue to expand our product offerings, we intend to introduce capabilities that will allow our systems to be compatible with third-party software developers while working to reduce merchants' third-party up-front costs for processing with us. We are committed to passing along our cost efficiencies to our merchants and their POS providers to encourage joint technology partnerships.
Merchant and Transaction Risk Management
We focus our sales efforts on low-risk bankcard merchants and have developed systems and procedures designed to minimize our exposure to potential merchant losses.
We have developed significant expertise in industries that we believe present relatively low risks as the customers are generally present and the products or services are generally delivered at the time the transaction is processed. These industries include restaurants, brick-and-mortar retailers, professional service providers, convenience and liquor stores, automotive sales and repair shops, gas stations, lodging establishments and others. The following table summarizes our SME merchants by industry as of December 31, 2015.
As of | |
Industry | December 31, 2015 |
Restaurants | 24.0% |
Retail | 18.2% |
Professional Services | 12.8% |
Convenience, Fast Food & Liquor | 11.5% |
Automotive | 7.8% |
Lodging | 2.9% |
Petroleum | 1.7% |
Other | 21.1% |
Effective risk management helps us minimize merchant losses relating to chargebacks, reject losses and merchant fraud for the mutual benefit of our merchants and ourselves. We believe our knowledge and experience in dealing with attempted fraud has resulted in our development and implementation of effective risk management and fraud prevention systems and procedures for the types of fraud discussed in this section. In 2015, 2014 and 2013, we experienced merchant losses of $2.9 million, $7.3 million and $3.1 million, respectively, or 0.31 basis points, 0.90 basis points and 0.41 basis points, respectively, of our SME card processing volume. In 2014, our losses included $4.6 million resulting from chargebacks from a single merchant who entered bankruptcy in the fourth quarter.
We employ the following systems and procedures to minimize our exposure to merchant and transaction fraud:
Underwriting. Our sales force sends new applications to their regional service team for scoring and account set up. Higher-risk applications are routed to our credit underwriting department for review and screening. Our underwriting department's review of these applications serves as the basis for our decision whether to accept or reject a merchant account. The review also provides the criteria for establishing cash deposit or letter of credit requirements, processing limits, average transaction amounts and pricing, which assists us in monitoring merchant transactions for those accounts that exceed those pre-determined thresholds. The criteria set by our underwriting department also assist our risk management staff in advising merchants with respect to identifying and avoiding fraudulent transactions. Depending upon their experience level, our underwriting staff has the authority to render judgment on new applications or to take additional actions such as adjusting processing limits supported by prior processing history, analyzing average charge per transaction information or establishing cash deposits/letters of credit, reserves, and delayed funding requirements for new and existing merchants. Our underwriting department prepares accounts that are risk-sensitive for our Credit Committee review. The Credit Committee consists of a Manager of Underwriting, Manager of Risk Review, Director of Underwriting and Vice President of HSC Operations. Merchant accounts that exceed certain committee thresholds are reviewed by our CEO, Vice Chairman, Group President, or Chief of Operations. Our sponsor
9
banks also review and approve our merchant underwriting policies and procedures to ensure compliance with Visa and MasterCard operating rules and regulations.
Merchant Monitoring. We employ several levels of merchant account monitoring to help us identify suspicious transactions and trends. Daily merchant activity is sorted into a number of customized reports by our systems. Our risk management team reviews any unusual activity highlighted by these reports, such as larger than normal transactions or credits, and monitors other parameters that are helpful in identifying suspicious activity. We have daily windows to decide if any transactions should be held for further review, which provides us time to interview a merchant or issuing bank to determine the validity of suspicious transactions. We have also developed a fraud management system for HPS Exchange that is fully integrated with our internal customer relationship management software and has detailed review capabilities to further streamline our monitoring of those transactions. We also place merchants who require special monitoring on alert status and have engaged a web crawling solution that scans all merchant websites for content and integrity.
Investigation and Loss Prevention. If a merchant exceeds any parameters established by our underwriting and/or risk management staff or violates regulations established by the applicable bankcard network or the terms of our merchant agreement, one of our investigators will identify the incident and take appropriate action to reduce our exposure to loss and the exposure of our merchant. This action may include requesting additional transaction information, withholding or diverting funds, verifying delivery of merchandise or even deactivating the merchant account. Additionally, Relationship Managers may be instructed to retrieve equipment owned by us.
Collateral. We require some of our merchants to establish cash deposits or letters of credit that we use to offset against liabilities we may incur. We hold such cash deposits or letters of credit for as long as we are exposed to a loss resulting from a merchant's payment processing activity. In addition, we maintain a five-day delayed deposit policy on transactions processed by our Internet merchants and newly established merchants who have not previously processed bankcards to allow for additional risk monitoring. We also place a “hold” on batches containing questionable transactions, diverting the funds to a separate account pending review. As of December 31, 2015, these cash deposits and delayed and “held” batches totaled approximately $6.6 million.
Industry Overview
The payment processing industry provides merchants with credit, debit, gift and loyalty card and other payment processing services, along with related information services. The industry continues to grow as a result of wider merchant acceptance, increased consumer use of bankcards and advances in payment processing and telecommunications technology. According to The Nilson Report, total expenditures for all card type transactions by U.S. consumers are expected to grow to $6.6 trillion by 2019, representing a compound annual growth rate of 8.3%. The proliferation of bankcards has made the acceptance of bankcard payments a virtual necessity for many businesses, regardless of size, in order to remain competitive. This increased use of bankcards and prepaid cards, payment processing via smart phones, enhanced technology initiatives, efficiencies derived from economies of scale and the availability of more sophisticated products and services to all market segments has resulted in a highly competitive and specialized industry.
The payment processing industry is dominated by a small number of large, fully integrated payment processors that sell directly to, and handle the processing needs of, the nation's largest merchants. These integrated processors serve a broad market spectrum from large to small merchants and some provide banking, ATM and other payment-related services and systems in addition to card payment processing. Large national merchants with multiple locations and high volumes of bankcard transactions typically demand and receive the full range of payment processing services at low per-transaction costs.
SME merchants' payment processing needs generally are served by a large number of smaller payment processors, including banks and ISOs, that generally procure most of the payment processing services they offer from large payment processors. It is difficult, however, for banks and ISOs to customize payment processing services for the SME merchant on a cost-effective basis or to provide sophisticated value-added services.
Accordingly, services to the SME merchant market segment historically have been characterized by basic payment processing without the availability of the more customized and sophisticated processing, information-based services or customer service that are offered to large merchants. The continued growth in bankcard transactions is expected to cause SME merchants to increasingly value sophisticated payment processing and information services similar to those provided to large merchants. Heartland employees handle all aspects of the merchant’s payments needs, including sales, underwriting and risk management and servicing, as well as ancillary services like equipment deployment and repair and transaction tokenization and encryption services.
10
We compete with other providers of payment processing services on the basis of the following factors:
• Sales force size and effectiveness
• Range of product offering
• Quality of service
• Reliability of service
• Professional association endorsements
• Ability to evaluate, undertake and manage risk
• Speed in approving merchant applications
• Price
• Brand name
Some of our large competitors have substantially greater capital resources than we have. Others operate as subsidiaries of financial institutions or bank holding companies, which could allow them to own and conduct depository and other banking activities that we do not have the regulatory authority to own or conduct. Further, since they are affiliated with financial institutions or banks, these competitors may not incur the costs associated with being sponsored by a bank for registration with card networks and they can settle transactions quickly for the merchants with a deposit account at the bank. In addition, large, global technology companies are emerging in the card payment space.
Competitive Advantage
We believe our competitive strengths related to card payment processing, particularly for SME merchants, include the following:
• | Large, Experienced, Efficient, Direct Sales Force |
We sell and market our SME card payment processing services through a nationwide direct sales force of 1,069 Relationship Managers and Territory Managers, and 171 Senior Product Advisors, as of December 31, 2015, who work exclusively for us. Our sales professionals have local merchant relationships and industry-specific knowledge that allow them to effectively compete for merchants. These relationships are also supported by our customer service and support teams located in our service center. We believe our control of sales, underwriting and servicing both enhances our SME merchant retention and reduces our risks. We also believe that internally generated SME merchant contracts generally are of a higher quality and are more predictable than contracts acquired from third parties and the costs associated with such contracts generally are lower than the costs associated with contracts acquired from third parties.
Many of our competitors rely on third party distribution channels, including ISO's and Value-Added Resellers (“VARs”) that often generate merchant accounts for multiple payment processing companies, maintain ownership of the merchant relationships and may demand, over time, an increasing level of compensation from their processors.
We grow our SME payment processing business exclusively through internal expansion by generating new SME merchant contracts submitted by our own direct sales force.
• | Strong Position and Substantial Experience in Our Target Markets |
As of December 31, 2015, we were providing card payment processing services to 182,526 active SME merchants located across the United States. We believe our understanding of the needs of SME merchants and the risks inherent in doing business with them, combined with our efficient direct sales force, provides us with a competitive advantage over larger service providers that access this market segment through third-party sales channels. We also believe that we have a competitive advantage over service providers of a similar or smaller size that may lack our extensive experience and resources, and so do not benefit from the economies of scale that we have achieved.
At December 31, 2015, we also provided card payment processing services to approximately 3,194 Network Services merchants with approximately 43,987 locations. These Network Services merchants are predominantly in the petroleum industry. We believe that our understanding of the processing needs of petroleum merchants and the products we offer them provides us with a competitive advantage.
11
• | Expertise and Focus |
Historically, we have focused our sales efforts on SME merchants who have certain key attributes and on industries in which we believe our direct sales model is most effective and the risks associated with card processing are relatively low. These attributes include owners who are typically on location, interact with customers in person, value a local sales and servicing presence and often consult with trade associations and other civic groups to help make purchasing decisions.
To further promote our products and services, we have entered into referral arrangements with various trade associations, with an emphasis on restaurant and hospitality groups. We believe that these partnerships have enabled us to gain exposure and credibility within the restaurant and hospitality industries and have provided us with opportunities to market our products to new merchants.
Our historical focus on SME merchants has diversified our merchant portfolio and we believe has reduced the risks associated with revenue concentration. In 2015, no single SME merchant represented more than 0.42% of our total SME Visa and MasterCard processing volume, consistent with prior years.
Our Network Services business has further diversified our total merchant portfolio, adding a substantial base of large national merchants, predominantly in the petroleum industry.
• | Merchant-Centric Culture |
We have built a corporate culture and established practices that we believe improve the quality of services and products we provide to our merchants. We developed and endorsed the Merchant Bill of Rights, an advocacy initiative that details ten principles we believe should characterize all merchants' processing relationships. The Merchant Bill of Rights allows our sales team to differentiate our approach to bankcard processing and we believe that a focus on these principles will enhance our merchant relationships, and so reduce merchant attrition. We believe that our culture and practices allow us to maintain strong merchant relationships and differentiate ourselves from our competitors in obtaining new merchants.
Our merchant-centric culture spans from our sales force, which maintains a local market presence to provide rapid, personalized customer service, through our service center, which is segmented into regional teams to optimize responsiveness, and to our technology organization, which has developed a customer management interface and information system that alerts our Relationship Managers to any problems a merchant has reported and provides them with detailed information on the merchants in their portfolio. Additionally, we believe that we are one of the few companies that fully disclose our pricing to merchants. We think this approach contributes substantially to building long-term merchant relationships.
• | Scalable Operating Structure |
Our scalable operating structure generally allows us to expand our operations without proportionally increasing our fixed and semi-fixed support costs. In addition, our front-end and back-end card processing platforms were designed with the flexibility to support significant growth and drive economies of scale with low incremental transaction costs. Most of our operating costs are tied to the number of individuals we employ. We have in the past used, and expect in the future to use, technology to leverage our personnel, which should cause our personnel costs to increase at a lower rate than our card processing volume.
• | Advanced Technology |
We employ information technology systems, which use the Internet to improve management reporting, enrollment processes, customer service, sales management, productivity, merchant reporting and problem resolution. We believe that these systems help attract both new merchants and Relationship Managers and provide us with a competitive advantage over many of our competitors who rely on less flexible legacy systems. We also offer a full suite of data security solutions, including encryption, tokenization and EMV, all wrapped with a data breach warranty that responds to an increasingly security-focused SME merchant.
We actively leverage the latest advances in technology to provide the best payments experience for merchants within liability levels that we believe exceed industry norms.
12
Campus Solutions
Campus Solutions provides integrated commerce solutions, payment processing, higher education loan services and open and closed-loop payment solutions to higher-education institutions.
TouchNet provides integrated commerce solutions to more than 700 higher education institutions serving over 7 million students, which is nearly one-third the higher education enrollment in the United States. Our offering of an end-to-end integrated commerce and payments solution to the higher education market is unmatched in the industry. Since 1989, TouchNet has been a pioneer in delivering innovative payment solutions. Colleges and universities have relied on TouchNet to unify and secure payment and related business transactions throughout the campus enterprise. TouchNet enables institutions of higher education to process and manage the myriad of campus payments—from student tuition to parking to alumni donations to campus events—on one platform and through one service provider.
Educational Computer Systems, Inc. ("ECSI") provides a suite of solutions to support administrative services for higher education including student loan payment processing, delinquency and default services, refund management, tuition payment plans, electronic billing and payment, tax document services, and business outsourcing. ECSI's core services support the management, payment and collection of student loans including Perkins and institutional financing. Since its founding in 1972, ECSI has printed and mailed 500 million billing statements, processed over 400 million tuition and loan payments and managed accounts for approximately 7 million students and borrowers. ECSI also processes nearly 5 million tax documents every year.
Campus Solutions also provides open- and closed-loop payment solutions for college or university campuses to efficiently process small-value electronic transactions. Campus Solutions currently serves more than 3,400 colleges and universities across multiple higher education sectors including nonprofit, for-profit, private, and community colleges.
Besides payment processing, our OneCard product which enables personal identification, door access, cashless vending transactions, cashless laundry, meal plans and cashless printing at campus facilities. In addition, our RefundSelect program, which we introduced in 2010, addresses the major operational needs of campuses by providing an open-loop debit card platform onto which schools load financial aid refunds. At December 31, 2015, we had 61 colleges enrolled in the RefundSelect program. We issued approximately 586,000 refunds totaling approximately $1.2 billion in 2015. We currently have 247 OneCard and RefundSelect college and university accounts.
The Campus Solutions industry is competitive with no single competitor providing the complete set of solutions that we provide. However, companies such as Higher One, Nelnet and Tuition Management Systems are larger competitors that compete with some of the solutions provided by us. Competition is primarily based on the products and services offered, innovation, customer service, reputation and price. Products must be compliant with various government regulations, which impede new, smaller entrants. We believe our Campus Solutions business is well positioned to gain customers and generate additional revenue by selling additional products to our existing base of customers.
The following table summarizes revenue and operating income for Campus Solutions for the years ended December 31, 2015, 2014 and 2013:
Year Ended December 31, | ||||||||||||
2015 | 2014 | 2013 | ||||||||||
(In thousands) | ||||||||||||
Revenue | $ | 117,208 | $ | 61,538 | $ | 36,186 | ||||||
Operating income | 36,293 | 12,653 | 3,930 | |||||||||
Heartland School Solutions
Heartland School Solutions provides cafeteria POS solutions to more than 34,000 schools, making us the largest provider of kindergarten through 12th grade (K-12) food-service technology in the nation. In conjunction with this core POS business, approximately 80% of our customer schools actively use Heartland's online prepayment solutions to allow parents to fund accounts for school lunches or other on-campus activities. Parents can opt to establish recurring payments with customized low balance thresholds, make one-time payments, or simply see what their students ate for lunch that day. With a consistently high annual renewal rate for its POS customers, those platforms serve as a reliable base on which to offer additional value-added products and services. We offer back-office management software, hardware, annual technical support, and training to our customer school districts.
13
Heartland School Solutions has been built through a series of six acquisitions in 2010, 2011, 2012, and 2014. On April 1, 2014, Heartland completed its most recent acquisition in this market, MCS Software. Following the acquisitions, we focused on merging the management and operational structures of the six acquired businesses that make up the School Solutions segment. The more than 200 combined School Solutions professionals now operate under a single management structure and go-to-market strategy. While continuing to maintain certain legacy POS platforms for the foreseeable future, we combined all online prepayment activity into our MySchoolBucks platform, which has more than five and half million registered users. During 2015, we made a significant investment in our consumer-focused marketing strategy in order to encourage more widespread adoption of our online payment products, which, along with our acquisition of MCS Software, resulted in total growth in processing volume of 22% in 2015. As of December 31, 2015, we have over 1.5 million parents who are actively using our online payment products.
The K-12 food service technology industry is competitive, with our largest competitor being Horizon Software International and other smaller, privately held companies. Competition in the K-12 food-service technology industry is primarily based on the products and services offered, innovation, customer service, ease of use, reputation and price. Products must be in compliance with government regulations for schools in the districts we serve. Payment processing is becoming an increasingly important element of the overall offering for schools, which provides us with a competitive advantage, as we are the only payment processor in the K-12 industry. We believe we are well positioned to gain new school customers and generate additional revenue with our existing customers primarily through greater adoption of payment processing services.
The following table summarizes revenue and operating income for Heartland School Solutions for the years ended December 31, 2015, 2014 and 2013:
Year Ended December 31, | ||||||||||||
2015 | 2014 | 2013 | ||||||||||
(In thousands) | ||||||||||||
Revenue | $ | 60,870 | $ | 57,570 | $ | 50,541 | ||||||
Operating income (a) | 23,451 | 10,874 | 16,348 | |||||||||
(a) See Note 1 Organization and Operations in the Notes to the Consolidated Financial Statements
for a discussion of an Out-of-Period Adjustment recorded in the year ended December 31, 2014.
Heartland Payroll Solutions
We operate a full-service nationwide payroll processing service. Our payroll services include check printing, direct deposit, related federal, state and local tax deposits, time clock sales and integrations, accounting documentation, Affordable Care Act ("ACA") reporting and human resources information. In order to improve operating efficiencies and ease of use for our customers and to decrease our own processing costs, we offer electronic and paperless payroll processing that allows an employer to submit its periodic payroll information to us via the Internet. If a customer chooses the online option, all reports and interactions between the employer and Heartland Payroll Solutions can be managed electronically, eliminating the need for cumbersome paperwork. Approximately half of our payroll customers currently submit their information electronically. However, if a customer chooses not to submit their payroll data online, they may submit such information via phone or facsimile. Regardless of input method, clients can choose to have Heartland Payroll Solutions print and ship their payroll package or to receive this information electronically.
On December 31, 2012, we acquired Ovation Payroll, Inc. ("Ovation"), adding more than 10,000 customers to our payroll business. On February 27, 2015, we purchased the stock of Payroll 1 for a $30.0 million cash payment, plus net working capital. The purchase price was financed from the 2014 Revolving Credit Facility. The acquisition of Payroll 1 expanded our existing payroll processing business and customer base by adding 6,573 customers at acquisition. As of December 31, 2015, 2014 and 2013, we provided payroll processing services to 33,937, 25,764 and 24,088 customers, respectively. In 2015, 2014 and 2013, we added 7,302, 5,821 and 5,797 new payroll processing customers, respectively.
We operate a comprehensive payroll management platform, which streamlines all aspects of the payroll process to enable time and cost savings. We consider our payroll platform to be state of the art, enabling us to process payroll on a large scale and provide customizable, cost-effective solutions for businesses of all sizes. It enables faster processing and continuous updates to help businesses remain compliant with payroll, tax, ACA and human resources regulations. The platform features web-hosted access, enabling businesses and their accountants to securely access all payroll data from virtually anywhere with SSL-encryption protection. It also provides robust, easy-to-use reporting for better business analysis. The Heartland Payroll platform is equipped to interface with certain leading providers of accounting services and time and attendance applications, as well as restaurant and retail POS systems. Our platform also includes an Employee Self-Serve web portal that allows employees to review copies of their paychecks, vouchers and payroll detail.
14
The payroll processing services industry is highly competitive, with services provided by outsourced providers like Heartland Payroll Solutions, but also accounting firms and self-service options. Overall the industry is comprised of two major segments: large national full-service payroll providers, and numerous much smaller national, regional, local and online providers. While large national payroll service firms such as ADP, Paychex, Ceridian, and Intuit are highly recognized, the full service payroll industry market is very fragmented. We compete with both segments.
Competition in the payroll processing industry is primarily based on service responsiveness, payroll accuracy, quality, reputation, range of product offering and price. Continual changes in tax laws and regulations are inherent to the payroll industry. When combined with the market demand for the latest in technology, third party integration and platform development, smaller competitors may lack the technical and financial resources to meet these needs. We believe Heartland Payroll Solutions is well positioned to continue to gain market share from those challenged providers. Additionally, we believe our competitive position is enhanced through our ability to offer payment processing services to payroll customers, and vice versa, and thus offer an integrated services suite, which will provide our customers with efficient and convenient options.
The following table summarizes revenue and operating income for Heartland Payroll Solutions for the years ended December 31, 2015, 2014 and 2013:
Year Ended December 31, | ||||||||||||
2015 | 2014 | 2013 | ||||||||||
(In thousands) | ||||||||||||
Revenue | $ | 69,037 | $ | 50,394 | $ | 44,565 | ||||||
Operating income | 9,465 | 9,076 | 3,404 | |||||||||
Heartland Commerce
We provide the hospitality and retail industry with leading-edge POS solutions, payments processing capabilities and other adjacent business service applications through our Heartland Commerce business. Heartland Commerce is comprised of Xpient Solutions, LLC (“Xpient” acquired in October 2014); Merchant Software Corporation (referred to as "Liquor POS" which was acquired in February 2014); Automation, Inc. (d/b/a “pcAmerica” acquired in January 2015); Dinerware, Inc. (“Dinerware” acquired in February 2015) and Menusoft Systems Corporation (a.k.a. “Digital Dining” acquired in October 2015) to the Heartland Commerce business. Heartland Commerce is in the process of developing cloud-based POS systems that complement our well-established on-premise POS solutions. Digital Dining offers restaurants the convenience of a handheld POS on an iPhone, iPod and iPad in a hybrid environment with conventional fixed terminals, and is also used by restaurateurs for table management, delivery, reservations, labor scheduling, inventory and loyalty programs. Heartland Commerce net revenue was $34.4 million in 2015 which includes $15.0 million in net revenue from the 2015 acquisitions described above. Heartland Commerce had a net operating loss of $2.1 million for 2015.
The POS solutions industry has become increasingly competitive, and integrated with payments, with some of the large POS companies forging key partnerships with payments companies, and other merchant acquirers selling their services through POS VARS. As a way to surpass the competition, Heartland’s strategy is to not only establish partnerships with POS dealers but to also own select best of breed POS technologies. This enables us to offer a truly integrated POS platform that becomes the focal point for many of Heartland's value added applications including payment processing, table management, payroll, security, and online ordering.
Micropayments
We provide services to the small-value transaction market through our Micropayments business. We manufacture and sell solutions comprising unattended online wireless credit card-based payment systems, and unattended value top-up systems for off-line closed-loop smart (chip) card based payment systems. Our electronic cash systems provide small-value transaction processing for commercial laundry machines and vending machines, which are located in apartment laundries, cruise ships, corporate and university campuses, and penitentiaries. These systems offer consumers convenient ways to use their debit and credit cards to purchase and reload electronic cash cards, and to spend the value on the card for small-value purchases in both attended and unattended POS locations. In addition, we provide merchants financial settlement between the electronic cash card issuer and the vendor/merchant who accepts the card as payment. Our WaveRider system allows laundry patrons to use their debit or credit card to pay directly for their laundry right at the washer or dryer, simply by swiping their card. We believe there is increasing consumer demand for, and merchant interest in, card-based solutions for small denomination transactions, and expect to make additional investments in the future in developing solutions in this area.
15
The unattended payments industry is competitive with the largest competitor being USA Technologies. Other competitors include vending machine manufacturers and privately held companies focusing on specific vertical markets. Competition is primarily based on the products and services offered, ease of installation and setup, innovation and price. As payment processing is a core component of the services offered, we believe that we have a distinct advantage over many of our competitors. As unattended payments become more commonplace and expected, we believe that we will continue to add new customers.
The following table summarizes revenue and operating income for Micropayments for the years ended December 31, 2015, 2014 and 2013:
Year Ended December 31, | ||||||||||||
2015 | 2014 | 2013 | ||||||||||
(In thousands) | ||||||||||||
Revenue | $ | 18,638 | $ | 16,950 | $ | 12,634 | ||||||
Operating income | 4,333 | 3,568 | 1,336 | |||||||||
Heartland Marketing Solutions
Heartland Marketing Solutions ("HMS") delivers a full suite of consumer engagement solutions for merchants. These include mobile and card-based gift and rewards marketing services to merchant locations through real-time communications with the merchant POS, enabling us to leverage existing installations across our merchant base and enhancing our overall value proposition to the merchant community. In addition to gift and rewards, HMS also delivers vertical use case driven mobile applications, such as the Heartland ToGo product, a mobile and online ordering solution that is integrated with gift and rewards. In addition to servicing the SME merchant market, HMS also provides these solutions to regional and national brands.
The Marketing Solutions space continues to evolve and become even more relevant as merchants are looking for deeper engagement with their customers. In 2015, HMS launched several enhancements such as a suite of Application Programming Interfaces ("APIs"), integration into several mobile application providers, a full suite of digital card distribution to the SME space and has developed the groundwork for a robust data and analytics solution. As of December 31, 2015, Heartland Marketing Solutions has 12,954 active merchant locations and loaded $458 million on approximately 12.5 million consumer gift cards, compared to 11,669 active merchant locations and $340 million loaded on approximately 9.6 million cards as of December 31, 2014.
In addition, there has been prolific emergence of mobile application providers to enable merchants to create a branded mobile application to compete with other large brands. HMS has reacted by developing a robust set of APIs to enable integration in the fast-moving market to allow for quick integration into multiple third-party solutions. This option enables merchants to partner with any application developer to integrate gift and rewards into the application of their choosing. HMS continues to see traction in vertical use case driven integrations, including the continued sales and growth of Heartland ToGo, a mobile and online ordering solution with embedded gift and rewards. As of December 31, 2015, Heartland has boarded more than 175 merchants on the Heartland ToGo solution.
The core gift space, historically defined as merchant branded gift card, is highly competitive. Most solutions are currently sold and provisioned by merchant processors. Competition usually focuses on one of two markets depending on their merchant base: medium to large merchant providers where solutions are highly flexible, feature-rich and allow for customization, and small merchant providers where solutions are still feature-rich, but have been streamlined to minimize implementation costs. Competition includes First Data Gift Card, Valutec (owned by Fidelity National Information Services) and Givex. We believe that very few gift card providers have a robust rewards platform, so merchants usually have to go to two different providers to satisfy their gift and rewards needs. Heartland Marketing Solutions is one of the few providers whose platform was specifically built to support both gift and rewards implementations.
The following table summarizes revenue and operating income (loss) for HMS for the years ended December 31, 2015, 2014 and 2013:
Year Ended December 31, | ||||||||||||
2015 | 2014 | 2013 | ||||||||||
(In thousands) | ||||||||||||
Revenue | $ | 10,015 | $ | 9,364 | $ | 9,649 | ||||||
Operating income (loss) | 211 | 378 | (248 | ) | ||||||||
16
Intellectual Property
Most of our services and products are based on proprietary software or processes that are updated to meet customer needs and remain competitive. Our proprietary software is critical, as it allows us to offer distinctive services and products to customers, which differentiates us from our competitors. We own and are pursuing numerous patents with the United States Patent and Trademark Office. In addition, we own various trademarks and have applied for numerous others.
WHERE YOU CAN GET ADDITIONAL INFORMATION
We file annual, quarterly and current reports, proxy statements and other information with the SEC. You may read and copy our reports or other filings made with the SEC at the SEC's Public Reference Room, located at 100 F Street, N.E., Washington, DC 20549. You can obtain information on the operation of the Public Reference Room by calling the SEC at 1-800-SEC-0330. You can also access these reports and other filings electronically on the SEC's web site, www.sec.gov.
In addition, certain of our SEC filings, including our Annual Report on Form 10-K, our Quarterly Reports on Form 10-Q and Current Reports on Form 8-K, and amendments to these reports, can be viewed, free of charge, and printed from the investor information section of our website at www.heartlandpaymentsystems.com, as soon as reasonably practicable after filing with the SEC. Certain materials relating to our corporate governance, including our code of ethics for chief executive and senior financial officers, code of business conduct and ethics, corporate governance guidelines and board committee charters, are also available in the investor relations section of our website.
The information on the websites listed above, is not and should not be considered part of this Annual Report on Form 10-K or any other report or document we file with the SEC and is not incorporated by reference in this document or any other report or document we file with the SEC. These websites are, and are only intended to be, inactive textual references.
In May 2015, we submitted to the New York Stock Exchange the CEO certification required by Section 303A.12(a) of the New York Stock Exchange Listed Company Manual without qualification.
ITEM 1A. RISK FACTORS
An investment in our common stock involves a high degree of risk. You should consider carefully the following risks and other information contained in this Annual Report on Form 10-K and other SEC filings before you decide whether to buy our common stock. If any of the events contemplated by the following discussion of risks should occur, our business, results of operations and financial condition could suffer significantly. As a result, the market price of our common stock could decline, and you may lose all or part of the money you paid to buy our common stock.
Risks Relating to the Merger with Global
The failure to complete or delays in completing the merger with Global could adversely affect our business and our stock price.
Consummation of the merger with Global is subject to customary closing conditions, including approval by our stockholders. There can be no assurance that these conditions will be satisfactorily met or validly waived, or that the Company and Global will be able to successfully consummate the merger, on the anticipated terms or at all. We will have incurred significant costs, including the diversion of management resources and transaction-related expenses for which we will receive little or no benefit, if the merger is not consummated. The Merger Agreement may be terminated by either party if the merger is not completed on or before June 15, 2016. In addition, the Merger Agreement contains certain other termination rights for both us and Global. A failed transaction may result in negative publicity. Any of these events, individually or in combination, could have an adverse effect on our results of operations and financial condition.
The pending merger could adversely affect our business, financial results and operations, including our relationships with customers, vendors and employees.
The proposed merger with Global could cause material disruptions in and create uncertainty surrounding our business. This could affect our relationships with customers, vendors and employees, which could have an adverse effect on our business, financial results and operations. In particular, we could lose important personnel if some employees decide to leave in light of the proposed Acquisition. We could potentially lose customers or suppliers, or our customers or suppliers could modify their relationships with us in an adverse manner. In addition, we have devoted-and will continue to devote significant management resources to complete the merger. This may cause our business and operating results to suffer.
17
The Merger Agreement also places restrictions on how we conduct our business before the merger is completed. These restrictions could result in our inability to respond effectively, and in a timely manner, to competitive pressures, industry developments and future opportunities. This could harm our business, financial results and operations. See “Item 7. Management’s Discussion and Analysis of Financial Condition and Results of Operations — Agreement and Plan of Merger” for more information about the proposed merger with Global and its impact on our business, including restrictive covenants relating to our operations.
Risks Relating to Our Business
Unauthorized disclosure of merchant, cardholder or other user data, whether through breach of our computer systems (such as the Processing System Intrusion discussed in Item 3 Legal Proceedings), cyber-attack or otherwise, could expose us to liability and protracted and costly litigation, as well as harm our reputation.
We collect and store sensitive data about merchants, including names, addresses, social security numbers, driver's license numbers and checking account numbers. In addition, we maintain a database of cardholder and other user data relating to specific transactions, including bankcard numbers, in order to process the transactions and for fraud prevention. Any unauthorized use, cyber-attack, unauthorized intrusion, malicious software infiltration, network disruption, denial of service, corruption of data, or theft of non-public or other sensitive information, similar act by a malevolent party, or inadvertent acts by our own employees, could result in the disclosure or misuse of confidential or proprietary information, and could have a materially adverse effect on our business operations, or that of our merchants. Additionally, any loss of data by us or our merchants could result in significant fines and sanctions by the card networks or governmental bodies, which could have a material adverse effect upon our business, financial position and/or results of operations. In addition, a significant breach could result in our computer systems being prohibited from processing transactions for card networks.
Our computer systems have been, and could be in the future, subject to penetration by hackers and our encryption of data may not prevent unauthorized use. In this event, we may be subject to liability, including claims for unauthorized purchases with misappropriated bankcard information, impersonation or other similar fraud claims. We could also be subject to liability for claims relating to misuse of personal information, such as unauthorized marketing purposes. These claims also could result in protracted and costly litigation. In addition, we could be subject to penalties or sanctions from the card networks, or our reputation could be harmed, which may deter clients from using our services.
Although we generally require that our agreements with our service providers who have access to merchant and customer data include confidentiality obligations that restrict these parties from using or disclosing any customer or merchant data except as necessary to perform their services under the applicable agreements, we cannot assure you that these contractual measures will prevent the unauthorized use or disclosure of data. In addition, our agreements with financial institutions require us to take certain protective measures to ensure the confidentiality of merchant and consumer data. Any failure to adequately enforce these protective measures could result in protracted and costly litigation.
The Heartland Secure solution could be breached at one or many merchant locations. In the event of a breach of the Heartland Secure solution, we could face material financial liability.
In 2015, we began offering a warranty to merchants using the Heartland Secure™ solution, a comprehensive credit/debit card secure payment solution combining EMV, the Heartland E3® end-to-end encryption technology and tokenization. Through the warranty, Heartland agrees not to pass on to covered merchants those costs, fees and fines from card brands that result from a breach.
The Heartland Secure solution could be breached at one or many merchant locations. In the event of a breach of the Heartland Secure solution, we could face liability for the costs associated with the breach, and the fees and fines assessed by the card brands. In addition, we may face liability arising from: (i) claims for unauthorized purchases with misappropriated bankcard information, (ii) impersonation or other related fraud claims; (iii) products liability claims; and/or (iv) breach of warranty claims. We could face protracted and costly litigation relating to such claims. If the Heartland Secure solution is breached, our reputation could be harmed, which may deter clients from using our services, and such a breach may have a material adverse effect upon our financial position and results of operations.
Unauthorized disclosure of customer, educational institution, employee or other user data from our business services other than our Payment Processing business, whether through breach of our computer systems, cyber-attack or otherwise, could expose us to liability and protracted and costly litigation, as well as harm our reputation.
We collect and store sensitive data about customers, educational institutions and employees, including names, addresses, social security numbers, driver's license numbers and checking account numbers. Any unauthorized use, cyber-
18
attack, unauthorized intrusion, malicious software infiltration, network disruption, denial of service, corruption of data, or theft of non-public or other sensitive information, similar act by a malevolent party, or inadvertent acts by our own employees, could result in the disclosure or misuse of confidential or proprietary information, and could have a materially adverse effect on our business operations, or that of our customers.
If we fail to comply with the applicable requirements of the Visa and MasterCard bankcard networks, Visa or MasterCard could seek to fine us, suspend us or terminate our registrations. Fines could have an adverse effect on our operating results and financial condition, and if these registrations are terminated, we will not be able to conduct our primary business.
On occasion, we have received notices from Visa and MasterCard of non-compliance and fines, which have typically related to excessive chargebacks by a merchant or data security failures on the part of a merchant. If we are unable to recover fines from our merchants, we will experience a financial loss. The termination of our registration, or any changes in the Visa or MasterCard rules that would impair our registration, could require us to stop providing Visa and MasterCard payment processing services, which would make it impossible for us to conduct our business on its current scale.
We rely on sponsor banks, which have substantial discretion with respect to certain elements of our business practices, in order to process bankcard transactions. If these sponsorships are terminated and we are unable to secure new bank sponsors, we will not be able to conduct significant portions of our business.
Over 72% of our revenue is derived from processing Visa and MasterCard bankcard transactions. Because we are not a bank, we are not eligible for membership in the Visa and MasterCard networks and are, therefore, unable to directly access the bankcard networks. Instead, Visa and MasterCard operating regulations require us to be sponsored by a member bank in order to process bankcard transactions. We are currently registered with Visa and MasterCard through Wells Fargo Bank N.A. since February 2012, The Bancorp Bank since November 2009, and Barclays Bank Delaware since March 2011.
Our sponsorship agreements with Wells Fargo Bank N.A., The Bancorp Bank and Barclays Bank Delaware expire in February 2016, February 2017 and March 2021, respectively. On November 5, 2015, we entered into a sponsorship agreement with Deutsche Bank for our SME merchants, which will replace the sponsorship agreement with Wells Fargo Bank N.A. The sponsorship agreement with Deutsche Bank expires in November 2020. If our sponsorships are terminated and we are unable to secure another bank sponsor or sponsors, which could arise due to future consolidation of sponsor banks or because sponsor banks exit this line of business, we will not be able to process Visa and MasterCard transactions. Furthermore, some agreements give the sponsor banks substantial discretion in approving certain aspects of our business practices, including our solicitation, application and qualification procedures for merchants, the terms of our agreements with merchants and our customer service levels. Our sponsor banks' discretionary actions under these agreements could be detrimental to our operations.
Current or future bankcard network rules and practices could adversely affect our business.
We are registered with the Visa and MasterCard networks through our bank sponsors as an ISO with Visa and a Member Service Provider with MasterCard. We are currently a sales agent and service agent for American Express and a registered acquirer with Discover. The rules of the bankcard networks are set by their boards, which may be strongly influenced by card issuers, and some of those card issuers are our competitors with respect to these processing services. The rules of the bankcard networks may change from time-to-time. Many banks directly or indirectly sell processing services to merchants in direct competition with us. These banks could attempt, by virtue of their influence on the networks, to alter the networks' rules or policies to the detriment of non-members like us. The termination of our registration or our status as an ISO or Member Service Provider, or any changes in card network or issuer rules that limit our ability to provide payment processing services, could have an adverse effect on our bankcard processing volumes, revenues or operating costs. In addition, if we were precluded from processing Visa and MasterCard bankcard transactions, we would lose the majority of our revenues.
Any new laws and regulations, or revisions made to existing laws, regulations, or other industry standards affecting our business may have an unfavorable impact on our operating results and financial condition.
Our business is impacted by laws and regulations that affect the bankcard industry. In July 2010, Congress passed The Dodd-Frank Wall Street Reform and Consumer Protection Act (the “Dodd-Frank Act”), which significantly changed financial regulation. Changes included restricting amounts of debit card fees that certain issuer banks can charge merchants and allowing merchants to offer discounts for different payment methods. The impact which requirements imposed by the Dodd-Frank Act or other new regulation will have on our operating results is difficult to determine, as their implementation could result in the need for us to modify our services and processing platforms. As new requirements are mandated, these regulations could adversely affect our operating results and financial condition. Furthermore, the requirements of the new regulations and the timing of their effective dates could result in changes in our clients' business practices that may alter their delivery of their
19
products and services to consumers and the timing of their investment decisions, which could change the demand for our services as well as alter the type or volume of transactions that we process on behalf of our clients.
Additionally, all persons engaged in commerce, including, but not limited to, us and our merchant and financial institution customers, are subject to Section 5 of the Federal Trade Commission Act prohibiting unfair or deceptive acts or practices, or UDAP. The Federal Trade Commission, or FTC, has authority to take action against nonbanks that engage in UDAP and to the extent we are processing payments for a merchant engaged in UDAP, we may be subject to action by the FTC.
On July 26, 2011, the Financial Crimes Enforcement Network of the U.S. Department of the Treasury, or FinCEN, issued a final rule regarding the applicability of the Bank Secrecy Act's regulations to “prepaid access” products and services. This rulemaking clarifies the anti-money laundering obligations for entities engaged in the provision and sale of prepaid services such as prepaid cards. We have registered with FinCEN as a “money services business-provider of prepaid access” in accordance with the rule. Notwithstanding previously implemented anti-money laundering procedures pursuant to various contractual obligations, the rule increases our regulatory risks and, as with other regulatory requirements, violations of the rule could have a material adverse effect on our business, financial condition and results of operations.
We are required to assist our Sponsor banks in complying with certain of their regulatory obligations. In particular, the anti-money laundering provisions of the USA PATRIOT Act require that customer identifying information be obtained and verified. In addition, both we and our Sponsor banks are subject to the laws and regulations enforced by the Office of Foreign Assets Control, or OFAC, which prohibit U.S. persons from engaging in transactions with certain prohibited persons or entities. Our failure to comply with any of these laws or rights could materially and adversely affect our business, financial credit and results of operations.
We are subject to laws and regulations relating to the collection, use, retention, security and transfer of personally identifiable information and data regarding our customers and their financial information. In addition, we are bound by our own privacy policies and practices concerning the collection, use and disclosure of user data, which are posted on certain of our website pages. New legislation and regulations in this area have been proposed, both at the federal and state level. Such measures, including pending Federal legislation, would potentially impose additional obligations on us, including requiring that we provide notifications to consumers and government authorities in the event of a data breach or unauthorized access or disclosure, beyond what state law already requires.
These and other laws and regulations could adversely affect our business, financial condition and results of operations. In addition, even an inadvertent failure to comply with laws and regulations, given rapidly evolving social expectations of corporate fairness, could damage our business or our reputation.
Governmental regulations designed to protect or limit access to consumer information could adversely affect our ability to effectively provide our services to merchants.
Governmental bodies in the United States and abroad have adopted, or are considering the adoption of, laws and regulations restricting the collection, use and transfer of, and safeguarding, non-public personal information. For example, in the United States, all financial institutions must undertake certain steps to ensure the privacy and security of consumer financial information. While our operations are subject to certain provisions of these privacy laws, we have limited our use of consumer information solely to providing services to other businesses and financial institutions. We limit sharing of non-public personal information to that necessary to complete the transactions on behalf of the consumer and the merchant and to that permitted by federal and state laws. In connection with providing services to the merchants and financial institutions that use our services, we are required by regulations and contracts with our merchants to provide assurances regarding the confidentiality and security of non-public consumer information. These contracts require periodic audits by independent companies regarding our compliance with industry standards and best practices established by regulatory guidelines. The compliance standards relate to our infrastructure, components, and operational procedures designed to safeguard the confidentiality and security of non-public consumer personal information shared by our clients with us. Our ability to maintain compliance with these standards and satisfy these audits will affect our ability to attract and maintain business in the future. The cost of such systems and procedures may increase in the future and could adversely affect our ability to compete effectively with other similarly situated service providers.
In many cases, these laws apply not only to third-party transactions, but also to transfers of information among the company and our subsidiaries. In addition, the possession and use of personal information and data in conducting our business subjects us to laws that may require notification to regulators, clients or employees in the event of a privacy breach. These laws continue to develop, the number of jurisdictions adopting such laws continues to increase, and these laws may be inconsistent
20
from jurisdiction to jurisdiction. The future enactment of more restrictive laws, rules or regulations could materially adversely impact our operations and the financial condition of our company, through increased costs or restrictions on our businesses and noncompliance could result in regulatory penalties and significant legal liability. In addition, enforcement actions and investigations by regulatory authorities related to data security incidents and privacy violations continue to increase.
Global economics, political and other conditions may adversely affect trends in consumer spending, which may adversely impact our revenue and profitability.
A recessionary economic environment could have a negative impact on our merchants, which may, in turn, adversely impact our revenue and profitability, particularly if the recessionary environment disproportionately affects some of the market segments that represent a larger portion of our card processing volume, like restaurants. The industries in which we operate depend heavily upon the overall level of consumer and business spending.
Adverse economic trends may accelerate the timing, or increase the impact of, risks to our financial performance. Such trends may include, but are not limited to, the following:
• | a declining economy and the pace of economic recovery can change consumer spending behaviors; |
• | low levels of consumer and business confidence typically associated with recessionary environments, may cause decreased spending by cardholders; |
• | a decline in the use of credit, debit or prepaid cards as a payment mechanism for their transactions or an adverse change in the mix of payments between cash, alternative currencies, credit, debit and prepaid cards; |
• | budgetary concerns in the United States could impact consumer confidence and spending and increase the risks of operating our business; |
• | financial institutions may restrict credit lines to cardholders or limit the issuance of new cards to mitigate cardholder defaults; |
• | uncertainty and volatility in the performance of our clients’ businesses may make estimates of our revenues, rebates, incentives, and realization of prepaid assets less predictable; |
• | our clients may decrease spending for value-added services; and |
• | government intervention, including the effect of laws, regulations, and/or government investments in our clients, may have potential negative effects on our business and our relationships with our clients or otherwise alter their strategic direction away from our products. |
If our merchants make fewer sales of their products and services, we will have fewer transactions to process, resulting in lower revenue and profits. In addition, we have a certain amount of fixed and semi-fixed costs, including rent and salaries, which could limit our ability to quickly adjust costs and respond to changes in our business and the economy.
In a recessionary environment our merchants could also experience a higher rate of business closures, which could adversely affect our business and financial condition. During the 2008-2009 recession, we experienced negative same-store sales growth (or contraction) and an increase in business closures. In the event of a closure of a merchant, we are unlikely to receive our fees for any transactions processed by that merchant in its final month of operation.
We have faced, and will in the future face, chargeback liability when our merchants refuse or cannot reimburse chargebacks resolved in favor of their customers, reject losses when our merchants go out of business, and merchant fraud. We cannot accurately anticipate these liabilities, which may adversely affect our results of operations and financial condition.
In the event a billing dispute between a cardholder and a merchant is not resolved in favor of the merchant, the transaction is normally “charged back” to the merchant and the purchase price is credited or otherwise refunded to the cardholder by the card-issuing bank and charged to the merchant. If we or our clearing banks are unable to collect such amounts from the merchant's account, or if the merchant refuses or is unable, due to closure, bankruptcy or other reasons, to reimburse us for the chargeback, we bear the loss for the amount of the refund paid to the cardholder. The risk of chargebacks is typically greater with those merchants that promise future delivery of goods and services rather than delivering goods or rendering services at the time of payment. We may experience significant losses from chargebacks in the future. Any increase in chargebacks not paid by our merchants may adversely affect our financial condition and results of operations.
We also bear the risk of reject losses, which arise from the fact that we typically collect our fees from our SME merchants on the first day after the monthly billing period. This results in the build-up of a substantial receivable from our customers, which significantly exceeds the receivables of any of our competitors which generally assess their fees on a daily basis. If a merchant has gone out of business during the billing period, changes their demand deposit account, or institutes
21
blocks on its demand deposit account, we may be unable to collect such fees. We maintain cash deposits or require the pledge of a letter of credit from certain merchants and we also maintain a loss reserve against losses including major fraud losses, which are unpredictable and involve large monetary amounts; however, these may not be sufficient to eliminate the risk of loss, which may adversely affect our financial condition and results of operations. In addition, if our sponsor bank is unable, due to system disruption or other failure, to collect our fees from our merchants, we would face a substantial loss.
We have potential liability for fraudulent bankcard transactions initiated by merchants. Merchant fraud occurs when a merchant knowingly uses a stolen or counterfeit bankcard or card number to record a false sales transaction, processes an invalid bankcard or intentionally fails to deliver the merchandise or services sold in an otherwise valid transaction. We have established systems and procedures designed to detect and reduce the impact of merchant fraud, but we cannot assure you that these measures are or will be effective. It is possible that incidents of fraud could increase in the future. Failure to effectively manage risk and prevent fraud would increase our chargeback liability. Increases in chargebacks could have an adverse effect on our operating results and financial condition.
In the years ended December 31, 2015, 2014 and 2013, we incurred charges relating to chargebacks, reject losses and merchant fraud of $2.9 million, $7.3 million and $3.1 million, respectively, or 0.31 basis points, 0.90 basis points and 0.41 basis points, respectively of our SME card processing volume. In 2014, our losses included $4.6 million resulting from chargebacks from a single merchant who entered bankruptcy in the fourth quarter.
We rely on various financial institutions to provide clearing services in connection with our settlement activities. If we are unable to maintain clearing services with these financial institutions and are unable to find a replacement, our business may be adversely affected.
We rely on various financial institutions to provide clearing services in connection with our settlement activities. If such financial institutions should stop providing clearing services, we must find other financial institutions to provide those services. If we are unable to find a replacement financial institution we may no longer be able to provide processing services to certain customers, which could negatively impact our revenue and earnings.
Increased merchant attrition that we cannot offset with increased card processing volume would cause our revenues to decline.
We experience attrition in merchant card processing volume resulting from several factors, including business closures, transfers of merchants' accounts to our competitors, account closures that we initiate due to heightened credit risks and reductions in our merchants’ sales volumes. During the years ended December 31, 2015, 2014 and 2013, we experienced average annualized attrition in our SME card processing volume of 10.0%, 12.7% and 12.9%, respectively. Substantially all of our SME processing contracts may be terminated by either party on relatively short notice. We cannot predict the level of attrition in the future, and it could increase. Increased attrition in merchant card processing volume may have an adverse effect on our financial condition and results of operations. If we are unable to establish accounts with new merchants or otherwise increase our card processing volume in order to counter the effect of this attrition, our revenues will decline.
If we cannot pass increases in bankcard network interchange fees, assessments and transaction fees along to our merchants, our operating margins will be reduced.
We pay interchange fees and other network fees set by the bankcard networks to the card issuing bank and the bankcard networks for each transaction we process. From time to time, the bankcard networks increase the interchange fees and other network fees that they charge payment processors and the sponsor banks. At their sole discretion, our sponsor banks have the right to pass any increases in interchange fees on to us and have always done so in the past. We are allowed to, and in the past we have been able to, pass these fee increases along to our merchants through corresponding increases in our processing fees. However, if we are unable to do so in the future, our operating margins will be reduced.
The payment processing industry is highly competitive and we compete with certain firms that are larger and that have greater financial resources. Such competition could increase, which would adversely influence our prices to merchants, and as a result, our operating margins.
The market for payment processing services is highly competitive. Other providers of payment processing services have established a sizable market share in the small and mid-sized merchant processing sector. Maintaining our historic growth will depend on a combination of the continued growth in electronic payment transactions and our ability to increase our market share. According to The Nilson Report, we accounted for approximately 4.5% of the 84.5 billion of purchase transactions processed by all U.S. bankcard acquirers in 2014. The competition we face may affect the prices we are able to charge. If the competition causes us to reduce the prices we charge, we will have to aggressively control our costs or our profit margins will decline. In addition, some of our competitors are financial institutions, subsidiaries of financial institutions or well-established
22
payment processing companies. Our competitors that are financial institutions or subsidiaries of financial institutions do not incur the costs associated with being sponsored by a bank into the card networks and can settle transactions more quickly for their merchants than we can for ours. These competitors have substantially greater financial, technological, management and marketing resources than we have. This may allow our competitors to offer more attractive fees to our current and prospective merchants, or other products or services that we do not offer. This could result in a loss of customers, greater difficulty attracting new customers, and a reduction in the price we can charge for our products and services. If this were to occur, there is no assurance we can successfully control our costs in order to maintain our profit margins. One or more of these factors could have a material adverse effect on our business, financial condition and results of operations.
The payment processing market in which we compete is subject to rapid technological changes. These markets are characterized by technological change, new product introductions (including mobile payment applications), evolving industry standards and changing customer needs. In order to remain competitive, we are continually involved in a number of projects to offer our customers convenient and efficient solutions for their payment needs. Any delay in the delivery of new services or the failure to differentiate our services or to accurately predict and address market demand could render our services less desirable, or even obsolete, to our clients. These projects carry the risks associated with any development effort, including cost overruns, delays in delivery and performance problems. Any failure to deliver reliable, effective and secure services that meet the expectations of our clients could result in increased costs and/or a loss in business and revenues that could reduce our earnings. In addition, many of our competitors may have the ability to devote more financial and operational resources than we can to the development of new technologies and services, including Internet payment processing services and mobile payment processing services that provide improved operating functionality and features to their product and service offerings. If more successful than ours, their development efforts could render our product and services offerings less desirable to customers, again resulting in the loss of customers or a reduction in the price we could demand for our offerings. Furthermore, our merchants’ and their customers’ potential negative reaction to our products and services can spread quickly through social media and damage our reputation before we have the opportunity to respond. If we are unable to develop, adapt to or access technological changes or evolving industry standards on a timely and cost effective basis, our business, financial condition and results of operations would be materially adversely affected.
Non-traditional electronic payments competitors are also increasingly entering the markets in which we operate. Furthermore, we are facing new competitive pressure from non-traditional payments processors and other parties entering the payments industry, such as PayPal, Google, Apple, Alibaba and Amazon, who may compete in one or more of the functions performed in processing merchant transactions. These companies have significant financial resources and robust networks and are highly regarded by consumers. If these companies gain a greater share of total electronic payments transactions or if we are unable to successfully react to changes in the industry spurred by the entry of these new market participants, it could have a material adverse effect on our business, financial condition and results of operations.
Our systems and our third-party providers' systems may fail due to factors beyond our control, which could interrupt our service, cause us to lose business and increase our costs.
We depend on the efficient and uninterrupted operation of our computer network systems, software, data center and telecommunications networks, as well as the systems of third parties. Our systems and operations or those of our third-party providers could be exposed to damage or interruption from, among other things, fire, natural disaster, power loss, telecommunications failure, unauthorized entry and computer viruses. A system outage could have a material adverse effect on our business, financial condition, and results of operations. Although we have taken steps to protect against data loss and system failures, there is still risk that we may lose critical data or experience system failures. Our property and business interruption insurance may not be adequate to compensate us for all losses or failures that may occur. Defects in our systems or those of third parties, errors or delays in the processing of payment transactions, telecommunications failures or other difficulties could result in:
• | loss of revenues; |
• | loss of merchants, although our contracts with merchants do not expressly provide a right to terminate for business interruptions; |
• | loss of merchant and cardholder data; |
• | harm to our business or reputation; |
• | exposure to fraud losses or other liabilities; |
• | negative publicity; |
• | additional operating and development costs; and/or |
• | diversion of technical and other resources. |
23
We may experience software defects, computer viruses, and development delays, which could damage client relations, our potential profitability and expose us to liability.
Our products are based on sophisticated software and computing systems that often encounter development delays, and the underlying software may contain undetected errors, viruses, or defects. Defects in our software products and errors or delays in our processing of electronic transactions could result in additional development costs, diversion of technical and other resources from our other development efforts, loss of credibility with current or potential customers, harm to our reputation, or exposure to liability claims. In addition, we rely on technologies supplied to us by third parties that may also contain undetected errors, viruses or defects that could have a material adverse effect on our business, financial condition and results of operations. Although we attempt to limit our potential liability for warranty claims through disclaimers in our software documentation and limitation-of-liability provisions in our license and other agreements with our clients, we cannot assure that these measures will be successful in limiting our liability. Additionally, we and many of our customers are subject to payment network rules. If we do not comply with the payment network requirements or standards, we may be subject fines or sanctions, including suspension or termination of our registration.
If we fail to protect our intellectual property rights and defend ourselves from potential patent infringement claims, our competitive advantages may diminish or our ability to offer services to our customers could be restricted.
Our patents, trademarks, proprietary software and other intellectual property are critical to our future success. We rely on proprietary technology. It is possible that others will independently develop the same or similar technologies. Assurance of protecting our rights and proprietary information cannot be guaranteed. Our patents could be challenged, invalidated or circumvented by others and may not be of sufficient scope or strength to provide any meaningful protection or advantage. If we are unable to maintain the proprietary nature of our technologies, we could lose competitive advantages and be materially adversely affected. Adverse determinations in judicial or administrative proceedings could prevent us from precluding others from selling competing services, and thereby may have a material adverse effect on our business and results of operations.
Additionally, claims have been made, and other claims may be made in the future, with regard to our services or technology infringing on a patent or other intellectual property rights of others. Third parties may have, or may eventually be issued, patents that could be infringed by our services or technology. Any of these third parties could make a claim of infringement against us with respect to our services or technology. We may also be subject to claims by third parties for breach of copyright, trademark, license usage or other intellectual property rights. Any claim from third parties may result in a limitation on our ability to use the intellectual property subject to these claims, restrict us from delivering the related service or result in an unfavorable settlement that could be material to our operating results, financial condition and cash flow. Also, in recent years, individuals and groups have been purchasing intellectual property assets for the sole purpose of making claims of infringement and attempting to extract settlements from companies like ours. Even if we believe that intellectual property related claims are without merit, defending against such claims is time consuming and expensive and could result in the diversion of the time and attention of our management and employees. Claims of intellectual property infringement also might require us to redesign affected services, enter into costly settlement or license agreements, pay costly damage awards, or face a temporary or permanent injunction prohibiting us from marketing or selling certain of our services. Even if we have an agreement for indemnification against such costs, the indemnifying party, if any in such circumstances, may be unable to uphold its contractual obligations. If we cannot or do not license the infringed technology on reasonable terms or substitute similar technology from another source, our revenue and earnings could be adversely impacted.
Finally, we use open source software in connection with our technology and services. Companies that incorporate open source software into their products have, from time to time, faced claims challenging the ownership of open source software. As a result, we could be subject to suits by parties claiming ownership of what we believe to be open source software. Some open source software licenses require users who distribute open source software as part of their software to publicly disclose all or part of the source code to such software and/or make available any derivative works of the open source code on unfavorable terms or at no cost. While we monitor the use of open source software in our technology and services and try to ensure that none is used in a manner that would require us to disclose the source code to the related technology or service, such use could inadvertently occur and any requirement to disclose our proprietary source code could be harmful to our business, financial condition and results of operations.
Adverse conditions in markets in which we obtain a substantial amount of our card processing volume, such as our largest SME merchant markets of California, Texas, Florida, New York, and Pennsylvania, could negatively affect our results of operations.
Adverse economic or other conditions in California, Texas, New York, Florida and Pennsylvania would negatively affect our revenue and could materially and adversely affect our results of operations. In December 2015, SME merchants located in these states represented the following percentages of our SME card processing volume: California represented
24
13.0%, Texas represented 6.2%, Florida represented 5.8%, New York represented 5.1% and Pennsylvania represented 3.5%, respectively. As a result of this geographic concentration of our merchants in these markets, we are exposed to the risks of downturns in these local economies and to other local conditions, which could adversely affect the operating results of our merchants in these markets. No other state represented more than 3.3% of our SME card processing volume in December 2015.
If we lose key personnel or are unable to attract additional qualified personnel as we grow, our business could be adversely affected.
We are dependent upon the ability and experience of a number of our key personnel who have substantial experience with our operations, the rapidly changing payment processing industry and the selected markets in which we offer our services. It is possible that the loss of the services of one or a combination of our senior executives or key managers, particularly Robert O. Carr, our Chief Executive Officer, would have an adverse effect on our operations. Our success also depends on our ability to continue to attract, manage and retain other qualified middle management and technical and clerical personnel as we grow. We may not continue to attract or retain such personnel.
Additionally, to successfully compete in the market and grow our business, we must attract, recruit, retain and develop the necessary personnel who can provide needed expertise. We may be required to hire additional personnel to execute our strategic plans. However, the market for qualified personnel is competitive, and we may not succeed in recruiting additional personnel or may fail to effectively replace current personnel who depart our company. Failure to retain or attract qualified personnel could have a material adverse effect on our business, financial condition and results of operations.
If we are unable to attract and retain qualified sales people, our business and financial results may suffer.
Unlike many of our competitors who rely on ISOs or salaried salespeople and telemarketers, we rely on a direct sales force whose compensation is entirely commission-based. Through our direct sales force of approximately 1,069 Relationship Managers and Territory Managers and 171 product specialists (SPAs), we seek to increase the number of merchants using our products and services. We intend to significantly increase the size of our sales force. Our success depends, in part, on the skill and experience of our sales force. If we are unable to retain and attract sufficiently experienced and capable Relationship Managers, Territory Managers and SPAs, our business and financial results may suffer.
Any potential strategic acquisitions or buyouts of our sales persons portfolio equity that we make could disrupt our business and harm our financial condition.
We expect to evaluate potential strategic acquisitions of complementary businesses, products or technologies. We may not be able to successfully finance or integrate any businesses, products or technologies that we acquire. Furthermore, the integration of any acquisition may divert management's time and resources from our core business and disrupt our operations. We may spend time and money on projects that do not increase our revenue. To the extent we pay the purchase price of any acquisition in cash, it would reduce our cash reserves or increase our borrowings, and to the extent the purchase price is paid with our stock, it could be dilutive to our stockholders. We, from time to time, evaluate potential acquisitions of businesses, products and technologies, and anticipate continuing to make these evaluations.
We also regularly buy out the residual commissions of our Relationship Managers and sales managers, at multiples that typically amount to 2 1/2 years of such commissions. If the merchants included in the portfolios we purchase do not generate sufficient incremental margin after the purchase, we will not achieve a positive return on the cash expended.
We may not be able to continue to expand our share of the existing payment processing markets or expand into new markets which would inhibit our ability to grow and increase our profitability.
Our future growth and profitability depend upon the growth of the markets in which we currently operate and our ability to increase our penetration and service offerings within these markets, as well as the emergence of new markets for our services and our ability to penetrate these new markets. According to The Nilson Report, we accounted for approximately 4.5% of the 84.5 billion of purchase transactions processed by all U.S. bankcard acquirers in 2014. It is difficult to attract new clients due to transition costs, business disruption and loss of accustomed functionality in connection a change in payment processing vendors. We seek to overcome these obstacles by offering enhanced functionality, greater data security, high customer service levels and competitive pricing. However, there can be no assurance that our efforts will be successful and the inability to grow in the markets in which we operate may have a material adverse effect on our business, financial condition and results of operations.
Our expansion into new markets in which we do not currently have any operating experience is also dependent upon our ability to adapt our existing technology and offerings or to develop new or innovative applications to meet the particular service needs of each new market. In order to do so, we will need to anticipate and react to market changes and devote appropriate
25
financial and technical resources to our development efforts, and there can be no assurance that we will be successful in these efforts.
Our operating results are subject to seasonality, which could result in fluctuations in our quarterly net income.
We have experienced in the past, and expect to continue to experience, seasonal fluctuations in our revenues as a result of consumer spending patterns. Historically, due to seasonal retail sales, our revenues have been strongest in our second and third quarters, and weakest in our first quarter.
We may become subject to additional U.S., state or local taxes that cannot be passed through to our merchants, which could negatively affect our results of operations.
Companies in the payment processing industry, including us, may become subject to taxation in various tax jurisdictions based on our net income or revenues. Taxing jurisdictions have not yet adopted uniform positions on taxation. If we are required to pay additional taxes on our net income or revenues and are unable to pass the tax expense through to our merchants, our costs would increase and our net income would be reduced.
We may need to raise additional funds to finance our future capital needs, which may prevent us from growing our business.
We may need to raise additional funds to finance our future capital needs, including developing new products and technologies, and operating expenses. We may need additional financing earlier than we anticipate if we:
• | expand faster than our internally generated cash flow can support; |
• | purchase portfolio equity (the portion of our commissions that we have committed to our sales force for as long as the merchant processes with us, which we may buy out at an agreed multiple) from a large number of Relationship Managers or sales managers; |
• | add new merchant accounts faster than expected; |
• | need to reduce pricing in response to competition; |
• | repurchase our common stock or pay dividends; or |
• | acquire complementary products, business or technologies. |
If we raise additional funds through the sale of equity securities, these transactions may dilute the value of our outstanding common stock. We may also decide to issue securities, including debt securities that have rights, preferences and privileges senior to our common stock. We may be unable to raise additional funds on terms favorable to us or at all. If financing is not available or is not available on acceptable terms, we may be unable to fund our future needs. This may prevent us from increasing our market share, capitalizing on new business opportunities or remaining competitive in our industry.
Risks Related to Our Company
Borrowings under our Credit Agreement could adversely affect our financial condition, and the related debt service obligations may adversely affect our cash flow and ability to invest in and grow our businesses.
The interest rates on debt outstanding under our Credit Agreement are floating based on the LIBOR rate; accordingly, if the LIBOR rate increases, our interest expense will be higher on the portion of our debt outstanding not managed with interest rate swaps. At December 31, 2015, there was $481.9 million outstanding under our Credit Agreement.
We intend to fulfill our total debt service obligations primarily from cash generated by our operations. Such funds will not be available to use in future operations, or investing in our businesses. This may adversely impact our ability to expand our businesses or make other investments. If we are unable to meet our debt obligations, we could be forced to restructure or refinance our obligations, to seek additional equity financing or to sell assets, which we may not be able to do on satisfactory terms or at all. As a result, we could default on those obligations and in the event of such default, our lenders could accelerate our debt or take other actions that could restrict our operations.
Our borrowing agreements contain restrictions which may limit our flexibility in operating and growing our business.
Our borrowing agreements contain covenants regarding our maintenance of certain leverage and fixed charge coverage ratios. Our borrowing agreements also include covenants that limit our ability to engage in specified types of transactions, including among other things:
• | incur additional indebtedness or issue equity; |
• | pay dividends on, repurchase or make distributions in respect of our common stock; |
26
• | make certain investments (including acquisitions) and distributions; |
• | sell certain assets; |
• | create liens; |
• | consolidate, merge, sell or otherwise dispose of all or substantially all of our assets; |
• | enter into certain transactions with respect to our affiliates, |
• | ability to enter into business combinations, and |
• | certain other financial and non-financial covenants. |
We were in compliance with these covenants as of December 31, 2015. Failure to be in compliance with these covenants could result in an event of default which, if not cured or waived, could result in the acceleration of all or a portion of our outstanding indebtedness, which would have a material adverse effect on our business, financial condition and results of operations.
Our balance sheet includes significant amounts of goodwill and intangible assets. The impairment of a significant portion of these assets would negatively affect our business, financial condition, and results of operations.
As a result of recent acquisitions, a significant portion of our total assets consist of goodwill and intangible assets. Combined goodwill and intangible assets, net of amortization, accounted for approximately 45% of the total assets on our balance sheet at December 31, 2015 and 2014, respectively. We may not realize the full carrying value of our intangible assets and goodwill. We test goodwill for impairment at least annually and during interim periods if an event occurs or changes in circumstances suggest a potential decline in the fair value of goodwill. We also evaluate intangible assets on an ongoing basis for indicators of impairment. A significant amount of judgment is involved in determining if an indicator or change in circumstances relating to impairment has occurred. If testing indicates that impairment has occurred, we would be required to write-off the impaired portion of goodwill and such intangible assets, resulting in a charge to our earnings. An impairment of a significant portion of goodwill or intangible assets could have a material adverse effect on our business, financial condition, and results of operations. Our impairment testing in 2014 indicated an impairment of goodwill and intangible assets relating to Leaf Acquisition, LLC (“Leaf”), a previous Heartland Commerce business reporting unit and related POS assets resulting in pre-tax impairment charges of $37.4 million, of which $18.5 million was related to goodwill.
The costs and effects of pending and future litigation, investigations or similar matters, or adverse facts and developments related thereto, could materially affect our business, financial position, results of operations and cash flow.
We are from time-to-time involved in various litigation matters and governmental or regulatory investigations or similar matters arising out of our current or future business. Our insurance or indemnities may not cover all claims that may be asserted against us, and any claims asserted against us, regardless of merit or eventual outcome, may harm our reputation. Furthermore, there is no guarantee that we will be successful in defending ourselves in pending or future litigation or similar matters under various laws. If we are unsuccessful in our defense in these litigation matters, or any other legal proceeding, we may be forced to pay damages or fines that significantly exceed our insurance coverage, enter into consent decrees, and/or change our business practices, any of which could have a materially adverse effect on the results of our business operations and financial condition. For more information about our legal proceedings, refer to “Item 3. Legal Proceedings” herein.
Future sales of our common stock, or the perception in the public markets that these sales may occur, could depress our stock price.
Sales of substantial amounts of our common stock in the public market, or the perception in the public markets that these sales may occur, could cause the market price of our common stock to decline. This could also impair our ability to raise additional capital through the sale of our equity securities. At December 31, 2015, we had 36,933,825 shares of our common stock outstanding. In addition, as of December 31, 2015, we had outstanding stock options and restricted share units representing 1,035,950 shares issued under our amended and restated 2008 Equity Incentive Plan and our 2000 Incentive Stock Option Plan, of which 5,900 were vested. Assuming the exercise of all outstanding options to acquire our common stock and the vesting of all restricted share units and performance share units, our current stockholders would own on a fully-diluted basis 95% of the outstanding shares of our common stock, and the number of shares of our common stock available to trade could cause the market price of our common stock to decline. In addition to the adverse effect a price decline could have on holders of our common stock, such a decline could impede our ability to raise capital or to make acquisitions through the issuance of additional shares of our common stock or other equity securities.
Failure to maintain effective systems of internal control over financial reporting and disclosure controls and procedures could cause a loss of confidence in our financial reporting and adversely affect the trading price of our common stock.
Effective internal control over financial reporting is necessary for us to provide accurate financial information. Section 404 of the Sarbanes-Oxley Act requires us to evaluate the effectiveness of our internal control over financial reporting as of the
27
end of each fiscal year and to include a management report assessing the effectiveness of our internal control over financial reporting in our Annual Report on Form 10-K. If we fail to maintain the adequacy of our internal control, we may not be able to conclude and report that we have effective internal control over financial reporting. If we are unable to adequately maintain our internal control over financial reporting, we may not be able to accurately report our financial results, which could cause investors to lose confidence in our reported financial information, negatively affecting the trading price of our common stock, or our ability to access the capital markets.
Provisions in our charter documents and Delaware law could discourage a takeover that our stockholders may consider favorable or could cause current management to become entrenched and difficult to replace.
Provisions in our amended and restated certificate of incorporation, in our bylaws and under Delaware law could make it more difficult for other companies to acquire us, even if doing so would benefit our stockholders. Our amended and restated certificate of incorporation and bylaws contain the following provisions, among others, which may inhibit an acquisition of our company by a third party:
• | advance notification procedures for matters to be brought before stockholder meetings; |
• | a limitation on who may call stockholder meetings; |
• | a prohibition on stockholder action by written consent; and |
• | the ability of our Board of Directors to issue up to 10 million shares of preferred stock without a stockholder vote. |
If any shares of preferred stock are issued that contain an extraordinary dividend or special voting power, a change in control could be impeded.
We are also subject to provisions of Delaware law that prohibit us from engaging in any business combination with any “interested stockholder,” meaning, generally, that a stockholder who beneficially owns more than 15% of our stock cannot acquire us for a period of three years from the date this person became an interested stockholder unless various conditions are met, such as approval of the transaction by our Board of Directors. Any of these restrictions could have the effect of delaying or preventing a change in control.
We may be unable or we may decide not to pay dividends on our common stock at a level anticipated by stockholders, which could depress our stock price.
The payment of dividends on our common stock in the future will be at the discretion of our Board of Directors and will depend on, among other factors, our earnings, stockholders' equity, cash position and financial condition. No assurance can be given that we will be able to or will choose to pay any dividends in the future.
ITEM 1B. UNRESOLVED STAFF COMMENTS
Not Applicable.
ITEM 2. PROPERTIES
At December 31, 2015, we owned one facility and leased thirty three facilities which we use for operational, sales and administrative purposes.
Our principal executive offices are located in approximately 9,300 square feet of leased office space on Nassau
Street in Princeton, New Jersey. The Nassau Street lease expires in June 2023. We own 58 acres of land in Jeffersonville, Indiana, on which we constructed our operations and service center. The state-of-the-art facility is comprised of 238,000 square feet of space supporting customer service, operations, deployment, day care, fitness, cafeteria, and large company meetings.
As of December 31, 2015, we also leased the following facilities located throughout the United States to operate our business. Multi-purpose facilities include administrative, sales, operations, technology and facilities shared by multiple business segments.
28
Segment | Square Feet | Expiration | ||
Multi-purpose | 249,061 | 5/15/2016 to 12/31/2026 | ||
Campus Solutions | 136,607 | 7/31/2016 to 12/31/2030 | ||
Heartland School Solutions | 37,315 | 5/25/2016 to 6/30/2023 | ||
Heartland Payroll Solutions | 81,473 | 6/30/2016 to 7/31/2019 | ||
Heartland Commerce | 72,244 | 8/14/2016 to 2/29/2024 | ||
Heartland Marketing Solutions | 10,838 | 12/31/2016 | ||
587,538 | ||||
We believe that our facilities are suitable and adequate for our current business operations and, if necessary, could be replaced with little disruption to our company. We periodically review our space requirements and may acquire new space to meet our business needs or consolidate and dispose of or sublet facilities which are no longer required.
ITEM 3. LEGAL PROCEEDINGS
Merger Agreement Proceedings
The Company, its Board of Directors, Global, Merger Sub One, and Merger Sub Two have been named as defendants in a putative class action lawsuit, brought by a purported Company stockholder, challenging the merger. The suit was filed in the New Jersey Superior Court, Mercer County, Civil Division, and is captioned Kevin Merchant v. Heartland Payment Systems, et al., L-45-16 (filed January 8, 2016). The complaint alleges, among other things, that the directors of the Company breached their fiduciary duties to the Company’s stockholders by agreeing to sell the Company for inadequate consideration, agreeing to improper deal protection terms in the merger agreement, and failing to properly value the Company. The complaint also alleges that the Company, Global, Merger Sub One, and Merger Sub Two aided and abetted these purported breaches of fiduciary duty. Plaintiff seeks, among other things, an injunction barring the merger, recession of the merger or rescissory damages to the extent the merger is already implemented, and an award of damages and attorney’s fees.
The Company believes the suit is without merit.
Processing System Intrusion Legal Proceedings
On January 20, 2009, we publicly announced the discovery of a criminal breach of our payment systems environment (the “Processing System Intrusion”). The Processing System Intrusion involved malicious software that appears to have been used to collect in-transit, unencrypted payment card data while it was being processed by us during the transaction authorization process. We believe the breach did not extend beyond 2008.
Several lawsuits were filed against us and our sponsor banks in connection with the Processing System Intrusion, including putative class action lawsuits brought by financial institutions and banks, which sought to represent all financial institutions that issued payment cards to cardholders whose transaction information was alleged to have been placed at risk in the course of the Processing System Intrusion. These actions were centralized before the United States District Court for the Southern District of Texas as part of a multi-district litigation captioned In re Heartland Payment Systems, Inc. Customer Data Security Breach Litigation, MDL No. 2046, 4:09-md-2046. These actions sought compensatory damages, including recovery of the cost of issuance of replacement cards and losses by reason of unauthorized transactions, as well as injunctive relief, attorneys' fees and costs.
On February 26, 2015, the financial institutions named as plaintiffs in the putative financial institution class actions and/or in the actions that were transferred to or otherwise made part of the centralized multi-district litigation agreed to dismiss their claims with prejudice. As part of this dismissal, we made no payments to the named plaintiffs.
Other Legal Proceedings
In the ordinary course of our business, we are party to various legal actions, which we believe are incidental to the operation of our business. We believe that the outcome of the proceedings to which we are currently a party will not have a material adverse effect on our financial position, results of operations or cash flows.
ITEM 4. MINE SAFETY DISCLOSURES
Not applicable.
29
PART II.
ITEM 5. MARKET FOR REGISTRANT'S COMMON EQUITY, RELATED STOCKHOLDER MATTERS AND ISSUER PURCHASES OF EQUITY SECURITIES
Market Information
Our common stock trades on the New York Stock Exchange under the ticker symbol “HPY.” The following table sets forth the high and low sales prices of our common stock and dividend paid per share for the four quarters during the years ended December 31, 2015 and 2014:
High | Low | Dividend Per Share | |
2014 | |||
Quarter Ended: | |||
March 31, 2014 | $50.44 | $38.67 | $0.085 |
June 30, 2014 | $43.52 | $37.25 | $0.085 |
September 30, 2014 | $49.46 | $40.61 | $0.085 |
December 31, 2014 | $56.28 | $46.67 | $0.085 |
2015 | |||
Quarter Ended: | |||
March 31, 2015 | $55.16 | $46.65 | $0.10 |
June 30, 2015 | $55.89 | $47.64 | $0.10 |
September 30, 2015 | $65.30 | $52.89 | $0.10 |
December 31, 2015 | $96.47 | $59.03 | $0.10 |
Holders of Common Stock
The number of stockholders of record of our common stock as of February 24, 2016 was 16.
Dividends
Our Board of Directors has declared a quarterly cash dividend on our common stock each quarter since the third quarter of 2006. The payment of dividends on our common stock in the future will be at the discretion of our Board of Directors and will depend on, among other factors, our earnings, stockholders' equity, cash position and financial condition. On February 2, 2016, our Board of Directors declared a quarterly cash dividend of $0.10 per share of common stock, payable on March 15, 2016 to stockholders of record as of March 1, 2016.
Securities Authorized For Issuance Under Equity Compensation Plans
We maintain the Heartland Payment Systems, Inc. Amended and Restated 2008 Equity Incentive Plan under which shares of our common stock are authorized for issuance. For more information on this plan, see Note 14, Stock Incentive Plans. Information regarding the common stock issuable under this plan as of December 31, 2015 is set forth in the following table:
Plan category | Number of securities to be issued upon exercise of outstanding options, warrants and rights | Weighted- average exercise price of outstanding options, warrants and rights | Number of securities remaining available for future issuance under equity compensation plans (excluding securities reflected in the first column) | |||
Equity compensation plans approved by security holders | 1,035,950 | $54.87 | 1,035,950 | |||
Equity compensation plans not approved by security holders | None | N/A | None | |||
Total | 1,035,950 | $54.87 | 1,035,950 | |||
Purchases of Equity Securities by the Issuer
Open Repurchase Authorization. On May 8, 2014, our Board of Directors authorized the repurchase of up to $75 million of our outstanding stock. We intend to fund any repurchases with cash flow from operations, existing cash on the balance sheet, and other sources including our 2014 Revolving Credit Facility. The manner, timing and amount of repurchases,
30
if any, will be determined by management and will depend on a variety of factors, including price, corporate and regulatory requirements, market conditions and other corporate liquidity requirements. The repurchase program may be modified or discontinued at any time. As of December 31, 2015, we have not repurchased any shares under the May 8, 2014 authorization.
Under the Merger Agreement, our repurchase activity after December 15, 2015 is limited to repurchases made to satisfy tax withholding amounts arising from stock option exercises or vesting of restricted shares.
Performance Graph
The following graph compares the percentage change in cumulative total stockholder return on our common stock for the past five years with the cumulative total returns over the same period of (i) the S&P 500 Index and (ii) the S&P Information Technology Index.
The below comparison assumes $100 was invested on December 31, 2010 in our common stock and in the S&P 500 Index and the S&P Information Technology Index, and assumes reinvestment of dividends, if any. Historical stock prices are not indicative of future stock price performance.
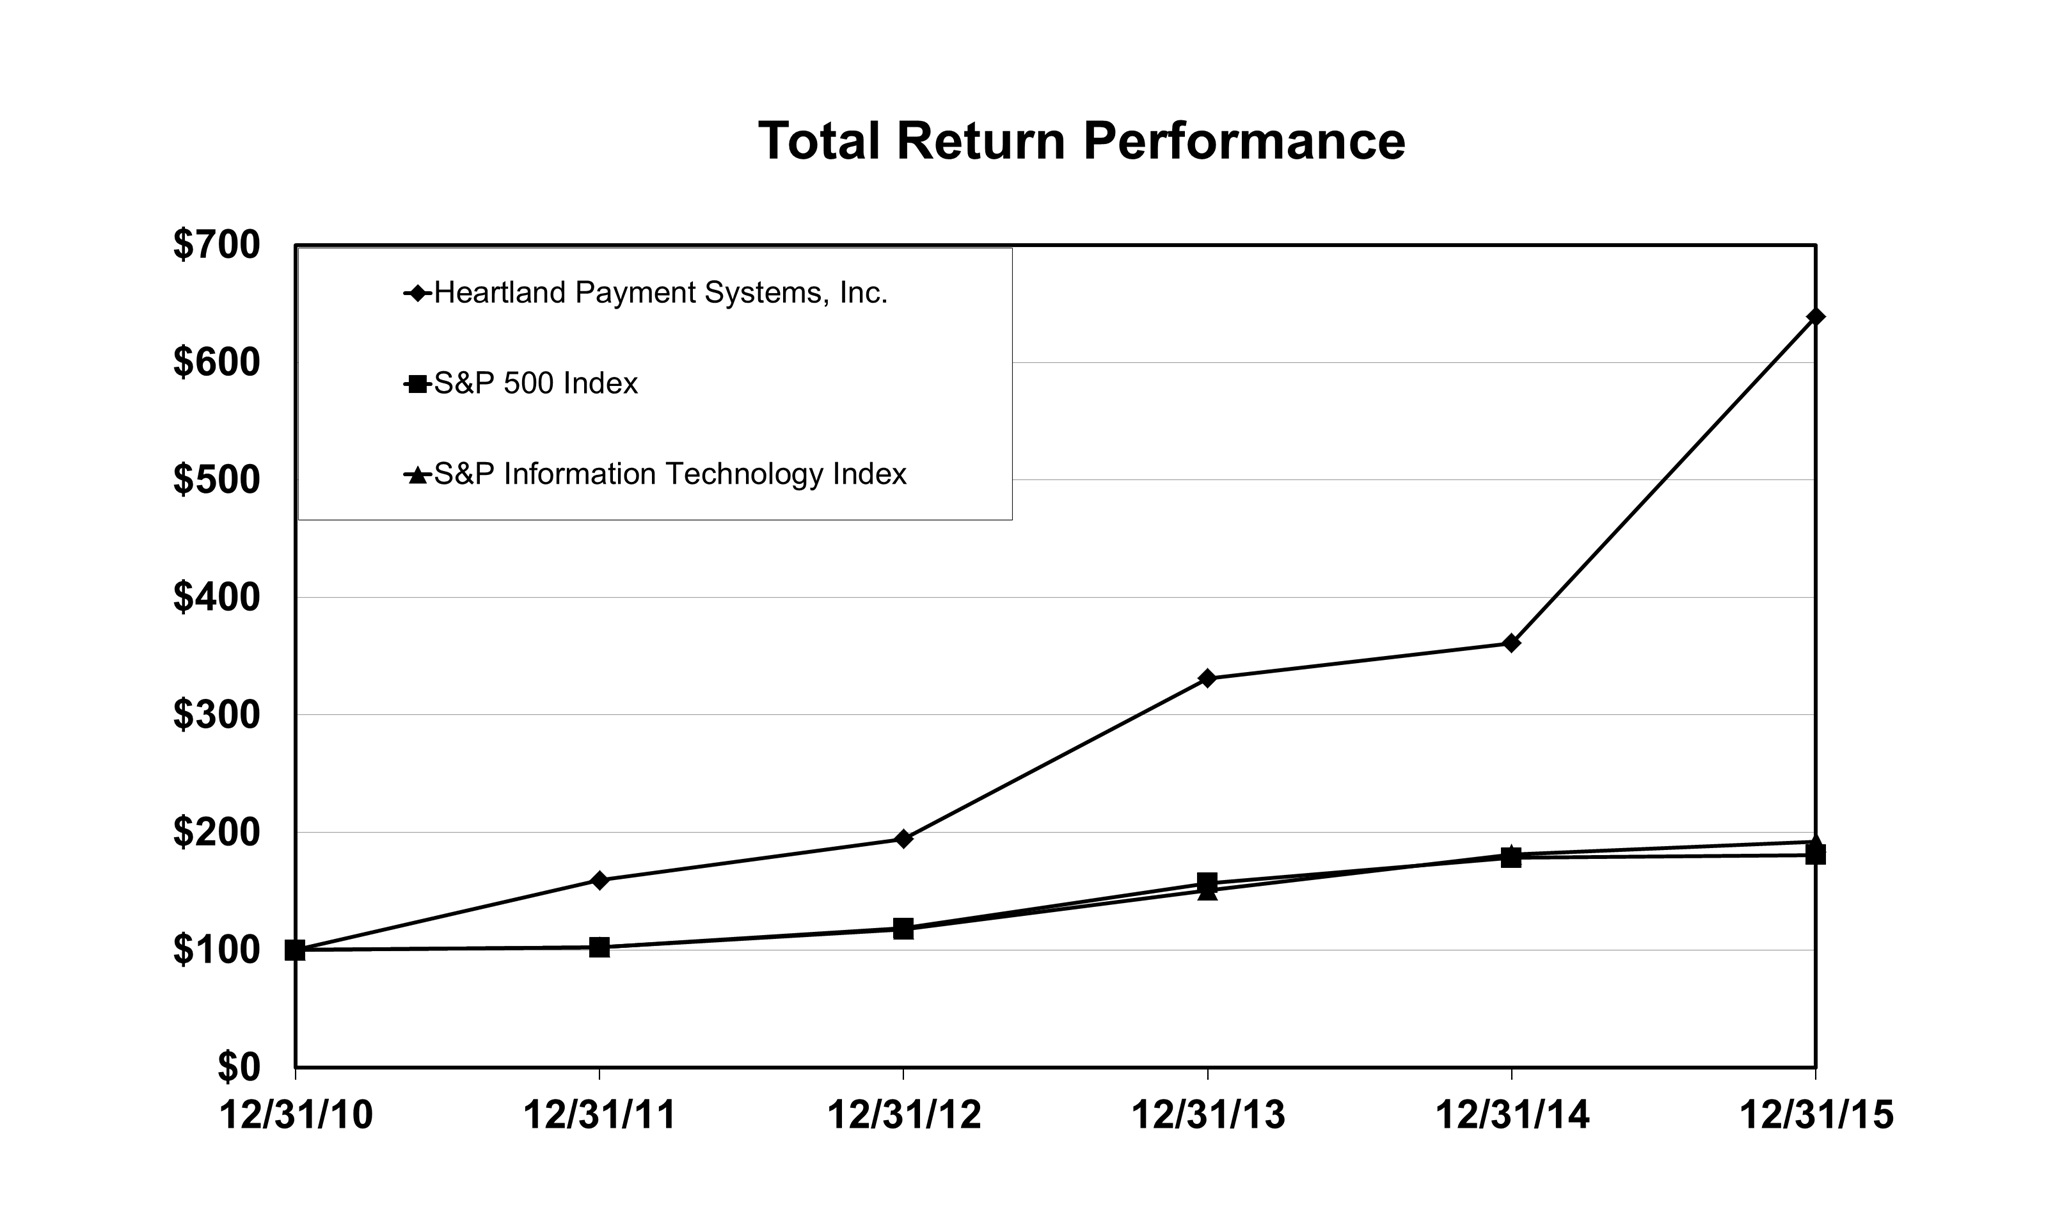
Base Period | Period Ended | ||||||||||||||||||||||
12/31/2010 | 12/31/2011 | 12/31/2012 | 12/31/2013 | 12/31/2014 | 12/31/2015 | ||||||||||||||||||
Heartland Payment Systems, Inc. | $ | 100.00 | $ | 159.25 | $ | 194.43 | $ | 331.09 | $ | 361.08 | $ | 638.98 | |||||||||||
S&P 500 | 100.00 | 102.11 | 118.45 | 156.82 | 178.29 | 180.75 | |||||||||||||||||
S&P Information Technology Index | 100.00 | 102.41 | 117.59 | 151.03 | 181.40 | 192.15 | |||||||||||||||||
ITEM 6. SELECTED FINANCIAL DATA
The following table sets forth our selected historical consolidated financial information and other data for the years ended December 31, 2015, 2014, and 2013, which are derived from our consolidated financial statements included elsewhere in this report. Historical consolidated financial information for 2012 and 2011 are derived from our consolidated financial statements for those years (not included herein). The information in the following table should be read together with “Management's Discussion and Analysis of Financial Condition and Results of Operations” and our consolidated financial statements and the related notes included elsewhere in this report.
31
Year Ended December 31, | |||||||||||||||||||
2015 | 2014 | 2013 | 2012 | 2011 | |||||||||||||||
Income Statement Data: | (In thousands, except per share data) | ||||||||||||||||||
Total revenues | $ | 2,682,396 | $ | 2,311,381 | $ | 2,135,372 | $ | 2,013,436 | $ | 1,985,577 | |||||||||
Total costs of services | 2,292,843 | 2,001,342 | 1,835,706 | 1,763,701 | 1,783,731 | ||||||||||||||
General and administrative | 244,005 | 190,554 | 173,568 | 139,934 | 125,765 | ||||||||||||||
Goodwill impairment charge | — | 18,490 | — | — | — | ||||||||||||||
Asset impairment charges | — | 18,875 | — | — | — | ||||||||||||||
Total expenses | 2,536,848 | 2,229,261 | 2,009,274 | 1,903,635 | 1,909,496 | ||||||||||||||
Income from operations | 145,548 | 82,120 | 126,098 | 109,801 | 76,081 | ||||||||||||||
Net income from continuing operations | 84,732 | 31,868 | 74,102 | 64,353 | 42,988 | ||||||||||||||
Net income attributable to Heartland | 84,732 | 33,879 | 78,626 | 65,889 | 43,939 | ||||||||||||||
Basic earnings per share: | |||||||||||||||||||
Income from continuing operations | $ | 2.31 | $ | 0.93 | $ | 2.03 | $ | 1.67 | $ | 1.10 | |||||||||
Income from discontinued operations | $ | — | $ | — | $ | 0.11 | $ | 0.04 | $ | 0.03 | |||||||||
Basic earnings per share | $ | 2.31 | $ | 0.93 | $ | 2.14 | $ | 1.71 | $ | 1.13 | |||||||||
Diluted earnings per share: | |||||||||||||||||||
Income from continuing operations | $ | 2.28 | $ | 0.91 | $ | 1.96 | $ | 1.60 | $ | 1.07 | |||||||||
Income from discontinued operations | $ | — | $ | — | $ | 0.10 | $ | 0.04 | $ | 0.02 | |||||||||
Diluted earnings per share | $ | 2.28 | $ | 0.91 | $ | 2.06 | $ | 1.64 | $ | 1.09 | |||||||||
Weighted average number of common shares outstanding: | |||||||||||||||||||
Basic | 36,646 | 36,354 | 36,791 | 38,468 | 38,931 | ||||||||||||||
Diluted | 37,237 | 37,187 | 38,053 | 40,058 | 40,233 | ||||||||||||||
Dividends declared per share | $ | 0.40 | $ | 0.34 | $ | 0.28 | $ | 0.24 | $ | 0.16 | |||||||||
Other Data: | |||||||||||||||||||
Net revenue* | $ | 822,958 | $ | 672,625 | $ | 598,982 | $ | 529,895 | $ | 470,896 | |||||||||
Operating margin | 17.7 | % | 12.2 | % | 21.1 | % | 20.7 | % | 16.2 | % | |||||||||
*Net revenue is defined as total revenues less Interchange fees and dues, assessments, and fees. | |||||||||||||||||||
As of December 31, | |||||||||||||||||||
2015 | 2014 | 2013 | 2012 | 2011 | |||||||||||||||
Balance Sheet Data (a): | (In thousands) | ||||||||||||||||||
Total assets | $ | 1,536,679 | $ | 1,378,465 | $ | 890,757 | $ | 802,939 | $ | 590,175 | |||||||||
Current portion of borrowings | 43,793 | 36,792 | — | 102,001 | 15,003 | ||||||||||||||
Long-term borrowings | 437,842 | 523,122 | 150,000 | 50,000 | 70,000 | ||||||||||||||
Total liabilities | 1,200,857 | 1,127,705 | 624,094 | 591,778 | 370,123 | ||||||||||||||
Total equity | 335,822 | 250,760 | 260,475 | 209,786 | 219,410 | ||||||||||||||
(a) Total assets and total liabilities have been retrospectively adjusted to reflect the adoption of the new accounting standards update regarding the classification of deferred taxes. See "Note 2, Summary of Significant Accounting Policies — New Accounting Pronouncements" for a discussion of this new accounting standards update.
ITEM 7. MANAGEMENT'S DISCUSSION AND ANALYSIS OF FINANCIAL CONDITION AND RESULTS OF OPERATIONS
The following discussion and analysis of our financial condition and results of operations should be read in conjunction with the consolidated financial statements and the accompanying notes to consolidated financial statements and the risk factors included elsewhere in this report.
Overview
General
Our primary business is to provide Payment Processing services to merchants throughout the United States. This involves providing end-to-end electronic payment processing services to merchants by facilitating the exchange of information and funds between them and cardholders' financial institutions. To accomplish this, we undertake merchant set-up and training,
32
transaction authorization and electronic draft capture, clearing and settlement, merchant accounting, merchant assistance and support, and risk management. Our card-accepting customers primarily fall into two categories: our core small and mid-sized merchants (referred to as "Small and Midsized Enterprises," or “SME merchants”) and Network Services merchants, predominantly petroleum industry merchants of all sizes (referred to as “Network Services merchants”).
We provide additional services such as:
• | Integrated commerce solutions, payment processing, higher education loan services and open and closed-loop payment solutions to higher-education institutions through Campus Solutions, |
• | School nutrition, point-of-sale solutions ("POS"), and associated payment solutions, including online prepayment solutions, to kindergarten through 12th grade ("K-12") schools through Heartland School Solutions, |
• | Full-service payroll processing and related tax filing services throughout the United States provided by Heartland Payroll Solutions, and |
• | Other, including (1) prepaid and stored-value card solutions throughout the United States and Canada provided by Micropayments, (2) POS solutions and other adjacent business service applications provided by Heartland Commerce, and (3) marketing solutions including loyalty and gift cards which we provide through Heartland Marketing Solutions. |
Agreement and Plan of Merger
On December 15, 2015, we entered into the Merger Agreement with Global and the Merger Subs. Pursuant to the terms and subject to the conditions set forth in the Merger Agreement, Global will acquire the Company through a two-step transaction. First, Merger Sub One will merge with and into the Company, with the Company continuing as a wholly owned subsidiary of Global. Second, the Company will merge with and into Merger Sub Two immediately following the initial merger, with Merger Sub Two surviving the second merger as a wholly owned subsidiary of Global.
As a result of the merger, subject to the terms and conditions of the Merger Agreement, each outstanding share of our common stock (other than certain shares owned by the parties to the Merger Agreement or by stockholders who have validly exercised their appraisal rights) will be converted into the right to receive (subject to adjustment as set forth in the next sentence) $53.28 in cash, without interest, and 0.6687 shares of Global common stock. Under the terms of the Merger Agreement, in the event that the number of shares of Global common stock issuable as a result of the merger would exceed 19.9% of the issued and outstanding shares of Global common stock immediately prior to the closing of the merger, the stock consideration will be reduced so that no more than 19.9% of the outstanding shares of Global common stock will be issuable in the merger and the cash consideration will be increased by a corresponding amount, so that the value of the per share merger consideration will remain the same.
Consummation of the merger is subject to customary conditions, including without limitation, (1) approval by the holders of at least a majority of the outstanding shares of our common stock, (2) the absence of any law or order of any governmental entity which prohibits the consummation of the merger, (3) the effectiveness under the Securities Act of 1933 (as amended) of the Registration Statement on Form S-4 filed by Global with respect to the merger, and (4) subject to certain materiality exceptions, the accuracy of the representations and warranties made by the parties and compliance by the parties with their respective obligations under the Merger Agreement.
Each of the Company and Global has made customary representations and warranties in the Merger Agreement. The Merger Agreement also contains customary covenants, including, without limitation, (1) covenants providing for the parties to use reasonable best efforts to cause the closing of the merger to be consummated, and (2) the Company’s agreement to not solicit proposals relating to alternative transactions to the merger or engage in discussions or negotiations with respect thereto, subject to certain exceptions. Additionally, the parties have agreed to select two Company nominees for appointment to Global’s board of directors in connection with the closing of the merger.
The Merger Agreement contains certain termination rights for Global and the Company, including a mutual termination right in the event the merger is not consummated by June 15, 2016 (subject to extension under certain circumstances). Upon termination of the Merger Agreement under specified circumstances described in the Merger Agreement, including (1) if Global terminates the Merger Agreement following a change of recommendation of the Company’s board of directors, (2) if the Company terminates the Merger Agreement to enter into a definitive agreement with a third party with respect to a superior acquisition proposal, or (3) if the Merger Agreement is terminated under certain circumstances and the Company subsequently enters into, or consummates, an alternative acquisition proposal within 12 months, the Company will be required to pay Global a termination fee of $153,000,000.
33
Certain terms of the Merger Agreement are summarized in, and the Merger Agreement has been filed as an exhibit to, the Current Report on Form 8-K filed by the Company on December 17, 2015.
See “Item 1A. Risk Factors-Risks Relating to the Merger with Global” for a description of certain risks related to this proposed transaction.
Payment Processing
At December 31, 2015, we provided our card payment processing services to 182,526 active SME merchants located across the United States. This compares to 169,831 active SME merchants at December 31, 2014. At December 31, 2015, we provided card payment processing services to approximately 3,194 Network Services merchants with approximately 43,987 locations, compared to 2,181 Network Services merchants with 42,397 locations at December 31, 2014. The increase in the number of Network Services merchants in 2015 primarily reflects adding smaller-size merchants (merchants with single or few locations), predominantly in the petroleum industry.
Our total card processing volume for the year ended December 31, 2015 was $117.4 billion, a 6.8% increase from the $109.9 billion processed during the year ended December 31, 2014. Our SME card processing volume for the year ended December 31, 2015 was $93.1 billion, a 14.8% increase over $81.1 billion in 2014. This increase in processing volume reflects same store sales growth and the addition of SME merchants whose processing volume exceeded that of merchants who attrited during the year. The increase in SME processing volume also reflects the impact of American Express Card Acceptance Program (referred to as "OptBlue") provided to new and existing merchants. We converted a majority of our existing merchants processing under the former sales and servicing agreement with American Express to OptBlue during the third quarter of 2014. For the year ended December 31, 2015, our OptBlue processing volume was $6.5 billion as compared to $2.6 billion for the year ended December 31, 2014. Our card processing volume for 2015 also includes $24.3 billion of settled volume for Network Services merchants, compared to $28.8 billion for 2014. The decrease in Network Services card processing volume primarily reflects lower gasoline prices at our petroleum industry customers. Card processing volume for the years ended December 31, 2015, 2014 and 2013 was as follows:
Year Ended December 31, | |||||||||||
2015 | 2014 | 2013 | |||||||||
(In millions) | |||||||||||
SME merchants | $ | 93,080 | $ | 81,077 | $ | 74,578 | |||||
Network Services merchants | 24,295 | 28,848 | 27,710 | ||||||||
Canada (a) | — | 59 | |||||||||
Total card processing volume (b) | $ | 117,375 | $ | 109,925 | $ | 102,347 | |||||
(a) | Canadian operations were discontinued as result of the sale of CPOS in January 2013. |
(b) | Card processing volume includes volume for credit and signature debit transactions. |
Merchant attrition is expected in the card payment processing industry in the ordinary course of business. We experience attrition in merchant card processing volume resulting from several factors, including business closures, transfers of merchants' accounts to our competitors and account closures that we initiate due to heightened credit risks. We measure SME processing volume attrition relative to all SME merchants that were processing with us in the same month a year earlier. During the year ended December 31, 2015, we experienced 10.0% attrition in our SME card processing volume compared to attrition of 12.7% and 12.9% for the years ended December 31, 2014 and 2013, respectively.
In our SME business, we measure same store sales growth, or contraction, as the change in card processing volume for all card merchants that were processing with us in the same month a year earlier. In 2015, same store sales grew 3.5% on average, compared to 2.0% same store sales growth in both 2014 and 2013, respectively. Same store sales growth or contraction results from the combination of the increasing or decreasing use by consumers of bankcards for the purchase of goods and services at the POS, and sales growth or contraction experienced by our retained SME merchants. Historically, our same store sales experience has tracked with the overall economic conditions in the industries we serve. The following table compares our same store sales growth or contraction during 2015, 2014 and 2013:
Same Store Sales Growth (Contraction) | 2015 | 2014 | 2013 | ||
First Quarter | 4.4% | (0.2)% | 2.2% | ||
Second Quarter | 3.4% | 2.4% | 1.9% | ||
Third Quarter | 4.1% | 1.8% | 1.6% | ||
Fourth Quarter | 2.2% | 3.9% | 2.4% | ||
Full Year | 3.5% | 2.0% | 2.0% | ||
34
We measure the overall production of our sales force by new gross margin installed, which reflects the expected annual gross profit from a merchant contract after deducting processing and servicing costs associated with that revenue. We measure installed margin primarily for our SME card processing, payroll processing and loyalty and gift card marketing businesses. In 2015, our newly installed gross margin for the year increased 21% from the gross margin we installed during the year ended December 31, 2014; in 2014 and 2013 the comparable growth rates were 17% and 22%, respectively. We attribute this increase in newly installed gross margin to higher volumes and margins at newly installed merchants and improved individual productivity achieved by our salespersons as well as growth in the sales force. Our combined Relationship Managers, Territory Managers, and Senior Product Advisors ("SPAs") totaled 1,240, 985 and 844 at December 31, 2015, 2014 and 2013, respectively. We expect to drive increases in year-over-year installed margin in future periods primarily by increasing the number of SPAs and Relationship and Territory Managers.
The card revenue we earn in our SME business is recurring in nature, as we typically enter into three-year service contracts with our card processing SME merchants that, in order to qualify for the agreed-upon pricing, require the merchant to achieve card processing volume minimums. Our SME revenue is generated primarily from payment processing fees, which are a combination of a fee equal to a percentage of the dollar amount of each transaction we process plus a flat fee per transaction. We make mandatory payments of interchange fees to the card issuer through the card networks and dues, assessments and other network fees to Visa, MasterCard, American Express and Discover. Our SME gross card processing revenue is largely driven by the Visa and MasterCard volume processed by our merchants. We also realize card processing revenues from processing transactions for our SME merchants accepting American Express and from processing Discover transactions.
In contrast to SME card processing revenues, revenues from our Network Services merchants are largely driven by the number of transactions we process (whether settled, or only authorized), not our processing volume, as the merchants which comprise Network Services' customer base pay on a per transaction basis for processing services. The number of Network Services transactions increased in 2015 primarily due to an increase in the number of transactions at our large petroleum merchants and the addition of smaller-size merchants.
Additionally, we provide authorization, settlement and account servicing services on our front and back end systems for American Express transactions for SME merchants and merchants originally signed to American Express by other processors. For those services we receive compensation from American Express on a per transaction basis. We converted a majority of our existing merchants processing under the former sales and servicing agreement with American Express to OptBlue during the third quarter of 2014. The number of transactions we processed for Network Services merchants and American Express for the years ended December 31, 2015, 2014 and 2013 were as follows:
Year Ended December 31, | ||||||||
2015 | 2014 | 2013 | ||||||
Network Services merchants: | (In thousands) | |||||||
Authorized | 2,403,163 | 2,384,723 | 2,347,776 | |||||
Settled | 1,208,448 | 1,083,606 | 967,230 | |||||
Total Network Services | 3,611,611 | 3,468,329 | 3,315,006 | |||||
American Express (a) | 1,025 | 17,150 | 32,016 | |||||
Total | 3,612,636 | 3,485,479 | 3,347,022 | |||||
(a) Includes only those transactions not eligible for residual compensation
Our ability to manage our front-end authorization systems, HPS Exchange, VAPS and NWS, provides us greater control of the electronic transaction process, allows us to offer our merchants a differentiated product offering, and offers economies of scale that we expect will increase our long-term profitability. During the years ended December 31, 2015, 2014 and 2013, approximately 97%, 96% and 96%, respectively, of our SME transactions were processed through HPS Exchange. All of our Network Services transactions were processed through VAPS or NWS.
We provide clearing, settlement and merchant accounting services through our own internally developed back-end processing system, Passport. Passport enables us to customize these services to the needs of our Relationship Managers and merchants. At December 31, 2015, 2014, and 2013, substantially all of SME merchants were processing on Passport and all Network Services settled transactions were processed on Passport.
We sold our interest in Collective POS Solutions Ltd. ("CPOS") in a transaction settled in January 2013. CPOS has historically represented an insignificant component of our financial position and results of operations. However, as further disclosed elsewhere in the notes to consolidated financial statements, we recognized a gain on the sale of CPOS in the first quarter of 2013.
35
Campus Solutions
Campus Solutions provides payment processing, integrated commerce solutions, higher education loan services and open- and closed-loop payment solutions to campuses throughout the United States and Canada.
We provide a suite of solutions to support administrative services for higher education including student loan payment processing, delinquency and default services, refund management, tuition payment plans, electronic billing and payment, tax document services, and business outsourcing. Our OneCard product enables personal identification, door access, cashless vending and laundry transactions, meal plans and cashless printing at campus facilities. Our Give Something Back Network adds internet and phone accessible closed-loop debit card based financial services to the students, faculty, staff and local community merchants of an educational institution.
On September 4, 2014, we acquired TouchNet Information Systems, Inc. ("TouchNet"), an integrated commerce solutions provider to higher-education institutions. TouchNet became a part of our Campus Solutions business. See “—Liquidity and Capital Resources — Acquisitions” for additional information on this transaction. TouchNet adds over 700 higher education clients serving over seven million students which is nearly one-third of higher education enrollment in the United States.
As of December 31, 2015, we provided services to more than 3,400 colleges and universities serving over 12 million students and borrowers. During 2015, we supported approximately $25.3 billion in higher education payments, 28.3 million payment transactions, prepared 5 million tax documents, and made over $1.2 billion in annual refunds.
Heartland School Solutions
We provide school nutrition, POS solutions, and associated payment solutions including online prepayment, to K-12 schools throughout the United States. At both December 31, 2015 and December 31, 2014 our Heartland School Solutions business provided services to more than 34,000 public and private schools. Our Heartland School Solutions business has been built through a series of six acquisitions, including the April 2014 acquisition of MCS Software. This acquisition continued the expansion of our market-leading position in the K-12 school nutrition and POS technology industry. The more than 34,000 K-12 schools that Heartland School Solutions serves nationwide, represent a 35% share of the public schools in the U.S.
Heartland Payroll Solutions
We provide payroll processing services throughout the United States. At December 31, 2015, we processed payroll for 33,937 customers, an increase of 31.7% from 25,764 payroll customers at December 31, 2014. In 2015, 2014 and 2013, we added 7,302, 5,821 and 5,797, respectively, new payroll processing customers. We operate a comprehensive payroll management platform, which we refer to as HPS (formerly PlusOne Payroll, and Heartland Ovation Payroll or HOP), that streamlines all aspects of the payroll process to enable time and cost savings. The HPS platform enables us to process payroll on a large scale and provide customizable solutions for businesses of all sizes.
On February 27, 2015, we purchased the stock of Payroll 1, Inc. ("Payroll 1") for a $30.0 million cash payment, plus net working capital. The purchase price was financed from the 2014 Revolving Credit Facility. The acquisition of Payroll 1 expanded our existing payroll processing business and customer base by adding 6,573 customers at acquisition.
Heartland Commerce
We provide the hospitality and retail industries with leading-edge POS solutions, payments processing capabilities and other adjacent business service applications through our Heartland Commerce business. Heartland Commerce is comprised of Xpient Solutions, LLC (“Xpient” acquired in October 2014); Merchant Software Corporation (referred to as "Liquor POS" which was acquired in February 2014); Automation, Inc. (d/b/a “pcAmerica” acquired in January 2015); Dinerware, Inc. (“Dinerware” acquired in February 2015) and Menusoft Systems Corporation (a.k.a. “Digital Dining” acquired in October 2015). Heartland Commerce is in the process of developing cloud-based POS systems that complement our well-established on-premise POS solutions. Digital Dining offers restaurants the convenience of a handheld POS on an iPhone, iPod and iPad in a hybrid environment with conventional fixed terminals, and is also used by restaurateurs for table management, delivery, reservations, labor scheduling, inventory and loyalty programs. See "— Liquidity and Capital Resources — Acquisitions" for more detail on these acquisitions.
In the fourth quarter of 2014, management considered the overlapping cloud-based POS systems in development at Heartland Commerce businesses and decided that it would stop POS development efforts at Leaf Acquisition, LLC (“Leaf”), a previous Heartland Commerce business. This decision caused a significant adverse change in the extent or manner in which the long-lived asset group of Leaf would be used, including Prosper, an internally developed POS software technology. Due to these changes in circumstances, the implied fair value of the Leaf reporting unit was determined to be significantly below its carrying value. This led to a Goodwill Impairment charge for the full balance of Leaf Goodwill as of December 31, 2014. In
36
the fourth quarter of 2014, we recorded pre-tax Goodwill and Asset Impairment charges of $18.5 million and $18.9 million, respectively. As of June 30, 2015, losses from Leaf have concluded. Leaf’s operations lost $10.4 million, or $0.08 per share, during the year ended December 31, 2014.
2015 Financial Highlights
Year Ended December 31, 2015 Compared to Year Ended December 31, 2014
For the year ended December 31, 2015, we recorded net income of $84.7 million, or $2.28 per share, compared to $33.9 million, or $0.91 per share, for the year ended December 31, 2014.
Net income for the year ended December 31, 2015 reflects a gain on sale of assets for the sale of SmartLink of $7.0 million pre-tax ($4.3 million after-tax, or $0.11 per share). See “— Results of Operations — Year Ended December 31, 2015 Compared to Year Ended December 31, 2014” for further details on this sale.
Net income for the year ended December 31, 2014 reflected the following:
• | Asset impairment charges related to our investment in Leaf and other POS assets, and our investment in the stock of TabbedOut, of $41.4 million pre-tax ($37.6 million after-tax, or $1.02 per share). See "— Overview — Heartland Commerce" for further details on these impairment charges. |
• | Pre- and after-tax gain of $3.6 million, or $0.10 per share, recognized as a result of our August 6, 2014 acquisition of all shares of Leaf common stock held by noncontrolling shareholders and the concurrent release from a contingent earn-out liability to those noncontrolling shareholders. |
• | Out of period adjustments of $2.3 million, or $.04 per share, as a result of immaterial errors that originated in 2013 in our Heartland School Solutions business. See “— Results of Operations — Year Ended December 31, 2015 Compared to Year Ended December 31, 2014” for further details on these out of period adjustments. |
Our income from operations, which we also refer to as operating income, increased $63.4 million, or 77.2%, to $145.5 million for the year ended December 31, 2015, from $82.1 million for the year ended December 31, 2014. Our operating margin, which we measure as operating income divided by net revenue, was 17.7% for the year ended December 31, 2015, compared to 12.2% for the year ended December 31, 2014. Operating income and operating margin for 2014 reflect the impact of the POS asset and goodwill impairment charges described above. Excluding the impact of the goodwill and asset impairment charges, our 2014 operating income and operating margin would have been $119.5 million and 17.8%, respectively.
Our operating income for the year ended December 31, 2015, as compared to the year ended December 31, 2014, benefited from 22.4% year-over-year growth in net revenue partially offset by increased expenses, including increases of 28.1% in general and administrative expenses and 15.3% in processing and servicing costs.
The following is a summary of our results of operations for the year ended December 31, 2015:
• | Net revenue, which we define as total revenues less interchange fees and dues, assessments and fees, increased $150.3 million, or 22.4%, from $672.6 million in the year ended December 31, 2014 to $823.0 million in the year ended December 31, 2015. The increase in net revenue reflects $81.2 million or 12.1% growth from our 2014 and 2015 acquisitions. The remaining $69.1 million, or 10.3%, organic increase in net revenue reflects the following: |
◦ | Increased Payment Processing net revenue of $45.6 million, or 9.6%, which reflects growth in SME processing volume. During the year ended December 31, 2015, our SME processing volume increased 14.8% to $93.1 billion from $81.1 billion during the year ended December 31, 2014. The year-over-year increase reflects same store sales growth and the addition of SME merchants whose processing volume and net revenue exceeded that of merchants who attrited in the same period. The increase in SME processing volume also reflects the conversion of new and existing merchants to OptBlue. We converted a majority of our existing merchants processing under the former sales and servicing agreement with American Express to OptBlue during the third quarter of 2014. For the year ended December 31, 2015, our OptBlue processing volume was $6.5 billion as compared to $2.6 billion for the year ended December 31, 2014. |
◦ | Organic increases in revenues across other business segments including Heartland School Solutions, Heartland Payroll Solutions and Campus Solutions. These organic increases are further detailed in “— Results of Operations — Year Ended December 31, 2015 Compared to Year Ended December 31, 2014.” |
37
• | Our processing and servicing expense increased 15.3% from $285.0 million for the year ended December 31, 2014 to $328.6 million for the year ended December 31, 2015. The increase in processing and servicing expenses includes a $22.0 million increase from our 2014 and 2015 acquisitions. The remaining increase is attributable to increased costs associated with processing and servicing higher SME bankcard processing volume, increased sales and incentive compensation and increased cost of sales and servicing related to higher Heartland Payroll Solutions and Campus Solutions net revenue. Partially offsetting these increases was a decrease in merchant losses. Merchant losses for the year ended December 31, 2014 included $4.6 million of chargebacks from a single merchant who entered bankruptcy in the fourth quarter of 2014. |
• | Our general and administrative expenses increased 28.1% from $190.6 million for the year ended December 31, 2014 to $244.0 million for the year ended December 31, 2015. The increase in general and administrative expenses includes $33.4 million from our 2014 and 2015 acquisitions. The remaining increase reflects higher personnel expense including incentive and share-based compensation increases, higher acquisition related expenses and increased expense across various general and administrative expense categories supporting our organic growth. |
See “— Results of Operations — Year Ended December 31, 2015 Compared to Year Ended December 31, 2014” for a more detailed discussion of our full year operating results.
Fourth Quarter Ended December 31, 2015 Compared to Fourth Quarter Ended December 31, 2014
For the fourth quarter ended December 31, 2015, we recorded net income of $22.7 million, or $.61 per share, compared to a net loss of $19.8 million, or $.55 per share, for the fourth quarter ended December 31, 2014.
Net income for the fourth quarter ended December 31, 2015 reflects a gain on sale of assets for the sale of SmartLink of $7.0 million pre-tax ($4.3 million after-tax, or $0.11 per share). See “— Results of Operations — Year Ended December 31, 2015 Compared to Year Ended December 31, 2014” for further details on this sale.
Net income for the fourth quarter ended December 31, 2014 reflected asset impairment charges related to our investment in Leaf and other POS assets, and our investment in the stock of TabbedOut, of $41.4 million pre-tax ($37.6 million after-tax, or $1.02 per share). See "— Overview — Heartland Commerce" for further details on these impairment charges.
Our income from operations, which we also refer to as operating income, increased $39.4 million to $34.8 million for the fourth quarter ended December 31, 2015, from a loss from operations of $4.6 million for the fourth quarter ended December 31, 2014. Our operating margin, which we measure as operating income divided by net revenue, was 16.3% for the fourth quarter ended December 31, 2015, compared to (2.4)% for the fourth quarter ended December 31, 2014. Operating loss for the fourth quarter of 2014 reflects the impact of the POS asset and goodwill impairment charges described above. Excluding the impact of the goodwill and asset impairment charges, our fourth quarter of 2014 operating income and operating margin would have been $32.8 million and 17.4%, respectively.
Our operating income for the fourth quarter ended December 31, 2015, as compared to the fourth quarter ended December 31, 2014, benefited from 13.7% quarter-over-quarter growth in net revenue partially offset by increased expenses, including increases of 30.1% in general and administrative expenses and 3.0% in processing and servicing costs.
The following is a summary of our results of operations for the fourth quarter ended December 31, 2015:
• | Net revenue, which we define as total revenues less interchange fees and dues, assessments and fees, increased $25.8 million, or 13.7%, from $188.3 million in the fourth quarter ended December 31, 2014 to $214.1 million in the fourth quarter ended December 31, 2015. The increase in net revenue reflects $11.6 million or 6.2% growth from our 2014 and 2015 acquisitions. The remaining $14.2 million, or 7.5%, organic increase in net revenue reflects the following: |
◦ | Increased Payment Processing net revenue of $6.1 million, or 4.8%, which reflects growth in SME processing volume. During the fourth quarter ended December 31, 2015, our SME processing volume increased to $24.0 billion from $21.0 billion during the fourth quarter ended December 31, 2014. The year-over-year increase reflects same store sales growth and the addition of SME merchants whose processing volume and net revenue exceeded that of merchants who attrited in the same period. The increase in SME processing volume also reflects the conversion of new and existing merchants to OptBlue. We converted a majority of our existing merchants processing under the former sales and servicing agreement with American Express to OptBlue during the third quarter of 2014. For the fourth quarter ended December 31, 2015, our OptBlue processing volume was $1.8 billion as compared to $1.4 |
38
billion for the fourth quarter ended December 31, 2014. Payment Processing net revenue for the fourth quarter ended December 31, 2014 included one-time revenues associated with the conversion to OptBlue.
◦ | Organic increases in revenues across other business segments including Heartland School Solutions, Heartland Payroll Solutions and Campus Solutions. |
• | Our processing and servicing expense increased 3.0% from $80.0 million for the fourth quarter ended December 31, 2014 to $82.4 million for the fourth quarter ended December 31, 2015. The increase in processing and servicing expenses includes a $3.3 million increase from our 2014 and 2015 acquisitions. Excluding acquisitions, processing and servicing expense reflects a decrease for the fourth quarter of 2015 compared to the fourth quarter of 2014. This decrease is primarily due to lower merchant losses. Merchant losses for the fourth quarter ended December 31, 2014 included $4.6 million of chargebacks from a single merchant who entered bankruptcy within the quarter. This decrease is partially offset by higher processing and servicing expense associated with higher SME bankcard processing volume, increased sales and incentive compensation and increased cost of sales and servicing related to higher Heartland Payroll Solutions and Campus Solutions net revenue. |
• | Our general and administrative expenses increased 30.9% from $53.3 million for the fourth quarter ended December 31, 2014 to $69.8 million for the fourth quarter ended December 31, 2015. The increase in general and administrative expenses includes $5.8 million from our 2014 and 2015 acquisitions. The remaining increase reflects higher personnel expense including incentive and share-based compensation increases, higher acquisition related expenses (including $2.2 million of costs associated with the pending merger with Global) and increased expense across various general and administrative expense categories supporting our organic growth. |
Components of Revenues and Expenses
Revenue. We report revenue as part of the following reporting segments: (i) Payment Processing, (ii) Campus Solutions, (iii) Heartland School Solutions, (iv) Heartland Payroll Solutions and (v) Other. We recognize revenue when (1) persuasive evidence of an arrangement exists; (2) delivery has occurred or services have been performed; (3) the price is fixed or determinable; and (4) collectability is reasonably assured. We also evaluate our contractual arrangements for indications that multiple element arrangements may exist, including instances where more-than-incidental software deliverables are included.
Payment Processing revenue primarily consists of discount, per-transaction and periodic (primarily monthly) fees from the processing of Visa, MasterCard, American Express and Discover transactions for SME merchants and per-transaction fees for the authorization and settlement of transactions for Network Services merchants. Also included in this category are American Express servicing fees, merchant service fees, fees for processing chargebacks and termination fees on terminated contracts. Interchange fees, which are our most significant expense, are set by the card networks and paid to the card issuing banks. For the majority of SME card processing revenue, we do not offset processing revenues and interchange fees because our business practice is to advance the interchange fees to most SME merchants when settling their daily transactions (thus paying the full amount of the transaction to the merchant), and then to collect the full discount fees from merchants on the first business day of the next month. For SME merchants to whom we do not advance interchange, we record card processing revenues net of interchange fees. As Network Services does not advance interchange fees to its merchants, we record card processing revenues net of interchange fees.
Campus Solutions revenue includes fees associated with providing integrated commerce solutions to support administrative services for higher education, as well as, student loan payment processing, delinquency and default services, refund management, tuition payment plans, electronic billing and payment, tax document services and business outsourcing. Campus Solutions revenue also includes fees from the sale and maintenance of open- and closed-loop payment hardware and software solutions for college or university campuses to process small value electronic transactions.
Heartland School Solutions’ revenue includes fees from sales and maintenance of cafeteria POS solutions and associated payment solutions, including online prepayment solutions, back office management and hardware and technical support.
Heartland Payroll Solutions revenue includes fees charged for payroll processing services, including check printing, direct deposit, related federal, state and local tax deposits and providing accounting documentation and interest income earned on funds held for customers.
Other revenues include Micropayments’ fees from selling hardware and software for unattended online wireless credit card based payment systems, and unattended value top up systems for off-line closed-loop smart (chip) card based payment
39
systems. Also included in this category are Heartland Marketing Solutions' fees from selling mobile and card-based marketing services, gift cards and rewards services as well as fees from selling, renting and deploying POS devices. Other revenues also include Heartland Commerce, which provides POS solutions, payments processing capabilities and other adjacent business service applications, serving the hospitality and retail industry.
Net Revenue. We define net revenue as total revenues less interchange fees and dues, assessments and fees. Management uses net revenue to assess our operating performance, including operating margin.
Expenses. In addition to interchange fees, we also pay Visa, MasterCard, American Express and Discover, as well as certain PIN networks, dues, assessments and fees, which are a combination of a percentage of the dollar volume processed and per-transaction fees. Interchange fees and dues, assessments and fees are recognized at the time transactions are processed. It is our policy to pass along to our merchants any changes in interchange fees and card network dues, assessments and fees. Since the card networks regularly adjust those rates, our gross card processing revenue will increase or decrease, but all the impact of such changes will be paid to the card issuing banks or networks, and our net revenue and income from operations will not be affected.
Costs of services also include processing and servicing costs, customer acquisition costs, and depreciation and amortization. Processing and servicing costs include:
• | processing costs, which are either paid to third parties, including our bank sponsors, or represent the cost of our own authorization/capture and accounting/settlement systems. During 2015 and 2014, costs we paid to third parties represented about 31% and 34% of our processing costs, respectively; |
• | residual commission payments to our Relationship Managers, sales managers, trade associations, agent banks and value-added resellers, which are a percentage of the gross margin we generated from our merchant contracts during the accounting period; |
• | the costs of operating our service center and other customer support locations, including telecommunications costs, personnel costs, occupancy costs, losses due to merchant defaults, depreciation and amortization, and other direct servicing costs; and |
• | the costs of merchant supplies, bankcard terminals, POS systems, hardware and software deployed in our businesses. |
Customer acquisition costs reflect the amortization over the initial three-year contract term of the cash signing bonus paid, and the deferred acquisition costs accrued for vested Relationship Managers and sales managers, as well as changes in the accrued buyout liability, which reflect the impact of buying out residual commissions and volume attrition (see “— Critical Accounting Estimates — Accrued Buyout Liability”).
Depreciation and amortization expenses consist of depreciation on our investments in property, equipment and software, and our amortization of acquired intangible assets. Depreciation and amortization expenses are primarily recognized on a straight-line basis over the estimated useful life of the asset, except for the amortization of customer relationships intangible assets which is recognized using a proportional cash flow method.
General and administrative expenses include personnel and other administrative expenses related to our information technology infrastructure costs, our marketing expenses and other administrative functions.
Critical Accounting Estimates
The discussion and analysis of our financial condition and results of operations are based on our consolidated financial statements, which have been prepared in accordance with accounting principles generally accepted in the United States. The preparation of these financial statements requires us to make estimates and judgments that affect the reported amounts of assets, liabilities, revenue and expenses. Actual results could differ from those estimates. Our significant accounting policies are more fully described in Note 2 to our consolidated financial statements included elsewhere in this report. The critical accounting estimates described here are those that are most important to the depiction of our financial condition and results of operations, including those whose application requires management's most subjective judgment in making estimates about the effect of matters that are inherently uncertain. The line items on our income statement and balance sheet, which are impacted by management's estimates, are described below.
Revenue
Our card processing revenue is derived from processing and settling Visa, MasterCard, American Express and Discover bankcard transactions for our merchant customers. Our most significant expense related to the generation of those revenues is interchange fees, which are set by the card networks, and paid to the card issuing banks. For our SME merchant
40
card processing, we do not offset card processing revenues and interchange fees in our income statement because our business practice is to advance the interchange fees to most of our SME merchants when settling their daily transactions (thus paying the full amount of the transaction to the merchant), and then to collect our full discount fees from our merchants on the first business day of the next month. We fund interchange advances to our SME merchants from a combination of our operating cash, processing cash and advances from our sponsor banks. We believe this policy aids in new business generation, as our merchants benefit from bookkeeping simplicity. However, this practice results in our carrying a large receivable from our merchants at each period-end, and a corresponding but smaller payable to our sponsor banks, which are settled on the first business day after the period-end. As we are at risk for the advance receivables, we record the associated revenues on a gross processing revenue basis in our consolidated Statements of Income. We have merchant portability, credit risk, and the ultimate responsibility to the merchant and, as such, revenue is reported at the time of settlement on a gross basis. Payment processing services are transaction based and priced either as a fixed fee per transaction or calculated as a percentage of the transaction value. The fees are charged for the processing services provided and do not include the gross sales price paid by the ultimate buyer to the merchant. Certain of our competitors report their processing revenue net of interchange fees. This is because the card issuing banks make their payments to these competitors net of those interchange fees, and these acquirers pay this reduced amount to their merchants. For our Network Services merchants, we also record a portion of our processing revenues net of interchange fees because the daily cash settlement with Network Services' merchants is net of interchange fees.
We also evaluate contractual arrangements for indications that multiple element arrangements may exist including instances where more-than-incidental software deliverables are included. Both Campus Solutions and Heartland School Solutions have arrangements that contain multiple elements, such as hardware, software products, including perpetual licenses and Software-as-a-Service (“SaaS”) services, maintenance, and professional installation and training services. We allocate revenues to each element based on the selling price hierarchy. The selling price for a deliverable is based on vendor specific objective evidence (“VSOE”) of selling price, if available, third party evidence ("TPE") if VSOE of selling price is not available, or estimated selling price (“ESP”) if neither VSOE or selling price nor TPE is available. We establish ESP, based on our judgment, considering internal factors such as margin objectives, pricing practices and controls, customer segment pricing strategies and the product life cycle. In arrangements with multiple elements, we determine allocation of the transaction price at inception of the arrangement based on the relative selling price of each unit of accounting.
In multiple element arrangements where more-than-incidental software deliverables are included, we have applied the residual method to determine the amount of software license revenues to be recognized. Under the residual method, if fair value exists for undelivered elements in a multiple-element arrangement, such fair value of the undelivered elements is deferred with the remaining portion of the arrangement consideration recognized upon delivery of the software license or services arrangement. We allocate the fair value of each element of a software related multiple-element arrangement based upon its fair value as determined by VSOE, with any remaining amount allocated to the software license. If evidence of the fair value cannot be established for the undelivered elements of a software arrangement then the entire amount of revenue under the arrangement is deferred until these elements have been delivered or objective evidence can be established.
Capitalized Customer Acquisition Costs
Capitalized customer acquisition costs consist of (1) up-front signing bonuses paid to Relationship Managers, SPAs and sales managers, referred to as the "salesperson" or "salespersons," for the establishment of new merchant relationships, and (2) deferred acquisition cost representing the estimated cost of buying out the commissions of vested salespersons at some point in the future. Capitalized customer acquisition costs represent incremental, direct customer acquisition costs that are recoverable through gross margins associated with SME merchant contracts. The capitalized customer acquisition costs are amortized using a method which approximates a proportional revenue approach over the initial three-year term of the merchant contract.
The amount of the up-front signing bonus paid for new SME card, payroll and loyalty marketing accounts is based on the estimated gross margin for the first year of the merchant contract. The gross signing bonuses paid during 2015, 2014 and 2013 were $53.3 million, $42.7 million and $32.7 million, respectively. The signing bonus paid, amount capitalized, and related amortization are adjusted at the end of the first year to reflect the actual gross margin generated by the merchant contract during that year. The net signing bonus adjustments made during 2015, 2014 and 2013 were $(5.1) million, $(4.0) million and $(3.7) million, respectively. Negative signing bonus adjustments occur when the actual gross margin generated by the merchant contract during the first year is less than the estimated gross margin for that year, resulting in the overpayment of the up-front signing bonus, which overpayment would be recovered from the relevant salesperson. Positive signing bonus adjustments result from prior underpayments of up-front signing bonuses, and would be paid to the relevant salesperson.
41
The deferred acquisition cost component of capitalized customer acquisition costs is accrued for vested salespersons over the first year of SME card, payroll and loyalty marketing merchant processing, consistent with the build-up in the accrued buyout liability, which is described below.
Management evaluates the capitalized customer acquisition costs for impairment by comparing, on a pooled basis by vintage month of origination, the expected future net cash flows from underlying merchant relationships to the carrying amount of the capitalized customer acquisition costs. If the estimated future net cash flows are lower than the recorded carrying amount, indicating an impairment of the value of the capitalized customer acquisition costs, the impairment loss will be charged to operations. We have not recognized an impairment loss of this type in 2015, 2014 or 2013.
Accrued Buyout Liability
We pay our salespersons residual commissions based on the gross margin generated from the monthly processing activity of SME, payroll, and loyalty marketing merchant accounts signed by them. We refer to these residual commissions as the ''owned'' portion of such commissions, or ''portfolio equity.'' The salesperson has no obligation to perform additional services for the merchant for so long as the merchant continues processing with us. We have the right, but not the obligation, to buy out some or all of these commissions, and intend to do so periodically. We accrue the buyout liability, which represents the estimated current settlement cost of buying out all vested and expected-to-vest salespersons for the owned portion of such commissions. We also record a deferred acquisition cost asset related to those buyouts, and amortize that asset as an expense over the initial three year contract term.
We consider a salesperson to be vested once they have established merchant relationships that generate on average the equivalent of $10,000 of monthly gross margin for a rolling 90 day period. Vested status entitles the salesperson to his or her residual commissions for as long as the merchant processes with us, even if the salesperson is no longer employed by us.
The accrued buyout liability is based on the merchants we have under contract at the balance sheet date, the gross margin we generated from those accounts in the prior twelve months, the “owned” commission rate, and the fixed buyout multiple of 2.5 times the commissions. The liability related to a new merchant is therefore zero when the merchant is installed, and increases over the twelve months following the installation date. A small portion of our accrued buyout liability, approximately 6%, relates to salespersons who have opted to receive a multiple of 2.0 times commissions in exchange for a larger company contribution towards their health insurance.
For unvested salespersons, the accrued buyout liability is accrued over the expected vesting period; however, no deferred acquisition cost is capitalized as future services are required in order to vest. In calculating the accrued buyout liability for unvested salespersons, we have assumed that 31% of unvested salespersons will vest in the future, which represents our historical vesting rate. A 5% increase to 36% in the expected vesting rate would have increased the accrued buyout liability for unvested salespersons by $0.3 million and $0.2 million at December 31, 2015 and 2014, respectively.
Buyout payments made to salespersons reduce the outstanding accrued buyout liability. Given our view of the duration of the cash flows associated with a pool of merchant contracts, we believe that the benefits of such buyouts significantly exceed the cost, which typically represents 2 ½ years of commissions. If the cash flows associated with a pool of bought out contracts does not exceed this cost, we will incur an economic loss on our decision to buyout the contracts. During 2015, 2014, and 2013, we made buyout payments of approximately $15.4 million, $11.6 million and $13.7 million, respectively.
Processing Liabilities
Processing liabilities result primarily from our card processing activities and include merchant deposits maintained to offset potential liabilities arising from merchant chargebacks. At December 31, 2015 and 2014, processing liabilities totaled approximately $152.2 million and $119.4 million, respectively.
Disputes between a cardholder and a merchant periodically arise as a result of, among other things, the cardholder's
dissatisfaction with merchandise quality or merchant services. Such disputes may not be resolved in the merchant's favor. In
these cases, the transaction is ''charged back'' to the merchant, which means the purchase price is refunded to the customer by the card-issuing bank and charged to the merchant. If the merchant is unable to fund the refund, we must do so. We also bear the risk of reject losses arising from the fact that we collect our fees from our merchants on the first day after the monthly billing period. If the merchant has gone out of business during such period, we may be unable to collect such fees. We maintain cash deposits or require the pledge of a letter of credit from certain merchants, generally those with higher average transaction size where the card is not present when the charge is made or the product or service is delivered after the charge is made, in order to offset potential contingent liabilities such as chargebacks and reject losses that would arise if the
42
merchant went out of business. At December 31, 2015 and 2014, we held SME merchant deposits totaling $6.6 million and $6.2 million, respectively. Most chargeback and reject losses are charged to processing and servicing as they are incurred. However, we also maintain a loss reserve against losses including major fraud losses, which are both less predictable and involve larger amounts. The loss reserve was established using historical loss rates, applied to recent card processing volume. At December 31, 2015 and 2014, our loss reserve totaled $1.0 million and $3.4 million (including amounts reserved for chargebacks from a single merchant described below), respectively. Aggregate SME merchant losses were $2.9 million, $7.3 million and $3.1 million, or 0.31 basis points, 0.90 basis points and 0.41 basis points, respectively, of our SME card processing volume for the years ended December 31, 2015, 2014 and 2013. In 2014, our losses included $4.6 million resulting from chargebacks from a single merchant who entered bankruptcy in the fourth quarter. Chargeback losses originating from Network Services card processing on Passport during the year ended December 31, 2015, 2014 and 2013 were immaterial.
Share-based Compensation
We expense employee share-based payments under the fair value method. Share-based compensation cost is measured at the grant date, based on the fair value of the award, and is recognized as expense over the requisite service period.
Restricted Share Units. We grant three types of Restricted Share Units (“RSUs”); service-based RSUs, performance-based RSUs (“PRSUs”), and total shareholder return RSUs (“TRSUs”). With regard to PRSUs and TRSUs, estimates and judgments are made concerning ultimate achievement of performance targets which impact the amount of share-based compensation expense recorded. The closing price of our common stock on the grant date equals the grant date fair value of our unvested service-based RSUs and PRSUs. A lattice valuation model was applied to measure the grant date fair value of our TRSUs.
PRSUs. In the fourth quarters of 2013, 2014 and 2015, the Compensation Committee of our Board of Directors approved grants of PRSUs having rights to earn 0% to 250% of a target number of shares of our common stock depending on the achievement of grant-specific three-year performance targets and service vesting. The target number of shares for these PRSUs will be earned only if we achieve target pro forma diluted earnings per share growth rates of 30% to 40% over the three-year periods. Pro forma diluted earnings per share for performance targets are calculated excluding non-operating gains and losses, if any, and excluding the after-tax impact of share-based compensation expense.
The closing price of our common stock on the grant date equals the grant date fair value of these nonvested Restricted Share Units awards and will be recognized as compensation expense over their vesting periods. We have recorded expense on these PRSUs based on achieving the performance targets.
TRSUs. Additionally, in the fourth quarters of 2013 and 2014, the Compensation Committee of our Board of Directors approved grants of TRSUs having rights to earn 0% to 225% of a target number of shares of our common stock depending on the achievement of grant-specific three- and four -year measures of total shareholder returns and service vesting. We have recorded expense on these TRSUs based on achieving the targets.
Certain Impacts of the Merger Agreement on Vesting of Share-Based Awards. All unvested share-based awards would become vested and be settled at the close of the transaction contemplated by the Merger Agreement. Any performance-based vesting condition will be deemed to have been satisfied at maximum or target levels, depending on whether the award was granted prior to or after December 1, 2015, respectively. See “Item 1. Business - Agreement and Plan of Merger” for more detail regarding this transaction.
In December 2015, we accelerated the vesting of 2016 vesting tranches for selected equity awards held by eight of our executive officers so that these awards vested on December 22, 2015. The value of these awards, based on the closing price of our common stock on the NYSE on December 22, 2015 of $95.02, was $8.3 million. Under Financial Accounting Standards Board Accounting Standards Codification ("FASB ASC") Topic 718, this acceleration of 2016 vesting tranches qualifies as a Type I Modification to vesting terms which requires acceleration of expense at original grant date fair value. This action resulted in the acceleration of $1.7 million of share-based compensation expense from 2016 to 2015. There was no incremental compensation cost recorded in connection with this modification as the modification only affects the service period of the awards, which is shorter than the requisite service period of the original awards.
Goodwill
Goodwill represents the excess of acquisition costs over the fair values of net assets acquired in business combinations. We test goodwill for impairment at least annually in the fourth quarter and between annual tests if an event occurs or changes in circumstances suggest a potential decline in the fair value of the reporting unit. A significant amount of
43
judgment is involved in determining if an indicator or change in circumstances relating to impairment has occurred. Such changes may include, among others: a significant decline in expected future cash flows; a sustained decline in market capitalization; a significant adverse change in legal factors or in the business climate; unanticipated competition; and slower growth rates.
We have the option of performing a qualitative assessment of impairment to determine whether any further quantitative testing for impairment is necessary. The option of whether or not to perform a qualitative assessment is made annually and may vary by reporting unit. Factors we consider in the qualitative assessment include general macroeconomic conditions, industry and market conditions, cost factors, overall financial performance of our reporting units, events or changes affecting the composition or carrying amount of the net assets of our reporting units, sustained decrease in our share price, and other relevant entity-specific events. If we elect to bypass the qualitative assessment or if we determine, on the basis of qualitative factors, that the fair value of the reporting unit is more likely than not less than the carrying value, we perform a two-step quantitative test for that reporting unit. In the first step, the fair value of each reporting unit is compared to the reporting unit's carrying value, including goodwill. If the fair value of a reporting unit is less than its carrying value, the second step of the goodwill impairment test is performed to measure the amount of impairment, if any. In the second step, the fair value of the reporting unit is allocated to the assets and liabilities of the reporting unit as if it had been acquired in a business combination and the purchase price was equivalent to the fair value of the reporting unit. The excess of the fair value of the reporting unit over the amounts assigned to its assets and liabilities is referred to as the implied fair value of goodwill. The implied fair value of the reporting unit's goodwill is then compared to the actual carrying value of the goodwill. If the implied fair value of goodwill is less than the carrying value of goodwill, an impairment loss is recognized for the difference.
Significant estimates and assumptions are used in our goodwill impairment review and include the identification of reporting units, assigning assets and liabilities to reporting units, assigning goodwill to reporting units and determining the fair value of each reporting unit. Our assessment of qualitative factors involves significant judgments about expected future business performance and general market conditions. In a quantitative assessment, the fair value of each reporting unit is determined based on a combination of techniques, including the present value of future cash flows, applicable multiples of competitors and multiples from sales of like businesses, and requires us to make estimates and assumptions regarding discount rates, growth rates and our future long-term business plans. Changes in any of these estimates or assumptions could materially affect the determination of fair value and the associated goodwill impairment charge for each reporting unit.
As of December 31, 2015, we performed a qualitative assessment for each of our reporting units, except one, for which we performed a quantitative assessment. Based on our annual test as of December 31, 2015, we determined on the basis of qualitative factors that the fair values of the reporting units for which we performed a qualitative assessment were not more likely than not less than their respective carrying amounts. Based on the quantitative assessment we did for one of our reporting units, we determined that the goodwill for that reporting unit was not impaired. We believe that the fair values of our reporting units are substantially in excess of their carrying amounts.
At December 31, 2015 and 2014, goodwill of $490.0 million and $425.7 million, respectively, was recorded in our Consolidated Balance Sheets. We may be required to record goodwill impairment losses in future periods, whether in connection with our next annual impairment testing in the fourth quarter of 2016 or prior to that, if any such indicators constitute a triggering event in other than the quarter in which the annual goodwill impairment test is performed. It is not possible at this time to determine if any such future impairment loss would result or, if it does, whether such charge would be material.
Income Taxes
We account for income taxes by recognizing deferred tax assets and liabilities, which are recorded to reflect the future tax consequences attributable to the effects of differences between the carrying amounts of existing assets and liabilities for financial reporting and for income tax purposes. Judgments are required in determining the amount and probability of future taxable income, which in turn is critical to a determination of whether a valuation allowance against the deferred tax assets is appropriate.
We also account for the recognition and measurement of tax benefits associated with uncertain tax positions. This requires evaluations of individual tax positions to determine whether any part of that position can be recognized or continues to be recognized in the financial statements. An uncertain tax position exists if it is unclear how a transaction will be treated under tax law. We had approximately $6.6 million of total gross unrecognized tax benefits as of December 31, 2015, approximately $4.5 million of which would impact the effective tax rate.
44
Results of Operations
Year Ended December 31, 2015 Compared to Year Ended December 31, 2014
The following table shows certain income statement data as a percentage of net revenue for the periods indicated (in | ||||||||||||||||||||
thousands of dollars): | % of Net Revenue | % of Net Revenue | Change | |||||||||||||||||
2015 | 2014 | Amount | % | |||||||||||||||||
Net revenue: | ||||||||||||||||||||
Total revenue | $ | 2,682,396 | $ | 2,311,381 | $ | 371,015 | 16.1 | % | ||||||||||||
Less: Interchange | 1,617,671 | 1,422,894 | 194,777 | 13.7 | % | |||||||||||||||
Less: Dues, assessments and fees | 241,767 | 215,862 | 25,905 | 12.0 | % | |||||||||||||||
Total net revenue | 822,958 | 100.0 | % | 672,625 | 100.0 | % | 150,333 | 22.4 | % | |||||||||||
Expenses: | ||||||||||||||||||||
Processing and servicing | 328,630 | 39.9 | % | 285,011 | 42.4 | % | 43,619 | 15.3 | % | |||||||||||
Customer acquisition costs | 59,458 | 7.2 | % | 46,977 | 7.0 | % | 12,481 | 26.6 | % | |||||||||||
Depreciation and amortization | 45,317 | 5.5 | % | 30,598 | 4.5 | % | 14,719 | 48.1 | % | |||||||||||
General and administrative | 244,005 | 29.6 | % | 190,554 | 28.3 | % | 53,451 | 28.1 | % | |||||||||||
Goodwill impairment charge | — | — | % | 18,490 | 2.7 | % | (18,490 | ) | (100.0 | )% | ||||||||||
Asset impairment charges | — | — | % | 18,875 | 2.8 | % | (18,875 | ) | (100.0 | )% | ||||||||||
Total expenses | 677,410 | 82.3 | % | 590,505 | 87.8 | % | 86,905 | 14.7 | % | |||||||||||
Income from operations | 145,548 | 17.7 | % | 82,120 | 12.2 | % | 63,428 | 77.2 | % | |||||||||||
Other income (expense): | ||||||||||||||||||||
Interest income | 105 | — | % | 125 | — | % | (20 | ) | (16.0 | )% | ||||||||||
Interest expense | (14,184 | ) | (1.7 | )% | (8,057 | ) | (1.2 | )% | (6,127 | ) | (76.0 | )% | ||||||||
Gain on sale of assets | 7,008 | 0.9 | % | — | — | % | 7,008 | 100.0 | % | |||||||||||
Other, net | (402 | ) | — | % | (444 | ) | (0.1 | )% | 42 | 9.5 | % | |||||||||
Total other expense | (7,473 | ) | (0.9 | )% | (8,376 | ) | (1.2 | )% | 903 | 10.8 | % | |||||||||
Income before income taxes | 138,075 | 16.8 | % | 73,744 | 11.0 | % | 64,331 | 87.2 | % | |||||||||||
Provision for income taxes | 53,343 | 6.5 | % | 41,876 | 6.2 | % | 11,467 | 27.4 | % | |||||||||||
Net income | 84,732 | 10.3 | % | 31,868 | 4.7 | % | 52,864 | 165.9 | % | |||||||||||
Less: Net loss attributable to noncontrolling interests | — | — | % | (2,011 | ) | (0.3 | )% | 2,011 | 100.0 | % | ||||||||||
Net income attributable to Heartland | $ | 84,732 | 10.3 | % | $ | 33,879 | 5.0 | % | $ | 50,853 | 150.1 | % | ||||||||
Revenue. The following tables summarize total revenue and total net revenue (which we define as total revenue less interchange fees and dues, assessments and fees) by segment for the years ended December 31, 2015 and 2014 (in thousands of dollars):
Year Ended December 31, | Change from Prior Year | ||||||||||||||
Total revenue: | 2015 | 2014 | Amount | % | |||||||||||
Payment Processing | $ | 2,371,878 | $ | 2,111,487 | $ | 260,391 | 12.3 | % | |||||||
Campus Solutions | 117,208 | 61,538 | 55,670 | 90.5 | % | ||||||||||
Heartland School Solutions (a) | 60,870 | 57,570 | 3,300 | 5.7 | % | ||||||||||
Heartland Payroll Solutions | 69,037 | 50,394 | 18,643 | 37.0 | % | ||||||||||
Other | 63,403 | 30,392 | 33,011 | 108.6 | % | ||||||||||
Total revenue | $ | 2,682,396 | $ | 2,311,381 | $ | 371,015 | 16.1 | % | |||||||
Year Ended December 31, | Change from Prior Year | ||||||||||||||
Total net revenue: | 2015 | 2014 | Amount | % | |||||||||||
Payment Processing | $ | 518,313 | $ | 472,731 | $ | 45,582 | 9.6 | % | |||||||
Campus Solutions | 111,335 | 61,538 | 49,797 | 80.9 | % | ||||||||||
Heartland School Solutions (a) | 60,870 | 57,570 | 3,300 | 5.7 | % | ||||||||||
Heartland Payroll Solutions | 69,037 | 50,394 | 18,643 | 37.0 | % | ||||||||||
Other | 63,403 | 30,392 | 33,011 | 108.6 | % | ||||||||||
Total net revenue | $ | 822,958 | $ | 672,625 | $ | 150,333 | 22.4 | % | |||||||
(a) See below for discussion of Out-of-Period Adjustments.
45
Payment Processing
Payment Processing net revenue increased $45.6 million, or 9.6%, from $472.7 million in 2014 to $518.3 million in 2015. This increase was driven by a $43.1 million or 10.3% increase in SME net revenue, reflecting a 14.8% increase in SME processing volume from $81.1 billion in 2014 to $93.1 billion in 2015. This increase reflects same store sales growth and the addition of SME merchants whose processing volume and net revenue exceeded that of merchants who attrited in the same period. This increase in processing volume also reflects the conversion of new and existing merchants to OptBlue. We converted a majority of our existing merchants processing under the former sales and servicing agreement with American Express to OptBlue during the third quarter of 2014. In 2015, our OptBlue processing volume was $6.5 billion as compared to $2.6 billion in 2014. Our reported SME processing volume includes processing volumes for merchants in our Heartland School Solutions, Campus Solutions, and Other businesses. Net revenue related to that processing volume is included in the net revenue reported for those businesses.
Campus Solutions
Campus Solutions net revenue increased 80.9% from $61.5 million in 2014 to $111.3 million in 2015. The increase in Campus Solutions net revenue included $44.1 million of net revenue from acquisitions, primarily from TouchNet. The remaining increase in Campus Solutions net revenue was due primarily to higher student loan servicing related revenue.
Heartland School Solutions
Heartland School Solutions net revenue increased 5.7% from $57.6 million in 2014 to $60.9 million in 2015. The increase in Heartland School Solutions net revenue is due primarily to an increase in transaction processing revenue reflecting growth in the number of parents who are adopting our electronic payment options. Also, in the second quarter of 2014, we recorded out-of-period adjustments decreasing our revenue and increasing bad debt expense (included in Processing and Servicing in our Consolidated Statements of Income) by $1.4 million and $0.9 million, respectively. These adjustments related to immaterial errors that originated in the prior year. These adjustments included revenue which was incorrectly recorded in prior periods and a reassessment of the collectability of certain customer accounts receivable. Partially offsetting the increases in net revenue was a decrease of $3.8 million in pass-through installation services net revenue for the year ended December 31, 2015 associated with a large school district customer in 2014 that did not repeat in 2015.
Heartland Payroll Solutions
Heartland Payroll Solutions net revenue increased 37.0% from $50.4 million in 2014 to $69.0 million in 2015. The increase in payroll processing net revenue included $10.6 million of net revenue added by the acquisition of Payroll 1. The remaining organic increase of $8.0 million is primarily due to a 6.2% increase in payroll processing customers (excluding 6,573 customers added by Payroll 1) from 25,764 at December 31, 2014 to 33,937 at December 31, 2015, as well as an overall increase in payroll processing revenue per customer.
Other
Other net revenue increased $33.0 million, or 108.6%, from $30.4 million in 2014 to $63.4 million in 2015. The increase in other revenue included $26.4 million of net revenue added by Xpient, pcAmerica, Dinerware, and Digital Dining (which are all included in Heartland Commerce). The remaining increase reflects organic growth in software sales at Heartland Commerce.
Total expenses. Total expenses increased 14.7% from $590.5 million in 2014 to $677.4 million in 2015, due to the increases in all major expense categories, reflecting acquisition related and organic growth and are further discussed below. Total expenses represented 82.3% of total net revenue in 2015, compared to 87.8% in 2014.
Processing and servicing expense in 2015 increased by $43.6 million, or 15.3%, compared to 2014. The increase in processing and servicing expenses includes a $22.0 million increase from our 2014 and 2015 acquisitions. The remaining increase is attributable to increased costs associated with processing and servicing higher SME bankcard processing volume, increased sales and incentive compensation, increased card equipment costs and increased cost of sales and servicing related to higher Heartland Payroll Solutions and Campus Solutions net revenue. Partially offsetting these increases was a decrease in merchant losses. Merchant losses for the year ended December 31, 2014 included $4.6 million of chargebacks from a single merchant who entered bankruptcy in the fourth quarter of 2014. As a percentage of net revenue, processing and servicing expense decreased to 39.9% in 2015, compared with 42.4% in 2014.
Customer acquisition costs in 2015 increased by $12.5 million, or 26.6% compared with 2014. As reflected in the table below, this increase reflects higher amortization on increased capitalized deferred acquisition costs resulting from
46
improved levels of new installed margin and the impact of subsequent changes in the estimated accrued buyout liability due to lower merchant attrition and same-store sales growth. As a percentage of total net revenue, customer acquisition costs were 7.2% and 7.0% for the years ended December 31, 2015 and 2014, respectively.
Customer acquisition costs for the years ended December 31, 2015 and 2014 included the following components (in thousands of dollars):
Year Ended December 31, | Change from Prior Year | |||||||||||||
2015 | 2014 | Amount | % | |||||||||||
Amortization of signing bonuses, net (a) | $ | 35,653 | $ | 30,345 | $ | 5,308 | 17.5 | % | ||||||
Amortization of capitalized customer deferred acquisition costs | 25,310 | 21,281 | 4,029 | 18.9 | % | |||||||||
Increase in accrued buyout liability | 27,264 | 20,182 | 7,082 | 35.1 | % | |||||||||
Capitalized customer deferred acquisition costs | (28,562 | ) | (24,831 | ) | (3,731 | ) | (15.0 | )% | ||||||
Total customer acquisition costs | $ | 59,665 | $ | 46,977 | $ | 12,688 | 27.0 | % | ||||||
(a) Includes the write off of signing bonuses related to the December 31, 2015 sale of assets of SmartLink included in "Gain on sale of assets" on the Consolidated Statements of Income.
Depreciation and amortization expense included in the consolidated income statement for the years ended December 31, 2015 and 2014, by financial statement line item is as follows (in thousands of dollars):
Year Ended December 31, | Change from Prior Year | |||||||||||||
2015 | 2014 | Amount | % | |||||||||||
Processing and servicing | ||||||||||||||
Amortization – capitalized system development | $ | 13,800 | $ | 14,780 | $ | (980 | ) | (6.6 | )% | |||||
Other | 3,838 | 2,892 | 946 | 32.7 | % | |||||||||
Total processing and servicing | 17,638 | 17,672 | (34 | ) | (0.2 | )% | ||||||||
Depreciation and amortization | ||||||||||||||
Acquired intangibles | 20,351 | 13,580 | 6,771 | 49.9 | % | |||||||||
Amortization – capitalized system development | 17,007 | 10,781 | 6,226 | 57.7 | % | |||||||||
Other | 7,959 | 6,237 | 1,722 | 27.6 | % | |||||||||
Total depreciation and amortization | 45,317 | 30,598 | 14,719 | 48.1 | % | |||||||||
Total depreciation and amortization | $ | 62,955 | $ | 48,270 | $ | 14,685 | 87.8 | % | ||||||
Total depreciation and amortization expenses increased $14.7 million, or 87.8%, from $48.3 million in 2014 to $63.0 million in 2015. The increase in total depreciation and amortization expenses in 2015 includes increases in acquired intangibles amortization of $6.8 million due to our 2014 and 2015 acquisitions. See “— Liquidity and Capital Resources — Acquisitions” for further information on these acquisitions. The increase in total depreciation and amortization expense is also due to a $5.2 million increase in capitalized system development amortization in 2015.
Most of our investments in information technology have supported the continuing development of our product, servicing and sales-related initiatives. Additionally, we capitalized outsourced programming costs as well as salaries, fringe benefits and other expenses incurred by our employees who worked on internally developed software projects. Amortization does not begin on the internally developed software until the project is complete and placed in service, at which time we begin to amortize the asset over expected lives of three to seven years. The amount capitalized decreased from $40.3 million in 2014 to $36.9 million in 2015. The total amount of capitalized costs for projects placed in service in 2015 and 2014 was $39.7 million and $36.5 million, respectively.
General and administrative expenses increased $53.5 million, or 28.1%, from $190.6 million in 2014 to $244.0 million in 2015. The increase in general and administrative expenses includes $33.4 million from our 2014 and 2015 acquisitions. The remaining increase reflects higher personnel expense including incentive and share-based compensation increases, higher acquisition related expenses and increased expense across various general and administrative expense categories supporting our organic growth. General and administrative expenses as a percentage of net revenue in 2015 was 29.6%, an increase from 28.3% in 2014.
In 2014, we recorded pre-tax asset impairment charges related to our investment in Leaf and other POS assets of $37.4 million, including $18.5 million for goodwill impairment. Management considered the overlapping cloud-based POS systems in development at Heartland Commerce businesses and decided that it would stop POS development efforts at Leaf
47
Acquisition, LLC (“Leaf”), a previous Heartland Commerce business. This decision caused a significant adverse change in the extent or manner in which the long-lived asset group of Leaf would be used, including Prosper, an internally developed POS software technology. Due to these changes in circumstances, the implied fair value of the Leaf reporting unit was determined to be significantly below its carrying value. This led to a Goodwill Impairment charge for the full balance of Leaf Goodwill as of December 31, 2014.
Income from operations. Our income from operations, which we also refer to as operating income, increased to $145.5 million for 2015, from $82.1 million for 2014, as a result of an increase in net revenue and a decrease in goodwill and asset impairment charges. This increase is partially offset by increases in processing and servicing expenses, customer acquisition costs, depreciation and amortization and general and administrative expenses. Our operating margin, which we measure as operating income divided by net revenue, was 17.7% for 2015, compared to 12.2% for 2014. Excluding the impact of the goodwill and asset impairment charges during the fourth quarter of 2014, our operating income would have been $119.5 million or 17.8% for 2014.
Interest expense. Interest expense for 2015 and 2014 was $14.2 million and $8.1 million, respectively. Interest expense in both periods includes interest incurred under our credit facilities and interest we recorded on payables to our sponsor banks. The increase in interest expense reflects higher borrowings under our 2014 Revolving Credit Facility (as defined in —Liquidity and Capital Resources—Credit Facilities herein) as well as interest expense on $375 million under our 2014 Term Credit Facility (as defined in —Liquidity and Capital Resources—Credit Facilities herein) that was used to fund the TouchNet Acquisition. See “— Liquidity and Capital Resources — Credit Facilities” for more detail on our borrowings.
Other income (expense), net. Other, net for 2015 includes the following:
•Pre-tax gain of $7.0 million relating to the December 31, 2015 sale of the assets of the SmartLink division (“SmartLink”), which included our secure payment gateways and managed network services technologies, to a third party, for a $10 million cash payment. We also entered into a channel partner agreement, whereby Heartland’s sales professionals will continue to promote the secure payment gateway and managed network services solutions to merchants. Our SmartLink division was included in the Payment Processing Segment. The sale of SmartLink resulted in a $7.0 million pre-tax gain ($4.3 million after-tax, or $0.11 per share) which was included in “Gain on sale of assets” as part of Other income (expense) in our Consolidated Statements of Income for the year ended December 31, 2015.
Other income (expense), net. Other, net for 2014 includes the following:
•Pre and after-tax gain of $3.6 million relating to a release from a contingent earn-out liability to the noncontrolling shareholders of Leaf. As a result of the Stock Purchase Agreement we entered into on August 6, 2014 with the noncontrolling shareholders of Leaf, we were released from a contingent earn-out liability to those noncontrolling shareholders. The non-cash impact of the gain associated with the release of the contingent earn-out liability is recorded in "Other, net" in the Consolidated Statements of Income and "Write-off of fixed assets and other" in the Consolidated Statement of Cash Flows.
•Pre-tax charge of $4.0 million relating to an other than temporary impairment ("OTTI") of an investment in the stock of TabbedOut. During the fourth quarter of 2014, we reviewed our investment in the stock of TabbedOut and estimated that the fair value of its investment in Tabbedout was substantially impaired, and therefore, an impairment charge was recorded as of December 31, 2014.
Income taxes. We recorded an income tax provision of $53.3 million for the year ended December 31, 2015 which resulted in an effective income tax rate for the year ended December 31, 2015 of 38.6% compared to an income tax provision of $41.9 million and an effective tax rate of 56.8% for the year ended December 31, 2014.
The effective income tax rate for the year ended December 31, 2014 was negatively impacted by an increase in the valuation allowance against deferred tax assets and the impact of a non-deductible goodwill impairment charge. The increase in the valuation allowance in 2014 resulted from Leaf's operating losses during the 66.67% ownership period from January 1 to August 5, 2014 and from the write down of our investment in TabbedOut. On August 6, 2014, we acquired 100% of the common stock shares of Leaf. As a result, we are able to utilize the losses generated from Leaf against consolidated taxable income for the period beginning on and after August 6, 2014. See “- Liquidity and Capital Resources - Acquisitions" for a description of the transaction involving Leaf’s ownership interests. Partially offsetting the higher effective tax rate in 2014 was a benefit from recognition of research and development credits. On December 19, 2014, the Tax Increase Prevention Act of
48
2014 was enacted which included an extension of the federal research and development credit retroactively for one year. On December 18, 2015, the Protecting Americans from Tax Hikes Act ("PATH") was enacted which made the federal research and development credit permanent. However, no benefit was recognized in 2015 for the federal research and development credit as we did not meet the threshold of qualifying expenses.
Net income attributable to Heartland. As a result of the above factors, we recorded net income of $84.7 million for 2015. This compares to a net income of $33.9 million for 2014.
Year Ended December 31, 2014 Compared to Year Ended December 31, 2013
The following table shows certain income statement data as a percentage of net revenue for the periods indicated | ||||||||||||||||||||
(in thousands of dollars): | ||||||||||||||||||||
% of Net Revenue | % of Net Revenue | Change | ||||||||||||||||||
2014 | 2013 | Amount | % | |||||||||||||||||
Net revenue: | ||||||||||||||||||||
Total revenue | $ | 2,311,381 | $ | 2,135,372 | $ | 176,009 | 8.2 | % | ||||||||||||
Less: Interchange | 1,422,894 | 1,335,487 | 87,407 | 6.5 | % | |||||||||||||||
Less: Dues, assessments and fees | 215,862 | 200,903 | 14,959 | 7.4 | % | |||||||||||||||
Total net revenue | 672,625 | 100.0 | % | 598,982 | 100.0 | % | 73,643 | 12.3 | % | |||||||||||
Expenses: | ||||||||||||||||||||
Processing and servicing | 285,011 | 42.4 | % | 237,232 | 39.6 | % | 47,779 | 20.1 | % | |||||||||||
Customer acquisition costs | 46,977 | 7.0 | % | 42,109 | 7.0 | % | 4,868 | 11.6 | % | |||||||||||
Depreciation and amortization | 30,598 | 4.5 | % | 19,975 | 3.3 | % | 10,623 | 53.2 | % | |||||||||||
General and administrative | 190,554 | 28.3 | % | 173,568 | 29.0 | % | 16,986 | 9.8 | % | |||||||||||
Goodwill impairment charge | 18,490 | 2.7 | % | — | — | % | 18,490 | 100.0 | % | |||||||||||
Asset impairment charge | 18,875 | 2.8 | % | — | — | % | 18,875 | 100.0 | % | |||||||||||
Total expenses | 590,505 | 87.8 | % | 472,884 | 78.9 | % | 117,621 | 24.9 | % | |||||||||||
Income from operations | 82,120 | 12.2 | % | 126,098 | 21.1 | % | (43,978 | ) | (34.9 | )% | ||||||||||
Other income (expense): | ||||||||||||||||||||
Interest income | 125 | — | % | 124 | — | % | 1 | 0.8 | % | |||||||||||
Interest expense | (8,057 | ) | (1.2 | )% | (5,429 | ) | (0.9 | )% | (2,628 | ) | (48.4 | )% | ||||||||
Other, net | (444 | ) | (0.1 | )% | (241 | ) | — | % | (203 | ) | (84.2 | )% | ||||||||
Total other expense | (8,376 | ) | (1.2 | )% | (5,546 | ) | (0.9 | )% | (2,830 | ) | (51.0 | )% | ||||||||
Income from continuing operations before income taxes | 73,744 | 11.0 | % | 120,552 | 20.1 | % | (46,808 | ) | (38.8 | )% | ||||||||||
Provision for income taxes | 41,876 | 6.2 | % | 46,450 | 7.8 | % | (4,574 | ) | (9.8 | )% | ||||||||||
Net income (loss) from continuing operations | 31,868 | 4.7 | % | 74,102 | 12.4 | % | (42,234 | ) | (57.0 | )% | ||||||||||
Income from discontinued operations, net of income tax | — | — | % | 3,970 | 0.7 | % | (3,970 | ) | (100.0 | )% | ||||||||||
Net income | 31,868 | 4.7 | % | 78,072 | 13.0 | % | (46,204 | ) | (59.2 | )% | ||||||||||
Less: Net income attributable to noncontrolling interests | ||||||||||||||||||||
Continuing operations | (2,011 | ) | (0.3 | )% | (610 | ) | (0.1 | )% | (1,401 | ) | (229.7 | )% | ||||||||
Discontinued operations | — | — | % | 56 | — | % | (56 | ) | (100.0 | )% | ||||||||||
Net income attributable to Heartland | $ | 33,879 | 5.0 | % | $ | 78,626 | 13.1 | % | $ | (44,747 | ) | (56.9 | )% | |||||||
Revenue. The following tables summarize total revenue and total net revenue (which we define as total revenue less interchange fees and dues, assessments and fees) by segment for the years ended December 31, 2014 and 2013 (in thousands of dollars):
Year Ended December 31, | Change from Prior Year | |||||||||||||
Total revenue: | 2014 | 2013 | Amount | % | ||||||||||
Payment Processing | $ | 2,111,487 | $ | 1,979,579 | $ | 131,908 | 6.7 | % | ||||||
Campus Solutions | 61,538 | 36,186 | 25,352 | 70.1 | % | |||||||||
Heartland School Solutions (a) | 57,570 | 50,541 | 7,029 | 13.9 | % | |||||||||
Heartland Payroll Solutions | 50,394 | 44,565 | 5,829 | 13.1 | % | |||||||||
Other | 30,392 | 24,501 | 5,891 | 24.0 | % | |||||||||
Total revenue | $ | 2,311,381 | $ | 2,135,372 | $ | 176,009 | 8.2 | % | ||||||
49
Year Ended December 31, | Change from Prior Year | |||||||||||||
Total net revenue: | 2014 | 2013 | Amount | % | ||||||||||
Payment Processing | $ | 472,731 | $ | 443,189 | $ | 29,542 | 6.7 | % | ||||||
Campus Solutions | 61,538 | 36,186 | 25,352 | 70.1 | % | |||||||||
Heartland School Solutions (a) | 57,570 | 50,541 | 7,029 | 13.9 | % | |||||||||
Heartland Payroll Solutions | 50,394 | 44,565 | 5,829 | 13.1 | % | |||||||||
Other | 30,392 | 24,501 | 5,891 | 24.0 | % | |||||||||
Total net revenue | $ | 672,625 | $ | 598,982 | $ | 73,643 | 12.3 | % | ||||||
(a) See below for discussion of Out-of-Period Adjustments.
Payment Processing
Payment Processing net revenue increased $29.5 million, or 6.7%, from $443.2 million in 2013 to $472.7 million in 2014. This increase was driven by a $26.1 million or 6.6% increase in SME net revenue, reflecting a 8.7% increase in SME processing volume from $74.6 billion in 2013 to $81.1 billion in 2014. This increase in processing volume reflects the addition of SME merchants whose processing volume exceeded that of merchants who attrited and the impact of same store sales growth in 2014. The increase in SME processing volume also reflects the conversion of new and existing merchants to OptBlue. We converted a majority of our existing merchants currently processing under the former sales and servicing agreement with American Express to OptBlue during the third and fourth quarter of 2014. Our reported SME processing volume includes processing volumes for merchants in our Heartland School Solutions, Campus Solutions, and Other businesses. However, net revenue related to that processing volume is included in the net revenue reported for those businesses.
Campus Solutions
Campus Solutions net revenue increased 70.1% from $36.2 million in 2013 to $61.5 million in 2014. The increase included $19.9 million of revenue added by TouchNet since its September 4, 2014 acquisition. The remaining increase in Campus Solutions net revenue is due to higher student loan servicing related revenue, as well as growth in transaction processing revenue related to our student tuition payment processing and tuition payment plan products.
Heartland School Solutions
Heartland School Solutions net revenue increased 13.9% from $50.5 million in 2013 to $57.6 million in 2014. The increase in Heartland School Solutions net revenue is due primarily to an increase in transaction processing revenue (partially aided by the April 2014 acquisition of MCS Software) and equipment-related revenues as a result of a sale of equipment and related installation services to a large new school district customer. Partially offsetting the increase in net revenue for Heartland School Solutions is a decrease associated with out-of-period adjustments. In the second quarter of 2014, we recorded out-of-period adjustments decreasing its revenue and increasing bad debt expense (included in Processing and Servicing in our Consolidated Statements of Income) by $1.4 million and $0.9 million, respectively. These adjustments related to immaterial errors that originated in the prior year in our Heartland School Solutions business. These adjustments included revenue which was incorrectly recorded in prior periods and a reassessment of the collectability of certain customer accounts receivable. These out-of-period adjustments reduced earnings before income taxes and net income in 2014 by $2.3 million and $1.4 million, respectively, and reduced diluted earnings per share by $0.04.
Heartland Payroll Solutions
Heartland Payroll Solutions net revenue increased 13.1% from $44.6 million in 2013 to $50.4 million in 2014. The increase in payroll processing net revenue is primarily due to a 7.0% increase in payroll processing customers from 24,088 at December 31, 2013 to 25,764 at December 31, 2014.
Other
Other net revenue increased 24.0% from $24.5 million in 2013 to $30.4 million in 2014, primarily due to growth in Micropayments revenue which reflects higher equipment sales and payment processing for unattended payment locations such as laundry facilities, kiosks and vending machines. The increase also included $1.4 million of revenue added by Xpient since its October 31, 2014 acquisition.
Total expenses. Total expenses increased 24.9% from $472.9 million in 2013 to $590.5 million in 2014, due to the increases in processing and servicing, depreciation and amortization, customer acquisition costs, general and administrative expenses and asset impairment charges related to our investment in Leaf and other POS assets . These increases are further discussed below and resulted in total expenses representing 87.8% of total net revenue in 2014, compared to 78.9% in 2013.
50
Processing and servicing expense for the year ended December 31, 2014 increased by $47.8 million, or 20.1%, compared with the year ended December 31, 2013. The increase in processing and servicing expense reflects the acquisitions of MCS Software, TouchNet and Xpient, as well as, increased costs associated with processing and servicing higher SME bankcard processing volume, increased sales compensation, higher merchant losses as a result of chargebacks from a single merchant who entered bankruptcy in the fourth quarter and increased cost of sales and servicing related to higher Heartland School Solutions, Heartland Payroll Solutions, Campus Solutions, and Other revenues (primarily our Micropayments business). The increase in processing and servicing expenses also reflects approximately $6.5 million of expenses which were classified as general and administrative expense in the prior year. This reclassification brings operating expenses in our legacy payroll business and Ovation business into alignment. As a percentage of total net revenue, processing and servicing expense increased to 42.4% for the year ended December 31, 2014 compared with 39.6% for the year ended December 31, 2013.
Customer acquisition costs for the year ended December 31, 2014 increased by $4.9 million, or 11.6% compared with the year ended December 31, 2013. As reflected in the table below, this increase reflects higher amortization on increased capitalized deferred acquisition costs resulting from improved levels of new installed margin and the impact of subsequent changes in the estimated accrued buyout liability due to lower merchant attrition and same-store sales growth. As a percentage of total net revenue, customer acquisition costs remained consistent at 7.0% for the year ended December 31, 2014 and 2013.
Customer acquisition costs for the years ended December 31, 2014 and 2013 included the following components (in thousands of dollars):
Year Ended December 31, | |||||||
2014 | 2013 | ||||||
Amortization of signing bonuses, net | $ | 30,345 | $ | 27,767 | |||
Amortization of capitalized customer deferred acquisition costs | 21,281 | 17,881 | |||||
Increase in accrued buyout liability | 20,182 | 17,620 | |||||
Capitalized customer deferred acquisition costs | (24,831 | ) | (21,159 | ) | |||
Total customer acquisition costs | $ | 46,977 | $ | 42,109 | |||
Depreciation and amortization expenses increased 53.2% from $20.0 million in 2013 to $30.6 million in 2014. The increase in depreciation and amortization expenses include increases in acquisition related amortization of intangible assets in 2014 compared to 2013. As a percentage of total net revenue, depreciation and amortization expenses increased to 4.5% for the year ended December 31, 2014 compared with 3.3% for the year ended December 31, 2013. See “— Liquidity and Capital Resources — Acquisitions” for further information on these acquisitions.
Most of our investments in information technology have supported the continuing development of HPS Exchange, Passport and other processing-related initiatives. Depreciation and amortization expense recorded on these investments is included in processing and servicing expense. Additionally, we capitalized salaries, fringe benefits and other expenses incurred by our employees that worked on internally developed software projects and outsourced programming. Amortization does not begin on the internally developed software until the project is complete and placed in service, at which time we begin to amortize the asset over expected lives of three to five years. The amount capitalized increased from $38.4 million in 2013 to $40.3 million in 2014. The total amount of capitalized costs for projects placed in service in 2014 and 2013 was $36.5 million and $25.7 million, respectively.
General and administrative expenses increased $17.0 million, or 9.8%, from $173.6 million in 2013 to $190.6 million in 2014. General and administrative expenses increased primarily due to a $15.2 million increase in personnel costs and an increase of $2.7 million in occupancy costs. The increase in personnel and occupancy costs primarily reflects the acquisitions of Leaf in September 2013, MCS Software in April 2014, TouchNet in September 2014 and Xpient in October 2014, as well as other headcount increases. The remaining increase in general and administrative expenses resulted from our acquisitions, including $3.7 million of acquisition-related expenses. Partially offsetting these increases was a decrease due to the reclassification of $6.5 million of payroll related expenses from general and administrative to processing and servicing expense for our payroll business as well as lower equipment lease and information technology related expenses. General and administrative expenses as a percentage of total net revenue for 2014 was 28.3%, a slight decrease from 29.0% for 2013.
We recorded pre-tax asset impairment charges related to our investment in Leaf and other POS assets of $37.4 million, including $18.5 million for goodwill impairment. Management considered the overlapping cloud-based POS systems in development at Heartland Commerce businesses and decided that it would stop POS development efforts at Leaf Acquisition, LLC (“Leaf”), a previous Heartland Commerce business. This decision caused a significant adverse change in the extent or
51
manner in which the long-lived asset group of Leaf would be used, including Prosper, an internally developed POS software technology. Due to these changes in circumstances, the implied fair value of the Leaf reporting unit was determined to be significantly below its carrying value. This led to a Goodwill Impairment charge for the full balance of Leaf Goodwill as of December 31, 2014.
Income from operations. Our income from operations, which we also refer to as operating income, decreased to $82.1 million for 2014, from $126.1 million for 2013, as a result of increases in processing and servicing expenses, depreciation and amortization, general and administrative expenses, and goodwill and asset impairments, partially offset by an increase in net revenue. Our operating margin, which we measure as operating income divided by net revenue, was 12.2% for 2014, compared to 21.1% for 2013. Excluding the impact of the goodwill and asset impairment charges during the fourth quarter, our operating income would have been $119.7 million or 17.8% for 2014.
Interest expense. Interest expense for 2014 and 2013 was $8.1 million and $5.4 million, respectively. Interest expense in both periods includes interest incurred under our credit facilities and interest we recorded on payables to our sponsor banks. The increase in interest expense reflects higher borrowings under our 2014 Revolving Credit Facility (as defined in —Liquidity and Capital Resources—Credit Facilities herein) as well as interest expense on $375 million under our 2014 Term Credit Facility (as defined in —Liquidity and Capital Resources—Credit Facilities herein) that was used to fund the TouchNet Acquisition. See “— Liquidity and Capital Resources — Credit Facilities” for more detail on our borrowings.
Other income (expense), net. Other, net for 2014 includes the following:
•Pre and after-tax gain of $3.6 million relating to a release from a contingent earn-out liability to the noncontrolling shareholders of Leaf. As a result of the Stock Purchase Agreement we entered into on August 6, 2014 with the noncontrolling shareholders of Leaf, we were released from a contingent earn-out liability to those noncontrolling shareholders. The non-cash impact of the gain associated with the release of the contingent earn-out liability is recorded in "Other, net" in the Consolidated Statements of Income and "Write-off of fixed assets and other" in the Consolidated Statement of Cash Flows.
•Pre-tax charge of $4.0 million relating to an other than temporary impairment ("OTTI") of an investment in the stock of TabbedOut. See "— 2014 Financial Highlights," for information on this OTTI.
Income taxes. Income tax expense for 2014 was $41.9 million, reflecting an effective tax rate of 56.8%. This compares to income tax expense of $46.5 million for 2013, an effective tax rate of 38.5%. The effective income tax rate for the year ended December 31, 2014 was unfavorably impacted by an increase in the valuation allowance against deferred tax assets and the impact of a non-deductible goodwill impairment charge. Our effective tax rate without these two charges would have been 39.2%. The increase in the valuation allowance resulted from Leaf's operating losses during the 66.67% ownership period from January 1 to August 5, 2014 and from the write down of our investment in TabbedOut. On August 6, 2014, we acquired 100% of the common stock shares of Leaf. As a result, we will be able to utilize the losses generated from Leaf against consolidated taxable income for the period beginning on and after August 6, 2014. See “— Liquidity and Capital Resources — Acquisitions" for a description of the transaction involving Leaf’s ownership interests. The effective tax rate for 2014 and 2013 benefited from recognition of research and development credits. On December 19, 2014, the Tax Increase Prevention Act of 2014 was enacted which included an extension of the federal research and development credit retroactively for one year and is reflected in 2014. On January 2, 2013, the American Taxpayer Relief Act of 2012 ("ATR Act") was enacted which included an extension of the federal research and development credit retroactively to 2012 and prospectively through 2013. We recognized the effects of the research and development credits in 2013 in conjunction with filing our 2012 tax return. The favorable impact of the research and development credits on the effective tax rate for 2013 was partially offset by a valuation allowance recorded against the deferred tax assets arising from Leaf’s operating losses and an increase in the state tax rates.
Net income attributable to Heartland. As a result of the above factors, we recorded net income of $33.9 million for 2014. This compares to a net income of $78.6 million for 2013.
52
Balance Sheet Information | ||||||||
December 31, 2015 | December 31, 2014 | |||||||
(In thousands) | ||||||||
Selected Balance Sheet Data | ||||||||
Cash and cash equivalents | $ | 56,483 | $ | 70,793 | ||||
Funds held for customers | 228,234 | 176,492 | ||||||
Receivables, net | 267,292 | 234,104 | ||||||
Property and equipment, net | 166,692 | 154,303 | ||||||
Goodwill | 490,020 | 425,712 | ||||||
Intangible assets, net | 197,223 | 192,553 | ||||||
Total assets | 1,536,679 | 1,378,465 | ||||||
Due to sponsor banks | 31,803 | 31,165 | ||||||
Customer fund deposits | 228,234 | 176,492 | ||||||
Processing liabilities | 152,188 | 119,398 | ||||||
Borrowings: | ||||||||
Current portion | 43,793 | 36,792 | ||||||
Long-term portion | 437,842 | 523,122 | ||||||
Unearned revenue: | ||||||||
Current portion | 57,346 | 46,601 | ||||||
Long term portion | 3,237 | 2,354 | ||||||
Total liabilities | 1,200,857 | 1,127,705 | ||||||
Total equity | 335,822 | 250,760 | ||||||
December 31, 2015 Compared to December 31, 2014
Total assets increased $158.2 million, or 11.5%, to $1,536.7 million at December 31, 2015 from $1,378.5 million at December 31, 2014. The increases at December 31, 2015 include $33.2 million in receivables, $51.7 million in funds held for customers (which is offset by an equal increase in customer fund deposits), $64.3 million in goodwill and $4.7 million in intangible assets. The increase in goodwill is primarily due to the acquisitions of pcAmerica, Dinerware, Payroll 1 and Digital Dining. These increases were partially offset by a decrease in cash of $14.3 million to partially fund these acquisitions. See “— Liquidity and Capital Resources” for further details on these acquisitions.
Our receivables, which increased $33.2 million or 14.2% from December 31, 2014, are primarily due from our card payment processing merchants and result in large part from our practice of advancing interchange fees to most of our SME merchants during the month and collecting those fees from our merchants at the beginning of the following month, as well as from transaction fees we charge merchants for processing transactions. Total receivables also include amounts due from Discover and American Express bankcard networks for merchant sales transactions. Receivables from the networks are recovered the following business day from the date of processing the transaction. Amounts due from SME bankcard processing merchants and bankcard networks at December 31, 2015 increased $29.6 million from December 31, 2014.
The amount due to sponsor banks primarily for funding merchant advances was $30.5 million and $29.9 million at December 31, 2015 and 2014, respectively. The liability to sponsor banks is repaid at the beginning of the following month out of the fees we collect from our merchants.
Total borrowings under our credit facility decreased $78.3 million, or 14.0%, to $481.6 million at December 31, 2015 from $559.9 million at December 31, 2014 reflecting our use of cash flow to reduce borrowings. See “—Liquidity and Capital Resources” for discussion of Credit Facilities.
Total equity increased $85.1 million from December 31, 2014 primarily due to net income of $84.7 million. Other increases in total stockholders’ equity at December 31, 2015 include proceeds received from the exercise of stock options, tax benefits related to those stock option exercises and share-based compensation. Partially offsetting the increases in stockholders' equity were payments of cash dividends of $14.7 million and restricted stock units vested of $18.9 million during 2015.
Liquidity and Capital Resources
General. Liquidity and capital resource management is a process focused on providing the funding we need to meet our short and long-term cash and working capital needs. We have used our funding sources to build our merchant portfolio, our technology platforms, our service center, and to make acquisitions with the expectation that these investments will generate cash flows sufficient to cover our working capital needs and other anticipated needs for capital.
53
Our cash requirements include funding payments to salespersons for signing bonuses, residual commissions and residual buyouts, paying interest expense and other operating expenses, including taxes, investing in our technology infrastructure, and making acquisitions of businesses or assets. We expect that our future cash requirements will continue to include amounts used to repurchase our common stock and pay dividends, both as authorized by our Board of Directors.
Other than borrowings we use to fund certain acquisitions and share repurchases, we fund our cash needs primarily with cash flow from our operating activities and through our agreements with our sponsor banks to fund SME merchant advances. We believe that our current cash and investment balances, cash generated from operations and our agreements with our sponsor banks to fund SME merchant advances will provide sufficient liquidity to meet our anticipated needs for operating capital for at least the next twelve months.
Working Capital. Our working capital, defined as current assets less current liabilities, was negative by $68.4 million at December 31, 2015 and positive by $5.8 million at December 31, 2014. The decrease in working capital is primarily due to the acquisitions of pcAmerica and Dinerware, which were partially funded by operating cash, and our use of operating cash to pay down borrowings under our 2014 Revolving Credit Facility which are generally classified as non-current liabilities.
At December 31, 2015 we had cash on our Consolidated Balance Sheet totaling $56.5 million compared to cash of $70.8 million at December 31, 2014. Our cash balance included processing-related cash in transit and collateral of $15.1 million and $17.8 million at December 31, 2015 and 2014, respectively.
On December 31, 2015, we had $269.7 million available under our Revolving Credit Facility. See “— Credit Facilities” for more details.
Acquisitions
Campus Solutions
On September 4, 2014, we completed the acquisition of TouchNet, an integrated commerce solutions provider to higher-education institutions for a cash payment of $375 million, less a net working capital deficit, for all outstanding common shares. The purchase was funded primarily with the proceeds from a five year, $375 million secured term loan. See “— Credit Facilities,” for further discussion. TouchNet added over 600 higher education clients serving over 6 million students, nearly one-third of the higher education enrollment in the United States, to our Campus Solutions business.
Heartland School Solutions
On April 1, 2014, we purchased the net assets of MCS Software for a $17.3 million cash payment. The purchase price was financed under our 2013 Credit Facility and from operating cash flows. The acquisition further expanded our market-leading position in the K-12 school nutrition and POS technology industry in our Heartland School Solutions business.
Heartland Payroll Solutions
On February 27, 2015, we purchased the stock of Payroll 1 for a $30.0 million cash payment, plus net working capital. The purchase price was financed under our 2014 Revolving Credit Facility. The acquisition of Payroll 1 expanded our existing payroll processing business and customer base by adding 6,573 customers.
Heartland Commerce
On October 30, 2015, we acquired the stock of Digital Dining for a cash payment of $18.7 million. The purchase price was financed under our 2014 Revolving Credit Facility and from operating cash flows. Digital Dining is a national provider of restaurant POS and management systems. Digital Dining offers restaurants the convenience of a handheld POS on an iPhone, iPod and iPad in a hybrid environment with conventional fixed terminals, and is also used by restaurateurs for table management, delivery, reservations, labor scheduling, inventory and loyalty programs.
On February 11, 2015, we acquired the stock of Dinerware for a cash payment of $15.0 million. The purchase was funded from a combination of operating cash and financing under the 2014 Revolving Credit Facility. Dinerware provides restaurant POS software solutions to the hospitality industry. Dinerware can be found in upscale restaurants, cafes, nightclubs, bar and grills, fast casual restaurants, counter service establishments, quick serve restaurants, hotels, casinos, cafeterias, golf courses, and wineries.
On January 30, 2015,we acquired the net assets of pcAmerica for a cash payment of $15.0 million. The purchase was funded from a combination of operating cash and financing under the 2014 Revolving Credit Facility. PcAmerica delivers POS
54
systems to streamline daily operations, including customer transactions, inventory tracking, employee labor, and marketing reports to meet the evolving needs of retail stores or restaurants.
On October 31, 2014, we acquired the net assets of Xpient Solutions, LLC (“Xpient”) for a cash payment of $30.0 million, plus net working capital. The purchase price was funded from a combination of operating cash and financing under the 2014 Revolving Credit Facility. Xpient provides POS software solutions to customers primarily in the food service industry.
On February 15, 2014, we purchased the assets of Merchant Software Corporation (referred to as "Liquor POS") for a $3.3 million cash payment. The purchase price was financed from operating cash flows. Liquor POS is a leading provider of POS systems to the liquor retail vertical serving over 3,400 merchants.
On September 11, 2013, we purchased 66.67% of Leaf's outstanding capital stock for a $14.5 million cash payment.
The purchase price was financed from operating cash flows. On August 6, 2014, we entered into a Stock Purchase Agreement with the noncontrolling shareholders of Leaf under which we acquired all shares of Leaf common stock held by the noncontrolling shareholders. As a result of this transaction, Leaf became our wholly-owned subsidiary.
Divestitures
Payment Processing
On December 31, 2015 we sold the assets of our SmartLink division (“SmartLink”), which included our secure payment gateways and managed network services technologies, to a third party, for a $10 million cash payment. We also entered into a channel partner agreement, whereby our sales professionals will continue to promote the secure payment gateway and managed network services solutions to merchants. The SmartLink division was included in the Payment Processing Segment. The sale of SmartLink resulted in a $7.0 million pre-tax gain ($4.3 million after-tax, or $0.11 per share) which was included in, “Gain on sale of assets”, as part of Other income (expense) in our Consolidated Statements of Income for the year ended December 31, 2015.
In the fourth quarter of 2012, we, along with the 30% noncontrolling shareholders of CPOS, entered into an agreement to sell CPOS to a third party. CPOS, which operates as a provider of payment processing services in Canada, was not a significant subsidiary and we had no continuing involvement in its operations. After receiving regulatory approval, the buyer settled this sale on January 31, 2013. The total sales price was $30.3 million cash including net working capital, of which we received $20.9 million for our 70% ownership position.
Cash Flow Provided By Operating Activities. We reported net cash provided by operating activities of $189.8 million in 2015, compared to $93.0 million in 2014 and $112.1 million in 2013.
Cash provided by operating activities in 2015, 2014, and 2013 reflects the benefit from net income as adjusted for non-cash operating items including increases in amortization of capitalized customer acquisition costs, depreciation and amortization and share-based compensation. Additionally, the net cash provided for 2015 reflects timing of collecting unearned revenue, net processing activities, and income tax payments. Net cash provided by operating activities in 2015 was reduced by higher payments for signing bonuses, increases in receivables, and higher payouts of accrued buyout liability.
Cash provided by operating activities for 2014 was also adjusted for the non-cash asset impairment charges. See "— Overview" for further detail. Cash provided by operating activities in 2014 was reduced by payments of signing bonuses, increases in receivables, increases in customer acquisition costs, payouts of accrued buyout liability, decreases in processing liabilities, decreases in accounts payable and decreases in accrued expenses and other liabilities. In 2013, cash provided by operating activities reflects uses of cash for an increase in receivables and a decrease in amounts due to sponsor banks, partially offset by an increase in processing liabilities. Cash provided by operating activities in 2013 was reduced by payments for income taxes of $38.8 million.
Major determinants of operating cash flow are net signing bonus payments, which consume operating cash as we install new merchants, and payouts on the accrued buyout liability, which represent the costs of buying out residual commissions owned by our salespersons. See “— Critical Accounting Estimates — Capitalized Customer Acquisition Costs” and “— Critical Accounting Estimates — Accrued Buyout Liability” for more information. We paid net signing bonuses of $48.3 million, $38.9 million, and $29.1 million, respectively, in 2015, 2014 and 2013. In 2015, 2014 and 2013, we reduced our accrued buyout liability by making buyout payments of $15.4 million, $11.6 million, and $13.7 million, respectively.
55
Cash Flow Used In Investing Activities. Net cash used in investing activities was $123.7 million for 2015, $447.2 million for 2014 and $52.0 million for 2013. Cash flows used in investing activities in 2015 reflect the purchases, net of cash acquired, of pcAmerica, Dinerware, Payroll 1 and Digital Dining for $15.0 million, $15.0 million, $30.0 million and $18.7 million, respectively. Partially offsetting cash flow used in investing activities were proceeds from sale of assets of $10.0 million relating to SmartLink (See “— Results of Operations — Year Ended December 31, 2015 Compared to Year Ended December 31, 2014” for further details on this sale. Cash flows used in investing activities in 2014 included the costs of acquiring, for a total of $392.1 million net of cash acquired, Liquor POS, MCS Software, TouchNet, and Xpient. Cash flows from investing activities for 2013 reflect the $19.3 million of net proceeds received from the sale of CPOS. The amount of cash used in investing activities during 2013 included $14.5 million for the investment in Leaf.
We made capital expenditures of $54.3 million, $54.9 million and $52.9 million in 2015, 2014, and 2013, respectively. We continue building our technology infrastructure, primarily for hardware and software needed for the development and expansion of our products and operating platforms. To further develop our technology, we anticipate that these expenditures will continue near current levels in the future.
Cash Flow (Used In) Provided By Financing Activities. Net cash used in financing activities was $80.4 million in 2015, compared to net cash provided by financing activities of $353.1 million in 2014 and used in financing activities of $38.8 million in 2013.
During 2015, we borrowed, net of financing costs, $230.0 million under our credit facilities, compared to $460.4 million in 2014 and $156.4 million in 2013. In 2015, 2014 and 2013 we made payments of $308.3 million, $54.2 million and $161.0 million, respectively, under our credit facilities. See “— Credit Facilities” for more details.
Cash provided by financing activities in 2015, 2014 and 2013 included exercised stock options generating cash proceeds in the aggregate of $2.9 million, $6.1 million and $14.2 million, respectively, and tax benefits of $9.6 million, $7.5 million and $11.6 million, respectively. Cash used in 2014 and 2013 included cash used for common stock repurchases. We used $54.5 million of cash to repurchase 1,347,817 shares of our common stock during 2014 and $49.6 million of cash to repurchase 1,486,783 shares of our common stock during 2013.
Cash dividends paid in 2015 were $14.7 million, compared to $12.3 million and $10.3 million, respectively, in 2014 and 2013. See “— Dividends” for more information on our common stock dividends.
Credit Facilities. On September 4, 2014, we entered into an amended and restated senior secured credit facility (the "2014 Credit Agreement") with Bank of America, N.A., as administrative agent, and certain lenders who are a party to the 2014 Credit Agreement. This 2014 Credit Agreement replaced our senior secured credit facility dated as of October 23, 2013 (the "2013 Credit Agreement”). Credit extended under the 2014 Credit Agreement is guaranteed by our subsidiaries and is secured by substantially all of our assets and the assets of our subsidiaries.
The 2014 Credit Agreement provides for a revolving credit facility in the aggregate amount of up to $400 million (the “2014 Revolving Credit Facility”) and a term loan in an initial principal amount of $375 million (the “2014 Term Credit Facility”). The 2014 Revolving Credit Facility included up to $35 million that may be used for the issuance of letters of credit and up to $35 million that is available for swing line loans. All principal and interest not previously paid on the 2014 Revolving Credit Facility will mature and be due and payable on September 4, 2019. On September 4, 2014, we borrowed $375 million under the 2014 Term Credit Facility to fund the TouchNet Acquisition. The 2014 Term Credit Facility amortizes on a quarterly basis as follows, with the remaining principal balance due on September 4, 2019: (i) 5% of the initial 2014 Term Credit Facility to be payable in each of the first three years, (ii) 7.5% of the initial Term Credit Facility to be payable in the fourth year and (iii) 10% of the initial 2014 Term Credit Facility to be payable in the fifth year. The 2014 Term Credit Facility is also subject to mandatory prepayment from the net cash proceeds of certain asset dispositions, casualty or condemnation events, issuance of indebtedness and extraordinary receipts. Subject to the terms and conditions of the 2014 Credit Agreement, without the consent of the then existing lenders (but subject to the receipt of commitments), the 2014 Revolving Credit Facility may be increased and new incremental term loans may be issued in an aggregate principal amount of up to $150 million for all such increases under the 2014 Revolving Credit Facility and new term loans, subject to certain minimum threshold amounts.
We had $351.6 million and $370.0 million outstanding under our 2014 Term Credit Facility at December 31, 2015 and December 31, 2014, respectively. We had $130.0 million and $189.5 million outstanding under our 2014 Revolving Credit Facility at December 31, 2015 and 2014, respectively.
The 2014 Credit Agreement contains covenants which include: maintenance of certain leverage and fixed charge coverage ratios; limitations on our indebtedness, liens on our properties and assets, investments in, loans to other business units, and our ability to enter into business combinations and asset sales; and certain other financial and non-financial covenants.
56
These covenants also apply to certain of our subsidiaries. We were in compliance with these covenants as of December 31, 2015 and 2014 and expect we will remain in compliance with the covenants of the 2014 Credit Agreement for at least the next twelve months.
Dividends. During 2015, 2014 and 2013, our Board of Directors declared dividends of $0.40, $0.34 and $0.28 per share of common stock, respectively. During 2015, 2014 and 2013, we paid cash dividends of $14.7 million, $12.3 million and $10.3 million, respectively.
On February 2, 2016, our Board of Directors declared a quarterly cash dividend of $0.10 per share of common stock, payable on March 15, 2016 to stockholders of record as of March 1, 2016.
Contractual Obligations. The card brand networks generally allow chargebacks up to four months after the later of the date the transaction is processed or the delivery of the product or service to the cardholder. If the merchant incurring the chargeback is unable to fund the refund to the card issuing bank, we must do so. As the majority of our SME transactions involve the delivery of the product or service at the time of the transaction, a good basis to estimate our exposure to chargebacks is the last four months' bankcard processing volume on our SME portfolio, which was $31.8 billion for the four months ended December 31, 2015 and $27.8 billion for the four months ended December 31, 2014. However, during the four months ended December 31, 2015 and December 31, 2014, we were presented with $18.0 million and $16.0 million, respectively, of chargebacks by issuing banks. In 2015, 2014 and 2013, we experienced merchant losses of $2.9 million, $7.3 million and $3.1 million, respectively, or 0.31 basis points, 0.90 basis points and 0.41 basis points, respectively, on total SME bankcard dollar volumes processed of $93.1 billion, $81.1 billion and $74.6 billion, respectively. In 2014, our losses included $4.6 million resulting from chargebacks from a single merchant who entered bankruptcy in the fourth quarter. These losses are included in processing and servicing expense in our Consolidated Statements of Income.
Payments Due by Period | |||||||||||||||||||
Contractual Obligations | Total | Less than 1 year | 1 to 3 years | 3 to 5 years | More than 5 years | ||||||||||||||
(In thousands) | |||||||||||||||||||
Processing providers (a) | $ | 9,008 | $ | 4,013 | $ | 4,995 | $ | — | $ | — | |||||||||
Telecommunications providers (b) | 6,818 | 3,307 | 3,511 | — | — | ||||||||||||||
Facility and equipment leases | 108,970 | 18,475 | 28,578 | 17,312 | 44,605 | ||||||||||||||
2014 Term Credit Facility | 351,563 | 18,750 | 56,250 | 276,563 | — | ||||||||||||||
2014 Revolving Credit Facility (c) | 130,000 | — | — | 130,000 | — | ||||||||||||||
Capital Lease Obligation | 73 | 43 | 30 | — | — | ||||||||||||||
$ | 606,432 | $ | 44,588 | $ | 93,364 | $ | 423,875 | $ | 44,605 | ||||||||||
(a) | We have agreements with several third-party processors to provide to us on a non-exclusive basis payment processing and transmittal, transaction authorization and data capture services, and access to various reporting tools. Our agreements with third-party processors require us to submit a minimum monthly number of transactions or volume for processing. If we submit a number of transactions or volume that is lower than the minimum, we are required to pay the third-party processors the fees that they would have received if we had submitted the required minimum number or volume of transactions. |
(b) | We have agreements in place with several large telecommunications companies that provide data center services, wide area network connectivity, and voice services that are used by both our call center and card payment processing platforms. These providers require both dollar and term commitments for the services they provide. If we do not meet the minimum terms, then there is a requirement to pay the remaining commitments. |
(c) | The 2014 Revolving Credit Facility is available on a revolving basis until September 4, 2019. While we are not contractually obligated to pay $25.0 million of the outstanding balance of the 2014 Revolving Credit Facility, we include this amount in the Current portion of borrowings on the Consolidated Balance Sheet since we intend to pay this amount in January 2016. |
Unrecognized Tax Benefits. At December 31, 2015, we had gross tax-effected unrecognized tax benefits of approximately $6.6 million. See “— Critical Accounting Estimates — Income Taxes.” As of December 31, 2015, we are unable to make reasonably reliable estimates of the period of cash settlement with the respective taxing authority, hence the unrecognized tax benefits have been excluded from the above commitment and contractual obligations table.
Off-Balance Sheet Arrangements
We have not entered into any transactions with third parties or unconsolidated entities whereby we have financial guarantees, subordinated retained interest, derivative instruments, or other contingent arrangements that expose us to material continuing risks, contingent liabilities, or other obligations other than for chargebacks and reject losses described under “— Critical Accounting Estimates.”
57
Legal and Regulatory Considerations
Processing System Intrusion Legal Proceedings
To date, we have had several lawsuits filed against us and our sponsor banks in connection with the Processing System Intrusion. For information concerning the remaining lawsuit, see "— Item 3. Legal Proceedings."
Other Legal Proceedings
In the ordinary course of our business, we are party to various legal actions, which we believe are incidental to the operation of our business. We believe that the outcome of the proceedings to which we are currently a party will not have a material adverse effect on our financial position, results of operations or cash flows.
ITEM 7A. QUANTITATIVE AND QUALITATIVE DISCLOSURES ABOUT MARKET RISK
Interest Rate Risk. Our primary market risk exposure is to increase in interest rates.
We have interest rate risk related to our amounts payable to our sponsor banks. Within our payable to our sponsor banks are balances which our sponsor banks have advanced to our SME merchants for interchange fees. The amount due to sponsor banks for funding merchant advances was $30.5 million at December 31, 2015. During the year ended December 31, 2015, the average daily interest-bearing balance of that payable was approximately $10.4 million. We incur interest expense on this payable at the prime rate. A hypothetical 100 basis point increase in the interest rate applied to our average payable to sponsor banks would result in a decrease of approximately $104,000 in annual pre-tax income.
We also incur interest rate risk on borrowings under our 2014 Credit Agreement. At December 31, 2015, there was $351.6 million outstanding under the 2014 Term Credit Facility and $130.0 million outstanding under the 2014 Revolving Credit Facility. We incur interest expense on these variable-rate borrowings based on short-term interest rates. The impact that a hypothetical 100 basis point increase in short-term interest rates would have on our outstanding December 31, 2015 balances under the Credit Agreement would be a decline of approximately $4.8 million in annual pre-tax income.
While the bulk of our cash and cash-equivalents, including Funds held for customers, are held in demand accounts or money market funds, we do hold certain fixed-income investments with remaining terms of less than five years. At December 31, 2015, a hypothetical 100 basis point increase in short-term interest rates would result in no material change in annual pre-tax income from investment holdings, but would result in a decrease in the value of fixed-rate investments of approximately $502,000.
ITEM 8. FINANCIAL STATEMENTS AND SUPPLEMENTARY DATA
Index to Consolidated Financial Statements | |||
Heartland Payment Systems, Inc. and Subsidiaries: | Page | ||
58
REPORT OF INDEPENDENT REGISTERED PUBLIC ACCOUNTING FIRM
To the Board of Directors and Stockholders of
Heartland Payment Systems, Inc.
We have audited the accompanying consolidated balance sheets of Heartland Payment Systems, Inc. and subsidiaries (the "Company") as of December 31, 2015 and 2014, and the related consolidated statements of income, comprehensive income, equity, and cash flows for each of the three years in the period ended December 31, 2015. These financial statements are the responsibility of the Company's management. Our responsibility is to express an opinion on the financial statements based on our audits.
We conducted our audits in accordance with the standards of the Public Company Accounting Oversight Board (United States). Those standards require that we plan and perform the audit to obtain reasonable assurance about whether the financial statements are free of material misstatement. An audit includes examining, on a test basis, evidence supporting the amounts and disclosures in the financial statements. An audit also includes assessing the accounting principles used and significant estimates made by management, as well as evaluating the overall financial statement presentation. We believe that our audits provide a reasonable basis for our opinion.
In our opinion, such consolidated financial statements present fairly, in all material respects, the financial position of Heartland Payment Systems, Inc. and subsidiaries as of December 31, 2015 and 2014, and the results of their operations and their cash flows for each of the three years in the period ended December 31, 2015, in conformity with accounting principles generally accepted in the United States of America.
As discussed in Note 2 to the consolidated financial statements, the Company adopted Financial Accounting Standards Board’s Accounting Standards Update 2015-17, Balance Sheet Classification of Deferred Taxes, and retrospectively applied the classification for deferred taxes in the consolidated balance sheet for the year ended December 31, 2014.
We have also audited, in accordance with the standards of the Public Company Accounting Oversight Board (United States), the Company's internal control over financial reporting as of December 31, 2015, based on the criteria established in Internal Control - Integrated Framework (2013) issued by the Committee of Sponsoring Organizations of the Treadway Commission and our report dated February 29, 2016 expressed an unqualified opinion on the Company's internal control over financial reporting.
/s/ Deloitte & Touche LLP
Philadelphia, Pennsylvania
February 29, 2016
59
REPORT OF INDEPENDENT REGISTERED PUBLIC ACCOUNTING FIRM
To the Board of Directors and Stockholders of
Heartland Payment Systems, Inc.
We have audited the internal control over financial reporting of Heartland Payment Systems, Inc. and subsidiaries (the "Company") as of December 31, 2015, based on criteria established in Internal Control - Integrated Framework (2013) issued by the Committee of Sponsoring Organizations of the Treadway Commission. The Company's management is responsible for maintaining effective internal control over financial reporting and for its assessment of the effectiveness of internal control over financial reporting, included in the accompanying Management Annual Report on Internal Control over Financial Reporting. Our responsibility is to express an opinion on the Company's internal control over financial reporting based on our audit.
We conducted our audit in accordance with the standards of the Public Company Accounting Oversight Board (United States). Those standards require that we plan and perform the audit to obtain reasonable assurance about whether effective internal control over financial reporting was maintained in all material respects. Our audit included obtaining an understanding of internal control over financial reporting, assessing the risk that a material weakness exists, testing and evaluating the design and operating effectiveness of internal control based on the assessed risk, and performing such other procedures as we considered necessary in the circumstances. We believe that our audit provides a reasonable basis for our opinion.
A company's internal control over financial reporting is a process designed by, or under the supervision of, the company's principal executive and principal financial officers, or persons performing similar functions, and effected by the company's board of directors, management, and other personnel to provide reasonable assurance regarding the reliability of financial reporting and the preparation of financial statements for external purposes in accordance with generally accepted accounting principles. A company's internal control over financial reporting includes those policies and procedures that (1) pertain to the maintenance of records that, in reasonable detail, accurately and fairly reflect the transactions and dispositions of the assets of the company; (2) provide reasonable assurance that transactions are recorded as necessary to permit preparation of financial statements in accordance with generally accepted accounting principles, and that receipts and expenditures of the company are being made only in accordance with authorizations of management and directors of the company; and (3) provide reasonable assurance regarding prevention or timely detection of unauthorized acquisition, use, or disposition of the company's assets that could have a material effect on the financial statements.
Because of the inherent limitations of internal control over financial reporting, including the possibility of collusion or improper management override of controls, material misstatements due to error or fraud may not be prevented or detected on a timely basis. Also, projections of any evaluation of the effectiveness of the internal control over financial reporting to future periods are subject to the risk that the controls may become inadequate because of changes in conditions, or that the degree of compliance with the policies or procedures may deteriorate.
In our opinion, the Company maintained, in all material respects, effective internal control over financial reporting as of December 31, 2015, based on the criteria established in Internal Control - Integrated Framework (2013) issued by the Committee of Sponsoring Organizations of the Treadway Commission.
We have also audited, in accordance with the standards of the Public Company Accounting Oversight Board (United States), the consolidated financial statements as of and for the year ended December 31, 2015 of the Company and our report dated February 29, 2016 expressed an unqualified opinion and on these consolidated financial statements included an explanatory paragraph related to the adoption of Accounting Standards Update 2015-17, Balance Sheet Classification of Deferred Taxes.
/s/ Deloitte & Touche LLP
Philadelphia, Pennsylvania
February 29, 2016
60
Heartland Payment Systems, Inc. and Subsidiaries
Consolidated Balance Sheets
(In thousands, except share data)
December 31, | |||||||
Assets | 2015 | 2014 | |||||
Current assets: | |||||||
Cash and cash equivalents | $ | 56,483 | $ | 70,793 | |||
Funds held for customers | 228,234 | 176,492 | |||||
Receivables, net | 267,292 | 234,104 | |||||
Investments | 109 | 106 | |||||
Inventory | 12,856 | 12,048 | |||||
Prepaid expenses | 20,733 | 22,658 | |||||
Current tax assets | 6,499 | 15,082 | |||||
Total current assets | 592,206 | 531,283 | |||||
Capitalized customer acquisition costs, net | 88,995 | 73,107 | |||||
Property and equipment, net | 166,692 | 154,303 | |||||
Goodwill | 490,020 | 425,712 | |||||
Intangible assets, net | 197,223 | 192,553 | |||||
Deposits and other assets, net | 1,543 | 1,507 | |||||
Total assets | $ | 1,536,679 | $ | 1,378,465 | |||
Liabilities and Equity | |||||||
Current liabilities: | |||||||
Due to sponsor banks | $ | 31,803 | $ | 31,165 | |||
Accounts payable | 70,418 | 58,460 | |||||
Customer fund deposits | 228,234 | 176,492 | |||||
Processing liabilities | 152,188 | 119,398 | |||||
Current portion of accrued buyout liability | 18,549 | 15,023 | |||||
Current portion of borrowings | 43,793 | 36,792 | |||||
Current portion of unearned revenue | 57,346 | 46,601 | |||||
Accrued expenses and other liabilities | 58,265 | 41,517 | |||||
Total current liabilities | 660,596 | 525,448 | |||||
Deferred tax liabilities, net | 51,283 | 36,496 | |||||
Reserve for unrecognized tax benefits | 6,599 | 7,315 | |||||
Long-term borrowings | 437,842 | 523,122 | |||||
Long-term portion of accrued buyout liability | 41,300 | 32,970 | |||||
Long-term portion of unearned revenue | 3,237 | 2,354 | |||||
Total liabilities | 1,200,857 | 1,127,705 | |||||
Commitments and contingencies (Note 17) | — | — | |||||
Equity | |||||||
Common stock, $0.001 par value, 100,000,000 shares authorized, 36,933,825 and 36,344,921 shares issued and outstanding at December 31, 2015 and December 31, 2014 | 37 | 36 | |||||
Additional paid-in capital | 270,822 | 255,921 | |||||
Accumulated other comprehensive loss | (31 | ) | (130 | ) | |||
Retained earnings (accumulated deficit) | 64,994 | (5,067 | ) | ||||
Total equity | 335,822 | 250,760 | |||||
Total liabilities and equity | $ | 1,536,679 | $ | 1,378,465 | |||
See accompanying notes to consolidated financial statements.
61
Heartland Payment Systems, Inc. and Subsidiaries
Consolidated Statements of Income
(In thousands, except per share data)
Year Ended December 31, | |||||||||||
2015 | 2014 | 2013 | |||||||||
Total revenues | $ | 2,682,396 | $ | 2,311,381 | $ | 2,135,372 | |||||
Costs of services: | |||||||||||
Interchange | 1,617,671 | 1,422,894 | 1,335,487 | ||||||||
Dues, assessments and fees | 241,767 | 215,862 | 200,903 | ||||||||
Processing and servicing | 328,630 | 285,011 | 237,232 | ||||||||
Customer acquisition costs | 59,458 | 46,977 | 42,109 | ||||||||
Depreciation and amortization | 45,317 | 30,598 | 19,975 | ||||||||
Total costs of services | 2,292,843 | 2,001,342 | 1,835,706 | ||||||||
General and administrative | 244,005 | 190,554 | 173,568 | ||||||||
Goodwill impairment charge | — | 18,490 | — | ||||||||
Asset impairment charges | — | 18,875 | — | ||||||||
Total expenses | 2,536,848 | 2,229,261 | 2,009,274 | ||||||||
Income from operations | 145,548 | 82,120 | 126,098 | ||||||||
Other income (expense): | |||||||||||
Interest income | 105 | 125 | 124 | ||||||||
Interest expense | (14,184 | ) | (8,057 | ) | (5,429 | ) | |||||
Gain on sale of assets | 7,008 | — | — | ||||||||
Other, net | (402 | ) | (444 | ) | (241 | ) | |||||
Total other expense | (7,473 | ) | (8,376 | ) | (5,546 | ) | |||||
Income before income taxes | 138,075 | 73,744 | 120,552 | ||||||||
Provision for income taxes | 53,343 | 41,876 | 46,450 | ||||||||
Net income from continuing operations | 84,732 | 31,868 | 74,102 | ||||||||
Income from discontinued operations, net of income tax of $—, $—, and $2,135 | — | — | 3,970 | ||||||||
Net income | 84,732 | 31,868 | 78,072 | ||||||||
Less: Net (loss) income attributable to noncontrolling interests | |||||||||||
Continuing operations | — | (2,011 | ) | (610 | ) | ||||||
Discontinued operations | — | — | 56 | ||||||||
Net income attributable to Heartland | $ | 84,732 | $ | 33,879 | $ | 78,626 | |||||
Amounts attributable to Heartland: | |||||||||||
Net income from continuing operations | $ | 84,732 | $ | 33,879 | $ | 74,712 | |||||
Income from discontinued operations, net of income tax and noncontrolling interests | — | — | 3,914 | ||||||||
Net income attributable to Heartland | $ | 84,732 | $ | 33,879 | $ | 78,626 | |||||
Basic earnings per share: | |||||||||||
Income from continuing operations | $ | 2.31 | $ | 0.93 | $ | 2.03 | |||||
Income from discontinued operations | — | — | 0.11 | ||||||||
Basic earnings per share | $ | 2.31 | $ | 0.93 | $ | 2.14 | |||||
Diluted earnings per share: | |||||||||||
Income from continuing operations | $ | 2.28 | $ | 0.91 | $ | 1.96 | |||||
Income from discontinued operations | — | — | 0.10 | ||||||||
Diluted earnings per share | $ | 2.28 | $ | 0.91 | $ | 2.06 | |||||
Weighted average number of common shares outstanding: | |||||||||||
Basic | 36,646 | 36,354 | 36,791 | ||||||||
Diluted | 37,237 | 37,187 | 38,053 | ||||||||
.
See accompanying notes to consolidated financial statements.
62
Heartland Payment Systems, Inc. and Subsidiaries
Consolidated Statements of Comprehensive Income
(In thousands)
Year Ended December 31, | |||||||||||
2015 | 2014 | 2013 | |||||||||
Net income | $ | 84,732 | $ | 31,868 | $ | 78,072 | |||||
Other comprehensive income (loss): | |||||||||||
Reclassification of losses (gains) on investments, net of income tax of $(7), $108 and $— | 12 | (170 | ) | — | |||||||
Unrealized gains (losses) on investments, net of income tax of $6, $(10) and $8 | 15 | (50 | ) | 12 | |||||||
Unrealized gains on derivative financial instruments, net of income tax of $54, $106 and $153 | 72 | 178 | 254 | ||||||||
Foreign currency translation adjustment | — | — | (54 | ) | |||||||
Comprehensive income | 84,831 | 31,826 | 78,284 | ||||||||
Less: Comprehensive loss attributable to noncontrolling interests | — | (2,011 | ) | (570 | ) | ||||||
Comprehensive income attributable to Heartland | $ | 84,831 | $ | 33,837 | $ | 78,854 | |||||
See accompanying notes to consolidated financial statements.
63
Heartland Payment Systems, Inc. and Subsidiaries
Consolidated Statements of Equity
(In thousands)
Heartland Stockholders’ Equity | ||||||||||||||||||||||||||||||
Common Stock | Additional Paid-In Capital | Accumulated Other Comprehensive Income (Loss) | (Accumulated Deficit) Retained Earnings | Treasury Stock | Noncontrolling Interests | Total Equity | ||||||||||||||||||||||||
Shares | Amount | |||||||||||||||||||||||||||||
Balance, January 1, 2013 | 36,856 | $ | 38 | $ | 222,705 | $ | (399 | ) | $ | 7,629 | (20,187 | ) | $ | 1,375 | $ | 211,161 | ||||||||||||||
Issuance of common stock – options exercised | 1,265 | 1 | 14,173 | — | — | — | — | 14,174 | ||||||||||||||||||||||
Issuance of common stock – RSU’s vested | 317 | — | (6,233 | ) | — | — | — | — | (6,233 | ) | ||||||||||||||||||||
Excess tax benefit on employee share-based compensation | — | — | 11,596 | — | — | — | — | 11,596 | ||||||||||||||||||||||
Repurchase of common stock | (1,487 | ) | — | — | — | — | (50,302 | ) | — | (50,302 | ) | |||||||||||||||||||
Retirement of treasury stock | — | (2 | ) | (10,024 | ) | — | (39,974 | ) | 50,000 | — | — | |||||||||||||||||||
Share-based compensation | — | — | 12,838 | — | — | — | — | 12,838 | ||||||||||||||||||||||
Changes in equity from sale of discontinued operations | — | — | — | 83 | — | — | (1,415 | ) | (1,332 | ) | ||||||||||||||||||||
Other comprehensive income (loss) | — | — | — | 228 | — | — | (16 | ) | 212 | |||||||||||||||||||||
Noncontrolling interests in subsidiary acquired | — | — | — | — | — | — | 6,798 | 6,798 | ||||||||||||||||||||||
Dividends on common stock ($0.28 per share) | — | — | — | — | (10,321 | ) | — | — | (10,321 | ) | ||||||||||||||||||||
Net income (loss) for the year | — | — | — | — | 78,626 | — | (554 | ) | 78,072 | |||||||||||||||||||||
Balance, December 31, 2013 | 36,951 | $ | 37 | $ | 245,055 | $ | (88 | ) | $ | 35,960 | $ | (20,489 | ) | $ | 6,188 | $ | 266,663 | |||||||||||||
Issuance of common stock – options exercised | 453 | 6,109 | — | — | — | — | 6,109 | |||||||||||||||||||||||
Issuance of common stock – RSU’s vested | 289 | (7,245 | ) | — | — | — | — | (7,245 | ) | |||||||||||||||||||||
Excess tax benefit on employee share-based compensation | — | — | 7,524 | — | — | — | — | 7,524 | ||||||||||||||||||||||
Repurchase of common stock | (1,348 | ) | — | — | — | — | (54,455 | ) | — | (54,455 | ) | |||||||||||||||||||
Retirement of treasury stock | — | (1 | ) | (12,368 | ) | — | (62,575 | ) | 74,944 | — | — | |||||||||||||||||||
Share-based compensation | — | — | 13,269 | — | — | — | — | 13,269 | ||||||||||||||||||||||
Other comprehensive loss | — | — | — | (42 | ) | — | — | — | (42 | ) | ||||||||||||||||||||
Acquisition of noncontrolling interest | — | — | 3,577 | — | — | — | (4,177 | ) | (600 | ) | ||||||||||||||||||||
Dividends on common stock ($0.34 per share) | — | — | — | — | (12,331 | ) | — | — | (12,331 | ) | ||||||||||||||||||||
Net income (loss) for the year | — | — | — | — | 33,879 | — | (2,011 | ) | 31,868 | |||||||||||||||||||||
Balance, December 31, 2014 | 36,345 | $ | 36 | $ | 255,921 | $ | (130 | ) | $ | (5,067 | ) | $ | — | $ | — | $ | 250,760 | |||||||||||||
Issuance of common stock – options exercised | 184 | 2,910 | 2,910 | |||||||||||||||||||||||||||
Issuance of common stock – RSU’s vested | 405 | 1 | (18,905 | ) | (18,904 | ) | ||||||||||||||||||||||||
Excess tax benefit on employee share-based compensation | 9,634 | 9,634 | ||||||||||||||||||||||||||||
Share-based compensation | 21,262 | 21,262 | ||||||||||||||||||||||||||||
Other comprehensive income | 99 | 99 | ||||||||||||||||||||||||||||
Dividends on common stock ($0.40 per share) | (14,671 | ) | (14,671 | ) | ||||||||||||||||||||||||||
Net income for the year | 84,732 | 84,732 | ||||||||||||||||||||||||||||
Balance, December 31, 2015 | 36,934 | $ | 37 | $ | 270,822 | $ | (31 | ) | $ | 64,994 | $ | — | $ | — | $ | 335,822 | ||||||||||||||
See accompanying notes to consolidated financial statements.
64
Heartland Payment Systems, Inc. and Subsidiaries
Consolidated Statements of Cash Flows
(In thousands)
Year Ended December 31, | ||||||||||||
2015 | 2014 | 2013 | ||||||||||
Cash flows from operating activities | ||||||||||||
Net income | $ | 84,732 | $ | 31,868 | $ | 78,072 | ||||||
Adjustments to reconcile net income to net cash provided by operating activities: | ||||||||||||
Amortization of capitalized customer acquisition costs | 60,755 | 51,626 | 45,648 | |||||||||
Other depreciation and amortization | 62,955 | 48,270 | 35,389 | |||||||||
Asset impairment charges | — | 37,365 | — | |||||||||
Addition to loss reserves | 2,852 | 9,650 | 2,787 | |||||||||
Provision for doubtful receivables | 6,155 | 3,279 | 195 | |||||||||
Deferred taxes | 8,157 | 7,515 | 8,403 | |||||||||
Share-based compensation | 21,262 | 13,269 | 12,838 | |||||||||
Gain on sale of assets | (7,008 | ) | — | (3,786 | ) | |||||||
Write off of fixed assets and other | 1,455 | 1,691 | 1,034 | |||||||||
Changes in operating assets and liabilities: | ||||||||||||
Increase in receivables | (38,203 | ) | (18,134 | ) | (19,693 | ) | ||||||
Increase in inventory | (1,302 | ) | (890 | ) | (1,343 | ) | ||||||
Payment of signing bonuses, net | (48,289 | ) | (38,875 | ) | (29,091 | ) | ||||||
Increase in capitalized customer acquisition costs | (28,562 | ) | (24,831 | ) | (21,159 | ) | ||||||
Decrease (increase) in current tax assets | 18,175 | 2,188 | (3,138 | ) | ||||||||
Decrease (increase) in prepaid expenses, deposits and other assets | 2,271 | (3,153 | ) | (3,782 | ) | |||||||
Excess tax benefits on employee share-based compensation | (9,634 | ) | (7,524 | ) | (11,596 | ) | ||||||
(Decrease) increase in reserve for unrecognized tax benefits | (716 | ) | 1,682 | 2,564 | ||||||||
Increase (decrease) in due to sponsor banks | 639 | 12,056 | (18,477 | ) | ||||||||
Increase (decrease) in accounts payable | 9,555 | (11,434 | ) | 2,136 | ||||||||
Increase in unearned revenue | 8,608 | 1,554 | 5,010 | |||||||||
Decrease in accrued expenses and other liabilities | (5,822 | ) | (11,666 | ) | (6,615 | ) | ||||||
Increase (decrease) in processing liabilities | 29,903 | (21,123 | ) | 32,761 | ||||||||
Payouts of accrued buyout liability | (15,408 | ) | (11,568 | ) | (13,651 | ) | ||||||
Increase in accrued buyout liability | 27,264 | 20,182 | 17,620 | |||||||||
Net cash provided by operating activities | 189,794 | 92,997 | 112,126 | |||||||||
Cash flows from investing activities | ||||||||||||
Purchase of investments | (2,283 | ) | (38,962 | ) | (5,262 | ) | ||||||
Sales of investments | — | 25,247 | — | |||||||||
Maturities of investments | 2,550 | 2.55 | — | 2,000 | ||||||||
(Increase) decrease in funds held for customers | (5,735 | ) | (35,420 | ) | 4,040 | |||||||
Increase (decrease) in customer fund deposits | 5,467 | 49,003 | (4,030 | ) | ||||||||
Proceeds from sale of assets | 9,973 | — | 19,343 | |||||||||
Acquisitions of businesses, net of cash acquired | (79,354 | ) | (392,142 | ) | (15,182 | ) | ||||||
Capital expenditures | (54,345 | ) | (54,913 | ) | (52,924 | ) | ||||||
Net cash used in investing activities | (123,727 | ) | (447,187 | ) | (52,015 | ) | ||||||
Cash flows from financing activities | ||||||||||||
Proceeds from borrowings, net | 230,000 | 460,392 | 156,416 | |||||||||
Principal payments on borrowings | (308,250 | ) | (54,188 | ) | (161,001 | ) | ||||||
Proceeds from exercise of stock options | 2,910 | 6,109 | 14,174 | |||||||||
Excess tax benefits on employee share-based compensation | 9,634 | 7,524 | 11,596 | |||||||||
Repurchases of common stock | — | (54,455 | ) | (49,625 | ) | |||||||
Dividends paid on common stock | (14,671 | ) | (12,331 | ) | (10,321 | ) | ||||||
Net cash (used in) provided by financing activities | (80,377 | ) | 353,051 | (38,761 | ) | |||||||
Net (decrease) increase in cash | (14,310 | ) | (1,139 | ) | 21,350 | |||||||
Effect of exchange rates on cash | — | — | 1 | |||||||||
Cash at beginning of year | 70,793 | 71,932 | 50,581 | |||||||||
Cash at end of year | $ | 56,483 | $ | 70,793 | $ | 71,932 | ||||||
Supplemental cash flow information | ||||||||||||
Cash paid during the period for: | ||||||||||||
Interest | $ | 12,781 | $ | 6,824 | $ | 4,598 | ||||||
Income taxes | 27,517 | 30,504 | 38,827 | |||||||||
See accompanying notes to consolidated financial statements.
65
Heartland Payment Systems, Inc. and Subsidiaries
Notes To Consolidated Financial Statements
1. Organization and Operations
Basis of Financial Statement Presentation— The accompanying consolidated financial statements include those of Heartland Payment Systems, Inc. (the "Company," “we,” “us,” or “our”) and its wholly-owned subsidiaries, Heartland Payroll Solutions, Inc., Heartland Payment Solutions, Inc., Heartland Acquisition LLC, TouchNet Information Systems, Inc. (“TouchNet”) and Heartland Commerce, Inc. The consolidated financial statements have been prepared in accordance with accounting principles generally accepted in the United States of America. All intercompany balances and transactions with the Company's subsidiaries have been eliminated upon consolidation.
Agreement and Plan of Merger— On December 15, 2015, the Company entered into an Agreement and Plan of Merger (the “Merger Agreement”) with Global Payments Inc., a Georgia corporation (“Global”), Data Merger Sub One, Inc., a Delaware corporation and wholly owned subsidiary of Global (“Merger Sub One”) and Data Merger Sub Two, LLC, a Delaware limited liability company and wholly owned subsidiary of Global (“Merger Sub Two”, and together with Merger Sub One, the “Merger Subs”). Pursuant to the terms and subject to the conditions set forth in the Merger Agreement, Global will acquire the Company by way of two mergers (the “Mergers”). First, Merger Sub One will merge with and into the Company, with the Company continuing as a wholly owned subsidiary of Global. Second, the Company will merge with and into Merger Sub Two immediately following the initial merger, with Merger Sub Two surviving the second merger as a wholly owned subsidiary of Global.
As a result of the Mergers, subject to the terms and conditions of the Merger Agreement, each outstanding share of the Company’s common stock, other than shares owned by (i) Global, the Merger Subs or the Company (which will be canceled), (ii) stockholders who have properly exercised and perfected appraisal rights under Delaware law, or (iii) any direct or indirect wholly owned subsidiary of the Company (which will remain outstanding), will be converted into the right to receive (subject to adjustment as set forth in the next sentence) $53.28 in cash (the “Cash Consideration”), without interest, and 0.6687 shares of common stock of Global (the “Stock Consideration”, and together with the Cash Consideration, the “Merger Consideration”). Under the terms of the Merger Agreement, in the event that the number of shares of common stock of Global issuable as a result of the Mergers would exceed 19.9% of the issued and outstanding shares of common stock of Global immediately prior to the closing of the Mergers, the Stock Consideration will be reduced so that no more than 19.9% of the outstanding shares of common stock of Global become issuable in the Mergers and the Cash Consideration will be increased by a corresponding amount, so that the value of the per share Merger Consideration will remain the same.
Out of Period Adjustments Recorded in Prior Year—In the second quarter of 2014, the Company recorded out-of-period adjustments decreasing its revenue and increasing bad debt expense (included in Processing and Servicing in its Consolidated Statements of Income) by $1.4 million and $0.9 million, respectively. These adjustments related to immaterial errors that originated in 2013 in the Company's Heartland School Solutions business. These adjustments included revenue which was incorrectly recorded in prior periods and a reassessment of the collectability of certain customer accounts receivable. These out-of-period adjustments reduced earnings before income taxes and net income in the year ended December 31, 2014 by $2.3 million and $1.4 million, respectively, and reduced diluted earnings per share by $0.04. The Company considered existing guidance in evaluating whether a restatement of prior financial statements was required as a result of these misstatements. The guidance requires corrections of errors to be recorded by restatement of prior periods, if material. The Company quantitatively and qualitatively assessed the materiality of the errors and concluded that the errors were not material to its earnings for the year ended December 31, 2013 and 2014, and accordingly, no restatement of prior period financial statements was warranted.
Business Description—The Company’s primary business is to provide payment processing services to merchants throughout the United States. This involves providing end-to-end electronic payment processing services to merchants by facilitating the exchange of information and funds between them and cardholders' financial institutions. To accomplish this, the Company undertakes merchant set-up and training, transaction authorization and electronic draft capture, clearing and settlement, merchant accounting, merchant assistance and support, and risk management. The Company also provides additional services, including those provided through its subsidiaries, such as:
• | Integrated commerce solutions, payment processing, higher education loan services and open and closed-loop payment solutions to higher-education institutions through Campus Solutions, |
66
Heartland Payment Systems, Inc. and Subsidiaries
Notes To Consolidated Financial Statements—(Continued)
• | School nutrition, point-of-sale solutions ("POS"), and associated payment solutions, including online prepayment solutions, to kindergarten through 12th grade ("K-12") schools through Heartland School Solutions, |
• | Full-service payroll processing and related tax filing services, through Heartland Payroll Solutions, and |
• | Others including (1) prepaid and stored-value card solutions through Micropayments, (2) POS solutions and other adjacent business service applications through Heartland Commerce, and (3) marketing solutions including loyalty and gift cards which the Company provides through Heartland Marketing Solutions. |
Approximately 72% of the Company's revenue is derived from processing and settling Visa and MasterCard bankcard transactions for its merchant customers. Because the Company is not a ''member bank'' as defined by Visa and MasterCard, in order to process and settle these bankcard transactions for its merchants, the Company has entered into sponsorship agreements with member banks. Visa and MasterCard rules restrict the Company from performing funds settlement or accessing merchant settlement funds and require that these funds be in the possession of the member bank until the merchant is funded. A sponsorship agreement with a member bank permits the Company to route Visa and MasterCard bankcard transactions under the member bank's control and identification numbers to clear credit and signature debit bankcard transactions through Visa and MasterCard. A sponsorship agreement also enables the Company to settle funds between cardholders and merchants by delivering funding files to the member bank, which in turn transfers settlement funds to the merchants' bank accounts. These restrictions place the settlement assets and obligations under the control of the member bank.
The sponsorship agreements with the member banks require, among other things, that the Company abide by the bylaws and regulations of the Visa and MasterCard networks, and certain sponsor banks require a cash balance in a deposit account. If the Company were to breach a sponsorship agreement and under certain other circumstances, the sponsor banks may terminate the agreement and, under the terms of the agreement, the Company would have six months to identify an alternative sponsor bank. The Company is generally dependent on its sponsor banks, Visa and MasterCard for notification of any compliance breaches. As of December 31, 2015, the Company has not been notified of any such issues by its sponsor banks, Visa or MasterCard.
As of December 31, 2015, the Company is party to three bank sponsorship agreements.
• | Processing for the majority of the Company’s small and mid-sized merchants (referred to as "Small and Midsized Enterprises," or “SME merchants”) is performed under a February 8, 2012, sponsorship agreement with Wells Fargo Bank, N.A. ("WFB"). The WFB sponsorship agreement was in effect until February 8, 2016 and would have automatically renewed for three years unless either party provided written notice of non-renewal to the other party. On November 5, 2015, the Company provided written notice of non-renewal to WFB. Under the terms of the WFB sponsorship agreement, the Company has up to six months beyond February 8, 2016 to complete a conversion of its SME merchants to another sponsorship arrangement. |
On November 5, 2015, the Company entered into a sponsorship agreement with Deutsche Bank Trust Company Americas ("Deutsche Bank") for its SME merchants. The Company is highly confident it will complete the conversion of its SME merchants to the Deutsche Bank sponsorship arrangement within the six-month conversion period beginning February 8, 2016. The sponsorship agreement with Deutsche Bank involves substantially the same terms as applied in the February 8, 2012 agreement with WFB. The agreement with Deutsche Bank is for a five-year term expiring on November 5, 2020 and will automatically renew for successive one-year periods unless either party provides six months written notice of non-renewal to the other party.
• | On November 23, 2009, the Company entered into a sponsorship agreement with The Bancorp Bank ("TBB") to sponsor processing for the Company's Network Services merchants, which are predominantly petroleum industry merchants of all sizes (referred to as "Network Services Merchants"), and since October 2013, certain of the Company's SME merchants. In August 2015, the agreement with TBB automatically renewed until February 2017. The agreement with TBB expires in February 2017 with subsequent one-year auto renewal periods, unless either party provides six months written notice of non-renewal to the other party. |
• | On March 24, 2011, the Company entered into a sponsorship agreement with Barclays Bank Delaware to sponsor processing for certain of its large national merchants. The original agreement with Barclays Bank Delaware would have expired in March 2016, however, in September 2015, the agreement with Barclays Bank Delaware automatically renewed until March 2017. In January 2016, the Company signed an extension of this |
67
Heartland Payment Systems, Inc. and Subsidiaries
Notes To Consolidated Financial Statements—(Continued)
agreement, which will now expire in March 2021. The agreement will continue to automatically renew for successive one-year periods thereafter, unless either party provides six months written notice of non-renewal to the other party.
The following is a breakout of the Company’s total Visa and MasterCard settled card processing volume for the month ending December 31, 2015 by percentage processed under its individual bank sponsorship agreements: | ||||
% of | December 2015 | |||
Sponsor Bank | Bankcard Processing Volume | |||
Wells Fargo Bank, N.A. | 75% | |||
The Bancorp Bank | 18% | |||
Barclays Bank Delaware | 7% | |||
The Company also provides card transaction processing for DFS Services, LLC ("Discover") and is designated as an
acquirer by Discover. The agreement with Discover allows the Company to acquire, process and fund transactions directly
through Discover's network without the need of a bank sponsor. The Company processes Discover transactions similarly to
the way it processes Visa and MasterCard transactions. The Company must comply with Discover's acquirer operating regulations and uses its sponsor banks to assist in funding its merchants' Discover transactions.
Under a prior sales and servicing program agreement with American Express Travel Related Services Company, Inc.
("American Express") the Company: (a) provided solicitation services by signing new-to-American Express merchants directly
with American Express; (b) provided transactional support services on behalf of American Express to the Company's American
Express accepting merchants; and (c) provided processing, settlement, customer support and reporting to merchants, similar to
the services provided for the merchants' Visa, MasterCard and Discover transactions. In May 2014, the Company began offering a new American Express Card Acceptance Program (referred to as "OptBlue") to new merchants. The Company converted a majority of its existing merchants who were processing under the prior sales and servicing agreement with American Express to OptBlue during the third quarter of 2014. As a participant in OptBlue, the Company acquires, contracts, and establishes pricing for, as well as provides customer service to merchants, similar to the transaction processing services the Company provides through Discover, Visa and MasterCard. The Company also uses its sponsor banks to assist in funding its merchants' American Express transactions.
2. Summary of Significant Accounting Policies
Use of Estimates— The preparation of consolidated financial statements in conformity with accounting principles generally accepted in the United States of America requires management to make estimates and assumptions that affect the reported amounts of assets, liabilities, and disclosure of contingent assets and liabilities at the date of the consolidated financial statements, and the reported amounts of revenues and expenses during the reporting period. Estimates include, among other things, the accrued buyout liability, capitalized customer acquisition costs, share-based compensation, goodwill and intangible asset impairment review, revenue recognition for multiple element arrangements, loss reserves, certain accounts payable and accrued expenses and certain tax assets and liabilities as well as the related valuation allowances, if any. Actual results could differ from those estimates.
Cash and Cash Equivalents— At December 31, 2015, cash included approximately $15.1 million of processing-related cash in transit and collateral, compared to approximately $17.8 million of processing-related cash in transit and collateral at December 31, 2014. Processing-related cash in transit and collateral includes merchant deposits, collateral deposits, and funds in transit relating to timing differences for the Company's card and non-card payment processing businesses.
Receivables— The Company's primary receivables are from its bankcard processing merchants. In addition to receivables for transaction fees the Company charges its merchants for processing transactions, these receivables include amounts resulting from the Company's practice of advancing interchange fees to most of its SME merchants during the month and collecting those fees at the beginning of the following month. The Company does not advance interchange fees to its Network Services merchants. Network Services merchants are invoiced monthly, on payment terms of 30 days net from date of invoicing. Receivables from merchants also include receivables from the sale of POS terminal equipment.
The timing for presentment of transaction funding files to the bankcard networks results in the Company's sponsor banks receiving settlement cash one day before payment is made to merchants, thereby increasing funding obligations to its SME merchants, which are carried in processing liabilities. The Company funds interchange advances/receivables to SME merchants first from this settlement cash received from bankcard networks, then from the Company's available cash or by incurring a liability to its sponsor banks. At both December 31, 2015 and 2014, the Company did not use any of its available cash to fund merchant advances. The amount due to sponsor banks for funding advances was $30.5 million at December 31, 2015 and $29.9 million at December 31, 2014. The liability to sponsor banks is repaid at the beginning of the following month out of the fees the Company collects from its merchants.
Receivables also include amounts due from Discover and American Express for merchant bankcard transactions. These amounts are recovered the next business day following the date of processing the transaction.
Receivables also include amounts resulting from the sale, installation, training and repair of payment system hardware and software for Campus Solutions, Heartland School Solutions and Other (which includes receivables from Micropayments, Heartland Commerce and Heartland Marketing Solutions). These receivables are mostly invoiced on terms of 30 days net from date of invoicing.
Receivables are stated net of allowance for doubtful accounts. The Company estimates its allowance based on experience with its merchants, customers, and sales force and its judgment as to the likelihood of their ultimate payment. The Company also considers collection experience and makes estimates regarding collectability based on trends in the aging. Historically, the Company has not experienced significant charge offs for its merchant and customer receivables, other than the out-of-period adjustment recorded in the second quarter of 2014 (see Note 1, Organization and Operations for further details).
Investments and Funds Held for Customers— Investments, including those carried on the Consolidated Balance Sheets as Funds held for customers, consist primarily of bond funds, tax-exempt bonds, certificates of deposit and equity investments. Funds held for customers also include overnight bank deposits. The majority of investments carried in Funds held for customers are available-for-sale and recorded at fair value based on quoted market prices. Certificates of deposit are classified as held to maturity and recorded at cost. In the event of a sale, cost is determined on a specific identification basis. At December 31, 2015, Funds held for customers included cash and cash equivalents of $201.4 million and investments available for sale of $26.9 million.
The asset Funds held for customers and the liability Customer fund deposits include: (1) amounts collected from customers prior to funding their payroll liabilities, as well as related tax and fiduciary liabilities for those customers, and (2) amounts collected by Campus Solutions in its capacity as a loan servicer, which will be remitted to the customer/owner of the student loans the following month.
Capitalized Customer Acquisition Costs, net— Capitalized customer acquisition costs consist of (1) up-front signing bonus payments made to Relationship Managers and sales managers (the Company's sales force, which are referred to as "salespersons") for the establishment of new merchant relationships, and (2) a deferred acquisition cost representing the estimated cost of buying out the residual commissions of vested salespersons. Capitalized customer acquisition costs represent incremental, direct customer acquisition costs that are recoverable through gross margins associated with merchant contracts. The capitalized customer acquisition costs are amortized using a method which approximates a proportional revenue approach over the initial three-year term of the merchant contract.
The up-front signing bonus paid for new SME bankcard, payroll and loyalty marketing accounts is based on the estimated gross margin for the first year of the merchant contract. The signing bonus, amount capitalized, and related amortization are adjusted after the first year to reflect the actual gross margin generated by the merchant contract during that year. The deferred customer acquisition cost asset is accrued over the first year of SME bankcard, payroll and loyalty marketing merchant processing, consistent with the build-up in the accrued buyout liability, as described below.
Management evaluates the capitalized customer acquisition costs for impairment on an annual basis by comparing, on a pooled basis by vintage month of origination, the expected future net cash flows from underlying merchant relationships to the carrying amount of the capitalized customer acquisition costs. If the estimated future net cash flows are lower than the recorded carrying amount, indicating an impairment of the value of the capitalized customer acquisition costs, the impairment loss will be charged to operations.
68
Heartland Payment Systems, Inc. and Subsidiaries
Notes To Consolidated Financial Statements—(Continued)
The Company believed that no impairment of capitalized customer acquisition costs had occurred as of December 31, 2015 and 2014.
Property and Equipment— Property and equipment are carried at cost, net of accumulated depreciation. Depreciation for the Company's owned service center building in Jeffersonville, Indiana is computed straight-line over 39 years with depreciation on certain building improvements computed over 15 years. Depreciation is computed straight-line over periods ranging from 3 to 10 years for furniture and equipment. Leasehold improvements are amortized over the lesser of the economic useful life of the improvement or the term of the lease.
Equipment held under capitalized lease arrangements is included in property and equipment, and the associated liabilities are included in current and long-term borrowings as appropriate. Amortization of equipment under capitalized leases is included in depreciation and amortization expense.
Fully depreciated property and equipment are retained in property and equipment and accumulated depreciation accounts until their disposal or removal from service. When fully depreciated property and equipment is taken out of service, the original cost basis and matching accumulated depreciation amounts are written off.
Rent expense on operating leases is recorded on a straight-line basis over the term of the lease agreement. Tenant improvement allowances are deferred and amortized on a straight-line basis over the life of the lease agreement as a reduction to rent expense.
The Company capitalizes software development costs and amortizes such costs on a straight-line basis over an estimated useful life of 3 to 7 years. The preliminary project stage consists of the conceptual formation of alternatives, the evaluation of alternatives, the determination of existence of needed technology and the final selection of alternatives. Costs incurred during the preliminary project stage are expensed as incurred. Once the preliminary project stage is complete, costs are capitalized until the software is placed in service.
Long-Lived Assets— The Company evaluates the potential for impairment when changes in circumstances indicate that undiscounted cash flows estimated to be generated by the related assets are less than the carrying amount. In the fourth quarter of 2014, the Company recorded non-cash asset impairments and write-offs relating to assets held and used of $18.9 million relating to internally developed software and intangible assets related to Leaf and a write-off of a capitalized internally developed software project termination (see "Goodwill," below for further detail).
Goodwill— Goodwill represents the excess of acquisition costs over the fair values of net assets acquired in business combinations. At December 31, 2015 and 2014, goodwill of $490.0 million and $425.7 million, respectively, was recorded on the Consolidated Balance Sheets. The Company tests goodwill for impairment at least annually in the fourth quarter and between annual tests if an event occurs or changes in circumstances suggest a potential decline in the fair value of the reporting unit. A significant amount of judgment is involved in determining if an indicator or change in circumstances relating to impairment has occurred. Such changes may include, among others: a significant decline in expected future cash flows; a sustained decline in market capitalization; a significant adverse change in legal factors or in the business climate; unanticipated competition; and slower growth rates.
The Company has the option of performing a qualitative assessment of impairment to determine whether any further quantitative testing for impairment is necessary. The option of whether or not to perform a qualitative assessment is made annually and may vary by reporting unit. Factors the Company considers in the qualitative assessment include general macroeconomic conditions, industry and market conditions, cost factors, overall financial performance of our reporting units, events or changes affecting the composition or carrying amount of the net assets of our reporting units, sustained decrease in our share price, and other relevant entity-specific events. If the Company elects to bypass the qualitative assessment or if it determines, on the basis of qualitative factors, that the fair value of the reporting unit is more likely than not less than the carrying value, then the Company performs a two-step quantitative test for that reporting unit. In the first step, the fair value of each reporting unit is compared to the reporting unit's carrying value, including goodwill. If the fair value of a reporting unit is less than its carrying value, the second step of the goodwill impairment test is performed to measure the amount of impairment, if any. In the second step, the fair value of the reporting unit is allocated to the assets and liabilities of the reporting unit as if it had been acquired in a business combination and the purchase price was equivalent to the fair value of the reporting unit. The excess of the fair value of the reporting unit over the amounts assigned to its assets and liabilities is referred to as the implied fair value of goodwill. The implied fair value of the reporting unit's goodwill is then compared to the actual
69
Heartland Payment Systems, Inc. and Subsidiaries
Notes To Consolidated Financial Statements—(Continued)
carrying value of the goodwill. If the implied fair value of goodwill is less than the carrying value of goodwill, an impairment loss is recognized for the difference.
Significant estimates and assumptions are used in the Company's goodwill impairment review and include the identification of reporting units, assigning assets and liabilities to reporting units, assigning goodwill to reporting units and determining the fair value of each reporting unit. The Company's assessment of qualitative factors involves significant judgments about expected future business performance and general market conditions. In a quantitative assessment, the fair value of each reporting unit is determined based on a combination of techniques, including the present value of future cash flows, applicable multiples of competitors and multiples from sales of like businesses, and requires us to make estimates and assumptions regarding discount rates, growth rates and our future long-term business plans. Changes in any of these estimates or assumptions could materially affect the determination of fair value and the associated goodwill impairment charge for each reporting unit.
As of December 31, 2015, the Company performed a qualitative assessment for each of its reporting units, except one, for which the Company performed a quantitative assessment. Based on our annual test as of December 31, 2015, the Company determined on the basis of qualitative factors that the fair values of the reporting units for which it performed a qualitative assessment were not more likely than not less than their respective carrying amounts. Based on the quantitative assessment the Company did for one of its reporting units, it determined that the goodwill for that reporting unit was not impaired.
In the fourth quarter of 2014, the Company considered the overlapping cloud-based POS systems in development at Heartland Commerce businesses (see Note 3, Acquisitions) and decided that it would stop POS development efforts at Leaf, a previous Heartland Commerce business. This decision caused a significant adverse change in the extent or manner in which the long-lived asset group of Leaf would be used, including Prosper, an internally developed POS software technology. Due to these changes in circumstances, the implied fair value of the Leaf reporting unit was determined to be significantly below its carrying value. This led to a Goodwill impairment charge for the full balance of Leaf goodwill as of December 31, 2014. In the fourth quarter of 2014, the Company recorded pre-tax goodwill and asset impairment charges of $18.5 million and $18.9 million, respectively.
Unearned revenue— Unearned revenue of $60.6 million and $49.0 million at December 31, 2015 and 2014, respectively, is primarily related to the Company's Heartland School Solutions, Campus Solutions, Heartland Payroll Solutions and Heartland Commerce businesses. Unearned revenue is derived primarily from the sale and subscription of e-commerce solutions and integration to host computer systems as well as from support and maintenance contracts and professional services. Unearned revenue represents contractual obligations of the Company to provide software, services and support to customers in the future.
Processing Liabilities— Processing liabilities result primarily from the Company's card processing activities. Processing liabilities primarily reflect funds in transit associated with differences arising between the amounts the Company's sponsor banks receive from the bankcard networks and the amounts funded to the Company's merchants. Such differences arise from timing differences, interchange expense, merchant advances, merchant reserves and chargeback processing. These differences result in payables or receivables. If the settlement received from the bankcard networks precedes the funding obligation to the merchant, the Company records a processing liability. Conversely, if funding to the merchant precedes the settlement from the bankcard networks, the Company records a receivable from the bankcard network. The amounts are generally collected or paid the following business day.
Chargebacks arise due to disputes between a cardholder and a merchant resulting from the cardholder's dissatisfaction with merchandise quality or the merchant's service, and the disputes may not always be resolved in the merchant's favor. In some of these cases, the transaction is ''charged back'' to the merchant and the purchase price is refunded to the cardholder by the credit card-issuing institution. If the merchant is unable to fund the refund, the Company is liable for the full amount of the transaction. The Company's obligation to stand ready to perform is minimal. The Company maintains a deposit or the pledge of a letter of credit from certain merchants as an offset to potential contingent liabilities that are the responsibility of such merchants. The Company evaluates its ultimate risk and records an estimate of potential loss for chargebacks based upon an assessment of actual historical loss rates compared to recent bankcard processing volume levels. The Company believes that the liability recorded as loss reserves approximates fair value.
Accrued Buyout Liability— The Company's Relationship Managers and sales managers are paid residual commissions based on the gross margin generated by monthly SME merchant processing activity. The Company has the right, but not the obligation, to buy out some or all of these commissions, and intends to do so periodically. Such purchases of the
70
Heartland Payment Systems, Inc. and Subsidiaries
Notes To Consolidated Financial Statements—(Continued)
commissions are at a fixed multiple of the last twelve months' commissions. Because of the Company's intent and ability to execute purchases of the residual commissions, and the mutual understanding between the Company and the Relationship Managers and sales managers, the Company has accounted for this deferred compensation arrangement pursuant to the substantive nature of the plan. The Company therefore records the amount that it would have to pay (the ''settlement cost'') to buy out non-servicing related commissions in their entirety from vested Relationship Managers and sales managers, and an accrual, based on their progress towards vesting, for those unvested Relationship Managers and sales managers who are expected to vest in the future. As noted above, as the liability increases over the first year of a SME merchant contract, the Company also records a related deferred acquisition cost asset for currently vested Relationship Managers and sales managers. The accrued buyout liability associated with unvested Relationship Managers and sales managers is not included in the deferred acquisition cost asset since future services are required in order to vest. Subsequent changes in the estimated accrued buyout liability due to merchant attrition, same-store sales growth or contraction and changes in gross margin are included in the same income statement caption as customer acquisition costs expense.
Relationship Managers and sales managers earn portfolio equity on their newly installed payroll and loyalty marketing merchant accounts based on the residual commissions they earn on those accounts. The accrued buyout liability and deferred acquisition cost asset are accrued in the same manner as the SME merchant portfolio equity.
The accrued buyout liability is based on merchants under contract at the balance sheet date, the gross margin generated by those merchants over the prior twelve months, and the contractual buyout multiple. The liability related to a new merchant is therefore zero when the merchant is installed, and increases over the twelve months following the installation date. The same procedure is applied to unvested commissions over the expected vesting period, but is further adjusted to reflect the Company's estimate that 31% of unvested Relationship Managers and sales managers become vested, which represents the Company's historical vesting rate.
The classification of the accrued buyout liability between current and non-current liabilities on the Consolidated Balance Sheets is based upon the Company's estimate of the amount of the accrued buyout liability that it reasonably expects to pay over the next twelve months. This estimate is developed by calculating the cumulative annual average percentage that total historical buyout payments represent of the accrued buyout liability. That percentage is applied to the period-end accrued buyout liability to determine the current portion.
Revenue— The Company classifies its revenues into five categories: (i) Payment Processing, (ii) Heartland School Solutions, (iii) Heartland Payroll Solutions, (iv) Campus Solutions and (v) Other (including Heartland Commerce). The Company recognizes revenue when (1) persuasive evidence of an arrangement exists; (2) delivery has occurred or services have been performed; (3) the price is fixed or determinable; and (4) collectability is reasonably assured. The Company also evaluates its contractual arrangements for indications that multiple element arrangements may exist, including instances where more-than-incidental software deliverables are included. The following revenue recognition policies define the manner in which the Company accounts for sales transactions by revenue category.
Payment Processing revenue primarily consists of discount, per-transaction and periodic (primarily monthly) fees from the processing of Visa, MasterCard, American Express and Discover transactions for SME merchants and per-transaction fees for the authorization and settlement of transactions for Network Services merchants. Also included in this category are American Express servicing fees, merchant service fees, fees for processing chargebacks and termination fees on terminated contracts. Interchange fees, which are the Company’s most significant expense, are set by the card networks and paid to the card issuing banks. For the majority of SME card processing revenue, the Company does not offset processing revenues and interchange fees because its business practice is to advance the interchange fees to most SME merchants when settling their daily transactions (thus paying the full amount of the transaction to the merchant), and then to collect the full discount fees from merchants on the first business day of the next month. The Company has merchant portability, credit risk, and the ultimate responsibility to the merchant and, as such, revenue is reported at the time of settlement on a gross basis. Payment processing services are transaction based and priced either as a fixed fee per transaction or as a percentage of the transaction value. The fees are charged for the processing services provided and do not include the gross sales price paid by the ultimate buyer to the merchant. For SME merchants to whom the Company does not advance interchange, it records card processing revenues net of interchange fees. As Network Services does not advance interchange fees to its merchants, the Company records its card processing revenues net of interchange fees.
71
Heartland Payment Systems, Inc. and Subsidiaries
Notes To Consolidated Financial Statements—(Continued)
Heartland Payroll Solutions revenue includes fees charged for payroll processing services, including check printing, direct deposit, related federal, state and local tax deposits and providing accounting documentation, and interest income earned on funds held for customers.
Heartland School Solutions revenue includes fees from sales and maintenance of cafeteria POS solutions and associated payment solutions, including online prepayment solutions, back office management and hardware and technical support.
Campus Solutions revenue includes fees associated with providing integrated commerce solutions to support administrative services for higher education, as well as student loan payment processing, delinquency and default services, refund management, tuition payment plans, electronic billing and payment, tax document services and business outsourcing. Campus Solutions revenue also includes fees from the sale and maintenance of open- and closed-loop payment hardware and software solutions for college or university campuses to process small value electronic transactions.
Heartland Commerce revenue includes sales of POS systems and the associated payment processing and adjacent business service applications.
Campus Solutions, Heartland School Solutions and Heartland Commerce have arrangements that contain multiple elements, such as hardware, software products, including perpetual licenses and Software-as-a-Service (“SaaS”) services, maintenance, and professional installation and training services. The Company allocates revenue to each element based on the selling price hierarchy. The selling price for a deliverable is based on vendor specific objective evidence (“VSOE”) of selling price, if available, third party evidence ("TPE") if VSOE of selling price is not available, or estimated selling price (“ESP”) if neither VSOE or selling price nor TPE is available. The Company establishes ESP based on management judgment, considering internal factors such as margin objectives, pricing practices and controls, customer segment pricing strategies and the product life cycle. In arrangements with multiple elements, the Company determines allocation of the transaction price at inception of the arrangement based on the relative selling price of each unit of accounting.
In multiple element arrangements where more-than-incidental software deliverables are included, the Company has applied the residual method to determine the amount of software license revenues to be recognized. Under the residual method, if fair value exists for undelivered elements in a multiple-element arrangement, such fair value of the undelivered elements is deferred with the remaining portion of the arrangement consideration recognized upon delivery of the software license or services arrangement. The Company allocates the fair value of each element of a software related multiple-element arrangement based upon its fair value as determined by VSOE, with any remaining amount allocated to the software license. If evidence of the fair value cannot be established for the undelivered elements of a software arrangement, then the entire amount of revenue under the arrangement is deferred until these elements have been delivered or objective evidence can be established.
Other revenues include Micropayments fees from selling hardware and software for unattended online wireless credit card based payment systems, and unattended value top up systems for off-line closed-loop smart (chip) card based payment systems. Also included in this category are Heartland Marketing Solutions fees from selling mobile and card-based marketing services, gift cards and rewards services as well as fees from selling, renting and deploying POS devices.
Loss Contingencies and Legal Expenses— The Company records a liability for loss contingencies when the liability is probable and the amount is reasonably estimable. Legal fees associated with loss contingencies are recorded when the legal fees are incurred.
The Company records recoveries from its insurance providers when cash is received from the provider.
Other Income (Expense)— Other income (expense) consists of interest income on cash and investments, the interest cost on the Company's borrowings, gains or losses on the disposal of assets, write downs of capitalized information technology development projects, Provision for Processing System Intrusion costs and other non-operating income or expense items.
In 2015, other non-operating income or expense items also include:
• | Pre-tax gain of $7.0 million relating to the December 31, 2015 sale of the assets of the SmartLink division (“SmartLink”), which included our secure payment gateways and managed network services technologies, to a third party, for a $10 million cash payment. The Company also entered into a channel partner agreement, whereby Heartland’s sales professionals will continue to promote the secure payment gateway and managed network |
72
Heartland Payment Systems, Inc. and Subsidiaries
Notes To Consolidated Financial Statements—(Continued)
services solutions to merchants. The Company’s SmartLink division was included in the Payment Processing Segment. The sale of SmartLink resulted in a $7.0 million pre-tax gain ($4.3 million after-tax, or $0.11 per share) which was included in “Gain on sale of assets” as part of Other income (expense) in the Company’s Consolidated Statements of Income for the year ended December 31, 2015.
In 2014, other non-operating income or expense items also include:
• | Pre and after-tax gain of $3.6 million relating to a release from a contingent earn-out liability to the noncontrolling shareholders of Leaf. As a result of the Stock Purchase Agreement that the Company entered into on August 6, 2014 with the noncontrolling shareholders of Leaf, the Company was released from a contingent earn-out liability to those noncontrolling shareholders. The non-cash impact of the gain associated with the release of the contingent earn-out liability is recorded in "Other, net" in the Consolidated Statements of Income and "Write-off of fixed assets and other" in the Consolidated Statement of Cash Flows. |
• | Pre-tax charge of $4.0 million relating to an other than temporary impairment ("OTTI") of an investment in the equity of TabbedOut. See Note 5, Funds Held for Customers and Investments for information on this OTTI. |
Income Taxes— The Company accounts for income taxes by recognizing deferred tax assets and liabilities for the expected future tax consequences of events that have been included in the financial statements or tax returns. Under this method, deferred tax assets and liabilities are determined based on the difference between the financial statements and the tax basis of assets and liabilities using enacted tax rates. The impact on deferred assets and liabilities of a change in tax rates is recognized in the period that the rate change is enacted. Valuation allowances are recorded when it is determined that it is more likely than not that a deferred tax asset will not be realized.
Share–Based Compensation— The Company expenses employee share-based payments under the fair value method. Share-based compensation cost is measured at the grant date, based on the fair value of the award, and is recognized as expense over the requisite service period.
Excess tax benefits are generated when employees exercise non-qualified stock options, make disqualifying dispositions of shares acquired through their exercise of incentive stock options and vest in restricted share units.
These excess tax benefits are reported as a financing cash inflow rather than a reduction of taxes paid, which is included within operating cash flows. Accordingly, cash provided by operating activities decreased and cash provided by financing activities increased by $9.6 million in 2015, $7.5 million in 2014 and $11.6 million in 2013 related to excess tax benefits from stock-based awards.
Earnings per Share— Basic earnings per share was computed by dividing net income by weighted average number of common shares outstanding during the period. Diluted earnings per share was computed based on the weighted average outstanding common shares plus equivalent shares assuming exercise of stock options and vesting of RSUs, PRSUs and TRSUs, where dilutive.
Noncontrolling Interests— Noncontrolling interests represent noncontrolling shareholders' share of the equity and after-tax net loss of Leaf until the Company's August 6, 2014 acquisition of Leaf noncontrolling interests.
Noncontrolling shareholders' share of after-tax net loss of Leaf is included in Net income (loss) attributable to noncontrolling interests from continuing operations in the Consolidated Statements of Income as of December 31, 2014 and 2013. On August 6, 2014, the Company entered into a Stock Purchase Agreement with the noncontrolling shareholders of Leaf under which it acquired all shares of Leaf common stock held by the noncontrolling shareholders. Prior to August 6, 2014, the Company owned 66.67% of the outstanding capital stock of Leaf. As a result of this transaction, Leaf became a wholly-owned subsidiary of the Company and there is no noncontrolling interest on the Consolidated Balance Sheet as of December 31, 2014.
Subsequent Events— The Company evaluated subsequent events through the issuance date with respect to the Consolidated Financial Statements as of and for the year ended December 31, 2015.
New Accounting Pronouncements— From time to time, new accounting pronouncements are issued by the Financial Accounting Standards Board (“FASB”) or other standards setting bodies that are adopted by us as of the specified effective date.
73
Heartland Payment Systems, Inc. and Subsidiaries
Notes To Consolidated Financial Statements—(Continued)
In May 2014, the FASB issued guidance on revenue from contracts with customers, which requires an entity to recognize revenue from the transfer of promised goods or services to customers in an amount that reflects the consideration to which the entity expects to be entitled in exchange for those goods or services. The guidance addresses in particular contracts with more than one performance obligation as well as the accounting for some costs to obtain or fulfill a contract with a customer and provides for additional disclosures with respect to revenues and cash flows arising from contracts with customers. Entities can transition to the standard either retrospectively or as a cumulative-effect adjustment as of the date of adoption. On July 9, 2015, the FASB voted to approve a one-year deferral of the effective date. This made the new guidance effective December 15, 2017 for annual reporting periods beginning after that date. The FASB also approved early adoption of the standard, but not before the original effective date which was for reporting periods beginning after December 15, 2016. The Company has not yet selected a transition method and is currently assessing the impact the adoption of this guidance will have on the Company's consolidated financial statements and disclosures.
In April 2015, the FASB issued guidance on debt issuance costs, which requires that debt issuance costs related to a recognized debt liability be presented in the balance sheet as a direct deduction from the carrying amount of the related debt liability instead of being presented as an asset. In August 2015, the FASB issued updated guidance to clarify that an entity may elect to present debt issuance costs related to a line-of-credit arrangement as an asset, regardless of whether or not there are any outstanding borrowings on the line-of-credit arrangement. The new guidance is effective for financial statements issued for fiscal years beginning after December 15, 2015, and interim periods within those fiscal years. Early adoption is permitted for financial statements that have not been previously issued. The new guidance should be applied on a retrospective basis. The effect of this update is still being evaluated and is not expected to have a material effect on the Company’s consolidated financial statements.
In April 2015, the FASB issued guidance that defines specific criteria entities must apply to determine if a cloud computing arrangement includes an in-substance software license. The new guidance clarifies that software licenses included in a cloud computing software should be accounted for in the same manner as other software licenses. This amendment is effective for annual reporting periods, including interim periods within those periods, beginning after December 15, 2015. Early adoption is permitted. The new guidance can be applied on either a prospective or retrospective basis. The effect of this update is still being evaluated and is not expected to have a material effect on the Company’s consolidated financial statements.
In July 2015, the FASB issued guidance to more clearly articulate the requirements for the subsequent measurement of inventory and related disclosures. The new guidance clarifies the basis for measuring inventory at the lower of cost and net realizable value. This amendment is effective for annual reporting periods, including interim periods within those periods, beginning after December 15, 2016. Early adoption is permitted. The new guidance should be applied on a prospective basis. The effect of this update is still being evaluated and is not expected to have a material effect on the Company’s consolidated financial statements.
In September 2015, the FASB issued guidance to simplify the accounting for measurement-period adjustments for business combinations. The new guidance eliminates the requirement to retrospectively account for adjustments made to provisional amounts recognized in a business combination. This amendment is effective for annual reporting periods, including interim periods within those periods, beginning after December 15, 2015. Early adoption is permitted. The new guidance should be applied on a prospective basis. The effect of this update is still being evaluated and is not expected to have a material effect on the Company’s consolidated financial statements.
In November 2015, the FASB issued guidance to simplify the balance sheet classification of deferred taxes. The new guidance requires that deferred tax liabilities and assets be classified as non-current in a classified statement of financial position. This amendment is effective for annual reporting periods, including interim periods within those periods, beginning after December 15, 2016. Early adoption is permitted. The new guidance can be applied on either a prospective or retrospective basis. The Company has elected to early adopt this guidance and apply it on a retrospective basis in the fourth quarter of 2015. As of December 31, 2014, the Company reclassified current deferred tax assets of $9.3 million to non-current liabilities, in order to conform to the current-period presentation.
74
Heartland Payment Systems, Inc. and Subsidiaries
Notes To Consolidated Financial Statements—(Continued)
3. Acquisitions
Campus Solutions
TouchNet Information Systems, Inc.
On September 4, 2014, the Company completed the acquisition of TouchNet, for a cash payment of $375 million, less a net working capital deficit, for all outstanding common shares. The purchase was funded primarily through a new five-year $375 million term loan. See Note 10, Credit Facilities for further details.
The transaction was accounted for under the acquisition method of accounting. Beginning September 4, 2014, TouchNet's results of operations are included in the Company's results of operations. The fair values of the TouchNet assets acquired and liabilities assumed were estimated as of their acquisition date. The excess of the purchase price over the net assets, approximately $221.6 million, was recorded as goodwill, which is deductible for income tax reporting. Acquisition-related costs of approximately $2.3 million for advisory, legal and regulatory costs incurred in connection with the TouchNet acquisition have been expensed in general and administrative expenses.
The following table summarizes the purchase price allocation (in thousands): | |||||
Cash and cash equivalents | $ | 34,576 | |||
Receivables, net | 12,243 | ||||
Inventory | 66 | ||||
Prepaid expenses | 601 | ||||
Property and equipment, net | 3,360 | ||||
Intangible assets, net | 144,400 | ||||
Goodwill | 221,575 | ||||
Total assets acquired | 416,821 | ||||
Accounts payable | 2,236 | ||||
Accrued expenses and other liabilities | 2,896 | ||||
Current portion of unearned revenue | 24,014 | ||||
Current tax liability | 13,914 | ||||
Long-term portion of unearned revenue | 2,037 | ||||
Net assets acquired | $ | 371,724 | |||
The weighted average amortization life for the 2014 acquired finite lived intangible assets related to the acquisition of TouchNet is as follows: | ||||
Weighted average amortization life | ||||
(In years) | ||||
Customer relationships | 20 | |||
Software | 15 | |||
Non-compete agreements | 5 | |||
Trademark | 5 | |||
Overall | 18 | |||
The following pro forma information shows the results of the Company's operations for the year ended December 31, 2014 as if the TouchNet acquisition had occurred on January 1, 2013. The pro forma information is presented for information purposes only and is not necessarily indicative of what would have occurred if the acquisition had been made as of that date. The pro forma information is also not intended to be a projection of future results due to the integration of the acquired business.
Year Ended December 31, | |||||||
2014 | 2013 | ||||||
(In thousands, except share data) | |||||||
Total revenues | $ | 2,363,916 | $ | 2,192,298 | |||
Net income attributable to Heartland | $ | 34,909 | $ | 79,585 | |||
Basic earnings per share | $ | 0.96 | $ | 2.16 | |||
Diluted earnings per share | $ | 0.94 | $ | 2.09 | |||
75
Heartland Payment Systems, Inc. and Subsidiaries
Notes To Consolidated Financial Statements—(Continued)
Heartland School Solutions
MCS Software Corporation
On April 1, 2014, the Company purchased the net assets of MCS Software Corporation ("MCS Software") for a $17.3 million cash payment. The purchase price was financed under an existing credit facility and from operating cash flows.
The transaction was accounted for under the acquisition method of accounting. Beginning April 1, 2014, MCS Software's results of operations are included in the Company's results of operations. The allocation of the total purchase price was as follows: $11.2 million to goodwill, $6.4 million to intangible assets and $0.3 million to net tangible liabilities. Pro forma results of operations have not been presented because the effect of this acquisition was not material. Goodwill is expected to be deductible for income tax reporting.
The weighted average amortization life for the 2014 acquired finite lived intangible assets related to the acquisition of MCS Software is as follows: | |||
Weighted average amortization life | |||
(In years) | |||
Customer relationships | 14 | ||
Non-compete agreement | 5 | ||
Software | 5 | ||
Overall | 11 | ||
Heartland Payroll Solutions
Payroll 1, Inc.
On February 27, 2015, the Company purchased the stock of Payroll 1, Inc. ("Payroll 1") for a $30.0 million cash payment, plus net working capital. The purchase price was financed under the 2014 Revolving Credit Facility.
The transaction was accounted for under the acquisition method of accounting. Beginning February 27, 2015, Payroll 1's results of operations were included in the Company's results of operations. The allocation of the total purchase price was as follows: $20.7 million to goodwill, $14.5 million to intangible assets and $4.4 million to net tangible liabilities. Pro forma results of operations have not been presented because the effect of this acquisition was not material. Goodwill is not expected to be deductible for income tax reporting.
The weighted average amortization life for the 2015 acquired finite lived intangible assets related to the acquisition of Payroll 1 is as follows: | |||
Weighted average amortization life | |||
(In years) | |||
Customer relationships | 13 | ||
Software | 6 | ||
Non-compete agreement | 4 | ||
Overall | 12 | ||
Heartland Commerce
Menusoft Systems Corporation
On October 30, 2015, the Company purchased the stock of Menusoft Systems Corporation (a.k.a. “Digital Dining”) for a $18.7 million cash payment, plus net working capital. The purchase price was funded from a combination of operating cash and financing under the 2014 Revolving Credit Facility.
The transaction was accounted for under the acquisition method of accounting. Beginning on October 30, 2015, Digital Dining's results of operations are included in the Company's results of operations. The allocation of the total purchase price was as follows: $14.7 million to goodwill, $4.7 million to intangible assets, and $0.7 million to net tangible liabilities. The fair values are preliminary, based on estimates, and may be adjusted as the Company analyzes what was known and knowable at the acquisition date, including the finalization of valuations. Pro forma results of operations have not been presented because the effect of this acquisition was not material. Goodwill is not expected to be deductible for income tax reporting.
76
Heartland Payment Systems, Inc. and Subsidiaries
Notes To Consolidated Financial Statements—(Continued)
The weighted average amortization life for the 2015 acquired finite lived intangible assets related to the acquisition of Digital Dining is as follows: | |||
Weighted average amortization life | |||
(In years) | |||
Customer relationships | 19 | ||
Software | 15 | ||
Trademark | 5 | ||
Non-compete agreement | 3 | ||
Overall | 17 | ||
Dinerware, LLC
On February 11, 2015, the Company purchased the stock of Dinerware for a $15.0 million cash payment, plus net working capital. The purchase price was funded from a combination of operating cash and financing under the 2014 Revolving Credit Facility.
The transaction was accounted for under the acquisition method of accounting. Beginning on February 11, 2015, Dinerware's results of operations are included in the Company's results of operations. The allocation of the total purchase price was as follows: $12.8 million to goodwill, $2.6 million to intangible assets, and $0.2 million to net tangible liabilities. The fair values are preliminary, based on estimates, and may be adjusted as the Company analyzes what was known and knowable at the acquisition date, including the finalization of valuations. Pro forma results of operations have not been presented because the effect of this acquisition was not material. Goodwill is not expected to be deductible for income tax reporting.
The weighted average amortization life for the 2015 acquired finite lived intangible assets related to the acquisition of Dinerware is as follows: | |||
Weighted average amortization life | |||
(In years) | |||
Customer relationships | 17 | ||
Software | 5 | ||
Trademark | 5 | ||
Non-compete agreement | 3 | ||
Overall | 13 | ||
pcAmerica, LLC
On January 30, 2015, the Company purchased the assets of Automation, Inc. ("pcAmerica") for a $15.0 million cash payment, plus net working capital. The cash purchase price was funded from a combination of operating cash and financing under the 2014 Revolving Credit Facility.
The transaction was accounted for under the acquisition method of accounting. Beginning on January 30, 2015, pcAmerica's results of operations are included in the Company's results of operations. The allocation of the total purchase price was as follows: $14.9 million to goodwill, $1.5 million to intangible assets, and $1.3 million to net tangible liabilities. The fair values are preliminary, based on estimates, and may be adjusted as the Company analyzes what was known and knowable at the acquisition date, including the finalization of valuations. Pro forma results of operations have not been presented because the effect of this acquisition was not material. Goodwill is expected to be deductible for income tax reporting.
The weighted average amortization life for the 2015 acquired finite lived intangible assets related to the acquisition of pcAmerica is as follows: | |||
Weighted average amortization life | |||
(In years) | |||
Customer relationships | 20 | ||
Software | 5 | ||
Trademark | 5 | ||
Non-compete agreement | 5 | ||
Overall | 14 | ||
77
Heartland Payment Systems, Inc. and Subsidiaries
Notes To Consolidated Financial Statements—(Continued)
Xpient Solutions, LLC
On October 31, 2014, the Company acquired the net assets of Xpient Solutions, LLC (“Xpient”) for a cash payment of $30.0 million, plus net working capital. The purchase price was funded from a combination of operating cash and financing under the 2014 Revolving Credit Facility.
The transaction was accounted for under the acquisition method of accounting. Beginning October 31, 2014, Xpient's results of operations are included in the Company's results of operations. The allocation of the total purchase price was as follows: $21.5 million to goodwill, $9.5 million to intangible assets and $3.0 million to net tangible assets. Pro forma results of operations have not been presented because the effect of this acquisition was not material. Goodwill is expected to be deductible for income tax reporting.
The weighted average amortization life for the 2014 acquired finite lived intangible assets related to the acquisition of Xpient is as follows: | |||
Weighted average amortization life | |||
(In years) | |||
Customer relationships | 21 | ||
Software | 10 | ||
Trademark | 5 | ||
Non-compete agreement | 3 | ||
Overall | 14 | ||
Liquor Point of Sale
On February 14, 2014, the Company purchased the assets of Merchant Software Corporation (referred to as
"Liquor POS") for a $3.3 million cash payment. The purchase price was funded from operating cash flows.
The transaction was accounted for under the acquisition method of accounting. Beginning on February 15, 2014, Liquor POS's results of operations are included in the Company's results of operations. The allocation of the total purchase price was as follows: $2.2 million to goodwill, $1.2 million to intangible assets, and $0.1 million to net tangible liabilities. Pro forma results of operations have not been presented because the effect of this acquisition was not material. Goodwill is expected to be deductible for income tax reporting.
The weighted average amortization life for the 2014 acquired finite lived intangible assets related to the acquisition of Liquor POS is as follows: | |||
Weighted average amortization life | |||
(In years) | |||
Customer relationships | 10 | ||
Software | 7 | ||
Non-compete agreement | 5 | ||
Patents | 5 | ||
Overall | 9 | ||
Leaf Holdings, Inc.
On September 11, 2013, the Company purchased 66.67% of the outstanding capital stock of Leaf for a $14.5 million cash payment. The purchase price was financed from operating cash flows.
The transaction was accounted for under the acquisition method of accounting. Beginning on September 11, 2013, Leaf's results of operations are included in the Company's results of operations. The allocation of the total purchase price was as follows: $18.5 million to goodwill, $6.9 million to intangible assets, $4.1 million to net tangible liabilities and $6.8 million to noncontrolling interest. Pro forma results of operations have not been presented because the effect of this acquisition was not material. Goodwill is not expected to be deductible for income tax reporting. See Note 2, Summary of Significant Accounting Policies — Goodwill, for details on the Leaf goodwill and intangible asset impairment in 2014.
On August 6, 2014, the Company entered into a Stock Purchase Agreement with the noncontrolling shareholders of Leaf under which it acquired all shares of Leaf common stock held by the noncontrolling shareholders. As a result of this transaction, Leaf became a wholly-owned subsidiary of the Company. The Company accounted for this transaction as additional paid-in capital on the Consolidated Balance Sheet.
78
Heartland Payment Systems, Inc. and Subsidiaries
Notes To Consolidated Financial Statements—(Continued)
4. Receivables
A summary of receivables by major class was as follows at December 31, 2015 and 2014: | ||||||||
December 31, | ||||||||
2015 | 2014 | |||||||
(In thousands) | ||||||||
Accounts receivable from merchants and customers | $ | 224,222 | $ | 200,912 | ||||
Accounts receivable from bankcard networks | 37,621 | 31,279 | ||||||
Accounts receivable from others | 7,155 | 3,465 | ||||||
268,998 | 235,656 | |||||||
Less allowance for doubtful accounts | (1,706 | ) | (1,552 | ) | ||||
Total receivables, net | $ | 267,292 | $ | 234,104 | ||||
Included in accounts receivable from others are amounts due from employees (predominantly salespersons), which are $3.5 million and $1.6 million at December 31, 2015 and 2014, respectively. Accounts receivable related to bankcard networks are primarily amounts due from Discover and American Express for bankcard transactions.
A summary of the activity in the allowance for doubtful accounts for the three years ended December 31, | ||||||||||||||
2015, 2014 and 2013 was as follows: | ||||||||||||||
Year Ended December 31, | ||||||||||||||
2015 | 2014 | 2013 | ||||||||||||
(In thousands) | ||||||||||||||
Beginning balance | $ | 1,552 | $ | 1,032 | $ | 1,438 | ||||||||
Out-of-Period adjustment (a) | — | 875 | — | |||||||||||
Additions to allowance | 6,155 | 2,405 | 180 | |||||||||||
Charges against allowance | (6,064 | ) | (3,426 | ) | (586 | ) | ||||||||
Additions for acquisitions (b) | 63 | 666 | — | |||||||||||
Ending balance | $ | 1,706 | $ | 1,552 | $ | 1,032 | ||||||||
(a) See Note 1, Organization and Operations for a discussion of the Out-of-Period Adjustment.
(b) Consists of allowances of businesses acquired during the years ended December 31, 2015 and 2014.
5. Funds Held for Customers
A summary of funds held for customers and investments, including the amortized cost, gross unrealized gains (losses) and estimated fair value for investments held to maturity and investments available-for-sale by major security type and class of security were as follows at December 31, 2015 and 2014:
Cost | Gross Unrealized Gains | Gross Unrealized Losses | Estimated Fair Value | ||||||||||||
(In thousands) | |||||||||||||||
December 31, 2015 | |||||||||||||||
Funds held for customers: | |||||||||||||||
Conservative income bond fund - available for sale | $ | 13,012 | $ | — | $ | (42 | ) | $ | 12,970 | ||||||
Fixed income - municipal bonds - available for sale | 13,893 | 18 | (25 | ) | 13,886 | ||||||||||
Cash and cash equivalents held for customers | 201,378 | — | — | 201,378 | |||||||||||
Total funds held for customers | $ | 228,283 | $ | 18 | $ | (67 | ) | $ | 228,234 | ||||||
79
Heartland Payment Systems, Inc. and Subsidiaries
Notes To Consolidated Financial Statements—(Continued)
Cost | Gross Unrealized Gains | Gross Unrealized Losses | Estimated Fair Value | ||||||||||||
(In thousands) | |||||||||||||||
December 31, 2014 | |||||||||||||||
Funds held for customers: | |||||||||||||||
Conservative income bond fund - available for sale | $ | 13,012 | $ | — | $ | (16 | ) | $ | 12,996 | ||||||
Fixed income - municipal bonds - available for sale | 14,688 | 2 | (51 | ) | 14,639 | ||||||||||
Cash and cash equivalents held for customers | 148,857 | — | — | 148,857 | |||||||||||
Total funds held for customers | $ | 176,557 | $ | 2 | $ | (67 | ) | $ | 176,492 | ||||||
Expected maturities of the Fixed income -municipal bonds at December 31, 2015 are as follows:
Total | Less Than 1 Year | 1 To 5 Years | 5 To 10 Years | ||||||||||||
(In thousands) | |||||||||||||||
December 31, 2015 | |||||||||||||||
Funds Held for Customers: | |||||||||||||||
Fixed income - municipal bonds - available for sale cost | $ | 13,893 | $ | 2,153 | $ | 11,740 | $ | — | |||||||
Fixed income - municipal bonds - available for sale estimated fair value | $ | 13,886 | $ | 2,154 | $ | 11,732 | $ | — | |||||||
During the fourth quarter of 2014, the Company reviewed its investment in the stock of TabbedOut and estimated that the fair value of its investment in TabbedOut was substantially impaired, and therefore, an impairment charge of $4.0 million was recorded as of December 31, 2014 and included in "Other, net" in the Consolidated Statements of Income. Besides this impairment charge, the Company did not experience any other-than-temporary losses on its other investments during the twelve months ended December 31, 2015 and 2014.
During the twelve months ended December 31, 2014, the Company sold available for sale securities for $25.2 million and realized a gain on this sale of $0.3 million which was recognized in the Consolidated Statements of Income.
6. Capitalized Customer Acquisition Costs, Net
A summary of net capitalized customer acquisition costs as of December 31, 2015 and 2014 was as follows: | |||||||||
December 31, | |||||||||
2015 | 2014 | ||||||||
(In thousands) | |||||||||
Capitalized signing bonuses | $ | 118,816 | $ | 98,879 | |||||
Less accumulated amortization | (54,539 | ) | (47,238 | ) | |||||
64,277 | 51,641 | ||||||||
Capitalized customer deferred acquisition costs | 64,310 | 54,583 | |||||||
Less accumulated amortization | (39,592 | ) | (33,117 | ) | |||||
24,718 | 21,466 | ||||||||
Capitalized customer acquisition costs, net | $ | 88,995 | $ | 73,107 | |||||
80
Heartland Payment Systems, Inc. and Subsidiaries
Notes To Consolidated Financial Statements—(Continued)
A summary of net capitalized customer acquisition costs for the three years ended December 31, 2015, | |||||||||||||
2014 and 2013 was as follows: | |||||||||||||
Year Ended December 31, | |||||||||||||
2015 | 2014 | 2013 | |||||||||||
(In thousands) | |||||||||||||
Balance at beginning of period | $ | 73,107 | $ | 61,027 | $ | 56,425 | |||||||
Plus additions to: | |||||||||||||
Capitalized signing bonuses, net | 48,289 | 38,875 | 29,091 | ||||||||||
Capitalized customer deferred acquisition costs | 28,562 | 24,831 | 21,159 | ||||||||||
76,851 | 63,706 | 50,250 | |||||||||||
Less amortization expense on: | |||||||||||||
Capitalized signing bonuses, net | (35,653 | ) | (30,345 | ) | (27,767 | ) | |||||||
Capitalized customer deferred acquisition costs (a) | (25,310 | ) | (21,281 | ) | (17,881 | ) | |||||||
(60,963 | ) | (51,626 | ) | (45,648 | ) | ||||||||
Balance at end of period | $ | 88,995 | $ | 73,107 | $ | 61,027 | |||||||
(a) Includes $0.2 million net charge for the year ended December 31, 2015 related to the sale of SmartLink included in "Gain on sale of assets" in the Consolidated Statements of Income.
Net signing bonus adjustments from estimated amounts to actual were $(5.1) million, $(4.0) million, and $(3.7) million, respectively, for the years ended December 31, 2015, 2014 and 2013. Net signing bonus adjustments are netted against additions in the table above. Negative signing bonus adjustments occur when the actual gross margin generated by the merchant contract during the first year is less than the estimated gross margin for that year, resulting in the overpayment of the up-front signing bonus and would be recovered from the relevant salesperson. Positive signing bonus adjustments result from the prior underpayment of signing bonuses and would be paid to the relevant salesperson.
Fully amortized signing bonuses of $28.0 million, $26.7 million and $27.8 million, respectively, were written off during the three years ended December 31, 2015, 2014, and 2013. In addition, fully amortized customer deferred acquisition costs of $18.8 million, $15.5 million and $13.7 million, respectively, were written off during the three years ended December 31, 2015, 2014 and 2013.
The Company believes that no impairment of capitalized customer acquisition costs has occurred as of December 31, 2015, 2014 and 2013.
7. Property and Equipment, Net
A summary of property and equipment, net as of December 31, 2015 and 2014 is as follows: | ||||||||
December 31, | ||||||||
2015 | 2014 | |||||||
(In thousands) | ||||||||
Computer hardware and software | $ | 225,988 | $ | 196,170 | ||||
Building | 55,095 | 54,998 | ||||||
Furniture, fixtures and equipment | 23,836 | 18,895 | ||||||
Leasehold improvements | 17,360 | 11,966 | ||||||
Land | 7,523 | 7,471 | ||||||
329,802 | 289,500 | |||||||
Less accumulated depreciation | (163,110 | ) | (135,197 | ) | ||||
$ | 166,692 | $ | 154,303 | |||||
Depreciation expense for the three years ended December 31, 2015, 2014 and 2013 was $43.4 million, $36.4 million and $30.1 million, respectively.
Total cost of assets not yet placed into service included in property and equipment at December 31, 2015 and 2014 were $20.6 million and $25.8 million, respectively. During the years ended December 31, 2015, 2014, and 2013 the amount of capitalized costs for internally developed projects amounted to $36.9 million, $40.3 million, and $38.4 million, respectively. During the years ended December 31, 2015, 2014, and 2013, the amounts of capitalized costs for internally developed projects placed in service were $39.7 million, $36.5 million, and $25.7 million, respectively.
81
Heartland Payment Systems, Inc. and Subsidiaries
Notes To Consolidated Financial Statements—(Continued)
As of December 31, 2015 and 2014 there were $61.3 million and $53.0 million, respectively, of net capitalized costs for internally developed projects placed into service.
The estimated depreciation expense related to capitalized costs for internally developed projects placed in service for the next five years is as follows: | |||||
For the Years Ended December 31, | |||||
(In thousands) | |||||
2016 | $ | 30,297 | |||
2017 | 19,853 | ||||
2018 | 8,314 | ||||
2019 | 1,602 | ||||
2020 | 894 | ||||
Thereafter | 296 | ||||
$ | 61,256 | ||||
8. Intangible Assets and Goodwill
Intangible Assets — Intangible assets consisted of the following as of December 31, 2015 and 2014: | |||||||||||||
December 31, 2015 | Amortization Life and Method | ||||||||||||
Gross Assets | Accumulated Amortization | Net Asset | |||||||||||
(In thousands) | |||||||||||||
Finite Lived Assets: | |||||||||||||
Customer relationships | $ | 179,178 | $ | 33,896 | $ | 145,282 | 5 to 21 years—proportional cash flow | ||||||
Merchant portfolios | 4,214 | 3,545 | 669 | 7 years—proportional cash flow | |||||||||
Software | 52,111 | 7,737 | 44,374 | 3 to 15 years—straight line | |||||||||
Non-compete agreements | 4,776 | 2,549 | 2,227 | 3 to 5 years—straight line | |||||||||
Other | 6,286 | 1,615 | 4,671 | 5 to 9 years—straight line | |||||||||
$ | 246,565 | $ | 49,342 | $ | 197,223 | ||||||||
December 31, 2014 | Amortization Life and Method | ||||||||||||
Gross Assets | Accumulated Amortization | Net Asset | |||||||||||
(In thousands) | |||||||||||||
Finite Lived Assets: | |||||||||||||
Customer relationships | $ | 159,925 | $ | 22,011 | $ | 137,914 | 6 to 21 years—proportional cash flow | ||||||
Merchant portfolios | 4,214 | 3,161 | 1,053 | 7 years—proportional cash flow | |||||||||
Software | 58,377 | 13,300 | 45,077 | 1 to 15 years—straight line | |||||||||
Non-compete agreements | 5,947 | 2,830 | 3,117 | 5 years—straight line | |||||||||
Other | 5,800 | 408 | 5,392 | 5 to 9 years—straight line | |||||||||
$ | 234,263 | $ | 41,710 | $ | 192,553 | ||||||||
Amortization expense related to the intangible assets was $20.1 million, $13.3 million and $9.0 million for the years ended December 31, 2015, 2014 and 2013, respectively.
The estimated amortization expense related to intangible assets for the next five years is as follows: | |||||
For the Years Ended December 31, | |||||
(In thousands) | |||||
2016 | $ | 19,323 | |||
2017 | 17,786 | ||||
2018 | 15,975 | ||||
2019 | 14,528 | ||||
2020 | 12,715 | ||||
Thereafter | 116,896 | ||||
$ | 197,223 | ||||
82
Heartland Payment Systems, Inc. and Subsidiaries
Notes To Consolidated Financial Statements—(Continued)
Goodwill — The changes in the carrying amount of goodwill by segment for the years ended December 31, 2015, | ||||||||||||||||||||||||||||
2014 and 2013 were as follows: | ||||||||||||||||||||||||||||
Payment Processing | Campus Solutions | Heartland School Solutions | Heartland Payroll Solutions | Leaf | Other (c) | Total | ||||||||||||||||||||||
Balance at January 1, 2013 | $ | 43,701 | $ | 33,679 | $ | 53,350 | $ | 30,831 | $ | — | $ | 6,501 | $ | 168,062 | ||||||||||||||
Goodwill acquired during the period | — | — | — | — | 20,619 | — | 20,619 | |||||||||||||||||||||
Other (a) | — | 2,110 | — | 187 | — | — | 2,297 | |||||||||||||||||||||
Balance at December 31, 2013 | 43,701 | 35,789 | 53,350 | 31,018 | 20,619 | 6,501 | 190,978 | |||||||||||||||||||||
Goodwill acquired during the period | — | 222,076 | 13,592 | — | — | 22,633 | 258,301 | |||||||||||||||||||||
Goodwill impairment (b) | — | — | — | — | (18,490 | ) | — | (18,490 | ) | |||||||||||||||||||
Other (a) | — | (528 | ) | (2,420 | ) | — | (2,129 | ) | — | (5,077 | ) | |||||||||||||||||
Balance at December 31, 2014 | 43,701 | 257,337 | 64,522 | 31,018 | — | 29,134 | 425,712 | |||||||||||||||||||||
Goodwill acquired during the period | — | — | — | 21,915 | — | 42,659 | 64,574 | |||||||||||||||||||||
Other (a) | — | 26 | — | (1,180 | ) | 888 | (266 | ) | ||||||||||||||||||||
Balance at December 31, 2015 | $ | 43,701 | $ | 257,363 | $ | 64,522 | $ | 51,753 | $ | — | $ | 72,681 | $ | 490,020 | ||||||||||||||
(a) Reflects adjustments to preliminary allocations of purchase price within the measurement period.
(b) See Note 2, Summary of Significant Accounting Policies — Goodwill, for a discussion of Goodwill and Asset Impairments.
(c) Other includes Micropayments, Heartland Commerce and Heartland Marketing Solutions.
The percentage of total reportable segments' assets comprised of goodwill as of December 31, 2015, 2014, and 2013 are as follows: | |||||||
Percent of Goodwill to Reportable Segments' Total Assets | |||||||
2015 | 2014 | 2013 | |||||
Payment Processing | 7.4% | 8.3% | 8.4% | ||||
Campus Solutions | 54.2% | 50.8% | 43.8% | ||||
Heartland School Solutions | 81.1% | 76.3% | 67.9% | ||||
Heartland Payroll Solutions | 18.4% | 15.9% | 20.1% | ||||
Leaf | —% | —% | 52.3% | ||||
Other | 64.2% | 46.7% | 37.7% | ||||
9. Processing Liabilities
Processing liabilities result primarily from the Company's card processing activities and include merchant deposits maintained to offset potential liabilities arising from merchant chargebacks. A summary of processing liabilities and loss reserves was as follows at December 31, 2015 and 2014:
December 31, | |||||||
2015 | 2014 | ||||||
(In thousands) | |||||||
Merchant bankcard processing | $ | 144,095 | $ | 109,361 | |||
Merchant deposits | 7,088 | 6,655 | |||||
Loss reserves | 1,005 | 3,382 | |||||
$ | 152,188 | $ | 119,398 | ||||
The Company's merchants have the liability for any charges properly reversed by the cardholder through a mechanism known as a chargeback. If the merchant is unable to pay this amount, the Company will be liable to the card brand networks for the reversed charges. The Company has determined that the fair value of its obligation to stand ready to perform is minimal. The Company requires personal guarantees and merchant deposits from certain merchants to minimize its obligation.
The card brand networks generally allow chargebacks within four months after the later of (1) the date the transaction is processed, or (2) the delivery of the product or service to the cardholder. As the majority of the Company's SME merchant transactions involve the delivery of the product or service at the time of the transaction, a reasonable basis for determining an estimate of the Company's exposure to chargebacks is the last four months' processing volume on the SME portfolio, which was $31.8 billion and $27.8 billion for the four months ended December 31, 2015 and 2014, respectively. However, for the
83
Heartland Payment Systems, Inc. and Subsidiaries
Notes To Consolidated Financial Statements—(Continued)
four months ended December 31, 2015, 2014 and 2013 the Company was presented with $18.0 million, $16.0 million and $11.7 million, respectively, in chargebacks by issuing banks. In the years ended December 31, 2015, 2014, and 2013 the Company incurred merchant losses of $2.9 million, $7.3 million and $3.1 million, respectively, or 0.31 basis points, 0.90 basis points and 0.41 basis points, respectively, on total SME card processing volumes processed of $93.1 billion, $81.1 billion and $74.6 billion, respectively. In 2014, the Company's losses included $4.6 million resulting from chargebacks from a single merchant who entered bankruptcy in the fourth quarter. These losses are included in processing and servicing costs in the Company's Consolidated Statements of Income.
The loss recorded by the Company for chargebacks associated with any individual merchant is typically small, due both to the relatively small size and the processing profile of the Company's SME merchants. However, from time to time the Company will encounter instances of merchant fraud, and the resulting chargeback losses may be considerably more significant to the Company. The Company has established a contingent reserve for estimated currently existing credit and fraud losses on its Consolidated Balance Sheets, amounting to $1.0 million at December 31, 2015 and $3.4 million at December 31, 2014. This reserve is determined by performing an analysis of the Company's historical loss experience applied to current processing volumes and exposures.
A summary of the activity in the loss reserve for the years ended December 31, 2015, 2014, and 2013 was as follows: | ||||||||||||
Year Ended December 31, | ||||||||||||
2015 | 2014 | 2013 | ||||||||||
(In thousands) | ||||||||||||
Beginning balance | $ | 3,382 | $ | 1,505 | 1,955 | |||||||
Additions to reserve | 2,852 | 9,650 | 2,738 | |||||||||
Charges against reserve (a) | (5,229 | ) | (7,773 | ) | (3,188 | ) | ||||||
Ending balance | $ | 1,005 | $ | 3,382 | 1,505 | |||||||
(a) | Includes $4.6 million of merchant losses as a result of chargebacks from a single merchant who entered bankruptcy in the fourth quarter of 2014 |
Chargeback losses originating from Network Services' bankcard processing on Passport during the years ended December 31, 2015, 2014 and 2013 were immaterial.
10. Credit Facilities
On September 4, 2014, the Company entered into an amended and restated senior secured credit facility (the "2014 Credit Agreement") with Bank of America, N.A., as administrative agent, and certain lenders who are a party to the 2014 Credit Agreement. This 2014 Credit Agreement replaces the Company's October 2013 Credit Agreement (the "2013 Credit Agreement”). Credit extended under the 2014 Credit Agreement is guaranteed by the Company's subsidiaries and is secured by substantially all of the Company's assets and the assets of the Company's subsidiaries.
The 2014 Credit Agreement provides for a revolving credit facility in the aggregate amount of up to $400 million (the “2014 Revolving Credit Facility”) and a term loan in an aggregate principal amount of $375 million (the “2014 Term Credit Facility”). The 2014 Revolving Credit Facility includes up to $35 million that may be used for the issuance of letters of credit and up to $35 million that is available for swing line loans. All principal and interest not previously paid on the 2014 Revolving Credit Facility will mature and be due and payable on September 4, 2019. The 2014 Term Credit Facility amortizes on a quarterly basis as follows, with the remaining principal balance due on September 4, 2019: (i) 5% of the initial 2014 Term Credit Facility to be payable in each of the first three years, (ii) 7.5% of the initial 2014 Term Credit Facility to be payable in the fourth year and (iii) 10% of the initial 2014 Term Credit Facility to be payable in the fifth year. The 2014 Term Credit Facility is also subject to mandatory prepayment from the net cash proceeds of certain asset dispositions, casualty or condemnation events, issuance of indebtedness and extraordinary receipts. Subject to the terms and conditions of the 2014 Credit Agreement, without the consent of the then existing lenders (but subject to the receipt of commitments), the 2014 Revolving Credit Facility may be increased and new incremental term loans may be issued in an aggregate principal amount of up to $150 million for all such increases under the 2014 Revolving Credit Facility and new term loans, subject to certain minimum threshold amounts.
On September 4, 2014, the Company borrowed $375 million under the 2014 Term Credit Facility and used that amount to fund the TouchNet Acquisition (See Note 3, Acquisitions). At December 31, 2015, the Company had $352 million outstanding under the 2014 Term Credit Facility.
84
Heartland Payment Systems, Inc. and Subsidiaries
Notes To Consolidated Financial Statements—(Continued)
The 2014 Credit Agreement contains covenants which include: maintenance of certain leverage and fixed charge coverage ratios; limitations on the Company's indebtedness, liens on the Company's properties and assets, investments in, and loans to other business units, the Company's ability to enter into business combinations and asset sales; and certain other financial and non-financial covenants. These covenants also apply to certain Company subsidiaries. The Company was in compliance with these covenants as of December 31, 2015 and 2014, respectively.
The Company had $130.0 million and $189.5 million outstanding debt under its 2014 Revolving Credit Facility as of December 31, 2015 and 2014, respectively.
Under the terms of the 2014 Credit Agreement, the Company may borrow, at its option, at interest rates equal to one, two, three or six month adjusted LIBOR rates, or equal to the greater of the prime rate, the federal funds rate plus 0.50% and the adjusted LIBOR rate plus 1%, in each case plus a margin determined by the Company's current leverage ratio.
The weighted average interest rate at December 31, 2015 was 2.5%. Total fees and direct costs paid for the Company's credit facilities as of December 31, 2015 were $4.6 million, including $3.5 million paid on September 4, 2014. These costs are being amortized to interest expense over the life of the Credit Agreement.
11. Accrued Buyout Liability
A summary of the accrued buyout liability was as follows as of December 31, 2015 and 2014: | |||||||||
December 31, | |||||||||
2015 | 2014 | ||||||||
(In thousands) | |||||||||
Vested Relationship Managers and sales managers | $ | 58,131 | $ | 46,301 | |||||
Unvested Relationship Managers and sales managers | 1,718 | 1,692 | |||||||
59,849 | 47,993 | ||||||||
Less current portion | (18,549 | ) | (15,023 | ) | |||||
Long-term portion of accrued buyout liability | $ | 41,300 | $ | 32,970 | |||||
In calculating the accrued buyout liability for unvested Relationship Managers and sales managers, the Company has assumed that 31% of the unvested Relationship Managers and sales managers will vest in the future, which represents the Company’s historical vesting rate. A 5% increase to 36% in the expected vesting rate would have increased the accrued buyout liability for unvested Relationship Managers and sales managers by $0.3 million and $0.2 million at December 31, 2015 and 2014, respectively.
A summary of the activity in the accrued buyout liability for the three years ended December 31, 2015, 2014, and | |||||||||||||
2013 was as follows: | |||||||||||||
Year Ended December 31, | |||||||||||||
2015 | 2014 | 2013 | |||||||||||
(In thousands) | |||||||||||||
Beginning balance | $ | 47,993 | $ | 39,379 | $ | 35,410 | |||||||
Increase in settlement obligation, net | 27,264 | 20,182 | 17,620 | ||||||||||
Buyouts | (15,408 | ) | (11,568 | ) | (13,651 | ) | |||||||
Ending balance | $ | 59,849 | $ | 47,993 | $ | 39,379 | |||||||
The Company buys out portfolio equity regularly. During the years ended 2015, 2014 and 2013, the Company made total buyout payments of approximately $15.4 million, $11.6 million and $13.7 million, respectively. Residual commission expense is recorded in Processing and servicing costs on the Consolidated Statement of Income. The amount of future annual reductions in residual commission expense will be impacted by any additional portfolio equity buyouts and merchant attrition. Partially offsetting the impact of these buyouts are increases in the settlement obligation due to new SME merchant account signings, as adjusted for changes in same-store sales growth, changes in gross margin for existing merchant relationships and the impact of SME merchant attrition.
12. Stockholders' Equity
Common Stock Repurchases.
Open Repurchase Authorization. On May 8, 2014, the Company's Board of Directors authorized the repurchase of up to $75 million of the Company's outstanding common stock. As of December 31, 2015, the Company has not repurchased any shares under the May 8, 2014 authorization.
Completed Repurchase Authorizations. On November 2, 2012, the Company's Board of Directors authorized the repurchase of up to $50 million of the Company's outstanding common stock. Repurchases under the November 2, 2012 authorization were completed during the second quarter of 2013. On May 8, 2013, the Company's Board of Directors authorized the repurchase of up to $75 million of the Company's outstanding common stock. These repurchases were completed during the second quarter of 2014.
Repurchases under these programs were made through the open market in accordance with applicable laws and regulations. The Company intends to fund any repurchases with cash flow from operations, existing cash on the balance sheet, and other sources including the Company's 2014 Revolving Credit Facility (as defined in Note 10 herein). The manner, timing and amount of repurchases, if any, will be determined by management and will depend on a variety of factors, including price, corporate and regulatory requirements, market conditions and other corporation liquidity requirements. The repurchase program may be modified or discontinued at any time. Under the Merger Agreement, repurchase activity after December 15, 2015 is limited to repurchases made to satisfy tax withholding amounts arising from stock option exercises or vesting of restricted shares. See Note 1. Organization and Operation - Agreement and Plan of Merger for more detail regarding this transaction.
A summary of repurchase activity under these authorizations is as follows:
Repurchase Programs by Authorization Date | |||||||||||
November 2012 | May 2013 | May 2014 | Total | ||||||||
Activity For the Year ended December 31, 2015 | |||||||||||
Shares repurchased | — | — | — | — | |||||||
Cost of shares repurchased (in thousands) | — | — | — | — | |||||||
Average cost per share | — | — | — | — | |||||||
Remaining authorization (in thousands) | — | — | $75,000 | $75,000 | |||||||
Activity For the Year ended December 31, 2014 | |||||||||||
Shares repurchased | — | 1,347,817 | — | 1,347,817 | |||||||
Cost of shares repurchased (in thousands) | — | $54,455 | — | $54,455 | |||||||
Average cost per share | — | $40.40 | — | $40.40 | |||||||
Activity For the Year ended December 31, 2013 | |||||||||||
Shares repurchased | 952,183 | 534,600 | — | 1,486,783 | |||||||
Cost of shares repurchased (in thousands) | $29,813 | $20,488 | — | $50,301 | |||||||
Average cost per share | $31.31 | $38.32 | — | $33.83 | |||||||
The Company's Board of Directors previously resolved to retire all common shares repurchased and include the retired shares in the authorized and unissued shares of the Company. At the time of share retirement, the excess of the purchase price of the treasury stock over the stated value is allocated between additional paid-in-capital and retained earnings. It is expected that future retirements of common shares repurchased will be recorded as repurchase authorizations are completed.
Dividends on Common Stock. During the years ended 2015, 2014 and 2013, the Company's Board of Directors declared dividends of $0.40, $0.34 and $0.28 per share of common stock, respectively. During the years ended 2015, 2014 and 2013, the Company paid cash dividends of $14.7 million, $12.3 million and $10.3 million, respectively.
On February 2, 2016, the Company's Board of Directors declared a quarterly cash dividend of $0.10 per share of common stock, payable on March 15, 2016 to stockholders of record as of March 1, 2016.
85
Heartland Payment Systems, Inc. and Subsidiaries
Notes To Consolidated Financial Statements—(Continued)
13. Income Taxes
The provision for income taxes for the three years ended December 31, 2015, 2014, and 2013 consists of the | |||||||||||||
following: | |||||||||||||
Year Ended December 31, | |||||||||||||
2015 | 2014 | 2013 | |||||||||||
Continuing Operations: | (in thousands) | ||||||||||||
Current: | |||||||||||||
Federal | $ | 40,260 | $ | 31,240 | $ | 31,326 | |||||||
State | 4,663 | 3,174 | 4,810 | ||||||||||
Deferred: | |||||||||||||
Federal | 6,540 | 5,733 | 8,766 | ||||||||||
State | 1,880 | 1,729 | 1,548 | ||||||||||
Total provision for income taxes from continuing operations | $ | 53,343 | $ | 41,876 | $ | 46,450 | |||||||
The differences in federal income taxes provided from continuing operations and the amounts determined by applying the federal statutory tax rate of 35% to income before income taxes for the three years ended December 31, 2015, 2014, and 2013 are:
Year Ended December 31, | ||||||||||||||||||||
2015 | 2014 | 2013 | ||||||||||||||||||
% | Amount | % | Amount | % | Amount | |||||||||||||||
(In thousands) | (In thousands) | (In thousands) | ||||||||||||||||||
U.S. federal income tax at statutory rate | 35.00 | % | $ | 48,326 | 35.00 | % | $ | 25,811 | 35.00 | % | $ | 42,193 | ||||||||
U.S. state and local income taxes, net | 3.48 | % | 4,802 | 4.21 | % | 3,103 | 3.26 | % | 3,932 | |||||||||||
Valuation allowance | (1.07 | )% | (1,484 | ) | 9.85 | % | 7,265 | 0.60 | % | 724 | ||||||||||
Goodwill impairment | — | % | — | 8.78 | % | 6,471 | — | % | — | |||||||||||
Nondeductible expenses | 1.50 | % | 2,081 | 0.82 | % | 609 | 0.52 | % | 621 | |||||||||||
U.S. tax on foreign income, net | — | % | — | 0.15 | % | 113 | — | % | — | |||||||||||
Other | (0.28 | )% | (382 | ) | (0.05 | )% | (33 | ) | 0.34 | % | 415 | |||||||||
Research and development credit, net | — | % | — | (0.28 | )% | (209 | ) | (1.19 | ) | (1,435 | ) | |||||||||
Release of earn-out liability | — | % | — | (1.70 | )% | (1,254 | ) | — | % | — | ||||||||||
Provision for income taxes from continuing operations | 38.63 | % | $ | 53,343 | 56.78 | % | $ | 41,876 | 38.53 | % | $ | 46,450 | ||||||||
On January 2, 2013, the American Taxpayer Relief Act of 2012 ("ATR Act") was enacted which included an extension of the federal research and development credit retroactively to 2012 and prospectively for 2013. The effect of the research and development credit for 2012 is being reflected in 2013 in conjunction with the filing of the Company’s 2012 tax return. The effect of the estimated research and development credit for 2013 is also reflected in 2013. On December 19, 2014, the Tax Increase Prevention Act of 2014 was enacted which included an extension of the federal research and development credit retroactively for one year and is reflected in 2014.
The Company recorded a liability of approximately $6.6 million, $7.3 million and $5.6 million for total gross unrecognized tax benefits of which approximately $4.5 million, $4.9 million and $3.8 million as of December 31, 2015, 2014 and 2013, respectively, would impact the effective tax rate. The Company does not expect any significant changes
within the next twelve months in its unrecognized tax benefits.
A reconciliation of the beginning and ending amount of unrecognized tax benefits for the years ended December 31, 2015, 2014, and 2013 is as follows:
Year Ended December 31, | |||||||||||
2015 | 2014 | 2013 | |||||||||
(In thousands) | |||||||||||
Balance at January 1, | $ | 7,315 | $ | 5,633 | $ | 3,069 | |||||
Additions based on tax positions related to the current year | 476 | 1,693 | 2,681 | ||||||||
Lapse of statute of limitations | (925 | ) | (11 | ) | (117 | ) | |||||
Settlements | (267 | ) | — | — | |||||||
Balance at December 31, | $ | 6,599 | $ | 7,315 | $ | 5,633 | |||||
86
Heartland Payment Systems, Inc. and Subsidiaries
Notes To Consolidated Financial Statements—(Continued)
The Company accrues interest related to uncertain tax positions in interest expense and accrues penalties in general and administrative expense. At December 31, 2015, 2014 and 2013, the Company had an accrued interest liability on uncertain tax positions of approximately $0.8 million, $0.7 million, and $0.4 million, respectively. During 2015, 2014 and 2013, the Company recognized approximately $0.2 million in each year, respectively, of interest expense related to uncertain tax positions. The Company does not expect to be assessed any penalties on its uncertain tax positions.
The tax years ended December 31, 2012, 2013 and 2014 remain subject to examination by the U.S. Internal Revenue Service and the Company is no longer subject to state income tax examinations prior to 2010. The State of California has finalized our Protest of Proposed Assessments for the years 2004 to 2008 and we have received revised assessments which are acceptable as a resolution of this examination. The Company is currently under examination in Connecticut, New York, and Minnesota and does not expect that its state liability will significantly increase or decrease during the next twelve months. The Company files income tax returns in all states where required.
During 2015 and 2014, the Company recorded current tax assets reflecting excess tax benefits of $9.6 million and $7.5 million, respectively, resulting from employees exercising non-qualified stock options, making disqualifying dispositions of shares acquired through their exercise of incentive stock options, and vesting of restricted share units. The Company classified the $9.6 million and $7.5 million of excess tax benefits for 2015 and 2014, respectively, as cash inflows from financing activities and cash outflows from operating activities in its Consolidated Statement of Cash Flows.
The net deferred tax asset (liability) was comprised of the following at December 31, 2015 and 2014: | ||||||||
December 31, | ||||||||
2015 | 2014 | |||||||
Deferred tax assets: | (In thousands) | |||||||
Merchant contract costs | $ | 14,155 | $ | 10,689 | ||||
Loss reserve and accounts receivable allowance | 543 | 1,513 | ||||||
Share-based compensation | 7,800 | 8,096 | ||||||
FIN No. 48 deferred tax reserve-state tax | 2,509 | 2,640 | ||||||
Other comprehensive income | — | 54 | ||||||
Net operating loss carry-forward | 10,987 | 12,492 | ||||||
Reserve for litigation | — | 272 | ||||||
State net operating loss carry-forwards | 32 | 32 | ||||||
Deferred revenue | 1,185 | — | ||||||
Capital loss carry-forward | 1,616 | 1,616 | ||||||
Deferred compensation | 5,850 | 1,482 | ||||||
Deferred state tax assets | 2,389 | 1,552 | ||||||
Intangibles | — | 1,349 | ||||||
Unearned rent | 581 | 141 | ||||||
Other | 626 | 943 | ||||||
Deferred tax assets | 48,273 | 42,871 | ||||||
Less valuation allowance | (6,504 | ) | (7,989 | ) | ||||
Net deferred tax assets | 41,769 | 34,882 | ||||||
Deferred tax liabilities: | ||||||||
Capitalized signing bonus | 25,846 | 20,716 | ||||||
Software development | 31,817 | 29,589 | ||||||
Property and equipment | 5,677 | 3,337 | ||||||
Goodwill | 25,953 | 17,736 | ||||||
Intangibles | 3,759 | — | ||||||
Deferred tax liabilities | 93,052 | 71,378 | ||||||
Net deferred tax liabilities | (51,283 | ) | (36,496 | ) | ||||
Valuation allowances are recorded to reduce deferred tax assets when it is more likely than not that a tax benefit will not be realized. Significant judgment is required in the evaluation of the deferred tax benefits and differences in future results from management’s estimates could result in material differences in the realization of these assets.
87
Heartland Payment Systems, Inc. and Subsidiaries
Notes To Consolidated Financial Statements—(Continued)
In the fourth quarter 2014, the Company determined the investment in TabbedOut to be significantly less in fair value as compared to the carrying value. As a result, the Company recorded a deferred tax asset in the amount of $1.6 million for unrealized capital losses and a 100% valuation allowance against the deferred tax that the Company may not realize due to the requirement that capital losses may only be offset against capital gains. The Company will continue to carry the valuation allowance until such time as it believes that these deferred tax assets are more-likely-than-not to be realized.
On September 11, 2013, the Company purchased 66.67% of the outstanding capital stock of Leaf. On August 6, 2014 the Company acquired the remaining 33.33% of the outstanding common stock shares of Leaf. Because Leaf was less than 80% owned, it could not be consolidated for tax purposes and during the periods prior to 100% ownership was required to file a separate tax return. As of December 31, 2014, management had provided a 100% valuation allowance against its deferred tax assets resulting from its net operating loss carryforwards since Leaf recorded cumulative net operating losses in recent years. During the year ended December 31, 2015, the Company determined that it was appropriate to release $1.5 million of valuation allowance due to acquisitions that generated future taxable income from the amortization of finite lived intangibles. For the period beginning on and after August 6, 2014, the Company intends to utilize the losses generated from Leaf against consolidated taxable income.
On December 31, 2012, the Company acquired Ovation and its $23.2 million of net operating losses (“NOLs”). This acquisition was a “change of ownership” within the meaning of Section 382 of the Internal Revenue Code, and, as a result such NOLs are subject to an annual limitation. Based upon the historical taxable income and projections for future taxable income over periods in which these NOLs will be deductible, the Company believes that it is more likely than not that the Company will be able to fully utilize these NOLs before the carry-forward periods begin to expire in fiscal 2023 and therefore a valuation allowance is not required.
14. Stock Incentive Plans
In May 2010, the Company approved the Amended and Restated 2008 Equity Incentive Plan (the "2008 Plan") under which it has granted stock options and Restricted Share Units including service-based RSUs, performance-based RSUs (“PRSUs”), and total shareholder return RSUs (“TRSUs”). The maximum number of share awards which may be granted under the Amended and Restated 2008 Equity Incentive Plan is 7,700,000, of which 1,297,064 stock options, 1,882,468 RSUs and 1,041,161 PRSUs and TRSUs were granted from 2010 through year end December 31, 2015. The stock options and Restricted Share Units granted during this time generally vest over four years, while the PRSUs and TRSUs will vest only if, over the term of these grants, performance targets are achieved. At December 31, 2015, 4,749,434 shares of the 7,700,000 authorized shares of common stock reserved for issuance under the Amended and Restated 2008 Equity Incentive Plan remain available for future grant.
Stock options were granted with terms of five years and an exercise price equal to the closing market price on the date of grant. The total intrinsic value of stock options exercised under the 2008 Plan during 2015, 2014 and 2013 was $7.1 million, $15.1 million and $27.9 million, respectively. No stock options were granted during the years ended December 31, 2015, 2014 and 2013. The total intrinsic value of Restricted Share Units vested under the 2008 Plan during 2015, 2014 and 2013 was $45.9 million, $19.8 million and $17.0 million, respectively.
The Company expenses employee share-based payments under the fair value method. Share-based compensation cost is measured at the grant date, based on the fair value of the award, and is recognized as expense over the requisite service period. The closing price of the Company's common stock on the grant date equals the grant date fair value of unvested service-based RSUs and PRSUs. A lattice valuation model was applied to measure the grant date fair value of TRSUs. Amounts the Company recognized in its consolidated financial statements for the years ended December 31, 2015, 2014, and 2013 with respect to these share-based plans were as follows:
88
Heartland Payment Systems, Inc. and Subsidiaries
Notes To Consolidated Financial Statements—(Continued)
Year Ended December 31, | ||||||||||||
2015 | 2014 | 2013 | ||||||||||
(In thousands) | ||||||||||||
Compensation expense recognized on share-based plans before income tax benefit | $ | 21,262 | $ | 13,269 | $ | 12,838 | ||||||
Related income tax benefit recognized in the income statement | 9,483 | 5,175 | 4,981 | |||||||||
Cash received from stock option exercises | 2,910 | 6,109 | 14,174 | |||||||||
Excess tax benefit recorded for tax deductions resulting from the exercise of stock options | 9,634 | 7,524 | 11,596 | |||||||||
Tax benefit realized as reductions of estimated tax payments during the period | 5,740 | 4,179 | 8,587 | |||||||||
Restricted Share Units. The Company grants three types of Restricted Share Units (“RSUs”), service-based RSUs, performance-based RSUs (“PRSUs”), and total shareholder return RSUs (“TRSUs”). At December 31, 2015, there was a total of $36.3 million of unrecognized compensation expense related to Restricted Share Units.
In the fourth quarters of 2013, 2014 and 2015, the Compensation Committee of the Company's Board of Directors approved grants of PRSUs having rights to earn 0% to 250% of a target number of shares of the Company’s common stock depending on the achievement of grant-specific performance targets and service vesting as shown in the following table:
Performance Awards by Grant Date | ||||||||
4th Quarter 2013 | 4th Quarter 2014 | 4th Quarter 2015 | ||||||
PRSUs granted at target | 115,223 | 47,421 | 50,613 | |||||
% of Target shares earned | (a) | (a) | (a) | |||||
Vesting during 2017 | 50% | |||||||
Vesting during 2018 | 50% | 50% | ||||||
Vesting during 2019 | — | 50% | 50% | |||||
Vesting during 2020 | 50% | |||||||
Grant Performance Target | (b) | (c) | (d) | |||||
(a) | PRSUs are still in the performance period. |
(b) | The target number of shares for these PRSUs will be earned only if the Company achieves a pro forma diluted earnings per share growth rate of forty percent (40)% over the three-year period ending December 31, 2016. Shares actually earned could range from 0% to 250% of target determined by the actual growth rate achieved over the three-year period ending December 31, 2016. The Company has recorded expense on these PRSUs based on achieving the 40% target. |
(c) | The target number of shares for these PRSUs will be earned only if the Company achieves a pro forma diluted earnings per share growth rate of forty percent (40)% over the three-year period ending December 31, 2017. Shares actually earned could range from 0% to 225% of target determined by the actual growth rate achieved over the three-year period ending December 31, 2017.The Company has recorded expense on these PRSUs based on achieving the 40% target. |
(d) | The target number of shares for these PRSUs will be earned only if the Company achieves aggregate diluted earnings per share growth rate of thirty percent (30)% over the three-year period ending December 31, 2018. Shares actually earned could range from 0% to 250% of target determined by the actual growth rate achieved over the three-year period ending December 31, 2018. The Company has recorded expense on these PRSUs based on achieving the 30% target. |
Pro forma diluted earnings per share for (b), (c) and (d) performance targets are calculated excluding non-operating gains and losses, if any, and excluding the after-tax impact of share-based compensation expense. The closing price of the Company's common stock on the grant date equals the grant date fair value of these nonvested Restricted Share Units awards and will be recognized as compensation expense over their vesting periods.
In the fourth quarters of 2013 and 2014, the Compensation Committee of the Company's Board of Directors approved grants of TRSUs having rights to earn 0% to 200% of a target number of shares of the Company’s common stock depending on the achievement of grant-specific measures of total shareholder returns and service vesting as summarized below:
89
Heartland Payment Systems, Inc. and Subsidiaries
Notes To Consolidated Financial Statements—(Continued)
In the fourth quarter of 2013, the Compensation Committee approved target grants of 57,598 Relative TRSUs. These Relative TRSUs are nonvested share awards for which vesting percentages and ultimate number of units vesting will be calculated based on the total shareholder return of the Company's common stock as compared to the total shareholder return of 91 peer companies. The payout schedule can produce vesting percentages ranging from 0% to 200%. Total shareholder return will be calculated based upon the average closing price for the 30 calendar day period ending December 6, 2016, divided by the closing price on December 6, 2013. The target number of units is based on achieving a total shareholder return equal to the 65th percentile of the peer group. The Company recorded expense on these Relative TRSUs based on achieving the target. A lattice valuation model was applied to measure the grant date fair value of these Relative TRSUs.
In the fourth quarter of 2013, the Compensation Committee approved target grants of 59,533 Absolute Total Shareholder Return Restricted Share Units (referred to as “Absolute TRSUs”). These Absolute TRSUs are nonvested share awards for which vesting percentages and ultimate number of units vesting will be calculated based on the three or four year total shareholder return of the Company's common stock. The payout schedule can produce vesting percentages ranging from 0% to 200%. Total shareholder return will be calculated based upon the average closing price for the 30 calendar day period ending December 6, 2016 or December 6, 2017, divided by the closing price on December 6, 2013. The target number of units is based on achieving a total shareholder return of 33% over three years or 46% over four years. The Company recorded expense on these Absolute TRSUs based on achieving the target. A lattice valuation model was applied to measure the grant date fair value of these Absolute TRSUs.
In the fourth quarter of 2014, the Compensation Committee approved target grants of 52,321Absolute TRSUs. These Absolute TRSUs are nonvested share awards for which vesting percentages and ultimate number of units vesting will be calculated based on the Company's three or four year total shareholder return of our common stock. The payout schedule can produce vesting percentages ranging from 0% to 200%. Total shareholder return will be calculated based upon the average closing price for the 30 calendar day period ending December 18, 2017 or December 18, 2018, divided by the closing price on December 18, 2014. The target number of units is based on achieving a total shareholder return of 33% over three years or 46% over four years. The Company recorded expense on these Absolute TRSUs based on achieving the target. A lattice valuation model was applied to measure the grant date fair value of these Absolute TRSUs.
In the fourth quarter of 2012, the Compensation Committee approved target grants of 72,345 Relative Total Shareholder Return Restricted Share Units (referred to as “Relative TRSUs”). These Relative TRSUs were nonvested share awards for which vesting percentages and ultimate number of units vesting were calculated based on the total shareholder return of the Company's common stock as compared to the total shareholder return of 86 peer companies. The target number of units would vest if the Company achieved a total shareholder return equal to the 65th percentile of the peer group. The payout schedule could produce vesting percentages ranging from 0% to 225% of target. Actual total shareholder return achieved relative to the peer group, which was calculated based upon the average closing price for the 30 calendar day period ending December 9, 2015 divided by the closing price on December 10, 2012, resulted in a vesting percentage of approximately 172% of target. The Company recorded share-based compensation expense on these Relative TRSUs over the service period based on the grant date fair value of the award. A lattice valuation model was applied to measure the grant date fair value of these Relative TRSUs.
Certain Impacts of the Merger Agreement on Vesting of Share-Based Awards. All unvested share-based awards would become vested and be settled at the close of the transaction contemplated by the Merger Agreement. Any performance-based vesting condition will be deemed to have been satisfied at maximum or target levels, depending on whether the award was granted prior to or after December 1, 2015, respectively. Any unrecognized compensation expense related to Restricted Share Units would be recognized at the close of the transaction. See Note 1. Organization and Operation - Agreement and Plan of Merger for more detail regarding this transaction.
In December 2015, the Company accelerated the vesting of 2016 vesting tranches for selected equity awards held by eight of its executive officers so that these awards vested on December 22, 2015. The value of these awards, based on the closing price of the Company's common stock on December 22, 2015 of $95.02, was $8.3 million. Under FASB ASC Topic 718, this acceleration of 2016 vesting tranches qualifies as a Type I Modification to vesting terms which requires acceleration of expense at original grant date fair value. This action resulted in the acceleration of $1.7 million of share-based compensation expense from 2016 to 2015.
90
Heartland Payment Systems, Inc. and Subsidiaries
Notes To Consolidated Financial Statements—(Continued)
Share-Based Plan Activity. During 2015 and 2014, employees exercised 183,493 and 453,001 stock options, respectively, to acquire the Company's common stock, generating $2.9 million and $6.1 million of stockholders' equity from the exercises and $9.6 million and $7.5 million of stockholders' equity related to tax deductions, which accrued to the Company as employees exercised non-qualified stock options, or made disqualifying dispositions of shares acquired through the exercise of incentive stock options. Stock option and restricted share activity in the Company's share-based plans during 2013, 2014 and 2015 was as follows:
Stock Options | Restricted Share Units | Combined | |||||||||||||||||
Shares | Weighted-Average Exercise Price | Shares | Weighted-Average Grant Price | Shares | Weighted-Average Exercise/Grant Price | ||||||||||||||
Options outstanding at January 1, 2013 | 4,230,187 | $ | 17.39 | 1,464,636 | $ | 22.31 | 5,694,823 | $ | 18.65 | ||||||||||
Issued | — | $ | — | 491,542 | $ | 42.50 | 491,542 | $ | 42.50 | ||||||||||
Exercised/vested | (1,264,825 | ) | $ | 11.21 | (502,225 | ) | $ | 18.72 | (1,767,050 | ) | $ | 13.34 | |||||||
Forfeited/cancelled | (2,283,218 | ) | $ | 21.84 | (98,451 | ) | $ | 23.88 | (2,381,669 | ) | $ | 21.92 | |||||||
Outstanding at December 31, 2013 | 682,144 | $ | 14.26 | 1,355,502 | $ | 30.83 | 2,037,646 | $ | 25.29 | ||||||||||
Options exercisable at December 31, 2013 | 394,252 | $ | 13.20 | — | $ | — | 394,252 | $ | 13.20 | ||||||||||
Issued | — | $ | — | 429,591 | $ | 51.20 | 429,591 | $ | 51.20 | ||||||||||
Exercised/vested | (453,001 | ) | $ | 13.49 | (457,232 | ) | $ | 25.00 | (910,233 | ) | $ | 19.27 | |||||||
Forfeited/cancelled | (30,250 | ) | $ | 12.51 | (87,142 | ) | $ | 30.78 | (117,392 | ) | $ | 26.07 | |||||||
Outstanding at December 31, 2014 | 198,893 | $ | 16.13 | 1,240,719 | $ | 38.49 | 1,439,612 | $ | 35.40 | ||||||||||
Options exercisable at December 31, 2014 | 187,643 | $ | 15.76 | — | $ | — | 187,643 | $ | 15.76 | ||||||||||
Issued | — | $ | — | 518,517 | $ | 67.82 | 518,517 | $ | 67.82 | ||||||||||
Exercised/vested | (183,493 | ) | $ | 15.86 | (680,629 | ) | $ | 30.62 | (864,122 | ) | $ | 27.49 | |||||||
Forfeited/cancelled | (7,000 | ) | $ | 15.22 | (51,057 | ) | $ | 45.77 | (58,057 | ) | $ | 42.09 | |||||||
Outstanding at December 31, 2015 | 8,400 | $ | 22.79 | 1,027,550 | $ | 55.13 | 1,035,950 | $ | 54.87 | ||||||||||
Options exercisable at December 31, 2015 | 5,900 | $ | 22.15 | — | $ | — | 5,900 | $ | 22.15 | ||||||||||
Stock options and Restricted Share Units which were outstanding at December 31, 2015 totaled 1,035,950 and had a weighted-average remaining contractual life of 3.0 years, a weighted average exercise/grant price of $54.87, and total intrinsic value of $98.0 million. Stock options which were exercisable at December 31, 2015 totaled 5,900 and had a weighted-average remaining contractual life of 0.9 years, a weighted average exercise price of $22.15, and total intrinsic value of $0.4 million. The Company has historically issued new shares to satisfy the exercise of options and vesting of RSUs.
15. Fair Value of Financial Instruments
The Company applies a fair value framework in order to measure and disclose its financial assets and liabilities which include fixed income equity securities, interest swap derivatives and certain other financial instruments. The Company determines fair value based on quoted prices when available or through the use of alternative approaches when market quotes are not readily accessible or available.
The Company’s framework for measuring fair value provides a three-level hierarchy, which prioritizes the factors (inputs) used to calculate the fair value of assets and liabilities as follows:
• | Level 1 inputs are unadjusted quoted prices, such as a New York Stock Exchange closing price, in active markets for identical assets. Level 1 is the highest priority in the hierarchy. |
• | Level 2 inputs may include quoted prices for similar assets and liabilities in active markets, as well as other significant inputs that are observable at commonly quoted intervals, such as interest rates, foreign exchange rates, and yield curves. |
• | Level 3 inputs are unobservable and are based on the Company's assumptions due to little, if any, observable market information. Level 3 is the lowest priority in the hierarchy. |
For the years ended December 31, 2015 and 2014, there have been no transfers between Level 1 and Level 2 categories. The following tables provide the assets and liabilities carried at fair value measured on a recurring basis as of December 31, 2015 and 2014:
December 31, 2015 | Fair Value Measurement Category | ||||||||||||||
Total | Level 1 | Level 2 | Level 3 | ||||||||||||
Assets: | (In thousands) | ||||||||||||||
Investments available for sale: | |||||||||||||||
Conservative income bond fund (a) | $ | 12,970 | $ | 12,970 | $ | — | $ | — | |||||||
Fixed income bond fund (a) | 13,886 | 13,886 | — | — | |||||||||||
Total assets | $ | 26,856 | $ | 26,856 | $ | — | $ | — | |||||||
December 31, 2014 | Fair Value Measurement Category | ||||||||||||||
Total | Level 1 | Level 2 | Level 3 | ||||||||||||
Assets: | (In thousands) | ||||||||||||||
Investments available for sale: | |||||||||||||||
Conservative income bond fund (a) | $ | 12,996 | $ | 12,996 | $ | — | $ | — | |||||||
Fixed income bond fund (a) | 14,639 | 14,639 | — | — | |||||||||||
Total assets | $ | 27,635 | $ | 27,635 | $ | — | $ | — | |||||||
(a) amounts included in Funds held for customers on the Consolidated Balance Sheet
The following tables provide the assets and liabilities carried at fair value measured on a non-recurring basis as of December 31, 2015 and 2014:
December 31, 2015 | Fair Value Measurement Category | ||||||||||||||
Total | Level 1 | Level 2 | Level 3 | ||||||||||||
Liabilities: | (In thousands) | ||||||||||||||
2014 Term Credit Facility | $ | 351,563 | $ | — | $ | 351,563 | $ | — | |||||||
2014 Revolving Credit Facility | 130,000 | — | 130,000 | — | |||||||||||
Capital Lease Obligation | 73 | 73 | |||||||||||||
Total liabilities | $ | 481,636 | $ | — | $ | 481,563 | $ | 73 | |||||||
December 31, 2014 | Fair Value Measurement Category | ||||||||||||||
Total | Level 1 | Level 2 | Level 3 | ||||||||||||
Liabilities: | (In thousands) | ||||||||||||||
2014 Term Credit Facility | $ | 370,312 | $ | — | $ | 370,312 | $ | — | |||||||
2014 Revolving Credit Facility | 189,500 | 189,500 | |||||||||||||
Capital Lease Obligation | 102 | 102 | |||||||||||||
Total liabilities | $ | 559,914 | $ | — | $ | 559,812 | $ | 102 | |||||||
16. Employee Benefit Plan
The Company offers a defined contribution plan (the "Plan") to all employees. Company contributions are generally based upon fixed amounts of eligible compensation. The Company contributed approximately $4.6 million, $3.4 million and $2.5 million to the Plan for the years ended December 31, 2015, 2014 and 2013, respectively.
17. Commitments and Contingencies
Litigation—The Company is involved in ordinary course legal proceedings, which include all claims, lawsuits, investigations and proceedings, including unasserted claims, which are probable of being asserted, arising in the ordinary course of business and otherwise not described below. The Company has considered all such ordinary course legal proceedings in formulating its disclosures and assessments. In the opinion of the Company, based on consultations with outside counsel,
91
Heartland Payment Systems, Inc. and Subsidiaries
Notes To Consolidated Financial Statements—(Continued)
material losses in addition to amounts previously accrued are not considered reasonably possible in connection with these ordinary course legal proceedings.
Merger Agreement Proceedings—The Company, its Board of Directors, Global, Merger Sub One, and Merger Sub Two have been named as defendants in a putative class action lawsuit, brought by a purported Company stockholder, challenging the merger. The suit was filed in the New Jersey Superior Court, Mercer County, Civil Division, and is captioned Kevin Merchant v. Heartland Payment Systems, et al., L-45-16 (filed January 8, 2016). The complaint alleges, among other things, that the directors of the Company breached their fiduciary duties to the Company’s stockholders by agreeing to sell the Company for inadequate consideration, agreeing to improper deal protection terms in the merger agreement, and failing to properly value the Company. The complaint also alleges that the Company, Global, Merger Sub One, and Merger Sub Two aided and abetted these purported breaches of fiduciary duty. Plaintiff seeks, among other things, an injunction barring the merger, recession of the merger or rescissory damages to the extent the merger is already implemented, and an award of damages and attorney’s fees.
The Company believes the suit is without merit.
Contingencies—The Company collects and stores sensitive data about its merchant customers and bankcard holders. If the Company’s network security is breached or sensitive merchant or cardholder data is misappropriated, the Company could be exposed to assessments, fines or litigation costs that could be material.
Leases—The Company leases various office spaces and certain equipment under operating leases with remaining terms ranging up to 15 years. The majority of the office space lease agreements contain renewal options and generally require the Company to pay certain operating expenses.
Future minimum lease payments for all non-cancelable leases as of December 31, 2015 were as follows:
For the Years Ended December 31, | Operating Leases (a) | ||
(In thousands) | |||
2016 | $ | 18,475 | |
2017 | 15,455 | ||
2018 | 13,123 | ||
2019 | 9,473 | ||
2020 | 7,839 | ||
Thereafter | 44,605 | ||
Total future minimum lease payments | $ | 108,970 | |
(a) There were no material capital leases at December 31, 2015. | |||
Rent expense for leased facilities and equipment was $18.0 million, $12.0 million and $10.2 million, respectively, for the years ended December 31, 2015, 2014, and 2013.
Commitments— Certain officers of the Company have entered into employee confidential information and non-competition agreements under which they are entitled to severance pay equal to their base salary and medical benefits for one year or two years depending on the officer and a pro-rated bonus in the event they are terminated by the Company other than for cause. The Company paid $0.6 million under one of these agreements in the year ended December 31, 2014.
The following table reflects the Company’s other significant contractual obligations, including leases from above, as of December 31, 2015:
92
Heartland Payment Systems, Inc. and Subsidiaries
Notes To Consolidated Financial Statements—(Continued)
Payments Due by Period | ||||||||||||||||||||
Contractual Obligations | Total | Less than 1 year | 1 to 3 Years | 3 to 5 years | More than 5 years | |||||||||||||||
(In thousands) | ||||||||||||||||||||
Processing providers (a) | $ | 9,008 | $ | 4,013 | $ | 4,995 | $ | — | $ | — | ||||||||||
Telecommunications providers (b) | 6,818 | 3,307 | 3,511 | — | — | |||||||||||||||
Facility and equipment leases | 108,970 | 18,475 | 28,578 | 17,312 | 44,605 | |||||||||||||||
2014 Term Credit Facility | 351,563 | 18,750 | 56,250 | 276,563 | — | |||||||||||||||
2014 Revolving Credit Facility (c) | 130,000 | — | — | 130,000 | — | |||||||||||||||
Capital Lease Obligation | 73 | 43 | 30 | — | — | |||||||||||||||
$ | 606,432 | $ | 44,588 | $ | 93,364 | $ | 423,875 | $ | 44,605 | |||||||||||
(a) | The Company has agreements with several third-party processors to provide to us on a non-exclusive basis payment processing and transmittal, transaction authorization and data capture services, and access to various reporting tools. The Company's agreements with third-party processors require it to submit a minimum monthly number of transactions or volume for processing. If the Company submits a number of transactions or volume that is lower than the minimum, it is required to pay the third-party processors the fees that they would have received if the Company had submitted the required minimum number or volume of transactions. |
(b) | The Company has agreements in place with several large telecommunications companies that provide data center services, wide area network connectivity, and voice services that are used by both the Company call center and card payment processing platforms. These providers require both dollar and term commitments for the services they provide. If the Company does not meet the minimum terms, then there is a requirement to pay the remaining commitments. |
(c) | Interest rates on the 2014 Revolving Credit Facility are variable in nature. The 2014 Revolving Credit Facility is available on a revolving basis until September 4, 2019. While the Company is not contractually obligated to pay $25.0 million of the outstanding balance of the 2014 Revolving Credit Facility, the Company includes this amount in the Current portion of borrowings on the Consolidated Balance Sheet since the Company intends to pay this amount in January 2016. |
18. Segments
The Company bases its business segments on how it monitors and manages the performance of its operations as determined by the Company's chief operating decision maker or decision making group. The Company's operating segments are strategic business units that offer different products and services. They are managed separately because each business requires different marketing strategies, personnel skill sets and technology.
The Company has the following six reportable segments: (1) Payment Processing, which provides card payment processing and related services to the Company's SME merchants and Network Services merchants, (2) Campus Solutions, which provides payment processing, integrated commerce solutions, loan services and open- and closed-loop payment solutions to institutions of higher education, (3) Heartland School Solutions, which provides school nutrition and POS solutions and associated payment solutions to K-12 schools, (4) Heartland Payroll Solutions, which provides payroll processing and related tax filing services, (5) Leaf, which includes the operating losses for Leaf as well as the goodwill and POS asset impairment charges recorded in the fourth quarter of 2014, (see Note 8, Intangible Assets and Goodwill for further details) and (6) Other. The Other segment consists of (a) integrated payments solutions for small ticket merchants provided by Micropayments, (b) loyalty and gift card marketing solutions including loyalty and gift cards provided by Heartland Marketing Solutions, and (c) POS solutions and other adjacent business service applications provided by Heartland Commerce. The individual components of the Other segment do not meet the defined thresholds for being individually reportable segments under applicable accounting guidance.
SME merchants and Network Services merchants are aggregated for financial reporting purposes in the Payment Processing Segment, as they both provide processing services related to bankcard transactions, exhibit similar economic characteristics, and share the same systems to provide services. Campus Solutions includes TouchNet and Educational Computer Systems, Inc. ("ECSI") for financial reporting purposes because they provide similar commerce solutions, exhibit similar economic characteristics, and provide services to a similar higher education customer base, including some client overlap.
The Company allocates revenues, expenses, assets and liabilities to segments only where directly attributable. The unallocated corporate administration amounts consist primarily of costs attributed to finance, corporate administration, human resources and corporate services.
93
Heartland Payment Systems, Inc. and Subsidiaries
Notes To Consolidated Financial Statements—(Continued)
The accounting policies of the operating segments are the same as described in the summary of significant accounting policies. The Company believes the terms and conditions of transactions between the segments are comparable to those which could have been obtained in transactions with unaffiliated parties.
At December 31, 2015 and 2014, 58% and 70%, respectively, of the total assets of Heartland Payroll Solutions were funds that the Company holds as a fiduciary in its payroll processing services activities primarily for payment to taxing authorities. At both December 31, 2015 and 2014, 8% of the total assets of Campus Solutions represent funds held for the Company's loan servicing customers related to payment processing services provided for federal student loan billing and processing that are payable to higher education institutions and other businesses. See Note 8, Intangible Assets and Goodwill for goodwill as a percentage of the reportable segments' total assets.
A summary of the Company’s segments for the three years ended December 31, 2015, 2014, and 2013 was as follows:
December 31, | ||||||||||||
2015 | 2014 | 2013 | ||||||||||
Revenues | (In thousands) | |||||||||||
Payment Processing | $ | 2,371,878 | $ | 2,111,487 | $ | 1,979,579 | ||||||
Campus Solutions | 117,208 | 61,538 | 36,186 | |||||||||
Heartland School Solutions (a) | 60,870 | 57,570 | 50,541 | |||||||||
Heartland Payroll Solutions | 69,037 | 50,394 | 44,565 | |||||||||
Other | 63,403 | 30,392 | 24,501 | |||||||||
Total revenues | $ | 2,682,396 | $ | 2,311,381 | $ | 2,135,372 | ||||||
December 31, | ||||||||||||
2015 | 2014 | 2013 | ||||||||||
Depreciation and amortization | (In thousands) | |||||||||||
Payment Processing | $ | 35,076 | $ | 30,702 | $ | 26,934 | ||||||
Campus Solutions | 13,922 | 6,040 | 2,330 | |||||||||
Heartland School Solutions | 4,874 | 3,857 | 2,282 | |||||||||
Heartland Payroll Solutions | 4,286 | 3,196 | 3,478 | |||||||||
Other | 4,266 | 4,117 | 1,641 | |||||||||
Unallocated corporate administration amounts | 531 | 358 | (1,311 | ) | ||||||||
Total depreciation and amortization | $ | 62,955 | $ | 48,270 | $ | 35,354 | ||||||
Income (loss) from operations | ||||||||||||
Payment Processing | $ | 119,312 | $ | 127,553 | $ | 138,226 | ||||||
Campus Solutions | 36,293 | 12,653 | 3,930 | |||||||||
Heartland School Solutions (a) | 23,451 | 10,874 | 16,348 | |||||||||
Heartland Payroll Solutions | 9,465 | 9,076 | 3,404 | |||||||||
Leaf (b) | (4,692 | ) | (47,906 | ) | (2,824 | ) | ||||||
Other | 2,088 | 1,330 | 229 | |||||||||
Unallocated corporate administration amounts | (40,369 | ) | (31,460 | ) | (33,215 | ) | ||||||
Total income from operations | $ | 145,548 | $ | 82,120 | $ | 126,098 | ||||||
Interest Expense | ||||||||||||
Payment Processing | $ | 4,221 | $ | 5,178 | $ | 5,425 | ||||||
Campus Solutions | 7,883 | 2,754 | 7 | |||||||||
Heartland Payroll Solutions | 591 | — | — | |||||||||
Other | 1,489 | 125 | — | |||||||||
Reconciling | — | — | (3 | ) | ||||||||
Total interest expense | $ | 14,184 | $ | 8,057 | $ | 5,429 | ||||||
94
Heartland Payment Systems, Inc. and Subsidiaries
Notes To Consolidated Financial Statements—(Continued)
Net income (loss) from continuing operations | ||||||||||||
Payment Processing | $ | 73,711 | $ | 74,567 | $ | 81,520 | ||||||
Campus Solutions | 17,470 | 6,686 | 2,255 | |||||||||
Heartland School Solutions (a) | 14,477 | 6,650 | 9,085 | |||||||||
Heartland Payroll Solutions | 5,439 | 5,497 | 2,056 | |||||||||
Leaf (b) | (2,148 | ) | (38,426 | ) | (2,012 | ) | ||||||
Other | 526 | (4,170 | ) | 462 | ||||||||
Unallocated corporate administration amounts | (24,743 | ) | (18,936 | ) | (19,264 | ) | ||||||
Total net income from continuing operations | $ | 84,732 | $ | 31,868 | $ | 74,102 | ||||||
Assets | ||||||||||||
Payment Processing | $ | 587,701 | $ | 524,498 | $ | 519,589 | ||||||
Campus Solutions | 474,995 | 507,036 | 81,719 | |||||||||
Heartland School Solutions | 79,539 | 84,603 | 78,573 | |||||||||
Heartland Payroll Solutions | 281,195 | 195,657 | 154,172 | |||||||||
Leaf (b) | — | 4,256 | 39,457 | |||||||||
Other | 113,249 | 62,415 | 17,247 | |||||||||
Total assets | $ | 1,536,679 | $ | 1,378,465 | $ | 890,757 | ||||||
(a) See Note 1, Organization and Operations for a discussion of an Out-of-Period Adjustment recorded in the year ended December 31, 2014.
(b) See Note 2, Summary of Significant Accounting Policies — Goodwill for a discussion of Goodwill and Asset Impairments in the year ended December 31, 2014.
19. Earnings Per Share
The Company presents earnings per share data following the established standards for the computation and presentation of basic and diluted earnings per share data. Under these standards, the dilutive effect of stock options is excluded from the calculation of basic earnings per share but included in diluted earnings per share. The following is a reconciliation of the amounts used to calculate basic and diluted earnings per share:
Year Ended December 31, | ||||||||||||
2015 | 2014 | 2013 | ||||||||||
(In thousands, except per share) | ||||||||||||
Numerator: | ||||||||||||
Income from continuing operations attributable to Heartland | $ | 84,732 | $ | 33,879 | $ | 74,712 | ||||||
Income from discontinued operations attributable to Heartland | — | — | 3,914 | |||||||||
Net income attributable to Heartland | $ | 84,732 | $ | 33,879 | $ | 78,626 | ||||||
Denominator: | ||||||||||||
Basic weighted average shares outstanding | 36,646 | 36,354 | 36,791 | |||||||||
Effect of dilutive instruments: | ||||||||||||
Stock options and restricted stock units | 591 | 833 | 1,262 | |||||||||
Diluted weighted average shares outstanding | 37,237 | 37,187 | 38,053 | |||||||||
Basic earnings per share: | ||||||||||||
Income from continuing operations | $ | 2.31 | $ | 0.93 | $ | 2.03 | ||||||
Income from discontinued operations | $ | — | $ | — | $ | 0.11 | ||||||
Basic earnings per share | $ | 2.31 | $ | 0.93 | $ | 2.14 | ||||||
Diluted earnings per share: | ||||||||||||
Income from continuing operations | $ | 2.28 | $ | 0.91 | $ | 1.96 | ||||||
Income from discontinued operations | $ | — | $ | — | $ | 0.10 | ||||||
Diluted earnings per share | $ | 2.28 | $ | 0.91 | $ | 2.06 | ||||||
20. Discontinued Operations
In the fourth quarter of 2012, the Company along with the 30% noncontrolling shareholders of CPOS entered into an agreement to sell CPOS to a third party. CPOS was not a significant subsidiary and the Company will have no continuing
involvement in its operations. After receiving regulatory approval, the transaction settled on January 31, 2013. The total sales
95
Heartland Payment Systems, Inc. and Subsidiaries
Notes To Consolidated Financial Statements—(Continued)
price was $30.3 million cash including net working capital, of which the Company received $20.9 million for its 70% ownership in CPOS. The total gain recorded on the sale for the year ended December 31, 2013 was $3.8 million, net of income taxes of $2.1 million.
There were no discontinued operations for the years ended December 31, 2015 and 2014. Income from discontinued operations for the year ended December 31, 2013 was as follows (in thousands of dollars):
2013 | ||||
Revenues | $ | 1,117 | ||
Expenses | 870 | |||
Income from operations | 247 | |||
Income from discontinued operations, net of income tax of $68 | 184 | |||
Gain on sale of discontinued operations, net of income tax of $2,067 | 3,786 | |||
Net income from discontinued operations attributable to noncontrolling interests | 56 | |||
Net income from discontinued operations attributable to Heartland | 3,914 | |||
21. Quarterly Consolidated Results of Operations (Unaudited)
The Company's unaudited quarterly results of operations for the years ended December 31, 2015 and 2014 were as follows:
For the Quarter Ended | ||||||||||||||||
March 31, 2015 | June 30, 2015 | September 30, 2015 | December 31, 2015 | |||||||||||||
(In thousands, except per share data) | ||||||||||||||||
Total revenues | $ | 602,459 | $ | 675,692 | $ | 705,667 | $ | 698,578 | ||||||||
Costs of services | 514,573 | 580,392 | 603,937 | 593,941 | ||||||||||||
General and administrative expenses | 58,124 | 56,872 | 59,216 | 69,793 | ||||||||||||
Total expenses | 572,697 | 637,264 | 663,153 | 663,734 | ||||||||||||
Income from operations | 29,762 | 38,428 | 42,514 | 34,844 | ||||||||||||
Net income | 17,238 | 20,906 | 23,881 | 22,707 | ||||||||||||
Diluted earnings per share | $ | 0.46 | $ | 0.56 | $ | 0.64 | $ | 0.61 | ||||||||
For the Quarter Ended | ||||||||||||||||
March 31, 2014 | June 30, 2014 | September 30, 2014 | December 31, 2014 | |||||||||||||
(In thousands, except per share data) | ||||||||||||||||
Total revenues | $ | 523,283 | $ | 582,859 | $ | 600,626 | $ | 604,613 | ||||||||
Costs of services | 452,435 | 509,554 | 520,834 | 518,519 | ||||||||||||
General and administrative expenses | 44,486 | 43,374 | 49,381 | 53,313 | ||||||||||||
Goodwill impairment charge (a) | — | — | — | 18,490 | ||||||||||||
Asset impairment charges (a) | — | — | — | 18,875 | ||||||||||||
Total expenses | 496,921 | 552,928 | 570,215 | 609,197 | ||||||||||||
Income (loss) from operations | 26,362 | 29,931 | 30,411 | (4,584 | ) | |||||||||||
Net income (loss) attributable to Heartland | 15,740 | 17,452 | 20,458 | (19,771 | ) | |||||||||||
Diluted earnings (loss) per share (b) | 0.42 | 0.48 | 0.56 | (0.55 | ) | |||||||||||
(a) See Note 2, Summary of Significant Accounting Policies — Goodwill for a discussion of Goodwill and Asset Impairments.
(b) Due to the net loss in the quarter ended December 31, 2014, calculating Diluted Earnings Per Share using diluted weighted
average shares would be anti-dilutive. Therefore, weighted average common stock outstanding was used to calculate Diluted
Earnings Per Share for the quarter ended December 31, 2014.
ITEM 9. CHANGES IN AND DISAGREEMENTS WITH ACCOUNTANTS ON ACCOUNTING AND FINANCIAL DISCLOSURE
None.
96
ITEM 9A. | CONTROLS AND PROCEDURES |
Evaluation of Disclosure Controls and Procedures
Under the supervision and with the participation of our management, including our Chief Executive Officer (“CEO”) and Chief Financial Officer (“CFO”) we evaluated the effectiveness of our disclosure controls and procedures, as such term is defined in Rule 13a-15(e) and Rule 15d-15(e) under the Exchange Act, as of December 31, 2015. Based upon that evaluation, our CEO and CFO concluded that, as of the end of the period covered by this report, our disclosure controls and procedures were effective.
Management Annual Report on Internal Control over Financial Reporting
Our management team is responsible for establishing and maintaining adequate internal control over financial reporting as defined in Rules 13a-15(f) and 15d-15(f) under the Exchange Act.
Our internal control over financial reporting includes those policies and procedures that:
• | Pertain to the maintenance of records that, in reasonable detail, accurately and fairly reflect the transactions and dispositions of the assets of the Company; |
• | Provide reasonable assurance that transactions are recorded as necessary to permit preparation of financial statements in accordance with generally accepted accounting principles, and that our receipts and expenditures are being made only in accordance with authorizations of the Company's management and directors; and |
• | Provide reasonable assurance regarding prevention or timely detection of unauthorized acquisition, use or disposition of our assets that could have a material effect on the financial statements. |
Any system of internal control over financial reporting, however well designed and operated, may not prevent or detect all misstatements. Internal control over financial reporting is a process that involves human diligence and compliance and is subject to lapses in judgment and breakdowns resulting from human failures. In addition, the design of any control system is based, in part, upon certain assumptions about the likelihood of future events. Because of these and other inherent limitations of internal control systems, there is only reasonable assurance that the Company's system of internal control over financial reporting will succeed in achieving its goals under all potential future conditions.
Our management assessed the effectiveness of the Company's internal control over financial reporting as of December 31, 2015. In making this assessment, our management used the criteria set forth by the Committee of Sponsoring Organizations of the Treadway Commission ("COSO") in the Internal Control - Integrated Framework (2013). As of December 31, 2015, management believes that the Company's internal control over financial reporting is effective based on this assessment and those criteria.
The effectiveness of the Company's internal control over financial reporting as of December 31, 2015 has been audited by Deloitte & Touche LLP, an independent registered public accounting firm, as stated in their report which is presented in the Annual Report on Form 10-K.
Changes in Internal Control Over Financial Reporting
There has been no change in the Company's internal controls over financial reporting as defined in Rule 13a-15(f) under the Exchange Act identified in connection with the evaluation required by Rule 13a-15(d) of the Exchange Act that occurred during our last fiscal quarter in the period covered by this Annual Report on Form 10-K that has materially affected, or is reasonably likely to materially affect, the Company's internal controls over financial reporting.
ITEM 9B. OTHER INFORMATION
None.
PART III.
ITEM 10. DIRECTORS, EXECUTIVE OFFICERS AND CORPORATE GOVERNANCE
The information required to be included in Item 10 of Part III of this Form 10-K is incorporated herein by reference to certain information contained in our definitive proxy statement for our 2016 Annual Meeting of Stockholders to be filed with the SEC not later than 120 days after the end of the fiscal year covered by this report.
ITEM 11. EXECUTIVE COMPENSATION
The information required to be included in Item 11 of Part III of this Form 10-K is incorporated herein by reference to certain information contained in our definitive proxy statement for our 2016 Annual Meeting of Stockholders to be filed with the SEC not later than 120 days after the end of the fiscal year covered by this report.
ITEM 12. SECURITY OWNERSHIP OF CERTAIN BENEFICIAL OWNERS AND MANAGEMENT AND RELATED STOCKHOLDER MATTERS
The information required to be included in Item 12 of Part III of this Form 10-K is incorporated herein by reference to certain information contained in our definitive proxy statement for our 2016 Annual Meeting of Stockholders to be filed with the SEC not later than 120 days after the end of the fiscal year covered by this report.
ITEM 13. CERTAIN RELATIONSHIPS AND RELATED TRANSACTIONS, AND DIRECTOR INDEPENDENCE
The information required to be included in Item 13 of Part III of this Form 10-K is incorporated herein by reference to certain information contained in our definitive proxy statement for our 2016 Annual Meeting of Stockholders to be filed with the SEC not later than 120 days after the end of the fiscal year covered by this report.
97
ITEM 14. PRINCIPAL ACCOUNTING FEES AND SERVICES
The information required to be included in Item 14 of Part III of this Form 10-K is incorporated herein by reference to certain information contained in our definitive proxy statement for our 2016 Annual Meeting of Stockholders to be filed with the SEC not later than 120 days after the end of the fiscal year covered by this report.
PART IV.
ITEM 15. EXHIBITS AND FINANCIAL STATEMENT SCHEDULES
1. Consolidated Financial Statements
Our consolidated financial statements listed below are set forth in “Item 8-Financial Statements and Supplementary Data” of this report:
Page | |||
2. Financial Statement Schedules
All schedules to our consolidated financial statements have been omitted because they are not required under the related instruction or are inapplicable, or because we have included the required information in our consolidated financial statements or related notes.
3. Exhibits
The following exhibits either (i) are filed with this report or (ii) have previously been filed with the SEC and are incorporated in this Item 15 by reference to those prior filings.
98
Exhibit Number | Description |
2.2 | Agreement and Plan of Merger dated September 29, 2000 by and among Heartland Payment Systems, Inc., Uhle and Associates, LLC, Martin J. Uhle, Mark K. Strippy and Steven B. Gamary. (Incorporated by reference to Exhibit 2.2 to the Registrant's Registration Statement on Form 10 filed on August 9, 2005 (File No. 000-51265)) |
2.3 | Agreement and Plan of Merger dated September 29, 2000 by and between Heartland Payment Systems, Inc. and Triad LLC. (Incorporated by reference to Exhibit 2.2 to the Registrant's Registration Statement on Form 10 filed on August 9, 2005 (File No. 000-51265)). |
2.4 | Agreement and Plan of Merger dated as of December 28, 2000 by and between Heartland Payment Systems, Inc. and Heartland Payment Systems L.L.C. (Incorporated by reference to Exhibit 2.2 to the Registrant's Registration Statement on Form 10 filed on August 9, 2005 (File No. 000-51265)). |
2.5 | Agreement of Merger dated as of June 14, 2004 by and between Heartland Payment Systems, Inc. and Credit Card Software Systems, Inc. (Incorporated by reference to Exhibit 2.2 to the Registrant's Registration Statement on Form 10 filed on August 9, 2005 (File No. 000-51265)). |
2.6 | Agreement and Plan of Merger, dated as of July 29, 2014, by and among Heartland Payment Systems, Inc., Titan Merger Sub, Inc., TouchNet Information Systems, Inc., and TNSR, LLC, as the Representative. (Incorporated by reference to Exhibit 2.1 to the Registrant’s Current Report on Form 8-K filed on July 29, 2014 (File No. 001-32594)). |
2.7 | Agreement and Plan of Merger, dated December 15, 2015, by and among Heartland Payment Systems, Inc., Global Payments, Inc.Data Merger Sub One, Inc. and Data Merger Sub Two, LLC. (Incorporated by reference to Exhibit 2.1 to the Registrant’s Current Report on Form 8-K filed on December 17, 2015 (File No. 001-32594)). |
3.1 | Amended and Restated Certificate of Incorporation of Heartland Payment Systems, Inc. (Incorporated by reference to Exhibit 3.3 to the Registrant's Registration Statement on Form S-1, as amended, filed on March 29, 2005. (File No. 333-118073)). |
3.2 | Amended and Restated Bylaws of Heartland Payment Systems, Inc. (Incorporated by reference to Exhibit 3.2 to the Registrant's Annual Report on Form 10-K filed on March 10, 2008 (File No. 001-32594)). |
4.1 | Stockholder Agreement, dated as of July 29, 2014, by and between Heartland Payment Systems, Inc. and each of the individuals or entities listed on the signature pages thereto. (Incorporated by reference to Exhibit 4.1 to the Registrant’s Current Report on Form 8-K filed on July 31, 2014 (File No. 001-32594)). |
10.1 | Lease Agreement dated September 2004, between Heartland Payment Systems, Inc. and Bank of America, N.A. (Incorporated by reference to Exhibit 10.19 to the Registrant's Registration Statement on Form S-1, as amended, filed on March 29, 2005 (File No. 333-118073)). |
10.2 | First Amendment to Lease Agreement, dated March 17, 2005, between Heartland Payment Systems, Inc. and First States Investors 5200, LLC (Incorporated by reference to Exhibit 10.20 to the Registrant's Registration Statement on Form S-1, as amended, filed on March 29, 2005 (File No. 333-118073)). |
10.3 | Extension of Lease between Heartland Payment Systems, Inc. and 90 Nassau LLC dated as of January 11, 2013. (Incorporated by reference to Exhibit 10.5 to the Registrant's Annual Report on Form 10-K filed on February 28, 2014) (File No. 001-32594). |
10.4** | Heartland Payment Systems, Inc. Amended and Restated 2000 Equity Incentive Plan (Incorporated by reference to Exhibit 10.21 to the Registrant's Registration Statement on Form S-1, as amended (File No. 333-118073)). |
10.5** | Form of Employee Incentive Stock Option Agreement Under 2000 Equity Incentive Plan (Incorporated by reference to Exhibit 10.22 to the Registrant's Registration Statement on Form S-1, as amended (File No. 333-118073)). |
10.6 | Form of Indemnification Agreement (Incorporated by reference to Exhibit 10.26 to the Registrant's Registration Statement on Form S-1, as amended (File No. 333-118073)). |
10.7** | Heartland Payment Systems, Inc. Second Amended and Restated 2000 Equity Incentive Plan (Incorporated by reference to Exhibit 10.28 to the Registrant's Registration Statement on Form S-1, as amended (File No. 333-118073)). |
10.8** | Form of Nonqualified Stock Option Agreement. (Incorporated by reference to Exhibit 10.32 to the Registrant's Quarterly Report on Form 10-Q filed on August 11, 2006 (File No. 001-32594)). |
10.9** | Form of Employee Confidential Information and Noncompetition Agreement entered into by Robert H.B. Baldwin, Jr. with Heartland Payment Systems, Inc. (Incorporated by reference to Exhibit 10.34 to the Registrant's Quarterly Report on Form 10-Q filed on August 11, 2006 (File No. 001-32594)). |
10.10** | Supplement No. I to Employee Confidential Information and Noncompetition Agreement by and between Robert H.B. Baldwin, Jr. and Heartland Payment Systems, Inc. (Incorporated by reference to Exhibit 10.35 to the Registrant's Quarterly Report on Form 10-Q filed on August 11, 2006 (File No. 001-32594)). |
10.11** | Amended and Restated Employee Confidential Information and Noncompetition Agreement dated May 4, 2007 entered into by Robert O. Carr with Heartland Payment Systems, Inc. (Incorporated by reference to Exhibit 10.37 to the Registrant's Current Report on Form 8-K filed on May 4, 2007 (File No. 001-32594)). |
10.12 | American Express Establishment Sales and Servicing Program Agreement dated as of December 20, 2007 between Heartland Payment Systems, Inc. and American Express Travel Related Services Company. (Incorporated by reference to Exhibit 10.41 to the Registrant's Annual Report on Form 10-K filed on March 10, 2008 (File No. 001-32594)). |
99
Exhibit Number | Description |
10.13** | Heartland Payment Systems, Inc. 2008 Equity Incentive Plan. (Incorporated by reference to Exhibit 10.1 to the Registrant's Quarterly Report on Form 10-Q filed on August 8, 2008 (File No. 001-32594)). |
10.14 | Membership Interest and Asset Purchase Agreement dated as of May 2, 2008, by and among Alliance Data Network Services LLC, ADS Alliance Data Systems, Inc., Alliance Data Systems Corporation, Heartland Acquisition, LLC and Heartland Payment Systems, Inc. (Incorporated by reference to Exhibit 10.1 to the Registrant's Current Report on Form 8-K filed on May 8, 2008 (File No. 001-32594)). |
10.15** | Form of Employee Incentive Stock Option Agreement Under 2008 Equity Incentive Plan. (Incorporated by reference to Exhibit 4.5 to the Registrant's Registration Statement on Form S-8 filed on November 19, 2008 (File No. 333-155450)). |
10.16** | Form of Employee Restricted Stock Unit Agreement. (Incorporated by reference to Exhibit 10.46 to the Registrant's Quarterly Report on Form 10-Q filed on August 7, 2009 (File No. 001-32594)). |
10.17** | Amendment No. I to Amended and Restated Employee Confidential Information and Noncompetition Agreement dated May 11, 2009 entered into by Robert O. Carr with Heartland Payment Systems, Inc. (Incorporated by reference to Exhibit 10.47 to the Registrant's Quarterly Report on Form 10-Q filed on August 7, 2009 (File No. 001-32594)). |
10.18** | Amendment and Restatement of Heartland Payment Systems, Inc.'s 2008 Equity Incentive Plan (Incorporated by reference to Exhibit 10.1 to the Company's Current Report on Form 8-K filed on May 18, 2010 (File No. 001-32594)). |
10.19 | International Swaps and Derivatives Association, Inc. 2002 Master Agreement dated as of December 30, 2010 between Heartland Payment Systems, Inc. and Bank of America, N.A.. (Incorporated by reference to Exhibit 10.67 to the Registrant's Annual Report on Form 10-K filed on March 10, 2011 (File No. 001-32594)). |
10.20** | Form of Performance-Based Employee Restricted Stock Unit Agreement (Incorporated by reference to Exhibit 10.1 to the Registrant's Quarterly Report on Form 10-Q filed on May 6, 2011 (File No. 001-32954)). |
10.21** | Form of Time Vesting Restricted Stock Unit Agreement. (Incorporated by reference to Exhibit 10.74 to the Registrant's Annual Report on Form 10-K filed on February 28, 2012 (File No. 001-32594)). |
10.22** | Form of Performance-Based Restricted Stock Unit Agreement. (Incorporated by reference to Exhibit 10.75 to the Registrant's Annual Report on Form 10-K filed on February 28, 2012 (File No. 001-32594)). |
10.23 | Merchant Financial Services Agreement with Wells Fargo Bank, N.A dated February 8, 2012. (Incorporated by reference to Exhibit 10.1 to the Registrant's Quarterly Report on Form 10-Q filed on May 7, 2012 (File No. 001-32594)). |
10.24 | Amendment No. 1 to the Merchant Financial Services Agreement between Wells Fargo Bank, N.A. and Heartland Payment Systems, Inc. dated April 30, 2012. (Incorporated by reference to Exhibit 10.2 to the Registrant's Quarterly Report on Form 10-Q filed on May 7, 2012 (File No. 001-32594)). |
10.25** | Offer Letter between David Gilbert and Heartland Payment Systems, Inc. dated May 21, 2012. (Incorporated by reference to Exhibit 10.5 to the Registrant's Quarterly Report on Form 10-Q filed on August 6, 2012 (File No. 001-32594)). |
10.26 | Employee Confidential Information and Noncompetition Agreement between David Gilbert and Heartland Payment Systems, Inc. dated June 14, 2012. (Incorporated by reference to Exhibit 10.6 to the Registrant's Quarterly Report on Form 10-Q filed on August 6, 2012 (File No. 001-32594)). |
10.27** | Offer Letter between Ian M. Drysdale and Heartland Payment Systems, Inc. dated July 9, 2012. (Incorporated by reference to Exhibit 10.7 to the Registrant's Quarterly Report on Form 10-Q filed on August 6, 2012 (File No. 001-32594)). |
10.28** | Employee Confidential Information and Noncompetition Agreement between Ian M. Drysdale and Heartland Payment Systems, Inc. dated July 9, 2012. (Incorporated by reference to Exhibit 10.8 to the Registrant's Quarterly Report on Form 10-Q filed on August 6, 2012 (File No. 001-32594)). |
10.29** | Employee Confidential Information and Noncompetition Agreement between Michael A. Lawler and Heartland Payment Systems, Inc. dated July 13, 2012. (Incorporated by reference to Exhibit 10.9 to the Registrant's Quarterly Report on Form 10-Q filed on August 6, 2012 (File No. 001-32594)). |
10.30 | Merchant BIN and ICA Sponsorship and Services Agreement entered into by and between Heartland Payment Systems, Inc. and The Bancorp Bank as of November 23, 2009. (Incorporated by reference to Exhibit 10.1 to Amendment No. 1 to the Registrant's Quarterly Report on Form 10-Q filed on February 20, 2013 (File No. 001-32594)). |
10.31** | Form of Total Shareholder Return Performance Restricted Stock Unit Agreement. (Incorporated by reference to Exhibit 10.63 to the Registrant’s Annual Report on Form 10-K filed on March 1, 2013 (File No. 001-32594)). |
10.32** | Form of Absolute Shareholder Return Performance Restricted Share Agreement. (Incorporated by reference to Exhibit 10.47 to the Registrant’s Annual Report on Form 10-K filed on February 28, 2014 (File No. 001-32594)). |
10.33 | Credit Agreement dated October 23, 2013, among Heartland Payment Systems, Inc., the lenders party to the Credit Agreement from time to time, Bank of America, N.A., as administrative agent, swingline lender and letter of credit issuer, SunTrust Bank and KeyBank National Association, as joint syndication agents, Wells Fargo Bank, National Association, as documentation agent, and Merrill Lynch, Pierce, Fenner & Smith Incorporated, SunTrust Robinson Humphrey, Inc. and KeyBank Capital Markets, as joint lead arranges and joint book managers. (Incorporated by reference to Exhibit 10.1 to the Registrant's Current Report on Form 8-K filed on October 29, 2013 (File No. 001-32594)). |
10.34 | Intercreditor Agreement dated October 23, 2013 by and among Heartland Payment Systems, Inc. , as borrower, Wells Fargo, as sponsor, and Bank of America, N.A., as bank group administrative agent. (Incorporated by reference to Exhibit 10.3 to the Registrant's Current Report on Form 8-K filed on October 29, 2013 (File No. 001-32594)). |
100
Exhibit Number | Description |
10.35 | ISDA Amendment dated October 23, 2013, among Heartland Payment Systems, Inc. and Bank of America, N.A. (Incorporated by reference to Exhibit 10.5 to the Registrant's Current Report on Form 8-K filed on October 29, 2013 (File No. 001-32594)). |
10.36 | Uncommitted Revolving Line of Credit Agreement, dated July 20, 2012 by and among Wells Fargo Bank, National Association, as lender and as sponsor bank, Heartland Payment Systems, Inc. and each guarantor thereto. (Incorporated by reference to Exhibit 10.1 to the Registrant's Current Report on Form 8-K filed on July 26, 2012 (File No. 001-32594)). |
10.37 | Uncommitted Revolving Line of Credit Note, dated July 20, 2012 between Heartland Payment Systems, Inc. and Wells Fargo Bank, National Association. (Incorporated by reference to Exhibit 10.2 to the Registrant's Current Report on Form 8-K filed on July 26, 2012 (File No. 001-32594)). |
10.38 | First Amendment to Uncommitted Revolving Line of Credit Agreement dated as of July 22, 2013, by and among Heartland Payment Systems, Inc., the Guarantors party thereto, and Wells Fargo Bank, National Association. (Incorporated by reference to Exhibit 10.1 to the Registrant’s Current Report on Form 8-K filed on July 23, 2013 (File No. 001-32594)). |
10.39 | Second Amendment to Uncommitted Revolving Line of Credit Agreement dated as of October 17, 2013, by and among Heartland Payment Systems, Inc. and Wells Fargo Bank, National Association. (Incorporated by reference to Exhibit 10.1 to the Registrant’s Current Report on Form 8-K filed on October 23, 2013 (File No. 001-32594)). |
10.40 | Summary of Compensatory Arrangements with non-employee directors. (Incorporated by reference to Exhibit 10.64 to the Registrant’s Annual Report on Form 10-K for the Year Ended December 31, 2013 filed on February 28, 2014 (File No. 001-32594)). |
10.41** | Employee Confidential Information and Noncompetition Agreement dated March 28, 2014, by and between Samir M. Zabaneh, and Heartland Payment Systems, Inc. (Incorporated by reference to Exhibit 10.1 to the Registrant’s Quarterly Report on Form 10-Q filed on May 7, 2014 (File No. 001-32594)). |
10.42** | Samir M. Zabaneh Offer Letter Dated March 28, 2014. (Incorporated by reference to Exhibit 10.2 to the Registrant’s Quarterly Report on Form 10-Q filed on May 7, 2014 (File No. 001-32594)). |
10.43 | Amended and Restated Credit Agreement dated September 14, 2014, among Heartland Payment Systems, Inc., the lenders party to the Credit Agreement from time to time, Bank of America, N.A. as administrative agent, swingline lender and letter of credit issuer, SunTrust Bank and BMO Harris Bank, N.A., as joint syndication agents, and Merrill Lynch, Pierce, Fenner & Smith Incorporated, SunTrust Robinson Humphrey, Inc. and BMO Capital Markets, as joint lead arranges and joint book managers. (Incorporated by reference to Exhibit 10.1 to the Registrant’s Current Report on Form 8-K, filed on September 8, 2014 (File No. 001-32594)). |
10.44 | Amended and Restated Collateral Agreement dated September 4, 2014, among Heartland Payment Systems, Inc. certain of its subsidiaries as guarantors and Bank of America, N.A. (Incorporated by reference to Exhibit 10.2 to the Registrant’s Current Report on Form 8-K, filed on September 8, 2014 (File No. 001-32594)). |
10.45 | Amended and Restated Subsidiary Guaranty dated September 4, 2014, among certain of Heartland Payment Systems, Inc. subsidiaries as guarantors and Bank of America, N.A. (Incorporated by reference to Exhibit 10.3 to the Registrant’s Current Report on Form 8-K, filed on September 8, 2014 (File No. 001-32594)). |
10.46 | Fourth Amendment to Uncommitted Revolving Line of Credit, dated as of September 24, 2014 by and among Heartland Payment Systems, Inc., the Guarantors party thereto, and Wells Fargo National Association, in its capacity as lender and as sponsor bank. (Incorporated by reference to Exhibit 10.1 to the Registrant’s Current Report on Form 8-K, filed on September 29, 2014 (File No. 001-32594)). |
*21.1 | List of Subsidiaries of Registrant. |
*23.1 | Consent of Deloitte & Touche LLP. |
*31.1 | Certification of the Chief Executive Officer, pursuant to Rule 13a-14(a)/15d-14(a), as adopted pursuant to Section 302 of the Sarbanes-Oxley Act of 2002 |
*31.2 | Certification of the Chief Financial Officer, pursuant to Rule 13a-14(a)/15d-14(a), as adopted pursuant to Section 302 of the Sarbanes-Oxley Act of 2002 |
*32.1 | Certification of the Chief Executive Officer, pursuant to 18 U.S.C. Section 1350, as adopted pursuant to Section 906 of the Sarbanes-Oxley Act of 2002 |
*32.2 | Certification of the Chief Financial Officer, pursuant to 18 U.S.C. Section 1350, as adopted pursuant to Section 906 of the Sarbanes-Oxley Act of 2002 |
*101 | The following financial information from the Annual Report on Form 10-K for the year ended December 31, 2015, formatted in XBRL ("Extensible Business Reporting Language") and furnished electronically herewith: (i) the Consolidated Statements of Income; (ii) the Consolidated Statements of Comprehensive Income (iii) the Consolidated Balance Sheets; (iv) the Consolidated Statements of Cash Flow; (v) the Consolidated Statements of Equity; and (vi) the Notes to the Consolidated Financial Statements. |
* Filed herewith.
** Management contract or compensatory plan or arrangement.
101
SIGNATURES
Pursuant to the requirements of Section 13 or 15(d) of the Securities Exchange Act of 1934, the registrant has duly caused this report to be signed on its behalf by the undersigned thereunto duly authorized.
Date: February 29, 2016
HEARTLAND PAYMENT SYSTEMS, INC.
(Registrant)
By: /s/ Robert O. Carr
Robert O. Carr
Chief Executive Officer
(Principal Executive Officer)
By: /s/ Samir M. Zabaneh
Samir M. Zabaneh
Chief Financial Officer
(Principal Financial and Accounting Officer)
Pursuant to the requirements of the Securities Exchange Act of 1934, this report has been signed below by the following persons on behalf of the registrant and in the capacities indicated on February 29, 2016.
SIGNATURE | TITLE | |
/s/ ROBERT O. CARR | Chairman of the Board and Chief Executive Officer | |
Robert O. Carr | (Principal Executive Officer) | |
/s/ SAMIR M. ZABANEH | Chief Financial Officer | |
Samir M. Zabaneh | (Principal Financial and Accounting Officer) | |
/s/ MAUREEN BREAKIRON-EVANS | Director | |
Maureen Breakiron-Evans | ||
/s/ MITCHELL L. HOLLIN | Director | |
Mitchell L. Hollin | ||
/s/ ROBERT H. NIEHAUS | Director | |
Robert H. Niehaus | ||
/s/ MARC J. OSTRO | Director | |
Marc J. Ostro | ||
/s/ JONATHAN PALMER | Director | |
Jonathan Palmer | ||
/s/ RICHARD W. VAGUE | Director | |
Richard W. Vague | ||
102
Exhibit Index
Exhibit Number | Description |
2.2 | Agreement and Plan of Merger dated September 29, 2000 by and among Heartland Payment Systems, Inc., Uhle and Associates, LLC, Martin J. Uhle, Mark K. Strippy and Steven B. Gamary. (Incorporated by reference to Exhibit 2.2 to the Registrant's Registration Statement on Form 10 filed on August 9, 2005 (File No. 000-51265)) |
2.3 | Agreement and Plan of Merger dated September 29, 2000 by and between Heartland Payment Systems, Inc. and Triad LLC. (Incorporated by reference to Exhibit 2.2 to the Registrant's Registration Statement on Form 10 filed on August 9, 2005 (File No. 000-51265)). |
2.4 | Agreement and Plan of Merger dated as of December 28, 2000 by and between Heartland Payment Systems, Inc. and Heartland Payment Systems L.L.C. (Incorporated by reference to Exhibit 2.2 to the Registrant's Registration Statement on Form 10 filed on August 9, 2005 (File No. 000-51265)). |
2.5 | Agreement of Merger dated as of June 14, 2004 by and between Heartland Payment Systems, Inc. and Credit Card Software Systems, Inc. (Incorporated by reference to Exhibit 2.2 to the Registrant's Registration Statement on Form 10 filed on August 9, 2005 (File No. 000-51265)). |
2.6 | Agreement and Plan of Merger, dated as of July 29, 2014, by and among Heartland Payment Systems, Inc., Titan Merger Sub, Inc., TouchNet Information Systems, Inc., and TNSR, LLC, as the Representative. (Incorporated by reference to Exhibit 2.1 to the Registrant’s Current Report on Form 8-K filed on July 29, 2014 (File No. 001-32594)). |
2.7 | Agreement and Plan of Merger, dated December 15, 2015, by and among Heartland Payment Systems, Inc., Global Payments, Inc. Data Merger Sub One, Inc. and Data Merger Sub Two, LLC. (Incorporated by reference to Exhibit 2.1 to the Registrant’s Current Report on Form 8-K filed on December 17, 2015 (File No. 001-32594)). |
3.1 | Amended and Restated Certificate of Incorporation of Heartland Payment Systems, Inc. (Incorporated by reference to Exhibit 3.3 to the Registrant's Registration Statement on Form S-1, as amended, filed on March 29, 2005. (File No. 333-118073)). |
3.2 | Amended and Restated Bylaws of Heartland Payment Systems, Inc. (Incorporated by reference to Exhibit 3.2 to the Registrant's Annual Report on Form 10-K filed on March 10, 2008 (File No. 001-32594)). |
4.1 | Stockholder Agreement, dated as of July 29, 2014, by and between Heartland Payment Systems, Inc. and each of the individuals or entities listed on the signature pages thereto. (Incorporated by reference to Exhibit 4.1 to the Registrant’s Current Report on Form 8-K filed on July 31, 2014 (File No. 001-32594)). |
10.1 | Lease Agreement dated September 2004, between Heartland Payment Systems, Inc. and Bank of America, N.A. (Incorporated by reference to Exhibit 10.19 to the Registrant's Registration Statement on Form S-1, as amended, filed on March 29, 2005 (File No. 333-118073)). |
10.2 | First Amendment to Lease Agreement, dated March 17, 2005, between Heartland Payment Systems, Inc. and First States Investors 5200, LLC (Incorporated by reference to Exhibit 10.20 to the Registrant's Registration Statement on Form S-1, as amended, filed on March 29, 2005 (File No. 333-118073)). |
10.3 | Extension of Lease between Heartland Payment Systems, Inc. and 90 Nassau LLC dated as of January 11, 2013. (Incorporated by reference to Exhibit 10.5 to the Registrant's Annual Report on Form 10-K filed on February 28, 2014) (File No. 001-32594). |
10.4** | Heartland Payment Systems, Inc. Amended and Restated 2000 Equity Incentive Plan (Incorporated by reference to Exhibit 10.21 to the Registrant's Registration Statement on Form S-1, as amended (File No. 333-118073)). |
10.5** | Form of Employee Incentive Stock Option Agreement Under 2000 Equity Incentive Plan (Incorporated by reference to Exhibit 10.22 to the Registrant's Registration Statement on Form S-1, as amended (File No. 333-118073)). |
10.6 | Form of Indemnification Agreement (Incorporated by reference to Exhibit 10.26 to the Registrant's Registration Statement on Form S-1, as amended (File No. 333-118073)). |
10.7** | Heartland Payment Systems, Inc. Second Amended and Restated 2000 Equity Incentive Plan (Incorporated by reference to Exhibit 10.28 to the Registrant's Registration Statement on Form S-1, as amended (File No. 333-118073)). |
10.8** | Form of Nonqualified Stock Option Agreement. (Incorporated by reference to Exhibit 10.32 to the Registrant's Quarterly Report on Form 10-Q filed on August 11, 2006 (File No. 001-32594)). |
10.9** | Form of Employee Confidential Information and Noncompetition Agreement entered into by Robert H.B. Baldwin, Jr. with Heartland Payment Systems, Inc. (Incorporated by reference to Exhibit 10.34 to the Registrant's Quarterly Report on Form 10-Q filed on August 11, 2006 (File No. 001-32594)). |
10.10** | Supplement No. I to Employee Confidential Information and Noncompetition Agreement by and between Robert H.B. Baldwin, Jr. and Heartland Payment Systems, Inc. (Incorporated by reference to Exhibit 10.35 to the Registrant's Quarterly Report on Form 10-Q filed on August 11, 2006 (File No. 001-32594)). |
10.11** | Amended and Restated Employee Confidential Information and Noncompetition Agreement dated May 4, 2007 entered into by Robert O. Carr with Heartland Payment Systems, Inc. (Incorporated by reference to Exhibit 10.37 to the Registrant's Current Report on Form 8-K filed on May 4, 2007 (File No. 001-32594)). |
10.12 | American Express Establishment Sales and Servicing Program Agreement dated as of December 20, 2007 between Heartland Payment Systems, Inc. and American Express Travel Related Services Company. (Incorporated by reference to Exhibit 10.41 to the Registrant's Annual Report on Form 10-K filed on March 10, 2008 (File No. 001-32594)). |
103
Exhibit Number | Description |
10.13** | Heartland Payment Systems, Inc. 2008 Equity Incentive Plan. (Incorporated by reference to Exhibit 10.1 to the Registrant's Quarterly Report on Form 10-Q filed on August 8, 2008 (File No. 001-32594)). |
10.14 | Membership Interest and Asset Purchase Agreement dated as of May 2, 2008, by and among Alliance Data Network Services LLC, ADS Alliance Data Systems, Inc., Alliance Data Systems Corporation, Heartland Acquisition, LLC and Heartland Payment Systems, Inc. (Incorporated by reference to Exhibit 10.1 to the Registrant's Current Report on Form 8-K filed on May 8, 2008 (File No. 001-32594)). |
10.15** | Form of Employee Incentive Stock Option Agreement Under 2008 Equity Incentive Plan. (Incorporated by reference to Exhibit 4.5 to the Registrant's Registration Statement on Form S-8 filed on November 19, 2008 (File No. 333-155450)). |
10.16** | Form of Employee Restricted Stock Unit Agreement. (Incorporated by reference to Exhibit 10.46 to the Registrant's Quarterly Report on Form 10-Q filed on August 7, 2009 (File No. 001-32594)). |
10.17** | Amendment No. I to Amended and Restated Employee Confidential Information and Noncompetition Agreement dated May 11, 2009 entered into by Robert O. Carr with Heartland Payment Systems, Inc. (Incorporated by reference to Exhibit 10.47 to the Registrant's Quarterly Report on Form 10-Q filed on August 7, 2009 (File No. 001-32594)). |
10.18** | Amendment and Restatement of Heartland Payment Systems, Inc.'s 2008 Equity Incentive Plan (Incorporated by reference to Exhibit 10.1 to the Company's Current Report on Form 8-K filed on May 18, 2010 (File No. 001-32594)). |
10.19 | International Swaps and Derivatives Association, Inc. 2002 Master Agreement dated as of December 30, 2010 between Heartland Payment Systems, Inc. and Bank of America, N.A.. (Incorporated by reference to Exhibit 10.67 to the Registrant's Annual Report on Form 10-K filed on March 10, 2011 (File No. 001-32594)). |
10.20** | Form of Performance-Based Employee Restricted Stock Unit Agreement (Incorporated by reference to Exhibit 10.1 to the Registrant's Quarterly Report on Form 10-Q filed on May 6, 2011 (File No. 001-32954)). |
10.21** | Form of Time Vesting Restricted Stock Unit Agreement. (Incorporated by reference to Exhibit 10.74 to the Registrant's Annual Report on Form 10-K filed on February 28, 2012 (File No. 001-32594)). |
10.22** | Form of Performance-Based Restricted Stock Unit Agreement. (Incorporated by reference to Exhibit 10.75 to the Registrant's Annual Report on Form 10-K filed on February 28, 2012 (File No. 001-32594)). |
10.23 | Merchant Financial Services Agreement with Wells Fargo Bank, N.A dated February 8, 2012. (Incorporated by reference to Exhibit 10.1 to the Registrant's Quarterly Report on Form 10-Q filed on May 7, 2012 (File No. 001-32594)). |
10.24 | Amendment No. 1 to the Merchant Financial Services Agreement between Wells Fargo Bank, N.A. and Heartland Payment Systems, Inc. dated April 30, 2012. (Incorporated by reference to Exhibit 10.2 to the Registrant's Quarterly Report on Form 10-Q filed on May 7, 2012 (File No. 001-32594)). |
10.25** | Offer Letter between David Gilbert and Heartland Payment Systems, Inc. dated May 21, 2012. (Incorporated by reference to Exhibit 10.5 to the Registrant's Quarterly Report on Form 10-Q filed on August 6, 2012 (File No. 001-32594)). |
10.26 | Employee Confidential Information and Noncompetition Agreement between David Gilbert and Heartland Payment Systems, Inc. dated June 14, 2012. (Incorporated by reference to Exhibit 10.6 to the Registrant's Quarterly Report on Form 10-Q filed on August 6, 2012 (File No. 001-32594)). |
10.27** | Offer Letter between Ian M. Drysdale and Heartland Payment Systems, Inc. dated July 9, 2012. (Incorporated by reference to Exhibit 10.7 to the Registrant's Quarterly Report on Form 10-Q filed on August 6, 2012 (File No. 001-32594)). |
10.28** | Employee Confidential Information and Noncompetition Agreement between Ian M. Drysdale and Heartland Payment Systems, Inc. dated July 9, 2012. (Incorporated by reference to Exhibit 10.8 to the Registrant's Quarterly Report on Form 10-Q filed on August 6, 2012 (File No. 001-32594)). |
10.29** | Employee Confidential Information and Noncompetition Agreement between Michael A. Lawler and Heartland Payment Systems, Inc. dated July 13, 2012. (Incorporated by reference to Exhibit 10.9 to the Registrant's Quarterly Report on Form 10-Q filed on August 6, 2012 (File No. 001-32594)). |
10.30 | Merchant BIN and ICA Sponsorship and Services Agreement entered into by and between Heartland Payment Systems, Inc. and The Bancorp Bank as of November 23, 2009. (Incorporated by reference to Exhibit 10.1 to Amendment No. 1 to the Registrant's Quarterly Report on Form 10-Q filed on February 20, 2013 (File No. 001-32594)). |
10.31** | Form of Total Shareholder Return Performance Restricted Stock Unit Agreement. (Incorporated by reference to Exhibit 10.63 to the Registrant’s Annual Report on Form 10-K filed on March 1, 2013 (File No. 001-32594)). |
10.32** | Form of Absolute Shareholder Return Performance Restricted Share Agreement. (Incorporated by reference to Exhibit 10.47 to the Registrant’s Annual Report on Form 10-K filed on February 28, 2014 (File No. 001-32594)). |
10.33 | Credit Agreement dated October 23, 2013, among Heartland Payment Systems, Inc., the lenders party to the Credit Agreement from time to time, Bank of America, N.A., as administrative agent, swingline lender and letter of credit issuer, SunTrust Bank and KeyBank National Association, as joint syndication agents, Wells Fargo Bank, National Association, as documentation agent, and Merrill Lynch, Pierce, Fenner & Smith Incorporated, SunTrust Robinson Humphrey, Inc. and KeyBank Capital Markets, as joint lead arranges and joint book managers. (Incorporated by reference to Exhibit 10.1 to the Registrant's Current Report on Form 8-K filed on October 29, 2013 (File No. 001-32594)). |
10.34 | Intercreditor Agreement dated October 23, 2013 by and among Heartland Payment Systems, Inc. , as borrower, Wells Fargo, as sponsor, and Bank of America, N.A., as bank group administrative agent. (Incorporated by reference to Exhibit 10.3 to the Registrant's Current Report on Form 8-K filed on October 29, 2013 (File No. 001-32594)). |
104
Exhibit Number | Description |
10.35 | ISDA Amendment dated October 23, 2013, among Heartland Payment Systems, Inc. and Bank of America, N.A. (Incorporated by reference to Exhibit 10.5 to the Registrant's Current Report on Form 8-K filed on October 29, 2013 (File No. 001-32594)). |
10.36 | Uncommitted Revolving Line of Credit Agreement, dated July 20, 2012 by and among Wells Fargo Bank, National Association, as lender and as sponsor bank, Heartland Payment Systems, Inc. and each guarantor thereto. (Incorporated by reference to Exhibit 10.1 to the Registrant's Current Report on Form 8-K filed on July 26, 2012 (File No. 001-32594)). |
10.37 | Uncommitted Revolving Line of Credit Note, dated July 20, 2012 between Heartland Payment Systems, Inc. and Wells Fargo Bank, National Association. (Incorporated by reference to Exhibit 10.2 to the Registrant's Current Report on Form 8-K filed on July 26, 2012 (File No. 001-32594)). |
10.38 | First Amendment to Uncommitted Revolving Line of Credit Agreement dated as of July 22, 2013, by and among Heartland Payment Systems, Inc., the Guarantors party thereto, and Wells Fargo Bank, National Association. (Incorporated by reference to Exhibit 10.1 to the Registrant’s Current Report on Form 8-K filed on July 23, 2013 (File No. 001-32594)). |
10.39 | Second Amendment to Uncommitted Revolving Line of Credit Agreement dated as of October 17, 2013, by and among Heartland Payment Systems, Inc. and Wells Fargo Bank, National Association. (Incorporated by reference to Exhibit 10.1 to the Registrant’s Current Report on Form 8-K filed on October 23, 2013 (File No. 001-32594)). |
10.40 | Summary of Compensatory Arrangements with non-employee directors. (Incorporated by reference to Exhibit 10.64 to the Registrant’s Annual Report on Form 10-K for the Year Ended December 31, 2013 filed on February 28, 2014 (File No. 001-32594)). |
10.41** | Employee Confidential Information and Noncompetition Agreement dated March 28, 2014, by and between Samir M. Zabaneh, and Heartland Payment Systems, Inc. (Incorporated by reference to Exhibit 10.1 to the Registrant’s Quarterly Report on Form 10-Q filed on May 7, 2014 (File No. 001-32594)). |
10.42** | Samir M. Zabaneh Offer Letter Dated March 28, 2014. (Incorporated by reference to Exhibit 10.2 to the Registrant’s Quarterly Report on Form 10-Q filed on May 7, 2014 (File No. 001-32594)). |
10.43 | Amended and Restated Credit Agreement dated September 14, 2014, among Heartland Payment Systems, Inc., the lenders party to the Credit Agreement from time to time, Bank of America, N.A. as administrative agent, swingline lender and letter of credit issuer, SunTrust Bank and BMO Harris Bank, N.A., as joint syndication agents, and Merrill Lynch, Pierce, Fenner & Smith Incorporated, SunTrust Robinson Humphrey, Inc. and BMO Capital Markets, as joint lead arranges and joint book managers. (Incorporated by reference to Exhibit 10.1 to the Registrant’s Current Report on Form 8-K, filed on September 8, 2014 (File No. 001-32594)). |
10.44 | Amended and Restated Collateral Agreement dated September 4, 2014, among Heartland Payment Systems, Inc. certain of its subsidiaries as guarantors and Bank of America, N.A. (Incorporated by reference to Exhibit 10.2 to the Registrant’s Current Report on Form 8-K, filed on September 8, 2014 (File No. 001-32594)). |
10.45 | Amended and Restated Subsidiary Guaranty dated September 4, 2014, among certain of Heartland Payment Systems, Inc. subsidiaries as guarantors and Bank of America, N.A. (Incorporated by reference to Exhibit 10.3 to the Registrant’s Current Report on Form 8-K, filed on September 8, 2014 (File No. 001-32594)). |
10.46 | Fourth Amendment to Uncommitted Revolving Line of Credit, dated as of September 24, 2014 by and among Heartland Payment Systems, Inc., the Guarantors party thereto, and Wells Fargo National Association, in its capacity as lender and as sponsor bank. (Incorporated by reference to Exhibit 10.1 to the Registrant’s Current Report on Form 8-K, filed on September 29, 2014 (File No. 001-32594)). |
*21.1 | List of Subsidiaries of Registrant. |
*23.1 | Consent of Deloitte & Touche LLP. |
*31.1 | Certification of the Chief Executive Officer, pursuant to Rule 13a-14(a)/15d-14(a), as adopted pursuant to Section 302 of the Sarbanes-Oxley Act of 2002 |
*31.2 | Certification of the Chief Financial Officer, pursuant to Rule 13a-14(a)/15d-14(a), as adopted pursuant to Section 302 of the Sarbanes-Oxley Act of 2002 |
*32.1 | Certification of the Chief Executive Officer, pursuant to 18 U.S.C. Section 1350, as adopted pursuant to Section 906 of the Sarbanes-Oxley Act of 2002 |
*32.2 | Certification of the Chief Financial Officer, pursuant to 18 U.S.C. Section 1350, as adopted pursuant to Section 906 of the Sarbanes-Oxley Act of 2002 |
*101 | The following financial information from the Annual Report on Form 10-K for the year ended December 31, 2015, formatted in XBRL ("Extensible Business Reporting Language") and furnished electronically herewith: (i) the Consolidated Statements of Income; (ii) the Consolidated Statements of Comprehensive Income (iii) the Consolidated Balance Sheets; (iv) the Consolidated Statements of Cash Flow; (v) the Consolidated Statements of Equity; and (vi) the Notes to the Consolidated Financial Statements. |
* Filed herewith.
** Management contract or compensatory plan or arrangement
105