Attached files
| file | filename |
|---|---|
| 8-K - 8-K - Alexander & Baldwin, Inc. | v432917_8k.htm |
Exhibit 99.1
Alexander & Baldwin, Inc. Real Estate Supplement As of and for the Years Ended December 31, 2015 and 2014 (unaudited)
ABOUT THIS SUPPLEMENT This periodic Supplement is designed to provide current and potential shareholders of Alexander & Baldwin, Inc. with addition al information regarding the Company’s Real Estate operating segments. This information is supplemental to and does not replace the informat ion provided to shareholders in the Company’s periodic filings with the Securities and Exchange Commission. The information contained in this Supplement is unaudited and should be read in conjunction with the Company’s quarterly and ann ual reports and other filings with the Securities and Exchange Commission. The Company intends to provide periodic updates to the informa tio n contained herein, but is not required, and undertakes no obligation, to revise or update forward - looking statements or any factors that ma y affect actual results, whether as a result of new information, future events, or circumstances occurring after the dates on the cover of th is Supplement. Feedback and suggestions regarding the contents of this Supplement are welcomed, and should be directed to Suzy P. Hollinger, Di rector, Investor Relations, via telephone at (808) 525 - 8422 or via email to shollinger@abinc.com. 2

INDEX TO REAL ESTATE SUPPLEMENT (Unaudited) As of Years Ended December 31, 2015 and 2014 Forward - Looking Statements 5 Basis of Presentation 5 Periodic Updates 6 About the Company 7 Landholdings 10 Landholdings 10 Landholdings by Geographic Location (Table 1) 11 Landholdings Under Joint Venture Development (Table 2) 11 Landholdings by Type and Location (Table 3) 12 A&B Ag Zoned Land Sales Data – Maui and Kauai – 2008 to 2015 (Table 4) 13 A&B Urban/Entitled Zoned Land Sales Data – Maui and Kauai – 2008 to 2015 (Table 4) 13 Real Estate Development & Sales 14 Segment Strategy and Operations 15 Real Estate Development & Sales Overview (Table 5) 16 Reconciliation of Acreage Under Development (Table 5) to Landholdings (Table 3) (Table 6) 18 Active Planning and Development Project Information Sheets 19 Future Development Project Summaries 29 Entitlement Activity 30 3
INDEX TO REAL ESTATE SUPPLEMENT (Unaudited) As of Years Ended December 31, 2015 and 2014 Real Estate Leasing 31 Segment Strategy and Operations 32 Asset Descriptions and Statistics 35 Property Detail – Hawaii (Table 7) 35 Property Detail – Mainland ( Table 8) 37 Comparable % Occupancy Data by Geographic Region and Asset Class (Table 9) 38 Weighted Average Gross Leasable Area by Geographic Region and Asset Class (Table 10) 38 Occupancy Trend Analysis - Last Five Quarters (Table 11) 38 Real Estate Leasing Net Operating Income (NOI) (Table 12) 39 Real Estate Leasing Same Store NOI (Table 13) 39 Statement on Management’s Use of Non - GAAP Financial Measures 40 Reconciliation of Real Estate Leasing Operating Profit to NOI and Same Store NOI (Non - GAAP) (Table 14) 40 Portfolio Acquisitions and Dispositions 41 2015 and 2014 Property Portfolio Acquisitions/Dispositions ( Table 15) 41 Lease Renewal Analysis 42 Lease Expirations (Table 16) 42 Portfolio Concentrations 43 Tenant Concentrations as of 12/31/15 (Table 17) 43 Hawaii Commercial Property Information Sheets 44 Mainland Commercial Property Information Sheets 61 4

FORWARD - LOOKING STATEMENTS This Supplement contains certain forward - looking statements, such as forecasts and projections of the Company’s future performance or statements of management’s plans and objectives . Statements in this Supplement that are not historical facts are forward - looking statements, as that term is defined in the Private Securities Litigation Reform Act of 1995 . Forward - looking statements include, for example, all references to current or future years . New risk factors emerge from time to time and it is not possible for the Company to predict all such risk factors, nor can it assess the impact of all such risk factors on the Company’s business or the extent to which any factor, or combination of factors, may cause actual results to differ materially from those contained in any forward - looking statements . Accordingly, forward - looking statements cannot be relied upon as a guarantee of future results and involve a number of risks and uncertainties that could cause actual results to differ materially from those projected in the statements, including, but not limited to the factors that are described in Part I, Item 1 A under the caption of “Risk Factors” of the Company’s Form 10 - K, as well as factors that are described in the Company’s other filings, including subsequent filings, with the Securities and Exchange Commission (“SEC”) . The Company is not required, and undertakes no obligation, to revise or update forward - looking statements or any factors that may affect actual results, whether as a result of new information, future events, or circumstances occurring after the date of this report . BASIS OF PRESENTATION The information contained in this Supplement does not purport to disclose all items required by accounting principles generally accepted in the United States of America (GAAP) . The information contained in this Supplement is unaudited and should be read in conjunction with the Company’s most recent Form 10 - K and other filings with the SEC . 5

PERIODIC UPDATES The Company provides quarterly updates, but undertakes no obligation to continue to provide updates, of the information conta ine d in the tables listed below: Table 7: Property Detail – Hawaii Table 8: Property Detail – Mainland Table 9: Comparable % Occupancy Data by Geographic Region and Asset Class Table 10: Weighted Average Gross Leasable Area by Geographic Region and Asset Class Table 11: Occupancy Analysis Trend – Last Five Quarters Table 12: Real Estate Leasing NOI Table 13: Real Estate Leasing Same Store NOI Table 14: Reconciliation of Real Estate Leasing Operating Profit to NOI and Same Store NOI (Non - GAAP) Table 15: Improved Property Portfolio Acquisitions/Dispositions For detailed information on past quarters, refer to the quarterly supplements for 2015, which are available on the Company’s website at www.alexanderbaldwin.com. The Company currently intends to update all other information contained herein on an annual basis. 6

ABOUT THE COMPANY Alexander & Baldwin, Inc . (“A&B” or “Company”) is a Hawaii - based company, with interests in commercial real estate, real estate development, agriculture , materials and construction . Founded in 1870 , the Company has evolved from its agricultural roots into complementary businesses serving the real estate, agricultural, and materials and construction needs of Hawaii . A&B’s operations also include 10 commercial properties and two development joint ventures on the U . S . Mainland . A&B has significant landholdings in Hawaii ; at December 31 , 2015 , the Company owned 87 , 715 acres in the state, primarily on the islands of Maui and Kauai . A&B is responsible for the stewardship of this land and the long - term enhancement of its value . The vast majority of this land was acquired over 100 years ago to support the cultivation of sugar cane . For a significant portion of the Company’s core Hawaii landholdings, agriculture and related uses represent the highest and best use for the foreseeable future, providing significant benefits to the community and shareholders alike . In total, roughly 86 , 900 acres of the Company’s land, including land leased to others, are currently designated for agriculture and conservation uses (the latter consisting mainly of the collection and transport of water for irrigation purposes and hydroelectric power production) . A&B cultivates sugar on nearly 36 , 000 acres (including land leased from third parties) in Maui’s Central Valley . In January 2016 , the Company announced the transition out of farming sugar to pursue a diversified agricultural model for its plantation . Sugar operations will be phased out by the end of 2016 , and the transition to a new model will occur over a multi - year period . Under the new diversified model, the plantation will be divided up into smaller farms with varied agricultural uses, potentially including energy crops, food crops, support for the local cattle industry, and the development of an agricultural park . On Kauai, A&B leases roughly 5 , 100 acres to third parties engaged in a variety of agricultural activities, including cultivation of coffee and seed corn, and raising of livestock . The Company also utilizes its land assets to produce renewable energy, including hydroelectric and solar photovoltaic generation facilities . A&B’s integrated approach to land management enables lands that are suitable for development to be employed at their highest and best use by undertaking planning, entitlement and development activities, where appropriate, to enhance the value of the Company’s lands, while addressing market demand and community needs . By identifying and pursuing developments and transactions that enhance the value of raw landholdings, and reinvesting proceeds from these efforts into new developments and commercial properties, A&B creates value for shareholders and diversifies its income stream . The Company’s development activities, once limited to its legacy landholdings on Maui and Kauai, have expanded to encompass lands newly acquired for development and the participation in a number of development joint ventures throughout Hawaii . This expansion of the Company’s development activities has allowed it to leverage its expertise, market knowledge and capital resources, while also mitigating risk . 7

ABOUT THE COMPANY REAL ESTATE Real estate development and leasing activities are conducted by A&B Properties, Inc . (“A&B Properties”), a wholly owned subsidiary of A&B, and various other subsidiaries and affiliates of A&B . The Company’s real estate business consists of two segments that principally operate in Hawaii : Development & Sales and Leasing . The Development & Sales segment creates value through an active and comprehensive program of land stewardship, planning, entitlement, investment, development and sale of land and commercial and residential properties . The Leasing segment generates significant, stable, recurring cash flows through the ownership, operation and management of a portfolio of high - quality retail, office and industrial properties in Hawaii and on the Mainland, as well as ground leases in Hawaii . Cash generated by this portfolio serves as an important source of funding for A&B's real estate development activities . MATERIALS & CONSTRUCTION Materials and construction operations are primarily conducted by Grace Pacific LLC (“Grace”), a wholly owned subsidiary of A&B . Grace mines, processes and sells basalt aggregate, imports sand and aggregates for sale and use, imports and markets liquid asphalt, manufactures and markets asphaltic concrete, performs asphalt paving as a prime contractor and subcontractor, manufactures and supplies precast/prestressed concrete products and provides and markets various construction - and traffic - control - related services and products . Grace was acquired by A&B on October 1 , 2013 . AGRIBUSINESS Agribusiness operations are conducted by Hawaiian Commercial & Sugar Company (“HC&S”), a division of A&B, and certain other wholly owned subsidiaries of A&B . Agribusiness produces and sells bulk raw sugar, specialty food - grade sugars and molasses, and is also a renewable energy provider on the island of Kauai through hydroelectric and solar facilities . In January 2016 , the Company announced the transition out of farming sugar to pursue a diversified agricultural model for its plantation . Sugar operations will be phased out by the end of 2016 , and the transition to a new model will occur over a multi - year period . Under the new diversified model, the plantation will be divided up into smaller farms with varied agricultural uses, potentially including energy crops, food crops, support for the local cattle industry, and the development of an agricultural park . This segment, which operates exclusively in Hawaii, also includes support services for other agricultural operations and includes general trucking services, mobile equipment maintenance and repair services . More information about the Company can be found at www . alexanderbaldwin . com . 8
ABOUT THE COMPANY CORPORATE HEADQUARTERS Alexander & Baldwin, Inc. 822 Bishop Street Honolulu, HI 96813 INVESTOR RELATIONS Suzy P. Hollinger Director, Investor Relations Tel: (808) 525 - 8422 Email: shollinger@abinc.com WEBSITES Alexander & Baldwin, Inc. www.alexanderbaldwin.com A&B Properties, Inc. www.abprop.com Grace Pacific LLC www.gracepacific.com Hawaiian Commercial & Sugar Company www.hcsugar.com TRANSFER AGENT & REGISTRAR Computershare P.O. BOX 30170 College Station, TX 77842 - 3170 OVERNIGHT CORRESPONDENCE Computershare 211 Quality Circle, Suite 210 College Station, TX 77845 SHAREHOLDER WEBSITE www.computershare.com/investor SHAREHOLDER ONLINE INQUIRIES https://www - us.computershare.com/investor/Contact STOCK EXCHANGE LISTING NYSE: ALEX 9
LANDHOLDINGS

LANDHOLDINGS As of December 31 , 2015 , A&B and its subsidiaries owned 87 , 870 acres, consisting of 87 , 715 acres in Hawaii and 155 acres on the Mainland . 11 TABLE 1 LANDHOLDINGS BY GEOGRAPHIC LOCATION December 31 , 2015 Table 1 does not include 1 , 016 acres held under joint venture development (see Table 2 below) . The Company also leases an additional 2 , 900 acres on Maui, Kauai, and Oahu from third parties, which are not included in the tables that follow . TABLE 2 LANDHOLDINGS UNDER JOINT VENTURE DEVELOPMENT December 31 , 2015 Location Acres Maui 65,725 Kauai 20,280 Oahu 1,435 Molokai 265 Big Island 10 Total Hawaii 87,715 California 54 Utah 41 Texas 20 Nevada 21 Arizona 19 Total U.S. Mainland 155 Total landholdings 87,870 Project Original acres Acres at 12/31/15 Kukui’ula (HI) 1,000 917 California joint ventures 75 75 Ka Milo (HI) 31 14 Keala o Wailea (HI) 7 7 The Collection (HI) 3 3 Total 1,116 1,016
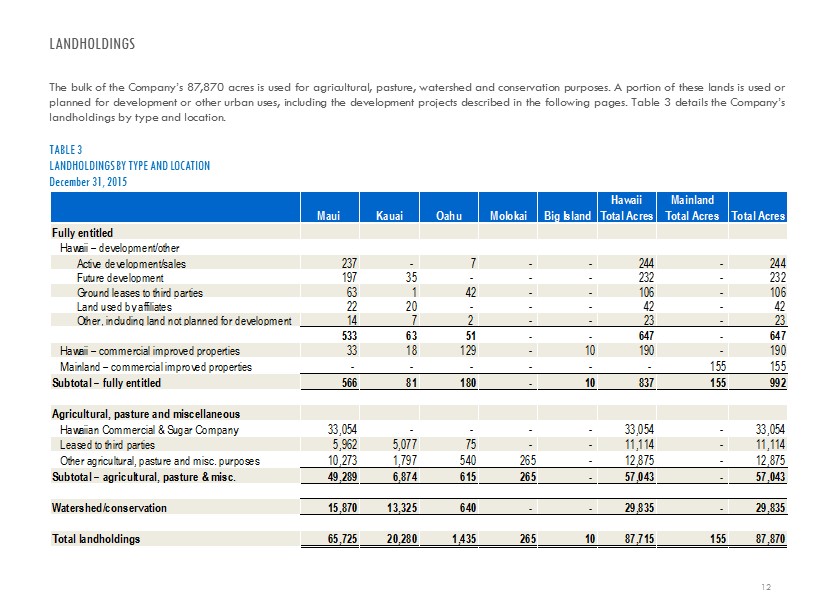
LANDHOLDINGS The bulk of the Company’s 87 , 870 acres is used for agricultural, pasture, watershed and conservation purposes . A portion of these lands is used or planned for development or other urban uses, including the development projects described in the following pages . Table 3 details the Company’s landholdings by type and location . 12 TABLE 3 LANDHOLDINGS BY TYPE AND LOCATION December 31 , 2015 Maui Kauai Oahu Molokai Big Island Hawaii Total Acres Mainland Total Acres Total Acres Fully entitled Hawaii – development/other Active development/sales 237 - 7 - - 244 - 244 Future development 197 35 - - - 232 - 232 Ground leases to third parties 63 1 42 - - 106 - 106 Land used by affiliates 22 20 - - - 42 - 42 Other, including land not planned for development 14 7 2 - - 23 - 23 533 63 51 - - 647 - 647 Hawaii – commercial improved properties 33 18 129 - 10 190 - 190 Mainland – commercial improved properties - - - - - - 155 155 Subtotal – fully entitled 566 81 180 - 10 837 155 992 Agricultural, pasture and miscellaneous Hawaiian Commercial & Sugar Company 33,054 - - - - 33,054 - 33,054 Leased to third parties 5,962 5,077 75 - - 11,114 - 11,114 Other agricultural, pasture and misc. purposes 10,273 1,797 540 265 - 12,875 - 12,875 Subtotal – agricultural, pasture & misc. 49,289 6,874 615 265 - 57,043 - 57,043 Watershed/conservation 15,870 13,325 640 - - 29,835 - 29,835 Total landholdings 65,725 20,280 1,435 265 10 87,715 155 87,870

LANDHOLDINGS 13 TABLE 4 A&B AG ZONED LAND SALES DATA – MAUI AND KAUAI 2008 - 2015 A&B URBAN/ENTITLED ZONED LAND SALES DATA – MAUI AND KAUAI 2008 - 2015 Total acres sold Average price per acre High Low 0-5 acres 19 117,500$ 175,000$ 85,000$ 5-20 acres 115 65,600 167,800 24,300 20-100 acres 647 29,400 55,700 13,750 100+ acres 1,326 20,750 29,000 11,300 Total 2,107 26,700$ 175,000$ 11,300$ Average annual acres sold 2008 through 2015 263 Total acres sold Average price per square foot High Low 0-3 Acres 15 49.00$ 105.60$ 10.00$ 3-25 Acres 72 39.80$ 64.60$ 16.50$

REAL ESTATE DEVELOPMENT & SALES

REAL ESTATE DEVELOPMENT & SALES SEGMENT STRATEGY AND OPERATIONS The Real Estate Development & Sales segment generates its operating profit through the development and sale of pipeline projects, raw lands, real estate investments, commercial properties from the Real Estate Leasing segment portfolio, and the equity in earnings of joint ventures . The Development & Sales segment primarily seeks to create shareholder value through an active, comprehensive, Hawaii - focused program of land stewardship, planning, entitlement, investment, development and sale of real estate . The segment’s primary strategic objectives include : FOCUS ON ENTITLEMENT AND DEVELOPMENT OF LEGACY HAWAII LANDS A&B focuses on the development of a portion of its core landholdings in Hawaii, pursuing entitlement and development projects that respond to market demand while meeting community needs . The large amount of land that the Company owns on Maui and Kauai provides opportunities for A&B to serve a wide range of markets . INVEST IN HIGH - RETURNING REAL ESTATE OPPORTUNITIES IN HAWAII In addition to the development of its legacy lands, since 1998 A&B has invested in attractive development opportunities across Hawaii, leveraging market knowledge, expertise , experience and financial strength to both create shareholder value and diversify its development portfolio and pipeline . EXPAND PIPELINE PROJECTS A&B’s pipeline of development projects encompasses a broad range of real estate product types, including residential and commercial properties . A&B works to continuously expand this pipeline to meet current and future market demand . UTILIZE STRATEGIC JOINT VENTURES WITH A WIDE VARIETY OF PARTNERS A&B pursues joint ventures and other strategic relationships, where appropriate, to supplement its in - house capabilities, access third - party capital, gain access to new opportunities in the Hawaii market, diversify its pipeline, and optimize risk - adjusted returns . 15

Project Location Product type Est. economic interest 1 Acres at 12/31/15 Planned units, saleable acres or gross leasable square feet Average unit (sf) or lot size (acres) Units/acres closed through 12/31/15 Targeted sales price range per square foot or NOI Est. project cost 2 A&B Projected Capital Commitment (JVs Only) 3 A&B Capital Invested A&B net investment as of 12/31/15 A&B capital est. 2016 4 Start/Est. start Est. substantial completion Start/Est. start Est. end Wholly owned (100% economic interest) Kahala Avenue Portfolio Honolulu, Oahu Residential 6 30 lots 0.5 acres 21 lots $150-$385 135 134 51 1 n/a n/a 2013 2018 Kamalani Kihei, Maui Primary residential 95 630 units tbd - tbd tbd 3 3 - 2016 2023 2017 2023 Maui Business Park II 5 Kahului, Maui Light industrial lots 125 136 acres 0.5 - 11 acres 30 acres $38-$60 96 77 45 9 2011 2021 2012 2028 Mililani Mauka South Mililani, Oahu Retail/Office developed for commercial portfolio 1 18,500 sf n/a - $0.7M stabilized NOI 8 7 7 1 2014 2016 n/a n/a The Ridge at Wailea (MF-19) Wailea, Maui Resort residential 6 9 lots (4.5 acres) 0.5 acres 1 lot $60-$100 10 9 9 - 2007 2009 2014 n/a Wailea B-1 Wailea, Maui Commercial/retail 11 60,000 sf tbd - tbd tbd 5 5 - tbd tbd tbd tbd Total 244 Joint ventures Ka Milo at Mauna Lani Kona, Hawaii Resort residential 50% 14 137 units 2,000 sf 76 units $530-$800 125 16 16 10 - 2005 2018 2007 2018 Keala o Wailea (MF-11) Wailea, Maui Resort residential 65%+/-5% 7 70 units 1,440 sf - $600-$1,000 63 10 9 9 - 2015 2018 2017 2018 Kukui'ula Poipu, Kauai Resort residential 85% +/- 5% 917 Up to 1,500 units on 640 saleable acres 0.42 acres 134 lots $40-$110 854 295 285 276 6 2006 2030 6 2006 2030 The Collection Honolulu, Oahu Primary residential/commercial 90% +/-5% 3 465 units (464 saleable) 904 sf - $575-$951 285 55 53 49 - 2014 2016 2016 2017 Total 941 Investments Keauhou Place Honolulu, Oahu B-note financing 423 units 35 - - 13 2015 2017 2015 2017 FUTURE DEVELOPMENT Wholly owned Aina 'O Kane Kahului, Maui Primary residential/commercial 4 Brydeswood Kalaheo, Kauai Agricultural lots 336 Haliimaile Haliimaile, Maui Primary residential 55 Kai Olino Port Allen, Kauai Primary residential 4 Wailea SF-8 Kihei, Maui Primary residential 13 Wailea MF-6 Wailea, Maui Resort residential lots 23 Wailea MF-7 Wailea, Maui Resort residential 13 Wailea MF-10 Wailea, Maui Resort/commercial 7 Wailea MF-16 Wailea, Maui Resort residential lots 7 Wailea, other Wailea, Maui Various 76 Total 538 ACTIVE PLANNING, DEVELOPMENT & SALES Sales Closings Timing(Dollars in millions) Construction timing Table 5 provides an overview of the Company’s wholly owned and joint venture development projects, and is further supplemented by project information sheets that follow the table . TABLE 5 REAL ESTATE DEVELOPMENT AND SALES OVERVIEW December 31 , 2015 16

17 TABLE 5 (CONTINUED) REAL ESTATE DEVELOPMENT AND SALES OVERVIEW December 31 , 2015 1 Economic interest represents the Company’s estimated share of distributions after return of capital contributions, based o n c urrent forecasts of sales activity. Actual results could differ materially from projected results due to the timing of expected sales, increases or decreases in estimated sales pr ices or costs and other factors. As a result, estimated economic interests are subject to change. 2 Includes land cost at book value and capitalized interest, but excludes sales commissions and closings costs . 3 Includes land cost at contribution value and total expected A&B capital to be contributed. The estimate includes due diligence costs and capitalized interest, but exc lud es capital projected to be contributed by equity partners, third - party debt, and amounts expected to be funded from project cash flows and/or buyer deposits. 4 Estimated 2016 capital is dependent on a number of factors, including timing of sales proceeds, project costs, construction p rog ress and timing of any additional government approvals, such as building permits. As a result, estimated capital expenditures, sales or leasing timing are subject to chan ge. 5 Includes 19 acres of roadways and other infrastructure that are not saleable. 6 Represents estimated completion date for major project infrastructure and amenities. Construction activities related to parce l d evelopment will be ongoing. Project Location Product type Est. economic interest 1 Acres at 12/31/15 Planned units, saleable acres or gross leasable square feet Average unit (sf) or lot size (acres) Units/acres closed through 12/31/15 Targeted sales price range per square foot or NOI Est. project cost 2 A&B Projected Capital Commitment (JVs Only) 3 A&B Capital Invested A&B net investment as of 12/31/15 A&B capital est. 2016 4 Start/Est. start Est. substantial completion Start/Est. start Est. end FUTURE DEVELOPMENT (Continued) Joint ventures Bakersfield Bakersfield, CA Retail 57 7 Palmdale Center Palmdale, CA Office/Industrial 18 5 Total 75 ENTITLEMENT Ele'ele Community Phase I Ele'ele, Kauai Primary residential 260 tbd Wai'ale Kahului, Maui Primary residential 545 up to 2,550 units Total 805 Sales Closings Timing(Dollars in millions) Construction timing
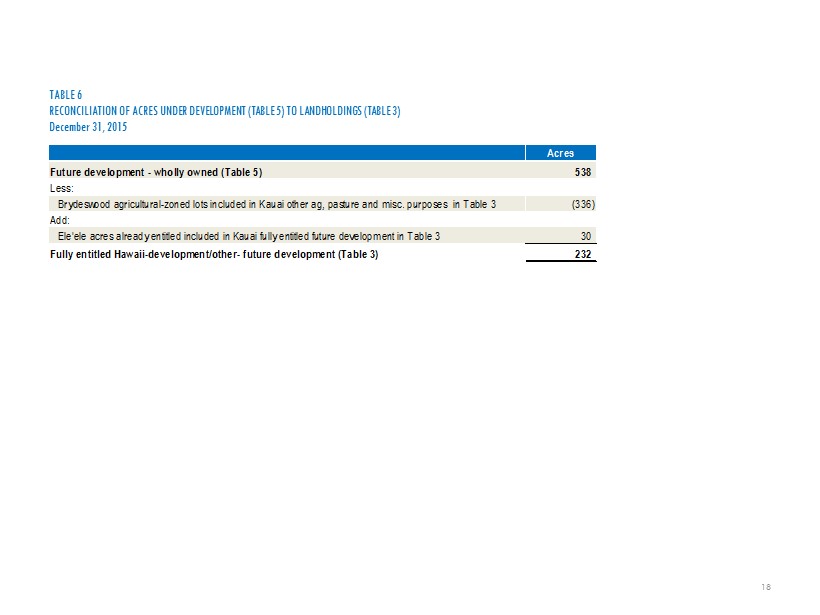
18 TABLE 6 RECONCILIATION OF ACRES UNDER DEVELOPMENT (TABLE 5 ) TO LANDHOLDINGS (TABLE 3 ) December 31 , 2015 Acres Future development - wholly owned (Table 5) 538 Less: Brydeswood agricultural-zoned lots included in Kauai other ag, pasture and misc. purposes in Table 3 (336) Add: Ele'ele acres already entitled included in Kauai fully entitled future development in Table 3 30 Fully entitled Hawaii-development/other- future development (Table 3) 232

ACTIVE PLANNING AND DEVELOPMENT PROJECT INFORMATION SHEETS ACTIVE DEVELOPMENT Wholly Owned Kahala Avenue Portfolio 21 Kamalani 21 Maui Business Park II 22 Mililani Mauka South – Office 22 Wailea 23 The Ridge at Wailea (MF - 19) 24 Wailea B - I 24 Joint Venture Ka Milo at Mauna Lani 25 Keala o Wailea (MF - II) 25 Kukui‘ula 26 The Collection 27 Investments Keauhou Place 28 19

ACTIVE PLANNING AND DEVELOPMENT PROJECT INFORMATION SHEETS FUTURE DEVELOPMENTS Wholly Owned Aina ‘O Kane 29 Brydeswood 29 Kahului Town Center 29 Kai Olino 29 Wailea Parcels 29 ENTITLEMENT ACTIVITY Ele`ele Community 30 Wai`ale Community 30 20
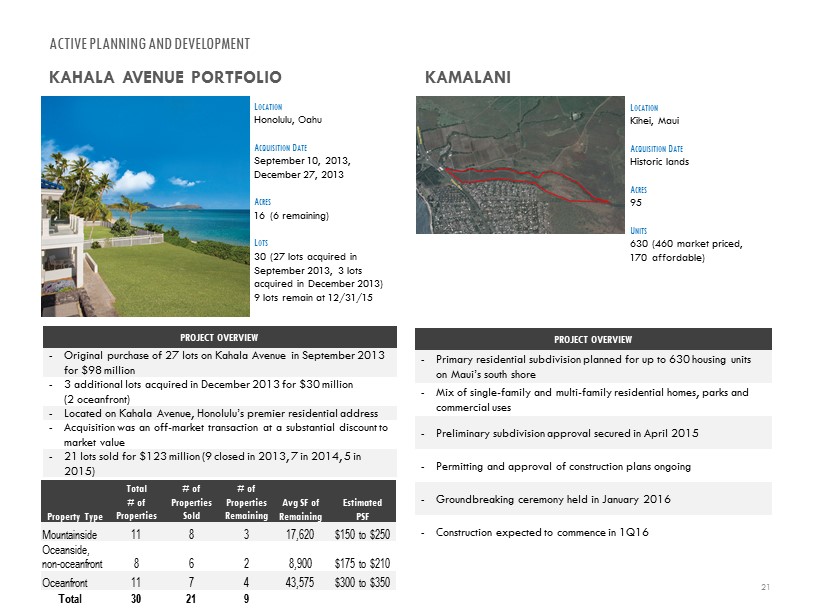
PROJECT OVERVIEW - Original purchase of 27 lots on Kahala Avenue in September 2013 for $98 million - 3 additional lots acquired in December 2013 for $30 million (2 oceanfront) - Located on Kahala Avenue, Honolulu’s premier residential address - Acquisition was an off - market transaction at a substantial discount to market value - 21 lots sold for $123 million (9 closed in 2013, 7 in 2014, 5 in 2015) - Of 9 remaining lots, 71% of remaining square feet is high value oceanfront lots ACTIVE PLANNING AND DEVELOPMENT KAHALA AVENUE PORTFOLIO KAMALANI L OCATION Honolulu, Oahu A CQUISITION D ATE September 10, 2013, December 27, 2013 A CRES 16 (6 remaining) L OTS 30 (27 lots acquired in September 2013, 3 lots acquired in December 2013) 9 lots remain at 12/31/15 PROJECT OVERVIEW - Primary residential subdivision planned for up to 630 housing units on Maui’s south shore - Mix of single - family and multi - family residential homes, parks and commercial uses - Preliminary subdivision approval secured in April 2015 - Permitting and approval of construction plans ongoing - Groundbreaking ceremony held in January 2016 - Construction expected to commence in 1Q16 L OCATION Kihei, Maui A CQUISITION D ATE Historic lands A CRES 95 U NITS 630 (460 market priced, 170 affordable) 21 Property Type Total # of Properties # of Properties Sold # of Properties Remaining Avg SF of Remaining Estimated PSF Mountainside 11 8 3 17,620 $150 to $250 Oceanside, non - oceanfront 8 6 2 8,900 $175 to $210 Oceanfront 11 7 4 43,575 $300 to $350 Total 30 21 9
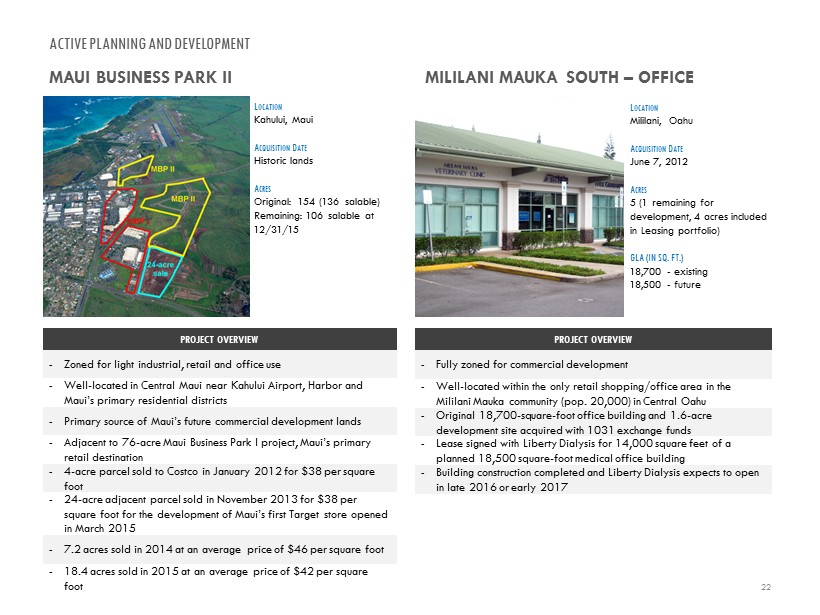
PROJECT OVERVIEW - Zoned for light industrial, retail and office use - Well - located in Central Maui near Kahului Airport, Harbor and Maui’s primary residential districts - Primary source of Maui’s future commercial development lands - Adjacent to 76 - acre Maui Business Park I project, Maui’s primary retail destination - 4 - acre parcel sold to Costco in January 2012 for $ 38 per square foot - 24 - acre adjacent parcel sold in November 2013 for $38 per square foot for the development of Maui’s first Target store opened in March 2015 - 7.2 acres sold in 2014 at an average price of $46 per square foot - 18.4 acres sold in 2015 at an average price of $42 per square foot ACTIVE PLANNING AND DEVELOPMENT MAUI BUSINESS PARK II MILILANI MAUKA SOUTH – OFFICE L OCATION Kahului, Maui A CQUISITION D ATE Historic lands A CRES Original: 154 (136 salable) Remaining: 106 salable at 12/31/15 PROJECT OVERVIEW - Fully zoned for commercial development - Well - located within the only retail shopping/office area in the Mililani Mauka community (pop. 20,000) in Central Oahu - Original 18,700 - square - foot office building and 1.6 - acre development site acquired with 1031 exchange funds - Lease signed with Liberty Dialysis for 14,000 square feet of a planned 18,500 square - foot medical office building - Building c onstruction completed and Liberty Dialysis expects to open in late 2016 or early 2017 L OCATION Mililani, Oahu A CQUISITION D ATE June 7, 2012 A CRES 5 (1 remaining for development, 4 acres included in Leasing portfolio) GLA (IN SQ. FT.) 18,700 - existing 18,500 - future 22

ACTIVE PLANNING AND DEVELOPMENT WAILEA 23 A&B was the original developer of the Wailea Resort on Maui, beginning in the 1970 s and continuing until A&B sold the resort in 1989 . In October 2003 , A&B re - acquired from the same purchaser all of the remaining undeveloped land in the resort, consisting of 270 acres of fully zoned, residential and commercial land, for $ 67 . 1 million . This map shows the sites (outlined in red) that were reacquired in 2003 . Since that time, the Golf Vistas, sites MF - 15 , MF - 9 , MF - 5 , MF - 4 and portions of sites MF - 10 ( 6 . 4 acres) and B - II ( 0 . 9 acres) have been sold or developed and MF - 8 was contributed to the Kai Malu joint venture . MF - 11 was contributed to the Keala o Wailea joint venture . A&B has approximately 160 acres of developable land remaining in the Wailea resort planned for up to 700 units ; 24 a cres are in active development and/or being marketed for sale . Future development or Sale Active development Sold ACTIVE DEVELOPMENT Wholly Owned The Ridge at Wailea (MF - 19), B - I Joint Ventures Keala o Wailea (MF - II) FUTURE DEVELOPMENT OR SALE MF - 6, MF - 7, MF - 10, MF - 12, MF - 13, MF - 16, B - II, SF - 7, SF - 8, SF - S

WAILEA ACTIVE DEVELOPMENT 24 ACTIVE DEVELOPMENT THE RIDGE AT WAILEA (MF - 19) - The Ridge at Wailea (MF - 19) consists of nine, half - acre, oceanview estate lots situated on 4.5 saleable acres. One lot sold in 2014 for $1.6 million ($70 per square foot). Eight lots remain available for sale. WAILEA B - 1 - The 11 - acre B - 1 parcel, which contains the only approved gas station site within the Wailea master plan, is planned for a retail commercial center with approximately 60,000 square feet of leasable space. Preliminary planning and design work was completed and bulk sale or development is being pursued.
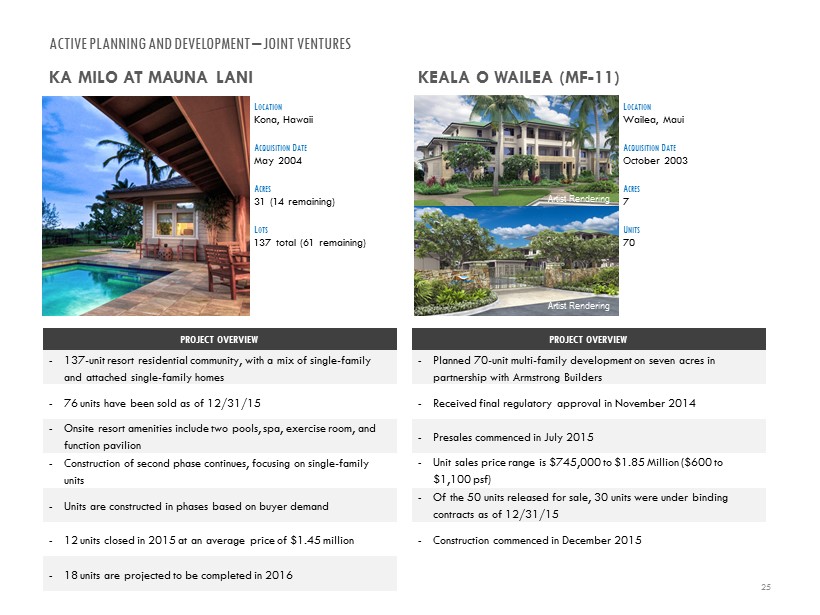
Artist Rendering Artist Rendering KEALA O WAILEA (MF - 11) L OCATION Wailea, Maui A CQUISITION D ATE October 2003 A CRES 7 U NITS 70 PROJECT OVERVIEW - 137 - unit resort residential community, with a mix of single - family and attached single - family homes - 76 units have been sold as of 12/31/15 - Onsite resort amenities include two pools, spa, exercise room, and function pavilion - Construction of second phase continues, focusing on single - family units - Units are constructed in phases based on buyer demand - 12 units closed in 2015 at an average price of $1.45 million - 18 units are projected to be completed in 2016 KA MILO AT MAUNA LANI L OCATION Kona, Hawaii A CQUISITION D ATE May 2004 A CRES 31 ( 14 remaining) L OTS 137 total (61 remaining) PROJECT OVERVIEW - Planned 70 - unit multi - family development on seven acres in partnership with Armstrong Builders - Received final regulatory approval i n November 2014 - Presales commenced in July 2015 - Unit sales price range is $745,000 to $1.85 Million ($600 to $1,100 psf) - Of the 50 units released for sale, 30 units were under binding contracts as of 12/31/15 - Construction commenced in December 2015 ACTIVE PLANNING AND DEVELOPMENT – JOINT VENTURES 25

PROJECT OVERVIEW - Luxury resort residential community in Poipu, Kauai for the development of up to 1,500 residential units on 1,000 fully entitled acres - Joint venture with DMB Associates, developer of premier master - planned residential communities - Resort amenities - 75,000 sq. ft. private club - Owners plantation house and golf club houses - World - class spas, pools, fitness center, movement studio - Weiskopf - designed championship golf course - Community lake and farm - Beach pool, bar and grill - Property types - Premiere Estate Lot – 2+ acres ($5.8M) - Club Villas – 3 to 4 - bedroom, single - family, ocean view homes ($4M - $5M) - Club Cottages – 3 - bedroom, furnished homes ($2.6M - $3M) - Club Bungalows – 1 to 3 - bedroom homes ($1.5M - $3M) - Club Villas – 4 - bedroom homes ($4M - $5M) - Custom Home Lots – 10,000 sf to 2.5 acres ($0.6M - $10M) - Custom Homes – 3 to 4 - bedroom homes, developer - sponsored ($2.5M - $8M) - 31 units closed or sold under binding contracts as of February 25, 2016 - 136 units closed; 89 units available as of February 25 , 2016 - 46 homes completed and 48 homes planned for construction in 2016 ACTIVE PLANNING AND DEVELOPMENT – JOINT VENTURES KUKUI‘ULA L OCATION Poipu, Kauai A CQUISITION D ATE Historic lands A CRES 1,000 ( 917 remaining) U NITS Up to 1,500 26 FINANCIAL & CAPITAL OVERVIEW - Kukui’ula is a long - term, master planned project, designed to accommodate high - end resort residential growth on Kauai’s south shore over the next 15 to 25 years, and significant fluctuations in annual absorption over that time frame can be expected. The Company experienced similar absorption fluctuations over the course of its earlier, highly successful Wailea project. - Sufficient project infrastructure is in place today to sell about 280 additional acres (500 to 800 units). Future infrastructure requirements would be paid for from project cash flows. - GAAP accounting for the project differs from cash flows, due to percentage of completion accounting. - Total capital contributions to the venture as of December 31, 2015, were $250 million by A&B and $ 30 million for the value of land contributed, and $190 million by DMB .

PROJECT OVERVIEW - Mixed - use residential community to include high - rise tower, mid - rise building and townhomes, as well as retail shops and restaurants - Capital stack finalized and construction loans secured - Broke ground in October 2014 - Development costs expected to range from $625 - $675 psf (excludes commissions and closing costs) - As of December 31, 2015, 100% of the 396 tower units and 54 mid - rise units were sold under binding contracts at an average price of $787 and $747 per square foot, respectively - As of December 31, 2015, four of the 14 available townhomes are sold under binding contracts at an average price of $951 per square foot - Expected completion of construction in late 2016 THE COLLECTION L OCATION Honolulu, Oahu A CQUISITION D ATE October 6, 2014. Site was controlled under a long - term option agreement from February 2012 until just prior to land acquisition. A CRES 3.3 U NITS 465 (464 saleable) ACTIVE PLANNING AND DEVELOPMENT – JOINT VENTURES 27
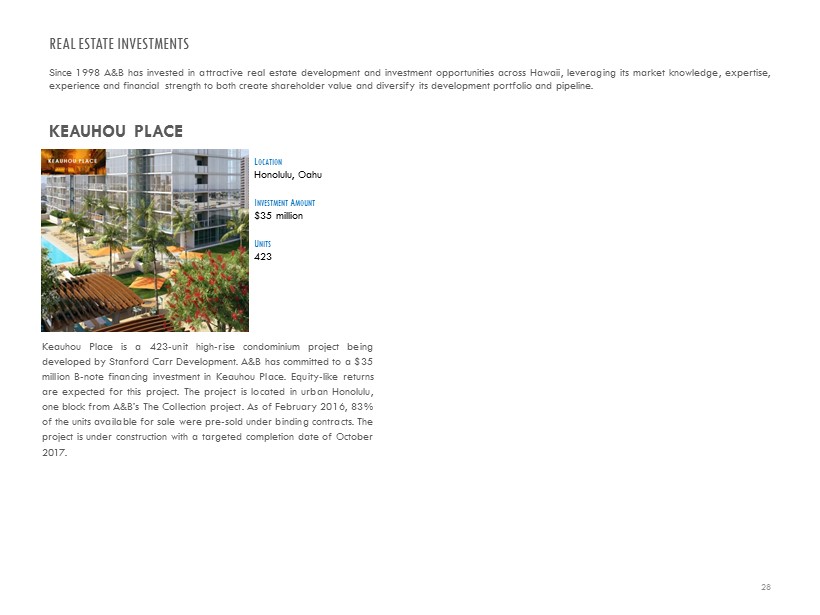
KEAUHOU PLACE L OCATION Honolulu, Oahu I NVESTMENT A MOUNT $35 million U NITS 423 REAL ESTATE INVESTMENTS 28 Keauhou Place is a 423 - unit high - rise condominium project being developed by Stanford Carr Development . A&B has committed to a $ 35 million B - note financing investment in Keauhou Place . Equity - like returns are expected for this project . The project is located in urban Honolulu, one block from A&B’s The Collection project . As of February 2016 , 83 % of the units available for sale were pre - sold under binding contracts . The project is under construction with a targeted completion date of October 2017 . Since 1998 A&B has invested in attractive real estate development and investment opportunities across Hawaii, leveraging its market knowledge, expertise , experience and financial strength to both create shareholder value and diversify its development portfolio and pipeline .

FUTURE DEVELOPMENT PROJECT SUMMARIES 29 HAWAII SUMMARY AINA ‘O KANE (MAUI) A residential condominium development with ground - floor commercial space on 4 acres in Kahului, Maui. BRYDESWOOD (KAUAI) Brydeswood is planned for 24 large agricultural lots encompassing 336 acres in Kalaheo, Kauai. HALIIMAILE (MAUI) Primary residential subdivision planned in Upcountry, Maui. Project planned to include 175 to 200 single - and multi - family units. 10 acres are allocated for a park. KAI OLINO (KAUAI) Kai‘ Olino is planned for 75 condominium units on four acres located at the Port Allen harbor on the island of Kauai. WAILEA PARCELS (MAUI) See page 23 for description

ENTITLEMENT ACTIVITY Successful land entitlement is a challenging, yet critical step in the development process . Similar to other high - demand, high - quality locales with a limited supply of land suitable for development, the entitlement process in Hawaii is complex, lengthy (spanning multiple years) and costly, involving a variety of state and county regulatory approvals . For example, conversion of an agriculturally zoned parcel to residential zoning usually requires the following approvals : - County amendment of the county general plan and community plan to reflect the desired residential use ; - State Land Use Commission (SLUC) reclassification of the parcel from the Agricultural district to the Urban district ; and - County rezoning of the property to the precise residential use desired . A&B actively works with regulatory agencies, commissions and legislative bodies at various levels of government to entitle lands . A&B designates a parcel as fully entitled or fully zoned when all of the above - mentioned land use approvals have been obtained . Ongoing planning and entitlement efforts are focused on the following projects : 30 ELE`ELE COMMUNITY (KAUAI) The Ele`ele Community Master Plan is an 840 - acre new primary residential community east of Port Allen on Kauai . The 260 - acre first phase is being pursued through Kauai’s multi - year General Plan Update Process, which commenced in 2013 . As part of the General Plan update process, infrastructure, land use and demographic technical studies have been completed and the formal general plan update should be completed in two years . Support for future growth in these areas will continue to be pursued through the general plan update . WAI`ALE COMMUNITY (MAUI) Wai`ale is a 545 - acre master - planned community located in Central Maui . The project has been designated for urban growth in the Maui General Plan to accommodate up to 2 , 550 primary housing units, together with parks, civic and commercial uses . In 2012 , the State Land Use Commission approved Urban designation for the project . The project master plan is being adjusted to best match anticipated residential market conditions, with more detailed land planning focused on the initial phase of the project, located south of Waiko Road . Plans for the initial phase include up to 950 homes on 123 acres . County land use applications, including updated technical studies and project design standards, were submitted in February 2015 . In November 2015 the Maui Planning Commission recommended approval, and hearings before the Maui County Council are expected to be scheduled in 2016 .

REAL ESTATE LEASING

REAL ESTATE LEASING SEGMENT STRATEGY AND OPERATIONS The Real Estate Leasing segment owns, operates and manages commercial properties . It focuses on acquiring high - quality retail, office and industrial properties in good locations, and effectively managing those properties to increase margins through higher occupancies and cost management . Real Estate Leasing income also includes revenue from a variety of land leases, licenses and other agreements related to real estate in Hawaii . From a strategic perspective, the relatively stable, recurring cash flows generated by the Real Estate Leasing business are used primarily to backstop the financing required for the more cyclical Real Estate Development & Sales business . As of December 31 , 2015 , A&B’s portfolio includes 58 income - producing properties comprising 4 . 9 million square feet of gross leasable area ( 2 . 7 million in Hawaii and 2 . 2 million on the Mainland) . Upon sale of a commercial asset, A&B will seek to redeploy the proceeds on a 1031 tax - deferred basis into a new asset with a higher return potential . The Company also may invest proceeds from sales of parcels into commercial assets with via 1031 exchanges . In 2012 , A&B increased its focus on Hawaii and began executing a strategy of migrating its investment in Mainland commercial assets to Hawaii . Since then, the Company has more than doubled its NOI from Hawaii assets and, with the acquisition of the 139 , 000 - square - foot Manoa Marketplace (Honolulu, Hawaii) in January 2016 , more than 80 % of the commercial portfolio NOI is now being generated from Hawaii assets . A&B is the second largest owner of retails assets and the largest owner of grocery/drug - anchored retail centers in Hawaii . The Company owns 1 . 8 million square feet of retail space strategically located in key communities throughout the islands, particularly on Oahu where it has 1 . 5 million square feet . NOI increased 8 . 5 % 1 in 2015 and 12 . 4 % in 2014 due to Hawaii portfolio expansion and portfolio migration in 2013 . See Table 15 for additional information on the Company’s commercial property acquisitions and dispositions in 2015 and 2014 . 32 1 See Table 14 for a statement regarding the Company’s use of NOI and a reconciliation of Leasing operating profit to NOI for t he total portfolio .

REAL ESTATE LEASING SEGMENT STRATEGY AND OPERATIONS (CONTINUED) PORTFOLIO SEGMENT DESCRIPTION HAWAII IMPROVED PROPERTIES A&B’s Hawaii improved property portfolio consists of 48 retail, office and industrial properties, comprising approximately 2 . 7 million square feet of leasable space . The majority of the commercial properties are located on Maui and Oahu, with smaller holdings in the area of Port Allen, Kauai, and the Big Island of Hawaii . KAILUA GROUND LEASES The Company leases and licenses portions of its land in Kailua on Oahu to third parties, which are categorized as “Kailua ground leases . ” These leases and licenses are developed with 270 , 000 square feet of retail and industrial commercial improvements owned by the lessees, and cover 20 acres . OTHER OAHU GROUND LEASES The Company leases and licenses portions of its land in urban Oahu, which is categorized as “Other Oahu ground leases,” to third parties . These leases and licenses are developed with 400 , 000 square feet of retail commercial improvements owned by the lessees, and cover 22 acres . 33
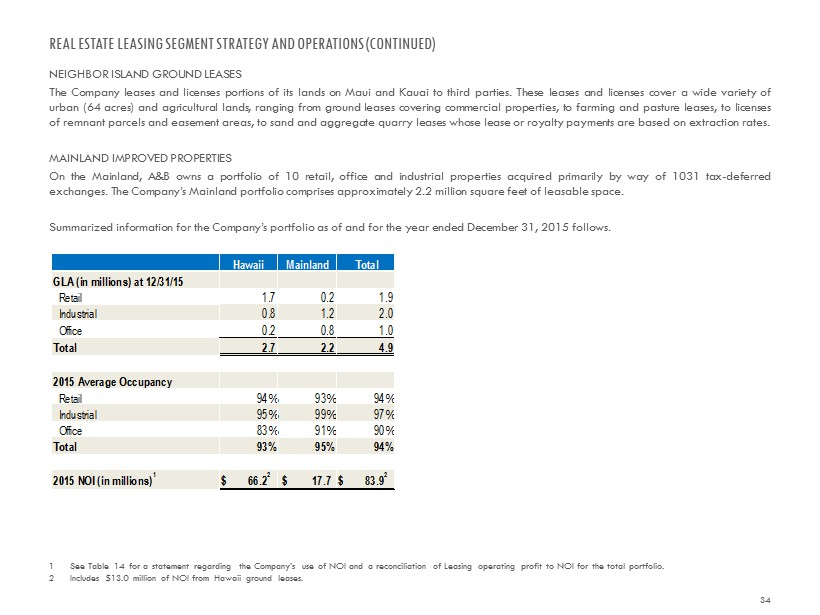
REAL ESTATE LEASING SEGMENT STRATEGY AND OPERATIONS (CONTINUED) NEIGHBOR ISLAND GROUND LEASES The Company leases and licenses portions of its lands on Maui and Kauai to third parties . These leases and licenses cover a wide variety of urban ( 64 acres) and agricultural lands, ranging from ground leases covering commercial properties, to farming and pasture leases, to licenses of remnant parcels and easement areas, to sand and aggregate quarry leases whose lease or royalty payments are based on extraction rates . MAINLAND IMPROVED PROPERTIES On the Mainland, A&B owns a portfolio of 10 retail, office and industrial properties acquired primarily by way of 1031 tax - deferred exchanges . The Company’s Mainland portfolio comprises approximately 2 . 2 million square feet of leasable space . Summarized information for the Company’s portfolio as of and for the year ended December 31 , 2015 follows . 34 1 See Table 14 for a statement regarding the Company’s use of NOI and a reconciliation of Leasing operating profit to NOI for t he total portfolio. 2 Includes $13.0 million of NOI from Hawaii ground leases. Hawaii Mainland Total GLA (in millions) at 12/31/15 Retail 1.7 0.2 1.9 Industrial 0.8 1.2 2.0 Office 0.2 0.8 1.0 Total 2.7 2.2 4.9 2015 Average Occupancy Retail 94% 93% 94% Industrial 95% 99% 97% Office 83% 91% 90% Total 93% 95% 94% 2015 NOI (in millions) 1 $ 66.2 2 $ 17.7 $ 83.9 2

REAL ESTATE LEASING SEGMENT – ASSET DESCRIPTIONS AND STATISTICS Tables 7 and 8 provide detail on the Company’s commercial real estate portfolio . 35 TABLE 7 PROPERTY DETAIL - HAWAII For the Year Ended 12 / 31 / 15 , Except as Indicated Table 7 continued on the next page. Property Number of properties Island Gross leasable area at 12/31/15 (sq. ft.) Leased 1 2015 (percent) Outstanding debt at 12/31/15 ($ in 000s) 2015 net operating income (NOI) 2 ($ in 000s) 2015 % NOI to total Hawaii portfolio Retail: Pearl Highlands Center 1Oahu 415,400 97 91,835$ $ 9,234 13.9 Kailua Retail 3 16Oahu 414,300 94 10,992 11,580 17.5 Waianae Mall 1Oahu 170,300 87 - 2,242 3.4 Kaneohe Bay Shopping Center 4 1Oahu 125,100 99 - 2,203 3.3 Waipio Shopping Center 1Oahu 113,800 95 - 3,145 4.7 The Shops at Kukui'ula 1Kauai 89,000 95 37,033 2,657 4.0 Lanihau Marketplace 1Hawaii 88,300 99 - 1,774 2.7 Kunia Shopping Center 1Oahu 60,400 91 - 2,132 3.2 Lahaina Square 1Maui 50,200 76 - 544 0.8 Kahului Shopping Center 1Maui 49,700 99 - 513 0.8 Napili Plaza 1Maui 45,700 88 - 1,051 1.6 Gateway at Mililani Mauka 1Oahu 34,900 90 - 1,191 1.8 Port Allen Marina Center 1Kauai 23,600 81 - 406 0.6 Subtotal – Retail 28 1,680,700 94 139,860$ $ 38,672 58.3 Industrial: Komohana Industrial Park 5 1Oahu 238,300 100 -$ $ 4,074 6.1 Kakaako Commerce Center 1Oahu 204,400 90 - 2,183 3.3 Waipio Industrial 1Oahu 158,400 99 - 2,173 3.3 P&L Building 1Maui 104,100 93 - 1,169 1.8 Kailua Industrial/Other 6Oahu 68,800 97 - 648 1.0 Port Allen 3Kauai 63,800 88 - 560 0.8 Subtotal – Industrial 13 837,800 95 -$ $ 10,807 16.3

REAL ESTATE LEASING SEGMENT – ASSET DESCRIPTIONS AND STATISTICS 36 TABLE 7 (CONT . ) PROPERTY DETAIL - HAWAII For the Year Ended 12 / 31 / 15 , Except as Indicated 1 Represents the average percentage of space leased during the period referenced or A&B’s ownership period, whichever is sho rte r. Space is considered leased when a tenancy agreement has been fully executed or the space is revenue producing. 2 See Table 14 for a statement regarding the Company’s use of NOI and a reconciliation of Leasing operating profit to NOI fo r t he total portfolio. Excludes properties sold in the year. 3 On May 1, 2015, the Company acquired the ground leasee’s interest in Aikahi Park Shopping Center in Kailua. NOI prior to the clo se date is included in Kailua Ground Leases and NOI after the close date is included in Kailua Retail. 4 Kaneohe Bay Shopping Center is a leasehold property. 5 Includes ground leased income. 6 NOI was lower due to a tenant rent credit in the fourth quarter related to the impact of a fire at the building. 7 Includes 64 of ground leased urban acres. Note: For portfolio asset class and geographic occupancy see Table 9. Gross leasable area is periodically adjusted based on rem easurement or reconfiguration of space. Property Number of properties Island Gross leasable area at 12/31/15 (sq. ft.) Leased 1 2015 (percent) Outstanding debt at 12/31/15 ($ in 000s) 2015 net operating income (NOI) 2 ($ in 000s) 2015 % NOI to total Hawaii portfolio Office: Kahului Office Building 1 Maui 59,600 82 -$ $ 1,343 2.0 Kahului Office Center 1 Maui 33,400 90 - 860 1.3 Stangenwald Building 1 Oahu 27,100 85 - 340 0.5 Judd Building 6 1 Oahu 20,200 77 - 100 0.2 Gateway at Mililani Mauka South 1 Oahu 18,700 100 - 711 1.1 Maui Clinic Building 1 Maui 16,600 51 - 110 0.2 Lono Center 1 Maui 13,700 93 - 269 0.4 Subtotal – Office 7 189,300 83 -$ $ 3,733 5.7 Ground Leases Kailua 3 20 acres Oahu - -$ $ 4,465 6.7 Other Oahu 22 acres Oahu - - 4,818 7.3 Neighbor Island 2,691 acres 7 Neighbor Island - - 3,749 5.7 Subtotal – Ground Leases 2,733 acres - -$ $ 13,032 19.7 Total Hawaii 48 2,707,800 93 139,860$ $ 66,244 100.0

REAL ESTATE LEASING SEGMENT – ASSET DESCRIPTIONS AND STATISTICS 37 TABLE 8 PROPERTY DETAIL - MAINLAND For the Year Ended 12 / 31 / 15 , Except as Indicated 1 Represents the average percentage of space leased during the period referenced or A&B’s ownership period, whichever is sho rte r. Space is considered leased when a tenancy agreement has been fully executed or the space is revenue producing. 2 See Table 14 for a statement regarding the Company’s use of NOI and a reconciliation of Leasing operating profit to NOI fo r t he total portfolio. Excludes properties sold in the year . Note: For portfolio asset class and geographic occupancy see Table 9. Gross leasable area is periodically adjusted based on rem easurement or reconfiguration of space. Property Number of properties Location Gross leasable area at 12/31/15 (sq. ft.) Leased 1 2015 (percent) Outstanding debt at 12/31/15 ($ in 000s) 2015 net operating income (NOI) 2 ($ in 000s) 2015 % NOI to total Mainland portfolio Retail: Little Cottonwood Center 1Sandy, UT 141,500 93 -$ 1,446$ 9.0 Royal MacArthur Center 1Dallas, TX 44,800 95 - 1,024 6.4 Subtotal – Retail 2 186,300 93 -$ 2,470$ 15.4 Industrial: Midstate Hayes 1Visalia, CA 790,200 100 8,243$ 2,902$ 18.1 Sparks Business Center 1Sparks, NV 396,100 97 - 1,714 10.7 Subtotal – Industrial 2 1,186,300 99 8,243$ 4,616$ 28.8 Office: 1800 and 1820 Preston Park 1Plano, TX 198,800 90 -$ 2,461$ 15.4 Ninigret Office Park 1Salt Lake City, UT 185,500 100 - 1,862 11.7 2868 Prospect Park 1Sacramento, CA 163,300 100 - 2,115 13.2 Concorde Commerce Center 1Phoenix, AZ 138,700 92 - 1,544 9.7 Deer Valley Financial Center 1Phoenix, AZ 126,600 71 - 436 2.7 Gateway Oaks 1Sacramento, CA 59,700 92 - 500 3.1 Subtotal – Office 6 872,600 91 -$ 8,918$ 55.8 Total Mainland 10 2,245,200 95 8,243$ 16,004$ 100.0
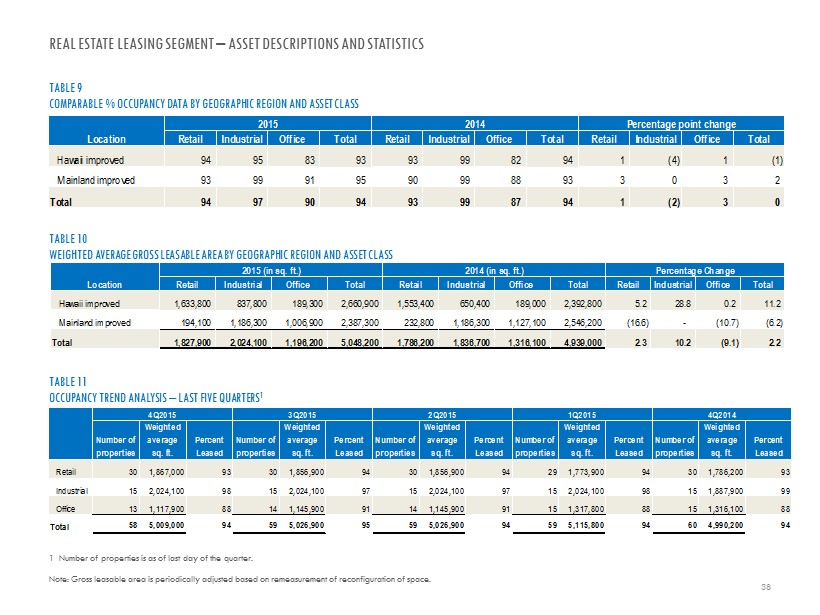
REAL ESTATE LEASING SEGMENT – ASSET DESCRIPTIONS AND STATISTICS 38 TABLE 9 COMPARABLE % OCCUPANCY DATA BY GEOGRAPHIC REGION AND ASSET CLASS 1 Number of properties is as of last day of the quarter. Note : Gross leasable area is periodically adjusted based on remeasurement of reconfiguration of space. TABLE 10 WEIGHTED AVERAGE GROSS LEASABLE AREA BY GEOGRAPHIC REGION AND ASSET CLASS TABLE 11 OCCUPANCY TREND ANALYSIS – LAST FIVE QUARTERS 1 Location Retail Industrial Office Total Retail Industrial Office Total Retail Industrial Office Total Hawaii improved 94 95 83 93 93 99 82 94 1 (4) 1 (1) Mainland improved 93 99 91 95 90 99 88 93 3 0 3 2 Total 94 97 90 94 93 99 87 94 1 (2) 3 0 2015 2014 Percentage point change Location Retail Industrial Office Total Retail Industrial Office Total Retail Industrial Office Total Hawaii improved 1,633,800 837,800 189,300 2,660,900 1,553,400 650,400 189,000 2,392,800 5.2 28.8 0.2 11.2 Mainland improved 194,100 1,186,300 1,006,900 2,387,300 232,800 1,186,300 1,127,100 2,546,200 (16.6) - (10.7) (6.2) Total 1,827,900 2,024,100 1,196,200 5,048,200 1,786,200 1,836,700 1,316,100 4,939,000 2.3 10.2 (9.1) 2.2 2015 (in sq. ft.) 2014 (in sq. ft.) Percentage Change Number of properties Weighted average sq. ft. Percent Leased Number of properties Weighted average sq. ft. Percent Leased Number of properties Weighted average sq. ft. Percent Leased Number of properties Weighted average sq. ft. Percent Leased Number of properties Weighted average sq. ft. Percent Leased Retail 30 1,867,000 93 30 1,856,900 94 30 1,856,900 94 29 1,773,900 94 30 1,786,200 93 Industrial 15 2,024,100 98 15 2,024,100 97 15 2,024,100 97 15 2,024,100 98 15 1,887,900 99 Office 13 1,117,900 88 14 1,145,900 91 14 1,145,900 91 15 1,317,800 88 15 1,316,100 88 Total 58 5,009,000 94 59 5,026,900 95 59 5,026,900 94 59 5,115,800 94 60 4,990,200 94 4Q2015 3Q2015 2Q2015 4Q20141Q2015

REAL ESTATE LEASING SEGMENT – ASSET DESCRIPTIONS AND STATISTICS 39 TABLE 12 REAL ESTATE LEASING NET OPERATING INCOME ( NOI) (in millions) TABLE 13 REAL ESTATE LEASING SAME STORE NOI 1 (in millions) 1 Same Store NOI relates to properties that were operated throughout the duration of both periods under comparison. Note: See Table 14 for a statement on the Company’s use of NOI and a reconciliation of Leasing operating profit to Real Esta te Leasing NOI and Real Estate Leasing Same Store NOI. Location Retail Industrial Office Total Retail Industrial Office Total Retail Industrial Office Total Hawaii improved 38.7$ 10.8$ 3.7$ 53.2$ 35.8$ 8.6$ 3.2$ 47.6$ 8.1 25.6 15.6 11.8 Hawaii ground leases - - - 13.0 - - - 12.2 - - - 6.6 Total Hawaii 38.7$ 10.8$ 3.7$ 66.2$ 35.8$ 8.6$ 3.2$ 59.8$ 8.1 25.6 15.6 10.7 Mainland improved 2.5 4.7 10.5 17.7 2.5 4.7 10.3 17.5 - - 1.9 1.1 Total 41.2$ 15.5$ 14.2$ 83.9$ 38.3$ 13.3$ 13.5$ 77.3$ 7.6 16.5 5.2 8.5 Percentage Change2015 2014 Location Retail Industrial Office Total Retail Industrial Office Total Retail Industrial Office Total Hawaii improved 36.3$ 8.7$ 3.7$ 48.7$ 34.8$ 8.4$ 3.2$ 46.4$ 4.3 3.6 15.6 5.0 Hawaii ground leases - - - 13.0 - - - 12.2 - - - 6.6 Total Hawaii 36.3$ 8.7$ 3.7$ 61.7$ 34.8$ 8.4$ 3.2$ 58.6$ 4.3 3.6 15.6 5.3 Mainland improved 2.5 4.6 8.9 16.0 2.3 4.6 8.2 15.1 8.7 - 8.5 6.0 Total 38.8$ 13.3$ 12.6$ 77.7$ 37.1$ 13.0$ 11.4$ 73.7$ 4.6 2.3 10.5 5.4 2015 2014 Percentage Change

STATEMENT ON MANAGEMENT’S USE OF NON - GAAP FINANCIAL MEASURES Net operating income (NOI) is a non - GAAP measure derived from real estate revenues (determined in accordance with GAAP, less str aight - line rental adjustments) minus property operating expenses (determined in accordance with GAAP). NOI does not have any standardize d m eaning prescribed by GAAP, and therefore, may differ from definitions of NOI used by other companies. NOI should not be considered a s a n alternative to net income (determined in accordance with GAAP) as an indicator of the Company’s financial performance, or as an alternative to cash flow from operating activities as a measure of the Company’s liquidity. NOI is commonly used as a measure of operating p erf ormance because it is an indicator of the return on property investment, and provides a method of comparing property performance over ti me. NOI excludes general and administrative expenses, straight - line rental adjustments, interest income, interest expense, depreciation and amortization expense, and gains on sales of interests in real estate. The Company believes that the Real Estate Leasing segment’s operatin g p rofit after discontinued operations is the most directly comparable GAAP measurement to NOI. A required reconciliation of Real Estate Lea sin g operating profit to Real Estate Leasing segment NOI and same store NOI is as follows: 40 1 NOI related to properties that were operated throughout the duration of both periods under comparison. TABLE 14 RECONCILIATION OF REAL ESTATE LEASING OPERATING PROFIT TO NOI AND SAME STORE NOI (NON - GAAP) (in millions) 2015 2014 2013 Real Estate Leasing segment operating profit before discontinued operations $ 53.1 $ 47.5 $ 43.4 Less amounts reported in discontinued operations - (0.3) (14.6) Real Estate Leasing segment operating profit after subtracting discontinued operations $ 53.1 47.2 $ 28.8 Adjustments: Depreciation and amortization expense $ 28.9 28.0 24.8 Straight-line lease adjustments (2.3) (2.7) (2.9) Other 0.3 General and administrative expense 3.9 4.5 3.5 Discontinued operations - 0.3 14.6 Real Estate Leasing total NOI $ 83.9 $ 77.3 $ 68.8 Acquisitions/ disposition and other adjustments (6.2) (3.6) Real Estate Leasing segment same store NOI 1 $ 77.7 $ 73.7 Change in Real Estate Leasing NOI 8.5% 12.4%
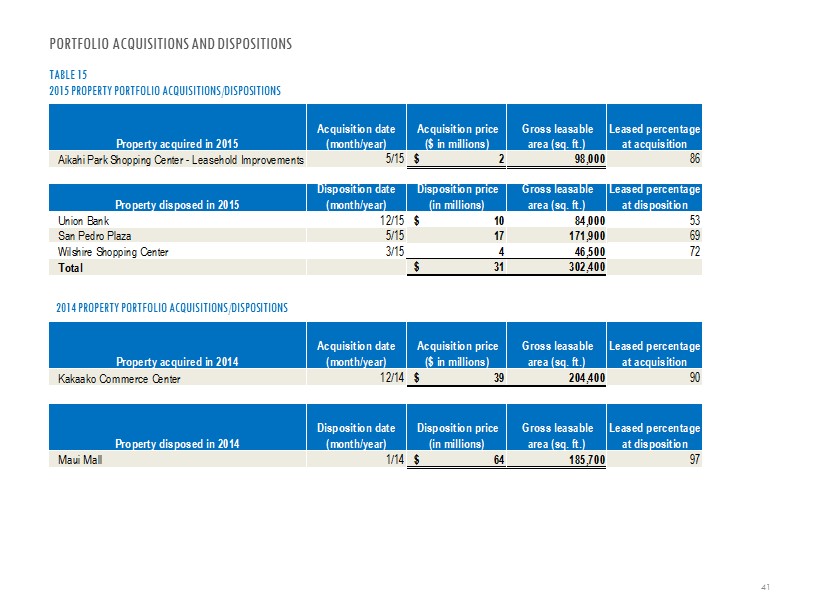
PORTFOLIO ACQUISITIONS AND DISPOSITIONS 41 TABLE 15 2015 PROPERTY PORTFOLIO ACQUISITIONS/DISPOSITIONS 2014 PROPERTY PORTFOLIO ACQUISITIONS/DISPOSITIONS Property acquired in 2014 Acquisition date (month/year) Acquisition price ($ in millions) Gross leasable area (sq. ft.) Leased percentage at acquisition Kakaako Commerce Center 12/14 $ 39 204,400 90 Property disposed in 2014 Disposition date (month/year) Disposition price (in millions) Gross leasable area (sq. ft.) Leased percentage at disposition Maui Mall 1/14 $ 64 185,700 97 Property acquired in 2015 Acquisition date (month/year) Acquisition price ($ in millions) Gross leasable area (sq. ft.) Leased percentage at acquisition Aikahi Park Shopping Center - Leasehold Improvements 5/15 $ 2 98,000 86 Property disposed in 2015 Disposition date (month/year) Disposition price (in millions) Gross leasable area (sq. ft.) Leased percentage at disposition Union Bank 12/15 $ 10 84,000 53 San Pedro Plaza 5/15 17 171,900 69 Wilshire Shopping Center 3/15 4 46,500 72 Total $ 31 302,400
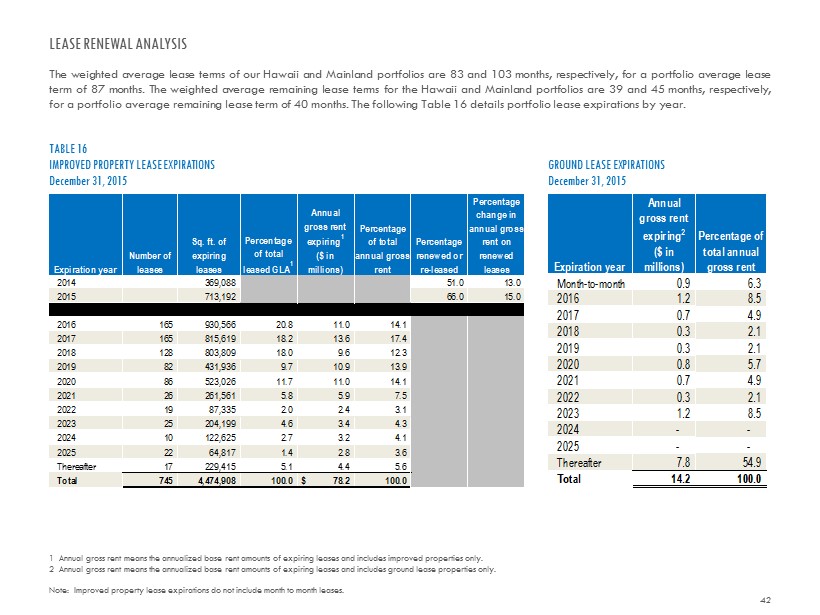
LEASE RENEWAL ANALYSIS The weighted average lease terms of our Hawaii and Mainland portfolios are 83 and 103 months, respectively, for a portfolio average lease term of 87 months . The weighted average remaining lease terms for the Hawaii and Mainland portfolios are 39 and 45 months, respectively, for a portfolio average remaining lease term of 40 months . The following Table 16 details portfolio lease expirations by year . 42 1 Annual gross rent means the annualized base rent amounts of expiring leases and includes improved properties only . 2 Annual gross rent means the annualized base rent amounts of expiring leases and includes ground lease properties only. Note: Improved property lease expirations do not include month to month leases. TABLE 16 IMPROVED PROPERTY LEASE EXPIRATIONS December 31 , 2015 GROUND LEASE EXPIRATIONS December 31 , 2015 Expiration year Number of leases Sq. ft. of expiring leases Percentage of total leased GLA 1 Annual gross rent expiring 1 ($ in millions) Percentage of total annual gross rent Percentage renewed or re-leased Percentage change in annual gross rent on renewed leases 2014 369,088 51.0 13.0 2015 713,192 66.0 15.0 2016 165 930,566 20.8 11.0 14.1 2017 165 815,619 18.2 13.6 17.4 2018 128 803,809 18.0 9.6 12.3 2019 82 431,936 9.7 10.9 13.9 2020 86 523,026 11.7 11.0 14.1 2021 26 261,561 5.8 5.9 7.5 2022 19 87,335 2.0 2.4 3.1 2023 25 204,199 4.6 3.4 4.3 2024 10 122,625 2.7 3.2 4.1 2025 22 64,817 1.4 2.8 3.6 Thereafter 17 229,415 5.1 4.4 5.6 Total 745 4,474,908 100.0 78.2$ 100.0 Expiration year Annual gross rent expiring 2 ($ in millions) Percentage of total annual gross rent Month-to-month 0.9 6.3 2016 1.2 8.5 2017 0.7 4.9 2018 0.3 2.1 2019 0.3 2.1 2020 0.8 5.7 2021 0.7 4.9 2022 0.3 2.1 2023 1.2 8.5 2024 - - 2025 - - Thereafter 7.8 54.9 Total 14.2 100.0

PORTFOLIO CONCENTRATIONS 43 TABLE 17 TENANT CONCENTRATIONS AS OF 12 / 31 / 15 Largest Tenants (In - Service Properties) Based Upon Annualized Gross Revenue 1 Annualized GAAP revenue for the indicated period, excluding FASB straight - line adjustments and percentage rent. 2 In January 2015, Albertsons Companies, Inc. and Safeway Inc. merged. As a result, Safeway’s gross revenue and GLA are incl ude d under Albertsons. Tenant Primary industry Lease expiration year Annualized gross revenue 1 Percentage of annual gross revenue GLA (sq. ft.) Percentage of total GLA Sam's Club Warehouse Club 2021 4,367,599$ 3.7 180,908 3.7 CVS Corporation Drug Store / Pharmacy 2019, 2024, 2028, 2036 3,761,645 3.2 123,727 2.5 United Healthcare Services, Inc. Healthcare Plans 2019 2,427,706 2.1 108,100 2.2 Foodland Super Market, Ltd. Supermarket & Grocery Store 2017, 2018, 2020, 2031 2,188,282 1.9 91,929 1.9 International Paper Paper Packaging/Distribution 2016, 2018 1,838,055 1.6 406,041 8.2 Albertsons Companies, Inc. 2 Supermarket & Grocery Store 2019, 2023, 2029 1,833,486 1.6 134,973 2.7 24 Hour Fitness USA, Inc Health Club 2024 1,786,287 1.5 45,870 0.9 Teleperformance USA Call Center/Communications 2020 1,638,059 1.4 92,036 1.9 Whole Foods Market, Inc Supermarket & Grocery Store 2032 1,344,603 1.2 31,647 0.6 Office Depot, Inc. Office Supplies & Stationary Stores 2017 1,198,501 1.0 75,824 1.5 Total 22,384,223$ 19.2 1,291,055 26.1

HAWAII COMMERCIAL PROPERTY INFORMATION SHEETS RETAIL Gateway at Mililani Mauka 46 Kahului Shopping Center 46 Kailua Retail 47 Kaneohe Bay Shopping Center 47 Kunia Shopping Center 48 Lahaina Square 48 Lanihau Marketplace 49 Napili Plaza 49 Pearl Highlands Center 50 Port Allen Marina Center 50 The Shops at Kukui’ula 51 Waianae Mall 51 Waipio Shopping Center 52 44 Note: NOI is provided for each of the properties in the following information sheets. Refer to Table 14 on page 40 for a sta tem ent about Management’s use of non - GAAP financial measures and required reconciliations.

HAWAII COMMERCIAL PROPERTY INFORMATION SHEETS INDUSTRIAL Kailua Industrial Other 53 Kakaako Commerce Center 53 Komohana Industrial Park 54 P&L Building 54 Port Allen 55 Waipio Industrial 55 OFFICE Gateway at Mililani Mauka South 56 Judd Building 56 Kahului Office Building 57 Kahului Office Center 57 Lono Center 58 Maui Clinic Building 58 Stangenwald Building 59 GROUND LEASES Kailua 60 Other Oahu 60 45 Note: NOI is provided for each of the properties in the following information sheets. Refer to Table 14 on page 40 for a sta tem ent about Management’s use of non - GAAP financial measures and required reconciliations.
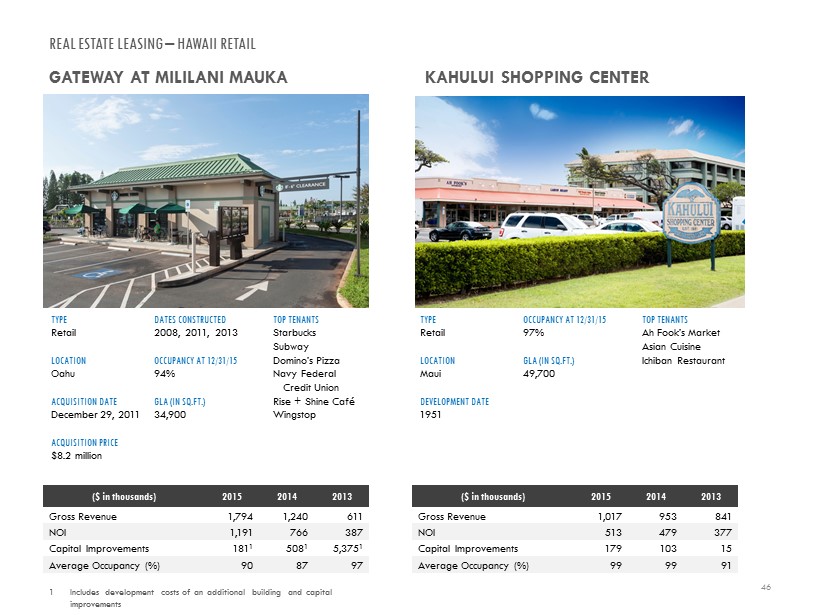
REAL ESTATE LEASING – HAWAII RETAIL GATEWAY AT MILILANI MAUKA KAHULUI SHOPPING CENTER TYPE Retail LOCATION Oahu ACQUISITION DATE December 29, 2011 ACQUISITION PRICE $8.2 million 46 DATES CONSTRUCTED 2008, 2011, 2013 OCCUPANCY AT 12/31/15 94% GLA (IN SQ.FT.) 34,900 ($ in thousands) 2015 2014 2013 Gross Revenue 1,794 1,240 611 NOI 1,191 766 387 Capital Improvements 181 1 508 1 5,375 1 Average Occupancy (%) 90 87 97 TOP TENANTS Starbucks Subway Domino’s Pizza Navy Federal Credit Union Rise + Shine Café Wingstop TYPE Retail LOCATION Maui DEVELOPMENT DATE 1951 OCCUPANCY AT 12/31/15 97% GLA (IN SQ.FT.) 49,700 ($ in thousands) 2015 2014 2013 Gross Revenue 1,017 953 841 NOI 513 479 377 Capital Improvements 179 103 15 Average Occupancy (%) 99 99 91 TOP TENANTS Ah Fook’s Market Asian Cuisine Ichiban Restaurant 1 Includes development costs of an additional building and capital improvements

KANEOHE BAY SHOPPING CENTER TYPE Retail LOCATION Oahu ACQUISITION DATE June 8, 2001 ACQUISITION PRICE $13.3 million (leasehold) DATE CONSTRUCTED 1971, renovated 2008 OCCUPANCY AT 12/31/15 100% GLA (IN SQ.FT.) 125,100 ($ in thousands) 2015 2014 2013 Gross Revenue 5,050 5,006 4,602 NOI 2,203 2,345 1,931 Capital Improvements - 132 122 Average Occupancy (%) 99 99 99 REAL ESTATE LEASING – HAWAII RETAIL KAILUA RETAIL TYPE Retail LOCATION Oahu ACQUISITION DATE December 20, 2013 ACQUISITION PRICE* 47 DATES CONSTRUCTED 1947 - 2014 OCCUPANCY AT 12/31/15 93% GLA (IN SQ.FT.) 414,300 PROPERTIES 16 ($ in thousands) 2015 2014 2013* Gross Revenue 19,089 14,121 403 NOI 11,580 8,617 309 Capital Improvements 1,429 769 - Average Occupancy (%) 94 96 98 TOP TENANTS California Pizza Kitchen Foodland Island Snow Jamba Juice Longs Drug Store Kalapawai Cafe & Deli Peet's Coffee Pier 1 Imports Starbucks Times Supermarket Whole Foods * Acquired December 20, 2013 as part of the Kailua Portfolio TOP TENANTS Brick Oven Pizza Central Pacific Bank First Hawaiian Bank Ichiriki Restaurant Kinkos Longs Drug Store/CVS Safeway Subway Vitamin Shoppe

REAL ESTATE LEASING – HAWAII RETAIL KUNIA SHOPPING CENTER LAHAINA SQUARE TYPE Retail LOCATION Oahu DEVELOPMENT DATE 1 2004 48 OCCUPANCY AT 12/31/15 79% GLA (IN SQ.FT.) 60,400 ($ in thousands) 2015 2014 2013 Gross Revenue 3,039 3,159 3,148 NOI 2,132 2,225 2,135 Capital Improvements 28 37 - Average Occupancy (%) 91 94 95 TOP TENANTS Bank of Hawaii Denny’s Jack In The Box Jamba Juice Starbucks 1 A&B was the original developer of the shopping center. TYPE Retail LOCATION Maui ACQUISITION DATE November 5, 2010 ACQUISITION PRICE $4.9 million DATE CONSTRUCTED 1973 OCCUPANCY AT 12/31/15 73% GLA (IN SQ.FT.) 50,200 ($ in thousands) 2015 2014 2013 Gross Revenue 1,032 1,011 919 NOI 544 567 509 Capital Improvements 20 44 34 Average Occupancy (%) 76 77 68 TOP TENANTS Ace Hardware Maui Tacos

REAL ESTATE LEASING – HAWAII RETAIL LANIHAU MARKETPLACE NAPILI PLAZA TYPE Retail LOCATION Hawaii ACQUISITION DATE April 9, 2010 ACQUISITION PRICE $22.5 million 49 DATE CONSTRUCTED 1987 OCCUPANCY AT 12/31/15 99% GLA (IN SQ.FT.) 88,300 ($ in thousands) 2015 2014 2013 Gross Revenue 3,048 2,759 2,748 NOI 1,774 1,538 1,583 Capital Improvements 419 555 4 Average Occupancy (%) 99 91 89 TOP TENANTS Baskin Robbins Famous Footwear IHOP GNC Longs Drug Store/CVS Sack N Save Supercuts Verizon Wireless TYPE Retail LOCATION Maui ACQUISITION DATE May 22, 2013 ACQUISITION PRICE $19.2 million DATE CONSTRUCTED 1991 OCCUPANCY AT 12/31/15 88% GLA (IN SQ.FT.) 45,700 ($ in thousands) 2015 2014 2013* Gross Revenue 1,798 1,681 983 NOI 1,051 959 591 Capital Improvements 292 135 17 Average Occupancy (%) 88 90 91 TOP TENANTS Napili Market Napili Pharmacy Maui Tacos * Acquired May 22, 2013

REAL ESTATE LEASING – HAWAII RETAIL PEARL HIGHLANDS CENTER PORT ALLEN MARINA CENTER TYPE Retail LOCATION Oahu ACQUISITION DATE September 17, 2013 ACQUISITION PRICE $141.5 million 50 DATE CONSTRUCTED 1992 - 1994 OCCUPANCY AT 12/31/15 95% GLA (IN SQ.FT.) 415,400 ($ in thousands) 2015 2014 2013* Gross Revenue 16,903 18,454 5,400 NOI 9,234 9,885 2,788 Capital Improvements 1,400 345 26 Average Occupancy (%) 97 95 98 TOP TENANTS 24 Hour Fitness Buffalo Wild Wings Pier 1 Regal Cinemas Ross Dress for Less Sam's Club TYPE Retail LOCATION Kauai DEVELOPMENT DATE 2002 OCCUPANCY AT 12/31/15 84% GLA (IN SQ.FT.) 23,600 ($ in thousands) 2015 2014 2013 Gross Revenue 636 617 597 NOI 406 416 375 Capital Improvements - - 61 Average Occupancy (%) 81 76 74 TOP TENANTS Blue Dolphin Charters Captain Andy’s Holo Holo Charters Kauai Chocolate Company Port Allen Bar & Grill * Acquired September 17, 2013

REAL ESTATE LEASING – HAWAII RETAIL THE SHOPS AT KUKUI’ULA WAIANAE MALL TYPE Retail LOCATION Kauai DEVELOPMENT DATE 2009 51 OCCUPANCY AT 12/31/15 97% GLA (IN SQ.FT.) 89,000 ($ in thousands) 2015 2014 2013 1 Gross Revenue 4,993 5,197 1,269 NOI 2,657 1,960 494 Capital Improvements 1,718 2 2 199 - Average Occupancy (%) 95 84 80 TOP TENANTS Eating House 1849 by Roy Yamaguchi Tapas Bar & Grill Living Foods Market Long’s/CVS Martin & MacArthur Merriman’s Fish House Sunglass Hut Tommy Bahama Tortilla Republic Grill TYPE Retail LOCATION Oahu ACQUISITION DATE January 22, 2013 ACQUISITION PRICE $29.8 million DATE CONSTRUCTED 1975 OCCUPANCY AT 12/31/15 86% GLA (IN SQ.FT.) 170,300 ($ in thousands) 2015 2014 2013 1 Gross Revenue 3,880 4,217 4,271 NOI 2,242 2,649 2,730 Capital Improvements 12 2,234 2 750 Average Occupancy (%) 87 89 90 TOP TENANTS Bank of Hawaii Burger King Goodyear Jamba Juice Longs/CVS Starbucks 1 Acquired January 22, 2013 2 Includes costs for deferred maintenance and repositioning of center’s tenants 1 Acquired September 30, 2013 2 Includes costs related to the build - out of new tenant space

REAL ESTATE LEASING – HAWAII RETAIL WAIPIO SHOPPING CENTER TYPE Retail LOCATION Oahu ACQUISITION DATE September 4, 2009 ACQUISITION PRICE $30.9 million 52 DATE CONSTRUCTED 1986 - 2004 OCCUPANCY AT 12/31/15 96% GLA (IN SQ.FT.) 113,800 ($ in thousands) 2015 2014 2013 Gross Revenue 4,395 4,357 4,393 NOI 3,145 3,146 3,082 Capital Improvements - 176 - Average Occupancy (%) 95 95 97 TOP TENANTS Aloha Gas Big City Diner Foodland Jack - In - The - Box Outback Steakhouse

REAL ESTATE LEASING – HAWAII INDUSTRIAL KAILUA INDUSTRIAL OTHER KAKAAKO COMMERCE CENTER TYPE Industrial LOCATION Oahu ACQUISITION DATE December 20, 2013 ACQUISITION PRICE* 53 DATE CONSTRUCTED 1951 - 1974 OCCUPANCY AT 12/31/15 96% GLA (IN SQ.FT.) 68,800 PROPERTIES 6 ($ in thousands) 2015 2014 2013* Gross Revenue 1,182 1,189 37 NOI 648 629 27 Capital Improvements 39 - - Average Occupancy (%) 97 100 100 TOP TENANTS Enterprise Rent - A - Car Hamakua Auto Body Kailua General Store Kama’aina Kids Pacific Island Medical TYPE Industrial LOCATION Oahu ACQUISITION DATE December 1 , 2014 ACQUISITION PRICE $39.1 million DATE CONSTRUCTED 1971 OCCUPANCY AT 12/31/15 95% GLA (IN SQ.FT.) 204,400 ($ in thousands) 2015 2014* 2013 Gross Revenue 3,787 323 n/a NOI 2,183 254 n/a Capital Improvements 28 - n/a Average Occupancy (%) 90 90 n/a TOP TENANTS CARE Hawaii Inc. StorQuest Self Storage * Acquired December 20, 2013 as part of the Kailua Portfolio * Acquired December 1 , 2014
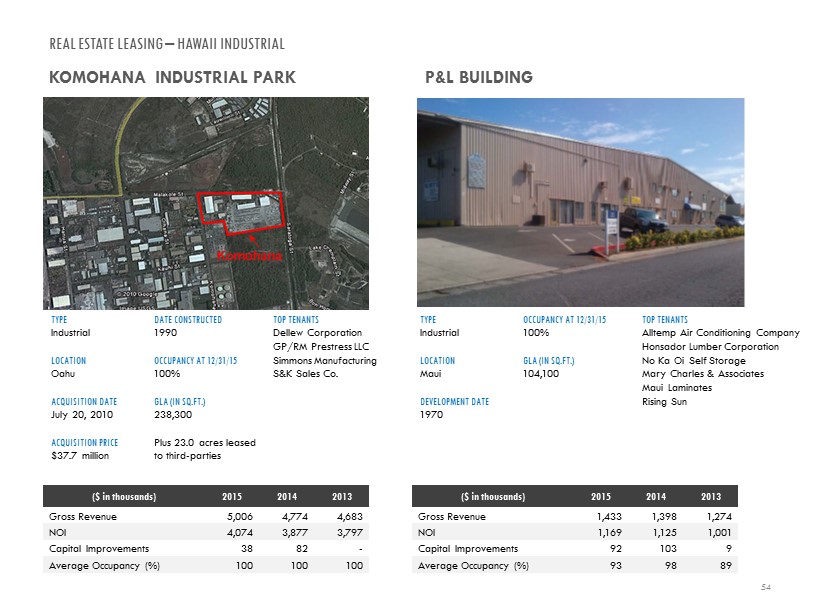
REAL ESTATE LEASING – HAWAII INDUSTRIAL KOMOHANA INDUSTRIAL PARK P&L BUILDING TYPE Industrial LOCATION Oahu ACQUISITION DATE July 20, 2010 ACQUISITION PRICE $37.7 million 54 DATE CONSTRUCTED 1990 OCCUPANCY AT 12/31/15 100 % GLA (IN SQ.FT.) 238,300 Plus 23.0 acres leased to third - parties ($ in thousands) 2015 2014 2013 Gross Revenue 5,006 4,774 4,683 NOI 4,074 3,877 3,797 Capital Improvements 38 82 - Average Occupancy (%) 100 100 100 TOP TENANTS Dellew Corporation GP/RM Prestress LLC Simmons Manufacturing S&K Sales Co. TYPE Industrial LOCATION Maui DEVELOPMENT DATE 1970 OCCUPANCY AT 12/31/15 100% GLA (IN SQ.FT.) 104,100 ($ in thousands) 2015 2014 2013 Gross Revenue 1,433 1,398 1,274 NOI 1,169 1,125 1,001 Capital Improvements 92 103 9 Average Occupancy (%) 93 98 89 TOP TENANTS Alltemp Air Conditioning Company Honsador Lumber Corporation No Ka Oi Self Storage Mary Charles & Associates Maui Laminates Rising Sun

REAL ESTATE LEASING – HAWAII INDUSTRIAL PORT ALLEN WAIPIO INDUSTRIAL TYPE Industrial LOCATION Kauai DEVELOPMENT DATE 1983 - 1993 55 OCCUPANCY AT 12/31/15 89% GLA (IN SQ.FT.) 63,800 ($ in thousands) 2015 2014 2013 Gross Revenue 785 837 832 NOI 560 629 615 Capital Improvements 15 56 10 Average Occupancy (%) 88 96 99 TOP TENANTS Aloha Professional Auto Body Kauai Island Brewing Company KIUC Lappert’s Inc. Paradise Sports Wear TYPE Industrial LOCATION Oahu ACQUISITION DATE March 4, 2009 ACQUISITION PRICE $28.3 million DATE CONSTRUCTED 1988 - 1989 OCCUPANCY AT 12/31/15 99% GLA (IN SQ.FT.) 158,400 ($ in thousands) 2015 2014 2013 Gross Revenue 2,916 2,790 2,732 NOI 2,173 2,097 2,041 Capital Improvements 15 3 27 Average Occupancy (%) 99 98 96 TOP TENANTS Arcadia City & County of Honolulu (EMS ) OfficeMax USC International

REAL ESTATE LEASING – HAWAII OFFICE GATEWAY AT MILILANI MAUKA SOUTH JUDD BUILDING TYPE Office LOCATION Oahu ACQUISITION DATE June 7, 2012 ACQUISITION PRICE 1 $11.4 million 56 DATE CONSTRUCTED 1992, 2006, 2008 OCCUPANCY AT 12/31/15 100 % GLA (IN SQ.FT.) 18,700 – current 18,500 – under development ($ in thousands) 2015 2014 2013 Gross Revenue 923 917 930 NOI 711 723 682 Capital Improvements 4,302 2 708 2 35 2 Average Occupancy (%) 100 100 100 TOP TENANTS Allstate Hawaii State Federal Union Kumon Mililani Veterinary Title Guaranty Wayland Baptist University 1 Acquisition price includes a 1.2 - acre development parcel. See development project information on page 22. TYPE Office LOCATION Oahu ACQUISITION DATE June 26, 2000 ACQUISITION PRICE $3.1 million DATE CONSTRUCTED 1898, renovated 1979 OCCUPANCY AT 12/31/15 86% GLA (IN SQ.FT.) 20,200 ($ in thousands) 2015 2014 2013 Gross Revenue 367 404 443 NOI 100 128 138 Capital Improvements 762 1 286 199 Average Occupancy (%) 77 64 71 TOP TENANTS Coffman Engineers Davis, Levin, Livingston, Grande Attorneys RIM Architects 2 Includes development cost of an additional building and capital improvements 1 Includes new tenant improvements and air conditioning work

REAL ESTATE LEASING – HAWAII OFFICE KAHULUI OFFICE BUILDING KAHULUI OFFICE CENTER TYPE Office LOCATION Maui DEVELOPMENT DATE 1974, renovated 1996 57 OCCUPANCY AT 12/31/15 82% GLA (IN SQ.FT.) 59,600 ($ in thousands) 2015 2014 2013 Gross Revenue 2,214 2,142 2,160 NOI 1,343 1,214 1,087 Capital Improvements 571 1,055 870 Average Occupancy (%) 82 81 81 TOP TENANTS Bistro Casanova Central Pacific Bank Hawaii Medical Service Association Morgan Stanley Smith Barney Stifel Nicolas TYPE Office LOCATION Maui DEVELOPMENT DATE 1991 OCCUPANCY AT 12/31/15 88% GLA (IN SQ.FT.) 33,400 ($ in thousands) 2015 2014 2013 Gross Revenue 1,293 921 816 NOI 860 450 452 Capital Improvements 66 305 302 Average Occupancy (%) 90 88 74 TOP TENANTS Finance Factors Hawaiiana Management Tutti Frutti Yogurt
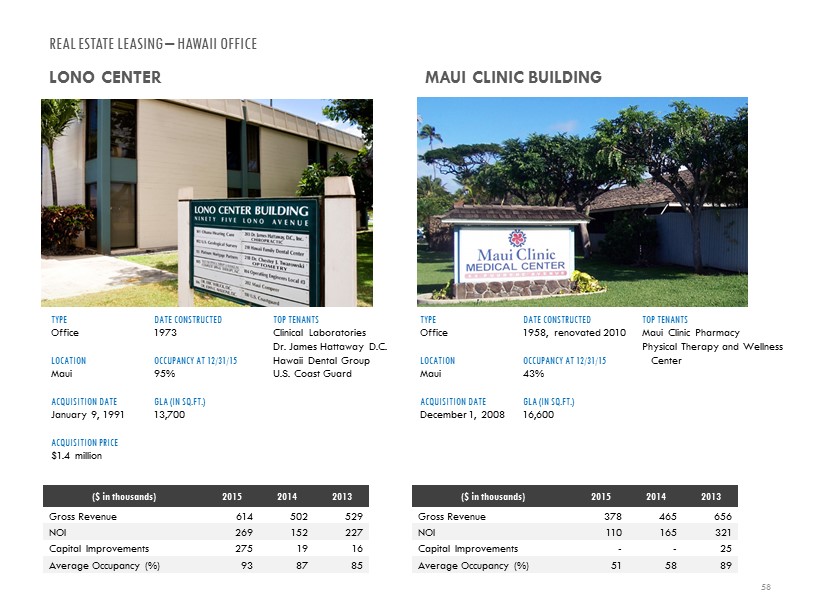
REAL ESTATE LEASING – HAWAII OFFICE LONO CENTER MAUI CLINIC BUILDING TYPE Office LOCATION Maui ACQUISITION DATE January 9, 1991 ACQUISITION PRICE $1.4 million 58 DATE CONSTRUCTED 1973 OCCUPANCY AT 12/31/15 95% GLA (IN SQ.FT.) 13,700 ($ in thousands) 2015 2014 2013 Gross Revenue 614 502 529 NOI 269 152 227 Capital Improvements 275 19 16 Average Occupancy (%) 93 87 85 TOP TENANTS Clinical Laboratories Dr . James Hattaway D.C. Hawaii Dental Group U.S. Coast Guard TYPE Office LOCATION Maui ACQUISITION DATE December 1, 2008 DATE CONSTRUCTED 1958, renovated 2010 OCCUPANCY AT 12/31/15 43% GLA (IN SQ.FT.) 16,600 ($ in thousands) 2015 2014 2013 Gross Revenue 378 465 656 NOI 110 165 321 Capital Improvements - - 25 Average Occupancy (%) 51 58 89 TOP TENANTS Maui Clinic Pharmacy Physical Therapy and Wellness Center

REAL ESTATE LEASING – HAWAII OFFICE STANGENWALD BUILDING TYPE Office LOCATION Oahu ACQUISITION DATE December 10, 1996 ACQUISITION PRICE $2.8 million DATE CONSTRUCTED 1901, renovated 1980 OCCUPANCY AT 12/31/15 84% GLA (IN SQ.FT.) 27,100 ($ in thousands) 2015 2014 2013 Gross Revenue 729 766 677 NOI 340 365 280 Capital Improvements - 95 550 Average Occupancy (%) 85 91 84 TOP TENANTS Brue Burke McPheeters and Estes Law Firm HonBlue Leather Sole 59

REAL ESTATE LEASING – HAWAII GROUND LEASES KAILUA GROUND LEASES OTHER OAHU GROUND LEASES TYPE Ground Lease LOCATION Oahu ACQUISITION DATE December 20, 2013 60 ACQUISITION PRICE** ACRES 20 ($ in thousands) 2015* 2014 2013** Gross Revenue 5,572 5,727 147 NOI 4,465 4,206 136 TOP TENANTS Napa Genuine Parts Company Fortus Property Group Windward Ford Pali Lanes, LLC TYPE Ground Lease LOCATION Oahu ACQUISITION DATE December 20, 2013 ACQUISITION PRICE* ACRES 22 ($ in thousands) 2015 2014 2013* Gross Revenue 6,076 5,994 181 NOI 4,818 4,777 161 TOP TENANTS Bradley Shopping Center Company Servco Pacific Tesoro Hawaii TSM Investments, Inc. WCSC, LLC * On May 1, 2015, the Company acquired the ground leasee’s interest in Aikahi Park Shopping Center in Kailua. NOI prior to the close date is included in Kailua Ground Leases and NOI after the close date is included in Kailua Retail . ** Acquired December 20, 2013 as part of the Kailua Portfolio * Acquired December 20, 2013 as part of the Kailua Portfolio

MAINLAND COMMERCIAL PROPERTY INFORMATION SHEETS RETAIL Little Cottonwood Center 62 Royal MacArthur Center 62 INDUSTRIAL Midstate Hayes 63 Sparks Business Center 63 OFFICE Concorde Commerce Center 64 Deer Valley Financial Center 64 Gateway Oaks 65 Ninigret Office Park 65 1800 and 1820 Preston Park 66 2868 Prospect Park 66 61 Note: NOI is provided for each of the properties in the following information sheets. Refer to Table 14 on page 40 for a sta tem ent about Management’s use of non - GAAP financial measures and required reconciliations.

REAL ESTATE LEASING – MAINLAND RETAIL LITTLE COTTONWOOD CENTER ROYAL MACARTHUR CENTER TYPE Retail LOCATION Sandy, UT ACQUISITION DATE October 26, 2010 ACQUISITION PRICE $20.8 million 62 DATES CONSTRUCTED 1998 - 2008 OCCUPANCY AT 12/31/15 92% GLA (IN SQ.FT.) 141,500 ($ in thousands) 2015 2014 2013 Gross Revenue 2,151 2,082 2,075 NOI 1,446 1,368 1,379 Capital Improvements 29 97 134 Average Occupancy (%) 93 94 94 TOP TENANTS Black Bear Restaurant Chase Bank Fresh Market McDonald’s Starbucks TYPE Retail LOCATION Dallas, TX ACQUISITION DATE March 1, 2007 ACQUISITION PRICE $13.5 million DATES CONSTRUCTED 2006 OCCUPANCY AT 12/31/15 100% GLA (IN SQ.FT.) 44,800 ($ in thousands) 2015 2014 2013 Gross Revenue 1,637 1,501 1,345 NOI 1,024 920 996 Capital Improvements 116 52 229 Average Occupancy (%) 95 98 100 TOP TENANTS Andalous Mediterranean Grill Five Guys Burgers Jamba Juice La Madeleine Pie Five
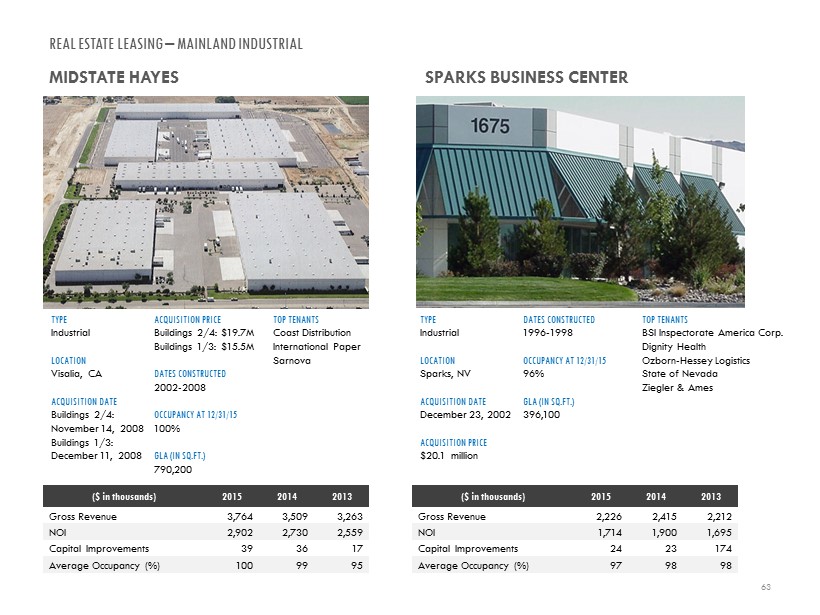
REAL ESTATE LEASING – MAINLAND INDUSTRIAL MIDSTATE HAYES SPARKS BUSINESS CENTER TYPE Industrial LOCATION Visalia, CA ACQUISITION DATE Buildings 2/4: November 14, 2008 Buildings 1/3: December 11, 2008 63 ACQUISITION PRICE Buildings 2/4: $19.7M Buildings 1/3: $15.5M DATES CONSTRUCTED 2002 - 2008 OCCUPANCY AT 12/31/15 100% GLA (IN SQ.FT.) 790,200 ($ in thousands) 2015 2014 2013 Gross Revenue 3,764 3,509 3,263 NOI 2,902 2,730 2,559 Capital Improvements 39 36 17 Average Occupancy (%) 100 99 95 TOP TENANTS Coast Distribution International Paper Sarnova TYPE Industrial LOCATION Sparks, NV ACQUISITION DATE December 23, 2002 ACQUISITION PRICE $20.1 million DATES CONSTRUCTED 1996 - 1998 OCCUPANCY AT 12/31/15 96% GLA (IN SQ.FT.) 396,100 ($ in thousands) 2015 2014 2013 Gross Revenue 2,226 2,415 2,212 NOI 1,714 1,900 1,695 Capital Improvements 24 23 174 Average Occupancy (%) 97 98 98 TOP TENANTS BSI Inspectorate America Corp. Dignity Health Ozborn - Hessey Logistics State of Nevada Ziegler & Ames
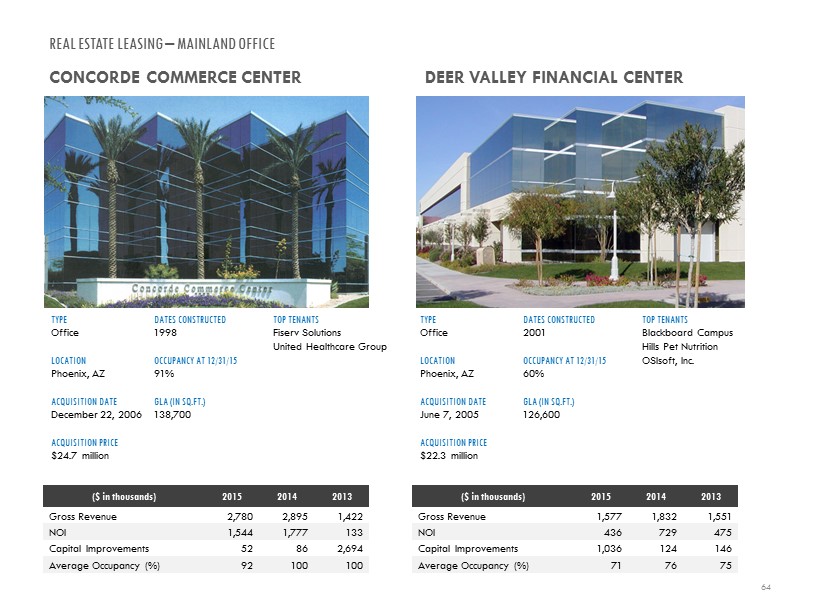
REAL ESTATE LEASING – MAINLAND OFFICE CONCORDE COMMERCE CENTER DEER VALLEY FINANCIAL CENTER TYPE Office LOCATION Phoenix, AZ ACQUISITION DATE December 22, 2006 ACQUISITION PRICE $24.7 million 64 DATES CONSTRUCTED 1998 OCCUPANCY AT 12/31/15 91% GLA (IN SQ.FT.) 138,700 ($ in thousands) 2015 2014 2013 Gross Revenue 2,780 2,895 1,422 NOI 1,544 1,777 133 Capital Improvements 52 86 2,694 Average Occupancy (%) 92 100 100 TOP TENANTS Fiserv Solutions United Healthcare Group TYPE Office LOCATION Phoenix, AZ ACQUISITION DATE June 7, 2005 ACQUISITION PRICE $22.3 million DATES CONSTRUCTED 2001 OCCUPANCY AT 12/31/15 60% GLA (IN SQ.FT.) 126,600 ($ in thousands) 2015 2014 2013 Gross Revenue 1,577 1,832 1,551 NOI 436 729 475 Capital Improvements 1,036 124 146 Average Occupancy (%) 71 76 75 TOP TENANTS Blackboard Campus Hills Pet Nutrition OSIsoft, Inc.

REAL ESTATE LEASING – MAINLAND OFFICE GATEWAY OAKS NINIGRET OFFICE PARK TYPE Office LOCATION Sacramento, CA ACQUISITION DATE June 14, 2006 ACQUISITION PRICE $12.3 million 65 DATES CONSTRUCTED 1999 OCCUPANCY AT 12/31/15 92% GLA (IN SQ.FT.) 59,700 ($ in thousands) 2015 2014 2013 Gross Revenue 994 649 567 NOI 500 277 134 Capital Improvements - 691 - Average Occupancy (%) 92 83 54 TOP TENANTS Fortune Schools RICOH Sutter Health Care URS TYPE Office LOCATION Salt Lake City, UT ACQUISITION DATE January 26, 2006 ACQUISITION PRICE $21.4 million DATES CONSTRUCTED 1999 & 2002, renovated 2010 OCCUPANCY AT 12/31/15 100% GLA (IN SQ.FT.) 185,500 ($ in thousands) 2015 2014 2013 Gross Revenue 3,088 3,056 3,024 NOI 1,862 1,865 1,834 Capital Improvements 1,585 - 394 Average Occupancy (%) 100 96 100 TOP TENANTS Silicon Valley Bank Sun Products Teleperformance USA Tetra Tech

REAL ESTATE LEASING – MAINLAND OFFICE 1800 AND 1820 PRESTON PARK 2868 PROSPECT PARK TYPE Office LOCATION Plano, TX ACQUISITION DATE June 30, 2006 ACQUISITION PRICE $24.3 million 66 DATES CONSTRUCTED 1997 - 1998, renovated 2010 OCCUPANCY AT 12/31/15 87% GLA (IN SQ.FT.) 198,800 ($ in thousands) 2015 2014 2013 Gross Revenue 4,189 3,551 3,508 NOI 2,461 1,882 1,945 Capital Improvements 365 305 1,109 Average Occupancy (%) 90 92 93 TOP TENANTS American Flood Research Arrow Electronics Riverwood Solutions RTI Community Management TYPE Office LOCATION Sacramento, CA ACQUISITION DATE August 25, 1998 ACQUISITION PRICE $20.6 million DATES CONSTRUCTED 1998, renovated 2008 OCCUPANCY AT 12/31/15 100% GLA (IN SQ.FT.) 163,300 ($ in thousands) 2015 2014 2013 Gross Revenue 3,403 2,921 2,452 NOI 2,115 1,677 1,299 Capital Improvements 246 1,298 890 Average Occupancy (%) 100 96 86 TOP TENANTS Bankrate Cisco GEI Keenan & Associates