Attached files
| file | filename |
|---|---|
| 8-K - FORM 8-K - AMERICAN PUBLIC EDUCATION INC | v432997_8k.htm |
| EX-99.3 - EXHIBIT 99.3 - AMERICAN PUBLIC EDUCATION INC | v432997_ex99-3.htm |
| EX-99.1 - EXHIBIT 99.1 - AMERICAN PUBLIC EDUCATION INC | v432997_ex99-1.htm |
Exhibit 99.2

February 29, 2016 Recent Results and Developments Fourth Quarter 2015
Statements made in this presentation regarding American Public Education, Inc . or its subsidiaries, that are not historical facts are forward - looking statements based on current expectations, assumptions, estimates and projections about American Public Education and the industry . These forward - looking statements are subject to risks and uncertainties that could cause actual future events or results to differ materially from such statements . Forward - looking statements can be identified by words such as “anticipate", “believe”, “seek”, “could”, “estimate”, “expect”, “intend”, “may”, “plan”, “should”, “will” and “would” . These forward - looking statements include, without limitation, statements regarding expected growth, amounts and nature of anticipated charges, expected registrations and enrollments, expected revenues, and expected earnings . Actual results could differ materially from those expressed or implied by these forward - looking statements as a result of various factors, including the various risks described in the “ Risk Factors ” section and elsewhere in the Company ’ s Annual Report on Form 10 - K for the year ended December 31 , 2015 and in the Company’s other filings with the SEC . The Company undertakes no obligation to update publicly any forward - looking statements for any reason, unless required by law, even if new information becomes available or other events occur in the future . 2 Advancing the Learning Experience | Exploring New Opportunities SAFE HARBOR STATEMENT American Public Education, Inc.
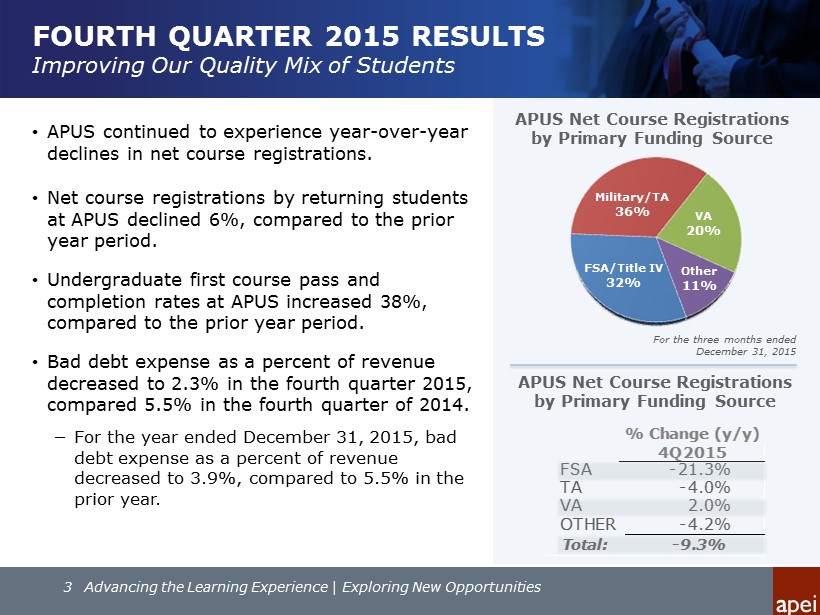
FOURTH QUARTER 2015 RESULTS Improving Our Quality Mix of Students • APUS continued to experience year - over - year declines in net course registrations. • Net course registrations by returning students at APUS declined 6%, compared to the prior year period. • Undergraduate first course pass and completion rates at APUS increased 38%, compared to the prior year period. • Bad debt expense as a percent of revenue decreased to 2.3 % in the fourth quarter 2015, compared 5.5 % in the fourth quarter of 2014 . − For the year ended December 31, 2015, bad debt expense as a percent of revenue decreased to 3.9%, compared to 5.5 % in the prior year. For the three months ended December 31, 2015 APUS Net Course Registrations by Primary Funding Source Other 11% FSA/Title IV 32% Military/TA 36% VA 20% 3 Advancing the Learning Experience | Exploring New Opportunities FSA -21.3% TA -4.0% VA 2.0% OTHER -4.2% Total: -9.3% % Change (y/y) 4Q2015 APUS Net Course Registrations by Primary Funding Source
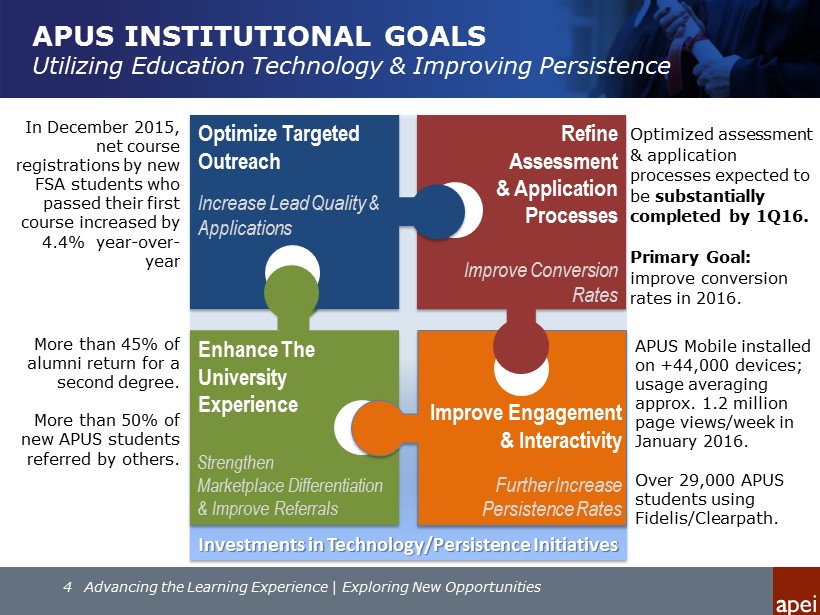
APUS INSTITUTIONAL GOALS Utilizing Education Technology & Improving Persistence 4 Advancing the Learning Experience | Exploring New Opportunities Refine Assessment & Application Processes Improve Conversion Rates Enhance The University Experience Optimize Targeted Outreach Increase Lead Quality & Applications Improve Engagement & Interactivity Further Increase Persistence Rates Optimized assessment & application processes expected to be substantially completed by 1Q16. Primary Goal: improve conversion rates in 2016. More than 45% of alumni return for a second degree. More than 50% of new APUS students referred by others. Strengthen Marketplace Differentiation & Improve Referrals In December 2015, net course registrations by new FSA students who passed their first course increased by 4.4% year - over - year APUS Mobile installed on +44,000 devices; usage averaging approx. 1.2 million page views/week in January 2016. Over 29,000 APUS students using Fidelis/Clearpath. Investments in Technology/Persistence Initiatives
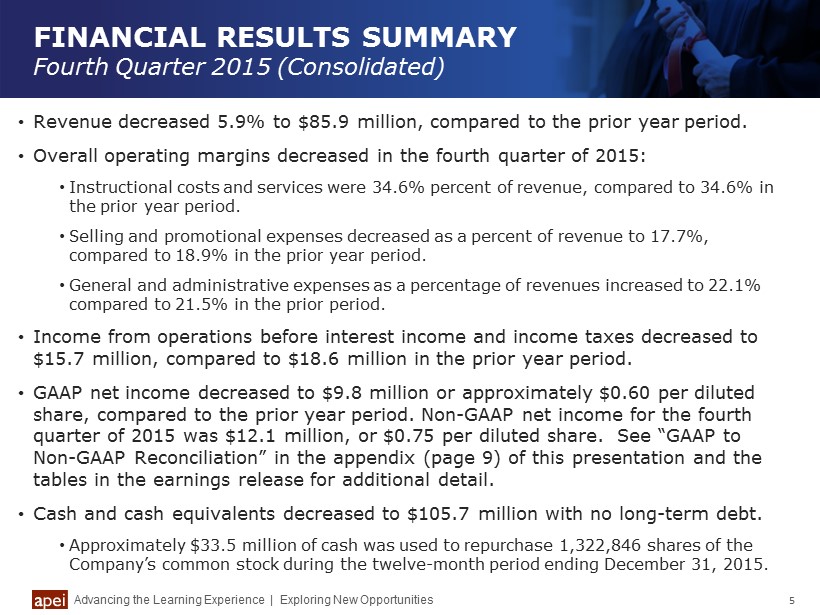
FINANCIAL RESULTS SUMMARY Fourth Quarter 2015 (Consolidated) Advancing the Learning Experience | Exploring New Opportunities 5 • Revenue decreased 5.9% to $85.9 million, compared to the prior year period. • Overall operating margins decreased in the fourth quarter of 2015: • Instructional costs and services were 34.6% percent of revenue, compared to 34.6% in the prior year period. • Selling and promotional expenses decreased as a percent of revenue to 17.7%, compared to 18.9% in the prior year period. • General and administrative expenses as a percentage of revenues increased to 22.1% compared to 21.5% in the prior period. • Income from operations before interest income and income taxes decreased to $15.7 million, compared to $18.6 million in the prior year period. • GAAP net income decreased to $9.8 million or approximately $0.60 per diluted share, compared to the prior year period. Non - GAAP net income for the fourth quarter of 2015 was $12.1 million, or $ 0.75 per diluted share . See “GAAP to Non - GAAP Reconciliation” in the appendix (page 9) of this presentation and the tables in the earnings release for additional detail. • Cash and cash equivalents decreased to $105.7 million with no long - term debt. • Approximately $33.5 million of cash was used to repurchase 1,322,846 shares of the Company’s common stock during the twelve - month period ending December 31, 2015.
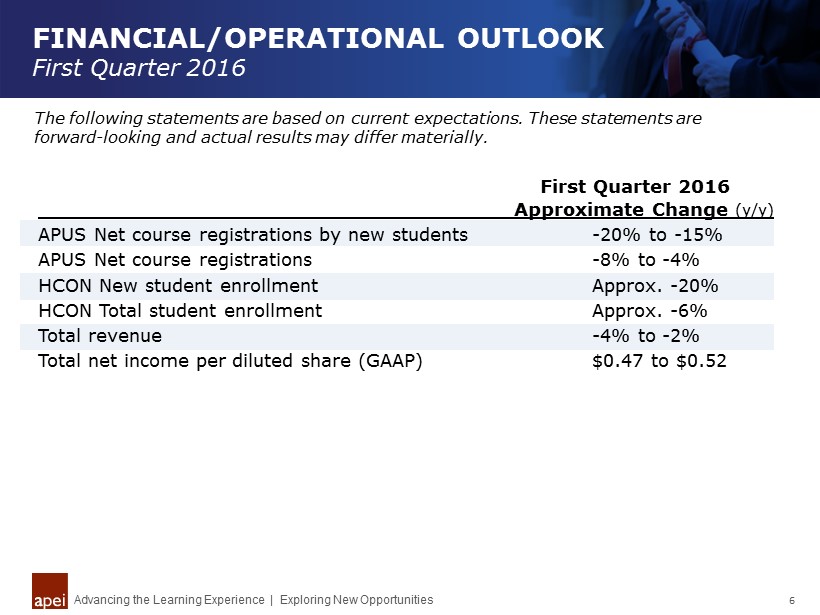
FINANCIAL/OPERATIONAL OUTLOOK First Quarter 2016 Advancing the Learning Experience | Exploring New Opportunities 6 The following statements are based on current expectations. These statements are forward - looking and actual results may differ materially. Approximate Change (y/y) APUS Net course registrations by new students - 20% to - 15% APUS Net course registrations - 8% to - 4% HCON New student enrollment Approx. - 20% HCON Total student enrollment Approx. - 6% Total revenue - 4% to - 2% Total net income per diluted share (GAAP) $0.47 to $0.52 First Quarter 2016
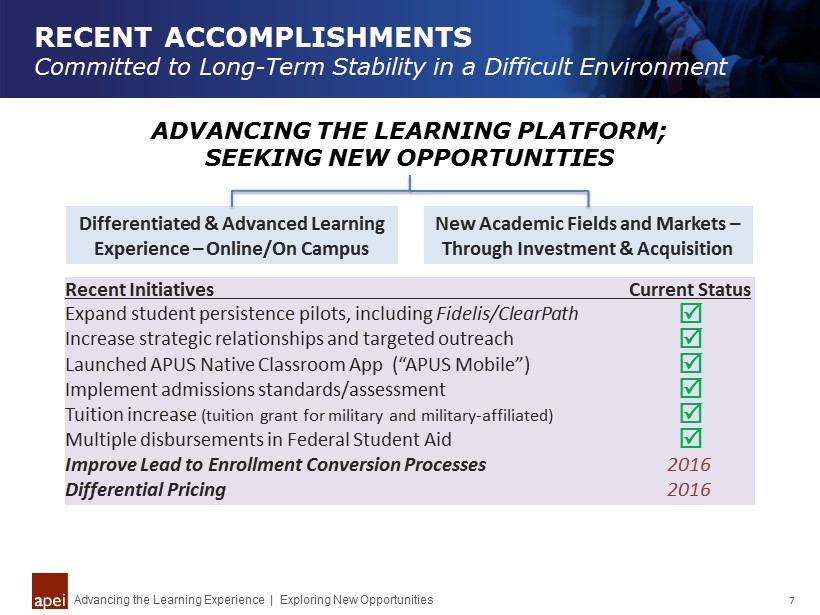
RECENT ACCOMPLISHMENTS Committed to Long - Term Stability in a Difficult Environment Advancing the Learning Experience | Exploring New Opportunities 7 ADVANCING THE LEARNING PLATFORM; SEEKING NEW OPPORTUNITIES Recent Initiatives Current Status Expand student persistence pilots, including Fidelis/ ClearPath Increase strategic relationships and targeted outreach Launched APUS Native Classroom App (“APUS Mobile”) Implement admissions standards/assessment Tuition increase (tuition grant for military and military - affiliated) Multiple disbursements in Federal Student Aid Improve Lead to Enrollment Conversion Processes 2016 Differential Pricing 2016 Differentiated & Advanced Learning Experience – Online/On Campus New Academic Fields and Markets – Through Investment & Acquisition

Fourth Quarter 2015 Financial Results Conference Call February 29, 2016
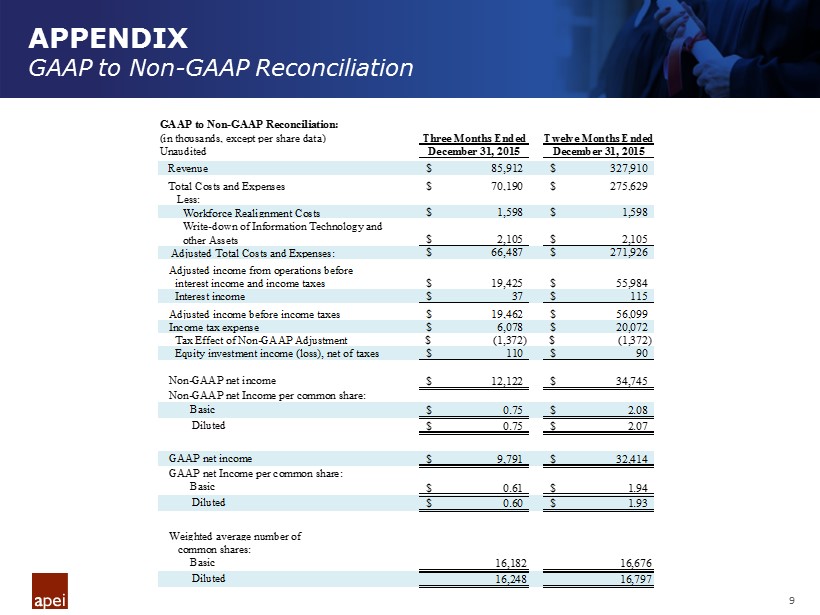
APPENDIX GAAP to Non - GAAP Reconciliation 9 GAAP to Non-GAAP Reconciliation: (in thousands, except per share data) Three Months Ended Twelve Months Ended Unaudited December 31, 2015 December 31, 2015 Revenue 85,912$ 327,910$ Total Costs and Expenses 70,190$ 275,629$ Less: Workforce Realignment Costs 1,598$ 1,598$ Write-down of Information Technology and other Assets 2,105$ 2,105$ Adjusted Total Costs and Expenses: 66,487$ 271,926$ Adjusted income from operations before interest income and income taxes 19,425$ 55,984$ Interest income 37$ 115$ Adjusted income before income taxes 19,462$ 56,099$ Income tax expense 6,078$ 20,072$ Tax Effect of Non-GAAP Adjustment (1,372)$ (1,372)$ Equity investment income (loss), net of taxes 110$ 90$ Non-GAAP net income 12,122$ 34,745$ Non-GAAP net Income per common share: Basic 0.75$ 2.08$ Diluted 0.75$ 2.07$ GAAP net income 9,791$ 32,414$ GAAP net Income per common share: Basic 0.61$ 1.94$ Diluted 0.60$ 1.93$ Weighted average number of common shares: Basic 16,182 16,676 Diluted 16,248 16,797