Attached files
| file | filename |
|---|---|
| EX-23 - EX-23 - AMERICAN NATIONAL INSURANCE CO | d75425dex23.htm |
| EX-31.2 - EX-31.2 - AMERICAN NATIONAL INSURANCE CO | d75425dex312.htm |
| EX-21 - EX-21 - AMERICAN NATIONAL INSURANCE CO | d75425dex21.htm |
| EX-32.1 - EX-32.1 - AMERICAN NATIONAL INSURANCE CO | d75425dex321.htm |
| EX-31.1 - EX-31.1 - AMERICAN NATIONAL INSURANCE CO | d75425dex311.htm |
Table of Contents
Index to Financial Statements
UNITED STATES
SECURITIES AND EXCHANGE COMMISSION
Washington, D.C. 20549
FORM 10-K
| x | Annual Report Pursuant to Section 13 or 15(d) of the Securities Exchange Act of 1934 |
For the fiscal year ended December 31, 2015
or
| ¨ | Transition Report Pursuant to Section 13 or 15(d) of the Securities Exchange Act of 1934 |
Commission File No. 001- 34280

American National Insurance Company
(Exact name of registrant as specified in its charter)
| Texas | 74-0484030 | |
| (State or other jurisdiction of incorporation or organization) |
(I.R.S. Employer Identification No.) |
One Moody Plaza
Galveston, Texas 77550-7999
(Address of principal executive offices) (Zip Code)
(409) 763-4661
(Registrant’s telephone number, including area code)
Indicate by check mark whether the registrant (1) has filed all reports required to be filed by Section 13 or 15(d) of the Securities Exchange Act of 1934 during the preceding 12 months (or for such shorter period that the registrant was required to file such reports), and (2) has been subject to such filing requirements for the past 90 days. x Yes ¨ No
Indicate by check mark whether the registrant has submitted electronically and posted on its corporate Web site, if any, every Interactive Data File required to be submitted and posted pursuant to Rule 405 of Regulation S-T (§229.405 of this chapter) during the preceding 12 months (or for such shorter period that the registrant was required to submit and post such files). x Yes ¨ No
Indicate by check mark whether the registrant is a large accelerated filer, an accelerated filer, a non-accelerated filer or a smaller reporting company. See definitions of “large accelerated filer”, “accelerated filer” and “smaller reporting company” in Rule 12b-2 of the Exchange Act:
| Large accelerated filer | x | Accelerated filer | ¨ | |||
| Non-accelerated filer | ¨ | Smaller reporting company | ¨ |
Indicate by check mark whether the registrant is a shell company (as defined in Rule 12b-2 of the Exchange Act). ¨ Yes x No
The aggregate market value on June 30, 2015 (the last business day of the registrant’s most recently completed second fiscal quarter) of the voting stock held by non-affiliates of the registrant was approximately $738.8 million. For purposes of the determination of the above-stated amount, only directors, executive officers and 10% shareholders are presumed to be affiliates, but neither the registrant nor any such person concedes that they are affiliates of registrant.
As of February 17, 2016, there were 26,894,655 shares of the registrant’s voting common stock, $1.00 par value per share, outstanding.
DOCUMENTS INCORPORATED BY REFERENCE
Information called for in Part III of this Form 10-K is incorporated by reference to the registrant’s Definitive Proxy Statement to be filed within 120 days of the close of the registrant’s fiscal year in conjunction with the registrant’s annual meeting of shareholders.
Table of Contents
Index to Financial Statements
AMERICAN NATIONAL INSURANCE COMPANY
| ITEM 1. |
3 | |||||
| ITEM 1A. |
12 | |||||
| ITEM 1B. |
19 | |||||
| ITEM 2. |
20 | |||||
| ITEM 3. |
20 | |||||
| ITEM 4. |
20 | |||||
| ITEM 5. |
20 | |||||
| ITEM 6. |
22 | |||||
| ITEM 7. |
MANAGEMENT’S DISCUSSION AND ANALYSIS OF FINANCIAL CONDITION AND RESULTS OF OPERATIONS |
23 | ||||
| ITEM 7A. |
57 | |||||
| ITEM 8. |
60 | |||||
| ITEM 9. |
CHANGES IN AND DISAGREEMENTS WITH ACCOUNTANTS ON ACCOUNTING AND FINANCIAL DISCLOSURE |
108 | ||||
| ITEM 9A. |
108 | |||||
| ITEM 9B. |
109 | |||||
| ITEM 10. |
109 | |||||
| ITEM 11. |
109 | |||||
| ITEM 12. |
SECURITY OWNERSHIP OF CERTAIN BENEFICIAL OWNERS AND MANAGEMENT AND RELATED STOCKHOLDER MATTERS |
109 | ||||
| ITEM 13. |
CERTAIN RELATIONSHIPS AND RELATED TRANSACTIONS AND DIRECTOR INDEPENDENCE |
109 | ||||
| ITEM 14. |
109 | |||||
| ITEM 15. |
110 | |||||
| 110 | ||||||
| 113 | ||||||
2
Table of Contents
Index to Financial Statements
| ITEM 1. | BUSINESS |
Company Overview
American National Insurance Company has over 110 years of experience. We have maintained our corporate headquarters in Galveston, Texas since our founding in 1905. Our core businesses are life insurance, annuities and property and casualty insurance. We also offer limited health insurance. We provide personalized service to approximately six million policyholders throughout the United States, the District of Columbia, and Puerto Rico.
In this document, we refer to American National Insurance Company and its subsidiaries as the “Company,” “we,” “our,” and “us.”
Our vision is to be a leading provider of financial products and services for current and future generations. For more than a century, we have maintained a conservative business approach and corporate culture. We have an unwavering commitment to serve our policyholders, agents, and shareholders by providing excellent customer service and competitively priced and diversified products. We are committed to profitable growth, which enables us to remain financially strong. Acquisitions that are strategic and offer synergies may be considered, but they are not our primary source of growth. We invest regularly in our distribution channels and markets to fuel internal growth.
We are committed to excellence and maintaining high ethical standards in all our business dealings. Disciplined adherence to our values has allowed us to deliver consistently high levels of customer service through talented people, who are at the heart of our business.
Business Segments
Our family of companies includes six life insurance companies, eight property and casualty insurance companies, and numerous non-insurance subsidiaries. The business segments and the principal products they offer or manage follow.
Life Segment
Whole Life. Whole life products provide a guaranteed benefit upon the death of the insured in return for the periodic payment of a fixed premium over a predetermined period. Premium payments may be required for the entire life of the contract, to a specified age or a fixed number of years, and may be level or change in accordance with a predetermined schedule. Whole life insurance includes some policies that provide a participation feature in the form of dividends. Policyholders may receive dividends in cash or apply them to increase death benefits or cash values available upon surrender, or reduce the premiums required to maintain the contract in-force.
Term Life. Term life products provide a guaranteed benefit upon the death of the insured for a specified time period in return for the periodic payment of premiums. Coverage periods typically range from one to thirty years, but in no event longer than the period over which premiums are paid.
Universal Life. Universal life insurance products provide coverage through a contract that gives the policyholder flexibility in premium payments and coverage amounts. Universal life products may allow the policyholder, within certain limits, to increase or decrease the amount of death benefit coverage over the term of the contract and to adjust the frequency and amount of premium payments. Universal life products are interest rate sensitive, and we determine the interest crediting rates, subject to policy specific minimums.
Equity-indexed universal life products have the same features as the universal life products, but also provide an opportunity for policyholders to earn additional return through credited interest tied to the performance of a particular stock index, such as the S&P 500.
3
Table of Contents
Index to Financial Statements
Variable Universal Life. Variable universal life products provide insurance coverage on a similar basis as universal life, except that the policyholder bears the investment risk because the value of the policyholder’s account balance varies with the investment experience of the securities held in the separate account investment options selected by the policyholder.
Credit Life Insurance. Credit life insurance products are sold in connection with a loan or other credit account. Credit life insurance products are designed to pay to the lender the borrower’s remaining debt on a loan or credit account if the borrower dies during the coverage period.
Annuity Segment
Deferred Annuity. A deferred annuity is an asset accumulation product. Deposits are received as a single premium deferred annuity or in a series of payments for a flexible premium deferred annuity. Deposits are credited with interest at our determined rates subject to policy minimums. For certain limited periods of time, usually from one to ten years, interest rates are guaranteed not to change. Deferred annuities usually have surrender charges that begin at issue and reduce over time and may have market value adjustments that can increase or decrease any surrender value.
An equity-indexed deferred annuity is credited with interest using a return that is based on changes in an index, such as the S&P 500 Composite Stock Price Index, subject to a specified minimum.
Single Premium Immediate Annuity (“SPIA”). A SPIA is purchased with one premium payment, providing periodic (usually monthly or annual) payments to the annuitant for a specified period, such as for the remainder of the annuitant’s life. Return of the original deposit may or may not be guaranteed, depending on the terms of the annuity contract.
Variable Annuity. With a variable annuity the policyholder bears the investment risk because the value of the policyholder’s account balance varies with the investment experience of the securities held in the separate account investment options selected by the policyholder. These products have no guaranteed minimum withdrawal benefits.
Health Segment
Medicare Supplement. Medicare Supplement insurance is a type of private health insurance designed to supplement or pay the costs of certain medical services not covered by Medicare.
Supplemental Insurance. Supplemental insurance is designed to provide supplemental coverage for specific events or illnesses such as cancer and accidental injury or death.
Stop-Loss. Stop-loss coverage is used by employers to limit their exposure under self-insured medical plans. Two coverages, which are usually offered concurrently, are available. Specific Stop-Loss provides coverage when claims for an individual reach a threshold; after the threshold is reached, the policy reimburses claims paid by the employer up to a coverage limit for each individual. Aggregate Stop-Loss reimburses the employer once the group’s total paid claims reach a threshold.
Credit Disability. Credit disability (also called credit accident and health) insurance pays a limited number of monthly payments on a loan or credit account if the borrower becomes disabled during the coverage period.
Medical Expense. Medical expense insurance covers most health expenses including hospitalization, surgery and outpatient services (excluding dental and vision costs). We no longer market these products and existing contracts are in run-off.
4
Table of Contents
Index to Financial Statements
Property and Casualty Segment
Personal Lines. Personal lines include insurance policies sold to individuals for auto, homeowners and other exposures. Auto insurance covers specific risks involved in owning and operating an automobile. Homeowner insurance provides coverage that protects the insured, owner’s or renter’s property against loss from perils. Other personal insurance provides coverage for property such as boats, motorcycles and recreational vehicles.
Commercial Lines. Agricultural business insurance is the majority of our commercial lines. This includes property and casualty coverage tailored for a farm, ranch, vineyard or other agricultural business, contractors, and business within rural and suburban markets. Commercial auto insurance is typically issued in conjunction with the sale of our Agricultural business insurance and covers specific risks involved in owning and operating vehicles. Other commercial insurance is offered along with our Agricultural business and encompasses property, liability and workers’ compensation coverages.
Credit-Related Property Insurance Products. We primarily offer the following credit insurance products:
Collateral or Creditor Protection Insurance (“CPI”). CPI provides insurance against loss, expense to recover, or damage to personal property pledged as collateral (typically automobiles and homes) resulting from fire, burglary, collision, or other loss occurrence that would either impair a creditor’s interest or adversely affect the value of the collateral. The coverage is purchased from us by the lender according to the terms of the credit obligation and charged to the borrower by the lender when the borrower fails to provide the required insurance.
Guaranteed Auto Protection or Guaranteed Asset Protection (“GAP”). GAP insures the excess outstanding indebtedness over the primary property insurance benefits that may occur when there is a total loss to or an unrecovered theft of the collateral. GAP can be written on a variety of assets that are used as collateral to secure credit; however, it is most commonly written on automobiles.
Corporate and Other Segment—Our Corporate and Other segment is primarily our invested assets not matched with our insurance activities. It also includes our non-insurance subsidiaries, such as our limited investment advisory services.
Marketing Channels
Product distribution is managed to satisfy specific markets, maintain brand identities and minimize channel conflict across our five marketing channels described below. When possible, products are cross-sold to maximize product offerings and return on investment in products and distribution.
Independent Marketing Group (“IMG”)—distributes life insurance and annuities through independent agents serving middle and affluent markets, as well as niche markets such as the small pension plan sponsor. IMG provides products and services to clients in need of wealth protection, accumulation, distribution, and transfer. Products are marketed through financial institutions, large marketing organizations, employee benefit firms, broker-dealers, and independent insurance agents and brokers.
IMG also markets to individuals who favor purchasing insurance directly from an insurance company. It offers life insurance to middle-income customers through channels including direct mail, internet and call centers.
Career Sales and Service Division’s (“CSSD”) —can be traced to the Company’s founding in 1905, and offers life insurance, annuities, and limited benefit health insurance products through exclusive employee agents primarily to the middle-income market. CSSD’s business model is structured to distribute new products as well as provide personalized service to the customer by agents located throughout much of the United States. CSSD has evolved its operations to offer a wider variety of products and alternative payment options to meet the changing needs of the customer.
5
Table of Contents
Index to Financial Statements
Multiple-line—offers life insurance, health insurance, annuities, and property and casualty insurance primarily through dedicated agents. Multiple-line serves individuals, families, agricultural clients, and small business owners at all income levels. Policyholders can generally do all their insurance business with a single agent, which has been identified as an important driver to client satisfaction.
Health Insurance Division—through independent agents and managing general underwriters (“MGU”), serves the needs of a variety of markets including middle-income seniors, self-insured employers, and the special needs of individuals through supplemental products. The Health Division offers an array of life and health insurance products for this growing segment of the population, including group life products, supplemental health insurance products, and health reinsurance. It remains committed to traditional Medicare supplement products. The Health Division also administers the health insurance products sold by other marketing channels.
Credit Insurance Division—offers products that provide protection to borrowers and the lenders that extend credit to them. Products offer coverage against unpaid indebtedness as a result of death, disability, involuntary unemployment or untimely loss to the collateral securing a loan. Distribution includes general agents who market to financial institutions, automobile dealers, and furniture dealers. These general agents are given non-exclusive authority to solicit insurance within a specified geographic area and to appoint and supervise subagents.
Policyholder Liabilities
We record the amounts for policyholder liabilities in accordance with U.S generally accepted accounting principles (“GAAP”) and the standards of practice of the American Academy of Actuaries. We carry liabilities for future policy benefits associated with base policies and riders, unearned mortality charges and future disability benefits, for other policyholder liabilities associated with unearned premiums and claims payable, and for unearned revenue and the unamortized portion of front-end fees. We also establish liabilities for unpaid claims and claim adjustment expenses, including those that have been incurred but not yet reported. In addition, we carry liabilities for minimum death benefit guarantees relating to certain annuity contracts, secondary guarantees relating to certain life policies, and fair value reserves associated with living benefits embedded derivative guarantees.
Pursuant to state insurance laws, we establish statutory reserves, which are reported as liabilities, and which generally differ from future policy benefits determined using GAAP on our respective policies. These statutory reserves are established in amounts sufficient to meet policy and contract obligations, when taken together with expected future premiums and interest at assumed rates.
Additional information regarding our policyholder liabilities may be found in Part II, Item 7, Management’s Discussion and Analysis of Financial Condition and Results of Operations– Critical Accounting Estimates – Reserves section.
Risk Management
A conservative operating philosophy was a founding principle for our Company. We manage risks throughout the Company by employing controls in our insurance and investment functions. These controls are designed to both place limits on activities and provide reporting information that helps shape adjustments to existing controls. The Company’s Board of Directors oversees a formal enterprise-wide risk management program to coordinate risk management efforts and to provide reasonable assurance that risk taking activities are aligned with strategic objectives. The Board Audit Committee assists the Board in its risk management oversight. The risk management program includes a corporate risk officer who chairs a Management Risk Committee to ensure consistent application of the enterprise risk management process across all business segments. We also use several other senior management committees to support the discussion and enforcement of risk controls in management of the Company.
6
Table of Contents
Index to Financial Statements
Our insurance products are designed to balance features desired by the marketplace with provisions that mitigate our risk exposures across our insurance portfolio. We employ underwriting standards to ensure proper rates are charged to different classes of insureds. In our life insurance and annuity products, we mitigate the risk of disintermediation through the use of surrender charges and market value adjustment features.
The process of linking the timing and the amount of paying obligations related to our insurance and annuity contracts and the cash flows and valuations of the invested assets supporting those obligations is commonly referred to as asset-liability management (“ALM”). Our ALM Committee regularly monitors the level of risk in the interaction of assets and liabilities and helps shape actions intended to attain our desired risk-return profile. Investment allocations and duration targets are also intended to limit the risk exposure in our annuity products by limiting the credited rate to a range supported by these investments. Additional tools which help shape investment decisions include deterministic and stochastic interest rate scenario analyses using a licensed, third party economic scenario generator and detailed insurance ALM models. These models also use experience related to surrenders and death claims.
We also manage risk by purchasing reinsurance to limit exposure on any one insurance contract or any single event or series of events. Our reinsurance program provides coverage for some individual risks with exposures above certain amounts as well as exposure to catastrophes including hurricanes, tornadoes, wind and hail events, earthquakes, fires following earthquakes, winter storms, and wildfires. We purchase reinsurance from many providers and we are not dependent on any single reinsurer. We believe that our reinsurers are currently reputable and financially secure, and we regularly review the financial strength ratings of our reinsurers to ensure they meet established thresholds. Reinsurance does not remove our liability to pay our policyholders, and we remain liable to our policyholders for the risks we insure. The operating and financial condition of our reinsurers can change between the time reinsurance is purchased and when claims become payable, which can increase our risk.
In our Property and Casualty segment, the use of catastrophic event models is an important element of risk management. These models assist us in the measurement and management of exposure concentrations and the amount and structure of reinsurance purchases. In addition to reinsurance, we manage exposure to catastrophic risk by limiting personal homeowners business in coastal areas, implementing hurricane, wind and hail deductible requirements where appropriate, and not renewing coverage in regions where exposure to risky events exceeds our risk appetite.
Pricing
We establish premium rates for life and health insurance products using assumptions as to future mortality, morbidity, persistency, and expenses, all of which are estimates generally based on our experience, industry data, projected investment earnings, competition, regulations and legislation. Premium rates for property and casualty insurance are influenced by many factors, including the estimated frequency and severity of claims, expenses, state regulation and legislation, and general business and economic conditions, including market interest rates and inflation. Profitability is affected to the extent actual experience deviates from our pricing assumptions.
Payments for certain annuity and life products are not recognized as revenues, but are deposits added to policyholder account balances. Revenues from these products are charges to the account balances for the cost of insurance risk and administrative fees and, in some cases surrender fees. Profits are earned to the extent these revenues exceed actual costs. Profits are also earned from investment income on assets invested from the deposits in excess of the amounts credited to policyholders.
Premiums for accident and health policies must take into account the rising costs of medical care. The annual rate of medical cost inflation has historically been higher than the general rate of inflation, requiring frequent rate increases, most of which are subject to approval by state regulatory agencies.
7
Table of Contents
Index to Financial Statements
Credit Life and Health rates are set by each state. These rates are the maximum amounts that may be charged. We may charge a lower rate to reflect a variety of factors including better than expected experience, compensation adjustments, and competitive forces. In the event that an account experiences poor experience, we may request a rate increase from the applicable state.
Competition
We compete principally on the scope of our distribution systems, the breadth of our product offerings, reputation, marketing expertise and support, financial strength and ratings, product features and prices, customer service, claims handling, and in the case of producers, compensation. The market for insurance, retirement and investment products continues to be highly fragmented and competitive. We compete with a large number of domestic and foreign insurance companies, many of which offer one or more similar products. In addition, for products that include an asset accumulation component, our competition includes domestic and foreign securities firms, investment advisors, mutual funds, banks and other financial institutions.
Several competing insurance carriers are larger than we are, and have brands that are more commonly known and spend significantly more on advertising than we do. We remain competitive with these commonly known brands by managing costs, providing attractive coverage and service, maintaining positive relationships with our agents, and maintaining our financial strength ratings.
Ratings
Rating agencies provide independent opinions or ratings regarding the capacity of an insurance company to meet the contractual obligations of its insurance policies and contracts. These ratings are based on each rating agencies’ quantitative and qualitative evaluation of a company and its management strategy. The rating agencies do not provide ratings as a recommendation to purchase insurance or annuities, nor as a guarantee of an insurer’s current or future ability to meet contractual obligations. Each agency’s rating should be evaluated independently of any other rating. Ratings may be changed, suspended, or withdrawn at any time.
Our current insurer financial strength rating from two of the most widely referenced rating organizations as of the date of this filing are as follows:
| • | A.M. Best Company: A (1) |
| • | Standard & Poor’s (“S&P”): A (2) |
| (1) | A.M. Best’s active company rating scale consists of thirteen ratings ranging from A++ (Superior) to D (poor). |
| (2) | S&P’s active company ratings scale ‘AA’ to ‘CCC’ may be modified by the addition of a plus (+) or minus (-) sign to show relative standing within the major rating categories. |
Regulation Applicable to Our Business
Our insurance operations are subject to extensive regulation, primarily at the state level. Such regulation varies by state but generally has its source in statutes that establish requirements for the business of insurance and that grant broad regulatory authority to a state agency. Insurance regulation has a substantial effect and governs a wide variety of matters, such as insurance company licensing, agent and adjuster licensing, policy benefits, price setting, accounting practices, product suitability, the payment of dividends, the nature and amount of investments, underwriting practices, reserve requirements, marketing and advertising practices, privacy, policy forms, reinsurance reserve requirements, risk and solvency assessments, mergers and acquisitions, capital adequacy, transactions with affiliates, participation in shared markets and guaranty associations, claims practices, the remittance of unclaimed property, and enterprise risk requirements. The models for state laws and regulations often emanate from the National Association of Insurance Commissioners (“NAIC”).
State insurance departments monitor compliance with regulations through periodic reporting procedures and examinations. At any given time, financial, market conduct or other examinations of our insurance companies may be occurring.
8
Table of Contents
Index to Financial Statements
The Dodd-Frank Wall Street Reform and Consumer Protection Act (“Dodd-Frank”) expanded the U.S. federal government presence in insurance oversight. Dodd-Frank’s requirements include streamlining the state-based regulation of reinsurance and non-admitted insurance. Dodd-Frank also established the Federal Insurance Office (“FIO”) within the U.S. Department of the Treasury, which is authorized to, among other things, gather data and information to monitor aspects of the insurance industry, identify certain issues in the regulation of insurers, and preempt state insurance measures under certain circumstances. We believe there likely will be further federal incursion into the business of insurance, which may add significant legal complexity and associated costs to our business.
Regulatory matters having the most significant effects on our insurance operations and financial reporting are described further below. In addition, Item 1A, Risk Factors, Litigation and Regulation Risk Factors, below discusses significant risks presented to our business by extensive regulation and describes certain other laws and regulations that are or may become applicable to us.
Limitations on Dividends by Insurance Subsidiaries. Dividends received from our insurance subsidiaries represent one source of cash for us. Our insurance subsidiaries’ ability to pay dividends is restricted by state law and impacted by federal income tax considerations.
Holding Company Regulation. We are an insurance holding company system under the insurance laws of the states where we do business. Our insurance companies are organized under the laws of Texas, Missouri, New York, Louisiana, and California. Insurance holding company system laws and regulations in such states generally require periodic reporting to state insurance regulators of various business, risk management and financial matters and advance notice to, or in some cases approval by, such regulators prior to certain transactions between insurers and their affiliates. These laws also generally require regulatory approval prior to the acquisition of a controlling interest in an insurance company. These requirements may deter or delay certain transactions considered desirable by management or our stockholders.
Price Regulation. Nearly all states have laws requiring property and casualty and health insurers to file price schedules and most insurers to file policy or coverage forms, and other information with the state’s regulatory authority. In many cases these must be approved prior to use. The objectives of pricing laws vary, but generally a price cannot be excessive, inadequate or unfairly discriminatory. Prohibitions on discriminatory pricing apply in the context of certain products as well.
Our ability to adjust prices is often dependent on the applicable pricing law and our ability to demonstrate to the particular regulator that current or proposed pricing complies with such law. In states that significantly restrict underwriting selectivity, we can manage our risk of loss by charging a price that reflects the cost and expense of providing insurance products. In states that significantly restrict price-setting ability, we can manage our risk of loss by being more selective in underwriting. When a state has significant underwriting and pricing restrictions, it becomes more difficult to manage our risk of loss, which can impact our willingness and ability to market products in such states.
Guaranty Associations and Involuntary Markets. State laws allow insurers to be assessed, subject to prescribed limits, insurance guaranty fund fees to pay certain obligations of insolvent insurance companies. In addition, to maintain our licenses to write property and casualty insurance in various states, require us to participate in assigned risk plans, reinsurance facilities, and joint underwriting associations that provide various insurance coverages to purchasers that otherwise are unable to obtain coverage from private insurers. Underwriting results related to these arrangements, which tend to be adverse, have not been material to our results of operations.
Investment Regulation. Insurance company investment regulations require investment portfolio diversification and limit the amount of investment in certain asset categories. Failure to comply with these regulations leads to the treatment of non-conforming investments as non-admitted assets for measuring statutory surplus. In some instances, these rules require sale of non-conforming investments.
9
Table of Contents
Index to Financial Statements
Exiting Geographic Markets, Canceling and Non-Renewing Policies. Most states regulate an insurer’s ability to exit a market by limiting the ability to cancel and non-renew policies. Some states prohibit an insurer from withdrawing one or more types of insurance business from the state, except pursuant to an approved plan. These regulations could restrict our ability to exit unprofitable markets.
Statutory Accounting. Financial reports to state insurance regulators utilize statutory accounting practices as defined in the Accounting Practices and Procedures Manual of the NAIC, which are different from GAAP. Statutory accounting practices, in keeping with the intent to assure the protection of policyholders, are generally based on a solvency concept, while GAAP is based on a going-concern concept. While not a substitute for GAAP performance measures, statutory information is used by industry analysts and reporting sources to compare the performance of insurance companies. Maintaining both GAAP and Statutory financial records increases our business costs.
Insurance Reserves. State insurance laws require life and property and casualty insurers to annually analyze the adequacy of statutory reserves. Our appointed actuaries must submit an opinion that policyholder and claim reserves are adequate.
Risk-Based Capital and Solvency Requirements. The NAIC has a formula for analyzing capital levels of insurance companies called risk-based capital (“RBC”). The RBC formula has minimum capital thresholds that vary with the size and mix of a company’s business and assets. It is designed to identify companies with capital levels that may require regulatory attention. At December 31, 2015, American National Insurance Company and each of its insurance subsidiaries was more than adequately capitalized and exceeded the minimum RBC requirements.
Securities Regulation. The sale and administration of variable life insurance and variable annuities are subject to extensive regulation at the federal and state level, including by the Securities and Exchange Commission (“SEC”) and the Financial Industry Regulatory Authority (“FINRA”). Our variable annuity contracts and variable life insurance policies are issued through separate accounts that are registered with the SEC as investment companies under the Investment Company Act of 1940. Each registered separate account is generally divided into sub-accounts, each of which invests in an underlying mutual fund that is itself a registered investment company under such act. In addition, the variable annuity contracts and variable life insurance policies issued by the separate accounts are registered with the SEC under the Securities Act of 1933. The U.S. federal and state regulatory authorities and FINRA from time to time make inquiries and conduct examinations regarding our compliance with securities and other laws and regulations.
In addition, our periodic reports and proxy statements to stockholders are subject to the requirements of the Securities Exchange Act of 1934 and corresponding rules of the SEC, and our corporate governance processes are subject to regulation by the SEC and the NASDAQ Stock Market. Our registered wholesale broker-dealer and registered investment adviser subsidiaries are subject to regulation and supervision by the SEC, FINRA and, in some cases, state securities administrators.
Suitability. FINRA rules require broker-dealers selling variable insurance products to determine that transactions in such products are “suitable” to the circumstances of the particular customer. In addition, most states have enacted the NAIC’s Suitability in Annuity Transactions Model Regulation that, in adopting states, places suitability responsibilities on insurance companies in the sale of fixed and indexed annuities, including responsibilities for training agents.
10
Table of Contents
Index to Financial Statements
Privacy Regulation. U.S. federal laws, such as the Gramm-Leach-Bliley Act, and the laws of some states regulate disclosures of certain customer information and require us to protect the security and confidentiality of such information. Such laws also require us to notify customers about our policies and practices relating to the collection, protection and disclosure of confidential customer information. State and federal laws, such as the federal Health Insurance Portability and Accountability Act regulate our use, protection and disclosure of certain personal health information.
The NAIC recently adopted the Cybersecurity Bill of Rights which provides a set of directives for insurance companies to follow that are aimed at protecting the data of consumers. Several obligations under the Cybersecurity Bill of Rights are as stringent as or more stringent than most state and federal breach notification laws. While it is currently not mandatory for insurers to comply with the Cybersecurity Bill of Rights, nor for states to adopt the bill, state and federal legislators and regulators are likely to look to the rules for guidance in proposing new legislation and as a standard to which insurance companies could be held in decisions on whether to bring enforcement actions.
Environmental Considerations. As an owner and operator of real property, we are subject to extensive federal, state and local environmental laws and regulations. Inherent in such ownership and operation is the risk that there may be potential environmental liabilities and costs in connection with any required remediation of such properties. We routinely have environmental assessments performed with respect to real estate being acquired for investment or through foreclosure, but we cannot provide assurance that unexpected environmental liabilities will not arise. In addition, we hold equity interests in companies that could potentially be subject to environmental liabilities. Based on information currently available to us, management believes that any costs associated with compliance with environmental laws and regulations or any required remediation will not have a material adverse effect on our business, results of operations or financial condition.
Other types of regulations that affect us include insurable interest laws, employee benefit plan laws, antitrust laws, federal anti-money laundering and anti-terrorism laws, employment and labor laws, and federal and state tax laws. Failure to comply with federal and state laws and regulations may result in censure; the issuance of cease-and-desist orders; suspension, termination or limitation of the activities of our operations and/or our employees and agents; or the obligation to pay fines, penalties, assessments, interest, or additional taxes and wages. In some cases, severe penalties may be imposed for breach of these laws. We cannot predict the impact of these actions on our businesses, results of operations or financial condition.
Employees
As of December 31, 2015, we had approximately 4,736 employees. We consider our employee relations to be good.
Available Information
We file periodic and current reports, proxy statements and other information with the SEC. Such reports, proxy statements and other information may be obtained by visiting the Public Reference Room of the SEC at 100 F Street, N.E., Washington D.C. 20549 or by calling the SEC at 1-800-SEC-0330. The SEC maintains a website (www.sec.gov) that contains reports, proxy statements, and other information regarding issuers that file electronically with the SEC.
Our press releases, financial information and reports filed with the SEC (for example, Annual Report on Form 10-K, Quarterly Reports on Form 10-Q, Current Reports on Form 8-K and any amendments to those forms) are available online at www.americannational.com. The reference to our website does not constitute the incorporation by reference of information contained at such website into this, or any other, report. Copies of any documents on our website are available without charge, and reports filed with or furnished to the SEC will be available as soon as reasonably practicable after they are filed with or furnished to the SEC.
11
Table of Contents
Index to Financial Statements
| ITEM 1A. | RISK FACTORS |
Our performance is dependent on our ability to manage complex operational, financial, legal, and regulatory risks and uncertainties throughout our operations. The most significant of these risks and uncertainties are described below. Any of these, individually or in the aggregate, could materially adversely impair our business, financial condition or results of operations, particularly if our actual experience differs from our estimates and assumptions. While our enterprise risk management framework contains various strategies, processes, policies and procedures in place to address these risks and uncertainties, we cannot be certain that these measures will be implemented successfully in all circumstances. In addition, we could experience risks that we failed to identify, or risks of a magnitude greater than expected.
Economic and Investment Market Risk Factors
Our results of operations are materially affected by economic and political conditions in the U.S. and elsewhere. There continues to be uncertainty about the strength and sustainability of economic activity. Factors such as continuing unemployment, declining workforce participation, consumer prices, geopolitical issues, energy prices, stagnant family income, low consumer confidence and spending, and increased student and consumer debt can adversely affect the economy and demand for our products. For example, difficult credit conditions may adversely affect purchases of credit-related insurance products, or our policyholders may choose to defer or stop paying insurance premiums, resulting in higher lapses or surrenders of policies.
Interest rates have a significant impact on our business and on consumer demand for our products. Some of our products, principally interest-sensitive life insurance and fixed annuities, expose us to the risk that changes in interest rates may reduce our “spread,” or the difference between the amounts we earn on investment and the amount we must pay under our contracts. Persistently low (or lower) interest rates, compound this spread compression. When market interest rates decrease or remain at relatively low levels, prepayments and redemptions affecting our investment securities and mortgage loan investments may increase as issuers and borrowers seek to refinance at a lower rate. Proceeds from maturing, prepaid or sold bonds or mortgage loan investments may be reinvested at lower yields, reducing our spread. Our ability to decrease product crediting rates in response may be limited by market and competitive conditions and by regulatory or contractual minimum rate guarantees. Conversely, increases in market interest rates can also have negative effects. For example, increasing rates on other insurance or investment products offered to our customers by competitors can lead to higher surrenders at a time when fixed maturity investment asset values are lower. We may react to market conditions by increasing crediting rates, which narrows spreads. In addition, when interest rates rise, the value of our investment portfolio may decline due to decreases in the fair value of our securities. While we use ALM processes to mitigate the effect on our spreads of changes in interest rates, they may not be fully effective. See the Risk Management discussion in Item 1 above and the General Trends discussion in Part II, Item 7 below for further details about interest rates and our ALM processes.
Fluctuations in the markets for fixed maturity securities, equity securities, and commercial real estate could adversely affect our business. Investment returns are an important part of our profitability. Substantially all investments, including our fixed income, equity, real estate and mortgage loan investment portfolios, are subject to market and credit risks, including market volatility and deterioration in the credit or prospects of companies or governmental entities in which we invest. We could incur significant losses from such risks, particularly during extreme market events. The concentration of our investments in any particular industry, group of related industries or government issuers, or geographic sector can compound these risks.
12
Table of Contents
Index to Financial Statements
In addition to negatively affecting investment returns, equity market downturns and volatility can have other adverse effects on us. First, equity market downturns and volatility may discourage new purchases of our products that have returns linked to the performance of the equity market and may cause some existing customers to withdraw cash values or reduce investments in such products, in turn reducing our fee revenues. Second, the guarantees that certain products provide, may cost more than expected in volatile or declining equity market conditions, which could negatively affect our earnings. Third, our estimates of liabilities and expenses for pension and other postretirement benefits incorporate assumptions regarding the rate used to discount estimated future liabilities and the long-term rate of return on plan assets. Declines in the discount rate or the rate of return on plan assets, both of which are influenced by potential investment returns, could increase our required cash contributions or pension-related expenses in future periods.
Some of our investments are relatively illiquid. Investments in privately placed securities, mortgage loans, and real estate, including real estate joint ventures and other equity interests, are relatively illiquid. If we suddenly require significant amounts of cash in excess of ordinary cash requirements, it may be difficult or not possible to sell these investments in an orderly manner for a favorable price.
Operational Risk Factors
Our actual experience could differ from our estimates and assumptions regarding product pricing, the fair value and future performance of our investments, and the realization of deferred tax assets. Our product pricing includes long-term assumptions regarding investment returns, mortality, morbidity (the rate of incidence of illness), persistency (the rate at which policies remain in-force), operating expenses, and other underwriting assumptions. Our profitability substantially depends on actual experience being consistent with or better than these assumptions. If we fail to appropriately price our insured risks, or if claims experience is more severe than we assumed, our earnings and financial condition may be negatively affected. Conversely, significantly overpriced risks may negatively impact new business growth and retention of existing business.
Our loss reserves are estimates of amounts needed to pay and administer incurred claims and, as such, are inherently uncertain; they do not and cannot represent exact measures of liability. Inflationary events, especially events outside of historical norms, or regulatory changes that affect the assumptions underlying our estimates can cause variability. For example, increases in costs for auto parts and repair services, construction costs, and commodities result in higher losses for property damage claims. Accordingly, our loss reserves could prove to be inadequate to cover our actual losses and related expenses. See Part II, Item 7, Management’s Discussion and Analysis of Financial Condition and Results of Operations—Critical Accounting Estimates—Reserves for additional information.
With respect to our investments, the determination of estimates for allowances and impairments varies by investment type and is based upon our periodic evaluation of known and inherent risks associated with the respective asset class. Historical trends and assumed changes may not be indicative of future impairments or allowances. See Note 2, Summary of Significant Accounting Policies and Practices, of the Notes to the Consolidated Financial Statements for further description of our evaluation of impairments.
Assumptions regarding the future realization of deferred tax assets are dependent upon estimating the generation of sufficient future taxable income, including capital gains. If future events differ from our current forecasts and it is determined that deferred tax assets cannot be realized, a deferred tax valuation allowance must be established, with a charge to expenses.
13
Table of Contents
Index to Financial Statements
Interest rate fluctuations and other events may require us to accelerate the amortization of deferred policy acquisition costs (“DAC”). When interest rates rise, life and annuity surrenders and withdrawals may increase as policyholders seek to buy products with higher or perceived higher returns, impacting estimates of future profits. Significantly lower future profits may cause us to accelerate DAC amortization, and such acceleration could adversely affect our results of operations to the extent such amortization exceeds any surrender or other charges earned as income upon surrender and withdrawal. See also Part II, Item 7, Management’s Discussion and Analysis of Financial Condition and Results of Operations — Critical Accounting Estimates, and Part II, Item 8, Financial Statements and Supplementary Data – Note 2, Summary of Significant Accounting Policies and Practices, and Note 10, Deferred Policy Acquisition Costs, of the Notes to the Consolidated Financial Statements for additional information.
We may be unable to maintain the availability and performance of our systems and safeguard our data. We rely on the availability, reliability, and security of our information-processing infrastructure, system platforms, and business applications to store, process, retrieve, calculate and evaluate customer and company information. In certain lines of our business, our information technology and telecommunication systems interface with and rely upon third-party services. We are highly dependent on the ability to access these external services for necessary business functions, such as acquiring new business, managing existing business, paying claims, and ensuring timely and accurate financial reporting. Furthermore, we have developed or evolved strategies and processes to maintain and enhance our existing technology and processing infrastructure, information systems, replacement of information systems to keep pace with changes in technology, changing customer preferences and expectations, and evolving industry and regulatory standards. However, system failures, extended outages, or damage or destruction to systems, whether caused by intentional or unintentional acts or events, as well as difficulties arising from the implementation of new systems and technologies, could compromise our ability to perform timely critical functions. If these systems were inaccessible or inoperable due to natural or man-made disasters, or if they fail to function effectively or as designed, the resulting disruptions may impede or interrupt our business operations.
We receive and transmit confidential data with and among customers, agents, financial institutions and selected third party vendors and service providers. We have invested significant time and resources towards preventing and mitigating data security risks through several layers of data protection technologies, designs and authentication capabilities. Our efforts may not be effective against all security threats and breach attempts in light of increasingly complex persistent threat techniques and the evolving sophistication of cyber-attacks. A breach, whether from external or internal sources, could result in access, viewing, misappropriation, altering or deleting information in ours or third party’s systems on which we rely, including customers’ and employees’ personal and financial information and our proprietary business information. Like other companies, we have from time to time experienced threats to our data and systems, including malware, seeking to gain unauthorized access to systems and data or to cause disruptions; however, to date, these have not been material to our operations. Any significant attacks, unauthorized access or disclosures, disruptions or other security breaches, whether affecting us or third parties, could result in substantial business disruption, costs and consequences, including repairing systems, increased security costs, customer notifications, lost revenues, litigation, regulatory action, fines and penalties, and reputational damage.
Employee and agent error and misconduct may be difficult to detect and prevent and may result in significant losses. Losses may result from, among other things, fraud, errors, failure to document transactions properly, failure to obtain proper internal authorization, failure to maintain effective internal controls or failure to comply with regulatory requirements. It is not always possible to deter or prevent misconduct, and the precautions we take to prevent and detect this activity may not be effective in all cases.
14
Table of Contents
Index to Financial Statements
Our business operations depend on our ability to appropriately execute and administer our policies and claims. Our primary business is writing and servicing life, annuity, property and casualty, and health insurance for individuals, families and commercial business. Any problems or discrepancies that arise in our pricing, underwriting, billing, processing, claims handling or other practices, whether as a result of employee error, vendor error, or technological problems, could have a negative effect on operations and reputation, particularly if such problems or discrepancies are replicated through multiple policies.
Catastrophic Event Risk Factors
We may incur significant losses resulting from catastrophic events. Our property and casualty operations are exposed to catastrophes caused by natural events, such as hurricanes, tornadoes, wildfires, droughts, earthquakes, snow, hail and windstorms, and manmade events, such as terrorism, riots, explosions, hazardous material releases, and utility outages. Our life and health insurance operations are exposed to the risk of catastrophic mortality or illness, such as a pandemic, an outbreak of an easily communicable disease, or another event that causes a large number of deaths or high morbidity. Our investment operations are exposed to catastrophes as a result of direct investments and mortgages related to real estate. Our operating results may vary significantly from one period to the next since the likelihood, timing, severity, number or type of catastrophe events cannot be accurately predicted. Our losses in connection with catastrophic events are primarily a function of the severity of the event and the amount of policyholder exposure in the affected area.
Some scientists believe climate change has added to the unpredictability, severity and frequency of extreme weather and loss events. To the extent climate change increases the frequency and severity of such events, we may face increased claims. Moreover, we cannot predict how legal, regulatory and social responses to concerns about global climate change will impact our business or the value of our investments.
The occurrence of events that are unanticipated in our business continuity and disaster recovery planning could impair our ability to conduct business effectively. Our corporate headquarters is located in Galveston, Texas, on the coast of the Gulf of Mexico and in the past has been impacted by hurricanes. Our League City, Texas offices are designed to support our operations and service our policyholders in the event of a hurricane or other natural disaster affecting Galveston. The primary offices of our property and casualty insurance companies are in Springfield, Missouri and Glenmont, New York, which helps to insulate these facilities and their operations from coastal catastrophes. However, the severity, timing, duration or extent of an event may be unanticipated by our business continuity planning, which could result in an adverse impact on our ability to conduct business. In the event a significant number of our employees or agents were unavailable following such a disaster, or if our computer-based data processing, transmission, storage and retrieval systems were affected, our ability to effectively conduct our business could be compromised.
Marketplace Risk Factors
Our future results are dependent in part on successfully operating in the insurance and annuity industries that are highly competitive with regard to customers and producers. Strong competition for customers has led to increased marketing and advertising by our competitors, many of whom have well-established national reputations and greater financial and marketing resources, as well as the introduction of new insurance products and aggressive pricing. In particular, our Medicare Supplement business is subject to intense price competition, which could negatively impact future sales of these products and affect our ability to offer this product. In addition, product development and life-cycles have shortened in many product segments, leading to intense competition with respect to product features.
We compete for customers’ funds with a variety of investment products offered by financial services companies other than insurance companies, such as banks, investment advisors, mutual fund companies and other financial institutions. If we cannot effectively respond to increased competition, we may not be able to grow our business or we may lose market share.
15
Table of Contents
Index to Financial Statements
We compete with other insurers for producers primarily on the basis of our financial position, reputation, stable ownership, support services, compensation, product features and pricing. We may be unable to compete with insurers that adopt more aggressive pricing or compensation, that offer a broader array of products or packages of products, or that have extensive promotional and advertising campaigns.
Our supplemental health business could be negatively affected by alternative healthcare providers or changes in federal healthcare policy. Our Medicare supplement business is impacted by market trends in the senior-aged healthcare industry that provide alternatives to traditional Medicare, such as health maintenance organizations and other managed care or private plans. The success of these alternative healthcare solutions for seniors could negatively affect the sales and premium growth of traditional Medicare Supplement insurance and could impact our ability to offer such products. In addition, Congress or the U.S. Department of Health and Human Services (“HHS”) could make changes in federal healthcare policy, including Medicare that could adversely impact our supplemental health business.
Litigation and Regulation Risk Factors
Litigation may result in significant financial losses and harm our reputation. Plaintiffs’ lawyers may bring lawsuits, including class actions, against us relating to, among other things, sales or underwriting practices, agent misconduct, product design, product disclosure, product administration, fees charged, denial or delay of benefits, product suitability, claims-handling practices (including the permitted use of aftermarket, non-original equipment manufacturer auto parts), loss valuation methodology, refund practices, and breaches of duties to customers. Plaintiffs may seek very large or indeterminate amounts, including punitive and treble damages. The damages claimed and the amount of any probable and estimable liability, if any, may remain unknown for substantial periods of time. Even when successful in the defense of such actions, we could incur significant attorneys’ fees, direct litigation costs and substantial amounts of management time that otherwise would be devoted to our business, and our reputation could be harmed.
We are subject to extensive regulation, and potential further regulation may increase our operating costs and limit our growth. We are subject to extensive insurance laws and regulations that affect nearly every aspect of our business. We are also subject to additional laws and regulations administered and enforced by a number of different governmental authorities, such as state securities and workforce regulators, the SEC, the Internal Revenue Service (“IRS”), FINRA, the U.S. Department of Justice, the U.S. Department of Labor (“DOL”), the U.S. Department of Housing and Urban Development (“HUD”), HHS, and state attorneys general, each of which exercises a degree of interpretive latitude. We face the risks that any particular regulator’s or enforcement authority’s interpretation of a legal issue may conflict with that of another regulator or enforcement authority or may change over time to our detriment. Regulatory investigations, which can be broad and unpredictable, may raise issues not identified previously and could result in new legal actions against us and industry-wide regulations that could adversely affect us.
The laws and regulations are complex and subject to change, and compliance is time consuming and personnel-intensive. Changes in these laws and regulations, or interpretations by courts or regulators, may materially increase our costs of doing business and may result in changes to our practices that may limit our ability to grow and improve our profitability. Regulatory developments or actions against us could have material adverse financial effects and could cause harm to our reputation. Among other things, we could be fined, prohibited from engaging in some or all of our business activities, or made subject to limitations or conditions on our business activities.
16
Table of Contents
Index to Financial Statements
As insurance industry practices and legal, judicial, social, and other conditions outside of our control change, unexpected issues related to claims and coverage may emerge. These changes may include modifications to long established business practices or policy interpretations, which may adversely affect us by extending coverage beyond our underwriting intent or by increasing the type, number, or size of claims. For example, a growing number of states have adopted legislation that is similar to the Model Unclaimed Life Insurance Benefits Act. Such legislation imposes new requirements on insurers to periodically compare their life insurance and annuity contracts and retained asset accounts against the U.S. Social Security Administration’s Death Master File, investigate any potential matches, determine whether benefits are payable, and attempt to locate beneficiaries. Some states are attempting to apply these laws retroactively to existing policies. A number of states have aggressively audited life insurance companies, including us and some of our subsidiaries, for compliance with such laws, and more states could do so. Such audits have sought to identify unreported insured deaths and to determine whether any unpaid benefits, proceeds or other payments under life insurance or annuity contracts should be treated as unclaimed property to be escheated to the state. We have modified our claims process to stay current with emerging trends. It is possible that such audits or additional enactment of similar legislation may result in additional payments to beneficiaries, additional escheatment of funds deemed abandoned under state laws, regulatory actions, litigation, administrative fines and penalties, interest, and additional changes to our procedures.
Federal regulatory changes and initiatives have a growing impact on us. For example, Dodd-Frank provides for enhanced federal oversight of the financial services industry through multiple initiatives. Provisions of Dodd-Frank are or may become applicable to us, our competitors, or certain entities with which we do business. For example, it is possible that regulations issued by the Consumer Financial Protection Bureau (“CFPB”) may extend, or be interpreted to extend, to the sale of certain insurance products by covered financial institutions, which could adversely affect sales of such products.
Second, we are subject to various conditions and requirements of the Patient Protection and Affordable Care Act of 2010 (“the Healthcare Act”). The Healthcare Act may affect the small blocks of business we have offered or acquired over the years that are, or deemed to be, health insurance. The Healthcare Act also influences the design of products sold by our Health segment, which may influence consumer acceptance of such products and the cost of monitoring compliance with the Healthcare Act. Moreover, the Healthcare Act affects the benefit plans we sponsor for employees or retirees and their dependents, our expense to provide such benefits, our tax liabilities in connection with the provision of such benefits, and our ability to attract or retain employees.
Third, certain federal regulation may impact our property and casualty operations. In 2013, HUD finalized a “disparate impact” regulation that may adversely impact our ability to differentiate pricing for homeowners policies using traditional risk selection analysis. Various legal challenges to this regulation are being pursued by the industry. If this regulation is implemented, whether or not modified by HUD, it is uncertain to what extent it may impact the property and casualty industry underwriting practices. Such regulation could increase litigation costs, force changes in underwriting practices, and impair our ability to write homeowners business profitably. In addition, Congress or states may enact legislation affecting insurers’ ability to use credit-based insurance scores as part of the property and casualty underwriting or rating process, which could force changes in underwriting practices and impair our property and casualty operations’ ability to write homeowners business profitably.
17
Table of Contents
Index to Financial Statements
Fourth, there have been federal efforts to change the standards of care applicable to broker-dealers and investment advisers. Following a study required by Dodd-Frank, the staff of the SEC recommended a uniform fiduciary duty standard applicable to both broker-dealers and investment advisers when providing personalized investment advice to retail customers. Such a change would apply a different standard of care than is currently applicable to broker-dealers and would affect how our variable insurance products are designed and sold. Moreover, the DOL proposed a regulation in April 2015 that would, if implemented substantially as proposed, significantly expand what is considered fiduciary investment advice under the Employee Retirement and Income Security Act of 1974 and the Internal Revenue Code. The proposal impacts individuals and entities that offer investment advice to those who purchase qualified retirement products, such as IRA’s and small employer retirement plans. The proposal would apply ERISA’s fiduciary standard to many insurance agents, broker-dealers, advisers and others not currently subject to the standard. If adopted, we would likely consider changing the design of certain of our annuity products and the amounts and methods of compensation we pay for distribution of qualified plan products, which could significantly increase product development costs and limit sales opportunities for such products through our current distribution arrangements.
Lastly, international standards continue to emerge in response to the globalization of the insurance industry and evolving standards of regulation, solvency measurement and risk management. Any international conventions or mandates that directly or indirectly impact or influence the nature of U.S. regulation or industry operations could negatively affect us.
For further discussions of the kinds of regulation applicable to us, see Item 1, Business, Regulation Applicable to Our Business section.
Changes in tax laws could decrease sales and profitability of certain products and increase our tax cost. Under current U.S. federal and state income tax laws, certain products we offer, primarily life insurance and annuities, receive tax treatment designed to encourage consumers to purchase these products. This treatment may encourage some consumers to select our products over non-insurance products. The U.S. Congress from time to time may consider legislation that would change the taxation of insurance products and/or reduce the taxation of competing products. Such legislation, if adopted, could materially change consumer behavior, which may harm our ability to sell such products and result in the surrender of some existing contracts and policies. In addition, changes in the U.S. federal and state estate tax laws could negatively affect the demand for the types of life insurance used in estate planning. Uncertainty regarding the tax structure in the future may also cause some current or future purchasers to delay or indefinitely postpone the purchase of products we offer. Lastly, changes to the tax laws, administrative rulings or court decisions affecting U.S. corporations or the insurance industry could increase our effective tax rate and lower our net income.
New accounting rules or changes to existing accounting rules could negatively impact our business. We are required to comply with GAAP. A number of organizations are instrumental in the development and interpretation of GAAP, such as the SEC, the Financial Accounting Standards Board (“FASB”), and the American Institute of Certified Public Accountants. GAAP is subject to review by these organizations and others and is, therefore, subject to change in ways that could change the current accounting treatments we apply.
We also must comply with statutory accounting principles (“SAP”) in our insurance operations. SAP and various components of SAP (such as actuarial reserving methodology) are subject to review by the NAIC and its taskforces and committees, as well as state insurance departments.
Future changes to GAAP or SAP could impact our product mix, product profitability, reserve and capital requirements, financial condition or results of operations. See Note 3, Recently Issued Accounting Pronouncements, of the Notes to Consolidated Financial Statements for a detailed discussion regarding the impact of the recently issued accounting pronouncements and the future adoption of new accounting standards on the Company.
18
Table of Contents
Index to Financial Statements
Reinsurance and Counterparty Risk Factors
Reinsurance may not be available, affordable, adequate or collectible to protect us against losses. As part of our risk management strategy, we purchase reinsurance for certain risks that we underwrite. Market conditions and geo-political events beyond our control, including the continued threat of terrorism, influence the availability and cost of reinsurance for new business. In certain circumstances, the price of existing reinsurance contracts may also increase. Reinsurance does not relieve us of our direct liability to our policyholders, even when the reinsurer is liable to us. Our reinsurers may not pay the reinsurance recoverables owed to us or they may not pay these balances on a timely basis.
The counterparties to derivative instruments we use to hedge our business risks could default or fail to perform. We enter into derivative contracts, such as options, with a number of counterparties to hedge various business risks. If our counterparties fail or refuse to honor their obligations, our economic hedges of the related risks will be ineffective. Such counterparty failures could have a material adverse effect on us.
Other Risk Factors
Our financial strength ratings could be downgraded. Various Nationally Recognized Statistical Rating Organizations (“NRSROs”) publish financial strength ratings as their opinion of an insurance company’s creditworthiness and ability to meet policyholder and contractholder obligations. As with other rated companies, our ratings could be downgraded at any time and without any notices by any NRSRO. A downgrade or an announced potential downgrade of our financial strength ratings could have multiple adverse effects on us including:
| • | reducing new sales of insurance and annuity products or increasing the number or amount of surrenders and withdrawals; |
| • | affecting our relationships with our sales force, independent sales intermediaries and credit counterparties; and |
| • | affecting our ability to obtain reinsurance at reasonable prices. |
It is likely that the NRSROs will continue to apply a high level of scrutiny to financial institutions, including us and our competitors, and may adjust the capital, risk management and other requirements employed in the NRSRO models for maintenance of certain ratings levels.
We are controlled by a small number of stockholders. As of December 31, 2015, the Moody Foundation, a charitable trust controlled by Robert L. Moody, Sr. and two of his children, beneficially owned approximately 22.8% of our common stock. In addition, Moody National Bank, of which Robert L. Moody, Sr. is Chairman of the Board, in its capacity as trustee or agent of various accounts, had the power to vote approximately 45.4% of our common stock as of such date. As a result, subject to applicable legal and regulatory requirements, these stockholders have the ability to exercise a controlling influence over matters submitted for stockholder approval, including the composition of our Board of Directors, and through the Board of Directors any determination with respect to our business direction and policies. This concentration of voting power could deter a change of control or other business combination that might be beneficial or preferable to other stockholders. It may also adversely affect the trading price of our common stock if controlling stockholders sell a significant number of shares or if investors perceive disadvantages in owning stock in a company controlled by a small number of stockholders.
See also Part II, Item 7A, Quantitative and Qualitative Disclosures About Market Risk, for additional details regarding certain risks that we face.
| ITEM 1B. | UNRESOLVED STAFF COMMENTS |
None.
19
Table of Contents
Index to Financial Statements
| ITEM 2. | PROPERTIES |
We own and occupy our corporate headquarters in Galveston, Texas. We also own and occupy the following properties that are materially important to our operations:
| • | Three buildings in League City, Texas which are used by our Life, Health, and Corporate and Other business segments. |
| • | Two buildings, one in Springfield, Missouri and the other in Glenmont, New York, which are used by our Property and Casualty segment. |
We believe our properties are adequate and suitable for our business as currently conducted and are adequately maintained. The above does not include properties we own for investment purposes only.
| ITEM 3. | LEGAL PROCEEDINGS |
Information required for Item 3 is incorporated by reference to the discussion under the heading “Litigation” in Note 19, Commitments and Contingencies, of the Notes to the Consolidated Financial Statements.
| ITEM 4. | MINE SAFETY DISCLOSURES |
Not applicable
| ITEM 5. | MARKET FOR REGISTRANT’S COMMON EQUITY, RELATED STOCKHOLDER MATTERS AND ISSUER PURCHASES OF EQUITY SECURITIES |
Stockholder Information
Our common stock is traded on the NASDAQ Global Select Market under the symbol “ANAT.” The following table presents the high and low prices for our common stock and the quarterly dividends declared per share.
| Stock Price Per Share | Dividend Per Share |
|||||||||||
| High | Low | |||||||||||
| 2015 |
||||||||||||
| Fourth quarter |
$ | 108.60 | $ | 94.01 | $ | 0.80 | ||||||
| Third quarter |
109.81 | 95.29 | 0.80 | |||||||||
| Second quarter |
107.02 | 97.29 | 0.77 | |||||||||
| First quarter |
114.99 | 92.04 | 0.77 | |||||||||
|
|
|
|||||||||||
| $ | 3.14 | |||||||||||
|
|
|
|||||||||||
| 2014 |
||||||||||||
| Fourth quarter |
$ | 116.50 | $ | 105.01 | $ | 0.77 | ||||||
| Third quarter |
118.38 | 108.00 | 0.77 | |||||||||
| Second quarter |
118.00 | 101.75 | 0.77 | |||||||||
| First quarter |
119.70 | 102.17 | 0.77 | |||||||||
|
|
|
|||||||||||
| $ | 3.08 | |||||||||||
|
|
|
|||||||||||
We expect to continue to pay regular cash dividends, although there is no assurance as to future dividends because they depend on future earnings, capital requirements and financial conditions. The payment of dividends is subject to restrictions described in Note 16, Stockholders’ Equity and Noncontrolling Interests, of the Notes to the Consolidated Financial Statements and as discussed in Part II, Item 7, Management’s Discussion and Analysis of Financial Condition and Results of Operations – Capital Resources.
On December 31, 2015, our closing stock price was $102.27 per share. As of December 31, 2015, there were 756 holders of record of our issued and outstanding shares of common stock.
20
Table of Contents
Index to Financial Statements
Securities Authorized for Issuance under Equity Compensation Plans
The following table provides information regarding our common stock that is authorized for issuance under American National’s 1999 Stock and Incentive Plan as of December 31, 2015:
| Equity Compensation Plan Information | ||||||||||||
| Number of securities to be issued upon exercise of outstanding options, warrants and rights |
Weighted-average exercise price outstanding options, warrants and rights |
Number of securities remaining available for future issuance under equity compensation plans (excluding securities reflected in column (a)) |
||||||||||
| (a) | (b) | (c) | ||||||||||
| Plan category |
||||||||||||
| Equity compensation plans |
||||||||||||
| Approved by security holders |
— | $ | 110.73 | 2,170,573 | ||||||||
| Not approved by security holders |
— | — | — | |||||||||
|
|
|
|
|
|
|
|||||||
| Total |
— | $ | 110.73 | 2,170,573 | ||||||||
|
|
|
|
|
|
|
|||||||
Performance Graph
The following graph compares the cumulative stockholder return for our common stock for the last five years with the performance of the NASDAQ Stock Market and a NASDAQ Insurance Stock index using NASDAQ OMX Global Indexes. It shows the cumulative changes in value of an initial $100 investment on December 31, 2010, with all dividends reinvested.
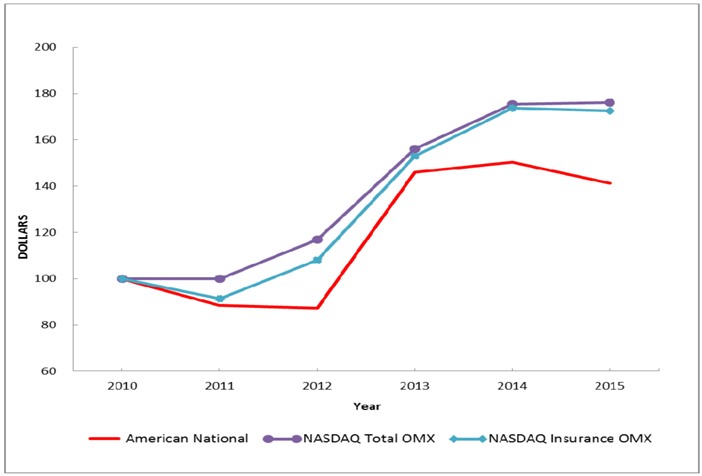
21
Table of Contents
Index to Financial Statements
Value at each year-end of a $100 initial investment made on December 31, 2010:
| December 31, | ||||||||||||||||||||||||
| 2010 | 2011 | 2012 | 2013 | 2014 | 2015 | |||||||||||||||||||
| American National |
$ | 100.00 | $ | 88.48 | $ | 87.35 | $ | 145.95 | $ | 150.34 | $ | 141.29 | ||||||||||||
| NASDAO Total OMX |
100.00 | 100.31 | 116.79 | 155.90 | 175.33 | 176.17 | ||||||||||||||||||
| NASDAQ Insurance OMX |
100.00 | 91.35 | 108.09 | 153.11 | 173.87 | 172.59 | ||||||||||||||||||
This performance graph shall not be deemed to be incorporated by reference into our SEC filings or to constitute soliciting material or otherwise be considered filed under the Securities Act of 1933, as amended, or the Securities Exchange Act of 1934, as amended.
| ITEM 6. | SELECTED FINANCIAL DATA |
American National Insurance Company
(and its subsidiaries)
| Years ended December 31, | ||||||||||||||||||||
| (dollar amounts in millions, except per share amounts) |
2015 | 2014 | 2013 | 2012 | 2011 | |||||||||||||||
| (As Adjusted) | (As Adjusted) | (As Adjusted) | (As Adjusted) | |||||||||||||||||
| Total premiums and other revenues |
$ | 3,017 | $ | 3,051 | $ | 3,119 | $ | 2,987 | $ | 3,023 | ||||||||||
| Income from continuing operations, net of tax |
242 | 247 | 270 | 193 | 190 | |||||||||||||||
| Net income |
242 | 247 | 270 | 193 | 190 | |||||||||||||||
| Net income attributable to American National |
243 | 245 | 266 | 192 | 189 | |||||||||||||||
| Per common share |
||||||||||||||||||||
| Income from continuing operations, net of tax |
||||||||||||||||||||
| Basic |
9.04 | 9.15 | 9.95 | 7.19 | 7.11 | |||||||||||||||
| Diluted |
9.02 | 9.11 | 9.90 | 7.15 | 7.07 | |||||||||||||||
| Net income attributable to American National |
||||||||||||||||||||
| Basic |
9.04 | 9.15 | 9.95 | 7.19 | 7.11 | |||||||||||||||
| Diluted |
9.02 | 9.11 | 9.90 | 7.15 | 7.07 | |||||||||||||||
| Cash dividends per share |
3.14 | 3.08 | 3.08 | 3.08 | 3.08 | |||||||||||||||
| December 31, | ||||||||||||||||||||
| 2015 | 2014 | 2013 | 2012 | 2011 | ||||||||||||||||
| (As Adjusted) | (As Adjusted) | (As Adjusted) | (As Adjusted) | |||||||||||||||||
| Total assets |
$ | 23,747 | $ | 23,545 | $ | 23,320 | $ | 23,104 | $ | 22,487 | ||||||||||
| Total American National stockholders’ equity |
4,452 | 4,428 | 4,188 | 3,827 | 3,635 | |||||||||||||||
| Total stockholder’s equity |
4,462 | 4,440 | 4,200 | 3,838 | 3,648 | |||||||||||||||
22
Table of Contents
Index to Financial Statements
| ITEM 7. | MANAGEMENT’S DISCUSSION AND ANALYSIS OF FINANCIAL CONDITION AND RESULTS OF OPERATIONS |
Management’s discussion and analysis (“MD&A”) of our financial condition and results of operations should be read in conjunction with our consolidated financial statements and related notes included herein.
Forward-Looking Statements
Certain statements made in this report include forward-looking statements within the meaning of the “safe harbor” provisions of the Private Securities Litigation Reform Act of 1995. Forward-looking statements may be identified by words such as “expects,” “intends,” “anticipates,” “plans,” “believes,” “estimates,” “will” or words of similar meaning; and include, but are not limited to, statements regarding the outlook of our business and financial performance. These forward-looking statements are subject to changes and uncertainties which are, in many instances, beyond our control and have been made based upon our assumptions, expectations and beliefs concerning future developments and their potential effect upon us. There can be no assurance that future developments will be in accordance with our expectations, or that the effect of future developments on us will be as anticipated. It is not a matter of corporate policy for us to make specific projections relating to future earnings, and we do not endorse any projections regarding future performance made by others. Additionally, we do not publicly update or revise forward-looking statements based on the outcome of various foreseeable or unforeseeable events. These forward-looking statements are not a guarantee of future performance and involve risks and uncertainties. There are certain important factors that could cause actual results to differ, possibly materially, from expectations or estimates reflected in such forward-looking statements, including without limitations risks, uncertainties and other factors discussed in Item 1A, Risk Factors and elsewhere in this report.
Overview
Chartered in 1905, we are a diversified insurance and financial services company offering a broad spectrum of insurance products in all 50 states, the District of Columbia, and Puerto Rico. Our headquarters are in Galveston, Texas.
Our business has been and will continue to be influenced by a number of industry-wide, segment or product-specific trends and conditions. In our discussion below, we first outline the broad macro-economic or industry trends (General Trends) that we expect to impact our overall business. Second, we discuss certain segment-specific trends we believe may impact individual segments or specific products within these segments.
Segments
The insurance segments do not directly own assets. Rather, assets are allocated to support the liabilities and capital allocated to each segment. The mix of assets allocated to each of the insurance segments is intended to support the characteristics of the insurance liabilities within each segment including expected cash flows and pricing assumptions, and is intended to be sufficient to support each segment’s business activities. We have utilized this methodology consistently over all periods presented.
The Corporate and Other business segment acts as the owner of all of the invested assets of the Company. The investment income from the invested assets is allocated to the insurance segments in accordance with the assets allocated to each insurance segment. Earnings of the Corporate and Other business segment are derived from income related to invested assets not allocated to the insurance segments and from our non-insurance businesses. All realized investment gains and losses, which includes other-than-temporary impairments (“OTTI”), are recorded in this segment.
23
Table of Contents
Index to Financial Statements
General Trends
Our business, financial condition and results of operations are materially affected by economic and financial market conditions. The U.S. and global economies, as well as the capital markets, continue to show mixed signals, and uncertainties continue to be significant factors in the markets in which we operate. Factors such as consumer spending, business investment, the volatility of the capital markets, the level of interest rates, unemployment, the level of participation in the workforce and the risk of inflation or deflation will affect the business and economic environment and, in turn, impact the demand for the type of financial and insurance products we offer. Adverse changes in the economy could have a material adverse effect on us. However, we believe those risks are somewhat mitigated by our financial strength, active enterprise risk management and disciplined underwriting for our products. Our diverse product mix across insurance segments is a strength that we expect will help us adapt to the volatile economic environment and give us the ability to serve the changing needs of our customers. Additionally, through our long-term business approach, we believe we remain financially strong, and we are committed to providing a steady and reliable source of financial protection for policyholders.
Interest Rates: The continued low-interest rate environment is a challenge for life insurers as the spreads on deposit-type contracts narrow, especially as interest rates approach minimum crediting rates. Low market interest rates reduce the spreads between the amounts we credit to fixed annuity and individual life policyholders and the amounts we earn on the investments that support these obligations. Our ALM Committee actively manages the profitability of our in-force contracts. In previous years, we reduced the guaranteed minimum crediting rates on new fixed annuity contracts and new business, which has afforded us the flexibility to respond to the unusually low-interest rate environment. In previous years, we also reduced crediting rates on in-force contracts, where permitted to do so. These actions help mitigate the adverse impact of low interest rates on the profitability of these products, although sales volume may be negatively impacted as a result. We also maintain assets with various maturities to support product liabilities and ensure liquidity. A gradual increase in longer-term interest rates relative to short-term rates generally will have a favorable effect on the profitability of our products. Rapidly rising interest rates could result in reduced persistency of our spread-based products, if contract holders shift assets into higher yielding investments. We believe our ability to react quickly to the changing marketplace will help us manage this risk.
The interest rate environment affects estimated future profit projections, which could impact the amortization of our DAC assets and the estimates of policyholder liabilities. Significantly lower future profits may cause us to accelerate the amortization of DAC or require us to establish additional policyholder liabilities, thereby reducing earnings. We periodically review assumptions with respect to future earnings to make sure that they remain appropriate considering the current interest rate environment.
Low interest rates are also challenging for property and casualty insurers. Investment income is an important element in earning an acceptable return on capital. Lower interest rates resulting in lower investment income require us to achieve better underwriting results. We have adjusted policy prices to help mitigate the adverse impact of low interest rates on our property and casualty business.
Changing Regulatory Environment: The insurance industry is primarily regulated at the state level, although some life and annuity products and services are also subject to U.S. federal regulation. We are regularly subjected to additional or changing regulation that requires us to update systems, change product structure, increase the amount of reporting or adopt changes to distribution. These changes may increase the capital requirements for us and the industry, increase operating costs, change our operating practices and change our ability to provide products with pricing attractive to the marketplace.
Importance of Operating Efficiencies: The challenging economic environment and costs associated with greater regulation create a further need for operating cost reductions and efficiencies. We manage our cost base while maintaining our commitment to provide superior customer service to policyholders and agents. Investments in technology are coordinated through a disciplined project management process. We anticipate continually improving our use of technology to enhance our policyholders’ and agents’ experience and increase efficiency of our employees.
24
Table of Contents
Index to Financial Statements
Increased Role of Advanced Technology: The use of mobile technology has changed the way consumers want to conduct their business, including real-time access to information. Many customers also expect to complete transactions in a digital format instead of traditional methods that require a phone call or submission of paper forms. Social media and other customer-facing technologies also reshape the way companies communicate and collaborate with key stakeholders, and new tools exist to better collect and analyze information for potential business opportunities and better manage risks. For example, American National has mobile-enabled all of its Internet-based access and leverages social media channels to reach out to potential customers to promote awareness of the company, including the products and services offered. We expect that technology will continue to evolve, offering new and more effective ways to reach and service our customers and shareholders. We evaluate available and evolving technologies and incorporate those that offer appropriate benefits to the company and its customers.
Increased Challenges of Talent Attraction and Retention: Attracting individuals with the right skills and retaining employees for the longer term remains a business challenge. These challenges may become more difficult as the working population ages, causing loss of valuable work knowledge and experience through attrition. The cost of higher education may result in fewer people attending college or a university, thus leaving a potential workforce that is less prepared for the higher thinking challenges of the new workplace. Competitors who develop stronger appeal to applicants who seek innovative and paradigm shifting companies will have an edge. We are increasing our talent development efforts so that we can promote from within. In addition, we are expanding the use of technology to broaden our candidate base when recruiting and to deliver targeted training to augment the current skill level of our employees.
Life and Annuity
Life insurance and annuity are our mainstay segments, as they have been during our long history. We believe that the combination of predictable and decreasing mortality rates, positive cash flow generation for many years after policy issue and favorable persistency characteristics suggest a viable and profitable future for these lines of business. We use a wide variety of marketing channels and plan to expand our traditional distribution models with additional agents.
Effective management of invested assets and associated liabilities involving crediting rates and, where applicable, financial hedging instruments (which we use as economic hedges of equity-indexed life and annuity products), are important to the success of our life and annuity segments. Asset “disintermediation”, the risk of large outflows of cash at times when it is disadvantageous to us to dispose of invested assets, is a risk associated with this segment.
Demographics: We believe a key driver shaping the actions of the life insurance industry is the rising income protection, wealth accumulation and insurance needs of retiring Baby Boomers (those born between 1946 and 1964). As a result of increasing longevity and uncertainty regarding the Social Security System and an ongoing transition from defined benefit pension plans to 401(k) type retirement plans, retirees will need to accumulate sufficient savings to support retirement income requirements.
We are well positioned to address the Baby Boomers’ increasing need for savings tools and income protection. We believe our overall financial strength and broad distribution channels position us to respond with a variety of products to individuals approaching retirement age, who seek information to plan for and manage their retirement needs. We believe our products that offer guaranteed income flows for life, including single premium immediate annuities, are well positioned to serve this market.
25
Table of Contents
Index to Financial Statements
Competitive Pressures: In recent years, the competitive landscape of the U.S. life insurance industry has shifted. Established insurers are competing against each other and also against new market entrants that are developing products to attract the interest of the growing number of retirees. Competition exists in terms of retaining and acquiring consumers’ business and also in terms of access to producers and distributors. Consolidation among distributors coupled with the aging sales force remains a challenge among insurers. In addition, the increased technological sophistication of consumers necessitates that insurers and distributors invest significant resources in technology to adapt to consumer expectations. We believe we possess sufficient scale, financial strength, resources and flexibility to compete effectively.
The annuity market is also highly competitive. In addition to aggressive interest crediting rates and new product features on annuities, there is competition from other financial service firms. Insurers continue to evaluate their distribution channels and the way they deliver products to consumers. We have never provided guaranteed living benefits as a part of our variable annuity products. We believe these products were not adequately priced relative to the risk profile of the product. While this may have impeded our ability to sell variable annuities in the short term, we believe this strategy provides an advantage in terms of profitability over the long-term.
We believe we will continue to be competitive in the life and annuity markets through our broad line of products, diverse distribution channels, and consistent high level of customer service. We modify our products to meet customer needs and to expand our reach where we believe we can obtain profitable growth.
Health
Most of the major provisions of the Patient Protection and Affordable Care Act, and a reconciliation measure, the Health Care and Education Reconciliation Act of 2010 (collectively, “the Healthcare Acts”), phased in effective January 1, 2014. The Healthcare Acts mandate broad changes in the delivery of health care benefits that have impacted our current business model including our relationships with current and future customers, producers, and health care providers, as well as our products, services and processes. As a result, the Healthcare Acts generated new opportunities in the limited benefit and supplemental product markets. In recent years, we built a portfolio of such products to be sold in the worksite market as well as to individuals. We had some success with the individual products in 2013 and 2014 although this had to be restricted somewhat in 2015 due to regulatory changes. We are now expanding our presence in the worksite market to generate new opportunities in the broker market, as well as designing and implementing a captive sales force.
We expect our Managing General Underwriter (“MGU”) business to remain stable during 2016. We generally retain only 10% of the MGU premium and risk. The majority of the revenue generated from this business is fee income included in “Other income” of the Health segment’s operating results.
Property and Casualty
Our operating results decreased during 2015 compared to 2014 as higher premiums were offset by increased non-catastrophe claims and operating expenses related to growth initiatives.
We remain committed to offering our personal and commercial property and casualty lines of business primarily through exclusive agents. We use a balanced, focused and collaborative approach to both growth and profitability through the development of successful agencies. We launched a revised Agent Career Program in 2013 to enhance how we recruit, select, on-board and train new agent candidates. We are experiencing growth in our agency force as a result of the program. We intend to introduce a similar program to grow the number of general agents in 2016.
Our primary focus is to acquire and retain profitable business. To accomplish this objective, we use sophisticated pricing models and risk segmentation, along with a focused distribution force. We believe this approach allows us to make product enhancements and offer programs that are tailored to our target markets while charging the right premium for the risk.
26
Table of Contents
Index to Financial Statements
Demand for property and casualty credit-related insurance products continues to increase. Credit markets have improved in recent years, which is increasing sales in the auto dealer market and, in turn, demand for our GAP products. We continue to update credit-related insurance product offerings and pricing to meet changing market needs, as well as adding new agents to expand market share in the credit-related insurance market. We are reviewing and implementing procedures to enhance customer service while, at the same time, looking for efficiencies to reduce administrative costs.
Competition: The property and casualty insurance industry remains highly competitive. Despite the competitive environment, we expect to identify profitable opportunities through our strong distribution channels, expanding geographic coverage, marketing efforts, new product development and pricing sophistication.
Critical Accounting Estimates
The preparation of financial statements in accordance with GAAP requires estimates and assumptions that often involve a significant degree of judgment. These estimates and judgements include expectations of current and future mortality, morbidity, persistency, claims and claim adjustment expenses, recoverability of receivables, investment returns and interest rates which extend well into the future. In developing these estimates, there is inherent uncertainty and material changes to facts and circumstances may develop. Although variability is inherent in these estimates, we believe the amounts as reported are appropriate, based upon the facts available upon compilation of the consolidated financial statements.
On an ongoing basis, management reviews the estimates and assumptions used in preparing the financial statements. If current facts and circumstances warrant modifications in estimates and assumptions, our financial position and results of operations as reported in the consolidated financial statements could change significantly.
A description of these critical accounting estimates is presented below. Also, see the Notes to the Consolidated Financial Statements for additional information.
Reserves
Life and Annuity Reserves
Life Reserving—Principal assumptions used in the determination of the reserves for future policy benefits are mortality, policy lapse rates, investment return, inflation, expenses and other contingent events as appropriate to the respective product type. Reserves for incurred but not reported (“IBNR”) claims on life policies are calculated using historical claims information. Reserves for interest-sensitive and variable universal life insurance policies are equal to the current account value calculated for the policyholder. Some of our universal life policies contain secondary guarantees, for which additional reserves are recorded based on the term of the policy.
Annuity Reserving—Reserves for payout annuities with more than insignificant amounts of mortality risk are calculated in accordance with the applicable accounting guidance for limited pay insurance contracts. Benefit and maintenance expense reserves are calculated by using assumptions reflecting our expectations of future costs, including an appropriate margin for adverse deviation. Payout annuity reserves are calculated using standard industry mortality tables specified for statutory reporting. If the resulting reserve would otherwise cause profits to be recognized at the issue date, additional reserves are recorded. The resulting recognition of profits would be gradual over the expected life of the contract.
Reserves for deferred annuities are established equivalent to the account value held on behalf of the policyholder. Additional reserves for guaranteed minimum death benefits are determined as needed in accordance with the applicable accounting guidance. The profit recognition on deferred annuity contracts is gradual over the expected life of the contract. No immediate profit is recognized on the sale of the contract.
27
Table of Contents
Index to Financial Statements
Key Assumptions—The following assumptions reflect our best estimates and may impact our life and annuity reserves:
| • | Future lapse rates will remain reasonably consistent with our current expectations; |
| • | Mortality rates will remain reasonably consistent within standard industry mortality table ranges; and |
| • | Future interest spreads will remain reasonably consistent with our current expectations. |
Recoverability—At least annually, we test the adequacy of the net benefit reserves (policy benefit reserves less DAC) recorded for life insurance and annuity products. This testing is referred to as “Loss Recognition” for traditional products and “Unlocking” for interest-sensitive products. To perform the tests, we use our current best-estimate assumptions as to policyholder mortality, persistency, maintenance expenses and invested asset returns.
For interest-sensitive business, best-estimate assumptions are updated to reflect observed changes based on experience studies and current economic conditions. We reflect the effect of such assumption changes in DAC and reserve balances accordingly. Due to the long-term nature of many of the liabilities, small changes in certain assumptions may cause large changes in profitability. In particular, changes in estimates of the future invested asset return have a large effect on the degree of reserve adequacy and DAC recoverability.
For traditional business, a “lock-in” principle applies, whereby the assumptions used to calculate the benefit reserves and DAC are set when a policy is issued and do not change with changes in actual experience. These include margins for adverse deviation in the event that actual experience differs from the original assumptions.
Health Reserves
Health reserves are established using the following methods:
Completion Factor Approach—This method assumes that the historical claim patterns will be an accurate representation of unpaid claim liabilities. An estimate of the unpaid claims is calculated by subtracting period-to-date paid claims from an estimate of the ultimate “complete” payment for all incurred claims in the period. Completion factors are calculated which “complete” the current period-to-date payment totals for each incurred month to estimate the ultimate expected payout.
Tabular Claims Reserves—This method is used to calculate the reserves for disability income blocks of business. These reserves rely on published valuation continuance tables created using industry experience regarding assumptions of continued morbidity and subsequent recovery. Reserves are calculated by applying these continuance tables, along with appropriate company experience adjustments, to the stream of contractual benefit payments. These expected benefit payments are discounted at the required interest rate.
Future Policy Benefits—Reserves are equal to the aggregate of the present value of expected future benefit payments, less the present value of expected future premiums. Morbidity and termination assumptions are based on our experience or published valuation tables when available and appropriate.
Premium Deficiency Reserves—Deficiency reserves are established when the expected future claim payments and expenses for a classification of policies are in excess of the expected premiums for these policies. The determination of a deficiency reserve takes into consideration the likelihood of premium rate increases, the timing of these increases, and the expected benefit utilization patterns. We have established premium deficiency reserves for portions of the major medical business and the long-term care business that are in run-off. The assumptions and methods used to determine the deficiency reserves are reviewed periodically for reasonableness, and the reserve amount is monitored against emerging losses.
28
Table of Contents
Index to Financial Statements
Property and Casualty Reserves
Reserves for Claims and Claim Adjustment Expense (“CAE”)—Property and casualty reserves are established to provide for the estimated cost of settling and paying both reported (“case”) as well as incurred but not reported (“IBNR”) claims. The two major categories of CAE are defense and cost containment expense, and adjusting and other expense. The details of property and casualty reserves are shown below (in thousands):
| December 31, 2015 | December 31, 2014 | |||||||||||||||||||||||
| Gross | Ceded | Net | Gross | Ceded | Net | |||||||||||||||||||
| Case |
$ | 487,154 | $ | 30,439 | $ | 456,715 | $ | 500,122 | $ | 38,995 | $ | 461,127 | ||||||||||||
| IBNR |
383,429 | 10,751 | 372,678 | 368,356 | 6,395 | 361,961 | ||||||||||||||||||
|
|
|
|
|
|
|
|
|
|
|
|
|
|||||||||||||
| Total |
$ | 870,583 | $ | 41,190 | $ | 829,393 | $ | 868,478 | $ | 45,390 | $ | 823,088 | ||||||||||||
|
|
|
|
|
|
|
|
|
|
|
|
|
|||||||||||||
Case Reserves—Reserves for reported losses are determined on either a judgment or a formula basis, depending on the timing and type of the loss. The formula reserve is a fixed amount for each claim of a given type based on historical paid loss data for similar claims with provisions for trend changes, such as those caused by inflation. Judgment reserve amounts generally replace initial formula reserves and are set for each loss based on facts and circumstances of each case and the expectation of damages. We regularly monitor the adequacy of reserves on a case-by-case basis and change the amount of such reserves as necessary.
IBNR— IBNR reserves are estimated based on many variables, including historical statistical information, inflation, legal developments, economic conditions, and general trends in claim severity, frequency and other factors that could affect the adequacy of claims reserves. Loss and premium data is aggregated by exposure class and by accident year. IBNR reserves are estimated by projecting ultimate losses on each class of business and subtracting paid losses and case reserves. Our overall reserve practice provides for ongoing claims evaluation and adjustment based on the development of related data and other relevant information pertaining to claims. Adjustments in aggregate reserves, if any, are included in the results of operations of the period during which such adjustments are made.
We believe we conservatively reflect the potential uncertainty generated by volatility in our loss development profiles when selecting loss development factor patterns for each line of business. See Results of Operations and Related Information by Segment – Property and Casualty, Prior Period Reserve Development section of the MD&A for additional information.
The evaluation process to determine reserves involves the collaboration of underwriting, claims and internal actuarial departments. The process also includes consultation with independent actuarial firms as part of our process of gaining reassurance that claims and CAE reserves estimate sufficiently, all obligations arising from all losses incurred as of year-end. The independent actuarial firm completes the Statements of Actuarial Opinion required by individual state insurance regulations at each year-end, opining that the recorded statutory claims and CAE reserves are reasonable.
Premium Deficiency Reserve—Deficiency reserves are recorded when the expected claims payments and policy maintenance costs for a product line exceed the expected premiums for that product line. The estimation of a deficiency reserve considers the current profitability of a product line using anticipated claims, CAE, and policy maintenance costs. The assumptions and methods used to determine the need for deficiency reserves are reviewed periodically for reasonableness. There were no reserves of this type at December 31, 2015 or 2014.
29
Table of Contents
Index to Financial Statements
Property and Casualty Reserving Methodology—The following methods are utilized:
| • | Initial Expected Loss Ratio—This method calculates an estimate of ultimate losses by applying an estimated loss ratio to actual earned premium for each calendar/accident year. This method is appropriate for classes of business where the actual paid or reported loss experience is not yet mature enough to influence initial expectations of the ultimate loss ratios. |
| • | Bornhuetter-Ferguson—This method uses as a starting point an assumed initial expected loss ratio method and blends in the loss ratio implied by the claims experience to date by using loss development patterns based on our historical experience. This method is generally appropriate where there are few reported claims and a relatively less stable pattern of reported losses. |
| • | Loss or Expense Development (Chain Ladder)—This method uses actual loss or defense and cost containment expense data and the historical development profiles on older accident periods to project more recent, less developed periods to their ultimate total. This method is appropriate when there is a relatively stable pattern of loss and expense emergence and a relatively large number of reported claims. |
| • | Ratio of Paid Defense and Cost Containment Expense to Paid Loss Development—This method uses the ratio of paid defense and cost containment expense to paid loss data and the historical development profiles on older accident periods to project more recent, less developed periods to their ultimate total. In this method, an ultimate ratio of paid defense and cost containment expense to paid loss is selected for each accident period. The selected paid defense and cost containment expense to paid loss ratio is then applied to the selected ultimate loss for each accident period to estimate the ultimate defense and cost containment expense. Paid defense and cost containment expense is then subtracted from the ultimate defense and cost containment expense to calculate the unpaid defense and cost containment expense for that accident period. |
| • | Calendar Year Paid Adjusting and Other Expense to Paid Loss—This method uses a selected ratio of prior calendar years’ paid expense to paid loss to project ultimate loss adjustment expenses for adjusting and other expense. A percentage of the selected ratio is applied to the case reserves (depending on the line of insurance) and 100% to the indicated IBNR reserves. These ratios assume that a percentage of the expense is incurred when a claim is opened and the remaining percentage is paid throughout the claim’s life. |
The basis of our selected single point best estimate on a particular line of business is often a blended result from two or more methods (e.g. weighted averages). Our estimate is highly dependent on actuarial and management judgment as to which method(s) is most appropriate for a particular accident year and class of business. Our methodology changes over time, as new information emerges regarding underlying loss activity and other factors.
Key Assumptions— The following assumptions may impact our property and casualty reserves:
| • | Stability of future inflation rates and consistency with historical inflation norms; |
| • | The expected loss development patterns; |
| • | A consistent claims handling, reserving and payment process; |
| • | No unusual growth patterns or unexpected changes in the mix of business; and |
| • | No significant prospective changes in laws that would significantly affect future payouts |
The loss ratio selections and development profiles are developed primarily using our historical claims and loss experience. These development patterns reflect prior inflation rates, and could be impacted by future changes in inflation rates, particularly those relating to medical care costs, automobile repair parts and building or home material costs. These assumptions have not been modified from the preceding periods and are consistent with historical loss reserve development patterns.
30
Table of Contents
Index to Financial Statements
For non-credit lines of business, future inflation rates could vary from our assumption of relatively stable rates. Unexpected changes in future inflation rates could impact our financial position and liquidity, and we measure the sensitivity of our reserve levels to unexpected changes in inflation. The impacts of future inflation for a 1.0% decrease and 3.0% increase over the implied inflation rate in the December 31, 2015 gross loss reserve balance are as follows (amounts in thousands):
| Cumulative Increase (Decrease) in Reserves |
1.0% Decrease | 3.0% Increase | ||||||
| Personal |
||||||||
| Automobile |
$ | (9,049 | ) | $ | 8,332 | |||
| Homeowner |
(1,740 | ) | 2,667 | |||||
| Commercial |
||||||||
| Agricultural Business |
(579 | ) | 32,971 | |||||
| Automobile |
(2,518 | ) | 5,773 | |||||
The analysis of our credit insurance line of business quantifies the estimated impact on gross loss reserves of a reasonably likely scenario of varying the ratio applied to the earned premium to determine the IBNR reserves at December 31, 2015. IBNR reserving methodology for this line of business focuses primarily on the use of a ratio applied to the unearned premium for each credit insurance product. The selected ratios are based on historical loss and claim data. In our analysis, we varied this ratio by +/- 5% across all credit insurance products combined. The results of our analysis show an increase or decrease in gross reserves across all accident years combined of approximately $7.0 million.
It is not appropriate to aggregate the impacts shown in our sensitivity analysis, as our lines of business are not directly correlated. The variations are not meant to be a “best-case” or “worst-case” scenario, and it is possible that future variations will be more or less than the amounts in the sensitivity analysis. While these are possible scenarios based on the information available to us at this time, we do not believe the reader should consider our sensitivity analysis an actual reserve range.
Management believes our reserves at December 31, 2015 are adequate. New information, regulation, events or circumstances, unknown at the original valuation date, however, may result in future development resulting in ultimate losses being significantly greater or less than the recorded reserves at December 31, 2015.
Deferred Policy Acquisition Costs
We had a DAC asset of approximately $1.32 billion and $1.25 billion at December 31, 2015 and 2014, respectively. See Note 10, Deferred Policy Acquisition Costs, of the Notes to the Consolidated Financial Statements for additional details.
We believe the estimates used in our DAC calculations provide a representative example of how variations in assumptions and estimates would affect our business. The following table displays the sensitivity of reasonably likely changes in assumptions in the DAC amortization for our long-tail business at December 31, 2015 (in thousands):
| Increase (Decrease) | ||||
| in DAC | ||||
| Increase in future investment margins of 25 basis points |
$ | 37,768 | ||
| Decrease in future investment margins of 25 basis points |
(40,487 | ) | ||
| Decrease in future life mortality by 1% |
3,678 | |||
| Increase in future life mortality by 1% |
(3,741 | ) | ||
31
Table of Contents
Index to Financial Statements
Reinsurance
We manage our insurance underwriting risk exposures by purchasing reinsurance. We manage counterparty risk by entering into agreements with reinsurers we consider creditworthy, generally measured by the individual entity or entities’ financial strength rating. However, we do not require a specified minimum rating. We monitor the concentrations of the reinsurers and reduce the participation percentage of lower-rated and unrated companies when appropriate. In the third quarter, we recognized a loss related to a reinsurer being unable to fulfill its obligations. While we believe we currently have no significant credit risk related to reinsurance counterparties, we continue to monitor their financial condition.
Some of our reinsurance contracts contain clauses that allow us to terminate the participation with reinsurers whose ratings are downgraded. Information used in our risk assessment is comprised of industry ratings, recent news and reports, and a limited review of financial statements. We also may require reinsurers not licensed in our state of domicile or with whom we have limited experience, to provide letters of credit, trust agreements, or cash advances to fund their share of reserves.
Other-Than-Temporary Impairment
A decline in the fair value of investment securities below their cost basis is evaluated on an ongoing basis to determine if the decline is other-than-temporary. A number of assumptions and estimates inherent in evaluating impairments are used to determine if they are other-than-temporary, which include 1) our ability and intent to hold the investment securities for a period of time sufficient to allow for an anticipated recovery in value; 2) the expected recoverability of principal and interest; 3) the length of time and extent to which the fair value has been less than cost basis; 4) the financial condition, near-term and long-term prospects of the issue or issuer, including relevant industry conditions and trends and implications of rating agency actions and offering prices; and 5) the specific reasons that a security is in a significant unrealized loss position, including market conditions, which could affect liquidity.
Valuation of Financial Instruments
The fair value of available-for-sale securities (equity and fixed maturity securities) is determined by management using one of the three primary sources of information: the quoted prices in active markets; third-party pricing services; or independent broker quotations. Estimated fair value of securities based on quoted prices in active markets is readily and regularly available; therefore, valuation of these securities generally does not involve management judgment. For securities without quoted prices, fair value measurement is determined using third-party pricing services’ proprietary pricing applications. Typical inputs used by the models are relevant market information, benchmark curves, benchmark pricing of like securities, sector groupings and matrix pricing. Any securities remaining unpriced after utilizing the first two pricing methods are submitted to independent brokers for prices. We have analyzed the third-party pricing services and independent brokers’ valuation methodologies and related inputs, and have evaluated the various types of securities in our investment portfolio to determine an appropriate fair value hierarchy level based upon trading activity and the observability of market inputs. Management completes certain tests throughout the year and at year-end to determine that prices provided by our pricing services are reasonable.
We utilize over-the-counter equity options to hedge our exposure to equity-indexed universal life and equity-indexed deferred annuity benefits, and the fair values for these options are sourced from broker quotations. Accounting guidance requires a fair value calculation as part of equity-indexed policy reserves. This is called the value of embedded derivative (or VED) and the other part of the indexed policy reserve is called the host reserve. The embedded derivative represents future benefit cash flows in excess of minimum guarantee cash flows. The host covers the minimum guarantee cash flows. Both the VED and the host reserve are calculated by a vendor-sourced reserve valuation system. The VED calculation model incorporates assumptions related to current option pricing (such as implied volatility and LIBOR/swap curve), future policyholder behavior (such as surrenders and withdrawals), and factors affecting the value of future indexed interest periods (such as option budgets).
32
Table of Contents
Index to Financial Statements
Pension and Postretirement Benefit Plans
On October 31, 2013, the Company adopted certain amendments to freeze, effective at December 31, 2013, our defined benefit pension plans. See Note 18, Pension and Postretirement Benefits, of the Notes to the Consolidated Financial Statements for a detailed discussion of the amendments. Our pension and postretirement benefit obligations and related costs covering our employees are estimated using actuarial concepts in accordance with the relevant accounting guidance. The discount rate and the expected return on plan assets are important elements of expense and/or liability measurements. Each year, these key assumptions are reevaluated to determine whether they reflect the best estimates for the current period. Changes in the methodology used to determine the best estimates are made when facts or circumstances change. Other assumptions involve demographic factors such as retirement age, mortality and turnover and, prior to the aforementioned plans freeze, the rate of compensation increases. The expected long-term rate of return on plan assets is determined using the building-block method.
Litigation Contingencies
Based on information currently available, we believe that amounts ultimately paid, if any, arising from existing and currently potential litigation would not have a material effect on our results of operations and financial condition. However, it should be noted that the frequency of large damage awards, which bear little or no relation to the economic damages incurred by plaintiffs, continue to create the potential for an unpredictable judgment in any given lawsuit. It is possible that, if the defenses in these lawsuits are not successful, and the judgments are greater than we anticipate, the resulting liability could have a material impact on the consolidated financial statements.
Federal Income Taxes
Our effective tax rate is based on income, non-taxable and non-deductible items, statutory tax rates and tax credits. Also, management’s best estimate of future events and their impact is included in our accounting estimates. Certain changes or future events, such as changes in tax legislation, and completion of tax audits could have an impact on our estimates and effective tax rate. Audit periods remain open for review until the statute of limitations has passed.
GAAP requires us to evaluate the recoverability of our deferred tax assets and establish a valuation allowance, if necessary, to reduce our deferred tax asset to an amount that is more-likely-than-not to be realized. Considerable judgment is required in determining whether a valuation allowance is necessary, and if so, the amount of such valuation allowance. Although realization is not assured, management believes it is more-likely-than-not that the deferred tax assets will be realized and that no valuation allowance is necessary.
33
Table of Contents
Index to Financial Statements
Consolidated Results of Operations
The following sets forth the consolidated results of operations (in thousands):
| Years ended December 31, | Change over prior year | |||||||||||||||||||
| 2015 | 2014 | 2013 | 2015 | 2014 | ||||||||||||||||
| Premiums and other revenues |
||||||||||||||||||||
| Premiums |
$ | 1,838,519 | $ | 1,815,971 | $ | 1,735,526 | $ | 22,548 | $ | 80,445 | ||||||||||
| Other policy revenues |
250,265 | 224,254 | 210,224 | 26,011 | 14,030 | |||||||||||||||
| Net investment income |
834,831 | 932,858 | 1,016,810 | (98,027 | ) | (83,952 | ) | |||||||||||||
| Realized investments gains (losses), net |
59,443 | 41,422 | 119,553 | 18,021 | (78,131 | ) | ||||||||||||||
| Other income |
34,397 | 36,085 | 37,097 | (1,688 | ) | (1,012 | ) | |||||||||||||
|
|
|
|
|
|
|
|
|
|
|
|||||||||||
| Total premiums and other revenues |
3,017,455 | 3,050,590 | 3,119,210 | (33,135 | ) | (68,620 | ) | |||||||||||||
|
|
|
|
|
|
|
|
|
|
|
|||||||||||
| Benefits, losses and expenses |
||||||||||||||||||||
| Policyholder benefits |
617,006 | 542,015 | 539,406 | 74,991 | 2,609 | |||||||||||||||
| Claims incurred |
923,367 | 933,768 | 886,398 | (10,401 | ) | 47,370 | ||||||||||||||
| Interest credited to policyholders’ account balances |
293,464 | 353,492 | 426,102 | (60,028 | ) | (72,610 | ) | |||||||||||||
| Commissions for acquiring and servicing policies |
425,338 | 397,126 | 371,948 | 28,212 | 25,178 | |||||||||||||||
| Other operating expenses |
501,377 | 485,865 | 503,051 | 15,512 | (17,186 | ) | ||||||||||||||
| Change in deferred policy acquisition costs (1) |
(11,785 | ) | 9,578 | 29,835 | (21,363 | ) | (20,257 | ) | ||||||||||||
|
|
|
|
|
|
|
|
|
|
|
|||||||||||
| Total benefits and expenses |
2,748,767 | 2,721,844 | 2,756,740 | 26,923 | (34,896 | ) | ||||||||||||||
|
|
|
|
|
|
|
|
|
|
|
|||||||||||
| Income before other items and federal income taxes |
$ | 268,688 | $ | 328,746 | $ | 362,470 | $ | (60,058 | ) | $ | (33,724 | ) | ||||||||
|
|
|
|
|
|
|
|
|
|
|
|||||||||||
| (1) | A negative amount of net change indicates more expense was deferred than amortized and represents a decrease to expenses in the period indicated. A positive net change indicates less expense was deferred than amortized and represents an increase to expenses in the period indicated. |
Consolidated earnings decreased during 2015 compared to 2014 primarily due to a decrease in net investment income, which exceeded the decrease in the related interest credited to policyholders’ account balances. The most significant factor in the consolidated earnings decrease during 2014 compared to 2013 was the decrease in net realized investment gains.
Life
Life segment financial results for the periods indicated were as follows (in thousands):
| Years ended December 31, | Change over prior year | |||||||||||||||||||
| 2015 | 2014 | 2013 | 2015 | 2014 | ||||||||||||||||
| Premiums and other revenues |
||||||||||||||||||||
| Premiums |
$ | 305,350 | $ | 307,771 | $ | 293,173 | $ | (2,421 | ) | $ | 14,598 | |||||||||
| Other policy revenues |
237,797 | 209,192 | 195,644 | 28,605 | 13,548 | |||||||||||||||
| Net investment income |
226,076 | 232,389 | 230,763 | (6,313 | ) | 1,626 | ||||||||||||||
| Other income |
1,709 | 1,427 | 3,018 | 282 | (1,591 | ) | ||||||||||||||
|
|
|
|
|
|
|
|
|
|
|
|||||||||||
| Total premiums and other revenues |
770,932 | 750,779 | 722,598 | 20,153 | 28,181 | |||||||||||||||
|
|
|
|
|
|
|
|
|
|
|
|||||||||||
| Benefits, losses and expenses |
||||||||||||||||||||
| Policyholder benefits |
386,785 | 351,271 | 345,566 | 35,514 | 5,705 | |||||||||||||||
| Interest credited to policyholders’ account balances |
59,148 | 68,796 | 56,805 | (9,648 | ) | 11,991 | ||||||||||||||
| Commissions for acquiring and servicing policies |
121,482 | 124,447 | 117,832 | (2,965 | ) | 6,615 | ||||||||||||||
| Other operating expenses |
201,112 | 194,927 | 207,520 | 6,185 | (12,593 | ) | ||||||||||||||
| Change in deferred policy acquisition costs (1) |
(31,048 | ) | (32,014 | ) | (24,752 | ) | 966 | (7,262 | ) | |||||||||||
|
|
|
|
|
|
|
|
|
|
|
|||||||||||
| Total benefits and expenses |
737,479 | 707,427 | 702,971 | 30,052 | 4,456 | |||||||||||||||
|
|
|
|
|
|
|
|
|
|
|
|||||||||||
| Income before other items and federal income taxes |
$ | 33,453 | $ | 43,352 | $ | 19,627 | $ | (9,899 | ) | $ | 23,725 | |||||||||
|
|
|
|
|
|
|
|
|
|
|
|||||||||||
| (1) | A negative amount of net change indicates more expense was deferred than amortized and represents a decrease to expenses in the period indicated. A positive net change indicates less expense was deferred than amortized and represents an increase to expenses in the period indicated. |
34
Table of Contents
Index to Financial Statements
Earnings decreased during 2015 compared to 2014 primarily due to the increase in policyholders benefits partially offset by an increase in other policy revenues. Earnings increased during 2014 compared to 2013 primarily due to a decrease in operating expenses, an increase in premiums on traditional products and other policy revenues.
Premiums and other revenues
Premiums were relatively flat during 2015 compared to 2014. Premiums increased during 2014 compared to 2013 primarily driven by the growth of renewal premiums for term products.
Other policy revenues include mortality charges, earned policy service fees and surrender charges on interest-sensitive life insurance policies. The increase in other policy revenues during 2015 compared to 2014 is attributable to an increase in mortality charges resulting from an increase in insurance in-force and due to an assumption change for universal life products. An increase in interest-sensitive life policies contributed to the increases in these charges during 2014 compared to 2013.
Life insurance sales
The following table presents life insurance sales as measured by annualized premium, a non-GAAP measure used by the insurance industry, which allows a comparison of new policies sold by an insurance company during the period (in thousands):
| Years ended December 31, | Change over prior year | |||||||||||||||||||
| 2015 | 2014 | 2013 | 2015 | 2014 | ||||||||||||||||
| Whole life |
$ | 26,249 | $ | 26,165 | $ | 25,209 | $ | 84 | $ | 956 | ||||||||||
| Term life |
29,036 | 29,226 | 32,174 | (190 | ) | (2,948 | ) | |||||||||||||
| Universal life |
37,263 | 37,773 | 37,769 | (510 | ) | 4 | ||||||||||||||
|
|
|
|
|
|
|
|
|
|
|
|||||||||||
| Total recurring |
$ | 92,548 | $ | 93,164 | $ | 95,152 | $ | (616 | ) | $ | (1,988 | ) | ||||||||
|
|
|
|
|
|
|
|
|
|
|
|||||||||||
| Single and excess |
$ | 2,163 | $ | 2,173 | $ | 2,327 | $ | (10 | ) | $ | (154 | ) | ||||||||
| Credit life |
3,984 | 3,940 | 4,105 | 44 | (165 | ) | ||||||||||||||
Life insurance sales are based on the total yearly premium that insurance companies would expect to receive if all recurring premium policies would remain in force, plus 10% of single and excess premiums and 15% of credit life premium. Life insurance sales measure activity associated with gaining new insurance business in the current period whereas GAAP premium revenues are associated with policies sold in current and prior periods; therefore, a reconciliation of premium revenues and insurance sales is not meaningful.
Life insurance sales decreased during 2015 compared to 2014 primarily driven by a decrease in universal life policy sales. Life insurance sales decreased during 2014 compared to 2013 due to a leveling of new term life sales from their introduction in late 2012 and significant increase in 2013. Marketing activities at financial institutions with whom the Company markets life insurance have been curtailed by such financial institutions as they seek to ensure compliance with Consumer Financial Protection Bureau rules and guidance.
Benefits, losses and expenses
Policyholder benefits increased during 2015 compared to 2014 primarily due to an increase in claims and a mortality improvement assumption change in premium reserves for universal life products. Policyholder benefits increased during 2014 compared to 2013 primarily due to higher claims in 2014.
Commissions decreased during 2015 compared to 2014 primarily due to decreased sales of our term and universal life products. Commissions increased during 2014 compared to 2013 primarily due to increased sales of our whole and equity-indexed universal life products.
35
Table of Contents
Index to Financial Statements
The following table presents the components of the change in DAC (in thousands):
| Years ended December 31, | Change over prior year | |||||||||||||||||||
| 2015 | 2014 | 2013 | 2015 | 2014 | ||||||||||||||||
| Acquisition cost capitalized |
$ | 108,615 | $ | 110,195 | $ | 107,410 | $ | (1,580 | ) | $ | 2,785 | |||||||||
| Amortization of DAC |
(77,567 | ) | (78,181 | ) | (82,658 | ) | 614 | 4,477 | ||||||||||||
|
|
|
|
|
|
|
|
|
|
|
|||||||||||
| Change in DAC |
$ | 31,048 | $ | 32,014 | $ | 24,752 | $ | (966 | ) | $ | 7,262 | |||||||||
|
|
|
|
|
|
|
|
|
|
|
|||||||||||
During the fourth quarter of 2015 and 2014, the Company unlocked certain prospective DAC assumptions based on recent experience related to universal life as required by relevant accounting guidance. The changes resulted in a $14.0 million increase in DAC partially offset by a $5.9 million increase in reserves in 2015, and a $9.1 million increase in DAC in 2014.
Policy in-force information
The following table summarizes changes in the Life segment’s in-force amounts (in thousands):
| December 31, | Change over prior year | |||||||||||||||||||
| 2015 | 2014 | 2013 | 2015 | 2014 | ||||||||||||||||
| Life insurance in-force |
||||||||||||||||||||
| Traditional life |
$ | 63,336,601 | $ | 59,409,750 | $ | 54,788,898 | $ | 3,926,851 | $ | 4,620,852 | ||||||||||
| Interest-sensitive life |
26,858,051 | 26,166,314 | 25,281,391 | 691,737 | 884,923 | |||||||||||||||
|
|
|
|
|
|
|
|
|
|
|
|||||||||||
| Total life insurance in-force |
$ | 90,194,652 | $ | 85,576,064 | $ | 80,070,289 | $ | 4,618,588 | $ | 5,505,775 | ||||||||||
|
|
|
|
|
|
|
|
|
|
|
|||||||||||
The following table summarizes changes in the Life segment’s number of policies in-force:
| December 31, | Change over prior year | |||||||||||||||||||
| 2015 | 2014 | 2013 | 2015 | 2014 | ||||||||||||||||
| Number of policies in-force |
||||||||||||||||||||
| Traditional life |
1,890,600 | 1,949,119 | 2,002,602 | (58,519 | ) | (53,483 | ) | |||||||||||||
| Interest-sensitive life |
212,851 | 205,805 | 196,949 | 7,046 | 8,856 | |||||||||||||||
|
|
|
|
|
|
|
|
|
|
|
|||||||||||
| Total number of policies |
2,103,451 | 2,154,924 | 2,199,551 | (51,473 | ) | (44,627 | ) | |||||||||||||
|
|
|
|
|
|
|
|
|
|
|
|||||||||||
Total life insurance in-force increased during 2015 compared to 2014, and 2014 compared to 2013, while the total number of policies decreased for the same periods, reflecting the transition to fewer but higher face amount policies.
Reinsurance
The table below summarizes reinsurance reserves and premium amounts assumed and ceded (in thousands):
| Reserves | Premiums | |||||||||||||||||||||||
| Years ended December 31, | Years ended December 31, | |||||||||||||||||||||||
| 2015 | 2014 | 2013 | 2015 | 2014 | 2013 | |||||||||||||||||||
| Reinsurance assumed |
$ | 48 | $ | 117 | $ | 442 | $ | (20 | ) | $ | 137 | $ | 550 | |||||||||||
| Reinsurance ceded |
(219,272 | ) | (209,853 | ) | (198,221 | ) | (101,636 | ) | (96,577 | ) | (93,240 | ) | ||||||||||||
|
|
|
|
|
|
|
|
|
|
|
|
|
|||||||||||||
| Total |
$ | (219,224 | ) | $ | (209,736 | ) | $ | (197,779 | ) | $ | (101,656 | ) | $ | (96,440 | ) | $ | (92,690 | ) | ||||||
|
|
|
|
|
|
|
|
|
|
|
|
|
|||||||||||||
36
Table of Contents
Index to Financial Statements
We use reinsurance to mitigate excessive risk to the Life segment. During 2015, our retention limits were $2,750,000 for issue ages 65 and under, and $1,725,000 for issue ages 66 and older for traditional and universal life. Accidental death and premium waiver benefits are mostly retained on new business. Increases in reserves and premium amounts ceded primarily reflect increased use of reinsurance in conjunction with treaties related to universal life products.
Consistent with our corporate risk management strategy, we periodically adjust our reinsurance program and retention limits as market conditions warrant. While, in the past, we have reinsured up to 90% of new business, we are currently reinsuring newly developed permanent products on a modified excess retention basis, in which we reinsure mortality risk on a yearly renewable term basis, ceding a 75% quota share of policies with a face value of at least $500,000 up to our retention and then 100% in excess of retention. Current traditionally marketed term products are reinsured on a modified excess retention basis, in which we reinsure mortality risk on a yearly renewable term basis, ceding 50% quota share of face amounts in excess of $250,000 up to our retention and then 100% in excess of retention.
Reinsurance is used in the credit life business primarily to provide producers of credit-related insurance products the opportunity to participate in the underwriting risk through offshore producer-owned captive reinsurance companies. A majority of the treaties entered into by our Credit Insurance Division are written on a 100% coinsurance basis with benefit limits of $100,000 on credit life. We have entered into funds withheld reinsurance treaties, which provide for cessions to the reinsurer on a written basis.
For 2015, the companies to whom we have ceded reinsurance for the Life segment are shown below (in thousands, except percentages):
| A.M. Best | Ceded | Percentage of | ||||||||
| Reinsurer |
Rating(1) | Premium | Gross Premium | |||||||
| Swiss Re Life & Health of America Inc. |
A+ | $ | 25,999 | 6.4 | % | |||||
| SCOR Global Life Reinsurance Company of Delaware |
A | 18,211 | 4.5 | |||||||
| Munich American Reassurance Company |
A+ | 14,905 | 3.7 | |||||||
| Canada Life Assurance Company |
A+ | 8,439 | 2.1 | |||||||
| RGA Reinsurance Company |
A+ | 6,311 | 1.6 | |||||||
| General Re Life Corporation |
A++ | 5,205 | 1.3 | |||||||
| Other Reinsurers with no single company greater than 5% of the total ceded premium |
22,566 | 5.9 | ||||||||
|
|
|
|
|
|||||||
| Total life reinsurance ceded |
$ | 101,636 | 25.5 | % | ||||||
|
|
|
|
|
|||||||
| (1) | A.M. Best rating as of the most current information available February 18, 2016. |
37
Table of Contents
Index to Financial Statements
Annuity
Annuity segment financial results for the periods indicated were as follows (in thousands):
| Years ended December 31, | Change over prior year | |||||||||||||||||||
| 2015 | 2014 | 2013 | 2015 | 2014 | ||||||||||||||||
| Premiums and other revenues |
||||||||||||||||||||
| Premiums |
$ | 183,125 | $ | 190,357 | $ | 155,162 | $ | (7,232 | ) | $ | 35,195 | |||||||||
| Other policy revenues |
12,468 | 15,062 | 14,580 | (2,594 | ) | 482 | ||||||||||||||
| Net investment income |
459,458 | 545,887 | 632,536 | (86,429 | ) | (86,649 | ) | |||||||||||||
| Other income |
3,464 | (1 | ) | 351 | 3,465 | (352 | ) | |||||||||||||
|
|
|
|
|
|
|
|
|
|
|
|||||||||||
| Total premiums and other revenues |
658,515 | 751,305 | 802,629 | (92,790 | ) | (51,324 | ) | |||||||||||||
|
|
|
|
|
|
|
|
|
|
|
|||||||||||
| Benefits, losses and expenses |
||||||||||||||||||||
| Policyholder benefits |
230,221 | 234,173 | 193,840 | (3,952 | ) | 40,333 | ||||||||||||||
| Interest credited to policyholders’ account balances |
234,316 | 284,696 | 369,297 | (50,380 | ) | (84,601 | ) | |||||||||||||
| Commissions for acquiring and servicing policies |
62,917 | 48,478 | 43,920 | 14,439 | 4,558 | |||||||||||||||
| Other operating expenses |
54,037 | 56,487 | 63,326 | (2,450 | ) | (6,839 | ) | |||||||||||||
| Change in deferred policy acquisition costs (1) |
17,069 | 31,735 | 36,359 | (14,666 | ) | (4,624 | ) | |||||||||||||
|
|
|
|
|
|
|
|
|
|
|
|||||||||||
| Total benefits and expenses |
598,560 | 655,569 | 706,742 | (57,009 | ) | (51,173 | ) | |||||||||||||
|
|
|
|
|
|
|
|
|
|
|
|||||||||||
| Income before other items and federal income taxes |
$ | 59,955 | $ | 95,736 | $ | 95,887 | $ | (35,781 | ) | $ | (151 | ) | ||||||||
|
|
|
|
|
|
|
|
|
|
|
|||||||||||
| (1) | A negative amount of net change indicates more expense was deferred than amortized and represents a decrease to expenses in the period indicated. A positive net change indicates less expense was deferred than amortized and represents an increase to expenses in the period indicated. |
Earnings decreased during 2015 compared to 2014 primarily due to the decrease in net investment income partially offset by a corresponding decrease in interest credited to policyholders’ account balances. Net investment income declined primarily due to unrealized losses in income on over-the-counter-equity-indexed option derivatives and a decrease in investment income. Earnings remained relatively unchanged during 2014 compared to 2013.
Premiums and other revenues
Annuity premium and deposit amounts received are shown below (in thousands):
| Years ended December 31, | Change over prior year | |||||||||||||||||||
| 2015 | 2014 | 2013 | 2015 | 2014 | ||||||||||||||||
| Fixed deferred annuity |
$ | 528,623 | $ | 316,265 | $ | 260,289 | $ | 212,358 | $ | 55,976 | ||||||||||
| Single premium immediate annuity |
213,341 | 215,871 | 203,890 | (2,530 | ) | 11,981 | ||||||||||||||
| Equity-indexed deferred annuity |
432,517 | 245,574 | 178,722 | 186,943 | 66,852 | |||||||||||||||
| Variable deferred annuity |
93,898 | 110,854 | 119,880 | (16,956 | ) | (9,026 | ) | |||||||||||||
|
|
|
|
|
|
|
|
|
|
|
|||||||||||
| Total premium and deposits |
1,268,379 | 888,564 | 762,781 | 379,815 | 125,783 | |||||||||||||||
| Less: Policy deposits |
1,085,254 | 698,207 | 607,619 | 387,047 | 90,588 | |||||||||||||||
|
|
|
|
|
|
|
|
|
|
|
|||||||||||
| Total earned premiums |
$ | 183,125 | $ | 190,357 | $ | 155,162 | $ | (7,232 | ) | $ | 35,195 | |||||||||
|
|
|
|
|
|
|
|
|
|
|
|||||||||||
Fixed deferred and equity-indexed annuity sales increased significantly during 2015 compared to 2014. During 2015, the Company marketed enhanced annuity crediting rates for specific products, which were well received by the market and increased sales.
Single premium immediate annuity sales were relatively flat during 2015 compared to 2014.
38
Table of Contents
Index to Financial Statements
We monitor account values and changes in those values as a key indicator of performance in our Annuity segment. Shown below are the changes in account values (in thousands):
| Years ended December 31, | ||||||||||||
| 2015 | 2014 | 2013 | ||||||||||
| Fixed deferred and equity-indexed annuity |
||||||||||||
| Account value, beginning of period |
$ | 8,873,397 | $ | 9,355,946 | $ | 9,803,197 | ||||||
| Net inflows |
677,708 | 408,615 | 293,746 | |||||||||
| Surrenders |
(899,400 | ) | (1,158,463 | ) | (1,091,890 | ) | ||||||
| Fees |
(6,302 | ) | (9,007 | ) | (9,067 | ) | ||||||
| Interest credited |
225,045 | 276,306 | 359,960 | |||||||||
|
|
|
|
|
|
|
|||||||
| Account value, end of period |
$ | 8,870,448 | $ | 8,873,397 | $ | 9,355,946 | ||||||
|
|
|
|
|
|
|
|||||||
| Single premium immediate annuity |
||||||||||||
| Reserve, beginning of period |
$ | 1,274,664 | $ | 1,144,616 | $ | 1,023,116 | ||||||
| Net inflows |
59,692 | 82,820 | 77,896 | |||||||||
| Interest and mortality |
55,077 | 47,228 | 43,604 | |||||||||
|
|
|
|
|
|
|
|||||||
| Reserve, end of period |
$ | 1,389,433 | $ | 1,274,664 | $ | 1,144,616 | ||||||
|
|
|
|
|
|
|
|||||||
| Variable deferred annuity |
||||||||||||
| Account value, beginning of period |
$ | 494,516 | $ | 489,305 | $ | 417,645 | ||||||
| Net inflows |
91,276 | 108,094 | 115,890 | |||||||||
| Surrenders |
(163,677 | ) | (129,577 | ) | (120,207 | ) | ||||||
| Fees |
(5,507 | ) | (5,763 | ) | (5,356 | ) | ||||||
| Change in market value and other |
1,213 | 32,457 | 81,333 | |||||||||
|
|
|
|
|
|
|
|||||||
| Account value, end of period |
$ | 417,821 | $ | 494,516 | $ | 489,305 | ||||||
|
|
|
|
|
|
|
|||||||
Variable annuity premiums have shown a declining trend in recent years. These net inflows are mostly renewal and first year deposits into group unallocated separate account funds with no minimum guarantees. A small proportion of the variable annuity premium is renewal deposits into a closed block of older retail variable annuities that do have guaranteed minimum death benefits, but with minimal risk exposure. Our total direct exposure on the guaranteed minimum death benefits associated with these products was $1.0 million and $0.9 million as of December 31, 2015 and 2014 respectively.
Benefits, losses and expenses
Policyholder benefits consist of annuity payments and reserve increases for single premium immediate annuity contracts. Reserve increases are highly correlated to the sales volume of SPIA contracts. The level of benefits in 2015 and 2014 increased compared to 2013, commensurate with increases in SPIA premium during these periods.
Commissions increased during 2015 compared to 2014 driven by the increase in fixed deferred and equity-indexed annuity sales. Commissions increased during 2014 compared to 2013 as a result of increased annuity sales.
Other operating expenses decreased during 2015 compared to 2014, and during 2014 compared to 2013 due to expense management activities.
39
Table of Contents
Index to Financial Statements
The change in DAC represents acquisition costs capitalized less the amortization of existing DAC, which is calculated in proportion to expected gross profits. The following shows the components of the change in DAC (in thousands):
| Years ended December 31, | Change over prior year | |||||||||||||||||||
| 2015 | 2014 | 2013 | 2015 | 2014 | ||||||||||||||||
| Acquisition cost capitalized |
$ | 64,724 | $ | 47,400 | $ | 49,397 | $ | 17,324 | $ | (1,997 | ) | |||||||||
| Amortization of DAC |
(81,793 | ) | (79,135 | ) | (85,756 | ) | (2,658 | ) | 6,621 | |||||||||||
|
|
|
|
|
|
|
|
|
|
|
|||||||||||
| Change in DAC |
$ | (17,069 | ) | $ | (31,735 | ) | $ | (36,359 | ) | $ | 14,666 | $ | 4,624 | |||||||
|
|
|
|
|
|
|
|
|
|
|
|||||||||||
The change in DAC is lower during 2015 compared to 2014 due to an increase in capitalization which is primarily driven by the increase in commissions. During the fourth quarter of 2014, the Company unlocked certain prospective DAC assumptions based on recent experience as required by relevant accounting guidance. Lapse rates and withdrawal assumptions were unlocked for certain gross unallocated variable annuities and certain fixed annuities resulting in a $1.0 million increase in DAC.
The amortization of DAC as a percentage of gross profits is an important ratio for the Annuity segment. Changes in this ratio reflect the impact of emerging experience. The ratios for the years ended December 31, 2015, 2014, and 2013 were 42.2%, 34.0%, and 35.8%, respectively. The 2015 ratio is at a relatively normal level, whereas the 2014 and 2013 ratios were lower than usual, for different reasons. The 2014 ratio reflects lower than estimated surrenders. The 2013 ratio reflects higher than estimated margins, related to favorable option returns.
Options and Derivatives
The S&P 500 Index return decreased by approximately 0.7% in 2015 and increased by approximately 11.4% in 2014. This change led to a decrease in the option return of $56.4 million during 2015 compared to 2014, partially offset by a $33.7 million decrease in the related equity-indexed embedded derivative, for a net decrease in earnings of $22.7 million.
Net investment income without option return decreased during 2015 compared to 2014, and during 2014 compared to 2013, primarily due to a lower net investment portfolio yield and aggregate account values.
The following table summarizes the incremental impact of the investment performance of equity-indexed options or “option return” on net investment income, and the impact of the equity-indexed annuity embedded derivatives to interest credited to policyholder’s account balances (in thousands):
| Years ended December 31, | Change over prior year | |||||||||||||||||||
| 2015 | 2014 | 2013 | 2015 | 2014 | ||||||||||||||||
| Net investment income |
||||||||||||||||||||
| Without option return |
$ | 466,660 | $ | 496,652 | $ | 550,313 | $ | (29,992 | ) | $ | (53,661 | ) | ||||||||
| Option return |
(7,202 | ) | 49,235 | 82,223 | (56,437 | ) | (32,988 | ) | ||||||||||||
| Interest credited to policy account balances |
||||||||||||||||||||
| Without embedded derivatives |
238,702 | 255,383 | 303,474 | (16,681 | ) | (48,091 | ) | |||||||||||||
| Equity-indexed annuity embedded derivatives |
(4,386 | ) | 29,313 | 65,823 | (33,699 | ) | (36,510 | ) | ||||||||||||
40
Table of Contents
Index to Financial Statements
Health
Health segment results for the periods indicated were as follows (in thousands):
| Years ended December 31, | Change over prior year | |||||||||||||||||||
| 2015 | 2014 | 2013 | 2015 | 2014 | ||||||||||||||||
| Premiums and other revenues |
||||||||||||||||||||
| Premiums |
$ | 196,777 | $ | 216,868 | $ | 212,931 | $ | (20,091 | ) | $ | 3,937 | |||||||||
| Net investment income |
10,135 | 11,692 | 11,314 | (1,557 | ) | 378 | ||||||||||||||
| Other income |
17,714 | 20,391 | 17,629 | (2,677 | ) | 2,762 | ||||||||||||||
|
|
|
|
|
|
|
|
|
|
|
|||||||||||
| Total premiums and other revenues |
224,626 | 248,951 | 241,874 | (24,325 | ) | 7,077 | ||||||||||||||
|
|
|
|
|
|
|
|
|
|
|
|||||||||||
| Benefits, losses and expenses |
||||||||||||||||||||
| Claims incurred |
146,805 | 144,799 | 139,762 | 2,006 | 5,037 | |||||||||||||||
| Commissions for acquiring and servicing policies |
27,455 | 35,896 | 28,225 | (8,441 | ) | 7,671 | ||||||||||||||
| Other operating expenses |
45,047 | 43,261 | 46,646 | 1,786 | (3,385 | ) | ||||||||||||||
| Change in deferred policy acquisition costs (1) |
3,394 | (564 | ) | 1,986 | 3,958 | (2,550 | ) | |||||||||||||
|
|
|
|
|
|
|
|
|
|
|
|||||||||||
| Total benefits and expenses |
222,701 | 223,392 | 216,619 | (691 | ) | 6,773 | ||||||||||||||
|
|
|
|
|
|
|
|
|
|
|
|||||||||||
| Income before other items and federal income taxes |
$ | 1,925 | $ | 25,559 | $ | 25,255 | $ | (23,634 | ) | $ | 304 | |||||||||
|
|
|
|
|
|
|
|
|
|
|
|||||||||||
| (1) | A negative amount of net change indicates more expense was deferred than amortized and represents a decrease to expenses in the period indicated. A positive net change indicates less expense was deferred than amortized and represents an increase to expenses in the period indicated. |
Earnings decreased during 2015 compared to 2014 primarily due to an increase in claims retained by the company from a reinsurer that was unable to meet its contractual obligations. Also, there were fewer premiums and claims in the closed medical blocks of business and Medicare Supplement products. Earnings were relatively unchanged during 2014 compared to 2013 as the increase in premiums was offset by the increase in claims incurred.
Premiums and other revenues
Health earned premiums for the periods indicated were as follows (in thousands, except percentages):
| Years ended December 31, | ||||||||||||||||||||||||
| 2015 | 2014 | 2013 | ||||||||||||||||||||||
| Medicare Supplement |
$ | 76,090 | 38.6 | % | $ | 85,099 | 39.2 | % | $ | 90,785 | 42.6 | % | ||||||||||||
| Medical expense |
16,910 | 8.6 | 21,919 | 10.1 | 30,331 | 14.2 | ||||||||||||||||||
| Group health |
34,361 | 17.5 | 33,835 | 15.6 | 37,391 | 17.6 | ||||||||||||||||||
| Credit accident and health |
13,106 | 6.7 | 13,736 | 6.3 | 15,029 | 7.1 | ||||||||||||||||||
| MGU |
23,798 | 12.1 | 24,230 | 11.2 | 19,619 | 9.2 | ||||||||||||||||||
| Supplemental Insurance |
26,546 | 13.5 | 31,769 | 14.7 | 13,125 | 6.2 | ||||||||||||||||||
| All other |
5,966 | 3.0 | 6,280 | 2.9 | 6,651 | 3.1 | ||||||||||||||||||
|
|
|
|
|
|
|
|
|
|
|
|
|
|||||||||||||
| Total |
$ | 196,777 | 100.0 | % | $ | 216,868 | 100.0 | % | $ | 212,931 | 100.0 | % | ||||||||||||
|
|
|
|
|
|
|
|
|
|
|
|
|
|||||||||||||
Earned premiums decreased during 2015 compared to 2014 primarily due to the continued contraction of the closed medical expense blocks of business, and a decrease in Medicare Supplement contract sales. The decline in Medicare Supplement earned premium reflects a sales shift to a lower premium high deductible Medicare Supplement Plan. For 2015 there was also a decrease in supplemental product sales due to Affordable Care Act regulations that required changes to a previously sold product, which made it unmarketable. Earned premiums increased during 2014 compared to 2013 primarily due to increased demand for individual limited benefit products in the supplemental insurance line.
41
Table of Contents
Index to Financial Statements
Our in-force certificates or policies as of the dates indicated are as follows:
| December 31, | ||||||||||||||||||||||||
| 2015 | 2014 | 2013 | ||||||||||||||||||||||
| Medicare Supplement |
35,586 | 6.8 | % | 38,245 | 6.0 | % | 40,064 | 6.4 | % | |||||||||||||||
| Medical expense |
2,717 | 0.5 | 3,313 | 0.5 | 4,633 | 0.7 | ||||||||||||||||||
| Group |
16,988 | 3.2 | 16,877 | 2.6 | 19,679 | 3.1 | ||||||||||||||||||
| Credit accident and health |
204,080 | 39.0 | 227,790 | 35.8 | 235,014 | 37.5 | ||||||||||||||||||
| MGU |
164,626 | 31.4 | 239,537 | 37.6 | 221,811 | 35.3 | ||||||||||||||||||
| Supplemental Insurance |
62,384 | 11.9 | 70,207 | 11.0 | 61,342 | 9.8 | ||||||||||||||||||
| All other |
37,335 | 7.2 | 41,417 | 6.5 | 45,369 | 7.2 | ||||||||||||||||||
|
|
|
|
|
|
|
|
|
|
|
|
|
|||||||||||||
| Total |
523,716 | 100.0 | % | 637,386 | 100.0 | % | 627,912 | 100.0 | % | |||||||||||||||
|
|
|
|
|
|
|
|
|
|
|
|
|
|||||||||||||
Total in-force policies decreased during 2015 compared to 2014, primarily due to decreases in the MGU line, credit accident and health business, and supplemental insurance. MGU inforce certificate counts decreased during 2015 primarily as a result of removing lesser performing groups by several MGUs. New sources of business have originated during the year to date and it is intended that premiums written for these groups will replace portions of the cancelled groups. Credit accident and health decreased due to contraction in that market as distributors continued to shift their marketing emphasis to property and casualty products. Total in-force policies increased during 2014 compared to 2013 primarily due to an increase in the MGU line and the supplemental insurance line, partially offset by a decrease in credit accident and health business.
Benefits, losses and expenses
Claims incurred increased during 2015 compared to 2014 due to the company retaining paid losses, as well as an estimate of incurred but not reported losses for a closed block of business ceded to a reinsurer that is not expected to be able to meet its obligations under reinsurance agreements. Claims incurred increased during 2014 compared to 2013 primarily due to a judicial determination that the Company could not rescind a certain reinsurance agreement that was in dispute.
Change in Deferred Policy Acquisition Costs
The following table presents the components of the change in DAC (in thousands):
| Years ended December 31, | Change over prior year | |||||||||||||||||||
| 2015 | 2014 | 2013 | 2015 | 2014 | ||||||||||||||||
| Acquisition cost capitalized |
$ | 20,249 | $ | 19,530 | $ | 13,263 | $ | 719 | $ | 6,267 | ||||||||||
| Amortization of DAC |
(23,643 | ) | (18,966 | ) | (15,249 | ) | (4,677 | ) | (3,717 | ) | ||||||||||
|
|
|
|
|
|
|
|
|
|
|
|||||||||||
| Change in DAC |
$ | (3,394 | ) | $ | 564 | $ | (1,986 | ) | $ | (3,958 | ) | $ | 2,550 | |||||||
|
|
|
|
|
|
|
|
|
|
|
|||||||||||
The increase in amortization of DAC in 2015 relative to 2014 was associated with the shrinking Medicare Supplement and closed Medical Expense blocks as well as greater than expected lapsation of the limited benefit medical supplemental products.
Reinsurance
For the medical expense business, we use reinsurance on an excess of loss basis. We retain the first $500,000 per claim and amounts in excess of $2,000,000. We cede or retrocede the majority of risk associated with our stop loss and other MGU programs. We maintain reinsurance on a quota share basis for our long-term care and disability income business.
42
Table of Contents
Index to Financial Statements
Reinsurance is also used in the credit accident and health business. In certain cases, particularly in the auto retail market, we may also reinsure the policy written through non-U.S. producer-owned captive reinsurers to allow the dealer to participate in the performance of these credit accident and health contracts. A majority of the treaties entered into by our Credit Insurance Division are written on a 100% coinsurance basis with benefit limits of $1,000 per month.
For 2015, the companies to which we have ceded reinsurance for the Health segment are shown below (in thousands, except percentages):
| A.M. Best | Ceded | Percentage of | ||||||||
| Reinsurer |
Rating(1) | Premium | Gross Premium | |||||||
| Maiden Reinsurance North America, Inc. |
A- | $ | 37,259 | 15.5 | % | |||||
| Munich Reinsurance America |
A+ | 27,794 | 11.5 | |||||||
| Monitor Life |
B++ | 24,139 | 10.0 | |||||||
| Lloyds 3623 |
A | 18,633 | 7.7 | |||||||
| Other reinsurers with no single company greater than 5.0% of the total ceded premium |
116,798 | 47.7 | ||||||||
|
|
|
|
|
|||||||
| Total health reinsurance ceded |
$ | 224,623 | 92.4 | % | ||||||
|
|
|
|
|
|||||||
| (1) | A.M. Best rating as of the most current information available February 18, 2016 |
Property and Casualty
Property and Casualty results for the periods indicated were as follows (in thousands, except percentages):
| Years ended December 31, | Change over prior year | |||||||||||||||||||
| 2015 | 2014 | 2013 | 2015 | 2014 | ||||||||||||||||
| Premiums and other revenues |
||||||||||||||||||||
| Net premiums written |
$ | 1,187,980 | $ | 1,109,029 | $ | 1,069,694 | $ | 78,951 | $ | 39,335 | ||||||||||
|
|
|
|
|
|
|
|
|
|
|
|||||||||||
| Net premiums earned |
$ | 1,153,267 | $ | 1,100,975 | $ | 1,074,260 | $ | 52,292 | $ | 26,715 | ||||||||||
| Net investment income |
55,620 | 58,843 | 66,632 | (3,223 | ) | (7,789 | ) | |||||||||||||
| Other income |
5,534 | 4,735 | 6,239 | 799 | (1,504 | ) | ||||||||||||||
|
|
|
|
|
|
|
|
|
|
|
|||||||||||
| Total premiums and other revenues |
1,214,421 | 1,164,553 | 1,147,131 | 49,868 | 17,422 | |||||||||||||||
|
|
|
|
|
|
|
|
|
|
|
|||||||||||
| Benefits, losses and expenses |
||||||||||||||||||||
| Claims incurred |
776,562 | 745,540 | 746,636 | 31,022 | (1,096 | ) | ||||||||||||||
| Commissions for acquiring and servicing policies |
213,486 | 188,305 | 181,748 | 25,181 | 6,557 | |||||||||||||||
| Other operating expenses |
156,583 | 130,655 | 128,437 | 25,928 | 2,218 | |||||||||||||||
| Change in deferred policy acquisition costs (1) |
(1,200 | ) | 10,421 | 16,242 | (11,621 | ) | (5,821 | ) | ||||||||||||
|
|
|
|
|
|
|
|
|
|
|
|||||||||||
| Total benefits and expenses |
1,145,431 | 1,074,921 | 1,073,063 | 70,510 | 1,858 | |||||||||||||||
|
|
|
|
|
|
|
|
|
|
|
|||||||||||
| Income before other items and federal income taxes |
$ | 68,990 | $ | 89,632 | $ | 74,068 | $ | (20,642 | ) | $ | 15,564 | |||||||||
|
|
|
|
|
|
|
|
|
|
|
|||||||||||
| Loss ratio |
67.3 | % | 67.7 | % | 69.5 | % | (0.4 | ) | (1.8 | ) | ||||||||||
| Underwriting expense ratio |
32.0 | 29.9 | 30.4 | 2.1 | (0.5 | ) | ||||||||||||||
|
|
|
|
|
|
|
|
|
|
|
|||||||||||
| Combined ratio |
99.3 | % | 97.6 | % | 99.9 | % | 1.7 | (2.3 | ) | |||||||||||
|
|
|
|
|
|
|
|
|
|
|
|||||||||||
| Impact of catastrophe events on combined ratio |
5.7 | 5.9 | 7.2 | (0.2 | ) | (1.3 | ) | |||||||||||||
|
|
|
|
|
|
|
|
|
|
|
|||||||||||
| Combined ratio without impact of catastrophe events |
93.6 | % | 91.7 | % | 92.7 | % | 1.9 | (1.0 | ) | |||||||||||
|
|
|
|
|
|
|
|
|
|
|
|||||||||||
| Gross catastrophe losses |
$ | 65,413 | $ | 64,479 | $ | 83,903 | $ | 934 | $ | (19,424 | ) | |||||||||
| Net catastrophe losses |
62,717 | 65,374 | 76,434 | (2,657 | ) | (11,060 | ) | |||||||||||||
| (1) | A negative amount of net change indicates more expense was deferred than amortized and represents a decrease to expenses in the period indicated. A positive net change indicates less expense was deferred than amortized and represents an increase to expenses in the period indicated. |
43
Table of Contents
Index to Financial Statements
Property and Casualty earnings decreased during 2015 compared to 2014 as higher premiums were offset by increased non-catastrophe claims and growth related operating expenses. Property and Casualty earnings increased during 2014 compared to 2013 due to decreases in catastrophe losses, improved rate adequacy and underwriting improvements.
Premiums and other revenues
Net premiums written and earned increased during 2015 compared to 2014 due to increases in the commercial and credit lines. Net premiums written and earned increased during 2014 compared to 2013 due to continued changes to improve rate adequacy in our homeowners and commercial lines.
Benefits, losses and expenses
The increase in claims during 2015 compared to 2014 was primarily a result of an increase in non-catastrophe weather related losses. Claims incurred decreased during 2014 compared to 2013 as a result of decreases in catastrophe losses.
Commissions for acquiring and servicing policies increased during 2015 compared to 2014 as a result of the growth of the collateral protection line of business during 2015.
Operating expenses increased during 2015 compared to 2014 as a result of costs related to growth initiatives.
Gross catastrophe losses for the year ended December 31, 2015 were relatively flat compared to 2014. Average severity of catastrophe losses decreased by 20% in 2015 compared to 2014 and by 25% in 2014 compared to 2013.
Products
Our Property and Casualty segment consists of: (i) Personal products, marketed primarily to individuals, representing 57.3% of net premiums written; (ii) Commercial products, which focus primarily on agricultural and other markets, representing 31.3% of net premiums written; and (iii) Credit-related property insurance products, which are marketed to and through financial institutions and retailers, representing 11.4% of net premiums written.
44
Table of Contents
Index to Financial Statements
Personal Products
Personal Products results for the periods indicated were as follows (in thousands, except percentages):
| Years ended December 31, | Change over prior year | |||||||||||||||||||
| 2015 | 2014 | 2013 | 2015 | 2014 | ||||||||||||||||
| Net premiums written |
||||||||||||||||||||
| Automobile |
$ | 412,686 | $ | 403,470 | $ | 404,807 | $ | 9,216 | $ | (1,337 | ) | |||||||||
| Homeowner |
226,272 | 223,852 | 216,806 | 2,420 | 7,046 | |||||||||||||||
| Other Personal |
41,658 | 37,290 | 35,562 | 4,368 | 1,728 | |||||||||||||||
|
|
|
|
|
|
|
|
|
|
|
|||||||||||
| Total net premiums written |
$ | 680,616 | $ | 664,612 | $ | 657,175 | $ | 16,004 | $ | 7,437 | ||||||||||
|
|
|
|
|
|
|
|
|
|
|
|||||||||||
| Net premiums earned |
||||||||||||||||||||
| Automobile |
$ | 405,891 | $ | 400,050 | $ | 404,664 | $ | 5,841 | $ | (4,614 | ) | |||||||||
| Homeowner |
222,338 | 219,920 | 209,556 | 2,418 | 10,364 | |||||||||||||||
| Other Personal |
40,966 | 36,638 | 35,597 | 4,328 | 1,041 | |||||||||||||||
|
|
|
|
|
|
|
|
|
|
|
|||||||||||
| Total net premiums earned |
$ | 669,195 | $ | 656,608 | $ | 649,817 | $ | 12,587 | $ | 6,791 | ||||||||||
|
|
|
|
|
|
|
|
|
|
|
|||||||||||
| Loss ratio |
||||||||||||||||||||
| Automobile |
77.6 | % | 78.0 | % | 77.9 | % | (0.4 | )% | 0.1 | % | ||||||||||
| Homeowner |
64.5 | 64.1 | 80.0 | 0.4 | (15.9 | ) | ||||||||||||||
| Other Personal |
62.8 | 42.6 | 55.4 | 20.2 | (12.8 | ) | ||||||||||||||
| Personal line loss ratio |
72.4 | % | 71.4 | % | 77.4 | % | 1.0 | % | (6.0 | )% | ||||||||||
| Combined Ratio |
||||||||||||||||||||
| Automobile |
102.8 | % | 101.1 | % | 101.0 | % | 1.7 | % | 0.1 | % | ||||||||||
| Homeowner |
91.7 | 89.4 | 104.9 | 2.3 | (15.5 | ) | ||||||||||||||
| Other Personal |
87.0 | 62.0 | 77.0 | 25.0 | (15.0 | ) | ||||||||||||||
| Personal line combined ratio |
98.2 | % | 95.0 | % | 101.0 | % | 3.2 | % | (6.0 | )% | ||||||||||
Automobile: Net premiums written and earned increased during 2015 compared to 2014, due to increases in sales volume and rates. Net premiums written and earned decreased in our personal automobile line during 2014 compared to 2013 primarily due to a decline in policies in-force. The combined ratio increased during 2015 compared to 2014 primarily due to an increase in operating expenses related to growth initiatives. The loss and combined ratio increased during 2014 compared to 2013 primarily due to a decline in premiums which increased the overall expense to premium ratio.
Homeowner: Net premiums written increased during 2015 compared to 2014 given growth in policy counts. Net premiums written and earned increased during 2014 compared to 2013 primarily due to increasing premium rates over the time period. The combined ratio increased during 2015 compared to 2014, due to increases in operating expenses related to growth initiatives. The loss and combined ratios decreased during 2014 compared to 2013 due to a decline in weather-related losses and improved rate adequacy.
Other Personal: These products include watercraft, rental-owner and umbrella coverages for individuals seeking to protect their personal property and liability not covered within their home and auto policies. The loss ratio increased during 2015 compared to 2014 due to increased catastrophe claim activity during the first half of 2015 and lower than typical loss results in 2014. The loss ratio decreased during 2014 compared to 2013, consistent with trends in the auto and homeowners business.
45
Table of Contents
Index to Financial Statements
Commercial Products
Commercial Products results for the periods indicated were as follows (in thousands, except percentages):
| Years ended December 31, | Change over prior year | |||||||||||||||||||
| 2015 | 2014 | 2013 | 2015 | 2014 | ||||||||||||||||
| Net premiums written |
||||||||||||||||||||
| Other Commercial |
$ | 159,834 | $ | 150,819 | $ | 137,107 | $ | 9,015 | $ | 13,712 | ||||||||||
| Agricultural Business |
123,548 | 115,592 | 107,894 | 7,956 | 7,698 | |||||||||||||||
| Automobile |
88,767 | 86,603 | 79,875 | 2,164 | 6,728 | |||||||||||||||
|
|
|
|
|
|
|
|
|
|
|
|||||||||||
| Total net premiums written |
$ | 372,149 | $ | 353,014 | $ | 324,876 | $ | 19,135 | $ | 28,138 | ||||||||||
|
|
|
|
|
|
|
|
|
|
|
|||||||||||
| Net premiums earned |
||||||||||||||||||||
| Other Commercial |
$ | 154,114 | $ | 146,845 | $ | 128,020 | $ | 7,269 | $ | 18,825 | ||||||||||
| Agricultural Business |
121,031 | 111,599 | 110,476 | 9,432 | 1,123 | |||||||||||||||
| Automobile |
87,450 | 84,653 | 78,016 | 2,797 | 6,637 | |||||||||||||||
|
|
|
|
|
|
|
|
|
|
|
|||||||||||
| Total net premiums earned |
$ | 362,595 | $ | 343,097 | $ | 316,512 | $ | 19,498 | $ | 26,585 | ||||||||||
|
|
|
|
|
|
|
|
|
|
|
|||||||||||
| Loss ratio |
||||||||||||||||||||
| Other Commercial |
65.3 | % | 77.5 | % | 66.6 | % | (12.2 | ) | 10.9 | |||||||||||
| Agricultural Business |
66.0 | 66.6 | 74.9 | (0.6 | ) | (8.3 | ) | |||||||||||||
| Automobile |
74.4 | 69.5 | 66.0 | 4.9 | 3.5 | |||||||||||||||
| Commercial line loss ratio |
67.7 | % | 72.0 | % | 69.4 | % | (4.3 | ) | 2.6 | |||||||||||
| Combined ratio |
||||||||||||||||||||
| Other Commercial |
93.3 | % | 104.4 | % | 94.3 | % | (11.1 | ) | 10.1 | |||||||||||
| Agricultural Business |
106.6 | 106.3 | 111.5 | 0.3 | (5.2 | ) | ||||||||||||||
| Automobile |
98.5 | 92.6 | 89.7 | 5.9 | 2.9 | |||||||||||||||
| Commercial line combined ratio |
99.0 | % | 102.1 | % | 99.1 | % | (3.1 | ) | 3.0 | |||||||||||
Other Commercial: Net premiums written and earned increased during 2015 compared to 2014 and 2014 compared to 2013, primarily due to increased premium per policy for the workers’ compensation and business owners’ products. Improvement in the loss and combined ratios during 2015 compared to 2014 is primarily due to favorable case reserve development on older workers’ compensation claims. Increases in the loss and combined ratios for 2014 compared to 2013 are due to larger reserve increases in the workers’ compensation line.
Agricultural Business: Our agricultural business product allows policyholders to customize and cover their agriculture exposure using a package policy which includes coverage for residences and household contents, farm buildings and building contents, personal and commercial liability and personal property. Net premiums earned increased during 2015 compared to 2014 primarily as a result of improved rate adequacy. Net premiums written and earned increased during 2014 compared to 2013 primarily as a result of rate increases and a decrease in ceded premiums. The combined ratios increased during 2015 compared to 2014 primarily due to increases in operating expenses related to growth initiatives. The loss and combined ratios decreased during 2014 compared to 2013 primarily as the result of a reduction in net catastrophe losses, and the rate and underwriting actions.
Automobile: Net premiums written increased during 2015 compared to 2014 primarily due to improved rate adequacy. Net premiums written and earned increased during 2014 compared to 2013 primarily due to rate increases. The loss and combined ratios increased during 2015 compared to 2014 and 2014 compared to 2013, primarily due to an increase in average severity of losses.
46
Table of Contents
Index to Financial Statements
Credit Products
Credit-related property product results for the periods indicated were as follows (in thousands, except percentages):
| Years ended December 31, | Change over prior year | |||||||||||||||||||
| 2015 | 2014 | 2013 | 2015 | 2014 | ||||||||||||||||
| Net premiums written |
$ | 135,215 | $ | 91,403 | $ | 87,643 | $ | 43,812 | $ | 3,760 | ||||||||||
| Net premiums earned |
121,477 | 101,270 | 107,931 | 20,207 | (6,661 | ) | ||||||||||||||
| Loss ratio |
38.4 | % | 29.5 | % | 22.7 | % | 8.9 | % | 6.8 | % | ||||||||||
| Combined ratio |
107.9 | % | 100.8 | % | 99.3 | % | 7.1 | % | 1.5 | % | ||||||||||
Credit-related property products are offered on automobiles, furniture and appliances in connection with the financing of those items. These policies pay an amount if the insured property is lost or damaged and the amount paid is not directly related to an event affecting the consumer’s ability to pay the debt.
Net written and earned premiums increased during 2015 compared to 2014 primarily due to increases in our Collateral Protection business and updated pricing initiatives in our Guaranteed Auto Protection (GAP) business. Net written premiums increased during 2014 compared to 2013 primarily due to increases in our GAP and Collateral Protection business. Net earned premiums decreased during the same period due to the shift from our GAP Insurance product to GAP Waiver and other products in our portfolio that have smaller premiums and shorter terms.
Reinsurance
We reinsure a portion of the risks that we underwrite to manage our loss exposure. In return for ceded premiums, reinsurers assume a portion of the claims incurred. In addition to our reinsurance coverage, we are partially protected by the Terrorism Risk Insurance Program Reauthorization Act of 2015 and its predecessors.
We retain the first $1.0 million of loss per risk, which will change to $0.5 million for workers’ compensation risks and $1.5 million for non-workers’ compensation risks for 2016. Workers’ compensation reinsurance coverage for losses between $0.5 million and $1.0 million follows satisfaction of a $2.0 million annual aggregate deductible. Our catastrophe reinsurance retention covering property and casualty companies in total has been $10.0 million in recent years and will increase to $17.5 million in 2016.
The following table summarizes the Company’s catastrophe reinsurance coverage effective during 2016.
| Layer of Loss |
Catastrophe Reinsurance Coverage in Force | |
| Less than $10 million |
100% of loss retained except for certain losses covered by the Catastrophe Aggregate and Stretch & Aggregate coverage described below | |
| $10 million - $17.5 million |
100% of earthquake losses countrywide | |
| $17.5 million - $500 million |
100% of multiple peril losses covered by Corporate Program(1) (all perils) | |
| (1) | The Corporate Program covers all non-credit property and casualty business, subject to certain limits, and is not specific to the Company or any of its subsidiaries, or any state or region. The program does cover the Mortgage Security Insurance business written by the Credit Insurance Division. |
47
Table of Contents
Index to Financial Statements
Each per-event coverage above includes one automatic reinstatement except for a 12.5% portion of the Corporate Program (12.5% of $35 million to $500 million). The automatic reinstatement requires us to pay additional reinsurance premium for any losses into each reinsurance layer. The reinstatement premium is prorated by the percentage of actual loss to the coverage, with the exception of losses from $35 million to $100 million, which reflect a 50% reduction on the prorated amount, and the losses from $17.5 million to $35.0 million, which are free for the first limit and reflect a 50% reduction on the second limit. The 12.5% placement of non-reinstateable coverage reduces the amount of reinstatement premium we are obligated to pay.
We purchase a Catastrophe Aggregate reinsurance coverage that provides for $30 million of limit excess of $90 million of aggregated catastrophe losses. Qualifying losses include amounts of retained losses below $10 million. The Catastrophe Aggregate reinsurance coverage has been placed at 100.0% for 2016 and does not include a reinstatement.
A Stretch & Aggregate cover is purchased which consists of a $35 million annual limit available either wholly or in part across two layers. The first layer is 8.75% of $400 million excess of $100 million on an occurrence basis. The second layer provides aggregate protection for a subject loss and is $35 million excess of $5 million of each catastrophe. Recoveries follow satisfaction of a $45 million annual aggregate deductible. This cover was placed at 100% on July 1, 2014 and again on July 1, 2015. It is in place until June 30, 2016. American National expects to place the cover again on July 1, 2016.
We use multiple reinsurers with each reinsurer absorbing part of the overall risk ceded. The primary reinsurers in the 2015 programs and the coverage each provides are shown in the following table:
| A.M. Best | Percent of Risk Covered | |||||||||
| Reinsurer |
Rating(1) | Non–Catastrophe | Catastrophe | |||||||
| Lloyd’s Syndicates |
A | 44.8 | % | 45.8 | % | |||||
| Tokio Millennium Re Ltd. |
A++ | — | 7.1 | |||||||
| Swiss Re |
A+ | 6.9 | 6.0 | |||||||
| Safety National Casualty Corporation |
A+ | 13.3 | — | |||||||
| Hannover Ruckversicherung-Aktiengesellschaft, Germany |
A+ | 9.3 | — | |||||||
| Munich Re America |
A+ | 9.0 | — | |||||||
| Amlin Bermuda Limited |
A | 5.1 | — | |||||||
| Other Reinsurers with no single company with greater than a 5% share |
11.6 | 41.1 | ||||||||
|
|
|
|
|
|||||||
| Total Reinsurance Coverage |
100.0 | % | 100.0 | % | ||||||
|
|
|
|
|
|||||||
| (1) | A.M. Best rating as of the most current information available February 4, 2016 |
Prior Period Reserve Development
The loss development table included herein shows the development of our claims and CAE reserves. The table does not present individual accident or policy year development data. Conditions and trends that affected development of liabilities in the past may not occur in the future. Accordingly, it is inappropriate to anticipate future redundancies or deficiencies based on historical experience.
The top line shows our original estimated reserves, net of reinsurance recoverable, for each of the indicated years. The table then shows the cumulative net paid claims and CAE as of successive years. The liabilities re-estimated shows the successive re-estimated amount of recorded reserves based on prior paid losses and loss expenses and the changes in estimates as of the end of each succeeding year. The cumulative deficiency or redundancy is the aggregate change in the estimates over all prior years. The deficiency or redundancy for different reporting dates is cumulative and should not be added together.
48
Table of Contents
Index to Financial Statements
Property and Casualty Claims and Claim Adjustment Expense Liability Development-Net of Reinsurance
Years Ended December 31,
| (Amounts in Thousands) | 2005 | 2006 | 2007 | 2008 | 2009 | 2010 | 2011 | 2012 | 2013 | 2014 | 2015 | |||||||||||||||||||||||||||||||||
| Liability for unpaid losses and loss adjustment expenses, net of reinsurance |
||||||||||||||||||||||||||||||||||||||||||||
| (includes loss reserves, IBNR, allocated and unallocated expense) |
796,267 | 801,953 | 809,500 | 847,860 | 856,662 | 887,008 | 857,840 | 832,653 | 816,573 | 823,088 | 829,393 | |||||||||||||||||||||||||||||||||
| Cumulative paid losses and loss expenses |
||||||||||||||||||||||||||||||||||||||||||||
| One year later |
366,007 | 296,620 | 318,943 | 345,350 | 308,114 | 331,192 | 329,102 | 314,649 | 299,228 | 298,308 | ||||||||||||||||||||||||||||||||||
| Two years later |
506,463 | 453,042 | 477,958 | 495,277 | 467,402 | 501,444 | 506,332 | 475,084 | 445,980 | |||||||||||||||||||||||||||||||||||
| Three years later |
590,644 | 544,100 | 569,030 | 593,384 | 565,819 | 621,992 | 607,135 | 563,762 | ||||||||||||||||||||||||||||||||||||
| Four years later |
640,003 | 593,112 | 625,925 | 651,781 | 637,286 | 683,506 | 658,749 | |||||||||||||||||||||||||||||||||||||
| Five years later |
664,587 | 623,884 | 655,613 | 696,867 | 671,923 | 713,221 | ||||||||||||||||||||||||||||||||||||||
| Six years later |
682,171 | 638,513 | 688,647 | 714,497 | 688,762 | |||||||||||||||||||||||||||||||||||||||
| Seven years later |
688,866 | 666,814 | 698,929 | 725,769 | ||||||||||||||||||||||||||||||||||||||||
| Eight years later |
713,247 | 673,762 | 706,395 | |||||||||||||||||||||||||||||||||||||||||
| Nine years later |
717,468 | 678,629 | ||||||||||||||||||||||||||||||||||||||||||
| Ten years later |
720,911 | |||||||||||||||||||||||||||||||||||||||||||
| Liabilities re-estimated |
||||||||||||||||||||||||||||||||||||||||||||
| One year later |
770,238 | 711,880 | 766,881 | 798,587 | 776,809 | 818,937 | 810,263 | 793,735 | 773,213 | 780,008 | ||||||||||||||||||||||||||||||||||
| Two years later |
737,341 | 713,339 | 733,361 | 770,900 | 753,152 | 809,757 | 809,969 | 769,160 | 754,919 | |||||||||||||||||||||||||||||||||||
| Three years later |
739,826 | 680,900 | 727,674 | 766,994 | 751,538 | 813,485 | 795,595 | 759,991 | ||||||||||||||||||||||||||||||||||||
| Four years later |
714,995 | 682,446 | 727,733 | 770,441 | 759,987 | 808,358 | 796,686 | |||||||||||||||||||||||||||||||||||||
| Five years later |
717,473 | 685,471 | 735,407 | 777,939 | 759,216 | 809,813 | ||||||||||||||||||||||||||||||||||||||
| Six years later |
720,931 | 694,268 | 746,114 | 779,533 | 759,580 | |||||||||||||||||||||||||||||||||||||||
| Seven years later |
726,479 | 708,245 | 745,988 | 780,944 | ||||||||||||||||||||||||||||||||||||||||
| Eight years later |
743,091 | 709,175 | 747,511 | |||||||||||||||||||||||||||||||||||||||||
| Nine years later |
744,133 | 710,435 | ||||||||||||||||||||||||||||||||||||||||||
| Ten years later |
744,339 | |||||||||||||||||||||||||||||||||||||||||||
| Deficiency (redundancy), net of reinsurance |
(51,928 | ) | (91,518 | ) | (61,989 | ) | (66,916 | ) | (97,082 | ) | (77,195 | ) | (61,154 | ) | (72,662 | ) | (61,654 | ) | (43,080 | ) | ||||||||||||||||||||||||
|
|
|
|
|
|
|
|
|
|
|
|
|
|
|
|
|
|
|
|
|
|||||||||||||||||||||||||
| 2005 | 2006 | 2007 | 2008 | 2009 | 2010 | 2011 | 2012 | 2013 | 2014 | 2015 | ||||||||||||||||||||||||||||||||||
| Net reserve as initially estimated |
796,267 | 801,953 | 809,500 | 847,860 | 856,662 | 887,008 | 857,840 | 832,653 | 816,573 | 823,088 | 829,393 | |||||||||||||||||||||||||||||||||
| Reinsurance and other recoverables as initially estimated |
65,186 | 62,115 | 55,951 | 89,410 | 46,778 | 40,552 | 53,152 | 52,184 | 38,959 | 45,390 | 41,190 | |||||||||||||||||||||||||||||||||
|
|
|
|
|
|
|
|
|
|
|
|
|
|
|
|
|
|
|
|
|
|
|
|||||||||||||||||||||||
| Gross reserve as initially estimated |
861,453 | 864,068 | 865,451 | 937,270 | 903,440 | 927,560 | 910,992 | 884,837 | 855,532 | 868,478 | 870,583 | |||||||||||||||||||||||||||||||||
| Net re-estimated reserve |
744,339 | 710,435 | 747,511 | 780,944 | 759,580 | 809,813 | 796,686 | 759,991 | 754,919 | 780,008 | ||||||||||||||||||||||||||||||||||
| Re-estimated and other reinsurance recoverables |
489,496 | 93,700 | 79,508 | 115,195 | 50,320 | 47,644 | 58,413 | 67,933 | 49,556 | 56,035 | ||||||||||||||||||||||||||||||||||
| Gross re-estimated reserve |
1,233,835 | 804,135 | 827,019 | 896,139 | 809,900 | 857,457 | 855,099 | 827,924 | 804,475 | 836,043 | ||||||||||||||||||||||||||||||||||
| Deficiency (redundancy), gross of reinsurance |
372,382 | (59,933 | ) | (38,432 | ) | (41,131 | ) | (93,540 | ) | (70,103 | ) | (55,893 | ) | (56,913 | ) | (51,057 | ) | (32,435 | ) | |||||||||||||||||||||||||
While we believe that our claims reserves at December 31, 2015 are adequate, new information, events or circumstances, unknown at the original valuation date, may lead to future developments in ultimate losses in amounts significantly greater or less than the reserves currently recorded. The actual final cost of settling both claims outstanding at December 31, 2015 and claims expected to arise from unexpired periods of risk is uncertain. There are many other possible changes that would cause losses to increase or decrease, which include but are not limited to: claim severity; the expected level of reported claims; judicial action changing the scope or liability of coverage; the regulatory, social and economic environment; and unexpected changes in loss inflation.
49
Table of Contents
Index to Financial Statements
We participate in the National Flood Insurance Program administered by the Federal Emergency Management Agency. For the year ended December 31, 2005, the $372.4 million deficiency gross of reinsurance was primarily the result of our participation in this program. These losses are 100% reimbursed by the Federal government and do not impact our net reserve calculations or our net loss development patterns. We had related to our participation, paid losses of $390.0 million because of the 2005 hurricanes, specifically Hurricane Katrina. Since reserves are not set up for the National Flood Insurance Program, any payments made subsequent to year-end will appear as adverse development on a gross basis. If the flood losses were removed from the gross data, the $372.4 million deficiency would be a $17.6 million redundancy.
For 2015, the net favorable prior year claims and CAE development was $43.1 million, compared to approximately $61.7 million of net favorable prior year development in 2014, as a result of better than expected paid and incurred loss emergence. Net favorable reserve development during 2015 and 2014 was primarily driven by personal auto, other liability, commercial multi-peril, and older Workers’ Compensation claims. Net and gross reserve calculations have shown favorable development as a result of loss emergence compared to what was implied by the loss development patterns used in the original estimation of losses. For additional information regarding claims and CAE, refer to Note 12, Liability for Unpaid Claims and Claim Adjustment Expenses, of the Notes to the Consolidated Financial Statements.
The current year loss ratio is a blend of the current accident year loss ratio and the impact of favorable or adverse development on prior accident years during the current calendar year. Excluding the 3.8 point impact of favorable prior year loss development for accident years 2014 and prior, the 2015 loss ratio would have been 71.1%. Excluding the 4.0 point impact of favorable prior year loss development for accident years 2013 and prior, the 2014 loss ratio would have been 71.7%.
Corporate and Other
Corporate and Other segment financial results for the periods indicated were as follows (in thousands):
| Years ended December 31, | Change over prior year | |||||||||||||||||||
| 2015 | 2014 | 2013 | 2015 | 2014 | ||||||||||||||||
| Other revenues |
||||||||||||||||||||
| Net investment income |
$ | 83,542 | $ | 84,047 | $ | 75,565 | $ | (505 | ) | $ | 8,482 | |||||||||
| Realized investment gains, net |
59,443 | 41,422 | 119,553 | 18,021 | (78,131 | ) | ||||||||||||||
| Other Income |
5,976 | 9,533 | 9,860 | (3,557 | ) | (327 | ) | |||||||||||||
|
|
|
|
|
|
|
|
|
|
|
|||||||||||
| Total other revenues |
148,961 | 135,002 | 204,978 | 13,959 | (69,976 | ) | ||||||||||||||
|
|
|
|
|
|
|
|
|
|
|
|||||||||||
| Benefits, losses and expenses |
||||||||||||||||||||
| Commissions |
(2 | ) | — | 223 | (2 | ) | (223 | ) | ||||||||||||
| Other operating expenses |
44,598 | 60,535 | 57,122 | (15,937 | ) | 3,413 | ||||||||||||||
|
|
|
|
|
|
|
|
|
|
|
|||||||||||
| Total benefits, losses and expenses |
44,596 | 60,535 | 57,345 | (15,939 | ) | 3,190 | ||||||||||||||
|
|
|
|
|
|
|
|
|
|
|
|||||||||||
| Income before other items and federal income taxes |
$ | 104,365 | $ | 74,467 | $ | 147,633 | $ | 29,898 | $ | (73,166 | ) | |||||||||
|
|
|
|
|
|
|
|
|
|
|
|||||||||||
Earnings increased during 2015 compared to 2014 primarily due to a decrease in operating expenses and an increase in realized investment gains. The increase in realized investment gains is attributable to the sale of equity securities and the first quarter 2015 sale of investment real estate property. Earnings decreased during 2014 compared to 2013 primarily due to lower realized investment gains. The decrease in realized gains is attributable to lower gains on equity securities and less real estate sale activity.
The Corporate and Other business segment recorded other-than-temporary impairments of $27.9 million, $6.6 million, and $4.6 million in 2015, 2014, and 2013, respectively, which are in “Realized investment gains, net.”
50
Table of Contents
Index to Financial Statements
Investments
We manage our investment portfolio to optimize the rate of return commensurate with sound and prudent asset selection and to maintain a well-diversified portfolio. Our investment operations are regulated primarily by the state insurance departments where the insurance subsidiaries are domiciled. Investment activities, including setting investment policies and defining acceptable risk levels, are subject to oversight by our Board of Directors, which is assisted by our Finance Committee and Management Risk Committee.
Our insurance and annuity products are primarily supported by investment-grade bonds, and to a lesser extent collateralized mortgage obligations and commercial mortgage loans. We purchase fixed maturity securities and designate them as either held-to-maturity or available-for-sale considering our estimated future cash flow needs.
We also monitor the composition of our fixed maturity securities classified as held-to-maturity and available-for-sale and adjust the mix within the portfolio as investments mature or new investments are purchased.
We invest in commercial mortgage loans when the yield and credit risk compare favorably with fixed maturity securities. Individual residential mortgage loans including sub-prime or Alt-A mortgage loans have not been and are not expected to be part of our investment portfolio. We purchase real estate and equity investments based on a risk and reward analysis where we believe there are opportunities for enhanced returns.
The following summarizes the carrying values of our invested assets (other than investments in unconsolidated affiliates) by asset class (in thousands, except percentages):
| December 31, 2015 | December 31, 2014 | |||||||||||||||
| Bonds held-to-maturity, at amortized cost |
$ | 7,609,420 | 38.6 | % | $ | 8,225,050 | 42.0 | % | ||||||||
| Bonds available-for-sale, at fair value |
5,483,916 | 27.8 | 4,921,807 | 25.2 | ||||||||||||
| Equity securities, at fair value |
1,514,979 | 7.7 | 1,516,978 | 7.8 | ||||||||||||
| Mortgage loans, net of allowance |
3,483,280 | 17.7 | 3,359,586 | 17.2 | ||||||||||||
| Policy loans |
407,491 | 2.1 | 405,979 | 2.1 | ||||||||||||
| Investment real estate, net of accumulated depreciation |
581,255 | 2.9 | 479,062 | 2.4 | ||||||||||||
| Short-term investments |
460,612 | 2.3 | 431,000 | 2.2 | ||||||||||||
| Other invested assets |
173,042 | 0.9 | 220,255 | 1.1 | ||||||||||||
|
|
|
|
|
|
|
|
|
|||||||||
| Total investments |
$ | 19,713,995 | 100.0 | % | $ | 19,559,717 | 100.0 | % | ||||||||
|
|
|
|
|
|
|
|
|
|||||||||
The increase in our total investments at December 31, 2015 compared to 2014 was primarily a result of the purchase of bonds available-for-sale and increased mortgage loan activity.
Bonds—We allocate most of our fixed maturity securities to support our insurance business. At December 31, 2015, our fixed maturity securities had an estimated fair value of $13.2 billion, which was $0.2 billion, or 1.6%, above amortized cost. At December 31, 2014, our fixed maturity securities had an estimated fair value of $13.6 billion, which was $0.7 billion, or 5.1%, above amortized cost. Fixed maturity securities’ estimated fair value, due in one year or less, decreased from $1.3 billion as of December 31, 2014 to $0.5 billion as of December 31, 2015, primarily as a result of maturities.
51
Table of Contents
Index to Financial Statements
The following table identifies the total bonds by credit quality rating, using both Standard & Poor’s and Moody’s ratings (in thousands, except percentages):
| December 31, 2015 | December 31, 2014 | |||||||||||||||||||||||
| Amortized | Estimated | % of Fair | Amortized | Estimated | % of Fair | |||||||||||||||||||
| Cost | Fair Value | Value | Cost | Fair Value | Value | |||||||||||||||||||
| AAA |
$ | 681,918 | $ | 720,175 | 5.4 | $ | 637,613 | $ | 676,728 | 5.0 | ||||||||||||||
| AA |
1,522,300 | 1,591,496 | 12.0 | 1,647,110 | 1,733,484 | 12.8 | ||||||||||||||||||
| A |
4,672,994 | 4,828,340 | 36.5 | 5,060,934 | 5,348,438 | 39.4 | ||||||||||||||||||
| BBB |
5,731,158 | 5,732,961 | 43.3 | 5,121,394 | 5,363,342 | 39.5 | ||||||||||||||||||
| BB and below |
428,881 | 366,497 | 2.8 | 452,715 | 452,728 | 3.3 | ||||||||||||||||||
|
|
|
|
|
|
|
|
|
|
|
|
|
|||||||||||||
| Total |
$ | 13,037,251 | $ | 13,239,469 | 100.0 | $ | 12,919,766 | $ | 13,574,720 | 100.0 | ||||||||||||||
|
|
|
|
|
|
|
|
|
|
|
|
|
|||||||||||||
Mortgage Loans— We invest in commercial mortgage loans that are diversified by property-type and geography. Generally, mortgage loans are secured by first liens on income-producing real estate with a loan-to-value ratio of up to 75%. Mortgage loans are carried at outstanding principal balances, adjusted for any unamortized premium or discount, deferred fees or expenses, and net of allowances. The weighted average coupon yield on the principal funded for mortgage loans was 4.4% and 4.9% at December 31, 2015 and 2014, respectively. It is likely that the weighted average yield on funded mortgage loans will decline as loans mature and new loans are originated with lower rates in the current interest rate environment.
Equity Securities—We invest in companies publicly traded on national U.S. stock exchanges; the cost and estimated fair value of the equity securities are as follows (in thousands):
| Cost | Gross Unrealized Gains |
Gross Unrealized (Losses) |
Fair Value | % of Fair Value |
||||||||||||||||
| December 31, 2015 |
||||||||||||||||||||
| Common stock |
$ | 794,839 | $ | 718,225 | $ | (22,035 | ) | $ | 1,491,029 | 98.4 | ||||||||||
| Preferred stock |
15,987 | 7,964 | (1 | ) | 23,950 | 1.6 | ||||||||||||||
|
|
|
|
|
|
|
|
|
|
|
|||||||||||
| Total |
$ | 810,826 | $ | 726,189 | $ | (22,036 | ) | $ | 1,514,979 | 100.0 | ||||||||||
|
|
|
|
|
|
|
|
|
|
|
|||||||||||
| December 31, 2014 |
||||||||||||||||||||
| Common stock |
$ | 719,651 | $ | 774,650 | $ | (7,176 | ) | $ | 1,487,125 | 98.0 | ||||||||||
| Preferred stock |
19,733 | 10,121 | (1 | ) | 29,853 | 2.0 | ||||||||||||||
|
|
|
|
|
|
|
|
|
|
|
|||||||||||
| Total |
$ | 739,384 | $ | 784,771 | $ | (7,177 | ) | $ | 1,516,978 | 100.0 | ||||||||||
|
|
|
|
|
|
|
|
|
|
|
|||||||||||
Investment Real Estate—We invest in commercial real estate where positive cash flows and/or appreciation in value is expected. Real estate may be owned directly by our insurance companies or non-insurance affiliates or indirectly in joint ventures with real estate developers or investors we determine share our perspective regarding risk and return relationships. The carrying value of real estate is stated at cost, less accumulated depreciation and valuation allowances, if any. Depreciation is provided over the estimated useful lives of the properties.
Short-Term Investments—Short-term investments are primarily commercial paper rated A2 or P2 or better by Standard & Poor’s and Moody’s, respectively. The amount fluctuates depending on our view of the desirability of investing in the available long-term investment opportunities and our liquidity needs, including mortgage investment-funding commitments.
Policy Loans—For certain life insurance products, policyholders may borrow funds using the policy’s cash value as collateral. The maximum amount of the policy loan depends upon the policy’s surrender value. As of December 31, 2015, we had $407.5 million in policy loans with a loan to surrender value of 61.3%, and at December 31, 2014, we had $406.0 million in policy loans with a loan to surrender value of 57.6%. Interest rates on policy loans primarily range from 3.0% to 12.0% per annum. Policy loans may be repaid at any time by the policyholder and have priority to any claims on the policy. If the policyholder fails to repay the policy loan, funds are withdrawn from the policy’s benefits.
52
Table of Contents
Index to Financial Statements
Net Investment Income and Net Realized Gains (Losses)
Net investment income decreased $98.0 million during 2015 primarily from decreased interest rates on bonds and a $61.2 million decrease in option income due to lower gains on the S&P index. Net investment income decreased $84.0 million during 2014 primarily from decreased interest rates on bonds and mortgage loans of $52.8 million, from decreased option income of $31.2 million due to smaller gains on the S&P 500 index and decreased other invested asset income of $3.9 million due to fewer joint venture dispositions.
Interest income on mortgage loans is accrued on the principal amount of the loan at the contractual interest rate. Accretion of discounts is recorded using the effective yield method. Interest income, accretion of discounts and prepayment fees are reported in net investment income. Interest is not accrued on loans generally more than 90 days past due or when the collection of interest is not considered probable. Loans in foreclosure are placed on non-accrual status. Interest received on non-accrual status mortgage loans is included in net investment income in the period received.
Net realized gains increased $39.3 million during 2015 compared to 2014 due to the sale of equity securities. Net realized gains decreased $76.1 million during 2014 compared to 2013 primarily as a result of very strong markets for the type and location of investment real estate sold in 2013. Other-than-temporary impairment on investment securities increased $21.3 million during 2015 compared to 2014 primarily relating to equity securities in the energy and utility sectors. Other-than-temporary impairment on investment securities increased $2.1 million during 2014 compared to 2013.
Net Unrealized Gains and Losses
The net unrealized gains on available-for-sale securities at December 31, 2015 and 2014 were $0.76 billion and $1.01 billion, respectively. Unrealized gains or losses on available-for-sale securities are recognized as other comprehensive income or loss which has no impact on earnings. The gross unrealized gains of available-for-sale securities decreased $137.9 million to $891.7 million during 2015, resulting from decreases in the value of bonds and equity securities. The gross unrealized losses of available-for-sale securities changed unfavorably by $106.5 million, going from $24.9 million at December 31, 2014 to $131.4 million at December 31, 2015. The gross unrealized gains of held-to-maturity securities decreased $170.8 million to $306.0 million and gross unrealized losses increased from $48.9 million in 2014 to $159.8 million in 2015.
The fair value of our investment securities is affected by various factors, including volatility of financial markets, changes in interest rates and fluctuations in credit spread. We have the ability and intent to hold those securities in unrealized loss positions until a market price recovery or maturity. Further, it is unlikely that we will be required to sell them prior to recovery, and recovery is expected in a reasonable period of time.
Liquidity
Our liquidity requirements have been and are expected to continue to be met by funds from operations, comprised of premiums received from our customers and investment income. The primary use of cash has been and is expected to continue to be payment of policyholder benefits and claims incurred. Current and expected patterns of claim frequency and severity may change from period to period but continue to be within historical norms. Management considers our current liquidity position to be sufficient to meet anticipated demands over the next twelve months. Our contractual obligations are not expected to have a significant negative impact to cash flow from operations.
53
Table of Contents
Index to Financial Statements
Changes in interest rates during 2015 and market expectations for potentially higher rates through 2016, although recently tempered due to economic uncertainty, may lead to an increase in the volume of annuity contracts, which may be partially offset by increases in surrenders. Freezing our defined benefit pension plans will lessen the impact of changes in interest rates on our contributions to these plans. Future contributions to our defined benefit plans are not expected to significantly impact cash flow and are expected to enhance overall funded status. No unusually large capital expenditures are expected in the next 12-24 months. We have paid dividends to stockholders for over 100 consecutive years and expect to continue this trend. There are no other known trends or uncertainties regarding product pricing, changes in product lines or rising costs that would have a significant impact to cash flows from operations.
Funds received as premium payments and deposits are generally invested in bonds and commercial mortgages. Funds are invested with the intent that income from the investments and proceeds from the maturities will meet our ongoing cash flow needs. We historically have not had to liquidate invested assets in order to cover cash flow needs. We believe our portfolio of highly liquid available-for-sale investment securities, including equity securities, is sufficient to meet future liquidity needs as necessary.
Our cash and cash equivalents and short-term investment position increased from $640.5 million at December 31, 2014 to $650.8 million at December 31, 2015. The increase relates to an increase in short term investments partially offset by a decrease in cash and cash equivalents as we look to minimize purchases of long term bonds beyond those needed to manage our longer term life and annuity related policyholder liabilities.
A downgrade or a potential downgrade in our financial strength ratings could result in a loss of business and could adversely affect our cash flow from operations.
Further information regarding additional sources or uses of cash is described in Note 19, Commitments and Contingencies, of the Notes to the Consolidated Financial Statements.
Capital Resources
Our capital resources are summarized below (in thousands):
| December 31, | ||||||||||||
| 2015 | 2014 | 2013 | ||||||||||
| (As Adjusted) | (As Adjusted) | |||||||||||
| American National stockholders’ equity, excluding accumulated other comprehensive income, net of tax (“AOCI”) |
$ | 4,099,662 | $ | 3,936,781 | $ | 3,774,153 | ||||||
| AOCI |
352,620 | 490,782 | 413,712 | |||||||||
|
|
|
|
|
|
|
|||||||
| Total American National stockholders’ equity |
$ | 4,452,282 | $ | 4,427,563 | $ | 4,187,865 | ||||||
|
|
|
|
|
|
|
|||||||
We have notes payable relating to borrowings by real estate joint ventures that we consolidate into our financial statements that are not part of our capital resources. The lenders for the notes payable have no recourse against us in the event of default by the joint ventures. Therefore, the liability we have for these notes payable is limited to our investment in the respective ventures, which totaled $34.7 million and $15.0 million at December 31, 2015 and 2014, respectively.
54
Table of Contents
Index to Financial Statements
The changes in our capital resources are summarized below (in thousands):
| December 31, | ||||||||||||||||||||||||
| 2015 | 2014 | |||||||||||||||||||||||
| Capital and Retained Earnings |
AOCI | Total | Capital and Retained Earnings |
AOCI | Total | |||||||||||||||||||
| Net income attributable to American National |
$ | 242,988 | $ | — | $ | 242,988 | $ | 245,335 | $ | — | $ | 245,335 | ||||||||||||
| Dividends to shareholders |
(84,446 | ) | — | (84,446 | ) | (82,805 | ) | — | (82,805 | ) | ||||||||||||||
| Increase (Decrease) in net unrealized gains |
— | (114,717 | ) | (114,717 | ) | — | 110,214 | 110,214 | ||||||||||||||||
| Defined benefit pension plan adjustment |
— | (21,815 | ) | (21,815 | ) | — | (32,190 | ) | (32,190 | ) | ||||||||||||||
| Foreign currency transaction and translation adjustment |
— | (1,630 | ) | (1,630 | ) | — | (954 | ) | (954 | ) | ||||||||||||||
| Other |
4,339 | — | 4,339 | 98 | — | 98 | ||||||||||||||||||
|
|
|
|
|
|
|
|
|
|
|
|
|
|||||||||||||
| Total |
$ | 162,881 | $ | (138,162 | ) | $ | 24,719 | $ | 162,628 | $ | 77,070 | $ | 239,698 | |||||||||||
|
|
|
|
|
|
|
|
|
|
|
|
|
|||||||||||||
Statutory Capital and Surplus and Risk-based Capital
Statutory capital and surplus is the capital of our insurance companies reported in accordance with accounting practices prescribed or permitted by the applicable state insurance departments. RBC is calculated using formulas applied to certain financial balances and activities that consider, among other things, investment risks related to the type and quality of investments, insurance risks associated with products and liabilities, interest rate risks and general business risks. Insurance companies that do not maintain capital and surplus at a level of at least 200% of the authorized control level RBC are required to take certain actions. At December 31, 2015 and December 31, 2014, American National Insurance Company’s statutory capital and surplus was $2,925,935,000 and $2,879,154,000, respectively. American National Insurance Company and each of its insurance subsidiaries had statutory capital and surplus at December 31, 2015 and December 31, 2014, substantially above 200% of the authorized control level.
The achievement of long-term growth will require growth in American National Insurance Company’s and our insurance subsidiaries’ statutory capital and surplus. Our subsidiaries may obtain additional statutory capital through various sources, such as retained statutory earnings or equity contributions from us.
Contractual Obligations
The following summarizes our contractual obligations as of December 31, 2015 (in thousands):
| Payments Due by Period | ||||||||||||||||||||
| Less than | More than | |||||||||||||||||||
| Total | 1 year | 1-3 years | 3-5 years | 5 years | ||||||||||||||||
| Life insurance obligations(1) |
$ | 5,373,949 | $ | (9,262 | ) | $ | 110,275 | $ | 278,938 | $ | 4,993,998 | |||||||||
| Annuity obligations(1) |
12,656,206 | 1,374,313 | 3,191,706 | 2,455,553 | 5,634,634 | |||||||||||||||
| Property and casualty insurance obligations(2) |
873,737 | 408,311 | 311,293 | 105,545 | 48,588 | |||||||||||||||
| Accident and health insurance obligations(3) |
269,594 | 155,171 | 34,651 | 18,095 | 61,677 | |||||||||||||||
| Purchase obligations |
||||||||||||||||||||
| Commitments to purchase and fund investments |
117,773 | 81,702 | 36,071 | — | — | |||||||||||||||
| Mortgage loan commitments |
586,925 | 410,379 | 176,546 | — | — | |||||||||||||||
| Operating leases |
4,932 | 1,706 | 2,199 | 597 | 430 | |||||||||||||||
| Defined benefit pension plans(4) |
114,704 | 16,907 | 21,654 | 21,229 | 54,914 | |||||||||||||||
| Notes payable(5) |
128,436 | 31,410 | 800 | — | 96,226 | |||||||||||||||
|
|
|
|
|
|
|
|
|
|
|
|||||||||||
| Total |
$ | 20,126,256 | $ | 2,470,637 | $ | 3,885,195 | $ | 2,879,957 | $ | 10,890,467 | ||||||||||
|
|
|
|
|
|
|
|
|
|
|
|||||||||||
55
Table of Contents
Index to Financial Statements
| (1) | Life and annuity obligations include undiscounted estimated claim, benefit, surrender and commission obligations offset by expected future premiums and deposits on in-force insurance policies and annuity contracts. All amounts are gross of any reinsurance recoverable. Estimated claim, benefit and surrender obligations are based on mortality and lapse assumptions comparable with historical experience. Estimated payments on interest-sensitive life and annuity obligations include interest credited to those products. The interest crediting rates are derived by deducting current product spreads from a constant investment yield. As a result, the estimated obligations for insurance liabilities included in the table exceed the liabilities recorded in the liability for future policy benefits and policy and contract claims. Due to the significance of the assumptions used, the amounts presented could materially differ from actual payments. Separate account obligations have not been included in the table since those obligations are not part of the general account obligations and will be funded by cash flows from separate account assets. The general account obligations for insurance liabilities will be funded by cash flows from general account assets and future premiums and deposits. Participating policyholder dividends payable consists of liabilities related to dividends payable in the following calendar year and are presented in the less than one-year category. All estimated cash payments are net of estimated future premiums on policies currently in-force net of future policyholder dividends payable. The participating policyholders’ share obligation included in other policyholder funds and the timing and amount of the ultimate participating policyholder obligation is subject to significant uncertainty and the amount of the participating policyholder obligation is based upon a long-term projection of the performance of the participating policy block. |
| (2) | Includes case reserves for reported claims and reserves for IBNR with the timing of future payments based on our historical payment patterns. The timing of these payments may vary significantly from the pattern shown in the preceding table. The ultimate losses may vary materially from the recorded amounts, which are our best estimates. |
| (3) | Reflects estimated future claim payments for claims incurred based on mortality and morbidity assumptions that are consistent with historical claims experience. These are not discounted with interest and will exceed the liabilities recorded in reserves for future claim payment, which are discounted with interest. Due to the significance of the assumptions used, the amounts presented could materially differ from actual payments. |
| (4) | Estimated payments through continuing operations for benefit obligations of the non-qualified defined benefit pension plan. A liability has been established for the full amount of benefits accrued. |
| (5) | The estimated payments due by period for notes payable reflect the contractual maturities of principal for amounts borrowed by real estate joint ventures and collateralized by real-estate owned by the respective entity. American National’s liability is limited to its investment in the respective joint venture. See Note 6, Investment Real Estate, of the Notes to the Consolidated Financial Statements for additional details. |
Off-Balance Sheet Arrangements
We have off-balance sheet arrangements relating to a third-party marketing operation’s bank loans as discussed in Note 19, Commitments and Contingencies, of the Notes to the Consolidated Financial Statements. We could be exposed to a liability for these loans, which are supported by the cash value of the underlying insurance contracts. The cash value of the life insurance policies is designed to always equal or exceed the balance of the loans. Accordingly, management does not foresee any loss related to these arrangements.
Related-Party Transactions
We have various agency, consulting and service arrangements with individuals and entities considered to be related parties. Each of these arrangements has been reviewed and approved by our Audit Committee, which retains final decision-making authority for these transactions. The amounts involved, both individually and in the aggregate, with these arrangements are not material to any segment or to our overall operations. For additional details see Note 20, Related Party Transactions, of the Notes to the Consolidated Financial Statements.
56
Table of Contents
Index to Financial Statements
| ITEM 7A. | QUANTITATIVE AND QUALITATIVE DISCLOSURES ABOUT MARKET RISK |
Our investments and some of our products are subject to market risks associated with changes in interest rates, credit spreads, issuer defaults and equity prices or market indices. Adverse changes due to these market risks may occur due to changes in market liquidity or to changes in market perceptions of credit worthiness or risk tolerance among other factors.
We emphasize prudent risk management throughout all our operations. Our enterprise risk management procedures help us to identify, prioritize and manage various risks including market risk. Under the leadership of our Board of Directors and Corporate Risk Officer, we have instituted a framework based on the principles of enterprise risk management to provide reasonable assurance regarding the achievement of our strategic objectives. Related activities include:
| • | Identifying evolving and potential risks and events that may affect us; |
| • | managing risks within our risk profile; |
| • | appropriate escalation of risks and disclosure of any risk limit breaches within the enterprise, along with the correction method if appropriate; |
| • | tracking actual risk levels against predetermined thresholds; and |
| • | monitoring of capital adequacy. |
We expect ongoing enterprise risk management efforts will expand the management tools used to ensure an efficient allocation of capital and enhance the measurement of possible diversification benefits across business segments and risk classes.
A key component of our risk management program is our ALM Committee. The ALM Committee monitors the level of our risk exposure in managing our assets and liabilities to attain the desired risk-return profile for our diverse mix of assets and liabilities and their resultant cash flows. This process includes maintaining adequate reserves, monitoring claims and surrender experience, managing interest rate spreads, evaluation of alternate investment strategies and protecting against disintermediation risk for life insurance and annuity products.
As a part of the ALM process, we have asset portfolios for each major line of business, which represent the investment strategies used to fund liabilities within acceptable levels of risk. We monitor these strategies through regular review of portfolio metrics, such as effective duration, yield curve sensitivity, convexity, liquidity, asset sector concentration and credit quality. In executing these ALM strategies, we regularly reevaluate the estimates used in determining the approximate amounts and timing of payments to or on behalf of policyholders for insurance liabilities. Many of these estimates are inherently subjective and could impact our ability to achieve our ALM goals and objectives. Our Finance Committee also reviews the risks associated with evaluation of alternate investment strategies and the specific investments made to support our business and for consistency with our overall investment strategy.
Interest Rate Risk
Interest rate risk is the risk that the value of our interest sensitive assets or liabilities will change with changes in market interest rates. The fair market value of fixed maturity securities is inversely related to changes in market interest rates. As interest rates fall, the cash flow from the interest coupon and dividend streams of existing fixed rate investments become more valuable and thus, market values of fixed maturity securities rise. As interest rates rise, the reverse occurs and the market value of fixed maturity securities falls.
57
Table of Contents
Index to Financial Statements
The carrying values of our investment in fixed maturity securities, which comprise 66.4% of our portfolio, are summarized below (in thousands):
| December 31, | ||||||||||||||||
| 2015 | 2014 | |||||||||||||||
| Amount | Percent | Amount | Percent | |||||||||||||
| Bonds held-to-maturity |
$ | 7,609,420 | 58.1 | % | $ | 8,225,050 | 62.6 | % | ||||||||
| Bonds available-for-sale |
5,483,916 | 41.9 | 4,921,807 | 37.4 | ||||||||||||
| Net unrealized gains on available-for-sale bonds |
56,085 | 1.0 | 227,091 | 4.6 | ||||||||||||
The decrease in the unrealized gains on available-for-sale bonds was primarily the result of an increase in unrealized losses on corporate debt securities. Information regarding our unrealized gains or losses is disclosed in Note 4, Investments in Securities, of the Notes to the Consolidated Financial Statements. Our exposure to cash flow changes is discussed further in the Liquidity and Capital Resources section of the MD&A.
Our mortgage loans also have interest rate risk. As of December 31, 2015, these mortgage loans have fixed rates ranging from 4.0% to 9.0%. Most of the mortgage loan contracts require periodic payments of both principal and interest, and have amortization periods of three to 30 years. Many of our mortgage loans contain prepayment restrictions or fees or both that reduce the risk of payment before maturity or compensate us for all or a portion of the investment income lost through early payment of the loan principal.
Rising interest rates can cause increases in policy loans associated with life insurance policies and surrenders relating to life insurance or annuities. Policyholders may move their assets into new products offering higher rates if there were sudden or significant changes in interest rates. We may have to sell assets earlier than anticipated to pay for these withdrawals. Our life insurance and annuity product designs reduce the financial impact of early surrenders through the use of restriction on withdrawal, surrender charges and market value adjustment features. ALM guidelines, including duration targets and asset allocation tolerances, help ensure this risk is managed within the constraints of established criteria. Consistent monitoring of and periodic changes to our product pricing help us to better match the duration of assets and liabilities.
Falling interest rates can have an adverse impact on our asset accumulation investment products, such as our fixed deferred annuity business. We aim to manage interest margins, which are the differences between yields on investments supporting our liabilities and amounts credited to policyholder account balances. As investment portfolio yields decline, we can reduce crediting rates on products, to a limit defined by contractual minimum guarantees. Due to these contractual minimums, declines in interest rates can ultimately impact the profitability of this business. As of December 31, 2015, of our $8.9 billion in deferred annuities, $90.6 million have guaranteed minimum rates greater than or equal to 3.5% with no guarantees greater than 4.5%.
The profitability of some of our products could be adversely affected by declining or persistently low interest rates. Assuming investment yields remain at 2015 levels, the impact of investing in that lower interest rate environment would have a minimal impact in 2016 and could reduce profit by $0.8 million in 2017 and $4.5 million in 2018. In projecting this impact, we modeled projected crediting rates, considering interest spread targets and crediting rate floors.
Interest Rate sensitivity analysis: The table below shows the estimated change in pre-tax market values of our investments in fixed maturity securities caused by instantaneous, one time parallel shifts in the corresponding year-end U.S. Treasury yield curves of +/- 100bps and +/- 50bps (in thousands):
| Increase (Decrease) in Market Value Given an Interest rate | ||||||||||||||||
| Increase (Decrease) of X Basis Points | ||||||||||||||||
| (100) | (50) | 50 | 100 | |||||||||||||
| December 31, 2015 |
$ | 652,006 | $ | 321,689 | $ | (315,117 | ) | $ | (622,712 | ) | ||||||
| December 31, 2014 |
$ | 660,798 | $ | 326,441 | $ | (317,224 | ) | $ | (626,963 | ) | ||||||
58
Table of Contents
Index to Financial Statements
These calculations hold all other variables influencing the values of fixed maturity securities constant and would not fully reflect any prepayment to the portfolio, changes in corporate spreads or non-parallel changes in interest rates for different maturities or credit quality. Actual results may differ materially from these amounts due to the assumptions and estimates used in calculating the scenarios.
Credit Risk
We are exposed to credit risk, which is the uncertainty that a counterparty will honor its obligation under the terms of a security, loan or contract including reinsurance agreements. To help manage credit risk, we have an Investment Plan approved by our Board of Directors. This plan provides issuer and geographic concentration limits, investment size limits and other applicable parameters such as mortgage loan-to-value guidelines. Investment activity, including the setting of investment policies and defining acceptable risk levels, is subject to review by our Finance Committee and Management Risk Committee.
We are also exposed to the risk created by changes in market prices and cash flows associated with fluctuations in the credit spread or the market’s perception of the relative risk and reward to hold fixed maturity securities of borrowers with different credit characteristics or credit ratings. Credit spread widening will reduce the fair value of our existing investment portfolio and will increase investment income on new purchases. Credit spread tightening would have the opposite effect. Information regarding the credit quality of our fixed maturity securities can be found in the Investments section of the MD&A.
We are subject to credit risk associated with our reinsurance agreements. While we believe our reinsurers are reputable and have the financial strength to meet their obligations to us, reinsurance does not eliminate our liability to pay our policyholders, and we remain primarily liable to our policyholders for the risks we insure. We regularly monitor the financial strength of our reinsurers and the levels of concentration to individual reinsurers to verify they meet established thresholds.
Equity Risk
Equity risk is the risk that we will incur realized or unrealized losses due to changes in the overall equity investment markets or specific investments within our portfolio. At December 31, 2015, we held approximately $1.5 billion of equity investments, which are subject to equity risk. Our exposure to the equity markets is managed by sector and individual security and is intended to track the Standard & Poor’s 500 Index (“S&P 500”) with minor variations. We mitigate our equity risk by diversification of the investment portfolio.
We also have equity risk associated with the equity-indexed life and annuity products we market. We have entered into derivative transactions, primarily over-the-counter equity call options, to hedge our exposure to equity-index changes.
Changes in Accounting Principles
Refer to Note 3, Recently Issued Accounting Pronouncements, of the Notes to the Consolidated Financial Statements for a discussion of recently issued accounting pronouncements not yet adopted.
59
Table of Contents
Index to Financial Statements
| Item 8. | FINANCIAL STATEMENTS AND SUPPLEMENTARY DATA |
Index to Annual Consolidated Financial Statements
60
Table of Contents
Index to Financial Statements
Report of Independent Registered Public Accounting Firm
The Board of Directors and Stockholders
American National Insurance Company:
We have audited the accompanying consolidated statements of financial position of American National Insurance Company and subsidiaries (the Company) as of December 31, 2015 and 2014, and the related consolidated statements of operations, comprehensive income, changes in stockholders’ equity, and cash flows for each of the years in the three year period ended December 31, 2015. In connection with our audits of the consolidated financial statements, we also have audited financial statement schedules I to V. These consolidated financial statements and financial statements schedules are the responsibility of the Company’s management. Our responsibility is to express an opinion on these consolidated financial statements and financial statement schedules based on our audits.
We conducted our audits in accordance with the standards of the Public Company Accounting Oversight Board (United States). Those standards require that we plan and perform the audit to obtain reasonable assurance about whether the financial statements are free of material misstatement. An audit includes examining, on a test basis, evidence supporting the amounts and disclosures in the financial statements. An audit also includes assessing the accounting principles used and significant estimates made by management, as well as evaluating the overall financial statement presentation. We believe that our audits provide a reasonable basis for our opinion.
In our opinion, the consolidated financial statements referred to above present fairly, in all material respects, the financial position of American National Insurance Company and subsidiaries as of December 31, 2015 and 2014, and the results of their operations and their cash flows for each of the years in the three year period ended December 31, 2015, in conformity with U.S. generally accepted accounting principles. Also in our opinion, the related financial statement schedules, when considered in relation to the basic consolidated financial statements taken as a whole, present fairly, in all material respects, the information set forth therein.
We also have audited, in accordance with the standards of the Public Company Accounting Oversight Board (United States), the Company’s internal control over financial reporting as of December 31, 2015, based on criteria established in Internal Control – Integrated Framework (2013) issued by the Committee of Sponsoring Organizations of the Treadway Commission (COSO), and our report dated February 29, 2016 expressed an unqualified opinion on the effectiveness of the Company’s internal control over financial reporting.
/s/ KPMG LLP
Houston, Texas
February 29, 2016
61
Table of Contents
Index to Financial Statements
Report of Independent Registered Public Accounting Firm
The Board of Directors and Stockholders
American National Insurance Company:
We have audited American National Insurance Company’s (the Company) internal control over financial reporting as of December 31, 2015, based on criteria established in Internal Control – Integrated Framework (2013) issued by the Committee of Sponsoring Organizations of the Treadway Commission (COSO). The Company’s management is responsible for maintaining effective internal control over financial reporting and for its assessment of the effectiveness of internal control over financial reporting, included in the accompanying Managements’ Annual Report on Internal Control over Financial Reporting in Item 9A. Our responsibility is to express an opinion on the Company’s internal control over financial reporting based on our audit.
We conducted our audit in accordance with the standards of the Public Company Accounting Oversight Board (United States). Those standards require that we plan and perform the audit to obtain reasonable assurance about whether effective internal control over financial reporting was maintained in all material respects. Our audit included obtaining an understanding of internal control over financial reporting, assessing the risk that a material weakness exists, and testing and evaluating the design and operating effectiveness of internal control based on the assessed risk. Our audit also included performing such other procedures as we considered necessary in the circumstances. We believe that our audit provides a reasonable basis for our opinion.
A company’s internal control over financial reporting is a process designed to provide reasonable assurance regarding the reliability of financial reporting and the preparation of financial statements for external purposes in accordance with generally accepted accounting principles. A company’s internal control over financial reporting includes those policies and procedures that (1) pertain to the maintenance of records that, in reasonable detail, accurately and fairly reflect the transactions and dispositions of the assets of the company; (2) provide reasonable assurance that transactions are recorded as necessary to permit preparation of financial statements in accordance with generally accepted accounting principles, and that receipts and expenditures of the company are being made only in accordance with authorizations of management and directors of the company; and (3) provide reasonable assurance regarding prevention or timely detection of unauthorized acquisition, use, or disposition of the company’s assets that could have a material effect on the financial statements.
Because of its inherent limitations, internal control over financial reporting may not prevent or detect misstatements. Also, projections of any evaluation of effectiveness to future periods are subject to the risk that controls may become inadequate because of changes in conditions, or that the degree of compliance with the policies or procedures may deteriorate.
In our opinion, American National Insurance Company maintained, in all material respects, effective internal control over financial reporting as of December 31, 2015, based on criteria established in Internal Control – Integrated Framework (2013) issued by COSO.
We also have audited, in accordance with the standards of the Public Company Accounting Oversight Board (United States), the consolidated statements of financial position of American National Insurance Company and subsidiaries as of December 31, 2015 and 2014, and the related consolidated statements of operations, comprehensive income, changes in stockholders’ equity, and cash flows for each of the years in the three-year period ended December 31, 2015, and the related financial statement schedules I-V, and our report dated February 29, 2016 expressed an unqualified opinion on those consolidated financial statements.
/s/ KPMG LLP
Houston, Texas
February 29, 2016
62
Table of Contents
Index to Financial Statements
AMERICAN NATIONAL INSURANCE COMPANY
CONSOLIDATED STATEMENTS OF FINANCIAL POSITION
(In thousands, except share data)
| December 31, | ||||||||
| 2015 | 2014 | |||||||
| (As Adjusted) | ||||||||
| ASSETS |
||||||||
| Fixed maturity, bonds held-to-maturity, at amortized cost (Fair value $7,755,553 and $8,652,913) |
$ | 7,609,420 | $ | 8,225,050 | ||||
| Fixed maturity, bonds available-for-sale, at fair value (Amortized cost $5,427,831 and $4,694,716) |
5,483,916 | 4,921,807 | ||||||
| Equity securities, at fair value (Cost $810,826 and $739,384) |
1,514,979 | 1,516,978 | ||||||
| Mortgage loans on real estate, net of allowance |
3,483,280 | 3,359,586 | ||||||
| Policy loans |
407,491 | 405,979 | ||||||
| Investment real estate, net of accumulated depreciation of $212,139 and $193,611 |
581,255 | 479,062 | ||||||
| Short-term investments |
460,612 | 431,000 | ||||||
| Other invested assets |
173,042 | 220,255 | ||||||
|
|
|
|
|
|||||
| Total investments |
19,713,995 | 19,559,717 | ||||||
|
|
|
|
|
|||||
| Cash and cash equivalents |
190,237 | 209,455 | ||||||
| Investments in unconsolidated affiliates |
379,348 | 311,779 | ||||||
| Accrued investment income |
177,474 | 185,943 | ||||||
| Reinsurance recoverables |
413,881 | 428,654 | ||||||
| Prepaid reinsurance premiums |
77,907 | 56,019 | ||||||
| Premiums due and other receivables |
285,446 | 280,587 | ||||||
| Deferred policy acquisition costs |
1,324,669 | 1,253,544 | ||||||
| Property and equipment, net |
120,680 | 110,794 | ||||||
| Current tax receivable |
4,091 | 8,669 | ||||||
| Other assets |
140,788 | 137,856 | ||||||
| Separate account assets |
918,446 | 1,001,515 | ||||||
|
|
|
|
|
|||||
| Total assets |
$ | 23,746,962 | $ | 23,544,532 | ||||
|
|
|
|
|
|||||
| LIABILITIES |
||||||||
| Future policy benefits |
||||||||
| Life |
$ | 2,853,962 | $ | 2,770,232 | ||||
| Annuity |
1,113,057 | 1,006,748 | ||||||
| Accident and health |
65,034 | 58,364 | ||||||
| Policyholders’ account balances |
10,829,173 | 10,781,285 | ||||||
| Policy and contract claims |
1,280,011 | 1,297,708 | ||||||
| Unearned premium reserve |
812,977 | 755,051 | ||||||
| Other policyholder funds |
305,836 | 291,775 | ||||||
| Liability for retirement benefits |
207,635 | 195,712 | ||||||
| Notes payable |
128,436 | 108,177 | ||||||
| Deferred tax liabilities, net |
219,295 | 287,175 | ||||||
| Other liabilities |
550,629 | 550,843 | ||||||
| Separate account liabilities |
918,446 | 1,001,515 | ||||||
|
|
|
|
|
|||||
| Total liabilities |
19,284,491 | 19,104,585 | ||||||
|
|
|
|
|
|||||
| STOCKHOLDERS’ EQUITY |
||||||||
| Common stock, $1.00 par value, - Authorized 50,000,000, Issued 30,832,449 and 30,832,449, Outstanding 26,894,456 and 26,871,942 shares |
30,832 | 30,832 | ||||||
| Additional paid-in capital |
13,689 | 9,248 | ||||||
| Accumulated other comprehensive income |
352,620 | 490,782 | ||||||
| Retained earnings |
4,157,184 | 3,998,642 | ||||||
| Treasury stock, at cost |
(102,043 | ) | (101,941 | ) | ||||
|
|
|
|
|
|||||
| Total American National stockholders’ equity |
4,452,282 | 4,427,563 | ||||||
| Noncontrolling interest |
10,189 | 12,384 | ||||||
|
|
|
|
|
|||||
| Total stockholders’ equity |
4,462,471 | 4,439,947 | ||||||
|
|
|
|
|
|||||
| Total liabilities and stockholders’ equity |
$ | 23,746,962 | $ | 23,544,532 | ||||
|
|
|
|
|
|||||
See accompanying notes to the consolidated financial statements.
63
Table of Contents
Index to Financial Statements
AMERICAN NATIONAL INSURANCE COMPANY
CONSOLIDATED STATEMENTS OF OPERATIONS
(In thousands, except share and per share data)
| Years ended December 31, | ||||||||||||
| 2015 | 2014 | 2013 | ||||||||||
| (As Adjusted) | (As Adjusted) | |||||||||||
| PREMIUMS AND OTHER REVENUE |
||||||||||||
| Premiums |
||||||||||||
| Life |
$ | 305,350 | $ | 307,771 | $ | 293,173 | ||||||
| Annuity |
183,125 | 190,357 | 155,162 | |||||||||
| Accident and health |
196,777 | 216,868 | 212,931 | |||||||||
| Property and casualty |
1,153,267 | 1,100,975 | 1,074,260 | |||||||||
| Other policy revenues |
250,265 | 224,254 | 210,224 | |||||||||
| Net investment income |
834,831 | 932,858 | 1,016,810 | |||||||||
| Net realized investment gains |
87,385 | 48,062 | 124,144 | |||||||||
| Other-than-temporary impairments |
(27,942 | ) | (6,640 | ) | (4,591 | ) | ||||||
| Other income |
34,397 | 36,085 | 37,097 | |||||||||
|
|
|
|
|
|
|
|||||||
| Total premiums and other revenues |
3,017,455 | 3,050,590 | 3,119,210 | |||||||||
|
|
|
|
|
|
|
|||||||
| BENEFITS, LOSSES AND EXPENSES |
||||||||||||
| Policyholder benefits |
||||||||||||
| Life |
386,785 | 351,271 | 345,566 | |||||||||
| Annuity |
230,221 | 234,173 | 193,840 | |||||||||
| Claims incurred |
||||||||||||
| Accident and health |
146,805 | 144,799 | 139,762 | |||||||||
| Property and casualty |
776,562 | 745,540 | 746,636 | |||||||||
| Interest credited to policyholders’ account balances |
293,464 | 353,492 | 426,102 | |||||||||
| Commissions for acquiring and servicing policies |
425,338 | 397,126 | 371,948 | |||||||||
| Other operating expenses |
501,377 | 485,865 | 503,051 | |||||||||
| Change in deferred policy acquisition costs |
(11,785 | ) | 9,578 | 29,835 | ||||||||
|
|
|
|
|
|
|
|||||||
| Total benefits, losses and expenses |
2,748,767 | 2,721,844 | 2,756,740 | |||||||||
|
|
|
|
|
|
|
|||||||
| Income before federal income tax and equity in earnings of unconsolidated affiliates |
268,688 | 328,746 | 362,470 | |||||||||
|
|
|
|
|
|
|
|||||||
| Less: Provision for federal income taxes |
||||||||||||
| Current |
93,979 | 77,547 | 73,798 | |||||||||
| Deferred |
9,741 | 19,067 | 34,277 | |||||||||
|
|
|
|
|
|
|
|||||||
| Total provision for federal income taxes |
103,720 | 96,614 | 108,075 | |||||||||
| Equity in earnings of unconsolidated affiliates |
77,408 | 14,694 | 16,019 | |||||||||
|
|
|
|
|
|
|
|||||||
| Net income |
242,376 | 246,826 | 270,414 | |||||||||
| Less: Net income (loss) attributable to noncontrolling interest, net of tax |
(612 | ) | 1,491 | 3,933 | ||||||||
|
|
|
|
|
|
|
|||||||
| Net income attributable to American National |
$ | 242,988 | $ | 245,335 | $ | 266,481 | ||||||
|
|
|
|
|
|
|
|||||||
| Amounts available to American National common stockholders |
||||||||||||
| Earnings per share |
||||||||||||
| Basic |
$ | 9.04 | $ | 9.15 | $ | 9.95 | ||||||
| Diluted |
9.02 | 9.11 | 9.90 | |||||||||
| Cash dividends to common stockholders |
3.14 | 3.08 | 3.08 | |||||||||
| Weighted average common shares outstanding |
26,876,522 | 26,802,841 | 26,791,900 | |||||||||
| Weighted average common shares outstanding and dilutive potential common shares |
26,950,066 | 26,918,670 | 26,914,591 | |||||||||
See accompanying notes to the consolidated financial statements.
64
Table of Contents
Index to Financial Statements
AMERICAN NATIONAL INSURANCE COMPANY
CONSOLIDATED STATEMENTS OF COMPREHENSIVE INCOME
(In thousands)
See accompanying notes to the consolidated financial statements.
65
Table of Contents
Index to Financial Statements
AMERICAN NATIONAL INSURANCE COMPANY
CONSOLIDATED STATEMENTS OF CASH FLOWS
(In thousands)
| Years ended December 31, | ||||||||||||
| 2015 | 2014 | 2013 | ||||||||||
| (As Adjusted) | (As Adjusted) | |||||||||||
| OPERATING ACTIVITIES |
||||||||||||
| Net income |
$ | 242,376 | $ | 246,826 | $ | 270,414 | ||||||
| Adjustments to reconcile net income to net cash provided by operating activities |
||||||||||||
| Net realized investment gains |
(87,385 | ) | (48,062 | ) | (124,144 | ) | ||||||
| Other-than-temporary impairments |
27,942 | 6,640 | 4,591 | |||||||||
| Amortization of premiums, discounts and loan origination fees |
2,701 | 7,294 | 6,052 | |||||||||
| Net capitalized interest on policy loans and mortgage loans |
(31,360 | ) | (32,122 | ) | (28,060 | ) | ||||||
| Depreciation |
40,573 | 38,414 | 31,176 | |||||||||
| Interest credited to policyholders’ account balances |
293,464 | 353,492 | 426,102 | |||||||||
| Charges to policyholders’ account balances |
(250,265 | ) | (224,254 | ) | (210,224 | ) | ||||||
| Deferred federal income tax expense |
9,741 | 19,067 | 34,277 | |||||||||
| Equity in earnings of unconsolidated affiliates |
(77,408 | ) | (14,694 | ) | (16,019 | ) | ||||||
| Distributions from equity method investments |
819 | 5,186 | 20,718 | |||||||||
| Changes in |
||||||||||||
| Policyholder liabilities |
259,645 | 200,718 | 96,435 | |||||||||
| Deferred policy acquisition costs |
(11,785 | ) | 9,578 | 29,835 | ||||||||
| Reinsurance recoverables |
14,773 | (13,911 | ) | 4,000 | ||||||||
| Premiums due and other receivables |
(5,512 | ) | (1,184 | ) | 3,517 | |||||||
| Prepaid reinsurance premiums |
(21,887 | ) | 1,850 | (1,043 | ) | |||||||
| Accrued investment income |
8,470 | 8,887 | 12,484 | |||||||||
| Current tax receivable/payable |
4,578 | 9,838 | (3,929 | ) | ||||||||
| Liability for retirement benefits |
(31,435 | ) | (19,084 | ) | 8,763 | |||||||
| Other, net |
(8,587 | ) | 2,306 | (19,837 | ) | |||||||
|
|
|
|
|
|
|
|||||||
| Net cash provided by operating activities |
379,458 | 556,785 | 545,108 | |||||||||
|
|
|
|
|
|
|
|||||||
| INVESTING ACTIVITIES |
||||||||||||
| Proceeds from sale/maturity/prepayment of |
||||||||||||
| Held-to-maturity securities |
1,150,650 | 661,125 | 1,619,721 | |||||||||
| Available-for-sale securities |
574,391 | 910,691 | 914,813 | |||||||||
| Investment real estate |
19,788 | 63,030 | 84,371 | |||||||||
| Mortgage loans |
836,443 | 606,738 | 758,677 | |||||||||
| Policy loans |
56,773 | 55,542 | 58,460 | |||||||||
| Other invested assets |
71,564 | 40,882 | 13,975 | |||||||||
| Disposals of property and equipment |
4,681 | 11,269 | 553 | |||||||||
| Distributions from unconsolidated affiliates |
130,742 | 41,779 | 25,055 | |||||||||
| Payment for the purchase/origination of |
||||||||||||
| Held-to-maturity securities |
(525,950 | ) | (439,422 | ) | (1,087,447 | ) | ||||||
| Available-for-sale securities |
(1,343,795 | ) | (1,044,602 | ) | (1,057,004 | ) | ||||||
| Investment real estate |
(106,255 | ) | (51,699 | ) | (45,345 | ) | ||||||
| Mortgage loans |
(962,267 | ) | (668,073 | ) | (914,740 | ) | ||||||
| Policy loans |
(26,459 | ) | (29,093 | ) | (26,623 | ) | ||||||
| Other invested assets |
(38,101 | ) | (27,705 | ) | (18,443 | ) | ||||||
| Additions to property and equipment |
(32,596 | ) | (31,951 | ) | (25,583 | ) | ||||||
| Contributions to unconsolidated affiliates |
(132,004 | ) | (12,560 | ) | (122,512 | ) | ||||||
| Change in short-term investments |
(29,612 | ) | 64,386 | (182,300 | ) | |||||||
| Other, net |
14,412 | 4,331 | (1,336 | ) | ||||||||
|
|
|
|
|
|
|
|||||||
| Net cash provided by (used in) investing activities |
(337,595 | ) | 154,668 | (5,708 | ) | |||||||
|
|
|
|
|
|
|
|||||||
| FINANCING ACTIVITIES |
||||||||||||
| Policyholders’ account deposits |
1,405,350 | 1,002,420 | 895,227 | |||||||||
| Policyholders’ account withdrawals |
(1,400,661 | ) | (1,532,023 | ) | (1,484,656 | ) | ||||||
| Change in notes payable |
20,259 | (5,672 | ) | (49,535 | ) | |||||||
| Dividends to stockholders |
(84,446 | ) | (82,805 | ) | (82,831 | ) | ||||||
| Payments to noncontrolling interest |
(1,583 | ) | (1,864 | ) | (2,667 | ) | ||||||
|
|
|
|
|
|
|
|||||||
| Net cash used in financing activities |
(61,081 | ) | (619,944 | ) | (724,462 | ) | ||||||
|
|
|
|
|
|
|
|||||||
| NET INCREASE (DECREASE) IN CASH AND CASH EQUIVALENTS |
(19,218 | ) | 91,509 | (185,062 | ) | |||||||
| Beginning of the period |
209,455 | 117,946 | 303,008 | |||||||||
|
|
|
|
|
|
|
|||||||
| End of the period |
$ | 190,237 | $ | 209,455 | $ | 117,946 | ||||||
|
|
|
|
|
|
|
|||||||
See accompanying notes to the consolidated financial statements.
66
Table of Contents
Index to Financial Statements
NOTES TO THE CONSOLIDATED FINANCIAL STATEMENTS
Note 1 – Nature of Operations
American National Insurance Company and its consolidated subsidiaries (collectively “American National” or “the Company”) offer a broad spectrum of insurance products, including individual and group life insurance, annuities, health insurance, and property and casualty insurance. Business is conducted in all 50 states, the District of Columbia and Puerto Rico.
Note 2 – Summary of Significant Accounting Policies and Practices
The consolidated financial statements and notes thereto have been prepared in conformity with U.S. generally accepted accounting principles (“GAAP”) and are reported in U.S. currency. American National consolidates entities that are wholly-owned and those in which American National owns less than 100% but controls, as well as variable interest entities in which American National is the primary beneficiary. Intercompany balances and transactions with consolidated entities have been eliminated. Investments in unconsolidated affiliates are accounted for using the equity method of accounting. Certain amounts in prior years have been reclassified to conform to current year presentation.
The preparation of the consolidated financial statements in conformity with GAAP requires the use of estimates and assumptions that affect the reported consolidated financial statement balances. Actual results could differ from those estimates.
Investments
Investment securities – Bonds classified as held-to-maturity are carried at amortized cost. Bonds classified as available-for-sale are carried at fair value. Equity securities are classified as available-for-sale and carried at fair value. After-tax net unrealized gains or losses on available-for-sale securities are reflected in stockholders’ equity as a component of “Accumulated Other Comprehensive Income” (“AOCI”).
Mortgage loans on real estate are stated at unpaid principal balance, adjusted for any unamortized discount, deferred expenses, and allowances. Accretion of discounts is recorded using the effective yield method. Interest income, prepayment fees and accretion of discounts and origination fees are reported in “Net investment income” in the consolidated statements of operations. Interest income earned on impaired and non-impaired loans is accrued on the principal amount of the loan based on contractual interest rate. However, interest ceases to accrue for loans on which interest is more than 90 days past due, when the collection of interest is not probable or when a loan is in foreclosure. Income on past due loans is reported on a cash basis. When a loan becomes current, it is placed back into accrual status. Cash receipts on impaired loans are recorded as a reduction of principal, interest income, expense reimbursement or other manner in accordance with the loan agreement. Gains and losses from the sale of loans and changes in allowances are reported in “Net realized investment gains” in the consolidated statements of operations.
Each mortgage loan is evaluated quarterly and placed in a watchlist if events occur or circumstances exist that could indicate that American National will be unable to collect all amounts due according to the contractual terms. Additionally, loans with estimated collateral value less than their balance and loans with characteristics indicative of higher than normal credit risks are reviewed quarterly. All loans in the watchlist are analyzed individually for impairment. If a loan is concluded to be fully collectible, no loss allowance is recorded. Loans are considered impaired when, based upon current information and events, it is probable that all amounts due under the contractual terms of the loan will be uncollectible. A specific allowance for loan losses is established for the excess carrying value of the loan over either: (i) the present value of expected future cash flows discounted at the loan’s original effective interest rate, or (ii) the estimated fair value of the underlying collateral if the loan is in the process of foreclosure or otherwise collateral dependent. Allowances are also established on groups of loans with similar characteristics, such as property types, if based on experience, it is probable that a loss has occurred and the amount of the loss can be reasonably estimated. The allowance is reviewed quarterly to determine if it is adequate, or if a recovery of the asset is assured and the allowance can be reduced.
67
Table of Contents
Index to Financial Statements
Note 2 – Summary of Significant Accounting Policies and Practices – (Continued)
Management believes the recorded allowance is adequate and is the best estimate of probable loan losses, including losses incurred at the reporting date but not identified by a specific loan. The allowance is based on historical loan loss experience, known and inherent risks in the portfolio, adverse situations affecting the borrower’s ability to repay, the estimated value of the underlying collateral, composition of the loan portfolio, current economic conditions and other relevant factors. Loans are charged off as uncollectible only when the loan is forgiven by a legal agreement. Prior to charging off a loan, an allowance is recorded based on the estimated recoverable amount. Upon forgiveness, both the allowance and the loan balance are reduced which results in no further gain or loss.
Policy loans are carried at cost, which approximates fair value.
Investment real estate including related improvements, are stated at cost less accumulated depreciation. Depreciation is provided on a straight-line basis over the estimated useful life of the asset (typically 15 to 50 years). Rental income is recognized on a straight-line basis over the term of the respective lease. American National classifies a property as held-for-sale if it commits to a plan to sell a property within one year and actively markets the property in its current condition for a price that is reasonable in comparison to its estimated fair value. Real estate held-for-sale is stated at the lower of depreciated cost or estimated fair value less expected disposition costs, and is not depreciated while it is classified as held-for-sale. American National periodically reviews its investment real estate for impairment and tests properties for recoverability whenever events or changes in circumstances indicate the carrying amount of the asset may not be recoverable and the carrying value of the property exceeds its estimated fair value. Properties whose carrying values are greater than their undiscounted cash flows are written down to their estimated fair value, with the impairment loss included in “Realized investment gains (losses)” in the consolidated statements of operations. Impairment losses are based upon the estimated fair value of real estate, which is generally computed using the present value of expected future cash flows from the real estate discounted at a rate commensurate with the underlying risks as well as other appraisal methods. Real estate acquired upon foreclosure is recorded at the lower of its cost, or its estimated fair value at the date of foreclosure.
Real Estate Joint Ventures and Other Limited Partnership Interests—In which the Company has more than a minor interest or influence over the investee’s operations, but it does not have a controlling interest and is not the primary beneficiary, are accounted for using the equity method. These investments are reported as “Investments in unconsolidated affiliates” in the consolidated statements of financial position. For certain joint ventures, American National records its share of earnings using a lag methodology of one to three months when timely financial information is not available and the contractual right does not exist to receive such financial information. In addition to the investees’ impairment analysis of its underlying investments, American National routinely evaluates its investments in those investees for impairments. American National considers financial and other information provided by the investee, other known information and inherent risks in the underlying investments, as well as future capital commitments, in determining whether impairment has occurred. When an impairment is deemed to have occurred at the joint venture level, American National recognizes its share within “Equity in earnings (losses) of unconsolidated affiliates” to record the investment at its fair value. When an impairment results from American National’s separate analysis, an adjustment is made through “Net realized investment gains ” to record the investment at its fair value.
Short-term investments comprised of commercial paper, are carried at amortized cost, which approximates fair value.
Other invested assets comprised primarily of tax credit partnerships, CAPCO investments, mineral rights and limited liability interests, are carried at cost, less allowance for depletion, where applicable. Other invested assets also include equity-indexed options which are carried at fair value. Impairments for other invested assets are considered on an individual basis.
68
Table of Contents
Index to Financial Statements
Note 2 – Summary of Significant Accounting Policies and Practices – (Continued)
Impairments are evaluated quarterly and where management believes that the carrying value will not be realized, an other-than-temporary impairment (“OTTI”) loss is recorded.
All fixed maturity securities with unrealized losses are assessed to determine if the creditworthiness of any of those securities has deteriorated to a point where its carrying value will not be realized at maturity. For fixed maturity securities at December 31, 2015, the unrealized losses on fixed maturity securities that were not other-than-temporarily impaired were the result of credit spread widening. There were no delinquent coupon payments attributed to these securities at December 31, 2015.
For all fixed maturity securities in unrealized loss positions which American National does not intend to sell and for which it is not more-likely-than-not that it will be required to sell before its anticipated recovery, American National assesses whether the amortized cost basis of securities will be recovered by comparing the net present value of the expected cash flows from those securities with its amortized cost basis. Management estimates the expected cash flows using historical experience information as well as market observable data, such as industry analyst reports and forecasts, sector credit ratings and other data relevant to the collectability of a security. The net present value of the expected cash flows from fixed maturity securities is calculated by discounting management’s best estimate of expected cash flows at the effective interest rate implicit in the fixed maturity security when acquired. If the net present value of the expected cash flows is less than the amortized cost, an OTTI has occurred in the form of a credit loss. The credit loss is recognized in earnings in the amount of excess amortized cost over the net present value of the expected cash flows. If the fair value is less than the net present value of its expected cash flows at the impairment measurement date, a non-credit loss exists which is recorded in other comprehensive income (loss) for the difference between the fair value and the net present value of the expected cash flows.
After the recognition of an OTTI, fixed maturity securities are accounted for as if they had been purchased on the OTTI measurement date, with a cost basis equal to their previous amortized cost less the related OTTI losses recognized in earnings. The new cost basis of an other-than-temporarily impaired security is not adjusted for subsequent increases in estimated fair value. Should there be a significant increase in the estimate of cash flows expected to be collected from previously impaired securities, the increase would be accounted for prospectively by accreting it as interest income over its remaining life.
American National evaluates quarterly all equity securities in unrealized loss positions and recognizes an OTTI loss on those where a market price recovery is not expected in a reasonable period of time. All equity securities with unrealized losses are also evaluated for credit quality. OTTI is recognized if management believes the carrying value of securities will not be realized, regardless of the length of time that they have had an unrealized loss.
Derivative instruments are purchased as hedges of a recognized asset or liability, and are recorded in the consolidated statements of financial position at fair value. The change in fair value of derivative assets and liabilities is reported in the consolidated statements of operations as “Net investment income” and “Interest credited to policyholder’ account balances,” respectively. American National does not apply hedge accounting treatment to its derivative instruments.
Cash and cash equivalents include cash on-hand and in banks, as well as amounts invested in money market funds and are reported as “Cash and cash equivalents” in the consolidated statements of financial position.
Property and equipment consist of buildings occupied by American National, data processing equipment, and furniture and equipment, which are carried at cost, less accumulated depreciation. Depreciation is calculated using straight-line and accelerated methods over the estimated useful lives of the assets (3 to 50 years).
69
Table of Contents
Index to Financial Statements
Note 2 – Summary of Significant Accounting Policies and Practices – (Continued)
Insurance specific assets and liabilities
Deferred policy acquisition costs (“DAC”) are capitalized costs related directly to the successful acquisition of new or renewal insurance contracts. Significant costs are incurred to acquire insurance and annuity contracts, including commissions and certain underwriting, policy issuance and processing expenses.
DAC on traditional life and health products is amortized with interest over the anticipated premium-paying period of the related policies, in proportion to the ratio of annual premium revenue expected to be received over the life of the policies. Expected premium revenue is estimated by using the same mortality, morbidity and withdrawal assumptions used in computing liabilities for future policy benefits. DAC is reduced by a provision for possible inflation of maintenance and settlement expenses determined by means of grading interest rates.
DAC on universal life, limited-pay and investment-type contracts is amortized as a level percentage of the present value of anticipated gross profits from investment yields, mortality, and surrender charges. The effect of the realization of unrealized gains (losses) on DAC is recognized within AOCI in the consolidated statements of financial position as of the reporting date. A change in interest rates could have a significant impact on DAC calculated for these contracts.
DAC associated with property and casualty business is amortized over the coverage period of the related policies, in relation to premium earned.
For short-duration and long-duration contracts, DAC is grouped consistent with the manner in which insurance contracts are acquired, serviced and measured for profitability and is reviewed for recoverability based on the profitability of the underlying insurance contracts. Investment income is not anticipated in assessing the recoverability of DAC for short-duration contracts.
Liabilities for future policy benefits for traditional products have been provided on a net level premium method based on estimated investment yields, withdrawals, mortality, and other assumptions that were appropriate at the time policies were issued. Estimates are based on historical experience, adjusted for possible adverse deviation. These estimates are periodically reviewed and compared with actual experience. When it is determined that future expected experience differs significantly from existing assumptions, the estimates are revised for current and future issues.
Policyholders’ account balances represent the contract value that has accrued to the benefit of the policyholders related to universal-life, limited-pay and investments-type contracts. These are generally equal to the accumulated deposits, plus interest credited, reduced by withdrawals, payouts, and accumulated policyholder assessments.
Reserves for claims and claim adjustment expenses (“CAE”) are established to provide for the estimated costs of paying claims. These reserves include estimates for both case reserves and incurred but not reported (“IBNR”) claim reserves. Case reserves include the liability for reported but unpaid claims. IBNR reserves include a provision for potential development on case reserves, losses on claims currently closed which may reopen in the future, as well as incurred but not reported claims. These reserves also include an estimate of the expense associated with settling claims, including legal and other fees and the general expenses of administering the claims adjustment process.
Reinsurance—Reinsurance recoverables are estimated amounts due to American National from reinsurers related to paid and unpaid ceded claims and CAE and are presented net of a reserve for collectability. Recoveries of gross ultimate losses are estimated by a review of individual large claims and the ceded portion of IBNR using assumed distribution of loss by percentage retained. The most significant assumption is the average size of the individual losses for those claims that have occurred but have not yet been reported. The ultimate amount of the reinsurance ceded recoverable is unknown until all losses settle.
70
Table of Contents
Index to Financial Statements
Note 2 – Summary of Significant Accounting Policies and Practices – (Continued)
Separate account assets and liabilities
Separate account assets and liabilities are funds intended to meet the investment objectives of contract holders who bear the investment risk. Investment income and investment gains and losses from these separate funds accrue to the benefit of the contract holders. Separate accounts are established in conformity with insurance laws and are not chargeable with liabilities that arise from any other business of American National. American National reports separately, as assets and liabilities, investments held in separate accounts and liabilities of the separate accounts if (i) such separate accounts are legally recognized; (ii) assets supporting the contract liabilities are legally insulated from American National’s general account liabilities; (iii) investments are directed by the contract holder; and (iv) all investment performance, net of contract fees and assessments, is passed through to the contract holder. The assets of these accounts are carried at fair value. Deposits, net investment income and realized investment gains and losses for these accounts are excluded from revenues, and related liability increases are excluded from benefits and expenses in the consolidated financial statements.
Premiums, benefits, claims incurred and expenses
Traditional ordinary life and health premiums are recognized as revenue when due. Benefits and expenses are associated with earned premiums to result in recognition of profits over the term of the insurance contracts.
Annuity premiums received on limited-pay and supplemental annuity contracts involving a significant life contingency are recognized as revenue when due. Deferred annuity premiums are recorded as deposits rather than recognized as revenue. Revenues from deferred annuity contracts are principally surrender charges and, in the case of variable annuities, administrative fees assessed to contractholders.
Universal life and single premium whole life revenues represent amounts assessed to policyholders including mortality charges, surrender charges actually paid and earned policy service fees. Amounts included in expenses are benefits in excess of account balances returned to policyholders.
Property and casualty premiums are recognized as revenue proportionately over the contract period, net of reinsurance ceded. Claims incurred consist of claims and CAE paid and the change in reserves, net of reinsurance received and recoverable.
Participating insurance policies
Participating business comprised approximately 6.7% of the life insurance in-force at December 31, 2015 and 19.6% of life premiums in 2015. Of the total participating business, 77.8% was written by Farm Family Life Insurance Company (“Farm Family Life”). For the participating business excluding Farm Family Life, the allocation of dividends to participating policyowners is based upon a comparison of experienced rates of mortality, interest and expenses, as determined periodically for representative plans of insurance, issue ages and policy durations, with the corresponding rates assumed in the calculation of premiums.
For the Farm Family Life participating business, profits earned on participating business are reserved for the payment of dividends to policyholders, except for the stockholders’ share of profits on participating policies, which is limited to the greater of 10% of the profit on participating business, or 50 cents per thousand dollars of the face amount of participating life insurance in-force. Participating policyholders’ interest includes the accumulated net income from participating policies reserved for payment to such policyholders in the form of dividends (less net income allocated to stockholders as indicated above) as well as a pro rata portion of unrealized investment gains (losses), net of tax.
Federal income taxes
American National files a consolidated life and non-life federal income tax return. Certain subsidiaries that are consolidated for financial reporting are not eligible to be included in the consolidated federal income tax return; accordingly, they file separate returns.
71
Table of Contents
Index to Financial Statements
Note 2 – Summary of Significant Accounting Policies and Practices – (Continued)
Deferred federal income tax assets and liabilities are recognized to reflect the future tax consequences attributable to differences between the financial statement amounts of assets and liabilities and their respective tax bases. Deferred taxes are measured using enacted tax rates expected to apply in the years in which those temporary differences are expected to be recovered or settled.
American National recognizes tax benefits on uncertain tax positions if it is “more-likely-than-not” the position based on its technical merits will be sustained by taxing authorities. American National recognizes the largest benefit that is greater than 50% likely of being ultimately realized upon settlement. Tax benefits not meeting the “more-likely-than-not” threshold, if applicable, are included with “Other liabilities” in the consolidated statements of financial position.
Interest and penalties assessed, if applicable, are classified as current federal income taxes in the consolidated statements of operations.
Pension and postretirement benefit plans
Pension and postretirement benefit obligations and costs are calculated using concepts in accordance with GAAP. The discount rate and the expected return on plan assets are important elements of expense and/or liability measurement, and these key assumptions are evaluated annually. Other assumptions involve demographic factors such as retirement age, mortality, turnover and compensation.
American National uses a discount rate to determine the present value of future benefits on the measurement date. The guideline for setting this rate is a high-quality long-term corporate bond rate. To determine the expected long-term rate of return on plan assets, a building-block method is used. The expected rate of return on each asset is broken down into inflation, the real risk-free rate of return (i.e., the long-term estimate of future returns on default-free U.S. government securities), and the risk premium for each asset class (i.e., the expected return in excess of the risk-free rate). Using this approach, the calculated return will fluctuate from year to year; however, it is American National’s policy to hold this long-term assumption relatively constant.
Stock-based compensation
Stock Appreciation Rights (“SARs”) liability and compensation cost is based on the fair value of the grants and are remeasured each reporting period through the settlement date. The fair value of the SAR’s is calculated using the Black-Scholes-Merton option-pricing model. The key assumptions used in the model include: the grant date and remeasurement date stock prices, expected life of the SARs and the risk-free rate of return. The compensation liability related to the SAR award is included in “Other liabilities” in the consolidated statements of financial position.
Restricted Stock (“RS”) equity and compensation cost is based on the fair value of the underlying stock at grant date. The compensation cost accrued is included in “Additional paid-in capital” in the consolidated statements of financial position.
Restricted Stock Units (“RSU”) provides the recipients of the awards the option to settle vested RSUs in either cash or American National common stock. Effective December 31, 2012, American National’s Board Compensation Committee modified the settlement provision within the outstanding restricted stock units, which changed the RSU classification from an equity to a liability award. The liability is remeasured each reporting period through the vesting date and is adjusted for changes in fair value. The compensation liability related to the RSUs is included in “Other Liabilities” in the consolidated statements of financial position.
72
Table of Contents
Index to Financial Statements
Note 2 – Summary of Significant Accounting Policies and Practices – (Continued)
Litigation contingencies
Existing and potential litigation is reviewed quarterly to determine if any adjustments to liabilities for possible losses are necessary. Reserves for losses are established whenever they are probable and estimable. If no one estimate within the range of possible losses is more probable than any other, a reserve is recorded based on the lowest amount of the range.
Note 3 – Recently Issued Accounting Pronouncements
Adoption of New Accounting Standards
In January 2014, the FASB issued Accounting Standards Update (“ASU”) 2014-01, Accounting for Investments in Qualified Affordable Housing Projects. The new standard allows a proportional amortization approach and treats the net investment performance as a component of income tax expense. Previously, these investments were accounted for under the equity method that records changes to investment value as a component of investment income and generates a deferred tax balance until the investment terminates. American National adopted this standard effective January 1, 2015, with retrospective adoption as of January 1, 2013. Upon adoption, the opening balance of stockholders’ equity was reduced by $818,000 at January 1, 2013.
Financial statement amounts previously reported were revised as shown below (in thousands):
| As of December 31, 2014 | ||||||||||||
| As Reported | As Adjusted | Effect of Change | ||||||||||
| Investment in unconsolidated affiliates |
$ | 319,283 | $ | 311,779 | $ | (7,504 | ) | |||||
| Deferred tax liabilities, net |
290,112 | 287,175 | (2,937 | ) | ||||||||
| Retained earnings |
4,003,209 | 3,998,642 | (4,567 | ) | ||||||||
| As Reported | As Adjusted | Effect of Change | ||||||||||
| Year ended December 31, 2014 |
||||||||||||
| Provision for federal income taxes, current |
$ | 72,327 | $ | 77,547 | $ | 5,220 | ||||||
| Provision for federal income taxes, deferred |
19,704 | 19,067 | (637 | ) | ||||||||
| Equity in earnings of unconsolidated affiliates |
11,969 | 14,694 | 2,725 | |||||||||
| Net Income attributable to American National |
247,193 | 245,335 | (1,858 | ) | ||||||||
| Year ended December 31, 2013 |
||||||||||||
| Provision for federal income taxes, current |
$ | 64,928 | $ | 73,798 | $ | 8,870 | ||||||
| Provision for federal income taxes, deferred |
34,713 | 34,277 | (436 | ) | ||||||||
| Equity in earnings of unconsolidated affiliates |
9,476 | 16,019 | 6,543 | |||||||||
| Net Income attributable to American National |
268,372 | 266,481 | (1,891 | ) | ||||||||
73
Table of Contents
Index to Financial Statements
Note 3 – Recently Issued Accounting Pronouncements – (Continued)
American National’s investments in Qualified Affordable Housing Projects were $42,097,000 and $32,778,000 as of December 31, 2015 and 2014, respectively. For the years ended December 31, 2015 and 2014, American National recognized tax credits and other tax benefits of $8,872,000 and $7,817,000, respectively, and amortized cost of $7,480,000 and $6,378,000, relating to these investments. At December 31, 2015 American National had commitments to provide additional funding to these investments during the following fiscal years as follows (in thousands):
| Expected year of payment |
2016 | 2017 | 2018 | 2019 | 2020 | Total | ||||||||||||||||||
| Equity commitments |
$ | 10,247 | 1,064 | 626 | 1,385 | — | $ | 13,322 |
Future Adoption of New Accounting Standards— The FASB issued the following accounting guidance relevant to American National:
In May 2014, the FASB issued guidance that will supersede most existing revenue recognition requirements in U.S. GAAP. Insurance contracts generally are excluded from the scope of the guidance. For those contracts which are impacted, the transaction price is attributed to the underlying performance obligations in the contract and revenue is recognized as the entity satisfies the performance obligations and transfers control of a good or service to the customer. In August 2015, the effective date of the guidance was deferred one year and is now effective for reporting periods beginning after December 15, 2017 and is to be applied retrospectively. The Company is evaluating the impact of adoption, which is not expected to be material to the Company’s financial statements.
In February 2015, the FASB issued guidance amending the consolidation analysis. The guidance modifies the evaluation of whether limited partnerships and similar legal entities are variable interest entities (VIEs) or voting interest entities. The guidance eliminates the presumption that a general partner should consolidate a limited partnership and affects the consolidation analysis of reporting entities that are involved with VIEs. The amended guidance is effective for reporting periods beginning after December 15, 2015. The impact of the adoption is not expected to be material to the Company’s financial statements.
In May 2015, the FASB issued guidance to expand the disclosures an insurance entity would provide about its short duration contracts. The disclosure about the liability for unpaid claims and claim adjustment expenses is intended to increase the transparency of significant estimates made in the measuring of those liabilities. It is also intended to provide insight into an insurance entity’s ability to underwrite and anticipate costs associated with claims. The amended guidance is effective for annual reporting periods beginning after December 15, 2015 and for interim reporting periods beginning after December 15, 2016. The guidance affects disclosures only and will not impact the Company’s results of operations or financial position.
74
Table of Contents
Index to Financial Statements
Note 4 – Investment in Securities
The cost or amortized cost and fair value of investments in securities are shown below (in thousands):
| December 31, 2015 | ||||||||||||||||
| Cost or Amortized Cost |
Gross Unrealized Gains |
Gross Unrealized (Losses) |
Fair Value | |||||||||||||
| Fixed maturity securities, bonds held-to-maturity |
||||||||||||||||
| U.S. states and political subdivisions |
$ | 324,643 | $ | 22,318 | $ | (444 | ) | $ | 346,517 | |||||||
| Foreign governments |
4,101 | 867 | — | 4,968 | ||||||||||||
| Corporate debt securities |
6,985,844 | 263,927 | (158,101 | ) | 7,091,670 | |||||||||||
| Residential mortgage-backed securities |
277,135 | 18,351 | (1,286 | ) | 294,200 | |||||||||||
| Collateralized debt securities |
1,924 | 100 | — | 2,024 | ||||||||||||
| Other debt securities |
15,773 | 401 | — | 16,174 | ||||||||||||
|
|
|
|
|
|
|
|
|
|||||||||
| Total bonds held-to-maturity |
7,609,420 | 305,964 | (159,831 | ) | 7,755,553 | |||||||||||
|
|
|
|
|
|
|
|
|
|||||||||
| Fixed maturity securities, bonds available-for-sale |
||||||||||||||||
| U.S. treasury and government |
24,024 | 702 | (34 | ) | 24,692 | |||||||||||
| U.S. states and political subdivisions |
933,958 | 39,808 | (1,275 | ) | 972,491 | |||||||||||
| Foreign governments |
5,000 | 1,733 | — | 6,733 | ||||||||||||
| Corporate debt securities |
4,431,765 | 120,471 | (107,614 | ) | 4,444,622 | |||||||||||
| Residential mortgage-backed securities |
25,629 | 2,155 | (420 | ) | 27,364 | |||||||||||
| Collateralized debt securities |
7,455 | 629 | (70 | ) | 8,014 | |||||||||||
|
|
|
|
|
|
|
|
|
|||||||||
| Total bonds available-for-sale |
5,427,831 | 165,498 | (109,413 | ) | 5,483,916 | |||||||||||
|
|
|
|
|
|
|
|
|
|||||||||
| Equity securities |
||||||||||||||||
| Common stock |
794,839 | 718,225 | (22,035 | ) | 1,491,029 | |||||||||||
| Preferred stock |
15,987 | 7,964 | (1 | ) | 23,950 | |||||||||||
|
|
|
|
|
|
|
|
|
|||||||||
| Total equity securities |
810,826 | 726,189 | (22,036 | ) | 1,514,979 | |||||||||||
|
|
|
|
|
|
|
|
|
|||||||||
| Total investments in securities |
$ | 13,848,077 | $ | 1,197,651 | $ | (291,280 | ) | $ | 14,754,448 | |||||||
|
|
|
|
|
|
|
|
|
|||||||||
| December 31, 2014 | ||||||||||||||||
| Cost or Amortized Cost |
Gross Unrealized Gains |
Gross Unrealized (Losses) |
Fair Value | |||||||||||||
| Fixed maturity securities, bonds held-to-maturity |
||||||||||||||||
| U.S. states and political subdivisions |
$ | 323,053 | $ | 26,800 | $ | (93 | ) | $ | 349,760 | |||||||
| Foreign governments |
29,130 | 1,293 | — | 30,423 | ||||||||||||
| Corporate debt securities |
7,517,195 | 424,845 | (47,315 | ) | 7,894,725 | |||||||||||
| Residential mortgage-backed securities |
336,853 | 22,317 | (1,535 | ) | 357,635 | |||||||||||
| Collateralized debt securities |
2,232 | 238 | — | 2,470 | ||||||||||||
| Other debt securities |
16,587 | 1,313 | — | 17,900 | ||||||||||||
|
|
|
|
|
|
|
|
|
|||||||||
| Total bonds held-to-maturity |
8,225,050 | 476,806 | (48,943 | ) | 8,652,913 | |||||||||||
|
|
|
|
|
|
|
|
|
|||||||||
| Fixed maturity securities, bonds available-for-sale |
||||||||||||||||
| U.S. treasury and government |
22,415 | 825 | (7 | ) | 23,233 | |||||||||||
| U.S. states and political subdivisions |
802,846 | 36,151 | (1,381 | ) | 837,616 | |||||||||||
| Foreign governments |
5,000 | 2,021 | — | 7,021 | ||||||||||||
| Corporate debt securities |
3,812,771 | 203,048 | (15,770 | ) | 4,000,049 | |||||||||||
| Residential mortgage-backed securities |
40,988 | 1,903 | (492 | ) | 42,399 | |||||||||||
| Collateralized debt securities |
10,696 | 863 | (70 | ) | 11,489 | |||||||||||
|
|
|
|
|
|
|
|
|
|||||||||
| Total bonds available-for-sale |
4,694,716 | 244,811 | (17,720 | ) | 4,921,807 | |||||||||||
|
|
|
|
|
|
|
|
|
|||||||||
| Equity securities |
||||||||||||||||
| Common stock |
719,651 | 774,650 | (7,176 | ) | 1,487,125 | |||||||||||
| Preferred stock |
19,733 | 10,121 | (1 | ) | 29,853 | |||||||||||
|
|
|
|
|
|
|
|
|
|||||||||
| Total equity securities |
739,384 | 784,771 | (7,177 | ) | 1,516,978 | |||||||||||
|
|
|
|
|
|
|
|
|
|||||||||
| Total investments in securities |
$ | 13,659,150 | $ | 1,506,388 | $ | (73,840 | ) | $ | 15,091,698 | |||||||
|
|
|
|
|
|
|
|
|
|||||||||
75
Table of Contents
Index to Financial Statements
Note 4 – Investment in Securities – (Continued)
The amortized cost and fair value, by contractual maturity, of fixed maturity securities are shown below (in thousands):
| December 31, 2015 | ||||||||||||||||
| Bonds Held-to-Maturity | Bonds Available-for-Sale | |||||||||||||||
| Amortized Cost | Fair Value | Amortized Cost | Fair Value | |||||||||||||
| Due in one year or less |
$ | 253,733 | $ | 257,904 | $ | 259,630 | $ | 261,111 | ||||||||
| Due after one year through five years |
2,753,119 | 2,911,920 | 1,103,407 | 1,158,800 | ||||||||||||
| Due after five years through ten years |
4,275,052 | 4,243,409 | 3,468,145 | 3,445,337 | ||||||||||||
| Due after ten years |
321,666 | 337,270 | 591,649 | 613,680 | ||||||||||||
| Without single maturity date |
5,850 | 5,050 | 5,000 | 4,988 | ||||||||||||
|
|
|
|
|
|
|
|
|
|||||||||
| Total |
$ | 7,609,420 | $ | 7,755,553 | $ | 5,427,831 | $ | 5,483,916 | ||||||||
|
|
|
|
|
|
|
|
|
|||||||||
Actual maturities differ from contractual maturities because borrowers may have the right to call or prepay obligations with or without call or prepayment penalties. Residential and commercial mortgage-backed securities, which are not due at a single maturity, have been allocated to their respective categories based on the year of final contractual maturity.
Proceeds from sales of available-for-sale securities, with the related gross realized gains and losses, are shown below (in thousands):
| Years ended December 31, | ||||||||||||
| 2015 | 2014 | 2013 | ||||||||||
| Proceeds from sales of available-for-sale securities |
$ | 86,793 | $ | 184,918 | $ | 228,159 | ||||||
| Gross realized gains |
34,434 | 38,301 | 43,263 | |||||||||
| Gross realized losses |
(592 | ) | (3,635 | ) | (3,413 | ) | ||||||
Gains and losses are determined using specific identification of the securities sold. During 2015 and 2014, bonds with a carrying value of $171,000 and $44,781,000, respectively, were transferred from held-to-maturity to available-for-sale after a significant deterioration in the issuers’ creditworthiness became evident. An unrealized loss of $53,000 and an unrealized gain of $1,301,000 were established in 2015 and 2014, respectively following the transfer at fair value.
In accordance with various regulations, American National had bonds on deposit with regulating authorities with a carrying value of $51,877,000 and $51,767,000 at December 31, 2015 and 2014, respectively. In addition, American National has pledged bonds in connection with agreements and transactions, such as financing and reinsurance agreements. The carrying value of bonds pledged was $77,360,000 and $65,331,000 at December 31, 2015 and 2014, respectively.
76
Table of Contents
Index to Financial Statements
Note 4 – Investment in Securities – (Continued)
The components of the change in net unrealized gains (losses) on securities are shown below (in thousands):
| Years ended December 31, | ||||||||||||
| 2015 | 2014 | 2013 | ||||||||||
| Bonds available-for-sale |
$ | (171,006 | ) | $ | 83,809 | $ | (205,827 | ) | ||||
| Equity securities |
(73,441 | ) | 108,066 | 282,668 | ||||||||
|
|
|
|
|
|
|
|||||||
| Change in net unrealized gains (losses) on securities during the year |
(244,447 | ) | 191,875 | 76,841 | ||||||||
| Adjustments for |
||||||||||||
| Deferred policy acquisition costs |
59,340 | (14,611 | ) | 59,893 | ||||||||
| Participating policyholders’ interest |
8,646 | (9,046 | ) | (2,300 | ) | |||||||
| Deferred federal income tax benefit (expense) |
61,744 | (58,004 | ) | (47,339 | ) | |||||||
|
|
|
|
|
|
|
|||||||
| Change in net unrealized gains (losses) on securities, net of tax |
$ | (114,717 | ) | $ | 110,214 | $ | 87,095 | |||||
|
|
|
|
|
|
|
|||||||
The gross unrealized losses and fair value of the investment securities, aggregated by investment category and length of time that individual securities have been in a continuous unrealized loss position, are shown below (in thousands):
| December 31, 2015 | ||||||||||||||||||||||||
| Less than 12 months | 12 Months or more | Total | ||||||||||||||||||||||
| Unrealized (Losses) |
Fair Value |
Unrealized (Losses) |
Fair Value |
Unrealized (Losses) |
Fair Value |
|||||||||||||||||||
| Fixed maturity securities, bonds held-to-maturity |
||||||||||||||||||||||||
| U.S. states and political subdivisions |
$ | (444 | ) | $ | 19,412 | $ | — | $ | — | $ | (444 | ) | $ | 19,412 | ||||||||||
| Corporate debt securities |
(93,285 | ) | 1,912,178 | (64,816 | ) | 283,469 | (158,101 | ) | 2,195,647 | |||||||||||||||
| Residential mortgage-backed securities |
(449 | ) | 21,275 | (837 | ) | 14,721 | (1,286 | ) | 35,996 | |||||||||||||||
|
|
|
|
|
|
|
|
|
|
|
|
|
|||||||||||||
| Total bonds held-to-maturity |
(94,178 | ) | 1,952,865 | (65,653 | ) | 298,190 | (159,831 | ) | 2,251,055 | |||||||||||||||
|
|
|
|
|
|
|
|
|
|
|
|
|
|||||||||||||
| Fixed maturity securities, bonds available-for-sale |
||||||||||||||||||||||||
| U.S. treasury and government |
(34 | ) | 18,802 | — | — | (34 | ) | 18,802 | ||||||||||||||||
| U.S. states and political subdivisions |
(1,223 | ) | 80,807 | (52 | ) | 2,569 | (1,275 | ) | 83,376 | |||||||||||||||
| Corporate debt securities |
(81,638 | ) | 1,796,357 | (25,976 | ) | 90,784 | (107,614 | ) | 1,887,141 | |||||||||||||||
| Residential mortgage-backed securities |
(228 | ) | 15,273 | (192 | ) | 4,984 | (420 | ) | 20,257 | |||||||||||||||
| Collateralized debt securities |
(66 | ) | 2,115 | (4 | ) | 253 | (70 | ) | 2,368 | |||||||||||||||
|
|
|
|
|
|
|
|
|
|
|
|
|
|||||||||||||
| Total bonds available-for-sale |
(83,189 | ) | 1,913,354 | (26,224 | ) | 98,590 | (109,413 | ) | 2,011,944 | |||||||||||||||
|
|
|
|
|
|
|
|
|
|
|
|
|
|||||||||||||
| Equity securities |
||||||||||||||||||||||||
| Common stock |
(22,035 | ) | 136,694 | — | — | (22,035 | ) | 136,694 | ||||||||||||||||
| Preferred stock |
— | — | (1 | ) | — | (1 | ) | — | ||||||||||||||||
|
|
|
|
|
|
|
|
|
|
|
|
|
|||||||||||||
| Total equity securities |
(22,035 | ) | 136,694 | (1 | ) | — | (22,036 | ) | 136,694 | |||||||||||||||
|
|
|
|
|
|
|
|
|
|
|
|
|
|||||||||||||
| Total |
$ | (199,402 | ) | $ | 4,002,913 | $ | (91,878 | ) | $ | 396,780 | $ | (291,280 | ) | $ | 4,399,693 | |||||||||
|
|
|
|
|
|
|
|
|
|
|
|
|
|||||||||||||
77
Table of Contents
Index to Financial Statements
Note 4 – Investment in Securities – (Continued)
| December 31, 2014 | ||||||||||||||||||||||||
| Less than 12 months | 12 Months or more | Total | ||||||||||||||||||||||
| Unrealized (Losses) |
Fair Value |
Unrealized (Losses) |
Fair Value |
Unrealized (Losses) |
Fair Value |
|||||||||||||||||||
| Fixed maturity securities, bonds held-to-maturity |
||||||||||||||||||||||||
| U.S. states and political subdivisions |
$ | (37 | ) | $ | 3,388 | $ | (56 | ) | $ | 2,465 | $ | (93 | ) | $ | 5,853 | |||||||||
| Corporate debt securities |
(20,575 | ) | 523,766 | (26,740 | ) | 662,362 | (47,315 | ) | 1,186,128 | |||||||||||||||
| Residential mortgage-backed securities |
(232 | ) | 12,186 | (1,303 | ) | 31,163 | (1,535 | ) | 43,349 | |||||||||||||||
|
|
|
|
|
|
|
|
|
|
|
|
|
|||||||||||||
| Total bonds held-to-maturity |
(20,844 | ) | 539,340 | (28,099 | ) | 695,990 | (48,943 | ) | 1,235,330 | |||||||||||||||
|
|
|
|
|
|
|
|
|
|
|
|
|
|||||||||||||
| Fixed maturity securities, bonds available-for-sale |
||||||||||||||||||||||||
| U.S. treasury and government |
(7 | ) | 14,552 | — | — | (7 | ) | 14,552 | ||||||||||||||||
| U.S. states and political subdivisions |
(166 | ) | 27,719 | (1,215 | ) | 78,851 | (1,381 | ) | 106,570 | |||||||||||||||
| Corporate debt securities |
(8,852 | ) | 384,451 | (6,918 | ) | 288,808 | (15,770 | ) | 673,259 | |||||||||||||||
| Residential mortgage-backed securities |
(170 | ) | 9,386 | (322 | ) | 14,042 | (492 | ) | 23,428 | |||||||||||||||
| Collateralized debt securities |
(63 | ) | 2,033 | (7 | ) | 339 | (70 | ) | 2,372 | |||||||||||||||
|
|
|
|
|
|
|
|
|
|
|
|
|
|||||||||||||
| Total bonds available-for-sale |
(9,258 | ) | 438,141 | (8,462 | ) | 382,040 | (17,720 | ) | 820,181 | |||||||||||||||
|
|
|
|
|
|
|
|
|
|
|
|
|
|||||||||||||
| Equity securities |
||||||||||||||||||||||||
| Common stock |
(7,176 | ) | 43,907 | — | — | (7,176 | ) | 43,907 | ||||||||||||||||
| Preferred stock |
(1 | ) | — | — | — | (1 | ) | — | ||||||||||||||||
|
|
|
|
|
|
|
|
|
|
|
|
|
|||||||||||||
| Total equity securities |
(7,177 | ) | 43,907 | — | — | (7,177 | ) | 43,907 | ||||||||||||||||
|
|
|
|
|
|
|
|
|
|
|
|
|
|||||||||||||
| Total |
$ | (37,279 | ) | $ | 1,021,388 | $ | (36,561 | ) | $ | 1,078,030 | $ | (73,840 | ) | $ | 2,099,418 | |||||||||
|
|
|
|
|
|
|
|
|
|
|
|
|
|||||||||||||
As of December 31, 2015, the securities with unrealized losses including those exceeding one year were not deemed to be other-than-temporarily impaired. American National has the ability and intent to hold those securities until a market price recovery or maturity. It is not more-likely-than-not that American National will be required to sell them prior to recovery, and recovery is expected in a reasonable period of time. It is possible an issuer’s financial circumstances may be different in the future, which may lead to a different impairment conclusion in future periods.
Bonds distributed by credit quality rating, using both Standard & Poor’s and Moody’s ratings, are shown below:
| December 31, | ||||||||
| 2015 | 2014 | |||||||
| AAA |
5.4 | % | 5.0 | % | ||||
| AA |
12.0 | 12.8 | ||||||
| A |
36.5 | 39.4 | ||||||
| BBB |
43.3 | 39.5 | ||||||
| BB and below |
2.8 | 3.3 | ||||||
|
|
|
|
|
|||||
| Total |
100.0 | % | 100.0 | % | ||||
|
|
|
|
|
|||||
Equity securities by market sector distribution are shown below:
| December 31, | ||||||||
| 2015 | 2014 | |||||||
| Consumer goods |
20.5 | % | 20.4 | % | ||||
| Energy and utilities |
10.3 | 13.3 | ||||||
| Finance |
20.0 | 19.1 | ||||||
| Healthcare |
14.6 | 14.0 | ||||||
| Industrials |
8.2 | 8.4 | ||||||
| Information technology |
17.8 | 16.2 | ||||||
| Other |
8.6 | 8.6 | ||||||
|
|
|
|
|
|||||
| Total |
100.0 | % | 100.0 | % | ||||
|
|
|
|
|
|||||
78
Table of Contents
Index to Financial Statements
Note 5 – Mortgage Loans
Generally, commercial mortgage loans are secured by first liens on income-producing real estate. American National attempts to maintain a diversified portfolio by considering the location of the underlying collateral. The distribution based on carrying amount of mortgage loans by location are as follows:
| December 31, | ||||||||
| 2015 | 2014 | |||||||
| East North Central |
18.8 | % | 19.4 | % | ||||
| East South Central |
4.8 | 5.0 | ||||||
| Mountain |
11.6 | 11.0 | ||||||
| Pacific |
10.7 | 10.8 | ||||||
| South Atlantic |
18.8 | 21.9 | ||||||
| West South Central |
29.0 | 24.9 | ||||||
| Other |
6.3 | 7.0 | ||||||
|
|
|
|
|
|||||
| Total |
100.0 | % | 100.0 | % | ||||
|
|
|
|
|
|||||
During 2015, American National foreclosed on three loans with a recorded investment of $24,333,000, and one loan was in the process of foreclosure with a recorded investment of $2,450,000. Two loans were in the process of foreclosure with a recorded investment of $15,945,000 for the same period in 2014. American National sold one loan with a recorded investment of $2,702,000 resulting in a realized loss of $1,602,000 for the year ended December 31, 2015. No loans were sold in 2014.
The age analysis of past due loans is shown below (in thousands):
| 30-59 Days | 60-89 Days | More Than | Total | Current | Total | |||||||||||||||||||||||
| Past Due | Past Due | 90 Days | Amount | Percent | ||||||||||||||||||||||||
| December 31, 2015 |
||||||||||||||||||||||||||||
| Industrial |
$ | — | $ | — | $ | — | $ | — | $ | 704,426 | $ | 704,426 | 20.1 | |||||||||||||||
| Office |
— | 5,883 | 2,450 | 8,333 | 1,252,484 | 1,260,817 | 36.1 | |||||||||||||||||||||
| Retail |
19,088 | — | — | 19,088 | 583,810 | 602,898 | 17.2 | |||||||||||||||||||||
| Other |
— | — | — | — | 928,034 | 928,034 | 26.6 | |||||||||||||||||||||
|
|
|
|
|
|
|
|
|
|
|
|
|
|
|
|||||||||||||||
| Total |
$ | 19,088 | $ | 5,883 | $ | 2,450 | $ | 27,421 | $ | 3,468,754 | $ | 3,496,175 | 100.0 | |||||||||||||||
|
|
|
|
|
|
|
|
|
|
|
|
|
|||||||||||||||||
| Allowance for loan losses |
(12,895 | ) | ||||||||||||||||||||||||||
|
|
|
|||||||||||||||||||||||||||
| Total, net of allowance |
$ | 3,483,280 | ||||||||||||||||||||||||||
|
|
|
|||||||||||||||||||||||||||
| December 31, 2014 |
||||||||||||||||||||||||||||
| Industrial |
$ | — | $ | — | $ | — | $ | — | $ | 702,541 | $ | 702,541 | 20.9 | |||||||||||||||
| Office |
— | — | 19,327 | 19,327 | 1,201,833 | 1,221,160 | 36.1 | |||||||||||||||||||||
| Retail |
— | — | — | — | 615,813 | 615,813 | 18.1 | |||||||||||||||||||||
| Other |
— | — | — | — | 837,932 | 837,932 | 24.9 | |||||||||||||||||||||
|
|
|
|
|
|
|
|
|
|
|
|
|
|
|
|||||||||||||||
| Total |
$ | — | $ | — | $ | 19,327 | $ | 19,327 | $ | 3,358,119 | $ | 3,377,446 | 100.0 | |||||||||||||||
|
|
|
|
|
|
|
|
|
|
|
|
|
|||||||||||||||||
| Allowance for loan losses |
(17,860 | ) | ||||||||||||||||||||||||||
|
|
|
|||||||||||||||||||||||||||
| Total, net of allowance |
$ | 3,359,586 | ||||||||||||||||||||||||||
|
|
|
|||||||||||||||||||||||||||
Total mortgage loans are net of unamortized discounts of $452,000 and $658,000 and unamortized origination fees of $22,637,000 and $15,659,000 at December 31, 2015 and 2014, respectively. No unearned income is included in these amounts.
79
Table of Contents
Index to Financial Statements
Note 5 – Mortgage Loans – (Continued)
Allowance for Credit Losses
The credit quality of the mortgage loan portfolio is assessed by evaluating the credit risk of the borrowers. A loan is classified as performing or non-performing based on whether all of the contractual terms of the loan have been met.
Loans not evaluated individually for collectability are segregated by property-type and location, and allowance factors are applied. These factors are developed annually and reviewed quarterly based on our historical loss experience adjusted for the expected trend in the rate of foreclosure losses. Allowance factors are higher for loans of certain property types and in certain regions based on loss experience or a blended historical loss factor.
The change in allowance for credit losses in mortgage loans is shown below (in thousands):
| Collectively | Individually | |||||||||||
| Evaluated | Evaluated | |||||||||||
| for Impairment | for Impairment | Total | ||||||||||
| Balance at December 31, 2012 |
$ | 11,519 | $ | 493 | $ | 12,012 | ||||||
| Change in allowance |
169 | — | 169 | |||||||||
|
|
|
|
|
|
|
|||||||
| Balance at December 31, 2013 |
11,688 | 493 | 12,181 | |||||||||
|
|
|
|
|
|
|
|||||||
| Change Due to Factor Development |
127 | — | 127 | |||||||||
| Change in allowance |
462 | 5,090 | 5,552 | |||||||||
|
|
|
|
|
|
|
|||||||
| Balance at December 31, 2014 |
12,277 | 5,583 | 17,860 | |||||||||
|
|
|
|
|
|
|
|||||||
| Change in allowance |
(1,561 | ) | (3,404 | ) | (4,965 | ) | ||||||
|
|
|
|
|
|
|
|||||||
| Balance at December 31, 2015 |
$ | 10,716 | $ | 2,179 | $ | 12,895 | ||||||
|
|
|
|
|
|
|
|||||||
At December 31, 2015 and 2014, the recorded investment for loans collectively evaluated for impairment was $3,442,211,000 and $3,321,241,000, respectively. The recorded investment for loans individually evaluated for impairment was $53,964,000 and $56,205,000, respectively.
80
Table of Contents
Index to Financial Statements
Note 5 – Mortgage Loans – (Continued)
Loans individually evaluated for impairment with and without an allowance recorded are shown below (in thousands):
| Years ended December 31, | ||||||||||||||||||||||||
| 2015 | 2014 | 2013 | ||||||||||||||||||||||
| Average | Interest | Average | Interest | Average | Interest | |||||||||||||||||||
| Recorded | Income | Recorded | Income | Recorded | Income | |||||||||||||||||||
| Investment | Recognized | Investment | Recognized | Investment | Recognized | |||||||||||||||||||
| With an allowance |
||||||||||||||||||||||||
| Office |
$ | 18,062 | $ | 1,342 | $ | 29,371 | $ | 2,203 | $ | — | $ | — | ||||||||||||
| Retail |
— | — | — | — | 493 | — | ||||||||||||||||||
|
|
|
|
|
|
|
|
|
|
|
|
|
|||||||||||||
| Total |
$ | 18,062 | $ | 1,342 | $ | 29,371 | $ | 2,203 | $ | 493 | $ | — | ||||||||||||
|
|
|
|
|
|
|
|
|
|
|
|
|
|||||||||||||
| Without an allowance |
||||||||||||||||||||||||
| Office |
$ | 28,765 | $ | 1,834 | $ | 27,019 | $ | 1,728 | $ | 12,444 | $ | 809 | ||||||||||||
| Industrial |
— | — | 2,721 | 146 | 2,773 | 180 | ||||||||||||||||||
| Retail |
8,856 | 540 | — | — | 1,673 | 103 | ||||||||||||||||||
|
|
|
|
|
|
|
|
|
|
|
|
|
|||||||||||||
| Total |
$ | 37,621 | $ | 2,374 | $ | 29,740 | $ | 1,874 | $ | 16,890 | $ | 1,092 | ||||||||||||
|
|
|
|
|
|
|
|
|
|
|
|
|
|||||||||||||
| December 31, | ||||||||||||||||
| 2015 | 2014 | |||||||||||||||
| Unpaid | Unpaid | |||||||||||||||
| Recorded | Principal | Recorded | Principal | |||||||||||||
| Investment | Balance | Investment | Balance | |||||||||||||
| With an allowance |
||||||||||||||||
| Office |
$ | 16,168 | $ | 17,855 | $ | 26,563 | $ | 31,653 | ||||||||
| Retail |
— | — | — | 493 | ||||||||||||
|
|
|
|
|
|
|
|
|
|||||||||
| Total |
$ | 16,168 | $ | 17,855 | $ | 26,563 | $ | 32,146 | ||||||||
|
|
|
|
|
|
|
|
|
|||||||||
| Without an allowance |
||||||||||||||||
| Office |
$ | 29,091 | $ | 29,091 | $ | 26,941 | $ | 26,941 | ||||||||
| Industrial |
— | — | 2,702 | 2,702 | ||||||||||||
| Retail |
8,705 | 8,705 | — | — | ||||||||||||
|
|
|
|
|
|
|
|
|
|||||||||
| Total |
$ | 37,796 | $ | 37,796 | $ | 29,643 | $ | 29,643 | ||||||||
|
|
|
|
|
|
|
|
|
|||||||||
Troubled Debt Restructurings
American National has granted concessions which are classified as troubled debt restructurings to mortgage loan borrowers. Concessions are generally one of, or a combination of, a delay in payment of principal or interest, a reduction of the contractual interest rate or an extension of the maturity date. American National considers the amount, timing and extent of concessions in determining any impairment or changes in the specific allowance for loan losses recorded in connection with a troubled debt restructuring. The carrying value after specific allowance, before and after modification in a troubled debt restructuring, may not change significantly, or may increase if the expected recovery is higher than the pre-modification recovery assessment.
81
Table of Contents
Index to Financial Statements
Note 5 – Mortgage Loans – (Continued)
Troubled debt restructuring mortgage loan information is as follows (in thousands, except number of contracts):
| Years ended December 31, | ||||||||||||||||||||||||
| 2015 | 2014 | |||||||||||||||||||||||
| Number of contracts |
Recorded investment pre- modification |
Recorded investment post modification |
Number of contracts |
Recorded investment pre- modification |
Recorded investment post modification |
|||||||||||||||||||
| Office |
2 | $ | 12,211 | $ | 12,211 | 1 | $ | 6,432 | $ | 6,432 | ||||||||||||||
There are $882,000 of commitments to lend additional funds to debtors whose loans have been modified in troubled debt restructuring, and there have been no defaults on modified loans during the periods presented.
Note 6 – Investment Real Estate
Investment real estate by property-type and geographic distribution are as follows:
| December 31, | ||||||||
| 2015 | 2014 | |||||||
| Industrial |
10.9 | % | 13.0 | % | ||||
| Office |
38.1 | 25.0 | ||||||
| Retail |
37.0 | 44.1 | ||||||
| Other |
14.0 | 17.9 | ||||||
|
|
|
|
|
|||||
| Total |
100.0 | % | 100.0 | % | ||||
|
|
|
|
|
|||||
| December 31, | ||||||||
| 2015 | 2014 | |||||||
| East North Central |
11.4 | % | 4.5 | % | ||||
| East South Central |
3.6 | 4.6 | ||||||
| Mountain |
12.6 | 9.6 | ||||||
| Pacific |
5.6 | 7.1 | ||||||
| South Atlantic |
10.1 | 12.2 | ||||||
| West South Central |
50.7 | 55.6 | ||||||
| Other |
6.0 | 6.4 | ||||||
|
|
|
|
|
|||||
| Total |
100.0 | % | 100.0 | % | ||||
|
|
|
|
|
|||||
American National regularly invests in real estate partnerships and joint ventures. American National frequently participates in the design of these entities with the sponsor, but in most cases, its involvement is limited to financing. Through analysis performed by American National, some of these partnerships and joint ventures have been determined to be variable interest entities (“VIEs”). In certain instances, in addition to an economic interest in the entity, American National holds the power to direct the most significant activities of the entity and is deemed the primary beneficiary or consolidator of the entity. The assets of the consolidated VIEs are restricted and must first be used to settle their liabilities. Creditors or beneficial interest holders of these VIEs have no recourse to the general credit of American National, as American National’s obligation is limited to the amount of its committed investment. American National has not provided financial or other support to the VIEs in the form of liquidity arrangements, guarantees, or other commitments to third parties that may affect the fair value or risk of its variable interest in the VIEs in 2015 or 2014.
82
Table of Contents
Index to Financial Statements
Note 6 – Investment Real Estate – (Continued)
The assets and liabilities relating to the VIEs included in the consolidated financial statements are as follows (in thousands):
| December 31, | ||||||||
| 2015 | 2014 | |||||||
| Investment real estate |
$ | 174,264 | $ | 140,032 | ||||
| Short-term investments |
1 | 1 | ||||||
| Cash and cash equivalents |
3,855 | 2,495 | ||||||
| Accrued investment income |
557 | 683 | ||||||
| Other receivables |
8,101 | 7,999 | ||||||
| Other assets |
8,210 | 8,483 | ||||||
|
|
|
|
|
|||||
| Total assets of consolidated VIEs |
$ | 194,988 | $ | 159,693 | ||||
|
|
|
|
|
|||||
| Notes payable |
$ | 128,436 | $ | 108,177 | ||||
| Other liabilities |
19,436 | 8,954 | ||||||
|
|
|
|
|
|||||
| Total liabilities of consolidated VIEs |
$ | 147,872 | $ | 117,131 | ||||
|
|
|
|
|
|||||
The notes payable in the consolidated statements of financial position pertain to the borrowings of the consolidated VIEs. The liability of American National Insurance Company relating to notes payable of the consolidated VIEs is limited to the amount of its direct or indirect investment in the respective ventures, which totaled $34,699,000 and $15,016,000 at December 31, 2015 and 2014, respectively. The total long-term portion of notes payable, $97,026,000, consists of three notes with the following interest rates: 4.0%, one note with adjusted LIBOR plus LIBOR margin, and one note at LIBOR. The long-term notes payable will mature beyond 5 years. The current portion of notes payable, $31,410,000, maturing in 2016, consists of two notes with the following interest: prime plus 0.5%, and a loan with adjusted LIBOR plus LIBOR margin.
For other VIEs in which American National is a partner, it is not the primary beneficiary and these entities are not consolidated, as the major decisions that most significantly impact the economic activities of the VIE require unanimous consent of all partners. The carrying amount and maximum exposure to loss relating to unconsolidated VIEs follows (in thousands):
| December 31, | ||||||||||||||||
| 2015 | 2014 | |||||||||||||||
| Carrying Amount |
Maximum Exposure to Loss |
Carrying Amount |
Maximum Exposure to Loss |
|||||||||||||
| Investment in unconsolidated affiliates |
$ | 236,816 | $ | 236,816 | $ | 157,620 | $ | 157,620 | ||||||||
| Mortgage loans |
212,228 | 212,228 | 172,408 | 172,408 | ||||||||||||
| Accrued investment income |
661 | 661 | 721 | 721 | ||||||||||||
As of December 31, 2015, no real estate investments were classified as held for sale.
83
Table of Contents
Index to Financial Statements
Note 7 – Derivative Instruments
American National purchases over-the-counter equity-indexed options as economic hedges against fluctuations in the equity markets to which equity-indexed products are exposed. Equity-indexed contracts include a fixed host universal-life insurance or annuity contract and an equity-indexed embedded derivative. The detail of derivative instruments is shown below (in thousands, except number of instruments):
| December 31, | ||||||||||||||||||||||||||
| Derivatives Not Designated as Hedging Instruments |
Location in the Consolidated Statements of Financial Position |
2015 | 2014 | |||||||||||||||||||||||
| Number of Instruments |
Notional Amounts |
Estimated Fair Value |
Number of Instruments |
Notional Amounts |
Estimated Fair Value |
|||||||||||||||||||||
| Equity-indexed options |
Other invested assets |
419 | $ | 1,200,600 | $ | 123,007 | 436 | $ | 1,095,300 | $ | 189,449 | |||||||||||||||
| Equity-indexed embedded derivative |
Policyholders’ account balances |
51,815 | 1,067,600 | 242,412 | 42,287 | 961,300 | 208,187 | |||||||||||||||||||
| Derivatives Not Designated as Hedging Instruments |
Location in the Consolidated Statements of Operations |
Gains (Losses) Recognized in Income on Derivatives | ||||||||||||
| Years ended December 31, | ||||||||||||||
| 2015 | 2014 | 2013 | ||||||||||||
| Equity-indexed options |
Net investment income |
$ | (9,103 | ) | $ | 52,071 | $ | 83,307 | ||||||
| Equity-indexed embedded derivative |
Interest credited to policyholders’ account balances |
6,439 | (32,071 | ) | (67,177 | ) | ||||||||
Note 8 – Net Investment Income and Realized Investment Gains (Losses)
Net investment income is shown below (in thousands):
| Years ended December 31, | ||||||||||||
| 2015 | 2014 | 2013 | ||||||||||
| Bonds |
$ | 558,837 | $ | 596,013 | $ | 631,561 | ||||||
| Equity securities |
36,314 | 35,324 | 30,668 | |||||||||
| Mortgage loans |
204,913 | 204,499 | 221,773 | |||||||||
| Real estate |
12,833 | 10,823 | 11,504 | |||||||||
| Options |
(9,103 | ) | 52,071 | 83,307 | ||||||||
| Other invested assets |
31,037 | 34,128 | 37,997 | |||||||||
|
|
|
|
|
|
|
|||||||
| Total |
$ | 834,831 | $ | 932,858 | $ | 1,016,810 | ||||||
|
|
|
|
|
|
|
|||||||
Realized investment gains (losses) are shown below (in thousands):
| Years ended December 31, | ||||||||||||
| 2015 | 2014 | 2013 | ||||||||||
| Bonds |
$ | 16,300 | $ | 25,580 | $ | 25,577 | ||||||
| Equity securities |
60,485 | 22,089 | 35,322 | |||||||||
| Mortgage loans |
(220 | ) | (5,679 | ) | 834 | |||||||
| Real estate |
10,872 | 7,035 | 62,531 | |||||||||
| Other invested assets |
(52 | ) | (963 | ) | (120 | ) | ||||||
|
|
|
|
|
|
|
|||||||
| Total |
$ | 87,385 | $ | 48,062 | $ | 124,144 | ||||||
|
|
|
|
|
|
|
|||||||
Other-than-temporary impairment losses are shown below (in thousands):
| Years ended December 31, | ||||||||||||
| 2015 | 2014 | 2013 | ||||||||||
| Bonds |
$ | (286 | ) | $ | (41 | ) | $ | — | ||||
| Equity securities |
(27,656 | ) | (6,599 | ) | (4,591 | ) | ||||||
|
|
|
|
|
|
|
|||||||
| Total |
$ | (27,942 | ) | $ | (6,640 | ) | $ | (4,591 | ) | |||
|
|
|
|
|
|
|
|||||||
84
Table of Contents
Index to Financial Statements
Note 9 – Fair Value of Financial Instruments
The carrying amount and fair value of financial instruments are shown below (in thousands):
| December 31, | ||||||||||||||||
| 2015 | 2014 | |||||||||||||||
| Carrying Amount |
Fair Value | Carrying Amount |
Fair Value | |||||||||||||
| Financial assets |
||||||||||||||||
| Fixed maturity securities, bonds held-to-maturity |
$ | 7,609,420 | $ | 7,755,553 | $ | 8,225,050 | $ | 8,652,913 | ||||||||
| Fixed maturity securities, bonds available-for-sale |
5,483,916 | 5,483,916 | 4,921,807 | 4,921,807 | ||||||||||||
| Equity securities |
1,514,979 | 1,514,979 | 1,516,978 | 1,516,978 | ||||||||||||
| Equity-indexed options |
123,007 | 123,007 | 189,449 | 189,449 | ||||||||||||
| Mortgage loans on real estate, net of allowance |
3,483,280 | 3,621,978 | 3,359,586 | 3,618,944 | ||||||||||||
| Policy loans |
407,491 | 407,491 | 405,979 | 405,979 | ||||||||||||
| Short-term investments |
460,612 | 460,612 | 431,000 | 431,000 | ||||||||||||
| Separate account assets |
918,446 | 918,446 | 1,001,515 | 1,001,515 | ||||||||||||
|
|
|
|
|
|
|
|
|
|||||||||
| Total financial assets |
$ | 20,001,151 | $ | 20,285,982 | $ | 20,051,364 | $ | 20,738,585 | ||||||||
|
|
|
|
|
|
|
|
|
|||||||||
| Financial liabilities |
||||||||||||||||
| Investment contracts |
$ | 8,787,376 | $ | 8,787,376 | $ | 8,894,747 | $ | 8,894,747 | ||||||||
| Embedded derivative liability for equity-indexed contracts |
242,412 | 242,412 | 208,187 | 208,187 | ||||||||||||
| Notes payable |
128,436 | 128,436 | 108,177 | 108,177 | ||||||||||||
| Separate account liabilities |
918,446 | 918,446 | 1,001,515 | 1,001,515 | ||||||||||||
|
|
|
|
|
|
|
|
|
|||||||||
| Total financial liabilities |
$ | 10,076,670 | $ | 10,076,670 | $ | 10,212,626 | $ | 10,212,626 | ||||||||
|
|
|
|
|
|
|
|
|
|||||||||
Fair value is defined as the price that would be received to sell an asset or paid to transfer a liability. A fair value hierarchy is used to determine fair value based on a hypothetical transaction at the measurement date from the perspective of a market participant. American National has evaluated the types of securities in its investment portfolio to determine an appropriate hierarchy level based upon trading activity and the observability of market inputs. The classification of assets or liabilities within the fair value hierarchy is based on the lowest level of significant input to its valuation. The input levels are defined as follows:
| Level 1 | Unadjusted quoted prices in active markets for identical assets or liabilities. | |
| Level 2 | Quoted prices in markets that are not active or inputs that are observable directly or indirectly. Level 2 inputs include quoted prices for similar assets or liabilities other than quoted prices in Level 1; quoted prices in markets that are not active; or other inputs that are observable or can be derived principally from or corroborated by observable market data for substantially the full term of the assets or liabilities. | |
| Level 3 | Unobservable inputs that are supported by little or no market activity and are significant to the fair value of the assets or liabilities. Unobservable inputs reflect American National’s own assumptions about the assumptions that market participants would use in pricing the asset or liability. Level 3 assets and liabilities include financial instruments whose values are determined using pricing models and third-party evaluation, as well as instruments for which the determination of fair value requires significant management judgment or estimation. | |
Fixed Maturity Securities and Equity Options—American National utilizes a pricing service to estimate fair value measurements. The estimates of fair value for most fixed maturity securities, including municipal bonds, provided by the pricing service are disclosed as Level 2 measurements as the estimates are based on observable market information rather than market quotes.
85
Table of Contents
Index to Financial Statements
Note 9 – Fair Value of Financial Instruments – (Continued)
The pricing service utilizes market quotations for fixed maturity securities that have quoted prices in active markets. Since fixed maturity securities generally do not trade on a daily basis, the pricing service prepares estimates of fair value measurements for these securities using its proprietary pricing applications, which include available relevant market information, benchmark curves, benchmarking of like securities, sector groupings and matrix pricing. Additionally, an option adjusted spread model is used to develop prepayment and interest rate scenarios.
The pricing service evaluates each asset class based on relevant market information, credit information, perceived market movements and sector news. The market inputs utilized in the pricing evaluation, listed in the approximate order of priority, include: benchmark yields, reported trades, broker/dealer quotes, issuer spreads, two-sided markets, benchmark securities, bids, offers, reference data, and economic events. The extent of the use of each market input depends on the asset class and the market conditions. Depending on the security, the priority of the use of inputs may change or some market inputs may not be relevant. For some securities, additional inputs may be necessary.
American National has reviewed the inputs and methodology used and the techniques applied by the pricing service to produce quotes that represent the fair value of a specific security. The review confirms that the pricing service is utilizing information from observable transactions or a technique that represents a market participant’s assumptions. American National does not adjust quotes received from the pricing service. The pricing service utilized by American National has indicated that they will only produce an estimate of fair value if there is objectively verifiable information available.
American National holds a small amount of private placement debt and fixed maturity securities that have characteristics that make them unsuitable for matrix pricing. For these securities, a quote from an independent broker (typically a market maker) is obtained. Due to the disclaimers on the quotes that indicate that the price is indicative only, American National includes these fair value estimates in Level 3.
For securities priced using a quote from an independent broker, such as the equity options and certain fixed maturity securities, American National uses a market-based fair value analysis to validate the reasonableness of prices received from an independent broker. Price variances above a certain threshold are analyzed further to determine if any pricing issue exists. This analysis is performed quarterly.
Equity Securities—For publicly-traded equity securities, prices are received from a nationally recognized pricing service that are based on observable market transactions, and these securities are classified as Level 1 measurements. For certain preferred stock, current market quotes in active markets are unavailable. In these instances, an estimate of fair value is received from the pricing service. The service utilizes similar methodologies to price preferred stocks as it does for fixed maturity securities. These estimates are disclosed as Level 2 measurements. American National tests the accuracy of the information provided by reference to other services regularly.
Mortgage Loans—The fair value of mortgage loans is estimated using discounted cash flow analyses on a loan by loan basis by applying a discount rate to expected cash flows from future installment and balloon payments. The discount rate takes into account general market trends and specific credit risk trends for the individual loan. Factors used to arrive at the discount rate include inputs from spreads based on U.S. Treasury notes and the loan’s credit quality, region, property type, lien priority, payment type and current status.
Embedded Derivative—The embedded derivative liability for equity-indexed contracts is measured at fair value and is recalculated each reporting period using equity option pricing models. To validate the assumptions used to price the embedded derivative liability, American National measures and compares embedded derivative returns against the returns of equity options held to hedge the liability cash flows.
86
Table of Contents
Index to Financial Statements
Note 9 – Fair Value of Financial Instruments – (Continued)
The significant unobservable input used to calculate the fair value of the embedded derivatives is equity option implied volatility. An increase in implied volatility will result in an increase in the value of the equity-indexed embedded derivatives, all other things being equal. At December 31, 2015 and 2014, the one year implied volatility used to estimate embedded derivative value was 17.5% and 17.3%, respectively.
Other Financial Instruments—Other financial instruments classified as Level 3 measurements, as there is little or no market activity, are as follows:
Policy loans—The carrying value of policy loans is the outstanding balance plus any accrued interest. Due to the collateralized nature of policy loans such that they cannot be separated from the policy contracts and the unpredictable timing of repayments and the fact that settlement is at outstanding value, American National believes the carrying value of policy loans approximates fair value.
Investment contracts —The carrying value of investment contracts is equivalent to the accrued account balance. The accrued account balance consists of deposits, net of withdrawals, plus or minus interest credited, fees and charges assessed and other adjustments. American National believes that the carrying value of investment contracts approximates fair value because the majority of these contracts’ interest rates reset to current rates offered at anniversary.
Notes payable— Notes payable are carried at outstanding principal balance. The carrying value of the notes payable approximates fair value because the underlying interest rates approximate market rates at the balance sheet date.
87
Table of Contents
Index to Financial Statements
Note 9 – Fair Value of Financial Instruments – (Continued)
Quantitative Disclosures
The fair value hierarchy measurements of the financial instruments are shown below (in thousands):
| Fair Value Measurement as of December 31, 2015 | ||||||||||||||||
| Total Fair Value |
Level 1 | Level 2 | Level 3 | |||||||||||||
| Financial assets |
||||||||||||||||
| Fixed maturity securities, bonds held-to-maturity |
||||||||||||||||
| U.S. states and political subdivisions |
$ | 346,517 | $ | — | $ | 346,517 | $ | — | ||||||||
| Foreign governments |
4,968 | — | 4,968 | — | ||||||||||||
| Corporate debt securities |
7,091,670 | — | 7,010,165 | 81,505 | ||||||||||||
| Residential mortgage-backed securities |
294,200 | — | 293,267 | 933 | ||||||||||||
| Collateralized debt securities |
2,024 | — | 2,024 | — | ||||||||||||
| Other debt securities |
16,174 | — | 12,355 | 3,819 | ||||||||||||
|
|
|
|
|
|
|
|
|
|||||||||
| Total bonds held-to-maturity |
7,755,553 | — | 7,669,296 | 86,257 | ||||||||||||
|
|
|
|
|
|
|
|
|
|||||||||
| Fixed maturity securities, bonds available-for-sale |
||||||||||||||||
| U.S. treasury and government |
24,692 | — | 24,692 | — | ||||||||||||
| U.S. states and political subdivisions |
972,491 | — | 969,996 | 2,495 | ||||||||||||
| Foreign governments |
6,733 | — | 6,733 | — | ||||||||||||
| Corporate debt securities |
4,444,622 | — | 4,431,263 | 13,359 | ||||||||||||
| Residential mortgage-backed securities |
27,364 | — | 24,958 | 2,406 | ||||||||||||
| Collateralized debt securities |
8,014 | — | 6,144 | 1,870 | ||||||||||||
|
|
|
|
|
|
|
|
|
|||||||||
| Total bonds available-for-sale |
5,483,916 | — | 5,463,786 | 20,130 | ||||||||||||
|
|
|
|
|
|
|
|
|
|||||||||
| Equity securities |
||||||||||||||||
| Common stock |
1,491,029 | 1,491,029 | — | — | ||||||||||||
| Preferred stock |
23,950 | 23,950 | — | — | ||||||||||||
|
|
|
|
|
|
|
|
|
|||||||||
| Total equity securities |
1,514,979 | 1,514,979 | — | — | ||||||||||||
|
|
|
|
|
|
|
|
|
|||||||||
| Options |
123,007 | — | — | 123,007 | ||||||||||||
| Mortgage loans on real estate |
3,621,978 | — | 3,621,978 | — | ||||||||||||
| Policy loans |
407,491 | — | — | 407,491 | ||||||||||||
| Short-term investments |
460,612 | — | 460,612 | — | ||||||||||||
| Separate account assets |
918,446 | — | 918,446 | — | ||||||||||||
|
|
|
|
|
|
|
|
|
|||||||||
| Total financial assets |
$ | 20,285,982 | $ | 1,514,979 | $ | 18,134,118 | $ | 636,885 | ||||||||
|
|
|
|
|
|
|
|
|
|||||||||
| Financial liabilities |
||||||||||||||||
| Investment contracts |
$ | 8,787,376 | $ | — | $ | — | $ | 8,787,376 | ||||||||
| Embedded derivative liability for equity-indexed contracts |
242,412 | — | — | 242,412 | ||||||||||||
| Notes payable |
128,436 | — | — | 128,436 | ||||||||||||
| Separate account liabilities |
918,446 | — | 918,446 | — | ||||||||||||
|
|
|
|
|
|
|
|
|
|||||||||
| Total financial liabilities |
$ | 10,076,670 | $ | — | $ | 918,446 | $ | 9,158,224 | ||||||||
|
|
|
|
|
|
|
|
|
|||||||||
88
Table of Contents
Index to Financial Statements
Note 9 – Fair Value of Financial Instruments – (Continued)
| Fair Value Measurement as of December 31, 2014 | ||||||||||||||||
| Total Fair Value |
Level 1 | Level 2 | Level 3 | |||||||||||||
| Financial assets |
||||||||||||||||
| Fixed maturity securities, bonds held-to-maturity |
||||||||||||||||
| U.S. states and political subdivisions |
$ | 349,760 | $ | — | $ | 349,760 | $ | — | ||||||||
| Foreign governments |
30,423 | — | 30,423 | — | ||||||||||||
| Corporate debt securities |
7,894,725 | — | 7,833,564 | 61,161 | ||||||||||||
| Residential mortgage-backed securities |
357,635 | — | 356,670 | 965 | ||||||||||||
| Collateralized debt securities |
2,470 | — | — | 2,470 | ||||||||||||
| Other debt securities |
17,900 | — | 12,975 | 4,925 | ||||||||||||
|
|
|
|
|
|
|
|
|
|||||||||
| Total bonds held-to-maturity |
8,652,913 | — | 8,583,392 | 69,521 | ||||||||||||
|
|
|
|
|
|
|
|
|
|||||||||
| Fixed maturity securities, bonds available-for-sale |
||||||||||||||||
| U.S. treasury and government |
23,233 | — | 23,233 | — | ||||||||||||
| U.S. states and political subdivisions |
837,616 | — | 835,106 | 2,510 | ||||||||||||
| Foreign governments |
7,021 | — | 7,021 | — | ||||||||||||
| Corporate debt securities |
4,000,049 | — | 3,941,925 | 58,124 | ||||||||||||
| Residential mortgage-backed securities |
42,399 | — | 40,473 | 1,926 | ||||||||||||
| Collateralized debt securities |
11,489 | — | 9,616 | 1,873 | ||||||||||||
|
|
|
|
|
|
|
|
|
|||||||||
| Total bonds available-for-sale |
4,921,807 | — | 4,857,374 | 64,433 | ||||||||||||
|
|
|
|
|
|
|
|
|
|||||||||
| Equity securities |
||||||||||||||||
| Common stock |
1,487,125 | 1,487,125 | — | — | ||||||||||||
| Preferred stock |
29,853 | 29,853 | — | — | ||||||||||||
|
|
|
|
|
|
|
|
|
|||||||||
| Total equity securities |
1,516,978 | 1,516,978 | — | — | ||||||||||||
|
|
|
|
|
|
|
|
|
|||||||||
| Options |
189,449 | — | — | 189,449 | ||||||||||||
| Mortgage loans on real estate |
3,618,944 | — | 3,618,944 | — | ||||||||||||
| Policy loans |
405,979 | — | — | 405,979 | ||||||||||||
| Short-term investments |
431,000 | — | 431,000 | — | ||||||||||||
| Separate account assets |
1,001,515 | — | 1,001,515 | — | ||||||||||||
|
|
|
|
|
|
|
|
|
|||||||||
| Total financial assets |
$ | 20,738,585 | $ | 1,516,978 | $ | 18,492,225 | $ | 729,382 | ||||||||
|
|
|
|
|
|
|
|
|
|||||||||
| Financial liabilities |
||||||||||||||||
| Investment contracts |
$ | 8,894,747 | $ | — | $ | — | $ | 8,894,747 | ||||||||
| Embedded derivative liability for equity-indexed contracts |
208,187 | — | — | 208,187 | ||||||||||||
| Notes payable |
108,177 | — | — | 108,177 | ||||||||||||
| Separate account liabilities |
1,001,515 | — | 1,001,515 | — | ||||||||||||
|
|
|
|
|
|
|
|
|
|||||||||
| Total financial liabilities |
$ | 10,212,626 | $ | — | $ | 1,001,515 | $ | 9,211,111 | ||||||||
|
|
|
|
|
|
|
|
|
|||||||||
89
Table of Contents
Index to Financial Statements
Note 9 – Fair Value of Financial Instruments – (Continued)
For financial instruments measured at fair value on a recurring basis using Level 3 inputs during the period, a reconciliation of the beginning and ending balances is shown below (in thousands):
| Level 3 | ||||||||||||
| Assets | Liability | |||||||||||
| Investment | Equity-Indexed | Embedded | ||||||||||
| Securities | Options | Derivative | ||||||||||
| Balance at December 31, 2012 |
$ | 107,036 | $ | 82,625 | $ | 75,032 | ||||||
| Total realized and unrealized investment gains (losses) included in other comprehensive income |
9,355 | — | — | |||||||||
| Net fair value change included in realized gains (losses) |
1,082 | — | — | |||||||||
| Net gain (loss) for derivatives included in net investment income |
— | 76,268 | — | |||||||||
| Net change included in interest credited |
— | — | 67,177 | |||||||||
| Purchases, sales and settlements or maturities |
||||||||||||
| Purchases |
2,153 | 15,906 | — | |||||||||
| Sales |
(10,452 | ) | — | — | ||||||||
| Settlements or maturities |
(7,268 | ) | (10,046 | ) | — | |||||||
| Premiums less benefits |
— | — | 6,226 | |||||||||
| Gross transfers out of Level 3 |
(53,602 | ) | — | — | ||||||||
|
|
|
|
|
|
|
|||||||
| Balance at December 31, 2013 |
48,304 | 164,753 | 148,435 | |||||||||
|
|
|
|
|
|
|
|||||||
| Total realized and unrealized investment gains (losses) included in other comprehensive income |
(11,746 | ) | — | — | ||||||||
| Net fair value change included in realized gains (losses) |
13,056 | — | — | |||||||||
| Net gain (loss) for derivatives included in net investment income |
— | 44,492 | — | |||||||||
| Net change included in interest credited |
— | — | 32,071 | |||||||||
| Purchases, sales and settlements or maturities |
||||||||||||
| Purchases |
— | 16,844 | — | |||||||||
| Sales |
(37,803 | ) | — | — | ||||||||
| Settlements or maturities |
(10 | ) | (36,640 | ) | — | |||||||
| Premiums less benefits |
— | — | 27,681 | |||||||||
| Gross transfers into Level 3 |
54,241 | — | — | |||||||||
| Gross transfers out of Level 3 |
(1,609 | ) | — | — | ||||||||
|
|
|
|
|
|
|
|||||||
| Balance at December 31, 2014 |
64,433 | 189,449 | 208,187 | |||||||||
|
|
|
|
|
|
|
|||||||
| Total realized and unrealized investment gains (losses) included in other comprehensive income |
427 | — | — | |||||||||
| Net fair value change included in realized gains (losses) |
— | — | — | |||||||||
| Net gain (loss) for derivatives included in net investment income |
— | (13,889 | ) | — | ||||||||
| Net change included in interest credited |
— | — | (6,439 | ) | ||||||||
| Purchases, sales and settlements or maturities |
||||||||||||
| Purchases |
— | 22,369 | — | |||||||||
| Sales |
(2 | ) | (55,279 | ) | — | |||||||
| Settlements or maturities |
(479 | ) | (19,643 | ) | — | |||||||
| Premiums less benefits |
— | — | 40,664 | |||||||||
| Gross transfers into Level 3 |
10,228 | — | — | |||||||||
| Gross transfers out of Level 3 |
(54,477 | ) | — | — | ||||||||
|
|
|
|
|
|
|
|||||||
| Balance at December 31, 2015 |
$ | 20,130 | $ | 123,007 | $ | 242,412 | ||||||
|
|
|
|
|
|
|
|||||||
Within the net gain (loss) for derivatives included in net investment income were unrealized losses of $50,114,000 relating to assets still held at December 31, 2015 and gains of $24,108,000 and $72,071,000 at December 31, 2014 and 2013, respectively.
There were no transfers between Level 1 and Level 2 fair value hierarchies. The transfers into Level 3 during the years ended December 31, 2015 and 2014, were the result of existing securities no longer being priced by the third-party pricing service at the end of the period. American National’s valuation of these securities involves judgment regarding assumptions market participants would use including quotes from independent brokers. The transfers out of Level 3 were securities being priced by a third-party service at the end of the period, using inputs that are observable or derived from market data, which resulted in classification of these assets as Level 2.
90
Table of Contents
Index to Financial Statements
Note 10 – Deferred Policy Acquisition Costs
Deferred policy acquisition costs are shown below (in thousands):
| Accident | Property | |||||||||||||||||||
| Life | Annuity | & Health | & Casualty | Total | ||||||||||||||||
| Balance at December 31, 2012 |
$ | 653,416 | $ | 406,540 | $ | 49,206 | $ | 138,513 | $ | 1,247,675 | ||||||||||
| Additions |
107,410 | 49,397 | 13,263 | 208,889 | 378,959 | |||||||||||||||
| Amortization |
(82,658 | ) | (85,756 | ) | (15,249 | ) | (225,131 | ) | (408,794 | ) | ||||||||||
| Effect of change in unrealized gains on available-for-sale securities |
5,916 | 53,977 | — | — | 59,893 | |||||||||||||||
|
|
|
|
|
|
|
|
|
|
|
|||||||||||
| Net change |
30,668 | 17,618 | (1,986 | ) | (16,242 | ) | 30,058 | |||||||||||||
|
|
|
|
|
|
|
|
|
|
|
|||||||||||
| Balance at December 31, 2013 |
684,084 | 424,158 | 47,220 | 122,271 | 1,277,733 | |||||||||||||||
|
|
|
|
|
|
|
|
|
|
|
|||||||||||
| Additions |
110,195 | 47,400 | 19,530 | 213,237 | 390,362 | |||||||||||||||
| Amortization |
(78,181 | ) | (79,135 | ) | (18,966 | ) | (223,658 | ) | (399,940 | ) | ||||||||||
| Effect of change in unrealized gains on available-for-sale securities |
(4,629 | ) | (9,982 | ) | — | — | (14,611 | ) | ||||||||||||
|
|
|
|
|
|
|
|
|
|
|
|||||||||||
| Net change |
27,385 | (41,717 | ) | 564 | (10,421 | ) | (24,189 | ) | ||||||||||||
|
|
|
|
|
|
|
|
|
|
|
|||||||||||
| Balance at December 31, 2014 |
711,469 | 382,441 | 47,784 | 111,850 | 1,253,544 | |||||||||||||||
|
|
|
|
|
|
|
|
|
|
|
|||||||||||
| Additions |
108,615 | 64,724 | 20,249 | 236,785 | 430,373 | |||||||||||||||
| Amortization |
(77,567 | ) | (81,793 | ) | (23,643 | ) | (235,585 | ) | (418,588 | ) | ||||||||||
| Effect of change in unrealized gains on available-for-sale securities |
13,506 | 45,834 | — | — | 59,340 | |||||||||||||||
|
|
|
|
|
|
|
|
|
|
|
|||||||||||
| Net change |
44,554 | 28,765 | (3,394 | ) | 1,200 | 71,125 | ||||||||||||||
|
|
|
|
|
|
|
|
|
|
|
|||||||||||
| Balance at December 31, 2015 |
$ | 756,023 | $ | 411,206 | $ | 44,390 | $ | 113,050 | $ | 1,324,669 | ||||||||||
|
|
|
|
|
|
|
|
|
|
|
|||||||||||
Commissions comprise the majority of the additions to deferred policy acquisition costs for each year.
Note 11 – Liability for Future Policy Benefits and Policyholder Account Balances
American National establishes liabilities for amounts payable under insurance and annuity policies. Generally, amounts are payable over an extended period of time and related liabilities are calculated as the present value of expected benefit payments reduced by the present value of expected premiums. Such liabilities are established on a block of business based on methods and underlying assumptions in accordance with GAAP and applicable actuarial standards. Principal assumptions used in the establishment of liabilities for future policy benefits are mortality, morbidity, policy lapse, renewal, retirement, disability incidence, disability termination, investment return, inflation, expenses, and other contingent events as appropriate to the respective product type.
Future policy benefits for non-participating traditional life insurance are equal to the aggregate of the present value of expected benefit payments and related expenses less the present value of expected net premiums. Assumptions as to mortality and persistency are based upon American National’s experience when the basis of the liability is established. Interest rates for the aggregate future policy benefit liabilities range from 3.0% to 8.0%.
Future policy benefit liabilities for participating traditional life insurance are equal to the aggregate of (i) net level premium reserves for death and endowment policy benefits (calculated based upon the non-forfeiture interest rate, ranging from 2.5% to 5.5%) and mortality rates guaranteed in calculating the cash surrender values described in such contracts; and (ii) the liability for terminal dividends.
Future policy benefit liabilities for individual fixed deferred annuities after annuitization and single premium immediate annuities are equal to the present value of expected future payments. The interest rate used in establishing such liabilities range from 3.0% to 6.0% for all policies in-force.
91
Table of Contents
Index to Financial Statements
Note 11 – Liability for Future Policy Benefits and Policyholder Account Balances – (Continued)
Future policy benefit liabilities for non-medical health insurance are calculated using the net level premium method and assumptions as to future morbidity, withdrawals and interest, which provide a margin for adverse deviation. The interest rate used in establishing such liabilities range from 3.5% to 8.0%.
Future policy benefit liabilities for disabled lives are estimated using the present value of benefits method and experience assumptions as to claim terminations, expenses and interest. The interest rate used in establishing such liabilities range from 3.0% to 4.5%.
Liabilities for universal life secondary guarantees and paid-up guarantees are determined by estimating the expected value of death benefits payable when the account balance is projected to be zero and recognizing those benefits ratably over the accumulation period based on total expected assessments. American National regularly evaluates estimates used and adjusts the additional liability balances with a related charge or credit to benefit expense, if actual experience or other evidence suggests that earlier assumptions should be revised. The assumptions used in estimating the secondary and paid-up guarantee liabilities are consistent with those used for amortizing DAC, and are thus subject to the same variability and risk. The assumptions of investment performance and volatility for variable products are consistent with historical Standard & Poor’s experience. The benefits used in calculating the liabilities are based on the average benefits payable over a range of scenarios.
American National periodically reviews its estimates of actuarial liabilities for future policy benefits and compares them with its actual experience. Differences between actual experience and the assumptions used in pricing these policies, guarantees and riders and in the establishment of the related liabilities result in variances in profit and could result in losses. The effects of changes in such estimated liabilities are included in the results of operations in the period in which the changes occur.
Policyholder account balances relate to investment-type contracts and universal life-type policies. Investment-type contracts principally include traditional individual fixed annuities in the accumulation phase and non-variable group annuity contracts. Policyholder account balances are equal to (i) policy account values, which consist of an accumulation of gross premium payments; (ii) credited interest, ranging from 1.0% to 8.0% (some annuities have enhanced first year crediting rates ranging from 1.0% to 7.0%), less expenses, mortality charges, and withdrawals; and (iii) fair value adjustments.
Note 12 – Liability for Unpaid Claims and Claim Adjustment Expenses
The liability for unpaid claims and claim adjustment expenses (“claims”) for accident and health, and property and casualty insurance is included in “Policy and contract claims” in the consolidated statements of financial position and is the amount estimated for claims that have been reported but not settled and IBNR claims. Liability for unpaid claims are estimated based upon American National’s historical experience and actuarial assumptions that consider the effects of current developments, anticipated trends and risk management programs and reduced for anticipated salvage and subrogation. The effects of the changes are included in the consolidated results of operations in the period in which the changes occur.
92
Table of Contents
Index to Financial Statements
Note 12 – Liability for Unpaid Claims and Claim Adjustment Expenses – (Continued)
Information regarding the liability for unpaid claims is shown below (in thousands):
| Years ended December 31, | ||||||||||||
| 2015 | 2014 | 2013 | ||||||||||
| Unpaid claims balance, beginning |
$ | 1,132,394 | $ | 1,096,301 | $ | 1,168,047 | ||||||
| Less reinsurance recoverables |
245,906 | 215,164 | 256,885 | |||||||||
|
|
|
|
|
|
|
|||||||
| Net beginning balance |
886,488 | 881,137 | 911,162 | |||||||||
|
|
|
|
|
|
|
|||||||
| Incurred related to |
||||||||||||
| Current |
950,228 | 940,466 | 938,620 | |||||||||
| Prior years |
(22,830 | ) | (44,806 | ) | (46,872 | ) | ||||||
|
|
|
|
|
|
|
|||||||
| Total incurred claims |
927,398 | 895,660 | 891,748 | |||||||||
|
|
|
|
|
|
|
|||||||
| Paid claims related to |
||||||||||||
| Current |
580,476 | 561,887 | 578,831 | |||||||||
| Prior years |
346,445 | 328,422 | 342,942 | |||||||||
|
|
|
|
|
|
|
|||||||
| Total paid claims |
926,921 | 890,309 | 921,773 | |||||||||
|
|
|
|
|
|
|
|||||||
| Net balance |
886,965 | 886,488 | 881,137 | |||||||||
| Plus reinsurance recoverables |
217,337 | 245,906 | 215,164 | |||||||||
|
|
|
|
|
|
|
|||||||
| Unpaid claims balance, ending |
$ | 1,104,302 | $ | 1,132,394 | $ | 1,096,301 | ||||||
|
|
|
|
|
|
|
|||||||
The net and gross reserve calculations have shown favorable development as a result of favorable loss emergence compared to what was implied by the loss development patterns used in the original estimation of losses in prior years. Estimates for ultimate incurred claims attributable to insured events of prior years decreased by approximately $22,830,000 in 2015 and $44,806,000 in 2014 and $46,872,000 in 2013, reflecting lower-than-anticipated losses in the personal auto, other liability, and commercial multi-peril lines of business.
Note 13 – Reinsurance
American National reinsures portions of certain life insurance policies to provide a greater diversification of risk and manage exposure on larger risks. For the issue ages zero to 65, the maximum amount that would be retained by one life insurance company (American National) would be $1,500,000 individual life, $250,000 individual accidental death, $100,000 group life, and $125,000 credit life (total $1,975,000). If individual, group and credit insurance were all in force at the same time, the maximum risk on any one life could be $3,775,000. For the issue ages 66 and over, the maximum amount that would be retained by one life insurance company (American National) would be $700,000 individual life, $250,000 individual accidental death, $100,000 group life, and $125,000 credit life (total $1,175,000). If individual, group and credit insurance were all in force at the same time, the maximum risk on any one life could be $2,750,000.
For the Property and Casualty segment, American National retained the first $1,000,000 of loss per risk in 2015. For 2016, American National will retain the first $500,000 of loss per workers’ compensation risk and $1,500,000 of loss per non-workers’ compensation risk. Workers’ compensation reinsurance coverage for losses between $500,000 and $1,000,000 follows satisfaction of a $2,000,000 annual aggregate deductible. Reinsurance covers up to $6,000,000 of property and liability losses per risk. For 2015, additional excess property per risk coverage was purchased to cover risks up to $20,000,000, and excess casualty clash coverage was purchased to cover losses up to $60,000,000. Excess casualty clash covers losses incurred as a result of one casualty event involving multiple policies, excess policy limits, and extra contractual obligations. Facultative reinsurance cover is purchased for individual risks attaching at $20,000,000, as needed. Corporate catastrophe coverage is also in place for losses up to a $500,000,000 event. Catastrophe aggregate reinsurance coverage is also purchased. This coverage is provided by two contracts. The first contract provides for $30,000,000 of coverage after $90,000,000 of aggregated catastrophe losses has been reached. The first $10,000,000 of each catastrophe loss contributes to the $90,000,000 aggregation of losses. This catastrophe aggregate reinsurance coverage was placed at 97.5% for 2015 and increased to 100% for 2016. The second aggregate contract is the Stretch & Aggregate cover. It consists of a $35,000,000 annual limit available either wholly or in part across two layers. The first layer is 8.75% of $400,000,000 excess of $100,000,000 on an occurrence basis. The second layer provides aggregate protection. Subject loss is $35,000,000 excess of $5,000,000 of each catastrophe. Recoveries follow satisfaction of a $45,000,000 annual aggregate deductible. This cover was placed at 100% on July 1, 2014 and again on July 1, 2015. It is in place until June 30, 2016. American National expects to place the cover again on July 1, 2016.
93
Table of Contents
Index to Financial Statements
Note 13 – Reinsurance – (Continued)
American National remains primarily liable with respect to any reinsurance ceded, and would bear the entire loss if the reinsurer does not meet their obligations under any reinsurance treaties. American National had amounts recoverable from reinsurers of $413,881,000 and $428,654,000 at December 31, 2015 and 2014, respectively. None of the amount outstanding at December 31, 2015 is the subject of litigation or is in dispute with the reinsurers involved. Management believes the unfavorable resolution of any dispute that may arise would not have a material impact on American National’s consolidated financial statements.
The amounts in the consolidated financial statements include the impact of reinsurance. Information regarding the effect of reinsurance is shown below (in thousands):
| Years ended December 31, | ||||||||||||
| 2015 | 2014 | 2013 | ||||||||||
| Direct premiums |
$ | 2,069,434 | $ | 2,049,447 | $ | 1,970,400 | ||||||
| Reinsurance premiums assumed from other companies |
188,368 | 227,076 | 189,067 | |||||||||
| Reinsurance premiums ceded to other companies |
(419,283 | ) | (460,552 | ) | (423,941 | ) | ||||||
|
|
|
|
|
|
|
|||||||
| Net premiums |
$ | 1,838,519 | $ | 1,815,971 | $ | 1,735,526 | ||||||
|
|
|
|
|
|
|
|||||||
Life insurance in-force and related reinsurance amounts are shown below (in thousands):
| December 31, | ||||||||||||
| 2015 | 2014 | 2013 | ||||||||||
| Direct life insurance in-force |
$ | 90,194,532 | $ | 85,570,057 | $ | 80,038,270 | ||||||
| Reinsurance risks assumed from other companies |
120 | 6,007 | 32,019 | |||||||||
| Reinsurance risks ceded to other companies |
(29,891,183 | ) | (30,007,131 | ) | (30,577,123 | ) | ||||||
|
|
|
|
|
|
|
|||||||
| Net life insurance in-force |
$ | 60,303,469 | $ | 55,568,933 | $ | 49,493,166 | ||||||
|
|
|
|
|
|
|
|||||||
Note 14 – Federal Income Taxes
A reconciliation of the effective tax rate to the statutory federal tax rate is shown below (in thousands, except percentages):
| Years ended December 31, | ||||||||||||||||||||||||
| 2015 | 2014 | 2013 | ||||||||||||||||||||||
| (As Adjusted) | (As Adjusted) | |||||||||||||||||||||||
| Amount | Rate | Amount | Rate | Amount | Rate | |||||||||||||||||||
| Income tax on pre-tax income |
$ | 121,134 | 35.0 | % | $ | 115,061 | 35.0 | % | $ | 126,865 | 35.0 | % | ||||||||||||
| Tax-exempt investment income |
(7,589 | ) | (2.2 | ) | (6,680 | ) | (2.0 | ) | (6,366 | ) | (1.8 | ) | ||||||||||||
| Dividend exclusion |
(8,183 | ) | (2.4 | ) | (7,620 | ) | (2.3 | ) | (6,928 | ) | (1.9 | ) | ||||||||||||
| Miscellaneous tax credits, net |
(9,103 | ) | (2.6 | ) | (7,888 | ) | (2.4 | ) | (7,757 | ) | (2.1 | ) | ||||||||||||
| Low income housing tax credit expense |
4,862 | 1.4 | 4,583 | 1.4 | 8,434 | 2.3 | ||||||||||||||||||
| Other items, net |
2,599 | 0.8 | (842 | ) | (0.3 | ) | (6,173 | ) | (1.7 | ) | ||||||||||||||
|
|
|
|
|
|
|
|
|
|
|
|
|
|||||||||||||
| Total |
$ | 103,720 | 30.0 | % | $ | 96,614 | 29.4 | % | $ | 108,075 | 29.8 | % | ||||||||||||
|
|
|
|
|
|
|
|
|
|
|
|
|
|||||||||||||
American National made income tax payments of $80,759,000, $61,821,000 and $73,993,000 during 2015, 2014, and 2013, respectively.
94
Table of Contents
Index to Financial Statements
Note 14 – Federal Income Taxes – (Continued)
The tax effects of temporary differences that gave rise to the deferred tax assets and liabilities are shown below (in thousands):
| December 31, | ||||||||
| 2015 | 2014 | |||||||
| (As Adjusted) | ||||||||
| DEFERRED TAX ASSETS |
||||||||
| Invested assets, principally due to impairment losses |
$ | 58,234 | $ | 58,375 | ||||
| Investment in bonds, principally due to differences between GAAP and tax basis |
6,780 | 1,897 | ||||||
| Investment in real estate and other invested assets, principally due to investment valuation allowances |
7,867 | 12,280 | ||||||
| Policyholder funds, principally due to policy reserve discount |
181,003 | 205,821 | ||||||
| Policyholder funds, principally due to unearned premium reserve |
33,214 | 32,153 | ||||||
| Participating policyholders’ surplus |
50,648 | 46,672 | ||||||
| Pension |
77,976 | 73,604 | ||||||
| Commissions and other expenses |
7,003 | 6,998 | ||||||
| Other assets |
33,150 | 29,939 | ||||||
| Tax carryforwards |
— | 1,651 | ||||||
|
|
|
|
|
|||||
| Gross deferred tax assets |
455,875 | 469,390 | ||||||
|
|
|
|
|
|||||
| DEFERRED TAX LIABILITIES |
||||||||
| Marketable securities, principally due to net unrealized gains |
265,577 | 361,352 | ||||||
| Deferred policy acquisition costs, due to difference between GAAP and tax amortization methods |
355,416 | 331,274 | ||||||
| Property, plant and equipment, principally due to difference between GAAP and tax depreciation methods |
23,636 | 16,995 | ||||||
| Other liabilities |
30,541 | 46,944 | ||||||
|
|
|
|
|
|||||
| Gross deferred tax liabilities |
675,170 | 756,565 | ||||||
|
|
|
|
|
|||||
| Total net deferred tax |
$ | (219,295 | ) | $ | (287,175 | ) | ||
|
|
|
|
|
|||||
Management believes that a sufficient level of taxable income will be achieved over time to utilize the deferred tax assets in the consolidated federal tax return; therefore, no valuation allowance was recorded as of December 31, 2015 and 2014.
The statute of limitations for the examination of federal income tax returns by the Internal Revenue Service for years 2006 to 2009 has been extended. In the opinion of management, all prior year deficiencies have been paid or adequate provisions have been made for any tax deficiencies that may be upheld. No provision for penalties was established, and no interest expense was incurred for 2015 or 2014 relating to uncertain tax positions. Management does not believe there are any uncertain tax benefits that could be recognized within the next twelve months that would decrease American National’s effective tax rate.
95
Table of Contents
Index to Financial Statements
Note 15 – Accumulated Other Comprehensive Income
The components of and changes in the accumulated other comprehensive income (“AOCI”), and the related tax effects, are shown below (in thousands):
| Net Unrealized Gains (Losses) on Securities |
Defined Benefit Pension Plan Adjustments |
Foreign Currency Adjustments |
AOCI | |||||||||||||
| Balance at December 31, 2012 |
$ | 370,842 | $ | (129,003 | ) | $ | 171 | $ | 242,010 | |||||||
|
|
|
|
|
|
|
|
|
|||||||||
| Amounts reclassified from AOCI (net of tax benefit $14,757 and expense $6,204) |
(27,407 | ) | 11,522 | — | (15,885 | ) | ||||||||||
| Unrealized holding gains arising during the period (net of tax expense $41,970) |
77,035 | — | — | 77,035 | ||||||||||||
| Unrealized adjustment to DAC (net of tax expense $20,931) |
38,962 | — | — | 38,962 | ||||||||||||
| Unrealized losses on investments attributable to participating policyholders’ interest (net of tax benefit $805) |
(1,495 | ) | — | — | (1,495 | ) | ||||||||||
| Actuarial gain arising during the period (net of tax expense of $39,630) |
— | 73,597 | — | 73,597 | ||||||||||||
| Foreign currency adjustment (net of tax benefit $276) |
— | — | (512 | ) | (512 | ) | ||||||||||
|
|
|
|
|
|
|
|
|
|||||||||
| Balance at December 31, 2013 |
457,937 | (43,884 | ) | (341 | ) | 413,712 | ||||||||||
|
|
|
|
|
|
|
|
|
|||||||||
| Amounts reclassified from AOCI (net of tax benefit $12,379 and expense $1,547) |
(22,990 | ) | 2,873 | — | (20,117 | ) | ||||||||||
| Unrealized holding gains arising during the period (net of tax expense $79,535) |
147,709 | — | — | 147,709 | ||||||||||||
| Unrealized adjustment to DAC (net of tax benefit $5,986) |
(8,625 | ) | — | — | (8,625 | ) | ||||||||||
| Unrealized losses on investments attributable to participating policyholders’ interest (net of tax benefit $3,166) |
(5,880 | ) | — | — | (5,880 | ) | ||||||||||
| Actuarial loss arising during the period (net of tax benefit of $18,880) |
— | (35,063 | ) | — | (35,063 | ) | ||||||||||
| Foreign currency adjustment (net of tax benefit $514) |
— | — | (954 | ) | (954 | ) | ||||||||||
|
|
|
|
|
|
|
|
|
|||||||||
| Balance at December 31, 2014 |
568,151 | (76,074 | ) | (1,295 | ) | 490,782 | ||||||||||
|
|
|
|
|
|
|
|
|
|||||||||
| Amounts reclassified from AOCI (net of tax benefit $12,845 and expense $3,429) |
(23,856 | ) | 6,368 | — | (17,488 | ) | ||||||||||
| Unrealized holding losses arising during the period (net of tax benefit $72,711) |
(135,035 | ) | — | — | (135,035 | ) | ||||||||||
| Unrealized adjustment to DAC (net of tax expense $20,786) |
38,554 | — | — | 38,554 | ||||||||||||
| Unrealized gains on investments attributable to participating policyholders’ interest (net of tax expense $3,026) |
5,620 | — | — | 5,620 | ||||||||||||
| Actuarial loss arising during the period (net of tax benefit of $15,175) |
— | (28,183 | ) | — | (28,183 | ) | ||||||||||
| Foreign currency adjustment (net of tax benefit $878) |
— | — | (1,630 | ) | (1,630 | ) | ||||||||||
|
|
|
|
|
|
|
|
|
|||||||||
| Balance at December 31, 2015 |
$ | 453,434 | $ | (97,889 | ) | $ | (2,925 | ) | $ | 352,620 | ||||||
|
|
|
|
|
|
|
|
|
|||||||||
96
Table of Contents
Index to Financial Statements
Note 16 – Stockholders’ Equity and Noncontrolling Interests
American National has one class of common stock with a par value of $1.00 per share and 50,000,000 authorized shares. The amounts outstanding at the dates indicated are shown below:
| Years ended December 31, | ||||||||||||
| 2015 | 2014 | 2013 | ||||||||||
| Common stock |
||||||||||||
| Shares issued |
30,832,449 | 30,832,449 | 30,832,449 | |||||||||
| Treasury shares |
(3,937,993 | ) | (3,960,507 | ) | (3,937,261 | ) | ||||||
|
|
|
|
|
|
|
|||||||
| Outstanding shares |
26,894,456 | 26,871,942 | 26,895,188 | |||||||||
| Restricted shares |
(76,000 | ) | (142,667 | ) | (190,667 | ) | ||||||
|
|
|
|
|
|
|
|||||||
| Unrestricted outstanding shares |
26,818,456 | 26,729,275 | 26,704,521 | |||||||||
|
|
|
|
|
|
|
|||||||
Stock-based compensation
American National has one stock-based compensation plan, which allows for grants of Non-Qualified Stock Options, Stock Appreciation Rights (“SAR”), Restricted Stock (“RS”) Awards, Restricted Stock Units (“RSU”), Performance Awards, Incentive Awards or any combination thereof. This plan is administered by the American National Board Compensation Committee. Incentive awards under this plan are made to officers meeting established performance objectives. All awards are subject to review and approval both at the time of setting applicable performance objectives and at payment of the awards. The number of shares available for grants under the plan cannot exceed 2,900,000 shares, and no more than 200,000 shares may be granted to any one individual in any calendar year. Grants are made to certain officers and directors as compensation and to align their interests with those of other shareholders.
SAR, RS and RSU information for the periods indicated are shown below:
| SAR | RS Shares | RS Units | ||||||||||||||||||||||
| Shares | Weighted-Average Grant Date Fair Value |
Shares | Weighted-Average Grant Date Fair Value |
Units | Weighted-Average Grant Date Fair Value |
|||||||||||||||||||
| Outstanding at December 31, 2012 |
108,951 | $ | 111.31 | 185,334 | $ | 109.13 | 127,059 | $ | 75.06 | |||||||||||||||
| Granted |
— | — | 10,000 | 80.05 | 71,084 | 80.05 | ||||||||||||||||||
| Exercised |
(19,849 | ) | 103.61 | (4,667 | ) | 111.60 | (76,378 | ) | 77.04 | |||||||||||||||
| Forfeited |
(334 | ) | 96.53 | — | — | (396 | ) | 77.20 | ||||||||||||||||
| Expired |
(14,333 | ) | 107.93 | — | — | — | — | |||||||||||||||||
|
|
|
|
|
|
|
|||||||||||||||||||
| Outstanding at December 31, 2013 |
74,435 | 114.08 | 190,667 | 107.54 | 121,369 | 76.23 | ||||||||||||||||||
|
|
|
|
|
|
|
|||||||||||||||||||
| Granted |
— | — | — | — | 66,383 | 113.49 | ||||||||||||||||||
| Exercised |
(3,226 | ) | 95.54 | (48,000 | ) | 108.00 | (59,438 | ) | 76.53 | |||||||||||||||
| Forfeited |
— | — | — | — | (100 | ) | 113.49 | |||||||||||||||||
| Expired |
(16,279 | ) | 115.11 | — | — | — | — | |||||||||||||||||
|
|
|
|
|
|
|
|||||||||||||||||||
| Outstanding at December 31, 2014 |
54,930 | 114.86 | 142,667 | 107.39 | 128,214 | 95.82 | ||||||||||||||||||
|
|
|
|
|
|
|
|||||||||||||||||||
| Granted |
— | — | — | — | 83,093 | 104.75 | ||||||||||||||||||
| Exercised |
(116 | ) | 73.97 | (66,667 | ) | 103.58 | (75,119 | ) | 91.35 | |||||||||||||||
| Forfeited |
— | — | — | — | (463 | ) | 105.30 | |||||||||||||||||
| Expired |
(16,722 | ) | 114.42 | — | — | — | — | |||||||||||||||||
|
|
|
|
|
|
|
|||||||||||||||||||
| Outstanding at December 31, 2015 |
38,092 | $ | 115.18 | 76,000 | $ | 110.73 | 135,725 | $ | 103.73 | |||||||||||||||
|
|
|
|
|
|
|
|||||||||||||||||||
97
Table of Contents
Index to Financial Statements
Note 16 – Stockholders’ Equity and Noncontrolling Interests – (Continued)
| SAR | RS Shares | RS Units | ||||||||||
| Weighted-average contractual remaining life (in years) |
1.17 | 3.52 | 1.78 | |||||||||
| Exercisable shares |
38,094 | N/A | N/A | |||||||||
| Weighted-average exercise price |
$ | 115.18 | $ | 110.73 | $ | 103.73 | ||||||
| Weighted-average exercise price exercisable shares |
115.18 | N/A | N/A | |||||||||
| Compensation expense (credit) |
||||||||||||
| Year ended December 31, 2015 |
$ | (72,000 | ) | $ | 1,147,000 | $ | 6,635,000 | |||||
| Year ended December 31, 2014 |
(23,000 | ) | 2,963,000 | 7,710,000 | ||||||||
| Year ended December 31, 2013 |
374,000 | 2,219,000 | 12,342,000 | |||||||||
| Fair value of liability award |
||||||||||||
| December 31, 2015 |
$ | 37,000 | N/A | $ | 19,415,000 | |||||||
| December 31, 2014 |
167,000 | N/A | 16,301,000 | |||||||||
The SARs give the holder the right to cash compensation based on the difference between the stock price on the grant date and the stock price on the exercise date. The SARs vest at a rate of 20% per year for five years and expire five years after vesting.
RS awards entitle the participant to full dividend and voting rights. Each RS share awarded has the value of one share of restricted stock and vests 10 years from the grant date. Unvested shares are restricted as to disposition, and are subject to forfeiture under certain circumstances. Compensation expense is recognized over the vesting period. The restrictions on these awards lapse after 10 years and most of these awards feature a graded vesting schedule in the case of the retirement of an award holder. Restricted stock awards for 350,334 shares have been granted at an exercise price of zero, of which 76,000 shares are unvested.
RSU awards allow the recipient of the awards to settle the vested RSUs in either shares of American National’s common stock or cash. RSUs vest after a three-year graded vesting requirement or over a shorter period as a result of death, disability or retirement after age 65.
Earnings per share
Basic earnings per share were calculated using a weighted average number of shares outstanding. Diluted earnings per share include RS and RSU award shares.
| Years ended December 31, | ||||||||||||
| 2015 | 2014 | 2013 | ||||||||||
| (As Adjusted) | (As Adjusted) | |||||||||||
| Weighted average shares outstanding |
26,876,522 | 26,802,841 | 26,791,900 | |||||||||
| Incremental shares from RS awards and RSUs |
73,544 | 115,829 | 122,691 | |||||||||
|
|
|
|
|
|
|
|||||||
| Total shares for diluted calculations |
26,950,066 | 26,918,670 | 26,914,591 | |||||||||
|
|
|
|
|
|
|
|||||||
| Net income attributable to American National (in thousands) |
$ | 242,988 | $ | 245,335 | $ | 266,481 | ||||||
| Basic earnings per share |
$ | 9.04 | $ | 9.15 | $ | 9.95 | ||||||
| Diluted earnings per share |
9.02 | 9.11 | 9.90 | |||||||||
98
Table of Contents
Index to Financial Statements
Note 16 – Stockholders’ Equity and Noncontrolling Interests – (Continued)
Statutory Capital and Surplus
Risk Based Capital (“RBC”) is a measure insurance regulators use to evaluate the capital adequacy of American National Insurance Company and its insurance subsidiaries. RBC is calculated using formulas applied to certain financial balances and activities that consider, among other things, investment risks related to the type and quality of investments, insurance risks associated with products and liabilities, interest rate risks and general business risks. Insurance companies that do not maintain capital and surplus at a level at least 200% of the authorized control level RBC are required to take certain actions. At December 31, 2015 and 2014, American National Insurance Company’s statutory capital and surplus was $2,925,935,000 and $2,879,154,000, respectively. American National Insurance Company and each of its insurance subsidiaries had statutory capital and surplus at December 31, 2015 and 2014, substantially above 200% of the authorized control level.
American National and its insurance subsidiaries prepare statutory-basis financial statements in accordance with statutory accounting practices prescribed or permitted by the insurance department of the state of domicile, which include certain components of the National Association of Insurance Commissioners’ Codification of Statutory Accounting Principles (“NAIC Codification”). NAIC Codification is intended to standardize regulatory accounting and reporting to state insurance departments. However, statutory accounting practices continue to be established by individual state laws and permitted practices. Modifications by the various state insurance departments may impact the statutory capital and surplus of American National Insurance Company and its insurance subsidiaries.
Statutory accounting differs from GAAP primarily by charging policy acquisition costs to expense as incurred, establishing future policy benefit liabilities using different actuarial assumptions, and valuing securities on a different basis. In addition, certain assets are not admitted under statutory accounting principles and are charged directly to surplus.
One of American National’s insurance subsidiaries has been granted a permitted practice from the Missouri Department of Insurance to record as the valuation of its investment in a wholly-owned subsidiary that is the attorney-in-fact for a Texas domiciled insurer, the statutory capital and surplus of the Texas domiciled insurer. This permitted practice increases the statutory capital and surplus of both American National Insurance Company and the Missouri domiciled insurance subsidiary by $67,076,000 and $62,807,000 at December 31, 2015 and 2014, respectively. Additionally, the statutory capital and surplus of both American National Insurance Company and the Missouri domiciled insurance subsidiary would have remained substantially above the company action level RBC had it not used the permitted practice.
The statutory capital and surplus and net income of our life and property and casualty insurance entities in accordance with statutory accounting practices are shown below (in thousands):
| December 31, | ||||||||||||
| 2015 | 2014 | |||||||||||
| Statutory capital and surplus |
||||||||||||
| Life insurance entities |
$ | 1,900,939 | $ | 1,904,128 | ||||||||
| Property and casualty insurance entities |
1,033,942 | 984,155 | ||||||||||
| Years ended December 31, | ||||||||||||
| 2015 | 2014 | 2013 | ||||||||||
| Statutory net income |
||||||||||||
| Life insurance entities |
$ | 136,170 | $ | 169,823 | $ | 191,932 | ||||||
| Property and casualty insurance entities |
71,823 | 73,076 | 61,737 | |||||||||
99
Table of Contents
Index to Financial Statements
Note 16 – Stockholders’ Equity and Noncontrolling Interests – (Continued)
Dividends
American National Insurance Company’s payment of dividends to stockholders is restricted by statutory regulations. The restrictions require life insurance companies to maintain minimum amounts of capital and surplus, and in the absence of special approval, limit the payment of dividends to the greater of the prior year’s statutory net income from operations, or 10% of prior year statutory surplus. American National Insurance Company is permitted to pay total dividends of $292,593,000 during 2016, without prior approval of the Texas Department of Insurance. Similar restrictions on amounts that can transfer in the form of dividends, loans, or advances to American National Insurance Company apply to its insurance subsidiaries.
Noncontrolling interests
American National County Mutual Insurance Company (“County Mutual”) is a mutual insurance company that is owned by its policyholders. American National has a management agreement that effectively gives it control of County Mutual. As a result, County Mutual is included in the consolidated financial statements of American National. Policyholder interests in the financial position of County Mutual are reflected as noncontrolling interest of $6,750,000 at December 31, 2015 and 2014.
American National Insurance Company and its subsidiaries exercise significant control or ownership of various joint ventures, resulting in their consolidation into American National’s consolidated financial statements. The interests of the other partners in the consolidated joint ventures are shown as noncontrolling interests of $3,439,000 and $5,634,000 at December 31, 2015 and 2014, respectively.
100
Table of Contents
Index to Financial Statements
Note 17 – Segment Information
Management organizes the business into five operating segments:
| • | Life—markets whole, term, universal, indexed and variable life insurance on a national basis primarily through career, multiple-line, and independent agents as well as direct marketing channels. |
| • | Annuity—offers fixed, indexed, and variable annuity products. These products are primarily sold through independent agents, brokers, and financial institutions, along with multiple-line and career agents. |
| • | Health—primary lines of business are Medicare supplement, stop loss, other supplemental health products and credit disability insurance. Health products are typically distributed through independent agents and managing general underwriters. |
| • | Property and Casualty—writes personal, agricultural and commercial coverages and credit-related property insurance. These products are primarily sold through multiple-line and independent agents. |
| • | Corporate and Other—consists of net investment income from investments not allocated to the insurance segments and revenues from non-insurance operations. |
The accounting policies of the segments are the same as those described in Note 2 to the consolidated financial statements. All revenues and expenses specifically attributable to policy transactions are recorded directly to the appropriate operating segment. Revenues and expenses not specifically attributable to policy transactions are allocated to each segment as follows:
| • | Recurring income from bonds and mortgage loans is allocated based on the assets allocated to each line of business at the average yield available from these assets. |
| • | Net investment income from all other assets is allocated to the insurance segments in accordance with the amount of capital allocated to each segment, with the remainder recorded in the Corporate and Other business segment. |
| • | Expenses are allocated based upon various factors, including premium and commission ratios of the operating segments. |
The following summarizes the results of operations measured as the income before federal income taxes, and equity in earnings of unconsolidated affiliates by operating segments (in thousands):
| Years ended December 31, | ||||||||||||
| 2015 | 2014 | 2013 | ||||||||||
| (As Adjusted) | (As Adjusted) | |||||||||||
| Life |
$ | 33,453 | $ | 43,352 | $ | 19,627 | ||||||
| Annuity |
59,955 | 95,736 | 95,887 | |||||||||
| Health |
1,925 | 25,559 | 25,255 | |||||||||
| Property and Casualty |
68,990 | 89,632 | 74,068 | |||||||||
| Corporate and Other |
104,365 | 74,467 | 147,633 | |||||||||
|
|
|
|
|
|
|
|||||||
| Total |
$ | 268,688 | $ | 328,746 | $ | 362,470 | ||||||
|
|
|
|
|
|
|
|||||||
| Total Assets |
||||||||||||
| Life |
$ | 5,718,553 | $ | 5,565,791 | $ | 5,367,551 | ||||||
| Annuity |
10,888,447 | 10,766,619 | 11,104,180 | |||||||||
| Health |
463,600 | 489,873 | 468,520 | |||||||||
| Property and Casualty |
2,040,102 | 1,992,741 | 2,120,645 | |||||||||
| Corporate and other |
4,636,260 | 4,729,508 | 4,258,977 | |||||||||
|
|
|
|
|
|
|
|||||||
| Total |
$ | 23,746,962 | $ | 23,544,532 | $ | 23,319,873 | ||||||
|
|
|
|
|
|
|
|||||||
101
Table of Contents
Index to Financial Statements
Note 18 – Pension and Postretirement Benefits
Pension benefits
On October 31, 2013, American National adopted certain amendments to freeze all of its remaining unfrozen defined benefit pension plans as of December 31, 2013. Prior to the plan amendments, American National had a qualified defined benefit pension plan covering virtually all employees and two non-qualified defined benefit pension plans covering executives. Effective December 31, 2013, no additional benefits accrued through these plans for additional years of service credit or future salary increase credit, and no new participants were added to the plans. Benefits earned by eligible employees prior to the effective date of the plan amendments have not been affected. The plan amendments did not result in any curtailment gain or loss.
The tax-qualified plan has three separate noncontributory programs. One of the programs covers Career Sales and Service Division agents and managers. The other two programs cover salaried and management employees and corporate clerical employees subject to a collective bargaining agreement. The program covering salaried and management employees, provides pension benefits that are based on years of service and the employee’s compensation during the five years before retirement. The programs covering hourly employees and agents generally provide benefits that are based on the employee’s career average earnings and years of service. The non-tax-qualified pension plans cover key executive employees and restore benefits that would otherwise be curtailed by statutory limits on qualified plan benefits. In addition, American National also has one frozen, tax-qualified, defined-benefit pension plan covering employees of the Farm Family companies hired prior to January 1, 1997. Effective January 1, 1997, benefits through this plan were frozen, and no new participants have been added.
Amounts recognized in the consolidated statements of financial position consist of (in thousands):
| 2015 | 2014 | |||||||
| Reconciliation of benefit obligation |
||||||||
| Obligation at January 1, |
$ | 513,151 | $ | 458,270 | ||||
| Service cost |
97 | 111 | ||||||
| Interest cost on projected benefit obligation |
18,721 | 20,612 | ||||||
| Actuarial loss |
21,451 | 61,906 | ||||||
| Benefits paid |
(29,277 | ) | (27,748 | ) | ||||
|
|
|
|
|
|||||
| Obligation at December 31, |
524,143 | 513,151 | ||||||
|
|
|
|
|
|||||
| Reconciliation of fair value of plan assets |
||||||||
| Fair value of plan assets at January 1, |
324,179 | 302,467 | ||||||
| Actual return on plan assets |
(1,051 | ) | 28,363 | |||||
| Employer contributions |
28,712 | 21,097 | ||||||
| Benefits paid |
(29,277 | ) | (27,748 | ) | ||||
|
|
|
|
|
|||||
| Fair value of plan assets at December 31, |
322,563 | 324,179 | ||||||
|
|
|
|
|
|||||
| Funded status at December 31, |
$ | (201,580 | ) | $ | (188,972 | ) | ||
|
|
|
|
|
|||||
The components of net periodic benefit cost for the defined benefit pension plans are shown below (in thousands):
| Years ended December 31, | ||||||||||||
| 2015 | 2014 | 2013 | ||||||||||
| Service cost |
$ | 97 | $ | 111 | $ | 19,873 | ||||||
| Interest cost |
18,721 | 20,612 | 20,277 | |||||||||
| Expected return on plan assets |
(20,856 | ) | (20,402 | ) | (20,354 | ) | ||||||
| Amortization of net actuarial loss |
9,797 | 4,421 | 17,726 | |||||||||
|
|
|
|
|
|
|
|||||||
| Net periodic benefit cost |
$ | 7,759 | $ | 4,742 | $ | 37,522 | ||||||
|
|
|
|
|
|
|
|||||||
102
Table of Contents
Index to Financial Statements
Note 18 – Pension and Postretirement Benefits – (Continued)
Amounts related to the defined benefit pension plans recognized as a component of OCI are shown below (in thousands):
| Years ended December 31, | ||||||||||||
| 2015 | 2014 | 2013 | ||||||||||
| Actuarial gain (loss) |
$ | (33,562 | ) | $ | (49,523 | ) | $ | 130,953 | ||||
| Deferred tax (expense) benefit |
11,747 | 17,333 | (45,834 | ) | ||||||||
|
|
|
|
|
|
|
|||||||
| Other comprehensive income (loss), net of tax |
$ | (21,815 | ) | $ | (32,190 | ) | $ | 85,119 | ||||
|
|
|
|
|
|
|
|||||||
The estimated actuarial loss for the plan that will be amortized out of AOCI into the net periodic benefit cost over the next fiscal year is $13,391,000. Amounts recognized as a component of AOCI that have not been recognized as a component of the combined net periodic benefit cost of the defined benefit pension plans, are shown below (in thousands):
| Years ended December 31, | ||||||||
| 2015 | 2014 | |||||||
| Net actuarial loss |
$ | (150,598 | ) | $ | (117,036 | ) | ||
| Deferred tax benefit |
52,709 | 40,962 | ||||||
|
|
|
|
|
|||||
| Amounts included in AOCI |
$ | (97,889 | ) | $ | (76,074 | ) | ||
|
|
|
|
|
|||||
The weighted average assumptions used are shown below:
| Used for Net Benefit | Used for Benefit | |||||||
| Cost in Fiscal Year | Obligations | |||||||
| 1/1/2015 to 12/31/2015 | as of 12/31/2015 | |||||||
| Discount rate |
3.70 | % | 4.08 | % | ||||
| Rate of compensation increase |
— | — | ||||||
| Long-term rate of return |
7.45 | 7.41 | ||||||
American National’s funding policy for the qualified pension plans is to make annual contributions to meet the minimum funding standards of ERISA. The unfunded plans will be funded out of general corporate assets when necessary. American National contributed $28,712,000, $21,097,000, and $10,065,000 to the qualified and non-qualified pension plan in 2015, 2014 and 2013, respectively. American National and its affiliates expect to contribute $19,600,000 to its qualified and non-qualified pension plan in 2016.
The following table shows pension benefit payments, which reflect expected future service as appropriate, that are expected to be paid (in thousands):
| 2016 |
$ | 39,452 | ||
| 2017 |
30,871 | |||
| 2018 |
34,839 | |||
| 2019 |
30,340 | |||
| 2020 |
33,919 | |||
| 2021-2025 |
163,579 |
103
Table of Contents
Index to Financial Statements
Note 18 – Pension and Postretirement Benefits – (Continued)
American National utilizes third-party pricing services to estimate fair value measurements of its pension plan assets. Refer to Note 9 for further information concerning the valuation methodologies and related inputs utilized by the third-party pricing services. The fair values of the pension plan assets by asset category are shown below (in thousands):
| December 31, 2015 | ||||||||||||||||
| Total | Level 1 | Level 2 | Level 3 | |||||||||||||
| Asset Category |
||||||||||||||||
| Corporate debt securities |
$ | 41,365 | $ | — | $ | 41,365 | $ | — | ||||||||
| Residential mortgage-backed securities |
803 | — | 803 | — | ||||||||||||
| Mutual fund |
9,405 | 9,405 | — | — | ||||||||||||
| Equity securities by sector |
||||||||||||||||
| Consumer goods |
50,485 | 50,485 | — | — | ||||||||||||
| Energy and utilities |
22,525 | 22,525 | — | — | ||||||||||||
| Financials |
47,469 | 47,469 | — | — | ||||||||||||
| Healthcare |
2,306 | 2,306 | — | — | ||||||||||||
| Industrials |
29,050 | 29,050 | — | — | ||||||||||||
| Information technology |
16,522 | 16,522 | — | — | ||||||||||||
| Other |
65,410 | 65,410 | — | — | ||||||||||||
| Commercial paper |
30,511 | — | 30,511 | — | ||||||||||||
| Unallocated group annuity contract |
5,763 | — | 5,763 | — | ||||||||||||
| Other |
949 | 862 | 87 | — | ||||||||||||
|
|
|
|
|
|
|
|
|
|||||||||
| Total |
$ | 322,563 | $ | 244,034 | $ | 78,529 | $ | — | ||||||||
|
|
|
|
|
|
|
|
|
|||||||||
| December 31, 2014 | ||||||||||||||||
| Total | Level 1 | Level 2 | Level 3 | |||||||||||||
| Asset Category |
||||||||||||||||
| Corporate debt securities |
$ | 53,768 | $ | — | $ | 53,768 | $ | — | ||||||||
| Residential mortgage-backed securities |
887 | — | 887 | — | ||||||||||||
| Mutual fund |
9,591 | 9,591 | — | — | ||||||||||||
| Equity securities by sector |
||||||||||||||||
| Consumer goods |
51,586 | 51,586 | — | — | ||||||||||||
| Energy and utilities |
32,287 | 32,287 | — | — | ||||||||||||
| Financials |
43,186 | 43,186 | — | — | ||||||||||||
| Healthcare |
28,256 | 28,256 | — | — | ||||||||||||
| Industrials |
16,145 | 16,145 | — | — | ||||||||||||
| Information technology |
30,157 | 30,157 | — | — | ||||||||||||
| Other |
31,094 | 31,094 | — | — | ||||||||||||
| Commercial paper |
21,053 | — | 21,053 | — | ||||||||||||
| Unallocated group annuity contract |
6,053 | — | 6,053 | — | ||||||||||||
| Other |
116 | 28 | 88 | — | ||||||||||||
|
|
|
|
|
|
|
|
|
|||||||||
| Total |
$ | 324,179 | $ | 242,330 | $ | 81,849 | $ | — | ||||||||
|
|
|
|
|
|
|
|
|
|||||||||
104
Table of Contents
Index to Financial Statements
Note 18 – Pension and Postretirement Benefits – (Continued)
The investment policy for the retirement plan assets is designed to provide the highest return possible commensurate with sound and prudent underwriting practices. The investment diversification goals are to have investments in cash and cash equivalents as necessary for liquidity, debt securities up to 100% and equity securities up to 75% of the total invested plan assets. The amount invested in any particular investment is limited based on credit quality, and no single investment may at the time of purchase be more than 5% of the total invested assets.
The corporate debt securities category are investment grade bonds of U.S and foreign issuers denominated and payable in U.S. dollars from diverse industries, with a maturity of 1 to 30 years. Foreign bonds in the aggregate shall not exceed 20% of the bond portfolio. Residential mortgage-backed securities represent asset-backed securities with a maturity date 1 to 30 years with a rating of NAIC 1 or 2.
Equity portfolio managers have discretion to choose the degree of concentration in various issues and industry sectors for the equity securities. Permitted securities are those for which there is an active market providing liquidity for the specific security.
Commercial paper investments generally have a credit rating of A2 Moody’s or P2 by Standard & Poor’s with at least BBB rating on the issuer’s outstanding debt, or selected issuers with no outstanding debt.
Postretirement life and health benefits
American National provides certain health and dental benefits to a closed block of retirees and their dependents who met certain age and length of service requirements as of December 31, 1993. The primary retiree health benefit plan provides Medicare Supplemental and prescription drug benefits. The plan is contributory, with American National’s contribution limited to $40 per month for retirees and spouses with any additional contributions necessary, being made by the retirees. Under American National’s various group benefit plans for active employees, life insurance benefits are provided upon retirement for eligible participants who meet certain age and length of service requirements. Effective June 1, 2014 Farm Family moved their life insurance coverage from a third party vendor to American National.
The accrued postretirement benefit obligation, included in the liability for retirement benefits, was $6,055,000 and $6,740,000 at December 31, 2015 and 2014, respectively. These amounts were approximately equal to the unfunded accumulated postretirement benefit obligation. Since American National’s contributions to the cost of the retiree benefit plans are fixed, the health care cost trend rate will have no effect on the future expense or the accumulated postretirement benefit obligation.
Savings plans
American National sponsors one defined contribution (401(k) plan) for all employees. The 401(k) plan allows employees to contribute up to the maximum allowable amount as determined by the IRS. The expense associated with this plan was $12,146,000 and $12,350,000 for 2015 and 2014, respectively.
105
Table of Contents
Index to Financial Statements
Note 19 – Commitments and Contingencies
Commitments
American National and its subsidiaries lease insurance sales office space in various cities. The remaining long-term lease commitments at December 31, 2015 were approximately $4,932,000.
American National had aggregate commitments at December 31, 2015, to purchase, expand or improve real estate, to fund fixed interest rate mortgage loans, and to purchase other invested assets of $704,698,000 of which $492,081,000 is expected to be funded in 2016 with the remainder funded in 2017 and beyond.
American National has a $100,000,000 short-term variable rate borrowing facility containing a $55,000,000 sub-feature for the issuance of letters of credit. Borrowings under the facility are at the discretion of the lender and would be used only for funding working capital requirements. The combination of borrowings and outstanding letters of credit cannot exceed $100,000,000 at any time. As of December 31, 2015 and 2014, the outstanding letters of credit were $9,501,000 and $12,214,000, respectively, and there were no borrowings on this facility. This facility expires on October 30, 2016. American National expects it will be renewed on substantially equivalent terms upon expiration.
Guarantees
American National has guaranteed bank loans for customers of a third-party marketing operation. The bank loans are used to fund premium payments on life insurance policies issued by American National. The loans are secured by the cash values of the life insurance policies. If the customer were to default on the bank loan, American National would be obligated to pay off the loans. As the cash values of the life insurance policies always equal or exceed the balance of the loans, management does not foresee any loss on these guarantees. The total amount of the guarantees outstanding as of December 31, 2015, was approximately $206,376,000, while the total cash value of the related life insurance policies was approximately $210,104,000.
Litigation
American National and certain subsidiaries, in common with the insurance industry in general, are defendants in various lawsuits concerning alleged breaches of contracts, various employment matters, allegedly deceptive insurance sales and marketing practices, and miscellaneous other causes of action arising in the ordinary course of operations. Certain of these lawsuits include claims for compensatory and punitive damages. We provide accruals for these items to the extent we deem the losses probable and reasonably estimable. After reviewing these matters with legal counsel, based upon information presently available, management is of the opinion that the ultimate resultant liability, if any, would not have a material adverse effect on American National’s consolidated financial position, liquidity or results of operations; however, assessing the eventual outcome of litigation necessarily involves forward-looking speculation as to judgments to be made by judges, juries and appellate courts in the future.
Such speculation warrants caution, as the frequency of large damage awards, which bear little or no relation to the economic damages incurred by plaintiffs in some jurisdictions, continues to create the potential for an unpredictable judgment in any given lawsuit. These lawsuits are in various stages of development, and future facts and circumstances could result in management changing its conclusions. It is possible that, if the defenses in these lawsuits are not successful, and the judgments are greater than management can anticipate, the resulting liability could have a material impact on our consolidated financial position, liquidity or results of operations. With respect to the existing litigation, management currently believes that the possibility of a material judgment adverse to American National is remote and no estimate of range can be made for loss contingencies that are at least reasonably possible but not accrued.
106
Table of Contents
Index to Financial Statements
Note 20 – Related Party Transactions
American National has entered into recurring transactions and agreements with certain related parties. These include mortgage loans, management contracts, agency commission contracts, marketing agreements, accident and health insurance contracts, and legal services. The impact on the consolidated financial statements of significant related party transactions is shown below (in thousands):
| Dollar Amount of Transactions | Amount due to (from) American National | |||||||||||||||||
| Years ended December 31, | December 31, | |||||||||||||||||
| Related Party |
Financial Statement Line Impacted |
2015 | 2014 | 2015 | 2014 | |||||||||||||
| Gal-Tex Hotel Corporation |
Mortgage loan on real estate | $1,326 | $1,234 | $5,182 | $6,508 | |||||||||||||
| Gal-Tex Hotel Corporation |
Net investment income | 428 | 521 | 31 | 39 | |||||||||||||
| Greer, Herz & Adams, LLP |
Other operating expenses | 7,951 | 10,146 | (274) | (309) | |||||||||||||
Mortgage Loans to Gal-Tex Hotel Corporation (“Gal-Tex”): American National holds a first mortgage loan originated in 1999, with an interest rate of 7.25% and final maturity date of April 1, 2019 issued to Gal-Tex, which is collateralized by a hotel property in San Antonio, Texas. This loan is current as to principal and interest payments.
Transactions with Greer, Herz & Adams, LLP: Irwin M. Herz, Jr. is an American National advisory director and a Partner with Greer, Herz & Adams, LLP, which serves as American National’s General Counsel.
Note 21 – Selected Quarterly Financial Data
The unaudited selected quarterly financial data is shown below (in thousands, except per share data):
| Three months ended | ||||||||||||||||||||||||||||||||
| March 31, | June 30, | September 30, | December 31, | |||||||||||||||||||||||||||||
| 2015 | 2014 | 2015 | 2014 | 2015 | 2014 | 2015 | 2014 | |||||||||||||||||||||||||
| (As Adjusted) | (As Adjusted) | (As Adjusted) | (As Adjusted) | |||||||||||||||||||||||||||||
| Total premiums and other revenues |
$ | 756,567 | $ | 772,436 | $ | 717,506 | $ | 754,786 | $ | 699,859 | $ | 746,170 | $ | 843,523 | $ | 777,198 | ||||||||||||||||
| Total benefits, losses and expenses |
665,208 | 697,968 | 668,099 | 688,864 | 653,199 | 651,395 | 762,261 | 683,617 | ||||||||||||||||||||||||
| Income before federal income tax and equity in earnings of unconsolidated affiliates |
91,359 | 74,468 | 49,407 | 65,922 | 46,660 | 94,775 | 81,262 | 93,581 | ||||||||||||||||||||||||
| Total provision for federal income taxes |
45,690 | 22,908 | 15,210 | 21,783 | 18,134 | 28,535 | 24,686 | 23,388 | ||||||||||||||||||||||||
| Equity in earnings (losses) of unconsolidated affiliates |
56,584 | (62 | ) | 462 | 12,797 | 16,339 | 3,576 | 4,023 | (1,617 | ) | ||||||||||||||||||||||
| Net income |
102,253 | 51,498 | 34,659 | 56,936 | 44,865 | 69,816 | 60,599 | 68,576 | ||||||||||||||||||||||||
| Net income (loss) attributable to noncontrolling interest |
(729 | ) | (756 | ) | (394 | ) | (238 | ) | 2,852 | 2,877 | (2,341 | ) | (392 | ) | ||||||||||||||||||
| Net income attributable to American National |
102,982 | 52,254 | 35,053 | 57,174 | 42,013 | 66,939 | 62,940 | 68,968 | ||||||||||||||||||||||||
| Earnings per share attributable to American National |
||||||||||||||||||||||||||||||||
| Basic |
3.84 | 1.95 | 1.30 | 2.13 | 1.56 | 2.50 | 2.34 | 2.57 | ||||||||||||||||||||||||
| Diluted |
3.82 | 1.94 | 1.30 | 2.11 | 1.56 | 2.49 | 2.33 | 2.56 | ||||||||||||||||||||||||
107
Table of Contents
Index to Financial Statements
| ITEM 9. | CHANGES IN AND DISAGREEMENTS WITH ACCOUNTANTS ON ACCOUNTING AND FINANCIAL DISCLOSURE |
None
| ITEM 9A. | CONTROLS AND PROCEDURES |
Evaluation of Disclosure Controls and Procedures
The Company maintains disclosure controls and procedures (as that term is defined in Rules 13a-15(e) and 15d-15(e) under the Securities Exchange Act of 1934, as amended (Exchange Act)) that are designed to provide reasonable assurance that information required to be disclosed in the Company’s reports under the Exchange Act is recorded, processed, summarized and reported within the time periods specified in the Securities and Exchange Commission’s rules and forms, and that such information is accumulated and communicated to the Company’s management, including its Chief Executive Officer and Chief Financial Officer, as appropriate, to allow timely decisions regarding required disclosures.
The Company’s management, with the participation of the Company’s Chief Executive Officer and Chief Financial Officer, has evaluated the effectiveness of the design and operation of the Company’s disclosure controls and procedures as of December 31, 2015. Based upon that evaluation and subject to the foregoing, the Company’s Chief Executive Officer and Chief Financial Officer concluded that, as of December 31, 2015, the design and operation of the Company’s disclosure controls and procedures were effective to accomplish their objectives at the reasonable assurance level.
Management’s Annual Report on Internal Control Over Financial Reporting
Management of the Company is responsible for establishing and maintaining adequate internal control over financial reporting as defined in Rule 13a-15(f) and 15d-15(f) under the Exchange Act. The Company’s internal control over financial reporting is a process designed to provide reasonable assurance regarding the reliability of financial reporting and the preparation of consolidated financial statements for external purposes in accordance with accounting principles generally accepted in the United States of America. The Company’s internal control over financial reporting includes those policies and procedures that:
| • | pertain to the maintenance of records that in reasonable detail accurately and fairly reflect the transactions and dispositions of the assets of the Company; |
| • | provide reasonable assurance that transactions are recorded as necessary to permit preparation of consolidated financial statements in accordance with accounting principles generally accepted in the United States of America, and that receipts and expenditures of the Company are being made only in accordance with authorizations of management and directors of the Company; and |
| • | provide reasonable assurance regarding prevention or timely detection of unauthorized acquisition, use or disposition of the Company’s assets that could have a material effect on the consolidated financial statements. |
Because of its inherent limitations, internal control over financial reporting may not prevent or detect misstatements. In addition, projections of any evaluation of effectiveness to future periods are subject to the risks that controls may become inadequate because of changes in conditions, or that the degree of compliance with the policies or procedures may deteriorate.
Management has monitored the internal controls over financial reporting, including any material changes to the internal control over financial reporting. There were no changes in the Company’s internal control over financial reporting (as that term is defined in Rules 13a-15(f) and 15d-15(f) under the Exchange Act) that occurred during the year ended December 31, 2015 that have materially affected, or are reasonably likely to materially affect, the Company’s internal control over financial reporting.
108
Table of Contents
Index to Financial Statements
Based on the Company’s assessment of internal control over financial reporting, management has concluded that, as of December 31, 2015, the Company’s internal control over financial reporting was effective to provide reasonable assurance regarding the reliability of financial reporting and preparation of consolidated financial statements for external purposes in accordance with generally accepted accounting principles. In making this assessment, management used the criteria set forth by the Committee of Sponsoring Organizations of the Treadway Commission (“COSO”) in Internal Control-Integrated Framework (2013).
The effectiveness of the Company’s internal control over financial reporting as of December 31, 2015, has been audited by KPMG LLP, an independent registered public accounting firm, as stated in their report.
| ITEM 9B. | OTHER INFORMATION |
None.
| ITEM 10. | DIRECTORS, EXECUTIVE OFFICERS AND CORPORATE GOVERNANCE |
The information required by this item is incorporated by reference from our definitive proxy statement for our Annual Meeting of Stockholders, which will be filed with the Securities and Exchange Commission within 120 days after December 31, 2015.
| ITEM 11. | EXECUTIVE COMPENSATION |
The information required by this item is incorporated by reference from our definitive proxy statement for our Annual Meeting of Stockholders, which will be filed with the Securities and Exchange Commission within 120 days after December 31, 2015.
| ITEM 12. | SECURITY OWNERSHIP OF CERTAIN BENEFICIAL OWNERS AND MANAGEMENT AND RELATED STOCKHOLDER MATTERS |
The information required by this item is incorporated by reference from our definitive proxy statement for our Annual Meeting of Stockholders, which will be filed with the Securities and Exchange Commission within 120 days after December 31, 2015.
| ITEM 13. | CERTAIN RELATIONSHIPS AND RELATED TRANSACTIONS AND DIRECTOR INDEPENDENCE |
The information required by this item is incorporated by reference from our definitive proxy statement for our Annual Meeting of Stockholders, which will be filed with the Securities and Exchange Commission within 120 days after December 31, 2015.
| ITEM 14. | PRINCIPAL ACCOUNTANT FEES AND SERVICES |
The information required by this item is incorporated by reference from our definitive proxy statement for our Annual Meeting of Stockholders, which will be filed with the Securities and Exchange Commission within 120 days after December 31, 2015.
109
Table of Contents
Index to Financial Statements
| ITEM 15. | EXHIBITS AND FINANCIAL STATEMENT SCHEDULES |
(a)(1) Financial Statements—(See Item 8: Financial Statements and Supplementary Data)
(a)(2) Supplementary Data and Financial Statement Schedules—are attached hereto at the following pages
| Page | ||||
| I – Summary of Investments – Other than Investments in Related Parties |
114 | |||
| 115 | ||||
| 118 | ||||
| 119 | ||||
| 119 | ||||
All other schedules are omitted as the required information is inapplicable or the information is presented in the financial statements or related notes.
| Exhibit Number |
Basic Documents | |
| 3.1 | Restated Articles of Incorporation, as amended (incorporated by reference to Exhibit No. 3.1 to the registrant’s Registration Statement on Form 10-12B filed April 10, 2009). | |
| 3.2 | Amended and Restated Bylaws (incorporated by reference to Exhibit No. 3.2 to the registrant’s Current Report on Form 8-K filed July 31, 2015). | |
| 4.1 | Specimen copy of Stock Certificate (incorporated by reference to Exhibit No. 4.1 to the registrant’s Registration Statement on Form 10-12B filed April 10, 2009). | |
| 10.1* | American National Insurance Company Amended and Restated 1999 Stock and Incentive Plan (the “Stock and Incentive Plan”) (incorporated by reference to Exhibit No. 10.2 to the registrant’s Registration Statement on Form 10-12B filed April 10, 2009). | |
| 10.2* | Form of Restricted Stock Agreement for Directors under the Stock and Incentive Plan (incorporated by reference to Exhibit No. 10.3 to the registrant’s Registration Statement on Form 10-12B filed April 10, 2009). | |
| 10.3* | Form of Restricted Stock Agreement for Employees (incorporated by reference to Exhibit No. 10.4 to the registrant’s Registration Statement on Form 10-12B filed April 10, 2009). | |
| 10.4* | Form of Stock Appreciation Rights Agreement under the Stock and Incentive Plan (grants on or after May 3, 2010) (incorporated by reference to Exhibit No. 10.5 to the registrant’s Annual Report on Form 10-K filed March 2, 2011). | |
| 10.5* | Form of Stock Appreciation Rights Agreement under the Stock and Incentive Plan (grants prior to May 3, 2010) (incorporated by reference to Exhibit No. 10.5 to the registrant’s Registration Statement on Form 10-12B filed April 10, 2009). | |
110
Table of Contents
Index to Financial Statements
| 10.6* | American National Insurance Company Nonqualified Retirement Plan for Certain Salaried Employees (incorporated by reference to Exhibit No. 10.6 to the registrant’s Registration Statement on Form 10-12B filed April 10, 2009). | |
| 10.7* | Amendment to the American National Insurance Company Nonqualified Retirement Plan of Certain Salaried Employees (incorporated by reference to Exhibit No. 10.2 to the registrant’s amended Current Report on Form 8-K/A filed on November 6, 2013). | |
| 10.8* | American National Insurance Company Nonqualified Retirement Plan (incorporated by reference to Exhibit No. 10.7 to the registrant’s Registration Statement on Form 10-12B filed April 10, 2009). | |
| 10.9* | Amendment No. 4 to the American National Insurance Company Nonqualified Retirement Plan (incorporated by reference to Exhibit No. 10.8 to the registrant’s Annual Report on Form 10-K filed March 2, 2011). | |
| 10.10* | Amendment No. 5 to the American National Insurance Company Nonqualified Retirement Plan (incorporated by reference to Exhibit No. 10.1 to the registrant’s amended Current Report on Form 8-K/A filed on November 6, 2013). | |
| 10.11* | Form of Restricted Stock Unit Agreement for Officers under the Stock and Incentive Plan (grants on or after March 4, 2011) (incorporated by reference to Exhibit No. 10.1 to the registrant’s Quarterly Report on Form 10-Q filed May 6, 2011). | |
| 10.12* | Form of Restricted Stock Unit Agreement for Directors under the Stock and Incentive Plan (incorporated by reference to Exhibit No. 10.2 to the registrant’s Quarterly Report on Form 10-Q filed May 6, 2011). | |
| 10.13* | Form of Restricted Stock Unit Agreement for Officers under the Stock and Incentive Plan (grants prior to March 4, 2011) (incorporated by reference to Exhibit No. 10.9 to the registrant’s Annual Report on Form 10-K filed March 2, 2011). | |
| 10.14* | American National Family of Companies Executive Supplemental Savings Plan (incorporated by reference to Exhibit No. 10.3 to the registrant’s amended Current Report on Form 8-K/A filed on November 6, 2013). | |
| 10.15* | Amendments One and Two to the American National Family of Companies Executive Supplemental Savings plan (incorporated by reference to Exhibit No. 10.15 to the registrant’s Quarterly Report on Form 10-Q filed on May 8, 2015). | |
| 10.16* | Form of Restricted Stock Unit Agreement for Executive Officers under the American National Insurance Company Amended and Restated 1999 Stock and Incentive Plan (grants on or after March 1, 2015) (incorporated by reference to Exhibit No. 10.16 to the registrant’s Quarterly Report on Form 10-Q filed on May 8, 2015). | |
| 10.17* | Form of Restricted Stock Unit Agreement for Directors under the American National Insurance Company Amended and Restated 1999 Stock and Incentive Plan (grants on or after March 1, 2015) (incorporated by reference to Exhibit No. 10.17 to the registrant’s Quarterly Report on Form 10-Q filed on May 8, 2015). | |
| 21 | Subsidiaries (filed herewith). | |
| 23 | Consent of KPMG LLP (filed herewith). | |
111
Table of Contents
Index to Financial Statements
| 31.1 | Certification of the principal executive officer pursuant to Section 302 of the Sarbanes- Oxley Act of 2002 (filed herewith). | |
| 31.2 | Certification of the principal financial officer pursuant to Section 302 of the Sarbanes-Oxley Act of 2002 (filed herewith). | |
| 32.1 | Certification of the principal executive officer and principal financial officer pursuant to Section 906 of the Sarbanes-Oxley Act of 2002 (filed herewith). | |
| 101 | The following financial information from American National Insurance Company’s Annual Report on Form 10-K for the year ended December 31, 2015 formatted in eXtensible Business Reporting Language (“XBRL”): (i) Consolidated Statements of Financial Position, (ii) Consolidated Statements of Operations, (iii) Consolidated Statements of Comprehensive Income (Loss), (iv) Consolidated Statements of Changes in Stockholders’ Equity, (v) Consolidated Statements of Cash Flows, and (vi) Notes to the Consolidated Financial Statements. | |
| * | Management contract or compensatory plan or arrangement. |
112
Table of Contents
Index to Financial Statements
Pursuant to the requirements of Section 13 or 15(d) of the Securities Exchange Act of 1934, the Registrant has duly caused this report to be signed on its behalf by the undersigned, thereunto duly authorized.
| AMERICAN NATIONAL INSURANCE COMPANY | ||
| By: | /s/ James E. Pozzi | |
| Name: | James E. Pozzi | |
| Title: | President and Chief Executive Officer (Principal Executive Officer) | |
Date: February 29, 2016
Pursuant to the requirements of the Securities and Exchange Act of 1934, this report has been signed below by the following persons on behalf of the registrant and in the capacities indicated.
| Signature |
Title |
Date | ||
| /s/ James E. Pozzi James E. Pozzi |
President, Chief Executive Officer (Principal Executive Officer) |
February 29, 2016 | ||
| /s/ John J. Dunn, Jr. John J. Dunn, Jr. |
Executive Vice President, Chief Financial Officer (Principal Financial Officer) |
February 29, 2016 | ||
| /s/ William C. Ansell William C. Ansell |
Director | February 29, 2016 | ||
| /s/ Arthur O. Dummer Arthur O. Dummer |
Director | February 29, 2016 | ||
| /s/ Frances A. Moody-Dahlberg Frances A. Moody-Dahlberg |
Director | February 29, 2016 | ||
| /s/ Russell S. Moody Russell S. Moody |
Director | February 29, 2016 | ||
| /s/ James P. Payne James P. Payne |
Director | February 29, 2016 | ||
| /s/ E.J. Pederson E.J. Pederson |
Director | February 29, 2016 | ||
| /s/ James D. Yarbrough James D. Yarbrough |
Director | February 29, 2016 | ||
113
Table of Contents
Index to Financial Statements
AMERICAN NATIONAL INSURANCE COMPANY AND SUBSIDIARIES
SCHEDULE I - SUMMARY OF INVESTMENTS - OTHER THAN INVESTMENTS IN RELATED PARTIES
(In thousands)
| December 31, 2015 | ||||||||||||
| Type of Investment |
Cost or Amortized Cost (1) |
Estimated Fair Value |
Amount at Which Shown in the Consolidated Statement of Financial Position |
|||||||||
| Fixed maturities |
||||||||||||
| Bonds held-to-maturity |
||||||||||||
| U.S. states and political subdivisions |
$ | 324,643 | $ | 346,517 | $ | 324,643 | ||||||
| Foreign governments |
4,101 | 4,968 | 4,101 | |||||||||
| Corporate debt securities |
6,985,844 | 7,091,670 | 6,985,844 | |||||||||
| Residential mortgage-backed securities |
277,135 | 294,200 | 277,135 | |||||||||
| Collateralized debt securities |
1,924 | 2,024 | 1,924 | |||||||||
| Other debt securities |
15,773 | 16,174 | 15,773 | |||||||||
| Bonds available-for-sale |
||||||||||||
| U.S.treasury government |
24,024 | 24,692 | 24,692 | |||||||||
| U.S. states and political subdivisions |
933,958 | 972,491 | 972,491 | |||||||||
| Foreign governments |
5,000 | 6,733 | 6,733 | |||||||||
| Corporate debt securities |
4,431,765 | 4,444,621 | 4,444,621 | |||||||||
| Residential mortgage-backed securities |
25,629 | 27,365 | 27,365 | |||||||||
| Collateralized debt securities |
7,455 | 8,014 | 8,014 | |||||||||
| Equity securities |
||||||||||||
| Common stocks |
||||||||||||
| Consumer goods |
144,359 | 310,110 | 310,110 | |||||||||
| Energy and utilities |
115,378 | 151,786 | 151,786 | |||||||||
| Finance |
160,585 | 287,296 | 287,296 | |||||||||
| Healthcare |
98,028 | 221,782 | 221,782 | |||||||||
| Industrials |
49,103 | 124,106 | 124,106 | |||||||||
| Information technology |
134,070 | 269,497 | 269,497 | |||||||||
| Other |
93,316 | 126,452 | 126,452 | |||||||||
| Preferred stocks |
15,987 | 23,950 | 23,950 | |||||||||
| Other Investments |
||||||||||||
| Mortgage loans on real estate, net of allowance |
3,483,280 | 3,621,978 | 3,483,280 | |||||||||
| Investment real estate, net of accumulated depreciation |
524,459 | 524,459 | ||||||||||
| Real estate acquired in satisfaction of debt |
56,796 | 56,796 | ||||||||||
| Policy loans |
407,491 | 407,491 | 407,491 | |||||||||
| Options |
84,457 | 123,007 | 123,007 | |||||||||
| Other long-term investments |
50,035 | 50,035 | ||||||||||
| Short-term investments |
460,612 | 460,612 | 460,612 | |||||||||
|
|
|
|
|
|
|
|||||||
| Total investments |
$ | 18,915,207 | $ | 19,367,536 | $ | 19,713,995 | ||||||
|
|
|
|
|
|
|
|||||||
| (1) | Original cost of equity securities and, as to fixed maturity securities, original cost reduced by repayments and valuation write-downs and adjusted for amortization of premiums or accrual of discounts. |
See accompanying Report of Independent Registered Public Accounting Firm.
114
Table of Contents
Index to Financial Statements
AMERICAN NATIONAL INSURANCE COMPANY (Parent Company Only)
SCHEDULE II - CONDENSED FINANCIAL INFORMATION OF REGISTRANT
(In thousands)
| December 31, | ||||||||
| Condensed Statements of Financial Position |
2015 | 2014 | ||||||
| (As Adjusted) | ||||||||
| Assets |
||||||||
| Fixed maturity securities |
$ | 9,341,563 | $ | 9,567,848 | ||||
| Equity securities |
2,690 | — | ||||||
| Mortgage loans on real estate, net of allowance |
3,386,231 | 3,266,361 | ||||||
| Other invested assets |
1,953,680 | 1,858,444 | ||||||
| Investment in subsidiaries |
2,431,398 | 2,301,218 | ||||||
| Deferred policy acquisition costs |
1,091,031 | 1,023,778 | ||||||
| Separate account assets |
918,446 | 1,001,515 | ||||||
| Other assets |
633,953 | 629,531 | ||||||
|
|
|
|
|
|||||
| Total assets |
$ | 19,758,992 | $ | 19,648,695 | ||||
|
|
|
|
|
|||||
| Liabilities |
||||||||
| Policy liabilities |
$ | 3,841,499 | $ | 3,625,092 | ||||
| Policyholders’ account balances |
9,943,694 | 9,975,383 | ||||||
| Separate account liabilities |
918,446 | 1,001,515 | ||||||
| Other liabilities |
603,071 | 619,142 | ||||||
|
|
|
|
|
|||||
| Total liabilities |
15,306,710 | 15,221,132 | ||||||
|
|
|
|
|
|||||
| Shareholders’ equity |
||||||||
| Common stock |
30,832 | 30,832 | ||||||
| Additional paid-in capital |
13,689 | 9,248 | ||||||
| Accumulated other comprehensive income |
352,620 | 490,782 | ||||||
| Retained earnings |
4,157,184 | 3,998,642 | ||||||
| Treasury stock, at cost |
(102,043 | ) | (101,941 | ) | ||||
|
|
|
|
|
|||||
| Total stockholders’ equity |
4,452,282 | 4,427,563 | ||||||
|
|
|
|
|
|||||
| Total liabilities and stockholders’ equity |
$ | 19,758,992 | $ | 19,648,695 | ||||
|
|
|
|
|
|||||
The condensed financial statements should be read in conjunction with the consolidated financial statements and notes therein.
See accompanying Report of Independent Registered Public Accounting Firm.
115
Table of Contents
Index to Financial Statements
AMERICAN NATIONAL INSURANCE COMPANY (Parent Company Only)
SCHEDULE II - CONDENSED FINANCIAL INFORMATION OF REGISTRANT
(In thousands)
| Years ended December 31, | ||||||||||||
| Condensed Statements of Operations |
2015 | 2014 | 2013 | |||||||||
| (As Adjusted) | (As Adjusted) | |||||||||||
| Premiums and other revenues |
||||||||||||
| Premiums and other policy revenues |
$ | 820,194 | $ | 786,823 | $ | 734,506 | ||||||
| Net investment income |
672,093 | 772,355 | 861,354 | |||||||||
| Net realized investment gain |
21,258 | 18,702 | 73,791 | |||||||||
| Other-than-temporary impairments |
(60 | ) | (41 | ) | — | |||||||
| Other income |
15,785 | 10,803 | 12,083 | |||||||||
|
|
|
|
|
|
|
|||||||
| Total premiums and other revenues |
1,529,270 | 1,588,642 | 1,681,734 | |||||||||
|
|
|
|
|
|
|
|||||||
| Benefits, losses and expenses |
||||||||||||
| Policyholder benefits |
615,180 | 574,975 | 520,806 | |||||||||
| Other operating expenses |
764,913 | 812,762 | 913,914 | |||||||||
|
|
|
|
|
|
|
|||||||
| Total benefits, losses and expenses |
1,380,093 | 1,387,737 | 1,434,720 | |||||||||
|
|
|
|
|
|
|
|||||||
| Income from continuing operations before federal income tax and equity in earnings of subsidiaries |
149,177 | 200,905 | 247,014 | |||||||||
|
|
|
|
|
|
|
|||||||
| Provision for federal income taxes |
47,501 | 63,454 | 50,927 | |||||||||
| Equity in earnings of subsidiaries, net of tax |
141,312 | 107,884 | 70,394 | |||||||||
|
|
|
|
|
|
|
|||||||
| Net income |
$ | 242,988 | $ | 245,335 | $ | 266,481 | ||||||
|
|
|
|
|
|
|
|||||||
The condensed financial statements should be read in conjunction with the consolidated financial statements and notes therein.
See accompanying Report of Independent Registered Public Accounting Firm.
116
Table of Contents
Index to Financial Statements
AMERICAN NATIONAL INSURANCE COMPANY (Parent Company Only)
SCHEDULE II - CONDENSED FINANCIAL INFORMATION OF REGISTRANT
(In thousands)
| Years ended December 31, | ||||||||||||
| Condensed Statements of Cash Flows |
2015 | 2014 | 2013 | |||||||||
| (As Adjusted) | (As Adjusted) | |||||||||||
| OPERATING ACTIVITIES |
||||||||||||
| Net income |
$ | 242,988 | $ | 245,335 | $ | 266,481 | ||||||
| Adjustments to reconcile net income to net cash provided by operating activities |
||||||||||||
| Net realized investments gains |
(21,258 | ) | (18,702 | ) | (73,791 | ) | ||||||
| Other-than-temporary impairments |
60 | 41 | — | |||||||||
| Amortization (accretion) of premiums, discounts and loan origination fees |
(2,293 | ) | 3,581 | 1,216 | ||||||||
| Net capitalized interest on policy loans and mortgage loans |
(27,346 | ) | (27,922 | ) | (23,864 | ) | ||||||
| Depreciation |
24,716 | 21,822 | 18,618 | |||||||||
| Interest credited to policyholders’ account balances |
263,362 | 324,325 | 395,013 | |||||||||
| Charges to policyholders’ account balances |
(238,169 | ) | (212,690 | ) | (199,285 | ) | ||||||
| Deferred federal income tax (benefit) expense |
8,091 | 16,429 | (15,245 | ) | ||||||||
| Net income of subsidiaries |
(135,678 | ) | (106,751 | ) | (61,871 | ) | ||||||
| Equity in (earnings) losses of affiliates |
(5,634 | ) | 3,800 | (8,523 | ) | |||||||
| Distributions from equity method investments |
— | 408 | 2,411 | |||||||||
| Changes in |
||||||||||||
| Accrued investment income |
6,995 | 9,801 | 9,336 | |||||||||
| Reinsurance recoverables |
(14,778 | ) | 2,312 | (1,025 | ) | |||||||
| Prepaid reinsurance premiums |
3,050 | 2,318 | 7,575 | |||||||||
| Premiums due and other receivables |
2,331 | 3,873 | 9,531 | |||||||||
| Deferred policy acquisition costs |
(13,323 | ) | 7,560 | 28,216 | ||||||||
| Policyholder liabilities |
222,928 | 152,923 | 38,188 | |||||||||
| Liability for retirement benefits |
(23,263 | ) | (12,552 | ) | 12,656 | |||||||
| Current tax receivable/payable |
7,551 | 8,181 | 9,936 | |||||||||
| Other, net |
(20,471 | ) | (29,831 | ) | (9,993 | ) | ||||||
|
|
|
|
|
|
|
|||||||
| Net cash provided by operating activities |
279,859 | 394,261 | 405,580 | |||||||||
|
|
|
|
|
|
|
|||||||
| INVESTING ACTIVITIES |
||||||||||||
| Proceeds from sale/maturity/prepayment of |
||||||||||||
| Held-to-maturity securities |
827,234 | 452,846 | 1,207,038 | |||||||||
| Available for sale securities |
340,274 | 625,563 | 599,228 | |||||||||
| Investment real estate |
18,929 | 53,859 | 8,006 | |||||||||
| Mortgage loans |
809,742 | 578,098 | 756,554 | |||||||||
| Policy loans |
44,257 | 45,732 | 47,018 | |||||||||
| Other invested assets |
71,469 | 40,791 | 88,883 | |||||||||
| Disposals of property and equipment |
2,721 | 43,869 | 270 | |||||||||
| Distributions from affiliates and subsidiaries |
15,958 | 439 | 10,581 | |||||||||
| Payment for the purchase/origination of |
||||||||||||
| Held-to-maturity securities |
(336,902 | ) | (287,694 | ) | (701,776 | ) | ||||||
| Available for sale securities |
(744,480 | ) | (572,299 | ) | (556,940 | ) | ||||||
| Investment real estate |
(69,145 | ) | (23,959 | ) | (28,882 | ) | ||||||
| Mortgage loans |
(933,879 | ) | (633,401 | ) | (908,512 | ) | ||||||
| Policy loans |
(21,106 | ) | (23,621 | ) | (21,682 | ) | ||||||
| Other invested assets |
(37,958 | ) | (43,423 | ) | (46,168 | ) | ||||||
| Additions to property and equipment |
(24,352 | ) | (56,651 | ) | (5,991 | ) | ||||||
| Contributions to unconsolidated affiliates |
(47,130 | ) | (1,035 | ) | (949 | ) | ||||||
| Change in short-term investments |
(42,258 | ) | 4,518 | (401,682 | ) | |||||||
| Change in investment in subsidiaries |
(20,782 | ) | — | — | ||||||||
| Other, net |
(3 | ) | 24,636 | 1,642 | ||||||||
|
|
|
|
|
|
|
|||||||
| Net cash provided by (used in) investing activities |
(147,411 | ) | 228,268 | 46,638 | ||||||||
|
|
|
|
|
|
|
|||||||
| FINANCING ACTIVITIES |
||||||||||||
| Policyholders’ account deposits |
1,280,756 | 941,400 | 835,942 | |||||||||
| Policyholders’ account withdrawals |
(1,337,668 | ) | (1,479,004 | ) | (1,420,675 | ) | ||||||
| Dividends to stockholders |
(84,446 | ) | (82,805 | ) | (82,831 | ) | ||||||
|
|
|
|
|
|
|
|||||||
| Net cash used in financing activities |
(141,358 | ) | (620,409 | ) | (667,564 | ) | ||||||
|
|
|
|
|
|
|
|||||||
| NET INCREASE (DECREASE) IN CASH AND CASH EQUIVALENTS |
(8,910 | ) | 2,120 | (215,346 | ) | |||||||
| Beginning of the period |
48,446 | 46,326 | 261,672 | |||||||||
|
|
|
|
|
|
|
|||||||
| End of the period |
$ | 39,536 | $ | 48,446 | $ | 46,326 | ||||||
|
|
|
|
|
|
|
|||||||
The condensed financial statements should be read in conjunction with the consolidated financial statements and notes therein.
See accompanying notes to the consolidated financial statements.
117
Table of Contents
Index to Financial Statements
AMERICAN NATIONAL INSURANCE COMPANY AND SUBSIDIARIES
SCHEDULE III - SUPPLEMENTARY INSURANCE INFORMATION
(In thousands)
| Future Policy | ||||||||||||||||||||||||||||||||||||
| Benefits, Policyholders’ |
||||||||||||||||||||||||||||||||||||
| Account Balances, | Benefits, | Amortization | ||||||||||||||||||||||||||||||||||
| Deferred | Benefits, Policy and | Claims, Losses | of Deferred | |||||||||||||||||||||||||||||||||
| Policy | Contract Claims | Net | and | Policy | Other | |||||||||||||||||||||||||||||||
| Acquisition | and Other | Unearned | Premium | Investment | Settlement | Acquisition | Operating | Premiums | ||||||||||||||||||||||||||||
| Segment |
Cost | Policyholder Funds | Premiums | Revenue | Income (1) | Expenses | Costs | Expenses (2) | Written | |||||||||||||||||||||||||||
| 2015 |
||||||||||||||||||||||||||||||||||||
| Life |
$ | 756,023 | $ | 4,860,263 | $ | 35,810 | $ | 305,350 | $ | 226,076 | $ | 386,785 | $ | 77,567 | $ | 201,112 | $ | — | ||||||||||||||||||
| Annuity |
411,206 | 10,410,157 | — | 183,125 | 459,458 | 230,221 | 81,793 | 54,037 | — | |||||||||||||||||||||||||||
| Health |
44,390 | 293,325 | 43,558 | 196,777 | 10,135 | 146,805 | 23,643 | 45,047 | — | |||||||||||||||||||||||||||
| Property & Casualty |
113,050 | 883,328 | 733,610 | 1,153,267 | 55,620 | 776,562 | 235,585 | 156,583 | 1,187,980 | |||||||||||||||||||||||||||
| Corporate & Other |
— | — | — | — | 83,542 | — | — | 44,598 | — | |||||||||||||||||||||||||||
|
|
|
|
|
|
|
|
|
|
|
|
|
|
|
|
|
|
|
|||||||||||||||||||
| Total |
$ | 1,324,669 | $ | 16,447,073 | $ | 812,978 | $ | 1,838,519 | $ | 834,831 | $ | 1,540,373 | $ | 418,588 | $ | 501,377 | $ | 1,187,980 | ||||||||||||||||||
|
|
|
|
|
|
|
|
|
|
|
|
|
|
|
|
|
|
|
|||||||||||||||||||
| 2014 |
||||||||||||||||||||||||||||||||||||
| Life |
$ | 711,469 | $ | 4,720,075 | $ | 35,524 | $ | 307,771 | $ | 232,389 | $ | 351,271 | $ | 78,181 | $ | 194,927 | $ | — | ||||||||||||||||||
| Annuity |
382,441 | 10,286,205 | — | 190,357 | 545,887 | 234,173 | 79,135 | 56,487 | — | |||||||||||||||||||||||||||
| Health |
47,784 | 316,684 | 46,137 | 216,868 | 11,692 | 144,799 | 18,966 | 43,261 | — | |||||||||||||||||||||||||||
| Property & Casualty |
111,850 | 883,148 | 673,390 | 1,100,975 | 58,843 | 745,540 | 223,658 | 130,655 | 1,109,029 | |||||||||||||||||||||||||||
| Corporate & Other |
— | — | — | — | 84,047 | — | — | 60,535 | — | |||||||||||||||||||||||||||
|
|
|
|
|
|
|
|
|
|
|
|
|
|
|
|
|
|
|
|||||||||||||||||||
| Total |
$ | 1,253,544 | $ | 16,206,112 | $ | 755,051 | $ | 1,815,971 | $ | 932,858 | $ | 1,475,783 | $ | 399,940 | $ | 485,865 | $ | 1,109,029 | ||||||||||||||||||
|
|
|
|
|
|
|
|
|
|
|
|
|
|
|
|
|
|
|
|||||||||||||||||||
| 2013 |
||||||||||||||||||||||||||||||||||||
| Life |
$ | 684,084 | $ | 4,559,721 | $ | 35,935 | $ | 293,173 | $ | 230,763 | $ | 345,566 | $ | 82,658 | $ | 207,520 | $ | — | ||||||||||||||||||
| Annuity |
424,158 | 10,641,769 | — | 155,162 | 632,536 | 193,840 | 85,756 | 63,326 | — | |||||||||||||||||||||||||||
| Health |
47,220 | 320,457 | 48,269 | 212,931 | 11,314 | 139,762 | 15,249 | 46,646 | — | |||||||||||||||||||||||||||
| Property & Casualty |
122,271 | 889,939 | 655,674 | 1,074,260 | 66,632 | 746,636 | 225,131 | 128,437 | 1,069,694 | |||||||||||||||||||||||||||
| Corporate & Other |
— | — | — | — | 75,565 | — | — | 57,122 | — | |||||||||||||||||||||||||||
|
|
|
|
|
|
|
|
|
|
|
|
|
|
|
|
|
|
|
|||||||||||||||||||
| Total |
$ | 1,277,733 | $ | 16,411,886 | $ | 739,878 | $ | 1,735,526 | $ | 1,016,810 | $ | 1,425,804 | $ | 408,794 | $ | 503,051 | $ | 1,069,694 | ||||||||||||||||||
|
|
|
|
|
|
|
|
|
|
|
|
|
|
|
|
|
|
|
|||||||||||||||||||
| (1) | Net investment income from fixed income assets (bonds and mortgage loans on real estate) is allocated to insurance lines based on the funds generated by each line at the average yield available from these fixed income assets at the time such funds become available. Net investment income from policy loans is allocated to the insurance lines according to the amount of loans made by each line. Net investment income from all other assets is allocated to the insurance lines as necessary to support the equity assigned to that line with the remainder allocated to capital & surplus. |
| (2) | Identifiable expenses are charged directly to the appropriate line of business. The remaining expenses are allocated to the lines based upon various factors including premium ratio within the respective lines. |
See accompanying Report of Independent Registered Public Accounting Firm.
118
Table of Contents
Index to Financial Statements
AMERICAN NATIONAL INSURANCE COMPANY AND SUBSIDIARIES
SCHEDULE IV - REINSURANCE INFORMATION
(In thousands)
| Ceded to | Assumed | Percentage of | ||||||||||||||||||
| Direct | Other | from Other | Net | Amount | ||||||||||||||||
| Amount | Companies | Companies | Amount | Assumed to Net | ||||||||||||||||
| Year Ended December 31, 2015 |
||||||||||||||||||||
| Life insurance in-force |
$ | 90,194,532 | $ | 29,891,183 | $ | 120 | $ | 60,303,469 | 0.0 | % | ||||||||||
|
|
|
|
|
|
|
|
|
|||||||||||||
| Premiums earned |
||||||||||||||||||||
| Life and annuity |
$ | 590,131 | $ | 101,636 | $ | (20 | ) | $ | 488,475 | 0.0 | ||||||||||
| Accident and health |
241,140 | 224,623 | 180,260 | 196,777 | 91.6 | |||||||||||||||
| Property and casualty |
1,238,163 | 93,024 | 8,128 | 1,153,267 | 0.7 | |||||||||||||||
|
|
|
|
|
|
|
|
|
|||||||||||||
| Total premiums |
$ | 2,069,434 | $ | 419,283 | $ | 188,368 | $ | 1,838,519 | 10.2 | |||||||||||
|
|
|
|
|
|
|
|
|
|||||||||||||
| Year Ended December 31, 2014 |
||||||||||||||||||||
| Life insurance in-force |
$ | 85,570,057 | $ | 30,007,131 | $ | 6,007 | $ | 55,568,933 | 0.0 | |||||||||||
|
|
|
|
|
|
|
|
|
|||||||||||||
| Premiums earned |
||||||||||||||||||||
| Life and annuity |
$ | 594,568 | $ | 96,577 | $ | 137 | $ | 498,128 | 0.0 | |||||||||||
| Accident and health |
271,004 | 274,368 | 220,232 | 216,868 | 101.6 | |||||||||||||||
| Property and casualty |
1,183,875 | 89,607 | 6,707 | 1,100,975 | 0.6 | |||||||||||||||
|
|
|
|
|
|
|
|
|
|||||||||||||
| Total premiums |
$ | 2,049,447 | $ | 460,552 | $ | 227,076 | $ | 1,815,971 | 12.5 | |||||||||||
|
|
|
|
|
|
|
|
|
|||||||||||||
| Year Ended December 31, 2013 |
||||||||||||||||||||
| Life insurance in-force |
$ | 80,038,270 | $ | 30,577,123 | $ | 32,019 | $ | 49,493,166 | 0.1 | |||||||||||
|
|
|
|
|
|
|
|
|
|||||||||||||
| Premiums earned |
||||||||||||||||||||
| Life and annuity |
$ | 541,025 | $ | 93,240 | $ | 550 | $ | 448,335 | 0.1 | |||||||||||
| Accident and health |
271,847 | 240,505 | 181,589 | 212,931 | 85.3 | |||||||||||||||
| Property and casualty |
1,157,528 | 90,196 | 6,928 | 1,074,260 | 0.6 | |||||||||||||||
|
|
|
|
|
|
|
|
|
|||||||||||||
| Total premiums |
$ | 1,970,400 | $ | 423,941 | $ | 189,067 | $ | 1,735,526 | 10.9 | % | ||||||||||
|
|
|
|
|
|
|
|
|
|||||||||||||
See accompanying Report of Independent Registered Public Accounting Firm.
AMERICAN NATIONAL INSURANCE COMPANY AND SUBSIDIARIES
SCHEDULE V - VALUATION AND QUALIFYING ACCOUNTS
(In thousands)
| Additions | Deductions | |||||||||||||||||||
| Balance at | Balance at | |||||||||||||||||||
| Beginning of | Charged to | Change in | End of | |||||||||||||||||
| Period | Expense | Written off | Estimate (1) | Period | ||||||||||||||||
| 2015 |
||||||||||||||||||||
| Investment valuation allowances: |
||||||||||||||||||||
| Mortgage loans on real estate |
$ | 17,860 | $ | 220 | $ | (5,185 | ) | $ | — | $ | 12,895 | |||||||||
|
|
|
|
|
|
|
|
|
|
|
|||||||||||
| 2014 |
||||||||||||||||||||
| Investment valuation allowances: |
||||||||||||||||||||
| Mortgage loans on real estate |
$ | 12,181 | $ | 5,679 | $ | — | $ | — | $ | 17,860 | ||||||||||
|
|
|
|
|
|
|
|
|
|
|
|||||||||||
| 2013 |
||||||||||||||||||||
| Investment valuation allowances: |
||||||||||||||||||||
| Mortgage loans on real estate |
$ | 12,012 | $ | 171 | $ | — | $ | (2 | ) | $ | 12,181 | |||||||||
|
|
|
|
|
|
|
|
|
|
|
|||||||||||
| (1) | Decrease in the required valuation allowance for mortgage loans as a result of changes to the estimate in calculating the mortgage loan allowance based on enhanced methodology. |
See accompanying Report of Independent Registered Public Accounting Firm.
119