Attached files
| file | filename |
|---|---|
| EX-23 - EX-23 - SAFETY INSURANCE GROUP INC | saft-20151231xex23.htm |
| EX-31.1 - EX-31.1 - SAFETY INSURANCE GROUP INC | saft-20151231ex311c50ad2.htm |
| EX-31.2 - EX-31.2 - SAFETY INSURANCE GROUP INC | saft-20151231ex312751f16.htm |
| EX-32.2 - EX-32.2 - SAFETY INSURANCE GROUP INC | saft-20151231ex322f0b077.htm |
| EX-32.1 - EX-32.1 - SAFETY INSURANCE GROUP INC | saft-20151231ex32169f79d.htm |
UNITED STATES
SECURITIES AND EXCHANGE COMMISSION
Washington, D.C. 20549
FORM 10‑K
|
☒ |
ANNUAL REPORT PURSUANT TO SECTION 13 OR 15(d) OF THE SECURITIES EXCHANGE ACT OF 1934 |
|
For the fiscal year ended December 31, 2015 |
|
|
Or |
|
|
☐ |
TRANSITION REPORT PURSUANT TO SECTION 13 OR 15(d) OF THE SECURITIES EXCHANGE ACT OF 1934 |
|
For the transition period from to |
|
Commission file number 000‑50070
SAFETY INSURANCE GROUP, INC.
(Exact name of registrant as specified in its charter)
|
Delaware |
13‑4181699 |
20 Custom House Street, Boston, Massachusetts 02110
(Address of principal executive offices including zip code)
(617) 951‑0600
(Registrant’s telephone number, including area code)
Securities registered pursuant to Section 12(b) of the Act:
|
Title of each class |
Name of each exchange on which registered |
|
Common Shares, $0.01 par value per share |
NASDAQ Global Select Market |
Indicate by check mark whether the registrant is a well‑known seasoned issuer, as defined in Rule 405 of the Securities Act. Yes ☐ No ☒
Indicate by check mark whether the registrant is not required to file reports pursuant to Section 13 of Section 15(d) of the Act. Yes ☐ No ☒
Indicate by check mark whether the registrant (1) has filed all reports required to be filed by Section 13 or 15(d) of the Securities Exchange Act of 1934 during the preceding 12 months (or for such shorter period that the registrant was required to file such reports), and (2) has been subject to such filing requirements for the past 90 days. Yes ☒ No ☐
Indicate by check mark whether the registrant has submitted electronically and posted on its corporate Web site, if any, every Interactive Data File required to be submitted and posted pursuant to Rule 405 of Regulations S‑T (§232.405 of this chapter) during the preceding 12 months (or for such shorter period that the registrant was required to submit and post such files). Yes ☒ No ☐
Indicate by check mark if disclosure of delinquent filers pursuant to Item 405 of Regulation S‑K (§ 229.405 of this chapter) is not contained herein, and will not be contained, to the best of registrant’s knowledge, in definitive proxy or information statements incorporated by reference in Part III of this Form 10‑K or any amendment to this Form 10‑K. ☒
Indicate by check mark whether the registrant is a large accelerated filer, an accelerated filer, a non‑accelerated filer, or a smaller reporting company. See definitions of “large accelerated filer,” “accelerated filer,” and “smaller reporting company” in Rule 12b‑2 of the Exchange Act. (Check one):
|
Large accelerated filer ☒ |
Accelerated filer ☐ |
Non-accelerated filer ☐ |
Smaller reporting company ☐ |
|
|
|
(Do not check if a |
|
Indicate by check mark whether the registrant is a shell company (as defined in Rule 12b‑2 of the Exchange Act). Yes ☐ No ☒
The aggregate market value of the registrant’s voting and non‑voting common equity (based on the closing sales price on NASDAQ) held by non‑affiliates of the registrant as of June 30, 2015, was approximately $811,331,905.
As of February 17, 2016 there were 15,092,099 Common Shares with a par value of $0.01 per share outstanding.
Documents Incorporated by Reference
Portions of the registrant’s definitive proxy statement for its Annual Meeting of Shareholders to be held on May 18, 2016, which Safety Insurance Group, Inc. (the “Company”, “we”, “our”, “us”) intends to file within 120 days after its December 31, 2015 year‑end, are incorporated by reference into Part II and Part III hereof.
SAFETY INSURANCE GROUP, INC.
In this Form 10-K, all dollar amounts are presented in thousands, except average premium, average claim and per claim data, share, and per share data.
We are a leading provider of private passenger automobile insurance in Massachusetts. In addition to private passenger automobile insurance (which represented 59.6% of our direct written premiums in 2015), we offer a portfolio of property and casualty insurance products, including commercial automobile, homeowners, dwelling fire, umbrella and business owner policies. Operating exclusively in Massachusetts and New Hampshire through our insurance company subsidiaries, Safety Insurance Company ("Safety Insurance"), Safety Indemnity Insurance Company ("Safety Indemnity") and Safety Property and Casualty Insurance Company ("Safety P&C") (together referred to as the "Insurance Subsidiaries"), we have established strong relationships with independent insurance agents, who numbered 924 in 1,102 locations throughout Massachusetts and New Hampshire during 2015. We have used these relationships and our extensive knowledge of the Massachusetts market to become the third largest private passenger automobile carrier, capturing an approximate 10.2% share of the Massachusetts private passenger automobile insurance market, and the second largest commercial automobile carrier, with an 14.1% share of the Massachusetts commercial automobile insurance market in 2015 according to statistics compiled by Commonwealth Automobile Reinsurers ("CAR"). We are also the fourth largest homeowners insurance carrier in Massachusetts with a 7.2% share of the Massachusetts homeowners insurance market. In addition, we were also ranked the 45th largest automobile writer in the country according to A.M. Best, based on 2014 direct written premiums. We were incorporated under the laws of Delaware in 2001, but through our predecessors, we have underwritten insurance in Massachusetts since 1979.
Our Insurance Subsidiaries began writing private passenger automobile and homeowners insurance in New Hampshire during 2008, personal umbrella insurance during 2009, and commercial automobile insurance during 2011. During the years ended December 31, 2015, 2014, and 2013, the Company wrote $22,731, $18,755, and $13,773 in direct written premiums, respectively, and approximately 24,364, 20,626 and 15,580 policies, respectively, in New Hampshire.
On February 9, 2015, the Insurance Subsidiaries each received a license to begin writing our property and casualty insurance products in the state of Maine. We anticipate that we will begin to write new business in Maine beginning in the first quarter of 2016.
Website Access to Information
The Internet address for our website is www.SafetyInsurance.com. All of our press releases and United States Securities and Exchange Commission ("SEC") reports are available for viewing or download at our website. These documents are made available on our website as soon as reasonably practicable after each press release is made and SEC report is filed with, or furnished to, the SEC. Copies of any current public information about our company are available without charge upon written, telephone, faxed or e-mailed request to the Office of Investor Relations, Safety Insurance Group, Inc., 20 Custom House Street, Boston, MA 02110, Tel: 877-951-2522, Fax: 617-603-4837, or e-mail: InvestorRelations@SafetyInsurance.com. The materials on our website are not part of this report on Form 10-K nor are they incorporated by reference into this report and the URL above is intended to be an inactive textual reference only.
Our Competitive Strengths
We Have Strong Relationships with Independent Agents. In 2015, Independent agents accounted for approximately 63.4% of the Massachusetts automobile insurance market measured by direct written premiums as
1
compared to approximately 31.3% nationwide, based on data made available by A.M. Best. For that reason, our strategy is centered around, and we sell exclusively through, a network of independent agents, who numbered 924 in 1,102 locations throughout Massachusetts and New Hampshire during 2015. In order to support our independent agents and enhance our relationships with them, we:
|
· |
provide our agents with a portfolio of property and casualty insurance products at competitive prices to help our agents address effectively the insurance needs of their clients; |
|
· |
provide our agents with a variety of technological resources which enable us to deliver superior service and support to them; and |
|
· |
offer our agents competitive commission schedules and profit sharing programs. |
Through these measures, we strive to become the preferred provider of the independent agents in our agency network and capture a growing share of the total insurance business written by these agents in Massachusetts and New Hampshire. We must compete with other insurance carriers for the business of independent agents.
We Have a History of Profitable Operations. In 34 out of 35 years since our inception in 1979, we have been profitable. The lone year where we did not have profits was 2015 when we were impacted by claims related to the highest recorded snowfall totals in Massachusetts history. We have achieved our profitability, among other things, by:
|
· |
maintaining a consistent number of private passenger automobile exposures we underwrite, which totaled 471,924 in 2015 compared to 477,238 in 2011; |
|
· |
growing our commercial automobile exposures we underwrite, which totaled 68,591 in 2015 compared to 49,150 in 2011; |
|
· |
growing our homeowner book of business which had total exposures of 162,703 in 2015 compared to 130,563 in 2011; |
|
· |
maintaining a combined ratio that is typically below industry averages (refer to Insurance Ratios under Item 7—Management's Discussion and Analysis of Financial Condition and Results of Operations for a discussion on insurance ratios); |
|
· |
taking advantage of the institutional knowledge our management has amassed during our long operating history in the Massachusetts market; |
|
· |
introducing new lines and forms of insurance products; |
|
· |
investing in technology to simplify internal processes and enhance our relationships with our agents; and |
|
· |
maintaining a high-quality investment portfolio. |
We Are a Technological Leader. We have dedicated significant human and financial resources to the development of advanced information systems. Our technology efforts have benefited us in two distinct ways. First, we continue to develop technology that empowers our independent agent customers to make it easier for them to transact business with their clients and with the Insurance Subsidiaries. In our largest business line, private passenger automobile insurance, our agents now submit approximately 99.0% of all applications for new policies or endorsements for existing policies to us electronically through our proprietary information portal, the Agents Virtual Community ("AVC"). Our agents can also submit commercial automobile and homeowners insurance policies electronically over AVC. Second, our investment in technology has allowed us to re-engineer internal back office processes to provide more efficient service at lower cost.
We Have an Experienced, Committed and Knowledgeable Management Team. Our senior management team owns approximately 4.9% of the common stock of Safety Insurance Group, Inc. on a fully diluted basis. Our senior management team has an average of over 29 years of experience with Safety. The team has demonstrated an ability to operate successfully within the Massachusetts automobile and homeowner insurance markets.
2
Our Strategy
To achieve our goal of increasing shareholder value, our strategy is to maintain and develop strong independent agent relationships by providing our agents with a full package of insurance products and information technology services. We believe this strategy will allow us to:
|
· |
further penetrate the Massachusetts, New Hampshire and Maine private passenger, commercial automobile and homeowners insurance markets; |
|
· |
implement rates, forms and billing options that allow us to cross-sell homeowners, dwelling fire, and personal umbrella in the personal lines market and business owner policies, commercial property package and commercial umbrella in the commercial lines market in order to capture a larger share of the total Massachusetts property and casualty insurance business written by each of our independent agents; and |
|
· |
continue to expand our technology to enable independent agents to more easily serve their customers and conduct business with us, thereby strengthening their relationships with us. |
Property and Casualty Insurance Market
Introduction. We are licensed by the Commissioner of Insurance (the "Commissioner") to transact property and casualty insurance in Massachusetts. All of our Massachusetts business is extensively regulated by the Commissioner.
The Massachusetts Market for Private Passenger Automobile Insurance. Private passenger automobile insurance is generally considered to be more heavily regulated in Massachusetts than in other states, under what the Massachusetts Commissioner of Insurance calls Managed Competition. Since 2008, Massachusetts automobile insurance premium rates are strictly regulated under a prior approval rate review process, governed by regulations that set certain terms and conditions that insurers must comply with in establishing their rates. Certain of the historically unique factors in Massachusetts continue to exist, including compulsory insurance, affinity group marketing, and the prominence of independent agents.
Historically, we have focused on underwriting private passenger automobile insurance, which is written through our subsidiary, Safety Insurance. In 1989, we formed Safety Indemnity to offer commercial automobile insurance at preferred rates. Since 1997, we have expanded the breadth of our product line in order for agents to address a greater portion of their clients' insurance needs by selling multiple products. Homeowners, business owners’ policies, personal umbrella, dwelling fire and commercial umbrella insurance are written by Safety Insurance at standard rates, and written by Safety Indemnity at preferred rates. In December 2006, we formed Safety P&C to offer homeowners and commercial automobile insurance at ultra preferred rates.
3
The table below shows our premiums in each of these product lines for the periods indicated and the portions of our total premiums each product line represented.
|
|
Years Ended December 31, |
|
|||||||||||||||
|
Direct Written Premiums |
2015 |
|
|
2014 |
|
|
2013 |
|
|||||||||
|
Private passenger automobile |
$ |
468,187 |
|
59.6 |
% |
|
$ |
472,553 |
|
61.7 |
% |
|
$ |
467,431 |
|
63.9 |
% |
|
Commercial automobile |
|
108,013 |
|
13.8 |
|
|
|
95,398 |
|
12.5 |
|
|
|
86,003 |
|
11.8 |
|
|
Homeowners |
|
170,410 |
|
21.7 |
|
|
|
161,388 |
|
21.1 |
|
|
|
144,925 |
|
19.8 |
|
|
Business owners |
|
22,223 |
|
2.8 |
|
|
|
20,751 |
|
2.7 |
|
|
|
19,688 |
|
2.7 |
|
|
Personal umbrella |
|
6,925 |
|
0.9 |
|
|
|
6,508 |
|
0.8 |
|
|
|
5,927 |
|
0.8 |
|
|
Dwelling fire |
|
8,920 |
|
1.1 |
|
|
|
8,104 |
|
1.1 |
|
|
|
6,811 |
|
0.9 |
|
|
Commercial umbrella |
|
1,052 |
|
0.1 |
|
|
|
983 |
|
0.1 |
|
|
|
895 |
|
0.1 |
|
|
Total |
$ |
785,730 |
|
100.0 |
% |
|
$ |
765,685 |
|
100.0 |
% |
|
$ |
731,680 |
|
100.0 |
% |
|
|
|
|
|
|
|
|
|
|
|
|
|
|
|
|
|
|
|
Our product lines are as follows:
Private Passenger Automobile (59.6% of 2015 direct written premiums). Private passenger automobile insurance is our primary product, and we support all Massachusetts policy forms and limits of coverage. Private passenger automobile policies provide coverage for bodily injury and property damage to others, no-fault personal injury coverage for the insured/insured's car occupants, and physical damage coverage for an insured's own vehicle for collision or other perils. We have priced our private passenger coverage competitively by offering group discounts since 1995 and we currently offer approximately 95 affinity group discount programs ranging from 3.0% to 8.0% discounts. Under Massachusetts' Managed Competition regulations, we offer various new discounts including a discount of up to 10.0% when a private passenger policy is issued along with an other than private passenger policy with us, a longevity/renewal credit of up to 4.0% for policyholders who maintain continuous coverage with us, and up to a 7.0% e-Customer discount for policyholders who want electronic policy issuance with one combined bill for all of their policies with us. We filed and were approved for a Massachusetts private passenger automobile insurance rate increase of 3.8% effective June 1, 2015. We filed and were approved for a New Hampshire private passenger automobile rate increase of 5.0%, which was effective November 1, 2015.
Commercial Automobile (13.8% of 2015 direct written premiums). Our commercial automobile program supports all Massachusetts policy forms and limits of coverage including endorsements that broaden coverage over and above that offered on the standard Massachusetts policy forms. Commercial automobile policies provide coverage for bodily injury and property damage to others, no-fault personal injury coverage, and physical damage coverage for an insured's own vehicle for collision or other perils resulting from the ownership or use of commercial vehicles in a business. We offer insurance for commercial vehicles used for business purposes such as private passenger-type vehicles, trucks, tractors and trailers, and insure individual vehicles as well as commercial fleets. Commercial automobile policies are written at a standard rate through Safety Insurance. We filed and were approved for a Massachusetts commercial automobile insurance rate increase of 3.5% effective February 1, 2015. We filed and were approved for a New Hampshire commercial automobile insurance rate increase of 7.9% effective August 1, 2015. Qualifying risks eligible for preferred rates are written through Safety Indemnity which offers rates that are 20.0% lower than Safety Insurance. Qualifying risks eligible for ultra preferred rates are written through Safety P&C which offers rates that are 35.0% lower than Safety Insurance.
Homeowners (21.7% of 2015 direct written premiums). We offer a broad selection of coverage forms for qualified policyholders. Homeowners policies provide coverage for losses to a dwelling and its contents from numerous perils, and coverage for liability to others arising from ownership or occupancy. We write policies on homes, condominiums, and apartments. We offer loss-free credits of up to 16.0% for eight years of loss-free experience, an account credit of up to 20.0% when a home is written together with an automobile, and up to a 5.0% e-Customer discount for policyholders who want electronic policy issuance with one combined bill for all of their policies with us. We filed and were approved for a Massachusetts rate increase of 9.1% which was effective November 1, 2015. We filed and were approved for a New Hampshire homeowners rate increase of 7.9%, which was effective November 1, 2015. All forms of homeowners coverage are written at a standard rate through Safety Insurance. Qualifying risks eligible for
4
preferred rates are written through Safety Indemnity which offers rates that are 13.0% lower than Safety Insurance. Homes with high insured property values are written through Safety P&C.
Business Owners Policies (2.8% of 2015 direct written premiums). We serve eligible small and medium sized commercial accounts with a program that covers apartments and residential condominiums; mercantile establishments, including limited cooking restaurants; offices, including office condominiums; processing and services businesses; special trade contractors; and wholesaling businesses. Business owner policies provide liability and property coverage for many perils, including business interruption from a covered loss. Equipment breakdown coverage is automatically included, and a wide range of additional coverage is available to qualified customers. We write policies for business owners at standard rates with qualifying risks eligible for preferred lower rates.
Commercial Package Policies (Included in our Business Owners Policies direct written premiums). For larger commercial accounts or those clients that require more specialized or tailored coverages, we offer a commercial package policy program that covers a more extensive range of business enterprises. Commercial package policies provide any combination of property, general liability, crime and inland marine insurance. Property automatically includes equipment breakdown coverage, and a wide range of additional coverage is available to qualified customers. We write commercial package policies at standard rates with qualifying risks eligible for preferred lower rates.
Personal Umbrella (0.9% of 2015 direct written premiums). We offer personal excess liability coverage over and above the limits of individual automobile, watercraft, and homeowner's insurance policies to clients. We offer an account credit of 10.0% when an umbrella policy is written together with an automobile insurance policy. We write policies at standard rates with limits of $1,000 to $5,000.
Dwelling Fire (1.1% of 2015 direct written premiums). We underwrite dwelling fire insurance, which is a limited form of a homeowner's policy for non-owner occupied residences. We offer superior construction and protective device credits, with an account credit of 5.0% when a dwelling fire policy is issued along with an automobile policy. We write all forms of dwelling fire coverage at standard rates with qualifying risks eligible for preferred lower rates.
Commercial Umbrella (0.1% of 2015 direct written premiums). We offer an excess liability product to clients for whom we underwrite both commercial automobile and business owner policies. The program is directed at commercial automobile risks with private passenger-type automobiles or light and medium trucks. We write commercial umbrella policies at standard rates with limits ranging from $1,000 to $5,000.
Inland Marine (Included in our Homeowners direct written premiums). We offer inland marine coverage as an endorsement for all homeowners and business owner policies, and as part of our commercial package policy. Inland marine provides additional coverage for jewelry, fine arts and other items that a homeowners or business owner policy would limit or not cover. Scheduled items valued at more than $5 must meet our underwriting guidelines and be appraised.
Watercraft (Included in our Homeowners direct written premiums). We offer watercraft coverage for small and medium sized pleasure craft with maximum lengths of 32 feet, valued at less than $75 and maximum speed of 39 knots. We write this coverage as an endorsement to our homeowner's policies.
In the wake of the September 11, 2001 tragedies, the insurance industry is also impacted by terrorism, and we have filed and received approval for a number of terrorism endorsements from the Commissioner, which limit our liability and property exposure according to the Terrorism Risk Insurance Act of 2002, the Terrorism Risk Insurance Extension Act of 2005, the Terrorism Risk Insurance Program Reauthorization Act of 2007 and the Terrorism Risk Insurance Program Reauthorization of 2014. See "Reinsurance," discussed below.
5
Distribution
We distribute our products exclusively through independent agents, unlike some of our competitors who use multiple distribution channels. We believe this gives us a competitive advantage with the agents. With the exception of personal automobile business assigned to us by the Massachusetts Automobile Insurance Plan (“MAIP”) or written through CAR’s commercial automobile Limited Servicing Carrier program, we do not accept business from insurance brokers. Our voluntary agents have authority pursuant to our voluntary agency agreement to bind our Insurance Subsidiaries for any coverage that is within the scope of their authority. We reserve the ability under Massachusetts law to cancel any coverage, other than private passenger automobile insurance, within the first 30 days after it is bound. In total, our independent agents numbered 924 and had 1,102 offices (some agencies have more than one office) and approximately 8,118 customer service representatives during 2015.
Voluntary Agents. In 2015, we obtained approximately 93.2% of our direct written premiums for automobile insurance and 100% of our direct written premiums for all of our other lines of business through our voluntary agents. As of December 31, 2015, we had agreements with 749 voluntary agents. Our voluntary agents are located in all regions of Massachusetts and New Hampshire.
We look for agents with profitable portfolios of business. To become a voluntary agent for our Company, we generally require that an agency: (i) have been in business for at least five years; (ii) have exhibited a three year private passenger average ratio of losses, excluding loss adjustment expenses, to net earned premiums ("pure loss ratio") of 65.0% or less on the portion of the agent's portfolio that we would underwrite; (iii) make a commitment for us to underwrite at least 300 policies from the agency during the first twelve months after entering an agreement with us; and (iv) offer multiple product lines. Every year, we review the performance of our agents during the prior year. If an agent fails to meet our profitability standards, we try to work with the agent to improve the profitability of the business it places with us. We generally terminate contracts each year with a few agencies, which, despite our efforts, have been consistently unable to meet our standards. Although independent agents usually represent several unrelated insurers, our goal is to be one of the top two insurance companies represented in each of our agencies, as measured by premiums. No individual agency generated more than 5.0% of our direct written premiums in 2015.
Massachusetts law guarantees that CAR provides motor vehicle insurance coverage to all qualified applicants. Under MAIP, personal automobile policies are assigned to us for three years, unless the policyholder is offered a voluntary policy by another insurer. All Massachusetts agents are authorized to submit eligible business to the MAIP for random assignment to a servicing carrier such as Safety Insurance. We are allocated all private passenger residual market business through the MAIP.
CAR runs a reinsurance pool for ceded commercial automobile policies through a Limited Servicing Carrier Program ("LSC"). CAR has approved Safety and three other servicing carriers to process ceded commercial automobile insurance. Approximately $140,000 of ceded premium is spread equitably among the four servicing carriers. Subject to the Commissioner's review, CAR sets the premium rates for commercial automobile policies reinsured through CAR and this reinsurance pool can generate an underwriting result that is a profit or deficit based upon CAR's rate level. This underwriting result is allocated among every Massachusetts commercial automobile insurance company, including us, based on a company's commercial automobile voluntary market share.
CAR also runs a reinsurance pool for Taxi, Limousine and Car Service risks (the "Taxi/Limo Program"). CAR approved Safety as one of the two servicing carriers for this program beginning January 1, 2011 for a five-year term. Approximately $10,000 of ceded premium was spread equitably between the two servicing carriers.
We are assigned independent agents by CAR who can submit commercial business to us in the LSC and Taxi/Limo Program, and we classify those agents as commercial LSC producers.
6
The table below shows our direct written exposures in each of our product lines for the periods indicated and the change in exposures for each product line.
|
|
|
Years Ended December 31, |
|
||||||||||
|
|
|
2015 |
|
2014 |
|
2013 |
|
||||||
|
Line of Business |
Exposures |
|
Change |
|
Exposures |
|
Change |
|
Exposures |
|
Change |
|
|
|
Private passenger automobile: |
|
|
|
|
|
|
|
|
|
|
|
|
|
|
|
Voluntary agents |
462,917 |
|
-1.8 |
% |
471,546 |
|
1.1 |
% |
466,209 |
|
0.9 |
% |
|
|
MAIP |
9,007 |
|
4.6 |
|
8,611 |
|
-10.4 |
|
9,615 |
|
-36.4 |
|
|
|
Total private passenger automobile |
471,924 |
|
-1.7 |
|
480,157 |
|
0.9 |
|
475,824 |
|
0.3 |
|
|
Commercial automobile: |
|
|
|
|
|
|
|
|
|
|
|
|
|
|
|
Voluntary agents |
60,995 |
|
4.2 |
|
58,550 |
|
6.6 |
|
54,934 |
|
11.2 |
|
|
|
LSC Producers |
7,596 |
|
20.6 |
|
6,299 |
|
-1.8 |
|
6,411 |
|
9.1 |
|
|
|
Total commercial automobile |
68,591 |
|
5.8 |
|
64,849 |
|
5.7 |
|
61,345 |
|
10.9 |
|
|
Other: |
|
|
|
|
|
|
|
|
|
|
|
|
|
|
Homeowners |
162,703 |
|
2.4 |
|
158,942 |
|
7.5 |
|
147,882 |
|
5.7 |
|
|
|
Business owners |
10,166 |
|
4.4 |
|
9,739 |
|
3.8 |
|
9,384 |
|
9.5 |
|
|
|
Personal umbrella |
24,083 |
|
2.6 |
|
23,483 |
|
9.0 |
|
21,551 |
|
7.9 |
|
|
|
Dwelling fire |
7,381 |
|
4.0 |
|
7,095 |
|
12.6 |
|
6,302 |
|
6.6 |
|
|
|
Commercial umbrella |
690 |
|
3.0 |
|
670 |
|
2.8 |
|
652 |
|
11.5 |
|
|
|
|
Total other |
205,023 |
|
2.6 |
|
199,929 |
|
7.6 |
|
185,771 |
|
6.2 |
|
|
|
Total |
745,538 |
|
0.1 |
|
744,935 |
|
3.0 |
|
722,940 |
|
2.2 |
|
|
Total voluntary agents |
728,935 |
|
-0.2 |
|
730,025 |
|
3.3 |
|
706,914 |
|
3.0 |
|
|
Our total written exposures increased by 0.1% for the year ended December 31, 2015. Our commercial automobile exposures increased by 5.8% in 2015 due to additional exposures from voluntary agents. Our other than auto exposures increased by 2.6% in 2015 primarily as a result of our voluntary agents' efforts to sell multiple products to their clients and our pricing strategy of offering account discounts to policyholders who insure both their home and automobile with us. In 2015, 55.8% of the private passenger automobile exposures we insure had an other than private passenger policy with us, compared to 55.4% and 52.4% in 2014 and 2013, respectively. In addition, 81.8% of our homeowners’ policyholders had a matching automobile policy with us in 2015 compared to 83.2% in 2014 and 83.6% in 2013.
We view the independent agent as our customer and business partner. As a result, a component of our marketing efforts focuses on developing interdependent relationships with leading Massachusetts and New Hampshire agents that write profitable business and positioning ourselves as the preferred insurance carrier of those agents, thereby receiving a larger portion of each agent's aggregate business. Our principal marketing strategies to agents are:
|
· |
to offer a range of products, which we believe enables our agents to meet the insurance needs of their clients, and overcomes the agents’ resistance to placing their clients' private passenger and commercial automobile, homeowners, commercial property and other coverage’s with different insurers; |
|
· |
to price our products competitively, including offering discounts when and where appropriate for safer drivers for our personal automobile products, loss-free credits for our homeowner products and also offering account discounts for policyholders that have more than one policy with us; |
|
· |
to design, price and market our products to our agents for their customers to place all their insurance with us; |
|
· |
to offer agents competitive commissions, with incentives for placing their more profitable business with us; and |
|
· |
to provide a level of support and service that enhances the agent's ability to do business with its clients and with us. |
We have a comprehensive branding campaign using a variety of radio, television, internet and print advertisements.
7
Commission Schedule and Profit Sharing Plan. We have several programs designed to attract profitable new business from agents by paying them competitive commissions. We recognize our top performing agents by making them members of either our Chairman's Elite, Chairman's, President's, Executive's or Preferred Agent's Club. In 2015, members of these Clubs received a commission of up to 18.0% of premiums for each new private passenger auto policy, up to 22.0% of premiums for each new homeowner policy, up to 20.0% for each new commercial auto policy and up to 22.0% for each new commercial property policy.
Further, we have a competitive agency incentive commission program under which we pay agents up to 7.5% of premiums based on the loss ratio on their business.
Service and Support. We believe that the level and quality of service and support we provide helps differentiate us from other insurers. We have made a significant investment in information technology designed to facilitate our agents' business. Our AVC website helps agents manage their work efficiently. We provide a substantial amount of information online that agents need to serve their customers, such as information about the status of new policies, bill payments and claims. Providing this type of content reduces the number of customer calls we receive and empowers the agent's customer service representatives by enabling them to respond to customers' inquiries while the customer is on the telephone. Finally, we believe that the knowledge and experience of our employees enhances the quality of support we provide.
Our underwriting department is responsible for a number of key decisions affecting the profitability of our business, including:
|
· |
pricing of our private passenger automobile, commercial automobile, homeowners, dwelling fire, personal umbrella, business owners, commercial umbrella and commercial package products; |
|
· |
developing new products, coverages, forms and discounts, as well as expansion into new states; |
|
· |
determining underwriting guidelines for all our products; and |
|
· |
evaluating whether to accept transfers of a portion of an existing or potential new agent's portfolio from another insurer. |
Pricing. Subject to the Commissioner's review, we set rates for our private passenger business using industry loss cost data, our own loss experience, residual market deficits, catastrophe modeling and prices charged by our competitors in the Massachusetts market. Additionally subject to the Commissioner's review, Commonwealth Automobile Reinsurers (“CAR”) establishes the rates for personal automobile policies assigned to carriers through the Massachusetts Automobile Insurance Plan (“MAIP”). In accordance with Massachusetts law, insurers may only charge MAIP policyholders the lower of the CAR/MAIP rate or the company's competitive voluntary market rate. We offer group discounts to private passenger auto policyholder who are members of 95 affinity groups. In general, we target affinity groups with a mature and stable membership base along with favorable driving records, offering between a 3.0% and 8.0% discount (with 4.7% being the average discount offered).
Subject to the Commissioner's review, CAR sets the premium rates for commercial automobile policies reinsured through the CAR residual market pool. We set rates for voluntary commercial automobile policies that are not reinsured through CAR, and for all other insurance lines we offer, including homeowners, dwelling fire, personal umbrella, commercial umbrella, commercial package policies and business owner policies. All of these rates are subject to the approval of the Commissioner of Insurance. In each line of business, we base our rates on our own loss experience, residual market deficits, catastrophe modeling, industry loss cost data and prices charged by our competitors in the Massachusetts market. We have three pricing segments for most products, utilizing Safety Insurance for standard rates, Safety Indemnity for preferred rates and Safety Property and Casualty for ultra preferred rates.
8
CAR Reinsurance Pool. CAR operates a reinsurance pool for commercial automobile policies and we are one of four approved servicing carriers. CAR also operates a reinsurance pool for taxi/limousine/car service commercial automobile policies, and we are one of two servicing carriers that service these policies for CAR. All commercial automobile business and taxi/limousine/car service business that is not written in the voluntary market in Massachusetts is apportioned to one of these servicing carriers who handle that business on behalf of CAR. Every Massachusetts commercial automobile insurer must bear a portion of the losses of the total commercial reinsurance pool that is serviced by the approved servicing carriers.
Bulk Policy Transfers and New Voluntary Agents. From time to time, we receive proposals from an existing voluntary agent to transfer a portfolio of the agent's business from another insurer to us. Our underwriters model the profitability of these portfolios before we accept these transfers. Among other things, we usually require that the private passenger portion of the portfolio have a pure loss ratio of 65.0% or less on the portion of the agent's portfolio that we would underwrite. In addition, we require any new voluntary agent to commit to transfer a portfolio to us consisting of at least 300 policies.
Policy Processing and Rate Pursuit. Our underwriting department assists in processing policy applications, endorsements, renewals and cancellations. Our proprietary software, Safety Express, provides our agents with new business and endorsement entry, real-time policy issuance for personal lines, immediate printing of declarations pages in agents' offices, policy downloads to most major agency management systems and data imports from Boston Software's WinRater (Massachusetts) and Vertafore's PL Rater (New Hampshire).
In personal lines, our agents now submit approximately 99% of all applications for new policies or endorsements for existing policies through Safety Express.
Our rate pursuit team aggressively monitors all insurance transactions to make sure we receive the correct premium for the risk insured. We accomplish this by verifying pricing criteria, such as proper classification of drivers, the make, model, and age of insured vehicles, and the availability of discounts. We verify that operators are properly listed and classified, assignment of operators to vehicles, vehicle garaging, vehicle pre-inspection requirements, and in some cases the validity of discounts. In our homeowners and dwelling fire lines, our team has completed a project to update the replacement costs for each dwelling. We use third-party software to assist in these appraisal efforts.
Product Management. The Product Management area is responsible for the overall review and updating of our products. The department maintains an annual schedule where each line of business is reviewed and benchmarked with our major competitors. Product offerings, discounts, rate levels and underwriting guidelines are reviewed and updates are performed as required. The department is also responsible for the updating of producer material such as rate and rule manuals, and underwriting guidelines as well as promotional materials. In conjunction with the underwriting operations area, the department works with third party vendors that assist with risk information gathering and rate pursuit for in force policies. The area also provides product training and general marketplace education for the organization.
Legal and Regulatory Compliance. The Legal and Regulatory Compliance department provides general legal and compliance support to all business units within the company. The department monitors legal and regulatory changes affecting the company and provides guidance on how to comply with those changes. The department reviews business unit operations to identify and address compliance vulnerabilities. It serves as the primary liaison for company regulators on regulatory matters, including complaints, inquiries, data requests and the like. The department also provides general legal support to all areas of the company, including the review of contracts and legal agreements with vendors and consultants. Legal and Regulatory Compliance additionally is responsible for the rate and form filing function at the company, across all states and lines of business.
9
Technology
The focuses of our information technology (IT) efforts are:
|
· |
to support the strategic goals, objectives and business needs of the Company by aligning our IT annual goals with those of the business assuring that IT resources are being utilized efficiently; |
|
· |
to constantly re-engineer internal processes to allow more efficient operations, resulting in lower operating costs; |
|
· |
to make it easier for independent agents to transact business with us; and |
|
· |
to enable agents to efficiently provide their clients with a high level of service. |
We believe that our technology initiatives have increased revenue and decreased costs. For example, these initiatives have allowed us to reduce the number of call-center transactions which we perform, and to transfer many manual processing functions from our internal operations to our independent agents. We also believe that these initiatives have contributed to overall increases in productivity.
Internal Applications (Intranet)
Our employees access our proprietary applications through our corporate intranet. Our intranet applications streamline internal processes and improve overall operational efficiencies in areas including:
Claims. Our claims workload management application allows our claims and subrogation adjusters to better manage injury claims. Subrogation refers to the process by which we are reimbursed by other insurers for claims costs we incur due to the fault of their insureds. The use of this application has reduced the time it takes for us to respond to and settle casualty claims, which we believe helps reduce the total amount of our claims expense.
The automated adjuster assignment system categorizes our new claims by severity and assigns them to the appropriate adjuster responsible for investigation. Once assigned, the integrated workload management tools facilitate the work of promptly assigning appraisers, investigating liability, issuing checks and receiving subrogation receipts.
The RadicalGlass.com application allows our claims department to contain glass costs by increasing the windshield repair to replacement ratio. For every windshield that is repaired rather than replaced there is an average savings of approximately $316 per windshield claim.
Our first VIP Claims Center was introduced during 2006 to provide increased service levels to our independent insurance agents and their clients. We currently operate three VIP Claims Centers which use a network of rental car centers and auto body repair shops to provide a higher level of service to the clients of the independent insurance agents while reducing costs, such as rental expense, through reduced cycle times.
Billing. Proprietary billing systems, integrated with the systems of our print and lock-box vendors, expedite the processing and collection of premium receipts and finance charges from agents and policyholders. We believe the sophistication of our direct bill system helps us to limit our bad debt expense. Our bad debt expense as a percentage of direct written premiums was 0.1% in both 2015 and 2014.
External Applications
Our Agent Technology offerings are centralized within our agency portal and feature PowerDesk and Safety Express. PowerDesk is a web based application that allows for billing inquiry, agent payments on behalf of their policyholders, policy inquiry and claims inquiry. Safety Express provides agents with new business and endorsement entry, real time policy issuance for personal lines, immediate printing of declarations pages in agents' offices, policy
10
downloads to most major agency management systems and data imports from Boston Software's WinRater (Massachusetts) and Vertafore's PL Rater (New Hampshire). In addition, we provide our agents with commission and claims download for all lines of business, Transformation Station and Transact Now Inquires, e-Claims online claims reporting, e-View daily transaction reports and e-Docs online electronic document file cabinet.
We also provide electronic billing (eBill), online bill pay (including credit and debit cards), online declarations pages, billing inquiry, claims inquiry, auto and homeowners claims first notice of loss, online auto insurance cards, and bill pay reminder alerts to our agent's policyholders through our public website, SafetyInsurance.com. We have also updated our telephone system to provide a voice activated phone directory, automated billing inquiry and payments, and call center screen pop-up technology.
We also provide policyholders mobile technology through our Safety Mobile App for iPhone and Android devices. Safety Mobile provides consumers with access to their agent information, bill pay capabilities, the ability to report an automobile or homeowners claim and access to their insurance card, among other features.
Claims
Because of the unique differences between the management of casualty claims and property claims, we use separate departments for each of these types of claims.
Casualty Claims
We have adopted stringent claims settlement procedures, which include guidelines that establish settlement ranges for soft tissue injuries, which constituted approximately 70% of our bodily injury claims in 2015. If we are unable to settle these claims within our pricing guidelines, we explore other cost effective options including alternative disputes resolutions and/or litigation. We believe that these procedures result in providing our adjusting staff with a uniform approach to negotiation.
We believe an important component of handling claims efficiently is prompt investigation and settlement. We find that faster claims settlements often result in less expensive claims settlements. Our E-Claim reporting system is an online product that reduces the time it takes for agents to notify our adjusters about claims, thereby enabling us to contact third-party claimants and other witnesses quickly. Our insureds are able to report claims directly by phone, web or mobile application. In addition, we utilize an after- hours reporting vendor to ensure that new claims can be reported 24 hours per day and 365 days per year.
We believe that early notification results in our adjusters conducting prompt investigations of claims and compiling more accurate information about those claims. Our claims workload management software also assists our adjusters in handling claims quickly.
We believe the structure of our casualty claims unit allows us to respond quickly to claimants anywhere in Massachusetts and New Hampshire. Comprising 120 people, the department is organized into distinct claim units that contain loss costs on injury claims. Field adjusters are located geographically for prompt response to claims, with our litigation unit focused on managing loss costs and litigation expenses for serious injury claims.
Additionally, we utilize a special unit to investigate fraud in connection with casualty claims. This special unit has seven dedicated employees including five field investigators. In cases where adjusters suspect fraud in connection with a claim, we deploy this special unit to conduct investigations. We deny payment to claimants in cases in which we have succeeded in accumulating sufficient evidence of fraud.
11
Property Claims
Our property claims unit handles property claims arising in our private passenger and commercial automobile, homeowners and other insurance lines. Process automation has streamlined our property claims function. Many of our property claims are now handled by our agents through AVC using our Power Desk software application. As agents receive calls from claimants, Power Desk permits the agent to immediately send information related to the claim directly to us and to an independent appraiser selected by the agent to value the claim. Once we receive this information, an automated system redirects the claim to the appropriate internal adjuster responsible for investigating the claim to determine liability. Upon determination of liability, the system automatically begins the process of seeking a subrogation recovery from another insurer, if liable. We believe this process results in a shorter time period from when the claimant first contacts the agent to when the claimant receives a claim payment, while enabling our agents to build credibility with their clients by responding to claims in a timely and efficient manner. We benefit from decreased labor expenses from the need for fewer employees to handle the reduced property claims call volume.
Another important factor in keeping our overall property claims costs low is collecting subrogation recoveries. We track the amounts we pay out in claims costs and identify cases in which we believe we can reclaim some or all of those costs through the use of our automated workload management tools.
Significant periods of time can elapse between the occurrence of an insured loss, the reporting of the loss to the insurer and the insurer's payment of that loss. To recognize liabilities for unpaid losses, insurers establish reserves as balance sheet liabilities representing estimates of amounts needed to pay reported and unreported losses and the expenses associated with investigating and paying the losses, or loss adjustment expenses. Every quarter, we review and establish our reserves. Regulations promulgated by the Commissioner require us to annually obtain a certification from either a qualified actuary or an approved loss reserve specialist who may be one of our employees that our loss and loss adjustment expenses reserves are reasonable.
When a claim is reported, claims personnel establish a "case reserve" for the estimated amount of the ultimate payment. The amount of the reserve is primarily based upon an evaluation of the type of claim involved, the circumstances surrounding each claim and the policy provisions relating to the loss. The estimate reflects informed judgment of such personnel based on general insurance reserving practices and on the experience and knowledge of the claims person. During the loss adjustment period, these estimates are revised as deemed necessary by our claims department based on subsequent developments and periodic reviews of the cases.
In accordance with industry practice, we also maintain reserves for estimated losses incurred but not yet reported. Incurred but not yet reported reserves are determined in accordance with commonly accepted actuarial reserving techniques on the basis of our historical information and experience. We make adjustments to incurred but not yet reported reserves quarterly to take into account changes in the volume of business written, claims frequency and severity, our mix of business, claims processing and other items that can be expected to affect our liability for losses and loss adjustment expenses over time.
When reviewing reserves, we analyze historical data and estimate the impact of various loss development factors, such as our historical loss experience and that of the industry, legislative enactments, judicial decisions, legal developments in imposition of damages, and changes and trends in general economic conditions, including the effects of inflation. There is no precise method, however, for evaluating the impact of any specific factor on the adequacy of reserves, because the eventual development of reserves is affected by many factors. After taking into account all relevant factors, management believes that our provision for unpaid losses and loss adjustment expenses at December 31, 2015 is adequate to cover the ultimate net cost of losses and claims incurred as of that date.
Management determines its loss and loss adjustment expense ("LAE") reserves estimates based upon the analysis of the Company's actuaries. Management has established a process for the Company's actuaries to follow in establishing reasonable reserves. The process consists of meeting with our claims department, establishing ultimate
12
incurred losses by using development models accepted by the actuarial community, and reviewing the analysis with management. The Company's estimate for loss and LAE reserves, net of the effect of ceded reinsurance, ranges from a low of $446,368 to a high of $495,541 as of December 31, 2015. The Company's net loss and LAE reserves, based on our actuaries' best estimate, were set at $485,716 as of December 31, 2015. The ultimate liability may be greater or less than reserves carried at the balance sheet date. Establishment of appropriate reserves is an inherently uncertain process, and there can be no certainty that currently established reserves will prove adequate in light of subsequent actual experience. To the extent that reserves are inadequate and are strengthened, the amount of such increase is treated as a charge to earnings in the period that the deficiency is recognized. To the extent that reserves are redundant and are released, the amount of the release is a credit to earnings in the period the redundancy is recognized. We do not discount any of our reserves.
The following table presents development information on changes in the reserves for losses and LAE of our Insurance Subsidiaries for each year in the three year period ended December 31, 2015.
|
|
|
Year Ended December 31, |
|||||||
|
|
|
2015 |
|
2014 |
|
|
2013 |
||
|
Reserves for losses and LAE at beginning of year |
|
$ |
482,012 |
|
$ |
455,014 |
|
$ |
423,842 |
|
Less receivable from reinsurers related to unpaid losses and LAE |
|
|
(61,245) |
|
|
(60,346) |
|
|
(52,185) |
|
Net reserves for losses and LAE at beginning of year |
420,767 | 394,668 | 371,657 | ||||||
|
Incurred losses and LAE, related to: |
|
|
|
|
|
|
|
|
|
|
Current year |
|
|
642,882 |
|
|
513,734 |
|
|
476,638 |
|
Prior years |
|
|
(30,313) |
|
|
(37,368) |
|
|
(28,889) |
|
Total incurred losses and LAE |
|
|
612,569 |
|
|
476,366 |
|
|
447,749 |
|
Paid losses and LAE related to: |
|
|
|
|
|
|
|
|
|
|
Current year |
|
|
415,256 |
|
|
316,979 |
|
|
299,882 |
|
Prior years |
|
|
132,364 |
|
|
133,288 |
|
|
124,856 |
|
Total paid losses and LAE |
|
|
547,620 |
|
|
450,267 |
|
|
424,738 |
|
Net reserves for losses and LAE at end of period |
|
|
485,716 |
|
|
420,767 |
|
|
394,668 |
|
Plus receivable from reinsurers related to unpaid losses and LAE |
|
|
68,261 |
|
|
61,245 |
|
|
60,346 |
|
Reserves for losses and LAE at end of period |
|
$ |
553,977 |
|
$ |
482,012 |
|
$ |
455,014 |
|
|
|
|
|
|
|
|
|
|
|
At the end of each period, the reserves were re-estimated for all prior accident years. Our prior year reserves decreased by $30,313, $37,368, and $28,889 for the years ended 2015, 2014, and 2013, respectively. The decreases in prior year reserves in 2015 resulted from re-estimations of prior year’s ultimate loss and LAE liabilities and are primarily composed of reductions of $18,644 in our retained automobile reserves and $7,964 in our retained homeowner’s reserves. The decreases in prior year reserves in 2014 resulted from re-estimations of prior year’s ultimate loss and LAE liabilities and is primarily composed of reductions of $23,272 in our retained automobile reserves and $8,804 in our retained homeowner reserves. The decrease in prior year reserves during 2013 is primarily composed of reductions of $23,938 in our retained automobile reserves and $4,740 in our retained homeowners reserves. It is not appropriate to extrapolate future favorable or unfavorable development of reserves from this past experience.
Our private passenger automobile line of business prior year reserves decreased by $14,411 for the year ended December 31, 2015, primarily due to improved retained private passenger results of $12,716 for the accident years 2009 through 2013. Our private passenger automobile line of business prior year reserves decreased by $20,815 for the year ended December 31, 2014, primarily due to improved retained private passenger results of $17,789 for accident years 2007 through 2012. Our private passenger automobile line of business reserves decreased by $21,090 for the year ended December 31, 2013, primarily due to improved retained private passenger results of $18,116 for accident years 2007 through 2012. The improved retained private passenger results were primarily due to fewer incurred but not yet reported claims than previously estimated and better than previously estimated severity on the Company’s established bodily injury and property damage case reserves. Our homeowners line of business prior year reserves decreased by $7,255 for the year ended December 31, 2015, primarily due to improved retained homeowner results of $7,354 for the years 2010 through 2013.
13
The following table represents the development of reserves, net of reinsurance, for calendar years 2005 through 2015. The top line of the table shows the reserves at the balance sheet date for each of the indicated years. This represents the estimated amounts of losses and loss adjustment expenses for claims arising in all years that were unpaid at the balance sheet date, including losses that had been incurred but not yet reported to us. The upper portion of the table shows the cumulative amounts paid as of the end of each successive year with respect to those claims. The lower portion of the table shows the re-estimated amount of the previously recorded reserves based on experience as of the end of each succeeding year, including cumulative payments made since the end of the respective year. The estimate changes as more information becomes known about the payments, frequency and severity of claims for individual years. Favorable loss development, shown as a cumulative redundancy in the table, exists when the original reserve estimate is greater than the re-estimated reserves at December 31, 2015.
Information with respect to the cumulative development of gross reserves (that is, without deduction for reinsurance ceded) also appears at the bottom portion of the table.
In evaluating the information in the table, it should be noted that each amount entered incorporates the effects of all changes in amounts entered for prior periods. Thus, if the 2012 estimate for a previously incurred loss was $150 and the loss was reserved at $100 in 2008, the $50 deficiency (later estimate minus original estimate) would be included in the cumulative (redundancy) deficiency in each of the years 2008-2012 shown in the table. It should further be noted that the table does not present accident or policy year development data. In addition, conditions and trends that have affected the development of liability in the past may not necessarily recur in the future. Accordingly, it is not appropriate to extrapolate future redundancies or deficiencies from the table.
|
|
|
As of and for the Year Ended December 31, |
||||||||||||||||||||
|
|
|
2015 |
|
2014 |
|
2013 |
|
2012 |
|
2011 |
|
2010 |
|
2009 |
|
2008 |
|
2007 |
|
2006 |
|
2005 |
|
Reserves for losses and |
|
|
|
|
|
|
|
|
|
|
|
|
|
|
|
|
|
|
|
|
|
|
|
LAE originally estimated: |
|
$ 485,716
|
|
$ 420,767
|
|
$ 394,668
|
|
$ 371,657
|
|
$ 352,098
|
|
$ 351,244
|
|
$ 374,832
|
|
$ 391,070
|
|
$ 393,430
|
|
$ 370,980
|
|
$ 370,166
|
|
Cumulative amounts paid as of: |
|
|
|
|
|
|
|
|
|
|
|
|
|
|
|
|
|
|
|
|
|
|
|
One year later |
|
|
|
132,363 |
|
133,288 |
|
124,855 |
|
130,204 |
|
128,854 |
|
130,960 |
|
126,858 |
|
142,259 |
|
122,806 |
|
133,213 |
|
Two years later |
|
|
|
|
|
178,411 |
|
175,822 |
|
181,739 |
|
176,774 |
|
183,061 |
|
189,897 |
|
195,798 |
|
183,457 |
|
187,231 |
|
Three years later |
|
|
|
|
|
|
|
199,741 |
|
211,578 |
|
205,171 |
|
211,182 |
|
217,695 |
|
234,359 |
|
212,331 |
|
221,390 |
|
Four years later |
|
|
|
|
|
|
|
|
|
223,941 |
|
219,310 |
|
224,831 |
|
233,160 |
|
248,560 |
|
233,438 |
|
234,705 |
|
Five years later |
|
|
|
|
|
|
|
|
|
|
|
224,354 |
|
232,177 |
|
239,553 |
|
254,915 |
|
240,275 |
|
244,454 |
|
Six years later |
|
|
|
|
|
|
|
|
|
|
|
|
|
233,853 |
|
241,587 |
|
257,362 |
|
242,298 |
|
247,299 |
|
Seven years later |
|
|
|
|
|
|
|
|
|
|
|
|
|
|
|
241,999 |
|
257,889 |
|
243,120 |
|
247,983 |
|
Eight years later |
|
|
|
|
|
|
|
|
|
|
|
|
|
|
|
|
|
258,173 |
|
243,270 |
|
248,206 |
|
Nine years later |
|
|
|
|
|
|
|
|
|
|
|
|
|
|
|
|
|
|
|
243,505 |
|
248,272 |
|
Ten years later |
|
|
|
|
|
|
|
|
|
|
|
|
|
|
|
|
|
|
|
|
|
248,391 |
|
|
|
|
|
|
|
|
|
|
|
|
|
|
|
|
|
|
|
|
|
|
|
|
|
|
|
As of and for the Year Ended December 31, |
||||||||||||||||||||
|
|
|
2015 |
|
2014 |
|
2013 |
|
2012 |
|
2011 |
|
2010 |
|
2009 |
|
2008 |
|
2007 |
|
2006 |
|
2005 |
|
Reserves re-estimated as of: |
|
|
|
|
|
|
|
|
|
|
|
|
|
|
|
|
|
|
|
|
|
|
|
One year later |
|
|
|
$ 390,454
|
|
$ 357,300
|
|
$ 342,767
|
|
$ 334,788
|
|
$ 314,561
|
|
$ 326,676
|
|
$ 347,004
|
|
$ 357,492
|
|
$ 340,189
|
|
$ 327,419
|
|
Two years later |
|
|
|
|
|
328,182 |
|
308,028 |
|
309,096 |
|
293,480 |
|
294,696 |
|
307,918 |
|
325,317 |
|
311,972 |
|
310,614 |
|
Three years later |
|
|
|
|
|
|
|
283,592 |
|
282,441 |
|
273,332 |
|
279,542 |
|
282,565 |
|
297,224 |
|
287,875 |
|
289,109 |
|
Four years later |
|
|
|
|
|
|
|
|
|
268,759 |
|
254,652 |
|
264,697 |
|
271,693 |
|
281,068 |
|
269,446 |
|
274,840 |
|
Five years later |
|
|
|
|
|
|
|
|
|
|
|
245,869 |
|
252,249 |
|
261,845 |
|
274,179 |
|
258,506 |
|
264,408 |
|
Six years later |
|
|
|
|
|
|
|
|
|
|
|
|
|
247,023 |
|
254,308 |
|
268,596 |
|
253,919 |
|
258,055 |
|
Seven years later |
|
|
|
|
|
|
|
|
|
|
|
|
|
|
|
250,760 |
|
263,797 |
|
251,304 |
|
254,812 |
|
Eight years later |
|
|
|
|
|
|
|
|
|
|
|
|
|
|
|
|
|
261,319 |
|
248,031 |
|
252,818 |
|
Nine years later |
|
|
|
|
|
|
|
|
|
|
|
|
|
|
|
|
|
|
|
246,317 |
|
250,876 |
|
Ten years later |
|
|
|
|
|
|
|
|
|
|
|
|
|
|
|
|
|
|
|
|
|
249,571 |
|
|
|
|
|
|
|
|
|
|
|
|
|
|
|
|
|
|
|
|
|
|
|
|
|
Cumulative |
|
|
|
|
|
|
|
|
|
|
|
|
|
|
|
|
|
|
|
|
|
|
|
(redundancy) deficiency 2015 |
|
|
|
(30,313) |
|
(66,486) |
|
(88,065) |
|
(83,339) |
|
(105,375) |
|
(127,809) |
|
(140,310) |
|
(132,111) |
|
(124,663) |
|
(120,595) |
|
|
|
|
|
|
|
|
|
|
|
|
|
|
|
|
|
|
|
|
|
|
|
|
|
|
|
As of and for the Year Ended December 31, |
||||||||||||||||||||
|
|
|
2015 |
|
2014 |
|
2013 |
|
2012 |
|
2011 |
|
2010 |
|
2009 |
|
2008 |
|
2007 |
|
2006 |
|
2005 |
|
Gross liability-end of year |
|
$ 553,977
|
|
$ 482,012
|
|
$ 455,014
|
|
$ 423,842
|
|
$ 403,872
|
|
$ 404,391
|
|
$ 439,706
|
|
$ 467,559
|
|
$ 477,720
|
|
$ 449,444
|
|
$ 450,716
|
|
Reinsurance recoverables |
|
68,261 |
|
61,245 |
|
60,346 |
|
52,185 |
|
51,774 |
|
53,147 |
|
64,874 |
|
76,489 |
|
84,290 |
|
78,464 |
|
80,550 |
|
Net liability-end of year |
|
485,716 |
|
420,767 |
|
394,668 |
|
371,657 |
|
352,098 |
|
351,244 |
|
374,832 |
|
391,070 |
|
393,430 |
|
370,980 |
|
370,166 |
|
Gross estimated liability-latest |
|
|
|
447,321 |
|
378,967 |
|
326,765 |
|
309,231 |
|
284,591 |
|
290,609 |
|
298,267 |
|
312,961 |
|
295,121 |
|
299,270 |
|
Reinsurance recoverables-latest |
|
|
|
56,867 |
|
50,785 |
|
43,173 |
|
40,472 |
|
38,722 |
|
43,586 |
|
47,507 |
|
51,642 |
|
48,804 |
|
49,699 |
|
Net estimated liability-latest |
|
|
|
390,454 |
|
328,182 |
|
283,592 |
|
268,759 |
|
245,869 |
|
247,023 |
|
250,760 |
|
261,319 |
|
246,317 |
|
249,571 |
As the table shows, our net reserves grew at a faster rate than our gross reserves over the ten-year period. As we have grown, we have been able to retain a greater percentage of our direct business. Additionally, in the past we conducted substantial business as a servicing carrier for other insurers, in which we would service the residual market automobile insurance business assigned to other carriers for a fee. All business generated through this program was ceded to the other carriers. As we reduced the amount of our servicing carrier business, our proportion of reinsurance ceded diminished.
14
The table also shows that we have substantially benefited in the current and prior years from releasing redundant reserves. In the years ended December 31, 2015, 2014, and 2013 we decreased loss reserves related to prior years by $30,313, $37,368 and $28,889, respectively. Reserves and development are discussed further in Item 7—Management's Discussion and Analysis of Financial Condition and Results of Operations, Executive Summary and Overview.
As a result of our focus on core business lines since our founding in 1979, we believe we have no exposure to asbestos or environmental pollution liabilities.
Reinsurance
Reinsurance involves an insurance company transferring (ceding) a portion of its exposure on insurance underwritten by it to another insurer (reinsurer). The reinsurer assumes a portion of the exposure in return for a share of the premium. Reinsurance does not legally discharge an insurance company from its primary liability for the full amount of the policies, but it does make the reinsurer liable to the company for the reinsured portion of any loss realized.
We reinsure with other insurance companies a portion of our potential liability under the policies we have underwritten, thereby protecting us against an unexpectedly large loss or a catastrophic occurrence that could produce large losses, primarily in our homeowners line of business. We are selective in choosing our reinsurers, seeking only those companies that we consider to be financially stable and adequately capitalized. In an effort to minimize exposure to the insolvency of a reinsurer, we continually evaluate and review the financial condition of our reinsurers. Swiss Re, our primary reinsurer, maintains an A.M. Best rating of "A+" (Excellent). Most of our other reinsurers have an A.M. Best rating of “A+” (Excellent) or “A” (Excellent).
We maintain reinsurance coverage to help lessen the effect of losses from catastrophic events, maintaining coverage that during 2015 protected us in the event of a "115-year storm" (that is, a storm of a severity expected to occur once in a 115-year period). We use various software products to measure our exposure to catastrophe losses and the probable maximum loss to us for catastrophe losses such as hurricanes. The models include estimates for our share of the catastrophe losses generated in the residual market for property insurance by the Massachusetts Property Insurance Underwriting Association ("FAIR Plan"). In 2015, we purchased three layers of excess catastrophe reinsurance providing $515,000 of coverage for property losses in excess of $50,000 up to a maximum of $565,000. Our reinsurers’ co-participation is 65.0% of $100,000 for the 1st layer, 80.0% of $280,000 for the 2nd layer, and 80.0% of $135,000 for the 3rd layer.
For 2016, we have increased our reinsurance coverage by buying a 4th layer at the top end of the reinsuance program. We purchased four layers of excess catastrophe reinsurance providing $615,000 of coverage for property losses in excess of $50,000 up to a maximum of $665,000. Our reinsurers’ co-participation is 65.0% of $100,000 for the 1st layer, 80.0% of $280,000 for the 2nd layer, 80.0% of $135,000 for the 3rd layer and 80% of $100,000 for the 4th layer. As a result of the changes to the models, and our revised reinsurance program, our catastrophe reinsurance in 2016 protects us in the event of a “133-year storm” (that is, a storm of a severity expected to occur once in a 133-year period).
We also have casualty excess of loss reinsurance for large casualty losses occurring in our automobile, homeowners, dwelling fire, business owners, and commercial package lines of business in excess of $2,000 up to a maximum of $10,000. We have property excess of loss reinsurance coverage for large property losses, with coverage in excess of $2,000 up to a maximum of $20,000, for our homeowners, business owners, and commercial package policies. In addition, we have liability excess of loss reinsurance for umbrella large losses in excess of $1,000 up to a maximum of $10,000. We also have various reinsurance agreements with Hartford Steam Boiler Inspection and Insurance Company, of which the primary contract is a quota share agreement under which we cede 100% of the premiums and losses for the equipment breakdown coverage under our business owner policies and commercial package policies.
15
In the wake of the September 11, 2001 tragedies, reinsurers began to exclude coverage for claims in connection with any act of terrorism. Our reinsurance program excludes coverage for acts of terrorism, except for fire or collapse losses as a result of terrorism, under homeowners, dwelling fire, private passenger automobile and commercial automobile policies.
The Terrorism Risk Insurance Act of 2002 ("TRIA") was signed into law on November 26, 2002, and expired December 31, 2005. The Terrorism Risk Insurance Extension Act of 2005 was signed into law on December 22, 2005, and expired December 31, 2007. The Terrorism Risk Insurance Extension Act of 2007 ("TRIEA") was signed into law on December 26, 2007 which reauthorized TRIA for seven years, expanded the definition of an "Act of Terrorism" while expanding the private sector role and reducing the federal share of compensation for insured losses under the program. TRIA expired on December 31, 2014, but on January 12, 2015 Congress reauthorized TRIA retroactive to January 1, 2015 with the program now lasting through 2020. The intent of this legislation is to provide federal assistance to the insurance industry for the needs of commercial insurance policyholders with the potential exposure for losses due to acts of terrorism. The TRIEA provides reinsurance for certified acts of terrorism.
In addition to the above mentioned reinsurance programs and as described in more detail above under The Massachusetts Property and Casualty Insurance Market, we are a participant in CAR, a state-established body that runs the residual market reinsurance programs for commercial automobile insurance in Massachusetts under which premiums, expenses, losses and loss adjustment expenses on ceded business are shared by all insurers writing automobile insurance in Massachusetts. We also participate in the FAIR Plan in which premiums, expenses, losses and loss adjustment expenses on homeowners business that cannot be placed in the voluntary market are shared by all insurers writing homeowners insurance in Massachusetts. The FAIR Plan’s exposure to catastrophe losses increased and as a result, the FAIR Plan decided to buy reinsurance to reduce their exposure to catastrophe losses. On July 1, 2015, the FAIR Plan purchased $1,325,000 of catastrophe reinsurance for property losses with retention of $100,000.
For the year ended December 31, 2015, our total expected reinsurance recovery from reinsurers under our catastrophe reinsurance program related to the 2015 snow event as discussed in the Recent Trends and Event section is $67,934. Amounts recoverable from reinsurers are billed to the reinsurer as claims are paid by the Company. At December 31, 2015, the reinsurance recoverable on paid and unpaid loss and loss adjustment expenses related to the 2015 snow event is $39,553.
On December 15, 2015, the Company filed for arbitration with a reinsurer in regards to the reinsurance recoverable resulting from the 2015 winter storm losses that are admissible under our contract. The total amount of recoverable in dispute, which is based on our total incurred loss, is $22,838. No provision for collectability has been recorded in the financial statements as we believe the recoverable is valid and will be recovered.
At December 31, 2015, we also had $70,812 due from CAR comprising of loss and loss adjustment expense reserves, unearned premiums and reinsurance recoverables.
On March 10, 2005, our Board of Directors (the “Board”) adopted a resolution that prohibits Safety from purchasing finite reinsurance (reinsurance that transfers only a relatively finite or limited amount of risk to the reinsurer) without approval by the Board. To date, the Company has never purchased a finite reinsurance contract.
The property and casualty insurance business is highly competitive and many of our competitors have substantially greater financial and other resources than we do. We compete with both large national writers and smaller regional companies. Our competitors include companies which, like us, serve the independent agency market, as well as companies which sell insurance directly to customers. Direct writers may have certain competitive advantages over agency writers, including increased name recognition, loyalty of the customer base to the insurer rather than to an independent agency and potentially, lower cost structures. A material reduction in the amount of business independent agents sell would adversely affect us. Further, we and others compete on the basis of the commissions and other cash and non-cash incentives provided to agents. Although historically, a number of national insurers that are much larger
16
than we are have chosen not to compete in a material way in the Massachusetts private passenger automobile market, if one or more of these companies decided to aggressively enter the market it could have a material adverse effect on us. The Commissioner announced that Managed Competition reforms were, in part, designed to make Massachusetts more appealing to these companies. Since then, new companies have entered the market including Progressive Insurance Company, Peerless and Safeco (subsidiaries of Liberty Mutual), AIG, Vermont Mutual, Preferred Mutual, IDS, Occidental, GEICO, Harleysville, Foremost and Allstate (including their subsidiary Esurance). These companies include some that would be able to sustain significant losses in order to acquire market share, as well as others which use distribution methods that compete with the independent agent channel. There can be no assurance that we will be able to compete effectively against these companies in the future.
Our principal competitors within the Massachusetts private passenger automobile insurance market are Commerce Insurance Company, Liberty Mutual (including Peerless) and Arbella Insurance Group, which held 25.7%, 11.5% and 10.0% market shares based on automobile exposures, respectively, in 2015 according to CAR.
At December 31, 2015, we employed 622 employees. Our employees are not covered by any collective bargaining agreement. Management considers our relationship with our employees to be good.
Investment income is an important source of revenue for us and the return on our investment portfolio has a material effect on our net earnings. Our investment objective is to focus on maximizing total returns while investing conservatively. We maintain a high-quality investment portfolio consistent with our established investment policy. As of December 31, 2015, our portfolio of fixed maturity investments was comprised principally of investment grade corporate fixed maturity securities, U.S. government and agency securities, and asset-backed securities. The portion of our non-investment grade portfolio of fixed maturity investments is primarily comprised of variable rate secured and senior bank loans and high yield bonds. We have no exposure to European sovereign debt.
According to our investment guidelines, no more than 2.0% of our portfolio may be invested in the securities of any one issuer (excluding U.S. government-backed securities). This one issuer must be rated "A" or above by Moody's. In addition, no more than 0.5% of our portfolio may be invested in securities of any one issuer rated "Baa," or the lowest investment grade assigned by Moody's. Of the less than 10.0% of our portfolio invested in senior bank loans and high yield bonds at December 31, 2015, no more than 5.0% may be invested in the securities of any one issuer, no more than 10.0% may be invested in any issuers total outstanding debt issue, and a maximum of 10.0% may be invested in securities unrated or rated "B-" or below by Moody's. We continually monitor the mix of taxable and tax-exempt securities in an attempt to maximize our total after-tax return. Since 1986, we have utilized the services of a third-party investment manager.
17
The following table reflects the composition of our investment portfolio as of December 31, 2015 and 2014.
|
|
|
As of December 31, |
||||||||||
|
|
|
2015 |
|
2014 |
||||||||
|
|
|
Estimated |
|
% of |
|
|
Estimated |
|
% of |
|||
|
|
|
Fair Value |
|
Portfolio |
|
|
Fair Value |
|
Portfolio |
|||
|
U.S. Treasury Securities |
$ |
1,801 |
|
0.2 |
% |
|
$ |
1,506 |
|
0.1 |
% |
|
|
Obligations of states and political subdivisions |
|
397,922 |
|
32.9 |
|
|
|
460,325 |
|
36.6 |
|
|
|
Residential mortgage-backed securities (1) |
|
241,456 |
|
20.0 |
|
|
|
207,683 |
|
16.5 |
|
|
|
Commercial mortgage-backed securities |
|
28,663 |
|
2.4 |
|
|
|
34,438 |
|
2.7 |
|
|
|
Other asset-backed securities |
|
23,931 |
|
2.0 |
|
|
|
10,250 |
|
0.8 |
|
|
|
Corporate and other securities |
|
387,864 |
|
31.9 |
|
|
|
421,249 |
|
33.7 |
|
|
|
|
Subtotal, fixed maturity securities |
|
1,081,637 |
|
89.4 |
|
|
|
1,135,451 |
|
90.4 |
|
|
Equity securities (2) |
|
110,204 |
|
9.1 |
|
|
|
109,153 |
|
8.7 |
|
|
|
Other invested assets |
|
17,602 |
|
1.5 |
|
|
|
11,657 |
|
0.9 |
|
|
|
|
|
$ |
1,209,443 |
|
100.0 |
% |
|
$ |
1,256,261 |
|
100.0 |
% |
|
|
|
|
|
|
|
|
|
|
|
|
|
|
(1) Residential mortgage-backed securities consists primarily of obligations of U.S. Government agencies including collateralized mortgage obligations and mortgage-backed securities guaranteed and/or insured by the following issuers: Government National Mortgage Association (GNMA), Federal Home Loan Mortgage Corporation (FHLMC), Federal National Mortgage Association (FNMA) and the Federal Home Loan Bank (FHLB).
(2) Equity securities include interests in mutual funds held to fund the Company's executive deferred compensation plan.
The principal risks inherent in holding mortgage-backed securities and other pass-through securities are prepayment and extension risks, which affect the timing of when cash flows will be received. When interest rates decline, mortgages underlying mortgage-backed securities tend to be prepaid more rapidly than anticipated, causing early repayments. When interest rates rise, the underlying mortgages tend to be prepaid at a slower rate than anticipated, causing the principal repayments to be extended. Although early prepayments may result in acceleration of income from recognition of any unamortized discount, the proceeds typically are reinvested at a lower current yield, resulting in a net reduction of future investment income. In addition, in the current market environment, such investments can also contain liquidity risks.
The Company invests in bank loans which are primarily investments in senior secured floating rate loans that banks have made to corporations. The loans are generally priced at an interest rate spread over the floating rate feature; this asset class provides protection against rising interest rates. However, this asset class is subject to default risk since these investments are typically below investment grade.
Equity risk is the risk that we will incur economic losses due to adverse changes in equity prices. Our exposure to changes in equity prices results from our holdings of common stock and mutual funds held to fund the executive deferred compensation plan. We continuously evaluate market conditions and we expect in the future to purchase additional equity securities. We principally manage equity price risk through industry and issuer diversification and asset allocation techniques.
The following table reflects our investment results for each year in the three-year period ended December 31, 2015.
|
|
Years Ended December 31, |
||||||||||
|
|
2015 |
|
2014 |
|
2013 |
||||||
|
Average cash and invested securities (at cost) |
$ |
1,213,718 |
|
|
$ |
1,220,033 |
|
|
$ |
1,175,414 |
|
|
Net investment income (1) |
$ |
40,534 |
|
|
$ |
42,303 |
|
|
$ |
43,054 |
|
|
Net effective yield (2) |
|
3.3 |
% |
|
|
3.5 |
% |
|
|
3.7 |
% |
(1) After investment expenses, excluding realized investment gains or losses.
(2) Net investment income for the period divided by average invested securities and cash for the same period.
18
As of December 31, 2015, our portfolio of fixed maturity investments was comprised principally of investment grade corporate fixed maturity securities, U.S. government and agency securities, and asset-backed securities. The portion of our non-investment grade portfolio of fixed maturity investments is primarily comprised of variable rate secured, senior bank loans and high yield bonds. We have no exposure to European sovereign debt.
The composition of our fixed income security portfolio by Moody's rating is presented in the following table.
|
|
|
As of December 31, |
|
||||||||
|
|
|
|
2015 |
|
|
2014 |
|
||||
|
|
|
Estimated |
|
|
|
|
Estimated |
|
|
|
|
|
|
|
Fair Value |
|
Percent |
|
|
Fair Value |
|
Percent |
|
|
|
U.S. Treasury securities and obligations of U.S. Government agencies |
|
$ |
243,562 |
|
22.5% |
|
$ |
210,020 |
|
18.5% |
|
|
Aaa/Aa |
|
|
391,839 |
|
36.2% |
|
|
463,871 |
|
40.9% |
|
|
A |
|
|
219,580 |
|
20.3% |
|
|
219,319 |
|
19.3% |
|
|
Baa |
|
|
110,386 |
|
10.2% |
|
|
108,149 |
|
9.5% |
|
|
Ba |
|
|
39,835 |
|
3.7% |
|
|
42,784 |
|
3.8% |
|
|
B |
|
|
61,189 |
|
5.7% |
|
|
64,773 |
|
5.7% |
|
|
Caa |
|
|
10,252 |
|
1.0% |
|
|
8,121 |
|
0.7% |
|
|
C |
|
|
21 |
|
0.0% |
|
|
- |
|
0.0% |
|
|
D |
|
|
303 |
|
0.0% |
|
|
- |
|
0.0% |
|
|
Not rated |
|
|
4,670 |
|
0.4% |
|
|
18,414 |
|
1.6% |
|
|
Total |
|
$ |
1,081,637 |
|
100.0% |
|
$ |
1,135,451 |
|
100% |
|
Ratings are generally assigned upon the issuance of the securities and are subject to revision on the basis of ongoing evaluations. Ratings in the table are as of the date indicated.
Moody's rating system utilizes nine symbols to indicate the relative investment quality of a rated bond. “Aaa” rated bonds are judged to be of the best quality and are considered to carry the smallest degree of investment risk. “Aa” rated bonds are also judged to be of high quality by all standards. Together with “Aaa” bonds, these bonds comprise what are generally known as high grade bonds. Bonds rated “A” possess many favorable investment attributes and are considered to be upper medium grade obligations. “Baa” rated bonds are considered as medium grade obligations; they are neither highly protected nor poorly secured. Bonds rated “Ba” or lower (those rated “B”, “Caa”, “C” and “D”) are considered to be too speculative to be of investment quality.
The Securities Valuation Office of the National Association of Insurance Commissioners (the "SVO") evaluates all public and private bonds purchased as investments by insurance companies. The SVO assigns one of six investment categories to each security it reviews. Category 1 is the highest quality rating and Category 6 is the lowest. Categories 1 and 2 are the equivalent of investment grade debt as defined by rating agencies such as Standard & Poor's Ratings Services and Moody's, while Categories 3-6 are the equivalent of below investment grade securities. SVO ratings are reviewed at least annually. At December 31, 2015, 79.4% of our available for sale fixed maturity investments were rated Category 1 and 10.2% were rated Category 2, the two highest ratings assigned by the SVO.
19
The following table indicates the composition of our fixed income security portfolio (at carrying value) by time to maturity as of December 31, 2015.
|
|
|
As of December 31, 2015 |
||||
|
|
|
Estimated |
|
|
||
|
|
|
Fair Value |
|
Percent |
||
|
Due in one year or less |
|
$ |
51,336 |
|
|
4.7% |
|
Due after one year through five years |
|
|
269,405 |
|
|
24.9% |
|
Due after five years through ten years |
|
|
165,061 |
|
|
15.3% |
|
Due after ten years through twenty years |
|
|
297,754 |
|
|
27.5% |
|
Due after twenty years |
|
|
4,029 |
|
|
0.4% |
|
Asset-backed securities (1) |
|
|
294,052 |
|
|
27.2% |
|
Totals |
|
$ |
1,081,637 |
|
|
100.0% |
|
|
|
|
|
|
|
|
(1) Actual maturities of asset-backed securities may differ from contractual maturities because borrowers may have the right to call or prepay obligations with or without call or prepayment penalties. Prepayment rates are influenced by a number of factors that cannot be predicted with certainty, including: the relative sensitivity of the underlying mortgages or other collateral to changes in interest rates; a variety of economic, geographic and other factors; and the repayment priority of the securities in the overall securitization structures.
A.M. Best, which rates insurance companies based on factors of concern to policyholders, currently assigns Safety Insurance an "A (Excellent)" rating. Our "A" rating was reaffirmed by A.M. Best on April 13, 2015. Such rating is the third highest rating of 13 ratings that A.M. Best assigns to solvent insurance companies, which currently range from "A++ (Superior)" to "D (Very Vulnerable)." Publications of A.M. Best indicate that the "A" rating is assigned to those companies that in A.M. Best's opinion have a strong ability to meet their obligations to policyholders over a long period of time. In evaluating a company's financial and operating performance, A.M. Best reviews the Company's profitability, leverage and liquidity, as well as its book of business, the adequacy and soundness of its reinsurance, the quality and estimated fair value of its assets, the adequacy of its loss reserves, the adequacy of its surplus, its capital structure, the experience and competence of its management and its market presence. A.M. Best's ratings reflect its opinion of an insurance company's financial strength, operating performance and ability to meet its obligations to policyholders and are not evaluations directed to purchasers of an insurance company's securities.
In assigning Safety Insurance's rating, A.M. Best recognized its solid risk-adjusted capitalization, conservative operating strategy, and long-standing agency relationships. A.M. Best also noted among our positive attributes our favorable investment leverage, our disciplined underwriting approach, and our expertise in the closely managed Massachusetts automobile insurance market, where rates, until recently, were historically established by the Commissioner. A.M. Best cited other factors that partially offset these positive attributes, including our concentration of business in the Massachusetts private passenger automobile market which exposes our business to regulatory actions.
Supervision and Regulation
Introduction. Our principal operations are conducted through the Insurance Subsidiaries which are subject to comprehensive regulation by the Division of Insurance, of which the Commissioner is the senior official. The Commissioner is appointed by the Governor. We are subject to the authority of the Commissioner in many areas of our business under Massachusetts law, including:
|
· |
our licenses to transact insurance; |
|
· |
the premium rates and policy forms we may use; |
|
· |
our financial condition including the adequacy of our reserves and provisions for unearned premium; |
|
· |
the solvency standards that we must maintain; |
20
|
· |
the type and size of investments we may make; |
|
· |
the prescribed or permitted statutory accounting practices we must use; and |
|
· |
the nature of the transactions we may engage in with our affiliates. |
In addition, the Commissioner periodically conducts a financial examination of all licensees domiciled in Massachusetts. We were most recently examined for the five-year period ending December 31, 2013. The Division had no material findings as a result of this examination.
Insurance Holding Company Regulation. Our principal operating subsidiaries are insurance companies, and therefore we are subject to certain laws in Massachusetts regulating insurance holding company systems. These laws require that we file a registration statement with the Commissioner that discloses the identity, financial condition, capital structure and ownership of each entity within our corporate structure and any transactions among the members of our holding company system. In some instances, we must provide prior notice to the Commissioner for material transactions between our insurance company subsidiaries and other affiliates in our holding company system. These holding company statutes also require, among other things, prior approval of the payment of extraordinary dividends or distributions and any acquisition of a domestic insurer and that we file an annual Enterprise Risk Management report with the Commissioner.
Insurance Regulation Concerning Dividends. We rely on dividends from the Insurance Subsidiaries for our cash requirements. The insurance holding company law of Massachusetts requires notice to the Commissioner of any dividend to the shareholders of an insurance company. The Insurance Subsidiaries may not make an "extraordinary dividend" until thirty days after the Commissioner has received notice of the intended dividend and has not objected in such time. As historically administered by the Commissioner, this provision requires the prior approval by the Commissioner of an extraordinary dividend. An extraordinary dividend is defined as any dividend or distribution that, together with other distributions made within the preceding twelve months exceeds the greater of 10.0% of the insurer's surplus as of the preceding December 31, or the insurer's net income for the twelve-month period ending the preceding December 31, in each case determined in accordance with statutory accounting practices. Under Massachusetts law, an insurer may pay cash dividends only from its unassigned funds, also known as its earned surplus, and the insurer's remaining surplus must be both reasonable in relation to its outstanding liabilities and adequate to its financial needs. At December 31, 2015, the statutory surplus of Safety Insurance was $571,038 and its net loss for 2015 was $12,209. A maximum of $57,104 will be available during 2016 for such dividends without prior approval of the Commissioner.
Acquisition of Control of a Massachusetts Domiciled Insurance Company. Massachusetts law requires advance approval by the Commissioner of any change in control of an insurance company that is domiciled in Massachusetts. That law presumes that control exists where any person, directly or indirectly, owns, controls, holds the power to vote or holds proxies representing 10.0% or more of our outstanding voting stock. Even persons who do not acquire beneficial ownership of more than 10.0% of the outstanding shares of our common stock may be deemed to have acquired control if the Commissioner determines that control exists in fact. Any purchaser of shares of common stock representing 10.0% or more of the voting power of our capital stock will be presumed to have acquired control of the Insurance Subsidiaries unless, following application by that purchaser the Commissioner determines that the acquisition does not constitute a change of control or is otherwise not subject to regulatory review. These requirements may deter, delay or prevent transactions affecting the control of or the ownership of our common stock, including transactions that could be advantageous to our stockholders.
Protection Against Insurer Insolvency. Massachusetts law requires that insurers licensed to do business in Massachusetts participate in the Massachusetts Insurers Insolvency Fund ("Insolvency Fund"). The Insolvency Fund must pay any claim up to $300 of a policyholder of an insolvent insurer if the claim existed prior to the declaration of insolvency or arose within sixty days after the declaration of insolvency. Members of the Insolvency Fund are assessed the amount the Insolvency Fund deems necessary to pay its obligations and expenses in connection with handling covered claims. Subject to certain exceptions, assessments are made in the proportion that each member's net written premiums for the prior calendar year for all property and casualty lines bore to the corresponding net written premiums for Insolvency Fund members for the same period. As a matter of Massachusetts law, insurance rates and premiums include amounts to recoup any amounts paid by insurers for the costs of the Insolvency Fund. By statute, no insurer in Massachusetts may be assessed in any year an amount greater than two percent of that insurer's direct written premium
21
for the calendar year prior to the assessment. We account for allocations from the Insolvency Fund as underwriting expenses. CAR also assesses its members as a result of insurer insolvencies. Because CAR is not able to recover an insolvent company's share of the net CAR losses from the Insolvency Fund, CAR must increase each of its member's shares of the deficit in order to compensate for the insolvent carrier's inability to pay its deficit assessment. It is anticipated that there will be future assessments from time to time relating to various insolvencies.
The Insurance Regulatory Information System. The Insurance Regulatory Information System ("IRIS") was developed to help state regulators identify companies that may require special financial attention. IRIS consists of a statistical phase and an analytical phase whereby financial examiners review annual statements and financial ratios. The statistical phase consists of 13 key financial ratios based on year-end data that are generated annually from the database of the National Association of Insurance Commissioners ("NAIC"). Each ratio has an established "usual range" of results. These ratios assist state insurance departments in executing their statutory mandate to oversee the financial condition of insurance companies.
A ratio result falling outside the usual range of IRIS ratios is not considered a failing result; rather, unusual values are viewed as part of the regulatory early monitoring system. Furthermore, in some years, it may not be unusual for financially sound companies to have several ratios with results outside the usual ranges. Generally, an insurance company will become subject to regulatory scrutiny if it falls outside the usual ranges of four or more of the ratios. In 2015, 2014, and 2013 all our ratios for all our Insurance Subsidiaries were within the normal range.
Risk-Based Capital Requirements. The NAIC has adopted a formula and model law to implement risk-based capital requirements for most property and casualty insurance companies, which are designed to determine minimum capital requirements and to raise the level of protection that statutory surplus provides for policyholder obligations. The risk-based capital formula for property and casualty insurance companies measures three major areas of risk facing property and casualty insurers:
|
· |
underwriting, which encompasses the risk of adverse loss developments and inadequate pricing; |
|
· |
declines in asset values arising from market and/or credit risk; and |
|
· |
off-balance sheet risk arising from adverse experience from non-controlled assets, guarantees for affiliates or other contingent liabilities and reserve and premium growth. |
Under Massachusetts law, insurers having less total adjusted capital than that required by the risk-based capital calculation will be subject to varying degrees of regulatory action, depending on the level of capital inadequacy.
The risk-based capital law provides for four levels of regulatory action. The extent of regulatory intervention and action increases as the level of total adjusted capital to risk-based capital falls. The first level, the company action level, as defined by the NAIC, requires an insurer to submit a plan of corrective actions to the Commissioner if total adjusted capital falls below 200% of the risk-based capital amount. The regulatory action level, as defined by the NAIC requires an insurer to submit a plan containing corrective actions and requires the Commissioner to perform an examination or other analysis and issue a corrective order if total adjusted capital falls below 150.0% of the risk-based capital amount. The authorized control level, as defined by the NAIC, authorizes the Commissioner to take whatever regulatory actions he or she considers necessary to protect the best interest of the policyholders and creditors of the insurer which may include the actions necessary to cause the insurer to be placed under regulatory control, i.e., rehabilitation or liquidation, if total adjusted capital falls below 100.0% of the risk-based capital amount. The fourth action level is the mandatory control level, as defined by the NAIC, which requires the Commissioner to place the insurer under regulatory control if total adjusted capital falls below 70.0% of the risk-based capital amount.
The formulas have not been designed to differentiate among adequately capitalized companies that operate with higher levels of capital. Therefore, it is inappropriate and ineffective to use the formulas to rate or to rank these companies. At December 31, 2015, our Insurance Subsidiaries had total adjusted capital in excess of amounts requiring company or regulatory action at any prescribed risk-based capital action level.
22
Regulation of Private Passenger Automobile Insurance in Massachusetts. Our principal line of business is Massachusetts private passenger automobile insurance. Automobile insurance in Massachusetts is regulated under what the Commissioner terms "managed competition", which subjects automobile insurance rates to generally stricter standards that apply in many other states. Certain of the historically unique factors, also apply in Massachusetts, including compulsory insurance, affinity group marketing, and the prominence of independent agents.
Market Conduct Regulation. Our sales and rating practices are subject to regulation by both the Commissioner and the Massachusetts Attorney General, pursuant to M.G.L. c. 93A. Among other requirements, the premiums we charge must comply with our filed rating plans, which must satisfy Massachusetts law. The Commissioner has the power to conduct examinations to review our market conduct and the Attorney General can investigate our market conduct through the use of Civil Investigative Demands.
Executive Officers and Directors
On January 4, 2016, the Company announced that David F. Brussard, current President and Chief Executive Officer of Safety Insurance will retire effective March 31, 2016. The Board of Directors appointed George M. Murphy, current Vice President of Marketing, as the new President and CEO, effective April 1, 2016. Mr. Brussard will remain as Non-Executive Chairman of the Board of Directors of Safety Insurance Group, Inc.
On February 23, 2016, Mr. Murphy was appointed to the Company’s Board of Directors and to the Investment Committee of the Board of Directors, effective April 1, 2016. Additionally, John P. Drago, 49, was appointed the Company’s Vice President of Marketing effective April 1, 2016.
The table below sets forth certain information concerning our directors and executive officers as of the date of this annual report.
|
|
|
|
|
Years |
|
|
|
|
|
Employed |
|
Name |
Age (1) |
Position |
|
by Safety |
|
David F. Brussard |
64 |
President, Chief Executive Officer and Chairman of the Board |
|
40 |
|
William J. Begley, Jr. |
61 |
Vice President, Chief Financial Officer and Secretary |
|
30 |
|
James D. Berry |
56 |
Vice President - Underwriting |
|
33 |
|
George M. Murphy |
49 |
Vice President - Marketing |
|
27 |
|
Paul J. Narciso |
52 |
Vice President - Claims |
|
25 |
|
David E. Krupa |
55 |
Vice President - Claims Operations |
|
33 |
|
Stephen A. Varga |
48 |
Vice President - Management Information Systems |
|
23 |
|
Ann M. McKeown |
49 |
Vice President - Insurance Operations |
|
26 |
|
A. Richard Caputo, Jr. |
50 |
Director |
|
- |
|
Frederic H. Lindeberg |
75 |
Director |
|
- |
|
Peter J. Manning |
77 |
Director |
|
- |
|
David K. McKown |
78 |
Director |
|
- |
|
___________________ |
|
|
|
|
|
(1) As of February 25, 2016 |
|
|
|
|
David F. Brussard was appointed Chairman of the Board in March 2004 and President and Chief Executive Officer ("CEO") in June 2001. Mr. Brussard has served as a Director of the Company since October 2001. Since January 1999, Mr. Brussard has been the CEO and President of the Insurance Subsidiaries. Previously, Mr. Brussard served as Executive Vice President of the Insurance Subsidiaries from 1985 to 1999 and as Chief Financial Officer and Treasurer of the Insurance Subsidiaries from 1979 to 1999. Mr. Brussard has been employed by one or more of our subsidiaries for over 40 years. Mr. Brussard is also Chairman of the Governing Committee and a member of the Budget Committee, Executive Committee and Nominating Committee of the Automobile Insurers Bureau of Massachusetts. Mr. Brussard is also on the Board of Trustees of the Insurance Library Association of Boston.
William J. Begley, Jr. was appointed Chief Financial Officer, Vice President and Secretary of the Company on March 4, 2002. Since January 1999, Mr. Begley has been the Chief Financial Officer and Treasurer of the Insurance Subsidiaries. Previously, Mr. Begley served as Assistant Controller of the Insurance Subsidiaries from 1985 to 1987, as Controller from 1987 to 1990 and as Assistant Vice President/Controller from 1990 to 1999. Mr. Begley has been
23
employed by the Insurance Subsidiaries for over 30 years. Mr. Begley also serves on the Audit Committee and Investment Committee of Guaranty Fund Management Services, and is a member of the Board of Directors of the Massachusetts Insurers Insolvency Fund.
James D. Berry, CPCU, was appointed Vice President of Underwriting of the Company in July 2015, and was named as Secretary of the Insurance Subsidiaries at that time. Prior to that, he served as the Vice President of Insurance Operations since October 1, 2005. Mr. Berry has been employed by the Insurance Subsidiaries for over 34 years and has directed the Company's Massachusetts Private Passenger line of business since 2001. Mr. Berry is on the Board of Directors of the Massachusetts Property Insurance Underwriting Association (FAIR Plan). He has served on several committees of Commonwealth Auto Reinsurers (“CAR”) including Market Review and Defaulted Brokers, Mr. Berry has represented Safety on the Computer Sciences Corporation Series II and Exceed advisory councils. He also is a member of the Lexis-Nexis Telematics Leadership Panel.
George M. Murphy, CPCU, was appointed Vice President of Marketing on October 1, 2005. Mr. Murphy was appointed as a member of the Board of directors in February 2016, and will replace Mr. Brussard as President and Chief Executive Officer as of April 1, 2016. Mr. Murphy has been employed by the Insurance Subsidiaries for over 27 years and most recently served as Director of Marketing.
Paul J. Narciso was appointed Vice President of Casualty Claims of the Company on August 5, 2013. Mr. Narciso has held various adjusting and claims management positions with the Company since 1990. Mr. Narciso has 28 years of claim experience having worked at two national carriers prior to joining Safety. He currently serves on the Governing Board of the Massachusetts Insurance Fraud Bureau.
David E. Krupa, CPCU, was appointed Vice President of Property Claims of the Company on March 4, 2002. Mr. Krupa has served as Vice President of Claims of the Insurance Subsidiaries since July 1990 and has been employed by the Insurance Subsidiaries for over 33 years. Mr. Krupa was first employed by the Company in 1982 and held a series of management positions in the Claims Department before being appointed Vice President in 1990. Mr. Krupa has served on the Auto Damage Appraisers Licensing Board of Massachusetts and on several claims committees both at the Automobile Insurers Bureau of Massachusetts and CAR.
Stephen A. Varga was appointed Vice President of Management Information Systems of the Company on August 6, 2014. Mr. Varga has held various information technology positions with the Company since 1992 and most recently served as Senior Director of MIS.
Ann M. McKeown was appointed Vice President of Insurance Operations of the Company on July 1, 2015. Ms. McKeown has been employed by the Insurance Subsidiaries for over 26 years wherein she has held management positions in the Underwriting, Information Technology, and Insurance Operations departments. Ms. McKeown has served on the MAIP Steering and Operations Committees of CAR.
A. Richard Caputo, Jr. has served as a director of the Company since June 2001. Mr. Caputo is Co-CEO and Managing Partner of The Jordan Company, a private investment firm, which he has been associated with since 1990. Mr. Caputo is also a director of various privately held companies.
Frederic H. Lindeberg has served as a director of the Company since August 2004. Mr. Lindeberg has had a consulting practice providing taxation, management and investment counsel since 1991, focusing on finance, real estate, manufacturing and retail industries. Mr. Lindeberg retired in 1991 as Partner-In-Charge of various KPMG tax offices, after 24 years of service where he provided both accounting and tax counsel to various clients. Mr. Lindeberg is an attorney and certified public accountant. Mr. Lindeberg was formerly an adjunct professor at Penn State Graduate School of Business. Mr. Lindeberg is currently a director of TAL International Group, Inc.
Peter J. Manning has served as a director of the Company since September 2003. Mr. Manning retired in 2003, as Vice Chairman Strategic Business Development of FleetBoston Financial, after 32 years with FleetBoston Financial
24
Corporation (formerly BankBoston) where he also held the positions of Comptroller and Executive Vice President and Chief Financial Officer. Mr. Manning started his career with Coopers & Lybrand in 1962 prior to his 1972 employment with BankBoston. He currently is a director of the Blue Hills Bank and the non-profit Campaign for Catholic Schools.
David K. McKown has served as director of the Company since November 2002. Mr. McKown has been a Senior Advisor to Eaton Vance Management since 2000, focusing on business origination in real estate and asset-based loans. Mr. McKown retired in March 2000 having served as a Group Executive with BankBoston since 1993, where he focused on acquisitions and high-yield bank debt financings. Mr. McKown has been in the banking industry for 52 years, worked for BankBoston for over 32 years and had previously been the head of BankBoston's real estate department, corporate finance department, and a managing director of BankBoston's private equity unit. Mr. McKown is currently a director of Global Partners L.P., Newcastle Investment Corp., and various privately held companies.
An investment in our common stock involves a number of risks. Any of the risks described below could result in a significant or material adverse effect on our results of operations or financial condition, and a corresponding decline in the market price of our common stock.
Because we are primarily a private passenger automobile insurance carrier, our business may be adversely affected by conditions in this industry.
Approximately 59.6% of our direct written premiums for the year ended December 31, 2015, were generated from private passenger automobile insurance policies. As a result of our focus on that line of business, negative developments in the economic, competitive or regulatory conditions affecting the private passenger automobile insurance industry could have a material adverse effect on our results of operations and financial condition. In addition, these developments would have a disproportionate effect on us, compared to insurers which conduct operations in multiple business lines.
Because we write insurance principally in Massachusetts, our business may be adversely affected by conditions in Massachusetts, including the impact of additional competitors.
Almost all of our direct written premiums are currently generated in Massachusetts. Our revenues and profitability are therefore subject to prevailing regulatory, economic, demographic, competitive and other conditions in Massachusetts. Changes in any of these conditions could make it more costly or difficult for us to conduct our business. The Massachusetts market has seen an increased level of competition due to prior changes in regulatory conditions. To date, we have not had a significant decrease in our private passenger automobile insurance business. However, further competition and adverse results could include loss of market share, decreased revenue, and/or increased costs.
We have exposure to claims related to severe weather conditions, which may result in an increase in claims frequency and severity.
We are subject to claims arising out of severe weather conditions, such as rainstorms, snowstorms and icestorms, that may have a significant effect on our results of operations and financial condition. The incidence and severity of weather conditions are inherently unpredictable. There is generally an increase in claims frequency and severity under the private passenger automobile insurance we write when severe weather occurs because a higher incidence of vehicular accidents and other insured losses tend to occur as a result of severe weather conditions. In addition, we have exposure to an increase in claims frequency and severity under the homeowners and other property insurance we write because property damage may result from severe weather conditions.
Because some of our insureds live near the Massachusetts coastline, we also have a potential exposure to losses from hurricanes and major coastal storms such as Nor'easters. Although we purchase catastrophe reinsurance to limit
25
our exposure to natural catastrophes, in the event of a major catastrophe resulting in property losses to us in excess of $565,000 our losses would exceed the limits of this reinsurance in addition to losses from our co-participation retention of a portion of the risk up to $565,000.
Climate change may adversely impact our results of operations.
There are concerns that the increase in weather-related catastrophes and other losses incurred by the industry in recent years may be indicative of changing weather patterns. This change in weather patterns could lead to higher overall losses which we may not be able to recover, particularly in light of the current competitive environment, and higher reinsurance costs. Climate change could also have an impact on issuers of securities in which we invest, resulting in realized and unrealized losses in future periods which could have a material adverse impact on our results of operations and/or financial position.
There is uncertainty involved in the availability of reinsurance and the collectability of reinsurance recoverable.
The Company reinsures a portion of its potential losses on the policies it issues to mitigate the volatility of the losses on its financial condition and results of operations. The availability and cost of reinsurance is subject to market conditions, which are outside of the Company’s control. From time to time, market conditions have limited, and in some cases, prevented insurers from obtaining the types and amounts of reinsurance that they consider adequate for their business needs. As a result, the Company may not be able to successfully purchase reinsurance and transfer a portion of the Company’s risk through reinsurance arrangements. In addition, as is customary, the Company initially pays all claims and seeks to recover the reinsured losses from its reinsurers. Although the Company reports as assets the amount of claims paid which the Company expects to recover from reinsurers, no assurance can be given that the Company will be able to collect from its reinsurers. If the amounts actually recoverable under the Company’s reinsurance treaties are ultimately determined to be less than the amount it has reported as recoverable, the Company may incur a loss during the period in which that determination is made.
If we are not able to attract and retain independent agents, it could adversely affect our business.
We market our insurance solely through independent agents. We must compete with other insurance carriers for the business of independent agents. Some of our competitors offer a larger variety of products, lower prices for insurance coverage or higher commissions. While we believe that the commissions and services we provide to our agents are competitive with other insurers, changes in commissions, services or products offered by our competitors could make it harder for us to attract and retain independent agents to sell our insurance products.
Established competitors with greater resources may make it difficult for us to market our products effectively and offer our products at a profit.
The property and casualty insurance business is highly competitive and many of our competitors have substantially greater financial and other resources than we do. We compete with both large national writers and smaller regional companies. Further, our competitors include other companies which, like us, serve the independent agency market, as well as companies which sell insurance directly to customers. Direct writers may have certain competitive advantages over agency writers, including increased name recognition, loyalty of the customer base to the insurer rather than to an independent agency and, potentially, lower cost structures. A material reduction in the amount of business independent agents sell would directly and negatively affect our profitability and our ability to compete with insurers that do not rely solely on the independent agency market to sell their products. Further, our Company and others compete on the basis of the commissions and other cash and non-cash incentives provided to agents. Although a number of national insurers that are much larger than we are do not currently compete in a material way in the Massachusetts personal auto market, if one or more of these companies decided to aggressively enter the market it could reduce our share of the Massachusetts market and thereby have a material adverse effect on us. These companies include some that would be able to sustain significant losses in order to acquire market share, as well as others which use distribution methods that compete with the independent agent channel. Progressive Corporation, GEICO and Allstate, large insurers that market
26
directly to policyholders rather than through agents, along with other carriers have entered the Massachusetts private passenger automobile insurance market.
As a holding company, Safety Insurance Group, Inc. is dependent on the results of operations of the Safety Insurance Company.
Safety Insurance Group, Inc. is a company and a legal entity separate and distinct from Safety Insurance Company, our principal operating subsidiary. As a holding company without significant operations of its own, the principal sources of Safety Insurance Group, Inc.'s funds are dividends and other distributions from Safety Insurance Company. Our rights to participate in any distribution of assets of Safety Insurance Company are subject to prior claims of policyholders, creditors and preferred shareholders, if any, of Safety Insurance Company (except to the extent that our rights, if any, as a creditor are recognized). Consequently, our ability to pay debts, expenses and cash dividends to our shareholders may be limited. The ability of Safety Insurance Company to pay dividends is subject to limits under Massachusetts insurance law. Further, the ability of Safety Insurance Group, Inc. to pay dividends, and our subsidiaries' ability to incur indebtedness or to use the proceeds of equity offerings, will be subject to limits under our revolving credit facility.
We are subject to comprehensive regulation by Massachusetts and our ability to earn profits may be restricted by these regulations.
General Regulation. We are subject to regulation by government agencies in Massachusetts, and we must obtain prior approval for certain corporate actions. We must comply with regulations involving:
|
· |
transactions between an insurance company and any of its affiliates; |
|
· |
the payment of dividends; |
|
· |
the acquisition of an insurance company or of any company controlling an insurance company; |
|
· |
approval or filing of premium rates and policy forms; |
|
· |
solvency standards; |
|
· |
minimum amounts of capital and surplus which must be maintained; |
|
· |
limitations on types and amounts of investments; |
|
· |
restrictions on the size of risks which may be insured by a single company; |
|
· |
limitation of the right to cancel or non-renew policies in some lines; |
|
· |
regulation of the right to withdraw from markets or terminate involvement with agencies; |
|
· |
requirements to participate in residual markets; |
|
· |
licensing of insurers and agents; |
|
· |
deposits of securities for the benefit of policyholders; and |
|
· |
reporting with respect to financial condition. |
In addition, insurance department examiners from Massachusetts perform periodic financial and market conduct examinations of insurance companies. Such regulation is generally intended for the protection of policyholders rather than security holders.
Massachusetts requires that all licensed property and casualty insurers bear a portion of the losses suffered by some insureds as a result of impaired or insolvent insurance companies by participating in the Massachusetts Insurers Insolvency Fund ("Insolvency Fund"). Members of the Insolvency Fund are assessed a proportionate share of the
27
obligations and expenses of the Insolvency Fund in connection with an insolvent insurer. These assessments are made by the Insolvency Fund to cover the cost of paying eligible claims of policyholders of these insolvent insurers, and by CAR, to recover the shares of net CAR losses that would have been assessed to the insolvent companies but for their insolvencies. In addition, Massachusetts has established an underwriting association in order to ensure that property insurance is available for owners of high risk property who are not able to obtain insurance from private insurers. The losses of this underwriting association are shared by all insurers that write property and casualty insurance in Massachusetts. We are assessed from time to time to pay these losses. The effect of these assessments could reduce our profitability in any given period and limit our ability to grow our business.
Because we are unable to predict with certainty changes in the political, economic or regulatory environments in Massachusetts in the future, there can be no assurance that existing insurance-related laws and regulations will not become more restrictive in the future or that new restrictive laws will not be enacted and, therefore, it is not possible to predict the potential effects of these laws and regulations on us.
We may enter new markets and there can be no assurance that our diversification strategy will be effective.
Although we intend to concentrate on our core businesses in Massachusetts, New Hampshire, and, we expect beginning in 2016, Maine, we also may seek to take advantage of prudent opportunities to expand our core businesses into other states where we believe the independent agent distribution channel is strong. As a result of a number of factors, including the difficulties of finding appropriate expansion opportunities and the challenges of operating in an unfamiliar market, we may not be successful in this diversification. Additionally, in order to carry out any such strategy we would need to obtain the appropriate licenses from the insurance regulatory authority of any such state.
Our failure to maintain a commercially acceptable financial strength rating would significantly and negatively affect our ability to implement our business strategy successfully.
A.M. Best has currently assigned Safety Insurance an "A (Excellent)" rating. An "A" rating is A.M. Best's third highest rating, out of 13 possible rating classifications for solvent companies. An "A" rating is assigned to insurers that in A.M. Best's opinion have a strong ability to meet their ongoing obligations to policyholders. Moreover, an "A" rating is assigned to companies that have, on balance, excellent balance sheet strength, operating performance and business profile when compared to the standards established by A.M. Best. A.M. Best bases its ratings on factors that concern policyholders and not upon factors concerning investor protection. Such ratings are subject to change and are not recommendations to buy, sell, or hold securities. An important factor in an insurer's ability to compete effectively is its A.M. Best rating. Our A.M. Best rating is lower than those of some of our competitors. Any future decrease in our rating could affect our competitive position.
Our losses and loss adjustment expenses may exceed our reserves, which could significantly affect our business.
The reserves for losses and loss adjustment expenses that we have established are estimates of amounts needed to pay reported and unreported claims and related expenses based on facts and circumstances known to us as of the time we established the reserves. Reserves are based on historical claims information, industry statistics and other factors. The establishment of appropriate reserves is an inherently uncertain process. If our reserves are inadequate and are strengthened, we would have to treat the amount of such increase as a charge to our earnings in the period that the deficiency is recognized. As a result of these factors, there can be no assurance that our ultimate liability will not materially exceed our reserves and have a negative effect on our results of operations and financial condition.
Due to the inherent uncertainty of estimating reserves, it has been necessary, and may over time continue to be necessary, to revise estimated future liabilities as reflected in our reserves for claims and policy expenses. The historic development of reserves for losses and loss adjustment expenses may not necessarily reflect future trends in the development of these amounts. Accordingly, it is not appropriate to extrapolate redundancies or deficiencies based on historical information.
28
If we lose key personnel, our ability to implement our business strategy could be delayed or hindered.
The loss of key personnel could prevent us from fully implementing our business strategy and could significantly and negatively affect our financial condition and results of operations. As we continue to grow, we will need to recruit and retain additional qualified management personnel, and our ability to do so will depend upon a number of factors, such as our results of operations and prospects and the level of competition then prevailing in the market for qualified personnel.
Market fluctuations and changes in interest rates can have significant and negative effects on our investment portfolio.
Our results of operations depend in part on the performance of our invested assets. As of December 31, 2015, based upon fair value measurement, 89.4% of our investment portfolio was invested in fixed maturity securities, 9.1% in common equity securities and 1.5% in other invested assets. Certain risks are inherent in connection with debt securities including loss upon default and price volatility in reaction to changes in interest rates and general market factors.
We have a significant investment portfolio and adverse capital market conditions, including but not limited to volatility and credit spread changes, will impact the liquidity and value of our investments, potentially resulting in higher realized or unrealized losses. Values of our investments can also be impacted by reductions in price transparency and changes in investor confidence and preferences, potentially resulting in higher realized or unrealized losses. If the carrying value of our investments exceeds the fair value, and the decline in fair value is deemed to be other-than-temporary, we will be required to write down the value of our investments, which could materially harm our results of operations and financial condition.
Developments in the global financial markets may adversely affect our investment portfolio and overall performance. Global financial markets have recently experienced unprecedented and challenging conditions. If conditions further deteriorate, our business could be affected in different ways. Continued turbulence in the U.S. economy and contraction in the credit markets could adversely affect our profitability, demand for our products or our ability to raise rates, and could also result in declines in market value and future impairments of our investment assets.
We may not be able to successfully alleviate risk through reinsurance arrangements which could cause us to reduce our premiums written in certain lines or could result in losses.
In order to reduce risk and to increase our underwriting capacity, we purchase reinsurance. The availability and the cost of reinsurance protection are subject to market conditions, which are outside of our control. As a result, we may not be able to successfully alleviate risk through these arrangements. For example, if reinsurance capacity for homeowner's risks were reduced as a result of terrorist attacks, climate change or other causes, we might seek to reduce the amount of homeowners business we write. In addition, we are subject to credit risk with respect to our reinsurance because the ceding of risk to reinsurers does not relieve us of our liability to our policyholders. A significant reinsurer's insolvency or inability to make payments under the terms of a reinsurance treaty could have a material adverse effect on our results of operations and financial condition.
There are anti-takeover provisions contained in our organizational documents and in laws of the State of Delaware and the Commonwealth of Massachusetts that could impede an attempt to replace or remove our management or prevent the sale of our company, which could diminish the value of our common stock.
Our certificate of incorporation, bylaws and the laws of Delaware contain provisions that may delay, deter or prevent a takeover attempt that shareholders might consider in their best interests. For example, our organizational documents provide for a classified board of directors with staggered terms, prevent shareholders from taking action by written consent, prevent shareholders from calling a special meeting of shareholders, provide for supermajority voting requirements to amend our certificate of incorporation and certain provisions of our bylaws and provide for the filling of vacancies on our board of directors by the vote of a majority of the directors then in office. These provisions will render
29
the removal of the incumbent board of directors or management more difficult. In addition, these provisions may prevent shareholders from receiving the benefit of any premium over the market price of our common stock offered by a bidder in a potential takeover. Even in the absence of a takeover attempt, the existence of these provisions may adversely affect the prevailing market price of our common stock if they are viewed as discouraging takeover attempts in the future.
The Massachusetts insurance law prohibits any person from acquiring control of us, and thus indirect control of the Insurance Subsidiaries., without the prior approval of the Commissioner. That law presumes that control exists where any person, directly or indirectly, owns, controls, holds the power to vote or holds proxies representing 10.0% or more of our outstanding voting stock. Even persons who do not acquire beneficial ownership of more than 10.0% of the outstanding shares of our common stock may be deemed to have acquired such control if the Commissioner determines that such control exists in fact. Therefore, any person seeking to acquire a controlling interest in us would face regulatory obstacles which could delay, deter or prevent an acquisition that shareholders might consider in their best interests.
Section 203 of the General Corporation Law of Delaware, the jurisdiction in which the Company is organized, may affect the ability of an "interested stockholder" to engage in certain business combinations including mergers, consolidations or acquisitions of additional shares, for a period of three years following the time that the stockholder becomes an interested stockholder. An interested stockholder is defined to include persons owning directly or indirectly 15.0% or more of the outstanding voting stock of the corporation.
Future sales of shares of our common stock by our existing shareholders in the public market, or the possibility or perception of such future sales, could adversely affect the market price of our stock.
Investors currently known to be the beneficial owners of greater than 5.0% of our outstanding common stock hold approximately 41.6% of the common stock of Safety Insurance Group, Inc. on a fully diluted basis. No prediction can be made as to the effect, if any, that future sales of shares by our existing shareholders, or the availability of shares for future sale, will have on the prevailing market price of our common stock from time to time. Sales of substantial amounts of our common stock in the public market by our existing shareholders, or the possibility or perception that such sales could occur, could cause the prevailing market prices for our common stock to decrease. If such sales reduce the market price of our common stock, our ability to raise additional capital in the equity markets may be adversely affected.
Our business depends on the uninterrupted operation of our systems and business functions, including our information technology, telecommunications and other business systems. Our business continuity and disaster recovery plans may not sufficiently address all contingencies.
Our business is highly dependent upon our ability to execute, in an efficient and uninterrupted fashion, necessary business functions, such as processing new and renewal business, providing customer service, and processing and paying claims. A shut-down of or inability to access our facility, a power outage, or a failure of one or more of our information technology, telecommunications or other systems could significantly impair our ability to perform such functions on a timely basis. If sustained or repeated, such a business interruption, systems failure or service denial could result in a deterioration in the level of service we provide to our agents and policyholders. We have established a business continuity plan in an effort to ensure the continuation of core business operations in the event that normal business operations could not be performed due to a catastrophic event. While we continue to test and assess our business continuity plan to ensure it meets the needs of our core business operations and addresses multiple business interruption events, there is no assurance that core business operations could be performed upon the occurrence of such an event, which may result in a material adverse effect on our financial position and results of operations.
We outsource certain business and administrative functions to third parties and may do so increasingly in the future. If we fail to develop and implement our outsourcing strategies or our third-party providers fail to perform as anticipated, we may experience operational difficulties, increased costs and a loss of business that may have a material adverse effect on our results of operations or financial condition.
30
Our business could be materially and adversely affected by a security breach or other attack involving our computer systems or the systems of one or more of our agents and vendors.
Our highly automated and networked organization is subject to cyber-terrorism and a variety of other cyber-security threats. These threats come in a variety of forms, such as viruses and malicious software. Such threats can be difficult to prevent or detect, and if experienced, could interrupt or damage our operations, harm our reputation or have a material effect on our operations. Our technology and telecommunications systems are highly integrated and connected with other networks. Cyber-attacks involving these systems could be carried out remotely and from multiple sources and could interrupt, damage or otherwise adversely affect the operations of these critical systems. Cyber-attacks could result in the modification or theft of data, the distribution of false information or the denial of service to users. We obtain, utilize and maintain data concerning individuals and organizations with which we have a business relationship. Threats to data security can emerge from a variety of sources and change in rapid fashion, resulting in the ongoing need to expend resources to secure our data in accordance with customer expectations and statutory and regulatory requirements. We could be subject to liability if confidential customer information is misappropriated from our technology systems. Despite the implementation of security measures, these systems may be vulnerable to physical break-ins, computer viruses, programming errors, attacks by third parties or similar disruptive problems. Any well-publicized compromise of security could deter people from entering into transactions that involve transmitting confidential information to our systems, which could have a material adverse effect on our business and reputation. We rely on services and products provided by many vendors. In the event that one or more of our vendors fails to protect personal information of our customers, claimants or employees, we may incur operational impairments, or could be exposed to litigation, compliance costs or reputational damage. While we have not experienced material cyber-incidents to date, the occurrence and effects of cyber-incidents may remain undetected for an extended period. We maintain cyber-liability insurance coverage to offset certain potential losses, subject to policy limits, such as liability to others, costs of related crisis management, data extortion, applicable forensics and certain regulatory defense costs, fines and penalties.
ITEM 1B. UNRESOLVED STAFF COMMENTS
As of the date of this report, the Company had no unresolved comments from the Commission staff regarding its periodic or current reports under the Exchange Act.
We conduct most of our operations in approximately 104 thousand square feet of leased space at 20 Custom House Street in downtown Boston, Massachusetts. Our lease expires in December 2018.
Our Insurance Subsidiaries are parties to a number of lawsuits arising in the ordinary course of their insurance business. We believe that the ultimate resolution of these lawsuits will not, individually or in the aggregate, have a material adverse effect on our financial condition.
On December 15, 2015, the Company filed for arbitration with a reinsurer in regards to the reinsurance recoverable resulting from the 2015 winter storm losses that are admissible under our contract.
ITEM 4. MINE SAFETY DISCLOSURES
Not Applicable
31
ITEM 5. MARKET FOR THE REGISTRANT'S COMMON EQUITY, RELATED STOCKHOLDER MATTERS AND ISSUER PURCHASES OF EQUITY SECURITIES
As of February 17, 2016, there were 25 holders of record of the Company's common stock, par value $0.01 per share, and we estimate another 9,400 held in "Street Name."
|
2015 |
|
High |
|
|
Low |
|
First quarter |
$ |
65.66 |
|
$ |
57.96 |
|
Second quarter |
$ |
61.32 |
|
$ |
54.99 |
|
Third quarter |
$ |
59.57 |
|
$ |
50.98 |
|
Fourth quarter |
$ |
59.53 |
|
$ |
51.14 |
|
|
|
|
|
|
|
|
2014 |
|
High |
|
|
Low |
|
First quarter |
$ |
56.98 |
|
$ |
53.40 |
|
Second quarter |
$ |
55.68 |
|
$ |
50.25 |
|
Third quarter |
$ |
55.87 |
|
$ |
49.88 |
|
Fourth quarter |
$ |
65.25 |
|
$ |
53.97 |
The closing price of the Company's common stock on February 17, 2016 was $56.80 per share.
During 2015 and 2014, the Company’s Board of Directors declared four quarterly cash dividends to shareholders, which were paid and accrued in the amounts of $41,994 and $39,499, respectively. On February 16, 2016, the Company's Board of Directors declared a quarterly cash dividend of $.70 per share to shareholders of record on March 1, 2016 payable on March 15, 2016. The Company plans to continue to declare and pay quarterly cash dividends in 2016, depending on the Company's financial position and the regularity of its cash flows.
The Company relies on dividends from its Insurance Subsidiaries for a portion of its cash requirements. The payment by the Company of any cash dividends to the holders of common stock therefore depends on the receipt of dividend payments from its Insurance Subsidiaries. The payment of dividends by the Insurance Subsidiaries is subject to limitations imposed by Massachusetts law, as discussed in Item 1—Business, Supervision and Regulation, Insurance Regulation Concerning Dividends, and also in Item 7—Management's Discussion and Analysis of Financial Condition and Results of Operations, Liquidity and Capital Resources.
The information called for by Item 201 (d) of Regulation S-K regarding securities authorized for issuance under equity compensation plans will be contained in the Company's Proxy Statement for its Annual Meeting of Shareholders, to be held on May 18, 2016 in Boston, MA, which the Company intends to file with the U.S. Securities and Exchange Commission within 120 days after December 31, 2015 (the Company's fiscal year end), and such information is incorporated herein by reference.
For information regarding our share repurchase program, refer to Item 8—Financial Statements and Supplementary Data, Note 12, Share Repurchase Program, of this Form 10-K.
COMMON STOCK PERFORMANCE GRAPH
Set forth below is a line graph comparing the dollar change in the cumulative total shareholder return on the Company's Common Stock, for the period beginning on December 31, 2010 and ending on December 31, 2015 with the cumulative total return of the NASDAQ Stock Market Index and a peer group comprised of six selected property & casualty insurance companies over the same period. The peer group consists of Baldwin & Lyons, Inc., Infinity Property & Casualty Corp., Mercury General Corp., State Auto Financial Corp., Selective Insurance Group, Inc., and Donegal
32
Group, Inc. The graph shows the change in value of an initial one hundred dollar investment over the period indicated, assuming re-investment of all dividends.
Comparative Cumulative Total Returns since December 31, 2010 Among
Safety Insurance Group, Inc.,
Property & Casualty Insurance Peer Group and the NASDAQ Stock Market Index
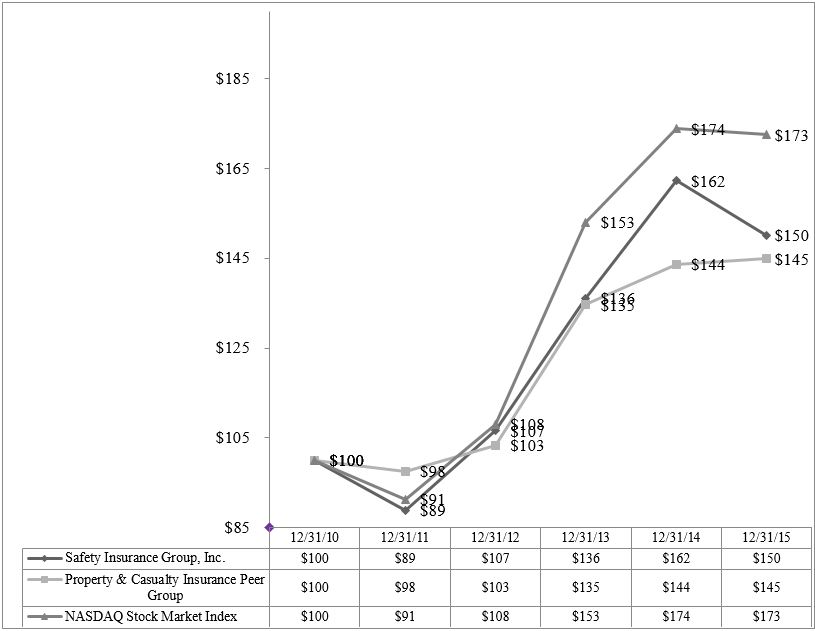
The foregoing performance graph and data shall not be deemed "filed" as part of this Form 10-K for purposes of Section 18 of the Securities Exchange Act of 1934 or otherwise subject to the liabilities of that section and should not be deemed incorporated by reference into any other filing of the Company under the Securities Act of 1933 or the Securities Exchange Act of 1934, except to the extent the Company specifically incorporates it by reference into such filing.
33
ITEM 6. SELECTED FINANCIAL DATA
The following table sets forth our selected historical consolidated financial data as of and for each of the five years ended December 31, 2015, 2014, 2013, 2012 and 2011.
The selected historical consolidated financial data for the years ended December 31, 2015, 2014, and 2013, and as of December 31, 2015 and 2014 have been derived from the financial statements of Safety Insurance Group, Inc. included in this annual report which have been audited. The selected historical consolidated financial data for the years ended December 31, 2012 and 2011 and as of December 31, 2013, 2012, and 2011 has been derived from Safety Insurance Group, Inc.'s consolidated financial statements not included in this annual report, which have been audited.
We have prepared the selected historical consolidated financial data in conformity with U. S. generally accepted accounting principles.
The selected financial data presented below should be read in conjunction with Item 7—Management's Discussion and Analysis of Financial Condition and Results of Operations and the consolidated financial statements and the accompanying notes included in this Form 10-K in order to more fully understand the historical consolidated financial data.
|
|
|
|
Years Ended December 31, |
|
|||||||||||||
|
|
|
|
2015 |
|
2014 |
|
|
2013 |
|
|
2012 |
|
|
2011 |
|
||
|
Direct written premiums |
|
|
$ |
785,730 |
|
$ |
765,685 |
|
$ |
731,680 |
|
$ |
696,220 |
|
$ |
649,262 |
|
|
Net written premiums |
|
|
$ |
746,180 |
|
$ |
734,914 |
|
$ |
697,450 |
|
$ |
663,942 |
|
$ |
620,316 |
|
|
Net earned premiums |
|
|
$ |
738,164 |
|
$ |
716,875 |
|
$ |
681,870 |
|
$ |
642,469 |
|
$ |
598,368 |
|
|
Net investment income |
|
|
|
40,534 |
|
|
42,303 |
|
|
43,054 |
|
|
40,870 |
|
|
39,060 |
|
|
Earnings from partnership investments |
|
|
|
2,387 |
|
|
878 |
|
|
- |
|
|
- |
|
|
- |
|
|
Net realized (losses) gains on investments |
|
|
|
(469) |
|
|
197 |
|
|
1,677 |
|
|
1,975 |
|
|
4,360 |
|
|
Net impairment losses on investments |
|
|
|
(796) |
|
|
— |
|
|
— |
|
|
— |
|
|
— |
|
|
Finance and other service income |
|
|
|
18,133 |
|
|
18,544 |
|
|
18,683 |
|
|
18,553 |
|
|
18,370 |
|
|
Total revenue |
|
|
|
797,953 |
|
|
778,797 |
|
|
745,284 |
|
|
703,867 |
|
|
660,158 |
|
|
Loss and loss adjustment expenses |
|
|
|
612,569 |
|
|
476,366 |
|
|
447,749 |
|
|
422,217 |
|
|
466,640 |
|
|
Underwriting, operating and related expenses |
|
|
|
213,939 |
|
|
219,023 |
|
|
209,758 |
|
|
200,138 |
|
|
179,157 |
|
|
Interest expense |
|
|
|
90 |
|
|
90 |
|
|
89 |
|
|
88 |
|
|
88 |
|
|
Total expenses |
|
|
|
826,598 |
|
|
695,479 |
|
|
657,596 |
|
|
622,443 |
|
|
645,885 |
|
|
(Loss) income before income taxes |
|
|
|
(28,645) |
|
|
83,318 |
|
|
87,688 |
|
|
81,424 |
|
|
14,273 |
|
|
Income tax (credit) expense |
|
|
|
(14,792) |
|
|
23,964 |
|
|
26,337 |
|
|
23,354 |
|
|
571 |
|
|
Net (loss) income |
|
|
$ |
(13,853) |
|
$ |
59,354 |
|
|
61,351 |
|
|
58,070 |
|
|
13,702 |
|
|
(Loss) earnings per weighted average common share: |
|
|
|
|
|
|
|
|
|
|
|
|
|
|
|
|
|
|
Basic |
|
|
$ |
(0.93) |
|
$ |
3.93 |
|
$ |
3.99 |
|
$ |
3.80 |
|
$ |
0.90 |
|
|
Diluted |
|
|
$ |
(0.93) |
|
$ |
3.91 |
|
$ |
3.98 |
|
$ |
3.80 |
|
$ |
0.90 |
|
|
Cash dividends paid per common share |
|
|
$ |
2.80 |
|
$ |
2.60 |
|
$ |
2.40 |
|
$ |
2.20 |
|
$ |
2.00 |
|
|
|
|
|
|
|
|
|
|
|
|
|
|
|
|
|
|
|
|
|
Number of shares used in computing earnings per share: |
|
|
|
|
|
|
|
|
|
|
|
|
|
|
|
|
|
|
Basic |
|
|
|
14,866,607 |
|
|
14,963,047 |
|
|
15,167,052 |
|
|
15,288,346 |
|
|
15,165,065 |
|
|
Diluted |
|
|
|
14,866,607 |
|
|
15,052,745 |
|
|
15,212,385 |
|
|
15,295,452 |
|
|
15,176,006 |
|
|
|
|
|
|
|
|
|
|
|
|
|
|
|
|
|
|
|
|
34
|
|
|
|
|
|
|
|
|
|
|
|
|
|
|
|
|
|
|
|
Years Ended December 31, |
|
||||||||||||
|
|
2015 |
|
2014 |
|
|
2013 |
|
|
2012 |
|
|
2011 |
|
||
|
Balance Sheet Data: |
|
|
|
|
|
|
|
|
|
|
|
|
|
|
|
|
Total cash and investment securities |
$ |
1,256,937 |
|
$ |
1,298,716 |
|
$ |
1,258,453 |
|
$ |
1,223,736 |
|
$ |
1,145,783 |
|
|
Total assets |
|
1,703,869 |
|
|
1,675,719 |
|
|
1,625,457 |
|
|
1,574,346 |
|
|
1,472,494 |
|
|
Losses and loss adjustment expense reserves |
|
553,977 |
|
|
482,012 |
|
|
455,014 |
|
|
423,842 |
|
|
403,872 |
|
|
Total liabilities |
|
1,059,370 |
|
|
967,436 |
|
|
930,270 |
|
|
879,987 |
|
|
816,181 |
|
|
Total shareholders' equity |
|
644,499 |
|
|
708,283 |
|
|
695,187 |
|
|
694,359 |
|
|
656,313 |
|
|
GAAP Ratios: |
|
|
|
|
|
|
|
|
|
|
|
|
|
|
|
|
Loss ratio (1) |
|
83.0 |
% |
|
66.5 |
% |
|
65.7 |
% |
|
65.7 |
% |
|
78.0 |
% |
|
Expense ratio (1) |
|
29.0 |
|
|
30.6 |
|
|
30.8 |
|
|
31.2 |
|
|
29.9 |
|
|
Combined ratio (1) |
|
112.0 |
% |
|
97.1 |
% |
|
96.5 |
% |
|
96.9 |
% |
|
107.9 |
% |
|
|
|
|
|
|
|
|
|
|
|
|
|
|
|
|
|
(1) The loss ratio is the ratio of losses and loss adjustment expenses to net earned premiums. The expense ratio, when calculated on a GAAP basis, is the ratio of underwriting expense to net earned premiums. The combined ratio is the sum of the loss ratio and the expense ratio. Please refer to Insurance Ratios under Item 7—Management's Discussion and Analysis of Financial Condition and Results of Operations for further discussion on our GAAP ratios.
35
ITEM 7. MANAGEMENT’S DISCUSSION AND ANALYSIS OF FINANCIAL CONDITION AND RESULTS OF OPERATIONS
The following discussion should be read in conjunction with our accompanying consolidated financial statements and notes thereto, which appear elsewhere in this document. In this discussion, all dollar amounts are presented in thousands, except share and per share data.
The following discussion contains forward-looking statements. We intend statements which are not historical in nature to be, and are hereby identified as “forward-looking statements” to be covered by the safe harbor provisions of the Private Securities Litigation Reform Act of 1995. In addition, the Company’s senior management may make forward-looking statements orally to analysts, investors, the media and others. This safe harbor requires that we specify important factors that could cause actual results to differ materially from those contained in forward-looking statements made by or on behalf of us. We cannot promise that our expectations in such forward-looking statements will turn out to be correct. Our actual results could be materially different from and worse than our expectations. See “Forward-Looking Statements” below for specific important factors that could cause actual results to differ materially from those contained in forward-looking statements.
Executive Summary and Overview
In this discussion, “Safety” refers to Safety Insurance Group, Inc. and “our Company,” “we,” “us” and “our” refer to Safety Insurance Group, Inc. and its consolidated subsidiaries. Our subsidiaries consist of Safety Insurance Company (“Safety Insurance”), Safety Indemnity Insurance Company (“Safety Indemnity”), Safety Property and Casualty Insurance Company (“Safety P&C”), Whiteshirts Asset Management Corporation (“WAMC”), and Whiteshirts Management Corporation, which is WAMC’s holding company.
We are a leading provider of private passenger automobile insurance in Massachusetts. In addition to private passenger automobile insurance (which represented 59.6% of our direct written premiums in 2015), we offer a portfolio of other insurance products, including commercial automobile (13.8% of 2015 direct written premiums), homeowners (21.7% of 2015 direct written premiums), dwelling fire, umbrella and business owner policies (totaling 4.9% of 2015 direct written premiums). Operating exclusively in Massachusetts and New Hampshire through our insurance company subsidiaries, Safety Insurance, Safety Indemnity, and Safety P&C (together referred to as the “Insurance Subsidiaries”), we have established strong relationships with independent insurance agents, who numbered 924 in 1,102 locations throughout Massachusetts and New Hampshire during 2015. We have used these relationships and our extensive knowledge of the Massachusetts market to become the third largest private passenger automobile and the second largest commercial automobile insurance carrier in Massachusetts, capturing an approximate 10.2% and 14.1% share, respectively, of the Massachusetts private passenger and commercial automobile markets in 2015, according to statistics compiled by Commonwealth Automobile Reinsurers (“CAR”) based on automobile exposures. These statistics total, for each vehicle insured, the number of months during the year insurance for that vehicle is in effect, to arrive at an aggregate number of car-months for each insurer; this aggregate number, divided by 12, equals the insurer’s number of car-years, a measure we refer to in this report as automobile exposures.
The Insurance Subsidiaries began writing private passenger automobile and homeowners insurance in New Hampshire during 2008, personal umbrella business during 2009, and commercial automobile business during 2011. During the years ended December 31, 2015, 2014, and 2013, we wrote $22,731, $18,755, and $13,773 in direct written premiums, respectively, and approximately 24,364, 20,626, and 15,580 policies, respectively, in New Hampshire.
On February 9, 2015, the Insurance Subsidiaries each received a license to begin writing our property and casualty insurance products in the state of Maine. We anticipate that we will begin to write new business in Maine beginning in the first quarter of 2016.
Recent Trends and Events
Losses and loss adjustment expenses incurred for the year ended December 31, 2015 increased by $136,203, or 28.6%, to $612,569 from $476,366 for the comparable 2014. The increase is due to losses related to the highest recorded
36
snowfall totals in Massachusetts history, which produced elevated catsastrophe and non-catstrophe claims activity throughout our personal and commercial property lines. An unprecedented level of snow, specifically 9 feet in various Massachusetts communities and 95 inches in the Boston area alone, was received during a 30 day period in the first quarter of 2015.
We define a “catastrophe” as an event that produces pre-tax losses before reinsurance in excess of $1,000 and involves multiple first-party policyholders, or an event that produces a number of claims in excess of a preset, per-event threshold of average claims in a specific area, occurring within a certain amount of time following the event. Catastrophes are caused by various natural events including high winds, winter storms, tornadoes, hailstorms, and hurricanes. The nature and level of catastrophes in any period cannot be reliably predicted.
Catastrophe losses incurred by the type of event are shown in the following table.
|
|
|
Years Ended December 31, |
|||||||
|
Event |
2015 |
|
2014 |
|
2013 |
||||
|
Windstorms and hailstorms |
$ |
13,569 |
|
$ |
1,969 |
|
$ |
- |
|
|
Tornado and windstorms |
|
- |
|
|
- |
|
|
- |
|
|
Rainstorms |
|
- |
|
|
- |
|
|
- |
|
|
Floods |
|
- |
|
|
- |
|
|
- |
|
|
Icestorms and snowstorms |
|
167,367 |
|
|
6,223 |
|
|
6,161 | |
|
Hurricane and tropical storms |
|
- |
|
|
- |
|
|
- |
|
|
|
Total losses incurred (1) |
$ |
180,936 |
|
$ |
8,192 |
|
$ |
6,161 |
(1) Total losses incurred include losses plus defense and cost containment expenses and excludes adjusting and other claims settlement expenses.
For the year ended December 31, 2015, our total expected reinsurance recovery from reinsurers under our catastrophe program related to the 2015 snow event is $67,934. Amounts recoverable from reinsurers are billed to the reinsurer as claims are paid by the Company. At December 31, 2015, the reinsurance recoverable on paid and unpaid loss and loss adjustment expense related to the 2015 snow event is $39,553. We did not have any recoveries from our primary catastrophe reinsurance treaties during the years ended December 31, 2014 and 2013.
On December 15, 2015, the Company filed for arbitration with a reinsurer in regards to the reinsurance recoverable resulting from the 2015 winter storm losses that are admissible under our contract. The total amount of recoverable in dispute, which is based on our total incurred loss, is $22,838. No provision for collectability has been recorded in the financial statements as we believe the recoverable is valid and will be recovered.
The following rate changes have been filed and approved by the insurance regulators of Massachusetts and New Hampshire in 2015 and 2014. Our Massachusetts private passenger automobile rates include a 13% commission rate for agents.
|
Line of Business |
|
Effective Date |
|
Rate Change |
|
Massachusetts Homeowner |
|
November 1, 2015 |
|
9.1% |
|
New Hampshire Personal Automobile |
|
November 1, 2015 |
|
5.0% |
|
New Hampshire Homeowner |
|
November 1, 2015 |
|
7.9% |
|
New Hampshire Commercial Auto |
|
August 1, 2015 |
|
7.9% |
|
Massachusetts Private Passenger Automobile |
|
June 1, 2015 |
|
3.8% |
|
Massachusetts Commercial Automobile |
|
February 1, 2015 |
|
3.5% |
|
Massachusetts Homeowner |
|
December 1, 2014 |
|
2.4% |
|
New Hampshire Personal Automobile |
|
November 1, 2014 |
|
3.0% |
|
New Hampshire Homeowner |
|
October 1, 2014 |
|
3.3% |
Massachusetts Automobile Insurance Market
We have been subject to extensive regulation in the private passenger automobile insurance industry in Massachusetts, which represented 59.6% of our direct written premiums in 2015. In many respects, the private
37
passenger automobile insurance market in Massachusetts is more heavily regulated, in comparison to other states. Massachusetts regulates private passenger automobile insurance under a system the Commissioner terms “managed completion” in which rates are strictly regulated under a prior approval rate review process, governed by regulations that set certain terms and conditions that insurers must comply with in establishing their rates. In addition, certain of the historically unique factors in Massachusetts exist, including compulsory insurance, affinity group marketing, and the prominence of independent agents.
CAR runs a reinsurance pool for ceded commercial automobile policies through a Limited Servicing Carrier Program ("LSC"). CAR has approved Safety and three other servicing carriers to process ceded this commercial automobile insurance. Subject to the Commissioner's review, CAR sets the premium rates for commercial automobile policies reinsured through CAR and this reinsurance pool can generate an underwriting result that is a profit or deficit based upon CAR's rate level. This underwriting result is allocated among every Massachusetts commercial automobile insurance company, including us, based on a company's commercial automobile voluntary market share.
CAR also runs a reinsurance pool for Taxi, Limousine and Car Service risks (the "Taxi/Limo Program"). CAR approved Safety as one of the two servicing carriers for this program beginning January 1, 2011 for a five-year term expiring December 31, 2016.
Statutory Accounting Principles
Our results are reported in accordance with GAAP, which differ from amounts reported in accordance with statutory accounting principles ("SAP") as prescribed by insurance regulatory authorities, which in general reflect a liquidating, rather than going concern concept of accounting. Specifically, under GAAP:
|
· |
Policy acquisition costs such as commissions, premium taxes and other variable costs incurred which are directly related to the successful acquisition of a new or renewal insurance contract are capitalized and amortized on a pro rata basis over the period in which the related premiums are earned, rather than expensed as incurred, as required by SAP. |
|
· |
Certain assets are included in the consolidated balance sheets whereas, under SAP, such assets are designated as "nonadmitted assets," and charged directly against statutory surplus. These assets consist primarily of premium receivables that are outstanding over ninety days, federal deferred tax assets in excess of statutory limitations, furniture, equipment, leasehold improvements and prepaid expenses. |
|
· |
Amounts related to ceded reinsurance are shown gross of ceded unearned premiums and reinsurance recoverables, rather than netted against unearned premium reserves and loss and loss adjustment expense reserves, respectively, as required by SAP. |
|
· |
Fixed maturities securities, which are classified as available-for-sale, are reported at current fair values, rather than at amortized cost, or the lower of amortized cost or market, depending on the specific type of security, as required by SAP. |
|
· |
The differing treatment of income and expense items results in a corresponding difference in federal income tax expense. Changes in deferred income taxes are reflected as an item of income tax benefit or expense, rather than recorded directly to surplus as regards policyholders, as required by SAP. Admittance testing may result in a charge to unassigned surplus for non-admitted portions of deferred tax assets. Under GAAP reporting, a valuation allowance may be recorded against the deferred tax asset and reflected as an expense. |
Insurance Ratios
The property and casualty insurance industry uses the combined ratio as a measure of underwriting profitability. The combined ratio is the sum of the loss ratio (losses and loss adjustment expenses incurred as a percent of net earned premiums) plus the expense ratio (underwriting and other expenses as a percent of net earned premiums,
38
calculated on a GAAP basis). The combined ratio reflects only underwriting results and does not include income from investments or finance and other service income. Underwriting profitability is subject to significant fluctuations due to competition, catastrophic events, weather, economic and social conditions, and other factors.
Our GAAP insurance ratios are presented in the following table for the periods indicated.
|
|
|
Year Ended December 31, |
|||||
|
|
|
2015 |
|
2014 |
|
2013 |
|
|
GAAP ratios: |
|
|
|
|
|
|
|
|
Loss ratio |
|
83.0 |
% |
66.5 |
% |
65.7 |
% |
|
Expense ratio |
|
29.0 |
|
30.6 |
|
30.8 |
|
|
Combined ratio |
|
112.0 |
% |
97.1 |
% |
96.5 |
% |
|
|
|
|
|
|
|
|
|
Share-Based Compensation
On June 25, 2002, the Board of Directors of the Company (the "Board") adopted the 2002 Management Omnibus Incentive Plan (the "Incentive Plan"). The Incentive Plan provides for a variety of awards, including nonqualified stock options ("NQSOs"), stock appreciation rights and restricted stock ("RS") awards.
On March 10, 2006, the Board approved amendments to the Incentive Plan, subject to shareholder approval, to (i) increase the number of shares of common stock available for issuance by 1,250,000 shares, (ii) remove obsolete provisions, and (iii) make other non-material changes. A total of 1,250,000 shares of common stock had previously been authorized for issuance under the Incentive Plan. The Incentive Plan, as amended, was approved by the shareholders at the 2006 Annual Meeting of Shareholders which was held on May 19, 2006. Under the Incentive Plan, as amended, the maximum number of shares of common stock with respect to which awards may be granted is 2,500,000. As of December 31, 2015, there were 369,755 shares available for future grant. The Board and the Compensation Committee intend to issue more awards under the Incentive Plan in the future. Grants outstanding under the Incentive Plan as of December 31, 2015, were comprised of 211,125 restricted shares and 6,200 nonqualified stock options.
39
Grants made under the Incentive Plan during the years 2011 through 2015 were as follows.
|
Type of |
|
|
|
Number of |
|
|
Fair |
|
|
|
Equity |
|
|
|
Awards |
|
|
Value per |
|
|
|
Awarded |
|
Effective Date |
|
Granted |
|
|
Share |
|
Vesting Terms |
|
RS - Service |
|
March 9, 2011 |
|
68,637 |
|
$ |
47.35 |
(1) |
3 years, 30%-30%-40% |
|
RS |
|
March 9, 2011 |
|
4,000 |
|
$ |
47.35 |
(1) |
No vesting period (3) |
|
RS - Service |
|
March 23, 2011 |
|
22,567 |
|
$ |
44.94 |
(1) |
5 years, 20% annually (5) |
|
RS - Service |
|
March 8, 2012 |
|
77,844 |
|
$ |
41.75 |
(1) |
3 years, 30%-30%-40% |
|
RS |
|
March 8, 2012 |
|
4,000 |
|
$ |
41.75 |
(1) |
No vesting period (3) |
|
RS - Service |
|
March 21, 2012 |
|
20,912 |
|
$ |
41.96 |
(1) |
5 years, 20% annually (5) |
|
RS - Service |
|
March 11, 2013 |
|
28,988 |
|
$ |
46.96 |
(1) |
3 years, 30%-30%-40% |
|
RS |
|
March 11, 2013 |
|
4,000 |
|
$ |
46.96 |
(1) |
No vesting period (3) |
|
RS - Performance |
|
March 11, 2013 |
|
35,429 |
|
$ |
43.90 |
(2) |
3 years, cliff vesting (4) |
|
RS - Service |
|
March 27, 2013 |
|
22,485 |
|
$ |
48.65 |
(1) |
5 years, 20% annually (5) |
|
RS - Service |
|
July 8, 2013 |
|
500 |
|
$ |
51.63 |
(1) |
5 years, 20% annually (5) |
|
RS - Service |
|
August 5, 2013 |
|
1,659 |
|
$ |
54.26 |
(1) |
3 years, 30%-30%-40% |
|
RS - Performance |
|
August 5, 2013 |
|
2,027 |
|
$ |
48.27 |
(2) |
3 years, cliff vesting (4) |
|
RS - Service |
|
March 11, 2014 |
|
24,426 |
|
$ |
54.35 |
(1) |
3 years, 30%-30%-40% |
|
RS |
|
March 11, 2014 |
|
4,000 |
|
$ |
54.35 |
(1) |
No vesting period (3) |
|
RS - Performance |
|
March 11, 2014 |
|
27,928 |
|
$ |
58.09 |
(2) |
3 years, cliff vesting (4) |
|
RS - Service |
|
March 24, 2014 |
|
20,588 |
|
$ |
53.64 |
(1) |
5 years, 20% annually (5) |
|
RS - Service |
|
July 15, 2014 |
|
1,767 |
|
$ |
50.94 |
(1) |
3 years, 30%-30%-40% |
|
RS - Performance |
|
July 15, 2014 |
|
1,975 |
|
$ |
55.70 |
(2) |
3 years, cliff vesting (4) |
|
RS - Service |
|
February 24, 2015 |
|
24,076 |
|
$ |
61.68 |
(1) |
3 years, 30%-30%-40% |
|
RS |
|
February 24, 2015 |
|
4,000 |
|
$ |
61.68 |
(1) |
No vesting period (3) |
|
RS - Performance |
|
February 24, 2015 |
|
35,932 |
|
$ |
63.73 |
(2) |
3 years, cliff vesting (4) |
|
RS - Service |
|
February 24, 2015 |
|
17,321 |
|
$ |
61.68 |
(1) |
5 years, 20% annually (5) |
|
RS - Service |
|
July 1. 2015 |
|
1,546 |
|
$ |
58.21 |
(1) |
3 years, 30%-30%-40% |
|
RS - Performance |
|
July 1. 2015 |
|
1,790 |
|
$ |
61.45 |
(2) |
3 years, cliff vesting (4) |
(1) The fair value per share of the restricted stock grant is equal to the closing price of our common stock on the grant date.
(2) The fair value per share of the restricted stock grant is equal to the performance-based restricted stock award calculation.
(3) Board of Director members must maintain stock ownership equal to at least four times their annual retainer. This requirement must be met within five years of becoming a director.
(4) The shares represent performance-based restricted shares award. Vesting of these shares is dependent upon the attainment of pre-established performance objectives, and any difference between shares granted and shares earned at the end of the performance period will be reported at the conclusion of the performance period.
(5) The shares represent awards granted to non-executive employees and vest ratable over a five-year service period.
Reinsurance
We reinsure with other insurance companies a portion of our potential liability under the policies we have underwritten, thereby protecting us against an unexpectedly large loss or a catastrophic occurrence that could produce large losses, primarily in our homeowners line of business. We use various software products to measure our exposure to catastrophe losses and the probable maximum loss to us for catastrophe losses such as hurricanes. The models include estimates for our share of the catastrophe losses generated in the residual market for property insurance by the Massachusetts Property Insurance Underwriting Association (“FAIR Plan”). The reinsurance market has seen from the various software modelers, increases in the estimate of damage from hurricanes in the southern and northeast portions of the United States due to revised estimations of increased hurricane activity and increases in the estimation of demand surge in the periods following a significant event. We continue to manage and model our exposure and adjust our reinsurance programs as a result of the changes to the models. As of January 1, 2016, we have purchased four layers of excess catastrophe reinsurance providing $615,000 of coverage for property losses in excess of $50,000 up to a maximum of $665,000. Our reinsurers’ co-participation is 65.0% of $100,000 for the 1st layer, 80.0% of $280,000 for the 2nd layer, 80.0% of $135,000 for the 3rd layer and 80.0% of the 4th layer. As a result of the changes to the models, and our revised reinsurance program, our catastrophe reinsurance in 2016 protects us in the event of a “133-year storm”
40
(that is, a storm of a severity expected to occur once in a 133-year period). Swiss Re, our primary reinsurer, maintains an A.M. Best rating of “A” (Excellent). Most of our other reinsurers have an A.M. Best rating of “A+” (Excellent) or “A” (Excellent).
We are a participant in CAR, a state-established body that runs the residual market reinsurance programs for commercial automobile insurance in Massachusetts under which premiums, expenses, losses and loss adjustment expenses on ceded business are shared by all insurers writing automobile insurance in Massachusetts. We also participate in the FAIR Plan in which premiums, expenses, losses and loss adjustment expenses on homeowners business that cannot be placed in the voluntary market are shared by all insurers writing homeowners insurance in Massachusetts. The FAIR Plan buys reinsurance to reduce their exposure to catastrophe losses. On July 1, 2015, the FAIR Plan purchased $1,325,000 of catastrophe reinsurance for property losses with retention of $100,000. At December 31, 2015, our total expected reinsurance recovery from reinsurers under our catastrophe reinsurance program related to the 2015 snow event as discussed in the Recent Trends and Event section is $67,934. Amounts recoverable from reinsurers are billed to the reinsurer as claims are paid by the Company. At December 31, 2015, the reinsurance recoverable on paid and unpaid loss and loss adjustment expense related to the 2015 snow event is $39,553.
On December 15, 2015, the Company filed for arbitration with a reinsurer in regards to the reinsurance recoverable resulting from the 2015 winter storm losses that are admissible under our contract. The total amount of recoverable in dispute, which is based on our total incurred loss, is $22,838. No provision for collectability has been recorded in the financial statements as we believe the recoverable is valid and will be recovered.
We also had $70,812 from CAR comprising of loss and loss adjustment expense reserves, unearned premiums and reinsurance recoverables
Effects of Inflation
We do not believe that inflation has had a material effect on our consolidated results of operations, except insofar as inflation may affect interest rates.
The following table shows certain of our selected financial results.
|
|
|
|
Years Ended December 31, |
|||||||
|
|
|
|
2015 |
|
2014 |
|
|
2013 |
||
|
Direct written premiums |
|
|
$ |
785,730 |
|
$ |
765,685 |
|
$ |
731,680 |
|
Net written premiums |
|
|
$ |
746,180 |
|
$ |
734,914 |
|
$ |
697,540 |
|
Net earned premiums |
|
|
$ |
738,164 |
|
$ |
716,875 |
|
$ |
681,870 |
|
Net investment income |
|
|
|
40,534 |
|
|
42,303 |
|
|
43,054 |
|
Earnings from partnership investments |
|
|
|
2,387 |
|
|
878 |
|
|
— |
|
Net realized (losses) gains on investments |
|
|
|
(469) |
|
|
197 |
|
|
1,677 |
|
Net impairment losses on investments |
|
|
|
(796) |
|
|
— |
|
|
— |
|
Finance and other service income |
|
|
|
18,133 |
|
|
18,544 |
|
|
18,683 |
|
Total revenue |
|
|
|
797,953 |
|
|
778,797 |
|
|
745,284 |
|
Loss and loss adjustment expenses |
|
|
|
612,569 |
|
|
476,366 |
|
|
447,749 |
|
Underwriting, operating and related expenses |
|
|
|
213,939 |
|
|
219,023 |
|
|
209,758 |
|
Interest expense |
|
|
|
90 |
|
|
90 |
|
|
89 |
|
Total expenses |
|
|
|
826,598 |
|
|
695,479 |
|
|
657,596 |
|
(Loss) income before income taxes |
|
|
|
(28,645) |
|
|
83,318 |
|
|
87,688 |
|
Income tax (credit) expense |
|
|
|
(14,792) |
|
|
23,964 |
|
|
26,337 |
|
Net (loss) income |
|
|
$ |
(13,853) |
|
$ |
59,354 |
|
$ |
61,351 |
|
(Loss) earnings per weighted average common share: |
|
|
|
|
|
|
|
|
|
|
|
Basic |
|
|
$ |
(0.93) |
|
$ |
3.93 |
|
$ |
3.99 |
|
Diluted |
|
|
$ |
(0.93) |
|
$ |
3.91 |
|
$ |
3.98 |
|
Cash dividends paid per common share |
|
|
$ |
2.80 |
|
$ |
2.60 |
|
$ |
2.40 |
|
|
|
|
|
|
|
|
|
|
|
|
41
YEAR ENDED DECEMBER 31, 2015 COMPARED TO YEAR ENDED 2014
Direct Written Premiums. Direct written premiums for the year ended December 31, 2015 increased by $20,045, or 2.6%, to $785,730 from $765,685 for the comparable 2014 period. The 2015 increases occurred primarily in our commercial automobile and homeowners business lines which experienced increases of 6.1% and 3.2%, respectively, in average written premium per exposure. Written exposures increased by 5.8% and 2.4% in our commercial automobile and homeowners lines, respectively. The increase in homeowners exposures is primarily the result of our pricing strategy of offering account discounts to policyholders who insure both an automobile and home with us.
Net Written Premiums. Net written premiums for the year ended December 31, 2015 increased by $11,266, or 1.5%, to $746,180 from $734,914 for the comparable 2014 period. The 2015 increase was primarily due to the factors that increased direct written premiums.
Net Earned Premiums. Net earned premiums for the year ended December 31, 2015 increased by $21,289, or 3.0%, to $738,164 from $716,875 for the comparable 2014 period. The 2015 increase was primarily due to the factors that increased direct written premiums.
The effect of reinsurance on net written and net earned premiums is presented in the following table.
|
|
|
|
Year Ended December 31, |
|||
|
|
|
2015 |
|
2014 |
||
|
Written Premiums |
|
|
|
|
|
|
|
Direct |
|
$ |
785,730 |
|
$ |
765,685 |
|
Assumed |
|
|
28,322 |
|
|
25,602 |
|
Ceded |
|
|
(67,872) |
|
|
(56,373) |
|
Net written premiums |
|
$ |
746,180 |
|
$ |
734,914 |
|
|
|
|
|
|
|
|
|
Earned Premiums |
|
|
|
|
|
|
|
Direct |
|
$ |
776,633 |
|
$ |
747,786 |
|
Assumed |
|
|
25,819 |
|
|
23,724 |
|
Ceded |
|
|
(64,288) |
|
|
(54,635) |
|
Net earned premiums |
|
$ |
738,164 |
|
$ |
716,875 |
Net Investment Income. Net investment income for the year ended December 31, 2015 decreased by $1,769, or 4.2%, to $40,534 from $42,303 for the comparable 2014 period. Net effective annual yield on the investment portfolio was 3.3 % for the year ended December 31, 2015 compared to 3.5 % for the year ended December 31, 2014. Our duration was 4.1 years at December 31, 2015, up from 3.8 years at December 31, 2014.
Earnings from Partnership Investments. Earnings from partnership investments was $2,387 for the year ended December 31, 2015 compared to $878 for the year ended in December 31, 2014. Investment activity in this partnership commenced in the fourth quarter of 2014.
Realized (Losses) Gains on Investments. Net realized losses on investments were $469 for the year ended December 31, 2015 compared to net realized gains on investments $197 for the comparable 2014 period.
42
The gross unrealized gains and losses on investments in fixed maturity securities, equity securities, including interests in mutual funds, and other invested assets were as follows:
|
|
|
As of December 31, 2015 |
|||||||||||||
|
|
|
|
|
|
|
|
|
Gross Unrealized Losses (3) |
|
|
|
||||
|
|
|
Cost or |
|
Gross |
|
Non-OTTI |
|
OTTI |
|
Estimated |
|||||
|
|
|
Amortized |
|
Unrealized |
|
Unrealized |
|
Unrealized |
|
Fair |
|||||
|
|
|
Cost |
|
Gains |
|
Losses |
|
Losses (4) |
|
Value |
|||||
|
U.S. Treasury securities |
|
$ |
1,805 |
|
$ |
— |
|
$ |
(4) |
|
$ |
— |
|
$ |
1,801 |
|
Obligations of states and political subdivisions |
|
|
377,188 |
|
|
21,160 |
|
|
(426) |
|
|
— |
|
|
397,922 |
|
Residential mortgage-backed securities (1) |
|
|
237,896 |
|
|
5,188 |
|
|
(1,628) |
|
|
— |
|
|
241,456 |
|
Commercial mortgage-backed securities |
|
|
28,851 |
|
|
30 |
|
|
(218) |
|
|
— |
|
|
28,663 |
|
Other asset-backed securities |
|
|
24,037 |
|
|
39 |
|
|
(145) |
|
|
— |
|
|
23,931 |
|
Corporate and other securities |
|
|
394,194 |
|
|
4,191 |
|
|
(10,521) |
|
|
— |
|
|
387,864 |
|
Subtotal, fixed maturity securities |
|
|
1,063,971 |
|
|
30,608 |
|
|
(12,942) |
|
|
— |
|
|
1,081,637 |
|
Equity securities (2) |
|
|
102,541 |
|
|
13,498 |
|
|
(5,835) |
|
|
— |
|
|
110,204 |
|
Other invested assets (5) |
|
|
17,602 |
|
|
— |
|
|
— |
|
|
— |
|
|
17,602 |
|
Totals |
|
$ |
1,184,114 |
|
$ |
44,106 |
|
$ |
(18,777) |
|
$ |
— |
|
$ |
1,209,443 |
(1) Residential mortgage-backed securities consists of obligations of U.S. Government agencies including collateralized mortgage obligations issued, guaranteed and/or insured by the following issuers: Government National Mortgage Association (GNMA), Federal Home Loan Mortgage Corporation (FHLMC), Federal National Mortgage Association (FNMA) and the Federal Home Loan Bank (FHLB).
(2) Equity securities include interests in mutual funds held to fund the Company’s executive deferred compensation plan.
(3) Our investment portfolio included 514 securities in an unrealized loss position at December 31, 2015.
(4) Amounts in this column represent other-than-temporary impairment (“OTTI”) recognized in accumulated other comprehensive income.
(5) Other invested assets are accounted for under the equity method which is used as a proxy for fair value.
The composition of our fixed income security portfolio by Moody’s rating was as follows:
|
|
|
As of December 31, 2015 |
|||
|
|
|
Estimated |
|
|
|
|
|
|
Fair Value |
|
Percent |
|
|
U.S. Treasury securities and obligations of U.S. Government agencies |
|
$ |
243,562 |
|
22.5% |
|
Aaa/Aa |
|
|
391,839 |
|
36.2% |
|
A |
|
|
219,580 |
|
20.3% |
|
Baa |
|
|
110,386 |
|
10.2% |
|
Ba |
|
|
39,835 |
|
3.7% |
|
B |
|
|
61,189 |
|
5.7% |
|
Caa |
|
|
10,252 |
|
1.0% |
|
C |
|
|
21 |
|
0.0% |
|
D |
|
|
303 |
|
0.0% |
|
Not rated |
|
|
4,670 |
|
0.4% |
|
Total |
|
$ |
1,081,637 |
|
100.0% |
Ratings are generally assigned upon the issuance of the securities and are subject to revision on the basis of ongoing evaluations. Ratings in the table are as of the date indicated.
As of December 31, 2015, our portfolio of fixed maturity investments was principally comprised of investment grade corporate fixed maturity securities, U.S. government and agency securities, and asset-backed securities. The portion of our non-investment grade portfolio of fixed maturity investments is primarily comprised of variable rate secured and senior bank loans and high yield bonds. We have no exposure to European sovereign debt.
43
The following table illustrates the gross unrealized losses included in our investment portfolio and the fair value of those securities, aggregated by investment category. The table also illustrates the length of time that they have been in a continuous unrealized loss position as of December 31, 2015.
|
|
|
As of December 31, 2015 |
||||||||||||||||
|
|
|
Less than 12 Months |
|
12 Months or More |
|
Total |
||||||||||||
|
|
|
Estimated |
|
Unrealized |
|
Estimated |
|
Unrealized |
|
Estimated |
|
Unrealized |
||||||
|
|
|
Fair Value |
|
Losses |
|
Fair Value |
|
Losses |
|
Fair Value |
|
Losses |
||||||
|
U.S. Treasury securities |
|
$ |
1,801 |
|
$ |
4 |
|
$ |
— |
|
$ |
— |
|
$ |
1,801 |
|
$ |
4 |
|
Obligations of states and political subdivisions |
|
|
34,837 |
|
|
342 |
|
|
4,777 |
|
|
84 |
|
|
39,614 |
|
|
426 |
|
Residential mortgage-backed securities |
|
|
85,561 |
|
|
860 |
|
|
32,845 |
|
|
768 |
|
|
118,406 |
|
|
1,628 |
|
Commercial mortgage-backed securities |
|
|
26,113 |
|
|
218 |
|
|
— |
|
|
— |
|
|
26,113 |
|
|
218 |
|
Other asset-backed securities |
|
|
14,454 |
|
|
145 |
|
|
— |
|
|
— |
|
|
14,454 |
|
|
145 |
|
Corporate and other securities |
|
|
173,493 |
|
|
5,528 |
|
|
33,522 |
|
|
4,993 |
|
|
207,015 |
|
|
10,521 |
|
Subtotal, fixed maturity securities |
|
|
336,259 |
|
|
7,097 |
|
|
71,144 |
|
|
5,845 |
|
|
407,403 |
|
|
12,942 |
|
Equity securities |
|
|
19,409 |
|
|
1,739 |
|
|
12,054 |
|
|
4,096 |
|
|
31,463 |
|
|
5,835 |
|
Total temporarily impaired securities |
|
$ |
355,668 |
|
$ |
8,836 |
|
$ |
83,198 |
|
$ |
9,941 |
|
$ |
438,866 |
|
$ |
18,777 |
As of December 31, 2015, we held insured investment securities of approximately $27,399, which represented approximately 2.3% of our total investments. Approximately $20,743 of these securities are pre-refunded, meaning that funds have been set aside in escrow to satisfy the future interest and principal obligations of the bond.
The following table shows our insured investment securities that are backed by financial guarantors including pre-refunded securities as of December 31, 2015. We do not have any direct investment holdings in a financial guarantee insurance company.
|
|
|
As of December 31, 2015 |
|||||||
|
|
|
|
|
|
|
|
Exposure Net |
||
|
|
|
|
|
|
Pre-refunded |
|
of Pre-refunded |
||
|
|
|
Total |
|
Securities |
|
Securities |
|||
|
Municipal bonds |
|
|
|
|
|
|
|
|
|
|
Ambac Assurance Corporation |
|
$ |
- |
|
$ |
- |
|
$ |
- |
|
Financial Guaranty Insurance Company |
|
|
245 |
|
|
245 |
|
|
- |
|
Assured Guaranty Municipal Corporation |
|
|
9,128 |
|
|
9,128 |
|
|
- |
|
National Public Finance Guaranty Corporation |
|
|
18,026 |
|
|
11,370 |
|
|
6,656 |
|
Total |
|
$ |
27,399 |
|
$ |
20,743 |
|
$ |
6,656 |
The Moody's ratings of our insured investments held at December 31, 2015 are essentially the same with or the without the investment guarantees.
We reviewed the unrealized losses in our fixed income and equity portfolio as of December 31, 2015 for potential other-than-temporary asset impairments. The Company held four debt securities at December 31, 2015 with a material (20% or greater) unrealized loss for four or more consecutive quarters that additionally had certain qualitative factors that led to an impairment charge. As a result of our analysis, the Company recognized OTTI of $796 for the year ended December 31, 2015, which consisted entirely of credit losses related to fixed maturity securities.
Specific qualitative analysis was also performed for securities appearing on our “Watch List,” if any. Qualitative analysis considered such factors as the financial condition and the near term prospects of the issuer, whether the debtor is current on its contractually obligated interest and principal payments, changes to the rating of the security by a rating agency and the historical volatility of the fair value of the security.
Of the $18,777 gross unrealized losses as of December 31, 2015, $430 relates to obligations of U.S. Treasuries, states and political subdivisions. The remaining $18,347 of gross unrealized losses relates primarily to holdings of investment grade asset-backed, corporate, other fixed maturity and equity securities.
The majority of unrealized losses recorded on the investment portfolio at December 31, 2015 resulted from fluctuations in market interest rates and other temporary market conditions as opposed to fundamental changes in the credit quality of the issuers of such securities. Given our current level of liquidity, the fact that we do not intend to sell
44
these securities, and that it is more likely than not that we will not be required to sell these securities prior to recovery of the cost basis of these securities, these decreases in values are viewed as being temporary.
For information regarding fair value measurements of our investment portfolio, refer to Item 8—Financial Statements and Supplementary Data, Note 14, Fair Value of Financial Instruments, of this Form 10-K.
Net Impairment Losses on Investments. Net impairment losses on investments were $796 for the year ended December 31, 2015. There were no impairment losses on investments for the year ended December 31, 2014.
Finance and Other Service Income. Finance and other service income include revenues from premium installment charges, which we recognize when earned, and other miscellaneous income and fees. Finance and other service income decreased by $411, or 2.2%, to $18,133 for the year ended December 31, 2015 from $18,544 for the comparable 2014 period.
Losses and Loss Adjustment Expenses. Losses and loss adjustment expenses incurred for the year ended December 31, 2015 increased by $136,203, or 28.6%, to $612,569 from $476,366 for the comparable 2014 period due primarily to winter snowfall catastrophe in 2015.
Our GAAP loss ratio for the year ended December 31, 2015 and 2014 was 83.0% and 66.5%, respectively. Our GAAP loss ratio excluding loss adjustment expenses was 72.9% and 57.8% for the year ended December 31, 2015 and 2014, respectively. Total prior year favorable development included in the pre-tax results for the year ended December 31, 2015 was $30,313, compared to $37,368, for the comparable 2014 period.
Underwriting, Operating and Related Expenses. Underwriting, operating and related expenses for the year ended December 31, 2015 decreased by $5,084, or 2.3%, to $213,939 from $219,023 for the comparable 2014 period, primarily due to a decrease in commissions expensed to agents. Our GAAP expense ratio for the year ended December 31, 2015 decreased to 29.0% from 30.6% for the comparable 2014 period. The decrease in underwriting, operating and related expenses and the expense ratio is attributable to decreases in contingent commissions and bonus compensation.
Interest Expenses. Interest expense was $90 for each of the years ended December 31, 2015 and 2014. The credit facility commitment fee included in interest expense was $75 for each of the years ended December 31, 2015 and 2014.
Income Tax (Credit) Expense. Our effective tax rates were 51.6% and 28.8% for the years ended December 31, 2015 and 2014, respectively. The effective rate in 2015 is the result of the net loss of the Company, which is increased by the adjustments for tax-exempt interest income. The effective rate in 2014 was lower than the statutory rate of 35.0% primarily due to adjustments for tax-exempt investment income.
Net (Loss) Income. Net loss for the year ended December 31, 2015 was $13,853 compared to net income of $59,354 for the comparable 2014 period.
YEAR ENDED DECEMBER 31, 2014 COMPARED TO YEAR ENDED 2013
Direct Written Premiums. Direct written premiums for the year ended December 31, 2014 increased by $34,005, or 4.6%, to $765,685 from $731,680 for the comparable 2013 period. The 2014 increases occurred primarily in our homeowners, commercial automobile and personal automobile business lines which experienced increases of 3.6%, 5.8%, and 0.5%, respectively, in average written premium per exposure. Written exposures increased by 0.9% in our personal automobile line and increased by 5.7% and 7.5% in our commercial automobile and homeowners lines, respectively. The increase in homeowners exposures is primarily the result of our pricing strategy of offering account discounts to policyholders who insure both an automobile and home with us.
45
Net Written Premiums. Net written premiums for the year ended December 31, 2014 increased by $37,374, or 5.4%, to $734,914 from $697,540 for 2013. The 2014 increase was primarily due to the factors that increased direct written premiums.
Net Earned Premiums. Net earned premiums for the year ended December 31, 2014 increased by $35,005, or 5.1%, to $716,875 from $681,870 for the comparable 2013 period. The 2014 increase was primarily due to the factors that increased direct written premiums.
The effect of reinsurance on net written and net earned premiums is presented in the following table.
|
|
|
Years Ended December 31, |
|||||
|
|
|
2014 |
|
2013 |
|
||
|
Written Premiums |
|
|
|
|
|
|
|
|
Direct |
|
$ |
765,685 |
|
$ |
731,680 |
|
|
Assumed |
|
|
25,602 |
|
|
20,593 |
|
|
Ceded |
|
|
(56,373) |
|
|
(54,733) |
|
|
Net written premiums |
|
$ |
734,914 |
|
$ |
697,540 |
|
|
|
|
|
|
|
|
|
|
|
Earned Premiums |
|
|
|
|
|
|
|
|
Direct |
|
$ |
747,786 |
|
$ |
715,657 |
|
|
Assumed |
|
|
23,724 |
|
|
19,251 |
|
|
Ceded |
|
|
(54,635) |
|
|
(53,038) |
|
|
Net earned premiums |
|
$ |
716,875 |
|
$ |
681,870 |
|
Net Investment Income. Net investment income for the year ended December 31, 2014 decreased by $751, or 1.7%, to $42,303 from $43,054 for the comparable 2013 period. Net effective annual yield on the investment portfolio was 3.5% for the year ended December 31, 2014 compared to 3.7% for the year ended December 31, 2013. Our duration was 3.8 years at December 31, 2014 down from 4.0 years at December 31, 2013.
Earnings from Partnership Investments. Earnings from partnership investments were $878 in 2014. Investment activity in this partnership commenced in 2014.
Net Realized Gains on Investments. Net realized gains on investments were $197 for the year ended December 31, 2014 compared to $1,677 for the comparable 2013 period.
The gross unrealized gains and losses on investments in fixed maturity securities, equity securities, including interests in mutual funds, and other invested assets were as follows:
|
|
|
As of December 31, 2014 |
|||||||||||||
|
|
|
|
|
|
|
|
|
Gross Unrealized Losses (3) |
|
|
|
||||
|
|
|
Cost or |
|
Gross |
|
Non-OTTI |
|
OTTI |
|
Estimated |
|||||
|
|
|
Amortized |
|
Unrealized |
|
Unrealized |
|
Unrealized |
|
Fair |
|||||
|
|
|
Cost |
|
Gains |
|
Losses |
|
Losses (4) |
|
Value |
|||||
|
U.S. Treasury securities |
|
$ |
1,507 |
|
$ |
— |
|
$ |
(1) |
|
$ |
— |
|
$ |
1,506 |
|
Obligations of states and political subdivisions |
|
|
437,299 |
|
|
23,562 |
|
|
(536) |
|
|
— |
|
|
460,325 |
|
Residential mortgage-backed securities (1) |
|
|
201,950 |
|
|
7,015 |
|
|
(1,282) |
|
|
— |
|
|
207,683 |
|
Commercial mortgage-backed securities |
|
|
34,216 |
|
|
256 |
|
|
(34) |
|
|
— |
|
|
34,438 |
|
Other asset-backed securities |
|
|
10,204 |
|
|
48 |
|
|
(2) |
|
|
— |
|
|
10,250 |
|
Corporate and other securities |
|
|
417,341 |
|
|
7,536 |
|
|
(3,628) |
|
|
— |
|
|
421,249 |
|
Subtotal, fixed maturity securities |
|
|
1,102,517 |
|
|
38,417 |
|
|
(5,483) |
|
|
— |
|
|
1,135,451 |
|
Equity securities (2) |
|
|
97,910 |
|
|
13,332 |
|
|
(2,089) |
|
|
— |
|
|
109,153 |
|
Other invested assets (5) |
|
|
11,657 |
|
|
— |
|
|
— |
|
|
— |
|
|
11,657 |
|
Totals |
|
$ |
1,212,084 |
|
$ |
51,749 |
|
$ |
(7,572) |
|
$ |
— |
|
$ |
1,256,261 |
(1) Residential mortgage-backed securities consists of obligations of U.S. Government agencies including collateralized mortgage obligations issued, guaranteed and/or insured by the following issuers: Government National Mortgage Association (GNMA), Federal Home Loan Mortgage Corporation (FHLMC), Federal National Mortgage Association (FNMA) and the Federal Home Loan Bank (FHLB).
(2) Equity securities include interests in mutual funds held to fund the Company’s executive deferred compensation plan.
46
(3) Our investment portfolio included 366 securities in an unrealized loss position at December 31, 2014.
(4) Amounts in this column represent other-than-temporary impairment (“OTTI”) recognized in accumulated other comprehensive income.
(5) Other invested assets are accounted for under the equity method which is used as a proxy for fair value.
The composition of our fixed income security portfolio by Moody’s rating was as follows:
|
|
|
As of December 31, 2014 |
|||
|
|
|
Estimated |
|
|
|
|
|
|
Fair Value |
|
Percent |
|
|
U.S. Treasury securities and obligations of U.S. Government agencies |
|
$ |
210,020 |
|
18.5% |
|
Aaa/Aa |
|
|
463,871 |
|
40.9% |
|
A |
|
|
219,319 |
|
19.3% |
|
Baa |
|
|
108,149 |
|
9.5% |
|
Ba |
|
|
42,784 |
|
3.8% |
|
B |
|
|
64,773 |
|
5.7% |
|
Caa |
|
|
8,121 |
|
0.7% |
|
Not rated |
|
|
18,414 |
|
1.6% |
|
Total |
|
$ |
1,135,451 |
|
100.0% |
As of December 31, 2014, our portfolio of fixed maturity investments was principally comprised of investment grade corporate fixed maturity securities, U.S. government and agency securities, and asset-backed securities. The portion of our non-investment grade portfolio of fixed maturity investments is primarily comprised of variable rate secured and senior bank loans and high yield bonds. We have no exposure to European sovereign debt.
The following table illustrates the gross unrealized losses included in our investment portfolio and the fair value of those securities, aggregated by investment category. The table also illustrates the length of time that they have been in a continuous unrealized loss position as of December 31, 2014.
|
|
|
As of December 31, 2014 |
||||||||||||||||
|
|
|
Less than 12 Months |
|
12 Months or More |
|
Total |
||||||||||||
|
|
|
Estimated |
|
Unrealized |
|
Estimated |
|
Unrealized |
|
Estimated |
|
Unrealized |
||||||
|
|
|
Fair Value |
|
Losses |
|
Fair Value |
|
Losses |
|
Fair Value |
|
Losses |
||||||
|
U.S. Treasury securities |
|
$ |
— |
|
$ |
— |
|
$ |
1,506 |
|
$ |
1 |
|
$ |
1,506 |
|
$ |
1 |
|
Obligations of states and political subdivisions |
|
|
65,174 |
|
|
489 |
|
|
3,553 |
|
|
47 |
|
|
68,727 |
|
|
536 |
|
Residential mortgage-backed securities |
|
|
18,853 |
|
|
44 |
|
|
47,769 |
|
|
1,238 |
|
|
66,622 |
|
|
1,282 |
|
Commercial mortgage-backed securities |
|
|
10,485 |
|
|
34 |
|
|
— |
|
|
— |
|
|
10,485 |
|
|
34 |
|
Other asset-backed securities |
|
|
1,999 |
|
|
2 |
|
|
— |
|
|
— |
|
|
1,999 |
|
|
2 |
|
Corporate and other securities |
|
|
119,722 |
|
|
3,079 |
|
|
37,469 |
|
|
549 |
|
|
157,191 |
|
|
3,628 |
|
Subtotal, fixed maturity securities |
|
|
216,233 |
|
|
3,648 |
|
|
90,297 |
|
|
1,835 |
|
|
306,530 |
|
|
5,483 |
|
Equity securities |
|
|
16,119 |
|
|
1,986 |
|
|
1,277 |
|
|
103 |
|
|
17,396 |
|
|
2,089 |
|
Total temporarily impaired securities |
|
$ |
232,352 |
|
$ |
5,634 |
|
$ |
91,574 |
|
$ |
1,938 |
|
$ |
323,926 |
|
$ |
7,572 |
|
|
|
|
|
|
|
|
|
|
|
|
|
|
|
|
|
|
|
|
As of December 31, 2014, we held insured investment securities of approximately $79,149, which represented approximately 6.3% of our total investments. Approximately $52,433 of these securities are pre-refunded, meaning that funds have been set aside in escrow to satisfy the future interest and principal obligations of the bond.
47
The following table shows our insured investment securities that are backed by financial guarantors including pre-refunded securities as of December 31, 2014. We do not have any direct investment holdings in a financial guarantee insurance company.
|
|
|
As of December 31, 2014 |
|||||||
|
|
|
|
|
|
|
|
Exposure Net |
||
|
|
|
|
|
|
Pre-refunded |
|
of Pre-refunded |
||
|
|
|
Total |
|
Securities |
|
Securities |
|||
|
Municipal bonds |
|
|
|
|
|
|
|
|
|
|
Ambac Assurance Corporation |
|
$ |
7,476 |
|
$ |
7,476 |
|
$ |
- |
|
Financial Guaranty Insurance Company |
|
|
255 |
|
|
255 |
|
|
- |
|
Assured Guaranty Municipal Corporation |
|
|
30,678 |
|
|
20,232 |
|
|
10,446 |
|
National Public Finance Guaranty Corporation |
|
|
40,740 |
|
|
24,470 |
|
|
16,270 |
|
Total |
|
$ |
79,149 |
|
$ |
52,433 |
|
$ |
26,716 |
|
|
|
|
|
|
|
|
|
|
|
The Moody's ratings of our insured investments held at December 31, 2014 are essentially the same with or without the investment guarantees.
We reviewed the unrealized losses in our fixed income and equity portfolio as of December 31, 2014 for potential other-than-temporary asset impairments. We held no securities at December 31, 2014 with a material (20.0% or greater) unrealized loss for four or more consecutive quarters. Specific qualitative analysis was performed for securities appearing on our “Watch List,” if any. Qualitative analysis considered such factors as the financial condition and the near term prospects of the issuer, whether the debtor is current on its contractually obligated interest and principal payments, changes to the rating of the security by a rating agency and the historical volatility of the fair value of the security.
Of the $7,572 gross unrealized losses as of December 31, 2014, $537 relates to obligations of U.S. Treasuries, states and political subdivisions. The remaining $7,035 of gross unrealized losses relates primarily to holdings of investment grade asset-backed, corporate, other fixed maturity and equity securities.
The unrealized losses recorded on the investment portfolio at December 31, 2014 resulted from fluctuations in market interest rates and other temporary market conditions as opposed to fundamental changes in the credit quality of the issuers of such securities. Given our current level of liquidity, the fact that we do not intend to sell these securities, and that it is more likely than not that we will not be required to sell these securities prior to recovery of the cost basis of these securities, these decreases in values are viewed as being temporary.
During the years ended December 31, 2014 and 2013, there was no significant deterioration in the credit quality of any of our holdings and no OTTI charges were recorded related to our portfolio of investment securities.
For information regarding fair value measurements of our investment portfolio, refer to Item 8—Financial Statements and Supplementary Data, Note 14, Fair Value of Financial Instruments, of this Form 10-K.
Finance and Other Service Income. Finance and other service income include revenues from premium installment charges, which we recognize when earned, and other miscellaneous income and fees. Finance and other service income decreased by $139, or 0.7%, to $18,544 for the year ended December 31, 2014 from $18,683 for the comparable 2013 period.
Losses and Loss Adjustment Expenses. Losses and loss adjustment expenses incurred for the year ended December 31, 2014 increased by $28,617, or 6.4%, to $476,366 from $447,749 for the comparable 2013 period. Our GAAP loss ratio for the years ended December 31, 2014 and 2013 was 66.5% and 65.7%, respectfully. Our GAAP loss ratio excluding loss adjustment expenses was 57.8% and 56.5% for the years ended December 31, 2014 and 2013, respectfully. Total prior year favorable development included in the pre-tax results for the year ended December 31, 2014 was $37,368, compared to $28,889, for the comparable 2013 period.
48
Underwriting, Operating and Related Expenses. Underwriting, operating and related expenses for the year ended December 31, 2014 increased by $9,265, or 4.4%, to $219,023 from $209,758 for the comparable 2013 period, primarily due to an increase in commissions paid to agents. Our GAAP expense ratios for the year ended December 31, 2014 decreased to 30.6% from 30.8% for the comparable 2013 period.
Interest Expenses. Interest expense was $90 and $89 for the years ended December 31, 2014 and 2013, respectively. The credit facility commitment fee included in interest expense was $75 for each of the years ended December 31, 2014 and 2013.
Income Tax Expense. Our effective tax rates were 28.8% and 30.0% for the years ended December 31, 2014 and 2013, respectively. These effective rates were lower than the statutory rate of 35.0% primarily due to adjustments for tax-exempt investment income.
Net Income. Net income for the year ended December 31, 2014 was $59,354 compared to $61,351 for the comparable 2013 period.
49
Liquidity and Capital Resources
As a holding company, Safety’s assets consist primarily of the stock of our direct and indirect subsidiaries. Our principal source of funds to meet our obligations and pay dividends to shareholders, therefore, is dividends and other permitted payments from our subsidiaries, principally Safety Insurance. Safety is the borrower under our credit facility.
Safety Insurance’s sources of funds primarily include premiums received, investment income and proceeds from sales and redemptions of investments. Safety Insurance’s principal uses of cash are the payment of claims, operating expenses and taxes, the purchase of investments and payment of dividends to Safety.
Net cash provided by operating activities was $22,891, $97,569, and $110,864 during the years ended December 31, 2015, 2014, and 2013, respectively. Our operations typically generate positive cash flows from operations as most premiums are received in advance of the time when claim and benefit payments are required. Cash flows from operations in the year ended 2015 were lower than the years ended 2014 and 2013, respectively, due to the increased claims activity resulting from the 2015 winter. These positive operating cash flows are expected to continue to meet our liquidity requirements.
Net cash provided by for investing activities was $23,845 for the year ended December 31, 2015 as sales, paydowns, calls and maturities of fixed maturities and equity securities exceeded purchases of fixed maturity and equity securities due to the payment of claims resulting from the 2015 winter events. Net cash used by investing activities was $48,522 and $51,298 during the years ended December 31, 2014 and 2013, respectively, as purchases of fixed maturity and equity securities exceeded sales, paydowns, calls and maturities of fixed maturity and equity securities.
Net cash used for financing activities was $41,697, $62,469, and $39,072 during the years ended December 31, 2015, 2014 and 2013, respectively. Net cash used for financing activities is primarily comprised of dividend payments to shareholders and the acquisition of treasury stock.
The Insurance Subsidiaries maintain a high degree of liquidity within their respective investment portfolios in fixed maturity and short-term investments. We do not anticipate the need to sell these securities to meet the Insurance Subsidiaries cash requirements. We expect the Insurance Subsidiaries to generate sufficient operating cash to meet all short-term and long-term cash requirements. However, there can be no assurance that unforeseen business needs or other items will not occur causing us to have to sell securities before their values fully recover; thereby causing us to recognize additional impairment charges in that time period.
Credit Facility
For information regarding our Credit Facility, please refer to Item 8—Financial Statements and Supplementary Data, Note 8, Debt, of this Form 10-K.
Recent Accounting Pronouncements
For information regarding Recent Accounting Pronouncements, please refer to Item 8—Financial Statements and Supplementary Data, Note 2, Summary of Significant Accounting Policies, of this Form 10-K.
Regulatory Matters
Our insurance company’s subsidiaries are subject to various regulatory restrictions that limit the maximum amount of dividends available to be paid to their parent without prior approval of the Commissioner. The Massachusetts statute limits the dividends an insurer may pay in any twelve-month period, without the prior permission of the Commissioner, to the greater of (i) 10% of the insurer’s surplus as of the preceding December 31 or (ii) the insurer’s net income for the twelve-month period ending the preceding December 31, in each case determined in accordance with statutory accounting practices. Our Insurance Subsidiaries may not declare an “extraordinary dividend” (defined as any
50
dividend or distribution that, together with other distributions made within the preceding twelve months, exceeds the limits established by Massachusetts statute) until thirty days after the Commissioner has received notice of the intended dividend and has not objected. As historically administered by the Commissioner, this provision requires the Commissioner’s prior approval of an extraordinary dividend. Under Massachusetts law, an insurer may pay cash dividends only from its unassigned funds, also known as earned surplus, and the insurer’s remaining surplus must be both reasonable in relation to its outstanding liabilities and adequate to its financial needs. At year-end 2015, the statutory surplus of Safety Insurance was $571,038, and its net loss for 2015 was $12,209. As a result, a maximum of $57,104 is available in 2016 for such dividends without prior approval of the Commissioner. Under this Massachusetts statute, the Insurance Subsidiaries has restricted net assets in the amount of $513,934 at December 31, 2015. During the twelve months ended December 31, 2015, Safety Insurance recorded dividends to Safety of $39,440
The maximum dividend permitted by law is not indicative of an insurer’s actual ability to pay dividends, which may be constrained by business and regulatory considerations, such as the impact of dividends on surplus, which could affect an insurer’s ratings or competitive position, the amount of premiums that can be written and the ability to pay future dividends.
Since the initial public offering of its common stock in November 2002, the Company has paid regular quarterly dividends to shareholders of its common stock. Quarterly dividends paid during 2015 and 2014 were as follows:
|
|
|
|
|
|
|
|
|
|
Total |
|
|
Declaration |
|
Record |
|
Payment |
|
Dividend per |
|
Dividends Paid |
||
|
Date |
|
Date |
|
Date |
|
Common Share |
|
and Accrued |
||
|
February 14, 2014 |
|
March 3, 2014 |
|
March 14, 2014 |
|
$ |
0.60 |
|
$ |
9,240 |
|
May 6, 2014 |
|
June 2, 2014 |
|
June 13, 2014 |
|
$ |
0.60 |
|
$ |
9,223 |
|
August 6, 2014 |
|
September 2, 2014 |
|
September 15, 2014 |
|
$ |
0.70 |
|
$ |
10,506 |
|
November 4, 2014 |
|
December 2, 2014 |
|
December 13, 2014 |
|
$ |
0.70 |
|
$ |
10,530 |
|
February 17, 2015 |
|
March 2, 2015 |
|
March 13, 2015 |
|
$ |
0.70 |
|
$ |
10,468 |
|
May 5, 2015 |
|
June 1, 2015 |
|
June 15, 2015 |
|
$ |
0.70 |
|
$ |
10,524 |
|
August 6, 2015 |
|
September 1, 2015 |
|
September 15, 2015 |
|
$ |
0.70 |
|
$ |
10,548 |
|
November 3, 2015 |
|
December 1, 2015 |
|
December 12, 2015 |
|
$ |
0.70 |
|
$ |
10,454 |
On February 16, 2016, our Board approved and declared a quarterly cash dividend on our common stock of $0.70 per share to be paid on March 15, 2016 to shareholders of record on March 1, 2016. We plan to continue to declare and pay quarterly cash dividends in 2016, depending on our financial position and the regularity of our cash flows.
On August 3, 2007, the Board of Directors approved a share repurchase program of up to $30,000 of the Company’s outstanding common shares. As of December 31, 2015, the Board of Directors had cumulatively authorized increases to the existing share repurchase program of up to $150,000 of its outstanding common shares. Under the program, the Company may repurchase shares of its common stock for cash in public or private transactions, in the open market or otherwise. The timing of such repurchases and actual number of shares repurchased will depend on a variety of factors including price, market conditions and applicable regulatory and corporate requirements. The program does not require us to repurchase any specific number of shares and may be modified, suspended or terminated at any time without prior notice. At December 31, 2015 and December 31, 2014, the Company had purchased 2,279,570 shares at a cost of $83,835.
Management believes that the current level of cash flow from operations provides us with sufficient liquidity to meet our operating needs over the next 12 months. We expect to be able to continue to meet our operating needs after the next 12 months from internally generated funds. Since our ability to meet our obligations in the long term (beyond such twelve-month period) is dependent upon such factors as market changes, insurance regulatory changes and economic conditions, no assurance can be given that the available net cash flow will be sufficient to meet our operating needs. We expect that we would need to borrow or issue capital stock if we needed additional funds, for example, to pay for an acquisition or a significant expansion of our operations. There can be no assurance that sufficient funds for any of the foregoing purposes would be available to us at such time.
51
Off-Balance Sheet Arrangements
We have no material obligations under a guarantee contract meeting the characteristics identified in Accounting Standards Codification (“ASC”) 460, Guarantees. We have no material retained or contingent interests in assets transferred to an unconsolidated entity. We have no material obligations, including contingent obligations, under contracts that would be accounted for as derivative instruments. We have no obligations, including contingent obligations, arising out of a variable interest in an unconsolidated entity held by, and material to, us, where such entity provides financing, liquidity, market risk or credit risk support to, or engages in leasing, hedging or research and development services with us. We have no direct investments in real estate and no holdings of mortgages secured by commercial real estate. Accordingly, we have no material off-balance sheet arrangements.
Contractual Obligations
We have obligations to make future payments under contracts and credit-related financial instruments and commitments. At December 31, 2015, certain long-term aggregate contractual obligations and credit-related commitments are summarized as follows:
|
|
|
|
Payments Due by Period |
||||||||||||
|
|
|
|
Within |
|
|
Two to Three |
|
|
Four to Five |
|
|
After |
|
|
|
|
|
|
|
One Year |
|
|
Years |
|
|
Years |
|
|
Five Years |
|
|
Total |
|
Loss and LAE reserves |
$ |
271,449 |
|
$ |
243,750 |
|
$ |
33,239 |
|
$ |
5,540 |
|
$ |
553,977 | |
|
Purchase commitments |
|
519 |
|
|
- |
|
|
- |
|
|
- |
|
|
519 | |
|
Operating leases |
|
4,006 |
|
|
7,861 |
|
|
123 |
|
|
- |
|
|
11,990 | |
|
|
Total contractual obligations |
$ |
275,974 |
|
$ |
251,611 |
|
$ |
33,362 |
|
$ |
5,540 |
|
$ |
566,486 |
As of December 31, 2015, the Company had loss and LAE reserves of $553,977, unpaid reinsurance recoverables of $68,261 and net loss and LAE reserves of $485,716. Our loss and LAE reserves are estimates as described in more detail under Critical Accounting Policies and Estimates. The specific amounts and timing of obligations related to case reserves, IBNR reserves and related LAE reserves are not set contractually, and the amounts and timing of these obligations are unknown. Nonetheless, based upon our cumulative claims paid over the last ten years, the Company estimates that its loss and LAE reserves will be paid in the period shown above. While management believes that historical performance of loss payment patterns is a reasonable source for projecting future claims payments, there is inherent uncertainty in this estimated projected settlement of loss and LAE reserves, and as a result these estimates will differ, perhaps significantly, from actual future payments. Our operations typically generate substantial positive cash flows from operations as most premiums are received in advance of the time when claim and benefit payments are required. These positive operating cash flows are expected to continue to meet our liquidity requirements, including any unexpected variations in the timing of claim settlements.
As part of the Company’s investment activity, we have committed $40,000 to investments in limited partnerships. The Company has contributed $15,400 to these commitments as of December 31, 2015. As of December 31, 2015, the remaining committed capital due to be called is $24,600.
Critical Accounting Policies and Estimates
Loss and Loss Adjustment Expense Reserves.
Significant periods of time can elapse between the occurrence of an insured loss, the reporting to us of that loss and our final payment of that loss. To recognize liabilities for unpaid losses, we establish reserves as balance sheet liabilities. Our reserves represent estimates of amounts needed to pay reported and unreported losses and the expenses of investigating and paying those losses, or loss adjustment expenses. Every quarter, we review our previously established reserves and adjust them, if necessary.
When a claim is reported, claims personnel establish a “case reserve” for the estimated amount of the ultimate payment. The amount of the reserve is primarily based upon an evaluation of the type of claim involved, the
52
circumstances surrounding each claim and the policy provisions relating to the loss. The estimate reflects the informed judgment of such personnel based on general insurance reserving practices and on the experience and knowledge of the claims person. During the loss adjustment period, these estimates are revised as deemed necessary by our claims department based on subsequent developments and periodic reviews of the cases. When a claim is closed with or without a payment, the difference between the case reserve and the settlement amount creates a reserve deficiency if the payment exceeds the case reserve or a reserve redundancy if the payment is less than the case reserve.
In accordance with industry practice, we also maintain reserves for estimated losses incurred but not yet reported (“IBNR”). IBNR reserves are determined in accordance with commonly accepted actuarial reserving techniques on the basis of our historical information and experience. We review and make adjustments to incurred but not yet reported reserves quarterly. In addition, IBNR reserves can also be expressed as the total loss reserves required less the case reserves on reported claims.
When reviewing reserves, we analyze historical data and estimate the impact of various loss development factors, such as our historical loss experience and that of the industry, trends in claims frequency and severity, our mix of business, our claims processing procedures, legislative enactments, judicial decisions, legal developments in imposition of damages, and changes and trends in general economic conditions, including the effects of inflation. A change in any of these factors from the assumption implicit in our estimate can cause our actual loss experience to be better or worse than our reserves, and the difference can be material. There is no precise method, however, for evaluating the impact of any specific factor on the adequacy of reserves, because the eventual development of reserves is affected by many factors.
In estimating all our loss reserves, we follow the guidance prescribed by Accounting Standards Codification (“ASC”) 944, Financial Services – Insurance.
Management determines our loss and LAE reserves estimate based upon the analysis of our actuaries. A reasonable estimate is derived by selecting a point estimate within a range of indications as calculated by our actuaries using generally accepted actuarial techniques. The key assumption in most actuarial analysis is that past patterns of frequency and severity will repeat in the future, unless a significant change in the factors described above takes place. Our key factors and resulting assumptions are the ultimate frequency and severity of claims, based upon the most recent ten years of claims reported to the Company, and the data CAR reports to us to calculate our share of the residual market, as of the date of the applicable balance sheet. For each accident year and each coverage within a line of business our actuaries calculate the ultimate losses incurred. Our total reserves are the difference between the ultimate losses incurred and the cumulative loss and loss adjustment payments made to date. Our IBNR reserves are calculated as the difference between our total reserves and the outstanding case reserves at the end of the accounting period. To determine ultimate losses, our actuaries calculate a range of indications and select a point estimation using such actuarial techniques as:
|
· |
Paid Loss Indications: This method projects ultimate loss estimates based upon extrapolations of historic paid loss trends. This method tends to be used on short tail lines such as automobile physical damage. |
|
· |
Incurred Loss Indications: This method projects ultimate loss estimates based upon extrapolations of historic incurred loss trends. This method tends to be used on long tail lines of business such as automobile liability and homeowner’s liability. |
|
· |
Bornhuetter-Ferguson Indications: This method projects ultimate loss estimates based upon extrapolations of an expected amount of IBNR, which is added to current incurred losses or paid losses. This method tends to be used on small, immature, or volatile lines of business, such as our BOP and umbrella lines of business. |
|
· |
Bodily Injury Code Indications: This method projects ultimate loss estimates for our private passenger and commercial automobile bodily injury coverage based upon extrapolations of the historic number of accidents and the historic number of bodily injury claims per accident. Projected ultimate bodily injury claims are then segregated into expected claims by type of injury (e.g. soft tissue injury vs. hard tissue injury) based on past experience. An ultimate severity, or average paid loss amounts, is estimated |
53
based upon extrapolating historic trends. Projected ultimate loss estimates using this method are the aggregate of estimated losses by injury type. |
Such techniques assume that past experience, adjusted for the effects of current developments and anticipated trends, is an appropriate basis for predicting our ultimate losses, total reserves and resulting IBNR reserves. It is possible that the final outcome may fall above or below these amounts as a result of a number of factors, including immature data, sparse data, or significant growth in a line of business. Using these methodologies our actuaries established a range of reasonably possible estimations for net reserves of approximately $446,368 to $495,541 as of December 31, 2015 compared to a range of $380,067 to $434,553 as of December 31, 2014. In general, the low and high values of the ranges represent reasonable minimum and maximum values of the indications based on the techniques described above. Our selected point estimate of net loss and LAE reserves based upon the analysis of our actuaries was $485,716 as of December 31, 2015 compared to $420,767 as of December 31, 2014.
The following tables present the point estimation of the recorded reserves and the range of estimations by line of business for net loss and LAE reserves as of December 31, 2015 and December 31, 2014.
|
|
|
|
As of December 31, 2015 |
||||||
|
Line of Business |
|
Low |
|
Recorded |
|
High |
|||
|
Private passenger automobile |
|
$ |
225,126 |
|
$ |
241,767 |
|
$ |
243,276 |
|
Commercial automobile |
|
|
64,647 |
|
|
71,499 |
|
|
72,092 |
|
Homeowners |
|
|
91,348 |
|
|
100,987 |
|
|
104,525 |
|
All other |
|
|
65,247 |
|
|
71,463 |
|
|
75,648 |
|
Total |
|
$ |
446,368 |
|
$ |
485,716 |
|
$ |
495,541 |
|
|
|
|
|
|
|
|
|
|
|
|
|
|
|
|
|
|
|
|
|
|
|
|
|
|
As of December 31, 2014 |
||||||
|
Line of Business |
|
Low |
|
Recorded |
|
High |
|||
|
Private passenger automobile |
|
$ |
216,138 |
|
$ |
228,559 |
|
$ |
237,540 |
|
Commercial automobile |
|
|
55,181 |
|
|
64,453 |
|
|
65,705 |
|
Homeowners |
|
|
63,273 |
|
|
69,326 |
|
|
71,275 |
|
All other |
|
|
45,475 |
|
|
58,429 |
|
|
60,033 |
|
Total |
|
$ |
380,067 |
|
$ |
420,767 |
|
$ |
434,553 |
The following table presents our total net reserves and the corresponding case reserves and IBNR reserves for each line of business as of December 31, 2015 and December 31, 2014.
|
|
|
|
As of December 31, 2015 |
||||||
|
Line of Business |
|
Case |
|
IBNR |
|
Total |
|||
|
Private passenger automobile |
|
$ |
254,778 |
|
$ |
(13,403) |
|
$ |
241,375 |
|
CAR assumed private passenger auto |
|
|
143 |
|
|
249 |
|
|
392 |
|
Commercial automobile |
|
|
43,709 |
|
|
10,545 |
|
|
54,254 |
|
CAR assumed commercial automobile |
|
|
8,091 |
|
|
9,154 |
|
|
17,245 |
|
Homeowners |
|
|
72,704 |
|
|
18,706 |
|
|
91,410 |
|
FAIR Plan assumed homeowners |
|
|
4,200 |
|
|
5,377 |
|
|
9,577 |
|
All other |
|
|
37,935 |
|
|
33,528 |
|
|
71,463 |
|
Total net reserves for losses and LAE |
|
$ |
421,560 |
|
$ |
64,156 |
|
$ |
485,716 |
|
|
|
|
|
|
|
|
|
|
|
|
|
|
|
|
|
|
|
|
|
|
|
|
|
|
As of December 31, 2014 |
||||||
|
Line of Business |
|
Case |
|
IBNR |
|
Total |
|||
|
Private passenger automobile |
|
$ |
238,552 |
|
$ |
(10,814) |
|
$ |
227,738 |
|
CAR assumed private passenger auto |
|
|
239 |
|
|
582 |
|
|
821 |
|
Commercial automobile |
|
|
39,156 |
|
|
10,436 |
|
|
49,592 |
|
CAR assumed commercial automobile |
|
|
6,793 |
|
|
8,068 |
|
|
14,861 |
|
Homeowners |
|
|
42,552 |
|
|
18,826 |
|
|
61,378 |
|
FAIR Plan assumed homeowners |
|
|
2,966 |
|
|
4,982 |
|
|
7,948 |
|
All other |
|
|
28,864 |
|
|
29,565 |
|
|
58,429 |
|
Total net reserves for losses and LAE |
|
$ |
359,122 |
|
$ |
61,645 |
|
$ |
420,767 |
At December 31, 2015 and 2014, our total IBNR reserves for our private passenger automobile line of business were comprised of $(34,929) and $(32,566) related to estimated ultimate decreases in the case reserves, including
54
anticipated recoveries (i.e. salvage and subrogation), and $21,526 and $21,752 related to our estimation for not yet reported losses, respectively.
Our IBNR reserves consist of our estimate of the total loss reserves required less our case reserves. The IBNR reserves for CAR assumed commercial automobile business are 53.1% of our total reserves for CAR assumed commercial automobile business as of December 31, 2015 due to the reporting delays in the information we receive from CAR, as described further in the section on CAR Loss and Loss Adjustment Expense Reserves. Our IBNR reserves for FAIR Plan assumed homeowners are 56.1% of our total reserves for FAIR Plan assumed homeowners at December 31, 2015 due to similar reporting delays in the information we receive from FAIR Plan.
The following tables present information by line of business for our total net reserves and the corresponding retained (i.e. direct less ceded) reserves and assumed reserves as of December 31, 2015 and 2014.
|
|
|
|
As of December 31, 2015 |
||||||
|
Line of Business |
|
|
Retained |
|
|
Assumed |
|
|
Net |
|
Private passenger automobile |
|
$ |
241,375 |
|
|
|
|
|
|
|
CAR assumed private passenger automobile |
|
|
|
|
$ |
392 |
|
|
|
|
Net private passenger automobile |
|
|
|
|
|
|
|
$ |
241,767 |
|
Commercial automobile |
|
|
54,254 |
|
|
|
|
|
|
|
CAR assumed commercial automobile |
|
|
|
|
|
17,245 |
|
|
|
|
Net commercial automobile |
|
|
|
|
|
|
|
|
71,499 |
|
Homeowners |
|
|
91,410 |
|
|
|
|
|
|
|
FAIR Plan assumed homeowners |
|
|
|
|
|
9,577 |
|
|
|
|
Net homeowners |
|
|
|
|
|
|
|
|
100,987 |
|
All other |
|
|
71,463 |
|
|
- |
|
|
71,463 |
|
Total net reserves for losses and LAE |
|
$ |
458,502 |
|
$ |
27,214 |
|
$ |
485,716 |
|
|
|
|
|
|
|
|
|
|
|
|
|
|
|
|
|
|
|
|
|
|
|
|
|
|
As of December 31, 2014 |
||||||
|
Line of Business |
|
|
Retained |
|
|
Assumed |
|
|
Net |
|
Private passenger automobile |
|
$ |
227,738 |
|
|
|
|
|
|
|
CAR assumed private passenger automobile |
|
|
|
|
$ |
821 |
|
|
|
|
Net private passenger automobile |
|
|
|
|
|
|
|
$ |
228,559 |
|
Commercial automobile |
|
|
49,592 |
|
|
|
|
|
|
|
CAR assumed commercial automobile |
|
|
|
|
|
14,861 |
|
|
|
|
Net commercial automobile |
|
|
|
|
|
|
|
|
64,453 |
|
Homeowners |
|
|
61,378 |
|
|
|
|
|
|
|
FAIR Plan assumed homeowners |
|
|
|
|
|
7,948 |
|
|
|
|
Net homeowners |
|
|
|
|
|
|
|
|
69,326 |
|
All other |
|
|
58,429 |
|
|
- |
|
|
58,429 |
|
Total net reserves for losses and LAE |
|
$ |
397,137 |
|
$ |
23,630 |
|
$ |
420,767 |
|
|
|
|
|
|
|
|
|
|
|
Residual Market Loss and Loss Adjustment Expense Reserves
We are a participant in CAR, the FAIR Plan and other various residual markets and assume a portion of losses and LAE on business ceded by the industry participants to the residual markets. We estimate reserves for assumed losses and LAE that have not yet been reported to us by the residual markets. Our estimations are based upon the same factors we use for our own reserves, plus additional factors due to the nature of and the information we receive.
Residual market deficits consist of premium ceded to the various residual markets less losses and LAE and is allocated among insurance companies based on a various formulas (the “Participation Ratio”) that take into consideration a company’s voluntary market share.
Because of the lag in the various residual market estimations, and in order to try to validate to the extent possible the information provided, we must try to estimate the effects of the actions of our competitors in order to establish our Participation Ratio.
55
Although we rely to a significant extent in setting our reserves on the information the various residual markets provide, we are cautious in our use of that information, both because of the delays in receiving data from the various residual markets. As a result, we are cautious in recording residual market reserves for the calendar years for which we have to estimate our Participation Ratio and these reserves are subject to significant judgments and estimates.
Sensitivity Analysis
Establishment of appropriate reserves is an inherently uncertain process. There can be no certainty that currently established reserves based on our key assumptions regarding frequency and severity in our lines of business, or our assumptions regarding our share of the CAR loss will prove adequate in light of subsequent actual experience. To the extent that reserves are inadequate and are strengthened, the amount of such increase is treated as a charge to earnings in the period that the deficiency is recognized. To the extent that reserves are redundant and are released, the amount of the release is a credit to earnings in the period the redundancy is recognized. For the twelve months ended December 31, 2015, a 1 percentage-point change in the loss and LAE ratio would result in a change in reserves of $7,379. Each 1 percentage-point change in the loss and loss expense ratio would have had a $4,796 effect on net income, or $0.32 per diluted share.
Our assumptions consider that past experience, adjusted for the effects of current developments and anticipated trends, are an appropriate basis for establishing our reserves. Our individual key assumptions could each have a reasonable possible range of plus or minus 5 percentage-points for each estimation, although there is no guarantee that our assumptions will not have more than a 5 percentage point variation. The following sensitivity tables present information for each of our primary lines of business on the effect each 1 percentage-point change in each of our key assumptions on unpaid frequency and severity could have on our retained (i.e., direct minus ceded) loss and LAE reserves and net income for the twelve months ended December 31, 2015. In evaluating the information in the table, it should be noted that a 1 percentage-point change in a single assumption would change estimated reserves by 1
56
percentage-point. A 1 percentage-point change in both our key assumptions would change estimated reserves within a range of plus or minus 2 percentage-points.
|
|
|
-1 Percent |
|
No |
|
+1 Percent |
|
|||
|
|
|
Change in |
|
Change in |
|
Change in |
|
|||
|
|
|
Frequency |
|
Frequency |
|
Frequency |
|
|||
|
Private passenger automobile retained loss and LAE reserves |
|
|
|
|
|
|
|
|
|
|
|
-1 Percent Change in Severity |
|
|
|
|
|
|
|
|
|
|
|
Estimated decrease in reserves |
|
$ |
(4,828) |
|
$ |
(2,414) |
|
$ |
— |
|
|
Estimated increase in net income |
|
|
3,138 |
|
|
1,569 |
|
|
— |
|
|
No Change in Severity |
|
|
|
|
|
|
|
|
|
|
|
Estimated (decrease) increase in reserves |
|
|
(2,414) |
|
|
— |
|
|
2,414 |
|
|
Estimated increase (decrease) in net income |
|
|
1,569 |
|
|
— |
|
|
(1,569) |
|
|
+1 Percent Change in Severity |
|
|
|
|
|
|
|
|
|
|
|
Estimated increase in reserves |
|
|
— |
|
|
2,414 |
|
|
4,828 |
|
|
Estimated decrease in net income |
|
|
— |
|
|
(1,569) |
|
|
(3,138) |
|
|
|
|
|
|
|
|
|
|
|
|
|
|
Commercial automobile retained loss and LAE reserves |
|
|
|
|
|
|
|
|
|
|
|
-1 Percent Change in Severity |
|
|
|
|
|
|
|
|
|
|
|
Estimated increase (decrease) in reserves |
|
|
(1,085) |
|
|
(543) |
|
|
— |
|
|
Estimated increase in net income |
|
|
705 |
|
|
353 |
|
|
— |
|
|
No Change in Severity |
|
|
|
|
|
|
|
|
|
|
|
Estimated (decrease) increase in reserves |
|
|
(543) |
|
|
— |
|
|
543 |
|
|
Estimated increase (decrease) in net income |
|
|
353 |
|
|
— |
|
|
(353) |
|
|
+1 Percent Change in Severity |
|
|
|
|
|
|
|
|
|
|
|
Estimated increase in reserves |
|
|
— |
|
|
543 |
|
|
1,085 |
|
|
Estimated decrease in net income |
|
|
— |
|
|
(353) |
|
|
(705) |
|
|
|
|
|
|
|
|
|
|
|
|
|
|
Homeowners retained loss and LAE reserves |
|
|
|
|
|
|
|
|
|
|
|
-1 Percent Change in Severity |
|
|
|
|
|
|
|
|
|
|
|
Estimated decrease in reserves |
|
|
(1,828) |
|
|
(914) |
|
|
— |
|
|
Estimated increase in net income |
|
|
1,188 |
|
|
594 |
|
|
— |
|
|
No Change in Severity |
|
|
|
|
|
|
|
|
|
|
|
Estimated (decrease) increase in reserves |
|
|
(914) |
|
|
— |
|
|
914 |
|
|
Estimated increase (decrease) in net income |
|
|
594 |
|
|
— |
|
|
(594) |
|
|
+1 Percent Change in Severity |
|
|
|
|
|
|
|
|
|
|
|
Estimated increase in reserves |
|
|
— |
|
|
914 |
|
|
1,828 |
|
|
Estimated decrease in net income |
|
|
— |
|
|
(594) |
|
|
(1,188) |
|
|
|
|
|
|
|
|
|
|
|
|
|
|
All other retained loss and LAE reserves |
|
|
|
|
|
|
|
|
|
|
|
-1 Percent Change in Severity |
|
|
|
|
|
|
|
|
|
|
|
Estimated decrease in reserves |
|
|
(1,429) |
|
|
(715) |
|
|
— |
|
|
Estimated increase in net income |
|
|
929 |
|
|
465 |
|
|
— |
|
|
No Change in Severity |
|
|
|
|
|
|
|
|
|
|
|
Estimated (decrease) increase in reserves |
|
|
(715) |
|
|
— |
|
|
715 |
|
|
Estimated increase (decrease) in net income |
|
|
465 |
|
|
— |
|
|
(465) |
|
|
+1 Percent Change in Severity |
|
|
|
|
|
|
|
|
|
|
|
Estimated increase in reserves |
|
|
— |
|
|
715 |
|
|
1,429 |
|
|
Estimated decrease in net income |
|
|
— |
|
|
(465) |
|
|
(929) |
|
Our estimated share of CAR loss and LAE reserves is based on assumptions about our Participation Ratio, the size of CAR, and the resulting deficit (similar assumptions apply with respect to the FAIR Plan). Our assumptions consider that past experience, adjusted for the effects of current developments and anticipated trends, is an appropriate basis for establishing our CAR reserves. Each of our assumptions could have a reasonably possible range of plus or minus 5 percentage-points for each estimation.
The following sensitivity table presents information of the effect each 1 percentage-point change in our assumptions on our share of reserves for CAR and other residual markets could have on our assumed loss and LAE
57
reserves and net income for the year ended December 31, 2015. In evaluating the information in the table, it should be noted that a 1 percentage-point change in our assumptions would change estimated reserves by 1 percentage-point.
|
|
|
-1 Percent |
|
+1 Percent |
|
||
|
|
|
Change in |
|
Change in |
|
||
|
|
|
Estimation |
|
Estimation |
|
||
|
CAR assumed private passenger automobile |
|
|
|
|
|
|
|
|
Estimated (decrease) increase in reserves |
|
$ |
(4) |
|
$ |
4 |
|
|
Estimated increase (decrease) in net income |
|
|
3 |
|
|
(3) |
|
|
CAR assumed commercial automobile |
|
|
|
|
|
|
|
|
Estimated (decrease) increase in reserves |
|
|
(172) |
|
|
172 |
|
|
Estimated increase (decrease) in net income |
|
|
112 |
|
|
(112) |
|
|
FAIR Plan assumed homeowners |
|
|
|
|
|
|
|
|
Estimated (decrease) increase in reserves |
|
|
(96) |
|
|
96 |
|
|
Estimated increase (decrease) in net income |
|
|
62 |
|
|
(62) |
|
Reserve Development Summary
The changes we have recorded in our reserves in the past illustrate the uncertainty of estimating reserves. Our prior year reserves decreased by $30,313, $37,368 and $28,889 for the years ended December 31, 2015, 2014, and 2013, respectively.
The following table presents a comparison of prior year development of our net reserves for losses and LAE for the years ended December 31, 2015, 2014 and 2013, respectively. Each accident year represents all claims for an annual accounting period in which loss events occurred, regardless of when the losses are actually reported, booked or paid. Our financial statements reflect the aggregate results of the current and all prior accident years.
|
|
|
Year Ended December 31, |
||||||
|
Accident Year |
|
2015 |
|
2014 |
2013 |
|||
|
2005 & prior |
|
$ |
(1,305) |
|
$ |
(1,904) |
$ |
(1,993) |
|
2006 |
|
|
(408) |
|
|
(1,132) |
|
(620) |
|
2007 |
|
|
(763) |
|
|
(1,526) |
|
(2,968) |
|
2008 |
|
|
(1,071) |
|
|
(2,738) |
|
(4,266) |
|
2009 |
|
|
(1,678) |
|
|
(4,812) |
|
(4,998) |
|
2010 |
|
|
(3,559) |
|
|
(6,573) |
|
(5,304) |
|
2011 |
|
|
(4,898) |
|
|
(7,975) |
|
(5,543) |
|
2012 |
|
|
(10,754) |
|
|
(8,085) |
|
(3,197) |
|
2013 |
|
|
(4,683) |
|
|
(2,623) |
|
— |
|
2014 |
|
|
(1,194) |
|
|
— |
|
— |
|
All prior years |
|
$ |
(30,313) |
|
$ |
(37,368) |
$ |
(28,889) |
The decreases in prior years reserves during the years ended December 31, 2015, 2014 and 2013 resulted from re-estimations of prior year ultimate loss and LAE liabilities. The 2015 decrease is primarily composed of reductions of $18,644, in our retained automobile reserves and $7,964 in our retained homeowners reserves. The 2014 decrease is primarily composed of reductions of $23,272 in our retained automobile reserves and $8,804 in our retained homeowners reserves. The 2013 decrease is primarily composed of reductions of $23,938 in our retained automobile reserves and $4,740 in our retained homeowners reserves..
58
The following table presents information by line of business for prior year development of our net reserves for losses and LAE for the year ended December 31, 2015.
|
|
|
Private Passenger |
|
Commercial |
|
|
|
|
|
|
|
|
|
|
||
|
Accident Year |
|
Automobile |
|
Automobile |
|
Homeowners |
|
All Other |
|
Total |
|
|||||
|
2005 & prior |
|
$ |
(437) |
|
$ |
(520) |
|
$ |
(118) |
|
$ |
(230) |
|
$ |
(1,305) |
|
|
2006 |
|
|
(146) |
|
|
(145) |
|
|
(112) |
|
|
(5) |
|
|
(408) |
|
|
2007 |
|
|
(561) |
|
|
(18) |
|
|
(105) |
|
|
(79) |
|
|
(763) |
|
|
2008 |
|
|
(243) |
|
|
(487) |
|
|
(97) |
|
|
(244) |
|
|
(1,071) |
|
|
2009 |
|
|
(1,273) |
|
|
(16) |
|
|
(75) |
|
|
(314) |
|
|
(1,678) |
|
|
2010 |
|
|
(1,549) |
|
|
(624) |
|
|
(912) |
|
|
(474) |
|
|
(3,559) |
|
|
2011 |
|
|
(2,471) |
|
|
(644) |
|
|
(1,370) |
|
|
(414) |
|
|
(4,899) |
|
|
2012 |
|
|
(5,508) |
|
|
(274) |
|
|
(4,093) |
|
|
(880) |
|
|
(10,755) |
|
|
2013 |
|
|
(1,914) |
|
|
(1,742) |
|
|
(1,326) |
|
|
300 |
|
|
(4,682) |
|
|
2014 |
|
|
(309) |
|
|
(1,469) |
|
|
953 |
|
|
(368) |
|
|
(1,193) |
|
|
All prior years |
|
$ |
(14,411) |
|
$ |
(5,939) |
|
$ |
(7,255) |
|
$ |
(2,708) |
|
$ |
(30,313) |
|
To further clarify the effects of changes in our reserve estimates for CAR and other residual markets, the next two tables break out the information in the table above by source of the business (i.e., non-residual market vs. residual market).
The following table presents information by line of business for prior year development of retained reserves for losses and LAE for the year ended December 31, 2015 that is, all our reserves except for business ceded or assumed from CAR and other residual markets.
|
|
|
|
Retained |
|
|
Retained |
|
|
|
|
|
|
|
|
|
|
|
|
|
|
Private Passenger |
|
|
Commercial |
|
|
Retained |
|
|
Retained |
|
|
|
|
|
Accident Year |
|
|
Automobile |
|
|
Automobile |
|
|
Homeowners |
|
|
All Other |
|
|
Total |
|
|
2005 & prior |
|
$ |
(254) |
|
$ |
(403) |
|
$ |
(118) |
|
$ |
(230) |
|
$ |
(1,005) |
|
|
2006 |
|
|
(16) |
|
|
(48) |
|
|
(112) |
|
|
(5) |
|
|
(181) |
|
|
2007 |
|
|
(561) |
|
|
(2) |
|
|
(102) |
|
|
(79) |
|
|
(744) |
|
|
2008 |
|
|
(243) |
|
|
(481) |
|
|
(91) |
|
|
(244) |
|
|
(1,059) |
|
|
2009 |
|
|
(1,273) |
|
|
(16) |
|
|
(66) |
|
|
(314) |
|
|
(1,669) |
|
|
2010 |
|
|
(1,549) |
|
|
(622) |
|
|
(888) |
|
|
(474) |
|
|
(3,533) |
|
|
2011 |
|
|
(2,471) |
|
|
(618) |
|
|
(1,294) |
|
|
(414) |
|
|
(4,797) |
|
|
2012 |
|
|
(5,508) |
|
|
(114) |
|
|
(3,957) |
|
|
(880) |
|
|
(10,459) |
|
|
2013 |
|
|
(1,915) |
|
|
(1,285) |
|
|
(1,215) |
|
|
300 |
|
|
(4,115) |
|
|
2014 |
|
|
(309) |
|
|
(956) |
|
|
(121) |
|
|
(368) |
|
|
(1,754) |
|
|
All prior years |
|
$ |
(14,099) |
|
$ |
(4,545) |
|
$ |
(7,964) |
|
$ |
(2,708) |
|
$ |
(29,316) |
|
The following table presents information by line of business for prior year development of reserves assumed from residual markets for losses and LAE for the year ended December 31, 2015.
|
|
|
|
CAR Assumed |
|
|
CAR Assumed |
|
|
|
|
|
|
|
|
|
|
|
Private Passenger |
|
|
Commercial |
|
|
FAIR Plan |
|
|
|
|
|
Accident Year |
|
|
Automobile |
|
|
Automobile |
|
|
Homeowners |
|
|
Total |
|
|
2005 & prior |
|
$ |
(183) |
|
$ |
(117) |
|
$ |
— |
|
$ |
(300) |
|
|
2006 |
|
|
(130) |
|
|
(97) |
|
|
— |
|
|
(227) |
|
|
2007 |
|
|
— |
|
|
(16) |
|
|
(3) |
|
|
(19) |
|
|
2008 |
|
|
— |
|
|
(6) |
|
|
(6) |
|
|
(12) |
|
|
2009 |
|
|
— |
|
|
— |
|
|
(9) |
|
|
(9) |
|
|
2010 |
|
|
— |
|
|
(2) |
|
|
(24) |
|
|
(26) |
|
|
2011 |
|
|
— |
|
|
(25) |
|
|
(76) |
|
|
(101) |
|
|
2012 |
|
|
— |
|
|
(159) |
|
|
(136) |
|
|
(295) |
|
|
2013 |
|
|
1 |
|
|
(458) |
|
|
(111) |
|
|
(568) |
|
|
2014 |
|
|
— |
|
|
(514) |
|
|
1,074 |
|
|
560 |
|
|
All prior years |
|
$ |
(312) |
|
$ |
(1,394) |
|
$ |
709 |
|
$ |
(997) |
|
Our private passenger automobile line of business prior year reserves decreased by $14,411 for the year ended December 31, 2015. The decrease was primarily due to improved retained private passenger results of $12,716 for the accident years 2009 through 2013. The improved retained private passenger results were primarily due to fewer IBNR
59
claims than previously estimated and better than previously estimated severity on our established bodily injury and property damage case reserves.
Our retained commercial automobile line of business prior year reserves decreased by $4,545 for the year ended December 31, 2015 due primarily to fewer IBNR claims than previously estimated.
Our retained homeowners line of business prior year reserves decreased by $7,964 for the year ended December 31, 2015 due primarily to re-estimation of catastrophe losses for 2010 through 2014.
In estimating all our loss reserves, including CAR, we follow the guidance prescribed by ASC 944, Financial Services-Insurance.
For further information, see “Results of Operations: Losses and Loss Adjustment Expenses.”
Other-Than-Temporary Impairments.
We use a systematic methodology to evaluate declines in fair values below cost or amortized cost of our investments. This methodology ensures that we evaluate available evidence concerning any declines in a disciplined manner.
In our determination of whether a decline in fair value below amortized cost is an other-than-temporary impairment (“OTTI”), we consider and evaluate several factors and circumstances including the issuer’s overall financial condition, the issuer’s credit and financial strength ratings, a weakening of the general market conditions in the industry or geographic region in which the issuer operates, a prolonged period (typically six months or longer) in which the fair value of an issuer’s securities remains below our amortized cost, and any other factors that may raise doubt about the issuer’s ability to continue as a going concern.
ASC 320, Investments — Debt and Equity Securities requires entities to separate an OTTI of a debt security into two components when there are credit related losses associated with the impaired debt security for which the Company asserts that it does not have the intent to sell the security, and it is more likely than not that it will not be required to sell the security before recovery of its cost basis. Under ASC 320, the amount of the OTTI related to a credit loss is recognized in earnings, and the amount of the OTTI related to other factors is recorded as a component of other comprehensive income (loss). In instances where no credit loss exists but it is more likely than not that the Company will have to sell the debt security prior to the anticipated recovery, the decline in market value below amortized cost is recognized as an OTTI in earnings. In periods after the recognition of an OTTI on debt securities, the Company accounts for such securities as if they had been purchased on the measurement date of the OTTI at an amortized cost basis equal to the previous amortized cost basis less the OTTI recognized in earnings. For debt securities for which OTTI was recognized in earnings, the difference between the new amortized cost basis and the cash flows expected to be collected will be accreted or amortized into net investment income.
For further information, see “Results of Operations: Net Realized Gains (Losses) on Investments.”
Forward-looking statements might include one or more of the following, among others:
|
· |
Projections of revenues, income, earnings per share, capital expenditures, dividends, capital structure or other financial items; |
|
· |
Descriptions of plans or objectives of management for future operations, products or services; |
|
· |
Forecasts of future economic performance, liquidity, need for funding and income; |
|
· |
Descriptions of assumptions underlying or relating to any of the foregoing; and |
|
· |
Future performance of credit markets. |
60
Forward-looking statements can be identified by the fact that they do not relate strictly to historical or current facts. They often include words such as “believe,” “expect,” “anticipate,” “intend,” “plan,” “estimate,” “aim,” “projects,” or words of similar meaning and expressions that indicate future events and trends, or future or conditional verbs such as “will,” “would,” “should,” “could,” or “may.” All statements that address expectations or projections about the future, including statements about the Company’s strategy for growth, product development, market position, expenditures and financial results, are forward-looking statements.
Forward-looking statements are not guarantees of future performance. By their nature, forward-looking statements are subject to risks and uncertainties. There are a number of factors, many of which are beyond our control, that could cause actual future conditions, events, results or trends to differ significantly and/or materially from historical results or those projected in the forward-looking statements. These factors include but are not limited to the competitive nature of our industry and the possible adverse effects of such competition. Although a number of national insurers that are much larger than we are do not currently compete in a material way in the Massachusetts private passenger automobile market, if one or more of these companies decided to aggressively enter the market it could have a material adverse effect on us. Other significant factors include conditions for business operations and restrictive regulations in Massachusetts, the possibility of losses due to claims resulting from severe weather, the possibility that we may be unable to collect from reinsurers, the possibility that the Commissioner may approve future Rule changes that change the operation of the residual market, the possibility that existing insurance-related laws and regulations will become further restrictive in the future, our possible need for and availability of additional financing, and our dependence on strategic relationships, among others, and other risks and factors identified from time to time in our reports filed with the SEC. Refer to Part I, Item 1A — Risk Factors.
Some other factors, such as market, operational, liquidity, interest rate, equity and other risks, are described elsewhere in this Annual Report on Form 10-K. Factors relating to the regulation and supervision of our Company are also described or incorporated in this report. There are other factors besides those described or incorporated in this report that could cause actual conditions, events or results to differ from those in the forward-looking statements.
Readers are cautioned not to place undue reliance on these forward-looking statements, which speak only as of the date on which they are made. We do not undertake any obligation to update publicly or revise any forward-looking statements to reflect circumstances or events that occur after the date the forward-looking statements are made.
61
ITEM 7A. QUANTITATIVE AND QUALITATIVE DISCLOSURES ABOUT MARKET RISK
Market Risk. Market risk is the risk that we will incur losses due to adverse changes in market rates and prices. We have exposure to market risk through our investment activities and our financing activities. Our primary market risk exposure is to changes in interest rates. We use both fixed and variable rate debt as sources of financing. We have not entered, and do not plan to enter, into any derivative financial instruments for trading or speculative purposes.
Interest Rate Risk. Interest rate risk is the risk that we will incur economic losses due to adverse changes in interest rates. Our exposure to interest rate changes primarily results from our significant holdings of fixed rate investments and from our financing activities. Our fixed maturity investments include U.S. and foreign government bonds, securities issued by government agencies, obligations of state and local governments and governmental authorities, corporate bonds and asset-backed securities, most of which are exposed to changes in prevailing interest rates.
We manage our exposure to risks associated with interest rate fluctuations through active review of our investment portfolio by our management and Board and consultation with third-party financial advisors. As a general matter, we do not attempt to match the durations of our assets with the durations of our liabilities, and the majority of our liabilities are “short tail.” Our goal is to maximize the total after-tax return on all of our investments. An important strategy that we employ to achieve this goal is to try to hold enough in cash and short-term investments in order to avoid liquidating longer-term investments to pay claims.
Based upon the results of interest rate sensitivity analysis, the following table shows the interest rate risk of our investments in fixed maturities, measured in terms of fair value (which is equal to the carrying value for all our fixed maturity securities).
|
|
|
|
-100 Basis |
|
|
|
|
|
+100 Basis |
|
|
|
|
|
Point Change |
|
|
No Change |
|
|
Point Change |
|
|
As of December 31, 2015 |
|
|
|
|
|
|
|
|
|
|
|
Estimated fair value |
|
$ |
1,118,743 |
|
$ |
1,081,637 |
|
$ |
1,039,997 |
|
|
Estimated increase (decrease) in fair value |
|
$ |
37,106 |
|
$ |
— |
|
$ |
(41,640) |
|
|
|
|
|
|
|
|
|
|
|
|
|
|
As of December 31, 2014 |
|
|
|
|
|
|
|
|
|
|
|
Estimated fair value |
|
$ |
1,171,808 |
|
$ |
1,135,451 |
|
$ |
1,095,575 |
|
|
Estimated increase (decrease) in fair value |
|
$ |
36,357 |
|
$ |
— |
|
$ |
(39,876) |
|
|
|
|
|
|
|
|
|
|
|
|
|
With respect to floating rate debt, we are exposed to the effects of changes in prevailing interest rates. At December 31, 2015, we had no debt outstanding under our credit facility. Assuming the full utilization of our current available credit facility, a 2.0% increase in the prevailing interest rate on our variable rate debt would result in interest expense increasing approximately $600 for 2015, assuming that all of such debt is outstanding for the entire year.
In addition, in the current market environment, our investments can also contain liquidity risks.
Equity Risk. Equity risk is the risk that we will incur economic losses due to adverse changes in equity prices. Our exposure to changes in equity prices results from our holdings of common stock and mutual funds held to fund the executive deferred compensation plan. We continuously evaluate market conditions and we expect in the future to purchase additional equity securities. We principally manage equity price risk through industry and issuer diversification and asset allocation techniques.
62
ITEM 8. FINANCIAL STATEMENTS AND SUPPLEMENTAL DATA
SAFETY INSURANCE GROUP, INC.
INDEX TO CONSOLIDATED FINANCIAL STATEMENTS
|
|
Page |
|
Consolidated Financial Statements: |
|
|
|
|
| 64 | |
|
|
|
| 65 | |
|
|
|
| 66 | |
|
|
|
| 67 | |
|
|
|
| 68 | |
|
|
|
| 69 | |
|
|
|
| 70 |
63
Report of Independent Registered Public Accounting Firm
To the Board of Directors and Shareholders of Safety Insurance Group, Inc.:
In our opinion, the consolidated financial statements listed in the accompanying index present fairly, in all material respects, the financial position of Safety Insurance Group, Inc. and its subsidiaries at December 31, 2015 and December 31, 2014, and the results of their operations and their cash flows for each of the three years in the period ended December 31, 2015 in conformity with accounting principles generally accepted in the United States of America. In addition, in our opinion, the financial statement schedules listed in the index appearing under Item 15(a)(2) present fairly, in all material respects, the information set forth therein when read in conjunction with the related consolidated financial statements. Also in our opinion, the Company maintained, in all material respects, effective internal control over financial reporting as of December 31, 2015 based on criteria established in Internal Control - Integrated Framework (2013) issued by the Committee of Sponsoring Organizations of the Treadway Commission (COSO). The Company's management is responsible for these financial statements and financial statement schedules, for maintaining effective internal control over financial reporting and for its assessment of the effectiveness of internal control over financial reporting, appearing on Management's Report on Internal Control over Financial Reporting under Item 9A. Our responsibility is to express opinions on these financial statements, on the financial statement schedules, and on the Company's internal control over financial reporting based on our integrated audits. We conducted our audits in accordance with the standards of the Public Company Accounting Oversight Board (United States). Those standards require that we plan and perform the audits to obtain reasonable assurance about whether the financial statements are free of material misstatement and whether effective internal control over financial reporting was maintained in all material respects. Our audits of the financial statements included examining, on a test basis, evidence supporting the amounts and disclosures in the financial statements, assessing the accounting principles used and significant estimates made by management, and evaluating the overall financial statement presentation. Our audit of internal control over financial reporting included obtaining an understanding of internal control over financial reporting, assessing the risk that a material weakness exists, and testing and evaluating the design and operating effectiveness of internal control based on the assessed risk. Our audits also included performing such other procedures as we considered necessary in the circumstances. We believe that our audits provide a reasonable basis for our opinions.
A company’s internal control over financial reporting is a process designed to provide reasonable assurance regarding the reliability of financial reporting and the preparation of financial statements for external purposes in accordance with generally accepted accounting principles. A company’s internal control over financial reporting includes those policies and procedures that (i) pertain to the maintenance of records that, in reasonable detail, accurately and fairly reflect the transactions and dispositions of the assets of the company; (ii) provide reasonable assurance that transactions are recorded as necessary to permit preparation of financial statements in accordance with generally accepted accounting principles, and that receipts and expenditures of the company are being made only in accordance with authorizations of management and directors of the company; and (iii) provide reasonable assurance regarding prevention or timely detection of unauthorized acquisition, use, or disposition of the company’s assets that could have a material effect on the financial statements.
Because of its inherent limitations, internal control over financial reporting may not prevent or detect misstatements. Also, projections of any evaluation of effectiveness to future periods are subject to the risk that controls may become inadequate because of changes in conditions, or that the degree of compliance with the policies or procedures may deteriorate.
/s/ PricewaterhouseCoopers LLP
Boston, Massachusetts
February 25, 2016
64
Safety Insurance Group, Inc. and Subsidiaries
(Dollars in thousands, except share data)
|
|
|
December 31, |
|
December 31, |
||
|
|
|
2015 |
|
2014 |
||
|
|
|
|
|
|
|
|
|
Assets |
|
|
|
|
|
|
|
Investments: |
|
|
|
|
|
|
|
Securities available for sale: |
|
|
|
|
|
|
|
Fixed maturities, at fair value (amortized cost: $1,063,971 and $1,102,517) |
|
$ |
1,081,637 |
|
$ |
1,135,451 |
|
Equity securities, at fair value (cost: $102,541 and $97,910) |
|
|
110,204 |
|
|
109,153 |
|
Other invested assets |
|
|
17,602 |
|
|
11,657 |
|
Total investments |
|
|
1,209,443 |
|
|
1,256,261 |
|
Cash and cash equivalents |
|
|
47,494 |
|
|
42,455 |
|
Accounts receivable, net of allowance for doubtful accounts |
|
|
178,567 |
|
|
175,532 |
|
Receivable for securities sold |
|
|
260 |
|
|
— |
|
Accrued investment income |
|
|
8,922 |
|
|
10,295 |
|
Taxes recoverable |
|
|
15,497 |
|
|
— |
|
Receivable from reinsurers related to paid loss and loss adjustment expenses |
|
|
40,972 |
|
|
6,267 |
|
Receivable from reinsurers related to unpaid loss and loss adjustment expenses |
|
|
68,261 |
|
|
61,245 |
|
Ceded unearned premiums |
|
|
23,222 |
|
|
19,638 |
|
Deferred policy acquisition costs |
|
|
68,937 |
|
|
67,329 |
|
Deferred income taxes |
|
|
4,430 |
|
|
— |
|
Equity and deposits in pools |
|
|
23,558 |
|
|
23,159 |
|
Other assets |
|
|
14,306 |
|
|
13,538 |
|
Total assets |
|
$ |
1,703,869 |
|
$ |
1,675,719 |
|
|
|
|
|
|
|
|
|
Liabilities |
|
|
|
|
|
|
|
Loss and loss adjustment expense reserves |
|
$ |
553,977 |
|
$ |
482,012 |
|
Unearned premium reserves |
|
|
401,961 |
|
|
390,361 |
|
Accounts payable and accrued liabilities |
|
|
53,722 |
|
|
65,863 |
|
Payable for securities purchased |
|
|
8,607 |
|
|
4,591 |
|
Payable to reinsurers |
|
|
11,547 |
|
|
7,653 |
|
Deferred income taxes |
|
|
— |
|
|
1,614 |
|
Taxes payable |
|
|
— |
|
|
265 |
|
Other liabilities |
|
|
29,556 |
|
|
15,077 |
|
Total liabilities |
|
|
1,059,370 |
|
|
967,436 |
|
|
|
|
|
|
|
|
|
Commitments and contingencies (Note 7) |
|
|
|
|
|
|
|
|
|
|
|
|
|
|
|
Shareholders’ equity |
|
|
|
|
|
|
|
Common stock: $0.01 par value; 30,000,000 shares authorized; 17,373,643 and 17,288,728 shares issued |
|
|
174 |
|
|
173 |
|
Additional paid-in capital |
|
|
179,896 |
|
|
175,583 |
|
Accumulated other comprehensive income, net of taxes |
|
|
16,464 |
|
|
28,715 |
|
Retained earnings |
|
|
531,800 |
|
|
587,647 |
|
Treasury stock, at cost: 2,279,570 shares |
|
|
(83,835) |
|
|
(83,835) |
|
Total shareholders’ equity |
|
|
644,499 |
|
|
708,283 |
|
Total liabilities and shareholders’ equity |
|
$ |
1,703,869 |
|
$ |
1,675,719 |
The accompanying notes are an integral part of these financial statements.
65
Safety Insurance Group, Inc. and Subsidiaries
Consolidated Statements of Operations
(Dollars in thousands, except per share data)
|
|
|
Year Ended December 31, |
|||||||
|
|
|
2015 |
|
2014 |
|
2013 |
|||
|
|
|
|
|
|
|
|
|
|
|
|
Net earned premiums |
|
$ |
738,164 |
|
$ |
716,875 |
|
$ |
681,870 |
|
Net investment income |
|
|
40,534 |
|
|
42,303 |
|
|
43,054 |
|
Earnings from partnership investments |
|
|
2,387 |
|
|
878 |
|
|
— |
|
Net realized (losses) gains on investments |
|
|
(469) |
|
|
197 |
|
|
1,677 |
|
Net impairment losses on investments (a) |
|
|
(796) |
|
|
— |
|
|
— |
|
Finance and other service income |
|
|
18,133 |
|
|
18,544 |
|
|
18,683 |
|
Total revenue |
|
|
797,953 |
|
|
778,797 |
|
|
745,284 |
|
|
|
|
|
|
|
|
|
|
|
|
Losses and loss adjustment expenses |
|
|
612,569 |
|
|
476,366 |
|
|
447,749 |
|
Underwriting, operating and related expenses |
|
|
213,939 |
|
|
219,023 |
|
|
209,758 |
|
Interest expense |
|
|
90 |
|
|
90 |
|
|
89 |
|
Total expenses |
|
|
826,598 |
|
|
695,479 |
|
|
657,596 |
|
|
|
|
|
|
|
|
|
|
|
|
(Loss) income before income taxes |
|
|
(28,645) |
|
|
83,318 |
|
|
87,688 |
|
Income tax (credit) expense |
|
|
(14,792) |
|
|
23,964 |
|
|
26,337 |
|
Net (loss) income |
|
$ |
(13,853) |
|
$ |
59,354 |
|
$ |
61,351 |
|
|
|
|
|
|
|
|
|
|
|
|
(Loss) earnings per weighted average common share: |
|
|
|
|
|
|
|
|
|
|
Basic |
|
$ |
(0.93) |
|
$ |
3.93 |
|
$ |
3.99 |
|
Diluted |
|
$ |
(0.93) |
|
$ |
3.91 |
|
$ |
3.98 |
|
|
|
|
|
|
|
|
|
|
|
|
Cash dividends paid per common share |
|
$ |
2.80 |
|
$ |
2.60 |
|
$ |
2.40 |
|
|
|
|
|
|
|
|
|
|
|
|
Number of shares used in computing earnings per share: |
|
|
|
|
|
|
|
|
|
|
Basic |
|
|
14,866,607 |
|
|
14,963,047 |
|
|
15,167,052 |
|
Diluted |
|
|
14,866,607 |
|
|
15,052,745 |
|
|
15,212,385 |
|
|
|
|
|
|
|
|
|
|
|
|
(a) |
No portion of the other-than-temporary impairments recognized in the period indicated were included in comprehensive income. |
The accompanying notes are an integral part of these financial statements.
66
Safety Insurance Group, Inc. and Subsidiaries
Consolidated Statements of Comprehensive Income
(Dollars in thousands)
|
|
|
Year Ended December 31, |
|||||||
|
|
|
2015 |
|
2014 |
|
2013 |
|||
|
Net (loss) income |
|
$ |
(13,853) |
|
$ |
59,354 |
|
$ |
61,351 |
|
|
|
|
|
|
|
|
|
|
|
|
Other comprehensive (loss) income, net of tax: |
|
|
|
|
|
|
|
|
|
|
Unrealized holding (losses) gains during the period, net of tax expense (benefit) of ($6,761), $6,269 , and ($13,497). |
|
|
(12,556) |
|
|
11,643 |
|
|
(25,066) |
|
Reclassification adjustment for gains included in net income, net of tax expense of $164, ($69), and ($587). |
|
|
305 |
|
|
(128) |
|
|
(1,090) |
|
Unrealized (losses) gains on securities available for sale |
|
|
(12,251) |
|
|
11,515 |
|
|
(26,156) |
|
|
|
|
|
|
|
|
|
|
|
|
Comprehensive (loss) income |
|
$ |
(26,104) |
|
$ |
70,869 |
|
$ |
35,195 |
The accompanying notes are an integral part of these financial statements.
67
Safety Insurance Group, Inc. and Subsidiaries
Consolidated Statements of Changes in Shareholders’ Equity
(Dollars in thousands)
|
|
|
|
|
|
|
|
|
Accumulated |
|
|
|
|
|
|
|
|
|
|
|
|
|
|
|
|
|
|
|
Other |
|
|
|
|
|
|
|
|
|
|
|
|
|
|
|
|
Additional |
|
Comprehensive |
|
|
|
|
|
|
|
Total |
|||
|
|
|
Common |
|
Paid-in |
|
Income, |
|
Retained |
|
Treasury |
|
Shareholders’ |
||||||
|
|
|
Stock |
|
Capital |
|
Net of Taxes |
|
Earnings |
|
Stock |
|
Equity |
||||||
|
Balance at December 31, 2012 |
|
$ |
170 |
|
$ |
163,041 |
|
$ |
43,356 |
|
$ |
543,361 |
|
$ |
(55,569) |
|
$ |
694,359 |
|
Net income |
|
|
|
|
|
|
|
|
|
|
|
61,351 |
|
|
|
|
|
61,351 |
|
Unrealized losses on securities available for sale, net of deferred federal income taxes |
|
|
|
|
|
|
|
|
(26,156) |
|
|
|
|
|
|
|
|
(26,156) |
|
Restricted share awards issued |
|
|
1 |
|
|
187 |
|
|
|
|
|
|
|
|
|
|
|
188 |
|
Recognition of employee share-based compensation, net of deferred federal income taxes |
|
|
|
|
|
4,618 |
|
|
|
|
|
|
|
|
|
|
|
4,618 |
|
Exercise of options, net of federal income taxes |
|
|
1 |
|
|
2,545 |
|
|
|
|
|
|
|
|
|
|
|
2,546 |
|
Dividends paid and accrued |
|
|
|
|
|
|
|
|
|
|
|
(36,920) |
|
|
|
|
|
(36,920) |
|
Acquisition of treasury stock |
|
|
|
|
|
|
|
|
|
|
|
|
|
|
(4,799) |
|
|
(4,799) |
|
Balance at December 31, 2013 |
|
|
172 |
|
|
170,391 |
|
|
17,200 |
|
|
567,792 |
|
|
(60,368) |
|
|
695,187 |
|
Net income |
|
|
|
|
|
|
|
|
|
|
|
59,354 |
|
|
|
|
|
59,354 |
|
Unrealized gains on securities available for sale, net of deferred federal income taxes |
|
|
|
|
|
|
|
|
11,515 |
|
|
|
|
|
|
|
|
11,515 |
|
Restricted share awards issued |
|
|
1 |
|
|
216 |
|
|
|
|
|
|
|
|
|
|
|
217 |
|
Recognition of employee share-based compensation, net of deferred federal income taxes |
|
|
|
|
|
4,677 |
|
|
|
|
|
|
|
|
|
|
|
4,677 |
|
Exercise of options, net of federal income taxes |
|
|
- |
|
|
299 |
|
|
|
|
|
|
|
|
|
|
|
299 |
|
Dividends paid and accrued |
|
|
|
|
|
|
|
|
|
|
|
(39,499) |
|
|
|
|
|
(39,499) |
|
Acquisition of treasury stock |
|
|
|
|
|
|
|
|
|
|
|
|
|
|
(23,467) |
|
|
(23,467) |
|
Balance at December 31, 2014 |
|
|
173 |
|
|
175,583 |
|
|
28,715 |
|
|
587,647 |
|
|
(83,835) |
|
|
708,283 |
|
Net loss |
|
|
|
|
|
|
|
|
|
|
|
(13,853) |
|
|
|
|
|
(13,853) |
|
Unrealized losses on securities available for sale, net of deferred federal income taxes |
|
|
|
|
|
|
|
|
(12,251) |
|
|
|
|
|
|
|
|
(12,251) |
|
Restricted share awards issued |
|
|
1 |
|
|
246 |
|
|
|
|
|
|
|
|
|
|
|
247 |
|
Recognition of employee share-based compensation, net of deferred federal income taxes |
|
|
|
|
|
3,787 |
|
|
|
|
|
|
|
|
|
|
|
3,787 |
|
Exercise of options, net of federal income taxes |
|
|
|
|
|
280 |
|
|
|
|
|
|
|
|
|
|
|
280 |
|
Dividends paid and accrued |
|
|
|
|
|
|
|
|
|
|
|
(41,994) |
|
|
|
|
|
(41,994) |
|
Acquisition of treasury stock |
|
|
|
|
|
|
|
|
|
|
|
|
|
|
- |
|
|
- |
|
Balance at December 31, 2015 |
|
$ |
174 |
|
$ |
179,896 |
|
$ |
16,464 |
|
$ |
531,800 |
|
$ |
(83,835) |
|
$ |
644,499 |
The accompanying notes are an integral part of these financial statements.
68
Safety Insurance Group, Inc. and Subsidiaries
Consolidated Statements of Cash Flows
(Dollars in thousands)
|
|
|
Year Ended December 31, |
|||||||
|
|
|
2015 |
|
2014 |
|
|
2013 |
||
|
Cash flows from operating activities: |
|
|
|
|
|
|
|
|
|
|
Net (loss) income |
|
$ |
(13,853) |
|
$ |
59,354 |
|
$ |
61,351 |
|
Adjustments to reconcile net (loss) income to net cash provided by operating activities: |
|
|
|
|
|
|
|
|
|
|
Depreciation and amortization, net |
|
|
12,597 |
|
|
13,123 |
|
|
12,326 |
|
Provision (credit) for deferred income taxes |
|
|
552 |
|
|
(602) |
|
|
1,899 |
|
Net realized losses (gains) on investments |
|
|
469 |
|
|
(197) |
|
|
(1,677) |
|
Net impairment losses on investments |
|
|
796 |
|
|
— |
|
|
— |
|
Earnings from partnership investments |
|
|
(2,387) |
|
|
(878) |
|
|
— |
|
Changes in assets and liabilities: |
|
|
|
|
|
|
|
|
|
|
Accounts receivable |
|
|
(3,035) |
|
|
(6,228) |
|
|
(3,554) |
|
Accrued investment income |
|
|
1,373 |
|
|
34 |
|
|
258 |
|
Receivable from reinsurers |
|
|
(41,721) |
|
|
(2,578) |
|
|
(6,139) |
|
Ceded unearned premiums |
|
|
(3,584) |
|
|
(1,738) |
|
|
(1,694) |
|
Deferred policy acquisition costs |
|
|
(1,608) |
|
|
(3,941) |
|
|
(2,723) |
|
Taxes recoverable |
|
|
(15,497) |
|
|
— |
|
|
— |
|
Other assets |
|
|
(726) |
|
|
(2,871) |
|
|
3,084 |
|
Loss and loss adjustment expense reserves |
|
|
71,965 |
|
|
26,998 |
|
|
31,172 |
|
Unearned premium reserves |
|
|
11,600 |
|
|
19,778 |
|
|
17,364 |
|
Accounts payable and accrued liabilities |
|
|
(12,423) |
|
|
(577) |
|
|
1,050 |
|
Payable to reinsurers |
|
|
3,894 |
|
|
559 |
|
|
38 |
|
Other liabilities |
|
|
14,479 |
|
|
(2,667) |
|
|
(1,891) |
|
Net cash provided by operating activities |
|
|
22,891 |
|
|
97,569 |
|
|
110,864 |
|
|
|
|
|
|
|
|
|
|
|
|
Cash flows from investing activities: |
|
|
|
|
|
|
|
|
|
|
Fixed maturities purchased |
|
|
(227,328) |
|
|
(234,172) |
|
|
(193,814) |
|
Equity securities purchased |
|
|
(26,658) |
|
|
(27,665) |
|
|
(75,891) |
|
Other invested assets purchased |
|
|
(4,824) |
|
|
(4,976) |
|
|
(5,600) |
|
Proceeds from sales and paydowns of fixed maturities |
|
|
150,932 |
|
|
153,701 |
|
|
179,729 |
|
Proceeds from maturities, redemptions, and calls of fixed maturities |
|
|
110,189 |
|
|
52,253 |
|
|
34,264 |
|
Proceed from sales of equity securities |
|
|
24,380 |
|
|
14,097 |
|
|
14,934 |
|
Proceeds from other invested assets redeemed |
|
|
1,195 |
|
|
— |
|
|
— |
|
Fixed assets purchased |
|
|
(4,041) |
|
|
(1,760) |
|
|
(4,920) |
|
Net cash provided by (used for) investing activities |
|
|
23,845 |
|
|
(48,522) |
|
|
(51,298) |
|
|
|
|
|
|
|
|
|
|
|
|
Cash flows from financing activities: |
|
|
|
|
|
|
|
|
|
|
Proceeds from stock options exercised |
|
|
278 |
|
|
297 |
|
|
2,592 |
|
Excess tax benefit from stock options exercised |
|
|
1 |
|
|
3 |
|
|
— |
|
Dividends paid to shareholders |
|
|
(41,976) |
|
|
(39,302) |
|
|
(36,865) |
|
Acquisition of treasury stock |
|
|
— |
|
|
(23,467) |
|
|
(4,799) |
|
Net cash used for financing activities |
|
|
(41,697) |
|
|
(62,469) |
|
|
(39,072) |
|
|
|
|
|
|
|
|
|
|
|
|
Net increase (decrease) in cash and cash equivalents |
|
|
5,039 |
|
|
(13,422) |
|
|
20,494 |
|
Cash and cash equivalents at beginning of year |
|
|
42,455 |
|
|
55,877 |
|
|
35,383 |
|
Cash and cash equivalents at end of year |
|
$ |
47,494 |
|
$ |
42,455 |
|
$ |
55,877 |
|
|
|
|
|
|
|
|
|
|
|
|
Supplemental disclosure of cash flow information: |
|
|
|
|
|
|
|
|
|
|
Cash paid during the year for: |
|
|
|
|
|
|
|
|
|
|
Federal and state income taxes |
|
$ |
89 |
|
$ |
23,720 |
|
$ |
18,890 |
|
Interest |
|
$ |
75 |
|
$ |
75 |
|
$ |
75 |
The accompanying notes are an integral part of these financial statements.
69
The consolidated financial statements have been prepared on the basis of accounting principles generally accepted in the United States of America (“GAAP”). The consolidated financial statements include Safety Insurance Group, Inc. and its subsidiaries (the “Company”). The subsidiaries consist of Safety Insurance Company, Safety Indemnity Insurance Company, Safety Property and Casualty Insurance Company, Whiteshirts Asset Management Corporation (“WAMC”), and Whiteshirts Management Corporation, which is WAMC’s holding company. All intercompany transactions have been eliminated.
The Company was incorporated on June 25, 2001 in the State of Delaware. On October 16, 2001, the Company acquired all of the issued and outstanding common stock of Thomas Black Corporation (“TBC”) and its property and casualty subsidiaries. TBC subsequently merged with and into Safety Insurance Group, Inc. with Safety Insurance Group, Inc. being the corporation surviving the merger.
The Company is a leading provider of personal lines property and casualty insurance focused primarily on the Massachusetts market. The Company’s principal product line is private passenger automobile insurance, which accounted for 59.6% of its direct written premiums in 2015. The Company operates through its insurance company subsidiaries, Safety Insurance Company, Safety Indemnity Insurance Company, and Safety Property and Casualty Insurance Company (together referred to as the “Insurance Subsidiaries”).
The Insurance Subsidiaries began writing private passenger automobile and homeowners insurance in New Hampshire during 2008, personal umbrella insurance in New Hampshire during 2009, and commercial automobile insurance in New Hampshire during 2011.
2.Summary of Significant Accounting Policies
Investments
Investments in fixed maturities available‑for‑sale, which include taxable and non‑taxable bonds and redeemable preferred stocks, are reported at fair value. Investments in equity securities available‑for‑sale, which include interests in common stocks, mutual funds and a real estate investment trust (“REIT”), are reported at fair value. Fair values for fixed maturity securities are based on estimates obtained from independent pricing services. Fair values for equity securities are derived from external market quotations, with the exception of the REIT whose fair value was determined using the trust’s net asset value obtained from its audited financial statements. Short‑term investments, which consist of U.S. Treasury securities, are reported at amortized cost, which approximates fair value. Other long‑term investments consist of investments in limited partnerships. The partnership interest is accounted for using the equity method of accounting and recorded in earnings from partnership investments. The carrying value of this investment is written down, or impaired, to fair value when a decline in value is considered to be other‑than‑temporary. In applying the equity method (including assessment for other‑than‑temporary impairment), the Company uses financial information provided by the investee, generally on a three month lag. Unrealized gains or losses on fixed maturity and equity securities reported at fair value are excluded from earnings and reported in a separate component of shareholders’ equity, known as “Accumulated other comprehensive income, net of taxes,” until realized. Realized gains or losses on the sale or maturity of investments are determined based on the specific cost identification method. Fixed maturities and equity securities that experience declines in value that are other‑than‑temporary are written down to fair value with a corresponding charge to net impairment losses on investments.
Investment income is recognized on an accrual basis of accounting. Bonds not backed by other loans are amortized using the interest method. Loan‑backed bonds and structured securities are amortized using the interest method and significant changes in estimated cash flows from the original purchase assumptions are accounted for using the retrospective method.
70
Cash and Cash Equivalents
Cash and cash equivalents includes money market accounts and United States (“U.S.”) Treasury bills with original maturities of three months or less from the date of purchase. U.S. Treasury bills are stated at amortized cost, which approximates fair value.
Accounts Receivable
Amounts included in accounts receivable represent premiums as well as finance charges, the majority of which are both billed on a monthly installment basis. Accounts receivable are stated net of allowances for doubtful accounts. At December 31, 2015 and 2014, these allowances were $425 and $462, respectively. Uncollected premium balances over ninety days past due are written off.
Deferred Policy Acquisition Costs
Amounts that vary with and are primarily related to the successful acquisition of a new or renewal insurance contract, principally commissions and premium taxes, are deferred and amortized ratably over the effective period of the policies. All other acquisition expenses are expensed as incurred. Deferred policy acquisition costs are reviewed to determine if they are recoverable from future income, and if not, are charged to expense. Future investment income attributable to related premiums is not taken into account in measuring the recoverability of the carrying value of this asset. Amortization of acquisition costs in the amount of $138,239, $132,526, and $126,201 was charged to underwriting, operating and other expenses for the years ended 2015, 2014 and 2013, respectively.
Equity and Deposits in Pools
Equity and deposits in pools represents the net receivable amounts from the residual market mechanisms, Commonwealth Automobile Reinsurers (“CAR”) for automobile and Massachusetts Property Insurance Underwriting Association (“FAIR Plan”) for homeowner insurance in Massachusetts. See Note 9 for a discussion of the Company’s accounting for amounts assumed from residual markets.
Equipment and Leasehold Improvements
Property, equipment, leasehold improvements, and software which are included in other assets are carried at cost less accumulated depreciation. Depreciation is provided using the straight‑ line or accelerated method over the estimated useful lives of the related assets, which range from 3 to 10 years. Amortization of leasehold improvements is provided using the straight‑line method over the term of the lease. The costs of computer software developed or obtained for internal use are capitalized and amortized over the estimated life of the business system, beginning when the software is ready for its intended use. Maintenance and repairs are charged to expense as incurred.
Losses and Loss Adjustment Expenses
Liabilities for losses and loss adjustment expenses (“LAE”) include case basis estimates for open claims reported prior to year‑end and estimates of unreported claims and claim adjustment expenses, net of salvage and subrogation. The estimates are continually reviewed and modified to reflect current conditions, and any resulting adjustments are reflected in current operating results. Adjustments for anticipated salvage and subrogation are recorded on incurred and reported and incurred but not reported losses.
Premiums and Unearned Premiums
Premiums are earned over the terms of the respective policies, which are generally one year. Unearned premiums represent the portion of premiums written applicable to the unexpired terms of the policies.
71
Ceded premiums are charged to income over the terms of the respective policies and the applicable term of the reinsurance contracts with third‑party reinsurers. Ceded unearned premiums represent the unexpired portion of premiums ceded to CAR and other reinsurers.
Premiums received in advance of the policy effective date are recorded as a liability and not recognized as income until earned. Such amounts are included in accounts payable and accrued liabilities and totaled $14,712 and $14,887 at December 31, 2015 and 2014, respectively.
Reinsurance
Liabilities for unearned premiums and unpaid losses are stated before deductions for ceded reinsurance. The ceded amounts are carried as receivables. Earned premiums are stated net of deductions for ceded reinsurance.
The Company, as primary insurer, will be required to pay losses in their entirety in the event that the reinsurers are unable to discharge their obligations under the reinsurance agreements.
Advertising Costs
Advertising costs are charged to expense when they are incurred. Total advertising costs were $1,906, $2,108 and $2,145 for the years ended December 31, 2015, 2014, and 2013, respectively.
Finance and Other Service Income
Finance and other service income primarily include revenues from premium installment charges, which are recognized when earned.
Income Taxes
The Company and its subsidiaries file a consolidated U.S. federal income tax return. The method of allocation among members of the consolidated group is subject to a written agreement approved by the Board of Directors (the “Board”). The consolidated tax liability (benefit) is allocated on the basis of the members’ proportionate contribution to consolidated taxable income (loss).
Deferred income taxes are generally recognized when assets and liabilities have different values for financial statement and tax reporting purposes, and for other temporary taxable and deductible differences as defined by Accounting Standards Codification (“ASC”) 740, Income Taxes. A valuation allowance is established where management has assessed that it is more likely than not that the Company will not be able to utilize the full deferred tax asset.
Earnings per Weighted Average Common share
Basic (loss) earnings per weighted average common share (“EPS”) are calculated by dividing net (loss) income by the weighted average number of basic common shares outstanding during the period. Diluted (loss) earnings per share amounts are based on the weighted average number of common shares including non-vested performance stock grants and the net effect of potentially dilutive common stock options.
72
The following table sets forth the computation of basic and diluted EPS for the periods indicated.
|
|
|
|
|
|
|
|
Year Ended December 31, |
|
|
|
|
|
|
|
|
|
2015 |
|
|
2014 |
|
|
2013 |
|||
|
Earnings attributable to common shareholders - basic and diluted): |
|
|
|
|
|
|
|
|
|
|
|
|
|
Net (loss) income from continuing operations |
|
$ |
(13,853) |
|
|
$ |
59,354 |
|
|
$ |
61,351 |
|
|
Allocation of income for participating shares |
|
|
- |
|
|
|
(567) |
(1) |
|
|
(762) |
(1) |
|
Net (loss) income from continuing operations attributed to common shareholders |
|
$ |
(13,853) |
|
|
$ |
58,787 |
(1) |
|
$ |
60,589 |
(1) |
|
Earnings per share denominator - basis and diluted |
|
|
|
|
|
|
|
|
|
|
|
|
|
Total weighted average common shares outstanding, including participating shares |
|
|
14,985,475 |
|
|
|
15,107,339 |
|
|
|
15,354,468 |
|
|
Less: weighted average participating shares |
|
|
(118,868) |
|
|
|
(144,292) |
|
|
|
(187,416) |
|
|
Basic earnings per share denominator |
|
|
14,866,607 |
|
|
|
14,963,047 |
(1) |
|
|
15,167,052 |
(1) |
|
Common equivalent shares- stock options |
|
|
- |
(2) |
|
|
2,391 |
|
|
|
5,558 |
|
|
Common equivalent shares- non-vested performance stock grants |
|
|
- |
(3) |
|
|
87,307 |
|
|
|
39,775 |
|
|
Diluted earnings per share denominator |
|
|
14,866,607 |
|
|
|
15,052,745 |
(1) |
|
|
15,212,385 |
(1) |
|
|
|
|
|
|
|
|
|
|
|
|
|
|
|
Basic (loss) earnings per share |
|
$ |
(0.93) |
|
|
$ |
3.93 |
|
|
$ |
3.99 |
|
|
Diluted (loss) earnings per share |
|
$ |
(0.93) |
|
|
$ |
3.91 |
|
|
$ |
3.98 |
|
|
|
|
|
|
|
|
|
|
|
|
|
|
|
|
Undistributed (loss) earnings attributable to common shareholders - basic and diluted: |
|
|
|
|
|
|
|
|
|
|
|
|
|
Net (loss) income from continuing operations attributable to common shareholders -Basic |
|
$ |
(0.93) |
|
|
$ |
3.93 |
|
|
$ |
3.99 |
|
|
Dividends declared |
|
|
(2.80) |
|
|
|
(2.60) |
|
|
|
(2.40) |
|
|
Undistributed (loss) earnings |
|
$ |
(3.73) |
|
|
$ |
1.33 |
|
|
$ |
1.59 |
|
|
|
|
|
|
|
|
|
|
|
|
|
|
|
|
Net (loss) income from continuing operations attributable to common shareholders -Diluted |
|
$ |
(0.93) |
|
|
$ |
3.91 |
|
|
$ |
3.98 |
|
|
Dividends declared |
|
|
(2.80) |
|
|
|
(2.60) |
|
|
|
(2.40) |
|
|
Undistributed (loss) earnings |
|
$ |
(3.73) |
|
|
$ |
1.31 |
|
|
$ |
1.58 |
|
|
|
|
|
|
|
|
|
|
|
|
|
|
|
(1) The 2014 and 2013 basic and diluted earnings per share denominators were revised to correct the allocation of net income to participating securities under the two-class method. The revision did not yield in a change to basic or diluted earnings per share. The Company evaluated the materiality of these revisions in accordance with SEC Staff Accounting Bulletin No. 99, Materiality, and SEC Staff Accounting Bulletin No. 108, Considering the Effects of Prior Year Misstatements When Quantifying Misstatements in Current Year Financial Statements, and concluded that these revisions, individually and in the aggregate, were immaterial to all prior periods. The 2014 basic earnings per share denominator as originally reported was 15,107,339 and the 2014 diluted earnings per share denominator as originally reported was 15,197,036. The 2013 basic earnings per share denominator as originally reported was 15,354,468 and the 2013 diluted earnings per share denominator as originally reported was 15,399,801.
(2) Excludes 1,587 of common equivalent shares related to stock options because their inclusion would be anti dilutive due to the net loss of the Company.
(3) Excludes 46,805 of common equivalent shares related to non-vested performance shares because their inclusion would be anti dilutive due to the net loss of the Company.
Diluted EPS excludes stock options with exercise prices and exercise tax benefits greater than the average market price of the Company’s common stock during the period because their inclusion would be anti‑dilutive. There were no anti‑dilutive stock options or non-vested performance stock grants for the years ended December 31, 2015, 2014 and 2013.
Share‑Based Compensation
Accounting Standards Codification (“ASC”) 718, Compensation —Stock Compensation requires the Company to measure and recognize the cost of employee services received in exchange for an award of equity instruments. Under the provisions of ASC 718, share-based compensation cost is measured at the grant date, based on the fair value of the award, and is recognized as an expense over the requisite service period (generally the vesting period of the equity grant).
See Note 6 for further information regarding share‑based compensation.
73
Use of Estimates
The preparation of financial statements in conformity with GAAP requires management to make estimates and assumptions that affect the reported amounts of assets and liabilities and disclosure of contingent assets and liabilities at the date of the financial statements and reported amounts of revenues and expenses during the reporting period. Actual results could differ from those estimates.
Recent Accounting Pronouncements
In January 2016, the FASB issued ASU 2016-01, Financial Instruments-Overall (Subtopic 825-10), Recognition and Measurement of Financial Assets and Financial Liabilities (“ASU 2016-01”). The amendments in this ASU update address certain aspects of recognition, measurement, presentation and disclosure of financial instruments. ASU 2016-01: (1) requires equity investments (except those accounted for under the equity method or those that result in the consolidation of the investee) to be measured at fair value with changes in the fair value recognized in net income; (2) simplifies the impairment assessment of equity investments without readily determinable fair values by requiring a qualitative assessment to identify impairment; (3) requires the use of the exit price notion when measuring the fair value of financial instruments for disclosure purposes; and (4) requires separate presentation of financial assets and financial liabilities by measurement category and form of financial asset on the balance sheet or the notes to the financial statements. These amendments are effective for fiscal years beginning after December 15, 2017, including interim periods within those fiscal years. The impact of the adoption of ASU 2016-01 to the Company’s financial position and results of operations is currently being evaluated.
In May 2015, the FASB issued ASU 2015-09, Disclosures about Short-Duration Contracts (“ASU 2015-09”). ASU 2015-09 requires companies that issue short duration contracts to disclose additional information, including: (i) incurred and paid claims development tables; (ii) frequency and severity of claims; and (iii) information about material changes in judgments made in calculating the liability for unpaid claim adjustment expenses, including reasons for the change and the effects on the financial statements. ASU 2015-09 is effective for annual periods beginning after December 15, 2015, and interim periods within annual periods beginning after December 15, 2016. The amendments in ASU 2015-09 should be applied retrospectively by providing comparative disclosures for each period presented, except for those requirements that apply only to the current period. As the requirements of this literature are disclosure only, the application of this guidance will not impact our financial condition, results of operations or cash flows.
In May 2015, the FASB issued ASU 2015-07, Fair Value Measurement Disclosures for Investments in Certain Entities that Calculate Net Asset Value per Share (or Its Equivalent) (“ASU 2015-07”). ASU 2015-07 removes the requirement to categorize within the fair value hierarchy all investments for which fair value is measured using the net asset value per share practical expedient. The reporting entity should continue to disclose information on investments for which fair value is measured at net asset value (or its equivalent) as a practical expedient to help users understand the nature and risks of the investments and whether the investments, if sold, are probable of being sold at amounts different from net asset value. ASU 2015-07 is effective for fiscal years beginning after December 31, 2015. Early adoption is allowed and the reporting entity should apply ASU 2015-07 retrospectively to all periods presented. The Company does not expect the adoption of ASU 2015-07 to have a material impact on its financial position, results of operations or cash flows.
In April 2015, the FASB issued ASU No. 2015-03, Imputation of Interest (“ASU 2015-03”). ASU 2015-03 simplifies the presentation of debt issuance costs as the amendments in this update require that debt issuance costs be presented in the balance sheet as a direct deduction from the carrying amount of debt liability, consistent with debt discounts or premiums. The recognition and measurement guidance for debt issuance costs are not affected by the amendments in this update. ASU 2015-03 is effective for annual and interim reporting periods beginning after December 15, 2015. Early adoption is permitted for financial statements that have not been previously issued. The standard requires a retrospective approach where the balance sheet of each individual period presented should be adjusted to reflect the period-specific effects of applying the new guidance. The standard also requires compliance with applicable disclosures for a change in an accounting principle. The Company does not expect the adoption of ASU 2015-03 to have a material impact on its financial position, results of operations or cash flows.
74
In August 2014, the FASB issued ASU No. 2014-15, “Presentation of Financial Statements – Going Concern (Subtopic 205-40): Disclosures of Uncertainties about an Entity’s Ability as a Going Concern” (“ASU 2014-15”). ASU 2014-15 provides guidance on determining when and how to disclose going concern uncertainties in the financial statements, and requires management to perform interim and annual assessments of an entity’s ability to continue as a going concern within one year of the date the financial statements are issued. ASU 2014-15 is effective for annual periods ending after December 15, 2016 and interim periods thereafter. Early adoption is permitted. The Company does not expect the adoption of ASU 2014-15 to have a material impact on its financial position, results of operations, or cash flows.
In June 2014, the FASB issued ASU No. 2014-12, "Compensation—Stock Compensation (Topic 718): Accounting for Share-Based Payments When the Terms of an Award Provide That a Performance Target Could Be Achieved After the Requisite Service Period" ("ASU 2014-12”), which revises the accounting treatment for stock compensation tied to performance targets. ASU 2014-12 is effective for calendar years beginning after December 15, 2015. The Company does not expect the adoption of ASU 2014-12 to have a material impact on its financial position, results of operations or cash flows.
In May 2014, the FASB issued as final, ASU 2014-09, “Revenue from Contracts with Customers (Topic 606)” which supersedes virtually all existing revenue recognition guidance under GAAP. The update's core principle is that an entity should recognize revenue to depict the transfer of promised goods or services to customers in an amount that reflects the consideration to which the entity expects to be entitled in exchange for those goods or services. The update is effective for interim and annual reporting periods in fiscal years beginning after December 15, 2017 and allows early adoption. ASU 2014-09 allows for the use of either the retrospective or modified retrospective approach of adoption. The Company does not expect the adoption of ASU 2014-09 to have a material impact on its financial position, results of operations, or cash flows.
Segments
The Company comprises one business segment: property and casualty insurance operations. Management organizes the business around private passenger automobile insurance in Massachusetts sold exclusively through independent agents and offers other personal and commercial insurance as complementary products. In accordance with ASC 280, Segment Reporting, the financial information of the segment is presented consistent with the way results are regularly evaluated by the chief operating decision maker in deciding how to allocate resources and in assessing performance.
3.Investments
The gross unrealized gains and losses on investments in fixed maturity securities, including redeemable preferred stocks that have characteristics of fixed maturities, and equity securities, including interests in mutual funds, and other invested assets, were as follows for the periods indicated.
|
|
|
As of December 31, 2015 |
|||||||||||||
|
|
|
|
|
|
|
|
|
Gross Unrealized Losses (3) |
|
|
|
||||
|
|
|
Cost or |
|
Gross |
|
Non-OTTI |
|
OTTI |
|
Estimated |
|||||
|
|
|
Amortized |
|
Unrealized |
|
Unrealized |
|
Unrealized |
|
Fair |
|||||
|
|
|
Cost |
|
Gains |
|
Losses |
|
Losses (4) |
|
Value |
|||||
|
U.S. Treasury securities |
|
$ |
1,805 |
|
$ |
— |
|
$ |
(4) |
|
$ |
— |
|
$ |
1,801 |
|
Obligations of states and political subdivisions |
|
|
377,188 |
|
|
21,160 |
|
|
(426) |
|
|
— |
|
|
397,922 |
|
Residential mortgage-backed securities (1) |
|
|
237,896 |
|
|
5,188 |
|
|
(1,628) |
|
|
— |
|
|
241,456 |
|
Commercial mortgage-backed securities |
|
|
28,851 |
|
|
30 |
|
|
(218) |
|
|
— |
|
|
28,663 |
|
Other asset-backed securities |
|
|
24,037 |
|
|
39 |
|
|
(145) |
|
|
— |
|
|
23,931 |
|
Corporate and other securities |
|
|
394,194 |
|
|
4,191 |
|
|
(10,521) |
|
|
— |
|
|
387,864 |
|
Subtotal, fixed maturity securities |
|
|
1,063,971 |
|
|
30,608 |
|
|
(12,942) |
|
|
— |
|
|
1,081,637 |
|
Equity securities (2) |
|
|
102,541 |
|
|
13,498 |
|
|
(5,835) |
|
|
— |
|
|
110,204 |
|
Other invested assets (5) |
|
|
17,602 |
|
|
— |
|
|
— |
|
|
— |
|
|
17,602 |
|
Totals |
|
$ |
1,184,114 |
|
$ |
44,106 |
|
$ |
(18,777) |
|
$ |
— |
|
$ |
1,209,443 |
75
|
|
|
As of December 31, 2014 |
|
|||||||||||||
|
|
|
|
|
|
|
|
|
Gross Unrealized Losses (3) |
|
|
|
|
||||
|
|
|
Cost or |
|
Gross |
|
Non-OTTI |
|
OTTI |
|
Estimated |
|
|||||
|
|
|
Amortized |
|
Unrealized |
|
Unrealized |
|
Unrealized |
|
Fair |
|
|||||
|
|
|
Cost |
|
Gains |
|
Losses |
|
Losses (4) |
|
Value |
|
|||||
|
U.S. Treasury securities |
|
$ |
1,507 |
|
$ |
— |
|
$ |
(1) |
|
$ |
— |
|
$ |
1,506 |
|
|
Obligations of states and political subdivisions |
|
|
437,299 |
|
|
23,562 |
|
|
(536) |
|
|
— |
|
|
460,325 |
|
|
Residential mortgage-backed securities (1) |
|
|
201,950 |
|
|
7,015 |
|
|
(1,282) |
|
|
— |
|
|
207,683 |
|
|
Commercial mortgage-backed securities |
|
|
34,216 |
|
|
256 |
|
|
(34) |
|
|
— |
|
|
34,438 |
|
|
Other asset-backed securities |
|
|
10,204 |
|
|
48 |
|
|
(2) |
|
|
— |
|
|
10,250 |
|
|
Corporate and other securities |
|
|
417,341 |
|
|
7,536 |
|
|
(3,628) |
|
|
— |
|
|
421,249 |
|
|
Subtotal, fixed maturity securities |
|
|
1,102,517 |
|
|
38,417 |
|
|
(5,483) |
|
|
— |
|
|
1,135,451 |
|
|
Equity securities (2) |
|
|
97,910 |
|
|
13,332 |
|
|
(2,089) |
|
|
— |
|
|
109,153 |
|
|
Other invested assets (5) |
|
|
11,657 |
|
|
— |
|
|
— |
|
|
|
|
|
11,657 |
|
|
Totals |
|
$ |
1,212,084 |
|
$ |
51,749 |
|
$ |
(7,572) |
|
$ |
— |
|
$ |
1,256,261 |
|
|
(1) |
Residential mortgage‑backed securities consists primarily of obligations of U.S. Government agencies including collateralized mortgage obligations issued, guaranteed and/or insured by the following issuers: Government National Mortgage Association (GNMA), Federal Home Loan Mortgage Corporation (FHLMC), Federal National Mortgage Association (FNMA) and the Federal Home Loan Bank (FHLB). |
|
(2) |
Equity securities include interests in mutual funds held to fund the Company’s executive deferred compensation plan. |
|
(3) |
The Company’s investment portfolio included 514 and 366 securities in an unrealized loss position at December 31, 2015 and December 31, 2014, respectively. |
|
(4) |
Amounts in this column represent other‑than‑temporary impairment (“OTTI”) recognized in accumulated other comprehensive income. |
|
(5) |
Other invested assets are accounted for under the equity method which approximates fair value. |
The amortized cost and the estimated fair value of fixed maturity securities, by maturity, are shown below for the period indicated. Expected maturities will differ from contractual maturities because borrowers may have the right to call or prepay obligations with or without call or prepayment penalties.
|
|
|
As of December 31, 2015 |
||||
|
|
|
Amortized |
|
Estimated |
||
|
|
|
Cost |
|
Fair Value |
||
|
Due in one year or less |
|
$ |
51,013 |
|
$ |
51,336 |
|
Due after one year through five years |
|
|
270,475 |
|
|
269,405 |
|
Due after five years through ten years |
|
|
168,304 |
|
|
165,061 |
|
Due after ten years through twenty years |
|
|
279,596 |
|
|
297,754 |
|
Due after twenty years |
|
|
3,799 |
|
|
4,029 |
|
Asset-backed securities |
|
|
290,784 |
|
|
294,052 |
|
Totals |
|
$ |
1,063,971 |
|
$ |
1,081,637 |
The gross realized gains and losses on sales of investments were as follows for the periods indicated.
|
|
|
Year Ended December 31, |
|||||||
|
|
|
2015 |
|
2014 |
|
2013 |
|||
|
Gross realized gains |
|
|
|
|
|
|
|
|
|
|
Fixed maturity securities |
|
$ |
496 |
|
$ |
644 |
|
$ |
854 |
|
Equity securities |
|
|
2,727 |
|
|
1,534 |
|
|
1,011 |
|
Gross realized losses |
|
|
|
|
|
|
|
|
|
|
Fixed maturity securities |
|
|
(3,315) |
|
|
(1,651) |
|
|
(141) |
|
Equity securities |
|
|
(377) |
|
|
(330) |
|
|
(47) |
|
Net realized (losses) gains on investments |
|
$ |
(469) |
|
$ |
197 |
|
$ |
1,677 |
In the normal course of business, the Company enters into transactions involving various types of financial instruments, including investments in fixed maturities and equity securities. Investment transactions have credit exposure to the extent that a counter party may default on an obligation to the Company. Credit risk is a consequence of carrying, trading and investing in securities. To manage credit risk, the Company focuses on higher quality fixed income
76
securities, reviews the credit strength of all companies in which it invests, limits its exposure in any one investment and monitors the portfolio quality, taking into account credit ratings assigned by recognized statistical rating organizations.
The following tables as of December 31, 2015 and 2014 present the gross unrealized losses included in the Company’s investment portfolio and the fair value of those securities aggregated by investment category. The tables also present the length of time that they have been in a continuous unrealized loss position.
|
|
|
As of December 31, 2015 |
|
||||||||||||||||
|
|
|
Less than 12 Months |
|
12 Months or More |
|
Total |
|
||||||||||||
|
|
|
Estimated |
|
Unrealized |
|
Estimated |
|
Unrealized |
|
Estimated |
|
Unrealized |
|
||||||
|
|
|
Fair Value |
|
Losses |
|
Fair Value |
|
Losses |
|
Fair Value |
|
Losses |
|
||||||
|
U.S. Treasury securities |
|
$ |
1,801 |
|
$ |
4 |
|
$ |
— |
|
$ |
— |
|
$ |
1,801 |
|
$ |
4 |
|
|
Obligations of states and political subdivisions |
|
|
34,837 |
|
|
342 |
|
|
4,777 |
|
|
84 |
|
|
39,614 |
|
|
426 |
|
|
Residential mortgage-backed securities |
|
|
85,561 |
|
|
860 |
|
|
32,845 |
|
|
768 |
|
|
118,406 |
|
|
1,628 |
|
|
Commercial mortgage-backed securities |
|
|
26,113 |
|
|
218 |
|
|
— |
|
|
— |
|
|
26,113 |
|
|
218 |
|
|
Other asset-backed securities |
|
|
14,454 |
|
|
145 |
|
|
— |
|
|
— |
|
|
14,454 |
|
|
145 |
|
|
Corporate and other securities |
|
|
173,493 |
|
|
5,528 |
|
|
33,522 |
|
|
4,993 |
|
|
207,015 |
|
|
10,521 |
|
|
Subtotal, fixed maturity securities |
|
|
336,259 |
|
|
7,097 |
|
|
71,144 |
|
|
5,845 |
|
|
407,403 |
|
|
12,942 |
|
|
Equity securities |
|
|
19,409 |
|
|
1,739 |
|
|
12,054 |
|
|
4,096 |
|
|
31,463 |
|
|
5,835 |
|
|
Total temporarily impaired securities |
|
$ |
355,668 |
|
$ |
8,836 |
|
$ |
83,198 |
|
$ |
9,941 |
|
$ |
438,866 |
|
$ |
18,777 |
|
|
|
|
As of December 31, 2014 |
|
||||||||||||||||
|
|
|
Less than 12 Months |
|
12 Months or More |
|
Total |
|
||||||||||||
|
|
|
Estimated |
|
Unrealized |
|
Estimated |
|
Unrealized |
|
Estimated |
|
Unrealized |
|
||||||
|
|
|
Fair Value |
|
Losses |
|
Fair Value |
|
Losses |
|
Fair Value |
|
Losses |
|
||||||
|
U.S. Treasury securities |
|
$ |
— |
|
$ |
— |
|
$ |
1,506 |
|
$ |
1 |
|
$ |
1,506 |
|
$ |
1 |
|
|
Obligations of states and political subdivisions |
|
|
65,174 |
|
|
489 |
|
|
3,553 |
|
|
47 |
|
|
68,727 |
|
|
536 |
|
|
Residential mortgage-backed securities |
|
|
18,853 |
|
|
44 |
|
|
47,769 |
|
|
1,238 |
|
|
66,622 |
|
|
1,282 |
|
|
Commercial mortgage-backed securities |
|
|
10,485 |
|
|
34 |
|
|
— |
|
|
— |
|
|
10,485 |
|
|
34 |
|
|
Other asset-backed securities |
|
|
1,999 |
|
|
2 |
|
|
— |
|
|
— |
|
|
1,999 |
|
|
2 |
|
|
Corporate and other securities |
|
|
119,722 |
|
|
3,079 |
|
|
37,469 |
|
|
549 |
|
|
157,191 |
|
|
3,628 |
|
|
Subtotal, fixed maturity securities |
|
|
216,233 |
|
|
3,648 |
|
|
90,297 |
|
|
1,835 |
|
|
306,530 |
|
|
5,483 |
|
|
Equity securities |
|
|
16,119 |
|
|
1,986 |
|
|
1,277 |
|
|
103 |
|
|
17,396 |
|
|
2,089 |
|
|
Total temporarily impaired securities |
|
$ |
232,352 |
|
$ |
5,634 |
|
$ |
91,574 |
|
$ |
1,938 |
|
$ |
323,926 |
|
$ |
7,572 |
|
Other‑Than‑Temporary Impairments
ASC 320, Investments—Debt and Equity Securities requires entities to separate an OTTI of a debt security into two components when there are credit related losses associated with the impaired debt security for which the Company asserts that it does not have the intent to sell the security, and it is more likely than not that it will not be required to sell the security before recovery of its cost basis. Under ASC 320, the amount of the OTTI related to a credit loss is recognized in earnings, and the amount of the OTTI related to other factors is recorded as a component of other comprehensive income (loss). In instances where no credit loss exists but it is more likely than not that the Company will have to sell the debt security prior to the anticipated recovery, the decline in market value below amortized cost is recognized as an OTTI in earnings. In periods after the recognition of an OTTI on debt securities, the Company accounts for such securities as if they had been purchased on the measurement date of the OTTI at an amortized cost basis equal to the previous amortized cost basis less the OTTI recognized in earnings. For debt securities for which OTTI was recognized in earnings, the difference between the new amortized cost basis and the cash flows expected to be collected will be accreted or amortized into net investment income.
The Company holds no subprime mortgage debt securities. All of the Company’s holdings in mortgage‑backed securities are either U.S. Government or Agency guaranteed or are rated investment grade by either Moody’s or Standard & Poor’s.
The unrealized losses in the Company’s fixed income and equity portfolio as of December 31, 2015 were reviewed for potential other-than-temporary asset impairments. The Company held four debt securities at December 31, 2015 with a material (20% or greater) unrealized loss for four or more consecutive quarters that additionally had certain
77
qualitative factors that led to an impairment charge. As a result of our analysis, during the year ended December 31, 2015, the Company recognized OTTI of $796 which consisted entirely of credit losses related to fixed maturity securities. There was no OTTI related to fixed maturity securities during the year ended December 31, 2014.
Specific qualitative analysis was also performed for any additional securities appearing on the Company’s “Watch List,” if any. Qualitative analysis considered such factors as the financial condition and the near term prospects of the issuer, whether the debtor is current on its contractually obligated interest and principal payments, changes to the rating of the security by a rating agency and the historical volatility of the fair value of the security.
The qualitative analysis performed by the Company concluded that outside of the securities that were recognized through OTTI, the unrealized losses recorded on the investment portfolio at December 31, 2015 resulted from fluctuations in market interest rates and other temporary market conditions as opposed to fundamental changes in the credit quality of the issuers of such securities. Therefore, decreases in fair values of the Company’s securities are viewed as being temporary.
The following table summarizes the credit loss recognized in earnings related to fixed maturity securities
|
|
|
|
Year Ended December 31, |
||||
|
|
|
|
2015 |
|
2014 |
||
|
Credit losses on fixed maturity securities, beginning of period |
|
$ |
- |
|
$ |
- |
|
|
|
Add: credit losses on OTTI not previously recognized |
|
|
796 |
|
|
- |
|
|
Less: credit losses on securities sold |
|
|
- |
|
|
- |
|
|
Less: credit losses on securities impaired due to intent to sell |
|
|
- |
|
|
- |
|
|
Add: credit losses on previously impaired securities |
|
|
- |
|
|
- |
|
|
Less: increases in cash flows expected on previously impaired securities |
|
|
- |
|
|
- |
|
Credit losses on fixed maturity securities, end of period |
|
$ |
796 |
|
$ |
- |
|
|
|
|
|
|
|
|
|
|
At December 31, 2015 and December 31, 2014, there were no amounts included in accumulated other comprehensive income related to securities which were considered by the Company to be other‑than‑temporarily impaired.
Based upon the qualitative analysis performed, the Company’s decision to hold these securities, the Company’s current level of liquidity and its positive operating cash flows, management believes it is more likely than not that it will not be required to sell any of its securities before the anticipated recovery in the fair value to its amortized cost basis.
Net Investment Income
The components of net investment income were as follow for the periods indicated.
|
|
|
Year Ended December 31, |
|||||||
|
|
|
2015 |
|
2014 |
|
2013 |
|||
|
Interest on fixed maturity securities |
|
$ |
38,794 |
|
$ |
40,717 |
|
$ |
43,328 |
|
Dividends on equity securities |
|
|
3,362 |
|
|
3,428 |
|
|
1,829 |
|
Equity in earnings of other invested assets |
|
|
918 |
|
|
685 |
|
|
148 |
|
Interest on other assets |
|
|
74 |
|
|
79 |
|
|
139 |
|
Interest on cash and cash equivalents |
|
|
11 |
|
|
10 |
|
|
18 |
|
Total Investment Income |
|
|
43,159 |
|
|
44,919 |
|
|
45,462 |
|
Investment expenses |
|
|
2,625 |
|
|
2,616 |
|
|
2,408 |
|
Net investment income |
|
$ |
40,534 |
|
$ |
42,303 |
|
$ |
43,054 |
78
4.Equipment and Leasehold Improvements
The carrying value of equipment and leasehold improvements by classification was as follows for the periods indicated.
|
|
|
As of December 31, |
|||||
|
|
|
2015 |
|
2014 |
|
||
|
Software |
|
$ |
25,292 |
|
$ |
21,748 |
|
|
Computer equipment |
|
|
7,260 |
|
|
6,807 |
|
|
Leasehold improvements |
|
|
2,524 |
|
|
2,524 |
|
|
Other equipment |
|
|
2,428 |
|
|
2,400 |
|
|
Furniture and fixtures |
|
|
1,331 |
|
|
1,316 |
|
|
Total cost |
|
|
38,835 |
|
|
34,795 |
|
|
Less accumulated depreciation and amortization |
|
|
30,417 |
|
|
26,510 |
|
|
Equipment and leasehold improvements, net |
|
$ |
8,418 |
|
$ |
8,285 |
|
Depreciation and amortization expense for the years ended December 31, 2015, 2014, and 2013 was $3,907, $4,133, and $3,974, respectively.
5.Employee Benefit Plan
The Company sponsors the Safety Insurance Company 401(k) qualified defined contribution retirement plan (the “Retirement Plan”). The Retirement Plan is available to all eligible employees of the Company. An employee must be 21 years of age to be eligible to participate in the Retirement Plan and is allowed to contribute on a pre‑tax basis up to the maximum allowed under federal law. The Retirement Plan is administered by the Company and is subject to the provisions of the Employee Retirement Income Security Act of 1974. At the close of each Retirement Plan year, the Company makes a matching contribution equal to 100% of the amount each participant contributed during the plan year from their total pay, up to a maximum amount of 8% of the participant’s base salary, to those participants who have contributed to the Retirement Plan and were employed on the last day of the Retirement Plan year. Compensation expense related to the Retirement Plan was $3,019, $2,775, and $2,649 for the years ended December 31, 2015, 2014, and 2013, respectively.
6.Share‑Based Compensation
Management Omnibus Incentive Plan
Long-term incentive compensation is provided under the Company’s 2002 Management Omnibus Incentive Plan (“the Incentive Plan”) which provides for a variety of share-based compensation awards, including nonqualified stock options, incentive stock options, stock appreciation rights and restricted stock (“RS”) awards.
The maximum number of shares of common stock with respect to which awards may be granted is 2,500,000. The Incentive Plan was amended in March of 2013 to remove "share recycling" plan provisions. Hence, shares of stock covered by an award under the Incentive Plan that are forfeited are no longer available for issuance in connection with 2013 and future grants of awards. At December 31, 2015, there were 369,755 shares available for future grant. The Board of Directors and the Compensation Committee intend to issue more awards under the Incentive Plan in the future.
For the years ended December 31, 2015, 2014, and 2013, the Company recorded compensation expense related to awards under the Incentive Plan of $2,423, $2,981, and $2,954, net of income tax benefit of $1,304, $1,605, and $1,591, respectively.
79
Stock Options
The following table summarizes stock option activity under the Incentive Plan.
|
|
|
Years Ended December 31, |
|||||||||||||
|
|
|
2015 |
|
2014 |
|
2013 |
|||||||||
|
|
|
Shares |
|
Weighted |
|
Shares |
|
Weighted |
|
Shares |
|
Weighted |
|||
|
|
|
Under |
|
Average |
|
Under |
|
Average |
|
Under |
|
Average |
|||
|
|
|
Option |
|
Exercise Price |
|
Option |
|
Exercise Price |
|
Option |
|
Exercise Price |
|||
|
Outstanding at beginning of year |
$ |
12,700 |
|
$ |
42.85 |
$ |
20,200 |
|
$ |
41.64 |
$ |
87,500 |
|
$ |
39.24 |
|
Exercised |
|
(6,500) |
|
|
42.85 |
|
(7,500) |
|
|
39.60 |
|
(67,300) |
|
|
38.52 |
|
Forfeited |
|
— |
|
|
— |
|
— |
|
|
— |
|
— |
|
|
— |
|
Outstanding at end of period |
|
6,200 |
|
|
42.85 |
|
12,700 |
|
|
42.85 |
|
20,200 |
|
|
41.64 |
|
Exercisable at end of period |
$ |
6,200 |
|
$ |
42.85 |
$ |
12,700 |
|
$ |
42.85 |
$ |
20,200 |
|
$ |
41.64 |
At December 31, 2015, 2014, and 2013, the aggregate intrinsic value of outstanding shares under option was $84, $269, and $296 with a weighted average remaining contractual term of 0.2, 1.2, and 2.1 years, respectively. Aggregate intrinsic value represents the total pretax intrinsic value, which is the difference between the fair value based upon the Company’s closing year‑ end stock price at December 31, 2015, 2014, and 2013 and the exercise price which would have been received by the option holders had all option holders exercised their options as of those dates. The exercise price on stock options outstanding under the Incentive Plan was $42.85 at December 31, 2015 and December 31, 2014. The range of exercise prices on stock options outstanding under the Incentive Plan was $18.50 to $42.85 at December 31, 2013. The total intrinsic value of options exercised during the years ended December 31, 2015, 2014, and 2013 was $138, $183, and $1,197, respectively.
Restricted Stock
Service-based restricted stock awarded in the form of unvested shares is recorded at the market value of the Company’s common stock on the grant date and amortized ratably as compensation expense over the requisite service period. Service-based restricted stock awards generally vest over a three-year period and vest 30% on the first and second anniversaries of the grant date and 40% on the third anniversary of the grant date, except for non-executive employees’ restricted stock awards which vest ratably over a five-year service period and independent directors’ stock awards which vest immediately. Our independent directors are subject to stock ownership guidelines, which require them to have a value equal to four times their annual cash retainer.
In addition to service-based awards, the Company grants performance-based restricted shares to certain employees. These performance shares cliff vest after a three-year performance period provided certain performance measures are attained. A portion of these awards, which contain a market condition, vest according to the level of total shareholder return achieved by the Company compared to its property-casualty insurance peers over a three-year period. The remainders, which contain a performance condition, vest according to the level of Company’s combined ratio results compared to a target based on its property-casualty insurance peers.
Actual payouts can range from 0% to 200% of target shares awarded depending upon the level of achievement of the respective market and performance conditions during a three fiscal-year performance period. Compensation expense for share awards with a performance condition is based on the probable number of awards expected to vest using the performance level most likely to be achieved at the end of the performance period.
Performance-based awards with market conditions are accounted for and measured differently from awards that have a performance or service condition. The effect of a market condition is reflected in the award’s fair value on the grant date. That fair value is recognized as compensation cost over the requisite service period regardless of whether the market-based performance objective has been satisfied.
All of the Company’s restricted stock awards are issued as incentive compensation and are equity classified.
The following table summarizes restricted stock activity under the Incentive Plan assuming a target payout for
80
the performance-based shares.
|
|
|
Years Ended December 31, |
||||||||||||||
|
|
|
2015 |
|
2014 |
|
2013 |
|
|||||||||
|
|
|
Shares |
|
Weighted |
|
Shares |
|
Weighted |
|
Shares |
|
Weighted |
|
|||
|
|
|
Under |
|
Average |
|
Under |
|
Average |
|
Under |
|
Average |
|
|||
|
|
|
Restriction |
|
Fair Value |
|
Restriction |
|
Fair Value |
|
Restriction |
|
Fair Value |
|
|||
|
Outstanding at beginning of year |
|
176,116 |
|
$ |
46.38 |
|
211,234 |
|
$ |
43.51 |
|
263,883 |
|
$ |
41.47 |
|
|
Granted |
|
46,943 |
|
|
61.57 |
|
50,781 |
|
|
53.94 |
|
57,632 |
|
|
47.87 |
|
|
Vested and unrestricted |
|
(108,130) |
|
|
44.51 |
|
(81,149) |
|
|
43.80 |
|
(103,788) |
|
|
40.75 |
|
|
Forfeited |
|
(2,905) |
|
|
49.94 |
|
(4,750) |
|
|
44.46 |
|
(6,493) |
|
|
43.48 |
|
|
Outstanding at end of period |
|
112,024 |
|
$ |
54.44 |
|
176,116 |
|
$ |
46.38 |
|
211,234 |
|
$ |
43.51 |
|
|
|
|
|
|
|
|
|
|
|
|
|
|
|
|
|
|
|
|
|
|
Years Ended December 31, |
|
|||||||||||||
|
|
|
2015 |
|
2014 |
|
2013 |
|
|||||||||
|
|
|
Performance-based |
|
Weighted |
|
Performance-based |
|
Weighted |
|
Performance-based |
|
Weighted |
|
|||
|
|
|
Shares Under |
|
Average |
|
Shares Under |
|
Average |
|
Shares Under |
|
Average |
|
|||
|
|
|
Restriction |
|
Fair Value |
|
Restriction |
|
Fair Value |
|
Restriction |
|
Fair Value |
|
|||
|
Outstanding at beginning of year |
|
64,724 |
|
$ |
50.40 |
|
37,456 |
|
$ |
44.13 |
|
— |
|
$ |
— |
|
|
Granted |
|
37,722 |
|
|
63.62 |
|
29,903 |
|
|
57.94 |
|
37,456 |
|
|
44.13 |
|
|
Vested and unrestricted |
|
— |
|
|
— |
|
— |
|
|
— |
|
— |
|
|
— |
|
|
Forfeited |
|
(3,345) |
|
|
46.91 |
|
(2,635) |
|
|
46.96 |
|
— |
|
|
— |
|
|
Outstanding at end of period |
|
99,101 |
|
$ |
55.55 |
|
64,724 |
|
$ |
50.40 |
|
37,456 |
|
$ |
44.13 |
|
As of December 31, 2015, there was $5,607 of unrecognized compensation expense related to non‑vested restricted stock awards that is expected to be recognized over a weighted average period of 1.7 years. The total fair value of the shares that were vested and unrestricted during the years ended December 31, 2015, 2014, and 2013 was $2,897, $3,554, and $4,230, respectively.
7.Commitments and Contingencies
Lease Commitments
The Company has various non‑cancelable long‑term operating leases. The approximate minimum annual rental payments due under these lease agreements as of December 31, 2015 are presented in the following table.
|
2016 |
$ |
4,006 |
|
|
2017 |
|
3,946 |
|
|
2018 |
|
3,915 |
|
|
2019 |
|
123 |
|
|
Total minimum lease payments |
$ |
11,990 |
|
|
|
|
|
|
Certain lease agreements contain renewal options and, in addition to the minimum annual rentals, generally provide for payment of a share of the real estate taxes and operating expenses in excess of a base amount. Rental expense was $4,293, $4,236, and $4,150 for the years ended December 31, 2015, 2014, and 2013, respectively. All leases expire prior to 2020. The Company expects that in the normal course of business, leases that expire will be renewed.
An eighth amendment to a lease agreement for the lease of office space was executed on April 5, 2007. Under the provisions of this amendment, additional space was occupied and the lease term was extended an additional ten years commencing on January 1, 2009, with an option to renew for one additional five‑year term.
At December 31, 2015, the Company has software purchase commitments of $519.
81
As part of the Company’s investment activity, we have committed $40,000 to investments in limited partnerships. The Company has contributed $15,400 to these commitments as of December 31, 2015. As of December 31, 2015, the remaining committed capital due to be called is $24,600.
Contingencies
On December 15, 2015, the Company filed for arbitration with a reinsurer in regards to the reinsurance recoverable resulting from the 2015 winter storm losses that are admissible under our contract. The total amount of recoverable in dispute, which is based on our total incurred loss, is $22,838. No provision for collectability has been recorded in the financial statements as we believe the recoverable is valid and will be recovered.
Various claims, generally incidental to the conduct of normal business, are pending or alleged against the Company from time to time. In the opinion of management, based in part on the advice of legal counsel, the ultimate resolution of such claims will not have a material adverse effect on the Company’s consolidated financial statements. However, if estimates of the ultimate resolutions of those proceedings are revised, liabilities related to those proceedings could be adjusted in the near term.
Massachusetts law requires that insurers licensed to do business in Massachusetts participate in the Massachusetts Insurers Insolvency Fund (“Insolvency Fund”). Members of the Insolvency Fund are assessed a proportionate share of the obligations and expenses of the Insolvency Fund in connection with an insolvent insurer. It is anticipated that there will be additional assessments from time to time relating to various insolvencies. Although the timing and amounts of any future assessments are not known, based upon existing knowledge, management’s opinion is that such future assessments will not have a material effect upon the financial position of the Company.
8.Debt
The Company has a Revolving Credit Agreement (the “Credit Agreement”) with RBS Citizens, NA (“RBS Citizens”). The Credit Agreement provides a $30,000 revolving credit facility with an accordion feature allowing for future expansion of the committed amount up to $50,000. Loans under the credit facility bear interest at the Company’s option at either (i) the LIBOR rate plus 1.25% per annum or (ii) the higher of RBS Citizens prime rate or 0.5% above the federal funds rate plus 1.25% per annum. Interest only is payable prior to maturity. The Credit Agreement has a maturity date of August 14, 2018.
The Company’s obligations under the credit facility are secured by pledges of its assets and the capital stock of its operating subsidiaries. The credit facility is guaranteed by the Company’s non‑insurance company subsidiaries. The credit facility contains covenants including requirements to maintain minimum risk‑based capital ratios and statutory surplus of Safety Insurance Company as well as limitations or restrictions on indebtedness, liens, and other matters. As of December 31, 2015, the Company was in compliance with all covenants. In addition, the credit facility includes customary events of default, including a cross‑default provision permitting the lenders to accelerate the facility if the Company (i) defaults in any payment obligation under debt having a principal amount in excess of $10,000 or (ii) fails to perform any other covenant permitting acceleration of all such debt.
The Company had no amounts outstanding on its credit facility at December 31, 2015 or 2014. The credit facility commitment fee included in interest expenses was computed at a rate of 0.25% per annum on the $30,000 commitment at December 31, 2015 and 2014.
The Company became a member of the FHLB-Boston during the quarter ended September 30, 2014. Membership in the FHLB-Boston allows the Company to borrow money at competitive interest rates provided the loan is collateralized by specific U.S Government residential mortgage backed securities. At December 31, 2015, the Company has the ability to borrow approximately $180,139 using eligible invested assets that would be used as collateral. The Company has no amounts outstanding from the FHLB-Boston at December 31, 2015.
82
9.Reinsurance
The Company cedes insurance to CAR and to other reinsurers. The Company has a property catastrophe excess of loss agreement and a casualty excess of loss agreement that qualify as reinsurance treaties and are designed to protect against large or unusual loss and LAE activity. Reinsurance contracts do not relieve the Company from its obligations to policyholders. Failure of reinsurers to honor their obligations could result in losses to the Company. The Company evaluates the financial condition of its reinsurers and monitors economic characteristics of the reinsurers to minimize its exposure to significant losses from reinsurer insolvencies.
At December 31, 2015, our total expected reinsurance recovery from reinsurers under our catastrophe reinsurance program related to the 2015 snow is $67,934. Amounts recoverable from reinsurers are billed to the reinsurer as claims are paid by the Company. The current reinsurance recoverable related to the 2015 snow event is $39,553.
The Company is subject to concentration of credit risk with respect to reinsurance ceded. At December 31, 2015, reinsurance receivables on paid and unpaid loss and LAE with a carrying value of $57,833 and ceded unearned premiums of $21,594 were associated with CAR. At December 31, 2014, reinsurance receivables on paid and unpaid loss and LAE with a carrying value of $52,667 and ceded unearned premiums of $17,909 were associated with CAR. The Company assumes a proportionate share of the obligations from CAR. The Company makes an estimate of its share of assumed activity from the most recent quarter reported by CAR and records adjustments to the reported activity to reflect its anticipated final assumed obligations. The Company’s participation in CAR resulted in assumed net losses of $365, $1,278 and $1,487 for the years ended December 31, 2015, 2014 and 2013, respectively.
CAR has been, with few exceptions, required by law to issue a policy to any applicant who seeks it. As a servicing carrier of CAR, this requirement has applied to the Company.
The effect of assumed and ceded premiums on net written and earned premiums and losses and LAE incurred is as follows.
|
|
|
Years Ended December 31, |
|||||||
|
|
|
2015 |
|
2014 |
|
2013 |
|||
|
Written Premiums |
|
|
|
|
|
|
|
|
|
|
Direct |
|
$ |
785,730 |
|
$ |
765,685 |
|
$ |
731,680 |
|
Assumed |
|
|
28,322 |
|
|
25,602 |
|
|
20,593 |
|
Ceded |
|
|
(67,872) |
|
|
(56,373) |
|
|
(54,733) |
|
Net written premiums |
|
$ |
746,180 |
|
$ |
734,914 |
|
$ |
697,540 |
|
|
|
|
|
|
|
|
|
|
|
|
Earned Premiums |
|
|
|
|
|
|
|
|
|
|
Direct |
|
$ |
776,633 |
|
$ |
747,786 |
|
$ |
715,657 |
|
Assumed |
|
|
25,819 |
|
|
23,724 |
|
|
19,251 |
|
Ceded |
|
|
(64,288) |
|
|
(54,635) |
|
|
(53,038) |
|
Net earned premiums |
|
$ |
738,164 |
|
$ |
716,875 |
|
$ |
681,870 |
|
|
|
|
|
|
|
|
|
|
|
|
Loss and LAE |
|
|
|
|
|
|
|
|
|
|
Direct |
|
$ |
688,793 |
|
$ |
486,649 |
|
$ |
465,162 |
|
Assumed |
|
|
22,306 |
|
|
18,144 |
|
|
15,247 |
|
Ceded |
|
|
(98,530) |
|
|
(28,427) |
|
|
(32,660) |
|
Net loss and LAE |
|
$ |
612,569 |
|
$ |
476,366 |
|
$ |
447,749 |
83
10.Loss and Loss Adjustment Expense Reserves
The following table sets forth a reconciliation of beginning and ending reserves for losses and loss adjustment expenses (“LAE”), as shown in the Company’s consolidated financial statements for the periods indicated.
|
|
|
Year Ended December 31, |
||||||
|
|
|
2015 |
|
2014 |
|
2013 |
||
|
Reserves for losses and LAE at beginning of year |
|
$ |
482,012 |
|
$ |
455,014 |
|
423,842 |
|
Less receivable from reinsurers related to unpaid losses and LAE |
|
|
(61,245) |
|
|
(60,346) |
|
(52,185) |
|
Net reserves for losses and LAE at beginning of year |
|
|
420,767 |
|
|
394,668 |
|
371,657 |
|
Incurred losses and LAE, related to: |
|
|
|
|
|
|
|
|
|
Current year |
|
|
642,882 |
|
|
513,734 |
|
476,638 |
|
Prior years |
|
|
(30,313) |
|
|
(37,368) |
|
(28,889) |
|
Total incurred losses and LAE |
|
|
612,569 |
|
|
476,366 |
|
447,749 |
|
Paid losses and LAE related to: |
|
|
|
|
|
|
|
|
|
Current year |
|
|
415,256 |
|
|
316,979 |
|
299,882 |
|
Prior years |
|
|
132,364 |
|
|
133,288 |
|
124,856 |
|
Total paid losses and LAE |
|
|
547,620 |
|
|
450,267 |
|
424,738 |
|
Net reserves for losses and LAE at end of period |
|
|
485,716 |
|
|
420,767 |
|
394,668 |
|
Plus receivable from reinsurers related to unpaid losses and LAE |
|
|
68,261 |
|
|
61,245 |
|
60,346 |
|
Reserves for losses and LAE at end of period |
|
$ |
553,977 |
|
$ |
482,012 |
|
455,014 |
|
|
|
|
|
|
|
|
|
|
At the end of each period, the reserves were re‑estimated for all prior accident years. The Company’s prior year reserves decreased by $30,313, $37,368, and $28,889 for the years ended 2015, 2014, and 2013, respectively, and resulted from re‑estimations of prior years ultimate loss and LAE liabilities. The decrease in prior year reserves during 2015 was primarily composed of a reduction $18,644 in the Company’s retained automobile and $7,964 in the Company’s retained homeowners reserves. The decrease in prior year reserves during 2014 was primarily composed of a reduction $23,272 in the Company’s retained automobile and $8,804 in the Company’s retained homeowners reserves. The decrease in prior year reserves during 2013 was primarily composed of a reduction in the Company’s retained automobile reserves, partially offset by an increase in reserves of homeowners and all other lines of business.
The Company’s private passenger automobile line of business prior year reserves decreased during the years ended December 31, 2015, 2014 and 2013 primarily due to improved retained private passenger results. The improved retained private passenger results were primarily due to fewer incurred but not yet reported claims than previously estimated and better than previously estimated severity on the Company’s established bodily injury and property damage case reserves.
Due to the nature of the risks that the Company underwrites and has historically underwritten, management does not believe that it has an exposure to asbestos or environmental pollution liabilities.
84
11.Income Taxes
A summary of the income tax (benefit) expense in the Consolidated Statements of Income is shown below.
|
|
|
Years Ended December 31, |
|
|||||||
|
|
|
2015 |
|
2014 |
|
2013 |
|
|||
|
Current Income Taxes: |
|
|
|
|
|
|
|
|
|
|
|
Federal |
|
$ |
(15,384) |
|
$ |
24,389 |
|
$ |
24,417 |
|
|
State |
|
|
40 |
|
|
177 |
|
|
21 |
|
|
|
|
|
(15,344) |
|
|
24,566 |
|
|
24,438 |
|
|
Deferred Income Taxes: |
|
|
|
|
|
|
|
|
|
|
|
Federal |
|
|
552 |
|
|
(602) |
|
|
1,899 |
|
|
State |
|
|
— |
|
|
— |
|
|
— |
|
|
|
|
|
552 |
|
|
(602) |
|
|
1,899 |
|
|
Total income tax (benefit) expense |
|
$ |
(14,792) |
|
$ |
23,964 |
|
$ |
26,337 |
|
The income tax (benefit) expense attributable to the consolidated results of operations is different from the amounts determined by multiplying income before federal income taxes by the statutory federal income tax rate. The sources of the difference and the tax effects of each were as follows for the periods indicated.
|
|
|
Years Ended December 31, |
|
|||||||
|
|
|
2015 |
|
2014 |
|
2013 |
|
|||
|
Federal income tax (benefit) expense, at statutory rate |
|
$ |
(10,025) |
|
$ |
29,162 |
|
$ |
30,691 |
|
|
Tax‑exempt investment income, net |
|
|
(4,889) |
|
|
(5,429) |
|
|
(4,711) |
|
|
State taxes, net |
|
|
26 |
|
|
115 |
|
|
14 |
|
|
Nondeductible expenses |
|
|
233 |
|
|
222 |
|
|
210 |
|
|
Other, net |
|
|
(137) |
|
|
(106) |
|
|
133 |
|
|
Total income tax (benefit) expense |
|
$ |
(14,792) |
|
$ |
23,964 |
|
$ |
26,337 |
|
85
The deferred income tax asset (liability) represents the tax effects of temporary differences attributable to the Company’s consolidated federal tax return group. Its components were as shown in the following table for the periods indicated.
|
|
|
Years Ended December 31, |
|
||||
|
|
|
2015 |
|
2014 |
|
||
|
Deferred tax assets: |
|
|
|
|
|
|
|
|
Discounting of loss reserves |
|
$ |
6,668 |
|
$ |
6,505 |
|
|
Discounting of unearned premium reserve |
|
|
27,542 |
|
|
26,993 |
|
|
Bad debt allowance |
|
|
509 |
|
|
516 |
|
|
Employee benefits |
|
|
7,922 |
|
|
8,112 |
|
|
Rent incentive |
|
|
371 |
|
|
503 |
|
|
Depreciation |
|
|
152 |
|
|
(35) |
|
|
Other |
|
|
— |
|
|
— |
|
|
Total deferred tax assets before valuation allowance |
|
|
43,164 |
|
|
42,594 |
|
|
Valuation allowance for deferred tax assets |
|
|
— |
|
|
— |
|
|
Total deferred tax assets |
|
|
43,164 |
|
|
42,594 |
|
|
Deferred tax liabilities: |
|
|
|
|
|
|
|
|
Deferred acquisition costs |
|
|
(24,128) |
|
|
(23,565) |
|
|
Investments |
|
|
(2,540) |
|
|
(2,161) |
|
|
Net unrealized gains on investments |
|
|
(8,865) |
|
|
(15,462) |
|
|
Software development costs |
|
|
(2,342) |
|
|
(2,090) |
|
|
Premium acquisition expenses |
|
|
(856) |
|
|
(862) |
|
|
Other |
|
|
(3) |
|
|
(68) |
|
|
Total deferred tax liabilities |
|
|
(38,734) |
|
|
(44,208) |
|
|
Net deferred tax asset (liability) |
|
$ |
4,430 |
|
$ |
(1,614) |
|
The Company believes, based upon consideration of objective and verifiable evidence, including its historical positive earnings and its future expectations, that the Company’s taxable income in future years will be sufficient to realize all federal deferred tax assets.
The Company believes that the positions taken on its income tax returns for open tax years will be sustained upon examination by the Internal Revenue Service (“IRS”). Therefore, the Company has not recorded any liability for uncertain tax positions under ASC 740, Income Taxes.
During the twelve months ended December 31, 2015, there were no material changes to the amount of the Company’s unrecognized tax benefits or to any assumptions regarding the amount of its ASC 740 liability.
As of December 31, 2015, 2014 and 2013, the Company had no unrecognized tax benefits, and none which if recognized would affect the effective tax rate. The Company does not currently anticipate significant changes in the amount of unrecognized income tax benefits during the next twelve months.
The Company records interest and penalties associated with audits as a component of income before income taxes. Penalties are recorded in underwriting, operating and other expenses, and interest expense is recorded in interest expenses in the Consolidated Statement of Operations. The Company had no interest and penalties related to income taxes accrued as of December 31, 2015 and 2014.
The Company’s U.S. federal tax return for the year ended December 31, 2011 was examined by the IRS. The examination was completed during the quarter ending September 30, 2014 with no findings. In the Company’s opinion, adequate tax liabilities have been established for all open years. However, the amount of these tax liabilities could be revised in the near term if estimates of the Company’s ultimate liability are revised. Tax years prior to 2012 are closed.
86
12.Share Repurchase Program
On August 3, 2007, the Board of Directors approved a share repurchase program of up to $30,000 of the Company’s outstanding common shares. As of December 31, 2015, the Board of Directors had cumulatively authorized increases to the existing share repurchase program of up to $150,000 of its outstanding common shares. Under the program, the Company may repurchase shares of its common stock for cash in public or private transactions, in the open market or otherwise. The timing of such repurchases and actual number of shares repurchased will depend on a variety of factors including price, market conditions and applicable regulatory and corporate requirements. The program does not require the Company to repurchase any specific number of shares and it may be modified, suspended or terminated at any time without prior notice. No purchases were made by the Company under the program during the year ended December 31, 2015. During the year ended December 31, 2014, the Company purchased 460,023 of its common shares on the open market under the program at a cost of $23,467. As of December 31, 2015, the Company had 2,279,570 shares on the open market at a cost of $83,835.
13.Statutory Net Income and Surplus
Statutory Accounting Practices
The Company’s insurance company subsidiaries, domiciled in the Commonwealth of Massachusetts, prepare statutory financial statements in accordance with the accounting practices prescribed or permitted by the Division. Prescribed statutory accounting practices are those practices that are incorporated directly or by reference in state laws, regulations, and general administrative rules applicable to all insurance enterprises domiciled in a particular state. Permitted statutory accounting practices include practices not prescribed by the Division, but allowed by the Division. Statutory net loss of the Company’s insurance company subsidiaries was $12,209 for the year ended December 31, 2015. Statutory net income was $55,330, and $57,518 for the years ended December 31, 2014, and 2013 respectively. Statutory capital and surplus of the Company’s insurance subsidiaries was $571,038, $630,041 at December 31, 2015 and 2014, respectively.
Dividends
The Insurance Subsidiaries are subject to various regulatory restrictions that limit the maximum amount of dividends available to be paid to their parent without prior approval of the Commonwealth of Massachusetts Commissioner of Insurance (the “Commissioner”). Massachusetts statute limits the dividends an insurer may pay in any twelve month period, without the prior permission of the Commissioner, to the greater of (i) 10% of the insurer’s surplus as of the preceding December 31 or (ii) the insurer’s net income for the twelve‑ month period ending the preceding December 31, in each case determined in accordance with statutory accounting practices. Our insurance company subsidiaries may not declare an “extraordinary dividend” (defined as any dividend or distribution that, together with other distributions made within the preceding twelve months, exceeds the limits established by Massachusetts statute) until thirty days after the Commissioner has received notice of the intended dividend and has not objected. As historically administered by the Commissioner, this provision requires the Commissioner’s prior approval of an extraordinary dividend. Under Massachusetts law, an insurer may pay cash dividends only from its unassigned funds, also known as earned surplus, and the insurer’s remaining surplus must be both reasonable in relation to its outstanding liabilities and adequate to its financial needs. At December 31, 2015, the statutory surplus of Safety Insurance was $571,038 and its net loss for 2015 was $12,209. As a result, a maximum of $57,104 is available in 2016 for such dividends without prior approval of the Commissioner. During the year ended December 31, 2015, Safety Insurance recorded dividends of $39,440. As result of this Massachusetts statute, the Insurance Subsidiaries had restrict net assets in the amount of $513,934 at December 31, 2015.
Risk‑Based Capital Requirements
The NAIC has adopted a formula and model law to implement risk‑based capital requirements for most property and casualty insurance companies, which are designed to determine minimum capital requirements and to raise the level of protection that statutory surplus provides for policyholder obligations. Under Massachusetts law, insurers
87
having less total adjusted capital than that required by the risk‑based capital calculation will be subject to varying degrees of regulatory action, depending on the level of capital inadequacy. The risk‑based capital law provides for four levels of regulatory action. The extent of regulatory intervention and action increases as the level of total adjusted capital to risk‑based capital falls. As of December 31, 2015, the Insurance Subsidiaries had total adjusted capital of $571,038, which is in excess of amounts requiring company or regulatory action at any prescribed risk‑based capital action level. Minimum statutory capital and surplus, or company action level risk‑based capital, was $101,243 at December 31, 2015.
14.Fair Value of Financial Instruments
ASC 820, Fair Value Measurements and Disclosure provides a revised definition of fair value, establishes a framework for measuring fair value and expands financial statement disclosure requirements for fair value information. Under ASC 820, fair value is defined as the price that would be received to sell an asset or paid to transfer a liability in an orderly transaction between market participants (an exit price). ASC 820 establishes a fair value hierarchy that distinguishes between inputs based on market data from independent sources (“observable inputs”) and a reporting entity’s internal assumptions based upon the best information available when external market data is limited or unavailable (“unobservable inputs”). The fair value hierarchy in ASC 820 prioritizes fair value measurements into three levels based on the nature of the inputs as follows:
Level 1 — Valuations based on quoted prices in active markets for identical assets and liabilities;
Level 2 — Valuations based on observable inputs that do not meet the criteria for Level 1, including quoted prices in inactive markets and quoted prices in active markets for similar, but not identical instruments; and
Level 3 — Valuations based on unobservable inputs.
Fair values for the Company’s fixed maturity securities are based on prices provided by its custodian bank and its investment managers. Both the Company’s custodian bank and investment managers use a variety of independent, nationally recognized pricing services to determine market valuations. If the pricing service cannot provide fair value determinations, the Company obtains non-binding price quotes from broker-dealers. A minimum of two quoted prices is obtained for the majority of the Company’s available-for-sale fixed maturity securities in its investment portfolio. The Company’s custodian bank is its primary provider of quoted prices from third-party pricing services and broker-dealers. To provide reasonable assurance of the validity of each price or quote, a secondary third-party pricing service or broker-dealer quote is obtained from the Company’s investment managers. An examination of the pricing data is then performed for each security. If the variance between the primary and secondary price quotes for a security is within an accepted tolerance level, the quoted price obtained from the Company’s custodian bank is used in the financial statements for the security. If the variance between the primary and secondary price quotes exceeds an accepted tolerance level, the Company obtains a quote from an alternative source, if possible, and documents and resolves any differences between the pricing sources. In addition, the Company may request that its investment managers and its traders provide input as to which vendor is providing prices that its traders believe are reflective of fair value for the security. Following this process, the Company may decide to value the security in its financial statements using the secondary or alternative source if it believes that pricing is more reflective of the security’s value than the primary pricing provided by its custodian bank. The Company analyzes market valuations received to verify reasonableness, to understand the key assumptions used and their sources, and to determine an appropriate ASC 820 fair value hierarchy level based upon trading activity and the observability of market inputs. Based on this evaluation and investment class analysis, each price is classified into Level 1, 2 or 3.
Fair values of instruments are based on (i) quoted prices in active markets for identical assets (Level 1), (ii) quoted prices for similar instruments in active markets, quoted prices for identical or similar instruments in markets that are not active and model-derived valuations in which all significant inputs are observable in active markets (Level 2) or (iii) valuations derived from valuation techniques in which one or more significant inputs are unobservable in the marketplace (Level 3).
The Company’s Level 1 securities consist of equity securities whose values are based on quoted prices in active
88
markets for identical assets. The Company’s Level 2 securities are comprised of available-for-sale fixed maturity securities whose fair value was determined using observable market inputs. The Company’s Level 3 security is a real estate investment trust equity investment whose fair value was determined using the trust’s net asset value obtained from its audited financial statements; however, the Company is required to submit a request 45 days before a quarter ended to dispose of the security. Fair values for securities for which quoted market prices were unavailable were estimated based upon reference to observable inputs such as benchmark interest rates, market comparables, and other relevant inputs. Investments valued using these inputs include U.S. Treasury securities, obligations of states and political subdivisions, corporate securities, commercial and residential mortgage-backed securities, and other asset-backed securities. Inputs into the fair value application that are utilized by asset class include but are not limited to:
|
· |
Obligations of states and political subdivisions: overall credit quality, including assessments of market sectors and the level and variability of sources of payment such as general obligation, revenue or lease; credit support such as insurance, state or local economic and political base, prefunded and escrowed to maturity covenants. |
|
· |
Corporate amd fixed maturities: overall credit quality, the establishment of a risk adjusted credit spread over the applicable risk-free yield curve for discounted cash flow valuations; assessments of the level of industry economic sensitivity, company financial policies, indenture restrictive covenants, and/or security and collateral. |
|
· |
Residential mortgage-backed securities, U.S. agency pass-throughs, collateralized mortgage obligations (“CMOs”), non U.S. agency CMOs: estimates of prepayment speeds based upon historical prepayment rate trends, underlying collateral interest rates, original weighted average maturity, vintage year, borrower credit quality characteristics, interest rate and yield curve forecasts, U.S. government support programs, tax policies, and delinquency/default trends. |
|
· |
Commercial mortgage-backed securities: overall credit quality, including assessments of the level and variability of credit support and collateral type such as office, retail, or lodging, predictability of cash flows for the deal structure, prevailing economic market conditions. |
|
· |
Other asset-backed securities: overall credit quality, estimates of prepayment speeds based upon historical trends and characteristics of underlying loans, including assessments of the level and variability of collateral, revenue generating agreements, area licenses agreements, product sourcing agreements and equipment and property leases. |
|
· |
Real estate investment trust (“REIT”): net asset value per share derived from member ownership in capital venture to which a proportionate share of independently appraised net assets is attributed. |
|
· |
Federal Home Loan Bank of Boston (“FHLB-Boston”): value is equal to the cost of the member stock purchased. |
In order to ensure the fair value determination is representative of an exit price (consistent with ASC 820), the Company’s procedures for validating quotes or prices obtained from third parties include, but are not limited to, obtaining a minimum of two price quotes for each fixed maturity security if possible, as discussed above, the periodic testing of sales activity to determine if there are any significant differences between the market price used to value the security as of the balance sheet date and the sales price of the security for sales that occurred around the balance sheet date, and the periodic review of reports provided by its investment manager regarding those securities with ratings changes and securities placed on its “Watch List.” In addition, valuation techniques utilized by pricing services and prices obtained from external sources are reviewed by the Company and its external investment manager, whose investment professionals are familiar with the securities being priced and the markets in which they trade, to ensure the fair value determination is representative of an exit price (consistent with ASC 820).
All unadjusted estimates of fair value for our fixed maturities priced by the pricing services as described above are included in the amounts disclosed in Level 2. With the exception of the REIT and FHLB-Boston securities, which are categorized as Level 3 securities, the Company’s entire available-for-sale portfolio was priced based upon quoted
89
market prices or other observable inputs as of December 31, 2015. There were no significant changes to the valuation process during the year ended December 31, 2015. As of December 31, 2015 and December 31, 2014, no quotes or prices obtained were adjusted by management. All broker quotes obtained were non-binding.
At December 31, 2015 and December 31, 2014, investments in fixed maturities and equity securities classified as available-for-sale had a fair value which equaled carrying value of $1,191,841 and $1,244,604, respectively. At December 31, 2015 and December 31, 2014, we held no short-term investments. The carrying values of cash and cash equivalents and investment income accrued approximated fair value.
The following tables summarize the Company’s total fair value measurements for available‑for‑sale investments for the periods indicated.
|
|
|
As of December 31, 2015 |
|
||||||||||
|
|
|
Total |
|
Level 1 Inputs |
|
Level 2 Inputs |
|
Level 3 Inputs |
|
||||
|
U.S. Treasury securities |
|
$ |
1,801 |
|
$ |
— |
|
$ |
1,801 |
|
$ |
— |
|
|
Obligations of states and political subdivisions |
|
|
397,922 |
|
|
— |
|
|
397,922 |
|
|
— |
|
|
Residential mortgage-backed securities |
|
|
241,456 |
|
|
— |
|
|
241,456 |
|
|
— |
|
|
Commercial mortgage-backed securities |
|
|
28,663 |
|
|
— |
|
|
28,663 |
|
|
— |
|
|
Other asset-backed securities |
|
|
23,931 |
|
|
— |
|
|
23,931 |
|
|
— |
|
|
Corporate and other securities |
|
|
387,864 |
|
|
— |
|
|
387,864 |
|
|
— |
|
|
Equity securities |
|
|
110,204 |
|
|
90,560 |
|
|
— |
|
|
19,644 |
|
|
Total investment securities |
|
$ |
1,191,841 |
|
$ |
90,560 |
|
$ |
1,081,637 |
|
$ |
19,644 |
|
|
|
|
As of December 31, 2014 |
|
||||||||||
|
|
|
Total |
|
Level 1 Inputs |
|
Level 2 Inputs |
|
Level 3 Inputs |
|
||||
|
U.S. Treasury securities |
|
$ |
1,506 |
|
$ |
— |
|
$ |
1,506 |
|
$ |
— |
|
|
Obligations of states and political subdivisions |
|
|
460,325 |
|
|
— |
|
|
460,325 |
|
|
— |
|
|
Residential mortgage-backed securities |
|
|
207,683 |
|
|
— |
|
|
207,683 |
|
|
— |
|
|
Commercial mortgage-backed securities |
|
|
34,438 |
|
|
— |
|
|
34,438 |
|
|
— |
|
|
Other asset-backed securities |
|
|
10,250 |
|
|
— |
|
|
10,250 |
|
|
— |
|
|
Corporate and other securities |
|
|
421,249 |
|
|
— |
|
|
421,249 |
|
|
— |
|
|
Equity securities |
|
|
109,153 |
|
|
91,523 |
|
|
— |
|
|
17,630 |
|
|
Total investment securities |
|
$ |
1,244,604 |
|
$ |
91,523 |
|
$ |
1,135,451 |
|
$ |
17,630 |
|
There were no transfers between Level 1 and Level 2 during the years ended December 31, 2015 or 2014.
The following tables summarize the changes in the Company’s Level 3 fair value securities for the periods indicated.
|
|
|
Year Ended December 31, |
|
|||||||
|
|
|
2015 |
|
2014 |
|
2013 |
|
|||
|
Balance at beginning of period |
|
$ |
17,630 |
|
$ |
15,920 |
|
$ |
5,346 |
|
|
Net gains and losses included in earnings |
|
|
— |
|
|
— |
|
|
— |
|
|
Net gains included in other comprehensive income |
|
|
1,972 |
|
|
1,205 |
|
|
574 |
|
|
Purchases |
|
|
42 |
|
|
505 |
|
|
10,000 |
|
|
Sales |
|
|
— |
|
|
— |
|
|
— |
|
|
Transfers into Level 3 |
|
|
— |
|
|
— |
|
|
— |
|
|
Transfers out of Level 3 |
|
|
— |
|
|
— |
|
|
— |
|
|
Balance at end of period |
|
$ |
19,644 |
|
$ |
17,630 |
|
$ |
15,920 |
|
|
Amount of total losses included in earnings attributable to the change in unrealized losses related to assets still held at end of period |
|
$ |
— |
|
$ |
— |
|
$ |
— |
|
|
|
|
|
|
|
|
|
|
|
|
|
Transfers in and out of Level 3 are attributable to changes in the ability to observe significant inputs in determining fair value exit pricing. As noted in the table above, no transfers were made in or out of Level 3 during 2015, 2014 and 2013. The Company held two Level 3 securities at December 31, 2015.
90
15.Quarterly Results of Operations (Unaudited)
An unaudited summary of the Company’s 2015 and 2014 quarterly performance, and audited annual performance, is as follows.
|
|
|
Year ended December 31, 2015 |
|||||||||||||
|
|
|
First |
|
Second |
|
Third |
|
Fourth |
|
Total |
|||||
|
|
|
Quarter |
|
Quarter |
|
Quarter |
|
Quarter |
|
Year |
|||||
|
Total revenue |
|
$ |
198,039 |
|
$ |
197,602 |
|
$ |
201,270 |
|
$ |
201,042 |
|
$ |
797,953 |
|
Net (loss) income |
|
|
(35,071) |
|
|
(1,053) |
|
|
11,981 |
|
|
10,290 |
|
|
(13,853) |
|
Earnings per weighted average common share: |
|
|
|
|
|
|
|
|
|
|
|
|
|
|
|
|
Basic |
|
|
(2.37) |
|
|
(0.07) |
|
|
0.80 |
|
|
0.69 |
|
|
(0.93) |
|
Diluted |
|
|
(2.37) |
|
|
(0.07) |
|
|
0.80 |
|
|
0.69 |
|
|
(0.93) |
|
Cash dividends paid per common share |
|
|
0.70 |
|
|
0.70 |
|
|
0.70 |
|
|
0.70 |
|
|
2.80 |
|
|
|
Year ended December 31, 2014 |
|||||||||||||
|
|
|
First |
|
Second |
|
Third |
|
Fourth |
|
Total |
|||||
|
|
|
Quarter |
|
Quarter |
|
Quarter |
|
Quarter |
|
Year |
|||||
|
Total revenue |
|
$ |
191,087 |
|
$ |
192,946 |
|
$ |
196,119 |
|
$ |
198,645 |
|
$ |
778,797 |
|
Net income |
|
|
12,125 |
|
|
21,423 |
|
|
15,436 |
|
|
10,370 |
|
|
59,354 |
|
Earnings per weighted average common share: |
|
|
|
|
|
|
|
|
|
|
|
|
|
|
|
|
Basic |
|
|
0.79 |
|
|
1.40 |
|
|
1.03 |
|
|
0.69 |
|
|
3.93 |
|
Diluted |
|
|
0.79 |
|
|
1.40 |
|
|
1.03 |
|
|
0.69 |
|
|
3.91 |
|
Cash dividends paid per common share |
|
|
0.60 |
|
|
0.60 |
|
|
0.70 |
|
|
0.70 |
|
|
2.60 |
16.Related Party Transactions
Mr. A. Richard Caputo, Jr., a member of the Company’s Board of Directors and the Chairman of its Investment Committee, is a principal of The Jordan Company, LP (“Jordan”). In 2012, the Company participated as a lender in two loans made by syndicates of lenders to a portfolio company in which funds managed by Jordan are controlling or a significant investor. The first loan, made to Vantage Specialties, Inc., currently bears interest at a rate of 5.00% per annum and matures in February 2019. The Company’s participation in the loan is $1,405 and $1,451 at December 31, 2015 and December 31, 2014, respectively. The loan amortizes in equal quarterly installments of 0.25% per annum and matures in February 2019. The second loan, made to ARCAS Automotive (formerly known as Sequa Auto), was disposed of in 2014. The Company made the loans on the same terms as the other lenders participating in the syndicate. The loans were subject to the approval of the Company’s full Investment Committee.
17.Subsequent Events
The Company has evaluated subsequent events for recognition or disclosure in the consolidated financial statements on Form 10‑K filed herewith and no events have occurred that require recognition or disclosure.
91
ITEM 9. CHANGES IN AND DISAGREEMENTS WITH ACCOUNTANTS ON ACCOUNTING AND FINANCIAL DISCLOSURE
None.
ITEM 9A. CONTROLS AND PROCEDURES
Conclusion Regarding the Effectiveness of Disclosure Controls and Procedures
Under the supervision and with the participation of our management, including our Chief Executive Officer and Chief Financial Officer, we evaluated the effectiveness of the design and operation of our disclosure controls and procedures (as defined in Rules 13a-15(e) and 15d-15(e) of the Securities Exchange Act of 1934, as amended [the "Exchange Act"]) as of the end of the period covered by this report. Based on that evaluation, our CEO and CFO have concluded that our disclosure controls and procedures are adequate and effective and ensure that all information required to be disclosed is recorded, processed, summarized and reported within the time periods specified in the SEC's rules and that information required to be disclosed in such reports is accumulated and communicated to management, including our Chief Executive Officer and Chief Financial Officer, to allow timely decisions regarding required disclosures.
Management's Report on Internal Control over Financial Reporting
Our management is responsible for establishing and maintaining adequate internal control over financial reporting, as defined in Exchange Act Rules 13a-15(f) and 15d-15(f). Under the supervision and with the participation of our management, including our Chief Executive Officer and Chief Financial Officer, we conducted an evaluation of the effectiveness of our internal control over financial reporting based on the framework in Internal Control—Integrated Framework (2013) issued by the Committee of Sponsoring Organizations of the Treadway Commission. Based on our evaluation under the framework in Internal Control—Integrated Framework (2013), our management concluded that our internal control over financial reporting was effective as of December 31, 2015.
PricewaterhouseCoopers LLP, the Company's independent registered public accounting firm, has audited the effectiveness of Safety Insurance Group, Inc.'s internal control over financial reporting as of December 31, 2015, as stated in their report which is included herein.
Changes in Internal Control over Financial Reporting
There have been no changes in our internal control over financial reporting identified in connection with the evaluation required by Exchange Act Rules 13a-15 and 15d-15 that occurred during our last fiscal quarter that have materially affected, or are reasonably likely to materially affect our internal control over financial reporting.
92
The following disclosures relate to actions taken by the Board of Directors of the Company (the "Board"), the Compensation Committee of the Board and the Board of Directors of Safety Insurance Company and would otherwise have been filed during the first fiscal quarter of 2016 on a Form 8-K.
On February 23, 2016, the Compensation Committee of the Board approved executive long-term incentive awards to certain members of senior management pursuant to our 2002 Management Omnibus Incentive Plan, as Amended. The long-term incentive awards were granted in a total amount of $3,050 in the form of restricted stock, to be effective on and given a fair value of the closing price of our common stock on February 23, 2016. Of the total award, 45% vests in three annual installments of 30% on February 23, 2017, 30% on February 23, 2018, and 40% on February 23, 2019 and were allocated to the Company's Named Executive Officers as follows; William J. Begley, Jr., $225 worth of restricted stock; George M. Murphy $360 worth of restricted stock; and James D. Berry, $180 worth of restricted stock. The form of restricted stock agreement with service vesting that will be entered into is incorporated by reference as Exhibit 10.66. Of the total award, 55% vests over a three-year performance period commencing on January 1, 2016 and ending on December 31, 2018. Vesting of these shares is dependent upon the attainment of pre-established performance objectives and were allocated to the Named Executive Officers as follows; William J. Begley, Jr., $275 worth of restricted stock; George M. Murphy $440 worth of restricted stock; and James D. Berry, $220 worth of restricted stock. The form of restricted stock agreement with performance vesting that will be entered into is incorporated by reference as Exhibit 10.66\5. The compensation committee also approved an award of an additional 10,000 shares of restricted shares with performance-based vesting to George M. Murphy, effective April 1, 2016.
93
Within 120 days after the close of its fiscal year, the Company intends to file with the Securities and Exchange Commission a definitive proxy statement pursuant to Regulation 14A of the Securities Exchange Act of 1934 as amended, which will include the matters required by these items.
ITEM 15. EXHIBITS, FINANCIAL STATEMENT SCHEDULES.
(a) The following documents are filed as a part of this report:
1. Financial Statements: The Consolidated Financial Statements for the year ended December 31, 2015 are contained herein as listed in the Index to Consolidated Financial Statements.
2. Financial Statement Schedules: The Financial Statement Schedules are contained herein as listed in the Index to Financial Statement Schedules.
3. Exhibits: The exhibits are contained herein as listed in the Index to Exhibits.
94
SAFETY INSURANCE GROUP, INC.
INDEX TO FINANCIAL STATEMENT SCHEDULES
|
Schedules |
|
Page |
|
|
|
|
| 96 | ||
|
|
|
|
| 97 | ||
|
|
|
|
| 99 | ||
|
|
|
|
| 100 | ||
|
|
|
|
| 101 | ||
|
|
|
|
|
Supplemental Information Concerning Property and Casualty Operations |
102 |
95
Safety Insurance Group, Inc.
Summary of Investments—Other than Investments in Related Parties
Schedule I
At December 31, 2015
(Dollars in thousands)
|
|
|
|
|
|
|
|
|
Amount at |
|
|
|
|
|
|
|
|
|
|
|
which shown |
|
|
|
|
|
Cost or |
|
Estimated |
|
in the Balance |
|
|||
|
|
|
Amortized Cost |
|
Fair Value |
|
Sheet |
|
|||
|
Fixed maturities: |
|
|
|
|
|
|
|
|
|
|
|
U.S. government and government agencies and authorities |
|
$ |
239,701 |
|
$ |
243,257 |
|
$ |
243,257 |
|
|
Obligations of states and political subdivisions |
|
|
377,188 |
|
|
397,922 |
|
|
397,922 |
|
|
Corporate and other securities |
|
|
447,082 |
|
|
440,458 |
|
|
440,458 |
|
|
Total fixed maturities |
|
|
1,063,971 |
|
|
1,081,637 |
|
|
1,081,637 |
|
|
Equity securities: |
|
|
|
|
|
|
|
|
|
|
|
Common stocks: |
|
|
|
|
|
|
|
|
|
|
|
Industrial, miscellaneous and all other |
|
|
102,541 |
|
|
110,204 |
|
|
110,204 |
|
|
Total equity securities |
|
|
102,541 |
|
|
110,204 |
|
|
110,204 |
|
|
Other invested assets |
|
|
17,602 |
|
|
17,602 |
|
|
17,602 |
|
|
Total investments |
|
$ |
1,184,114 |
|
$ |
1,209,443 |
|
$ |
1,209,443 |
|
|
|
|
|
|
|
|
|
|
|
|
|
96
Safety Insurance Group, Inc.
Condensed Financial Information of the Registrant
Condensed Balance Sheets
Schedule II
(Dollars in thousands)
|
|
|
Years Ended December 31, |
|
||||
|
|
|
2015 |
|
2014 |
|
||
|
Assets |
|
|
|
|
|
|
|
|
Investments in consolidated affiliates |
|
$ |
645,701 |
|
$ |
709,523 |
|
|
Other |
|
|
87 |
|
|
54 |
|
|
Total assets |
|
$ |
645,788 |
|
$ |
709,577 |
|
|
Liabilities |
|
|
|
|
|
|
|
|
Accounts payable and other liabilities |
|
$ |
1,289 |
|
$ |
1,294 |
|
|
Total liabilities |
|
|
1,289 |
|
|
1,294 |
|
|
Shareholders’ equity |
|
|
644,499 |
|
|
708,283 |
|
|
Total liabilities and shareholders’ equity |
|
$ |
645,788 |
|
$ |
709,577 |
|
Safety Insurance Group, Inc.
Condensed Financial Information of the Registrant
Condensed Statements of Operations and Comprehensive Income
Schedule II
(Dollars in thousands)
|
|
|
Years Ended December 31, |
|
|||||||
|
|
|
2015 |
|
2014 |
|
2013 |
|
|||
|
Revenues |
|
$ |
— |
|
$ |
— |
|
$ |
— |
|
|
Expenses |
|
|
1,230 |
|
|
1,264 |
|
|
1,201 |
|
|
Net loss |
|
|
(1,230) |
|
|
(1,264) |
|
|
(1,201) |
|
|
Earnings from consolidated subsidiaries |
|
|
(12,623) |
|
|
60,618 |
|
|
62,552 |
|
|
Net (loss) income |
|
|
(13,853) |
|
|
59,354 |
|
|
61,351 |
|
|
Other net comprehensive income, net of taxes |
|
|
(12,251) |
|
|
11,515 |
|
|
(26,156) |
|
|
Comprehensive net (loss) income |
|
$ |
(26,104) |
|
$ |
70,869 |
|
$ |
35,195 |
|
97
Safety Insurance Group, Inc.
Condensed Financial Information of the Registrant
Condensed Statements of Cash Flows
Schedule II
(Dollars in thousands)
|
|
|
Years Ended December 31, |
|
|||||||
|
|
|
2015 |
|
2014 |
|
2013 |
|
|||
|
Net (loss) income |
|
$ |
(13,853) |
|
$ |
59,354 |
|
$ |
61,351 |
|
|
Adjustments to reconcile net (loss) income to net cash provided by operating activities: |
|
|
|
|
|
|
|
|
|
|
|
Loss (Earnings) from consolidated subsidiaries |
|
|
12,623 |
|
|
(60,618) |
|
|
(62,552) |
|
|
Dividends received from consolidated subsidiaries(1) |
|
|
39,440 |
|
|
59,186 |
|
|
36,114 |
|
|
Amortization of restricted stock expense |
|
|
3,515 |
|
|
4,315 |
|
|
4,153 |
|
|
Changes in assets and liabilities: |
|
|
|
|
|
|
|
|
|
|
|
Other assets |
|
|
(33) |
|
|
15 |
|
|
(61) |
|
|
Accounts payable and accrued liabilities |
|
|
5 |
|
|
217 |
|
|
67 |
|
|
Net cash provided by operating activities |
|
|
41,697 |
|
|
62,469 |
|
|
39,072 |
|
|
Proceeds from exercise of stock options |
|
|
278 |
|
|
297 |
|
|
2,592 |
|
|
Excess tax benefit from stock options exercised |
|
|
1 |
|
|
3 |
|
|
|
|
|
Dividends paid |
|
|
(41,976) |
|
|
(39,302) |
|
|
(36,865) |
|
|
Acquisition of treasury stock |
|
|
— |
|
|
(23,467) |
|
|
(4,799) |
|
|
Net cash used for financing activities |
|
|
(41,697) |
|
|
(62,469) |
|
|
(39,072) |
|
|
Net increase in cash and cash equivalents |
|
|
— |
|
|
— |
|
|
— |
|
|
Cash and cash equivalents, beginning of year |
|
|
— |
|
|
— |
|
|
— |
|
|
Cash and cash equivalents, end of year |
|
$ |
— |
|
$ |
— |
|
$ |
— |
|
(1) In 2013, the Company incorrectly presented dividends received from operating subsidiaries that represent returns on these investments as investing activities rather than as operating activities in the statements of cash flows. The Company has revised the presentation of all prior cash flows to correct this classification. No portion of the dividends received from operating subsidiaries during 2015, 2014 or 2013 represent returns of capital and therefore no portion is presented as an investing activity.
98
Safety Insurance Group, Inc.
Supplementary Insurance Information
Schedule III
(Dollars in thousands)
|
|
|
|
|
|
|
|
|
|
|
|
|
|
As of December 31, |
|||||||
|
|
|
|
|
|
Future Policy |
|
|
|
|
|
|
|
Deferred |
|
Benefits, |
|
|
|
||
|
|
|
Policy |
|
Losses, |
|
|
|
||
|
|
|
Acquisition |
|
Claims and Loss |
|
Unearned |
|||
|
Segment |
|
Costs |
|
Expenses |
|
Premiums |
|||
|
Property and Casualty Insurance |
|
|
|
|
|
|
|
|
|
|
2015 |
|
$ |
68,937 |
|
$ |
553,977 |
|
$ |
401,961 |
|
2014 |
|
|
67,329 |
|
|
482,012 |
|
|
390,361 |
|
2013 |
|
|
63,388 |
|
|
455,014 |
|
|
370,583 |
|
|
|
Years Ended December 31, |
|
||||||||||||||||
|
|
|
|
|
|
|
|
|
Benefits, |
|
|
|
|
|
|
|
Amortization of |
|
||
|
|
|
|
|
|
|
|
|
Claims, |
|
|
|
|
|
|
|
Deferred |
|
||
|
|
|
|
|
|
Net |
|
Losses, and |
|
Other |
|
|
|
|
Policy |
|
||||
|
|
|
Premium |
|
Investment |
|
Settlement |
|
Operating |
|
Premiums |
|
Acquisition |
|
||||||
|
Segment |
|
Revenue |
|
Income |
|
Expenses |
|
Expenses |
|
Written |
|
Costs |
|
||||||
|
Property and Casualty Insurance |
|
|
|
|
|
|
|
|
|
|
|
|
|
|
|
|
|
|
|
|
2015 |
|
$ |
738,164 |
|
$ |
40,534 |
|
$ |
612,569 |
|
$ |
75,700 |
|
$ |
746,180 |
|
$ |
138,239 |
|
|
2014 |
|
|
716,875 |
|
|
42,303 |
|
|
476,366 |
|
|
86,497 |
|
|
734,914 |
|
|
132,526 |
|
|
2013 |
|
|
681,870 |
|
|
43,054 |
|
|
447,749 |
|
|
83,557 |
|
|
697,540 |
|
|
126,201 |
|
99
Safety Insurance Group, Inc.
Schedule IV
(Dollars in thousands)
|
|
|
|
|
|
|
|
|
|
|
|
|
|
Percent of |
|
|
|
|
|
|
|
|
|
|
|
|
|
|
|
|
|
Amount |
|
|
Property and Casualty |
|
Gross |
|
Ceded to Other |
|
Assumed from |
|
Net |
|
Assumed |
|
||||
|
Insurance Earned Premiums |
|
Amount |
|
Companies |
|
Other Companies |
|
Amount |
|
to Net |
|
||||
|
Years ended December 31, |
|
|
|
|
|
|
|
|
|
|
|
|
|
|
|
|
2015 |
|
$ |
776,633 |
|
$ |
64,288 |
|
$ |
25,819 |
|
$ |
738,164 |
|
3.5% |
|
|
2014 |
|
|
747,786 |
|
|
54,635 |
|
|
23,724 |
|
|
716,875 |
|
3.3% |
|
|
2013 |
|
|
715,657 |
|
|
53,038 |
|
|
19,251 |
|
|
681,870 |
|
2.8% |
|
100
Safety Insurance Group, Inc.
Valuation and Qualifying Accounts
Schedule V
(Dollars in thousands)
|
|
|
|
|
|
Additions |
|
|
|
|
|
|
|
||||
|
|
|
Balance at |
|
Charged to |
|
Charged to |
|
|
|
|
Balance at |
|
||||
|
|
|
Beginning |
|
Costs and |
|
Other |
|
|
|
|
End of |
|
||||
|
|
|
of Period |
|
Expenses |
|
Accounts |
|
Deductions(1) |
|
Period |
|
|||||
|
Allowance for doubtful accounts Years Ended December 31, |
|
|
|
|
|
|
|
|
|
|
|
|
|
|
|
|
|
2015 |
|
$ |
462 |
|
$ |
1,008 |
|
$ |
— |
|
$ |
1,045 |
|
$ |
425 |
|
|
2014 |
|
|
456 |
|
|
1,131 |
|
|
— |
|
|
1,125 |
|
|
462 |
|
|
2013 |
|
|
635 |
|
|
836 |
|
|
— |
|
|
1,015 |
|
|
456 |
|
(1) Deductions represent write‑offs of accounts determined to be uncollectible.
101
Safety Insurance Group, Inc.
Supplemental Information Concerning Property and Casualty Insurance Operations
Schedule VI
(Dollars in thousands)
|
|
|
As of December 31, |
|
Years Ended December 31, |
|
|||||||||||
|
|
|
|
|
|
Reserves for |
|
|
|
|
|
|
|
|
|
|
|
|
|
|
Deferred |
|
Unpaid Claims |
|
|
|
|
|
|
|
|
|
|
||
|
|
|
Policy |
|
and Claims |
|
|
|
|
|
|
|
Net |
|
|||
|
|
|
Acquisition |
|
Adjustment |
|
Unearned |
|
Earned |
|
Investment |
|
|||||
|
Affiliation With Registrant |
|
Costs |
|
Expenses |
|
Premiums |
|
Premiums |
|
Income |
|
|||||
|
Consolidated Property & Casualty Subsidiaries |
|
|
|
|
|
|
|
|
|
|
|
|
|
|
|
|
|
2015 |
|
$ |
68,937 |
|
$ |
553,977 |
|
$ |
401,961 |
|
$ |
738,164 |
|
$ |
40,534 |
|
|
2014 |
|
|
67,329 |
|
|
482,012 |
|
|
390,361 |
|
|
716,875 |
|
|
42,303 |
|
|
2013 |
|
|
63,388 |
|
|
455,014 |
|
|
370,583 |
|
|
681,870 |
|
|
43,054 |
|
|
|
|
Years Ended December 31, |
|
|||||||||||||
|
|
|
Claims and Claims |
|
|
Amortization |
|
|
Paid Claims |
|
|
|
|
||||
|
|
|
Adjustment Expenses |
|
|
of Deferred |
|
|
and Claims |
|
|
|
|
||||
|
|
|
Incurred Related to |
|
|
Policy |
|
|
|
|
|
|
|
||||
|
|
|
Current |
|
Prior |
|
|
Acquisition |
|
|
Adjustment |
|
Premiums |
|
|||
|
Affiliation With Registrant |
|
Year |
|
Year |
|
|
Costs |
|
|
Expenses |
|
Written |
|
|||
|
Consolidated Property & Casualty Subsidiaries |
|
|
|
|
|
|
|
|
|
|
|
|
|
|
|
|
|
2015 |
|
$ |
642,882 |
|
$ |
(30,313) |
|
$ |
138,239 |
|
$ |
547,620 |
|
$ |
746,180 |
|
|
2014 |
|
|
513,734 |
|
|
(37,368) |
|
|
132,526 |
|
|
450,267 |
|
|
734,914 |
|
|
2013 |
|
|
476,638 |
|
|
(28,889) |
|
|
126,201 |
|
|
424,738 |
|
|
697,540 |
|
102
Pursuant to the requirements of Section 13 or 15(d) of the Securities Exchange Act of 1934, as amended, the Registrant has duly caused this report to be signed on its behalf by the undersigned, thereunto duly authorized on February 25, 2016
|
Safety Insurance Group, Inc. |
|
|
|
By: |
/s/ David F. Brussard |
|
|
|
David F. Brussard, |
|
|
|
President, Chief Executive Officer and Chairman of the Board |
|
POWER OF ATTORNEY
KNOW ALL PERSONS BY THESE PRESENTS, that each person whose signature appears below constitutes and appoints David F. Brussard and William J. Begley, Jr., and each of them individually, his true and lawful attorney-in-fact and agent with full power of substitution and resubstitution for him and in his name, place and stead, in any and all capacities, to sign any and all amendments to this Annual Report, and to file the same, with all exhibits thereto, and other documents in connection therewith, with the Securities and Exchange Commission, granting unto each such attorney-in-fact and agent, or his substitutes, full power and authority to do and perform each and every act and thing requisite and necessary to be done in and about the premises, to all intents and purposes and as fully as he might or could do in person, hereby ratifying and confirming all that each such attorney-in-fact and agent, or his substitutes, may lawfully do or cause to be done by virtue hereof.
Pursuant to the requirements of the Securities Exchange Act of 1934, this Annual Report has been signed by the following persons in the capacities and on the date indicated:
|
Signature |
Title |
Date |
|
|
|
|
|
/s/ David F. Brussard |
President, Chief Executive Officer and |
February 25, 2016 |
|
David F. Brussard |
Chairman of the Board |
|
|
|
|
|
|
/s/ William J. Begley, Jr. |
Vice President, Chief Financial Officer, |
February 25, 2016 |
|
William J. Begley, Jr. |
Secretary, and Principal Accounting Officer |
|
|
|
|
|
|
/s/ A. Richard Caputo, Jr. |
Director |
February 25, 2016 |
|
A. Richard Caputo, Jr. |
|
|
|
|
|
|
|
/s/ Frederic H. Lindeberg |
Director |
February 25, 2016 |
|
Frederic H. Lindeberg |
|
|
|
|
|
|
|
/s/ Peter J. Manning |
Director |
February 25, 2016 |
|
Peter J. Manning |
|
|
|
|
|
|
|
/s/ David K. McKown |
Director |
February 25, 2016 |
|
David K. McKown |
|
|
103
SAFETY INSURANCE GROUP, INC.
INDEX TO EXHIBITS
|
Exhibit |
Description |
|
3.1 |
Form of Amended and Restated Certificate of Incorporation of Safety Insurance Group, Inc.(1) |
|
3.2 |
Form of Amended and Restated Bylaws of Safety Insurance Group, Inc.(1) |
|
4 |
Form of Stock Certificate for the Common Stock (1) |
|
10.1 |
Lease Agreement between Thomas Black Corporation and Aman, Inc. for the lease of office space located on the 1st through 6th, 11th and 12th floors of 20 Custom House Street, Boston, Massachusetts, dated June 11, 1987, and as amended on October 11, 1988, September 14, 1989, September 19, 1990, February 23, 1994, December 20, 1996, June 24, 2002, July 26, 2004 and April 5, 2007 (2) |
|
10.2 |
Tax Indemnity Agreement by and among Safety Holdings, Inc. and the Management Team, dated October 16, 2001(1) |
|
10.3 |
2001 Restricted Stock Plan (1)(4) |
|
10.4 |
Executive Incentive Compensation Plan (1)(4) |
|
10.5 |
2002 Management Omnibus Incentive Plan, as Amended (7) |
|
10.6 |
Reinsurance Terms Sheet between Safety Insurance Company and Swiss Re America Corporation, effective January 1, 2002(1) |
|
10.7 |
Excess Catastrophe Reinsurance Program Terms Sheet between Safety Insurance Company, Safety Indemnity Insurance Company and Benfield Blanch Inc., effective January 1, 2002(1) |
|
10.8 |
Property Risk Excess of Loss Reinsurance Program Terms Sheet between Safety Insurance Company, Safety Indemnity Insurance Company and Benfield Blanch Inc., effective January 1, 2002(1) |
|
10.9 |
Reinsurance Agreement between Safety Insurance Company, Safety Indemnity Insurance Company and the Hartford Steam Boiler Inspection and Insurance Company, effective July 1, 2003(1) |
|
10.10 |
Amended and Restated Employment Agreement by and between Safety Insurance Group, Inc. and David F. Brussard, as of December 31, 2008(3)(4)(11) |
|
10.11 |
Amended and Restated Employment Agreement by and between Safety Insurance Group, Inc. and William J. Begley, Jr., as of December 31, 2008(3)(4)(11) |
|
10.12 |
Amended and Restated Employment Agreement by and between Safety Insurance Group, Inc. and Edward N. Patrick, Jr., as of December 31, 2008(3)(4)(11) |
|
10.13 |
Amended and Restated Employment Agreement by and between Safety Insurance Group, Inc. and Daniel D. Loranger, as of December 31, 2008(3)(4)(11) |
|
10.14 |
Amended and Restated Employment Agreement by and between Safety Insurance Group, Inc. and Robert J. Kerton, as of December 31, 2008(3)(4)(13) |
|
10.15 |
Amended and Restated Employment Agreement by and between Safety Insurance Group, Inc. and David E. Krupa, as of December 31, 2008(3)(4)(11) |
|
10.16 |
Safety Insurance Company Executive Incentive Compensation Plan—Basic Document(4)(5)(12) |
|
10.17 |
Safety Insurance Company Executive Incentive Compensation Plan—Adoption Agreement(4)(5)(12) |
|
10.18 |
Safety Insurance Company Executive Incentive Compensation Plan—Rabbi Trust Agreement(4)(5)(12) |
|
10.19 |
Form of Restricted Stock Notice and Agreement (with vesting) under the 2002 Management Omnibus Incentive Plan(4)(5) |
104
|
10.20 |
Form of Restricted Stock Notice and Agreement (without vesting) under the 2002 Management Omnibus Incentive Plan(4)(5) |
|
10.21 |
Form of Nonqualified Stock Option Notice and Agreement under the 2002 Management Omnibus Incentive Plan(4)(5) |
|
10.22 |
Form of Incentive Stock Option Notice and Agreement under the 2002 Management Omnibus Incentive Plan(4)(5) |
|
10.23 |
Form of Stock Appreciation Right Notice and Agreement under the 2002 Management Omnibus Incentive Plan(4)(5) |
|
10.24 |
Amended and Restated Employment Agreement by and between Safety Insurance Group, Inc. and James D. Berry, as of December 31, 2008(4)(6)(13) |
|
10.25 |
Amended and Restated Employment Agreement by and between Safety Insurance Group, Inc. and George M. Murphy, as of December 31, 2008(4)(6)(13) |
|
10.26 |
Excess Catastrophe Reinsurance Contract between Safety Insurance Company, Safety Indemnity Insurance Company and Benfield Blanch Inc., effective January 1, 2006(7) |
|
10.27 |
Property Excess of Loss Reinsurance Contract between Safety Insurance Company, Safety Indemnity Insurance Company and Benfield Blanch Inc., effective January 1, 2006(7) |
|
10.28 |
Casualty Excess of Loss Reinsurance Agreement between Safety Insurance Company, Safety Indemnity Insurance Company and Swiss Re America Corporation, effective January 1, 2006(7) |
|
10.29 |
Addendum No. 1 to Casualty Excess of Loss Reinsurance Agreement between Safety Insurance Company, Safety Indemnity Insurance Company and Swiss Re America Corporation, effective January 1, 2006(7) |
|
10.30 |
Property Catastrophe Excess of Loss Reinsurance Agreement between Safety Insurance Company, Safety Indemnity Insurance Company and Swiss Re America Corporation, effective January 1, 2006(7) |
|
10.31 |
Umbrella Liability Quota Share Reinsurance Agreement between Safety Insurance Company, Safety Indemnity Insurance Company and Swiss Re America Corporation, effective January 1, 2006(7) |
|
10.32 |
Addendum No. 1 to Reinsurance Agreement between Safety Insurance Company, Safety Indemnity Insurance Company and the Hartford Steam Boiler Inspection and Insurance Company, effective April 1, 2006(7) |
|
10.33 |
Annual Performance Incentive Plan(4)(7) |
|
10.34 |
Excess Catastrophe Reinsurance Contract between Safety Insurance Company, Safety Indemnity Insurance Company and Benfield Inc., effective January 1, 2007(8) |
|
10.35 |
Addendum No.1 to Excess Catastrophe Reinsurance Contract between Safety Insurance Company, Safety Indemnity Insurance Company and Benfield Inc., adding Safety Property and Casualty Insurance Company as a named reinsured company, effective January 1, 2007(8) |
|
10.36 |
Property Excess of Loss Reinsurance Contract between Safety Insurance Company, Safety Indemnity Insurance Company and Benfield Inc., effective January 1, 2007(8) |
|
10.37 |
Addendum No. 1 to Property Excess of Loss Reinsurance Contract between Safety Insurance Company, Safety Indemnity Insurance Company and Benfield Inc., adding Safety Property and Casualty Insurance Company as a named reinsured company, effective January 1, 2007(8) |
|
10.38 |
Property Catastrophe Excess of Loss Reinsurance Agreement between Safety Insurance Company, Safety Indemnity Insurance Company and Swiss Reinsurance America Corporation, effective January 1, 2007(8) |
|
10.39 |
Addendum No. 2 to Casualty Excess of Loss Reinsurance Agreement between Safety Insurance Company, Safety Indemnity Insurance Company and Swiss Reinsurance America Corporation, effective January 1, 2007(8) |
105
|
10.40 |
Addendum No. 2 to Reinsurance Agreement between Safety Insurance Company, Safety Indemnity Insurance Company and The Hartford Steam Boiler Inspection and Insurance Company, effective January 1, 2007(8) |
|
10.41 |
Addendum No. 1 to Umbrella Liability Quota Share Reinsurance Agreement between Safety Insurance Company, Safety Indemnity Insurance Company and Swiss Re America Corporation, adding Safety Property and Casualty Insurance Company as a named reinsured company, effective September 1, 2007(9) |
|
10.42 |
Addendum No. 3 to Casualty Excess of Loss Reinsurance Agreement between Safety Insurance Company, Safety Indemnity Insurance Company and Swiss Re America Corporation, adding Safety Property and Casualty Insurance Company as a named reinsured company, effective September 1, 2007(9) |
|
10.43 |
Amendment to Annual Performance Incentive Plan(4)(11) |
|
10.44 |
Amendment to Management Omnibus Incentive Plan dated December 31, 2008(4)(11) |
|
10.45 |
Service Line for Homeowners Reinsurance Agreement between Safety Insurance Company, Safety Indemnity Insurance Company, and Safety Property and Casualty Insurance Company and The Hartford Steam Boiler Inspection and Insurance Company, effective August 1, 2010 (14) |
|
10.46 |
Equipment Breakdown for Homeowners Reinsurance Agreement between Safety Insurance Company, Safety Indemnity Insurance Company, and Safety Property and Casualty Insurance Company and the Hartford Steam Boiler Inspection and Insurance Company, effective August 1, 2010(14) |
|
10.47 |
Amendment to Management Omnibus Incentive Plan dated August 4, 2010 (4)(15) |
|
10.48 |
Umbrella Liability Excess of Loss Reinsurance Agreement between Safety Insurance Company, Safety Indemnity Insurance Company and Safety Property and Casualty Insurance Company and Swiss Reinsurance America Corporation Effective January 1, 2011(16) |
|
10.49 |
Property Catastrophe Excess of Loss Reinsurance Agreement between Safety Insurance Company, Safety Indemnity Insurance Company and Safety Property and Casualty Insurance Company and Swiss Reinsurance America Corporation Effective January 1, 2011(16) |
|
10.50 |
Excess Catastrophe Reinsurance Contract between Safety Insurance Company, Safety Indemnity Insurance Company and Safety Property and Casualty Insurance Company and AON Benfield Effective January 1, 2011(16) |
|
10.51 |
Amendment No. 1 to the Amended and Restated Employment Agreement by and between Safety Insurance Group, Inc. and David F. Brussard, as of December 17, 2012(4)(17) |
|
10.52 |
Amendment No. 1 to the Amended and Restated Employment Agreement by and between Safety Insurance Group, Inc. and William J. Begley, Jr., as of December 17, 2012(4) (17) |
|
10.53 |
Amendment No. 1 to the Amended and Restated Employment Agreement by and between Safety Insurance Group, Inc. and Daniel D. Loranger, as of December 17, 2012(4) (17) |
|
10.54 |
Amendment No. 1 to the Amended and Restated Employment Agreement by and between Safety Insurance Group, Inc. and Edward N. Patrick, Jr., as of December 17, 2012(4) (17) |
|
10.55 |
Amendment No. 1 to the Amended and Restated Employment Agreement by and between Safety Insurance Group, Inc. and David E. Krupa, as of December 17, 2012(4) (17) |
|
10.56 |
Amendment No. 1 to the Amended and Restated Employment Agreement by and between Safety Insurance Group, Inc. and Robert J. Kerton, as of December 17, 2012(4) (17) |
|
10.57 |
Amendment No. 1 to the Amended and Restated Employment Agreement by and between Safety Insurance Group, Inc. and James D. Berry, as of December 17, 2012(4) (17) |
|
10.58 |
Amendment No. 1 to the Amended and Restated Employment Agreement by and between Safety Insurance Group, Inc. and George M. Murphy, as of December 17, 2012(4) (17) |
|
10.59 |
Amendment to Management Omnibus Incentive Plan, as Amended dated March 11, 2013(4)(18) |
106
|
10.60 |
Form of Restricted Stock Notice and Agreement (with performance-based vesting) under the 2002 Management Omnibus Plan, as Amended(4)(18) |
|
10.61 |
Amended and Restated Revolving Credit Agreement with RBS Citizens(19) |
|
10.62 |
Form of Restricted Stock Notice and Agreement (with performance-based vesting) under the 2002 Management Omnibus Plan, As Amended(4) (20) |
|
10.63 |
Employment Agreement by and between Safety Insurance Group, Inc. and Paul J. Narciso, as of August 5, 2013(4) (20) |
|
10.64 |
Employment Agreement by and between Safety Insurance Group, Inc. and Stephen A. Varga, as of August 6, 2014(4) (21) |
|
10.65 |
Form of Restricted Stock Notice and Agreement (with performance-based vesting) under the 2002 Management Omnibus Plan, As Amended(4) (22) |
|
10.66 |
Form of Restricted Stock Notice and Agreement under the 2002 Management Omnibus Plan, As Amended(4) (22) |
|
10.67 |
Employment Agreement by and between Safety Insurance Group, Inc. and Ann M. McKeown, as of August 5, 2015(4) (23) |
|
21 |
Subsidiaries of Safety Insurance Group, Inc.(9) |
|
23 |
Consent of PricewaterhouseCoopers LLP (24) |
|
24 |
Power of Attorney(1) |
|
31.1 |
CEO Certification Pursuant to Rule 13a‑14(a)/15d‑14(a), as Adopted Pursuant to Section 302 of the Sarbanes‑Oxley Act of 2002(24) |
|
31.2 |
CFO Certification Pursuant to Rule 13a‑14(a)/15d‑14(a), as Adopted Pursuant to Section 302 of the Sarbanes‑Oxley Act of 2002(24) |
|
32.1 |
CEO Certification Pursuant to U.S.C. Section 1350, as Adopted Pursuant to Section 906 of the Sarbanes‑Oxley Act of 2002(24) |
|
32.2 |
CFO Certification Pursuant to U.S.C. Section 1350, as Adopted Pursuant to Section 906 of the Sarbanes‑Oxley Act of 2002(24) |
|
101.INS |
XBRL Instance Document (24) |
|
101.SCH |
XBRL Taxonomy Extension Schema (24) |
|
101.CAL |
XBRL Taxonomy Extension Calculation Linkbase (24) |
|
101.DEF |
XBRL Taxonomy Extension Definition Linkbase (24) |
|
101.LAB |
XBRL Taxonomy Extension Label Linkbase (24) |
|
101.PRE |
XBRL Taxonomy Extension Presentation Linkbase (24) |
(1)Incorporated herein by reference to the Registrant’s Registration Statement on Form S-1 (File No. 333-87056) filed April 26, 2002, and as amended on Form S-8 (Reg. No. 333-110676) filed on November 21, 2003 and as amended on Form S-8 (Reg. No. 333-140423) filed on February 2, 2007.
(2)Incorporated herein by reference to the Registrant’s Registration Statement on Form S-1 (File No. 333-87056) filed April 26, 2002, and as amended on Form S-8 (Reg. No. 333-110676) filed on November 21, 2003 and as amended on Form S-8 (Reg. No. 333-140423) filed on February 2, 2007, and as incorporated herein by reference on Form 10-Q for the quarterly period ended June 30, 2007, as filed on August 9, 2007.
(3)Incorporated herein by reference to the Registrant's Form 10-Q for the quarterly period ended September 30, 2004 filed on November 9, 2004.
107
(4)Denotes management contract or compensation plan or arrangement.
(5)Incorporated herein by reference to the Registrant’s Form 10-K for the year ended December 31, 2004 filed on March 16, 2005.
(6)Incorporated herein by reference to the Registrant’s Form 10-K for the year ended December 31, 2005 filed on March 16, 2006.
(7)Incorporated herein by reference to the Registrant’s Form 10-K for the year ended December 31, 2006 filed on March 1, 2007.
(8)Incorporated herein by reference to the Registrant’s Form 10-Q for the quarter ended September 30, 2007 filed on November 9, 2007.
(9)Incorporated herein by reference to the Registrant’s Form 10-K for the year ended December 31, 2007 filed on March 14, 2008.
(11)Incorporated herein by reference to the Registrant’s Form 8-K filed on December 31, 2008.
(12)Incorporated herein by reference to the Registrant’s Form 10-Q for the quarter ended September 30, 2008, as filed on November 7, 2008.
(13)Incorporated herein by reference to the Registrant’s Form 10-K for the year ended December 31, 2008 filed on March 13, 2009.
(14)Incorporated herein by reference to the Registrant’s Form 10-Q for the quarter ended June 30, 2010, as filed on August 6, 2010.
(15)Incorporated herein by reference to the Registrant’s Form 10-K for the year ended December 31, 2010 filed on March 14, 2011.
(16)Incorporated herein by reference to the Registrant’s Form 10-Q for the quarter ended September 30, 2011, as filed on November 8, 2011.
(17)Incorporated herein by reference to the Registrant’s Form 8-K filed on December 20, 2012.
(18)Incorporated herein by reference to the Registrant’s Form 10-K for the year ended December 31, 2012 filed on March 18, 2013
(19)Incorporated herein by reference to the Registrant’s Form 8-K filed on August 26, 2013.
(20)Incorporated herein by reference to the Registrant’s Form 10-Q for the quarter ended September 30, 2013, as filed on November 8, 2013.
(21)Incorporated herein by reference to the Registrant’s Form 10-Q for the quarter ended September 30, 2014, as filed on November 7, 2014.
(22)Incorporated herein by reference to the Registrant’s Form 10-K for the year ended December 31, 2014 filed on March 2, 2015
(23)Incorporated herein by reference to the Registrant’s Form 8-K filed on August 5, 2015.
(24)Included herein.
108